Annual Report 2010 - Investor relations
168
Annual Report 2010
-
Upload
khangminh22 -
Category
Documents
-
view
1 -
download
0
Transcript of Annual Report 2010 - Investor relations

Annual Report 2010
Performance highlights 2010
revenue
74,073 DKK million
operating profit before other items
4,267 DKK million
net profit/(loss)
(532) DKK million
organiC revenue growth
3.5%
operating margin
5.8%
number of employees
522,700
CovEr pAgE: A world of sErviCEs in BrAzil our staff in action, serving some of our customers in Brazil a selection of our support services. With over 20,000 employees, ISS Brazil is the largest ISS organisation in Latin America. Delivering the Group's highest organic growth of 37% in 2010, ISS Brazil is one of the growth locomotives in ISS and proves the value of our strategic focus on emerging markets.
total revenue growth
7%
growth in operating profit before other items
10%
Cash Conversion
98%

ISS is among the world’s largest private employers. The vast majority of its more than 520,000 employees work with front-line delivery of services.
Through a network of local operations, ISS offers facility services on an international scale, leveraging knowledge and experience between countries to benefit its custom-ers. It is ISS’s ambition to develop partnerships with its customers, enabling them to focus their attention and resources on their core business by outsourcing a broad range of facility services to ISS.
sErviCE offEring
ISS’s service offering has been developed to meet customer needs. our core business is to manage and deliver facility services, covering a range of facility services within cleaning services, support services, property services, catering services, security services and facility management services.
our service offering is built on a strong foundation of service excellence which means that our customers enjoy the benefits of partnering with a facility service expert – a company that truly understands customer needs with specific on-site service solutions to each customer seg-ment and the capabilities to consistently self-deliver the services.
The services are delivered as single services, multi services or as an integrated facility service (IFS) solution with on-site management through a single point of contact with the customer.
ISS at a glance
ISS is one of the world’s largest providers of facility services, operating in more than 60 countries in Europe, Asia, Pacific, Latin America and North America. ISS has a diverse customer base of more than 200,000 public and private-sector customers.
orgAnisAtion
ISS’s head office is located in Copenhagen, Denmark. ISS maintains a decentralised organisational structure under which its country operations are separately organised and act with a significant amount of autonomy, assisted by a strong regional management structure providing strategic direction, managerial support and financial control com-bined with functional leadership from the head office. This structure ensures a coherent direction while making the organisation responsive to market conditions while fostering an entrepreneurial culture within ISS.
ownErship
FS Invest II S.à r.l (Luxembourg), a company indirectly owned by funds advised by EQT Partners and Goldman Sachs Capital Partners, is the owner and single share-holder of ISS A/S.
history
ISS has operated in the service industry for more than a hundred years. The ISS Group was founded as a small Danish security company in 1901 and began offering cleaning services in 1934. Selected key milestones of the Group’s history are listed opposite.
vision
ISS has a strong position in the global facility services market. To maintain this position, ISS continues to pursue its vision to
"lead facility services globally – by leading facility services locally."

1901 ISS was founded in Copenhagen, Denmark as a small security company with 20 night watchmen named København-Frederiksberg nattevagt (Copenhagen-Frederiksberg night Watch)
1934 ISS entered the cleaning business with the establishment of Det Danske Rengørings Selskab A/S (The Danish Cleaning Company) as an independent subsidiary of the security company
1946 The first geographical expansion outside Denmark: Swedish subsidiary established
1968 The company adopted the ISS name
1973 overseas expansion started
1975 Group revenue reached DKK 1 billion
1977 ISS shares listed on the Copenhagen Stock Exchange
1989 The total number of employees in the Group reached 100,000
1997 Strategy 'aim 2002' was launched. This strategy focused on multi services – selling a number of services to the same customer
1999 ISS acquired Abilis, the second-largest European provider of cleaning and special-ised services, in a DKK 3.6 billion acquisition, the Group’s largest ever. Abilis had about 50,000 employees and annual revenues of DKK 5.2 billion in 1998. The total number of employees in the Group reached 200,000
2000 A new five-year strategy 'create2005' was launched, introducing the Facility Service concept
2005 A new strategy was introduced aiming at continuous transformation of ISS towards an integrated facility service company. The total number of employees in the Group reached 300,000
2005 ISS World Services A/S was acquired by funds advised by EQT Partners and Gold-man Sachs Capital Partners, and de-listed from the Copenhagen Stock Exchange
2006 Group revenue passed DKK 50 billion. ISS made the second-largest acquisition in company history when acquiring the outstanding 51% of the shares in Tempo Services Ltd. in Australia
2007 Group revenue passed DKK 60 billion. Establishment of Corporate Clients organisation. ISS entered the uS market through the acquisition of Sanitors Inc. The total number of employees in the Group reached 400,000
2008 Introduction of ISS’s strategy plan 'The ISS Way', which is built on four strategic cornerstones: customer focus, people management, the IFS strategy and a multi-local approach. ISS’s largest ever international integrated facility service contract was signed
2010 Group revenue passed DKK 70 billion. The total number of employees in the Group surpassed 500,000
iss milestones revenue 2010
by serviCe
Cleaning services 52%
Property services 20%
Catering services 9%
Support services 8%
Security services 7%
Facility management 4%
0 10 20 30 40 50 60
% of Group revenue
by region
0 10 20 30 40 50 60
% of Group revenue
Western Europe 53%
Nordic 23%
Asia 7%
Pacific 7%
Latin America 4%
North America 4%
Eastern Europe 2%
by Customer segment
Business services & IT 26%
Public administration 16%
Industry & Manufacturing 14%
Healthcare 12%
Transportation & Infrastructure 7%
Retail and Wholesale 7%
Energy & Resources 4%
Hotels, Leisure & Entertainment 4%
Food & Beverage 3%
Pharmaceuticals 2%
Other 5%
% of Group revenue
0 5 10 15 20 25 30

Contents MANAGEMENT REVIEW Letter to our stakeholders 7
Key fi gures and fi nancial ratios 10
Operational review 13
Outlook 27
Financial review 29
Strategy – The ISS Way 37
Corporate Responsibility 43
Corporate governance and risk management 49
Board of Directors 57
Executive Group Management 60
Group Management 61
FINANCIAL STATEMENTS Consolidated fi nancial statements 64
Parent company fi nancial statements 137
Management statement 156
Independent auditor's report 157
ADDITIONAL INFORMATION Performance highlights 2010 cover
ISS at a glance cover
Capital structure 159
ISS Group & Services 163
Country addresses 164
Regional adresses cover
LUDOVIC DUPRE, ECOLE MILITAIRE SAINT-CYR, FRANCE

KONG LING YU, WORLD EXPO, CHINA
ISS at World Expo 2010 ISS security employees in China protected one of Denmark’s most important landmarks: the statue of The Little Mermaid while she attended Expo 2010 in Shanghai between 1 May and 31 October. The Little Mermaid statue, which normally adorns Copenhagen’s shore, was guarded for six months while she sat in a pond in the middle of the Danish Expo pavilion. The Danish pavilion experienced a record of 5.6 million guests.

In 2010, the impact of our customer focus was mani-fested when the International Association of Outsourcing Professionals (IAOP) ranked ISS number six on IAOP’s list of the world’s leading outsourcing providers – The Global Outsourcing 100. Our ranking among the top outsourcing providers underlines that ISS is a professional and reliable outsourcing partner of choice.
2010 has been a year of recovery in many of the markets in which ISS operates. Despite the macro-economic chal-lenges still seen in certain markets, ISS performed very well against our key operational objectives and delivered among the best results in our industry. Total Group revenue reached DKK 74 billion, up 7% for the year, including a pick-up in organic growth from 0.6% in 2009 to 3.5% in 2010. Operating profi t before other items increased by 10% to DKK 4.3 billion compared with last year and the operating margin before other items amounted to 5.8% an increase of 0.2 percentage point. ISS maintained a low level of debtor days and continued to have robust cash genera-tion leading to a cash conversion rate of 98%.
Our well established presence and developed service plat-form in emerging markets contributed to ISS’s increased growth and profi tability in 2010 and will continue to be an important factor in future profi table organic growth for ISS. Our emerging markets, comprising Asia, Eastern Europe, Latin America, Israel, South Africa and Turkey, now account for more than half of our global workforce and contributed 18% of the Group’s revenue in 2010 and 66% of the Group’s organic growth. In 2010, our employee base exceeded 500,000, making ISS one of the world’s largest private employers. At ISS, our successful performance is based on the day-to-day efforts of all our employees, who together ensure that we reach our strategic goals. We would like to express our warm gratitude to all our employees for their dedicated work.
In April, Jeff Gravenhorst took over as our new Group CEO. The Executive Group Management team now consists of Group CEO Jeff Gravenhorst and Group CFO Jakob Stausholm.
Yours faithfully
Ole Andersen Jeff GravenhorstChairman Group Chief Executive Offi cer
Letter to our stakeholders
In 2005, ISS was taken private and delisted from the Copenhagen Stock Exchange. During almost fi ve years of private ownership, ISS has developed into a leading global facility services provider with a unique service offering including facility management and self-delivery of a range of facility services within six core service categories.
As we have developed tailored customer value proposi-tions for specifi c customer segments, we can take over the tasks of running our customers’ properties or facilities. We now have global service delivery capabilities across geographies, customer segments and facility services. This development is driven by customer demand and the trans-formation during private ownership, which has encour-aged ISS to expand its geographical presence and service platform. In addition, during private ownership, ISS has organically increased the number of international cus-tomer contracts from two to eleven and simultaneously increased the share of revenue generated from integrated facility service solutions from 3% of the total revenue in 2004 to 19% in 2010.
This transformation has required an alignment of process-es, principles and values in order to ensure consistency in our service offering - from a local single service offering through to a global integrated facility services solution. The ISS Way strategy is and has been a catalyst for focus and alignment through Excellence Centres and best practices in our business as well as for securing excellence in leadership through common values and principles that both contribute to increased effi ciency and consistency in our delivery and promises to our customers.
ISS has demonstrated that by following the strategic direction outlined in The ISS Way strategy, we have both transformed our business platform and delivered a solid fi nancial performance in recent years. Today, ISS is in a position where we are focusing on utilising the platform to the fullest extent and therefore consider this to be the right time to initiate an initial public offering and thereby re-introduce ISS to NASDAQ OMX Copenhagen.
The strength of our business model has been proven by our prominent contract wins in 2010, including Hewlett-Packard (HP) in the Americas, one of the world’s largest banks, Citi in EMEA and the United Kingdom Foreign Commonwealth Offi ces in APJ.
Letter to our Stakeholders | Management Review 7

JOHANN GROSS, SONY ERICSSON, GERMANY
LENA MAGNUSSON, SONY ERICSSON, SWEDEN FRANCISCO FLORES, SONY ERICSSON, USA
SUSANNE DALLING, SONY ERICSSON, SWEDEN

KRYSTALLIA PAPPA, SONY ERICSSON, GERMANY
SONY ERICSSON – GLOBAL CONTRACT ISS has entered a global agreement with Sony Ericsson Mobile Communication to take over the facility management of Sony Ericsson locations and handle activities such as cleaning, building maintenance, waste handling, switchboard operation, security services and catering in Sweden, the United Kingdom, Germany, the USA, Japan, Taiwan, Singapore and India as well as a large production site in China. The contract covers more than 200,000 square meters and more than 500 ISS employees will be involved in the operation. ISS has a number of other global facility services contracts but the Sony Ericsson agreement is the fi rst spanning both the Americas, Europe and Asia Pacifi c.

Key fi gures and fi nancial ratiosDKK million (unless otherwise stated) 2010 2009 2008 2007 2006
KEY FIGURESIncome statementRevenue 74,073 69,004 68,829 63,922 55,772 Operating profi t before other items 1) 4,267 3,874 4,061 3,835 3,234 EBITDA 4,999 4,145 4,622 4,484 3,764 Adjusted EBITDA 2) 5,117 4,742 4,930 4,680 3,979 Operating profi t 3) 4,149 3,277 3,753 3,639 3,019 Financial income 198 223 242 199 230 Financial expenses (2,566) (2,531) (2,973) (3,216) (2,581)Profi t before goodwill impairment/amortisation and impairment of brands and customer contracts 1,031 385 494 376 226 Net profi t/(loss) for the year (532) (1,629) (631) (442) (809)
Cash fl owCash fl ow from operating activities 4,036 3,732 4,334 3,713 3,195 Acquisition of intangible assets and property, plant and equipment not related to acquisitions, net (886) (897) (718) (715) (843)
Financial positionTotal assets 55,435 54,354 53,605 55,348 52,253 Goodwill 27,747 27,434 27,259 27,593 26,178 Additions to property, plant and equipment not related to acquisitions, gross 861 954 964 938 907 Carrying amount of net debt 4) 30,619 30,886 29,639 29,086 26,159 Total equity (attributable to owners of ISS A/S) 2,626 2,190 3,498 5,459 5,917
EmployeesNumber of employees at 31 December 522,700 485,800 472,800 438,100 391,400 Full-time employees, % 73 71 69 68 66
FINANCIAL RATIOSGrowth, %Organic growth 5) 3.5 0.6 5.9 6.0 5.5 Acquisitions 0 3 7 10 17 Divestments (2) (1) (2) (1) (2)Currency adjustments 6) 5 (3) (3) (0) 0 Total revenue growth 7 0 8 15 20
Other fi nancial ratios, %Operating margin 2) 5.8 5.6 5.9 6.0 5.8 Equity ratio 4.7 4.0 6.5 9.9 11.3 Interest coverage 2) 2.2 2.1 1.8 1.6 1.7 Cash conversion 2) 98 96 103 99 102 Basic earnings per share (EPS), DKK (5.5) (16.5) (6.4) (4.7) (8.3)Diluted earnings per share, DKK (5.5) (16.5) (6.4) (4.7) (8.3)Adjusted earnings per share, DKK 10.3 3.9 4.9 3.8 2.3
1) Excluding Other income and expenses, net, Acquisition and integration costs, Goodwill impairment and Amortisation and impairment of brands and customer contracts.2) The Group uses Operating profi t before other items for the calculations instead of Operating profi t. Consequently, the Group excludes from the calculations Acquisition and integration
costs and those items recorded under Other income and expenses, net, in which the Group includes income and expenses that it believes do not form part of the Group’s normal ordinary operations, such as gains and losses arising from divestments, the winding up of operations, disposals of property and restructurings. Some of these items are recurring and some are non-recurring in nature.
3) Excluding Goodwill impairment and Amortisation and impairment of brands and customer contracts.4) With effect from 31 December 2010 the fair value of interest rate swaps hedging the interest rate of loans and borrowings has been reclassifi ed from Other liabilities to Loans and
borrowings. Comparative fi gures have been restated accordingly.5) Previously, acquisitions with reported annual revenue of DKK 50 million or more as well as acquisition of businesses that established ISS presence in a new jurisdiction were excluded from
the calculation of organic growth during the fi rst 12 months of ISS ownership. This has been changed in 2010 in order to align to a single-string calculation methodology for acquisitions. The change has been implemented retroactively for the fi nancial years 2008, 2009 and 2010. There was no signifi cant impact on the reported fi gures for 2009 and 2010 while organic growth for 2008 increased from 5.3% to 5.9% under the new calculation principle.
6) Calculated as total revenue growth less organic growth and less net acquisition/divestment growth. Currency adjustments thereby include the effect stemming from exclusion of currency effects from the calculation of organic growth and net acquisition/divestment growth.
10 Annual Report 2010

DEFINITIONS
ACQUISITIONS, %
= Revenue from acquired businesses 1) x 100
Revenue prior year at current year's exchange rates1) Revenue from acquired businesses is based on management's expectations at the acquisition date.
ADJUSTED EARNINGS PER SHARE
Profi t before goodwill impairment/amortisation and impairment of brands and customer contracts=
Average number of shares, diluted
ADJUSTED EBITDA
= Operating profi t before other items + Depreciation and amortisation
BASIC EARNINGS PER SHARE (EPS)
= Net profi t/(loss) for the year attributable to owners of ISS A/S
Average number of shares
CARRYING AMOUNT OF NET DEBT
= Non-current loans and borrowings + Current loans and borrowings - Receivables from companies within the ISS Group - Securities - Cash and cash equivalents - Positive fair value of interest rate swaps
CASH CONVERSION, %
= (Operating profi t before other items + Changes in working capital) x 100
Operating profi t before other items
DILUTED EARNINGS PER SHARE
= Net profi t/(loss) for the year attributable to owners of ISS A/S
Average number of shares, diluted
DIVESTMENTS, %
= Revenue from divested businesses 1) x 100
Revenue prior year at current year's exchange rates1) Revenue from divested businesses is based on estimates or actual revenue where available at the divestment date.
EBITDA
= Operating profi t + Depreciation and amortisation
EQUITY RATIO, %
= Total equity attributable to owners of ISS A/S x 100
Total assets
INTEREST-BEARING DEBT, NET
= Carrying amount of net debt - Non-interest-bearing debt, net 1)
1) Sum of non-interest-bearing items included in carrying amount of net debt, e.g. fair value of interest rate swaps, unamortised gains from settlement of interest rate swaps and unamortised loan costs.
INTEREST COVERAGE
= Operating profi t before other items + Depreciation and amortisation
Financial income and fi nancial expenses, net
OPERATING MARGIN, %
= Operating profi t before other items x 100
Total revenue
ORGANIC GROWTH, %
= (Comparable revenue 1) current year - comparable revenue 1) prior year) x 100
Comparable revenue 1) prior year1) Comparable revenue implies the exclusion of changes in revenue attributable to businesses acquired or divested and the effect of changes in foreign
exchange rates. In order to present comparable revenue and thereby organic growth excluding any effect from changes in foreign currency exchange rates, comparable revenue in the prior year is calculated at the subsequent year's foreign currency exchange rates. Acquisitions of businesses are treated as having been integrated into ISS upon acquisition, and ISS’s calculation of organic growth includes changes in revenue of these acquired businesses compared with revenue expectations at the date of acquisition. Organic growth is not a measure of fi nancial performance under Danish GAAP or IFRS and the organic growth fi gures have not been audited.
TOTAL REVENUE GROWTH, %
= (Revenue current year - revenue prior year) x 100
Revenue prior year
Key fi gures | Management Review 11

NOELIA LUNA, IBM, ARGENTINA
YUNUS BALCIO LU, CITIBANK, TURKEY
ROBERT PEREZ
BUSINESS SERVICES & IT – representing 26% of Group revenue The Business services & IT customer segment consists of customers with activities within fi nancials, insurance, telecommunications, real estate, information and communication. ISS services retailers and corporate offi ce buildings with widely differing regulatory environments and cultures around the world. We offer industry specifi c integrated solutions on a local, regional and global basis, drawing on our people management skills, best-practice capabilities and geographical footprint.
LENKA HNEDA, HP, IRELAND

Operational review
HIGHLIGHTS OF THE YEAR
In 2010, ISS has shown improvements on all key opera-tional objectives.
Group revenue amounted to DKK 74.1 billion, an increase of 7.3% compared with 2009, driven mainly by double-digit growth rates in the emerging markets, including Latin America and Asia, which delivered growth rates of 48% and 31%, respectively. The emerging markets comprising Asia, Eastern Europe, Latin America, Israel, South Africa and Turkey now represent 18% of total Group revenue, 66% of total organic growth for the Group and more than 50% of our employees.
Organic growth for the year was 3.5% compared with 0.6% in 2009. Five out of the seven regions contributed positively to ISS’s organic growth, with Asia and Latin America once again delivering double-digit organic growth rates. The organic growth in Q4 2010 amounted to 4.0%.
Operating profi t before other items increased by 10% to DKK 4.3 billion in 2010 compared with 2009, and operat-ing profi t before other items as a percentage of revenue, i.e. the operating margin, increased to 5.8% from 5.6% in 2009.
Operating profi t increased by 27% from DKK 3,277 million in 2009 to DKK 4,149 million in 2010. The increase was a result of a decrease in expenses recog-nised as other income and expenses, net following the investments in restructuring projects in 2009 as well as the increase in operating profi t before other items as described above.
The turnaround initiatives initiated in France continue to progress. However, France remains in its recovery phase from exposure to the manufacturing and public sectors. In addition, the effects from the turnaround initiatives have yet to substantially materialise. Excluding France, ISS’s operating profi t before other items improved by 11% compared with 2009, with an operating margin of 6.0% and organic growth of 4.6%.
Profi t before goodwill impairment / amortisation and im-pairment of brands and customer contracts increased to DKK 1,031 million in 2010 from DKK 385 million in 2009 driven by the increase in operating profi t partly offset by an increase in income taxes.
The net result for the year improved from a loss of DKK 1,629 million in 2009 to a loss of DKK 532 million in 2010, which was positively impacted by growth in revenue and improved operational performance in 2010, combined with a decrease in net expenses recognised as other income and expenses, net as well as lower non-cash expenses related to goodwill impairment and amortisa-tion and impairment of brands and customer contracts compared with 2009.
In April 2010, the International Association of Outsourcing Professionals (IAOP) announced that ISS had been ranked number six on IAOP’s list of the world’s leading outsourc-ing providers – The Global Outsourcing 100. This is one step up from last year and underlines that ISS is a profes-sional and reliable outsourcing partner of choice.
PERFORMANCE HIGHLIGHTS
REVENUE GROWTH – excluding acquisitions and divestments was 9% or DKK 6 billion in 2010
OPERATING MARGIN – increased by 0.2 percentage point to 5.8% in 2010
CASH CONVERSION – increased and reached 98% in 2010
NUMBER OF EMPLOYEES – surpassed 500,000, making ISS one the world's largest private employers
2010 was a successful year for ISS – we strengthened our position as a leading global facility services provider through continuous increased presence in emerging markets, several major international contract wins and improved performance on all key operational objectives.
Operational Review | Management Review 13
In line with The ISS Way strategy, ISS continued to pro-mote a strong and uniform commercial culture by focusing on meeting its customers’ needs and thereby delivering a larger share of customers’ facility services requests, includ-ing demand from multinational corporations for integrated facility service solutions. Our focus has been on further developing and refi ning the value propositions for custom-ers within selected customer segments, such as Business services & IT, Public administration and Healthcare.
Over the past decade, ISS has built its global capability in the delivery of a well-defi ned set of facility services that are equally well suited for delivery as single services and as part of an integrated offering. In order to fully leverage on its unique platform, ISS continued to drive the global implementation of best practices and standard processes during 2010.
The implementation of The ISS Way has a broad and posi-tive impact on our business – allowing us to deliver to our customers consistent excellence in single services and inte-grated services across borders. Evidence of the successful execution of our strategy was refl ected in the continued increase in organic growth in 2010, which positions ISS competitively in the industry. Continued successful implementation of The ISS Way will boost our key growth drivers – new sales, cross-sales and customer retention.
Implementation of The ISS Way also focuses on securing excellence in leadership through the relentless applica-tion of uniform principles and values throughout the entire organisation. Successful implementation aligns our corporate culture and contributes to achieving our high ambitions.
Our strategic focus on delivering portfolio-based services has led to continued organic growth in the portfolio business. Historically, the portfolio business’ share of total revenue has been between 75% - 80% and during 2009 and 2010 there was an increasing trend in the portfolio business’ share of total revenue within this range.
Across ISS regions, we saw strong demand for our inte-grated facility services (IFS) offering in 2010. Multi-service and IFS, where we deliver two or more services to the same customer comprised 35% of total Group revenue in 2010 compared with 33% in 2009. Multi-service and IFS revenues allow ISS to exploit synergies in the provision of services, and create stronger customer relationships.
The performance of ISS’s business in 2010 demonstrates the resilience of the business as a result of the fl exibility of ISS’s cost base, the large size of ISS’s portfolio business and rigorous fi nancial and operational control.
ISS's continued focus on cash fl ow resulted in a reduc-tion of 0.9 debtor days compared with 2009, leading to a robust cash conversion of 98%, which underlines ISS’ continued robust and stable cash generation.
In order to further strengthen our focus on sales growth and leadership development, in 2010 ISS established and appointed a Group Chief Commercial Offi cer (CCO) and recruited a new Group HR Director. Both have an interna-tional profi le through several international positions and are part of ISS’s Group Management Board.
The Global Corporate Clients organisation continues to successfully leverage on ISS’s global footprint to pursue and win multi-national contracts. ISS followed up on the EDS and Shell contract wins in 2009 by entering into a new international IFS contract with Hewlett-Packard (HP) covering the Americas, and a 3.5-year extension of the EMEA and APJ contracts for HP and EDS. Additional, contract wins included the United Kingdom Foreign Com-monwealth Offi ce (FCO) in APJ and Citi in EMEA as well as Sony Ericsson in APJ, EMEA and North America. After winning the HP Americas contract, ISS now services 850 HP and EDS sites in more than 50 countries in APJ, EMEA, and the Americas, which includes delivery of cleaning services, property services, support services, catering services, project management and integrated facility man-agement. FCO is an IFS contract comprising 28 diplomatic posts and over 700 diplomatic residential properties in 14 APJ countries. The Sony Ericsson contract covers facili-ties management and substantial self delivery of several facility services to 14 sites in nine countries in APJ, EMEA and North America. The Citi contract includes delivery of full facility management services, project management,
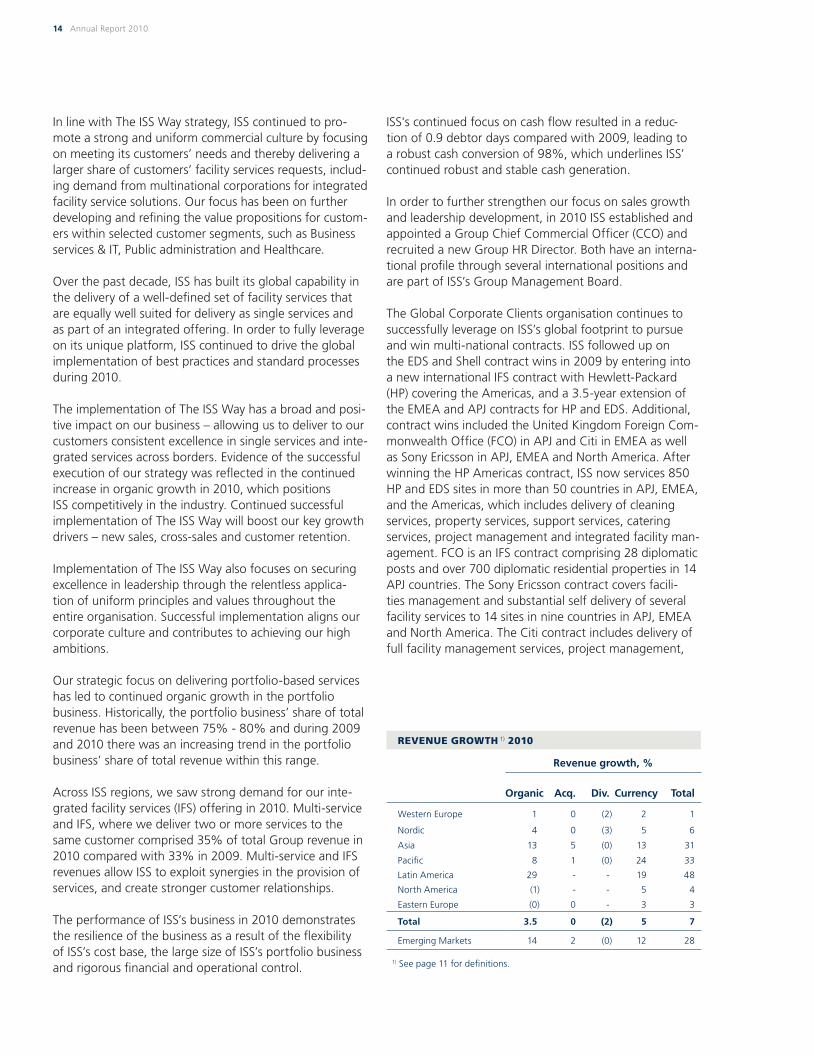
REVENUE GROWTH 1) 2010
Revenue growth, %
Organic Acq. Div. Currency Total
Western Europe 1 0 (2) 2 1
Nordic 4 0 (3) 5 6
Asia 13 5 (0) 13 31
Pacifi c 8 1 (0) 24 33
Latin America 29 - - 19 48
North America (1) - - 5 4
Eastern Europe (0) 0 - 3 3
Total 3.5 0 (2) 5 7
Emerging Markets 14 2 (0) 12 28
1) See page 11 for defi nitions.
14 Annual Report 2010

cleaning services and technical property services to almost 800 sites in 26 countries. These contract wins confi rm ISS’s strategic direction, as an increasing number of global customers now perceive ISS as one of the only compa-nies that can deliver facility services in an integrated and standardised way on a global scale.
In September 2010, ISS completed the repayment of the outstanding 2010 EMTNs. The remaining EUR 200 million of the original EUR 850 million were redeemed at matu-rity on 20 September 2010.
By the end of the year, ISS had more than 522,000 em-ployees worldwide. Since year-end 2009, a net increase of almost 37,000 employees joined the company as a result of organic growth and the acquisition of SDB Cisco in India, which added approximately 27,000 employees.
CONTEMPLATED INITIAL PUBLIC OFFERING ON NASDAQ OMX COPENHAGEN
ISS announced on 17 February 2011 that it contemplates launching an Initial Public Offering (‘IPO’) of shares and to list its shares on NASDAQ OMX Copenhagen.
The contemplated IPO is expected to support ISS’s future growth and operational strategy, advance the company’s public and commercial profi le, and provide improved ac-cess to public capital markets along with a diversifi ed base of new Danish and international shareholders. As part of the preparations for the contemplated IPO, the name of the parent company, ISS Holding A/S, has been changed
to ISS A/S. Simultaneously, the name of the directly owned subsidiary ISS A/S has been changed to ISS World Services A/S.
The contemplated IPO is expected to consist primarily of a sale of new shares to raise gross proceeds of approxi-mately DKK 13.3 billion, which are proposed, together with amounts drawn under a new facilities agreement to repay all amounts under our current senior facilities and our second lien facility. A partial secondary sell-down of shares by our existing shareholder, FS Invest II S.à r.l, which is incirectly controlled by certain funds advised by EQT Partners and funds affi liated with Goldman Sachs & Co., is also expected to cover the obligations under our management and employee incentive programmes.
The new facilities agreement, which was put in place on 18 February 2011 will be able to be drawn upon subject to satisfaction of certain conditions precedent, including that the offering of the shares contemplated by the IPO has occurred or will occur contemporaneously with the new facilities agreement fi rst utilisation. The new facility is in place with a smaller number of relationship banks and gives the fl exibility to pay margins dependant on our leverage at a given time.
This Annual Report for 2010 including the fi nancial statements has in line with previous years been prepared based on the rules applicable for Class-D companies and on rules for companies with listed debt instruments. Sub-ject to completion of the IPO, the Annual Report for 2011 will be based on the rules applicable for companies with listed shares.
OPERATING RESULTS
RevenueOperating profi t
before other items Operating margin
DKK million DKK million
2010 2009 Change 2010 2009 Change 2010 2009
Western Europe 39,121 38,632 1 % 2,278 2.056 11 % 5.8 % 5.3 %
Nordic 17,301 16,367 6 % 1,228 1.219 1 % 7.1 % 7.4 %
Asia 5,401 4,120 31 % 407 308 32 % 7.5 % 7.5 %
Pacifi c 5,018 3,768 33 % 333 259 29 % 6.6 % 6.9 %
Latin America 3,070 2,077 48 % 178 131 36 % 5.8 % 6.3 %
North America 2,625 2,515 4 % 132 134 (1)% 5.0 % 5.3 %
Eastern Europe 1,602 1,561 3 % 113 106 7 % 7.1 % 6.8 %
Corporate / eliminations (65) (36) (402) (339) 19 % (0.5)% (0.5)%
Total 74,073 69,004 7 % 4,267 3,874 10 % 5.8 % 5.6 %
Emerging Markets 13,574 10,632 28 % 927 732 27 % 6.8 % 6.9 %
Operational Review | Management Review 15

For further information regarding the proposed IPO, hereunder effects from proposed refi nancing, incentive programmes and corporate governance changes, please refer to the offering circular for ISS A/S if and when this is published.
REGIONAL DEVELOPMENT
The "ISS world" consists of seven regions: Western Eu-rope, Nordic, Asia, Pacifi c, Latin America, North America and Eastern Europe. The principle for the regional group-ing generally follows the geographical split, however the Nordic region is presented separately from the Western European region. In addition, in order to highlight the performance of emerging markets, ISS discloses certain information for emerging markets.
The description of regions below comprises countries generating signifi cant revenue. In addition, ISS operates in a number of countries which due to negligible revenue are not included. Those countries are: Bosnia and Herze-govina, Bulgaria, Colombia, Costa Rica, Ecuador, Latvia, Lithuania, Panama, Peru, Puerto Rico and Venezuela.
Western EuropeThe Western European region comprises France, the United Kingdom, Spain, the Netherlands, Belgium & Luxembourg, Switzerland, Germany, Turkey, Israel, Austria, Greece, Ireland, Portugal, Italy and South Africa.
The markets included in the Western European region are generally characterised as developed markets. Most countries in the region have experienced improving but still challenging market conditions during 2010. However, the market conditions in Greece are still very diffi cult as a result of the economic instability in the country. The ISS operations in the region generally have well developed service platforms and delivery models. In 2010 focus has been on further developing sales processes targeting selected customer segments as well as implementing best practice operational processes and concepts in order to develop the best possible value proposition to support our chosen customer segments.
In 2010, revenue in the Western European region in-creased by 1% to DKK 39,121 million. Organic growth was positive by 1% and currency adjustments increased revenue for the region by approximately 2%. This was offset by 2% negative growth from acquisitions and divestments, net. Turkey, Germany, the United Kingdom, Israel, Spain, Italy, Portugal and the Netherlands all deliv-ered positive organic growth rates resulting in a weighted organic growth rate of 3.7% for these countries. The
organic growth was a result of improved economic condi-tions combined with successful sales efforts. This positive effect was partly offset by mainly France still suffering from exposure to the manufacturing and public sectors. In addition, the effect from the turnaround initiatives have yet to substantially materialise. Finally, Greece and Ireland were negatively impacted by the economic instability, leading to negative organic growth as both public and private spending was reduced.
Operating profi t before other items in Western Europe increased by 11% to DKK 2,278 million in 2010. The op-erating margin of 5.8% was 0.5 percentage point higher compared with 2009. The increase was a result of a generally strong development in operating margin across the region despite a still challenging economic environ-ment, with the exception of Greece, where the operating margin decreased signifi cantly due to economic instability in the country. To a large extent, the operating margin improvements are a result of the actions taken in 2009 to increase effi ciencies and improve profi tability. In France, the operating margin was 4.2% which was an increase of
WESTERN EUROPE 2010
REVENUE
39.1 DKK billion 53% of Group
revenue
% of total Western Europe revenue
France 21%
United Kingdom 19%
Spain 11%
Netherlands 9%
Belgium & Luxembourg 8%
Switzerland 7%
Germany 7%
Turkey 5%
Israel 4%
Austria 3%
Greece 2%
Ireland 2%
Portugal 1%
Italy 1%
South Africa 0%
0 5 10 15 20 25
EMPLOYEES
213.1 in thousands 41% of Group employees
16 Annual Report 2010

0.4 percentage point compared with 2009. The increase was mainly a result of a positive effect stemming from the newly introduced Contribution économique territo-riale (CET), which is recognised as part of income taxes, replacing the Taxe professionnelle, which historically has been recognised as part of staff costs as well as a posi-tive effect from the turnaround plan initiated in 2009. However, France remains in its early recovery phase from the exposure to the manufacturing sector, as well as to the public sector where reduced public spending had a negative impact especially on landscaping services, which led to an overall negative organic growth and conse-quential pressure on the operating margin. In addition, the operating margin in France was in 2010 negatively impacted by further organisational changes related to the turnaround initiatives started in 2009.
Nordic The Nordic region, comprising Norway, Finland, Sweden, Denmark, Greenland and Iceland, is among the most developed. ISS is the leader within the facility services market throughout the region.
During 2010, the Nordic region has been focused on con-tinuing the implementation of The ISS Way that started in 2009. One of the most important success criteria in the Nordic strategy is to create profi table organic growth. This will be achieved through a strong service delivery locally in each of the countries supported by the newly established Nordic sales organisation that will mainly focus on sales to larger complex customers within selected segments. During 2010, a central sales and segmentation process and structure has been implemented enabling our Nordic region to focus on the right customer segments going forward. Furthermore, a Nordic pilot project focused on single service excellence and best practices sharing within cleaning services across the Nordic region has shown an attractive potential for standardisation of concepts and methods. The implementation and roll-out will continue within cleaning services going into 2011. To further secure a continued focus on best practices sharing and busi-ness innovation across the region, it has been decided to strengthen the regional organisation within Business Development and Innovation.
In 2010, revenue in the Nordic region increased by 6% from DKK 16,367 million in 2009 to DKK 17,301 million. Organic growth amounted to 4% and resulted from stra-tegic initiatives focused on sales combined with a positive effect from non-recurring services such as snow removal. The impact from divestments was a revenue reduction of 3%, resulting primarily from the divestments completed in Sweden and Norway in 2009 and 2010. Currency adjust-ments increased revenue for the region by approximately
5%, which stemmed mainly from an appreciation of NOK and SEK against DKK.
Operating profi t before other items in the Nordic region amounted to DKK 1,228 million in 2010 compared with DKK 1,219 million in 2009. The operating margin in the region remained above 7.0%, in 2010 at 7.1% compared with 7.4% in 2009. The operating margin in 2010 was positively impacted by one-off income related to sale of certain assets. The drivers behind the continued high op-erating margin in the Nordic region are ISS’s high market share and broad service offering combined with a suc-cessful effort to increase the services delivered to existing customers.
Asia The Asian region comprises Hong Kong, Singapore, Indonesia, Thailand, India, China, Taiwan, Malaysia, Philip-pines, Japan and Brunei.
In 2010, the Asian region focused on building and de-veloping the service platform but also on leveraging on several years of strong growth in the region which has secured ISS a stronger market share and service offering in the region. The strategy is to develop and deliver IFS solutions to major global companies in chosen sectors as the IFS market matures and at the same time continue to build leading local presence. In 2010, the region contin-ued the service transformation with a decreasing share of revenue stemming from cleaning services and with an
NORDIC 2010
REVENUE
17.3 DKK billion 23% of Group
revenue
Norway 33%
Sweden 23%
Finland 22%
Denmark 21%
Greenland 1%
Iceland 0%
% of total Nordic revenue
0 10 20 30 40
EMPLOYEES
45.2 in thousands 9% of Group employees
Operational Review | Management Review 17

increase in revenue share in mainly catering services, secu-rity services and property services. Especially property ser-vices and security services have been a catalyst for organic revenue growth and cross selling activities. Furthermore, the acquisition of SDB Cisco Ltd. in India added compe-tencies within security services, mainly within manned guarding, enabling India to deliver a full IFS offering. ISS India was in 2010 the fastest organic growing country operation in the region.
Revenue in Asia increased by 31% from DKK 4,120 million in 2009 to DKK 5,401 million in 2010. The increase was driven by organic growth of 13% and acquisition-driven growth of 5% as well as a positive impact of 13% from currency adjustments. All countries in the region except for the Philippines, Singapore, Brunei and Japan delivered double-digit organic growth rates. The continued strong organic growth was driven by strong GDP development in the countries in the region. However, in most countries in the region, ISS delivered organic growth rates in excess of the GDP growth as a result of among other things new sales and cross-selling activities within property services and security services.
Operating profi t before other items in Asia increased by 32% to DKK 407 million in 2010 compared with DKK 308 million in 2009. The operating margin was maintained at 7.5% in 2010, the highest margin of any ISS region, and refl ects a relatively stable development in most countries in the region supported by the double-digit growth rates and a continued focus on contract effi ciencies.
Pacifi cThe Pacifi c region comprises Australia, which ISS entered in 2002, and New Zealand, which ISS entered in 2005. ISS in Australia delivers more than 90% of the revenue in this region.
In 2010, the focus in Australia has been on further devel-oping and refi ning the IFS value proposition within the remote site resource sector and within security services to the transportation segment (mainly airports). In New Zea-land the focus was mainly on initiatives aimed at increas-ing the operating margin.
Revenue in the Pacifi c region increased by 33% to DKK 5,018 million in 2010. Organic growth increased revenue by 8%, which stemmed mainly from an all-time high organic growth of 8.6% in Australia due to positive effects of maintaining and increasing revenue from the existing client base combined with the positive effect from a large new contract within the Healthcare segment. Growth from ac-quisitions increased revenue by 1%. Currency adjustments increased revenue for the region by approximately 24%.
In the Pacifi c region, operating profi t before other items increased by 29% to DKK 333 million in 2010. The oper-ating margin in the region amounted to 6.6% in 2010, compared with 6.9% in 2009. The decrease in operating margin related primarily to New Zealand, where the full-year effect of margin improvement initiatives implement-ed during 2010 will not fully materialise until 2011. The operating margin in Australia was in line with expecta-
PACIFIC 2010
REVENUE
5.0 DKK billion 7% of Group
revenue
Australia 91%
New Zealand 9%
% of total Pacific revenue
0 20 40 60 80 100
EMPLOYEES
15.4 in thousands 3% of Group employees
ASIA 2010
REVENUE
5.4 DKK billion 7% of Group
revenue
Hong Kong 26%
Singapore 19%
Indonesia 16%
Thailand 13%
India 11%
China 6%
Taiwan 5%
Malaysia 2%
Philippines 1%
Japan 1%
Brunei 0%
% of total Asia revenue
0 5 10 15 20 25 30
EMPLOYEES
164.5 in thousands 31% of Group employees
18 Annual Report 2010

tions – slightly below the level realised in 2009, mainly as a result of start-up costs concerning a large new contract within the Healthcare segment.
Latin AmericaThe Latin American region comprises Brazil, Mexico, Chile, Argentina and Uruguay.
ISS has built a unique position in Latin America, currently the fastest growing region within the ISS Group. ISS has a strong geographical presence and a developed service offering which means that no other competitor is able to self-deliver a comparable number of services in the countries in which ISS is present. Focus is on exploiting our fi rst mover advantage and selectively expand the geographical platform as markets mature. In addition, Latin America will continue to establish and develop IFS and facility management capabilities in all operating and non-operating countries in order to leverage IFS offerings and thereby position ISS as the top IFS provider in the region. In 2010, the strategic direction combined with a very systematic and customer focused sales approach in line with The ISS Way strategy were the drivers behind an impressive organic growth in the region.
Revenue in Latin America increased by 48% from DKK 2,077 million in 2009 to DKK 3,070 million in 2010. Organic growth amounted to 29%, which was driven mainly by organic growth of 37% in Brazil and double-digit organic growth rates in the remaining countries in the region. The strong organic growth in Brazil was driven by several contract wins within mainly the telecommunications sector and with shopping malls. Currency adjustments increased revenue for the region by approximately 19%.
In Latin America, operating profi t before other items increased by 36% to DKK 178 million in 2010. The operat-ing margin was 5.8% in 2010, 0.5 percentage point lower than in 2009. Brazil, Mexico and Uruguay increased their margin compared with 2009 as a result of strong organic growth combined with the continued focus on contract ef-fi ciencies, which was more than offset by margin decreases in Chile and Argentina. In Chile, the margin was impacted partly by the effects of the earthquake earlier in 2010.
North AmericaThe North American region comprises the USA, which ISS entered in 2007, and Canada, which ISS entered through a greenfi eld establishment in 2009 via our US operations.
ISS has established good geographical coverage in several of the economical growth areas in the USA and continues to focus on enhancing its geographical footprint in select-ed targeted metropolitan areas. In 2010, the region con-tinued the development of more customer focused and segmented value propositions, targeting specifi c customer
LATIN AMERICA 2010
REVENUE
3.1 DKK billion 4% of Group
revenue
Brazil 56%
Mexico 17%
Chile 14%
Argentina 10%
Uruguay 3%
% of total Latin America revenue
0 10 20 30 40 50 60
EMPLOYEES
50.3 in thousands 9% of Group employees
Operational Review | Management Review 19
ISS's ability to successful win and self-deliver on facility service contracts at local, regional and now also truly global levels proves to our customers the strength of our commercial value proposition. Together, our global presence, broad service offering and unique self-delivery model give us a strong foundation for capturing growth opportunities in the facility services market.Jeff GravenhorstGroup CEO

NORTH AMERICA 2010
REVENUE
2.6 DKK billion 4% of Group
revenue
USA 100%
Canada 0%
% of total North America revenue
0 20 40 60 80 100
EMPLOYEES
14.9 in thousands 3% of Group employees
segments. Furthermore, IFS sales represent a signifi cant opportunity for ISS, and a dedicated team is now in place to capitalise on the market opportunities. The presence in North America also represents a strong platform to sup-port additional bids on global contracts which has most recently resulted the win of a 5 year global contract with HP for integrated facility services, where the US opera-tions will service 261 sites across the USA and Canada.
Revenue in the North American region increased by 4% to DKK 2,625 million in 2010. Organic growth was nega-tive by 1% while currency adjustments increased rev-enue for the region by 5%. The slightly negative organic growth is a result of diffi cult market conditions that is still infl uenced by the uncertainty in the North American economy and consequential low level of new sales.
Operating profi t before other items in North America amounted to DKK 132 million in 2010 compared with DKK 134 million in 2009. The operating margin in 2010 was 5.0% compared with 5.3% in 2009. 2010 was a transformational year where investments in building up competencies led to the HP Americas contract win. This together with the slightly negative organic revenue growth and start-up costs for large contracts won in 2010 led to the small margin decrease.
Eastern EuropeThe Eastern European region comprises the Czech Repub-lic, Slovakia, Poland, Romania, Slovenia, Hungary, Estonia, Russia and Croatia.
ISS has established a wide geographical reach and a strong service platform in Eastern Europe which means that no other competitor is able to self-deliver a compa-rable number of services in the countries in which ISS is present.
After a harsh macro economic climate during 2009 some of the countries in Eastern Europe started to see a recovery during 2010 whereas other countries in the region were still impacted by the economic slowdown. Even though the outsourcing rates are increasing all over Eastern Europe, it is still a developing region in terms of maturity in the facility services market. We experience a growing demand for multi services and integrated service solutions coming from international and multinational clients. Dur-ing 2010, the main focus has been on driving alignment of processes and implementation of best practices within sales, contract and risk management, single service excel-lence, HR minimum standards and procurement.
Revenue in Eastern Europe increased by 3% from DKK 1,561 million in 2009 to DKK 1,602 million in 2010. This
increase was driven by currency adjustments of 3%. Organic growth was 0% and was impacted by a general request for price reductions from customers resulting from the still challenging economic climate. Double-digit growth rates were seen in Russia, Romania and Slove-nia and were driven by a strong development within IFS services in Russia and Romania and a strong develop-ment in catering in Slovenia. The strong development in these countries was offset by the development in Czech Republic and Slovakia, where revenue decreased mainly as a result of lower demand within property services.
EASTERN EUROPE 2010
REVENUE
1.6 DKK billion 2% of Group
revenue
Czech Republic 26%
Slovakia 17%
Poland 12%
Slovenia 11%
Romania 10%
Hungary 10%
Estonia 8%
Russia 4%
Croatia 2%
% of total Eastern Europe revenue
0 5 10 15 20 25 30
EMPLOYEES
19.2 in thousands 4% of Group employees
20 Annual Report 2010

REVENUE BY CUSTOMER SEGMENT 2010
Business services & IT 26%
Public administration 16%
Industry & Manufacturing 14%
Healthcare 12%
Transportation & Infrastructure 7%
Retail and Wholesale 7%
Energy & Resources 4%
Hotels, Leisure & Entertainment 4%
Food & Beverage 3%
Pharmaceuticals 2%
Other 5%
% of Group revenue
0 5 10 15 20 25 30
Operating profi t before other items in Eastern Europe increased by 7% to DKK 113 million in 2010. Despite requests for price reductions from customers, the operating margin increased by 0.3 percentage point to 7.1% in 2010. This was due mainly to operating margin improvements in Slovakia, Slovenia, Hungary and Poland, and was a result of cost savings and increased contract effi ciencies following roll-out and implementation of best practices.
BUSINESS DEVELOPMENT IN 2010
During 2010, in line with The ISS Way strategy, ISS contin-ued to enhance its response to customer needs by focus-ing on further developing and refi ning the value proposi-tion to customers within selected customer segments.
ISS also focused on securing service excellence by driving the global implementation of best practices and standard processes in 2010. Investments have been made in excel-lence centres both globally and locally and the excellence centres, which ensure a continuous improvement in ef-fi ciencies, have now been established for several service types. The development of best practices within the excellence centres is not only focused on the services ISS delivers but also the way in which the service is delivered and on specifi c service offerings for specifi c customer segments.
ISS measures and monitors the overall business develop-ment based on the following three measures:
Revenue by customer segment Revenue by service delivery type Revenue by service type
The development within these three categories is de-scribed in the following.
Revenue by customer segment In line with an increased focus on developing market-leading value propositions across a number of selected customer segments, ISS has as of 2010 split its revenue by a set of defi ned customer segments.
The segmentation of revenue by customer segment fol-lows 10 customer segments identifi ed by ISS based on the section classifi cation level of the International Standard Industrial Classifi cation.
Our service offerings are increasingly tailored to specifi c customer segments in order to address these customers’ explicit needs resulting in additional value added.
ISS focuses on promoting a strong and uniform commer-cial culture through deployment of a commercial strat-egy methodology and to leverage its platform towards selected customer segments.
The Business services & IT, Public administration and Healthcare segments are among our most important and largest customer segments, and we focus on developing services solutions for these segments. Simultaneously, we focus on service delivery to the public sector, which includes both the Public administration segment as well as part of the revenue included in Healthcare, Transportation & Infrastructure and Energy & Resources.
Revenue by service delivery typeFundamentally, ISS's delivery model includes three differ-ent ways of delivering services to customers. Service solu-tions are offered either as single services, multi services or integrated facility services. In 2010, ISS continued to develop and strengthen the single service excellence con-cepts and integrated facility services capabilities.
In 2010, single services, including key accounts, multi services and integrated facility services generated 64.8%, 16.5% and 18.7% of our revenue, respectively, compared with 67.0%, 15.3% and 17.7% in 2009. The development illustrates that the share of revenue origin from deliver-ing two or more services or integrated service solutions increased by 2.2 percentage points in 2010 with a similar reduction in the share of revenue stemming from deliver-ing of single services. This development is a continua-tion of the trend in recent years and fully in line with the strategic aim of becoming the leading global provider of integrated facility services.
Operational Review | Management Review 21

DEVELOPMENT IN REVENUE
BY DELIVERYSingle services
Key accounts
Multi services
Integrated facility services
% of Group revenue
0 10 20 30 40 50 60
’09
’10
’09
’10
’09
’10
’09
’10
BY SERVICE
Cleaning services
Property services
Catering services
Support services
Security services
Facility management
% of Group revenue
0 10 20 30 40 50 60
’09
’10
’09
’10
’09
’10
’09
’10
’09
’10
’09
’10
Revenue by service typeCleaning services ISS’s cleaning services offering encompasses a range of services within daily offi ce and facility cleaning, hospital cleaning, food hygiene, indus-trial cleaning, cleaning in transport systems, dust control, washroom services and specialised cleaning e.g. of win-dows, communication equipment etc.
In 2010, cleaning services remained ISS’s largest business area with revenue of DKK 38.4 billion, representing 52% of total Group revenue, unchanged compared with 2009. In line with the strategy to broaden the service platform, cleaning services relative share of total Group revenue has in recent years continuously been diluted, while the revenue share from support services, catering services and security services in particular has continued to increase. In 2010, cleaning services share of revenue was unchanged compared with 2009 as a result of a recovery in recur-ring portfolio-based services within cleaning services, which in 2009 were impacted by reductions in volume on contracts, price pressure and low incremental spend-ings by customers. In addition, the change in focus from building the service platform through acquisitions within other services than cleaning to utilising the existing service platform combined with a number of divestments within other service types has maintained cleaning services share of revenue at 52% in 2010.
Property services ISS’s property services offering en-compasses building maintenance, technical maintenance, landscaping, pest control and damage control.
In 2010, revenue from property services amounted to DKK 14.6 billion, representing 20% of total Group revenue compared with 21% in 2009. In 2010, property services which encompasses non-portfolio-based services was still negatively impacted by the downturn in the construction-based industries e.g. building and grounds construction leading to few building installation projects and landscaping projects. Furthermore, revenue within Property services was negatively impacted by a number of divestments completed in 2010, most signifi cantly the waste management business in France, the non-core building maintenance business in Spain and the non-core property services business in Norway.
Support services ISS’s support services offering encom-passes the operation of receptions, internal mail handling, scanning and other offi ce logistics, call centres, manpow-er supply and outplacement services.
In 2010, support services accounted for approximately 8% of total Group revenue, up almost 1 percentage point compared with 2009. In absolute fi gures, revenue in
support services increased from DKK 5.0 billion in 2009 to DKK 5.6 billion in 2010. In 2010, support services was positively impacted by higher demand for outplacement services and cross selling of services to mainly cleaning customers offset by lower demand for manpower supply services.
Catering services ISS’s catering services offering includes in-house restaurants, hospital canteens, cater-ing services to remote sites, corporate catering and offi ce catering services such as coffee solutions.
In 2010, revenue from catering services amounted to DKK 7.1 billion equal to 10% of total Group revenue, up almost 1 percentage point compared with last year. In 2010, catering services continued to be positively impacted by cross selling to existing customers combined with a gradu-al recovery in revenue from non-portfolio-based services within catering services e.g. event catering.
22 Annual Report 2010

Security services ISS’s security services offering includes manned guarding, access control and patrolling of custom-er facilities and the installation of alarm and access systems.
Revenue increased by DKK 0.6 billion to DKK 5.2 bil-lion, equivalent to 7% of total Group revenue in 2010, unchanged compared with 2009. ISS's service offering within security services was strengthened further in 2010 through the acquisition of SDB Cisco Ltd. in India which added approximately DKK 400 million in annual revenue. The increase in revenue from security services was also positively impacted by strong organic growth in Asia which was partly offset by the divestment of the security business in France.
Facility management services ISS’s facility management offering includes on-site management of facility services, change management, space management and consult-ing. In 2010, revenue from facility management services increased by DKK 0.6 billion to DKK 3.2 billion, equivalent to 4% of total Group revenue, the same relative share as the year before. The increase was positively impacted by start-up of remote site mining contracts in Australia.
ACQUISITIONS AND DIVESTMENTS
Following several years with a high number of acquisi-tions in order to build the business platform globally, since mid-2008 ISS has tightened its strategic and fi nancial fi lter, leading to a more disciplined acquisition policy and to a focus on exploiting the platform to generate organic growth and improved operational performance. In 2010, one acquisition was completed.
In August, ISS acquired a 49% ownership share of SDB Cisco Ltd. in India, a well-recognised security services pro-vider in India, with approximately 80% of revenue stem-ming from manned guarding. Through the acquisition, ISS in India added security services to its service platform, and can now provide the full house of services. The acquisition added approximately DKK 400 million in annual revenue and 27,000 employees.
The strategic rationale behind selected acquisitions was reviewed in the light of the ISS Way strategy, which led to the identifi cation and evaluation of certain activities that were either non-core to The ISS Way strategy or lacked critical mass. Some of these activities were divested in 2009, and additional nine divestments were completed in 2010. The divestments in 2010 comprise the non-core waste management activities and security activities in France, non-core building maintenance activities in Spain, non-core property service activities in Norway, contact
centres in Denmark and the washroom activities in Den-mark, Norway and Sweden.
The divestments completed in 2010, of which the major-ity of the activities were classifi ed as held for sale at 31 December 2009, resulted in a positive effect of DKK 46 million in other income and expenses, net and an impair-ment loss on goodwill of DKK 9 million.
Towards the end of 2010, sales processes have been initi-ated for additionally two non-core activities in Western Europe, which have been classifi ed as held for sale at 31 December 2010.
We expect to continue a disciplined acquisition policy in the future and expect that such acquisition activities will primarily take place in emerging markets, either by ex-panding our presence in existing markets through bolt-on acquisitions or by establishing a service platform in new markets. Future acquisitions might also include selective competence enhancing acquisitions in developed markets. We expect that the average annual amount to be spent on acquisitions in the short term will be approximately half a billion Danish kroner (although the actual amount in any given year will depend on the timing of transactions).
FINANCING
ISS has committed long-term fi nancing in place following the repayment of the remaining 2010 EMTNs in Septem-ber 2010.
The outstanding EUR 350 million of the 2010 EMTNs was successfully repaid by proceeds raised from the receiva-bles backed securitisation of trade receivables, which was launched in 2009 in fi ve countries and increased by fi ve additional countries during 2010. EUR 150 million were tendered in January and the remaining EUR 200 million were redeemed at maturity in September 2010. The tender in January resulted in an accounting loss of DKK 32 million as the bonds were bought back at a price slightly higher than their nominal value and additionally due to the fair value adjustment made in connection with the acquisition of the former ISS A/S in 2005.
In March 2010, ISS took advantage of the strong capital market environment and successfully raised EUR 127.5 million through a tap issue of the existing 8.875% 2016 Senior Subordinated Notes (increasing this to a total of EUR 581.5 million). The proceeds of this tap issue were intended for general corporate purposes, including poten-tial acquisitions, liquidity and back-up for the refi nancing of the 2010 EMTNs.
Operational Review | Management Review 23

MANAGEMENT CHANGES
On 1 April 2010, the former Group COO Jeff Gravenhorst took over the responsibility as new Group CEO replacing Jørgen Lindegaard. The Executive Group Management team consists of Group CEO Jeff Gravenhorst and Group CFO Jakob Stausholm.
On 6 April 2010, Jørgen Lindegaard was elected as new member of the Board of Directors of ISS.
On 9 July 2010, Michel Combes was elected as new mem-ber of the Board of Directors of ISS replacing Christoph Sander and on 25 August 2010, Marcus Brennecke and Casper von Koskull stepped down as members of the Board of Directors of ISS.
SUBSEQUENT EVENTS
On 17 February 2011, the Group announced that it con-templates launching an Initial Public Offering (IPO) of shares and to list its shares on NASDAQ OMX Copenhagen.
The contemplated IPO is expected to consist primarily of a sale of new shares to raise gross proceeds of approxi-mately DKK 13.3 billion, which are proposed, together with amounts drawn under a new facilities agreement to repay all amounts under our current senior secured facili-ties and second lien facility. A partial secondary sell-down of shares by our existing shareholder, FS Invest II S.à r.l., which is indirectly controlled by certain funds advised by EQT Partners and funds affi liated with Goldman Sachs & Co., is expected to cover the obligations under our man-agement and employee incentive programmes.
The new facilities agreement, which was put in place on 18 February 2011, will be able to be drawn upon subject to satisfaction of certain conditions precedent, including that the offering of the shares contemplated by the IPO has occurred or will occur contemporaneously with the new facilities agreement fi rst utilisation. The new facility is in place with a smaller number of relationship banks and gives the fl exibility to pay margins dependant on our leverage at a given time.
Apart from the above and the events described in this annual report, the Group is not aware of events subse-quent to 31 December 2010, which are expected to have a material impact on the Group's fi nancial position.
24 Annual Report 2010 24 Annual Report 2010

AULI NVANNAH, HELSINKI THEATRE ACADEMY,
FINLAND
INES KAISER, DEUTSCHE BUNDESPOLIZEI, GERMANY
WILMA HANSEN, THE ROYAL LIBRARY, DENMARK
PUBLIC ADMINISTRATION – representing 16% of Group revenue The Public administration customer segment includes governments, municipalities, educational institutions and defence. At ISS we tailor our solution to meet individual needs and as a result we enable our customers within Public administration to deliver essential services and effectively manage the increasing constraints on government expenditure.

HO KA YIU, HONG KONG AIRPORT, HONG KONG
SATPRIT KAUR, ARLANDA AIRPORT, SWEDEN
ZURICH INTERNATIONAL AIRPORT, SWITZERLAND
BENNY LUNDORFF AND LEIF NIELSEN, THE GREAT BELT BRIDGE, DENMARK
TRANSPORTATION & INFRASTRUCTURE – representing 7% of Group revenue This customer segment includes customers who provide transportation by airplanes, trains, trucks, buses or subway systems. ISS services private and public customers who carry passengers or provide freight transport. The customers within Infrastructure handle maintenance, construction and repair of roads, railroads, harbours and airfi elds. The timely and safe movement of goods and people is critical for our customers, and we assist in their continuous process of delivering faster, further, with less cost and with a sustainable profi le.

Outlook
The outlook set out below should be read in conjunction with "Forward-looking statements" (see below) and the description of risk management on pages 54-55.
In 2011, ISS will maintain its focus on key operational objectives; (i) organic growth, (ii) operating margin and (iii) cash conversion.
The increased economic stability seen in 2010 in several of the markets in which ISS operates is expected to continue. In addition, the economic uncertainty experienced in certain countries in Western Europe is expected to con-tinue to impact the countries in which ISS operates in this region. The general increase in demand for our services seen in 2010 is expected to continue in 2011. In addition, the three major Corporate Clients contract wins in the second half of 2010 will positively affect revenue growth in 2011. Consequently, ISS expects revenue growth in 2011 to be approximately 4% assuming constant foreign exchange rates and before the impact of any acquisition or divestment in 2011. This expected revenue growth is negatively impacted by approximately 1%-point related to the net effect of the acquisition and the divestments completed in 2010.
ISS increased its profi tability in 2010 and delivered an operating margin of 5.8% compared with 5.6% in 2009. Through the increase in revenue combined with a general margin improvement, ISS expects its operating margin for 2011 to be slightly above the level realised in 2010.
ISS will continue to prioritise cash fl ow and we will focus on managing the absolute level of debt supported by a continued low level of acquisition spending and continued robust cash conversion, which in 2011 is expected to be at the level realised in 2010.
FORWARD-LOOKING STATEMENTS
This report contains forward-looking statements, including, but not limited to, the guidance and expectations contained in the "Outlook" section on this page. Statements herein, other than statements of historical fact, regarding future events or prospects, are forward-looking statements. The words "may", "will", "should", "expect", "anticipate", "be-lieve", "estimate", "plan", "predict", "intend" or variations of these words, as well as other statements regarding matters that are not historical fact or regarding future events or pros-pects, constitute forward-looking statements. ISS has based these forward-looking statements on its current views with respect to future events and fi nancial performance. These views involve a number of risks and uncertainties that could cause actual results to differ materially from those predicted in the forward-looking statements and from the past perfor-mance of ISS. Although ISS believes that the estimates and projections refl ected in the forward-looking statements are reasonable, they may prove materially incorrect, and actual results may materially differ, e.g. as the result of risks related to the facility service industry in general or ISS in particular including those described in this report and other information made available by ISS.
As a result, you should not rely on these forward-looking statements. ISS undertakes no obligation to update or revise any forward-looking statements, whether as a result of new information, future events or otherwise, except to the extent required by law.
Outlook | Management Review 27

FAZLINA, RAFFLES HOSPITAL, SINGAPORE
PAUL BOZVARD, WORCESTERSHIRE HOSPITAL, UK
MOBILE DECONTAMINATION UNIT, UK
LAI TSZ FUNG AND MAO LIU MIN, ALICE HO MIU LING NETHERSOLE HOSPITAL, HONG KONG
HEALTHCARE – representing 12% of Group revenue Within the Healthcare customer segment we have a market leading position in UK and Singapore. The Healthcare segment includes customers with activities starting from healthcare provided by trained medical professionals in hospitals to residential care activities. ISS services both general hospitals e.g. community and regional hospitals, and specialised hospitals e.g. mental health and maternity hospitals. The services range from reception services, patient feeding, catering to staff and visitors, bio-cleaning of patient and operating rooms to maintenance. The purpose is to provide a comfortable daily life for our customers’ patients, their families and staff while enhancing our customers’ competitiveness through letting them focus on their core competence.

Financial review
INCOME STATEMENT
Revenue amounted to DKK 74,073 million representing year-on-year revenue growth of 9%, excluding the impact of acquisitions and divestments. Revenue growth was driven by organic growth of 3.5% with positive organic growth rates delivered by fi ve of seven regions and with Latin America and Asia once again delivering double-digit organic growth rates. Revenue was positively impacted by exchange rate movements of 5%, mainly stemming from an appreciation of AUD, NOK and SEK against DKK. Revenue growth was impacted by 2% negative growth from acquisitions and divestments, net.
Staff costs increased by DKK 3,209 million, or 7%, from DKK 44,781 million in 2009 to DKK 47,990 mil-lion in 2010. This increase was due primarily to currency exchange-rate movements and an increase in the overall number of employees as a result of organic growth and the acquisition of SDB Cisco Ltd. in India partly offset by the effect from completed divestments. Staff costs as a percentage of revenue decreased slightly from 64.9% in 2009 to 64.8% in 2010.
Consumables increased by DKK 315 million, or 5%, from DKK 6,044 million in 2009 to DKK 6,359 million in 2010. Consumables which comprise items such as chemicals, food costs and uniforms amounted to 8.6% as a percent-age of revenue in 2010, a slight decrease compared with 8.8% in 2009.
Other operating expenses increased by DKK 1,170 million, or 9%, from DKK 13,437 million in 2009 to DKK 14,607 million in 2010 and other operating expenses as a percentage of revenue totalled 19.7%, up slightly compared with 19.5% in 2009. The increase was a result of an increase in costs related to subcontractors which as a percentage of revenue increased from 7.1% in 2009
Success in execution of the ISS Way strategy as well of signs of recovery of the global economy meant that ISS was able to show improvements on all key operational objectives in 2010.
REVENUE
65
70
75
60
55
502008 2009 2010
DKK billion
ORGANIC GROWTH, %
2008 2009 20100
1
2
3
4
5
6
OPERATING MARGIN, %
2008 2009 20105.00
5.25
5.50
5.75
6.00
CASH CONVERSION, %
2008 2009 201094
96
98
100
102
104
Financial Review | Management Review 29

In 2010, fi nancial income and expenses, net mainly com-prised DKK 1,964 million of net interest expenses, DKK 259 million in expenses related to changes in fair value of hedges, DKK 123 million in amortisation of fi nancing fees, DKK 48 million in net gains on foreign exchange, DKK 40 million related to amortisation of fair value adjustment of issued bonds and a loss of DKK 32 million related to repayment of the 2010 EMTNs acquired at nominal value with a carrying amount lower than nominal value due to the market value adjustment made in connection with the acquisition of the former ISS A/S.
Of the total fi nancial income and expenses, net in 2010 and 2009, expenses of DKK 72 million and DKK 255 mil-lion, respectively, resulted from charges relating to the purchase price allocation in May 2005 in connection with the acquisition of the former ISS A/S. See Purchase price allocation in May 2005 on page 31.
Income taxes increased from DKK 588 million in 2009 to DKK 760 million in 2010. The effective tax rate was 42.4% in 2010 compared with 60.4% in 2009, calcu-lated as the consolidated tax expense of DKK 760 million divided by the Profi t before tax and goodwill impairment / amortisation and impairment of brands and customer contracts of DKK 1,791 million. The tax expense in 2010 was adversely impacted by the rules on limitation on the deductibility of fi nancial expenses in Denmark of approxi-mately DKK 615 million compared with DKK 559 million in 2009. The effective tax rate amounts to 33.8% when adjusted for the impact of the limitation on deductibility of fi nancial expenses. The net effect on the interest limita-tion in 2010 amounted to DKK 154 million compared with DKK 137 million in 2009. In addition, the tax expense in 2010 was adversely impacted by the newly introduced Contribution économique territoriale (CET) in France replacing the Taxe professionnelle which historically has been recognised as part of staff costs as well as write down of tax assets in certain countries in Western Europe following divestments and classifi cation of activities as held for sale. These negative effects have been partly off-set by Danish credit possibilities for paid withholding taxes that are non-proportional to the profi t before tax.
Of the total income taxes in 2010 and 2009, income of DKK 18 million and DKK 64 million, respectively, resulted from charges relating to the purchase price allocation in May 2005 in connection with the acquisition of the former ISS A/S. See Purchase price allocation in May 2005 on page 31.
Goodwill impairment amounted to DKK 938 million of which DKK 929 million derived from impairment tests and DKK 9 million derived from divestment of businesses.
to 8.0% in 2010, mainly as a result of the increase in number of global contracts, where ISS in certain coun-tries, where there is no ISS operation, relies on the use of subcontractors.
Operating profi t before other items amounted to DKK 4,267 million in 2010, an increase of 10% from DKK 3,874 million in 2009. The increase was a result of improved operational performance and an increase in rev-enue as a result of organic growth and positive exchange rate movements. The operating margin increased to 5.8% compared with 5.6% in 2009. This was due mainly to an increase in operating margin in Western Europe and was to a large extent a result of the actions taken in 2009 to increase effi ciencies and improve profi tability com-bined with positive organic growth. Corporate overhead costs were 0.5% of revenue in 2010, unchanged from 2009.
Other income and expenses, net, represented a net expense of DKK 112 million in 2010 compared with a net expense of DKK 551 million in 2009. Expenses of DKK 113 million related to prior year adjustments in Norway, DKK 16 million related to redundancy and severance payments related to senior management changes and DKK 17 mil-lion comprised costs related to the initiated IPO process. Partly offsetting these expenses was a net gain of DKK 46 million related to divestments, mainly stemming from a gain from the divestment of the washroom activities in Denmark, Norway and Sweden partly offset by a loss from divestment of mainly the waste management activi-ties and the security activities in France, both of which were classifi ed as held for sale at 31 December 2009.
In 2009, other income and expenses, net, represented a net expense of DKK 551 million mainly related to restruc-turing projects of DKK 426 million in France, Germany, Spain, Australia, Belgium, Denmark, Finland and the United Kingdom as well as impairment losses related to activities classifi ed as held for sale of DKK 159 million partly offset by a net gain from divestments of DKK 83 million primarily related to the sale of the non-core laun-dry activities in Sweden and Norway.
Financial income and expenses, net represented an increase in net expenses of by DKK 60 million, or 3%, to DKK 2,368 million in 2010 from DKK 2,308 million in 2009. The reason for the increase was mainly an increase in interest expenses, net of DKK 121 million and an in-crease in amortisation of fi nancing fees of DKK 66 million partly offset by mainly a decrease in expenses related to changes in fair value of hedges of DKK 66 million and a decrease in amortisation of fair value adjustment of issued bonds of DKK 59 million.
30 Annual Report 2010

PURCHASE PRICE ALLOCATION IN MAY 2005
In connection with the acquisition of ISS World Services A/S (former ISS A/S) in May 2005, a purchase price of approximately DKK 22 billion was paid for the shares. When preparing consolidated fi nancial statements for the acquiring company, ISS A/S (former ISS Holding A/S) the purchase price paid was allocated to all identifi able assets, liabilities and contingent liabilities which were restated at their fair value in accordance with ap-plicable international fi nancial reporting standards. The residual amount was allocated to goodwill.
As the carrying amount of the net assets of the ac-quired company was approximately DKK 9 billion at the time of the acquisition, the reassessment of as-sets, liabilities and contingent liabilities to fair value resulted in an increase in carrying amount of mainly intangible assets. The table presents such fair value adjustments following the acquisition and such fair value adjustments remaining at 31 December 2010.
Apart from a material increase in intangible assets such as brands, customer contracts and goodwill there was an increase in deferred tax liabilities primarily as a result of the increase in the value of customer contracts and brands. The fair value of non-current loans and borrowings was lower than the carrying amount as a consequence of a de-crease in market value of the Medium Term Notes in relation to the acquisition of ISS World Services A/S.
The higher carrying amounts arising from the purchase price allocation in 2005, particularly in the case of goodwill and customer contracts, result in higher non-cash charges in our income statement through amortisation and impairment of customer contracts and potential goodwill impairment.The following table shows the income statement effects of the purchase price allocation in 2005 for the years ended 31 December 2010 and 2009.
DKK million
Fair value adjustments
following acquisition
Fair value adjustments remaining at 31 Dec. 2010
Goodwill 6,443 4,452
Brands 1,657 1,608
Customer contracts 6,665 3,041
Other non-current and current assets (156) 197
Pensions (30) -
Deferred tax liabilities (2,960) (1,292)
Non-current loans and borrowings 1,811 86
Non-controlling interests and other non-current and current liabilities (299) (1)
Total identifi able net assets including goodwill 13,131 8,091
2010 2009
DKK million Actual
Fairvalue
adj.
Actual excl. adj. Actual
Fairvalue
adj.
Actualexcl.adj.
Operating profi t before other items 4,267 - 4,267 3,874 - 3,874
Other income and expenses, net (112) - (112) (551) - (551)
Acquisition and integration costs (6) - (6) (46) - (46)
Operating profi t 4,149 - 4,149 3,277 - 3,277
Share of result from associates 10 - 10 4 - 4
Financial income and fi nancial expenses, net (2,368) (72) (2,296) (2,308) (255) (2,053)
Profi t before tax and goodwill impairment/amortisation and impairment of brands and customer contracts 1,791 (72) 1,863 973 (255) 1,228
Income taxes (760) 18 (778) (588) 64 (652)
Profi t before goodwill impairment/amortisation and impairment of brands and customer contracts 1,031 (54) 1,085 385 (191) 576
Goodwill impairment (938) (679) (259) (1,246) (525) (721)
Amortisation and impairment of brands and customer contracts (869) (434) (435) (1,129) (575) (554)
Income tax effect 244 128 116 361 182 179
Net profi t/(loss) for the year (532) (1,039) 507 (1,629) (1,109) (520)
Financial Review | Management Review 31

Impairment losses derived from impairment tests of DKK 929 million related to ISS France of DKK 335 million, ISS Greece of DKK 329 million, ISS Spain of DKK 150 million and ISS Ireland of DKK 115 million. The loss in France was mainly a result of a slight extension of the turnaround plan compared with prior expectations. The loss in Greece was mainly a result of an increase in the discount rate applied following an increase in the interest rate as well as challenging market conditions. In Spain and Ireland the losses were mainly a result of an increase in the interest rate. Impairment losses of DKK 9 million derived from divestment of businesses related to the divestment of the non-strategic call centre activities in Denmark and the property services activities in Ireland.
In 2009, goodwill impairment amounted to DKK 1,246 million, of which DKK 550 million derived from impair-ment tests and DKK 696 million derived from divestment of businesses, including classifi cation of activities as held for sale. Impairment losses derived from impairment tests comprised losses of DKK 450 million and DKK 100 million in France and Germany, respectively, whereas impairment losses of DKK 696 million derived from divestments mainly comprised losses related to the waste management activi-ties in France classifi ed as held for sale on 31 December 2009 as well as certain other activities sold during 2009 or classifi ed as held for sale on 31 December 2009.
Of the total goodwill impairment in 2010 and 2009, ex-penses of DKK 679 million and DKK 525 million, respec-tively, resulted from charges relating to the purchase price allocation in May 2005 in connection with the acquisition of the former ISS A/S. See Purchase price allocation in May 2005 on page 31.
A detailed specifi cation is included in note 11 to the con-solidated fi nancial statements.
Amortisation and impairment of brands and cus-tomer contracts amounted to DKK 869 million in 2010, down from DKK 1,129 million in 2009. The decrease of DKK 260 million compared with 2009 was mainly a result of an impairment loss on customer contracts of DKK 210 million in 2009 related mainly to classifi cation of the waste management business in France as held for sale on 31 December 2009 as well as a general decrease in the amortisation of customer contracts due to the use of the declining balance method.
Of the total amortisation and impairment of brands and customer contracts in 2010 and 2009, expenses of DKK 434 million and DKK 575 million, respectively, resulted from charges relating to the purchase price allocation in May 2005 in connection with the acquisition of the for-
mer ISS A/S. See Purchase price allocation in May 2005 on page 31.
Tax effect of goodwill impairment and amortisation and impairment of brands and customer contracts, which is presented separately in the income statement to show the effective tax percentage before impairment and amortisa-tion of intangibles, was DKK 244 million in 2010 com-pared with DKK 361 million in 2009. The decrease was due to the decrease in amortisation and impairment of brands and customer contracts.
Of the total tax effect of amortisation and impairment of brands and customer contracts in 2010 and 2009, income of DKK 128 million and DKK 182 million, respectively, resulted from charges relating to the purchase price allo-cation in May 2005 in connection with the acquisition of the former ISS A/S. See Purchase price allocation in May 2005 on page 31.
Net loss improved from a loss of DKK 1,629 million in 2009 to a loss of DKK 532 million in 2010, and was positively impacted by growth in revenue and improved operational performance in 2010, combined with a decrease in net expenses recognised as other income and expenses, net as well as lower non-cash expenses related
I am delighted to see that ISS improved all its key operational priorities in 2010. In a still challenging market, we grew revenue by 7.3% with the positive impact of 3.5% organic growth while managing to increase our operating margin by 0.2 percentage point to 5.8% and increasing cash conversion to 98%.Jakob Stausholm Group CFO
32 Annual Report 2010

to goodwill impairment and amortisation and impairment of brands and customer contracts compared with 2009. A loss of DKK 552 million was attributable to the owners of ISS, whereas a profi t of DKK 20 million was attributable to non-controlling interests.
Of the total net loss in 2010 and 2009, expenses of DKK 1,039 million and DKK 1,109 million, respectively, resulted from charges relating to the purchase price allocation in May 2005 in connection with the acquisition of the former ISS A/S. See Purchase price allocation in May 2005 on page 31.
STATEMENT OF CASH FLOWS
Cash fl ow from operating activities was DKK 4,036 million in 2010, up DKK 304 million from DKK 3,732 mil-lion in 2009. The development was due primarily to an increase in operating profi t before other items of DKK 393 million, a decrease in cash outfl ow regarding payments related to other income and expenses, net of DKK 174 million and a decrease in outfl ow from changes in work-ing capital of DKK 50 million partly offset by higher tax payments of DKK 303 million.
Cash outfl ow from changes in working capital of DKK 87 million was due to a negative cash fl ow from trade receivables as a result of the increase in revenue of 7% and despite a reduction of debtor days by approximately one day. This negative effect was partly offset by a posi-tive impact from trade payables mainly stemming from the increase in activity level.
Payments related to other income and expenses, net of DKK 197 million mainly related to restructuring projects initiated and expensed in 2009.
Income taxes paid increased from DKK 394 million in 2009 to DKK 697 million in 2010 as a result of improved perfor-mance in 2010 leading to higher tax payments. In addition, income taxes paid in 2009 were impacted by tax refunds.
Cash fl ow from investing activities in 2010 was a net cash outfl ow of DKK 717 million, of which DKK 470 million related to acquisitions completed during 2010 and payment of earn-outs and deferred payments on acqui-sitions completed in previous years. The sole acquisi-tion completed in 2010 was the 49% ownership in SDB Cisco Ltd. in India. The cash outfl ow from acquisitions was more than offset by proceeds from divestments of DKK 591 million that related primarily to the divestments of non-core activities in the Nordic region and France. Investments in intangible assets and property, plant and
equipment, net, (excluding acquisition-related intangibles) amounted to DKK 886 million in 2010, representing 1.2% of revenue. Investments in fi nancial assets, net, amounted to an infl ow of DKK 48 million in 2010 primarily related to sale of government bonds in ISS’s insurance captive com-pany which activities ceased in the second half of 2010.
Cash fl ow from investing activities in 2009 was a net cash outfl ow of DKK 1,832 million, of which DKK 914 million related to acquisitions completed during 2009 and pay-ment of earn-outs and deferred payments on acquisitions completed in previous years partly offset by DKK 22 million related to divestments. Investments in intangible assets and property, plant and equipment, net, (excluding acquisition-related intangibles) totalled DKK 897 million in 2009, rep-resenting 1.3% of revenue. Investments in fi nancial assets, net, totalled an outfl ow of DKK 43 million in 2009.
Cash fl ow from fi nancing activities in 2010 was a net cash outfl ow of DKK 3,186 million. This was mainly a result of repayment of borrowings of DKK 3,395 million and interest payments, net of DKK 2,278 million, partly offset by proceeds from borrowings of DKK 2,496 million. Repayment of borrowings was a result of DKK 2,606 million related to repayment of the 2010 EMTNs and re-payment of DKK 789 million on the Acquisition and Term Loan facilities. Proceeds from borrowings mainly related to the issuance of DKK 950 million (EUR 127.5 million) in debt through a tap issue in the existing High Yield Notes 2016 and additional debt raised under the securitisation programme of DKK 1,529 million since year-end 2009.
Cash fl ow from fi nancing activities in 2009 was a net cash outfl ow of DKK 1,547 million. This was mainly a result of net interest payments of DKK 2,205 million and repay-ment of borrowings of DKK 5,177 million due primarily to settlement of EUR 500 million of the 2010 EMTNs in July 2009 as well as amortisation on senior facilities. This was partly offset by drawings on credit facilities of DKK 5,849 million stemming mainly from the issuance of new Senior Notes due in 2014 in July 2009, the launch of a securiti-sation programme in the last quarter of 2009 as well as drawings on the acquisition facility up until 11 May 2009 when the acquisition facility expired.
Cash conversion Changes in working capital was DKK 87 million, which resulted in a cash conversion of 98% in 2010 compared with 96% in 2009.
Cash conversion ratios for individual years may vary. The cash fl ows from operations for the individual periods de-pend on the timing of a number of payments towards the end of the individual months and years. For a defi nition of cash conversion, see page 11.
Financial Review | Management Review 33

STATEMENT OF FINANCIAL POSITION
Total assets amounted to DKK 55,435 million at 31 De-cember 2010, of which DKK 38,367 million represented non-current assets, primarily acquisition-related intangible assets, and DKK 17,068 million represented current assets, primarily trade receivables of DKK 10,896 million.
Intangible assets decreased by DKK 94 million from DKK 35,452 million at 31 December 2009 to DKK 35,358 million at 31 December 2010. Intangible assets comprise primarily goodwill, customer contracts and brands related to a signifi cant number of acquisitions over the years. The majority stems from the acquisition of the former ISS A/S in May 2005, when a carrying amount of DKK 31,844 million of intangible assets, of which DKK 22,035 million related to goodwill, was recognised in ISS’s statement of fi nancial position.
At 31 December 2010, goodwill amounted to DKK 27,747 million, an increase of DKK 313 million or 1% from last year. Additions related to acquisitions in 2010 amounted to DKK 230 million while currency adjustments increased goodwill by DKK 1,380 million. Goodwill was reduced by DKK 355 million due to goodwill transferred to assets held for sale and due to impairment losses of DKK 938 million that related to impairment losses derived from impairment tests of DKK 335 million in France, DKK 329 million in Greece, DKK 150 million in Spain and DKK 115 million in Ireland and impairment losses derived from divestments of DKK 9 million related to the divestment of the non-core call centre activities in Denmark and the property services business in Ireland.
Goodwill is related to acquisitions, including the acquisi-tion of the former ISS A/S, carried out under varying cir-cumstances and at different stages of macroeconomic cy-cles. The goodwill is distributed on most of the countries in which the Group operates. The acquired companies, to which the goodwill relates, comprise a diverse portfolio of service types, customer segments, geographical regions, contract sizes and management skills. The largest amount of goodwill relates to the Group’s operations in France, representing approximately 14% of the total carrying amount of goodwill.
Customer contracts decreased by DKK 508 million to DKK 5,612 million at 31 December 2010. Amortisation and impairment of customer contracts of DKK 853 was partly offset by DKK 321 million in positive foreign exchange adjustments.
Assets and liabilities held for sale amounted to DKK 824 million and DKK 255 million, respectively, and include
the assets and liabilities attributable to two non-core ac-tivities in Western Europe for which sales processes have been initiated.
Non-current assets other than intangible assets amounted to DKK 3,009 million at 31 December 2010, an increase of DKK 194 million from DKK 2,815 million at 31 December 2009. The increase of DKK 194 million related mainly to an increase in deferred tax assets as a result of recognition of deferred tax assets in France.
Trade receivables increased from DKK 10,130 million at 31 December 2009 to DKK 10,896 million at 31 Decem-ber 2010. This increase was a result of the increase in revenue of 7% and despite a reduction in debtor days from 45.3 in 2009 to 44.4 in 2010.
Cash and cash equivalents increased from DKK 3,364 million at 31 December 2009 to DKK 3,606 million at 31 December 2010, of which DKK 2,431 million resided at Group level with the remainder at country level. The cash position was positively impacted by working capital infl ow in Q4 2010. The cash position may fl uctuate signifi cantly over the months due to the frequency and timing of cash collection and outgoing payments, e.g. salary payments.
Other current assets, comprising inventories, contract work in progress, tax receivables, other receivables, pre-payments and securities amounted to DKK 1,742 million at 31 December 2010, a decrease of DKK 237 million from 31 December 2009. Other receivables decreased from DKK 551 million at 31 December 2009 to DKK 348 million at 31 December 2010 as the fi gure in 2009 was impacted by receivable sales price related to divestments.
Total equity increased from DKK 2,213 million at 31 De-cember 2009 to DKK 2,651 million at 31 December 2010, of which DKK 2,626 million was equity attributable to the equity holders of ISS A/S. The total change in equity for the year attributable to the equity holders of ISS was an increase of DKK 436 million.
Net income and expenses recognised in equity increased equity by DKK 357 million. This included positive currency adjustments of DKK 911 million relating to investments in foreign subsidiaries and a positive effect of DKK 91 million related to hedges net of tax. Partly offsetting this was a net loss of DKK 532 million for the year and actuarial losses, net, including the effect of the asset ceiling on defi ned ben-efi t pension schemes that amounted to DKK 113 million.
The equity ratio, defi ned as total equity attributable to owners of ISS A/S relative to total assets, increased to 4.7% at 31 December 2010, from 4.0% at 31 December 2009.
34 Annual Report 2010

Non-current loans and borrowings increased from DKK 28,649 million at 31 December 2009 to DKK 29,032 million at 31 December 2010 primarily due to the issuance of DKK 950 million (EUR 127.5 million) in debt through a tap issue in the existing High Yield Notes 2016. The increase was partly offset by a decrease in the non-current part of the Acquisition and Term Loan facilities.
Other non-current liabilities comprise pensions and similar obligations, deferred tax liabilities and provisions, and amounted to DKK 3,719 million at 31 December 2010 compared with DKK 3,572 million at 31 December 2009. The increase was mainly a result of an increase in pensions and similar obligations of DKK 216 million.
Pensions and similar obligations amounted to DKK 1,053 million at 31 December 2010, compared with DKK 837 million at 31 December 2009. The majority of the Group’s pension plans are defi ned contribution plans. The Group’s contributions to such plans are accrued and expensed on an ongoing basis. In certain countries, mainly France, Germany, the Netherlands, Sweden, Switzerland, Norway and the United Kingdom, ISS has defi ned benefi t plans. As mentioned above, actuarial losses of DKK 113 million, net of tax, including the net effect from the asset ceiling, were taken directly to equity. The losses were primarily a result of an increase in the discount rate applied in Switzerland and a number of other countries as well as an increase in the pension obligation in Norway due to a general announcement by the authorities that the plan is con-sidered to be under funded which will lead to additional contributions in coming years. These losses were partly offset by gains in Sweden, the Netherlands and Italy. Due to the current market conditions, the determination of the discount rates in the individual countries is subject to uncertainty. Exchange rate movements increased the net pension obligation by DKK 80 million.
Provisions amounted to DKK 740 million at 31 December 2010, of which DKK 361 million had an estimated maturity of more than one year. Comparative fi gures at 31 Decem-ber 2009 were DKK 802 million and DKK 379 million, respectively. The provisions comprise acquisition-related provisions and various obligations incurred in the course of business, e.g. self-insurance obligations, labour-related obligations, legal obligations, restructurings, contract closures, etc. Other current liabilities comprising current loans and borrowings, trade payables, tax payables and provisions, amounted to DKK 8,832 million at 31 December 2010 compared with DKK 9,063 million at 31 December 2009. The decrease in current loans and borrowings of DKK 498 million was mainly related to repayment of 2010 EMTNs,
which was partly fi nanced from debt raised under the securitisation programme at year-end 2009.
Other liabilities amounted to DKK 10,946 million at 31 December 2010 compared with DKK 10,478 million at 31 December 2009. Other liabilities consist mainly of accrued wages and holiday allowances, tax withholdings, VAT and other payables and accrued expenses.
Carrying amount of net debt amounted to DKK 30,619 million at 31 December 2010, down DKK 267 million from DKK 30,886 million at 31 December 2009. The decrease was mainly related to repayments on the Acquisition and Term Loan facilities as well as net proceeds from divest-ments and acquisitions, partly offset by a negative impact from foreign exchange. At 31 December 2010, non-current loans and borrowings was DKK 29,032 million, current loans and borrowings amounted to DKK 5,212 million while securities, cash and cash equivalents and receivables from companies within the ISS Group totalled DKK 3,625 million.
Financial Review | Management Review 35

GUNHILD SAMUELSEN, STATOIL LNG PLANT, NORWAY
HASAN ÇIÇEK, AREVA, TURKEY
ANDERS DÄCK, FORSMARK ATOMIC POWER PLANT, SWEDEN
KEVIN LAWER, RIO TINTO, AUSTRALIA
ENERGY & RESOURCES – representing 4% of Group revenue ISS is experienced in providing service solutions to major companies operating in the oil, gas, electricity and mining industries. This covers both onshore and remote sites where our proven competence and commitment to our high health and safety standards are critical to both our customers and ourselves.

Strategy – The ISS Way
STRATEGY AND BUSINESS MODEL
ISS’s business model is based on creating value for our customers by offering a range of facility services within cleaning services, support services, property services, ca-tering services, security services and facility management services. ISS's facility management approach represents a unique offering whereby the service delivery can be integrated into one seamless solution.
The ISS Way strategy, launched in 2008, is based on our four strategic cornerstones; customer focus, people management, the IFS strategy and a multi-local approach. Combined with our corporate values and leadership principles, these cornerstones provide the foundation on which we pursue our vision to "Lead facility services glob-ally – by leading facility services locally".
The implementation of The ISS Way is well under way and has shown substantial progress during 2010. We are unique-ly positioned to grasp the huge opportunities in our markets, not least delivering integrated facility service solutions to multinational corporations across numerous countries.
ISS also focused on securing service excellence by driving the global implementation of best practices and standard processes in 2010. Investments have been made in excel-lence centres both globally and locally and the excellence centres, which ensure a continuous improvement in ef-fi ciencies, have now been established for several service types. The development of best practices within the excel-lence centres is not only focused on the services ISS delivers but also the way in which the service is delivered and on specifi c service offerings for specifi c customer segments.
The continued successful implementation of The ISS Way strategy is the foundation for robust and profi table growth in the years to come.
HONESTY – We respect
Our honesty is not negotiable. We respect our customers, our colleagues and our company. Honesty comes fi rst.
ENTREPRENEURSHIP – We act
Action speaks louder than words. All our employees have a ‘licence to act’ and are expected to do so.
RESPONSIBILITY – We care
Indifference is immoral. We care about what we do and for whom we do it.
QUALITY – We deliver
We are professionals with a passion for quality. We deliver on our promises.
During 2010, we made substantial progress in implementing The ISS Way strategy and a number of key initiatives to enhance customer focus, drive the deployment of best practices and secure service excellence.
CORPORATE VALUES
Strategy – The ISS Way | Management Review 37

HOW WE OPERATE OUR BUSINESS
Our corporate values, leadership principles and strategic cornerstones, together with The ISS Way strategy, provide the roadmap by which we operate our business.
Corporate valuesUltimately, The ISS Way strategy is founded on the four corporate values on which we base our strategic, opera-tional and fi nancial plans and actions.
Leadership principlesOur set of international leadership principles defi ne the attitudes and behaviour ISS expects from its leaders:
At ISS we
put the customer fi rst have a passion for performance encourage innovation treat people with respect lead by example lead by empowerment develop ourselves and others believe teamwork is at the heart of our performance ISS is one company with shared values, one brand and one strategy.
These principles, which are currently being integrated in the processes surrounding recruitment, appraisals, devel-opment and talent management, are applicable for all ISS leaders. Furthermore, an ISS University programme on the leadership principles was launched during 2010. As the principles translate our values into actions and behaviours by describing successful leaders, this initiative will further enhance our leadership capabilities.
Our strategic cornerstonesThe ISS Way is built on our strategic cornerstones: customer focus, people management, the IFS strategy, and our multi-local approach:
Customer focus We put customers in focus. We serve our chosen customers locally, regionally and globally with specifi c value propositions through focusing on identifying customer needs and wants. We build sustainable partner-ships with customers who value our approach to service.
People management People management is our core competence. We excel in people management in order to deliver excellence in our service offerings. We mitigate risks and volatility transferred from our customers by ap-plying leadership skills, Human Resource and HSE policies, employee training and skills in complying with local labour
legislation. We obtain these benefi ts by sharing knowl-edge and best practices within the Group.
IFS strategy IFS is our strategic aim. We advance our service offering towards IFS by building the ISS House of services and developing our facility management capabili-ties. We self-deliver multiple site-based services within the ISS House and we integrate our service deliveries seam-lessly in our customers' organisations.
Multi-local approach We strike a balance between autonomy and alignment. We operate with strong local leadership and autonomy to ensure timely responses to operational demands and to benefi t from knowledge of local market conditions. We also implement our Group fundamental policies and strategic direction to enable us to exploit best practices and leverage our geographical foot-print. We are disciplined and use tight fi nancial control.
OUR SERVICE OFFERING
ISS's service offering is developed to meet customer needs. Our fundamental offering is illustrated by the ISS House, which has fi ve pillars: cleaning services, support services, property services, catering services and security services. The 'roof', facility management, represents the sixth service and our capabilities within the integration of service deliveries. The ISS House is built on a strong foundation of service excellence, which means that our customers enjoy the benefi ts of partnering with a service expert – a company that truly understands customer needs and has the services required to meet them.
Our service concepts are developed to address specifi c customer needs. This entails defi ning versions of the ISS House that are built on ISS's fundamental competencies and presenting an integrated solution of services custom-ised for a given segment. For example, the ISS House for the Business services & IT segment is illustrated on the opposite page. ISS focuses primarily on delivering site-based services based on portfolio contracts, where ISS employees become an in-tegrated part of the clients' daily operations. ISS also offers selected route-based services, such as pest control.
The delivery modelISS distinguishes between services offered and the way in which these services are delivered. The three delivery models are: single services, multi services and integrated facility services. During 2010, we continued to develop and strengthen our single service excellence and integrat-ed facility service capabilities.
38 Annual Report 2010

THE ISS HOUSE For the Business & IT segment
FACILITYMANAGEMENT
Supply ChainManagement
Procurement Services
Supplier Selection
Supplier Performance
Risk Management
Risk Identifi cation
Business Continuity Plan
Disaster Recovery
Service Desk
Consumer Interface
Call Logging
Workfl ow Management
Consultancy & Advisory Services
Outsourcing Partner Selection
Construction Advisory (TCO)
Benchmarking
Financial Adm.& Reporting
Budgeting (Facility Related Costs)
Property Taxes
Insurance Administration
Change Management
Process Changes
People Changes
Capital Projects
Facility Man. System (CAFM)
System & Process Implementation
Ongoing Support & Maintenance
Performance Reporting
Internal Cleaning
Daily Offi ce Cleaning
Washroom Services
Tele- & Computer Cleaning
Dust Control
Collection & Deployment of Mats (On-Site)
Carpet Cleaning
Laundry Services
Furniture Cleaning
External Cleaning
Window Cleaning
Facade Cleaning
Road Sweeping
Grounds Cleaning
Pavement & Sidewalk Services (Sweeping / Snow Removal)
Technical Cleaning
Specialised Cleaning e.g. Fixtures, Lightning, Duct Cleaning, Height Cleaning etc.
CLEANING SERVICES
Front of House
Switchboard (On-site)
Reception Services
Hostess Services
Back of House
Printing & Copying
Storage Management (Off-site)
Offi ce Furniture Management
Interior Landscaping & Decor (Horticultural & Objet d‘art)
Stationary / Offi ce Supplies
Document Handling (On-site)
Document Management & Archiving (Off-site)
Mail Handling
Shipping & Receivables (Non-core Items)
Moves, Adds & Changes
Call Centre (Off-site)In Bound & Out Bound
Welfare Facilities
Sports Facilities (Indoor & Outdoor)
Recreational & Medical / Physiotherapy Services
Labour Supply
Temporary Workers
Search & Selection (Recruitment)
SUPPORT SERVICES
Building Maintenance
Preventive Maintenance
Handyman (Light Reactive Maintenance)
M&E Services
Building Installations & Fabric
Repairs & Replacements
Lifts & Escalator Services
Plumbing Services
Carpentry Services
Painting Services
Glazing Services
Mason Services
Building Management Systems
Grounds Maintenance
Landscaping
Grounds Maintenance
Road Services
Environment Management
Pest Control
Waste Management
Refuse Collection & Recycle Management
Energy
Energy Management
Water Supply
Lighting & Power
HVAC (incl. Cooling)
Damage Control
Loss Prevention
Damage Recovery
Dehumidifi cation
PROPERTY
SERVICES
Contract Catering
Staff Dining – Management Contract
Staff Dining – Operational Contract
Hospitality Services
Executive Dining
Conference Facilities
Beverages incl. Coffee / Tea
Fruit, Confectionary & Pastry Provisions
Take-away Staff Dining
Vending Services
Service & Installation of Vending Machines
Supply & Refi lling of Vending Machines
Events Catering
Off-site Produced & Delivered F&B
Off-site Dining Services (Large Kitchens)
Event Management
CATERING
SERVICES
Guarding
Manned Guarding
Armed Guarding
Mobile Patrols
Admission Control – External & Internal
Keys & Cards
Cash in Transit
Surveillance
Monitoring (CCTV)
Alarm Response
Emergency Evacuation
Technical Installations
Fire & Gas Detection
Burglary Detection
CCTV
Alarm Systems
Access Control Systems
Car Parking Control
Security Duties
Visitor Escorting
Lost Property
Workplace Safety
First Aid Services
SECURITY
SERVICES
Strategy – The ISS Way | Management Review 39

With single service outsourcing, the customer buys one service solution from ISS, outsourcing of catering services, for instance.
With multi service outsourcing, which consists of two or more services but not a fully integrated solution, the customer achieves the same benefi ts as with single service outsourcing with the additional benefi ts of service inte-gration where possible.
With integrated facility service solutions, ISS delivers two or more service under one contract with a single point of contact on-site, which allows ISS to integrate the facil-ity service functions taken over by ISS at the customer’s premises. The customer receives both the full potential of single service outsourcing and the advantages of inte-grating services, including cost effi ciencies and a more effi cient and fl exible service set-up.
THE ISS WAY STRATEGY – IMPLEMENTATION STATUS
After a period of building our business platform through acquisitions, our focus has now changed to unleashing the full potential of our unique platform. We are well underway with implementing The ISS Way based on a number of key strategic priorities, where central themes are focus and alignment.
We are pursuing standardisation, best practice and knowl-edge sharing across the organisation. Excellence centres
and knowledge forums have been established and are con-tributing to further increasing the effi ciency and consistency of our service delivery. Experts from corporate, regional and country levels are working together in various global service forums, such as catering services and security services, to further align key ISS business processes and procedures.
Further, The ISS Way is promoting a strong and uniform commercial culture through the deployment of a com-mercial strategy methodology and ensuring market-leading value propositions. Our service offerings are increasingly tailored to specifi c customer segments to address these customers’ explicit needs, which adds more value. We are also focusing on services within which we consistently deliver service excellence and that are most suitable for in-tegration and are therefore consistent with our IFS strategy.
In 2010, ISS expanded its portfolio of multi-national cus-tomers procuring services in multiple jurisdictions through a number of major new contract wins and a contract extension with a key customer while continuing to invest in expanding the global Corporate Clients organisation established in 2007. This is a huge market opportunity for ISS and The ISS Way will continue to contribute to ISS’s ability to both win and successfully deliver contracts to these customers.
The ISS Way focuses on organic growth and entails a con-solidation phase after a period of high acquisition volume in which ISS successfully built its existing business platform.
THE ISS VALUE CHAIN
Our strategy, The ISS Way, is being implemented by the application of our management tool, the ISS Value Chain.
The links in the ISS Value Chain are best illustrated by starting at the Business Growth end. The shared purpose of our existence at ISS is to create shareholder value. This emerges from profi table growth which in turn is driven by satisfi ed customers who expand their business with ISS and renew their contracts. Customer satisfac-tion is founded on capable employees who are engaged in their jobs and motivated by being part of a strong team. Capable employees are employees who have been trained to deliver clearly defi ned and operational service concepts. Strong and attractive service concepts are the result of informed decisions made regarding the busi-ness platform, which determines the customer segments we should serve and the services we choose to deliver to these segments. Acquisitions are a useful tool in the continued development of ISS, and will be used selectively to improve ISS’s competitiveness, build critical mass and
Progress in the continued implementation of The ISS Way during 2010 has been extremely encouraging. We are moving steadily in the right direction and are comfortable that the positive impact of the strategy will be increasingly visible.Todd O'NeillHead of Group Strategy and Corporate Development
40 Annual Report 2010

THE ISS VALUE CHAIN
BusinessPlatform
ServiceConcept
EmployeeEngagement
ServiceValue
CustomerExperience
BusinessGrowth
AcquisitionGrowth
increase service capabilities and capacity where and when appropriate.
The ISS Value Chain is our primary management tool ap-plied across the entire organisation which is designed to ensure a structured and robust approach to the implemen-tation of The ISS Way at a strategic, tactical and operation-al level. It forms a central part of The ISS Way of thinking and working. Management at all levels of the organisation have shared points of reference deeply embedded in the organisation that enable them to see their actions from a broader perspective, thus creating a well-founded, valu-able and homogenous service culture at ISS.
Implementation of The ISS Way and the application of the ISS Value Chain are supported by an ISS University pro-gramme for top management that addresses our strategy and implementation tools – all of which drive focus and alignment.
OPERATIONAL OBJECTIVES
ISS seeks to maintain and enhance operational effi ciency by focusing on three well-established operational objec-tives which are used throughout the Group: (i) organic growth, (ii) operating margin, and (iii) cash conversion.
Organic growthISS's objective is to focus on organic growth through new sales and cross-selling of service solutions to both new and existing customers. ISS will aim to continue to lever-age its international market position and service offering in order to increase its local market positions and drive organic growth. ISS continue to work with a wide range of initiatives, including the further development of the Corporate Clients organisation, enhancing our focus on specifi c customer segments and implementing commercial planning processes and tools.
Operating marginISS's objective is to maintain or improve its operating margin. ISS seek to improve operational effi ciencies by increasing its local positions and operational densities, as well as by imple-menting group-wide excellence and best practice initiatives.
Cash conversionISS's objective is to continue to maintain a robust rate of cash conversion primarily by operating in a manner that optimises working capital. Through this approach, ISS ex-pects to continue to generate a high level of positive cash fl ow from operations. ISS targets a continued consistent robust cash conversion.
Strategy – The ISS Way | Management Review 41

FERNANDA BARATA, ARMAZÉNS DO CHIADO SEMPRE, PORTUGAL
RETAIL & WHOLESALE – representing 7% of Group revenue The Retail & Wholesale customer segment varies from shopping centres, department stores to retail chains. ISS services shopping malls containing numerous small and large boutiques/stores and restaurants, multi-store department stores with different needs under one roof and clothing chain stores. In Indonesia alone we provide services to more than 100 shopping malls.
SAMMY ABRAHAM TATUIL AND NINA ARSIH, PONDOK INDAH MALL, INDONESIA BISHAL GIRI, APPLE STORE SYDNEY, AUSTRALIA

More than a century in the service industry has made ISS well aware that our long-term sustainable business suc-cess depends on a high level of Corporate Responsibility (CR), as economic, social and environmental issues are inevitably interconnected. Therefore CR is an integral part of our values and business strategy and is closely linked to The ISS Value Chain. Developing our values into concrete actions is also our response to demand from several stakeholder groups, e.g. existing and potential employees and customers. The leading global companies require a constant CR performance, which is a key factor in winning and retaining contracts in the IFS customer segment.
ISS has made a strong commitment as a signatory and supporter of the United Nations Global Compact since its inception in 1999. In line with membership regulations, ISS is committed to aligning strategy and operations with the ten Global Compact principles on human rights, la-bour rights, environmental protection and anti-corruption. ISS respects, supports and promotes human rights as stated in the United Nations Declaration of Human Rights and the Core Conventions of the International Labour Organisation.
CORPORATE RESPONSIBILITY AT ISS
As such, Corporate Responsibility for ISS means our commitment to contributing to a sustainable economic development and responsible business practices by:
Giving people an opportunity to enter the labour market; Working with our employees and the local community and society at large in improving employees’ lives in ways that support sustainable development and our business;
Ensuring fair and equal treatment and no discrimination or harassment;
Respecting employee’s right to collective bargaining and the right to join trade unions;
Supporting introduction of minimum wages and compliance with working time regulations;
Avoiding use of child labour as well as forced or compulsory labour;
Providing proper working conditions including a safe working environment for our employees;
Managing our business activities in an environmentally responsible way;
Conducting our business in a lawful manner; Competing for business on fair terms and solely on merits of our services;
Combating corruption and bribery; Carrying out our activities according to principles of good corporate governance; and
Ensuring that the social, environmental and ethical commitments of ISS are refl ected in dealings with customers, suppliers and other stakeholders
OUR APPROACH TO CORPORATE RESPONSIBILITY
We have adopted a principles-based approach to Cor-porate Responsibility that contributes to sustainable development as defi ned by the international community. This approach effectively integrates universally accepted principles into the way we do our business, forming a foundation that is embedded in our Corporate values, our Code of Conduct and our business strategy, The ISS Way.
Corporate Responsibility
As a global company with more than 520,000 employees serving 200,000 customers in more than 60 countries, ISS infl uences the lives of many people through providing employment and training as well as providing safe and healthy work environments for millions of employees and customers in the facilities we service.
COMPULSORY REPORTS
This CR chapter does not constitute ISS's full report on Corporate Responsibility. The full CR Report as per section 99a of the Danish Financial Statements Act is available at www.issworld.com and inaccordance with instructions from the UN GlobalCompact to the members; the CR Report also servesas ISS’s communication on progress in implement-ing the ten principles of the Global Compact.
Corporate Responsibility | Management Review 43
At ISS Corporate Responsibility means our commitment to contributing to sustainable economic development and responsible business practices. It is core to the way we do business and it is necessary to take a long-term rather than short-term view. We therefore continuously support the UN Global Compact and its ten principles.Jeff Gravenhorst Group CEO
In line with The ISS Way, ISS holds a unique position in contributing to the following focus areas:
facilitating the right to work; non-discrimination, equal opportunities and diversity; and access to education
Our initiativesIn 2010, ISS established a Health, Safety and Environment (HSE) and Corporate Responsibility (CR) function to set group-wide HSE and CR strategies and policies, develop value propositions for our customers, facilitate knowledge sharing and provide the best advice and coaching on HSE practices.
As our business is based on people, the fi rst initiative addressed by the HSE and CR function was to work on the management of health and safety risks. A Group HSE Vision and a Group HSE Policy was developed. Our HSE Vision is called ‘100’:
1: We aim to be number 1 in our industry and recog-nised as an industry leader in the way we deliver health, safety and environmental performance;
0: We operate with 0 fatalities at our workplaces; and 0: We incur 0 serious incidents and occupational injuries at our workplaces.
A Group Health, Safety and Environment Manual hasbeen developed that outlines the key HSE requirementsfor development and implementation of effective HSEmanagement in the ISS Group in accordance with interna-tionally recognised standards. The Manual sets minimum requirements and is a framework for the countries to devel-op and tailor their HSE management system to their specifi c activities and risk exposure levels. Systematic risk manage-ment is fundamental for effective HSE management within ISS. The aim is that by the end of 2011, all countries must comply with the requirements of the Group HSE Manual.
Another initiative was the development of ISS Safety Rules to align our behaviours when carrying out our daily tasks. The Rules were launched in September 2010 with campaigns carried out in individual countries to ensure commitment to these rules. The Rules cover:
Stopping unsafe work Work permits Energy isolation Electrical safety Confi ned space entry Working at heights Housekeeping Driving safety Manual handling Working with chemicals
In order to identify the material issues relevant to ISS in relation to our commitment to align our operations to the ten UN Global Compact principles, ISS, with the help of an external consultant, conducted a materiality assessment to identify those human rights, labour practices, environmen-tal and Anti-Corruption issues of greatest signifi cance to our stakeholders and our future success topics in accord-ance with the United Nations Global Compact (UNGC).
This led us to strengthen the Code of Conduct and our International Human Resource Standards in areas such as Human Rights, Anti-Corruption, Forced and Compulsory Labour, Child Labour and Working Hours. In 2010, we also developed an Anti-Corruption Policy in line with our Code of Conduct. To support our zero tolerance Anti-Corruption policy and the importance of our Competition Guidelines, 311 people from 32 countries have received training in these areas in 2010.
In 2011, we will be rolling out an e-learning module on Anti-Corruption to further train our employees about our Policy.
44 Annual Report 2010

ISS has developed a whistleblower policy to enable alI ISS em-ployees, business partners and other stakeholders to report any suspected violations or concerns relating to any matter of exceptional gravity or sensitivity. The Policy was approved by the Board and subsequently submitted to the Danish Data Protection Agency for approval in October 2010.
In terms of responsible procurement, ISS developed a Sup-plier Self-Assessment that was sent to our major vendors covering issues such as our Code of Conduct, Forced Labour, Non-discrimination, Human Rights, and Child Labour. This is to ensure that we also include the supply chain in our scope.
Our performance For the fi rst time, in 2010 ISS developed a Group Report-ing Manual to provide reporting principles and rules to ensure a consistent basis for reporting HSE and CR data. The primary purpose of gathering HSE and CR data is to manage HSE and CR risks by monitoring performance. A sound understanding and analysis of HSE and CR data is necessary in order to direct appropriate efforts and improve HSE and CR performance. The data will also be used to inform ISS management and external stakehold-ers of our performance and track progress towards the achievement of our HSE and CR commitments.
Some of the key parameters we measure and monitor are safety related. In 2010, we unfortunately suffered fi ve fatal injuries in the ISS Group. This is unacceptable and to achieve our Vision of zero fatalities, we have implemented investigation procedures to ensure that we determine the root causes of such incidents, learn from them and prevent them for reoccurring. We believe that the devel-opment of a systematic approach to managing HSE risks through the development of the Group HSE Manual re-quirements and our continued focus on safety awareness will contribute to a reduction of incidents.
In terms of the environment, our environmental impact stems primarily from our vehicles and business travel as well as use of chemicals and cleaning products. In 2010, ISS continued to broaden the use of environmentally friendly cleaning products and initiated a process for measuring CO2 emissions in order to continue our efforts to reduce emissions.
Going forwardGoing forward, our objective is to expand the data pa-rameters to include additional safety, social and environ-mental indicators. The environmental indicators include electricity consumption at our own offi ces and own sites and this will provide a baseline for setting reduction tar-gets in the coming years.
Our initiatives in 2010 are another step in our journey towards embedding CR in our business. We have built a solid foundation for our approach in this area and will be building on this foundation both in terms of implementa-tion and reporting.
EMPLOYEES
August 2010 was an important month for ISS, as we sur-passed the 500,000 employee milestone and thereby one of the world's largest private employer.
PEOPLE INDICATORS 2010 2009
Total employees 522,700 485,800
Full-time employees 73% 71%
Part-time employees 27% 29%
Seniority (employment > 1 year) 61% 62%
At the end of 2010, ISS had more than 522,000 employ-ees located in Europe, Asia, Pacifi c, Latin America and North America.
At the end of 2010 our employees in emerging markets comprised more then half of our workforce.
Human Resources – Vision and StrategyThe ISS Human Resources vision "to be the preferred employer in our industry" supports The ISS Way strategy by focusing on: upgrading leadership and management capabilities, enhancing customers’ service experience, integrating acquired businesses, and ensuring competi-tiveness through cost effi ciencies.
The Human Resources strategy is implemented through "ISS International HR standards", which comprise the framework for local initiatives covering the following twelve topics:
Recruitment Employee appraisals and reviews Motivation and loyalty Employee relations Training and development Talent management Managing sickness and absenteeism Reporting and monitoring HR Support for M&A and contract integration Health and safety Remuneration, benefi ts and incentives Succession planning
Corporate Responsibility | Management Review 45

The standards were introduced in 2007. Since then, the countries have been working on implementing the requirements locally to ensure compliance with Group policy. Improvements will continue in 2011, where the fol-lowing fi ve prioritised HR initiatives that are all embedded in The ISS Way will be in focus:
Employee Engagement Leadership Development Succession Planning Talent Management Performance Management
ISS’s performance management system plays an impor-tant role in all of the above key initiatives. The system is the principal tool for assessing individual capabilities. Feedback during an annual goal evaluation and goal-setting process, followed up by a mid-year review, help to develop the full potential of the individual managers. In addition to facilitating the process, the performance management system provides ISS with a basis for talent management and succession planning.
Training and developmentResources are invested in staff and management develop-ment – ranging from basic skills training through middle management and executive management programmes to Global Talent Programmes.
The philosophy is to offer tailored training at all functional levels to enhance employee skills and encourage upward staff mobility. Much attention is devoted to developing the fi rst management layer e.g. team leaders, supervisors and contract managers, who are responsible for their immediate staff and customer interface. Most training is conducted at ISS academies and training facilities in national and local operations.
Additionally, in order to implement strategic initiatives, such as cleaning excellence and the integrated facility service concept, ISS University continues to develop key specialists and leaders for train-the-trainers. This is sup-plemented by local initiatives.
As in previous years, the ISS University programme portfo-lio consisted of internal and external seminars designed in cooperation with suppliers such as IMD, Henley Manage-ment College and INSEAD. The ISS University seminars are based upon our nine Leadership Principles.
The ISS University focuses on continuously enhancing its executives’ competences. The ‘ISS Advantage’ manage-ment induction programme for executives throughout the Group, also highlights The ISS Way strategy and our ISS
Value Chain management tool. In 2010, the ISS University expanded its portfolio of programmes for our top man-agement with two new mandatory management pro-grammes: ‘Strategy and the Value Chain’, which features how to implement The ISS Way strategy and training in change management, and ‘ISS Leadership’, which centres on our nine leadership principles and how to manage our employees in accordance with these principles. All pro-grammes at the University are based on case work and a dialogue-based teaching style.
Employee engagementThe success of each service delivered depends on the people delivering it. With more than half a million em-ployees worldwide, this makes people management and leadership some of the most important elements in ISS. Employee engagement exists when every level of the organisation is staffed with people who understand what is expected of them and can and want to deliver services in a way that strengthens the customer’s experience of service value. We therefore focus on two main aspects of employee engagement:
Motivation Capability
Our company requires many different sets of people skills. This puts great emphasis on our ability to train and develop employees. While some employees may want to stay in their current jobs, we need to encourage develop-ment whenever we see the possibility. In order to fulfi l ISS's vision, HR - globally and locally - and every business unit must ensure that employees are properly skilled through local training and development programmes. This enables us to offer our employees fl exibility in job func-tions, thereby strengthening our collaboration.
The service industry in general has high levels of employee turnover, as part of the industry is often considered suit-able for short-term or secondary employment. HR pursues a range of strategies to retain its employees by offering training and development, more full-time and daytime work, multi-task jobs, teamwork, career opportunities, leisure activities, etc.
In 2010, the share of full-time employees (working 25 hours or more a week) increased from 71% in 2009 to 73% in 2010. This indicator is important, as, on aver-age, full-time employees develop stronger ties with ISS. The distribution of employee seniority (in years) provides another perspective for employee loyalty within ISS. In 2010, approximately 61% of the Group’s employees had been with ISS for more than one year, a slight decrease from 62% in 2009.
46 Annual Report 2010

To identify and monitor improvement areas, a Corpo-rate Employee Engagement Survey (EES) was carried out during 2010 covering more than 60,000 employees. The EES is part of The ISS Way and is considered an important tool for indicating employee engagement. The EES will be rolled out globally in the future, based on the process used in 2010.
Equal opportunitiesISS rewards its people solely on the basis of merit. When recruiting, developing and promoting, ISS focuses on the individual capabilities and qualifi cations of a candidate and not on the person’s gender, age, ethnic origin, reli-gion, political views, etc.
Thanks to our corporate culture, and aided by language courses and adapted training materials, ISS is an employer of choice for many immigrants and ethnic minorities. In all regions but especially in Western Europe, ISS is among the largest employers of ethnic minorities. For ISS, diversity is a strength.
Employee and trade union relationsEmployee and trade union relations are a natural part of a people-centred business such as ISS. The corporate policy of involvement and dialogue is applied locally in the country operations. Established in 1995, the European Works Council (EWC) is an in-house forum for dialogue between ISS executives and ISS employee representatives from across Europe.
In June 2009, the EWC and ISS signed a new four-year EWC agreement. The EWC meeting agenda includes in-formation and consultation on matters relating to the ISS Group in Europe, in particular concerning the structure, fi nancial situation, development of ISS, the current situa-tion and probable trends of employment. Discussions also involve the introduction of new working methods and processes, training and health & safety issues, provided that such issues may affect the interest of the employees of the ISS Group in more than one country in Europe. A total of 22 representatives from 16 counties took part in the EWC dialogue in 2010.
The global agreement between Union Network Internation-al (UNI) and ISS was renewed in 2008. The agreement aims at enabling all ISS employees worldwide to exercise rights to union membership and collective bargaining. As part of the agreement, ISS and UNI created the Global UNI–ISS Foundation in 2009 with the purpose of monitoring and improving employment standards within the service indus-try globally. The agreement and collaboration has prompted UNI to name ISS as an employer that treats its workers well and is setting a good example for other global employers.
Corporate Responsibility | Management Review 47

MARTIN RICHTER, BMW DINGOLFING, GERMANY
INDUSTRY & MANUFACTURING – representing 14% of Group revenue The Industry & Manufacturing customer segment contains customers who produce and manufacture a variety of goods such as computer, electronic, electrical equipment, cars and machinery. The manufacturing sites are plants, factories and mills where our services ensure that our clients can focus on their core competences while experiencing a reduction in costs in non-core services to them and deliver a better experience for the people they employ and serve.
YÖNEY GÜLAY, BMW DINGOLFING, GERMANY

Corporate governance and risk management
1) As described in note 38 to the consolidated fi nancial statements, certain members of the Board, the EGM members and a number of senior offi cers of the Group have invested, directly or indirectly, in shares and warrants in FS Invest S.à r.l. (FS Invest), ISS’s ultimate parent company. The total number of shares held by these directors and offi cers is below 2% of the total share capital.
2) Effective 17 February 2011 the company name was changed from ISS Holding A/S to ISS A/S.3) Effective 17 February 2011 the company name was changed from ISS A/S to ISS World Services A/S.
EQT 54% FS INVEST S.À R.L (LUXEMBOURG) 1)
FS INVEST II S.À R.L (LUXEMBOURG)
ISS A/S 2)
ISS WORLD SERVICES A/S 3)
ISS GLOBAL A/S
OPERATING SUBSIDIARIES
GOLDMAN SACHS CAPITAL PARTNERS 44%
CORPORATE GOVERNANCE
The Board of Directors regularly reviews the Group’s corporate governance in relation to the Group’s activities, business environment and statutory requirements. Good corporate governance practices at ISS are implemented in a dynamic process with the Board of Directors continu-ously assessing the need for adjustments to benefi t ISS stakeholders and the Group itself.
Corporate governance policies and procedures at ISS take into account the Danish Companies Act, the Danish Finan-cial Statements Act, IFRS, the Action Plan for Corporate Social Responsibility (CSR), the Danish Venture Capital and Private Equity Association’s (DVCA) guidelines for respon-sible ownership and good corporate governance as well as good corporate governance practices for companies of ISS’s size and global reach. The DVCA guidelines for responsible ownership and good corporate governance are available at www.dvca.dk.
ShareholdersISS A/S is a limited liability company incorporated and op-erating under Danish law. The company’s share capital is indirectly owned by funds advised by EQT Partners (EQT) and Goldman Sachs Capital Partners (GS Capital Partners). EQT and GS Capital Partners are together referred to as
the Principal Shareholders and hold 54% and 44% of the share capital respectively. The remaining approximately 2% of the share capital is held by certain members of the Board of Directors, the Executive Group Management and a number of senior offi cers of the Group through director and management investment programmes.
EQT is the leading private equity group in Northern Eu-rope with more than €13 bn in raised capital and mul-tiple investment strategies. Together with a network of industrial advisers, EQT implements its business concept by acquiring or fi nancing good medium-sized to large companies in Northern and Eastern Europe, Asia and the United States, developing them into leading companies. Development is achieved by applying an industrial strategy with focus on growth. To date, EQT has invested in more than 85 companies (equivalent to €9.7bn) and exited around 40.
EQT Partners, acting as investment advisor to the man-agers of each EQT fund, has more than 100 investment professionals with an extensive industrial and fi nancial competence. EQT Partners has offi ces in Copenhagen, Frankfurt, Helsinki, Hong Kong, Oslo, London, Munich, New York, Shanghai, Singapore, Stockholm, Warsaw and Zurich.
Corporate Governance and Risk Management | Management Review 49

GS Capital Partners is managed by Goldman, Sachs & Co. or an affi liate thereof. Goldman Sachs & Co. is a wholly owned subsidiary of the Goldman, Sachs Group Inc. ("Goldman Sachs"). Goldman Sachs is a leading global in-vestment banking, securities and investment management fi rm that provides a wide range of services worldwide to a substantial and diversifi ed client base that includes corporations, fi nancial institutions, governments and high net worth individuals. Founded in 1869, the fi rm is head-quartered in New York and maintains offi ces in London, Frankfurt, Tokyo, Hong Kong and other major fi nancial centres around the world.
Management ISS has a two-tier management structure consisting of:
the Board of Directors (the Board), and the Executive Group Management (the EGM).
The Board determines the overall Group strategy and supervises the Company’s activities, its management and organisation. The EGM is responsible for ISS’s day-to-day operations. The two bodies are separate and no person serves as a member of both.
Board of DirectorsThe Board has seven members appointed by the general meeting for a period of one year. Re-election may take place.
Board members have been nominated jointly by the Principal Shareholders.
Four members are independent, while two members are representatives of the Principal Shareholders and one member has been a member of the EGM within the past fi ve years.
The Board functions in accordance with the rules of the Danish Companies Act, the articles of association and the rules of procedure, which provide guidelines for the Board’s work in general. Board resolutions are generally passed with a simple majority, and in the event of a tie, the Chairman casts the deciding vote.
The Board convenes at least six times a year. Extraordinary meetings are convened whenever specifi c matters require attention between scheduled meetings. Ten Board meet-ings were held in 2010. The Board receives a monthly fi nan-cial and operational reporting package and is briefed about important matters between Board meetings. The Board approves the strategy plan, the annual budget and large ac-quisitions or divestments based on recommendations from the Acquisition Committee (see Board Committees below).
In a process led by the Principal Shareholders and the Chairman an appraisal of the Board is carried out annually to assess the competencies of the Board, the effectiveness of its work and how the Board ensures that good corpo-rate governance is in place.
More details on the Board members are available on pages 58-59 and in note 38 to the consolidated fi nancial statements. Remuneration to the Board is disclosed in note 5 to the consolidated fi nancial statements.
Board Committees The Board has established four committees that all report to the Board.
The Remuneration Committee recommends the remu-neration packages and incentive schemes for the Group CEO, and provides input on remuneration in respect of other EGM members and certain senior offi cers, as well as on compensation levels and bonus systems in general. The committee consists of three members of the Board (currently Ole Andersen, Leif Östling and Jørgen Linde-gaard), and the Group CEO participates in its meetings. Ole Andersen is chairman of the committee. The commit-tee held no formal meetings in 2010, but have had regular discussions during the year.
The Audit Committee evaluates our external fi nancial reporting, and monitors and challenges our main account-ing policies and estimates as well as our systems of internal controls and risk management. Its duties also include supervision of our external auditors and our internal audit function in addition to considering the relationship with our external auditor and reviewing the audit process. The Board of Directors appoints the committee members and the chairman of the committee who cannot be the Chairman. The committee consists of three members of the Board (currently John Allan, Michel Combes and Peter Korsholm), and meetings are also attended by the Group CFO, the Head of Group Controlling, the Head of Group Internal Au-dit and the Group General Counsel. John Allan is chairman of the committee, which held three meetings in 2010.
The Acquisition Committee considers ISS’s procedures for acquisitions and divestments, reviews the acquisition and divestment pipeline, approves certain large acquisitions and divestments in accordance with adopted procedures, and evaluates selected effected acquisitions. The com-mittee consists of three members of the Board (currently Jørgen Lindegaard, Peter Korsholm and Steven Sher), and meetings are also attended by the Group CEO, the Group CFO and the Head of Group Strategy and Corporate De-velopment. Jørgen Lindegaard is chairman of the commit-tee, which held two meetings in 2010.
50 Annual Report 2010

The Financing Committee considers ISS’s capital structure, fi nancing of future investments and hedging policies. The committee consists of two members of the Board (cur-rently Peter Korsholm and Steven Sher), and the Group CFO and Head of Group Treasury participate in its meet-ings. The committee held ten meetings in 2010.
Executive Group ManagementThe EGM consists of Group CEO Jeff Gravenhorst and Group CFO Jakob Stausholm. The primary tasks of the EGM are to carry out day-to-day management of the Group, develop new strategic initiatives, develop Group policies, monitor Group performance and evaluate invest-ments including acquisitions and divestments.
Group ManagementThe Group Management (the GM) comprises the EGM and the following Corporate Senior Offi cers: Regional CEOs, Group CCO, COO-Projects, Head of Group Human Resources, Head of Group Strategy and Corporate Devel-opment, Group General Counsel, Head of Group Treasury, Head of Group Controlling and Head of Group IT. The members of the GM have been appointed by the EGM to carry out day-to-day management within their functional areas, including providing strategic direction, managerial support and fi nancial control.
Two functional boards, the Group Management Board and the Financial Board, were established in 2009. The primary tasks of the two boards are to develop and execute new strategic initiatives, develop and implement Group policies, monitor Group performance, review fi nancial matters, coordinate and evaluate acquisitions and divestments and provide the EGM with input for deci-sion making. The Group Management Board is headed by the Group CEO, and includes Regional CEOs, Group CCO, COO-Projects, Head of Group Human Resources and Head of Group Strategy and Corporate Development. The Financial Board is led by the Group CFO and includes Head of Group Controlling, Head of Group Treasury, Head of Group IT, Head of Group Internal Audit, Head of Group Tax, Group General Counsel and Regional CFOs.
No member of the GM is permitted to hold directorships in companies outside the ISS Group unless specifi c con-sent is granted.
Country ManagementIn each of the countries in which ISS operates, country management teams are appointed to manage the busi-ness in accordance with ISS Group policies and procedures as well as local legislation and practice. ISS delegates sub-stantial autonomy and considerable powers to the country management teams including management of operations
in their relevant markets, fi nancial reporting, local tax and compliance with local legislation and practices. The country management teams for each relevant country are described on the ISS website at www.issworld.com.
RemunerationEach Board member (except representatives of the Principal Shareholders) receives a fi xed annual fee and members of the Board committees receive an additional fi xed fee.
Remuneration to the Board is reported in note 5 to the consolidated fi nancial statements. The investment by certain Board members in the Directors' Participation Programme is described below.
The members of the GM are remunerated with a com-bination of a fi xed salary, standard benefi ts in accord-ance with market standards and, for most members, a performance-based bonus of up to 60% of their fi xed salary. Most members of the GM are also subject to a cash bonus scheme triggered by the completion of an initial public offering or a sale of the company, the size of such bonus depending on the price of the shares of the company in the offering or the sales price respectively. All employment contracts of the GM members may be termi-nated at 6-24 months' notice. One employment contract includes a severance payment of 2 years salary. No other members of the GM are entitled to severance payments. The employment contracts contain no special termination rights.
Directorships in companies in the ISS Group held by mem-bers of the GM are not remunerated separately.
Detailed reporting on remuneration made to the mem-bers of the EGM is included in note 5 to the consolidated fi nancial statements. The investment by the EGM and certain senior offi cers of the Group in the Management Participation Programme is described below.
Management Participation ProgrammeThe Principal Shareholders have established a Manage-ment Participation Programme in which the EGM and a number of senior offi cers of the Group have invested. The programme is structured as a combination of direct and indirect investments in a mix of shares and warrants in FS Invest based on market values until the Principal Shareholders’ exit. At the introduction of the programme in 2006, warrants in FS Invest were granted free of charge to certain senior offi cers of the Group with a vesting schedule (based on value of shares and time) of which 277,632 were outstanding as of 31 December 2010.
Corporate Governance and Risk Management | Management Review 51

Members of the Board (except representatives of the Prin-cipal Shareholders) participate in a Directors’ Participation Programme and a Co-investment Scheme, under which they have invested in a mix of shares and warrants in FS Invest based on market values until the Principal Share-holders’ exit.
As of 31 December 2010, the net investments were as follows:
Number of
persons
Investmentmeasured at cost
DKK million
Board of Directors 5 27.4
Executive Group Management 2 10.1
Corporate Offi cers 33 56.7
Country Management 113 117.2
INTERNAL CONTROL AND RISK MANAGEMENT SYSTEMS RELATING TO FINANCIAL REPORTING
Overall control environmentThe Board and the EGM have overall responsibility for the Group's internal control and risk management systems for the fi nancial reporting process including compliance with applicable laws and other regulations related to fi nancial reporting.
ISS considers internal controls to be an essential manage-ment tool. Accordingly, care is taken to ensure that a sound framework of controls is in place for safeguard-ing the business, the company’s assets and shareholder investments as well as its fi nancial reporting.
The Group's internal control and risk management sys-tems are developed to mitigate rather than eliminate risks identifi ed in relation to the fi nancial reporting process and thus assist in ensuring that the consolidated fi nancial statements provide a true and fair view of the fi nancial performance and fi nancial position of the Group without material errors.
The Board has approved policies, standards and proce-dures in key areas related to fi nancial reporting, including the Code of Conduct, Accounting and Reporting Policies, Treasury Policies and Procedures, and Control Procedures.
The Audit Committee is responsible for monitoring the internal controls and risk management systems as well as challenging the EGM in its assessment of material fi nan-
cial reporting risks. A material fi nancial reporting risk is considered to be a risk that may cause a material error in the consolidated fi nancial statements of the Group.
On an annual basis, the Audit Committee assesses the need for establishing an internal audit function. The Audit Committee has set up an internal audit department that is responsible for providing assurance concerning the internal control environment in accordance with an approved audit plan.
The EGM has established a Group Controlling department that is responsible for controlling the fi nancial reporting from subsidiaries.
Internal control procedures at Group level have been established to assess on an ongoing basis the Group’s internal control environment and to manage identifi ed risks. However, as a risk of misuse of assets, unexpected losses, etc. always exists, such controls can provide only reasonable and not absolute assurance against material misstatements, omissions or losses.
The aim of the established control environment is there-fore to provide the Board and the EGM with reasonable assurance that:
management reporting is reliable and in compliance with internal policies and procedures and gives a true and fair view of the fi nancial performance and fi nancial position;
material risks are identifi ed and minimised; internal controls are in place to support the quality and effi ciency of the business processes and to safeguard the Group’s business and assets;
ISS’s business is conducted in compliance with applica-ble legislation, regulation and ISS policies.
Risk assessmentRisks related to the fi nancial reporting process are identi-fi ed and assessed annually based on a materiality test including a risk assessment of the impact of quantitative and qualitative factors. The evaluation of the risks includes an assessment of the likelihood that an error will occur and whether such an error may be material.
The risk of errors is relatively higher for accounting areas that require management judgement and/or are transac-tions that are generated through complex accounting pro-cesses. Accounting areas that require management judge-ment are described in note 2 to the consolidated fi nancial statements, Critical Accounting Estimates and Judgements.
On an ongoing basis the Audit Committee discusses:
52 Annual Report 2010

material and relevant new accounting pronouncements and implementation of such;
evaluation of the overall effectiveness of the internal controls for fi nancial reporting; and
accounting for material legal and tax issues and signifi -cant accounting estimates.
Control activitiesIn order to sustain a sound control environment, spe-cifi c control activities are designed to obtain the desired assurance. These measures must ensure that all relevant aspects of a specifi c area are covered, and that the combi-nation of control activities monitors all relevant aspects of the business. The control activities are based on the risk assessment made by the EGM. The purpose of the control activities is to ensure that material errors in the fi nancial reporting are prevented, detected and corrected.
The Group has implemented a formalised fi nancial report-ing process that includes:
reporting of fi nancial performance and fi nancial posi-tion – all countries must report a full income statement, balance sheet, cash fl ow statement, portfolio analysis etc. on a monthly basis. The reporting is monitored and controlled by Group Controlling. Any signifi cant vari-ance from budgets must be explained;
reporting of cash fl ow forecasts – all countries must bi-weekly report the daily cash fl ow forecast for a rolling three-month period. Subsequently, actual fi gures are continuously monitored by Group Treasury for devia-tions from the forecasted fi gures;
business reviews – monthly meetings between regional management and country management with a focus on the current performance and the state of the business;
budgets and fi nancial plans – all countries must prepare budgets and plans for the following fi nancial year in a pre-defi ned process and format. With the countries, regional management teams review the proposed budgets and plans with the countries;
full-year forecasts – all countries must update and report their full-year estimates twice a year;
strategy reviews – annual meetings with country man-agers at which the strategy is discussed, and priorities and plans for the coming year are agreed;
acquisitions and divestments – all acquisition and divest-ment proposals must be presented in a predefi ned acquisition or divestment report and valuation model for approval. Board or Acquisition Committee approval is re-quired for large or strategic acquisitions and divestments.
Information and reporting systemsAll countries use a standardised fi nancial reporting tool. Due to the decentralised structure, various ERP platforms
exist within the Group. However, the number of different ERP platforms is continuously being reduced.
Information and communication systems to ensure ac-counting and internal control compliance have been established, including an Accounting Manual, Reporting Instructions, Budgeting Manual and other relevant guide-lines. The aim is to ensure that all employees receive the relevant information on a timely basis to ensure effi cient and reliable execution of tasks including carrying out the established control activities.
MonitoringEvery month the Group’s subsidiaries report fi nancial information and comments on fi nancial developments to Group Controlling. This information is used to prepare consolidated fi nancial statements and reports submitted to the Board and the EGM. Financial reporting from the subsidiaries is controlled on a monthly basis (see Control activities).
The country management teams are responsible for ensur-ing that the control environment in each operating coun-try is suffi cient to avoid material errors in the country's fi nancial performance and fi nancial position reported for consolidation purposes. The regional management teams provide governance of the country operations.
Additionally, in order to independently evaluate the adequacy of the local internal control environment and procedures, Group Internal Audit visits the country organisations regularly. The visits take place according to a plan for the year approved by the Audit Committee. The fi ndings and conclusions of internal audits, including recommendations on how to improve the control environ-ment, are presented in reports addressed to country and regional management, representatives of EGM and the external auditor.
Group Internal Audit performs follow-up audits to ensure that the recommendations are implemented. The key fi ndings from internal audits are presented to the Audit Committee, which evaluates the results reported and uses the conclusions to assess the general control environment and performance and fi nancial position when reviewing the Internal Audit Plan for the coming year.
External auditThe Board nominates the external auditor for election. The nomination follows an assessment of the competen-cies, objectivity and independence of the external auditor and the effectiveness of the audit process.
Corporate Governance and Risk Management | Management Review 53

An independent business relationship with the Group’s external auditor is essential for the control environment. As part of the safeguards to ensure independence, the external auditor may not be used for certain non-audit services for ISS including, but not limited to, prepara-tion of accounting records and fi nancial statements and recruitment for senior management positions.
The company collaborates with its external auditor at country level and at Group level in relation to procedures and internal controls by exchanging internal audit reports and independent audit reports and by generally sharing relevant knowledge.
All Board members receive the external auditor’s long-form audit reports in connection with the audit of the annual consolidated fi nancial statements and any other long-form audit reports. Auditor reports are discussed in detail by the Audit Committee.
The Board reviews the Annual Report at a Board meet-ing attended by the external auditor. The fi ndings of the external auditor and any major issues arising during the course of the audit are discussed and signifi cant account-ing principles and critical accounting estimates and judge-ments are reviewed.
RISK MANAGEMENT
ISS continuously seeks to identify, evaluate and mitigate risks that may have an adverse effect on the Group’s abil-ity to achieve the strategic objectives, including fi nancial performance, fi nancial position and growth.
Overall, operational and fi nancial risks are managed in accordance with policies adopted by the Board. Detailed plans and business procedures for a number of functions are also described in manuals and guidelines. The policies for operational and fi nancial risk management and ISS Group standards are documented and distributed to the operating companies. ISS’s Group Controlling, Group In-ternal Audit, Group Risk Management and Group Treasury departments supervise compliance with these standards.
Operational risk managementISS is exposed to operational risks through its actions and activities on our own premises as well as on our custom-ers' premises. Operational risk is assessed based on the activities of each operating company, historic and current claims events, and the markets in which the companies operate. Furthermore, operational risk is assessed on an individual site-by-site basis on our customers' premises where we provide our services. Operational risk is moni-
tored and mitigated in accordance with ISS Group stand-ards for risk management, risk fi nancing, HSE manage-ment and good operational practice.
Operational risk fi nancing is based on insurance and own funding, primarily through global insurance programmes managed centrally in ISS.
ISS considers that the Group is not subject to material operational risks except for risks common in the ordinary course of business in the service industry.
Financial risk management ISS is exposed to fi nancial risks as a result of its operating activities, investing activities and fi nancing activities. The Group’s fi nancial risks are managed centrally in Group Treasury based on policies approved by the Board. The Group’s fi nancial risk management is described in detail in note 36 to the consolidated fi nancial statements.
Risk factorsThe risks discussed below are those that the Board and Group Management currently views as being most signifi -cant to our business.
Macro-economy We believe that the growth in de-mand for our services generally correlates with economic conditions, including growth in gross domestic product, in the countries in which we operate. We believe that the facility services industry is less sensitive to macroeconomic cycles than a number of other industries. However, eco-nomic downturns or otherwise uncertain economic out-looks in the markets in which we operate or on a global scale could adversely affect the demand for outsourcing of facility services.
Periods of recession or defl ation may adversely impact prices, payment terms and demand for services particular-ly if customers downsize their businesses or reduce their demand for services.
During the recent economic downturn, in certain regions and in certain customer segments, we experienced re-duced activity levels that negatively impacted our revenue and put pressure on our operating margins. However, generally speaking we were able to off-set these factors by adapting our cost structure appropriately. Our portfolio business tends to be more resilient and was less affected during the recent economic downturn than our once-only business.
Customer retention risk Our organic growth strategy is dependent on various factors including our ability to cross- and up-sell, the increased trend among multina-
54 Annual Report 2010

tional companies to outsource facility services and procure cross-border contracts and our ability to subsequently provide these services in a global, effective and price-effi -cient manner. Sustaining the organic growth of our busi-ness requires us to adapt continuously to meet the needs of our existing and potential customers. In particular, our success will depend on:
the continued growth in demand for the outsourcing of facility services, either as single services, multi services or integrated facility services;
our ability to continue to self-deliver integrated facil-ity services to local and multi-national customers and the recognition by such customers that we are one of very few service providers positioned to provide such integrated facility services, also on a global scale;
our ability to establish our presence in new markets and to grow our market share in existing markets.
We strive to meet all these requirements by adapting appropriate sales processes to refl ect the needs of our customers, evaluate our existing business platform - in terms of the services delivered, our capabilities and the geographies in which we operate - on an ongoing basis to ensure it refl ects both the current and future require-ments of our customers.
Risks associated with our customer contracts The profi tability of our contracts generally depends on our abil-ity to successfully calculate prices by taking into considera-tion all economic factors, direct as well as inherent liabili-ties, and our ability to manage our day-to-day operations under these contracts. We may not be able to accurately predict the costs of and identify all risks associated with our contracts or the complexity of the services delivered, which may result in lower margins than expected, losses under these contracts or even the loss of customers.
We seek to mitigate these risks by applying good opera-tional practices when entering into contractual agree-ments with our customers.
Qualifi ed local managers and employees Our con-tinued success depends largely on our effective decen-tralised organisational structure in which country and regional managers retain substantial autonomy regarding the management of operations in their local markets. As a result, we largely depend on these local managers. Qualifi ed local and regional managers are also important in order to ensure best practices are shared across the Group, effective management continuity and the imple-mentation and management of our growth strategies. Our competitive strength also depends partly upon our ability to attract, train and retain employees.
Competition risk The facility services market is frag-mented with relatively low barriers to entry and there is signifi cant competition from local, regional, national and international companies of varying sizes and fi nancial abilities offering an array of service capabilities. We also face competition from in-house providers.
We believe that our self-delivering capabilities, our abil-ity to deliver services across borders, group-wide HSE standards, credible risk transfer as well as our general process and management systems all contribute towards positioning ISS very favourably in the markets in which we operate.
Regulatory risks Due to the nature of our industry and the global reach of our operations, we are subject to a variety of laws and regulations governing areas such as labour, employment, immigration, health and safety, tax (including social security and salary taxes), corporate governance, customer protection, business practices, and the environment. Changes in such laws and regulations may constrain our ability to provide services to customers or increase the costs of providing the services.
To the extent that we are unable to pass on to our cus-tomers the costs of compliance with stricter or changing requirements (e.g. increases in labour costs mandated by law or collective bargaining agreements) and taxes, our margins may decline. In particular, because of our large workforce, laws and regulations relating to labour, employment (including the transfer of employees), social security, health and safety of employees and immigration affect our operations and the cost of compliance signifi -cantly affects our results and fi nancial condition.
Financial risks The Group is exposed to a number of fi nancial risks including currency risk, interest rate risk, li-quidity risk and credit risk. The fi nancial risks and manage-ment hereof are described in note 36 to the consolidated fi nancial statements.
Corporate Governance and Risk Management | Management Review 55

GORDANA RISTIC, THERMALBAD SCHINZNACH, SWITZERLAND
HOTEL, LEISURE & ENTERTAINMENT – representing 4% of Group revenue At ISS we understand the complexity in the number of services and facilities our hotel customers choose to deliver. Through our service solution we help our customers to provide a coherent experience to their customers. Further, we develop service solutions that meet the expectations of our customers who organise major cultural and sports events and manage exceptional leisure destinations. And for the end-customer, this means an improved experience.

Board of Directors
1) All members of the Board of Directors are nominated for re-election at the annual general meeting.
NAME FIRST ELECTED
END OF TERM 1)
BORN INDEPENDENCE
Ole Andersen, Chairman 2005 2011 1956 Independent
Leif Östling, Vice-Chairman 2005 2011 1945 Independent
John Allan 2008 2011 1948 Independent
Michel Combes 2010 2011 1962 Independent
Peter Korsholm 2008 2011 1971 Not independent
Jørgen Lindegaard 2010 2011 1948 Not independent
Steven Sher 2007 2011 1970 Not independent
Board of Directors | Management Review 57

3 5 6 7
21
4
1 OLE ANDERSEN Ole Andersen is the Chairman of the Board and has
been a member of the Board since March 2005. Mr. Andersen served as senior partner and head of the Copenhagen offi ce of EQT Partners from September 2003 to May 2008. Prior to joining EQT Partners, Mr. Andersen worked for Enskilda Securities. From 1997 to 2000, he was head of the Copenhagen Branch and, from 2000 to 2003, he was global head of Corporate Finance. From 1983 to 1997, Mr. Andersen worked for Arthur Andersen & Co (1984-1989), Skandinavisk Hold-ing (1989-1990), Capex (1990-1990), Trap & Kornum (1990-1991) and Alfred Berg (1991-1997). Mr. Andersen is currently Chairman of the Board of Privathospitalet Hamlet A/S, Chr. Hansen Holding A/S, Bang & Olufsen A/S and Bang & Olufsen Operations A/S and a member of the Board of Danske Bank A/S, Kommunekemi A/S, Duke Infrastructure Holding A/S, and Duke Infrastruc-ture A/S.
Mr. Andersen holds a Master of Science in Business Administration and Auditing from the Copenhagen Business School. He is also a state Authorised Public Accountant.
Competence profi le: Professional experience in manag-ing large fi nancial and international companies, fi nancial and economic expertise and extensive board experience including from listed companies.
2 LEIF ÖSTLING Leif Östling is Vice Chairman of the Board and has
been a member of the Board since October 2005. He is currently the President and Group Chief Executive Offi cer of Scania AB, a position he has held since 1995. Prior to that time, Mr. Östling held various positions with Scania, including acting manager of Scania’s
South American operations, head of Strategic Planning, Marketing Manager in the Netherlands and President of Scania Nederland. Mr. Östling is Chairman of the Board of Directors of AB SKF, Confederation of Swedish Enter-prise (Svensk Näringsliv) and The Association of Swedish Engineering Industries (Teknikföretagen) and member of the Board of Directors of Scania AB and a member of an advisory board to Toyota Industries Cooperation.
Mr. Östling holds a Master of Science in Engineering from Chalmers University of Technology in Gothenburg, a Master of Business Administration from the Gothen-burg School of Economics and two honorary doctorate degrees in engineering science from the Royal Institute of Technology in Stockholm and Luleå University of Technology.
Competence profi le: Executive management experi-ence from international companies, management and marketing experience from different cultures, extensive board experience including from listed, international companies.
3 JOHN ALLAN John Allan has been a member of the Board since June
2008. Mr. Allan is currently Chairman of the Board of Dixons Retail Plc. and Care UK Plc. and a member of the Board of 3i Plc., National Grid Plc. and Natakate Ltd. Mr. Allan started his career at Lever Brothers, moving to Bristol-Myers Company Ltd and then Fine Fare Ltd. He joined BET Plc. in 1985 and was appointed to the board in 1987. In 1994, Mr. Allan was appointed CEO of Ocean Group Plc. which later became Exel Plc. In 2005, Exel was acquired by Deutsche Post World Net, and Mr. Allan joined the Management Board of Deutsche Post World Net. From 2007 until his retirement in 2009 Mr. Allan was the CFO of Deutsche Post World Net. Mr. Al-lan was previously Chairman of the Board of Samsonite Corporation, non-executive Director of PHS Group Plc., Wolseley Plc., Hamleys Plc., Connell Plc., member of the Supervisory Board of Lufthansa AG and Deutsche Postbank AG.
Mr. Allan holds a degree in Mathematical Science from Edinburgh University.
Competence profi le: Executive management experience from international companies, fi nancial and account-ing expertise, management experience from the service industry, extensive board experience, including from listed, international companies in the United Kingdom, the USA and Germany.
58 Annual Report 2010

4 MICHEL COMBES Michel Combes has been a member of the Board since
July 2010. Mr. Combes is currently the Chief Executive Offi cer for the Europe Region of Vodafone Plc. He was appointed to this position and joined Voda-fone in October 2008 and the board in June 2009.
Mr. Combes began his career at France Telecom in 1986 in the External Networks Division, following which he moved to the Industrial and International Affairs Division. He became technical advisor to the Minister of Transportation in 1991, before serving as Chairman and Chief Executive Offi cer of GlobeCast from 1995 to 1999, when he became Executive Vice President of Nouvelles Frontières Group. From 2001 to 2003, he was Chief Executive Offi cer of Assystem SA, a com-pany specialising in industrial engineering. Mr. Combes returned to France Telecom Group in 2003 as Senior Vice President of Group Finance and Chief Financial Offi cer. Until January 2006, Mr. Combes was Senior Executive Vice President, in charge of NExT Financial Balance & Value Creation and a member of the France Telecom Group Strategic Committee. From 2006 to 2008, he was Chairman and Chief Executive Offi cer of TDF Group. Mr. Combes is Chairman of the Supervisory Board of Assystem SA.
Mr. Combes is a graduate of the École Polytechnique and École National Supérieure des Télécommunications in France and holds a Master of Business Administration from Paris Dauphine University.
Competence profi le: Executive management experience from international companies, expertise in international strategy, sales and marketing and in-depth knowledge of French industry and business.
5 PETER KORSHOLM Peter Korsholm has been a member of the Board since
April 2008. Mr. Korsholm is a partner and Head of the Copenhagen offi ce as managing partner of EQT Part-ners A/S. He joined EQT Partners in 1999. Previously, he worked at Morgan Stanley in London. Mr. Korsholm is currently a member of the Board of BTX Group A/S, EQT Partners A/S, Holdingselskabet af 24. februar 2006 A/S, Caridian BCT Holding Corp, Gambro AB, Indap Sweden AB, Indap Holding AB and the Danish Venture Capital and Private Equity Association (DVCA).
Mr. Korsholm holds a Master of Business Administration with distinction from INSEAD. He also holds a Master of Science in Econometrics and Mathematical Econom-ics from London School of Economics and a Bachelor in Economics from the University of Copenhagen.
Competence profi le: Professional experience in invest-ing in large international companies, broad experience within banking and private equity, expertise in complex fi nancing structures and M&A.
6 JØRGEN LINDEGAARD Jørgen Lindegaard has been a member of the Board since
April 2010. Mr. Lindegaard was Group Chief Executive Offi cer of ISS from August 2006 until March 2010. Mr. Lindegaard joined ISS as a member of the Board in April 2006, a position he resigned from when he was ap-pointed Chief Executive Offi cer in August 2006. He was the President and CEO of SAS Group from 2001 to 2006 and, prior to that, the CEO of GN Store Nord A/S from 1997 to 2001. From 1995 to 1996, he was Managing Director of Tele Danmark. From 1991 to 1995, he was the CEO of KTAS. From 1990 to 1991, he was the CEO of Fyns Telefon. Mr Lindegaard is currently Chairman of the Board of AVT Business School A/S, Deducta A/S, K/S Vimmelskaftet 39-41, København and deputy chairman of IT University of Copenhagen (ITU) as well as a member of the Board of Parken Sport & Entertainment A/S, Trifi na Mellemholding ApS, Trifi na Holding ApS and Efsen Engi-neering A/S.
Mr. Lindegaard holds a Master of Science in Engineering (Electronics) from Technical University of Denmark.
Competence profi le: Executive management experience from several positions in international companies, broad experience with leadership development and in-depth knowledge of the governance and organisation of ISS.
7 STEVEN SHER Steven Sher has been a member of the Board since
December 2007. Mr. Sher is currently a Managing Direc-tor of Goldman Sachs International within the Merchant Banking Division. Prior to joining Goldman Sachs in 1997, Mr. Sher was with Price Waterhouse in London, where he qualifi ed with the Institute of Chartered Ac-countants in England and Wales. Mr. Sher is a member of the Board of Directors of Ahlsell AB and Edam Acquisition I B.V. Cooperatief U.A.
Mr. Sher holds a Bachelor of Commerce and a post graduate Bachelor of Accounting from the University of Witwatersrand.
Competence profi le: Professional experience in invest-ing in large international companies, broad experience within banking and private equity, expertise in fi nance and accounting and M&A.
Board of Directors | Management Review 59
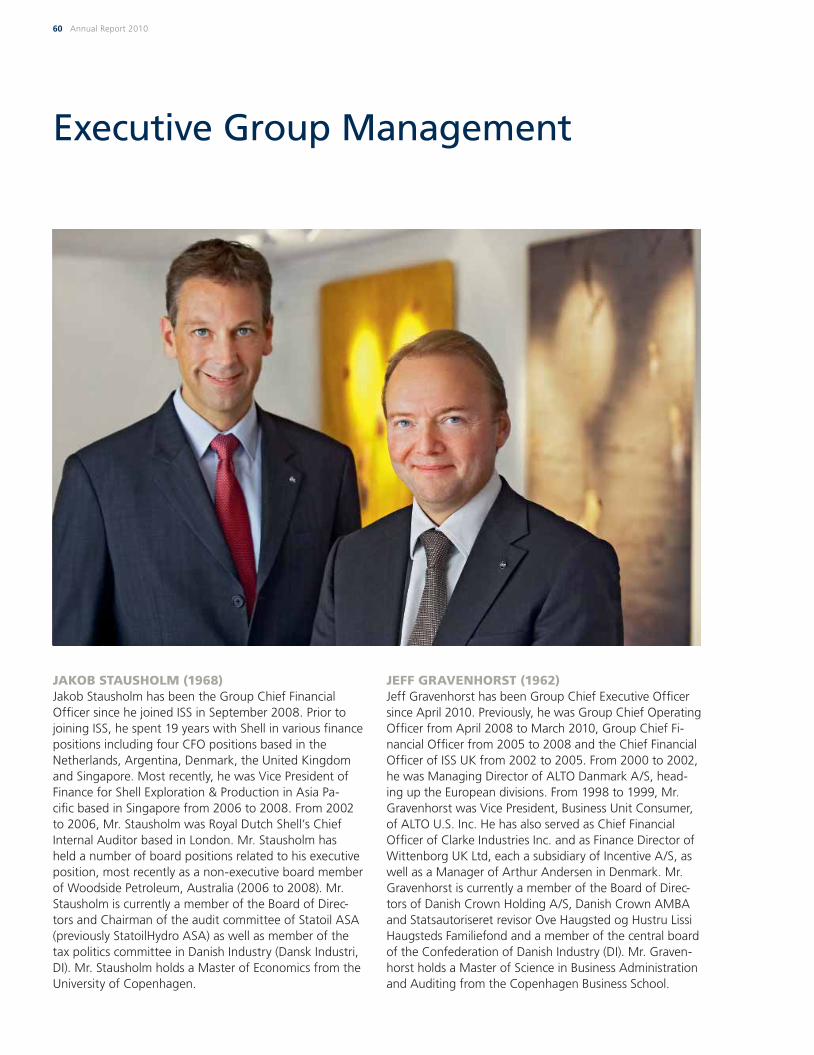
Executive Group Management
JAKOB STAUSHOLM (1968)Jakob Stausholm has been the Group Chief Financial Offi cer since he joined ISS in September 2008. Prior to joining ISS, he spent 19 years with Shell in various fi nance positions including four CFO positions based in the Netherlands, Argentina, Denmark, the United Kingdom and Singapore. Most recently, he was Vice President of Finance for Shell Exploration & Production in Asia Pa-cifi c based in Singapore from 2006 to 2008. From 2002 to 2006, Mr. Stausholm was Royal Dutch Shell’s Chief Internal Auditor based in London. Mr. Stausholm has held a number of board positions related to his executive position, most recently as a non-executive board member of Woodside Petroleum, Australia (2006 to 2008). Mr. Stausholm is currently a member of the Board of Direc-tors and Chairman of the audit committee of Statoil ASA (previously StatoilHydro ASA) as well as member of the tax politics committee in Danish Industry (Dansk Industri, DI). Mr. Stausholm holds a Master of Economics from the University of Copenhagen.
JEFF GRAVENHORST (1962)Jeff Gravenhorst has been Group Chief Executive Offi cer since April 2010. Previously, he was Group Chief Operating Offi cer from April 2008 to March 2010, Group Chief Fi-nancial Offi cer from 2005 to 2008 and the Chief Financial Offi cer of ISS UK from 2002 to 2005. From 2000 to 2002, he was Managing Director of ALTO Danmark A/S, head-ing up the European divisions. From 1998 to 1999, Mr. Gravenhorst was Vice President, Business Unit Consumer, of ALTO U.S. Inc. He has also served as Chief Financial Offi cer of Clarke Industries Inc. and as Finance Director of Wittenborg UK Ltd, each a subsidiary of Incentive A/S, as well as a Manager of Arthur Andersen in Denmark. Mr. Gravenhorst is currently a member of the Board of Direc-tors of Danish Crown Holding A/S, Danish Crown AMBA and Statsautoriseret revisor Ove Haugsted og Hustru Lissi Haugsteds Familiefond and a member of the central board of the Confederation of Danish Industry (DI). Mr. Graven-horst holds a Master of Science in Business Administration and Auditing from the Copenhagen Business School.
60 Annual Report 2010

1 BJØRN RAASTEEN (1964)Group General Counsel
2 DAVID OPENSHAW (1949)Regional CEONorth America, United Kingdom, Ireland, South Africa & Middle East
3 DANIEL BRENNAN (1956)Head of Group Human Resources
4 MARTIN GAARN THOMSEN (1970)Regional CEOWestern Europe
5 HANS JOHN ØIESTAD (1955)Regional CEONordic
6 TROELS BJERG (1963)Regional CEOEastern Europe
7 HENRIK LANGEBÆK (1966)COO-Projects
Group Management
8 JEAN-MANUEL BULLUKIAN (1964)Regional CEO Asia-Pacifi c
9 HENRIK TREPKA (1963)Head of Group IT
10 JACOB GÖTZSCHE (1967)Regional CEOCentral Europe
11 LUIS ANDRADE (1960)Regional CEOIberia & Latin America
12 TODD O’NEILL (1966)Head of Group Strategy and Corporate Development
13 PETER HARDER THOMSEN (1971)Head of Group Controlling
14 BARBARA PLUCNAR JENSEN (1971)Head of Group Treasury
15 LARS SANDAHL SØRENSEN (1962)Chief Commercial Offi cer
1 23 4 5 6 7
8 9 11
15
1413
1211
10
Executive and Group Management | Management Review 61

THOMAS MÄLSTRÖM AND MARKUS SVENSSON, SWEDEN

Financial statements

WANESSA REGIS, BRAZIL
Group

Consolidated income statement1 January – 31 December
DKK million Note 2010 2009
Revenue 3, 4 74,073 69,004
Staff costs 5, 6 (47,990) (44,781)Consumables 21 (6,359) (6,044)Other operating expenses 7 (14,607) (13,437)Depreciation and amortisation 1) 15, 17 (850) (868)
Operating profi t before other items 2) 4,267 3,874
Other income and expenses, net 8 (112) (551)Acquisition and integration costs (6) (46)
Operating profi t 1) 3 4,149 3,277
Share of result from associates 18 10 4 Financial income 9 198 223 Financial expenses 9 (2,566) (2,531)
Profi t before tax and goodwill impairment/amortisation and impairment of brands and customer contracts 1,791 973
Income taxes 3) 10 (760) (588)
Profi t before goodwill impairment/amortisation and impairment of brands and customer contracts 1,031 385
Goodwill impairment 11, 15, 16 (938) (1,246)Amortisation and impairment of brands and customer contracts 4) 15 (869) (1,129)Income tax effect 5) 10, 19 244 361
Net profi t/(loss) for the year (532) (1,629)
Attributable to:
Owners of ISS A/S (552) (1,647)Non-controlling interests 20 18
Net profi t/(loss) for the year (532) (1,629)
Earnings per share:
Basic earnings per share (EPS), DKK 12 (5.5) (16.5)Diluted earnings per share, DKK 12 (5.5) (16.5)Adjusted earnings per share, DKK 6) 12 10.3 3.9
1) Excluding Goodwill impairment and Amortisation and impairment of brands and customer contracts.2) Excluding Other income and expenses, net, Acquisition and integration costs, Goodwill impairment and Amortisation and impairment of brands and
customer contracts.3) Excluding tax effect of Goodwill impairment and Amortisation and impairment of brands and customer contracts.4) Including customer contract portfolios and related customer relationships.5) Income tax effect of Goodwill impairment and Amortisation and impairment of brands and customer contracts.6) Calculated as Profi t before goodwill impairment/amortisation and impairment of brands and customer contracts divided by the average number of shares (diluted).
Consolidated fi nancial statements 65

Consolidated statement of comprehensive income1 January – 31 December
DKK million Note 2010 2009
Net profi t/(loss) for the year (532) (1,629)
Other comprehensive incomeForeign exchange adjustments of subsidiaries and non-controlling interests 911 364 Fair value adjustment of hedges, net 37 (138) (327)Fair value adjustment of hedges, net, transferred to Financial expenses 37 259 325Actuarial gains/(losses) 30 (129) (45)Impact from asset ceiling regarding pensions 30 (20) 18 Tax regarding other comprehensive income 10 6 2
Total other comprehensive income 889 337
Total comprehensive income for the year 357 (1,292)
Attributable to:
Owners of ISS A/S 336 (1,310)Non-controlling interests 21 18
Total comprehensive income for the year 357 (1,292)
66 Annual Report 2010

Consolidated statement of cash fl ows1 January – 31 December
DKK million Note 2010 2009
Operating profi t before other items 4,267 3,874 Depreciation and amortisation 15, 17 850 868 Changes in working capital 13 (87) (137)Changes in provisions, pensions and similar obligations (85) (50)Other expenses paid (197) (371)Integration costs paid (15) (58)Income taxes paid 24 (697) (394)
Cash fl ow from operating activities 4,036 3,732
Acquisition of businesses 14 (470) (914)Divestment of businesses 14 591 22 Acquisition of intangible assets and property, plant and equipment (987) (1,007)Disposal of intangible assets and property, plant and equipment 101 110 (Acquisition)/disposal of fi nancial assets 48 (43)
Cash fl ow from investing activities (717) (1,832)
Proceeds from borrowings 2,496 5,849 Repayment of borrowings (3,395) (5,177)Interest received 105 82 Interest paid (2,383) (2,287)Non-controlling interests (9) (14)
Cash fl ow from fi nancing activities (3,186) (1,547)
Total cash fl ow 133 353
Cash and cash equivalents at 1 January 3,364 2,961 Total cash fl ow 133 353 Foreign exchange adjustments 109 50
Cash and cash equivalents at 31 December 26 3,606 3,364
Consolidated fi nancial statements 67

Consolidated statement of fi nancial position At 31 December
DKK million Note 2010 2009
Assets
Intangible assets 15, 16 35,358 35,452 Property, plant and equipment 17 2,055 2,004 Investments in associates 18 9 21 Deferred tax assets 19 655 514 Other fi nancial assets 20 290 276
Non-current assets 38,367 38,267
Inventories 21 318 303 Trade receivables 22 10,896 10,130 Contract work in progress 23 125 195 Tax receivables 24 386 308 Other receivables 25 348 551 Prepayments 546 525 Securities 26 19 97 Cash and cash equivalents 26 3,606 3,364 Assets held for sale 27 824 614
Current assets 17,068 16,087
Total assets 55,435 54,354
Equity and liabilities
Total equity attributable to owners of ISS A/S 2,626 2,190 Non-controlling interests 25 23
Total equity 28 2,651 2,213
Loans and borrowings 29 29,032 28,649 Pensions and similar obligations 30 1,053 837 Deferred tax liabilities 19 2,305 2,356 Provisions 31 361 379
Non-current liabilities 32,751 32,221
Loans and borrowings 29 5,212 5,710 Trade payables 2,830 2,624 Tax payables 24 411 306 Other liabilities 32 10,946 10,478 Provisions 31 379 423 Liabilities related to assets held for sale 27 255 379
Current liabilities 20,033 19,920
Total liabilities 52,784 52,141
Total equity and liabilities 55,435 54,354
68 Annual Report 2010
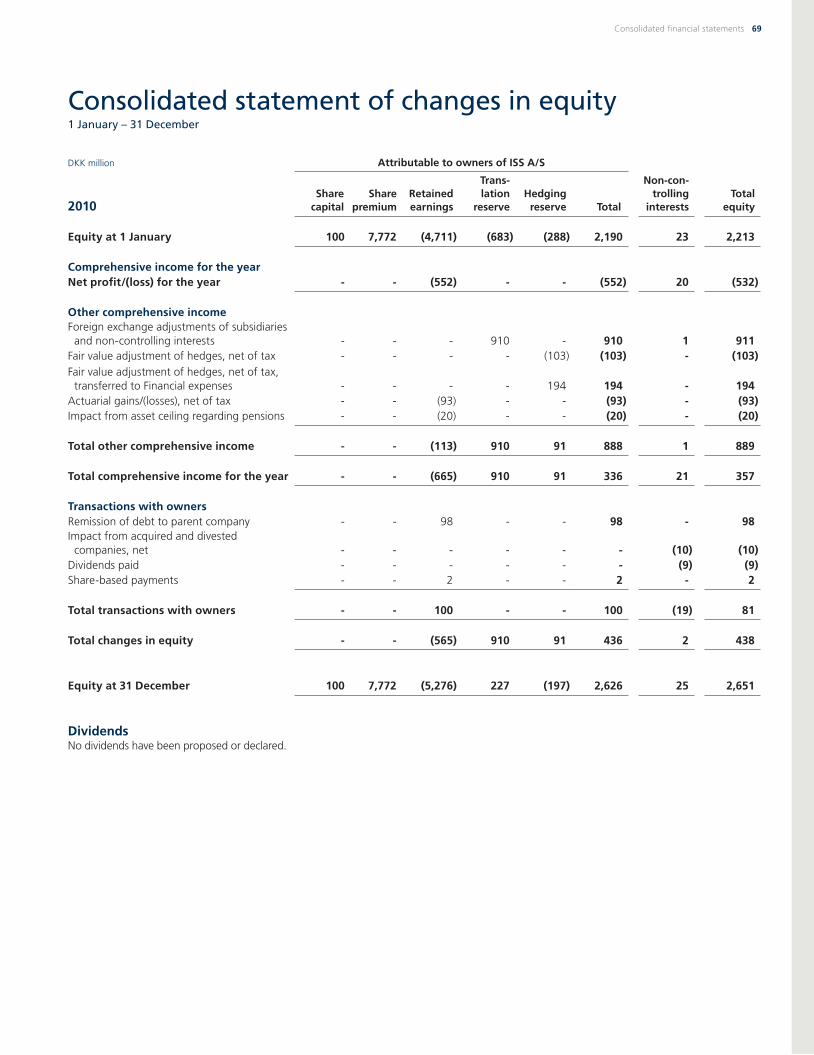
Consolidated statement of changes in equity1 January – 31 December
DKK million Attributable to owners of ISS A/S
2010Share
capitalShare
premiumRetained earnings
Trans-lation
reserveHedging
reserve Total
Non-con-trolling
interestsTotal
equity
Equity at 1 January 100 7,772 (4,711) (683) (288) 2,190 23 2,213
Comprehensive income for the yearNet profi t/(loss) for the year - - (552) - - (552) 20 (532)
Other comprehensive incomeForeign exchange adjustments of subsidiaries and non-controlling interests - - - 910 - 910 1 911 Fair value adjustment of hedges, net of tax - - - - (103) (103) - (103)Fair value adjustment of hedges, net of tax, transferred to Financial expenses - - - - 194 194 - 194 Actuarial gains/(losses), net of tax - - (93) - - (93) - (93)Impact from asset ceiling regarding pensions - - (20) - - (20) - (20)
Total other comprehensive income - - (113) 910 91 888 1 889
Total comprehensive income for the year - - (665) 910 91 336 21 357
Transactions with ownersRemission of debt to parent company - - 98 - - 98 - 98 Impact from acquired and divested companies, net - - - - - - (10) (10)Dividends paid - - - - - - (9) (9)Share-based payments - - 2 - - 2 - 2
Total transactions with owners - - 100 - - 100 (19) 81
Total changes in equity - - (565) 910 91 436 2 438
Equity at 31 December 100 7,772 (5,276) 227 (197) 2,626 25 2,651
DividendsNo dividends have been proposed or declared.
Consolidated fi nancial statements 69

Consolidated statement of changes in equity1 January – 31 December
DKK million Attributable to owners of ISS A/S
2009Share
capitalShare
premiumRetained earnings
Trans-lation
reserveHedging
reserve Total
Non-con-trolling
interestsTotal
equity
Equity at 1 January 100 7,772 (3,043) (1,047) (284) 3,498 35 3,533
Comprehensive income for the yearNet profi t/(loss) for the year - - (1,647) - - (1,647) 18 (1,629)
Other comprehensive incomeForeign exchange adjustments of subsidiaries and non-controlling interests - - - 364 - 364 - 364 Fair value adjustment of hedges, net of tax - - - - (245) (245) - (245)Fair value adjustment of hedges, net of tax, transferred to Financial expenses - - - - 244 244 - 244 Limitation to interest deduction in Denmark - - - - (3) (3) - (3)Actuarial gains/(losses), net of tax - - (41) - - (41) - (41)Impact from asset ceiling regarding pensions - - 18 - - 18 - 18
Total other comprehensive income - - (23) 364 (4) 337 - 337
Total comprehensive income for the year - - (1,670) 364 (4) (1,310) 18 (1,292)
Transactions with ownersImpact from acquired and divested companies, net - - - - - - (16) (16)Dividends paid - - - - - - (14) (14)Share-based payments - - 2 - - 2 - 2
Total transactions with owners - - 2 - - 2 (30) (28)
Total changes in equity - - (1,668) 364 (4) (1,308) (12) (1,320)
Equity at 31 December 100 7,772 (4,711) (683) (288) 2,190 23 2,213
DividendsNo dividends have been proposed or declared.
70 Annual Report 2010

ACCOUNTING POLICIESNote 1 Signifi cant accounting policies 72Note 2 Critical accounting estimates and judgements 81
INCOME STATEMENTNote 3 Segment information 84Note 4 Revenue 88Note 5 Staff costs 88Note 6 Share-based payments 90Note 7 Fees to auditors elected at the Annual General Meeting 91Note 8 Other income and expenses, net 91Note 9 Financial income and fi nancial expenses 92Note 10 Income taxes 93Note 11 Goodwill impairment 94Note 12 Earnings per share 94
STATEMENT OF CASH FLOWSNote 13 Changes in working capital 95Note 14 Acquisition and divestment of businesses 95
STATEMENT OF FINANCIAL POSITIONNote 15 Intangible assets 100Note 16 Impairment tests 101Note 17 Property, plant and equipment 104Note 18 Investments in associates 105Note 19 Deferred tax 106Note 20 Other fi nancial assets 107Note 21 Inventories 107Note 22 Trade receivables 108Note 23 Contract work in progress 108Note 24 Tax receivables and tax payables 109Note 25 Other receivables 109Note 26 Securities, cash and cash equivalents 110Note 27 Assets and Liabilities held for sale 110Note 28 Share capital 111Note 29 Loans and borrowings 111Note 30 Pensions and similar obligations 114Note 31 Provisions 117Note 32 Other liabilities 118Note 33 Financial assets and liabilities 119
OTHERNote 34 Contingent liabilities, pledges and guarantees 121Note 35 Operating leases 122Note 36 Financial risk management 122Note 37 Derivatives 127Note 38 Related parties 129Note 39 Interests in joint ventures 131Note 40 Subsequent events 132Note 41 New standards and interpretations not yet implemented 132Note 42 Subsidiaries, associates, joint ventures and SPEs 133
Notes to the consolidated fi nancial statements
Consolidated fi nancial statements 71

ISS A/S (formerly ISS Holding A/S) is a company domiciled in Den-mark. The consolidated fi nancial statements of ISS A/S as of and for the year ended 31 December 2010 comprise ISS A/S and its subsidi-aries (together referred to as "the Group") and the Group's interests in jointly controlled entities and associates.
STATEMENT OF COMPLIANCEThe consolidated fi nancial statements have been prepared in ac-cordance with International Financial Reporting Standards (IFRS) as adopted by the EU and additional Danish disclosure requirements for consolidated fi nancial statements (class D) and the statutory order on the adoption of IFRS issued pursuant to the Danish Financial State-ments Act.
In addition, the consolidated fi nancial statements have been pre-pared in compliance with the IFRSs issued by the IASB.
The consolidated fi nancial statements were discussed and approved by the Executive Group Management and the Board of Directors on 3 March 2011 and issued for approval at the Annual General Meet-ing on 3 March 2011.
BASIS OF PREPARATIONThe consolidated fi nancial statements are presented in Danish kroner (DKK) (rounded to nearest DKK million), which is also ISS A/S’s func-tional currency.
The consolidated fi nancial statements have been prepared on the historical cost basis except for the following assets and liabilities, which are measured at fair value: derivatives, fi nancial instruments designated as fair value through the income statement and fi nancial assets classifi ed as available-for-sale.
Non-current assets and disposal groups classifi ed as held for sale are measured at the lower of the carrying amount before the changed classifi cation and fair value less costs to sell.
The accounting policies set out below have been applied consistently to all periods presented in these consolidated fi nancial statements except for the changes as explained below in "Changes in account-ing policies".
CHANGES IN ACCOUNTING POLICIESWith effect from 1 January 2010, the Group has implemented IFRS 3 (revised 2008) "Business Combinations", IAS 27 (amended 2008) "Consolidated and Separate Financial Statements", amendments to IAS 39 "Financial Instruments: Recognition and Measurement: Eligible Hedged Items", parts of "Improvements to IFRSs May 2008", amendments to IFRIC 9 and IAS 39 "Reassessment of Embedded De-rivatives", amendments to IFRS 2 "Group Cash-settled Share-based Payment Transactions", amendments to IFRS 1 "Additional Exemp-tions for First-Time Adopters" and parts of "Improvements to IFRSs April 2009".
Except for IFRS 3 and IAS 27 the adoption of these Standards and Interpretations did not affect recognition and measurement in the consolidated fi nancial statements.
The adoption of IFRS 3 (revised 2008) and IAS 27 (amended 2008) has changed the Group's accounting policy in the following areas:
Transaction costs that the Group incurs in connection with busi-ness combinations, such as fi nder's fees, legal fees, due diligence
fees, and other professional and consulting fees are expensed as incurred. Previously such costs were considered part of the consid-eration paid and included in the cost price.
Contingent consideration (earn-outs) payable is recognised at fair value at the acquisition date, and subsequent adjustments are gen-erally recognised in the income statement as incurred. Previously such adjustments were recognised against the original cost price.
When less than 100% of a subsidiary is acquired, the Group elects on a transaction-by-transaction basis to either recognise goodwill relating only to its present ownership interest in the acquiree or to recognise 100% goodwill. Previously, only goodwill relating to the present ownership interest was recognised.
In business combinations achieved in stages, the Group remeas-ures its previously held equity interest at its acquisition-date fair value and recognises the related gain or loss in the income statement. Previously, in step acquisitions goodwill was measured separately for each transaction.
Acquisition/disposal of non-controlling interests, when control is maintained, is accounted for as transactions with equity holders and therefore no gain/loss is recognised in the income statement in respect of such disposals and no goodwill is recognised as a result of such acquisitions. Previously, goodwill was recognised for such transactions as the excess of the cost of the additional investment over the carrying amount of the non-controlling interest.
The change in accounting policy relating to IFRS 3 and IAS 27 was applied prospectively for business combinations occuring in the fi nancial year starting 1 January 2010. In 2010, the change impacted Acquisition and integration costs in the income statement negatively by DKK 5 million.
Business combinations occuring before 1 January 2010 are accounted for in accordance with the previous IFRS 3 whereby subsequent ad-justments to contingent consideration and transaction costs continue to be recognised in goodwill.
BASIS OF CONSOLIDATIONThe consolidated fi nancial statements comprise the parent company ISS A/S and subsidiaries in which ISS A/S has control of fi nancial and operating policies in order to obtain a return or other benefi ts from its activities. Control is presumed to exist when ISS A/S owns, directly or indirectly, more than 50% of the voting rights of an entity or otherwise has a controlling interest, e.g. by virtue of a statute or agreement.
Special purpose entities (SPEs) The Group has established a num-ber of SPEs with the purpose of raising external funding to the Group. The Group does not have any direct or indirect shareholdings in these entities. An SPE is consolidated if, based on an evaluation of the substance of its relationship with the Group and the SPE’s risks and rewards, the Group concludes that it controls the SPE. SPEs controlled by the Group were established under terms that impose strict limita-tions on the decision-making powers of the SPEs’ management and that result in the Group receiving the majority of the benefi ts related to the SPEs’ operations and net assets, being exposed to the majority of risks incident to the SPEs’ activities, and retaining the majority of the residual or ownership risks related to the SPEs or their assets.
NOTE 1 SIGNIFICANT ACCOUNTING POLICIES
72 Annual Report 2010
Loss of control Upon the loss of control, the Group derecognises the assets and liabilities of the subsidiary, any non-controlling inter-ests and the other components of equity related to the subsidiary. Any surplus or defi cit arising on the loss of control is recognised in the income statement. If the Group retains any interest in the previ-ous subsidiary, then such interest is measured at fair value at the date that control is lost. Subsequently it is accounted for as an equity ac-counted investee or as an available-for-sale fi nancial asset depending on the level of infl uence retained.
Associates Entities in which the Group has a signifi cant infl uence, but which it does not control, are considered associates. Signifi cant infl uence is presumed to exist when the Group owns directly or indirectly more than 20% of the voting rights but less than 50%. When assessing whether ISS A/S has control or signifi cant infl uence, potential voting rights that are exercisable at the reporting date are taken into account. Investments in associates are accounted for using the equity method and are accounted for initially at cost. The cost of the investment includes transaction cost.
Joint ventures The Group's interests in jointly controlled entities are regarded as joint ventures and are consolidated proportionally, and the individual accounting entries are recognised in proportion to the ownership share.
A group chart is included in note 42, Subsidiaries, associates, joint ventures and SPEs.
The consolidated fi nancial statements have been prepared as a consolidation of the fi nancial statements of ISS A/S, subsidiaries, SPEs and proportionally consolidated entities prepared according to the Group's accounting policies. On consolidation, intra-group income and expenses, shareholdings, intra-group balances and dividends and realised and unrealised gains and losses on intra-group transac-tions are eliminated. Unrealised gains on transactions with associates and proportionally consolidated entities are eliminated in propor-tion to the Group's ownership share of the entity. Unrealised losses are eliminated in the same way as unrealised gains, but only to the extent that there is no evidence of impairment.
Investments in subsidiaries and proportionally consolidated entities are set off against the proportionate share of the subsidiaries’ fair value of identifi able net assets, including recognised contingent li-abilities, at the acquisition date. The accounting items for subsidiaries are included in full in the con-solidated fi nancial statements. The non-controlling interest’s share of the net profi t/loss for the year and of the equity of subsidiaries, which are not wholly owned, are included in the Group’s net profi t/loss and equity respectively, but is disclosed separately. By virtue of agreement certain non-controlling shareholders are only eligible of receiving benefi ts from their non-controlling interest when ISS as controlling shareholder has received their initial investment and com-pound interest on such. In such instances the subsidiaries' result and equity are fully allocated to ISS until the point in time where ISS has recognised amounts exceeding their investment including compound interest on such.
Business combinations Acquired businesses or entities formed during the year are recognised in the consolidated fi nancial state-ments from the acquisition date or date of formation. Businesses which are divested or wound up are recognised in the consolidated
income statement until the date of divestment or winding-up. Com-parative fi gures are not restated for businesses acquired, divested or wound up.
For acquisitions where the Group obtains control of the acquired business the acquisition method is applied. The identifi able as-sets, liabilities and contingent liabilities of acquired businesses are measured at fair value at the acquisition date. Identifi able intangible assets are recognised if separable or if they arise from contractual or other legal rights. Deferred tax related to fair value adjustments is recognised.
The acquisition date is the date when the Group effectively obtains control of the acquired business.
Any excess of the fair value of the consideration transferred, the recognised amount of any non-controlling interests and the fair value of any existing equity interest in the acquiree over the fair value of identifi able assets, liabilities and contingent liabilities acquired is recognised as goodwill under Intangible assets. Goodwill is not am-ortised but tested for impairment annually. The fi rst impairment test is performed no later than at the end of the acquisition year. Upon acquisition, goodwill is allocated to the cash-generating units, which subsequently form the basis for the impairment test. Goodwill and fair value adjustments in connection with the acquisition of a foreign entity with a functional currency other than the presentation cur-rency used in the Group are treated as assets and liabilities belonging to the foreign entity and translated into the foreign entity’s function-al currency at the exchange rate at the transaction date. When the excess is negative, a bargain purchase gain is recognised immediately in the income statement.
The consideration transferred comprises the fair value of the assets transferred and the liabilities and contingent liabilities incurred. If parts of the consideration are conditional upon future events (con-tingent consideration), these parts are recognised at fair value at the acquisition date. Transaction costs that the Group incurs in connec-tion with the business combination are expensed as incurred.
If uncertainties exists at the acquisition date regarding identifi ca-tion or measurement of acquired identifi able assets, liabilities and contingent liabilities or regarding the consideration transferred, initial recognition will take place on the basis of provisionally determined fair values. If identifi able assets, liabilities and contingent liabilities are subsequently determined to have a different fair value at the acquisition date from that fi rst assumed, goodwill is adjusted up until 12 months after the acquisition date and comparative fi gures are restated accordingly.
Changes in estimates of contingent consideration relating to busi-ness combinations effected on or after 1 January 2010 are generally recognised in the income statement. However, if new information becomes available within 12 months from the acquisition date and provides evidence of conditions relating to the contingent consid-eration or circumstances that existed at the acquisition date, then the acquisition accounting is adjusted with effect on goodwill. For business combinations effected prior to 1 January 2010 subsequent adjustments to estimates of contingent consideration and transaction costs continue to be recognised in goodwill.
When less than 100% of a subsidiary is acquired, the Group elects on a transaction-by-transaction basis to either measure the non-
NOTE 1 SIGNIFICANT ACCOUNTING POLICIES (CONTINUED)
Consolidated fi nancial statements 73

controlling interests at fair value at the acquisition date or at its proportionate interest in the fair value of the net assets acquired. Measurement at fair value means that goodwill includes a portion attributable to the non-controlling interests while measurement at its proportionate interest in the fair value of the net assets acquired, means that goodwill relates only to the controlling interest acquired.
Written put options relating to business combinations effected prior to 1 January 2010 and held by non-controlling shareholders are ac-counted for in accordance with the anticipated acquisition method, i.e. as if the put option has been exercised already. Such options are recognised as other liabilities initially at fair value. Fair value is meas-ured at the present value of the exercise price of the option. At each reporting date the liability is remeasured at fair value and changes in the carrying amount, i.e. excluding the effect of unwind of discount, which is accounted for as a fi nancial expense, are recognised by adjusting the carrying amount of goodwill.
Gains or losses on the divestment or winding-up of subsidiaries, associates or joint ventures are measured as the difference between the consideration received adjusted for directly related divestment or winding-up costs and the carrying amount of the net assets at the time of disposal or winding-up including any carrying amount of allocated goodwill.
Foreign currency For each of the reporting entities in the Group, a functional currency is determined. The functional currency is the primary currency used for the reporting entity’s operations. Transac-tions denominated in currencies other than the functional currency are considered transactions denominated in foreign currencies.
On initial recognition, transactions denominated in foreign currencies are translated to the functional currency at the exchange rates at the transaction date. Foreign exchange adjustments arising between the exchange rates at the transaction date and at the date of payment are recognised in the income statement under Financial income or Financial expenses.
Receivables, payables and other monetary items denominated in foreign currencies are translated at the exchange rates at the report-ing date. The difference between the exchange rates at the reporting date and at the date at which the receivable or payable arose or the exchange rate in the latest fi nancial statement is recognised in the income statement under Financial income or Financial expenses.
On recognition in the consolidated fi nancial statements of entities with a functional currency other than the presentation currency of ISS A/S (DKK), the income statements and statements of cash fl ows are translated at the exchange rates at the transaction date and the state-ments of fi nancial position are translated at the exchange rates at the reporting date. An average exchange rate for the month is used as the exchange rate at the transaction date to the extent that this does not signifi cantly deviate from the exchange rate at the transac-tion date. Foreign exchange adjustments arising on translation of the opening balance of equity of foreign entities at the exchange rates at the reporting date and on translation of the income statements from the exchange rates at the transaction date to the exchange rates at the reporting date are recognised in other comprehensive income and presented in equity under a separate translation reserve.
Foreign exchange adjustment of balances with foreign entities which are considered part of the investment in the entity is recognised in
other comprehensive income and presented in equity under a sepa-rate translation reserve. Foreign exchange gains and losses on the part of loans and derivative fi nancial instruments which are desig-nated as hedges of investments in foreign entities with a functional currency different from ISS A/S’s and which effectively hedge against corresponding foreign exchange gains and losses on the investment in the entity are also recognised in other comprehensive income and presented in equity under a separate translation reserve.
On recognition in the consolidated fi nancial statements of associates with a functional currency other than the presentation currency of ISS A/S, the share of profi t or loss for the year is translated at average exchange rates and the share of equity, including goodwill, is trans-lated at the exchange rates at the reporting date. Foreign exchange adjustments arising on the translation of the share of the opening balance of equity of foreign associates at the exchange rates at the reporting date, and on translation of the share of profi t/loss for the year from average exchange rates to the exchange rates at the reporting date, are recognised in other comprehensive income and presented in a separate translation reserve in equity.
Foreign exchange adjustments of foreign entities are recognised in other comprehensive income, and presented in the separate transla-tion reserve in equity. However, if the foreign entity is a non-wholly-owned subsidiary, the relevant proportionate share of the foreign exchange adjustment is allocated to the non-controlling interests. When a foreign entity is disposed off such that control, signifi cant infl uence or joint control is lost or on repayment of balances which constitute part of the net investment in the foreign entity, the cumulative amount in the translation reserve related to that foreign entity is reclassifi ed to the income statement under Financial income or Financial expenses. When the Group disposes of only part of its interest in a subsidiary that includes a foreign entity while retaining control, the relevant proportion of the cumulative amount is allo-cated to non-controlling interests. When the Group disposes of only part of its investment in an associate or joint venture that include a foreign entity while retaining signifi cant infl uence or joint control, the relevant proportion of the cumulative amount is reclassifi ed to the income statement under Financial income or Financial expenses.
Derivative fi nancial instruments are recognised in the statement of fi nancial position on the transaction date and measured at fair value. Positive and negative fair values of derivative fi nancial instru-ments are included in Other receivables or Loans and borrowings, respectively. Positive and negative values are only offset when the Group has the legal right and the intention to settle several fi nan-cial instruments net. Fair values of derivative fi nancial instruments are calculated on the basis of current market data and according to generally accepted valuation methods.
Fair value hedges Changes in the fair value of derivative fi nancial instruments designated as and qualifying for recognition as a fair value hedge of recognised assets and liabilities are recognised in the income statement together with changes in the value of the hedged asset or liability as far as the hedged portion is concerned. Hedging of future cash fl ows in accordance with a fi rm commitment, except for foreign currency hedges, is treated as a fair value hedge of a recognised asset or liability.
For derivative fi nancial instruments that do not qualify for hedge accounting, changes in fair value are recognised in the income state-ment under Financial income or Financial expenses.
NOTE 1 SIGNIFICANT ACCOUNTING POLICIES (CONTINUED)
74 Annual Report 2010
Cash fl ow hedges Changes in the portion of the fair value of derivative fi nancial instruments designated as and qualifying for recognition as a cash fl ow hedge, and which effectively hedges changes in the value of the hedged item, are recognised in other comprehensive income and presented in a separate hedging reserve in equity until the hedged transaction is realised. At this time, gains or losses concerning such hedging transactions are transferred from other comprehensive income to the income statement and recog-nised under the same line item as the hedged item.
If the hedging instrument no longer meets the criteria for hedge ac-counting, expires or is sold, terminated or exercised, or the designa-tion is revoked, then hedge accounting is discontinued prospectively. The accumulated change in fair value recognised in other compre-hensive income is reclassifi ed to the income statement in the same period that the hedged item affects the income statement. If the forcasted transaction is no longer expected to occur, then the accu-mulated change in fair value is reclassifi ed to the income statement.
For derivative fi nancial instruments that do not qualify for hedge accounting, changes in fair value are recognised in the income state-ment under Financial income or Financial expenses.
CONSOLIDATED INCOME STATEMENTPresentation The consolidated income statement is presented in accordance with the "nature of expense" method. Goodwill impair-ment and Amortisation and impairment of brands and customer contracts as well as the Income tax effect hereof are presented in separate line items after Operating profi t. This income statement presentation is considered most appropriately to refl ect the Group's profi tability.
Revenue from rendering services is recognised in the income state-ment in proportion to the stage of completion of the transaction at the reporting date. Revenue is recognised when the amount of revenue can be measured reliably, the recovery of the consideration is probable, the stage of completion can be measured reliably and the costs incurred for the transaction and the costs to complete the transaction can be measured reliably.
In assessing whether revenue should be reported on a gross or a net basis (i.e. net of related costs), the Group considers whether it: (i) is the primary obligor in the arrangement; (ii) has the general inventory risk; (iii) has latitude in establishing price; (iv) changes the product or per-forms part of the service; (v) has discretion in supplier selection; (vi) is involved in the determination of product or service specifi cations; (vii) has physical loss inventory risk; or (viii) carries the credit risk. If these assumptions are fulfi lled revenue is reported on a gross basis.
Contract revenue is recognised in the income statement in propor-tion to the stage of completion of the contract when the outcome of the contract can be estimated reliably. Contract revenue includes the initial amount agreed in the contract plus any variations in the contract work, claims and incentive payments, to the extent that it is probable that they will result in revenue and can be measured reliably. Contract costs are recognised as incurred unless they create an asset related to future contract activity. When the outcome of a contract can not be measured reliably, contract revenue is recognised only to the extent of contract costs incurred that are likely to be re-coverable. An expected loss on a contract is recognised immediately in the income statement.
The stage of completion of a contract is assessed by reference to the proportion that contract costs incurred for work performed to date bear to the estimated total contract costs.
Revenue from the sale of goods in the course of the ordinary activi-ties is recognised in the income statement provided that all signifi -cant risks and rewards of ownership have been transferred to the customer, and that the amount of revenue can be measured reliably.
Revenue is measured at fair value of the consideration received less VAT and duties as well as price and quantity discounts.
Government grants mainly comprises wage subventions. Grants that compensate the Group for expenses incurred are recognised in the income statement on a systematic basis in the same periods in which the expenses are incurred.
Staff costs comprises salaries and wages, pensions, social security costs and other employee related expenses.
Consumables comprises material consumption related to the recog-nised revenue, e.g. food costs, chemicals, cloths, uniforms etc.
Other operating expenses includes expenses related to the opera-tion of service equipment and other non-current assets, external assistance as well as other selling, distribution and administrative expenses, including expenses related to marketing, transportation, operating leases, subcontractors, audit, legal assistance and impair-ment losses on receivables etc.
Depreciation and amortisation includes depreciation and amorti-sation of intangible and tangible assets excluding Goodwill impair-ment and Amortisation and impairment of brands and customer contracts, which are presented in separate line items after Profi t before goodwill impairment/amortisation and impairment of brands and customer contracts.
Other income and expenses, net consists of income and ex-penses, both recurring and non-recurring, that the Group does not consider to be part of normal ordinary operations, such as gains and losses arising from divestments, remeasurement of disposal groups classifi ed as held for sale, the winding-up of operations, disposals of property and restructurings.
Acquisition and integration costs Acquisition costs comprise earn-out adjustments, direct acquisition costs related to external advisors and other acquisition related costs such as reversal of provi-sions in opening balances. Integration costs comprise costs incurred by the acquiring Group company and the acquired business that are a consequense of the integration. Integration costs include costs for termination of employees, contract termination costs mainly related to leasehold as well as advisory fees.
Share of result from associates comprises the share of the associ-ates’ result after tax and non-controlling interests. Share of result from associates is recognised in the income statement after elimination of the proportionate share of unrealised intra-group profi ts/losses.
Financial income and fi nancial expenses comprises interest in-come and expense, gains and losses on securities, foreign exchange
NOTE 1 SIGNIFICANT ACCOUNTING POLICIES (CONTINUED)
Consolidated fi nancial statements 75

gains and losses, amortisation of fi nancial assets and liabilities, including fi nance lease and unwind of discount. Additionally realised and unrealised gains and losses on fair value hedges (currency swaps) and derivatives which are not designated as hedging arrangements are included.
Income taxes consists of current tax and changes in deferred tax. The tax expense relating to the profi t/loss for the year is recognised in the income statement and the tax expense relating to items recog-nised in other comprehensive income is recognised directly in other comprehensive income.
ISS A/S is jointly taxed with all Danish resident subsidiaries. The Danish income tax payable is allocated between the jointly taxed Danish companies based on their proportion of taxable income (full absorption including reimbursement of tax defi cits). The jointly taxed companies are included in the Danish tax on account scheme. Ad-ditions, deductions and allowances are recognised under Financial income or Financial expenses.
Goodwill impairment includes impairment losses arising from im-pairment tests as well as impairment of goodwill in connection with divestments and classifi cation of disposal groups as held for sale.
Amortisation and impairment of brands and customer contracts includes amortisation of acquired brands and acquired customer contract portfolios and related customer relationships, im-pairment losses arising from impairment tests and impairment losses in connection with divestments and classifi cation of disposal groups as held for sale.
Income tax effect of Goodwill impairment and Amortisation and impairment of brands and customer contracts is presented in a sepa-rate line item in connection with these two line items.
CONSOLIDATED STATEMENT OF CASH FLOWSThe statement of cash fl ows shows the Group's cash fl ows from op-erating, investing and fi nancing activities for the year, the change in its cash position during the year as well as the Group's cash position at the beginning and the end of the year.
The liquidity effect of acquisition and divestment of businesses is shown separately under Cash fl ow from investing activities. The statement of cash fl ows includes cash fl ows from acquired busi-nesses from the date of acquisition and cash fl ows from divested businesses until the date of divestment.
Cash fl ow from operating activities is calculated using the indi-rect method and comprises Operating profi t before other items ad-justed for non-cash items, changes in working capital and provisions and payments regarding income taxes, other income and expenses and acquisition and integration costs.
Cash fl ow from investing activities comprises payments in connection with acquisition and divestment of businesses and the purchase and sale of intangible assets, property, plant and equip-ment and other non-current assets as well as acquisition and disposal of securities not recognised as cash and cash equivalents.
Acquisition of assets by means of fi nance leases are treated as non-cash transactions.
Cash fl ow from fi nancing activities comprises proceeds from and repayment of loans, dividends, proceeds from share issues, purchase and sale of treasury shares, cash fl ow related to derivatives hedging net investments and dividends to non-controlling interests. Furthermore, interest paid and received is included in cash fl ow from fi nancing activities as this better refl ects the distinction between op-erating and fi nancing activities following the acquisition of ISS World Services A/S (formerly ISS A/S) by ISS A/S (formerly ISS Holding A/S).
Cash fl ows relating to assets held under fi nance leases are recog-nised as payment of interest and repayment of debt.
Cash and cash equivalents comprises cash and marketable securi-ties, with maturity of less than three months that are readily convert-ible to known amounts of cash and that are subject to an insignifi -cant risk of changes in value.
Cash fl ows in currencies other than the functional currency are trans-lated using average exchange rates unless these deviate signifi cantly from the exchange rate at the transaction date.
CONSOLIDATED STATEMENT OF FINANCIAL POSITIONGoodwill is initially recognised in the statement of fi nancial position at cost as described under "Business combinations". Subsequently, goodwill is measured at cost less accumulated impairment losses. Goodwill is not amortised.
The carrying amount of goodwill is allocated to the Group’s cash-generating units at the acquisition date and tested at least annu-ally as part of the annual impairment test for non-current assets. Identifi cation of cash-generating units is based on the management structure and internal fi nancial control, i.e. generally equal to country level.
Brands Acquisition related brands are recognised at fair value at the date of acquisition. Subsequently, acquired brands with indefi nite useful lives are measured at historical cost less any accumulated impairment losses while acquired brands with fi nite useful lives are measured at historical cost less accumulated amortisation and any accumulated impairment losses. Amortisation is provided on a straight-line basis over the expected useful life of the brand, which is usually in the range 2-5 years.
A deferred tax liability is calculated at the local tax rate on the dif-ference between the carrying amount and the tax value. The initial recognition of this deferred tax liability increases the amount of goodwill.
The value of brands is allocated to cash generating units and tested for impairment as part of the annual impairment test of non-current assets.
Customer contract portfolios and related customer relation-ships ("Customer contracts") Acquisition related customer contracts are recognised at fair value at the date of acquisition and subsequent-ly carried at cost less accumulated amortisation and any accumulated impairment losses. The value is amortised based on the churn rate of the acquired portfolio using the declining balance method. This churn rate is calculated on a contract by contract basis and has historically averaged approximately 12% to 13% annually. In certain cases the value of customer contracts is amortised on a straight line basis based on the legal duration of the acquired contract.
NOTE 1 SIGNIFICANT ACCOUNTING POLICIES (CONTINUED)
76 Annual Report 2010

A deferred tax liability is calculated at the local tax rate on the dif-ference between the carrying amount and the tax value. The initial recognition of this deferred tax liability increases the amount of goodwill.
The value of customer contracts is allocated to cash generating units and tested for impairment as part of the annual impairment test of non-current assets.
Software and other intangible assets that are acquired by the Group and have fi nite useful lives are measured at cost less accumu-lated amortisation and accumulated impairment losses.
The cost of software developed for internal use includes external costs to consultants and software as well as internal direct and indi-rect costs related to the development. Other development costs for which it cannot be rendered probable that future economic benefi ts will fl ow to the Group are recognised in the income statement as and when incurred.
Amortisation is based on the cost of the asset and recognised in the income statement on a straight-line basis over the estimated useful lives of the assets. The estimated useful lives for the current and comparative years are as follows:
Estimated useful life
Software 5-10 yearsOther intangible assets 5-10 years
Amortisation methods and useful lives are reassessed at each report-ing date and adjusted if appropriate. When changing the amorti-sation period due to a change in the useful life, the effect on the amortisation is recognised prospectively as a change in accounting estimates.
Property, plant and equipment is measured at cost less accumu-lated depreciation and accumulated impairment losses.
Cost of assets comprises the purchase price and any costs directly attributable to bringing the asset to the location and condition necessary for it to operate in the manner intended. The net present value of estimated liabilities related to dismantling and removing the asset and restoring the site on which the asset is located is added to the cost of the asset to the extent that this cost is recognised as a provision.
The cost of assets held under fi nance leases is stated at the lower of fair value of the asset and the net present value of future minimum lease payments. When calculating the net present value, the interest rate implicit in the lease or an approximated rate is applied as the discount rate.
Subsequent costs of replacing part of an item are recognised as an asset if it is probable that the future economic benefi ts embodied by the item will fl ow to the Group. The remaining carrying amount of the replaced item is de-recognised in the statement of fi nancial position and transferred to the income statement. All other costs for common repairs and maintenance are recognised in the income statement as and when incurred.
Depreciation is based on the cost of an asset less its residual value. When parts of an item of property, plant and equipment have differ-
ent useful lives, they are accounted for as separate items of property, plant and equipment. The residual value is determined at the acquisi-tion date and reassessed at each reporting date. If the residual value exceeds the carrying amount depreciation is discontinued.
Depreciation of property, plant and equipment is recognised in the income statement on a straight-line basis over the estimated useful lives of the assets. Assets under fi nance lease are depreciated over the shorter of the lease term and their useful lives unless it is reasonably certain that the Group will obtain ownership by the end of the lease term. The estimated useful lives for current and comparative years are as follows:
Estimated useful life
Buildings 5-40 yearsLeasehold improvements (the lease term) 5-12 yearsPlant and equipment 3-10 years
Land is not depreciated.
Depreciation methods, useful lives and residual values are reassessed at each reporting date and adjusted if appropriate. When chang-ing the depreciation period or the residual value, the effect on the depreciation is recognised prospectively as a change in accounting estimates.
Gains and losses arising on the disposal or retirement of property, plant and equipment are measured as the difference between the selling price less direct sales costs and the carrying amount, and are recognised in the income statement under Other operating expenses in the year of sale, except gains and losses arising on disposals of property, which are recognised under Other income and expenses, net.
Investments in associates are recognised in accordance with the equity method and measured at the proportionate share of the enti-ties’ net asset values calculated in accordance with the Group’s ac-counting policies minus or plus the proportionate share of unrealised intra-group profi ts and losses plus the carrying amount of goodwill. Investments in associates are tested for impairment if indications of impairment exists.
Investments in associates with a negative net asset value are meas-ured at zero. If the Group has a legal or constructive obligation to cover a defi cit in the associate, the defi cit is recognised under provi-sions.
Receivables from associates are measured at amortised cost. An al-lowance for impairment losses is recognised.
Investments in associates are accounted for using the acquisition method, see description under Business combinations.
Other fi nancial assets comprise mainly deposits measured at am-ortised cost and regulatory long-term loans measured at amortised cost with any resulting adjustment being recognised in the income statement.
Impairment of non-current assets Goodwill and brands with an indefi nite useful life are subject to annual impairment tests, initially before the end of the acquisition year. Similarly, brands with defi nite useful life and customer contracts are tested for impairment annually.
NOTE 1 SIGNIFICANT ACCOUNTING POLICIES (CONTINUED)
Consolidated fi nancial statements 77

The carrying amount of goodwill is tested for impairment together with the other non-current assets in the cash-generating unit to which goodwill is allocated. If the carrying amount exceeds the re-coverable amount an impairment loss is recognised in a separate line in the income statement. The recoverable amount is generally calcu-lated as the present value of the expected future cash fl ows (value in use) from the cash-generating unit to which goodwill is allocated.
Deferred tax assets are subject to impairment tests annually and recognised only to the extent that it is probable that they will be utilised.
The carrying amount of other non-current assets is tested annu-ally for indications of impairment. If such an indication exists, the recoverable amount of the asset is determined. The recoverable amount is the higher of the fair value of the asset less anticipated costs of disposal and its value in use. The value in use is calculated as the present value of expected future cash fl ows from the asset or the cash-generating unit to which the asset belongs.
An impairment loss is recognised if the carrying amount of an asset or its cash-generating unit exceeds its estimated recoverable amount. Impairment losses are recognised in the income statement.
An impairment loss in respect of goodwill is not reversed. In respect of other assets, impairment losses are only reversed if there has been a change in the estimates used to determine the recoverable amount. An impairment loss is reversed only to the extent that the asset’s carrying amount does not exceed the carrying amount that would have been determined, net of depreciation and amortisation, if no impairment loss had been recognised.
Inventories are measured at the lower of cost under the FIFO princi-ple and net realisable value.
Finished goods and work in progress are measured at the lower of cost plus attributable overheads and net realisable value. The cost of raw materials and supplies includes the purchase price plus costs directly related to the purchase.
Net realisable value is the estimated selling price less costs of comple-tion and selling costs and is determined taking into account market-ability, obsolescence and development in expected sales price.
Receivables are measured at amortised cost. An impairment loss is recognised when objective evidence indicates that a receivable or a portfolio of receivables is impaired. Objective evidence that receivables are impaired can include default or delinquency by a debtor, restruc-turing of an amount due to the Group on terms that would not other-wise be considered or indications that a debtor will enter bankruptcy.
The Group considers evidence of impairment at both a specifi c receivable and portfolio level. All individually signifi cant receivables are assessed for specifi c impairment. Receivables, that are found not to be specifi cally impaired, are collectively assessed for impairment on portfolio level by grouping together receivables with similar risk characteristics.
In assessing collective impairment the Group uses historical trends of the probability of default, timing of recoveries and the amount of loss incurred, adjusted for management’s judgement as to whether current economic and credit conditions are such that the actual
losses are likely to be greater or less than suggested by historical trends.
Impairment losses during the year are recognised under Other operating expenses and refl ected in an allowance account against receivables. Interest on the impaired receivable continues to be recognised. When a subsequent event causes the amount of impair-ment loss to decrease, the decrease in impairment loss is reversed through the income statement.
Contract work in progress represents the gross unbilled amount expected to be collected from customers for contract work per-formed to date. It is measured at the contract revenue of the work completed (i.e. cost plus profi t recognised to date) less progress bill-ings and recognised losses.
The contract revenue is calculated in proportion to the stage of completion at the reporting date and the total contract revenue to be received for each individual contract. The stage of completion is determined on the basis of an assessment of the work performed, which is measured as the proportion of contract costs incurred for work performed on each individual contract relative to the total estimated contract costs.
When it is probable that the total contract costs will exceed the total contract revenue, the anticipated loss on the contract is immediately recognised as an expense and a provision.
When the outcome of a contract cannot be determined reliably, the realisable value is measured as the contract costs incurred that are likely to be recovered.
Where on a contract-by-contract basis the realisable value of work performed exceeds progress billings and anticipated losses, the excess is recognised under Contract work in progress. If progress billings and anticipated losses exceed the realisable value of a con-struction contract, the defi cit is recognised under Other liabilities.
Prepayments from customers are recognised under Other liabilities.
Costs relating to sales work and securing contracts are recognised in the income statement as incurred.
Other receivables comprise various receivables, e.g. receivable divestment proceeds, outlays for customers, employee receivables and certain contract costs. Capitalised contract costs are amortised over the term of the contract. Contract costs relate to PPP/PFI con-tracts and certain other signifi cant contracts. Costs related to ten-ders for public offers for PPP (Public Private Partnership)/PFI (Private Finance Initiative) contracts are generally recognised in the income statement as incurred. However, if the Group is awarded status as preferred bidder, directly attributable contract costs from that date, if any, are capitalised. If the Group is not awarded the contract, all costs are recognised in the income statement.
Prepayments comprise various prepaid expenses such as rent, leas-ing and insurance as well as accrued interest expenses. Prepayments are measured at cost.
Securities that are designated as fair value through profi t or loss are measured at fair value at the reporting date, with any resulting gains or losses recognised in the income statement.
NOTE 1 SIGNIFICANT ACCOUNTING POLICIES (CONTINUED)
78 Annual Report 2010

EquityTranslation reserve The translation reserve comprises all foreign exchange differences arising from the translation of fi nancial state-ments of subsidiaries/joint ventures and investments in associates with another functional currency than DKK as well as from the translation of non-current balances which are considered part of the investment in subsidiaries/joint ventures, loans and borrowings in foreign currency and derivatives hedging net investments in foreign subsidiaries/joint ventures.
Hedging reserve The hedging reserve comprises the effective portion of the cumulative net change after tax in the fair value of cash fl ow hedging instruments which fulfi l the criteria for hedging of future cash fl ows, when the hedged transactions have not yet occurred.
Share premium comprises amounts above the nominal share capital paid by shareholders when shares are issued by the Group. The share premium amount is a part of the Group's free reserves.
Treasury shares Proceeds related to the acquisition or disposal of treasury shares are recognised directly in equity.
Dividends proposed are recognised as a liability at the date when they are adopted at the Annual General Meeting (declaration date). Interim dividends are recognised as a liability at the date when the decision to pay interim dividend is made.
Retirement benefi t obligations and similar long-term obliga-tions The Group has entered into retirement benefi t schemes and similar arrangements with the majority of the Group’s employees.
A defi ned contribution plan is a post-employment benefi t plan under which the Group pays fi xed contributions into a separate entity and will have no legal or constructive obligation to pay further amounts. Contributions to defi ned contribution plans are recognised in the income statement under Staff costs in the periods during which ser-vices are rendered by employees. Any contributions outstanding are recognised in the statement of fi nancial position as Other liabilities.
A defi ned benefi t plan is a post-employment benefi t plan other than a defi ned contribution plan. The Group's net obligation in respect of defi ned benefi t pension plans is calculated separately for each plan by estimating the amount of future benefi t that employees have earned in return for their service in the current and prior periods; that benefi t is discounted to determine its present value. The calculation is performed annually by a qualifi ed actuary using the Projected Unit Credit Method. The present value is determined on the basis of as-sumptions about the future development in variables such as salary levels, interest rates, inflation and mortality. The actuarial present value less the fair value of any plan assets is recognised in the state-ment of fi nancial position under Pensions and similar obligations.
Pension costs for the year are recognised in the income statement on the basis of actuarial estimates and fi nancial expectations at the beginning of the year. Differences between the expected develop-ment in pension assets and liabilities and the realised amounts at the end of the year are designated actuarial gains or losses and are recognised in other comprehensive income.
If changes in benefits relating to services rendered by employees in previous years result in changes in the actuarial present value, the
changes are recognised as historical costs. Historical costs are rec-ognised immediately if employees have already earned the changed benefits. If employees have not earned the benefits, the historical costs are recognised in the income statement over the period in which the changed benefi ts are earned by the employees.
If a pension plan constitutes a net asset, the asset is only recognised to the extent that it represents future refunds from the plan, or it will lead to reductions in future contributions to the plan.
Interest on defi ned benefi t plans and the expected return on plan assets are recognised under Staff costs.
Other long-term employee benefi ts are recognised similarly based on an actuarial calculation. All actuarial gains and losses are recognised in the income statement immediately under Staff costs. Other long-term employee benefi ts comprise jubilee benefi ts, long-service or sabbatical leave etc.
Share-based payments The value of services received in exchange for granted warrants is measured at the fair value of these warrants. The fair value of equity-settled programmes is measured at grant date and recognised in the income statement under Other income and expenses, net over the vesting period with a corresponding increase in equity.
The fair value of the warrants granted is measured using the Black-Scholes option pricing model based on the terms and conditions on which they were granted. Service and non-market vesting conditions are not taken into account when estimating the fair value, but are considered when estimating the number of warrants expected to vest.
At each reporting date, the Group revises the estimate of number of warrants expected to vest. The impact of this revision, if any, is rec-ognised in the income statement, and a corresponding adjustment is made to equity over the remaining vesting period. Accordingly, total recognition is based on the number of warrants ultimately vested. Adjustments relating to prior years are included in the income state-ment in the year of adjustment.
Current tax receivable/payable and deferred tax Current tax pay-able and receivable is recognised in the statement of fi nancial position as tax computed on the taxable income for the year, adjusted for tax on the taxable income for previous years and for tax paid on account.
Deferred tax is measured in accordance with the liability method and comprises all temporary differences between accounting and tax val-ues of assets and liabilities. However, deferred tax is not recognised on temporary differences relating to goodwill which is not deductible for tax purposes and on offi ce premises and other items where temporary differences, apart from in business combinations, arose at the time of acquisition without affecting either profi t/loss for the year or taxable income. Where alternative taxation rules can be applied to determine the tax base, deferred tax is measured according to management’s intended use of the asset or settlement of the liability, respectively.
Deferred tax assets, including the tax base of tax losses carried for-ward, are recognised under non-current assets at the expected value of their utilisation: either as a set-off against tax on future income or as a set-off against deferred tax liabilities in the same legal tax entity and jurisdiction.
NOTE 1 SIGNIFICANT ACCOUNTING POLICIES (CONTINUED)
Consolidated fi nancial statements 79

Deferred tax assets and liabilities are offset if the Group has a legal right to offset current tax assets and tax liabilities or intends to settle current tax assets and tax liabilities on a net basis or to realise the assets and settle the liabilities simultaneously.
Deferred tax is adjusted for elimination of unrealised intra-group profi ts and losses.
Deferred tax is measured according to the taxation rules and tax rates in the respective countries applicable at the reporting date when the deferred tax is expected to be realised as current tax. The change in deferred tax as a result of changes in tax rates is recog-nised in the income statement.
Provisions comprise obligations concerning legal cases, self-insur-ance, acquisition and integration costs, contingent liabilities related to acquisitions, dismantling costs, and various other operational issues. Provisions are recognised if the Group, as a result of a past event has a present legal or constructive obligation that can be esti-mated reliably, and it is probable that an outfl ow of economic ben-efi ts will be required to settle the obligation. The amount recognised as a provision is management’s best estimate of the amount required to settle the obligation.
When measuring provisions, the costs required to settle the obliga-tion are discounted if this signifi cantly impacts the measurement of the liability. The entity’s average borrowing rate is used as discount rate. The unwind of discount is recognised under Financial expenses.
Restructuring costs are recognised under Provisions when a detailed, formal restructuring plan is announced to the affected parties on or before the reporting date. On acquisition of businesses, restructur-ing provisions in the acquiree are only included in goodwill when the acquiree has a restructuring liability at the acquisition date.
A provision for onerous contracts is recognised when the expected benefi ts to be derived by the Group from a contract are lower than the unavoidable costs of meeting the obligations under the contract.
When the Group has a legal obligation to dismantle or remove an asset or restore a site or rented facilities when vacated, a provision is recognised corresponding to the present value of expected future costs. The present value of the obligation is included in the cost of the relevant tangible asset and depreciated accordingly.
Financial liabilities are recognised at the date of borrowing at the amount of proceeds received less related transaction costs paid. Sub-sequently, fi nancial liabilities are measured at amortised cost using the effective interest method. Any difference between the proceeds initially received and the nominal value is recognised in the income statement under Financial expenses over the term of the loan.
Financial liabilities also include the capitalised residual obligation on fi nance leases, which are measured at amortised cost.
Leasing For accounting purposes lease obligations are divided into fi nance leases and operating leases.
A fi nance lease is a lease that transfers substantially all risks and re-wards incident to ownership to the lessee. Other leases are classifi ed as operating leases. The accounting treatment of assets held under a
fi nance lease and the related obligation is described under Property, plant and equipment and Financial liabilities, respectively.
Payments made under operating leases are recognised in the income statement on a straight-line basis over the term of the lease.
Assets held for sale comprises non-current assets and disposal groups held for sale. A disposal group is defi ned as a group of as-sets to be disposed of by sale or otherwise together as a group in a single transaction. Liabilities relating to assets held for sale are those directly associated with the assets that will be transferred in the transaction. Assets are classifi ed as held for sale when the carrying amount of the assets is expected to primarily be recovered through a sale within 12 months of the reporting date in accordance with a formal plan rather than through continuing use.
Immediately before classifi cation as held for sale, the assets or disposal groups are remeasured in accordance with the Group's ac-counting policies. Thereafter generally the assets are measured at the lower of their carrying amount and fair value less costs to sell. Any impairment loss is fi rst allocated to goodwill, and then to remaining assets and liabilities on pro rata basis, except that no loss is allocated to inventories, fi nancial assets or deferred tax assets, which continue to be measured in accordance with the Group's accounting policies. Intangible assets and property, plant and equipment once classifi ed as held for sale are not amortised or depreciated.
Impairment losses on initial classifi cation as held for sale, and sub-sequent gains and losses on remeasurement are recognised in the income statement. Gains and losses are disclosed in the notes.
Assets held for sale and related liabilities are presented in separate lines in the statement of fi nancial position and the main elements are specifi ed in the notes to the consolidated fi nancial statements.
SEGMENT INFORMATIONThe Group's reportable segments have been identifi ed based on the Group's internal management reporting. Operations are managed based on a geographical structure in which countries are grouped into seven regions representing the Group's reportable segments. The regions have been identifi ed based on a key principle of group-ing countries that share market conditions and cultures.
The accounting policies of the reportable segments are the same as the Group's accounting policies described above. Segment revenue, costs, assets and liabilities comprise items that can be directly re-ferred to the individual segments. Unallocated items mainly consist of revenue, costs, assets and liabilities relating to the Group's Corporate functions as well as Financial income, Financial expenses and Income taxes.
For IFRS 8 purposes, segment profi t has been identifi ed as Oper-ating profi t (before Goodwill impairment and Amortisation and impairment of brands and customer contracts). Segment assets and segment liabilities have been identifi ed as Total assets and Total li-abilities, respectively.
When presenting geographical information segment revenue and non-current assets are based on the geographical location of the individual subsidiary from which the sales transaction originates.
NOTE 1 SIGNIFICANT ACCOUNTING POLICIES (CONTINUED)
80 Annual Report 2010

The preparation of the consolidated fi nancial statements of the Group requires management to make judgements, accounting estimates and assumptions that affect the application of accounting policies and the reported amounts of the Group’s assets and liabili-ties, income and expenses.
ESTIMATION UNCERTAINTYDetermination of the carrying amount of certain assets and liabilities requires estimates and assumptions concerning future events.
The estimates and assumptions are based on historical experience and other factors which management assesses to be reliable, but which by their nature are associated with uncertainty and unpre-dictability. These assumptions may prove incomplete or incorrect, and unexpected events or circumstances may arise. Further, the Group is exposed to a number of risks and uncertainties as a result of its operating, investing and fi nancing activities. These risks may lead to actual results differing from estimates, both positively and negatively. Specifi c fi nancial risks for the Group are discussed in the notes.
Assumptions about the future and estimation uncertainty on the reporting date are described in the notes where there is a signifi cant risk of changes that could result in material adjustments to the carry-ing amount of assets or liabilities within the next fi nancial year.
Estimates and underlying assumptions are reviewed on an ongoing basis. Revisions to accounting estimates are recognised in the period in which the estimates are revised and in any future periods affected.
In 2009 and 2010, the development in the global economy and fi nancial markets lead to higher uncertainty regarding a number of key assumptions about the future, e.g. interest rates, growth rates, volatility and credit risk.
Management believes the following are the areas involving signifi -cant accounting estimates in the preparation of the consolidated fi nancial statements of the Group:
Acquisition of businesses When acquiring businesses the ac-quisition method is applied. The most signifi cant assets acquired generally comprise goodwill, brands, customer contracts and trade receivables.
Generally, there are uncertainties related to the identifi cation of assets, liabilities and contingent liabilities as well as to the measure-ment of their fair value at the acquisition date. As no active market exists for the majority of acquired assets, liabilities and contingent liabilities, in particular in respect of acquired intangible assets, man-agement makes estimates of the fair value.
Goodwill is measured as the difference between the consideration transferred and the fair value of the net identifi able assets acquired. Management makes estimates of cash-generating units and the al-location of goodwill.
Considering the uncertainties associated with the determination of the cash fl ows of acquired cash-generating units, it is the assessment of management that the allocation made is based on documented estimates. The fair value of identifi able net assets is specifi ed in note 14, Acquisition and divestment of businesses.
Brands The fair value of the brands acquired in business combina-tions and their expected useful lives are assessed based on the brands' market position, expected long-term developments in the relevant markets and the brands' profi tability.
Generally, the Group’s strategy is based on the ISS brand, which means that all acquired brands are either immediately converted to the ISS brand or co-branded with the ISS brand for a longer or short-er period of time. Whether the conversion is effected immediately or implemented over a period of time depends on the assessment of the fair value of the acquired brand, i.e. whether the acquired brand is expected to separately generate future economic benefi ts.
When an acquired brand is assessed to separately generate future economic benefi ts, measurement of the fair value is based on a discounted cash fl ow model using the after-tax royalty payments (the royalty relief method). Cash fl ows are discounted on an after tax basis using the local Weighted Average Cost of Capital (WACC) plus a risk premium for the assumed risk inherent in the brand.
The net present value of the cash fl ow is increased with an estimated portion of the tax amortisation benefi t applicable for a potential buyer based on the local tax amortisation opportunity available for brand names when bought as a trade and asset purchase. The tax amortisation benefi t is discounted. This increased value of the brand equals the fair value at the date of acquisition.
Customer contracts The fair value of customer contracts acquired in business combinations is based on an evaluation of the conditions relating to the acquired contract portfolio and related customer relationships in terms of local market conditions, terms and condi-tions of the underlying contracts and historical experience relating to churn rates.
Measurement is based on a discounted cash fl ow model based on key assumptions about the estimated split of the acquired revenue in business segments and the related churn rates and profi tability of the revenue at the time of the acquisition. A contributory asset charge as a cost or return requirement for assets supporting the intangible asset has been included in the model. Cash fl ows are dis-counted on an after tax basis using the local Weighted Average Cost of Capital (WACC) plus a risk premium for the assumed risk inherent in customer contracts.
The net present value of the cash fl ow is increased with an estimated portion of the tax amortisation benefi t applicable for a potential buyer based on the local tax amortisation opportunity available for customer contracts when bought as a trade and asset purchase. The tax amortisation benefi t is discounted. This increased value of customer contracts equals the fair value at the date of acquisition.
Impairment test Goodwill, brands and customer contracts are tested for impairment at least annually or whenever there is an indication that the intangibles may be impaired. In performing the impairment test management makes an assessment of whether the cash generating unit to which the intangibles relate will be able to generate positive net cash fl ows suffi cient to support the value of intangibles and other net assets of the entity.
The recoverable amount of each cash-generating unit (CGU) is deter-mined on the basis of its value-in-use. The value-in-use is established
NOTE 2 CRITICAL ACCOUNTING ESTIMATES AND JUDGEMENTS
Consolidated fi nancial statements 81

using certain key assumptions. The key assumptions are revenue growth and discount rates.
Value-in-use cash fl ow projections are based on fi nancial budgets approved by management covering the following fi nancial year. The assumptions applied in the short to medium term are based on management’s expectations regarding the operational development and growth. The terminal growth rates do not exceed the expected long-term average growth rate including infl ation for the countries in which the CGU's operate.
Uncertainties refl ecting historical performance and possible varia-tions in the amount or timing of the future cash fl ow are generally refl ected in the discount rates. Consequently, a country specifi c risk premium has been added to the discount rates to refl ect the specifi c risk associated with each cash-generating unit.
The Group’s impairment tests including sensitivity analyses are pre-sented in note 16, Impairment tests.
Defi ned benefi t plans and similar obligations The value of the Group’s defi ned benefi t plans and other long-term employee benefi ts are based on valuations from external actuaries. When calculating the net present value of the retirement benefi t obligation a number of signifi cant actuarial assumptions are made including discount rates, expected return on plan assets, expected increases in future wages, salary and retirement benefi ts. All assumptions are assessed at the reporting date. The range and weighted average for these assump-tions are disclosed in note 30, Pensions and similar obligations. In certain countries, the Group participates in multi-employer pension schemes, which by their nature are defi ned benefi t plans. The funds, however, are currently not able to provide the necessary informa-tion in order for the Group to account for the schemes as such. The pension schemes are therefore accounted for as defi ned contribution plans. There is a risk that the plans are not suffi ciently funded. How-ever, information on surplus or defi cit in the schemes is not available.
Provisions and contingencies Management assesses provisions, contingent assets and liabilities and the likely outcome of pending or probable lawsuits etc. on an ongoing basis. The outcome depends on future events that are by nature uncertain. In assessing the likely outcome of lawsuits and tax disputes etc., management bases its as-sessment on external legal assistance and established precedents.
Provisions are disclosed in note 31, Provisions and contingent li-abilities are disclosed in note 34, Contingent liabilities, pledges and guarantees.
Deferred tax assets The recognition of deferred tax assets regard-ing tax losses carried forward is based on management's assessment of expected future profi tability in the foreseeable future. Deferred tax assets relating to tax losses carried forward are only recognised to the extent that it is more likely than not that future taxable profi t will be available against which the unused tax losses can be utilised in the foreseeable future taking into account any restrictions in utilisation in the local tax legislation. This judgement is made on the reporting date based on budgets and estimates.
The Group’s tax assets are presented, and uncertainties relating to recognition are described, in note 19, Deferred tax.
Receivables are measured at amortised cost. Impairment losses recognised are based on management’s assessment of the custom-er’s ability to make the required payments. Management performs analysis of impairment at both specifi c receivable and portfolio level as described in note 1, Signifi cant accounting policies.
The recognised allowance for impairment losses is expected to be suffi cient to cover future losses. The fi nancial uncertainty associated with impairment of receivables is usually considered to be limited.
Impairment of receivables is described and disclosed in note 36, Financial risk management.
Assets held for sale mainly comprises disposal groups and is meas-ured at the lower of the carrying amount and fair value less costs to sell. Consequently, management makes estimates of the fair value of the disposal group. Depending on the nature of the disposal group's activity, assets and liabilities, the estimated fair value may be associ-ated with uncertainty and possibly adjusted subsequently. Manage-ment considers impairment of intangibles both on initial classifi cation as held for sale and subsequently. The estimation uncertainty relating to impairment of intangibles is described above.
Assets held for sale are disclosed in note 27, Assets and Liabilities held for sale.
Divestments When divesting businesses management makes estimates of the fi nal sales price. Additionally, management assesses the appropriate level of provisions to cover claims from purchasers or other parties in connection with divestments and representation and warranties given in relation to divestments.
JUDGEMENT IN RELATION TO APPLICATION OF ACCOUNTING POLICIESIn applying the Group’s accounting policies, management makes judgements which may signifi cantly infl uence the amounts recog-nised in the consolidated fi nancial statements.
On business combinations and establishing new entities assess-ment is made in order to classify the acquired business as a subsidi-ary, joint venture or associate. The assessment is made on basis of the agreement entered into on the acquisition of ownership interest or voting rights in the entity etc.
Revenue is primarily generated from rendering of services or from contract work in progress. Management makes judgements to dis-tinguish between revenue generated from rendering of service and revenue from contract work in progress for the purpose of classifi ca-tion of revenue either in accordance with IAS 18 "Revenue" or IAS 11 "Construction Contracts".
Other income and expenses, net The use of Other income and expenses, net entails management judgement in the separation from the normal ordinary operations of the Group. When using Other income and expenses, net it is crucial that these constitute items that can not be attributed directly to the Group’s ordinary operating activities.
Management carefully evaluates each item to ensure the correct dis-tinction between the Group’s ordinary operating activities and Other income and expenses, net.
NOTE 2 CRITICAL ACCOUNTING ESTIMATES AND JUDGEMENTS (CONTINUED)
82 Annual Report 2010

Acquisition and integration costs Acquisition costs comprise earn-out adjustments, direct acquisition costs related to external advisors and other acquisition related costs such as reversal of provisions in opening balances. Integration costs comprise costs incurred as a consequence of the integration of acquired businesses and include cost for termination of employees, contract termination costs mainly related to leasehold as well as advisory fees. The use of Acquisition and integration costs entails management judgement in the separation of these costs from the ordinary operating activities in the Group.
Management carefully evaluates each item to ensure the correct distinction between the Group’s ordinary operating activities and Acquisition and integration costs.
Leases The Group has entered into a number of leases and for each lease agreement an assessment is made as to whether the lease is a fi nance lease or an operating lease. The Group primarily enters into operating lease agreements. Operating leases consist of leases and rentals of properties, vehicles (primarily cars), production equipment and other equipment.
Financial instruments When entering into fi nancial instruments, management assesses whether the instrument is an effective hedge of recognised assets and liabilities and expected future cash fl ows. The hedge effectiveness of recognised hedge instruments is assessed on a monthly basis and any ineffectiveness is recognised in the income statement.
Assets held for sale Non-current assets and disposal groups are classifi ed as held for sale when the carrying amount of the assets or disposal groups are expected to primarily be recovered through a sale within 12 months in accordance with a formal plan rather than through continuing use. Management makes judgement to make the correct classifi cation. The classifi cation is signifi cant as the classifi ca-tion as held for sale changes the measurement basis of the non-current assets and disposal groups as well as the presentation in the statement of fi nancial position.
NOTE 2 CRITICAL ACCOUNTING ESTIMATES AND JUDGEMENTS (CONTINUED)
Consolidated fi nancial statements 83

Reportable segmentsISS is a global facility services company, that operates in more than 50 countries and delivers a wide range of services within the areas cleaning services, support services, property services, catering services, security services and facility management services.
Operations are managed based on a geographical structure in which countries are grouped into seven regions. The regions have been identifi ed based on a key principle of grouping countries that share market conditions and cultures.
The segment reporting is prepared in a manner consistent with the Group's internal management and reporting structure. Segment revenue, costs, assets and liabilities comprise items that can be directly referred to the individual segments.
DKK millionWestern
Europe Nordic Asia Pacifi cLatin
AmericaNorth
AmericaEastern Europe
Total re-portable
segments
2010Income statementRevenue 1) 39,121 17,301 5,401 5,018 3,070 2,625 1,602 74,138
Depreciation and amortisation 2) (374) (250) (78) (47) (31) (15) (21) (816)
Operating profi t before other items 3) 2,278 1,228 407 333 178 132 113 4,669
Other income and expenses, net (213) 136 0 - - - 0 (77)Acquisition and integration costs 1 (0) (7) - - - - (6)
Operating profi t 2) 2,066 1,364 400 333 178 132 113 4,586
Goodwill impairment (934) (4) - - - - - (938)Amortisation and impairment of brands and customer contracts (492) (193) (57) (49) (11) (42) (25) (869)
Statement of fi nancial positionTotal assets 31,464 14,492 4,028 3,394 1,751 1,662 1,356 58,147
Additions excluding acquisitions/divestments 459 222 107 88 64 15 21 976 Additions from acquisition of businesses 133 - 140 (2) - (3) 32 300 Disposals related to divestment of businesses 4) (12) (18) - - - - - (30)
Additions to non-current assets, net 5) 580 204 247 86 64 12 53 1,246
Total liabilities 21,309 9,374 1,908 2,580 1,536 1,191 633 38,531
Transactions between reportable segments are made on market terms.
1) Segment revenue comprises total revenue of each segment. Due to the nature of the business internal revenue is insignifi cant and is therefore not disclosed.2) Excluding Goodwill impairment and Amortisation and impairment of brands and customer contracts.3) Excluding Other income and expenses, net, Acquisition and integration costs, Goodwill impairment and Amortisation and impairment of brands and customer
contracts.4) Disposals related to divestment of businesses does not include Intangible assets and Property, plant and equipment from divestments that have been classifi ed as
held for sale.5) Additions to non-current assets comprise additions to Intangible assets and Property, plant and equipment.
NOTE 3 SEGMENT INFORMATION
84 Annual Report 2010

DKK millionWestern
Europe Nordic Asia Pacifi cLatin
AmericaNorth
AmericaEastern Europe
Total re-portable
segments
2009Income statementRevenue 1) 38,632 16,367 4,120 3,768 2,077 2,515 1,561 69,040
Depreciation and amortisation 2) (444) (237) (58) (35) (23) (15) (23) (835)
Operating profi t before other items 3) 2,056 1,219 308 259 131 134 106 4,213
Other income and expenses, net (567) 52 (4) (20) - - (2) (541)Acquisition and integration costs 4) (31) (4) (5) (2) (1) (2) (1) (46)
Operating profi t 2) 1,458 1,267 299 237 130 132 103 3,626
Goodwill impairment (1,011) (235) - - - - - (1,246)Amortisation and impairment of brands and customer contracts (715) (226) (53) (44) (17) (46) (28) (1,129)
Statement of fi nancial positionTotal assets 30,833 14,151 3,107 2,942 1,309 1,544 1,318 55,204
Additions excluding acquisitions/divestments 526 319 88 58 41 12 17 1,061 Additions from acquisition of businesses 333 170 337 45 (10) 84 3 962 Disposals related to divestment of businesses 5) (38) (366) (1) - - - - (405)
Additions to non-current assets, net 6) 821 123 424 103 31 96 20 1,618
Total liabilities 20,432 9,550 1,588 2,311 1,099 1,108 728 36,816
Transactions between reportable segments are made on market terms.
1) Segment revenue comprises total revenue of each segment. Due to the nature of the business internal revenue is insignifi cant and is therefore not disclosed. 2) Excluding Goodwill impairment and Amortisation and impairment of brands and customer contracts.3) Excluding Other income and expenses, net, Acquisition and integration costs, Goodwill impairment and Amortisation and impairment of brands and customer
contracts.4) In 2009, Acquisition and integration costs only comprised integration costs as acquisition costs were recognised as part of goodwill. 5) Disposals related to divestment of businesses does not include Intangible assets and Property, plant and equipment from divestments that have been classifi ed as
held for sale.6) Additions to non-current assets comprise additions to Intangible assets and Property, plant and equipment.
Grouping of countries into regions
Western Europe: Austria, Belgium & Luxembourg, France, Germany, Greece, Ireland, Israel, Italy, the Netherlands, Portugal, Spain, South Africa, Switzerland, Turkey and the United Kingdom
Nordic: Denmark, Finland, Greenland, Iceland, Norway and Sweden
Asia: Brunei, China, Hong Kong, India, Indonesia, Japan, Malaysia, the Philippines, Singapore, Taiwan and Thailand
Pacifi c: Australia and New Zealand
Latin America: Argentina, Brazil, Chile, Mexico and Uruguay
North America: Canada and the USA
Eastern Europe: Croatia, the Czech Republic, Estonia, Hungary, Poland, Romania, Russia, Slovakia and Slovenia
NOTE 3 SEGMENT INFORMATION (CONTINUED)
Consolidated fi nancial statements 85

Service typesThe Group's revenue derives from the following service types:
DKK million 2010 2009
Cleaning services 38,372 36,050 Support services 5,606 4,981 Property services 14,626 14,503 Catering services 7,059 6,201 Security services 5,246 4,672 Facility management services 3,164 2,597
Total revenue 74,073 69,004
Geographical informationRevenue and non-current assets (excluding deferred tax assets) is specifi ed below for each of the Group's signifi cant countries 1):
2010 2009
DKK million Revenue
Non-current assets Revenue
Non-current assets
France 8,084 5,080 8,879 5,493 United Kingdom 7,384 3,163 6,948 3,072 Norway 5,681 3,080 5,246 2,977 Australia 4,583 2,265 3,419 1,859 Spain 4,446 1,866 4,534 2,058 Sweden 3,898 2,051 3,536 1,814 Finland 3,841 3,130 3,678 3,298 Denmark (country of domicile) 3,714 2,346 3,731 2,396 Other countries 2) 32,442 14,731 29,033 14,786
Total 74,073 37,712 69,004 37,753
1) In this context signifi cant countries are defi ned as countries representing 5% or more of the Group's revenue. 2) Including unallocated items and eliminations.
Major customersNo customer comprises more than 10% of the Group's external revenue.
NOTE 3 SEGMENT INFORMATION (CONTINUED)
86 Annual Report 2010

ReconciliationsDKK million 2010 2009
RevenueRevenue for reportable segments 74,138 69,040 Elimination of internal revenue (65) (36)
Revenue according to the income statement 74,073 69,004
Operating profi tOperating profi t for reportable segments 4,586 3,626 Unallocated corporate costs (402) (339)Unallocated other income and expenses, net (35) (10)
Operating profi t according to the income statement 4,149 3,277 Unallocated:Share of result from associates 10 4 Financial income 198 223 Financial expenses (2,566) (2,531)
Profi t before tax and goodwill impairment/amortisation and impairment of brands and customer contracts according to the income statement 1,791 973
Total assetsTotal assets for reportable segments 58,147 55,204 Elimination of internal assets 1) (35,160) (30,536)Unallocated assets 32,448 29,686
Total assets according to the statement of fi nancial position 55,435 54,354
Additions to non-current assets 2)
Additions to non-current assets for reportable segments 1,246 1,618 Unallocated additions to non-current assets 38 33
Total additions to non-current assets according to the statement of fi nancial position 1,284 1,651
Total liabilitiesTotal liabilities for reportable segments 38,531 36,816 Elimination of internal liabilities 1) (34,657) (30,111)Unallocated liabilities 48,910 45,436
Total liabilities according to the statement of fi nancial position 52,784 52,141
1) Eliminations mainly relate to intra-group balances.2) Additions to non-current assets comprise additions to Intangible assets and Property, plant and equipment.
NOTE 3 SEGMENT INFORMATION (CONTINUED)
Consolidated fi nancial statements 87

DKK million 2010 2009
Rendering of services 69,129 64,647 Sales of goods 2,928 2,495 Contract work in progress 2,016 1,862
Revenue 74,073 69,004
Both revenue from rendering of services and contract work in progress have been determined based on the stage of completion method. The amount of revenue recognised from contract work in progress mainly relates to the Group's landscaping and damage control activities. The work performed is based on specifi cally negotiated contracts with customers.
DKK million 2010 2009
Wages and salaries 37,700 35,111 Defi ned benefi t plans 172 150 Defi ned contribution plans 1,791 1,573 Social security costs 5,629 5,343 Other employee benefi ts 2,698 2,604
Staff costs 47,990 44,781
Average number of employees 506,693 482,531
The Group received government grants in the form of wage subventions, which have been recognised in the income statement as a reduction of staff costs. The grants compensate the Group for staff costs primarily related to social security as well as hiring certain categories of employees such as trainees, disabled persons, long-term unemployed and employees in certain age groups.
NOTE 4 REVENUE
NOTE 5 STAFF COSTS
88 Annual Report 2010

Remuneration to the Board of Directors, the Executive Group Management and Corporate Senior Offi cers
2010 2009
DKK thousandBoard of Directors
Executive Group
Management
CorporateSenior
Offi cersBoard of Directors
Executive Group
Management
CorporateSenior
Offi cers
Salaries and other remuneration 2,173 15,003 50,098 1,969 20,027 37,036 Bonus - 5,450 15,830 - 5,703 7,409 Severance payments 1) - 16,204 3,188 - - 7,091 Share-based payments 2) - 233 1,413 - 233 2,021
Total remuneration 2,173 36,890 70,529 1,969 25,963 53,557
DKK thousand 2010 2009
Executive Group ManagementJeff Gravenhorst 10,246 7,483 Jakob Stausholm 8,362 7,351 Jørgen Lindegaard (former Group CEO) 18,282 10,879 Flemming Schandorff (former Group COO) - 250
36,890 25,963
The Board of Directors received remuneration for duties performed in ISS A/S and other companies within the ISS Group. The remuneration is a fi xed annual amount. The Board of Directors does not participate in the warrant programme described in note 6, Share-based payments. However, the non-executive members (except representatives of the Principal Shareholders) have been offered to invest in a mix of shares and warrants as part of the Directors Participation Programme described in note 38, Related parties.
The members of the Executive Group Management and Corporate Senior Offi cers received remuneration for duties performed in ISS A/S and other companies within the ISS Group. The remuneration consists of a combination of a fi xed salary, standard benefi ts in accordance with market standards and, for most of these, a performance-based bonus of up to 60% of their fi xed salary. Most members are also subject to a cash bonus scheme triggered by the completion of an initial public offering (IPO) or a sale of the company, the size of such bonus depending on the price of the shares of the company in the offering or the sales price, respectively. Furthermore, the Executive Group Management and certain Corporate Senior Offi cers participate in the warrant programme as well as the Management Participation Programme described in note 6, Share-based payments.
Corporate Senior Offi cers comprises members of Group Management, other than members of the Executive Group Management. Members of Group Management have authority and responsibility for planning, implementing and controlling the Group's activities and are together with the Board of Directors considered as the Group's key management personnel.
The employment contracts for the Executive Group Management and Corporate Senior Offi cers may be terminated at 6-24 months' notice. One employment contract includes a severance payment of 2 years salary. No other members are entitled to severance payments. The employment contracts contain no special termination rights.
Remuneration to the Board of Directors, the Executive Group Management and Corporate Senior Offi cers is paid by ISS World Services A/S.
1) Severance payments related to senior management changes at Corporate of DKK 16 million (2009: DKK 7 million) were included in Other income and expenses, net. 2) Included in Other income and expenses, net.
NOTE 5 STAFF COSTS (CONTINUED)
Consolidated fi nancial statements 89

Management Participation ProgrammeFunds advised by EQT Partners and Goldman Sachs Capital Partners (the "Principal Shareholders") have established a Management Participation Programme, under which the Executive Group Management and a number of senior offi cers 1) of the Group have been offered to invest. The programme is structured as a combination of direct and indirect investments in a mix of shares and warrants of FS Invest S.à r.l ("FS Invest"), ISS A/S's ultimate parent. As part of the initial programme - in addition to the investments - warrants in FS Invest were granted free of charge to the Executive Group Management and a number of Corporate Offi cers 2) of the Group.
The direct and indirect investments in FS Invest were made on market terms and hence are not share-based payments within the scope of IFRS 2 Share-based Payment. Further details of the programme and these investments are provided in note 38, Related parties. The warrants granted to the Executive Group Management and a number of Corporate Offi cers of the Group are within the scope of IFRS 2.
Warrants granted as part of the Management Participation ProgrammeThe warrants were granted in July 2006 as a one-time grant and were issued in two series, A and B, both expiring on 1 June 2014. The estimated FS Invest share price at the time of the grant was DKK 1,019 per share. The warrants entitle the holder to subscribe for FS Invest shares at an exercise price of DKK 2,039 and DKK 2,549 per share for warrants in series A and series B, respectively, in a proportion which is determined by the exercise restrictions mentioned below. The warrants are exercisable for a period of 30 business days prior to and ending on 1 June 2014. The warrants are non-transferable.
The fair value of the warrants was estimated to DKK 25 million at the time of grant measured using the Black-Scholes option pricing model based on the assumptions at the time of grant and exercise restrictions.
The warrants are accounted for as equity-settled transactions. The fair value at grant date of these warrants is expensed in the income statement over the vesting period from July 2006 to June 2014. In 2010, DKK 2 million were recognised under Other income and expenses, net in respect of warrants granted (2009: DKK 3 million).
The warrants are subject to exercise restrictions depending on the share price at the time of exercise. At a share price of 6,114 or more at the time of exercise, 90% of the warrants vested can be exercised. The proportion of exercisable warrants decreases in intervals down to 10% at a share price of 2,039. At share prices below 2,039, no warrants are exercisable.
Warrants outstanding at 31 December 2010 and movements during 2009 and 2010 were:
Executive Group Management Corporate Offi cers 2) Total
Number of warrants Series A Series B Total Series A Series B Total Series A Series BSeries A
and B
Outstanding at 1 January 2009 - 57,888 57,888 29,852 309,200 339,052 29,852 367,088 396,940 Warrants settled during 2009 - - - - (67,536) (67,536) - (67,536) (67,536)
Outstanding at 31 December 2009 - 57,888 57,888 29,852 241,664 271,516 29,852 299,552 329,404 Warrants settled during 2010 - - - (7,577) (44,195) (51,772) (7,577) (44,195) (51,772)
Outstanding at 31 December 2010 - 57,888 57,888 22,275 197,469 219,744 22,275 255,357 277,632
Warrants settled relates to cash settlement by FS Invest of warrants in connection with termination of employment.
1) Senior offi cers of the Group comprises Corporate Senior Offi cers (members of Group Management other than members of the Executive Group Management) and other Corporate Offi cers as well as certain members of Country Management of each country.
2) Corporate Offi cers of the Group comprises Corporate Senior Offi cers (members of Group Management other than members of the Executive Group Management) and other Corporate Offi cers.
NOTE 6 SHARE-BASED PAYMENTS
90 Annual Report 2010

DKK million 2010 2009
KPMGAudit fees 41 40 Other assurance services 12 7 Tax and VAT advisory services 12 10 Other services 5 10
Total KPMG 70 67
Audit fees comprised audit of the consolidated and local fi nancial statements. Other assurance services in 2010 comprised mainly work related to the contemplated initial public offering (IPO) process as well as half year review. Tax and VAT advisory services comprised general tax and VAT consultancy and assistance. Other services comprised among other things work related to acquisitions such as fi nancial and tax due diligence.
NOTE 8 OTHER INCOME AND EXPENSES, NET
DKK million 2010 2009
Gain on divestments 254 102 Gain on sale of properties 1 8 Other 0 6
Other income 255 116
Loss on divestments (208) (19)Accounting irregularities in Norway in prior years (113) - Redundancy and severance payments relating to senior management changes (16) (44)Costs related to the contemplated initial public offering (IPO) process (17) - Restructuring projects (0) (426)Impairment losses related to businesses classifi ed as held for sale - (159)Other (13) (19)
Other expenses (367) (667)
Other income and expenses, net (112) (551)
Gain on divestments in 2010 mainly related to completion of the divestment of the non-strategic washroom activities in Denmark, Norway and Sweden. In 2009, the gain related to the sale of the non-core laundry activities in Sweden and Norway.
Loss on divestments in 2010 primarily related to completion of the sale of the waste management and security activities in France and the non-core building maintenance activities in Spain which were classifi ed as held for sale on 31 December 2009. In 2009, the loss mainly related to the non-strategic landscaping activities in Norway and Sweden as well as the contact centre activities in the Netherlands.
Accounting irregularities in Norway in prior years related to one of ISS Norway's subsidiaries and took place in the period from 2005-2010 resulting in an accumulated impact of DKK 118 million stemming from an overstatement of revenue of DKK 75 million and an understatement of cost of DKK 43 million. The impact from accounting irregularities carried out in prior years amounted to DKK 113 million.
Costs related to the contemplated initial public offering (IPO) process comprised costs for external advisors incurred as part of the initiated IPO process.
NOTE 7 FEES TO AUDITORS ELECTED AT THE ANNUAL GENERAL MEETING
Consolidated fi nancial statements 91

Restructuring projects in 2009 related to a number of projects in France, Germany, Spain, Australia, Belgium, Denmark, Finland and the United Kingdom covering closure of certain parts of business units or divisions as well as changes in the organisational setup, consolidation of offi ce locations and other effi ciency improvements. Generally, restructuring projects include primarily redundancy payments, termination of leaseholds and relocation costs.
Impairment losses related to businesses classifi ed as held for sale in 2009 mainly related to net assets (excluding goodwill, brands, customer contracts and the related tax effect) of the waste management activities in France, which were classifi ed as held for sale at 31 December 2009, and sold in 2010 as mentioned above.
NOTE 9 FINANCIAL INCOME AND EXPENSES
DKK million 2010 2009
Interest income on cash and cash equivalents etc. 93 81 Interest income from ISS Equity A/S - 0 Amortisation of gain from settlement of interest rate swaps 2 14 Foreign exchange gains 103 128
Financial income 198 223
Hereof fi nancial income on fi nancial assets measured at amortised cost 93 81
Interest expenses on loans and borrowings etc. (2,054) (1,920)Amortisation of fair value adjustment of issued bonds (40) (99)Amortisation of fi nancing fees (123) (57)Interest expenses to ISS Equity A/S (3) (4)Net change in fair value of cash fl ow hedges transferred from equity (259) (325)Foreign exchange losses (55) (67)Loss related to partial redemption of EMTNs 1) 2) (32) (59)
Financial expenses (2,566) (2,531)
Hereof fi nancial expenses on fi nancial liabilities measured at amortised cost (2,220) (2,080)
1) In January 2010, a partial redemption of the EMTNs due 2010 was carried out through the completion of a tender offer for DKK 1,116 million (EUR 150 million). The redemption resulted in a loss of DKK 32 million primarily due to the purchase price being above nominal value, and additionally from the carrying amount being below nominal value due to the fair value adjustment made in connection with ISS A/S's acquisition of ISS World Services A/S in May 2005. In 2009, the partial redemption in July of the EMTNs due in 2010 resulted in a loss of DKK 59 million.
2) The EMTNs are measured at amortised cost.
NOTE 8 OTHER INCOME AND EXPENSES, NET (CONTINUED)
92 Annual Report 2010

DKK million 2010 2009
Current tax regarding profi t before impairment/amortisation of intangibles 1) 769 542 Deferred tax regarding profi t before impairment/amortisation of intangibles 1) 32 23
Tax on profi t before impairment/amortisation of intangibles 1) 801 565 Adjustments relating to prior years, net (41) 23
Income taxes 760 588
Tax effect of impairment/amortisation of intangibles 1) (244) (361)
Total tax recognised in the income statement 516 227
Income tax recognised in other comprehensive income
DKK million 2010 2009
Before tax Tax
Net of tax
Before tax Tax
Net of tax
Foreign exchange adjustment of subsidiaries and non-controlling interests 911 - 911 364 - 364 Fair value adjustment of hedges, net (138) 35 (103) (327) 82 (245)Fair value adjustment of hedges, net, transferred to Financial expenses 259 (65) 194 325 (81) 244 Limitation to interest deduction in Denmark - - - - (3) (3)Actuarial gains/(losses) (129) 36 (93) (45) 4 (41)Impact from asset ceiling regarding pensions (20) - (20) 18 - 18
Total recognised in other comprehensive income 883 6 889 335 2 337
Computation of effective tax rate 2010 2009
Statutory income tax rate in Denmark 25.0 % 25.0 %Foreign tax rate differential, net (3.1)% (1.5)%
21.9 % 23.5 %Non-tax deductible expenses less non-taxable income 3.1 % 5.4 %
Adjustments relating to prior years, net (2.3)% 2.3 %Change of valuation of net tax assets 3.6 % 9.6 %Effect of changes in tax rates (0.1)% (0.2)%Other taxes 2) 7.6 % 5.7 %Limitation to interest deduction in Denmark 8.6 % 14.1 %
Effective tax rate (excluding effect from impairment/amortisation of intangibles) 1) 42.4 % 60.4 %
1) In this context intangibles comprise the value of goodwill, brands and customer contracts.2) Other taxes mainly comprise withholding tax and the French Cortisation sur La Valeur Ajoutee des Entreprises (CVAE).
NOTE 10 INCOME TAXES
Consolidated fi nancial statements 93
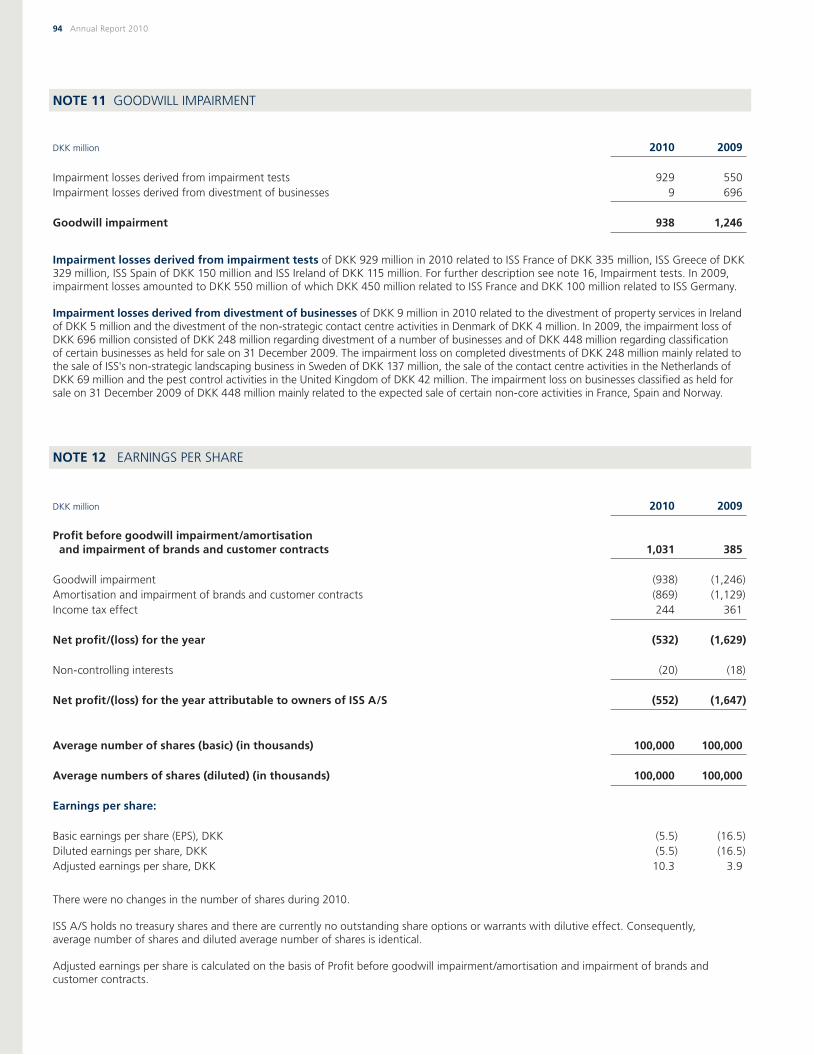
DKK million 2010 2009
Impairment losses derived from impairment tests 929 550 Impairment losses derived from divestment of businesses 9 696
Goodwill impairment 938 1,246
Impairment losses derived from impairment tests of DKK 929 million in 2010 related to ISS France of DKK 335 million, ISS Greece of DKK 329 million, ISS Spain of DKK 150 million and ISS Ireland of DKK 115 million. For further description see note 16, Impairment tests. In 2009, impairment losses amounted to DKK 550 million of which DKK 450 million related to ISS France and DKK 100 million related to ISS Germany.
Impairment losses derived from divestment of businesses of DKK 9 million in 2010 related to the divestment of property services in Ireland of DKK 5 million and the divestment of the non-strategic contact centre activities in Denmark of DKK 4 million. In 2009, the impairment loss of DKK 696 million consisted of DKK 248 million regarding divestment of a number of businesses and of DKK 448 million regarding classifi cation of certain businesses as held for sale on 31 December 2009. The impairment loss on completed divestments of DKK 248 million mainly related to the sale of ISS's non-strategic landscaping business in Sweden of DKK 137 million, the sale of the contact centre activities in the Netherlands of DKK 69 million and the pest control activities in the United Kingdom of DKK 42 million. The impairment loss on businesses classifi ed as held for sale on 31 December 2009 of DKK 448 million mainly related to the expected sale of certain non-core activities in France, Spain and Norway.
NOTE 12 EARNINGS PER SHARE
DKK million 2010 2009
Profi t before goodwill impairment/amortisation and impairment of brands and customer contracts 1,031 385
Goodwill impairment (938) (1,246)Amortisation and impairment of brands and customer contracts (869) (1,129)Income tax effect 244 361
Net profi t/(loss) for the year (532) (1,629)
Non-controlling interests (20) (18)
Net profi t/(loss) for the year attributable to owners of ISS A/S (552) (1,647)
Average number of shares (basic) (in thousands) 100,000 100,000
Average numbers of shares (diluted) (in thousands) 100,000 100,000
Earnings per share:
Basic earnings per share (EPS), DKK (5.5) (16.5)Diluted earnings per share, DKK (5.5) (16.5)Adjusted earnings per share, DKK 10.3 3.9
There were no changes in the number of shares during 2010.
ISS A/S holds no treasury shares and there are currently no outstanding share options or warrants with dilutive effect. Consequently, average number of shares and diluted average number of shares is identical.
Adjusted earnings per share is calculated on the basis of Profi t before goodwill impairment/amortisation and impairment of brands and customer contracts.
NOTE 11 GOODWILL IMPAIRMENT
94 Annual Report 2010

DKK million 2010 2009
Changes in inventories (7) (25)Changes in receivables (455) (20)Changes in payables 375 (92)
Changes in working capital (87) (137)
NOTE 14 ACQUISITION AND DIVESTMENT OF BUSINESSES
Acquisition of businesses The Group uses acquisitions as a tool in the continued development of the business platform. Acquisitions are used selectively to improve competitiveness, build critical mass and increase service capabilities and capacity where and when appropriate.
When acquiring businesses the Group seeks to generate value by restructuring and refi ning the acquired business by applying The ISS Way strategy. The main impact from acquisitions derives from synergies, the value of human resources and the creation of platforms for growth. Consequently, goodwill recognised on acquisition is attributable mainly to; i) assembled workforce, ii) technical expertise and technological know how, iii) training expertise, training and recruitment programmes and iv) platform for growth.
Acquisitions occuring on or after 1 January 2010 are accounted for in accordance with IFRS 3 (revised 2008), whereas acquisitions occuring before 1 January 2010 are accounted for in accordance with the previous IFRS 3. Consequently, for the latter adjustments to contingent consideration and transaction costs continue to be recognised in goodwill as described in note 1, Signifi cant accounting policies.
Acquisitions in 2010The Group made one acquisition in 2010. The opening balance of the acquisition and adjustments to prior years' acquisitions had the following effect on the Group's assets and liabilities at 31 December 2010:
2010
DKK million
SDB Cisco
Ltd.
Adjustments to prior
years' acquisitions
Total acquisitions
Customer contracts 48 - 48 Other non-current assets 24 (3) 21 Trade receivables 70 (19) 51 Other current assets 83 (8) 75 Provisions - 2 2 Pensions, deferred tax liabilities and non-controlling interests (14) 9 (5)Non-current loans and borrowings (1) - (1)Other current liabilities (112) 7 (105)
Total identifi able net assets 98 (12) 86 Goodwill 118 112 230 Acquisition costs, net of tax - (1) (1)
Consideration transferred 216 99 315 Cash and cash equivalents in acquired businesses (49) - (49)
Cash consideration transferred 167 99 266 Contingent and deferred consideration (8) 206 198 Acquisition costs paid, net of tax 5 1 6
Total payments regarding acquisition of businesses 164 306 470
NOTE 13 CHANGES IN WORKING CAPITAL
Consolidated fi nancial statements 95

Acquisition of businesses (continued)
SDB Cisco Ltd.On 9 August 2010, the Group acquired 49% of the shares in the Indian security company SDB Cisco Ltd. Under IFRS, the Group has the power to govern the fi nancial and operating policies of the company by virtue of the governance structure and consequently, SDB Cisco is consolidated as a subsidiary. The non-controlling interest is accounted for in accordance with note 1, Signifi cant accounting policies.
Acquiring SDB Cisco adds security services to the service offerings of ISS India, provides national coverage within security services and secures ISS a leading position in the market for outsourced services in India.
The total annual revenue of SDB Cisco was estimated at DKK 400 million (approximate fi gures extracted from unaudited fi nancial information) based on expectations at the time of the acquisition. In the period from the acquisition date to 31 December 2010, SDB Cisco contributed revenue of DKK 181 million and operating profi t before other items of DKK 11 million. Total number of employees taken over is approx. 27,000.
Total consideration transferred amounted to DKK 216 million of which DKK 8 million has been deferred. No contingent consideration has been agreed as part of the transaction. Adjusted for cash and cash equivalents acquired in the opening balance the cash consideration transferred was DKK 167 million.
The Group incurred acquisition-related costs of DKK 5 million related to external legal fees and due diligence costs. The legal fees and due diligence costs have been included in the income statement in the line Acquisition and integration costs.
In line with usual Group procedures for completion of opening balances of acquired businesses the review of the opening balance of SDB Cisco has not yet been completed. Consequently, the opening balance is provisionally determined as at 31 December 2010.
Trade receivables of DKK 70 million are included in the provisionally determined opening balance. The trade receivables comprise gross contractual amounts of DKK 74 million, of which DKK 4 million were expected to be uncollectible at the acquisition date based on the preliminary assessment.
Based on the provisionally determined fair values of identifi able net assets goodwill amounts to DKK 118 million. The goodwill recognised is not expected to be deductible for income tax purposes.
Adjustments to prior years' acquisitionsAdjustments to prior years' acquisitions comprise various minor adjustments to the identifi able net assets of a number of acquisitions. The goodwill addition is mainly related to a revised estimate of the purchase obligation for the remaining 10% of ISS Turkey, DKK 148 million, as well as the fi nal settlement of the purchase obligation related to ISS Estonia with the acquisition of the remaining 49%, DKK 30 million. The amounts recognised in goodwill refl ect the excess over the originally estimated purchase obligations already recognised in the statement of fi nancial position in prior years. On the other hand the total addition to goodwill is reduced by a revised estimate for contingent consideration (earn-out) related to Inbuilt Engineering in Singapore, DKK 49 million, as well as a number of minor adjustments related to various acquisitions.
NOTE 14 ACQUISITION AND DIVESTMENT OF BUSINESSES (CONTINUED)
96 Annual Report 2010

Acquisition of businesses (continued)
Acquisitions in 2009The Group made 22 acquisitions in 2009. The total purchase price amounted to DKK 680 million. The total annual revenue of the acquired businesses (approximate fi gures extracted from unaudited fi nancial information) is estimated at DKK 997 million based on expectations at the time of acquisition.
Acquisitions made in 2009 (including adjustments to acquisitions in prior years) had the following effect on the Group's assets and liabilities at the acquisition date:
2009
Fair value adj.
DKK million
Pre-acquisi-tion carrying
amounts
Current year
acquisitionsPrior year
acquisitions
Recognised values on
acquisition
Customer contracts 0 165 - 165 Other non-current assets 18 5 9 32 Trade receivables 124 (2) (15) 107 Other current assets 33 1 0 34 Provisions (1) (8) (20) (29)Pensions, deferred tax liabilities and non-controlling interests 7 (36) (4) (33)Non-current loans and borrowings (2) (1) - (3)Current loans and borrowings (16) - (2) (18)Other current liabilities (113) (10) (15) (138)
Total identifi able net assets 50 114 (47) 117 Goodwill 66 589 Acquisition costs, net of tax 2 (26)
Consideration transferred 21 680 Cash and cash equivalents in acquired businesses (15)
Cash consideration transferred 665 Contingent and deferred consideration 223 Prepaid acquisitions (3)Acquisition costs paid, net of tax 29
Total payments regarding acquisition of businesses 914
In 2009, no acquisitions accounted for more than 2% of the Group's revenue on an individual basis. Consequently, all acquisitions are deemed individually immaterial and are therefore shown in aggregate.
The purchase price of prior years' acquisitions increased by DKK 21 million, mainly due to revised estimates relating to earn-outs for the acquisitions of Inbuilt in Singapore of DKK 74 million and Sardunya in Turkey of DKK 36 million, offset mainly by Carlos Rocha in Spain of DKK 21 million, Loghis Logistica in Brazil of DKK 13 million, Ryvola in the Czech Republic of DKK 10 million, Hunt/Ondes in Belgium of DKK 8 million and Gastronomia in Spain of DKK 7 million. Furthermore, net assets of prior years' acquisitions were reduced by DKK 47 million relating to various acquisitions. Accordingly, goodwill has been adjusted.
Acquisition costs mainly comprised fees to lawyers, auditors and consultants (paid in relation to the acquisition).
NOTE 14 ACQUISITION AND DIVESTMENT OF BUSINESSES (CONTINUED)
Consolidated fi nancial statements 97
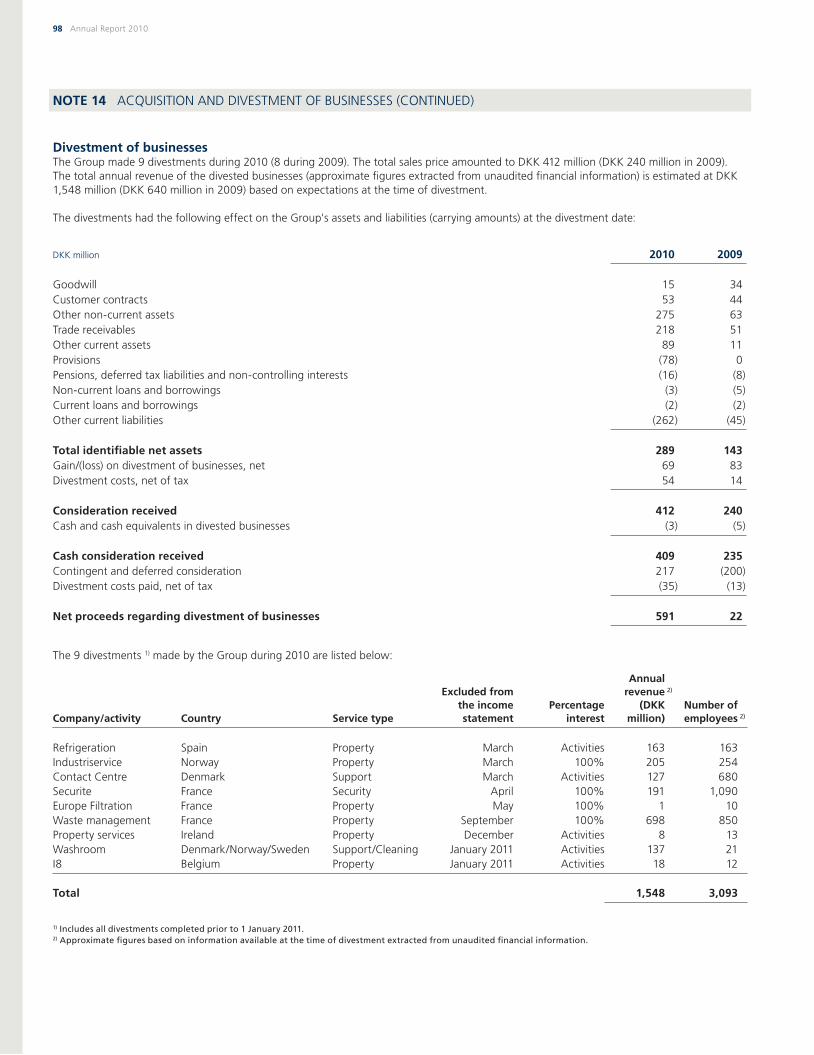
Divestment of businessesThe Group made 9 divestments during 2010 (8 during 2009). The total sales price amounted to DKK 412 million (DKK 240 million in 2009). The total annual revenue of the divested businesses (approximate fi gures extracted from unaudited fi nancial information) is estimated at DKK 1,548 million (DKK 640 million in 2009) based on expectations at the time of divestment.
The divestments had the following effect on the Group's assets and liabilities (carrying amounts) at the divestment date:
DKK million 2010 2009
Goodwill 15 34 Customer contracts 53 44 Other non-current assets 275 63 Trade receivables 218 51 Other current assets 89 11 Provisions (78) 0 Pensions, deferred tax liabilities and non-controlling interests (16) (8)Non-current loans and borrowings (3) (5)Current loans and borrowings (2) (2)Other current liabilities (262) (45)
Total identifi able net assets 289 143 Gain/(loss) on divestment of businesses, net 69 83 Divestment costs, net of tax 54 14
Consideration received 412 240 Cash and cash equivalents in divested businesses (3) (5)
Cash consideration received 409 235 Contingent and deferred consideration 217 (200)Divestment costs paid, net of tax (35) (13)
Net proceeds regarding divestment of businesses 591 22
The 9 divestments 1) made by the Group during 2010 are listed below:
Company/activity Country Service type
Excluded fromthe income statement
Percentage interest
Annual revenue
(DKK million)
2)
Number of employees 2)
Refrigeration Spain Property March Activities 163 163Industriservice Norway Property March 100% 205 254Contact Centre Denmark Support March Activities 127 680Securite France Security April 100% 191 1,090Europe Filtration France Property May 100% 1 10Waste management France Property September 100% 698 850Property services Ireland Property December Activities 8 13Washroom Denmark/Norway/Sweden Support/Cleaning January 2011 Activities 137 21I8 Belgium Property January 2011 Activities 18 12
Total 1,548 3,093
1) Includes all divestments completed prior to 1 January 2011.2) Approximate fi gures based on information available at the time of divestment extracted from unaudited fi nancial information.
NOTE 14 ACQUISITION AND DIVESTMENT OF BUSINESSES (CONTINUED)
98 Annual Report 2010

Pro forma revenue and operating profi t before other items Assuming all acquisitions and divestments in the year were included as of 1 January the effect on revenue and operating profi t before other items is estimated as follows:
DKK million 2010 2009
Pro forma revenueRevenue recognised in the income statement 74,073 69,004 Acquisitions 219 184
Revenue adjusted for acquisitions 74,292 69,188 Divestments (758) (403)
Pro forma revenue 73,534 68,785
Pro forma operating profi t before other itemsOperating profi t before other items recognised in the income statement 4,267 3,874 Acquisitions 21 19
Operating profi t before other items adjusted for acquisitions 4,288 3,893 Divestments (59) (5)
Pro forma operating profi t before other items 4,229 3,888
Applied assumptionsThe adjustment of revenue and operating profi t before other items is based on estimates made by local ISS management in the respective jurisdictions in which such acquisitions and divestments occurred at the time of such acquisition and divestment or actual results where available. Synergies from acquisitions are not included for periods in which such acquisitions were not controlled by the Group. The estimates are based on unaudited fi nancial information.
These adjustments and the computation of total revenue and operating profi t before other items calculated on a pro forma basis based on such adjustments are presented for informational purposes only. This information does not represent the results the Group would have achieved had the acquisitions and divestments during the year occurred on 1 January. In addition, the information should not be used as the basis for or prediction of any annualised calculation.
Acquisitions and divestments subsequent to 31 December 2010Divestments made by the Group in the period from 1 January to 28 February 2011 are listed below. No acquisitions were completed in the period.
Company/activity Country Service type
Excluded fromthe income statement
Percentage interest
Annual revenue
(DKK million)
1)
Number of employees
ISS Batiservices France Property January 100% 6 7
Divestments 6 7
In accordance with usual Group procedures, divestment balances are prepared during the fi rst months following the divestment. Consequently, the fi nal divestment balances are not available for divestments completed from 1 January to 28 February 2011.
1) Approximate fi gures based on unaudited fi nancial information available at the time of divestment.
NOTE 14 ACQUISITION AND DIVESTMENT OF BUSINESSES (CONTINUED)
Consolidated fi nancial statements 99

DKK million Goodwill BrandsCustomer contracts
Software and other intan gible
assets Total
2010Cost at 1 January 28,502 1,584 10,560 698 41,344 Foreign exchange adjustments 1,380 57 553 31 2,021 Additions 230 - - 153 383 Additions from acquisition of businesses - - 48 - 48 Disposals related to divestment of businesses - - (0) (6) (6)Other disposals (9) - - (5) (14)Reclassifi cation from Property, plant and equipment - - - 47 47 Reclassifi cation to Assets held for sale (355) - (48) (12) (415)
Cost at 31 December 29,748 1,641 11,113 906 43,408
Amortisation and impairment losses at 1 January (1,068) (17) (4,440) (367) (5,892)Foreign exchange adjustments (4) (1) (232) (18) (255)Amortisation - (3) (820) (130) (953)Impairment losses 1) (938) (8) (33) - (979)Disposals related to divestment of businesses - - 0 0 0 Other disposals 9 - - 2 11 Reclassifi cation from Property, plant and equipment - - - (14) (14)Reclassifi cation to Assets held for sale - - 24 8 32
Amortisation and impairment losses at 31 December (2,001) (29) (5,501) (519) (8,050)
Carrying amount at 31 December 27,747 1,612 5,612 387 35,358
2009Cost at 1 January 27,783 1,540 10,596 447 40,366 Foreign exchange adjustments 875 44 376 15 1,310 Adjustment relating to prior years - - - 121 121 Additions 595 - - 139 734 Additions from acquisition of businesses - - 169 1 170 Disposals related to divestment of businesses (34) - (91) (6) (131)Other disposals (702) - (370) (7) (1,079)Reclassifi cation to Assets held for sale (15) - (120) (12) (147)
Cost at 31 December 28,502 1,584 10,560 698 41,344
Amortisation and impairment losses at 1 January (524) (14) (3,678) (149) (4,365)Foreign exchange adjustments - 1 (124) - (123)Adjustment relating to prior years - - - (121) (121)Amortisation - (4) (910) (107) (1,021)Impairment losses 1) (1,246) - (210) - (1,456)Disposals related to divestment of businesses - - 46 2 48 Other disposals 702 - 370 - 1,072 Reclassifi cation to Assets held for sale - - 66 8 74
Amortisation and impairment losses at 31 December (1,068) (17) (4,440) (367) (5,892)
Carrying amount at 31 December 27,434 1,567 6,120 331 35,452
The carrying amount of Brands is primarily related to the ISS brand, which is considered to have an indefi nite useful life since there is no foreseeable limit to the period over which the brand is expected to generate net cash infl ows. Factors that played a signifi cant role in determining that the ISS brand has an indefi nite useful life are: i) the ISS brand has existed for decades, ii) the Group's strategy is based on the ISS brand, iii) all acquired brands are converted to or co-branded with the ISS brand and iv) the ISS brand is used in the business to business and public segments with low maintenance costs attached.
1) In 2010, impairment losses on brands and customer contracts were related to Greece derived from impairment tests. In 2009, impairment losses on customer contracts was mainly related to non-core activities in France, which were classifi ed as held for sale at 31 December 2009.
NOTE 15 INTANGIBLE ASSETS
100 Annual Report 2010

Impairment test procedureThe Group performs impairment tests on intangibles 1) annually and whenever there is an indication that intangibles may be impaired. The Group's intangibles primarily relate to the purchase price allocation following the take-over of ISS World Services A/S as at 9 May 2005. A part of the Group's intangibles relates to acquisitions carried out after the take-over of ISS World Services A/S. Companies acquired after the take-over comprise a diverse portfolio of service types, customer segments, geographical regions, contract sizes and management skills.
Impairment tests are carried out per country as this represents the lowest level of cash-generating units (CGU) to which the carrying amount of intangibles can be allocated and monitored with any reasonable certainty. This level of allocation and monitoring of intangibles should be seen in the light of the Group's strategy to integrate acquired companies as quickly as possible in order to benefi t from synergies.
Acquired companies are typically organisationally integrated and merged with (or activities transferred to) existing Group companies shortly after the completion of the acquisition. Furthermore, synergies and other effects resulting from cooperation with existing Group companies in their geographical or business area normally infl uence the fi nancial performance of an acquired company. Consequently, after a short period of time, it is generally not possible to track and measure the value of intangibles of the individual acquired companies (or activities) with any reasonable certainty.
Estimates used to measure recoverable amountThe recoverable amount of each CGU is determined on the basis of its value-in-use. The value-in-use is established using certain key assumptions as described below. The key assumptions are revenue growth and discount rates.
Value-in-use cash fl ow projections are based on fi nancial budgets approved by management covering the following fi nancial year. The assumptions applied in the short to medium term are based on management's expectations regarding the operational development and growth. The terminal growth rates do not exceed the expected long-term average growth rate including infl ation for the business in which the CGU's operate.
In determining the country specifi c discount rates, which are calculated net of tax, a target ratio of 60/40 between the market value of debt and enterprise value is used. Uncertainties refl ecting historical performance and possible variations in the amount or timing of the future cash fl ow are generally refl ected in the discount rates. Consequently, a country specifi c risk premium has been added to the discount rates to refl ect the specifi c risk associated with each CGU.
As a company based in Europe, the Group assumes the long-term market equity risk premium to be 4.5%. When performing impairment tests for individual CGU's, the risk premium applied may be higher than the Group's. When acquiring businesses the Group typically applies a hurdle rate, which is signifi cantly higher than the calculated cost of capital.
Impairment test results 2010The carrying amount of intangibles and the key assumptions 2) used in the impairment testing as per 31 December 2010 are presented below for each CGU representing more than 5% of the carrying amount of intangibles or where impairment losses have been incurred during the year. Based on the impairment tests performed impairment losses of DKK 970 million have been recognised in 2010 in respect of goodwill, brands and customer contracts. The impairment losses recognised are specifi ed below:
DKK million Goodwill BrandsCustomer contracts Total
Greece 329 8 33 370 France 335 - - 335 Spain 150 - - 150 Ireland 115 - - 115
Total impairment losses 3) 929 8 33 970
ISS GreeceAt 30 June 2010, the impairment test for ISS Greece resulted in recognition of an impairment loss of DKK 200 million mainly due to a signifi cant increase in the discount rate. However, as a consequence of the continuing challenging market conditions in Greece the assumptions applied were reassessed at 30 September 2010, which resulted in recognition of an additional impairment loss of DKK 170 million. As per 31 December 2010 the assumptions in the business plan have been evaluated and updated as part of the annual impairment testing. No additional impairment losses were identifi ed. Consequently, during 2010 the total recognised impairment loss for ISS Greece amounted to DKK 370 million of which DKK 329 million related to goodwill, DKK 8 million related to brands and DKK 33 million related to customer contracts.
1) In this context intangibles cover the value of goodwill, brands and customer contracts resulting from the acquisition of businesses.2) The key assumptions applied in the impairment tests are used for accounting purposes and should not be considered a forward-looking statement within the
meaning of the US Private Securities Litigation Act of 1995 and similar laws in other countries regarding expectations to the future development.3) Excluding impairment losses derived from divestment of businesses.
NOTE 16 IMPAIRMENT TESTS
Consolidated fi nancial statements 101

ISS FranceThe impairment test for ISS France at 31 December 2010 resulted in recognition of an impairment loss of DKK 335 million. The loss was mainly a result of a slight extension of the turnaround plan compared with prior expectations which has led to slightly adjusted assumptions in the business plan prepared by local management at year end 2010.
ISS SpainThe impairment test for ISS Spain resulted in the recognition of an impairment loss of DKK 150 million mainly due to an increase in the discount rate applied. The increase in the discount rate was mainly driven by an increase in the risk-free interest rate.
ISS IrelandDue to a continued increase in the discount rate applied driven by signifi cant increases in the risk-free interest rate, the impairment test for ISS Ireland was updated at 30 June 2010 and again at 30 September 2010, which resulted in recognition of impairment losses of DKK 40 million and DKK 30 million, respectively. In connection with the impairment test as per 31 December 2010 an additional loss of DKK 45 million was recognised as the interest rates had increased even further. Hence, the total impairment loss recognised in ISS Ireland in 2010 amounted to DKK 115 million.
Carrying amounts and key assumptionsCarrying amount Applied key assumptions
DKK million Goodwill BrandsCustomer contracts
Total intan-gibles 1)
Long-term growth
Discount rate,
net of tax
Discount rate,
pre tax
2010France 3,925 300 522 4,747 3.0% 8.5% 13.5%United Kingdom 2,276 166 562 3,004 3.0% 9.0% 11.4%Finland 2,308 120 561 2,989 3.0% 8.8% 11.1%Norway 2,143 138 545 2,826 3.0% 9.8% 12.8%Netherlands 1,875 122 167 2,164 3.0% 9.3% 11.6%Denmark 1,739 131 251 2,121 3.0% 9.3% 11.7%Australia 1,783 13 325 2,121 3.0% 10.7% 14.4%Belgium 1,495 86 242 1,823 3.0% 9.6% 13.4%Spain 1,317 90 317 1,724 3.0% 11.0% 14.8%Ireland 2) 192 16 59 267 3.0% 11.1% 12.5%Greece 3) - - 66 66 3.0% 11.1% 13.6%Other 8,694 430 1,995 11,119 - - -
Total carrying amount at 31 December 27,747 1,612 5,612 34,971
2009France 4,253 300 610 5,163 3.0% 8.8% 12.0%Finland 2,304 120 627 3,051 3.0% 9.1% 11.4%United Kingdom 2,158 158 599 2,915 3.0% 9.4% 12.1%Norway 2,012 130 567 2,709 3.0% 10.2% 13.3%Netherlands 1,872 121 198 2,191 3.0% 9.6% 12.0%Denmark 1,744 131 297 2,172 3.0% 9.8% 12.3%Belgium 1,563 85 304 1,952 3.0% 8.9% 12.2%Spain 1,465 90 369 1,924 3.0% 9.8% 13.0%Australia 1,453 10 303 1,766 3.0% 11.4% 15.4%Germany 634 66 88 788 3.0% 9.8% 12.9%Other 7,976 356 2,158 10,490 - - -
Total carrying amount at 31 December 27,434 1,567 6,120 35,121
1) In this context intangibles cover the value of goodwill, brands and customer contracts resulting from the acquisition of businesses.2) The applied long-term discount rate, net of tax of 11.1% is calculated based on a ten year average yield on a 10 year Irish government bond while the short to
medium term discount rate applied was 15.5% and was calculated based on the current interest yield on a 10 year Irish government bond.3) The applied long-term discount rate, net of tax of 11.1% is calculated based on a ten year average yield on a 10 year Greek government bond while the short to
medium term discount rate applied was 17.8% and was calculated based on the current interest yield on a 10 year Greek government bond.
NOTE 16 IMPAIRMENT TESTS (CONTINUED)
102 Annual Report 2010

Sensitivity analysis A sensitivity analysis on the key assumptions in the impairment testing is presented below. The allowed change represents the percentage points by which the value assigned to the key assumption as applied in the expected long-term rate can change, all other things being equal, before the unit's recoverable amount equals its carrying amount.
Growth Discount rate, net of tax
Applied expected
long-term rateAllowed decrease
Applied rate
Allowed increase
2010France 3.0% 0.0% 8.5% 0.0%United Kingdom 3.0% >3.0% 9.0% >3.0%Finland 3.0% 2.7% 8.8% 2.9%Norway 3.0% >3.0% 9.8% >3.0%Netherlands 3.0% 3.0% 9.3% 2.4%Denmark 3.0% 2.7% 9.3% 2.9%Australia 3.0% 2.7% 10.7% 2.8%Belgium 3.0% 1.5% 9.6% 1.2%Spain 3.0% 0.0% 11.0% 0.0%Ireland 3.0% 0.0% 11.1% 0.0%Greece 3.0% 0.1% 11.1% 0.1%
2009France 3.0% 0.0% 8.8% 0.0%Finland 3.0% 1.7% 9.1% 1.8%United Kingdom 3.0% >3.0% 9.4% >3.0%Norway 3.0% >3.0% 10.2% >3.0%Netherlands 3.0% 2.2% 9.6% 1.6%Denmark 3.0% 1.8% 9.8% 1.8%Belgium 3.0% 1.3% 8.9% 1.0%Spain 3.0% 0.4% 9.8% 0.3%Australia 3.0% 1.5% 11.4% 1.5%Germany 3.0% 0.0% 9.8% 0.0%
NOTE 16 IMPAIRMENT TESTS (CONTINUED)
Consolidated fi nancial statements 103

2010 2009
DKK millionLand andbuildings
Plant and equipment Total
Land andbuildings
Plant and equipment Total
Cost at 1 January 161 5,093 5,254 285 3,339 3,624 Foreign exchange adjustments 7 344 351 6 183 189 Adjustment relating to prior years - - - 25 1,332 1,357 Additions 9 852 861 68 886 954 Additions from acquisition of businesses 8 14 22 0 26 26 Disposals related to divestment of businesses - (24) (24) (6) (96) (102)Other disposals (4) (251) (255) (11) (258) (269)Reclassifi cation to Intangible assets - (47) (47) - - - Reclassifi cation to Assets held for sale 0 (207) (207) (206) (319) (525)
Cost at 31 December 181 5,774 5,955 161 5,093 5,254
Depreciation and impairment losses at 1 January (56) (3,194) (3,250) (47) (1,301) (1,348)Foreign exchange adjustments (2) (242) (244) (2) (123) (125)Adjustment relating to prior years - - - (25) (1,332) (1,357)Depreciation (4) (723) (727) (14) (753) (767)Impairment losses - - - (92) (67) (159)Additions from acquisition of businesses - (3) (3) - (8) (8)Disposals related to divestment of businesses 0 21 21 2 36 38 Other disposals 2 154 156 3 166 169 Reclassifi cation to Intangible assets - 14 14 - - - Reclassifi cation to Assets held for sale - 133 133 119 188 307
Depreciation and impairment at 31 December (60) (3,840) (3,900) (56) (3,194) (3,250)
Carrying amount at 31 December 121 1,934 2,055 105 1,899 2,004
Hereof carrying amount at 31 December of assets held under fi nance leases - 194 194 - 177 177
SecurityA minor part of the Group's Land and buildings and Plant and equipment in certain countries has been provided as security for the borrowings under the senior facilities, see note 34, Contingent liabilities, pledges and guarantees.
Leased plant and equipmentThe Group leases cleaning and offi ce equipment under a number of fi nance lease agreements. Some leases provide the Group with the option to purchase the equipment at a benefi cial price at the end of the lease term. The leased equipment secures lease obligations.
In 2010, additions included assets held under fi nance leases of DKK 101 million (2009: DKK 114 million).
NOTE 17 PROPERTY, PLANT AND EQUIPMENT
104 Annual Report 2010

The Group’s share
DKK million Country Revenue
Operat-ing
profi tNet
result AssetsLiabili-
tiesOwner-ship % Equity
Netresult
2010NSB Trafi kservice AS Norway 85 5 3 38 30 45 4 2 ISS Industriservice AB 1) Sweden 286 19 12 - - 48 - 6 Other associates - 130 11 8 25 18 - 5 2
Carrying amount at 31 December 501 35 23 63 48 9 10
The Group’s share
DKK million Country Revenue
Operat-ing
profi tNet
result AssetsLiabili-
tiesOwner-ship % Equity
Netresult
2009NSB Trafi kservice AS Norway 70 2 1 35 30 45 2 1 ISS Industriservice AB Sweden 238 4 1 105 74 48 15 1 Other associates - 121 12 9 19 14 - 4 2
Carrying amount at 31 December 429 18 11 159 118 21 4
1) As per 31 December 2010 ISS Industriservice AB was reclassifi ed to Assets held for sale.
NOTE 18 INVESTMENTS IN ASSOCIATES
DKK million 2010 2009
Cost at 1 January 16 21 Foreign exchange adjustments 1 1 Disposals (0) (0)Reclassifi cation to Assets held for sale (10) (6)
Cost at 31 December 7 16
Revaluation at 1 January 5 3 Foreign exchange adjustments 1 1 Net result for the year 10 4 Dividends received 0 (5)Additions 1 - Disposals (2) (0)Reclassifi cation to Assets held for sale (13) 2
Revaluation at 31 December 2 5
Carrying amount at 31 December 9 21
Consolidated fi nancial statements 105

Deferred tax specifi cation2010 2009
DKK million
Deferred tax
assets
Deferred tax
liabilities
Deferred tax
assets
Deferred tax
liabilities
Tax losses carried forward 425 - 422 - Goodwill 29 413 59 301 Brands - 452 - 443 Customer contracts - 1,429 - 1,608 Property, plant and equipment 222 202 122 179 Provisions 196 - 114 - Issued bonds - 3 - 5 Tax losses in foreign subsidiaries under Danish joint taxation - 23 - 23 Set-off within legal tax units and jurisdictions (217) (217) (203) (203)
Deferred tax 655 2,305 514 2,356
Deferred tax assets relating to tax losses carried forward are only recognised to the extent that it is more likely than not that future taxable profi t will be available against which the unused tax losses can be utilised in the foreseeable future. Management's assessment is based on relevant information available at the reporting date, including internal budgets and estimates, taking into account any restrictions in utilisation in the local tax legislation.
Deferred tax on temporary differences relating to investments in subsidiaries, joint ventures and associates amounts to DKK 0 million (2009: DKK 0 million).
NOTE 19 DEFERRED TAX
DKK million 2010 2009
Deferred tax liabilities/(assets), net at 1 January 1,842 2,026 Foreign exchange adjustments 69 89 Additions from acquisition of businesses 7 17 Tax on other comprehensive income (36) (4)Reclassifi cation to Assets held for sale (20) 52 Tax on profi t before impairment/amortisation of intangibles 1) 32 23 Tax effect of impairment/amortisation of intangibles 1) (244) (361)
Deferred tax liabilities/(assets), net at 31 December 1,650 1,842
Recognised in the statement of fi nancial position as follows:Deferred tax liabilities 2,305 2,356 Deferred tax assets (655) (514)
Deferred tax liabilities/(assets), net 1,650 1,842
1) In this context intangibles comprise the value of goodwill, brands and customer contracts.
106 Annual Report 2010

NOTE 20 OTHER FINANCIAL ASSETS
DKK million 2010 2009
Deposits 152 157 Regulatory long-term loans 64 54 Other 74 65
Other fi nancial assets 290 276
Deposits comprise deposits related to rent, security and juridical deposits mainly relating to legal and tax cases.
NOTE 21 INVENTORIES
DKK million 2010 2009
Raw materials and supplies 136 136 Finished goods 182 167
Inventories 318 303
Inventories expensed as consumables 6,359 6,044
Unrecognised deferred tax assetsThe Group had unrecognised deferred tax assets regarding tax losses carried forward in the following countries:
2010 2009
DKK million Total Recog-
nised Unrecog-
nised Total Recog-
nised Unrecog-
nised
Germany 332 5 327 297 57 240 Denmark 2 - 2 113 111 2 France 222 191 31 61 61 - Brazil 47 - 47 51 4 47 Belgium 14 - 14 30 19 11 Israel 20 12 8 15 3 12 Austria 6 6 - 9 - 9 USA 30 29 1 8 8 - Argentina 6 4 2 4 2 2 Hong Kong 4 2 2 3 1 2 Greece 6 5 1 2 1 1 New Zealand 2 2 - 1 1 - Italy - - - 1 - 1 United Kingdom 10 7 3 - - -
Total 438 327
The unrecognised tax losses can be carried forward indefi nitely in the individual countries except for the USA (20 years) and Argentina, Greece and Italy (5 years). Deferred tax assets have not been recognised in respect of the above unrecognised tax losses because it is not probable that future taxable profi t will be available against which the Group can utilise these benefi ts thereon.
NOTE 19 DEFERRED TAX (CONTINUED)
Consolidated fi nancial statements 107

NOTE 23 CONTRACT WORK IN PROGRESS
DKK million 2010 2009
Contract costs 588 512 Recognised profi ts (less recognised losses) 89 105
Contract work in progress, gross 677 617
Progress billings (575) (422)
Contract work in progress, net 102 195
Contract work in progress, net, comprise the following assets and liabilities:Contract work in progress (assets) 125 195 Contract work in progress (liabilities) 23 -
Contract work in progress, net 102 195
Advances from customers 4 -
Retentions 3 -
Contract work in progress (liabilities) are recognised as part of Other liabilities, see note 32, Other liabilities.
Advances from customers is included in Other liabilities in the line Prepayments from customers, see note 32, Other liabilities.
NOTE 22 TRADE RECEIVABLES
DKK million 2010 2009
Trade receivables, gross 11,137 10,371 Impairment losses (241) (241)
Trade receivables 10,896 10,130
The Group's exposure to credit risk and impairment losses related to trade receivables is disclosed in note 36, Financial risk management.
SecuritisationAs part of the refi nancing of the EMTNs that matured in September 2010, the Group has during 2009 and 2010 launched a securitisation programme in 10 major countries. Under the securitisation programme securitised trade receivables of the participating countries are provided as security for the securitisation debt (bank loans). The securitised trade receivables continue to be recognised in the Group's statement of fi nancial position as the credit risk and rewards remain with the Group.
As at 31 December 2010, trade receivables of DKK 4,863 million (2009: DKK 2,267 million) recognised in the statement of fi nancial position have been provided as security for securitisation debt with a face value of DKK 2,466 million (2009: DKK 937 million).
108 Annual Report 2010

NOTE 25 OTHER RECEIVABLES
DKK million 2010 2009
Outlays for customers 57 36 Receivable social insurance costs 54 55 Receivable training subvention 32 - Costs related to PPP (Public Private Partnerships)/PFI (Private Finance Initiative) contracts 5 5 Receivable divestment proceeds 2 210 Receivable from ISS Equity A/S - 12 Other 198 233
Other receivables 348 551
Receivable divestment proceeds According to the Senior Facility Agreement the use of proceeds from divestments is subject to restrictions. Consequently, divestment proceeds may only be used for acquisition of businesses or repayment of loans and borrowings. It is management's intention to use the proceeds from the receivable sales price of DKK 2 million for acquisition of businesses.
Receivable from ISS Equity A/S related to a joint taxation scheme with Danish resident companies within the ISS Group. ISS Equity A/S has been merged with it's sole shareholder FS Invest II S.à r.l as at 22 December 2010 and consequently is no longer part of the joint taxation scheme at 31 December 2010.
Other comprise various receivables such as employee receivables and certain contract costs etc.
NOTE 24 TAX RECEIVABLES AND TAX PAYABLES
DKK million 2010 2009
Tax (receivables)/payables, net at 1 January (2) (105)Foreign exchange adjustments (44) (57)Additions from acquired companies, net 9 2 Adjustment relating to prior years, net (41) 23 Tax on profi t before impairment/amortisation of intangibles 1) 769 542 Tax on other comprehensive income 30 2 Joint taxation contribution 1 (15)Tax paid (697) (394)
Tax (receivables)/payables, net at 31 December 25 (2)
Recognised in the statement of fi nancial position as follows:Tax payables 411 306 Tax receivables (386) (308)
Tax (receivables)/payables, net 25 (2)
1) In this context intangibles comprise the value of goodwill, brands and customer contracts.
Consolidated fi nancial statements 109

NOTE 27 ASSETS AND LIABILITIES HELD FOR SALE
DKK million 2010 2009
Goodwill 355 15 Other intangibles 28 58 Property, plant and equipment 74 218 Other fi nancial assets 23 8 Deferred tax assets - 64 Inventories 8 2 Trade and other receivables 336 249
Assets held for sale 824 614
Deferred tax liabilities 20 12 Pensions and similar obligations - 14 Provisions 4 64 Loans and borrowings 0 11 Trade payables and other liabilities 231 278
Liabilities related to assets held for sale 255 379
At 31 December 2010, sales processes have been initiated for two non-core activities in Western Europe, which have been classifi ed as held for sale. The assets and liabilities of these activities have been reclassifi ed and are presented separately in the statement of fi nancial position at the lower of the carrying amount at the date of the classifi cation as held for sale and fair value less costs to sell. No impairment losses were recognised in connection with the reclassifi cation.
The businesses classifi ed as held for sale at 31 December 2009 have been divested during 2010. The divestments comprised the waste management activities and the security activities in France, the industry service activities in Norway and a part of the building maintenance activities in Spain and resulted in a loss of DKK 177 million in addition to the impairment loss recognised in 2009 in connection with classifying the businesses as held for sale. The additional impairment loss of DKK 177 million has been recognised in Other income and expenses, net, see note 8, Other income and expenses, net.
NOTE 26 SECURITIES, CASH AND CASH EQUIVALENTS
2010 2009
Carrying amount
(DKK million)
Average effective interest
rate
Average duration
(years)
Carrying amount
(DKK million)
Average effective interest
rate
Average duration
(years)
Investment funds 19 14.1% - 12 29.0% - Bonds - - - 85 4.0% 0.9
Securities 19 97
Cash and cash equivalents 3,606 1.3% 3,364 1.0%
Investment funds comprise investments in various listed securities related to an employee scheme in the USA. The funds are managed by ISS but restricted from general use.
Bonds mainly consisted of listed Danish government bonds.
Cash and cash equivalents included DKK 936 million (2009: DKK 507 million) held by the Group's consolidated SPEs handling the Group's securitisation programme whereof DKK 161 million (2009: DKK 157 million) was not considered readily available for general use by the parent company or other subsidiaries. In addition DKK 30 million (2009: DKK 62 million) of the total cash position at 31 December 2010 was placed on blocked or restricted bank accounts due to legal circumstances.
110 Annual Report 2010

NOTE 29 LOANS AND BORROWINGS
This note provides information about the Group's interest-bearing loans and borrowings, which are measured at amortised cost. For more information about the Group's exposure to interest rate, foreign currency and liquidity risk, see note 36, Financial risk management.
DKK million 2010 2009
Issued bonds 8,766 10,315 Bank loans 22,760 22,594 Securitisation 2,401 892 Finance lease liabilities 182 208 Interest rate swaps 135 256 Debt to ISS Equity A/S 1) - 94
Total loans and borrowings 34,244 34,359
Loans and borrowings are recognised in the statement of fi nancial position as follows:Non-current liabilities 29,032 28,649 Current liabilities 5,212 5,710
Total loans and borrowings 34,244 34,359
The fair value of loans and borrowings is disclosed in note 33, Financial assets and liabilities.
In 2010, fi nancing fees amounting to DKK 49 million (2009: DKK 304 million) have been recognised in loans and borrowings while accumulated fi nancing fees recognised in loans and borrowings on 31 December 2010 amounted to DKK 430 million (2009: DKK 504 million).
In 2010 and 2009, the Group had no loans and borrowings convertible into equity.
Capital market transactionsDuring 2010, the 2010 EMTNs were fully redeemed through the proceeds from the securitisation programme that was launched in 2009 in fi ve countries and further rolled out in fi ve countries in 2010. The redemption was carried out in two steps with a tender offer in January for DKK 1,116 million (EUR 150 million) and repayment of the remaining DKK 1,490 million (EUR 200 million) at maturity in September. Additionally, in March a tap bond issue under the existing subordinated notes due 2016 was completed resulting in DKK 950 million (EUR 127.5 million) being raised.
1) Debt to ISS Equity A/S in 2009 included DKK 13 million related to a joint taxation scheme with Danish resident subsidiaries. ISS Equity A/S has been merged with it's sole shareholder FS Invest II S.à r.l as at 22 December 2010 and consequently is no longer part of the joint taxation scheme at 31 December 2010.
NOTE 28 SHARE CAPITAL
2010 2009
Nominal value(DKK
million)
Number of shares (in
thousands)
Nominal value(DKK
million)
Number of shares (in
thousands)
Share capital at 1 January 100 100,000 100 100,000
Share capital at 31 December 100 100,000 100 100,000
At 31 December 2010, a total of 100,000,001 shares with a nominal value of DKK 1 per share were issued and fully paid (2009: 100,000,001 shares). No shares carry special rights. At 31 December 2010, shares were not freely transferable, as any transfer required the consent of the Board of Directors as set out in the Articles of Association. Effective 1 March 2011, the Articles of Association have been changed resulting in the shares being freely transferable.
Consolidated fi nancial statements 111

Currency profi le of loans and borrowingsThe Group's loans and borrowings are denominated in the following currencies (excluding impact from currency swaps):
2010 2009
EUR 86.7% 89.3%GBP 4.9% 4.0%DKK 2.8% 1.7%NOK 2.4% 2.3%SEK 1.8% 1.5%CHF 0.6% 0.5%Others 0.8% 0.7%
Total 100.0% 100.0%
Terms and maturity of loans and borrowings 2010 2009
DKK million
Nominal interest
rate
Average effective interest
rateInterest
rate Year of
maturityFace
valueAmount hedged
Carrying amount
Carrying amount
Issued bonds:EMTNs due 2010 4.75% 4.80% Fixed 2010 - - - 2,577 EMTNs due 2014 4.50% 5.06% Fixed 2014 823 - 742 719 Subordinated notes 2016 8.875% 9.06% Fixed 2016 4,335 - 4,259 3,300 Senior notes 2014 11.00% 11.50% Fixed 2014 3,914 - 3,765 3,718 Interest rate swaps - - - - - - - 1
Bank loans:Senior facilities: Term facility A Libor + 2.00% 3.77% Floating 2012 746 746 699 981 Term facility B Libor + 2.00% 2.81% Floating 2013 13,115 7,971 13,063 12,952 Acquisition facility A Libor + 2.25% 3.06% Floating 2012 616 600 616 985 Acquisition facility B Libor + 2.25% 3.06% Floating 2013 2,135 - 2,135 2,125 Second lien facility Euribor + 3.75% 4.61% Floating 2015 4,473 4,025 4,430 4,412 Bank loans and overdrafts - - - - 1,817 - 1,817 1,139 Securitisation Euribor + 3.00% 3.60% Floating 2011 2,466 - 2,401 892
Interest rate swaps - - - - - - 135 256 Finance lease liabilities - - - - 182 - 182 208 Debt to ISS Equity A/S - - - - - - - 94
Loans and borrowings 5.01% 34,622 34,244 34,359
NOTE 29 LOANS AND BORROWINGS (CONTINUED)
112 Annual Report 2010

Finance lease liabilitiesFinance lease liabilities are payable as follows:
2010 2009
DKK million
Minimum lease
payments Interest Principal
Minimum lease
payments Interest Principal
Within 1 year 80 (6) 74 100 (7) 93 1-5 years 118 (10) 108 120 (7) 113 After 5 years 0 (0) 0 2 (0) 2
Total 198 (16) 182 222 (14) 208
The lease arrangements are described in note 17, Property, plant and equipment where the carrying amount of assets held under fi nance leases is also disclosed.
Maturity profi le of loans and borrowings The contractual maturities of loans and borrowings based on undiscounted contractual cash fl ows, including interest payments, estimated based on expectations at the reporting date, are shown below:
DKK millionCarrying amount
Contractual cash fl ows < 1 year 1-2 years 2-3 years 3-4 years 4-5 years > 5 years
2010Issued bonds 8,766 12,772 852 852 852 5,352 386 4,478 Other loans and borrowings 25,343 28,465 6,065 1,437 16,008 317 4,638 -
Total loans and borrowings excluding derivatives 34,109 41,237 6,917 2,289 16,860 5,669 5,024 4,478
Hereof estimated interest payments 6,615 1,660 1,694 1,646 925 547 143
Interest rate swaps 135 135 117 18 - - - -
Total derivatives 135 135 117 18 - - - -
2009Issued bonds 10,315 14,720 3,371 767 767 767 5,258 3,790 Other loans and borrowings 23,788 26,276 3,888 1,584 1,703 16,124 338 4,639
Total loans and borrowings excluding derivatives 34,103 40,996 7,259 2,351 2,470 16,891 5,596 8,429
Hereof estimated interest payments 8,274 1,584 1,700 1,832 1,705 867 586
Interest rate swaps 256 256 224 21 11 - - -
Total derivatives 256 256 224 21 11 - - -
NOTE 29 LOANS AND BORROWINGS (CONTINUED)
Consolidated fi nancial statements 113

NOTE 30 PENSIONS AND SIMILAR OBLIGATIONS
The Group contributes to defi ned contribution plans as well as defi ned benefi t plans. The majority of the pension plans are funded through payments of annual premiums to independent insurance companies responsible for the pension obligation towards the employees (defi ned contribution plans). In these plans the Group has no legal or constructive obligation to pay further contributions irrespective of the funding by these insurance companies. Pension costs related to such plans are recognised as expenses when incurred.
In some countries, most signifi cantly, the Netherlands, Sweden, Switzerland, France, Germany, Norway and the United Kingdom, the Group has pension schemes where the actuarially determined pension obligations are recognised in the statement of fi nancial position (defi ned benefi t plans). The defi ned benefi t plans are primarily based on years of service, and benefi ts are generally determined on the basis of salary and rank. The majority of the obligations are funded, but in some countries, mainly Sweden and France, the obligation is unfunded.
The Group’s liabilities and pension costs under defi ned benefi t plans may be signifi cantly affected by changes in the discount rate, the expected return on plan assets, the social security rate, the rate of increase in salaries and pension contributions, changes in demographic variables or other events and circumstances. Furthermore, there is a risk that changes to local legislation will entail that pension plans are reclassifi ed from defi ned contribution plans to defi ned benefi t plans, requiring the Group to recognise a provision.
In certain countries the Group participates in multi-employer pension schemes. The funds are currently not able to provide the necessary information in order for the Group to account for the schemes as defi ned benefi t plans. The pension schemes are therefore accounted for as defi ned contribution plans with pension costs being expensed as incurred and recognised in Staff costs, see note 5, Staff costs. There is a risk that the plans are not suffi ciently funded. However, information on surplus or defi cit in the schemes is not available.
Recognised in the statement of fi nancial positionDKK million 2010 2009
Present value of funded obligations 3,835 3,171 Fair value of plan assets (3,435) (2,877)
Funded obligations, net 400 294 Present value of unfunded obligations 557 487 Unrecognised past service costs (5) (3)Accumulated impact from asset ceiling 21 1 Reclassifi cation to Liabilities related to assets held for sale - (14)
Recognised in the statement of fi nancial position for defi ned benefi t obligations 973 765 Other long-term employee benefi ts 80 72
Pensions and similar obligations at 31 December 1,053 837
Specifi cation of defi ned benefi t obligations:Present value of funded obligations 3,835 3,171 Present value of unfunded obligations 557 487
Defi ned benefi t obligations at 31 December 4,392 3,658
Movement in defi ned benefi t obligations (funded and unfunded):Present value of obligations at 1 January 3,658 3,338 Foreign exchange adjustments 471 48 Reclassifi cations from Other long-term employee benefi ts 12 2 Additions from new contracts 44 - Additions from acquisition of businesses - 8 Disposals related to divestment of businesses (15) - Interest on obligation 159 153 Current service costs 137 117 Benefi ts paid (360) (315)Employee contributions 89 81 Actuarial (gains)/losses 207 224 Recognised past service costs 12 11 Liabilities extinguished on settlements and curtailments (22) (9)
Present value of obligations at 31 December 4,392 3,658
114 Annual Report 2010

Recognised in the income statementDKK million 2010 2009
Current service costs 137 117 Interest on obligation 159 153 Expected return on plan assets (124) (124)Recognised past service costs, net 11 7 Gains on curtailments and settlements, net (11) (3)
Recognised in the income statement as Staff costs 172 150
Losses on settlements related to restructuring projects - 4
Recognised in the income statement as Other expenses - 4
NOTE 30 PENSIONS AND SIMILAR OBLIGATIONS (CONTINUED)
Recognised in the statement of fi nancial position (continued)DKK million 2010 2009
Movement in fair value of plan assets:Fair value of plan assets at 1 January 2,877 2,591 Foreign exchange adjustments 391 30 Reclassifi cations (3) 3 Additions from new contracts 33 - Expected return on plan assets 124 124 Actuarial gains/(losses) 78 179 Assets distributed on settlements (9) (10)Employee contributions 89 81 Employer contributions 132 121 Benefi ts paid (277) (242)
Fair value of plan assets at 31 December 3,435 2,877
Realised return on plan assets:Expected return on plan assets 124 124 Actuarial gains/(losses) 78 179
Realised return on plan assets at 31 December 202 303
Major categories of plan assets (% of total plan assets):Bonds 59% 58%Equities 26% 26%Property 6% 6%Cash 1% 1%Other 8% 9%
Total 100% 100%
The Group expects to contribute DKK 196 million to its defi ned benefi t plans in 2011.
Consolidated fi nancial statements 115

NOTE 30 PENSIONS AND SIMILAR OBLIGATIONS (CONTINUED)
Recognised in the statement of comprehensive incomeDKK million 2010 2009
Cumulative (gains)/losses recognised in the statement of comprehensive income at 1 January 149 122 Actuarial (gains)/losses during the year 129 45 Impact from asset ceiling 20 (18)
Cumulative (gains)/losses recognised in the statement of comprehensive income at 31 December 298 149
Hereof accumulated actuarial (gains)/losses 277 148
Actuarial assumptionsActuarial calculations and valuations are performed annually for all major defi ned benefi t plans. The actuarial assumptions vary from country to country due to local conditions. The range of actuarial assumptions used is as follows:
EUR CHF Other currencies
2010 2009 2010 2009 2010 2009
Discount rates at 31 December 4.3-4.6% 5.2-5.5% 2.9% 3.3% 1.7-11.0% 1.7-11.0%Expected return on plan assets at 31 December 3.0-4.7% 2.7-5.2% 2.8% 3.0% 2.0-6.8% 1.7-8.0%Future salary increases 1.8-2.0% 1.8-2.3% 2.0% 2.0% 0.0-10.0% 0.0-10.3%Future pension increases 1.8-2.0% 1.8-2.3% 0.0% 0.0% 0.0-3.2% 0.0-4.8%
Discount rates are based on the market yield of high quality corporate bonds or government bonds with a maturity approximating to the terms of the defi ned benefi t obligations. Switzerland represents 56% of the gross obligation (2009: 54%) while the euro countries represents 23% of the gross obligation (2009: 23%).
Expected return on plan assets is based on the plan asset portfolio and general expectations to the economic development.
Historical information DKK million 2010 2009 2008 2007 2006
Present value of obligations (funded and unfunded) 4,392 3,658 3,338 3,244 3,446 Fair value of plan assets (3,435) (2,877) (2,591) (2,617) (2,606)Unrecognised past service costs (5) (3) 1 1 1 Asset ceiling 21 1 14 44 3 Reclassifi cation to Liabilities related to assets held for sale - (14) - - -
Net obligations at 31 December 973 765 762 672 844
Actuarial (gains)/losses on obligations 207 224 (244) (200) (59)Actuarial gains/(losses) on plan assets 78 179 (426) (48) (13)
Actuarial (gains)/losses during the year 129 45 182 (152) (46)
Cumulative actuarial (gains)/losses at 31 December 277 148 103 (79) 73
116 Annual Report 2010

NOTE 31 PROVISIONS
DKK millionLegal cases
Self-insurance
Acquisition and inte -
gration costs
Contingent liabilities
in acquisi-tions Other Total
2010Provisions at 1 January 223 200 26 93 260 802 Foreign exchange adjustments 10 14 2 3 13 42 Unwind of discount 7 6 - - - 13 Reclassifi cation to Liabilities related to assets held for sale - - - - (4) (4)Reclassifi cation (to)/from Other liabilities 4 - (0) - (1) 3 Additions from acquisition of businesses - - - - (0) (0)Provisions made during the year 60 188 10 - 128 386 Provisions used during the year (53) (217) (28) (1) (85) (384)Provisions reversed during the year (49) - - (4) (65) (118)
Provisions at 31 December 202 191 10 91 246 740
Current 121 62 10 - 186 379 Non-current 81 129 0 91 60 361
202 191 10 91 246 740
2009Provisions at 1 January 176 166 45 45 400 832 Foreign exchange adjustments 7 6 2 0 9 24 Reclassifi cation to Liabilities related to assets held for sale (3) - - - (61) (64) Reclassifi cation between categories and (to)/from Other liabilities (1) 4 1 34 (15) 23 Additions from acquisition of businesses 2 - - 14 17 33 Provisions made during the year (included in the income statement) 95 124 46 - 100 365 Provisions made during the year (included in goodwill) - - 27 - - 27 Provisions used during the year (39) (99) (95) - (148) (381)Provisions reversed during the year (14) (1) (0) - (42) (57)
Provisions at 31 December 223 200 26 93 260 802
Current 126 74 26 - 197 423 Non-current 97 126 0 93 63 379
223 200 26 93 260 802
Consolidated fi nancial statements 117

NOTE 32 OTHER LIABILITIES
DKK million 2010 2009
Accrued wages and holiday allowances 4,913 4,332 Tax withholdings, VAT etc. 3,181 3,069 Prepayments from customers 480 440 Contract work in progress (liabilities) 23 - Currency swaps 4 31 Other payables and accrued expenses 2,345 2,606
Other liabilities 10,946 10,478
Other payables and accrued expenses primarily comprise accrued expenses, accrued interests, contingent consideration (earn-outs) and deferred payments regarding acquisitions.
Legal cases The provision comprises various obligations in relation to a number of legal and labour-related cases in certain countries. The provisions are measured based on management's assessment of the amount by which the obligation is expected to be redeemed. Legal advice and established precedence is taken into consideration when assessing the obligation.
Self-insurance In Australia, Ireland, the USA and the United Kingdom, the Group carries insurance provisions on employers' liability. Ireland and the United Kingdom are self-insured up to a yearly limit of DKK 21 million (DKK 20 million in 2009) for employers' liability. The USA is self-insured up to a limit of DKK 1.4 million per claim (DKK 1.3 million in 2009). Australia is self-insured up to a limit of DKK 2.8 million per claim (DKK 2.3 million in 2009). Generally, the provisions for self-insurance are based on valuations from external actuaries.
During 2010, the ISS captive insurance company Global Insurance A/S, which had carried part of the risk on the third party liability programme, has transferred its insurance cases to an external insurance company except for a liability of DKK 12.9 million, which has been taken over by ISS Finans A/S.
Acquisition and integration costs The provision includes obligations incurred in the normal course of acquisitions mainly related to transaction costs, redundancy payments and termination of rental of properties.
Contingent liabilities in acquisitions The provision relates to contingent liabilities assumed in connection with acquisitions and relates mainly to legal cases.
Other The provision comprises various other obligations incurred in the course of business, e.g. restructuring costs, guarantee reserves, dismantling costs, operational issues, closure of contracts and costs of meeting obligations under onerous contracts.
NOTE 31 PROVISIONS (CONTINUED)
118 Annual Report 2010

NOTE 33 FINANCIAL ASSETS AND LIABILITIES
The fair values of fi nancial assets and liabilities, together with the carrying amounts in the statement of fi nancial position, are shown below:
2010 2009
DKK million NoteCarrying amount
Fair value
Carrying amount
Fair value
Securities (fair value option) 26 19 19 97 97 Derivative fi nancial instruments (currency swaps) 37 7 7 0 0
Financial assets designated as fair value through profi t or loss 26 26 97 97
Derivative fi nancial instruments designated as cash fl ow hedge 37 1 1 - -
Financial assets used for hedging 1 1 - -
Trade receivables 22 10,896 10,896 10,130 10,130 Other receivables 25 2 2 210 210 Cash and cash equivalents 26 3,606 3,606 3,364 3,364 Other fi nancial assets 20 290 290 281 281
Loans and receivables 14,794 14,794 13,985 13,985
Derivative fi nancial instruments (currency swaps) 37 11 11 31 31
Financial liabilities designated as fair value through profi t or loss 11 11 31 31
Derivative fi nancial instruments designated as cash fl ow hedge 37 136 136 256 256
Financial liabilities used for hedging 136 136 256 256
Issued bonds 29 8,766 9,609 10,315 10,779 Bank loans including securitisation 29 25,161 25,368 23,486 23,723 Finance lease liabilities 29 182 182 208 208 Debt to ISS Equity A/S 29 - - 94 94 Trade payables 2,830 2,830 2,624 2,624 Other liabilities 32 239 239 404 404
Financial liabilities measured at amortised cost 37,178 38,228 37,131 37,832
Consolidated fi nancial statements 119

NOTE 33 FINANCIAL ASSETS AND LIABILITIES (CONTINUED)
Methods, assumptions and techniques used to determine fair value Fair value measurements are classifi ed by using a fair value hierarchy that refl ects the signifi cance of the inputs used in making the measurements. The fair value hierarchy has the following levels:
Level 1 Quoted prices (unadjusted) in active markets for identical assets or liabilities.
Level 2 Inputs other than quoted prices included within Level 1 that are observable for the asset or liability, either directly (i.e. as prices) or indirectly (i.e. derived from prices).
Level 3 Inputs for the asset or liability that are not based on observable market data (unobservable inputs).
The methods, assumptions and techniques used in determining the fair values of each category of fi nancial assets and fi nancial liabilities is disclosed below. The methods are unchanged compared with 2009. Furthermore, the level in the fair value hierarchy within which the fair value measurement is categorised is disclosed.
Securities comprise investment funds related to investments in various listed securities measured at fair value through the income statement. The fair value is determined by reference to their quoted prices at the reporting date (Level 1).
Derivative fi nancial instruments comprise currency swaps and interest rate swaps. The fair value of derivative fi nancial instruments is determined on the basis of observable market data using generally accepted methods. The fair value of interest rate swaps is based on market rates for yield curves (Level 2). The fair value of currency swaps is based on the difference between the purchase price and the price at the reporting date (Level 2).
Loans and receivables mainly comprise trade receivables and cash and cash equivalents and are measured at amortised cost in the statement of fi nancial position. The carrying amount of loans and receivables approximates their fair values.
Other fi nancial liabilities including issued bonds, bank loans, fi nance lease liabilities, trade payables and other liabilities are measured at amortised cost in the statement of fi nancial position. The note disclosure of the fair value of the issued bonds (EMTNs, subordinated notes and senior notes) is based on the quoted market price on the Luxembourg Stock Exchange (Level 1). For the remaining part of loans and borrowings fair value is equal to the nominal value (Level 2).
Fair value hierarchyThe table below analyses fi nancial instruments carried at fair value in the statement of fi nancial position by valuation method. The methods used are described above.
DKK million Level 1 Level 2 Total
2010Securities (fair value option) 19 - 19 Derivative fi nancial instruments (currency swaps) - 7 7 Derivative fi nancial instruments designated as cash fl ow hedge - 1 1
Total fi nancial assets 19 8 27
Derivative fi nancial instruments (currency swaps) - 11 11 Derivative fi nancial instruments designated as cash fl ow hedge - 136 136
Total fi nancial liabilities - 147 147
2009Securities (fair value option) 97 - 97
Total fi nancial assets 97 - 97
Derivative fi nancial instruments (currency swaps) - 31 31 Derivative fi nancial instruments designated as cash fl ow hedge - 256 256
Total fi nancial liabilities - 287 287
120 Annual Report 2010

NOTE 34 CONTINGENT LIABILITIES, PLEDGES AND GUARANTEES
Senior Facility AgreementISS A/S has executed a share pledge over its shares in ISS World Services A/S as security for the Group's senior facilities and a secondary share pledge over such shares as security for the subordinated notes issued by ISS A/S.
ISS World Services A/S, ISS Global A/S's and certain material subsidiaries of ISS Global A/S in Australia, Belgium, Denmark, Finland, France, the Netherlands, Norway, Spain, Sweden, the United Kingdom and the USA have provided guarantees for ISS Global A/S's borrowings under the senior facilities. The guarantees have been backed up by security over bank accounts, trade receivables, intra-group receivables, other receivables, properties, production equipment and intellectual property rights of ISS World Services A/S and these subsidiaries. At 31 December 2010, the aggregate values of assets provided as security for the borrowings under the senior facilities were:
DKK billion 2010 2009
Goodwill 3.8 3.4Customer contracts 0.9 0.9Intellectual property rights 1.6 1.6Other intangible and tangible assets 0.4 0.3Trade receivables 1.8 2.4Other receivables 0.3 0.2Bank accounts 1.5 1.7
Total 10.3 10.5
In addition, the shares in ISS Global A/S's material subsidiaries and shares in certain of their subsidiaries as well as shares in certain subsidiaries in Aus-tria, Brazil, the Czech Republic, Germany, Hong Kong, Ireland, Israel, Portugal, New Zealand, Singapore, Switzerland and Turkey have been pledged.
SecuritisationAs part of the refi nancing of the EMTNs that were repaid at maturity in September 2010, the Group has during 2009 and 2010 launched a se-curitisation programme in 10 major countries. Under the securitisation programme securitised trade receivables of the participating countries are provided as security for the securitisation debt. As at 31 December 2010, trade receivables of DKK 4,863 million (31 December 2009: DKK 2,267 million) have been placed as security for securitisation debt. In addition hereto DKK 936 million (31 December 2009: DKK 507 million) cash held by the Group's consolidated SPEs handling the Group's securitisation programme was pledged as security for securitisation debt. Of the total amount of cash held by the Group's SPEs DKK 161 million (2009: DKK 157 million) was not considered readily available for general use by the parent company or other subsidiaries.
Guarantee commitmentsIndemnity and guarantee commitments at 31 December 2010 amounted to DKK 574 million (31 December 2009: DKK 462 million).
Performance guarantees The Group has issued performance guarantee bonds for service contracts with an annual revenue of DKK 1,374 million (31 December 2009: DKK 1,517 million) of which DKK 1,017 million (31 December 2009: DKK 1,288 million) were bank-guaranteed performance bonds. Such performance bonds are issued in the ordinary course of business in the service industry.
Outsourcing of ITThe Group has an IT outsourcing agreement with Computer Sciences Corporation (CSC) running until 2015. The Group's contractual obligations related to the agreement at 31 December 2010 amounted to approximately DKK 25 million (31 December 2009: DKK 41 million).
DivestmentsThe Group makes provisions for claims from purchasers or other parties in connection with divestments and representations and warranties given in relation to such divestments. Management believes that provisions made at 31 December 2010 are adequate. However, there can be no assurance that one or more major claims arising out of the Group's divestment of companies will not adversely affect the Group's activities, results of operations and fi nancial position.
Legal proceedingsThe Group is party to certain legal proceedings. Management believes that these proceedings (which are to a large extent labour cases incidental to its business) will not have a material impact on the Group's fi nancial position beyond the assets and liabilities already recognised in the statement of fi nancial position at 31 December 2010.
RestructuringsRestructuring projects aiming at adjusting capacity to lower activity have been undertaken across different geographies and service areas. Labour laws especially in Europe include restrictions on dismissals and procedural rules to be followed. The procedures applied by ISS could be challenged in certain jurisdictions resulting in liabilities. Management believes that this would not have a material impact on the Group's fi nancial position beyond the assets and liabilities already recognised in the statement of fi nancial position at 31 December 2010.
Consolidated fi nancial statements 121

NOTE 35 OPERATING LEASES
Non-cancellable operating lease rentals are payable as follows:
DKK million Year 1 Year 2 Year 3 Year 4 Year 5After
5 years
Total lease
payments
At 31 December 2010 1,461 961 652 393 253 441 4,161At 31 December 2009 1,399 915 616 375 250 448 4,003
During 2010, DKK 2,134 million (DKK 2,070 million in 2009) was recognised as an expense in the income statement in respect of operating leases.
Additional future lease payments of DKK 11 million (DKK 6 million in 2009) existed regarding associates at 31 December 2010.
The Group leases a number of properties, vehicles (primarily cars) and other equipment under operating leases. The leases typically run for a period of 2-5 years, with an option to renew the lease after that date.
Leasing of cars is primarily entered under an international car fl eet lease framework agreement that was renewed effective 1 January 2011 and is valid until end 2013. The framework agreement contains a quarterly option for the Group to terminate the fl eet of an entire country or the entire fl eet under the framework agreement with four weeks notice subject to payment of a termination amount. The majority of the underlying agreements have a lifetime duration of 3-5 years.
The disclosed non-cancellable operating lease rentals assume no early termination of any agreement.
NOTE 36 FINANCIAL RISK MANAGEMENT
The Group is exposed to a number of fi nancial risks as a result of its operating activities, investing activities and fi nancing activities, mainly related to currency risk, interest rate risk, liquidity risk and credit risk.
The Group's fi nancial risks are managed centrally in Group Treasury based on policies approved by the Board of Directors. The Group'sfi nancial risk management is focused on managing risks arising from the Group's operating and fi nancing activities, mainly by use of interestrate instruments and currency instruments with the purpose of managing volatility in the Group's results. Additionally, the Group policy complies with current loan documentation, e.g. the Senior Facility Agreement and the Inter Creditor Agreement. It is not the Group's policy to take speculative positions in the fi nancial markets.
The Group has not identifi ed additional fi nancial risk exposures in 2010 compared with 2009.
Currency risk Currency risk is the risk that changes in exchange rates will affect the Group's result or value of its holdings of fi nancial instruments. The service industry is characterised by a relatively low level of transaction risk (operational risk), since the services are produced, delivered and invoiced in the same local currency with minimal exposure from imported components. However, with worldwide operations, business is conducted in a variety of currencies. Since a signifi cant portion of the Group's revenue and operating profi t is generated in foreign entities, the Group is exposed to currency risk relating to the translation into Danish kroner of income statements and net assets of foreign subsidiaries (translation risk). Furthermore, the Group has a currency risk on loans and borrowings, which are predominantly denominated in other currencies than Danish kroner (fi nancial risk).
Currency exposure related to loans and borrowings (fi nancial risk)To a limited extent the Group is exposed to currency risk on loans and borrowings that are denominated in a currency other than the Group's functional currency. The currency profi le of the Group's current and non-current loans and borrowings (excluding impact from currency swaps) is shown below:
2010 2009
EUR 86.7% 89.3%GBP 4.9% 4.0%DKK 2.8% 1.7%NOK 2.4% 2.3%SEK 1.8% 1.5%CHF 0.6% 0.5%Others 0.8% 0.7%
Total 100.0% 100.0%
122 Annual Report 2010

NOTE 36 FINANCIAL RISK MANAGEMENT (CONTINUED)
As 87% of the Group's loans and borrowings are denominated in EUR the Group is exposed primarily to EUR, but also to GBP, NOK, SEK and CHF. Furthermore, the Group has a currency risk to the extent that its interest payments with respect to loans and borrowings are not denominated in the same currencies as the Group's revenue.
The Group's overall policy is to fully hedge any foreign exchange exposure towards Danish kroner or towards Euro to the extent that the net exposure exceeds DKK 5 million. However, certain currencies cannot be hedged within a reasonable price range, e.g. BRL, CLP, IDR and ISK and are therefore not hedged. Based on a risk assessment Group Treasury may choose not to hedge the risk exposure towards Euro although exceeding DKK 5 million.
All hedging is conducted at Group level. No hedging transactions are made by local subsidiaries. The Group uses currency swaps to hedge the currency risk related to loans and borrowings as well as intercompany loans from the parent company to foreign subsidiaries. Group Treasury measures the Group's total currency exposure in different currencies on a weekly basis in order to evaluate the need for hedging currency positions. When measuring the currency positions all loans and borrowings, intercompany balances and cash and cash equivalents are taken into account. As fair value adjustments of both the hedged item and the derivative fi nancial instrument are recognised in the income statement, hedge accounting in accordance with IAS 39 is not applied.
It is not Group policy to hedge the currency exposure on foreign investments. Consequently, no hedging transactions of net investments in foreign subsidiaries were entered in 2010 and 2009. However, the Group may choose to hedge the currency exposure on foreign investments by funding such investments in local currencies.
Sensitivity analysis At 31 December 2010 the most signifi cant exposure to currency risk was the net exposure to EUR of DKK 16,253 million. A strengthening of the EUR of 1% against DKK would have impacted the income statement and other comprehensive income negatively by DKK 163 million. This analysis is based on foreign currency exchange rate variances that the Group considered to be reasonably possible at the reporting date. The analysis assumes that all other variables, in particular interest rates, remain constant and ignores any impact of forecasted sales and purchases. Furthermore, the effect of hedging instruments is taken into account.
Translation and operational riskThe Group is exposed to a relatively low level of transaction risk, since the services are produced, delivered and invoiced in the same local currency with minimal exposure from imported components. The Group is however exposed to risk in relation to translation into Danish kroner of income statements and net assets of foreign subsidiaries, including intercompany items such as loans, royalties, management fees and interest payments between entities with different functional currencies since a signifi cant portion of the Group's revenue and operating profi t is generated in foreign entities.
In 2010, the currencies in which the Group's revenue was denominated increased with an average of 5.0% (2009: decreased with 2.8%) relative to Danish kroner, increasing the Group's revenue by DKK 3,423 million (2009: a decrease of DKK 1,877 million). Currency movements increased the Group's operating profi t before other items by DKK 241 million (2009: a decrease of DKK 126 million). The effect of the translation of net assets in foreign subsidiaries increased other comprehensive income by DKK 911 million (2009: a decrease of DKK 364 million).
Sensitivity analysis A 5% change in foreign exchange rates of the Group's main currencies would have impacted revenue, operating profi t before other items and other comprehensive income by the amounts shown below. The analysis assumes that all other variables, in particular interest rates, remain constant and ignores any impact of forecasted sales and purchases. The analysis is prepared on the same basis for 2009.
2010 2009
DKK million Revenue
Operating profi t
before other items
Net assets in foreign
subsidiaries Revenue
Operating profi t
before other items
Net assets in foreign
subsidiaries
EUR 1,482 80 336 1,522 76 385 CHF 143 14 78 132 11 64 GBP 368 25 114 347 24 100 NOK 284 19 43 262 21 39 SEK 195 14 40 177 11 26 AUD 229 15 35 171 12 27 USD 131 7 24 126 7 22 Other 683 46 199 523 35 142
Total 3,515 220 869 3,260 197 805
Consolidated fi nancial statements 123

NOTE 36 FINANCIAL RISK MANAGEMENT (CONTINUED)
Interest rate risk Interest rate risk arises from the possibility that changes in interest rates will affect future cash fl ows or the fair value of fi nancial instruments, primarily bank loans and issued bonds. The Group's exposure towards interest rates is illustrated in note 29, Loans and borrowings, where a breakdown of the Group's loans and borrowings in fl oating and fi xed rates is provided. The interest rate exposure to fl oating interest rates is primarily in EUR, but also to a limited extent to GBP and the nordic currencies via securitisation.
It is Group policy to hedge the risk related to changes in interest rates to limit the negative economic effect of changes in interest rates by converting variable interest rates to fi xed interest rates. The Group will mitigate the net interest rate risk via interest rate swaps. Additionally, it is the Group's policy to ensure a predefi ned amount of debt to fi xed interest rates to avoid adverse movements in fl oating rates and interest expenses.
According to the Senior Facility Agreement at least 50% of the Group's total non-current bank loans and bonds must carry fi xed interest rates. At least on a monthly basis Group Treasury measures the balance between fi xed and variable interest rates to ensure compliance with the policy.
The Group uses cash fl ow hedge accounting in respect of interest rate derivatives. The interest rate contracts classifi ed as hedge transactions including the effect on other comprehensive income are disclosed in note 37, Derivatives.
Sensitivity analysis The interest rate risk is measured by the duration of the net debt (fi xed-rate period). As at 31 December 2010, the duration of net debt was approximately 1.6 years (31 December 2009: 2.2 years). A decrease in interest rates will increase the fair value of the loans and borrowings with a fi xed interest rate, but only part of this increase will be refl ected in the income statement and other comprehensive income as loans and borrowings are measured at amortised cost and therefore not adjusted to fair value.
It is estimated that a general increase in relevant interest rates of 1%-point would have increased/(decreased) profi t for the year and other comprehensive income by the amounts shown below. The estimate is based on net debt adjusted for the effect of hedging instruments as at 31 December 2010. The analysis assumes that all other variables, in particular foreign currency rates, remain constant. The analysis is performed on the same basis for 2009.
2010 2009
DKK millionIncome
statement
Other com-prehensive
incomeIncome
statement
Other com-prehensive
income
Loans and borrowings (84) (84) (91) (91)Derivatives, interest rate swaps - 83 - 215
Liquidity riskLiquidity risk results from the Group's potential inability or diffi culty in meeting the contractual obligations associated with its fi nancial liabilities due to insuffi cient liquidity. Raising capital and investment of liquidity to the extent relevant is managed centrally in Group Treasury. The goal is to ensure effi cient liquidity management, which mainly comprise ensuring that adequate liquidity is available. Group Treasury mitigates liquidity risk by obtaining borrowing facilities with highly rated fi nancial institutions, via issued bonds, bank loans and securitisation and via effective working capital management.
For day-to-day liquidity management cash pools have been established in several local entities. As a result excess liquidity is transferred to and from ISS Global A/S, which operates as the internal bank of the ISS Group.
The Group's liquid reserves mainly consist of liquid funds and unused credit facilities. As at 31 December 2010, the Group's liquid reservesconsisted of readily available liquid funds of DKK 3,415 million (2009: DKK 3,145 million) and unused revolving credit facilities of DKK 551 million (2009: DKK 418 million) available for drawing until 30 June 2012. It is the Group's policy to maintain an appropriate level of liquid reserve. Cash in the Group's consolidated SPEs under the securitisation programme amounts to DKK 936 million (2009: DKK 507 million), of which DKK 161 million (2009: DKK 157 million) are excluded from the liquid reserves as they are not considered readily available for general use by the parent company or other subsidiaries.
The bank loans, subordinated notes and senior notes are subject to customary undertakings, covenants (including fi nancial covenants) and other restrictions. Financial covenants comprise the following: i) Debt cover ii) Senior debt cover, iii) Cash fl ow cover, iv) Interest cover and v) Limitation on Capex spending. The fi nancial covenants are calculated on a last-twelve-months basis and reported quarterly, except for ii) and v), which are only reported at year-end. In the event of a default under those agreements, the debt incurred including accrued interest could be declared immediately due and payable. In 2010 and 2009, all covenants have been complied with.
124 Annual Report 2010

NOTE 36 FINANCIAL RISK MANAGEMENT (CONTINUED)
For a breakdown of the contractual maturities based on contractual cash fl ows (i.e. including estimated interest payments) of the Group's loans and borrowings, see note 29, Loans and borrowings. The charts below also illustrate the maturity profi le and commitment curve of issued bonds and bank loans. Compared with the specifi cation in note 29, the basis of the presentation below is different in two areas; 1) expected interest payments are not included and 2) securitisation debt is presented with maturity in September 2012 as the facility is committed until then. This is contrary to the recognition in the statement of fi nancial position, where securitisation debt is classifi ed as current due to the terms of the agreement. The presentation below is based on the assumption that the amount of trade receivables entered into the securitisation programme continue to be at the same level as at 31 December 2010.
Maturity profi le of nominal debt (DKK million) Commitment curve (DKK million)
During 2010, the 2010 EMTNs were fully redeemed through the proceeds from the securitisation programme that was launched in 2009 in fi ve countries and further rolled out in fi ve countries in 2010. The redemption was carried out in two steps with a tender offer in January for DKK 1,116 million (EUR 150 million) and repayment of the remaining DKK 1,490 million (EUR 200 million) at maturity in September. Following the fi nal repayment of the remaining EUR 200 million of the 2010 EMTNs ISS has committed long-term fi nancing in place.
Capital managementThe Group monitors the capital structure and evaluates the need for adjustments on an ongoing basis. The dividend policy and payment of dividends is made subject to the necessary consolidation of equity and the Group's continuing expansion. The Group seeks to reduce the fi nancial leverage on a multiple basis in terms of net debt to pro forma adjusted EBITDA 1). At 31 December 2010, the Group's net debt to proforma adjusted EBITDA was 6.04x (2009: 6.47x).
ISS A/S (the Group's parent) is a holding company, and its primary assets consist of shares in ISS World Services A/S. ISS A/S has no revenue generating operations of its own, and therefore ISS A/S’s cash fl ow and ability to service its indebtedness, will primarily depend on the operating performance and fi nancial condition of ISS World Service A/S and its operating subsidiaries, and the receipt by ISS A/S of funds from ISS World Services A/S and its subsidiaries in the form of dividends or otherwise.
Credit riskCredit risk is the risk of fi nancial loss infl icted on the Group if a counterparty to a fi nancial instrument or a customer fails to meet its contractual obligations and arises principally from the Group's transactions with fi nancial institutions (liquid funds, securities and derivatives with positive fair value) and from the Group's trade receivables from customers.
Transactions with fi nancial institutionsTo limit its exposure to credit risk it is Group policy only to enter into transactions with fi nancial institutions carrying a certain short-term credit rating assigned by Standard & Poor's (A-1 rating) or Moody's (P-1 rating). Other banks may be approved separately by Group Treasury. Group Treasury monitors credit ratings and given that the Group generally enters into transactions only with fi nancial institutions with high credit ratings, management does not expect any counterparty to fail to meet its contractual obligations.
0
5,000
10,000
15,000
20,000
25,000
30,000
35,000Senior
EMTNs
Senior notes
Subordinated notes
Second lien
Securitisation
2010 2011 2012 2013 2014 2015 2016
Senior
EMTNs
Senior notes
Subordinated notes
Second lien
Securitisation
2011 2012 2013 2014 2015 20160
2,000
4,000
6,000
8,000
10,000
12,000
14,000
16,000
DKK million 2010 2009
Maximum credit risk related to securities, cash and cash equivalents 3,625 3,461
Maximum credit risk related to derivatives 8 -
1) Pro forma information is based on unaudited fi nancial information and for informational purposes only.
Consolidated fi nancial statements 125

NOTE 36 FINANCIAL RISK MANAGEMENT (CONTINUED)
Trade receivables The Group performs ongoing credit evaluations of its customers in order to reduce the credit risk exposure. The customers' fi nancial position and the general market conditions are taken into account. The carrying amount of trade receivables recognised in the statement of fi nancial position represents the maximum credit exposure, see note 22, Trade receivables. The Group's customer portfolio is diversifi ed in terms of geography, industry sector and customer size and historically amounts written off as uncollectible have been relatively low. The Group is not exposed to credit risk related to signifi cant individual customers. Generally, the Group does not hold collateral as security for trade receivables. Impairment losses The ageing of trade receivables at the reporting date was:
2010 2009
DKK million Gross ImpairmentCarrying amount Gross Impairment
Carrying amount
Not past due 8,602 (3) 8,599 8,018 0 8,018 Past due 1 to 60 days 1,755 (2) 1,753 1,603 (3) 1,600 Past due 61 to 180 days 425 (18) 407 427 (25) 402 Past due 181 to 360 days 144 (49) 95 149 (60) 89 More than 360 days 211 (169) 42 174 (153) 21
Total 11,137 (241) 10,896 10,371 (241) 10,130
Allowance for impairment losses is recognised when objective evidence indicates that a receivable or a portfolio of receivables is impaired. Impairment losses, both individual and collective, are recorded in a separate account. The allowance is used to record impairment losses unless the Group is satisfi ed that no recovery of the amount owing is possible; at that point the amount is considered irrecoverable and is written off against the receivable directly.
The Group believes that the allowance for impairment losses at 31 December 2010 is suffi cient to cover future losses. Further, the Group believes that the unimpaired amounts that are past due are still collectible, based on historic payment behaviour and analyses of the underlying customers' creditworthiness.
The movement in the allowance for impairment losses during the year was as follows:
DKK million 2010 2009
Impairment losses at 1 January (241) (228)Foreign exchange adjustments (11) (6)Additions from acquired businesses (4) (9)Impairment loss recognised (74) (93)Impairment loss reversed 35 34 Amounts written off as uncollectible 49 58 Reclassifi cation to Assets held for sale 5 3
Impairment losses at 31 December (241) (241)
126 Annual Report 2010

NOTE 37 DERIVATIVES
As described in the note 36, Financial risk management, the Group uses derivative fi nancial instruments (interest rate swaps and currency swaps) for managing currency and interest risks arising from the Group's operating and fi nancing activities.
The accounting treatment of hedge transactions varies according to the nature of the item being hedged and whether the hedge qualifi es for hedge accounting according to IFRS. Derivatives that qualify for hedge accounting are being accounted for in accordance with the nature of the item being hedged and the applicable hedge model.
Hedging of assets and liabilities The Group uses currency swaps to hedge the exposure to currency risk on the intercompany loans to foreign subsidiaries as well as the currency risk on external borrowings denominated in a currency other than Danish kroner. As fair value adjustments of both the hedged item and the derivative fi nancial instrument are recognised in the income statement, hedge accounting in accordance with IAS 39 is not applied.
DKK millionContractual
valueFair value at 31
December
Fair value adjust-ment recognised
in the income statement Maturity
2010CHF 679 4 4 2011EUR 3,548 0 0 2011GBP 1,202 (6) (6) 2011NOK 45 0 0 2011SEK 34 (0) (0) 2011Others 54 (1) (1) 2011
Forward foreign currency, purchases 5,562 (3) (3)
AUD 1,461 0 0 2011ILS 218 0 0 2011NOK 790 (1) (1) 2011NZD 133 (2) (2) 2011SEK 58 0 0 2011SGD 250 (1) (1) 2011THB 155 1 1 2011USD 1,108 1 1 2011Others 242 1 1 2011
Forward foreign currency, sales 4,415 (1) (1)
Total currency swaps (4) (4)
Consolidated fi nancial statements 127

NOTE 37 DERIVATIVES (CONTINUED)
DKK millionContractual
valueFair value at 31
December
Fair value adjust-ment recognised
in the income statement Maturity
2009CHF 407 0 0 2010EUR 3,491 (0) (0) 2010GBP 579 (1) (1) 2010
Forward foreign currency, purchases 4,477 (1) (1)
AUD 1,178 (14) (14) 2010CZK 101 (0) (0) 2010ILS 182 (1) (1) 2010MXN 91 (0) (0) 2010NOK 1,304 (3) (3) 2010SEK 369 (4) (4) 2010USD 994 (5) (5) 2010Others 482 (3) (3) 2010
Forward foreign currency, sales 4,701 (30) (30)
Total currency swaps (31) (31)
Hedging of forecasted transactions (cash fl ow hedges) The Group uses interest rate swaps to hedge the exposure to variability in future cash fl ows due to changes in interest rates on the Group's bank loans with a variable interest rate. The swaps convert a major part of the fl oating rates within the bank loans to fi xed interest rates.
DKK millionContractual
value
Positive fair value at
31 December
Negative fair value at
31 December
Fair value adjust-ment recognised in other compre-hensive income Maturity
2010CHF 131 - (2) (2) 2012GBP 1,454 - (34) (34) 2012SEK 286 1 - 1 2012NOK 329 - (2) (2) 2012EUR 11,141 - (98) (98) 2011-2012
Total cash fl ow hedges 13,341 1 (136) (135)
2009CHF 342 - (3) (3) 2010-2012GBP 2,762 - (16) (16) 2010-2012SEK 776 - (6) (6) 2010-2012NOK 955 - (5) (5) 2010-2012EUR 22,213 - (226) (226) 2010-2012
Total cash fl ow hedges 27,048 - (256) (256)
In 2010 and 2009, no ineffectiveness is recognised in the income statement.
Hedging of assets and liabilities (continued)
128 Annual Report 2010

NOTE 38 RELATED PARTIES
Parent and ultimate controlling partyThe sole shareholder of ISS A/S, FS Invest II S.à r.l (FS Invest II), has controlling infl uence in the Group. The ultimate controlling company of the Group is FS Invest S.à r.l ("FS Invest"), which is 54% owned by funds advised by EQT Partners and 44% owned by funds advised by Goldman Sachs Capital Partners, together The Principal Shareholders. There were no signifi cant transactions with the ultimate controlling party during the year. Transactions with the parent during the year is described below under Other related party transactions.
Key management personnelMembers of the Board of Directors, the Executive Group Management and Corporate Senior Offi cers have authority and responsibility for planning, implementing and controlling the Group's activities and are therefore considered as the Group's key management personnel. Apart from remuneration, described in note 5, Staff costs and co-investment programmes described below there were no signifi cant transactions during the year with members of the Board of Directors, the Executive Group Management or Corporate Senior Offi cers.
Co-investment programmes The Principal Shareholders have established a Management Participation Programme, under which the Executive Group Management and a number of senior offi cers 1) of the Group were offered to invest. The programme is structured as a combination of direct and indirect investments in a mix of shares and warrants of FS Invest, ISS A/S's ultimate parent. As of 31 December 2010, the investments amounted to DKK 184.0 million in total for 148 executives and offi cers. As part of the initial programme - in addition to the investments - the Executive Group Management and a number of Corporate Offi cers 2) were granted warrants in FS Invest with a vesting schedule (based on value of shares and time). As of 31 December 2010, 277,632 warrants were outstanding, see note 6, Share-based payments.
Non-executive members of the Board of Directors (except representatives of the Principal Shareholders) were offered to participate in a Directors Participation Programme, under which they have invested in a mix of shares and warrants of FS Invest amounting to approximately DKK 19.2 million in total. In addition, they have co-invested with the Principal Shareholders for approximately DKK 8.2 million in total.
External directorships and executive positions of the Board of Directors at 31 December 2010
Board of Directors Board Member Executive Position
Ole Andersen (Chairman) Privathospitalet Hamlet A/S (Chairman), Chr. Hansen Holding A/S (Chairman), Bang & Olufsen A/S (Chairman), Bang & Olufsen Operations A/S (Chairman), Danske Bank A/S, Georg Jensen A/S, Kommunekemi A/S, Duke Infrastructure Holding A/S and Duke Infrastructure A/S.
Managing Director of CBTJ ApS, CBTJ/D1 ApS and CBTJ/D4 ApS.
Leif Östling (Vice-Chairman) AB SKF (Chairman), Confederation of Swedish Enterprise (Svenskt Näringsliv) (Chairman), The Association of Swedish Engineering Industries (Teknikföretagen) (Chairman) and Scania AB.
President and Group Chief Executive Offi cer of Scania AB
John Allan Dixons Retail Plc. (Chairman), Care UK Plc. (Chairman), 3i Plc., National Grid Plc. and Natakate Ltd.
None
Michel Combes Supervisory Board of Assystem SA (Chairman) and Vodafone Plc.
Chief Executive Offi cer for the Europe Region of Vodafone Plc
Peter Korsholm BTX Group A/S, EQT Partners A/S, Holdingselskabet af 24. februar 2006 A/S, CaridianBCT Holding Corp, Gambro AB, Indap Sweden AB, Indap Holding AB and the Danish Venture Capital & Private Equity Association (DVCA).
Partner at EQT Partners A/S and head of the Copenhagen offi ce as Managing Partner of EQT Partners A/S
Jørgen Lindegaard AVT Business School A/S (Chairman), Deducta A/S (Chairman), K/S Vimmelskaftet 39-41, København (Chair-man), IT University of Copenhagen (ITU) (deputy chairman), Parken Sport & Entertainment A/S, Trifi na Holding ApS, Trifi na Mellemholding ApS and Efsen Engineering A/S.
Chief Executive Offi cer of JL Rungsted Holding ApS, JL Rungsted Invest ApS, Trifi na Invest ApS, Trifi na Holding ApS and Vimmelskaftet 39-41, 2004 ApS
Steven Sher Ahlsell Sverige AB, Edam Acquisition I Cooperatief U.A. and Endemol B.V.
Managing Director, Goldman Sachs International, Merchant Banking Division
1) Senior offi cers of the Group comprises Corporate Senior Offi cers (members of Group Management other than members of the Executive Group Management) and other Corporate Offi cers as well as certain members of Country Management of each country.
2) Corporate Offi cers of the Group comprises Corporate Senior Offi cers (members of Group Management other than members of the Executive Group Management) and other Corporate Offi cers.
Consolidated fi nancial statements 129

NOTE 38 RELATED PARTIES (CONTINUED)
External directorships and executive positions of the Executive Group Management at 31 December 2010
Executive Group Management Board Member Executive Position
Jeff Gravenhorst Confederation of Danish Industri (DI), Danish Crown Holding A/S, Danish Crown AMBA and Statsautoriseret revisor Ove Haugsted og Hustru Lissi Haugsteds Familiefond
None
Jakob Stausholm Statoil ASA None
Other related party transactionsIn 2010, the Group had the following transactions with other related parties, which were all made on market terms:
ISS Equity A/S (previously the ultimate parent company in Denmark) was merged with FS Invest II as at 22 December 2010 with retrospective application as from 1 January 2010. Prior to the merger the Group had the following transactions with ISS Equity A/S:
- the Group paid interest to ISS Equity A/S, see note 9, Financial income and fi nancial expenses. - the Group received/paid joint taxation contribution equal to 25% of taxable income from/to ISS Equity A/S.
the Group's debt to ISS Equity A/S of DKK 98 million was remitted and recognised directly in equity following the merger of ISS Equity A/S with FS Invest II.
the Group and Goldman Sachs International have agreed general terms and conditions for the supply of Facility Services to be applied by local ISS operations and local Goldman Sachs affi liates when contracting with each other. ISS in Switzerland, Russia and the United Kingdom have entered into Facility Services agreements with local Goldman Sachs affi liates. The annual revenue from these agreements in 2010 was DKK 86 million. Furthermore, the Group has local agreement terms with Goldman Sachs in France, Ireland, Singapore, Brazil and China. Finally, ISS in Spain and Italy are subcontractors to local Goldman Sachs suppliers. The annual revenue from the local and subcontractor agreements in 2010 was DKK 9 million.
the Group and Goldman Sachs International have entered into various agreements on provision of fi nancing and banking related services.
the Group has entered into an agreement with Goldman Sachs International, an affi liate of Goldman Sachs Capital Partners, whereby Goldman Sachs International acts as Joint Global Coordinator and Joint Bookrunner of the initiated initial public offering (IPO).
affi liates of Goldman Sachs Capital Partners are lenders under the senior facilities and holders of 2014 EMTNs.
the Group has entered into local facility services agreements with various companies owned by EQT. The annual revenue from these agreements in 2010 was DKK 76 million.
Associates and joint ventures Transactions with associates and joint ventures are limited to transactions related to shared service agreements. There were no signifi cant transactions with associates and joint ventures during the year. All transactions were made on market terms.
OtherIn addition to the above and except for intra-group transactions, which have been eliminated in the consolidated accounts, there were no material transactions with other related parties and shareholders during the year.
130 Annual Report 2010

NOTE 39 INTERESTS IN JOINT VENTURES
As of 31 December 2010, the Group had interests in 9 joint ventures (10 in 2009). The signifi cant joint ventures are specifi ed in note 42, Subsidiaries, associates, joint ventures and SPEs. The Group's interests in joint ventures are recognised using the proportionate consolidation method. At the reporting date the joint ventures had the following effect on the Group's consolidated income statement and statement of fi nancial position:
DKK million 2010 2009
Revenue 359 332 Expenses (336) (304)
Operating profi t before other items 23 28
Net profi t for the year 16 20
Non-current assets 1) 26 26 Current assets 103 101
Total assets 129 127
Equity 45 39 Non-current liabilities 6 5 Current liabilities 78 83
Total equity and liabilities 129 127
The Group's part of contingent liabilities (operating leases) in joint ventures 14 16
The aggregate investment in joint ventures is as follows: Norway DKK 37.8 million (2009: DKK 28.2 million), Sri Lanka DKK 4.0 million (2009: DKK 3.8 million), the Netherlands DKK 3.8 million (2009: DKK 8.1 million), Spain DKK 0.3 million (2009: DKK 0.6 million), Greece DKK 0.3 million (2009: DKK 0 million) and Israel DKK (1.8) million (2009: DKK (1.5) million).
1) Excluding goodwill arising from the acquisition of the joint ventures.
Consolidated fi nancial statements 131

NOTE 41 NEW STANDARDS AND INTERPRETATIONS NOT YET IMPLEMENTED
IASB has published the following new standards, amendments to existing standards and interpretations that are not yet mandatory for the preparation of the consolidated fi nancial statements of the Group for the year ended 31 December 2010:
Amendments to IFRIC 14 "Prepayments of minimum funding requirement"; IFRIC 19 "Extinguishing Financial Liabilities with Equity Instruments"; Revised IAS 24 "Related Party Disclosures"; and Amendments to IAS 32 "Classifi cation of Rights Issues".
In addition the following standards are published by IASB, but not yet adopted by the EU:
IFRS 9 "Financial Instruments (replacement of IAS 39) project"; Amendments to IFRS 1 "First-time Adoption of International Financial Reporting Standards"; Amendments to IFRS 7; Amendments to IAS 12 "Deferred tax: Recovery of Underlying Assets"; and Improvements to IFRS (May 2010).
The Group expects to adopt the new standards and interpretations when they become mandatory. The standards and interpretations that are approved with different effective dates in the EU than the corresponding effective dates under IASB will be early adopted so that the implementation follows the effective dates under IASB.
None of the standards and interpretations are expected to have a material impact on the consolidated fi nancial statements of the Group.
NOTE 40 SUBSEQUENT EVENTS
Contemplated initial public offering on NASDAQ OMX CopenhagenOn 17 February 2011, the Group announced that it contemplates launching an Initial Public Offering (IPO) of shares and to list its shares on NASDAQ OMX Copenhagen.
The contemplated IPO is expected to consist primarily of a sale of new shares to raise gross proceeds of approximately DKK 13.3 billion, which are proposed, together with amounts drawn under a new facilities agreement to repay all amounts under the Group’s current senior secured facilities and second lien facility. A partial secondary sell-down of shares by the existing shareholder, FS Invest II S.à r.l., which is indirectly controlled by certain funds advised by EQT Partners and funds affi liated with Goldman Sachs Capital Partners, is expected to cover the obligations under the Management Participation Programme.
The new facilities agreement, which was put in place on 18 February 2011, will be able to be drawn upon subject to satisfaction of certain conditions precedent, including that the offering of the shares contemplated by the IPO has occurred or will occur contemporaneously with the new facilities agreement's fi rst utilisation. The new facility is in place with a smaller number of relationship banks and gives the fl exibility to pay margins dependant on our leverage at a given time.
OtherAcquisitions and divestments completed subsequent to 31 December 2010 are listed in note 14, Acquisition and divestment of businesses.
Apart from the above and the events described in the consolidated fi nancial statement, the Group is not aware of events subsequent to 31 December 2010, which are expected to have a material impact on the Group's fi nancial position.
132 Annual Report 2010

NOTE 42 SUBSIDIARIES, ASSOCIATES, JOINT VENTURES AND SPEs
Below the signifi cant subsidiaries, associates, joint ventures and SPEs of the Group are presented together with a Group chart showing the ownership structure from ISS A/S 1) and down. Together these are referred to as "Companies within the ISS Group".
Argentina Bosnia and Herzegovina Equipo Blanco S.R.L. 100% ISS Facility Services d.o.o. Banja Luka 100%Facility Services S.R.L. 100% ISS Facility Services d.o.o. Sarajevo 100%ISS Argentina S.A. 100%SIM S.A. 100% BrazilTop Service S.R.L. 100% ISS Biosystem Saneamento Ambiental Ltda. 100%
ISS Catering Sistemas de Alimentação Ltda. 100%Australia ISS Manutenção e Operação de Utilidades Ltda. 100%Blurlato Pty Ltd. 100% ISS Manutenção e ServicosIntegrados Ltda. 100%Fondi Investments Ltd. 100% ISS Servisos de Logistica Integrada Ltda. 100%ISS Catering Services Pty Ltd. 100% ISS Servisystem do Brasil Ltda. 100%ISS Facility Services Australia Ltd. 100% ISS Sulamericana Brasil Ltda. 100%ISS Franchise Services Pty Ltd. 100%ISS Health Services Pty Ltd. 100% Brunei ISS Holdings Pty Ltd. 100% ISS Facility Services Sdn. Bhd. 100%ISS Hygiene Services Pty Ltd. 100%ISS Integrated Services Pty Ltd. 100% BulgariaISS Property Services Pty Ltd. 100% ISS Facility Services EOOD 100%ISS Security Pty Ltd. 100%Pacifi c Invest December 2004 Pty Ltd. 100% CanadaPacifi c Service Solutions Pty Ltd. 100% ISS Facility Services Inc. 100%Prestige Protection Services Pty Ltd. 100%
ChileAustria EFI Ltda. 100%ISS Austria Holding GmbH 100% Glanzend Ltda. 100%ISS Beta Beteiligungsverwaltung GmbH 100% ISS Chile S.A. 100%ISS Facility Services GmbH 100% ISS Facility Services S.A. 100%ISS Ground Services GmbH 51% ISS Offi ce Support Ltda. 100%ISS Hotel, SPA & Gastro Services GmbH 100% ISS Servicios Generales Ltda. 100%
Ledan Ltda. 100%Belgium Slim S.A. 100%BD Food Invest S.A. 100%ISS Building Services N.V. 100% China and Hong KongISS Catering N.V. 100% Cornerstone Associates Ltd. 100%ISS Industrial Cleaning N.V. 100% Hung Fat Cleaning Transportation Co., Ltd. 100%ISS Industrial Services N.V. 100% ISS Adams Secuforce Limited 100%ISS Landscaping N.V. 100% ISS Allsecure Ltd. 100%ISS N.V. 100% ISS Building Consultancy Ltd. 100%ISS Offi ce Support Services N.V. 100% ISS China Holdings I Ltd. 100%ISS Pest Management Solutions N.V. 100% ISS China Holdings Ltd. 100%ISS Reception & Support Services N.V. 100% ISS EastPoint Properties Ltd. 100%National Pest Control B.V.B.A. 100% ISS EastPoint Property Consultants Ltd. 100%Synerg'ISS N.V. 100% ISS EastPoint Property Management Ltd. 100%
ISS Environmental Services (HK) Ltd. 100%
1) Effective 17 February 2011 the company name was changed from ISS Holding A/S to ISS A/S. 2) Effective 17 February 2011 the company name was changed from ISS A/S to ISS World Services A/S.
ISS WORLD SERVICES A/S 2)
ISS A/S 1)
ISS GLOBAL A/S
ARGENTINA AUSTRALIA .... USA
Consolidated fi nancial statements 133

NOTE 42 SUBSIDIARIES, ASSOCIATES, JOINT VENTURES AND SPEs (CONTINUED)
China and Hong Kong (continued) France (continued)ISS Facility Services (Beijing) Ltd. 100% ISS Holding Paris SAS 100%ISS Facility Services (Shanghai) Ltd. 100% ISS Hygiene & Prevention SAS 100%ISS Facility Services China Ltd. 100% ISS Hygiene SAS 100%ISS Facility Services Ltd. 100% ISS Logistique et Production SAS 100%ISS Greater China Ltd. 100% ISS Proprete SAS 100%ISS Hangyang (Beijing) Cleaning Services Co., Ltd. 100% Logicbuy SAS 100%ISS Hong Kong Services Ltd. 100% Stopfl am SAS 100%ISS Hygiene Services (HK) Ltd. 100% Verts Paysages & Aménagement SAS 100%ISS Mediclean (HK) Ltd. 100%ISS Pan Asia Security Services Ltd. 100% GermanyISS Roboclean (HK) Co., Ltd. 100% ISS Damage Control Deutschland GmbH 100%ISS Servisystem (China) Ltd. 100% ISS Facility Management GmbH 100%ISS Thomas Cowan Co., Ltd. 70% ISS Facility Services GmbH 100%JSL Ltd. 100% ISS HWS GmbH & Co. KG 100%LAWN Environmental Protection Ltd. 100% ISS Personalservice GmbH 100%Shanghai ISS Catering Management Co., Ltd. 100% ISS Schädlingsbekämpfung und Hygiene GmbH 100%Silvertech E&M Engineering Co., Ltd. 100% Klaus Harren GmbH 100%
Vatro Trockungs- und Sanierungstec. GmbH & Co. KG 86%Croatia Vatro Verwaltungs GmbH 86%ISS Kadrovske usluge d.o.o. 100%ISS Usluzne djelatnosti d.o.o. 100% Greece
Eretbo S.A. 50% *Czech Republic ISS ASPIS Security S.A. 100%ISS Facility Services s.r.o 100% ISS Facility Services S.A. 100%ISS Optimal s.r.o. 100% ISS Human Resources S.A. 100%ISS Sprava Budov s.r.o. 100%
GreenlandDenmark ISS Grønland A/S 100%House of Coffee A/S 100%ISS Capital A/S 100% HungaryISS Document A/S 100% ISS Facility Services Kft. 100%ISS Facility Services A/S 100% Profi -Komfort Kft. 100%ISS Finans A/S 100%ISS Holding France A/S 100% IcelandISS Kloak- & Industriservice A/S 100% ISS Island ehf. 100%ISS Security A/S 100%ISS Venture A/S 100% IndiaPersonalehuset A/S 100% ISS Catering Services (South) Pvt. Ltd. 100%
ISS Catering Services (West) Pvt. Ltd. 100%Estonia ISS Facility Services (India) Pvt. Ltd. 100%ISS Eesti AS 100% ISS Hi Care Pvt. Ltd. 100%ISS Haldus OÜ 100% ISS Integrated Facility Services Pvt. Ltd. 100%ISS Holding OÜ 100% ISS Management Services Pvt. Ltd. 100%
ISS Pest Control Services Pvt. Ltd. 100%Finland ISS SDB Security Services Pvt. Ltd. 49% ****ISS Aviation Oy 100% ISS Support Services Pvt. Ltd 100%ISS Henkilöstöpalvelut Oy 100% Modern Protection & Investigations Ltd. 49% ****ISS Palvelut Holding Oy 100%ISS Palvelut Oy 100% IndonesiaISS Proko Oy 100% P.T. ISS Catering Services 100%ISS Teollisuuspalvelut Oy 100% P.T. ISS Facility Services 100%Suomen Laatutakuu Palvelut Oy 100% P.T. ISS Indonesia 100%
P.T. ISS Parking Management 100%FranceChannel Passengers Services SAS 100% IrelandExtincteurs Haas SAS 100% ISS Ireland Holding Ltd. 100%GIE ISS Services 100% ISS Ireland Ltd. 100%ISS Accueil & Services SAS 100%ISS Espaces Verts SAS 100%ISS Facility Management SAS 100%
134 Annual Report 2010

NOTE 42 SUBSIDIARIES, ASSOCIATES, JOINT VENTURES AND SPEs (CONTINUED)
Israel Netherlands (continued)A. Kfi r Holding Ltd. 100% ISS Reception Services B.V. 100%Catering Ltd. 100% ISS Security Services B.V. 100%Catering Tefen (1991) Ltd. 100% Omring Thuisservice B.V. 50% *Glat Chef Ltd. 50% * TalentGroep Montaigne Facility Management B.V. 100%I.S.S Outsourcing Ltd. 100%ISS Ashmoret Ltd. 100% New ZealandISS Integrated Facility Service Management Ltd. 100% First Security Guard Services Ltd. 100%ISS Israel Manpower Services Ltd. 100% ISS Facilities Services Ltd. 100%ISS Israel Comprehensive Business Services Ltd. 100% ISS Holdings NZ Ltd. 100%ISS Kfi r Surveillance and Control Solutions Ltd. 100%Kfi r Surveillance and Electronic Systems Ltd. 100% Norway M.A.S.H. Mahatz Agencies (1997) Ltd. 100% ForvaltningsCompagniet AS 100%Norcat Ltd. 100% Hero Holding AS 50% *Norfolk Enterprizes Ltd. 100% House of Coffee AS 100%Norfolk International Ltd. 100% ISS Facility Services AS 100%
ISS Holding AS 100%Italy ISS Management AS 100%G.S. Services S.p.A. 100% ISS Personalhuset AS 100%ISS Facility Services S.r.l. 100% ISS Serveringspartner AS 100%Karmak S.p.A. 100% ISS Service Management AS 100%
ISS Skadeservice AS 100%Japan NSB Trafi kkservice AS 45% **Nihon ISS KK 100% Personalhuset Rignes AS 50% *
Raufoss Beredskap AS 51%Latvia Reaktorskolen AS 100%ISS Namu Serviss SIA 100% Varig Gruppen AS 100%
Lithuania PhilippinesISS Pastatu Valda UAB 100% ISS Facility Services Phils., Inc. 100%
Luxembourg PolandISS Facility Services S.A. 100% ISS Facility Services Sp. z.o.o. 100%Lux Intérim S.A.R.L. 100%
PortugalMalaysia ISS Facility Services, Lda 100%ISS Facility Services Sdn. Bhd. 30% ISS FS Açores, Lda 100%ISS Hygiene Services Sdn. Bhd. 100% ISS Human Resources, Lda. 100%Kontrekleen Services Sdn. Bhd. 30% ISS Pest Control, Lda. 100%Reliance Suci Environmental Services Sdn. Bhd. 30% ISS Plantiagro, Lda. 100%
ISS Portugal II, Lda. 100%MexicoISS Centro América, S de RL de CV 100% RomaniaISS Facility Services, SA de CV 100% 3D Romania S.A. 100%ISS Servicios Gerenciales, S de RL de CV 100% ISS Facility Services S.R.L. 100%ISS Servicios Integrales, S de RL de CV 100% ISS Romania Group S.R.L. 100%Mantenimiento Ténico Tapnew, SA de CV 100%Martex, SA de CV 100% RussiaServicoin, SA de CV 100% Facility Services RUS LLC 100%
Netherlands SingaporeGroene Team B.V. 100% ISS Catering Pte. Ltd. 100%ISS Arbo Plus B.V. 100% ISS Catering Services Pte. Ltd. 100%ISS Building Maintenance Services B.V. 100% ISS Facility Services Private Limited 100%ISS Catering Services B.V. 100% ISS Hydroculture Pte. Ltd. 100%ISS Cure & Care B.V. 100% ISS Landscaping Pte. Ltd. 100%ISS Holding Nederland B.V. 100% ISS M&E Pte. Ltd. 100%ISS Hygiene Services B.V. 100% ISS Pest Management Pte. Ltd. 100%ISS Integrated Facility Services B.V. 100% ISS Sanitation Services Pte. Ltd. 100%ISS Landscaping Services B.V. 100% ISS-CDCS Catering Pte. Ltd. 100%ISS Nederland B.V. 100% Serve 1st Services Pte. Ltd. 100%
Consolidated fi nancial statements 135

NOTE 42 SUBSIDIARIES, ASSOCIATES, JOINT VENTURES AND SPEs (CONTINUED)
Slovakia ISS Schweiz AG 100%ISS Facility Services spol s.r.o. 100% ISS Security AG 100%ISS Security spol s.r.o. 100%
TaiwanSlovenia ISS Facility Services Ltd. 100%ISS Facility Services d.o.o. 100% ISS Security Ltd. 100%ISS Global storitve d.o.o. 100%Magnetik d.o.o. 100% Thailand
Golden Mind Manufacturing Co., Ltd. 100%South Africa Golden Mind Marketing Co., Ltd. 100%ISS Facility Services (Pty) Limited 100% Golden Mind Transportation Co., Ltd. 100%
ISS Facility Services Co., Ltd. 100%Spain ISS Security Services Co Ltd. 100%Centro de Actividades Formativas y Educacionales S.L. 100% ISS Support Services Co., Ltd. 100%Fabri Facility Management, S.L. 100% Job Golden Co., Ltd. 100%Gelim Andalucia S.A. 100% Notre-Bel Co., Ltd. 100%Gelim Asturias S.A. 100%Gelim Baleares S.A. 100% TurkeyGelim Canarias S.A. 100% CMC Iletişim Bilgi Reklam ve D. Hiz. Ve San. Tic. A.Ş. 90% *****Gelim Galicia S.A. 100% ISS Hasere Kontrol Hizmetleri A.Ş. 90% *****Gelim Madrid S.A. 100% ISS Tesis Yönetim Hizmetleri A.Ş. 90% *****Gelim Mediterránea Clásica, S.L. 100% Proser Koruma ve Güvenlik Hizmetleri A.Ş. 90% *****Gelim S.A. 100% Sardunya Hazir Yemek Uretim ve Hizmet A.Ş. 90% *****Gelim Valencia S.A. 100%Integrated Service Solutions S.L. 100% United KingdomISS Activa Educacional S.L. 100% ISS Collections Ltd. 0% ***ISS Facility Services S.A. 100% ISS Damage Control (Scotland) Ltd. 100%ISS Financiera Corporativa S.L. 0% *** ISS Damage Control Ltd. 100%ISS Higiene Ambiental 3D S.A. 100% ISS Facility Services Ltd. 100%ISS Logistica Producción y Outsourcing S.L. 100% ISS Financing Plc. 0% ***ISS Mediterranean Vending Solutions S.L. 100% ISS Mediclean Ltd. 100%ISS Salud y Servicios Sociosanitarios S.A. 100% ISS UK Holding Ltd. 100%ISS Serv. Auxiliares y Complem. de Ofi cinas S.A. 100% ISS UK Ltd. 100%ISS Servicios Control Incendios S.L. 100% Pegasus Security Holdings Ltd. 100%ISS Soluciones de Catering S.L. 100% Spectrum Franchising Ltd. 100%ISS Soluciones de Jardinería S.L. 100% Spectrum Holdings Ltd. 100%ISS Soluciones de Mantenimiento Gestión Integral S.L. 100%ISS Soluciones de Seguridad S.L. 100% Uruguay
Falcri Ltda. 100%Sri Lanka Habitue S.A. 100%ISS Abans Environmental Services (PT) Ltd. 50% * ISS Uruguay S.A. 100%
Samilar S.A. 100%SwedenISS Facility Services AB 100% USAISS Facility Services Holding AB 100% C&S Building Maintenance Corporation 100%ISS Industriservice AB 48% ** ISS Facility Services Holding, Inc. 100%ISS Palvelut Holding AB 100% ISS Facility Services of California, Inc. 100%ISS Traffi Care AB 100% ISS Facility Services of Texas, LP 100%
ISS Facility Services, Inc. 100%Switzerland ISS GP Inc. 100%ISS Aviation AG 100% ISS Grounds Control of Texas, LP 100%ISS Bernasconi SA 100% ISS Grounds Control, Inc. 100%ISS Facility Services (Liechtenstein) AG 100% ISS Holding (USA) Inc. 100%ISS Facility Services AG 100% ISS Management and Finance Co., Inc. 100%ISS FM Services AG 100% ISS Specialty Services, LLC 100%ISS Holding AG 100% ISS TMC Services, Inc. 100%ISS Jakober AG 100% ISS Uniguard, Inc. 100%ISS Notter Kanalservice AG 100% TMC Ridge, LLC 100%ISS Pest Control AG 100% Tri-Enterprise Construction, LLC 100%
.
Undertakings of immaterial interest are left out * Joint venture ** Associate *** Special Purpose Entity (SPE) **** By virtue of the governance structure, the Group has the power to govern the fi nancial and operating policies of the company. Consequently, it is consolidated as a subsidiary.***** The non-controlling shareholder holds a put option which is accounted for as if the put option has already been exercised. Accordingly, the subsidiary is consolidated with no
non-controlling interest.
136 Annual Report 2010

INÊS COSTA, PORTUGAL
Parent company

Income statement of the parent company1 January – 31 December
DKK million Note 2010 2009
Other operating expenses 3 (3) (2)
Operating profi t/(loss) before other items (3) (2)
Other expenses 4 (17) -
Operating profi t/(loss) (20) (2)
Financial income 5 69 77 Financial expenses 5 (667) (601)
Profi t/(loss) before tax (618) (526)
Income taxes 6 67 60
Net profi t/(loss) for the year (551) (466)
Attributable to:
Owners of ISS A/S (551) (466)
Net profi t/(loss) for the year (551) (466)
138 Annual Report 2010

Statement of comprehensive income of the parent company 1 January – 31 December
DKK million Note 2010 2009
Net profi t/(loss) for the year (551) (466)
Other comprehensive incomeFair value adjustment of hedges, net 16 (18) (77)Fair value adjustment of hedges, net, transferred to Financial expenses 16 69 87 Tax regarding other comprehensive income 6, 13 (12) (2)
Total other comprehensive income 39 8
Total comprehensive income for the year (512) (458)
Attributable to:
Owners of ISS A/S (512) (458)
Total comprehensive income for the year (512) (458)
Parent company fi nancial statements 139

Statement of cash fl ows of the parent company1 January – 31 December
DKK million Note 2010 2009
Operating profi t/(loss) before other items (3) (2)Changes in working capital 0 0 Other expenses paid (16) - Income taxes received, net 13 93 110
Cash fl ow from operating activities 74 108
Proceeds from borrowings 950 - Interest received 69 77 Interest paid (628) (658)Payments (to)/from companies within the ISS Group, net (465) 472
Cash fl ow from fi nancing activities (74) (109)
Total cash fl ow 0 (1)
Cash and cash equivalents at 1 January 0 1 Total cash fl ow 0 (1)
Cash and cash equivalents at 31 December 11 0 0
140 Annual Report 2010
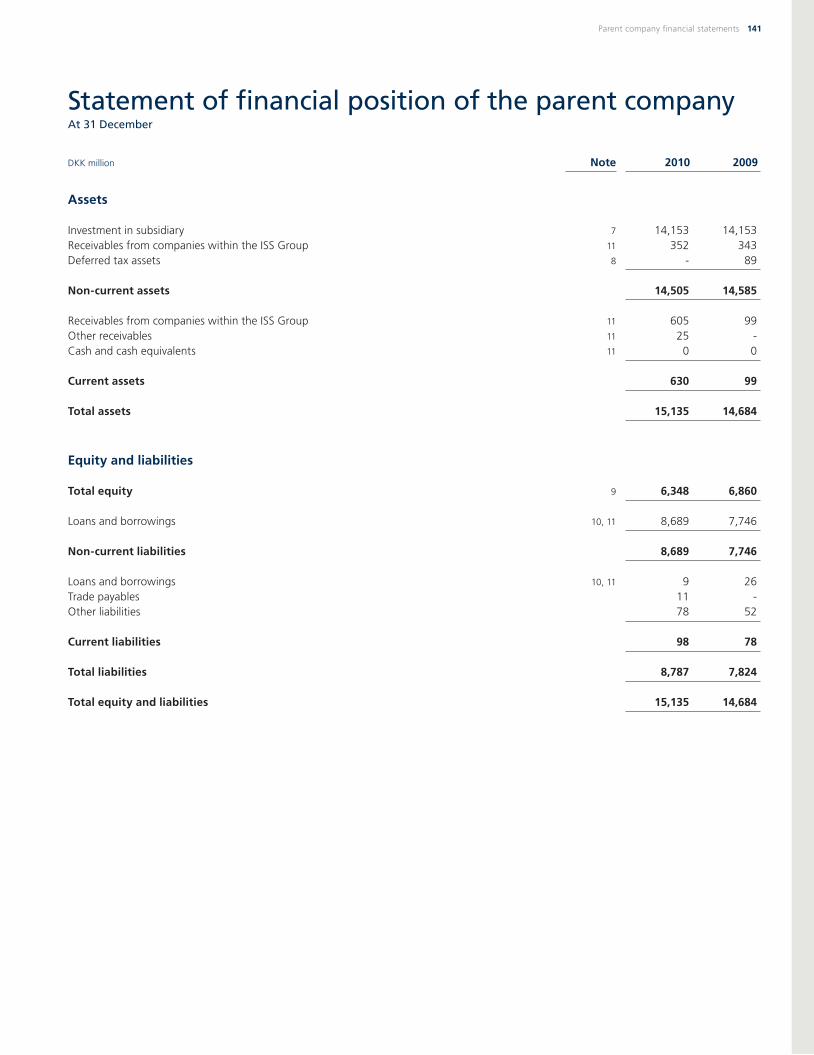
Statement of fi nancial position of the parent company At 31 December
DKK million Note 2010 2009
Assets
Investment in subsidiary 7 14,153 14,153 Receivables from companies within the ISS Group 11 352 343 Deferred tax assets 8 - 89
Non-current assets 14,505 14,585
Receivables from companies within the ISS Group 11 605 99 Other receivables 11 25 - Cash and cash equivalents 11 0 0
Current assets 630 99
Total assets 15,135 14,684
Equity and liabilities
Total equity 9 6,348 6,860
Loans and borrowings 10, 11 8,689 7,746
Non-current liabilities 8,689 7,746
Loans and borrowings 10, 11 9 26 Trade payables 11 - Other liabilities 78 52
Current liabilities 98 78
Total liabilities 8,787 7,824
Total equity and liabilities 15,135 14,684
Parent company fi nancial statements 141

Statement of changes in equity of the parent company1 January – 31 December
DKK millionShare
capitalShare
premiumRetained earnings
Hedging reserve Total
2010Equity at 1 January 100 7,772 (937) (75) 6,860
Comprehensive income for the yearNet profi t/(loss) for the year - - (551) - (551)
Other comprehensive incomeFair value adjustment of hedges, net of tax - - - (13) (13)Fair value adjustment of hedges, net of tax, transferred to Financial expenses - - - 52 52
Total other comprehensive income - - - 39 39
Total comprehensive income for the year - - (551) 39 (512)
Total changes in equity - - (551) 39 (512)
Equity at 31 December 100 7,772 (1,488) (36) 6,348
2009Equity at 1 January 100 7,772 (471) (83) 7,318
Comprehensive income for the yearNet profi t/(loss) for the year - - (466) - (466)
Other comprehensive incomeFair value adjustment of hedges, net of tax - - - (58) (58)Fair value adjustment of hedges, net of tax, transferred to Financial expenses - - - 66 66
Total other comprehensive income - - - 8 8
Total comprehensive income for the year - - (466) 8 (458)
Total changes in equity - - (466) 8 (458)
Equity at 31 December 100 7,772 (937) (75) 6,860
Dividends No dividends have been proposed or declared.
142 Annual Report 2010

Notes to the parent company fi nancial statements
ACCOUNTING POLICIESNote 1 Signifi cant accounting policies 144Note 2 Critical accounting estimates and judgements 144
INCOME STATEMENTNote 3 Fees to auditors elected at the Annual General Meeting 145Note 4 Other expenses 145Note 5 Financial income and fi nancial expenses 145Note 6 Income taxes 146
STATEMENT OF FINANCIAL POSITIONNote 7 Investment in subsidiary 146Note 8 Deferred tax 147Note 9 Share capital 147Note 10 Loans and borrowings 148Note 11 Financial assets and liabilities 150
OTHERNote 12 Remuneration to the Board of Directors and the
Executive Group Management 150Note 13 Tax receivables and tax payables 151Note 14 Contingent liabilities, pledges and guarantees 151Note 15 Financial risk management 152Note 16 Derivatives 153Note 17 Related parties 154
Parent company fi nancial statements 143

NOTE 1 SIGNIFICANT ACCOUNTING POLICIES
NOTE 2 CRITICAL ACCOUNTING ESTIMATES AND JUDGEMENTS
STATEMENT OF COMPLIANCEThe fi nancial statements of ISS A/S (formerly ISS Holding A/S) have been prepared in accordance with International Financial Reporting Standards (IFRS) as adopted by the EU and additional Danish disclosure requirements (class D) and the statutory order on the adoption of IFRS issued pursuant to the Danish Financial Statements Act.
In addition, the fi nancial statements have been prepared in compliance with the IFRSs issued by the IASB.
CHANGES IN ACCOUNTING POLICIESChanges in accounting policies are described in note 1 to the Group's consolidated fi nancial statements.
DESCRIPTION OF ACCOUNTING POLICIESWith the exception of the items described below, the accounting policies for ISS A/S are identical to the Group's accounting policies, which are described in note 1 to the consolidated fi nancial statements.
Foreign currency Foreign exchange adjustments of balances with foreign entities which are considered part of the total net investment in the entity are recognised in the income statement of the parent company.
INCOME STATEMENTIncome from subsidiary comprises dividends and gains and losses from divestment of subsidiaries. Dividends are recognised in the income statement in the fi nancial year in which the dividend is declared. If dividends declared exceed the total comprehensive income for the year, an impairment test is performed.
STATEMENT OF FINANCIAL POSITIONInvestment in subsidiary is measured at cost. If there is indication of impairment, an impairment test is performed as described in the accounting policies in note 1 to the consolidated fi nancial statements. Where the recoverable amount is lower than the cost, the investment is written down to this lower value.
Tax ISS A/S is jointly taxed with all Danish resident subsidiaries. The Danish income tax payable is allocated between the jointly taxed Danish companies based on their proportion of taxable income (full absorption including reimbursement of tax defi cits). The jointly taxed companies are included in the Danish tax on account scheme. Additions, deductions and allowances are recognised under Financial income or Financial expenses.
Critical accounting estimates and judgements relating to the applied accounting policies for ISS A/S are the same as for the Group to the extent of similar accounting items, see note 2 to the consolidated fi nancial statements for a description. In addition, estimates and judgements are required for measurement of ISS A/S's investment in subsidiary as described below. Furthermore, the specifi c risks for ISS A/S are described in the notes to the fi nancial statements of the parent company.
Investment in subsidiary is tested for impairment when there is an indication that the investment may be impaired. The assessment of whether there is an indication of impairment is based on both external and internal sources of information such as performance of the subsidiary, signifi cant decline in market values etc.
144 Annual Report 2010

NOTE 4 OTHER EXPENSES
DKK million 2010 2009
Costs related to the contemplated initial public offering (IPO) process (17) -
Other expenses (17) -
Costs related to the contemplated initial public offering (IPO) process comprised costs for external advisors incurred as part of the initiated IPO process.
NOTE 5 FINANCIAL INCOME AND FINANCIAL EXPENSES
DKK million 2010 2009
Interest income on cash and cash equivalents etc. 0 0 Interest income from ISS Global A/S 50 30 Interest income from other companies within the ISS Group 19 19 Foreign exchange gains - 28
Financial income 69 77
Hereof fi nancial income on fi nancial assets measured at amortised cost 69 49
Interest expenses on loans and borrowings etc. (570) (543)Amortisation of fi nancing fees 1) (24) 29 Net change in fair value of cash fl ow hedges transferred from equity (69) (87)Foreign exchange losses (4) -
Financial expenses (667) (601)
Hereof fi nancial expenses on fi nancial liabilities measured at amortised cost (594) (514)
1) In 2009, amortisation of fi nancing fees was positively impacted by an adjustment of DKK 51 million related to amortisation in prior years.
NOTE 3 FEES TO AUDITORS ELECTED AT THE ANNUAL GENERAL MEETING
DKK million 2010 2009
KPMGAudit fees 1 1 Other assurance services 9 1 Other services 0 -
Total KPMG 10 2
Audit fees comprised audit of the fi nancial statements. Other assurance services in 2010 comprised mainly work related to the contemplated initial public offering (IPO) process as well as half year review. The costs related to the contemplated IPO process are included in Other expenses.
Parent company fi nancial statements 145

NOTE 7 INVESTMENT IN SUBSIDIARY
DKK million 2010 2009
Cost at 1 January 22,050 22,050
Cost at 31 December 22,050 22,050
Revaluation at 1 January (7,897) (7,897)
Revaluation at 31 December (7,897) (7,897)
Carrying amount at 31 December 14,153 14,153
Subsidiary Share % Share %
ISS World Services A/S, Copenhagen, Denmark 100 100
NOTE 6 INCOME TAXES
DKK million 2010 2009
Current tax regarding profi t/(loss) before tax 155 164 Deferred tax regarding profi t/(loss) before tax (89) (102)
Tax on profi t/(loss) before tax 66 62 Adjustments relating to prior years, net 1 (2)
Income taxes 67 60
Income tax recognised in other comprehensive income
2010 2009
DKK million Before
tax Tax Net of
tax Before
tax Tax Net of
tax
Fair value adjustment of hedges, net (18) 5 (13) (77) 19 (58)Fair value adjustment of hedges, net, transferred to Financial expenses 69 (17) 52 87 (21) 66
Total recognised in other comprehensive income 51 (12) 39 10 (2) 8
146 Annual Report 2010

NOTE 8 DEFERRED TAX
DKK million 2010 2009
Deferred tax assets/(liabilities), net at 1 January 89 191 Tax on profi t/(loss) before tax (89) (102)
Deferred tax assets/(liabilities), net at 31 December - 89
Deferred tax specifi cationDKK million 2010 2009
Tax losses carried forward - 89
Deferred tax - 89
Deferred tax assets relating to tax losses carried forward are only recognised to the extent that it is more likely than not, that future taxable profi t will be available against which the unused tax losses can be utilised in the foreseeable future. ISS A/S has unrecognised deferred tax assets regarding tax losses carried forward of DKK 1 million (2009: DKK 1 million). The unrecognised tax losses can be carried forward indefi nitely.
NOTE 9 SHARE CAPITAL
2010 2009
Nominal value (DKK
million)
Number of shares (in
thousands)
Nominal value (DKK
million)
Number of shares (in
thousands)
Share capital at 1 January 100 100,000 100 100,000
Share capital at 31 December 100 100,000 100 100,000
At 31 December 2010, a total of 100,000,001 shares with a nominal value of DKK 1 per share were issued and fully paid (2009: 100,000,001 shares). No shares carry special rights. At 31 December 2010, shares were not freely transferable, as any transfer required the consent of the Board of Directors as set out in the Articles of Association. Effective 1 March 2011, the Articles of Association have been changed resulting in the shares being freely transferable.
Parent company fi nancial statements 147

NOTE 10 LOANS AND BORROWINGS
DKK million 2010 2009
Issued bonds 4,259 3,300 Bank loans 4,430 4,412 Interest rate swaps 9 60
Total loans and borrowings 8,698 7,772
Loans and borrowings are recognised in the statement of fi nancial position as follows:Non-current liabilities 8,689 7,746 Current liabilities 9 26
Total loans and borrowings 8,698 7,772
The fair value of loans and borrowings is disclosed in note 11, Financial assets and liabilities. In March, a tap bond issue under the existing subordinated notes due 2016 was completed resulting in DKK 950 million (EUR 127.5 million) being raised.
In 2010, fi nancing fees amounting to DKK 11 million (2009: DKK 0 million) have been recognised in loans and borrowings while accumulated fi nancing fees recognised in loans and borrowings on 31 December 2010 amounted to DKK 118 million (2009: DKK 131 million).
In 2010 and 2009, ISS A/S had no loans and borrowings convertible into equity.
Terms and maturity of loans and borrowings2010 2009
DKK million
Nominalinterest
rate
Average effective
interest rateInterest
rateYear of
maturityFace
valueAmount hedged
Carrying amount
Carrying amount
Issued bonds:Subordinated notes 8.875% 9.06% Fixed 2016 4,335 - 4,259 3,300
Bank loans:Second lien facility Euribor + 3.75% 4.61% Floating 2015 4,473 4,025 4,430 4,412
Interest rate swaps - - - - - - 9 60
Loans and borrowings 6.66% 8,808 8,698 7,772
148 Annual Report 2010

NOTE 10 LOANS AND BORROWINGS (CONTINUED)
Maturity profi le of loans and borrowings The contractual maturities of loans and borrowings based on undiscounted contractual cash fl ows, including interest payments estimated based on expectations at the reporting date, are shown below:
DKK millionCarrying amount
Contractual cash fl ows < 1 year 1-2 years 2-3 years 3-4 years 4-5 years > 5 years
2010Issued bonds 4,259 6,403 385 385 385 385 385 4,478 Other loans and borrowings 4,430 5,692 222 248 279 308 4,635 -
Total loans and borrowings excluding derivatives 8,689 12,095 607 633 664 693 5,020 4,478
Hereof estimated interest payments 3,287 607 633 664 693 547 143
Interest rate swaps 9 9 9 - - - - -
Total derivatives 9 9 9 - - - - -
2009Issued bonds 3,300 5,290 300 300 300 300 300 3,790 Other loans and borrowings 4,412 6,084 224 266 298 320 337 4,639
Total loans and borrowings excluding derivatives 7,712 11,374 524 566 598 620 637 8,429
Hereof estimated interest payments 3,531 524 566 598 620 637 586
Interest rate swaps 60 60 55 5 - - - -
Total derivatives 60 60 55 5 - - - -
Parent company fi nancial statements 149

NOTE 11 FINANCIAL ASSETS AND LIABILITIES
The fair values of fi nancial assets and liabilities, together with the carrying amounts in the statement of fi nancial position, are shown below:
2010 2009
DKK million Note
Carrying amount
Fair value
Carrying amount
Fair value
Receivables from companies within the ISS Group 1) 957 957 442 442 Cash and cash equivalents 2) 0 0 0 0
Loans and receivables 957 957 442 442
Derivative fi nancial instruments designated as cash fl ow hedge 16 9 9 60 60
Financial liabilities used as hedging 9 9 60 60
Issued bonds 10 4,259 4,491 3,300 3,243 Bank loans 10 4,430 4,473 4,412 4,465
Financial liabilities measured at amortised cost 8,689 8,964 7,712 7,708
1) The effective interest rate was 6.8% (2009: 5.0%).2) The effective interest rate was 0.4% (2009: 0.7%).
NOTE 12 REMUNERATION TO THE BOARD OF DIRECTORS AND THE EXECUTIVE GROUP MANAGEMENT
2010 2009
DKK thousandBoard of Directors
Executive Group
Manage-ment
Board of Directors
Executive Group
Manage-ment
Salaries and other remuneration 2,173 15,003 1,969 20,027 Bonus - 5,450 - 5,703 Severance payment 1) - 16,204 - - Share-based payments 1) - 233 - 233
2,173 36,890 1,969 25,963
DKK thousand 2010 2009
Executive Group ManagementJeff Gravenhorst 10,246 7,483 Jakob Stausholm 8,362 7,351 Jørgen Lindegaard (former Group CEO) 18,282 10,879 Flemming Schandorff (former Group COO) - 250
36,890 25,963
Remuneration to the Board of Directors and the Executive Group Management is paid by ISS World Services A/S and is described in note 5 to the consolidated fi nancial statements. The Group's warrant programme is descibed in note 6 to the consolidated fi nancial statements.
1) Included in Other income and expenses, net in ISS World Services A/S.
150 Annual Report 2010

NOTE 14 CONTINGENT LIABILITIES, PLEDGES AND GUARANTEES
Senior Facility Agreement ISS A/S has executed a share pledge over its shares in ISS World Services A/S as security for the Group's senior facilities and a secondary share pledge over such shares as security for the subordinated notes issued by ISS A/S.
ISS World Services A/S, ISS Global A/S and certain material subsidiaries of ISS Global A/S in Australia, Belgium, Denmark, Finland, France, the Netherlands, Norway, Spain, Sweden, the United Kingdom and the USA have provided guarantees for ISS Global A/S's borrowings under the senior facilities. The guarantees have been backed up by security over bank accounts, trade receivables, intra-group receivables, other receivables, properties, production equipment and intellectual property rights of ISS World Services A/S and these subsidiaries.
In addition, the shares in ISS Global A/S's material subsidiaries and shares in certain of their subsidiaries as well as shares in certain subsidiaries in Austria, Brazil, the Czech Republic, Germany, Hong Kong, Ireland, Israel, Portugal, New Zealand, Singapore, Switzerland and Turkey have been pledged.
VAT ISS A/S and certain Danish Group companies are jointly registered for VAT and are jointly liable for the payment hereof.
NOTE 13 TAX RECEIVABLES AND TAX PAYABLES
DKK million 2010 2009
Tax payables/(receivables), net at 1 January - - Adjustment relating to prior years, net (1) 2 Tax on profi t/(loss) before tax (155) (164)Tax on other comprehensive income 12 2 Joint taxation contribution 51 50 Tax received, net 93 110
Tax payables/(receivables), net at 31 December - -
Parent company fi nancial statements 151

2010 2009
DKK millionIncome
statement
Other comprehen-sive income
Income statement
Other comprehen-sive income
Loans and borrowings (4) (4) (4) (4)Derivatives, interest rate swaps - 0 - 40
NOTE 15 FINANCIAL RISK MANAGEMENT
ISS A/S's fi nancial risks are managed centrally in Group Treasury based on policies approved by the Board of Directors. The policies are described in note 36 to the consolidated fi nancial statements. The risks specifi c to ISS A/S are described below.
Currency riskCurrency risk is the risk that changes in exchange rates will affect ISS A/S's result or value of its holdings of fi nancial instruments. To a limited extent ISS A/S is exposed to currency risk on loans and borrowings as they are denominated in EUR.
At 31 December 2010 the net exposure to EUR on loans and borrowings was DKK 8,808 million. A strengtening of the EUR of 1% against DKK would have impacted the income statement and other comprehensive income negatively by DKK 88 million. This analysis is based on foreign currency exchange rate variances that the Group considered to be reasonably possible at the reporting date. The analysis assumes that all other variables, in particular interest rates, remain constant.
Interest rate risk Interest rate risk arises from the possibility that changes in interest rates will affect future cash fl ows or the fair value of fi nancial instruments, primarily bank loans and issued bonds. ISS A/S's loan portfolio consists of bank loans (second lien facility) and listed bonds (subordinated notes). To manage the interest rate risk ISS A/S uses fi xed-rate bonds and derivatives, such as interest rate swaps. A part of ISS A/S's interest payments on the second lien facility have been swapped from fl oating into fi xed rates, see note 10, Loans and borrowings, where a breakdown of ISS A/S's loans and borrowings as well as applied interest rate swaps is provided.
The interest rate risk is measured by the duration of the net debt (fi xed-rate period). As at 31 December 2010, the duration of net debt was approximately 2.7 years (31 December 2009: 3.4 years). A decrease in interest rates will increase the fair value of the debt with a fi xed interest rate, but only part of this increase will be refl ected in the income statement and other comprehensive income as loans and borrowings are measured at amortised cost and therefore not adjusted to fair value.
It is estimated that a general increase in relevant interest rates of 1%-point would have increased/(decreased) profi t for the year and other comprehensive income by the amounts shown below. The estimate is based on net debt adjusted for the effect of hedging instruments as at 31 December 2010. The analysis assumes that all other variables, in particular foreign currency rates, remain constant. The analysis is performed on the same basis for 2009.
152 Annual Report 2010
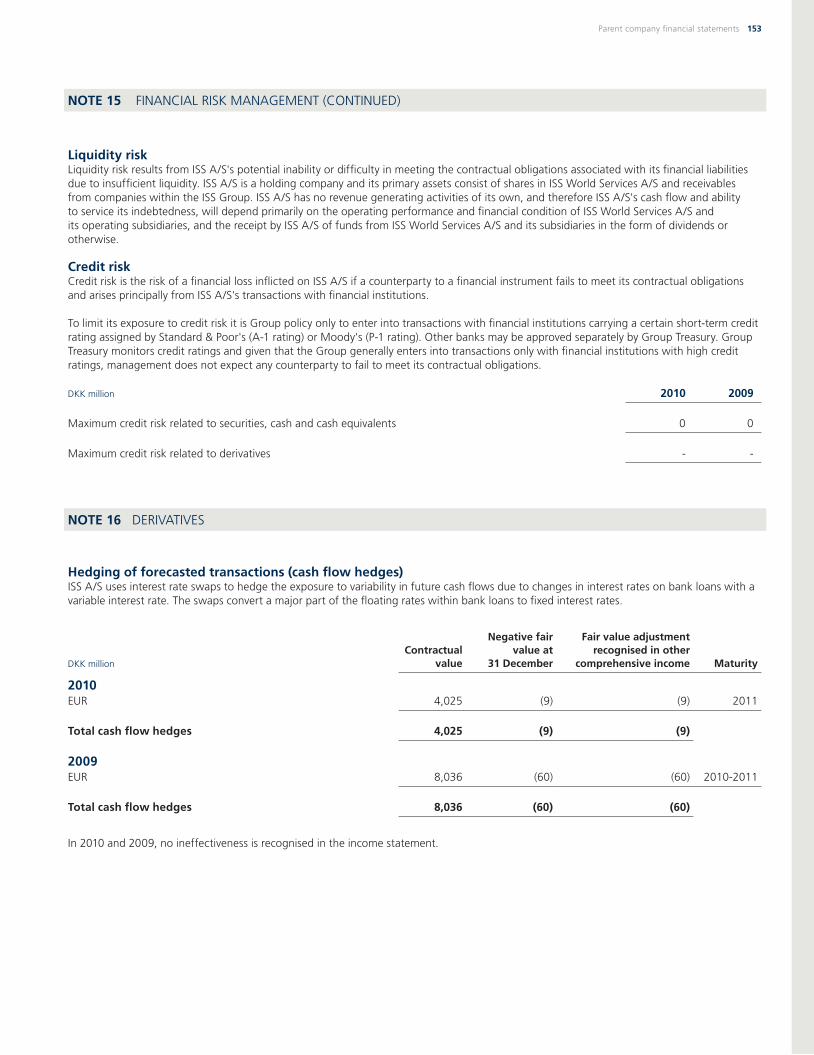
NOTE 15 FINANCIAL RISK MANAGEMENT (CONTINUED)
Liquidity riskLiquidity risk results from ISS A/S's potential inability or diffi culty in meeting the contractual obligations associated with its fi nancial liabilities due to insuffi cient liquidity. ISS A/S is a holding company and its primary assets consist of shares in ISS World Services A/S and receivables from companies within the ISS Group. ISS A/S has no revenue generating activities of its own, and therefore ISS A/S's cash fl ow and ability to service its indebtedness, will depend primarily on the operating performance and fi nancial condition of ISS World Services A/S and its operating subsidiaries, and the receipt by ISS A/S of funds from ISS World Services A/S and its subsidiaries in the form of dividends or otherwise.
Credit riskCredit risk is the risk of a fi nancial loss infl icted on ISS A/S if a counterparty to a fi nancial instrument fails to meet its contractual obligations and arises principally from ISS A/S's transactions with fi nancial institutions.
To limit its exposure to credit risk it is Group policy only to enter into transactions with fi nancial institutions carrying a certain short-term credit rating assigned by Standard & Poor's (A-1 rating) or Moody's (P-1 rating). Other banks may be approved separately by Group Treasury. Group Treasury monitors credit ratings and given that the Group generally enters into transactions only with fi nancial institutions with high credit ratings, management does not expect any counterparty to fail to meet its contractual obligations.
DKK million 2010 2009
Maximum credit risk related to securities, cash and cash equivalents 0 0
Maximum credit risk related to derivatives - -
NOTE 16 DERIVATIVES
Hedging of forecasted transactions (cash fl ow hedges) ISS A/S uses interest rate swaps to hedge the exposure to variability in future cash fl ows due to changes in interest rates on bank loans with a variable interest rate. The swaps convert a major part of the fl oating rates within bank loans to fi xed interest rates.
DKK millionContractual
value
Negative fair value at
31 December
Fair value adjustment recognised in other
comprehensive income Maturity
2010EUR 4,025 (9) (9) 2011
Total cash fl ow hedges 4,025 (9) (9)
2009EUR 8,036 (60) (60) 2010-2011
Total cash fl ow hedges 8,036 (60) (60)
In 2010 and 2009, no ineffectiveness is recognised in the income statement.
Parent company fi nancial statements 153

NOTE 17 RELATED PARTIES
In addition to the description in note 38 to the consolidated fi nancial statements of related parties and transactions with these, related parties of ISS A/S comprise ISS World Services A/S and its subsidiaries, associates, joint ventures and SPEs, see note 42 to the consolidated fi nancial statements.
In 2010, ISS A/S had the following transactions with other related parties, which were all made on market terms:
ISS A/S received/paid interest from/to ISS Global A/S and other companies within the ISS Group, see note 5, Financial income and fi nancial expenses. ISS A/S received/paid joint taxation contribution equal to 25% of taxable income from/to ISS Equity A/S (previously the ultimate parent company in Denmark), see note 13, Tax receivables and tax payables. At 22 December 2010, ISS Equity A/S was merged with FS Invest II S.à r.l with retrospective application as from 1 January 2010.
154 Annual Report 2010

MARIA JESUS LOPEZ GARCIA, EUROPASTRY, SPAIN
MUSTAFA KARATAS, DANISH CROWN, DENMARK
GABRIELA COUTINHO, BAUDUCCO, BRAZIL
FOOD & BEVERAGE – representing 3% of Group revenue The Food & Beverage customer segment includes customers who process and manufacture food and beverage products. This customer segment is subject to an array of laws and regulations which vary across the globe and therefore demand a professional choice in which we offer reliability, consistency and quality in a healthy and safe working environment.

Management statement
COPENHAGEN, 3 MARCH 2011
The Board of Directors and the Executive Group Manage-ment have today discussed and approved the Annual Report 2010 of ISS A/S. The Annual Report 2010 has been prepared in accordance with International Financial Reporting Standards (IFRS) as adopted by the EU and additional Danish disclosure requirements for annual reports.
In our opinion, the consolidated fi nancial statements and parent company fi nancial statements give a true and fair view of the Group’s and the parent company’s assets,
EXECUTIVE GROUP MANAGEMENT
Ole AndersenChairman
Leif Östling Vice-Chairman
John Allan
Michel Combes Peter Korsholm Jørgen Lindegaard
Jeff Gravenhorst Group Chief Executive Offi cer
Jakob Stausholm Group Chief Financial Offi cer
BOARD OF DIRECTORS
liabilities and fi nancial position at 31 December 2010 and of the results of the Group’s and the parent company’s operations and cash fl ows for the fi nancial year 2010. Furthermore, in our opinion the Management Review gives a fair review of the development and performance of the Group’s and the parent company’s activities and of the Group’s and the parent company’s fi nancial position taken as a whole, together with a description of the most signifi cant risks and uncertainties that the Group and parent company may face. In addition, the section Capital Structure pages 159-161 gives a fair review of the devel-opment of the Group’s capital structure.
Steven Sher
156 Annual Report 2010

Independent auditor's reportTo the shareholder of ISS A/SWe have audited the consolidated fi nancial statements and parent company fi nancial statements of ISS A/S for the fi nancial year 1 January - 31 December 2010 (pages 65-154). The consolidated fi nancial statements and parent company fi nancial statements comprise the Income state-ment, Statement of comprehensive income, Statement of cash fl ows, Statement of fi nancial position, Statement of changes in equity and Notes to the fi nancial statements for the Group as well as for the parent company. The consoli-dated fi nancial statements and parent company fi nancial statements have been prepared in accordance with the In-ternational Financial Reporting Standards (IFRS) as adopted by the EU and additional Danish disclosure requirements.
In addition to our audit, we have read the Management Review, pages 7-61 and issued a statement in this regard.
Management’s responsibilityManagement is responsible for the preparation and fair presentation of the consolidated fi nancial statements and parent company fi nancial statements in accordance with the International Financial Reporting Standards (IFRS) as adopted by the EU and additional Danish disclosure requirements for consolidated fi nancial statements and parent company fi nancial statements. This responsibility includes: designing, implementing and maintaining internal control relevant to the preparation and fair presentation of the consolidated fi nancial statements and parent company fi nancial statements that are free from material misstate-ment, whether due to fraud or error; selecting and using appropriate accounting policies; and making account-ing estimates that are reasonable in the circumstances. Further, it is the responsibility of Management to prepare and issue a Management Review that gives a fair review of the development in the Group’s and the parent company’s activities and fi nancial matters, the results for the year and the Group’s and the parent company’s fi nancial position as well as information about material risks and uncertainties affecting the Group and the parent company.
Auditor’s responsibilityOur responsibility is to express an opinion on the consoli-dated fi nancial statements and parent company fi nancial statements based on our audit. We conducted our audit in accordance with Danish and International Standards on Auditing. Those standards require that we comply with ethical requirements, and plan and perform the audit to obtain reasonable assurance regarding whether the consol-
idated fi nancial statements and parent company fi nancial statements are free from material misstatement.
An audit involves performing procedures to obtain audit evidence on the amounts and disclosures in the consolidat-ed fi nancial statements and parent company fi nancial state-ments. The procedures selected depend on the auditor’s judgement, including the assessment of the risks of material misstatement of the consolidated fi nancial statements and parent company fi nancial statements, whether due to fraud or error. In making those risk assessments, the auditors con-sider internal control relevant to the Company’s preparation and fair presentation of the consolidated fi nancial state-ments and parent company fi nancial statements in order to design audit procedures that are appropriate in the circum-stances, but not for the purpose of expressing an opinion on the effectiveness of the Company’s internal control. An audit also includes evaluating the appropriateness of ac-counting policies used and the reasonableness of account-ing estimates made by management, as well as evaluating the overall presentation of the consolidated fi nancial state-ments and parent company fi nancial statements.
We believe that the audit evidence we have obtained is suffi -cient and appropriate to provide a basis for our audit opinion.
Our audit did not result in any qualifi cation.
OpinionIn our opinion, the consolidated fi nancial statements and parent company fi nancial statements give a true and fair view of the Group’s and the parent company’s assets, liabilities and fi nancial position at 31 December 2010 and of the results of the Group’s and the parent company’s op-erations and cash fl ows for the fi nancial year then ended in accordance with the International Financial Reporting Standards (IFRS) as adopted by the EU and additional Dan-ish disclosure requirements.
Statement on the Management ReviewPursuant to the Danish Financial Statements Act, we have read the Management Review, pages 7-61 in the annual report. We have not performed any additional procedures in addi tion to the audit of the consolidated fi nancial statements and parent company fi nancial statements. On this basis, it is our opinion that the information given in the Management Review is consistent with the consolidated fi nancial state-ments and parent company fi nancial statements.
KPMG Statsautoriseret RevisionspartnerselskabCopenhagen, 3 March 2011
Jesper Ridder Olsen Claus KronbakState Authorised State AuthorisedPublic Accountant Public Accountant
Financial Statements 157

SERKAN ATSIZ, DENMARK
Additional information

Capital structure
SHARE CAPITAL
ISS is indirectly owned by funds advised by EQT Partners and Goldman Sachs Capital Partners, which hold 54% and 44% of the share capital, respectively. In addition, certain members of the Board of Directors, the Executive Group Management and a number of senior offi cers of ISS hold approximately 2% of the share capital through Directors' and Management Participation Programmes. At 31 December 2010, the carry-ing amount of Shareholders’ Equity (including non-controlling interests) was DKK 2,651 million.
CREDIT RATINGS
Standard & Poor’s continues to assign a BB- long-term credit rating to ISS and its wholly owned subsidiaries, ISS Global A/S (ISS Global) and ISS World Services A/S, and Moody’s continues to assign ISS a B2 corporate rating. Standard & Poor’s has assigned the bonds issued by ISS, ISS Global’s EMTN programme as well as the Senior Notes issued by ISS Financing plc a B rating and Moody’s has assigned the subordinated notes issued by ISS a Caa1 rating.
BONDS
ISS has issued EUR 581.5 million (DKK 4,335 million) of 8.875% senior subordinated notes maturing on 15 May 2016. ISS Global has issued EUR 110.4 million (DKK 823 million) of 4.50% senior unsecured Medium Term Notes maturing on 8 December 2014. ISS Financing plc, a special purpose vehicle, has issued EUR 525 million (DKK 3,914) of 11% senior notes maturing on 15 June 2014.
BANK LOANS
Senior credit facilitiesAt 31 December 2010, ISS Global had senior credit facili-ties of DKK 19,6 billion under which DKK 18.1 billion was drawn and DKK 0.8 billion was allocated to support performance bonds issued by operating subsidiaries. The senior credit facilities include customary loan covenant clauses, which were all complied with in 2010. The senior lenders comprise a syndicate of international banks and
institutional investors. The senior credit facilities mature in 2012 and 2013.
The Senior Facilities have been drawn in certain currenciesin addition to Danish Kroner as specifi ed under the SeniorFacilities Agreement.
Term Loans ISS has loans of DKK 13,861 million under two term loan facilities, of which DKK 746 million was
CORPORATE CREDIT RATINGS
Standard & Poor’s BB-Moody’s B2
ISS A/S senior subordinated notes
Issuer ISS A/SBloomberg ISS DCStandard & Poor’s rating BMoody’s rating Caa1Listing LuxembourgAmount outstanding EUR 581.5 millionMaturity date 15 May 2016Coupon 8.875%ISIN securities code XS0253470644Reuters DK025347064=
Global A/S Medium Term Notes
Issuer ISS Global A/SBloomberg ISS DCStandard & Poor’s rating BListing LuxembourgAmount outstanding EUR 110.4 millionMaturity date 8 December 2014Coupon 4.50%ISIN securities code XS0206714247Reuters DK020671424=
ISS Financing plc senior notes
Issuer ISS Financing plcBloomberg ISS DCStandard & Poor’s rating BListing LuxembourgAmount outstanding EUR 525 millionMaturity date 15 June 2014Coupon 11.0%ISIN securities code XS0441258117Reuters DK0441258117=
Capital Structure | Additional Information 159

borrowed under Term Facility A and DKK 13,115 million was borrowed under Term Facility B. Term Facility A, which will mature on 30 June 2012, is amortising by ap-proximately DKK 426 million in 2011; and DKK 320 million in 2012. Term Facility B, which will mature on 31 Decem-ber 2013, will be repaid with DKK 67 million in March 2011 and the remaining in two equal instalments on 30 June 2013 and 31 December 2013.
Acquisition Facilities At 31 December 2010, ISS had loans of DKK 2,751 million under two acquisition facilities, of which DKK 616 million was drawn under Acquisition Facility A and DKK 2,135 million was drawn under Acquisi-tion Facility B.
In accordance with the provisions of the Senior Facilities Agreement to repay 50% of the excess cash fl ow relating to the previous fi nancial year, ISS repaid DKK 276.5 million under Acquisition Facility A in 2010.
Acquisition Facility A matures on 30 June 2012 and is amortis-ing by DKK 455 million in 2011 and DKK 161 million in 2012.
The drawn amount under Acquisition Facility B matures on 31 December 2013 and will be repaid with DKK 11 million in March 2011 and the remaining in two equal instalments on 30 June 2013 and 31 December 2013.
Revolving Credit Facility ISS has a revolving credit fa-cility (RCF) in an amount equivalent to DKK 2,500 million, of which amounts equivalent to DKK 1,253 million were drawn as of 31 December 2010. Borrowings under the RCF are provided primarily by local lenders to certain sub-sidiaries and are included in current loans and borrowings in ISS’s consolidated fi nancial statements. In addition DKK 696 million of the revolving credit facility was allocated to support performance bonds issued by operating subsidi-aries. The RCF will mature on 30 June 2012.
Letter of Credit Facility ISS has a letter of credit facility in the amount of DKK 500 million. Letters of credit are issued primarily in support of borrowings, other than bor-rowings under the revolving credit facility or the Secured Local Facilities, and, to the extent that these borrowings are deemed to constitute indebtedness, the borrowings are included in current Loans and borrowings and non- current Loans and borrowings in ISS’s consolidated fi nan-cial statements. DKK 126 million of the Letter of Credit facility was allocated to support performance bonds issued by operating subsidiaries. The letter of credit facility will mature on 30 June 2012.
SecuritisationIn 2009, ISS initiated a securitisation of trade receivables programme in Spain, Norway, Denmark, Sweden and the United Kingdom.
During 2010, Austria, Belgium, France, Germany and the Netherlands have been added to the programme. The programme has a total credit facility of EUR 500 million and at 31 December 2010, EUR 331 million (DKK 2,466 million) had been utilised. The proceeds were used to redeem the EMTNs that matured in September 2010. In accordance with the Senior Facilities Agreement, addi-tional proceeds raised under the programme will be used to repay Senior Credit facilities. Usually, a securitisation programme is backed by a 360 days facility, however to avoid having to roll the programme on a yearly basis, the facility was originally put in place as a 3 year facility, and will expire 14 September 2012. The existing securitisation programme can be extended for an additional year at a time, and since it is structured according to S&P's meth-odology this can be done both with the existing banks (HSBC and Nordea) or a third party, should this become relevant.
Second lien facilityOn 31 December 2010, ISS had DKK 4.473 million, EUR 600 million of second lien facility. The second lien facility includes customary loan covenant clauses, which were all complied with in 2010.
The second lien lenders comprise a syndicate of interna-tional institutional investors. The second lien facility will mature on 30 June 2015.
Other credit facilitiesFurther to the above, ISS had DKK 555 million of other credit facilities as of 31 December 2010. Such facilities comprise mainly fi nance leases, mortgage debt and other local credit facilities, which are not part of the senior facilities.
Financial leveragePro forma Adjusted EBITDA is adjusted to refl ect the full year effect of acquired or divested businesses. Estimated pro forma Adjusted EBITDA of acquired and divested busi-nesses represents the net aggregate estimated Adjusted EBITDA of businesses acquired or divested for the period from 1 January 2010 to the date of its acquisition or divestment by the Group. At 31 December 2010, carry-ing amount of Net debt was DKK 30,619 million and Pro forma adjusted EBITDA was estimated to be approximate-ly DKK 5,068 million. Consequently, the ratio of net Debt to Pro forma adjusted EBITDA was decreased to 6.04x from 6.47x at 31 December 2009.
160 Annual Report 2010

SUMMARY OF CREDIT FACILITIES
DKK millionPrincipal
value Drawn CurrencyCoupon/
margin Maturity
Bonds:Senior subordinated notes due 2016 4,335 4,335 EUR 8.875% 15 May 2016Senior notes due 2014 3,914 3,914 EUR 11.00% 15 Jun 2014Medium term notes due 2014 823 823 EUR 4.50% 8 Dec 2014
9,072 9,072
Bank loans:
Senior facilities: Term facility A 746 746 SEK, NOK, CHF + 200bps 30 Jun 2012 Term facility B 13,115 13,115 EUR, GBP + 200bps 31 Dec 2013 Acquisition facility A 616 616 Multi Currency + 225bps 30 Jun 2012 Acquisition facility B 2,135 2,135 Multi Currency + 225bps 31 Dec 2013 Revolving credit facility 2,500 1,253 Multi Currency + 225bps 30 Jun 2012 Letter of credit facility 500 191 Multi Currency + 225bps 30 Jun 2012Second lien facility 4,473 4,473 EUR + 375bps 30 Jun 2015Securitisation 3,727 2,466 Multi Currency +300bps 14 Sep 2012
27,812 24,995
PRO FORMA ADJUSTED EBITDA
DKK million 2010 2009
Adjusted EBITDA 5,117 4,742Estimated pro forma adjusted EBITDA of acquired and divested businesses (49) 31
5,068 4,773
NET DEBT AS OF 31 DECEMBER 2010
Carrying value
Leverage(x Pro forma
EBITDA)
Senior facilities 17,957 3.55xSecond lien facility 4,430 0.87xSenior subordinated notes due 2016 4,259 0.84xSenior notes due 2014 3,765 0.74xMedium term notes due 2014 742 0.15xSecuritisation 2,401 0.47xInterest rate swaps 135 0.03xOther current and non-current loans and borrowings 555 0.11x
34,244 6.76x
Total cash and cash equivalents and securities (3,625) (0.72)
30,619 6.04x
Note: For further information on the Group's Loans and borrowings, see note 29 to the consolidated fi nancial statements.
Capital Structure | Additional Information 161

ROKIA KALTÉ, SANOFI AVENTIS, FRANCE
PHARMACEUTICALS – representing 2% of Group revenue The Pharmaceutical customer segment consists of developers and manufacturers and marketers of licensed drugs. ISS services both generic and branded customers. Since this customer segment is subject to a variety of laws and regulations regarding the patenting, testing and marketing of drugs, our customers demand a professional choice in which we offer reliability, consistency and quality in a healthy, safe and more comfortable work environment.

DKK MILLION 2010
COUNTRYTOTAL REVENUE
TOTAL EMPLOYEES
CLEANING SERVICES
PROPERTY SERVICES
SUPPORT SERVICES
CATERING SERVICES
SECURITY SERVICES
FACILITYMANAGEMENT
France 8,084 34,246
United Kingdom 7,384 41,061
Norway 5,681 13,591
Australia 4,583 12,883
Spain 4,446 29,723
Sweden 3,898 9,768
Finland 3,841 11,766
Denmark 3,714 9,027
Netherlands 3,350 18,117
Belgium and Luxembourg 3,181 10,338
Switzerland 2,865 10,773
USA 2,623 14,891
Germany 2,580 11,335
Turkey 1,826 21,145
Brazil 1,734 19,507
Israel 1,657 12,217
Hong Kong 1,413 15,109
Austria 1,383 6,885
Singapore 1,004 7,814
Indonesia 890 52,919
Greece 798 4,647
Thailand 686 26,027
Ireland 587 3,002
India 581 44,895
Portugal 572 8,505
Mexico 511 15,223
New Zealand 435 2,484
Chile 433 10,258
Czech Republic 421 4,327
Italy 388 1,124
China 306 10,744
Argentina 302 3,951
Slovakia 270 4,448
Taiwan 265 2,559
Poland 198 2,506Slovenia 170 1,198Romania 166 2,022
Hungary 152 1,972
Estonia 126 1,563
Malaysia 104 1,835
Greenland 94 278
Uruguay 89 1,393
Philippines 79 2,196
Iceland 74 730
Russia 70 762
Japan 50 34
Croatia 29 400
Brunei 24 355
South Africa 1) 20 0
Canada 2) 2 2
Country eliminations (2)
Corporate / eliminations (65) 122
Total 74,073 522,677
ISS Group & Services
1) The South African activities are managed by the Global Corporate Clients organisation.2) The Canadian activities are managed by the US organisation.
ISS Group & Services | Additional Information 163

ARGENTINA ISS Argentina S.A.Bazurco 2355C1419FKCBuenos AiresArgentinaTel.: +54 11 4830 4100Fax: +54 11 4830 4111Country Manager: Alejandro Luis Avilawww.ar.issworld.com
AUSTRALIA ISS facility services Australia Ltd.Unit 1, 12 Mars Road Lane Cove NSW 2066AustraliaTel : +61 2 8644 9700Fax : +61 2 8987 5830Country Manager: Dane Hudsonhttp://www.au.issworld.com/
AUSTRIA ISS facility services GmbHBrünner Strasse 851210 ViennaAustriaTel.: +43 (0) 5 7400 1000Fax: +43 (0) 5 7400-991000Country Manager: Thomas Hinnerskovwww.at.issworld.com
BELGIUM ISS N.V.Steenstraat 20/11800 Vilvoorde / KoningsloBelgiumTel.: +32 2 263 66 11Fax: +32 2 263 66 12Country Manager: Kris Clootswww.be.issworld.com
BRAZILISS Servisystem do Brasil LtdaEstrada do Kaiko 8CEP: 06843-900 Embu - São PauloBrazilTel.: +55 11 21 35 37 00Fax: +55 11 47 04 62 52Country Manager: Jorge Luis Limawww.br.issworld.com
BRUNEI ISS facility services Sdn. Bhd.1A, Bangunan Menglait 1, Mile 2Jalan GadongBandar Seri Begawan BE3919Brunei DarussalamTel.: +673-2420973Fax: +673-2446498Country Manager: Houtman Simanjuntakwww.bn.issworld.com
BULGARIA 1) ISS facility services EOODRakovski Str., No 100, fl oor 3 Sofi a 1000BulgariaTel.: +359 2 815 54 63Fax: +359 2 981 43 50Country Manager: Jan Bohácek
CHILE ISS facility services S.A.Avenida Las Torres 1385El Rosal - HuechurabaSantiago de ChileTel.: +56 27 26 65 00Fax: +56 27 26 65 07 Country Manager: Miguel Galmeswww.cl.issworld.com
CHINA ISS HongrunFacility services (Shanghai) Limited13/F, Yinlu Mansion1112 Pingliang RoadShanghaiChinaTel: +8621 6519 5234Fax: +8621 6519 6412Country Manager: Jack Zhouwww.cn.issworld.com
CROATIA ISS Uslužne djelatnosti d.o.o.Radnicka cesta 8010000 ZagrebCroatiaTel.: +385 1 61 55 868Fax: +385 1 61 55 869Country manager: Igor Rajkovicwww.hr.issworld.com
CZECH REPUBLIC ISS facility services s.r.o.Eastbuilding, Antala Staska 510/38140 00 Prague 4 - KrcCzech RepublicTel.: +420 2 6139 2311Fax: +420 2 6139 2320Country Manager: Jan Bohácekwww.cz.issworld.com
DENMARK ISS facility services A/SMøntmestervej 312400 Copenhagen NVDenmarkTel.: +45 38 17 17 17Fax: +45 38 33 40 11Country Manager: Maarten van Engelandwww.dk.issworld.com
ESTONIA ISS Haldus OüVilde tee 12912613 TallinnEstoniaTel.: +372 613 9107Fax.: +372 613 9132Country Manager: Priit Paistewww.iss.ee
FINLANDISS Palvelut OyP.O. Box 100 (visiting address: Rajatorpantie 8 A - Vantaa)01055 ISSFinlandTel. +358 205 155Fax +358 205 150 155Country Manager: Kari Virta www.fi .issworld.com
FRANCE ISS Holding Paris SAS65, rue Ordener75018 ParisFranceTel.: +33 1 44 04 48 87Fax: +33 1 44 92 48 00Country Manager: Yann Coléouwww.fr.issworld.com
GERMANY ISS facility services GmbHWanheimer Straße 9240468 DüsseldorfGermanyTel.: +49 211 30278-0Fax: +49 211 30278-222 Country Manager: Alexander Granderathwww.de.issworld.com
GREECE ISS facility services S.A.479 Mesogeion Avenue153 43 Agia Paraskevi, AthensGreeceTel.: +30 210 27 05 600Fax: +30 210 27 25 623Country Manager, interim: Jacob Götzschewww.gr.issworld.com
GREENLAND ISS Grønland A/SPostboks 5193900 NuukGreenlandTel.: +299 34 20 50Fax: +299 34 20 77General Manager: Jesper Hansenwww.gl.issworld.com
HONG KONGISS facility services Limited18/F Warwick House WestTaikoo Place, 979 King’s RoadQuarry Bay, Hong KongTel.: +852 2826 9166Fax: +852 2869 1441Country Manager: Keith Futcherwww.hk.issworld.com
HUNGARY ISS facility services Kft.Peterdy u. 151071 BudapestHungaryTel.: +36 (1) 413-3140Fax: +36 1 413-3141Country Manager: György Györfi www.hu.issworld.com
ICELANDISS Iceland ehfAusturhraun 7,210 GardabaerIcelandTel.: +354 5800 600Fax: +354 5800 666Country Manager: Gudmundur Gudmundssonwww.is.issworld.com
INDIA ISS integrated facility services Pvt. Ltd.Godrej Industrial Complex, Road No. 4.Pirojshanagar, EasternExpress Highway,Vikhroli (East) Mumbai - 400079IndiaTel. +91 22 25197866Fax +91 22 25197065Country Manager: K.J. Jollywww.in.issworld.com
INDONESIA PT ISS INDONESIAGraha ISSJl. Jend. Sudirman Blok J No. 3Bintaro Jaya 15229IndonesiaTel: +6221 748 64490Fax: +6221 748 64491Country Manager: Houtman Simanjuntakwww.id.issworld.com
IRELAND ISS facility services3007 Lake DriveCitywest business campus Dublin 24IrelandTel.: +353 1 468 2900Fax: +353 1 468 2901Country Manager: Paul Lynch www.ie.issworld.com
Country addresses
In addition to the 50 operating country shown above, where ISS operates and has an offi ce, ISS also operates in 13 countries where we have not established an offi ce yet. These countries are: Bosnia and Herzegovina, Canada, Colombia, Costa Rica, Ecuador, Latvia, Lithuania, Panama, Peru, Puerto Rico, South Africa, Ukraine and Venezuela.1) The Group's revenue generated from activities in Bulgaria is reported as part of the activities in the Czech Republic.
164 Annual Report 2010

isrAElISS Israel ltd30 Hacharoshet st.,P.o.B. 703,or-yehuda 60256,Israel Tel.: +972-3-538-2236Fax: +972-3-538-2240Country Manager: Shimon Shovalwww.il.issworld.com
itAly ISS facility services S.r.l.Via E Bugatti 1220142 MilanoItalyTel.: +39 02 82681299Fax: +39 02 82681994 Country Manager: Antonio Ivewww.it.issworld.com
JApAn ISS Japan Co.,Ltd. Sunflower Bldg. 2F, 2-11-17, Kyobashi, Chuo-ku, Tokyo JapanPhone: 03-5159-6760Fax: 03-5159-6761
luxEmBourg ISS facility services S.A.Rue Christophe Plantin 5L - 2339 GasperichLuxembourgTel.: +352 42 46 20 1Fax: +352 42 46 20 20Country Manager: Kris Clootswww.lu.issworld.com
mAlAysiA ISS facility services Sdn Bhdno. 18, Jalan 19/146300 Petaling JayaSelangorMalaysiaTel: +603 7968 8288/7968 8388Fax: +603 7968 2388Country Manager: Simon Limwww.my.issworld.com
mExiCoGrupo ISS MéxicoAquiles Serdán 157Col. Ángel Zimbrón02090 México DFTel.: +52 (55) 9114 1300Fax: +52 (55) 9114 1312Country Manager: Claus E. Madsenwww.mx.issworld.com
nEthErlAnds ISS facility services nederlandRijnzathe 83454 PV De MeernnetherlandsTel.: +31 30 242 43 44Fax: +31 30 241 39 47Country Manager: Peter van der Vorm www.nl.issworld.com
nEw zEAlAnd ISS facility services2 Arthur Brown PlaceMt WellingtonAucklandnew ZealandTel.: +64 95 73 45 00Fax.: +64 95 73 56 45Country Manager: Brian young www.nz.issworld.com
norwAy ISS facility services ASPostboks 132 Økern(visiting address: Sjølyst Plass 2)0509 oslonorwayTel.: +47 815 55 155Fax: +47 228 85 400Country Manager: Hans John Øiestadwww.no.issworld.com
philippinEs ISS facility services Phils., Inc.CRB Road Cor Bagsakan RoadFTI Complex, Taguig CityPhilippines Tel: +632 838 6144 to 48Fax: +632 837 1113Country Manager: Peter Lundwww.ph.issworld.com polAnd ISS facility services Sp. z o.o.ul. Flisa 202-247 WarsawPolandTel.: +48 22 577 4200Fax: +48 22 612 5345Country Manager: Krzysztof Poznanskiwww.pl.issworld.com
portugAl ISS facility services LdaRua Moinho da Barrunchada, 4 - 1º Dtº2790-109 CarnaxidePortugalTel.: +351 21 424 67 60Fax: +351 21 424 67 99Country Manager: José Martinswww.pt.issworld.com
romAniA ISS facility services SRL13 Ferdinand I Blvd021381 Sector 2, BucharestRomaniaTel: +40 21 2524785Fax: +40 21 2524777Country Manager: Dan Jacotawww.ro.issworld.com
russiA Facility services RuS LLC21 noviy Arbat str.119019, MoscowRussiaTel.: +7 (495) 933 44 73Fax: +7 (495) 642 96 44 Country Manager: Elena Lipskayawww.ru.issworld.com
singAporE ISS facility services Private Limitedno.1 Jalan Kilang Timor#10-00 Pacific Tech CentreSingapore 159303Tel.: +65 6 227 9711Fax: +65 6 225 8340Country Manager: C.C. Woonwww.sg.issworld.com
slovAkiA ISS facility services spol. s r.o. Mokráň Záhon 2821 04 BratislavaSlovakiaTel : +421 2 32 630 111Fax: +421 2 32 630 199Country Manager: Jan Bohácekwww.sk.issworld.com
slovEniA ISS facility services d.o.o.Tržaška cesta 37A2000 MariborSloveniaTel.: +386 2 450 33 00Fax: +386 2 450 33 38Country Manager: Rudi Zupanwww.si.issworld.com
spAin ISS facility services S.A.C/ Francesc Viñas, 7 - 08174Sant Cugat del Vallès - Barcelona SpainTel: +34 93 590 3060 Fax: +34 93 590 0627Country Manager: Joaquim Borrás Ferréwww.iss.es
swEdEn ISS facility services AB Årstaängsvägen 11Box 47635117 94 StockholmSwedenTel.: +46 8 681 60 00Fax: +46 8 681 63 90 Country Manager: Lars Täuberwww.se.issworld.com
switzErlAnd ISS Schweiz AGBuckhauserstrasse 22Postfach 8010 ZürichSwitzerlandTel. +41 58 787 80 00Fax +41 58 787 80 11Country Manager: André nauerwww.ch.issworld.com
tAiwAn ISS facility services LTD.10F - 1, no. 20, Sec. 3, BaDe RoadTaipei Tawain 105Tel.: +886 2 2577 4888Fax: +886 2 2577 4948Country Manager, interim: Mark Ting www.tw.issworld.com
thAilAnd ISS facility services Co., Ltd.92/9 Moo 7, Phaholyothin RoadAnusawaree, BangkhenBangkok 10220ThailandTel.: +66 2 552 5015Fax: +66 2 552 1260Country Manager: Theinsiri Theingviboonwongwww.th.issworld.com
turkEy ISS Tesis yönetim Hizmetleri A.S.Kore Sehitleri Cad. Mithat ulu Ünlü Sok. no:19 Zincirlikuyu 34394IstanbulTurkeyTel.: +90 212 354 74 00Fax: +90 212 274 63 50Country Manager: Cavit Habibhttp://www.tr.issworld.com/
unitEd kingdom ISS uK LimitedISS HouseGenesis Business ParkAlbert DriveWoking Surrey Gu21 5RWunited KingdomTel +44 845 057 6500Fax +44 871 429 6500Country Manager: Henrik Andersenwww.uk.issworld.com
uruguAy Dr. Carlos María de Pena 4368 esquina Palomeque12.900 Montevideo uruguayTel: +598 2 3046012Fax.: +598 2 3046012 ant 201Country Manager: Alejandro Luis Avilawww.uy.issworld.com
usA ISS facility services Inc.1019 Central Parkway north, Suite 100San Antonio, Texas 78232uSATel.: +1 210 495 6021Fax: +1 210 495 6071Country Manager: Sean Bondwww.us.issworld.com
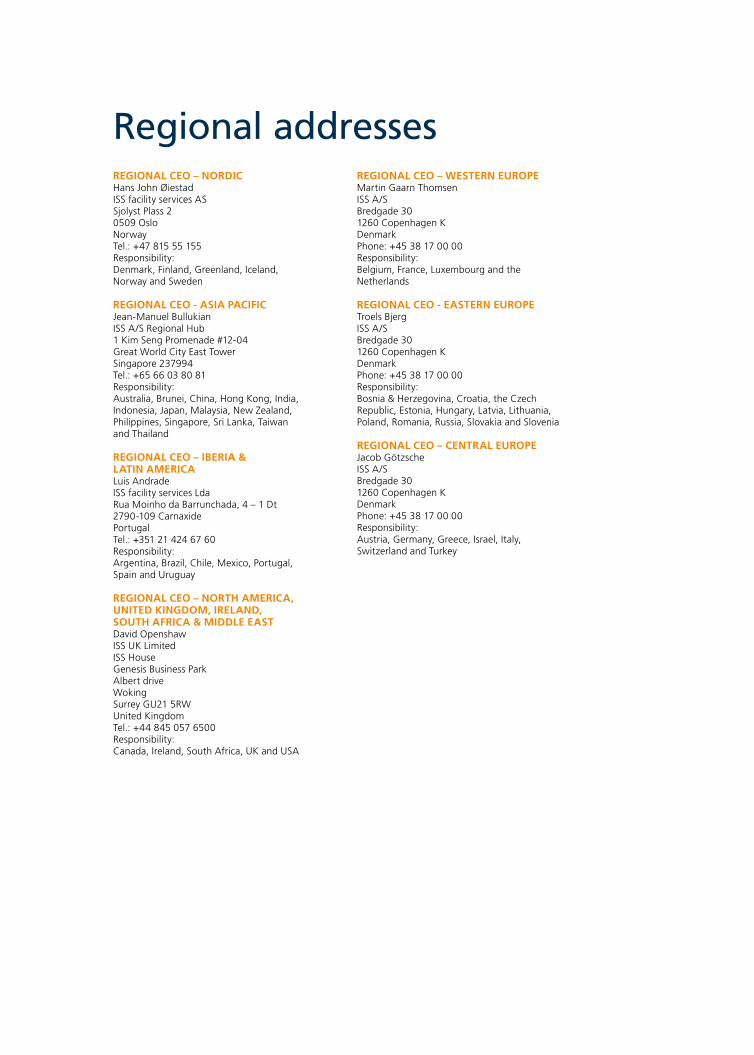
rEgionAl CEo – nordiCHans John ØiestadISS facility services ASSjolyst Plass 20509 oslonorwayTel.: +47 815 55 155Responsibility:Denmark, Finland, Greenland, Iceland, norway and Sweden
rEgionAl CEo - AsiA pACifiCJean-Manuel BullukianISS A/S Regional Hub1 Kim Seng Promenade #12-04Great World City East TowerSingapore 237994Tel.: +65 66 03 80 81Responsibility:Australia, Brunei, China, Hong Kong, India, Indonesia, Japan, Malaysia, new Zealand, Philippines, Singapore, Sri Lanka, Taiwan and Thailand
rEgionAl CEo – iBEriA & lAtin AmEriCA Luis AndradeISS facility services LdaRua Moinho da Barrunchada, 4 – 1 Dt2790-109 CarnaxidePortugalTel.: +351 21 424 67 60Responsibility:Argentina, Brazil, Chile, Mexico, Portugal, Spain and uruguay
rEgionAl CEo – north AmEriCA, unitEd kingdom, irElAnd, south AfriCA & middlE EAstDavid openshawISS uK LimitedISS HouseGenesis Business ParkAlbert driveWokingSurrey Gu21 5RWunited KingdomTel.: +44 845 057 6500Responsibility:Canada, Ireland, South Africa, uK and uSA
rEgionAl CEo – wEstErn EuropEMartin Gaarn ThomsenISS A/SBredgade 301260 Copenhagen KDenmarkPhone: +45 38 17 00 00Responsibility: Belgium, France, Luxembourg and the netherlands
rEgionAl CEo - EAstErn EuropETroels BjergISS A/SBredgade 301260 Copenhagen KDenmarkPhone: +45 38 17 00 00Responsibility:Bosnia & Herzegovina, Croatia, the Czech Republic, Estonia, Hungary, Latvia, Lithuania, Poland, Romania, Russia, Slovakia and Slovenia
rEgionAl CEo – CEntrAl EuropEJacob GötzscheISS A/SBredgade 301260 Copenhagen KDenmarkPhone: +45 38 17 00 00Responsibility:Austria, Germany, Greece, Israel, Italy, Switzerland and Turkey
Regional addresses

ContaCt information
ISS A/S
Bredgade 30
DK-1260 Copenhagen K
Denmark
Tel: +45 38 17 00 00
Fax: +45 38 17 00 11
www.issworld.com
CVR 28 50 47 99
Group Communications
Kenth Kærhøg,
Head of Group
Communications
Tel: +45 38 17 00 00
EDITED By:
Group Controlling
ISS A/S
DESIGn:
KP2 A/S
PRoDuCTIon & PRInT:
KP2 A/S
Denmark
March 2011.
KP2 is
environmentally
certified after
DS/En ISo
14001:2004 and EMAS
and FSC certified.
FS InVEST S.À R.L.:
FS Invest is the ultimate
parent company for which
consolidated financial
statements are prepared.
The consolidated financial
statements can be
obtained from FS Invest,
2 rue de Fosse, L-1536
Luxembourg.
AnnA Enqvist, swEdEn

ISS A/S · BREDGADE 30 · DK-1260 COPENHAGEN K · DENMARKWWW.ISSWORLD.COM · TEL: +45 38 17 00 00 · FAX: +45 38 17 00 11