DNB BANK - DNB - Investor relations
120
Annual report 2012 – a company in the DNB Group DNB BANK
-
Upload
khangminh22 -
Category
Documents
-
view
3 -
download
0
Transcript of DNB BANK - DNB - Investor relations
DN
B Bank Annual R
eport 2012
Annual report 2012
– a company in the DNB GroupDNB BANK


DNB Bank Annual Report 2012 1
Contents
Important events in 2012 ................................................... 2 Financial highlights ............................................................. 3 Directors' report .................................................................... 4 Annual accounts ................................................................. 16 Income statement .......................................................................... 16 Balance sheet ................................................................................. 17 Statement of changes in equity ....................................................... 18 Cash flow statement ....................................................................... 19 Accounting principles ...................................................................... 20 Notes to the accounts Note 1 Important accounting estimates and discretionary assessments .................................................................. 29 Note 2 Changes in group structure ............................................. 31 Note 3 Segments ....................................................................... 32 Note 4 Capitalisation policy and capital adequacy ...................... 35 Note 5 Risk management .......................................................... 39 Credit risk Note 6 Credit risk ....................................................................... 42 Note 7 Loans and commitments for principal customer groups ... 47 Note 8 Loans and commitments according
to geographical location .................................................. 49 Note 9 Impaired loans and guarantees for principal
customer groups ............................................................ 53 Note 10 Impairment of loans and guarantees ............................... 54 Note 11 Impairment of loans and guarantees
for principal customer groups .......................................... 55 Note 12 Developments in impairment of loans and guarantees .... 56 Market risk Note 13 Market risk ..................................................................... 57 Note 14 Interest rate sensitivity .................................................... 57 Note 15 Currency positions .......................................................... 58 Note 16 Financial derivatives ....................................................... 58 Liquidity risk Note 17 Liquidity risk ................................................................... 61 Income statements Note 18 Net interest income ........................................................ 64 Note 19 Interest rates on selected balance sheet items ............... 65 Note 20 Net commission and fee income ..................................... 65 Note 21 Other income ................................................................. 66 Note 22 Net gains on financial instruments at fair value ............... 66 Note 23 Salaries and other personnel expenses .......................... 67 Note 24 Other expenses ............................................................. 67 Note 25 Depreciation and impairment of fixed and intangible assets ............................................................ 67 Note 26 Pensions ........................................................................ 68 Note 27 Number of employees/full-time positions ......................... 71 Note 28 Taxes ............................................................................. 72
Balance sheet Note 29 Classification of financial instruments ............................. 74 Note 30 Fair value of financial instruments at amortised cost ...... 76 Note 31 Financial instruments at fair value .................................. 78 Note 32 Shareholdings ............................................................... 83 Note 33 Repurchase agreements and securities lending ............. 84 Note 34 Securities recieved which can be sold or repledged ....... 85 Note 35 Commercial paper and bonds, held to maturity .............. 85 Note 36 Investment properties .................................................... 87 Note 37 Investments in associated companies ............................. 87 Note 38 Investments in subsidiaries ............................................ 88 Note 39 Intangible assets ............................................................ 89 Note 40 Goodwill ......................................................................... 91 Note 41 Fixed assets ................................................................... 93 Note 42 Leasing ......................................................................... 94 Note 43 Other assets .................................................................. 95 Note 44 Deposits from customers for principal customer groups ............................................................ 95 Note 45 Debt securities issued .................................................... 96 Note 46 Subordinated loan capital and perpetual
subordinated loan capital securities ............................... 98 Note 47 Provisions ..................................................................... 100 Note 48 Other liabilities .............................................................. 100 Additional information Note 49 Remunerations etc. ....................................................... 101 Note 50 Information on related parties ....................................... 106 Note 51 Off-balance sheet transactions, contingencies
and post-balance sheet events ..................................... 109 Signatures of the board members ................................................. 110 Statement pursuant to the Securities Trading Act .......................... 111 Auditor's report .................................................................. 112 Control Committee's report ......................................... 113 Key figures ........................................................................... 114 Governing bodies .............................................................. 115
2 DNB Bank Annual Report 2012
Important events in 2012
First quarter
• Finanstilsynet’s (the Financial Supervisory Authority of Norway) new rules on a minimum 15 per cent down payment for home mortgages entered into force
• DNB Bank Group established a pilot project for Norwegian bank production in Latvia
• DNB Livsforsikring signed a contract to purchase the three buildings which constitute the DNB Bank Group’s new headquarters in Bjørvika in Oslo
Second quarter
• DNB Bank Group launched the savings products SuperSave and Junior HomeSave
• DNB Bank Group’s shares in Nordisk Tekstil Holding AS, which were acquired in 2009, were sold at a profit after a successful restructuring process
• DNB and two large Swedish banks were downgraded one notch by Moody’s credit rating agency
Third quarter
• DNB presented new financial targets at its Capital Markets Day event
• DNB continued to climb on Ipsos MMI’s Norwegian corporate reputation list and was ranked best among the banks
• DNB still qualified for inclusion in the Dow Jones Sustainability Index and thus remains among the top 10 per cent companies within its industry group
• DNB Bank Group entered into an agreement to sell its wholly-owned Swedish subsidiary SalusAnsvar AB
• DNB Bank Group started to move into its new headquarters in Bjørvika in Oslo
Fourth quarter
• The EU Ministers of Finance decided to establish a single supervisory authority for the largest banks in the eurozone
• Nordlandsbanken and DNB Bank were formally merged
• DNB Bank Group entered into an agreement to sell the branch network in Poland
DNB Bank Annual Report 2012 3
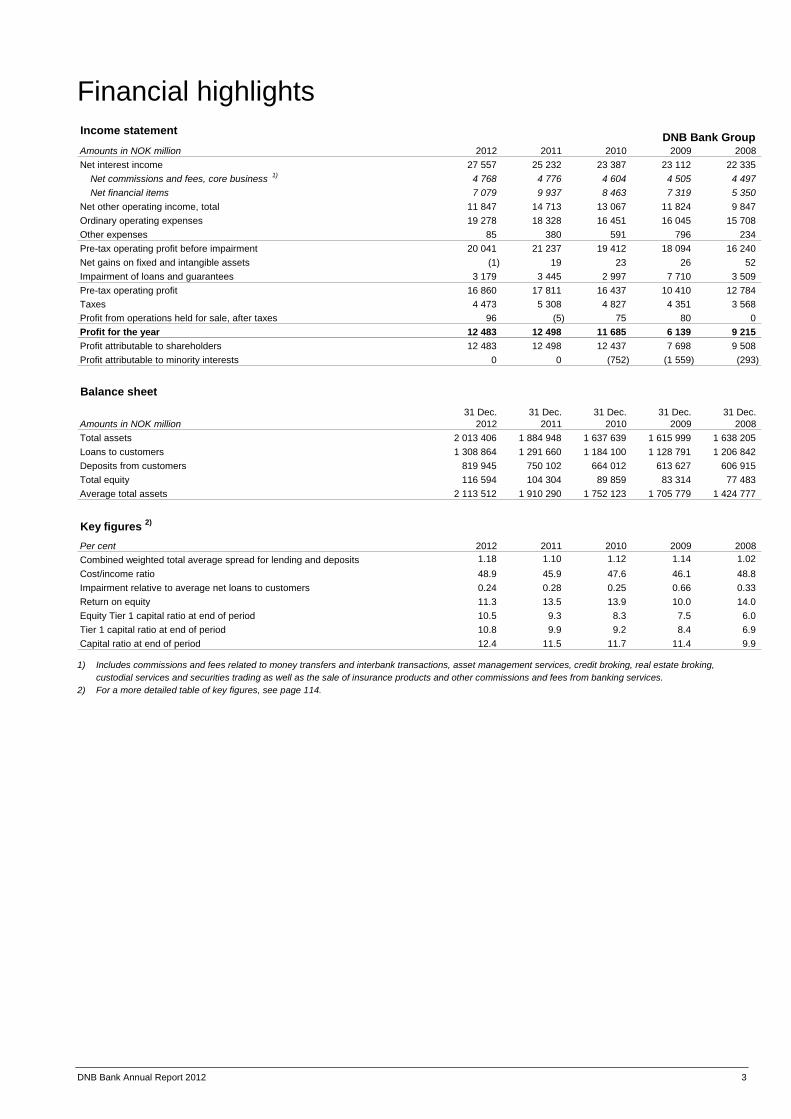
Financial highlights Income statement DNB Bank Group Amounts in NOK million 2012 2011 2010 2009 2008 Net interest income 27 557 25 232 23 387 23 112 22 335
Net commissions and fees, core business 1) 4 768 4 776 4 604 4 505 4 497 Net financial items 7 079 9 937 8 463 7 319 5 350
Net other operating income, total 11 847 14 713 13 067 11 824 9 847 Ordinary operating expenses 19 278 18 328 16 451 16 045 15 708 Other expenses 85 380 591 796 234 Pre-tax operating profit before impairment 20 041 21 237 19 412 18 094 16 240 Net gains on fixed and intangible assets (1) 19 23 26 52 Impairment of loans and guarantees 3 179 3 445 2 997 7 710 3 509 Pre-tax operating profit 16 860 17 811 16 437 10 410 12 784 Taxes 4 473 5 308 4 827 4 351 3 568 Profit from operations held for sale, after taxes 96 (5) 75 80 0 Profit for the year 12 483 12 498 11 685 6 139 9 215 Profit attributable to shareholders 12 483 12 498 12 437 7 698 9 508 Profit attributable to minority interests 0 0 (752) (1 559) (293)
Balance sheet
31 Dec. 31 Dec. 31 Dec. 31 Dec. 31 Dec. Amounts in NOK million 2012 2011 2010 2009 2008 Total assets 2 013 406 1 884 948 1 637 639 1 615 999 1 638 205 Loans to customers 1 308 864 1 291 660 1 184 100 1 128 791 1 206 842 Deposits from customers 819 945 750 102 664 012 613 627 606 915 Total equity 116 594 104 304 89 859 83 314 77 483 Average total assets 2 113 512 1 910 290 1 752 123 1 705 779 1 424 777
Key figures 2)
Per cent 2012 2011 2010 2009 2008 Combined weighted total average spread for lending and deposits 1.18 1.10 1.12 1.14 1.02Cost/income ratio 48.9 45.9 47.6 46.1 48.8 Impairment relative to average net loans to customers 0.24 0.28 0.25 0.66 0.33 Return on equity 11.3 13.5 13.9 10.0 14.0 Equity Tier 1 capital ratio at end of period 10.5 9.3 8.3 7.5 6.0 Tier 1 capital ratio at end of period 10.8 9.9 9.2 8.4 6.9 Capital ratio at end of period 12.4 11.5 11.7 11.4 9.9
1) Includes commissions and fees related to money transfers and interbank transactions, asset management services, credit broking, real estate broking, custodial services and securities trading as well as the sale of insurance products and other commissions and fees from banking services.
2) For a more detailed table of key figures, see page 114.

4 Director’s report DNB Bank Annual Report 2012
Director`s Report DNB Bank Group 1) is part of the DNB Group. The DNB Group is Norway's largest financial services group and one of the largest in the Nordic region in terms of market capitalisation. The DNB Group offers a full range of financial services, including loans, savings and advisory services, insurance and pension products for retail and corporate customers and the public sector. The banking group serves customers in Norway through the country’s largest distribution network for financial services, a 24/7 customer service telephone and electronic services such as Internet and SMS banking. Internationally, the banking group is among the world's leading banks within its priority areas energy, shipping and seafood. Operations in 2012 DNB Bank Group 1) recorded profits of NOK 12 483 million in 2012, a decrease of NOK 14 million or 0.1 per cent compared with 2011. Adjusted for the accounting effect of basis swaps 2), there was a rise in profits of NOK 3 382 million or 32.8 per cent. The increase was primarily due to higher net interest income, a rise in other operating income and lower taxes. Compared with 2011, there was a significant increase in costs to finance the banking group’s lending operations in the form of both higher deposit rates relative to the short-term money market rate and a rise in long-term funding costs. Wider lending spreads compensated for the higher costs, and net interest income was up 9.2 per cent from 2011 to 2012. Lending growth was relatively brisk in the second half of 2011, but the rate of growth abated throughout 2012. In terms of NOK, deposits increased significantly more than loans from 2011 to 2012, which gave a marked increase in the ratio of deposits to net loans, from 58.1 per cent at end-December 2011 to 62.6 per cent at year-end 2012. Adjusted for the effect of basis swaps, other operating income rose by NOK 1 853 million or 16 per cent. Due to reduced financial market uncertainty, there was an increase in other operating income in most areas of operation. Total operating expenses rose by NOK 656 million or 3.5 per cent from 2011. Adjusted for non-recurring effects and costs pertaining to non-core operations, operating expenses were up 3.2 per cent. There was an increase in pension expenses due to lower interest rate levels. New initiatives entailing an increase in full-time positions in the largest Norwegian cities and at certain international offices in the second half of 2011 also contributed to the rise in costs from 2011 to 2012. Impairment losses on loans and guarantees were reduced by NOK 265 million from 2011. At NOK 3179 million, impairment was roughly on a level with indications in the annual report for 2011 and estimates in the quarterly reports through 2012. Impairment losses increased within shipping, but were significantly reduced in the Baltics and Poland. Return on equity was 11.3 per cent, down from 13.5 per cent in 2011. Adjusted for the effect of basis swaps, return on equity increased from 11.1 per cent to 12.4 per cent. The cost/income ratio, adjusted for the effect of basis swaps, was reduced from 49.6 per cent in 2011 to 46.9 per cent. The employee satisfaction index rose by 0.7 percentage points from 2011, to 75.9 points at year-end 2012. Sickness absence in the banking group’s Norwegian operations was 4.4 per cent in 2012, up 1) DNB Bank ASA is a subsidiary of DNB ASA and part of the DNB Group. The DNB Bank Group, hereinafter called "the banking group", comprises the bank and the bank's subsidiaries. Other companies owned by DNB ASA, including DNB Livsforsikring, DNB Skadeforsikring and DNB Asset Management, are not part of the banking group. Operations in DNB ASA and the total DNB Group are not covered in this report but described in a separate report and presentation. 2) Basis swaps are hedging contracts entered into by the bank when issuing senior bonds or raising other long-term funding in foreign currency and converting the relevant currency to Norwegian kroner.
from 4.1 per cent in 2011. The special follow-up of units with high sickness absence rates continued in 2012. The DNB Group continued to climb on Ipsos MMI’s Norwegian corporate reputation list and was ranked best among the banks. In addition, DNB still qualified for inclusion in the Dow Jones World Sustainability Index in 2012. The index is based on extensive ana-lyses of companies’ sustainability and comprises the top 10 per cent within each industry sector worldwide based on their financial, environmental and social performance. In 2012, the banking group entered into an agreement to sell its Swedish subsidiary SalusAnsvar AB. The transaction was completed in January 2013. The banking group has also entered into an agree-ment to sell the branch network in Poland. In consequence of these transactions, it is expected that the number of employees in the banking group will be reduced by close to 400 in 2013. The shares in Nordisk Tekstil Holding AS (Kid Interiør) were sold during the second quarter of 2012. The company was acquired in 2009 and was thereafter successfully restructured. The sale generated a gain of NOK 92 million after tax. The banking group’s management team and some of the busi-ness areas’ operations were moved to the new head office in Bjørvika in Oslo in the autumn of 2012. The banking group’s other employees in Oslo will move as and when the premises are completed up until spring 2014. During the second quarter, changes were made to the Board of Directors of DNB Bank ASA. Ingjerd Skjeldrum resigned from the Board, while Vigdis Mathisen was elected as a board member representing the employees. Anne Carine Tanum was re-elected as chairman of the board. The DNB Group’s organisational structure was changed at the start of 2013. The largest changes were the division of personal and corporate banking into separate business areas and the establish-ment of a new business area to serve high-net worth clients. The new structure aims to strengthen the DNB organisation and make it better prepared to meet changes in the regulatory framework and customer behaviour. The banking group aimed to strengthen its capital adequacy ratio by year-end 2012. Due to a healthy profit trend, combined with a number of measures to ensure efficient capital utilisation, the com-mon equity Tier 1 capital ratio, calculated according to the Basel II transitional rules, was 10.5 per cent at end-December. Parallel to this, the banking group continued its adaptations to the new liquidity and capital requirements which are expected to be introduced over the next few years. Higher capital adequacy ratios and an increase in long-term funding make the banking group well prepared to meet these requirements. Based on full implementation of Basel II and excluding the effects of the limitations ensuing from the transitional rules, the common equity Tier 1 capital ratio would have been 11.9 per cent at year-end 2012. The Board of Directors considers the banking group to be well capitalised in relation to the risk of opera-tions and prepared to meet future capital adequacy requirements. The Board of Directors would like to thank all employees for their contribution to the banking group’s continued strong profit perfor-mance and improved corporate reputation and customer satisfaction scores. Parallel to this, the banking group has succeeded in widening
DNB Bank Annual Report 2012 Director’s report 5
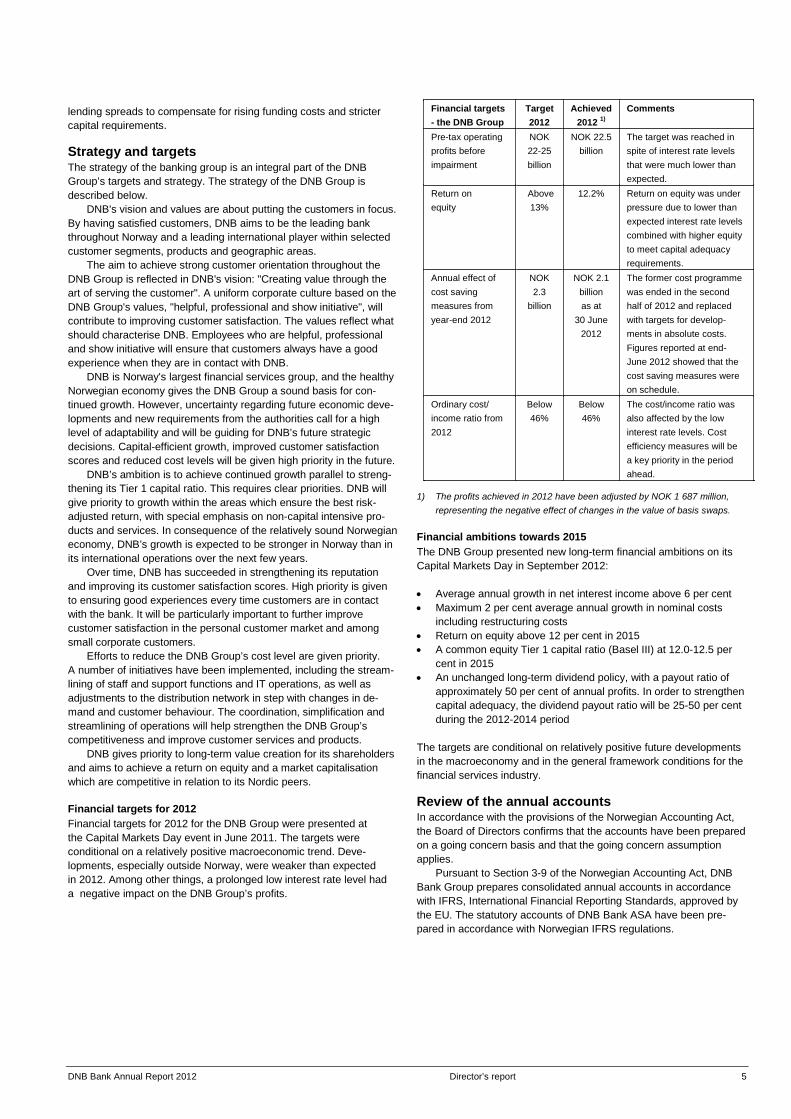
lending spreads to compensate for rising funding costs and stricter capital requirements. Strategy and targets The strategy of the banking group is an integral part of the DNB Group’s targets and strategy. The strategy of the DNB Group is described below. DNB's vision and values are about putting the customers in focus. By having satisfied customers, DNB aims to be the leading bank throughout Norway and a leading international player within selected customer segments, products and geographic areas. The aim to achieve strong customer orientation throughout the DNB Group is reflected in DNB's vision: "Creating value through the art of serving the customer". A uniform corporate culture based on the DNB Group's values, "helpful, professional and show initiative", will contribute to improving customer satisfaction. The values reflect what should characterise DNB. Employees who are helpful, professional and show initiative will ensure that customers always have a good experience when they are in contact with DNB. DNB is Norway's largest financial services group, and the healthy Norwegian economy gives the DNB Group a sound basis for con-tinued growth. However, uncertainty regarding future economic deve-lopments and new requirements from the authorities call for a high level of adaptability and will be guiding for DNB’s future strategic decisions. Capital-efficient growth, improved customer satisfaction scores and reduced cost levels will be given high priority in the future. DNB’s ambition is to achieve continued growth parallel to streng-thening its Tier 1 capital ratio. This requires clear priorities. DNB will give priority to growth within the areas which ensure the best risk-adjusted return, with special emphasis on non-capital intensive pro-ducts and services. In consequence of the relatively sound Norwegian economy, DNB’s growth is expected to be stronger in Norway than in its international operations over the next few years. Over time, DNB has succeeded in strengthening its reputation and improving its customer satisfaction scores. High priority is given to ensuring good experiences every time customers are in contact with the bank. It will be particularly important to further improve customer satisfaction in the personal customer market and among small corporate customers. Efforts to reduce the DNB Group’s cost level are given priority. A number of initiatives have been implemented, including the stream-lining of staff and support functions and IT operations, as well as adjustments to the distribution network in step with changes in de-mand and customer behaviour. The coordination, simplification and streamlining of operations will help strengthen the DNB Group’s competitiveness and improve customer services and products. DNB gives priority to long-term value creation for its shareholders and aims to achieve a return on equity and a market capitalisation which are competitive in relation to its Nordic peers. Financial targets for 2012 Financial targets for 2012 for the DNB Group were presented at the Capital Markets Day event in June 2011. The targets were conditional on a relatively positive macroeconomic trend. Deve-lopments, especially outside Norway, were weaker than expected in 2012. Among other things, a prolonged low interest rate level had a negative impact on the DNB Group’s profits.
1) The profits achieved in 2012 have been adjusted by NOK 1 687 million, representing the negative effect of changes in the value of basis swaps.
Financial ambitions towards 2015 The DNB Group presented new long-term financial ambitions on its Capital Markets Day in September 2012: • Average annual growth in net interest income above 6 per cent • Maximum 2 per cent average annual growth in nominal costs
including restructuring costs • Return on equity above 12 per cent in 2015 • A common equity Tier 1 capital ratio (Basel III) at 12.0-12.5 per
cent in 2015 • An unchanged long-term dividend policy, with a payout ratio of
approximately 50 per cent of annual profits. In order to strengthen capital adequacy, the dividend payout ratio will be 25-50 per cent during the 2012-2014 period
The targets are conditional on relatively positive future developments in the macroeconomy and in the general framework conditions for the financial services industry. Review of the annual accounts In accordance with the provisions of the Norwegian Accounting Act, the Board of Directors confirms that the accounts have been prepared on a going concern basis and that the going concern assumption applies. Pursuant to Section 3-9 of the Norwegian Accounting Act, DNB Bank Group prepares consolidated annual accounts in accordance with IFRS, International Financial Reporting Standards, approved by the EU. The statutory accounts of DNB Bank ASA have been pre-pared in accordance with Norwegian IFRS regulations.
Financial targets - the DNB Group
Target 2012
Achieved 2012 1)
Comments
Pre-tax operating profits before impairment
NOK 22-25 billion
NOK 22.5 billion
The target was reached in spite of interest rate levels that were much lower than expected.
Return on equity
Above 13%
12.2% Return on equity was under pressure due to lower than expected interest rate levels combined with higher equity to meet capital adequacy requirements.
Annual effect of cost saving measures from year-end 2012
NOK 2.3
billion
NOK 2.1 billion as at
30 June 2012
The former cost programme was ended in the second half of 2012 and replaced with targets for develop-ments in absolute costs. Figures reported at end-June 2012 showed that the cost saving measures were on schedule.
Ordinary cost/ income ratio from 2012
Below 46%
Below 46%
The cost/income ratio was also affected by the low interest rate levels. Cost efficiency measures will be a key priority in the period ahead.
6 Director’s report DNB Bank Annual Report 2012
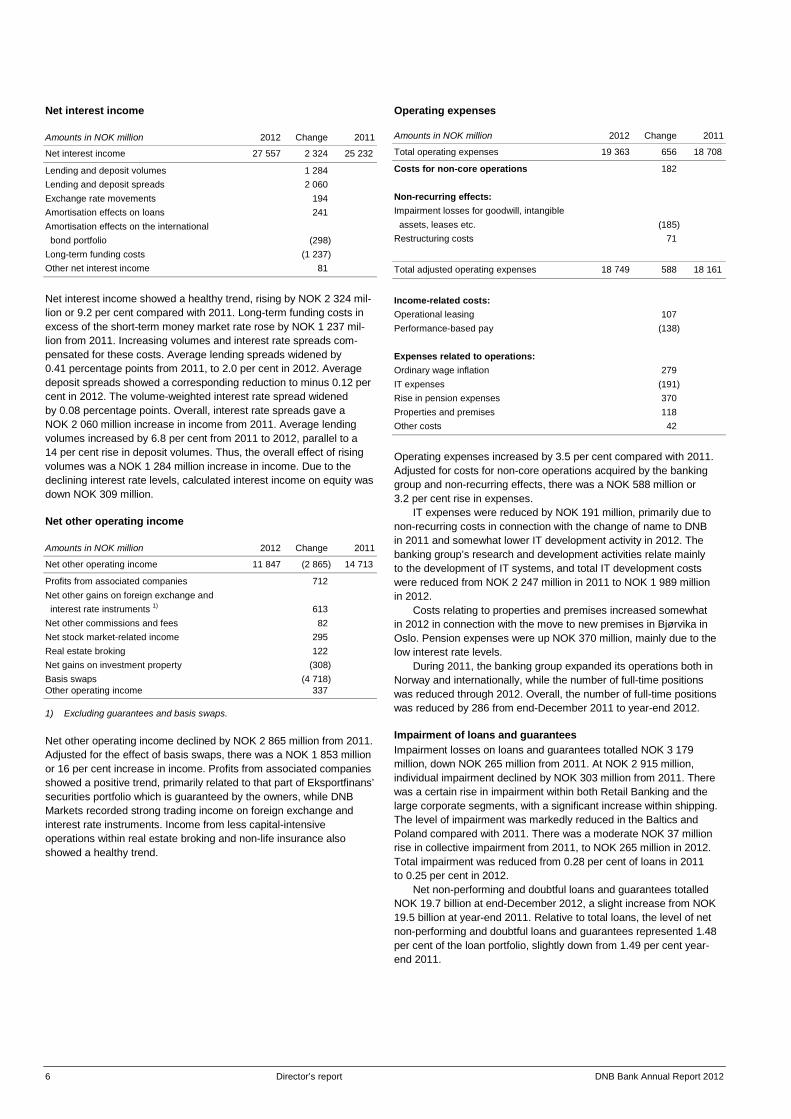
Net interest income Amounts in NOK million 2012 Change 2011 Net interest income 27 557 2 324 25 232 Lending and deposit volumes 1 284 Lending and deposit spreads 2 060 Exchange rate movements 194 Amortisation effects on loans 241 Amortisation effects on the international bond portfolio (298) Long-term funding costs (1 237) Other net interest income 81 Net interest income showed a healthy trend, rising by NOK 2 324 mil-lion or 9.2 per cent compared with 2011. Long-term funding costs in excess of the short-term money market rate rose by NOK 1 237 mil-lion from 2011. Increasing volumes and interest rate spreads com-pensated for these costs. Average lending spreads widened by 0.41 percentage points from 2011, to 2.0 per cent in 2012. Average deposit spreads showed a corresponding reduction to minus 0.12 per cent in 2012. The volume-weighted interest rate spread widened by 0.08 percentage points. Overall, interest rate spreads gave a NOK 2 060 million increase in income from 2011. Average lending volumes increased by 6.8 per cent from 2011 to 2012, parallel to a 14 per cent rise in deposit volumes. Thus, the overall effect of rising volumes was a NOK 1 284 million increase in income. Due to the declining interest rate levels, calculated interest income on equity was down NOK 309 million. Net other operating income Amounts in NOK million 2012 Change 2011 Net other operating income 11 847 (2 865) 14 713 Profits from associated companies 712 Net other gains on foreign exchange and interest rate instruments 1) 613 Net other commissions and fees 82 Net stock market-related income 295 Real estate broking 122 Net gains on investment property (308) Basis swaps (4 718) Other operating income 337 1) Excluding guarantees and basis swaps. Net other operating income declined by NOK 2 865 million from 2011. Adjusted for the effect of basis swaps, there was a NOK 1 853 million or 16 per cent increase in income. Profits from associated companies showed a positive trend, primarily related to that part of Eksportfinans’ securities portfolio which is guaranteed by the owners, while DNB Markets recorded strong trading income on foreign exchange and interest rate instruments. Income from less capital-intensive operations within real estate broking and non-life insurance also showed a healthy trend.
Operating expenses Amounts in NOK million 2012 Change 2011
Total operating expenses 19 363 656 18 708
Costs for non-core operations 182 Non-recurring effects: Impairment losses for goodwill, intangible assets, leases etc. (185) Restructuring costs 71
Total adjusted operating expenses 18 749 588 18 161
Income-related costs: Operational leasing 107 Performance-based pay (138) Expenses related to operations: Ordinary wage inflation 279 IT expenses (191) Rise in pension expenses 370 Properties and premises 118 Other costs 42 Operating expenses increased by 3.5 per cent compared with 2011. Adjusted for costs for non-core operations acquired by the banking group and non-recurring effects, there was a NOK 588 million or 3.2 per cent rise in expenses. IT expenses were reduced by NOK 191 million, primarily due to non-recurring costs in connection with the change of name to DNB in 2011 and somewhat lower IT development activity in 2012. The banking group’s research and development activities relate mainly to the development of IT systems, and total IT development costs were reduced from NOK 2 247 million in 2011 to NOK 1 989 million in 2012. Costs relating to properties and premises increased somewhat in 2012 in connection with the move to new premises in Bjørvika in Oslo. Pension expenses were up NOK 370 million, mainly due to the low interest rate levels. During 2011, the banking group expanded its operations both in Norway and internationally, while the number of full-time positions was reduced through 2012. Overall, the number of full-time positions was reduced by 286 from end-December 2011 to year-end 2012. Impairment of loans and guarantees Impairment losses on loans and guarantees totalled NOK 3 179 million, down NOK 265 million from 2011. At NOK 2 915 million, individual impairment declined by NOK 303 million from 2011. There was a certain rise in impairment within both Retail Banking and the large corporate segments, with a significant increase within shipping. The level of impairment was markedly reduced in the Baltics and Poland compared with 2011. There was a moderate NOK 37 million rise in collective impairment from 2011, to NOK 265 million in 2012. Total impairment was reduced from 0.28 per cent of loans in 2011 to 0.25 per cent in 2012. Net non-performing and doubtful loans and guarantees totalled NOK 19.7 billion at end-December 2012, a slight increase from NOK 19.5 billion at year-end 2011. Relative to total loans, the level of net non-performing and doubtful loans and guarantees represented 1.48 per cent of the loan portfolio, slightly down from 1.49 per cent year-end 2011.

DNB Bank Annual Report 2012 Director’s report 7
Taxes The banking group's tax charge for 2012 was NOK 4 473 million, a reduction from NOK 5 308 million in 2011. Relative to pre-tax operating profits, the estimated tax charge was 26.5 per cent, down from 29.8 per cent in 2011. The reduction reflected changes in estimated taxes for the banking group’s international operations. Funding, liquidity and balance sheet Throughout 2012, the short-term funding markets were generally accessible to banks with strong credit ratings, and the banking group had ample access to short-term funding. During the second half of the year, investors showed a greater interest in short-term funding with somewhat longer maturities. The markets were less selective, and an increasing number of banks were regarded as financially strong. There was a very high level of activity in the long-term funding markets during the January through March period, and banks with strong credit ratings had good access to these markets. The banking group completed most of its annual long-term funding activities during this period. There was increasing uncertainty regarding European sovereign debt during the second quarter, and fewer transactions were completed. In the second half of the year, investors showed renewed interest in long-term funding, while the banks had a limited need for new funding. Thus, there was a reduction in funding costs for both new covered bonds and senior bond debt. Debt securities issued by the banking group totalled NOK 713 bil-lion at year-end 2012 and NOK 640 billion a year earlier. The average remaining term to maturity for the portfolio of debt securities issued was 4.6 years at end-December 2012, compared with 4.5 years a year earlier. In order to keep the banking group’s liquidity risk at a low level, short-term and long-term liquidity risk limits have been established. Among other things, this implies that the majority of loans are financed through customer deposits, long-term securities and primary capital. The banking group stayed well within the liquidity limits during 2012. The Basel III regulations define short and long-term liquidity requirements and the appurtenant calculation methods. With effect from 2012, the banking group has adjusted its liquidity risk limits in line with the calculation methods in the Basel III regulations. A gradual adaptation to the liquidity requirements within the time limits stipulated by the Basel Committee is being planned. At end-December 2012, total combined assets in the banking group were NOK 2 114 billion, an increase from NOK 1 910 billion at year-end 2011. Total assets in the banking group’s balance sheet were NOK 2 013 billion as at 31 December 2012 and NOK 1 885 billion a year earlier. Net loans to customers increased by NOK 17.3 billion or 1.3 per cent from end-December 2011. Customer deposits increased by NOK 69.8 billion or 9.3 per cent during the same period. The ratio of customer deposits to net loans to customers increased from 58.1 per cent at end-December 2011 to 62.6 per cent at year-end 2012. The ratio of deposits to net loans in DNB Bank ASA was 110.3 per cent at end-December 2012, reflecting that all loans which were not carried in the books of DNB Boligkreditt were financed through customer depo-sits. Corporate Governance The management of the banking group is inter alia based on the Norwegian Accounting Act and the Norwegian Code of Practice for Corporate Governance. See also the chapter, in the DNB Group’s Annual Report, on DNB’s compliance with the Norwegian Accounting Act and the Code of Practice. During 2012, the Board of Directors of DNB Bank ASA held fifteen meetings. The banking group’s strategy, financial development and risk management were high on the agenda, in addition to the capitalisation of the banking group and announced changes in external parameters for the financial services industry.
The Audit Committee, which is a sub-committee of the Board of Directors in DNB ASA, reviewed the annual accounts and reports for DNB Bank ASA the banking group. With effect from 2013, the com-mittee has been renamed the Audit and Risk Management Com-mittee. Risk and capital adequacy Organisation and monitoring The Board of Directors continually monitors the banking group’s capital situation and aims for DNB Bank ASA to maintain an AA level rating for ordinary long-term debt. The banking group will maintain a low risk profile and will only assume risk which is comprehensible and possible to follow up, and which will not harm its reputation. The DNB Group's credit policy is laid down in a joint meeting of the Boards of Directors of DNB ASA (the holding company) and DNB Bank ASA. The Board of Directors of DNB Bank ASA determines credit strategies and annual limits for liquidity risk and market risk for the banking group. Market risk reflects equity, currency, interest rate and commodity exposure. The Boards of Directors of the other operative companies in the DNB Bank Group set limits for relevant risks pertaining to their operations. The DNB group management meetings are attended by the group executive vice presidents in charge of the business areas and staff and support units. A number of advisory bodies have been established to assist in preparing documentation and carrying out follow-ups and controls within various specialist areas: • The Asset and Liability Committee, ALCO, is an advisory body
for the chief financial officer and the chief risk officer and handles matters relating to the management of market and funding risk, risk modelling, capital structure and return targets.
• In 2012, the DNB Group had three central credit committees: the Group Advisory Credit Committee, the Advisory Credit Committee for Large Corporates and International, and the Advisory Credit Committee for Retail Banking. The Group Advisory Credit Com-mittee approves large credits for the business areas according to assigned authorisations and advises the DNB group chief exe-cutive and the Board of Directors in connection with large indi-vidual credit proposals and other credits of an extraordinary nature. The committee plays a key role in formulating the DNB Group's credit policy, credit strategies and credit regulations, as well as in assessing portfolio risk. The Credit Committees for the business areas approve other credits according to assigned authorisations.
Due to new, comprehensive regulations, the financial services indu-stry has become increasingly complex. With effect from January 2013, the DNB Group’s specialist units within risk management have been organised as a separate support unit, Risk Management. This unit is headed by the DNB Group’s chief risk officer, CRO, who re-ports directly to the group chief executive. In 2012, the DNB Group established a risk appetite framework for the the DNB Group, which will become effective as from 2013. The risk appetite concept has become best practice in the financial ser-vices industry, enabling organisations to include risk as a holistic part of their strategy and planning processes and thus react more swiftly to changing surroundings. In the DNB Group, the framework will re-present an operationalisation of the DNB Group’s current risk policy and guidelines to ensure that risk is managed and integrated in the DNB Group’s other management processes. The framework is owned by the Board of Directors and will be reviewed at least once a year. The actual risk level that is measured in accordance with the frame-work will be reported on a monthly basis.
8 Director’s report DNB Bank Annual Report 2012
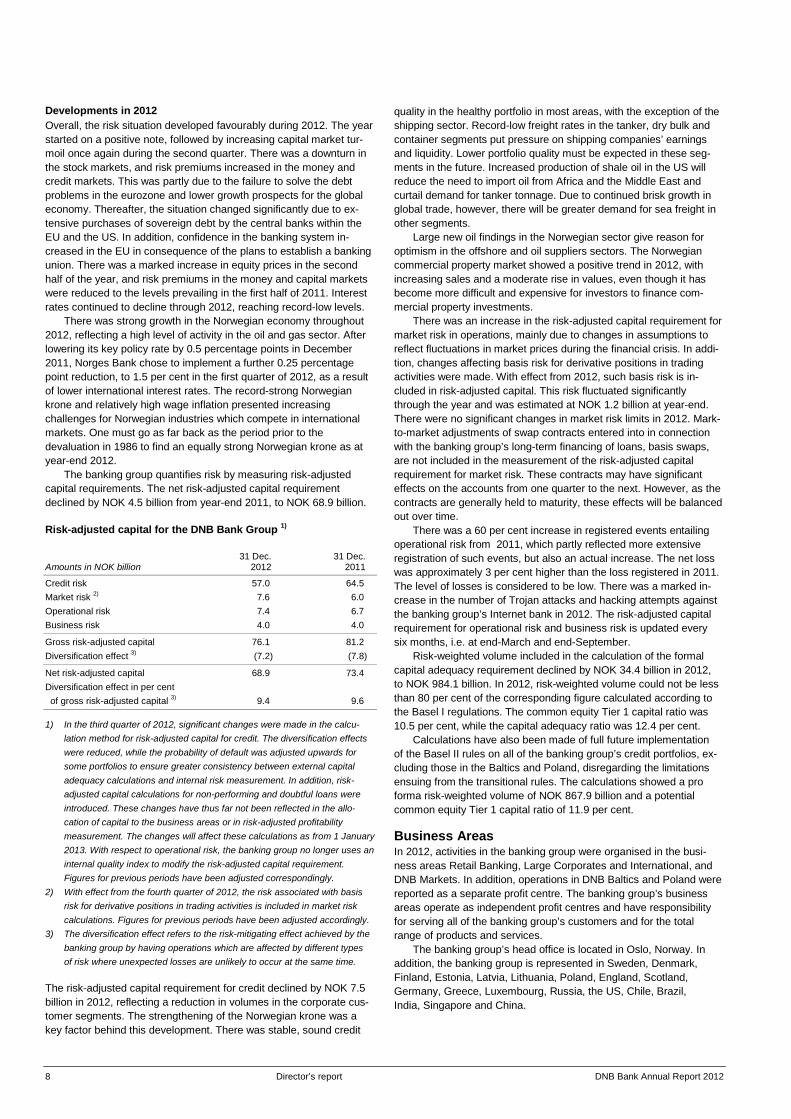
Developments in 2012 Overall, the risk situation developed favourably during 2012. The year started on a positive note, followed by increasing capital market tur-moil once again during the second quarter. There was a downturn in the stock markets, and risk premiums increased in the money and credit markets. This was partly due to the failure to solve the debt problems in the eurozone and lower growth prospects for the global economy. Thereafter, the situation changed significantly due to ex-tensive purchases of sovereign debt by the central banks within the EU and the US. In addition, confidence in the banking system in-creased in the EU in consequence of the plans to establish a banking union. There was a marked increase in equity prices in the second half of the year, and risk premiums in the money and capital markets were reduced to the levels prevailing in the first half of 2011. Interest rates continued to decline through 2012, reaching record-low levels. There was strong growth in the Norwegian economy throughout 2012, reflecting a high level of activity in the oil and gas sector. After lowering its key policy rate by 0.5 percentage points in December 2011, Norges Bank chose to implement a further 0.25 percentage point reduction, to 1.5 per cent in the first quarter of 2012, as a result of lower international interest rates. The record-strong Norwegian krone and relatively high wage inflation presented increasing challenges for Norwegian industries which compete in international markets. One must go as far back as the period prior to the devaluation in 1986 to find an equally strong Norwegian krone as at year-end 2012. The banking group quantifies risk by measuring risk-adjusted capital requirements. The net risk-adjusted capital requirement declined by NOK 4.5 billion from year-end 2011, to NOK 68.9 billion. Risk-adjusted capital for the DNB Bank Group 1) 31 Dec. 31 Dec. Amounts in NOK billion 2012 2011 Credit risk 57.0 64.5 Market risk 2) 7.6 6.0 Operational risk 7.4 6.7 Business risk 4.0 4.0 Gross risk-adjusted capital 76.1 81.2 Diversification effect 3) (7.2) (7.8) Net risk-adjusted capital 68.9 73.4 Diversification effect in per cent of gross risk-adjusted capital 3) 9.4 9.6
1) In the third quarter of 2012, significant changes were made in the calcu-
lation method for risk-adjusted capital for credit. The diversification effects were reduced, while the probability of default was adjusted upwards for some portfolios to ensure greater consistency between external capital adequacy calculations and internal risk measurement. In addition, risk-adjusted capital calculations for non-performing and doubtful loans were introduced. These changes have thus far not been reflected in the allo-cation of capital to the business areas or in risk-adjusted profitability measurement. The changes will affect these calculations as from 1 January 2013. With respect to operational risk, the banking group no longer uses an internal quality index to modify the risk-adjusted capital requirement. Figures for previous periods have been adjusted correspondingly.
2) With effect from the fourth quarter of 2012, the risk associated with basis risk for derivative positions in trading activities is included in market risk calculations. Figures for previous periods have been adjusted accordingly.
3) The diversification effect refers to the risk-mitigating effect achieved by the banking group by having operations which are affected by different types of risk where unexpected losses are unlikely to occur at the same time.
The risk-adjusted capital requirement for credit declined by NOK 7.5 billion in 2012, reflecting a reduction in volumes in the corporate cus-tomer segments. The strengthening of the Norwegian krone was a key factor behind this development. There was stable, sound credit
quality in the healthy portfolio in most areas, with the exception of the shipping sector. Record-low freight rates in the tanker, dry bulk and container segments put pressure on shipping companies’ earnings and liquidity. Lower portfolio quality must be expected in these seg-ments in the future. Increased production of shale oil in the US will reduce the need to import oil from Africa and the Middle East and curtail demand for tanker tonnage. Due to continued brisk growth in global trade, however, there will be greater demand for sea freight in other segments. Large new oil findings in the Norwegian sector give reason for optimism in the offshore and oil suppliers sectors. The Norwegian commercial property market showed a positive trend in 2012, with increasing sales and a moderate rise in values, even though it has become more difficult and expensive for investors to finance com-mercial property investments. There was an increase in the risk-adjusted capital requirement for market risk in operations, mainly due to changes in assumptions to reflect fluctuations in market prices during the financial crisis. In addi-tion, changes affecting basis risk for derivative positions in trading activities were made. With effect from 2012, such basis risk is in-cluded in risk-adjusted capital. This risk fluctuated significantly through the year and was estimated at NOK 1.2 billion at year-end. There were no significant changes in market risk limits in 2012. Mark-to-market adjustments of swap contracts entered into in connection with the banking group’s long-term financing of loans, basis swaps, are not included in the measurement of the risk-adjusted capital requirement for market risk. These contracts may have significant effects on the accounts from one quarter to the next. However, as the contracts are generally held to maturity, these effects will be balanced out over time. There was a 60 per cent increase in registered events entailing operational risk from 2011, which partly reflected more extensive registration of such events, but also an actual increase. The net loss was approximately 3 per cent higher than the loss registered in 2011. The level of losses is considered to be low. There was a marked in-crease in the number of Trojan attacks and hacking attempts against the banking group’s Internet bank in 2012. The risk-adjusted capital requirement for operational risk and business risk is updated every six months, i.e. at end-March and end-September. Risk-weighted volume included in the calculation of the formal capital adequacy requirement declined by NOK 34.4 billion in 2012, to NOK 984.1 billion. In 2012, risk-weighted volume could not be less than 80 per cent of the corresponding figure calculated according to the Basel I regulations. The common equity Tier 1 capital ratio was 10.5 per cent, while the capital adequacy ratio was 12.4 per cent. Calculations have also been made of full future implementation of the Basel II rules on all of the banking group’s credit portfolios, ex-cluding those in the Baltics and Poland, disregarding the limitations ensuing from the transitional rules. The calculations showed a pro forma risk-weighted volume of NOK 867.9 billion and a potential common equity Tier 1 capital ratio of 11.9 per cent. Business Areas In 2012, activities in the banking group were organised in the busi-ness areas Retail Banking, Large Corporates and International, and DNB Markets. In addition, operations in DNB Baltics and Poland were reported as a separate profit centre. The banking group’s business areas operate as independent profit centres and have responsibility for serving all of the banking group’s customers and for the total range of products and services. The banking group’s head office is located in Oslo, Norway. In addition, the banking group is represented in Sweden, Denmark, Finland, Estonia, Latvia, Lithuania, Poland, England, Scotland, Germany, Greece, Luxembourg, Russia, the US, Chile, Brazil, India, Singapore and China.
DNB Bank Annual Report 2012 Director’s report 9
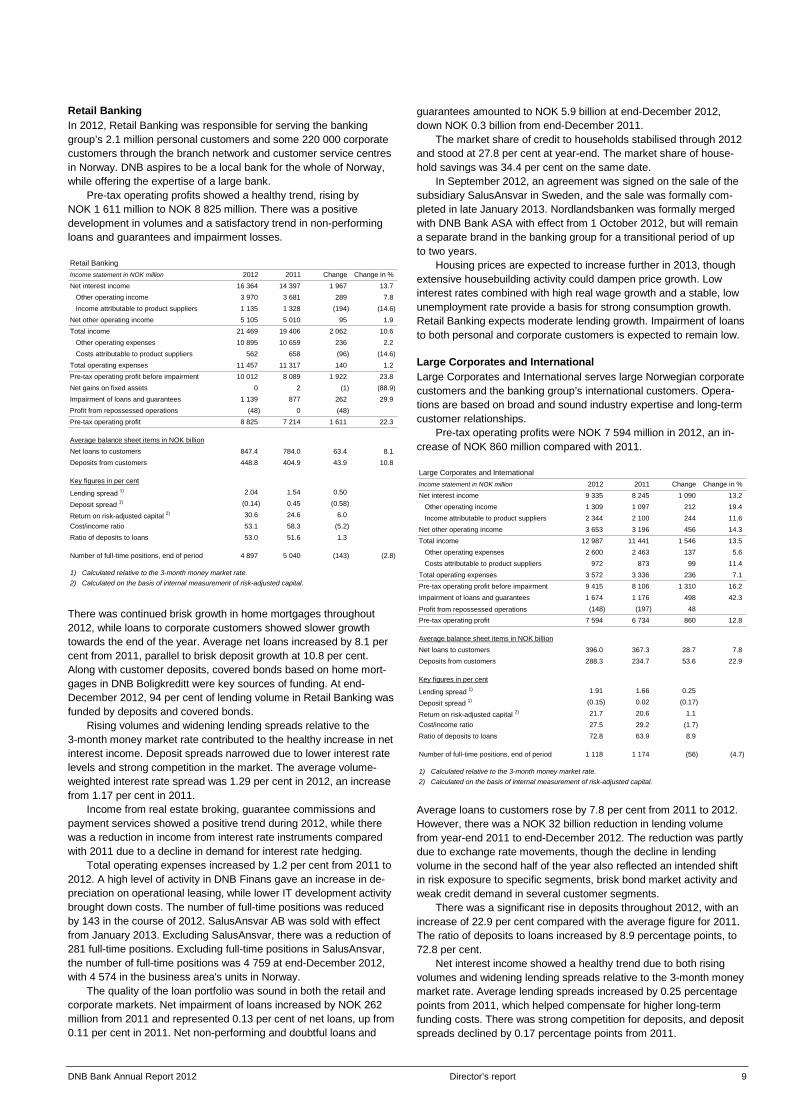
Retail Banking In 2012, Retail Banking was responsible for serving the banking group’s 2.1 million personal customers and some 220 000 corporate customers through the branch network and customer service centres in Norway. DNB aspires to be a local bank for the whole of Norway, while offering the expertise of a large bank. Pre-tax operating profits showed a healthy trend, rising by NOK 1 611 million to NOK 8 825 million. There was a positive development in volumes and a satisfactory trend in non-performing loans and guarantees and impairment losses. Retail BankingIncome statement in NOK million 2012 2011 Change Change in % Net interest income 16 364 14 397 1 967 13.7 Other operating income 3 970 3 681 289 7.8 Income attributable to product suppliers 1 135 1 328 (194) (14.6)Net other operating income 5 105 5 010 95 1.9Total income 21 469 19 406 2 062 10.6 Other operating expenses 10 895 10 659 236 2.2 Costs attributable to product suppliers 562 658 (96) (14.6)Total operating expenses 11 457 11 317 140 1.2Pre-tax operating profit before impairment 10 012 8 089 1 922 23.8Net gains on fixed assets 0 2 (1) (88.9)Impairment of loans and guarantees 1 139 877 262 29.9Profit from repossessed operations (48) 0 (48)Pre-tax operating profit 8 825 7 214 1 611 22.3
Average balance sheet items in NOK billionNet loans to customers 847.4 784.0 63.4 8.1Deposits from customers 448.8 404.9 43.9 10.8
Key figures in per cent
Lending spread 1) 2.04 1.54 0.50
Deposit spread 1) (0.14) 0.45 (0.58)
Return on risk-adjusted capital 2) 30.6 24.6 6.0Cost/income ratio 53.1 58.3 (5.2)Ratio of deposits to loans 53.0 51.6 1.3
Number of full-time positions, end of period 4 897 5 040 (143) (2.8)
1) Calculated relative to the 3-month money market rate.2) Calculated on the basis of internal measurement of risk-adjusted capital. There was continued brisk growth in home mortgages throughout 2012, while loans to corporate customers showed slower growth towards the end of the year. Average net loans increased by 8.1 per cent from 2011, parallel to brisk deposit growth at 10.8 per cent. Along with customer deposits, covered bonds based on home mort-gages in DNB Boligkreditt were key sources of funding. At end-December 2012, 94 per cent of lending volume in Retail Banking was funded by deposits and covered bonds. Rising volumes and widening lending spreads relative to the 3-month money market rate contributed to the healthy increase in net interest income. Deposit spreads narrowed due to lower interest rate levels and strong competition in the market. The average volume-weighted interest rate spread was 1.29 per cent in 2012, an increase from 1.17 per cent in 2011. Income from real estate broking, guarantee commissions and payment services showed a positive trend during 2012, while there was a reduction in income from interest rate instruments compared with 2011 due to a decline in demand for interest rate hedging. Total operating expenses increased by 1.2 per cent from 2011 to 2012. A high level of activity in DNB Finans gave an increase in de-preciation on operational leasing, while lower IT development activity brought down costs. The number of full-time positions was reduced by 143 in the course of 2012. SalusAnsvar AB was sold with effect from January 2013. Excluding SalusAnsvar, there was a reduction of 281 full-time positions. Excluding full-time positions in SalusAnsvar, the number of full-time positions was 4 759 at end-December 2012, with 4 574 in the business area's units in Norway. The quality of the loan portfolio was sound in both the retail and corporate markets. Net impairment of loans increased by NOK 262 million from 2011 and represented 0.13 per cent of net loans, up from 0.11 per cent in 2011. Net non-performing and doubtful loans and
guarantees amounted to NOK 5.9 billion at end-December 2012, down NOK 0.3 billion from end-December 2011. The market share of credit to households stabilised through 2012 and stood at 27.8 per cent at year-end. The market share of house-hold savings was 34.4 per cent on the same date. In September 2012, an agreement was signed on the sale of the subsidiary SalusAnsvar in Sweden, and the sale was formally com-pleted in late January 2013. Nordlandsbanken was formally merged with DNB Bank ASA with effect from 1 October 2012, but will remain a separate brand in the banking group for a transitional period of up to two years. Housing prices are expected to increase further in 2013, though extensive housebuilding activity could dampen price growth. Low interest rates combined with high real wage growth and a stable, low unemployment rate provide a basis for strong consumption growth. Retail Banking expects moderate lending growth. Impairment of loans to both personal and corporate customers is expected to remain low. Large Corporates and International Large Corporates and International serves large Norwegian corporate customers and the banking group’s international customers. Opera-tions are based on broad and sound industry expertise and long-term customer relationships. Pre-tax operating profits were NOK 7 594 million in 2012, an in-crease of NOK 860 million compared with 2011. Large Corporates and InternationalIncome statement in NOK million 2012 2011 Change Change in % Net interest income 9 335 8 245 1 090 13.2 Other operating income 1 309 1 097 212 19.4 Income attributable to product suppliers 2 344 2 100 244 11.6Net other operating income 3 653 3 196 456 14.3Total income 12 987 11 441 1 546 13.5 Other operating expenses 2 600 2 463 137 5.6 Costs attributable to product suppliers 972 873 99 11.4Total operating expenses 3 572 3 336 236 7.1Pre-tax operating profit before impairment 9 415 8 106 1 310 16.2Impairment of loans and guarantees 1 674 1 176 498 42.3
Profit from repossessed operations (148) (197) 48Pre-tax operating profit 7 594 6 734 860 12.8
Average balance sheet items in NOK billionNet loans to customers 396.0 367.3 28.7 7.8Deposits from customers 288.3 234.7 53.6 22.9
Key figures in per cent
Lending spread 1) 1.91 1.66 0.25
Deposit spread 1) (0.15) 0.02 (0.17)
Return on risk-adjusted capital 2) 21.7 20.6 1.1Cost/income ratio 27.5 29.2 (1.7)Ratio of deposits to loans 72.8 63.9 8.9
Number of full-time positions, end of period 1 118 1 174 (56) (4.7)
1) Calculated relative to the 3-month money market rate.2) Calculated on the basis of internal measurement of risk-adjusted capital. Average loans to customers rose by 7.8 per cent from 2011 to 2012. However, there was a NOK 32 billion reduction in lending volume from year-end 2011 to end-December 2012. The reduction was partly due to exchange rate movements, though the decline in lending volume in the second half of the year also reflected an intended shift in risk exposure to specific segments, brisk bond market activity and weak credit demand in several customer segments. There was a significant rise in deposits throughout 2012, with an increase of 22.9 per cent compared with the average figure for 2011. The ratio of deposits to loans increased by 8.9 percentage points, to 72.8 per cent. Net interest income showed a healthy trend due to both rising volumes and widening lending spreads relative to the 3-month money market rate. Average lending spreads increased by 0.25 percentage points from 2011, which helped compensate for higher long-term funding costs. There was strong competition for deposits, and deposit spreads declined by 0.17 percentage points from 2011.
10 Director’s report DNB Bank Annual Report 2012
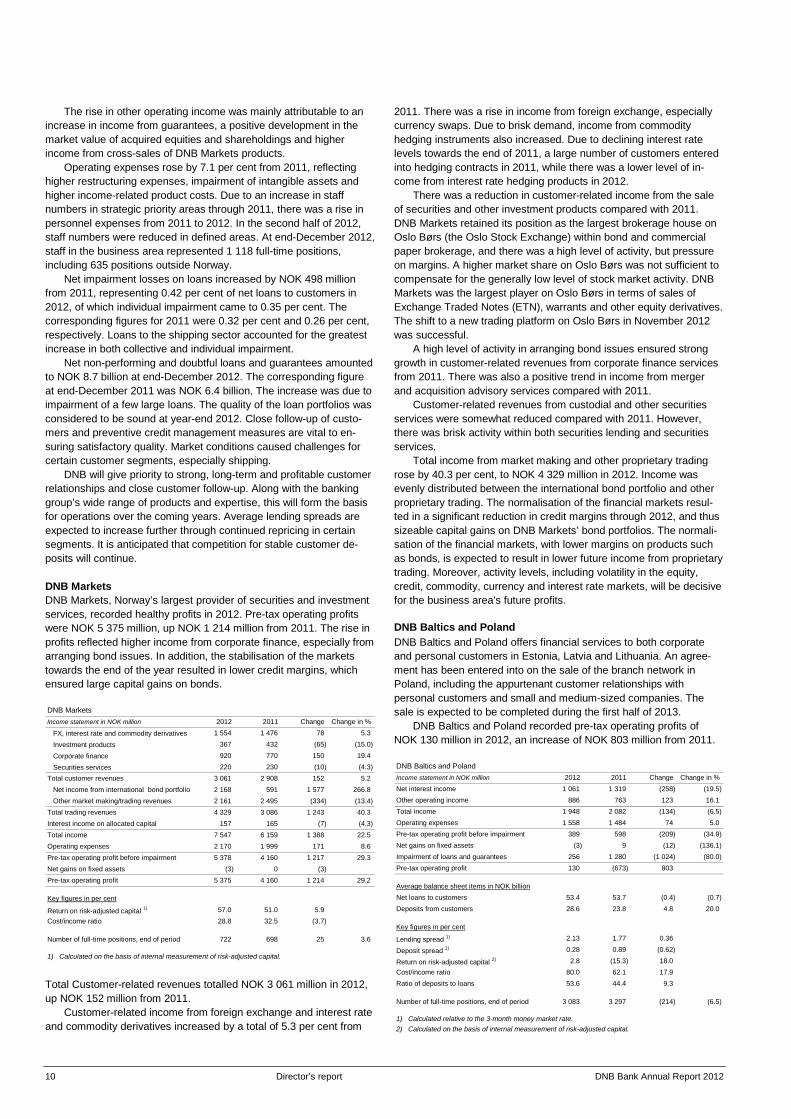
The rise in other operating income was mainly attributable to an increase in income from guarantees, a positive development in the market value of acquired equities and shareholdings and higher income from cross-sales of DNB Markets products. Operating expenses rose by 7.1 per cent from 2011, reflecting higher restructuring expenses, impairment of intangible assets and higher income-related product costs. Due to an increase in staff numbers in strategic priority areas through 2011, there was a rise in personnel expenses from 2011 to 2012. In the second half of 2012, staff numbers were reduced in defined areas. At end-December 2012, staff in the business area represented 1 118 full-time positions, including 635 positions outside Norway. Net impairment losses on loans increased by NOK 498 million from 2011, representing 0.42 per cent of net loans to customers in 2012, of which individual impairment came to 0.35 per cent. The corresponding figures for 2011 were 0.32 per cent and 0.26 per cent, respectively. Loans to the shipping sector accounted for the greatest increase in both collective and individual impairment. Net non-performing and doubtful loans and guarantees amounted to NOK 8.7 billion at end-December 2012. The corresponding figure at end-December 2011 was NOK 6.4 billion. The increase was due to impairment of a few large loans. The quality of the loan portfolios was considered to be sound at year-end 2012. Close follow-up of custo-mers and preventive credit management measures are vital to en-suring satisfactory quality. Market conditions caused challenges for certain customer segments, especially shipping. DNB will give priority to strong, long-term and profitable customer relationships and close customer follow-up. Along with the banking group’s wide range of products and expertise, this will form the basis for operations over the coming years. Average lending spreads are expected to increase further through continued repricing in certain segments. It is anticipated that competition for stable customer de-posits will continue. DNB Markets DNB Markets, Norway’s largest provider of securities and investment services, recorded healthy profits in 2012. Pre-tax operating profits were NOK 5 375 million, up NOK 1 214 million from 2011. The rise in profits reflected higher income from corporate finance, especially from arranging bond issues. In addition, the stabilisation of the markets towards the end of the year resulted in lower credit margins, which ensured large capital gains on bonds. DNB MarketsIncome statement in NOK million 2012 2011 Change Change in %
FX, interest rate and commodity derivatives 1 554 1 476 78 5.3
Investment products 367 432 (65) (15.0)
Corporate finance 920 770 150 19.4
Securities services 220 230 (10) (4.3)Total customer revenues 3 061 2 908 152 5.2 Net income from international bond portfolio 2 168 591 1 577 266.8 Other market making/trading revenues 2 161 2 495 (334) (13.4)Total trading revenues 4 329 3 086 1 243 40.3Interest income on allocated capital 157 165 (7) (4.3)Total income 7 547 6 159 1 388 22.5Operating expenses 2 170 1 999 171 8.6Pre-tax operating profit before impairment 5 378 4 160 1 217 29.3Net gains on fixed assets (3) 0 (3)Pre-tax operating profit 5 375 4 160 1 214 29.2
Key figures in per cent
Return on risk-adjusted capital 1) 57.0 51.0 5.9Cost/income ratio 28.8 32.5 (3.7)
Number of full-time positions, end of period 722 698 25 3.6
1) Calculated on the basis of internal measurement of risk-adjusted capital. Total Customer-related revenues totalled NOK 3 061 million in 2012, up NOK 152 million from 2011. Customer-related income from foreign exchange and interest rate and commodity derivatives increased by a total of 5.3 per cent from
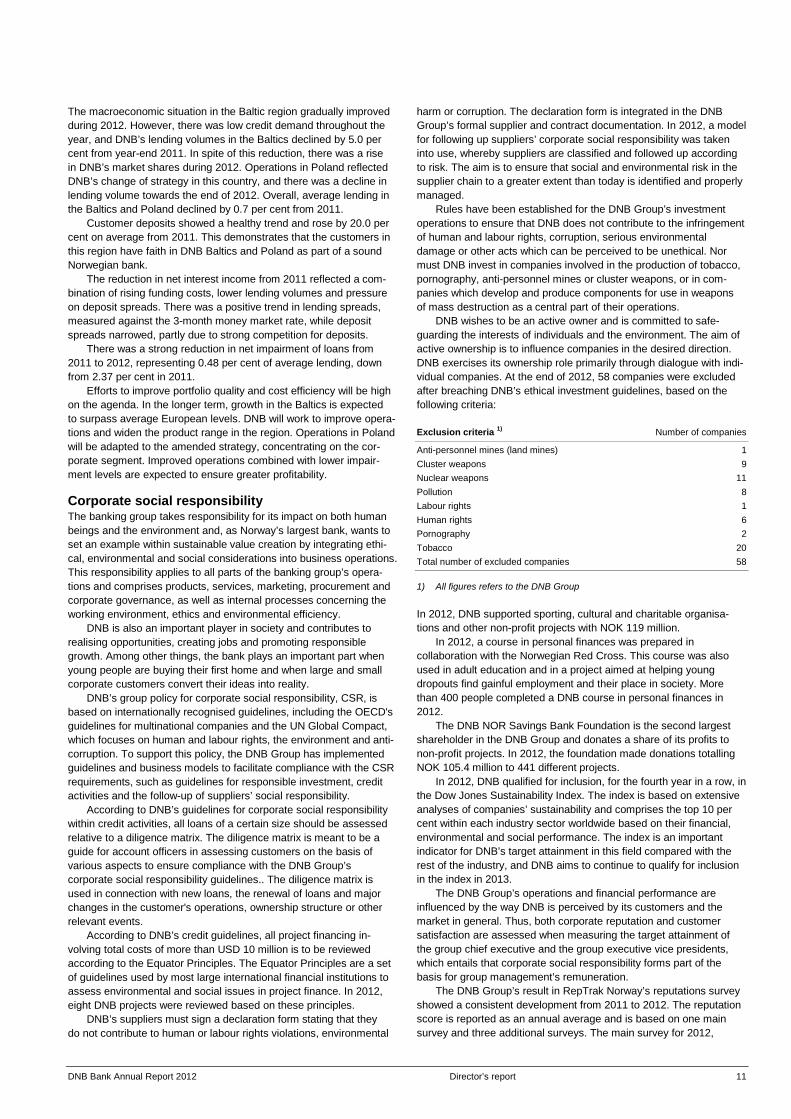
2011. There was a rise in income from foreign exchange, especially currency swaps. Due to brisk demand, income from commodity hedging instruments also increased. Due to declining interest rate levels towards the end of 2011, a large number of customers entered into hedging contracts in 2011, while there was a lower level of in-come from interest rate hedging products in 2012. There was a reduction in customer-related income from the sale of securities and other investment products compared with 2011. DNB Markets retained its position as the largest brokerage house on Oslo Børs (the Oslo Stock Exchange) within bond and commercial paper brokerage, and there was a high level of activity, but pressure on margins. A higher market share on Oslo Børs was not sufficient to compensate for the generally low level of stock market activity. DNB Markets was the largest player on Oslo Børs in terms of sales of Exchange Traded Notes (ETN), warrants and other equity derivatives. The shift to a new trading platform on Oslo Børs in November 2012 was successful. A high level of activity in arranging bond issues ensured strong growth in customer-related revenues from corporate finance services from 2011. There was also a positive trend in income from merger and acquisition advisory services compared with 2011. Customer-related revenues from custodial and other securities services were somewhat reduced compared with 2011. However, there was brisk activity within both securities lending and securities services. Total income from market making and other proprietary trading rose by 40.3 per cent, to NOK 4 329 million in 2012. Income was evenly distributed between the international bond portfolio and other proprietary trading. The normalisation of the financial markets resul-ted in a significant reduction in credit margins through 2012, and thus sizeable capital gains on DNB Markets’ bond portfolios. The normali-sation of the financial markets, with lower margins on products such as bonds, is expected to result in lower future income from proprietary trading. Moreover, activity levels, including volatility in the equity, credit, commodity, currency and interest rate markets, will be decisive for the business area's future profits. DNB Baltics and Poland DNB Baltics and Poland offers financial services to both corporate and personal customers in Estonia, Latvia and Lithuania. An agree-ment has been entered into on the sale of the branch network in Poland, including the appurtenant customer relationships with personal customers and small and medium-sized companies. The sale is expected to be completed during the first half of 2013. DNB Baltics and Poland recorded pre-tax operating profits of NOK 130 million in 2012, an increase of NOK 803 million from 2011. DNB Baltics and PolandIncome statement in NOK million 2012 2011 Change Change in % Net interest income 1 061 1 319 (258) (19.5)Other operating income 886 763 123 16.1Total income 1 948 2 082 (134) (6.5)Operating expenses 1 558 1 484 74 5.0Pre-tax operating profit before impairment 389 598 (209) (34.9)Net gains on fixed assets (3) 9 (12) (136.1)Impairment of loans and guarantees 256 1 280 (1 024) (80.0)Pre-tax operating profit 130 (673) 803
Average balance sheet items in NOK billionNet loans to customers 53.4 53.7 (0.4) (0.7)Deposits from customers 28.6 23.8 4.8 20.0
Key figures in per cent
Lending spread 1) 2.13 1.77 0.36
Deposit spread 1) 0.28 0.89 (0.62)
Return on risk-adjusted capital 2) 2.8 (15.3) 18.0Cost/income ratio 80.0 62.1 17.9Ratio of deposits to loans 53.6 44.4 9.3
Number of full-time positions, end of period 3 083 3 297 (214) (6.5)
1) Calculated relative to the 3-month money market rate.2) Calculated on the basis of internal measurement of risk-adjusted capital.
DNB Bank Annual Report 2012 Director’s report 11
The macroeconomic situation in the Baltic region gradually improved during 2012. However, there was low credit demand throughout the year, and DNB’s lending volumes in the Baltics declined by 5.0 per cent from year-end 2011. In spite of this reduction, there was a rise in DNB’s market shares during 2012. Operations in Poland reflected DNB’s change of strategy in this country, and there was a decline in lending volume towards the end of 2012. Overall, average lending in the Baltics and Poland declined by 0.7 per cent from 2011. Customer deposits showed a healthy trend and rose by 20.0 per cent on average from 2011. This demonstrates that the customers in this region have faith in DNB Baltics and Poland as part of a sound Norwegian bank. The reduction in net interest income from 2011 reflected a com-bination of rising funding costs, lower lending volumes and pressure on deposit spreads. There was a positive trend in lending spreads, measured against the 3-month money market rate, while deposit spreads narrowed, partly due to strong competition for deposits. There was a strong reduction in net impairment of loans from 2011 to 2012, representing 0.48 per cent of average lending, down from 2.37 per cent in 2011. Efforts to improve portfolio quality and cost efficiency will be high on the agenda. In the longer term, growth in the Baltics is expected to surpass average European levels. DNB will work to improve opera-tions and widen the product range in the region. Operations in Poland will be adapted to the amended strategy, concentrating on the cor-porate segment. Improved operations combined with lower impair-ment levels are expected to ensure greater profitability. Corporate social responsibility The banking group takes responsibility for its impact on both human beings and the environment and, as Norway’s largest bank, wants to set an example within sustainable value creation by integrating ethi-cal, environmental and social considerations into business operations. This responsibility applies to all parts of the banking group’s opera-tions and comprises products, services, marketing, procurement and corporate governance, as well as internal processes concerning the working environment, ethics and environmental efficiency. DNB is also an important player in society and contributes to realising opportunities, creating jobs and promoting responsible growth. Among other things, the bank plays an important part when young people are buying their first home and when large and small corporate customers convert their ideas into reality. DNB’s group policy for corporate social responsibility, CSR, is based on internationally recognised guidelines, including the OECD's guidelines for multinational companies and the UN Global Compact, which focuses on human and labour rights, the environment and anti-corruption. To support this policy, the DNB Group has implemented guidelines and business models to facilitate compliance with the CSR requirements, such as guidelines for responsible investment, credit activities and the follow-up of suppliers’ social responsibility. According to DNB’s guidelines for corporate social responsibility within credit activities, all loans of a certain size should be assessed relative to a diligence matrix. The diligence matrix is meant to be a guide for account officers in assessing customers on the basis of various aspects to ensure compliance with the DNB Group’s corporate social responsibility guidelines.. The diligence matrix is used in connection with new loans, the renewal of loans and major changes in the customer's operations, ownership structure or other relevant events. According to DNB’s credit guidelines, all project financing in-volving total costs of more than USD 10 million is to be reviewed according to the Equator Principles. The Equator Principles are a set of guidelines used by most large international financial institutions to assess environmental and social issues in project finance. In 2012, eight DNB projects were reviewed based on these principles. DNB’s suppliers must sign a declaration form stating that they do not contribute to human or labour rights violations, environmental
harm or corruption. The declaration form is integrated in the DNB Group’s formal supplier and contract documentation. In 2012, a model for following up suppliers’ corporate social responsibility was taken into use, whereby suppliers are classified and followed up according to risk. The aim is to ensure that social and environmental risk in the supplier chain to a greater extent than today is identified and properly managed. Rules have been established for the DNB Group’s investment operations to ensure that DNB does not contribute to the infringement of human and labour rights, corruption, serious environmental damage or other acts which can be perceived to be unethical. Nor must DNB invest in companies involved in the production of tobacco, pornography, anti-personnel mines or cluster weapons, or in com-panies which develop and produce components for use in weapons of mass destruction as a central part of their operations. DNB wishes to be an active owner and is committed to safe-guarding the interests of individuals and the environment. The aim of active ownership is to influence companies in the desired direction. DNB exercises its ownership role primarily through dialogue with indi-vidual companies. At the end of 2012, 58 companies were excluded after breaching DNB’s ethical investment guidelines, based on the following criteria: Exclusion criteria 1) Number of companies Anti-personnel mines (land mines) 1 Cluster weapons 9 Nuclear weapons 11 Pollution 8 Labour rights 1 Human rights 6 Pornography 2 Tobacco 20 Total number of excluded companies 58
1) All figures refers to the DNB Group In 2012, DNB supported sporting, cultural and charitable organisa-tions and other non-profit projects with NOK 119 million. In 2012, a course in personal finances was prepared in collaboration with the Norwegian Red Cross. This course was also used in adult education and in a project aimed at helping young dropouts find gainful employment and their place in society. More than 400 people completed a DNB course in personal finances in 2012. The DNB NOR Savings Bank Foundation is the second largest shareholder in the DNB Group and donates a share of its profits to non-profit projects. In 2012, the foundation made donations totalling NOK 105.4 million to 441 different projects. In 2012, DNB qualified for inclusion, for the fourth year in a row, in the Dow Jones Sustainability Index. The index is based on extensive analyses of companies’ sustainability and comprises the top 10 per cent within each industry sector worldwide based on their financial, environmental and social performance. The index is an important indicator for DNB’s target attainment in this field compared with the rest of the industry, and DNB aims to continue to qualify for inclusion in the index in 2013. The DNB Group’s operations and financial performance are influenced by the way DNB is perceived by its customers and the market in general. Thus, both corporate reputation and customer satisfaction are assessed when measuring the target attainment of the group chief executive and the group executive vice presidents, which entails that corporate social responsibility forms part of the basis for group management’s remuneration. The DNB Group’s result in RepTrak Norway’s reputations survey showed a consistent development from 2011 to 2012. The reputation score is reported as an annual average and is based on one main survey and three additional surveys. The main survey for 2012,

12 Director’s report DNB Bank Annual Report 2012
carried out in January and February 2012, resulted in a score of 66 points, while the annual average ended up at 68 points. Customer satisfaction, which measures DNB customers’ opinion of and satisfaction with the DNB Group, remained unchanged from 2011 to 2012 at 97 per cent. The target is 100 per cent, which is the market average. DNB aims to further integrate non-financial information into its future annual reports and wants to present more comprehensive financial reporting to better demonstrate how non-financial aspects help DNB achieve its financial targets and strategic ambitions. More information about the DNB Group’s corporate social responsibility initiatives can be found on dnb.no/en/about-us/corporate-social-responsibility. Environmental efficiency The banking group’s direct impact on the climate and the environment is mainly related to its greenhouse gas emissions and waste from its office operations. In 2012, the DNB Group participated in the Carbon Disclosure Project, CDP, a climate reporting project, together with 4 100 other large, global companies. In DNB’s opinion, the voluntary reporting to CDP is a way of communicating both the DNB Group’s strengths and improvement areas regarding greenhouse gas emissions. DNB’s target is to be the best Nordic financial services group which reports to the CDP by 2015. In order to reduce the DNB Group’s direct impact on the climate and the environment, it is important for DNB to increase its employees’ commitment for the environment. New ways of working which, among other things, reduce the need for paper, office space, travel and physical meetings are key initiatives to achieve this. All of the DNB Group’s employees, independent of where they work, will be required to apply the new working methods as well as an environ-mental waste management concept. The relocation of employees in Oslo, Bergen and Trondheim to new, more environmentally efficient buildings will contribute positively to DNB’s environmental impact in the future. Each year, DNB draws up a carbon audit, quantifying emissions from the heating of buildings, transport using the DNB Group’s own vehicles, waste, purchased electricity, district heating/cooling and air travel. Significant environmental impact of the DNB Group’s Norwegian operations
1) The target is based on emission levels in 2009. 2) The target is based on number of kilometres in 2011. The carbon audit for the DNB Group’s Norwegian operations showed a reduction in total CO2 emissions of more than 1 000 tonnes, or approximately 6 per cent. The reduction was mainly due to reduced air travel emissions. Energy consumption has also been slightly reduced due to the relocation of operations to the new headquarters
in Bjørvika in Oslo, but the full effect of the move will not be seen until the 2014 carbon audit, when DNB will have moved from as many as 18 Oslo area locations. In 2012, the DNB Group prepared the first separate carbon audit for its Baltic operations, and the DNB Group’s reporting of significant environmental impact thus includes close to 85 per cent of its total operations. Figures for the Baltics will be included in the annual report from 2013, with comparable figures from 2012. The DNB Group’s respective carbon audits for its operations in Norway, the Baltics and the DNB Group as a whole are available on the Group’s website. Employees and managers The vision ”the art of serving the customer” are guiding for the DNB Group’s employees at all levels of the organisation. Professional development is emphasised, which includes promoting internal mobility so that all employees can use their abilities in the best interest of the DNB Group. A common corporate culture will help ensure that all employees work to realise the DNB Group’s vision and reach its targets. The DNB Group’s leadership principles imply that all managers must create results, develop their employees and teams, set direction and drive change. Leadership in DNB should reflect the way we meet our customers and create added value for customers, employees, the bank and society at large. The DNB Group’s vision, values and code of ethics should govern the employees’ behaviour towards colleagues, customers and other external parties. The code of ethics describes the due care and re-sponsible behaviour that DNB expects from its employees. The pur-pose of the code of ethics is to contribute to the awareness of and compliance with the high ethical standards required of all employees in all parts of the DNB Group. The code was revised in 2011, and its implementation received much attention in 2012, in particular in the DNB Group’s international operations. The DNB Group has manda-tory, web-based ethics programmes for all employees. In addition, measures to strengthen the ethics training of customer advisers were introduced in 2012. New employees sign a statement confirming that they are familiar with DNB’s code of ethics and must also participate in ethical dilemma training at DNB’s introduction meetings for new employees. Knowledge of the ethical guidelines is monitored through the DNB Group’s annual employee survey. In 2012, 138 managers and other employees became authorised in accordance with the requirements under the Norwegian authorisa-tion scheme for financial advisers. The purpose of the scheme is to strengthen the financial sector's reputation and ensure that each individual adviser meets the necessary competence requirements. At year-end 2012, DNB satisfied the requirement that all employees and managers working as financial advisers must be authorised. The DNB Group recruited six new candidates of various backgrounds and experience to its corporate trainee programme in 2012. The candidates follow an individually tailored development programme and are assigned a management level mentor for the duration of the trainee period. Furthermore, one new candidate was recruited to the DNB Group’s executive trainee programme in 2012. The number of DNB employees on long-term contracts abroad rose from 65 to 91 between 2011 and 2012, including employees of foreign entities on long-term contracts in the Norwegian part of the organisation, and employees from Norway working on IT projects in Lithuania. Initiatives to implement a group policy for people and organisation continued in 2012. The policy provides guidelines for recruitment, re-muneration and HS&E, and aims to ensure that uniform recruitment principles are applied throughout the DNB Group. In order to help increase mobility through internal recruitment, the use of internal short-term assignments and career coaching and ad-vice for employees affected by a reorganisation or change process, a career change centre was established in 2012.
Category 2011 2012
Targets by year-end 2013
Total CO2 emissions (tons) 20 398 19 228 CO2 emissions per employee (tons) 2.1 2.0
20 per cent reduction 1)
Total energy consumption (Gwh) 104.0 101.8
Energy consumption per employee (Kwh) 10.6 10.8
20 per cent reduction 1)
Domestic air travel in Norway (1 000 kms) 21 538 19 988
20 per cent reduction 2)
International air travel (1 000 kms) 27 962 23 368
20 per cent reduction 2)
Purchased paper (tons) 1 302 870
DNB Bank Annual Report 2012 Director’s report 13
The employee survey conducted in November 2012 was the first to include all employees in the DNB Group. Results showed that efforts to establish a common strategy based on a clear vision have yielded results and that the employees are highly committed. The employee satisfaction index rose from 75.1 points in 2011 to 75.6 points in 2012. The figure for 2011 has been adjusted for results from the Baltics, where a separate survey was conducted in 2011. At the end of 2012, there were 13 703 employees in the DNB Group, of whom 4 371 were based outside Norway. Health, safety and environment Health, safety and environment, HS&E, are important elements in the group policy for people and organisation. Preventive working environment measures should be adopted to promote employees’ safety, health, well-being and working capacity. Furthermore, cooperation between management and employees should ensure that efforts to improve the working environment are future-oriented and an integrated part of daily operations. When planning and establishing new main buildings in Oslo, Bergen and Trondheim, important proactive measures to promote employees’ health have included food concepts and physical adaptation. The new buildings have been especially adapted for people with reduced working capacity. In 2012, new HS&E guidelines were introduced to facilitate systematic follow-up and development of HS&E efforts. These guidelines will be implemented globally in 2013. Operations in each country must have individual rules for following up sickness absence and ensuring that medical help is provided in emergencies. The guidelines also include security principles for DNB’s international offices and for travelling employees. The DNB Group has separate guidelines addressing harassment, bullying and other improper conduct. The guidelines aim to ensure that a reported incident is assessed swiftly, predictably and consi-stently. As part of the work to prevent harassment and bullying, the annual employee survey also contains specific questions about such issues. HS&E training is mandatory for new managers with personnel responsibility. The training is tailored to satisfy the authorities’ and the DNB Group’s internal requirements for the follow-up of, and imple-mentation of suitable measures for, employees on sick leave. A total of 109 managers completed the training in 2012. In addition, 37 safety representatives completed HS&E training arranged by the occu-pational health service. The training provides the necessary insight and knowledge to comply with the Working Environment Act and DNB’s internal HS&E requirements. DNB endeavours to prevent injuries caused by robberies and threats through extensive security procedures and training pro-grammes. In 2012, 395 employees in the DNB Group's operations in Norway attended courses on how to handle robberies. In addition, 373 employees attended various courses on threat management, security and fire protection. Six evacuation drills were held in 2012, in which a total of 4 750 employees participated. A total of 74 em-ployees in the DNB Group's operations in Norway were exposed to threats during the year. DNB was not exposed to any robberies in 2012. 21 accidents and injuries were registered during working hours or in connection with commuting to and from work, but none were of a serious nature. Accidents at work are registered in the DNB Group’s event database and reported to the Norwegian Labour and Welfare Organisation (NAV) as occupational injuries. The incidents are re-ported to the group working environment committee and serious incidents are reported to the Norwegian Labour Inspection Authority. Criminal acts characterised by violence or force are also reported to the DNB Group’s security department for further follow-up.
Sickness absence and an inclusive workplace In 2012, sickness absence was 4.4 per cent in the banking group’s Norwegian operations, an increase from 4.1 per cent in 2011. Of 1 894 000 possible man-days, some 84 200 man-days were lost due to sickness absence in 2012. The special follow-up of units with high sickness absence rates continued in 2012. DNB’s inclusive workplace agreement was extended in 2012. In order to achieve the targets specified in the agreement: sickness absence reductions, special adaptation for employees with reduced capacity for work and a higher average retirement age, DNB has implemented several measures. As part of the agreement, DNB also takes in people on long-term sickness leave to see if they are ready to return to work. In 2012, the average retirement age was 63.6 years in the banking group’s Norwegian operations, a positive development from 62.5 years in 2011. This is partly due to more consistent com-pliance with the retirement age of 67 years. The number of em-ployees under 62 years of age who retired on a disability pension dropped from 38 in 2011 to 27 in 2012.
Equality and discrimination The banking group has flexible schemes that make it easier to combine a career with family life. DNB is committed to gender-balanced participation in its talent and management development programmes. As a measure to promote gender equality, DNB gives priority to female applicants for management positions, subject to equal qualifications. In the banking group’s Norwegian operations, the proportion of women was 50 per cent in 2012. The average age was 46 years for women and 44 years for men. Of employees working part-time in 2012, 75 per cent were women, a reduction from 79 per cent in 2011. The average fixed salary was NOK 490 207 for women and NOK 613 693 for men, having converted all part-time positions to full-time. The proportion of women in the DNB group management team was unchanged at 45 per cent at year-end 2012. At management level four, female representation increased from 27 per cent in 2011 to 29.1 per cent in 2012, while at management level five, there was an increase from 33 per cent in 2011 to 37.2 per cent in 2012. The female representation target set by the Board of Directors for the top four management levels in the DNB Group is minimum 40 per cent. Physical adaptation for employees with reduced working capacity has been taken into account in the planning of new office buildings in Oslo, Bergen and Trondheim. The number of disabled parking spaces has been adapted to actual requirements in each building. The group recruitment guidelines should help ensure quality, diversity and non-discrimination in selection processes. Local regu-latory requirements must be complied with, and DNB has a zero-tolerance approach to discrimination in the recruitment process. When selecting candidates for the group trainee programme and summer internships, candidates who are qualified and of a non-Norwegian nationality or ethnicity shall be included in the final stage of the process. Macroeconomic developments The weak trend in the international economy continued throughout 2012. Following an upturn in 2010 and 2011, the euro area ex-perienced a decline in manufacturing output. Coupled with large running budget deficits, there was thus an increase in sovereign debt relative to GDP. Nevertheless, some countries succeeded in reducing their deficits through a tighter fiscal policy, which contributed to the weak GDP growth. Measures implemented by the European Central Bank reduced interest rates on sovereign debt and thus eased the debt burden for the European countries. Even though the crisis in Europe has received less attention over the past few months, the

14 Director’s report DNB Bank Annual Report 2012
weak economic trend may cause renewed turmoil in countries with high sovereign debt levels. The US experienced moderate economic growth in 2012, but rising sovereign debt levels may cause problems here as well. As the country has low tax revenues relative to GDP, it will have to use more government revenues to service debt than most European countries. This could contribute to dampening international economic growth. In Norway, the economic recovery continued in 2012. In spite of an increase in employment levels, the unemployment rate rose from 3.1 per cent of the labour force in the first quarter to 3.5 per cent in the fourth quarter. This was caused partly by an increase in the supply of labour, reflecting continued high immigration levels. The strong increase in the supply of labour also contributed to keeping price inflation low. Wage inflation in 2012 was on a level with 2011. Combined with an increase in pension payments, this gave a boost in household purchasing power. In addition, low interest rates ensured continued strong growth in housing prices and housing investments, which in turn contributed to higher production within both the building and construction industry and the private service industry. A high level of petroleum investment also gave a positive impetus to the economic growth in Norway. New oil discoveries on the Norwegian shelf indicate that this trend will continue. Due to expected sluggish growth among key trading partners, the Norwegian economy will probably get little stimulus from exports of goods and services over the next few years. Thus, it is assumed that petroleum activities and the household sector will continue to be the main drivers of economic growth. Due to a strong increase in household income and high population growth, especially in urban areas, housing demand will probably remain strong. The low interest rate level reinforces this trend. An anticipated increase in house-building activity may gradually ensure an adequate supply of new homes to dampen price growth on resale housing. Even though it is expected that interest rate levels will normalise in the course of two to three years, households’ interest expenses will probably not be so high as to cause a major setback in the housing market. New regulatory framework At the end of 2012, the EU had not yet finalised its proposal for new regulations for credit institutions and investment firms, CRR and CRD IV (Capital Requirements Regulation and Capital Requirements Directive). Due to the EEA agreement, new regulations in Norway will be implemented on the basis of EU legislation. The regulations are based on the Basel Committee’s recommendations from December 2010 on new and stricter capital and liquidity standards, Basel III. The new regulations will present major challenges for banks in the form of requirements for higher earnings in order to increase equity. Parallel to this, requirements for increased long-term funding and stricter liquidity requirements will give higher funding costs. CRR and CRD IV are intended to apply to all banks and investment firms within the EEA. The possible implementation date is 1 January 2014, depending on when the EU will finalise the proposals, with full implementation as from 2019. Uncertainty still prevails regarding the final content of the new liquidity requirements. Several important changes regarding the short-term liquidity requirement, LCR, were announced in January 2013. The European Banking Authority, EBA, will use the observation period in 2013 to assess the effects of the new rules for European banks. Based on the EBA’s report, the EU Commission will present a final proposal regarding LCR to the EU. Over the next couple of years, these bodies will also continue to work on the long-term liquidity requirement, NSFR. The new capitalisation proposals imply that the minimum capital adequacy requirement will be unchanged at 8 per cent. With the addition of the so-called capital conservation buffer, however, this requirement will in practice be increased to 10.5 per cent. In addition, a counter-cyclical capital element will be introduced, ranging between
0 and 2.5 per cent, which will be determined by the national super-visory authorities. The Norwegian Ministry of Finance has previously signalled that it aims to introduce a counter-cyclical capital buffer as soon as possible in 2013 after the new capital and liquidity require-ments have been approved by the EU. The process in the EU has been delayed, thus it remains to be seen when this will happen. Addi-tional capital buffers will be required for global and national systemi-cally important banks. Finanstilsynet (the Financial Supervisory Authority of Norway) has chosen to retain the Basel II transitional rules, which set a floor for how low a bank’s risk-weighted volume can be relative to the Basel I rules, the so-called “80 per cent floor”. This distinctively Norwegian supervisory practice will be of no consequence to Norwegian banks’ actual capital adequacy, but will make Norwegian banks appear weaker capitalised in international comparisons. The Ministry of Finance has asked Finanstilsynet to review an increase in the systemic risk premium on the risk weights for home mortgages to minimum 35 per cent. Today, the banking group’s average risk weight on home mortgages is 12.1 per cent. An increase to 35 per cent will thus have a negative impact on the banking group’s capital adequacy according to Basel II without transitional rules and Basel III. Finansinspektionen, the Swedish financial supervisory authority, recently proposed a 15 per cent average risk weight floor for home mortgages. In addition, measurement according to the proposal will make Swedish banks appear better capitalised than Norwegian banks. The banking group is of the opinion that it is vital that equal framework conditions are established for competition in the market and therefore urges the Norwegian authorities to work for optimal harmonisation in agreement with the intentions behind the new regulatory framework within the EEA. Covered bonds issued by wholly or partially-owned mortgage institutions have become an important source of funding for Norwegian banks, contributing to reducing the banks’ funding costs and liquidity risk during a period characterised by extensive turmoil in the international financial markets. Towards the end of 2012, the Ministry of Finance asked Finanstilsynet to consider whether the introduction of a qualitative rule whereby banks will not be allowed to transfer more assets to their mortgage institutions than what is con-sidered prudent, could help reduce systemic risk. The Ministry also asks for a proposal for legal authority to introduce additional capital requirements if there is a significant increase in risk in the banks which transfer loans to mortgage institutions. The banking group assumes that the authorities will not introduce rules which undermine the banks’ chances to strengthen their liquidity profile through the use of covered bonds, which in turn will be of great significance to the banks’ general ability to serve both personal and corporate cus-tomers. Towards the end of 2012, the EU decided to establish a single, supranational supervisory authority for the banks in the eurozone. The European Central Bank will assume the supervisory function, and the new authority is expected to be operative as from 2014. At year-end 2012, the Norwegian parliament resolved that the members of the Norwegian Banks’ Guarantee Fund should pay a full annual levy to the Guarantee Fund independent of the Fund’s size. The change in practice will imply an increase in the banks’ annual guarantee fund levies compared with today, when the Fund’s mem-bers are required to pay levies only when the Fund’s capital base is below a certain level. The banking group is working to be ready to meet the various new requirements. Up until the final regulations are in place, the banking group’s activities will be gradually adapted to the new requirements.
DNB Bank Annual Report 2012 Director’s report 15
Future prospects The DNB Group presented updated financial targets at its Capital Markets Day event in September 2012, and these targets remain un-changed. A more detailed description of the targets can be found in the section on strategy and targets. There are a number of key factors which make the DNB Group believe that these targets are attainable. In spite of a weak inter-national economic trend, the Norwegian economy is expected to remain strong. Coupled with strict cost control, this will provide the basis for a healthy profit trend in the DNB Group’s Norwegian opera-tions. During the period up to 2015, the banking group will make some adjustments to its credit exposure in the large corporate seg-ments. In addition, the banking group will implement other measures to reduce the exposure to capital-intensive operations while focusing on operations which increase less capital-intensive income. The DNB Group’s targets are based on key analysis institutions’ expectations to developments in the Norwegian and international economies, which include a gradual normalisation of interest rate levels. However, there is still great uncertainty regarding these developments, and a further postponement of a new international growth period, along with the possibility of even stricter regulatory requirements, could influence future target attainment.
A gradual widening of volume-weighted interest rate spreads and moderate growth in lending volumes are expected in the period ahead. Costs will remain stable. Portfolio quality is expected to re-main strong, with impairment of loans on a level with 2012. The banking group will continue to build up capital and improve its capital adequacy ratios. The banking group is well positioned to meet ex-pected regulatory requirements. Allocation of profits Profits for 2012 in DNB Bank ASA came to NOK 13 319 million, compared with NOK 10 633 million in 2011. The Board of Directors has proposed a group contribution from DNB Bank ASA to DNB ASA of NOK 6 000 million after taxes. The remaining profits will be transferred to other equity. The banking group’s capital adequacy ratio as at 31 December 2012 was 12.4 per cent, while the common equity Tier 1 capital ratio was 10.5 per cent. Correspondingly, the capital adequacy ratio in DNB Bank ASA was 13.6 per cent and the common equity Tier 1 capital ratio 11.5 per cent. In the opinion of the Board of Directors, following allocations, DNB Bank ASA will have adequate financial strength and flexibility to provide sufficient support to operations in subsidiaries and meet the DNB Bank Group's expansion requirements and changes in external parameters.
Oslo, 13 March 2013 The Board of Directors of DNB Bank ASA Anne Carine Tanum Jarle Bergo Sverre Finstad (chairman) (vice-chairman) Vigdis Mathisen Kai Nyland Torill Rambjør Rune Bjerke (group chief executive)
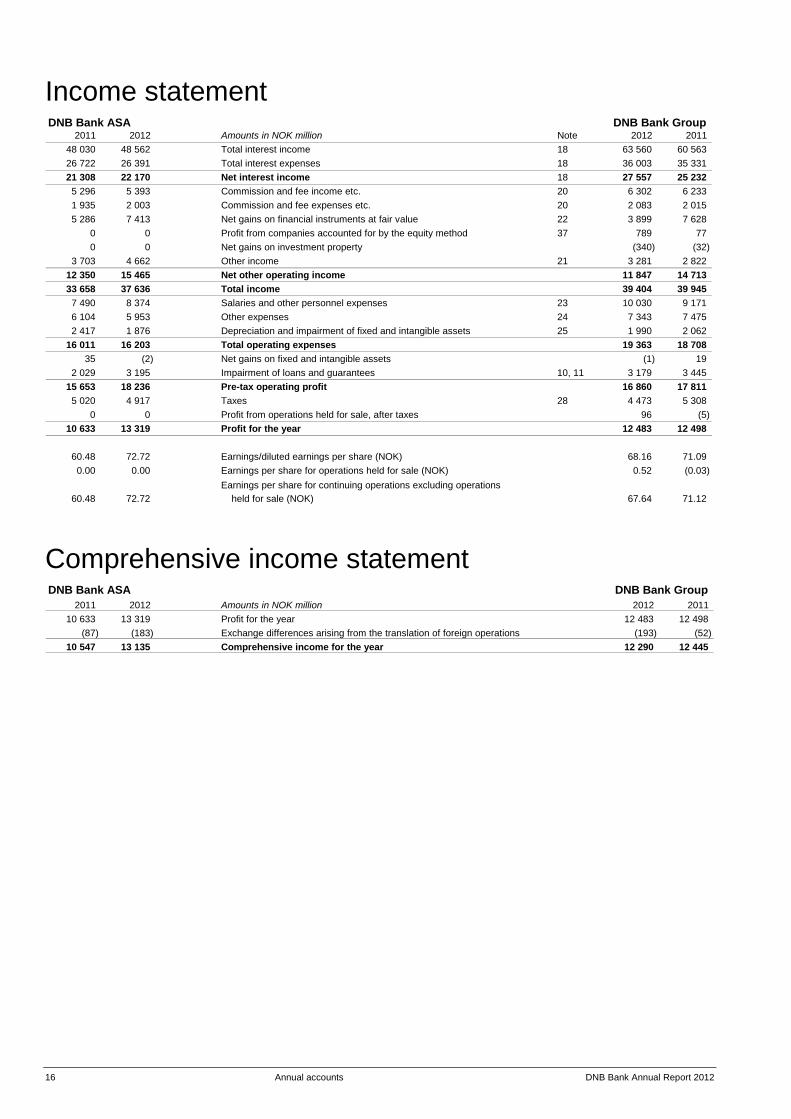
16 Annual accounts DNB Bank Annual Report 2012
Income statement DNB Bank ASA DNB Bank Group
2011 2012 Amounts in NOK million Note 2012 2011 48 030 48 562 Total interest income 18 63 560 60 563 26 722 26 391 Total interest expenses 18 36 003 35 331 21 308 22 170 Net interest income 18 27 557 25 232 5 296 5 393 Commission and fee income etc. 20 6 302 6 233 1 935 2 003 Commission and fee expenses etc. 20 2 083 2 015 5 286 7 413 Net gains on financial instruments at fair value 22 3 899 7 628
0 0 Profit from companies accounted for by the equity method 37 789 77 0 0 Net gains on investment property (340) (32)
3 703 4 662 Other income 21 3 281 2 822 12 350 15 465 Net other operating income 11 847 14 713 33 658 37 636 Total income 39 404 39 945 7 490 8 374 Salaries and other personnel expenses 23 10 030 9 171 6 104 5 953 Other expenses 24 7 343 7 475 2 417 1 876 Depreciation and impairment of fixed and intangible assets 25 1 990 2 062
16 011 16 203 Total operating expenses 19 363 18 708 35 (2) Net gains on fixed and intangible assets (1) 19
2 029 3 195 Impairment of loans and guarantees 10, 11 3 179 3 445 15 653 18 236 Pre-tax operating profit 16 860 17 811 5 020 4 917 Taxes 28 4 473 5 308
0 0 Profit from operations held for sale, after taxes 96 (5) 10 633 13 319 Profit for the year 12 483 12 498
60.48 72.72 Earnings/diluted earnings per share (NOK) 68.16 71.09 0.00 0.00 Earnings per share for operations held for sale (NOK) 0.52 (0.03)
Earnings per share for continuing operations excluding operations60.48 72.72 held for sale (NOK) 67.64 71.12
Comprehensive income statement DNB Bank ASA DNB Bank Group
2011 2012 Amounts in NOK million 2012 2011 10 633 13 319 Profit for the year 12 483 12 498
(87) (183) Exchange differences arising from the translation of foreign operations (193) (52) 10 547 13 135 Comprehensive income for the year 12 290 12 445
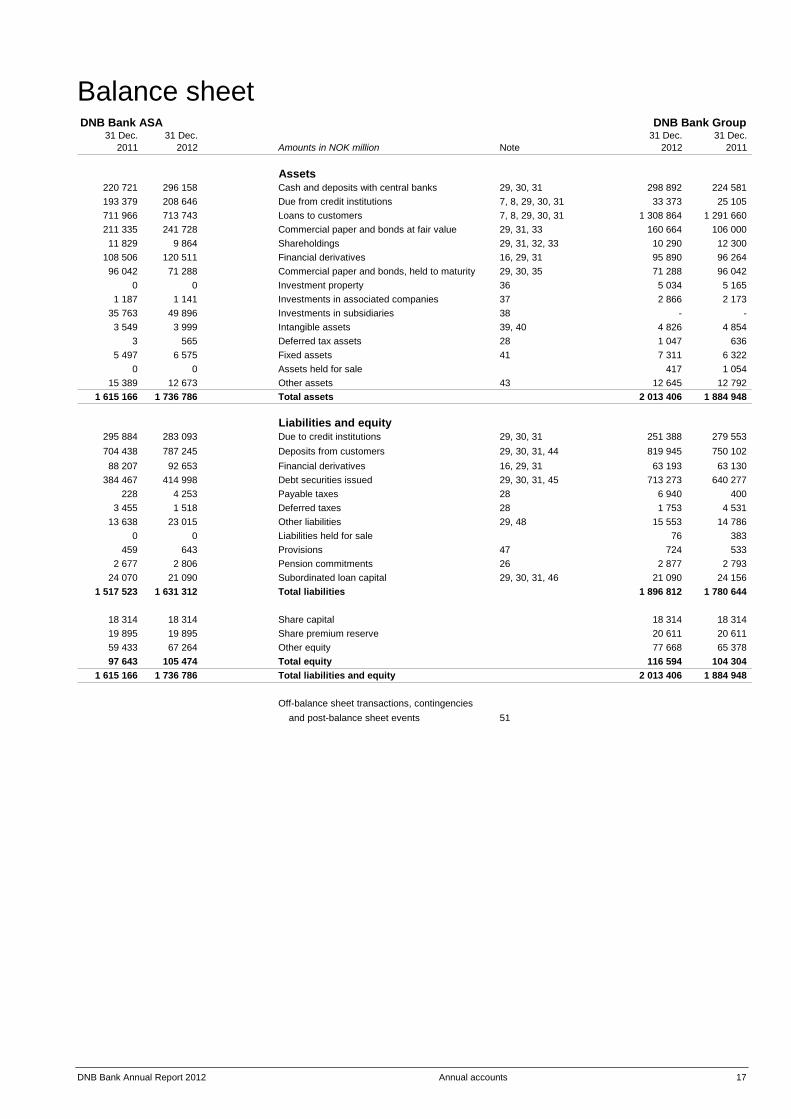
DNB Bank Annual Report 2012 Annual accounts 17
Balance sheet DNB Bank ASA DNB Bank Group
31 Dec. 31 Dec. 31 Dec. 31 Dec. 2011 2012 Amounts in NOK million Note 2012 2011
Assets220 721 296 158 Cash and deposits with central banks 29, 30, 31 298 892 224 581 193 379 208 646 Due from credit institutions 7, 8, 29, 30, 31 33 373 25 105 711 966 713 743 Loans to customers 7, 8, 29, 30, 31 1 308 864 1 291 660 211 335 241 728 Commercial paper and bonds at fair value 29, 31, 33 160 664 106 000 11 829 9 864 Shareholdings 29, 31, 32, 33 10 290 12 300
108 506 120 511 Financial derivatives 16, 29, 31 95 890 96 264 96 042 71 288 Commercial paper and bonds, held to maturity 29, 30, 35 71 288 96 042
0 0 Investment property 36 5 034 5 165 1 187 1 141 Investments in associated companies 37 2 866 2 173
35 763 49 896 Investments in subsidiaries 38 - - 3 549 3 999 Intangible assets 39, 40 4 826 4 854
3 565 Deferred tax assets 28 1 047 636 5 497 6 575 Fixed assets 41 7 311 6 322
0 0 Assets held for sale 417 1 054 15 389 12 673 Other assets 43 12 645 12 792
1 615 166 1 736 786 Total assets 2 013 406 1 884 948
Liabilities and equity295 884 283 093 Due to credit institutions 29, 30, 31 251 388 279 553 704 438 787 245 Deposits from customers 29, 30, 31, 44 819 945 750 102 88 207 92 653 Financial derivatives 16, 29, 31 63 193 63 130
384 467 414 998 Debt securities issued 29, 30, 31, 45 713 273 640 277 228 4 253 Payable taxes 28 6 940 400
3 455 1 518 Deferred taxes 28 1 753 4 531 13 638 23 015 Other liabilities 29, 48 15 553 14 786
0 0 Liabilities held for sale 76 383 459 643 Provisions 47 724 533
2 677 2 806 Pension commitments 26 2 877 2 793 24 070 21 090 Subordinated loan capital 29, 30, 31, 46 21 090 24 156
1 517 523 1 631 312 Total liabilities 1 896 812 1 780 644
18 314 18 314 Share capital 18 314 18 314 19 895 19 895 Share premium reserve 20 611 20 611 59 433 67 264 Other equity 77 668 65 378 97 643 105 474 Total equity 116 594 104 304
1 615 166 1 736 786 Total liabilities and equity 2 013 406 1 884 948
Off-balance sheet transactions, contingenciesand post-balance sheet events 51

18 Annual accounts DNB Bank Annual report 2012
Statement of changes in equity DNB Bank ASA
Share premium Amounts in NOK million Share capital reserve Other equity Total equity Balance sheet as at 31 December 2010 17 514 12 695 48 887 79 096 Profit for the period 10 633 10 633 Exchange differences arising from the translation of foreign operations (87) (87) Comprehensive income for the period 10 547 10 547 Share issue 800 7 200 8 000 Balance sheet as at 31 December 2011 18 314 19 895 59 433 97 643 Profit for the period 13 319 13 319 Exchange differences arising from the translation of foreign operations (183) (183) Comprehensive income for the period 13 135 13 135 Group contribution to DNB ASA (6 000) (6 000) Merger with Nordlandsbanken ASA 696 696 Balance sheet as at 31 December 2012 18 314 19 895 67 264 105 474
Of which currency translation reserve:Balance sheet as at 31 December 2010 (270) (270) Comprehensive income for the period (87) (87) Balance sheet as at 31 December 2011 (356) (356) Comprehensive income for the period (183) (183) Balance sheet as at 31 December 2012 (540) (540) The share premium reserve can be used to cover financial losses. Other equity can be used in accordance with stipulations in the Public Limited Companies Act. The restricted share of retained earnings (fund for unrealised gains) in DNB Bank ASA totalled NOK 1 434 million at 31 December 2012 and NOK 2 067 million at 31 December 2011.
DNB Bank Group Share premium
Amounts in NOK million Share capital reserve Other equity Total equity Balance sheet as at 31 December 2010 17 514 13 411 58 933 89 859 Profit for the period 12 498 12 498 Exchange differences arising from the translation of foreign operations (52) (52) Comprehensive income for the period 12 445 12 445 Group contribution for 2010 to DNB ASA (6 000) (6 000) Share issue 800 7 200 8 000 Balance sheet as at 31 December 2011 18 314 20 611 65 378 104 304 Profit for the period 12 483 12 483 Exchange differences arising from the translation of foreign operations (193) (193) Comprehensive income for the period 12 290 12 290 Balance sheet as at 31 December 2012 18 314 20 611 77 668 116 594
Of which currency translation reserve:Balance sheet as at 31 December 2010 (438) (438) Comprehensive income for the period (52) (52) Balance sheet as at 31 December 2011 (490) (490) Comprehensive income for the period (193) (193) Accumulated currency translation reserve in Pres-Vac 2 2 Balance sheet as at 31 December 2012 (682) (682) The share premium reserve can be used to cover financial losses. Other equity can be used in accordance with stipulations in the Public Limited Companies Act.
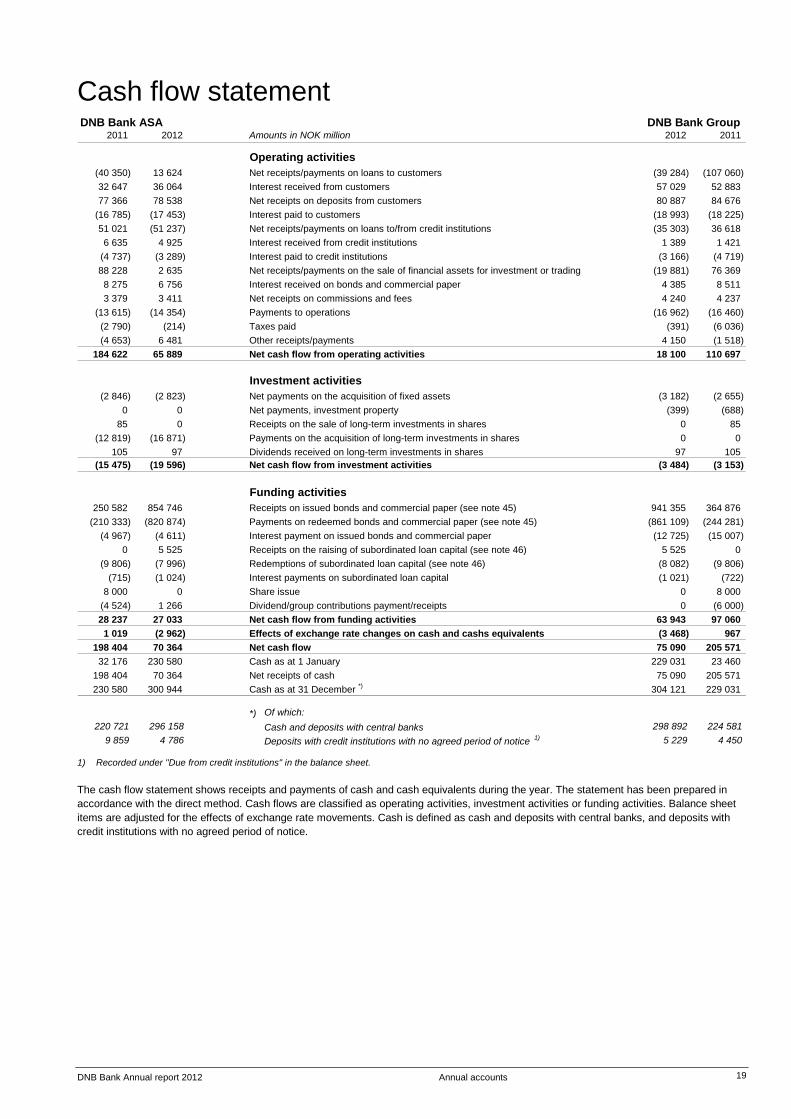
DNB Bank Annual report 2012 Annual accounts 19
Cash flow statement DNB Bank ASA DNB Bank Group
2011 2012 Amounts in NOK million 2012 2011
Operating activities(40 350) 13 624 Net receipts/payments on loans to customers (39 284) (107 060) 32 647 36 064 Interest received from customers 57 029 52 883 77 366 78 538 Net receipts on deposits from customers 80 887 84 676
(16 785) (17 453) Interest paid to customers (18 993) (18 225) 51 021 (51 237) Net receipts/payments on loans to/from credit institutions (35 303) 36 618 6 635 4 925 Interest received from credit institutions 1 389 1 421
(4 737) (3 289) Interest paid to credit institutions (3 166) (4 719) 88 228 2 635 Net receipts/payments on the sale of financial assets for investment or trading (19 881) 76 369 8 275 6 756 Interest received on bonds and commercial paper 4 385 8 511 3 379 3 411 Net receipts on commissions and fees 4 240 4 237
(13 615) (14 354) Payments to operations (16 962) (16 460) (2 790) (214) Taxes paid (391) (6 036) (4 653) 6 481 Other receipts/payments 4 150 (1 518)
184 622 65 889 Net cash flow from operating activities 18 100 110 697
Investment activities(2 846) (2 823) Net payments on the acquisition of fixed assets (3 182) (2 655)
0 0 Net payments, investment property (399) (688) 85 0 Receipts on the sale of long-term investments in shares 0 85
(12 819) (16 871) Payments on the acquisition of long-term investments in shares 0 0 105 97 Dividends received on long-term investments in shares 97 105
(15 475) (19 596) Net cash flow from investment activities (3 484) (3 153)
Funding activities250 582 854 746 Receipts on issued bonds and commercial paper (see note 45) 941 355 364 876
(210 333) (820 874) Payments on redeemed bonds and commercial paper (see note 45) (861 109) (244 281) (4 967) (4 611) Interest payment on issued bonds and commercial paper (12 725) (15 007)
0 5 525 Receipts on the raising of subordinated loan capital (see note 46) 5 525 0 (9 806) (7 996) Redemptions of subordinated loan capital (see note 46) (8 082) (9 806)
(715) (1 024) Interest payments on subordinated loan capital (1 021) (722) 8 000 0 Share issue 0 8 000
(4 524) 1 266 Dividend/group contributions payment/receipts 0 (6 000) 28 237 27 033 Net cash flow from funding activities 63 943 97 060 1 019 (2 962) Effects of exchange rate changes on cash and cashs equivalents (3 468) 967
198 404 70 364 Net cash flow 75 090 205 571 32 176 230 580 Cash as at 1 January 229 031 23 460
198 404 70 364 Net receipts of cash 75 090 205 571 230 580 300 944 Cash as at 31 December *) 304 121 229 031
*) Of which:220 721 296 158 Cash and deposits with central banks 298 892 224 581
9 859 4 786 Deposits with credit institutions with no agreed period of notice 1) 5 229 4 450
1) Recorded under "Due from credit institutions" in the balance sheet. The cash flow statement shows receipts and payments of cash and cash equivalents during the year. The statement has been prepared in accordance with the direct method. Cash flows are classified as operating activities, investment activities or funding activities. Balance sheet items are adjusted for the effects of exchange rate movements. Cash is defined as cash and deposits with central banks, and deposits with credit institutions with no agreed period of notice.

20 Annual accounts DNB Bank Annual Report 2012
Accounting principles Contents 1. Corporate information 2. Basis for preparing the accounts 3. Changes in accounting principles and
presentation 4. Consolidation
- Subsidiaries - Associated companies - Conversion of transactions in foreign currency
5. Business combinations - Operations held for sale
6. Recognition in the income statement 7. Financial instruments
- Recognition and derecognition - Classification and presentation - Determination of fair value - Impairment of financial assets
8. Hedge accounting 9. Offsetting 10. Leasing
- DNB Bank as lessor - DNB Bank as lessee
11. Investment property and fixed assets 12. Intangible assets
- Goodwill - IT systems and software
13. Impairment of fixed and intangible assets 14. Pensions
- Defined benefit occupational pension schemes - Defined contribution occupational pension
schemes
15. Income tax 16. Segment information 17. Restructuring 18. Cash flow statements 19. Equity and capital adequacy
- Proposed dividends - Capital adequacy
20. Approved standards and interpretations that have not entered into force
1. CORPORATE INFORMATION DNB Bank ASA is subsidiary of DNB ASA, which is a Norwegian public limited company listed on Oslo Børs (the Oslo Stock Exchange). The consolidated accounts for 2012 were approved by the Board of Directors on 13 March 2013. The banking group offers banking services and securities and investment services in the Norwegian and international retail and corporate markets. The visiting address to the banking group's head office is Dronning Eufemias gate 30, Bjørvika, Oslo, Norway. 2. BASIS FOR PREPARING THE ACCOUNTS DNB Bank has prepared consolidated accounts for 2012 in accor-dance with IFRS, International Financial Reporting Standards, as endorsed by the EU. DNB Bank ASA has prepared accounts according to the Norwegian Ministry of Finance's regulations on annual accounts, Section 1-5, on the use of IFRS, hereinafter called the Norwegian IFRS regulations, which implies that recog-nition and measurements are in accordance with IFRS. The only exception is that the Norwegian IFRS regulations also give per-mission to record provisions for dividends and group contributions in subsidiaries as income and record the Board of Directors' proposed dividends and group contributions as liabilities on the balance sheet date. According to IFRS, dividends should be classified as equity until approved by the general meeting. DNB Bank ASA presents note information in accordance with IFRS. The consolidated accounts are based on the historic cost prin-ciple, with the following exceptions: financial assets and liabilities (including financial derivatives) carried at fair value through profit or loss and investment property. The consolidated accounts are presented in Norwegian kroner. Unless otherwise specified, values are rounded off to the nearest million. The banking group's balance sheets are primarily based on an assessment of the liquidity of the balance sheet items. 3. CHANGES IN ACCOUNTING PRINCIPLES
AND PRESENTATION The banking group's accounting principles and calculation methods are essentially the same as those described in the annual report for 2011, with the exception of the presentation of repossessed operations. With effect from 1 January 2012 profits from repossessed operations which are fully consolidated in the DNB Bank Group are presented net under ”Profit from re-possessed operations” in the company’s internal reporting of busi-ness areas. The repossessed operations are included in theGroup Centre. The presentation in note 3 Segments has been adjusted correspondingly, including comparable figures. The changes are of significance only to the presentation of profits for the individual business areas and have no impact on the presentation of the banking group’s income statement. The following new standards, amendments and interpretations were also taken into use with effect from the 2012 accounting year: Amendments to IAS 12 – Income Taxes. The amendments
imply that deferred tax on investment property carried at fair value according to IAS 40 Investment Property, as a rule should be determined based on the presumption that the carrying amount of the asset will be recovered through sale rather than use. The amendments also apply to non-depreciable assets recorded at fair value according to the rules in IAS 16 Property, Plant and Equipment. The amend-ments are not expected to have any significant impact on the banking group's use of accounting principles.
Accounting principles (continued)
DNB Bank Annual Report 2012 Annual accounts 21
Amendments to IFRS 7 – New note information for dere-cognition of financial instruments. The amendments include enhanced disclosure requirements for note information about financial assets which have been transferred, but not dere-cognised. In addition, note information must be disclosed about financial assets which have been derecognised, but where the institution still has an interest in the assets through a guarantee, option etc. See note 33 for additional infor-mation.
4. CONSOLIDATION The consolidated accounts for DNB Bank ASA ("DNB Bank" or "the banking group") include DNB Bank and subsidiaries. The accounting principles are applied consistently when con-solidating ownership interests in subsidiaries and are based on the same reporting periods as those used for the parent company. When preparing the consolidated accounts, intra-group tran-sactions and balances, along with gains and losses on trans-actions between group units, are eliminated. Subsidiaries Subsidiaries are defined as companies in which DNB Bank has control, directly or indirectly, through ownership or other means. DNB Bank recognises the existence of de facto control, but generally assumes to have control when the banking group's direct or indirect holdings represent more than 50 per cent. With respect to companies where the banking group's holding is 50 per cent or less, DNB Bank makes an assessment of whether other factors indicate de facto control. Subsidiaries are fully consoli-dated from the date on which control is transferred to the banking group. Subsidiaries are consolidated up till the time control is transferred. Associated companies Associated companies are companies in which DNB Bank has a significant influence, that is the power to participate in the financial and operating policy decisions of the companies, but is not in con-trol or joint control of the companies. DNB Bank assumes that significant influence exists when the banking group holds between 20 and 50 per cent of the voting share capital or primary capital in another entity. Associated companies are recognised in the group accounts according to the equity method. The investment is recorded at cost at the time of acquisition and is adjusted for subsequent changes in the banking group's share of equity in the associated company. Any goodwill is included in the acquisition cost. The banking group's share of profits or losses is recognised in the income statement and added to the balance sheet value of the investment along with other changes in equity which have not been reflected in the income statement. The banking group's share of losses is not reflected in the income statement if the balance sheet value of the investment will be negative, unless the banking group has taken on commitments or issued guarantees for the commitments of the associated company. If there are any indications of a decrease in value (loss event), the investment will be tested for impairment. The recorded value of the investment will be compared with the recoverable amount (the higher of fair value less costs to sell and value in use). If ne-cessary, the recorded value will be written down to the recover-able amount. The banking group's share of unrealised gains on transactions between the banking group and its associated companies is eli-minated. The same applies to unrealised losses unless the tran-saction indicates an impairment of the transferred assets.
Conversion of transactions in foreign currency The major entity in the banking group, DNB Bank ASA, has Norwegian kroner as its functional currency. Balance sheet items of foreign branches and subsidiaries in other functional currencies are translated into Norwegian kroner according to exchange rates prevailing on the balance sheet date, while profit and loss items are translated according to exchange rates on the transaction date. Changes in net assets resulting from exchange rate move-ments are recorded as other comprehensive income. Monetary assets and liabilities in foreign currency are trans-lated at exchange rates prevailing on the balance sheet date. Changes in value of such assets due to exchange rate move-ments between the transaction date and the balance sheet date, are recognised in the income statement. 5. BUSINESS COMBINATIONS The acquisition method is applied for acquisitions of operations. The consideration is measured at fair value. Direct acquisition costs are expensed as they occur, with the exception of issue and borrowing costs. Acquired assets and liabilities are recorded at fair value at the time of acquisition. If the consideration exceeds the fair value of identifiable assets and liabilities, the excess will be recorded as goodwill. See item 12 Intangible assets for more information about goodwill. If cost is lower than the fair value of identifiable assets and liabilities, the difference will be recognised in the income statement on the transaction date. In connection with step acquisitions of subsidiaries, the banking group will measure previous holdings in the company at fair value immediately before control is obtained, and any gains or losses will be recognised in profit or loss. Contingent considerations are measured at fair value irre-spective of the probability of the consideration being paid. Subsequent changes in the consideration will be reflected in the accounts according to relevant standards. Operations held for sale The banking group classifies operations as held for sale when the recorded value will be retrieved through a sale. An operation is classified as held for sale from the time management has approved a concrete plan to sell the operation in its current form and it is highly probable that the sale will take place shortly. Subsidiaries which are acquired with a view to their subse-quent sale, including companies taken over as part of loan re-structurings, are immediately classified as assets held for sale if the banking group intends to sell the subsidiary. Operations held for sale are measured at the lower of the balance sheet value and fair value less costs to sell. Acquired operations which are immediately classified as held for sale are recorded at fair value less costs to sell upon initial recognition. Profits after taxes for such operations, which meet the criteria for “discontinued operations” in IFRS 5, are presented separately as "Profit from operations held for sale, after taxes" in the consoli-dated accounts. Total assets and liabilities from these operations are presented separately under "Assets held for sale" and "Liabilities held for sale" in the banking group's balance sheet. 6. RECOGNITION IN THE INCOME STATEMENT Interest income is recorded using the effective interest method. This implies that interest is recorded when incurred, with the addition of amortised front-end fees and any other fees which are regarded as an integral part of the effective interest rate. The effective interest rate is set by discounting contractual cash flows based on the expected life of the asset. Cash flows
Accounting principles (continued)
22 Annual accounts DNB Bank Annual Report 2012
include front-end fees and direct marginal transaction costs which are not paid directly by the customer, plus any residual value at the expiry of the asset's expected life. Interest is recorded according to the effective interest method with respect to both balance sheet items carried at amortised cost and balance sheet items carried at fair value in the income state-ment, with the exception of front-end fees on loans at fair value, which are recorded when earned. Interest taken to income on impaired loans corresponds to the effective interest rate on the written-down value. Interest income on financial instruments presented as lending is included in "Net interest income". "Net other operating income" includes, among others, fees and commissions relating to money transfers, success fees, credit broking, real estate broking, corporate finance and securities services. Credit broking commissions include syndication income in the form of fees and commissions from transactions where DNB arranges the loans without retaining parts of the loan itself or participates in a loan syndicate and receives compensation in excess of the effective interest received by the other participants. Fees which are not included in effective interest rate calculations, as well as commissions, are recorded during the period when the services are rendered or the transactions are completed. Success fees are recorded when the fees with a high degree of certainty have been earned and can be measured in a reliable manner. Fees that are incurred when establishing financial guarantees are recorded over the term of the contract under “Net gains on financial instruments at fair value”. Dividends on investments are recognised from the date the dividends were approved at the general meeting. Income from net profits on financial instruments carried at fair value through profit or loss is described under item 7 Financial instruments. 7. FINANCIAL INSTRUMENTS Recognition and derecognition Financial assets and liabilities are recorded in the balance sheet at the time the banking group becomes a party to the instruments' contractual obligations. Derecognition of financial assets The banking group enters into agreements whereby assets are transferred to counterparties, though parts of or the entire risk and returns associated with the ownership are retained by the banking group. If the major part of risk and returns is retained, the financial asset is not derecognised, but recorded at a value limited to the banking group's continuing involvement. Such agreements could entail the transfer of a loan portfolio where the banking group retains the risk and returns associated with the transferred port-folio by guaranteeing for all risks in the portfolio or entering into a total return swap. Derecognition of financial liabilities Financial liabilities are derecognised at the time the rights to the contractual obligations have been fulfilled or cancelled or have expired. Repurchase and reverse repurchase agreements Securities which have been purchased under an agreement to resell and securities sold under an agreement to repurchase are generally not recognised and derecognised, as the risk and returns are normally not taken over or transferred. Such transact-ions primarily involve fixed-income securities. Securities received, including securities received as collateral, are registered off the balance sheet irrespective of whether the
banking group has the right to sell or repledge the securities. Upon the sale of securities received, the banking group will record an obligation in the balance sheet. See note 34 Securities re-ceived which can be sold or repledged. Transferred securities which the recipient is entitled to sell or repledge, are presented as securities in the banking group's balance sheet and are specified in note 33 Repurchase agree-ments and securities lending. Securities borrowing and lending agreements Transactions mainly include equity borrowing or lending. Agree-ments on securities borrowing and lending are generally based on collateral in the form of cash or securities. Equities which have been received or transferred in such tran-sactions, are generally not recognised and derecognised, as risk and returns associated with ownership of the assets are normally not taken over or transferred. Equities received, including equities received as collateral, are registered off the balance sheet irrespective of whether the banking group has the right to sell or repledge the securities. Upon the sale of securities received, the banking group will record an obligation in the balance sheet. See note 34 Securities received which can be sold or repledged. Transferred equities and collateral which the recipient is entitled to sell or repledge, are presented as equities or securities in the banking group's balance sheet and are specified in note 33 Repurchase agreements and securities lending. Classification and presentation On initial recognition financial assets are classified in one of the following categories according to the type of instrument and the purpose of the investment: • financial assets held for trading and derivatives carried at fair
value with changes in value recognised in profit or loss • financial instruments designated as at fair value with changes
in value recognised in profit or loss • financial derivatives designated as hedging instruments • loans and receivables, carried at amortised cost • held-to-maturity investments, carried at amortised cost On initial recognition financial liabilities are classified in one of the following categories: • financial liabilities held for trading and derivatives carried at
fair value with changes in value recognised in profit or loss • financial liabilities designated as at fair value with changes in
value recognised in profit or loss • financial derivatives designated as hedging instruments • other financial liabilities carried at amortised cost Guidelines for classification in the various portfolios of the banking group are given below. Financial assets and liabilities in the trading portfolio Financial instruments in the trading portfolio are recorded at fair value excluding transaction costs. Fair value will normally be the transaction price, unless a different value can be justified based on observable market transactions. See the paragraph below on determining fair value at subsequent valuation. Changes in value of the financial instruments are included under "Net gains on financial instruments at fair value" in the income statement. Interest income and expenses on fixed-income securities are included under "Net interest income" using the effective interest method. Financial derivatives are presented as an asset if the market value is positive and as a liability if there is a negative market value.

Accounting principles (continued)
DNB Bank Annual Report 2012 Annual accounts 23
The trading portfolio mainly includes financial assets in DNB Markets and financial derivatives excluding derivatives used for hedging. In addition, the portfolio includes securities borrowing and deposits where instruments are used actively in interest rate and liquidity management and have a short remaining maturity. Financial assets and liabilities designated as at fair value with changes in value recognised in profit or loss Financial instruments in the portfolio are recorded at fair value excluding transaction costs. Fair value will normally be the transaction price, unless a different value can be justified based on observable market transactions. See the paragraph below on determining fair value at subsequent valuation. Financial instru-ments are classified in this category if one of the following criteria is fulfilled: • The classification eliminates or significantly reduces measure-
ment inconsistency that would otherwise have arisen from measuring financial assets or liabilities or recognising the gains and losses on them on different bases
• The financial instruments are part of a portfolio that is managed and evaluated on a fair value basis, in accordance with a documented risk management or investment strategy
Changes in value of the financial instruments are included under "Net gains on financial instruments at fair value" in the income statement. Interest income and expenses relating to loans designated as at fair value and other fixed-income securities are included under "Net interest income". These portfolios include commercial paper and bonds, equities, fixed-rate loans in Norwegian kroner, fixed-rate securities issued in Norwegian kroner, such as index-linked bonds and equity-linked bank deposits and other fixed-rate deposits in Norwegian kroner. Financial derivatives designated as hedging instruments See item 8 Hedge accounting. Loans and receivables carried at amortised cost Loans and receivables carried at amortised cost are recorded at the transaction price plus direct transaction expenses. Recording and subsequent measurement follow the effective interest me-thod. The effective interest method is described under item 6 Recognition in the income statement. Upon subsequent measurement, amortised cost is set at the net present value of contractual cash flows based on the expected life of the financial instrument, discounted by the effective interest rate. Interest income on financial instruments classified as lending is included under "Net interest income" using the effective interest method. A decrease in value on the balance sheet date based on objective indications of impairment for loans valued at amortised cost and in the portfolios of fixed-rate loans measured at fair value, are reflected in "Impairment of loans and guarantees". Other changes in value of the portfolios of fixed-rate loans measured at fair value, and changes in value of loans included in the trading portfolio are included under "Net gains on financial instruments at fair value". Held-to-maturity investments carried at amortised cost Held-to-maturity investments are carried at amortised cost and recorded at the transaction price plus direct transaction expenses. Recording and subsequent measurement follow the effective
interest method. The effective interest method is described under item 6 Recognition in the income statement. Upon subsequent measurement, amortised cost is set at the net present value of contractual cash flows based on the expected life of the financial instrument, discounted by the effective interest rate. Interest income relating to the instruments is included under "Net interest income". This category mainly comprises the liquidity portfolio in DNB Markets. Other financial liabilities carried at amortised cost Financial liabilities carried at amortised cost are recorded at the transaction price plus direct transaction expenses. Interest expenses on such instruments are included under "Net interest income" using the effective interest method. This category includes deposits from customers and credit institutions, commercial paper issued, bonds, subordinated loan capital and perpetual subordinated loan capital securities. Issued financial guarantees Contracts resulting in the banking group having to reimburse the holder for a loss incurred because a specific debtor fails to make payment when due, are classified as issued financial guarantees. On initial recognition, issued financial guarantees are recorded at the consideration received for the guarantee. Issued financial guarantees are subsequently measured at the higher of the consideration received for the guarantee excluding any amortised amounts recorded in the income statement and the best estimate of the consideration due if the guarantee is honoured. When issuing financial guarantees, the consideration for the guarantee is recorded under "Provisions" in the balance sheet. Except for individually identified impaired loans, any changes in the carrying amount of financial guarantee contracts issued are recorded as "Net gains on financial instruments at fair value". Changes in the value of such guarantee contracts are recorded under "Impairment of loans and guarantees". Determination of fair value Fair value is the amount for which an asset could be traded, or a liability settled, in a transaction between independent parties. Financial assets and liabilities are measured at bid or asking prices respectively. Derivatives which are carried net, are recorded at mid-market prices on the balance sheet date. Instruments traded in an active market With respect to instruments traded in an active market, quoted prices are used, obtained from a stock exchange, a broker or a price-setting agency. A market is considered active if it is possible to obtain external, observable prices, exchange rates or interest rates and these prices represent actual and frequent market transactions. Some investments in equities and commercial paper and bonds are traded in active markets. Instruments not traded in an active market Financial instruments not traded in an active market are valued according to different valuation techniques and are divided into two categories: Valuation based on observable market data: • recently observed transactions in the relevant instrument
between informed, willing and independent parties • instruments traded in an active market which are substantially
similar to the instrument that is valued
Accounting principles (continued)
24 Annual accounts DNB Bank Annual Report 2012
• other valuation techniques where key parameters are based on observable market data.
Valuation based on other factors than observable market data: • estimated cash flows • valuation of assets and liabilities in companies • models where key parameters are not based on observable
market data • possible industry standards.
When using valuation techniques, values are adjusted for credit and liquidity risk. Valuations are based on pricing of risk for similar instruments. Impairment of financial assets On each balance sheet date, the banking group will consider whether there are objective indications that the financial assets have decreased in value. A financial asset or group of financial assets is written down if there is objective evidence of impairment. Objective evidence of a decrease in value include serious financial problems on the part of the debtor, non-payment or other serious breaches of contract, the probability that the debtor will enter into debt negotiations or other special circumstances that have occurred. Renegotiation of loan terms to ease the position of the borrower qualifies as objective indications of impairment. Individual impairment of loans If objective indications of a decrease in value can be found, impairment losses on loans are calculated as the difference between the value of the loan in the balance sheet and the net present value of estimated future cash flows discounted by the effective interest rate. In accordance with IAS 39, the best estimate is used to assess future cash flows. The effective interest rate used for discounting is not adjusted to reflect changes in the credit risk and terms of the loan due to objective indications of impairment being identified. Individual impairment of loans reduces the value of the loans and guarantees in the balance sheet. Impairment during the period is recorded under "Impairment of loans and guarantees". Collective impairment of loans Loans which have not been individually evaluated for impairment, are evaluated collectively in groups. Loans which have been indi- vidually evaluated, but not subject to impairment, are also evalu-ated in groups. The evaluation is based on objective evidence of a decrease in value that has occurred on the balance sheet date and can be related to the group. Loans are grouped on the basis of similar risk and value characteristics in accordance with the division of customers into sectors or industries and risk categories. The need for impairment is estimated per customer group based on estimates of the general economic situation and loss experience for the respective customer groups. Collective impairment reduces the value of loans and guarantees in the balance sheet. For loans, changes during the period are recorded under "Impairment of loans and guarantees". Like individual impairment, collective impairment is discounted. The discount factor is based on statistics derived from individual impairment. Interest is calculated on loans subject to collective impairment according to the same principles and experience base as for loans evaluated on an individual basis. Repossession of assets Assets which are repossessed as part of the management of non-
performing and impaired loans, are recorded at fair value at the time of acquisition. Such assets are recorded in the balance sheet according to the nature of the asset. Any difference between the recorded value of the loan and the fair value of the asset is re-corded under “Impairment of loans and guarantees”. Subsequent valuations and classification of the impact on profits follow the principles for the relevant balance sheet item. 8. HEDGE ACCOUNTING The banking group enters into hedging transactions to manage interest rate risk on long-term borrowings and deposits in foreign currencies. These transactions are recorded as fair value hedges. When instruments are individually hedged, there is a clear, direct and documented correlation between changes in the value of the hedged item resulting from the hedged risk and changes in the value of the financial derivative (hedging instrument). Upon entering into the hedge relationship, the correlation bet-ween the hedged item and the hedging instrument is documented. In addition, the goal and strategy underlying the hedging tran-saction are documented. Changes in fair value related to the hedged risk of the hedged item and instrument are evaluated periodically to ensure the necessary hedge effectiveness. Hedging instruments are recorded at fair value and included under "Net gains on financial instruments at fair value" in the income state-ment. Changes in the fair value of the hedged item attributable to the hedged risk will be recorded as an addition to or deduction from the balance sheet value of financial liabilities and assets and re-corded under "Net gains on financial instruments at fair value" in the income statement. If the hedge relationship ceases or adequate hedge effec-tiveness cannot be verified, the change in value of the hedged item is amortised over the remaining maturity. DNB Bank ASA undertakes fair value hedging of investments in foreign subsidiaries to eliminate the currency risk on the in-vested amount. Hedging transactions are in the form of currency swaps or long-term borrowings in foreign currency. In the consolidated accounts, the hedge relationships are re-corded as hedging of net investments in international operations. 9. OFFSETTING Financial assets and financial liabilities are offset and the net amount recorded in the balance sheet only when the banking group has a legally enforceable right to set off the amounts and intends to settle assets and liabilities on a net basis or to realise the assets and settle the liabilities collectively. 10. LEASING A lease is classified as a finance lease if it transfers substantially the risks and rewards incident to ownership. Other leases are classified as operational leases. DNB Bank as lessor Operational leases Operating leases are leases where a not insignificant share of the risk and rewards relating to the investment in the leased object accrues to DNB Bank at the end of the lease period. Operating assets are recorded as machinery, fixtures and fittings and means of transport. Income from operating leases is recognised over the lease term on a straight-line basis. Depreciation in the accounts is classified as ordinary depreciation. Financial leases Finance leases are classified as lending and at the inception of the lease, its value is set at an amount equal to the net investment in the lease. The net investment represents minimum lease pay-
Accounting principles (continued)
DNB Bank Annual Report 2012 Annual accounts 25
ments, unguaranteed residual values and any direct expenses incurred by the lessor in negotiating the lease, discounted by the implicit interest rate (internal rate of return). Leasing income is recorded according to the annuity method, where the interest component is recorded under "Net interest income" while instalments reduce the balance sheet value of lending. DNB Bank as lessee Operational leasing Lease payments are recognised as an expense on a straight-line basis over the lease term unless another systematic basis is more representative of the time pattern of DNB Bank's use of the asset. 11. INVESTMENT PROPERTY AND FIXED
ASSETS Properties held to generate profits through rental income or for an increase in value, are classified as investment property. Other tangible assets are classified as fixed assets. On initial recognition, investment properties are measured at cost including acquisition costs. In subsequent periods, invest-ment properties are measured at fair value. No annual deprecia-tion is made on investment property. Internal and external ex-pertise is used for valuations. A selection of external appraisals are obtained and compared with internal valuations. Sensitivity tests are carried out for various estimates of parameter values included in an overall evaluation. Changes in value of investment property are recorded under "Net gains on investment property" in the income statement. Other tangible assets are measured at cost less accumulated depreciation and impairment losses. Cost includes expenses directly related to the acquisition of the asset. Subsequent ex-penses are capitalised on the relevant assets when it is probable that future economic benefits associated with the expenditure will flow to DNB Bank and can be measured reliably. Expenses for repairs and maintenance are recorded in the income statement as they occur. The residual values and useful lives of the assets are re-viewed annually and adjusted if required. Gains and losses on the sale of fixed assets are recorded under "Net gain on fixed and intangible assets" in the income statement. 12. INTANGIBLE ASSETS Goodwill An annual impairment test is made for all cash-generating units which include goodwill. If there is objective evidence of a decrease in value during the year, a new test will be carried out in order to verify whether values are intact. The test is based on the units' recoverable amounts. The choice of cash-generating unit is based on where it is possible to identify and separate cash flows relating to operations. A cash-generating unit may include goodwill from several transactions, and the impairment test of the unit includes all goodwill allocated to the unit. Calculations of value in use are based on historical results and available budgets and plan figures approved by management. On the basis of plan figures for the cash-generating units, a future cash flow is estimated, defined as the potential return to the owner. The return includes profits from operations adjusted for the need to build sufficient capital to meet expected future capital adequacy requirements. Higher capital requirements due to expanded operations could make it necessary to retain part of the profits or to inject more capital from the owner, if profits from operations are not adequate to build the necessary capital. Beyond the plan period, which in most cases is three years, cash flow trends are assumed to reflect market expectations for the type of operations carried out by the cash-generating unit.
The required rate of return is based on an assessment of the market's required rate of return for the type of operations carried out by the cash-generating unit. The required rate of return reflects the risk of the operations. Goodwill from the acquisition of companies generating cash flows in foreign currencies is translated at rates of exchange ruling on the balance sheet date. IT systems and software Acquired software is recorded at cost with the addition of ex-penses incurred to make the software ready for use. Identifiable costs for internally developed software controlled by the banking group where it is probable that economic benefits will cover deve-lopment expenses at the balance sheet date, are recorded as intangible assets. When assessing balance sheet values, the economic benefits are evaluated on the basis of profitability ana-lyses. Development expenses include expenses covering pay to employees directly involved in the project, materials and a share of directly related overhead expenses. Expenses relating to main-tenance of software and IT systems are charged to the income statement as they occur. Software expenses recorded in the balance sheet are depreciated according to a straight line principle over their expected useful life, usually five years. The need for impairment testing is considered according to the principles described below. 13. IMPAIRMENT OF FIXED AND INTANGIBLE
ASSETS If there is any indication of a decrease in value of fixed and in-tangible assets, the recoverable amount of the asset is calculated to estimate possible impairment needs. Goodwill and intangible assets with an indefinite useful life are tested for impairment on each reporting date even if there is no indication of a decrease in value of the asset. The recoverable amount represents the higher of an asset's fair value less costs to sell and its value in use. If the asset's recorded value exceeds the estimated recoverable amount, the asset is immediately written down to its recoverable amount. See note 40 Goodwill for a description of impairment testing. The following relevant criteria are among those used by the banking group to consider whether there are indications that an asset has been impaired: a decline in the asset's market value changes in the long-term return requirement which may affect
the discount rate used in the calculation of the asset's value in use
plans to restructure or liquidate the asset the asset generates less income than anticipated. 14. PENSIONS Defined benefit occupational pension schemes In a defined benefit scheme, the employer is committed to paying future specified pension benefits. The basis for calculating pension expenses is a linear distri-bution of pension entitlements measured against estimated accumulated commitments at the time of retirement. Expenses are calculated on the basis of pension entitlements earned during the year with the deduction of the return on funds assigned to pensions. Pension commitments which are administered through life insurance companies, are matched against funds within the scheme. When total pension funds exceed estimated pension commitments on the balance sheet date, the net value is classified as an asset in the balance sheet if it has been rendered probable that the overfunding can be utilised to cover future commitments.
Accounting principles (continued)
26 Annual accounts DNB Bank Annual Report 2012
When pension commitments exceed pension funds, the net commitments are classified under liabilities in the balance sheet. Each scheme is considered separately. Pension commitments represent the present value of esti-mated future pension payments which in the accounts are classi-fied as accumulated on the balance sheet date. The calculation of pension commitments is based on actuarial and economic assumptions about life expectancy, rise in salaries and early retirement. The discount rate used is determined by reference to the yield on covered bonds at the balance sheet date, plus an addition that takes into account the relevant duration of the pension liabilities. Deviations in estimates are recorded in the income statement over the average remaining service period when the difference ex-ceeds the highest of 10 per cent of pension funds or 10 per cent of pension commitments. The financial effects of changes in pension schemes are re-corded as income or charged to expense on the date of the change, unless the rights under the new pension scheme are conditional on the employee remaining in service for a specified period. Pension expenses are based on assumptions determined at the start of the period. Pension expenses are classified as personnel expenses in the income statement. Employer's contributions are included in pension expenses and pension commitments. DNB’s life insurance company, DNB Livsforsikring ASA, largely administers the banking group's pension schemes in Norway. See item 21 Approved standards and interpretations that have not entered into force for amendments to IAS 19 Employee Benefits, effective as of 1 January 2013. Defined contribution occupational pension schemes Under defined contribution pension schemes, the banking group does not commit itself to paying specified future pension benefits, but makes annual contributions to the employees' banking group pension savings. Future pensions will depend on the size of annual contributions and the annual return on pension savings. After paying annual contributions, the banking group thus has no further commitments linked to employees' work performance. Thus, no allocations are made for accrued pension commitments in such schemes. Defined contribution pension schemes are charged directly to the income statement. 15. INCOME TAX Taxes for the year comprise payable taxes for the financial year, any payable taxes for previous years and changes in deferred taxes on temporary differences. Temporary differences are differences between the recorded value of an asset or liability and the taxable value of the asset or liability. The most significant temporary differences refer to pensions, depreciation of fixed assets and properties, impairment losses for goodwill and revaluations of certain financial assets and liabilities. Deferred taxes are calculated on the basis of tax rates and tax rules that are applied on the balance sheet date or are highly likely to be approved and are expected to be applicable when the deferred tax asset is realised or the deferred tax liability settled. Deferred tax assets are recorded in the balance sheet to the extent that it is probable that future taxable income will be avail-able against which they can be utilised. Deferred taxes and deferred tax assets in the tax group are recorded net in DNB Bank's balance sheet.
Payable and deferred taxes are recorded against equity if the taxes refer to items recorded against equity during the same or in previous periods. 16. SEGMENT INFORMATION The segment information has been prepared on the basis of internal financial reporting for the functional organisation of the banking group into business areas, as reported to the group management team (highest decision-making body) for an assess-ment of developments and the allocation of resources. Figures for the business areas are based on DNB’s management model and the banking group’s accounting principles. The figures are based on a number of assumptions, estimates and discretionary distri-bution. See note 3 Segments. The operational structure of DNB Bank includes three busi-ness areas and four staff and support units. DNB Baltics and Poland is reported as a separate profit centre. The business areas carry responsibility for customer segments served by the banking group, as well as the products offered. According to DNB's management model, the business areas are independent profit centres with responsibility for meeting requirements for return on allocated capital. All of the banking group's customer activities are divided among the business areas, along with the related balance-sheet items, income and expenses. Excess liquidity and liquidity deficits in the business areas are placed in or borrowed from the bank's Treasury at market terms, where interest rates are based on duration and the banking group's financial position. When business areas cooperate on the delivery of financial services to customers, internal deliveries are based on market prices or simulated market prices according to agreements. In certain cases where it is particularly difficult to find relevant principles and prices for the distribution of items between two cooperating business areas, DNB Bank has chosen to show net contributions from each transaction in both business areas. The impact on profits is eliminated at group level. Services provided by group services and staff units are charged to the business areas in accordance with service agree-ments. Joint expenses, which are indirectly linked to activities in the business areas, are charged to the business areas' accounts on the basis of distribution formulas. A number of key functions along with profits from activities not related to the business areas' strategic operations are entered in the accounts under the Group Centre. This item comprises in-come and expenses relating to the banking group's liquidity management, income from investments in equity instruments not included in the trading portfolio and interest income assigned to the banking group's unallocated capital. Further entries include ownership-related expenses and income from the management of the bank's real estate portfolio. Repossessed operations which are fully consolidated in the DNB Bank Group are also included in the Group Centre on the respective lines in the income statement. Return on capital is estimated on the basis of internal measurement of risk-adjusted capital requirements. Note 3 Segments also shows a geographic breakdown of operations, including DNB Baltics and Poland and other international operations. 17. RESTRUCTURING If restructuring plans that change the scope of operations or the way operations are carried out are approved and communicated, the need for restructuring provisions will be considered. The provisions are reviewed on each reporting date and will be reversed as expenses are incurred.
Accounting principles (continued)
DNB Bank Annual Report 2012 Annual accounts 27
18. CASH FLOW STATEMENTS The cash flow statements show cash flows grouped according to source and use. Cash is defined as cash, deposits with central banks and deposits with credit institutions with no agreed period of notice. The cash flow statement has been prepared in accordance with the direct method. 19. EQUITY AND CAPITAL ADEQUACY Proposed dividends Proposed dividends are part of equity until approved by the general meeting. Proposed dividends are not included in capital adequacy calculations. Capital adequacy Capital adequacy calculations are subject to special consolidation rules governed by the Consolidation Regulations. Primary capital and nominal amounts used in calculating risk-weighted volume will deviate from figures in the DNB Bank Group's accounts, as associated companies which are presented in the accounts according to the equity method are included in capital adequacy calculations according to the gross method. Valuation rules used in the statutory accounts form the basis for the consolidation. 20. APPROVED STANDARDS AND
INTERPRETATIONS THAT HAVE NOT ENTERED INTO FORCE
The IASB has published a number of amendments to current regulations which have not entered into force. Below is a description of the amendments which may affect the banking group’s future reporting. IFRS 9 Financial Instruments (phase 1) IFRS 9 will replace the current IAS 39. The project comprises several phases. The IASB approved the first phase of the project on the classification and measurement of financial assets in 2010. In November 2012, the IASB proposed limited amendments to the classification principles which are expected to be approved in 2013. In addition, new rules for impairment and hedge accounting are expected to be approved in 2013 or later. Under the new standard, the number of measurement categories for financial assets is reduced from four to three, amortised cost, fair value through profit or loss and fair value through other comprehensive income. With respect to financial liabilities designated as at fair value, changes in fair value due to changes in credit risk should be recorded against other comprehensive income, provided that this does not result in measurement inconsistency. In order for a financial asset to be measured at amortised cost, the instrument must have basic features in common with loans and be managed on a contractual cash flow basis. If the criteria for measuring the financial instrument at amortised cost are not met, the instrument must be measured at fair value. It will still be possible to use the fair value option for financial assets which initially must be recorded at amortised cost if fair value measurement will reduce or eliminate measurement inconsi-stency. It is assumed that loans to customers that are currently measured at amortised cost can generally still be measured at amortised cost according to the new rules. Equities, equity instruments and financial derivatives will still be measured at fair value. Commercial paper and bonds held for trading will be measured at fair value. The banking group may consider measuring commercial paper and bonds classified as held-to-maturity at amortised cost if it intends to collect the instruments' contractual cash flows. Contract terms and the banking group's
business model must be considered specifically for each instru-ment. IFRS 9 will enter into force on 1 January 2015. It remains uncertain when the standard will be endorsed by the EU, and the EU has decided not to endorse IFRS 9 until all phases of the project are known. The banking group will consider the effects of the new IFRS 9. To be able to make an overall assessment of the accounting effects of the new classification and measurement of the banking group's financial instruments, the banking group considers it appropriate to wait until all elements in the new IFRS 9 are known. IFRS 10 Consolidated Financial Statements The standard will replace the parts of IAS 27 which address consolidated financial statements and also include structured units, which were previously addressed in SIC – 12 Consolidation - Special Purpose Entities. IFRS 10 establishes a control model which applies to all companies. The definition of control is different from that used in IAS 27. According to IFRS 10, companies shall only be consoli-dated if de facto control exists. Control exists if the investor has power over the investee, is exposed, or has rights, to variable returns from the investee and has the ability to use its power to direct the activities of the investee that significantly affect returns. Potential voting rights, options, convertible debt and other aspects should also be taken into account. The IASB has decided that the effective date of IFRS 10 will be 1 January 2013. The standard was endorsed by the EU in the fourth quarter of 2012, the effective date being 1 January 2014. Early adoption is permitted. The banking group will use the new rules as of 1 January 2014. The new standard will require increased judgement when assessing which entities are controlled by the company. Due to the new definition of control, certain investments or mutual funds may be reclassified. Final assessments will be made during 2013. The new rules are not expected to have any material impact on the banking group’s profit and loss. IFRS 11 Joint Arrangements The standard will replace IAS 31 Interests in Joint Ventures and SIC – 13 Jointly-controlled Entities - Non-monetary Contributions by Venturers, and eliminates proportionate consolidation of joint ventures. The standard identifies two categories of joint control (joint arrangements): joint ventures and joint operations. When consoli-dating joint ventures, the equity method should be applied, while for joint operations, the parties should recognise their rights to assets and liabilities in their balance sheets and recognise their share of income and costs incurred jointly in their income statements. The IASB has decided that the effective date of IFRS 11 will be 1 January 2013. The standard was endorsed by the EU in the fourth quarter of 2012, the effective date being 1 January 2014. Early adoption is permitted. The banking group will use the new rules as of 1 January 2014. At year-end 2012, the DNB Bank Group had no significant investments in jointly controlled operations. Thus, the new standard is not expected to have any material impact on the consolidated accounts. IFRS 12 Disclosure of Interests in Other Entities IFRS 12 applies to companies which have interests in subsidiaries, jointly controlled operations, associated companies and structured entities. The standard replaces all of the disclosure requirements that were previously in IAS 27 Consolidated and Separate Financial Statements, IAS 28 Investment in Associates
Accounting principles (continued)
28 Annual accounts DNB Bank Annual Report 2012
and IAS 31 Interests In Joint Ventures. In addition, a number of new disclosure requirements to, among others, IFRS 10 and IFRS 11, are introduced. The IASB has decided that the effective date of IFRS 12 will be 1 January 2013. The standard was endorsed by the EU in the fourth quarter of 2012, the effective date being 1 January 2014. Early adoption is permitted. The banking group will use the new rules as of 1 January 2014. The new standard will require additional note information about the DNB Bank Group’s ownership interests. IFRS 13 Fair Value Measurement The standard includes principles and guidance for fair value measurement of assets and liabilities when other IFRS require or permit fair value measurements. The standard does not change what is required or permitted to be measured at fair value. IFRS 13 applies both at initial recognition and in subsequent measure-ments. IFRS 13 will require more detailed note information in both quarterly and annual accounts. IFRS 13 entered into force on 1 January 2013. The banking group will use the new rules as of 1 January 2013. During 2012, DNB reviewed the fair value measurement of the banking group’s assets and liabilities to make sure that it is consistent with the principles in IFRS 13. The new rules will not have any material impact on the banking group’s profit and loss or balance sheet, but will have an impact on the note information presented in the quarterly and annual accounts. Amendments to IAS 1 – Presentation of Financial Statements The amendments to IAS 1 entail that items of income and expense in other comprehensive income should be grouped together based on whether or not they can be reclassified to the profit or loss section of the income statement on a future date. The amendments to IAS 1 entered into force as from the accounting year starting on 1 July 2012 or later. The banking group will use the new rules as of 1 January 2013. The amendments will only affect the presentation in other comprehensive income. Amendments to IAS 19 – Employee Benefits The amendments to IAS 19 will affect the recognition and presentation of the banking group’s defined benefit pension schemes. One of the effects of the amendments is that the corridor approach for recognising actuarial gains and losses will be removed. Actuarial gains and losses should now be recognised in other comprehensive income in the year in which they occur. In accordance with the current IAS 19, the banking group presents pension expenses as operating expenses under “Salaries and other personnel expenses”. In line with the new rules, pension expenses should be split, whereby: the service cost for the current and previous periods, gains
and losses in connection with settlement and net interest income/expenses are to be recognised in profit or loss
remeasurements, such as actuarial gains and losses, are to be recognised in other comprehensive income.
In addition, the disclosure requirements relating to defined benefit pension schemes have been changed.
The amendments to IAS 19 entered into force on 1 January 2013. The banking group will use the new rules as of 1 January 2013. Figures for previous periods will be restated. In accordance with the current IAS 19, DNB uses the corridor approach for recognising actuarial gains and losses. Once the new rules are implemented in 2013, the banking group will recognise unrecognised actuarial gains and losses for previous periods directly in the company’s equity. The economic and actuarial assumptions used in actuarial calculations at end-December 2012 determined the scope of the actuarial gains and losses to be recognised directly in equity on the implementation date. At year-end 2012, the banking group’s unrecognised actuarial losses totalled NOK 592 million and NOK 4 181 million at year-end 2011, see note 27 Pensions. The new requirements will result in a reduction in the banking group’s equity of NOK 426 million, net after 28 per cent tax. Amendments to IAS 32 – Offsetting Financial Assets and Financial Liabilities The amendments to the standard clarify the rules on presenting financial assets and liabilities on a net basis. The amendments will enter into force on 1 January 2014. The banking group will use the new rules as of 1 January 2014. The preliminary assessment of the new rules is that they will have no material impact on the offsetting of financial assets and liabilities in the accounts. Amendments to IFRS 7 – Disclosures – Offsetting Financial Assets and Financial Liabilities Note information is required to enable users of the accounts to assess the effects or the potential effects the offsetting of financial assets and liabilities will have on the company’s financial position. The disclosure requirements apply to all financial instruments offset in accordance with IAS 32. The amendments to IFRS 7 entered into force on 1 January 2013 and will require the banking group to present additional note information. Revised IAS 27 – Consolidated and Separate Financial Statements and IAS 28 Investment in Associates In consequence of the introduction of IFRS 10, 11 and 12, the IASB has made amendments to IAS 27 and IAS 28 to harmonise the standards with the new accounting standards. Following the revision, IAS 27 only regulates the statutory accounts, while IAS 28 regulates investments in both associated companies and jointly controlled entities which are required to be accounted for using the equity method. The IASB has decided that the effective date of IAS 27 and IAS 28 will be 1 January 2013. The amendments were endorsed by the EU in the fourth quarter of 2012, the effective date being 1 January 2014. Early adoption is permitted. The banking group will use the new rules as of 1 January 2014.
DNB Bank Annual Report 2012 Annual accounts 29
Note 1 Important accounting estimates and discretionary assessments
When preparing the consolidated accounts for the bank and the banking group, management makes estimates and discretionary assess-ments and prepares assumptions that influence the effect of the accounting principles applied. In turn, this will affect the recorded values of assets and liabilities, income and expenses. Estimates and discretionary assessments are subject to continual evaluation and are based on historical experience and other factors, including expectations of future events that are believed to be probable on the balance sheet date. Impairment of loans If objective evidence of a decrease in value can be found, impairment losses on loans are calculated as the difference between the value of the loan in the balance sheet and the net present value of estimated future cash flows discounted by the effective interest rate. Estimates of future cash flow are based on empirical data and discretionary assessments of future macroeconomic developments and developments in problem loans, based on the situation on the balance sheet date. The estimates are the result of a process which involves the business areas and central credit units and represents management's best estimate. When considering impairment of loans, there will be an element of uncertainty with respect to the identification of impaired loans, the estimation of amounts and the timing of future cash flows, including collateral assessments. Individual impairment When estimating impairment of individual loans and guarantees, both the current and the future financial positions of customers are considered. For corporate customers, the prevailing market situation is also reviewed, along with market conditions within the relevant industry and general market conditions which could affect the loans. In addition, potential restructuring, refinancing and recapitalisation are taken into account. An overall assessment of these factors forms the basis for estimating the future cash flow. The discount period is estimated on an individual basis or based on empirical data regarding the period up until a solution is found to the problems resulting in an impairment of loans and guarantees. Collective impairment On each balance sheet date, loans which have not been individually evaluated for impairment, are evaluated collectively in groups. Loans which have been individually evaluated, but not individually impaired, are also included in this category. Loans are divided into customer groups on the basis of macroeconomic conditions which are assumed to have the same effect on the relevant customers. The expected future cash flow is estimated on the basis of expected losses and the anticipated economic situation for the respective customer groups. Expected losses are based on loss experience within the relevant customer groups. The economic situation is assessed by means of economic indicators for each customer group based on external information about the markets. Various parameters are used depending on the customer group in question. Key parameters are production gaps, which give an indication of capacity utilisation in the economy, housing prices and shipping freight rates. The economic indicators that are used show a high degree of correlation with historical impairment. To estimate the net present value of expected future cash flows for loans subject to collective impairment, a discount factor based on observed empirical data from individually evaluated loans is used. Loans to customers and amounts due from credit institutions totalled NOK 1 342 billion at end-December 2012, which represented 66.7 per cent of the banking group’s balance sheet. Estimated impairment of goodwill See note 40 for information regarding goodwill. Goodwill represented less than 1 per cent of the banking group’s balance sheet at year-end 2012. Fair value of financial derivatives and other financial instruments The fair value of financial instruments that are not traded in an active market is determined by using different valuation techniques. The banking group considers and chooses techniques and assumptions that as far as possible are based on market conditions on the balance sheet date. When valuing financial instruments for which observable market data are not available, the banking group will make assumptions regarding what it expects the market to use as a basis for valuing corresponding financial instruments. The valuations require a high level of discretion when calculating liquidity risk, credit risk and volatility. Changes in these factors could affect the established fair value of the banking group's financial instruments. Financial assets and liabilities at level 3 in the valuation hierarchy totalled NOK 140 968 million and NOK 607 million, respectively, at year-end 2012. See note 31 Financial instruments at fair value. Pension commitments The net present value of pension commitments depends on current economic and actuarial assumptions. Any change made to these assumptions affects the pension commitments amount recorded in the balance sheet and pension expenses.
30 Annual accounts DNB Bank Annual Report 2012
Note 1 Important accounting estimates and discretionary assessments (continued)
The discount rate estimation is subject to uncertainty as to whether the corporate bond market has the required depth and quality. The Norwegian covered bond market is considered to meet the requirement for corporate bonds with a sufficiently deep market. The discount rate used at year-end 2012 is determined by reference to the market yield on covered bonds, plus an addition that takes into account the relevant duration of the pension commitments. The type of pension fund investments and historical returns determine the expected return on pension funds. Other fundamental assumptions for pension commitments include annual rise in salaries, annual rise in pensions, anticipated increase in the National Insurance basic amount (G) and mortality statistics The assumptions are based on the updated guidance notes on pension assumptions issued by the Norwegian Accounting Standards Board. See note 26 Pensions for the parameters used at the end of the year as well as the sensitivity analysis linked to the key parameters. As from 1 January 2013, the banking group will use the revised IAS 19 Employee Benefits when recognising and presenting the company’s pension commitments. See item 21 in the accounting principles for information about the effects of the amendments. Income taxes, including deferred tax assets and uncertain tax liabilities The banking group is subject to income taxes in a number of jurisdictions. Significant discretion is required in determining the income tax in the consolidated accounts, including assessments of recognised deferred tax assets and uncertain tax liabilities. Deferred tax assets are recognised to the extent it is probable that the banking group will have future taxable income against which they can be utilised. Extensive assessments must be made to determine the amount which can be recognised, included the expected time of utilisation, the level of profits computed for tax purposes as well as strategies for tax planning and the existence of taxable temporary differences. The final tax liability relating to many transactions and calculations will be uncertain. The banking group recognises liabilities related to the future outcome of tax disputes based on estimates of additional taxes. When assessing the uncertain tax liabilities to be recognised in the balance sheet, the probability of the liability arising is considered. The liability is calculated on a best estimate basis. If the final outcome of the cases deviates from the originally allocated amounts, the deviations will affect income tax entered in the applicable period. Contingencies Due to its extensive operations in Norway and abroad, the banking group will regularly be party to a number of legal actions. Any impact on the accounts will be considered in each case. Among other things, the banking group considers the probability of an unfavourable outcome and the possibility of making reliable estimates of potential losses. See note 51 Off-balance sheet transactions, contingencies and post-balance sheet events. The Norwegian government's stimulus package The Norwegian government's stimulus package for the banks allows the banks to exchange covered bonds for Treasury bills. DNB Bank ASA has purchased bonds from DNB Boligkreditt which have been used as collateral for swap agreements with Norges Bank. The value of the collateral must exceed the value of the Treasury bills by a minimum safety margin throughout the contract period. At the end of the contract period, the bank is required to repurchase the covered bonds at the original selling price. The bank receives yield from the covered bonds as if they never had been sold. From an accounting perspective, the banking group is of the opinion that the terms for derecognition in IAS 39 have not been fulfilled, as the banking group, through the swap agreements, retain the risk associated with changes in value of the bonds and other cash flows in the form of yields. The interest rate paid by the banks in the swap scheme with Norges Bank is determined through auctions. In order to assess the fair value of the banking group's existing funding through the swap scheme with Norges Bank, it is necessary to calculate the anticipated long-term yield on Treasury bills. The banking group has thus made an assessment of the normal spread between the Treasury bill yield and NIBOR, based on developments in the interest rate market, which has been used when estimating the value of the funding at year-end. Transfer of loan portfolios When transferring loan portfolios to, among others, Eksportfinans AS, the banking group will consider whether the criteria for derecognition have been fulfilled in accordance with IAS 39. In cases where the banking group retains the credit risk and margins relating to the loan portfolios, the risks and returns are not considered to be transferred to the counterparty, and the loan portfolios are retained in the banking group's balance sheet. As at 31 December 2012, such portfolios totalled NOK 4 089 million.
DNB Bank Annual Report 2012 Annual accounts 31
Note 2 Changes in group structure
Pres-Vac Pres-Vac Engineering Aps and Valpress GmbH (Pres-Vac) develop and produce, among other things, tank valves for ships which transport liquid cargo. As part of the restructuring of the bank’s loans and commitments with the companies, DNB Bank ASA took over all the shares in the companies. With effect from the first quarter of 2012, the companies are consolidated in the group accounts. The companies were taken over at a price of DKK 1 and EUR 1, respectively. At the beginning of 2012, the Pres-Vac Group had a total negative equity of DKK 208 million. Prior to the acquisition, DNB Bank ASA had written down the loan by approximately DKK 272 million. In the acquisition analysis, the remaining DKK 64 million was considered to represent the difference between fair value and recorded value of goodwill in Pres-Vac’s consolidated accounts. During the first quarter of 2012, DKK 105 million of the company’s debt to the bank was converted to equity. Sales revenues for 2012 were DKK 97 million, while operating expenses came to DKK 149 million (including impairment losses for goodwill of DKK 38 million). The company recorded an operating loss of DKK 52 million. Bryggetorget Holding AS After Faktor Eiendom ASA went into liquidation, Bryggetorget Holding AS, which is owned by DNB Bank ASA, took over Skurufjellet Eiendom AS, Trysiltunet Eiendom AS and Trysilfjell Apartment Eiendom AS from the estate in the first quarter of 2012. In addition, 31 holiday apart-ments in Uvdal organised as a housing cooperative were taken over. The properties were acquired at fair value. After the acquisition, the balance sheet value of the properties in Bryggetorget Holding was NOK 222 million.
SalusAnsvar During the third quarter of 2012, DNB entered into an agreement to sell the wholly-owned subsidiary SalusAnsvar AB to the insurance company Folksam Sak AB. SalusAnsvar primarily offers non-life insurance and personal insurance in the Swedish market. The company’s staff represents 137 full-time positions. In consequence of the agreement, the DNB bank Group recorded impairment losses for goodwill of SEK 55 million (corresponding to NOK 47 million) in the third quarter of 2012. The transaction was approved by the supervisory authorities during the fourth quarter, and the operations were classified as held for sale in the group accounts as at 31 December 2012. Assets totalling SEK 444 million (corresponding to NOK 380 million), classified as held for sale, included the residual value of goodwill of SEK 210 million and other intangible assets of SEK 80 million.
32 Annual accounts DNB Bank Annual Report 2012
Note 3 Segments Business areas DNB’s business areas are independent profit centres and have responsibility for serving all of the banking group's customers and for the total range of products. The operational structure of the DNB Bank Group in 2012 included three business areas and four staff and support units. The business areas comprised Retail Banking, Large Corporates and International and DNB Markets. In addition, operations in DNB Baltics and Poland were reported as a separate profit centre. Retail Banking - offers a broad range of financial products and services through a wide distribution network. In cooperation
with several of the banking group's product areas, customers are offered various financing and leasing, deposit and investment alternatives, insurance, as well as real estate broking and financial advisory services. In addition, extensive everyday banking services are provided through the internet bank, mobile banking, SMS services, branch offices, in-store banking outlets, in-store postal outlets and Norway Post. The ordinary home mortgage operations of DNB Boligkreditt AS are integrated in Retail Banking, while the company’s debt capital funding is shown under the Group Centre.
Large Corporates - offers a broad range of financial products and services to large Norwegian and international customers in and International cooperation with several of the banking group's product areas, including various types of financing solutions,
deposits and investments, insurance, e-commerce products, commercial property brokerage, foreign currency, interest rate products, trade finance and corporate finance services.
DNB Markets - is the banking group's investment bank with the key products foreign exchange, interest rate and commodity
products, securities and other investment products, debt and equity financing in capital markets, research and advisory services, as well as custodial and other securities services.
DNB Baltics and Poland - offers financial services to corporate and personal customers in Estonia, Latvia and Lithuania. The strategy in
Poland has been changed, whereby future operations will focus on the corporate market within the DNB Bank Group’s international priority areas.
The income statement and balance sheet for the business areas have been prepared on the basis of internal financial reporting for the functional organisation of the DNB Bank Group into business areas, as reported to group management (highest decision-making body) for an assessment of current developments and the allocation of resources. Figures for the business areas are based on DNB's management model and accounting principles. The figures have been restated in accordance with the banking group's current principles for allocating costs and capital between business areas and are based on a number of assumptions, estimates and discretionary distribution. Internal transfer rates used between the business areas are determined based on observable market rates, e.g. NIBOR. Additional costs relating to the banking group's long-term funding are charged to the business areas. With effect from the first quarter of 2012, profits from repossessed operations which are fully consolidated in the DNB Bank Group are presented net under ”Profit from repossessed operations” in the company’s internal reporting of business areas. The acquired companies are included in the Group Centre. See Accounting principles. Figures for previous periods have been restated. The risk-adjusted capital requirement is a measure of the banking group's economic capital, based on its risk systems. It is used to measure the capital required. The banking group's actual equity is affected by external parameters and is not directly comparable with the risk-adjusted capital requirement. Returns in the table of key figures below are calculated based on the risk-adjusted capital requirement. Certain customers and transactions of major importance require extensive cooperation within the banking group. To stimulate such cooperation, operating income and expenses relating to some of these customers and transactions are recorded in the accounts of all relevant business areas. This refers primarily to income from customer trading in DNB Markets. Double entries are presented gross in the income statement. Income is presented under "Income attributable to product suppliers", appurtenant costs under "Costs attributable to product suppliers" and impairment under "Impairment attributable to product suppliers". Double entries are eliminated in the group accounts.
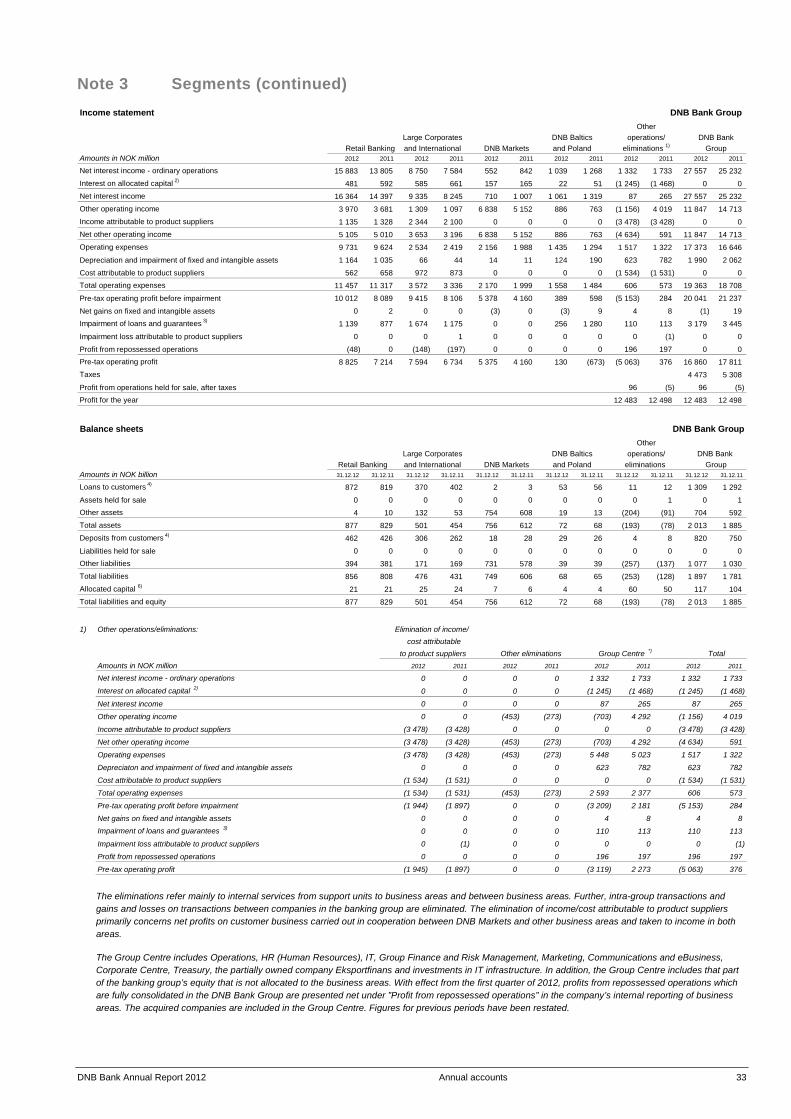
DNB Bank Annual Report 2012 Annual accounts 33
Note 3 Segments (continued) Income statement DNB Bank Group
Amounts in NOK million 2012 2011 2012 2011 2012 2011 2012 2011 2012 2011 2012 2011
Net interest income - ordinary operations 15 883 13 805 8 750 7 584 552 842 1 039 1 268 1 332 1 733 27 557 25 232 Interest on allocated capital 2) 481 592 585 661 157 165 22 51 (1 245) (1 468) 0 0 Net interest income 16 364 14 397 9 335 8 245 710 1 007 1 061 1 319 87 265 27 557 25 232 Other operating income 3 970 3 681 1 309 1 097 6 838 5 152 886 763 (1 156) 4 019 11 847 14 713 Income attributable to product suppliers 1 135 1 328 2 344 2 100 0 0 0 0 (3 478) (3 428) 0 0 Net other operating income 5 105 5 010 3 653 3 196 6 838 5 152 886 763 (4 634) 591 11 847 14 713 Operating expenses 9 731 9 624 2 534 2 419 2 156 1 988 1 435 1 294 1 517 1 322 17 373 16 646
Depreciation and impairment of fixed and intangible assets 1 164 1 035 66 44 14 11 124 190 623 782 1 990 2 062
Cost attributable to product suppliers 562 658 972 873 0 0 0 0 (1 534) (1 531) 0 0 Total operating expenses 11 457 11 317 3 572 3 336 2 170 1 999 1 558 1 484 606 573 19 363 18 708
Pre-tax operating profit before impairment 10 012 8 089 9 415 8 106 5 378 4 160 389 598 (5 153) 284 20 041 21 237
Net gains on fixed and intangible assets 0 2 0 0 (3) 0 (3) 9 4 8 (1) 19 Impairment of loans and guarantees 3) 1 139 877 1 674 1 175 0 0 256 1 280 110 113 3 179 3 445
Impairment loss attributable to product suppliers 0 0 0 1 0 0 0 0 0 (1) 0 0
Profit from repossessed operations (48) 0 (148) (197) 0 0 0 0 196 197 0 0 Pre-tax operating profit 8 825 7 214 7 594 6 734 5 375 4 160 130 (673) (5 063) 376 16 860 17 811 Taxes 4 473 5 308
Profit from operations held for sale, after taxes 96 (5) 96 (5) Profit for the year 12 483 12 498 12 483 12 498
Retail Banking and International DNB MarketsLarge Corporates
eliminations 1) Groupand Poland operations/ DNB Bank
OtherDNB Baltics
Balance sheets DNB Bank Group
Amounts in NOK billion 31.12.12 31.12.11 31.12.12 31.12.11 31.12.12 31.12.11 31.12.12 31.12.11 31.12.12 31.12.11 31.12.12 31.12.11
Loans to customers 4) 872 819 370 402 2 3 53 56 11 12 1 309 1 292
Assets held for sale 0 0 0 0 0 0 0 0 0 1 0 1 Other assets 4 10 132 53 754 608 19 13 (204) (91) 704 592 Total assets 877 829 501 454 756 612 72 68 (193) (78) 2 013 1 885 Deposits from customers 4) 462 426 306 262 18 28 29 26 4 8 820 750
Liabilities held for sale 0 0 0 0 0 0 0 0 0 0 0 0 Other liabilities 394 381 171 169 731 578 39 39 (257) (137) 1 077 1 030 Total liabilities 856 808 476 431 749 606 68 65 (253) (128) 1 897 1 781 Allocated capital 6) 21 21 25 24 7 6 4 4 60 50 117 104 Total liabilities and equity 877 829 501 454 756 612 72 68 (193) (78) 2 013 1 885
eliminations GroupRetail Banking and International DNB Markets and Poland operations/ DNB Bank Large Corporates
OtherDNB Baltics
1) Other operations/eliminations:
Amounts in NOK million 2012 2011 2012 2011 2012 2011 2012 2011
Net interest income - ordinary operations 0 0 0 0 1 332 1 733 1 332 1 733 Interest on allocated capital 2) 0 0 0 0 (1 245) (1 468) (1 245) (1 468)
Net interest income 0 0 0 0 87 265 87 265
Other operating income 0 0 (453) (273) (703) 4 292 (1 156) 4 019
Income attributable to product suppliers (3 478) (3 428) 0 0 0 0 (3 478) (3 428)
Net other operating income (3 478) (3 428) (453) (273) (703) 4 292 (4 634) 591
Operating expenses (3 478) (3 428) (453) (273) 5 448 5 023 1 517 1 322
Depreciaton and impairment of fixed and intangible assets 0 0 0 0 623 782 623 782
Cost attributable to product suppliers (1 534) (1 531) 0 0 0 0 (1 534) (1 531)
Total operating expenses (1 534) (1 531) (453) (273) 2 593 2 377 606 573
Pre-tax operating profit before impairment (1 944) (1 897) 0 0 (3 209) 2 181 (5 153) 284
Net gains on fixed and intangible assets 0 0 0 0 4 8 4 8 Impairment of loans and guarantees 3) 0 0 0 0 110 113 110 113
Impairment loss attributable to product suppliers 0 (1) 0 0 0 0 0 (1)
Profit from repossessed operations 0 0 0 0 196 197 196 197
Pre-tax operating profit (1 945) (1 897) 0 0 (3 119) 2 273 (5 063) 376
Elimination of income/
TotalGroup Centre *) Other eliminations cost attributable
to product suppliers
The eliminations refer mainly to internal services from support units to business areas and between business areas. Further, intra-group transactions and
gains and losses on transactions between companies in the banking group are eliminated. The elimination of income/cost attributable to product suppliers primarily concerns net profits on customer business carried out in cooperation between DNB Markets and other business areas and taken to income in both areas.
The Group Centre includes Operations, HR (Human Resources), IT, Group Finance and Risk Management, Marketing, Communications and eBusiness,
Corporate Centre, Treasury, the partially owned company Eksportfinans and investments in IT infrastructure. In addition, the Group Centre includes that part of the banking group’s equity that is not allocated to the business areas. With effect from the first quarter of 2012, profits from repossessed operations which are fully consolidated in the DNB Bank Group are presented net under ”Profit from repossessed operations” in the company’s internal reporting of business areas. The acquired companies are included in the Group Centre. Figures for previous periods have been restated.
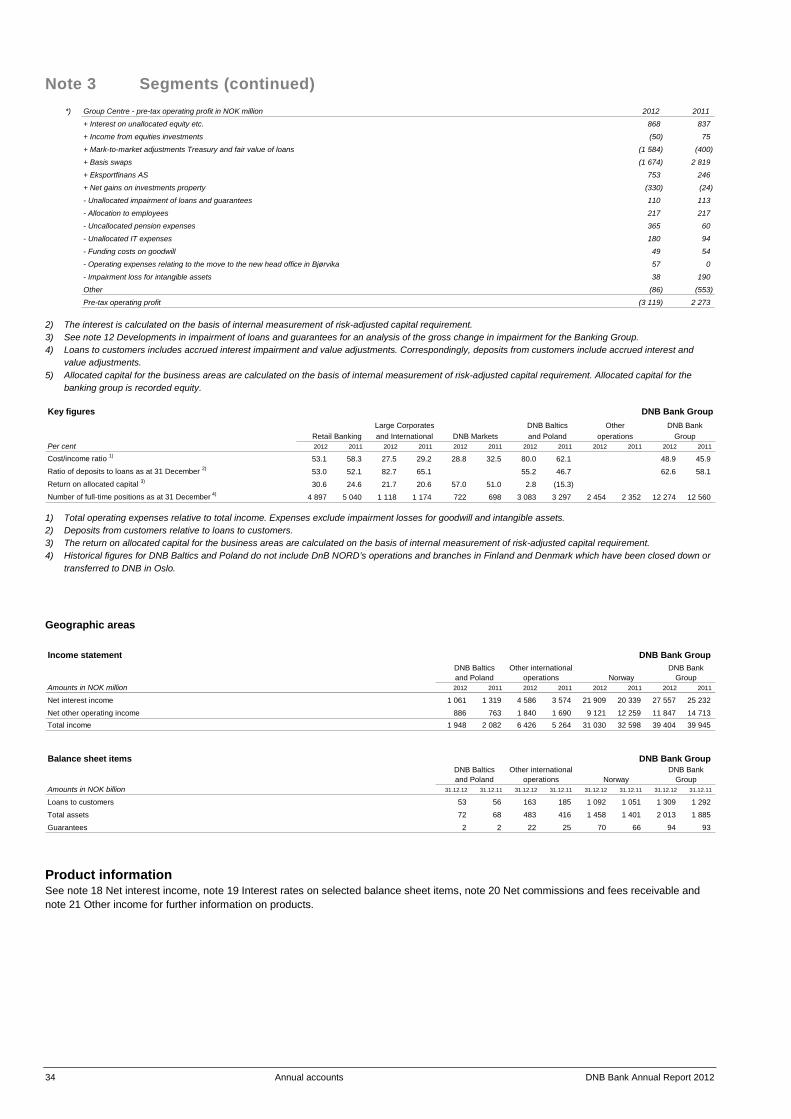
34 Annual accounts DNB Bank Annual Report 2012
Note 3 Segments (continued) *) Group Centre - pre-tax operating profit in NOK million 2012 2011
+ Interest on unallocated equity etc. 868 837
+ Income from equities investments (50) 75
+ Mark-to-market adjustments Treasury and fair value of loans (1 584) (400)
+ Basis swaps (1 674) 2 819
+ Eksportfinans AS 753 246
+ Net gains on investments property (330) (24)
- Unallocated impairment of loans and guarantees 110 113
- Allocation to employees 217 217
- Uncallocated pension expenses 365 60
- Unallocated IT expenses 180 94
- Funding costs on goodwill 49 54
- Operating expenses relating to the move to the new head office in Bjørvika 57 0
- Impairment loss for intangible assets 38 190
Other (86) (553)
Pre-tax operating profit (3 119) 2 273 2) The interest is calculated on the basis of internal measurement of risk-adjusted capital requirement. 3) See note 12 Developments in impairment of loans and guarantees for an analysis of the gross change in impairment for the Banking Group. 4) Loans to customers includes accrued interest impairment and value adjustments. Correspondingly, deposits from customers include accrued interest and
value adjustments. 5) Allocated capital for the business areas are calculated on the basis of internal measurement of risk-adjusted capital requirement. Allocated capital for the
banking group is recorded equity.
Key figures DNB Bank Group
Per cent 2012 2011 2012 2011 2012 2011 2012 2011 2012 2011 2012 2011
Cost/income ratio 1) 53.1 58.3 27.5 29.2 28.8 32.5 80.0 62.1 48.9 45.9Ratio of deposits to loans as at 31 December 2) 53.0 52.1 82.7 65.1 55.2 46.7 62.6 58.1Return on allocated capital 3) 30.6 24.6 21.7 20.6 57.0 51.0 2.8 (15.3)Number of full-time positions as at 31 December 4) 4 897 5 040 1 118 1 174 722 698 3 083 3 297 2 454 2 352 12 274 12 560
Retail Banking DNB Bank Large Corporates
and International DNB Baltics
DNB Markets and Poland Other
operations Group
1) Total operating expenses relative to total income. Expenses exclude impairment losses for goodwill and intangible assets. 2) Deposits from customers relative to loans to customers. 3) The return on allocated capital for the business areas are calculated on the basis of internal measurement of risk-adjusted capital requirement. 4) Historical figures for DNB Baltics and Poland do not include DnB NORD’s operations and branches in Finland and Denmark which have been closed down or
transferred to DNB in Oslo. Geographic areas Income statement DNB Bank Group
Amounts in NOK million 2012 2011 2012 2011 2012 2011 2012 2011
Net interest income 1 061 1 319 4 586 3 574 21 909 20 339 27 557 25 232
Net other operating income 886 763 1 840 1 690 9 121 12 259 11 847 14 713 Total income 1 948 2 082 6 426 5 264 31 030 32 598 39 404 39 945
Balance sheet items DNB Bank Group
Amounts in NOK billion 31.12.12 31.12.11 31.12.12 31.12.11 31.12.12 31.12.11 31.12.12 31.12.11
Loans to customers 53 56 163 185 1 092 1 051 1 309 1 292
Total assets 72 68 483 416 1 458 1 401 2 013 1 885
Guarantees 2 2 22 25 70 66 94 93
GroupOther international
GroupOther international DNB Bank
DNB Bankoperations
Norway
Norway
and Poland operations
DNB Baltics
DNB Baltics
and Poland
Product information See note 18 Net interest income, note 19 Interest rates on selected balance sheet items, note 20 Net commissions and fees receivable and note 21 Other income for further information on products.
DNB Bank Annual Report 2012 Annual accounts 35
Note 4 Capitalisation policy and capital adequacy
The Basel Committee proposed a new international regulatory framework for capital and liquidity for banks in 2010 (Basel III). The EU will implement the regulations in its new capital requirements directive, CRD IV, and capital requirements regulation, CRR. Their implementation has been delayed, though the new regulations are expected to enter into force as from 1 January 2014. As part of the DNB Group's Internal Capital Adequacy Assessment Process, ICAAP, the Board of Directors is in dialogue with Finanstilsynet (the Financial Supervisory Authority of Norway) regarding the capitalisation of the DNB Group. The basis for this dialogue in 2012 is that the DNB Group should have a common equity Tier 1 capital ratio of 12.5 per cent based on IRB measurement of risk-weighted volume under normal market conditions in 2015. According to these principles, the common equity Tier 1 capital ratio should not fall below 10.0 per cent during an economic recession. Through its considerations of the Basel III proposal, the EU has supplemented the capital adequacy requirements with additional requirements for systemically important banks. The DNB Group’s capitalisation guidelines will be revised when the regulatory requirements have been finalised. The DNB Group's capitalisation level shall support the bank's AA level rating target for ordinary long-term funding. Relative to the current risk-weighted volume, which is based on a combination of the standardised approach and the IRB approach, it has been estimated that measure-ment according to the IRB approach would have given a further reduction in risk-weighted volume of approximately 11 per cent at year-end 2012. The transitional rule stipulating that risk-weighted volume cannot be reduced below 80 per cent of corresponding amounts calculated in accordance with the Basel I rules, has not been taken into account. It has been proposed that this rule be extended to apply through 2015. The transitional rule will be reviewed in connection with the implementation of CRD IV. The DNB Group had a common equity Tier 1 capital ratio of 10.7 per cent and a capital adequacy ratio of 12.6 per cent at year-end 2012, compared with 9.4 and 11.4 per cent, respectively, at year-end 2011. The DNB Group is well prepared to meet the uncertain economic climate and stricter capitalisation requirements from the market and the authorities. The planned accumulation of capital will influence the growth limits. According to the DNB Group's capital strategy and dividend policy, the DNB Group aims to be among the best capitalised financial services groups in the Nordic region based on equal calculation principles. In addition, the DNB Group will seek to achieve satisfactory ratings. Dividends will be determined based on factors such as the need to maintain satisfactory financial strength and developments in external parameters, in addition to an evaluation of expected profit levels in a normal situation. The DNB Group aspires to ensure that companies at all levels within the DNB Group are adequately capitalised. Based on requirements from the European Banking Authority, EBA, Finanstilsynet requires that all Norwegian credit institutions have a common equity Tier 1 capital ratio of minimum 9 per cent from 30 June 2012. This requirement also applies for subsidiaries in financial services groups. The DNB Bank Group had a common equity Tier 1 capital ratio of 10.5 per cent and a capital adequacy ratio of 12.4 per cent at year-end 2012, compared with 9.3 and 11.5 per cent, respectively, a year earlier. In addition, a separate requirement from the US authorities to the banking group relating to the operations of the subsidiary DNB Markets Inc. in New York must be fulfilled, whereby the Tier 1 capital ratio for the banking group must be 6 per cent and the total capital adequacy ratio 10 per cent. At year-end 2012, this requirement was fulfilled by a wide margin. At year-end 2012 DNB Boligkreditt AS had a common equity Tier 1 capital ratio of 10.3 per cent and a capital adequacy ratio of 11.2 per cent. In addition to the regulatory assessment and allocation of capital to the DNB Group's legal units, an allocation of capital to the operative business areas is made for management purposes. With effect from 2013, the DNB Group’s entire equity will be allocated to the business areas. The allocation reflects both regulatory requirements and the calculation of risk-adjusted capital requirements.
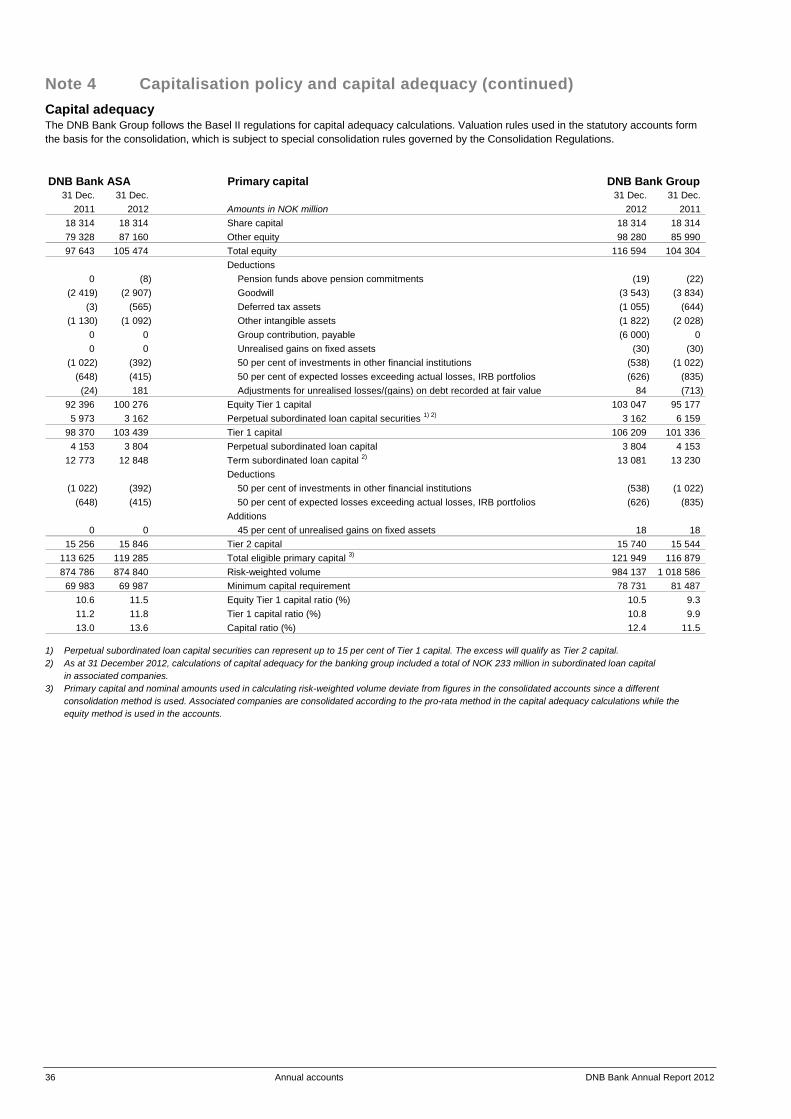
36 Annual accounts DNB Bank Annual Report 2012
Note 4 Capitalisation policy and capital adequacy (continued) Capital adequacy The DNB Bank Group follows the Basel II regulations for capital adequacy calculations. Valuation rules used in the statutory accounts form the basis for the consolidation, which is subject to special consolidation rules governed by the Consolidation Regulations. DNB Bank ASA Primary capital DNB Bank Group
31 Dec. 31 Dec. 31 Dec. 31 Dec. 2011 2012 Amounts in NOK million 2012 2011
18 314 18 314 Share capital 18 314 18 314 79 328 87 160 Other equity 98 280 85 990 97 643 105 474 Total equity 116 594 104 304
Deductions0 (8) Pension funds above pension commitments (19) (22)
(2 419) (2 907) Goodwill (3 543) (3 834) (3) (565) Deferred tax assets (1 055) (644)
(1 130) (1 092) Other intangible assets (1 822) (2 028) 0 0 Group contribution, payable (6 000) 0 0 0 Unrealised gains on fixed assets (30) (30)
(1 022) (392) 50 per cent of investments in other financial institutions (538) (1 022) (648) (415) 50 per cent of expected losses exceeding actual losses, IRB portfolios (626) (835) (24) 181 Adjustments for unrealised losses/(gains) on debt recorded at fair value 84 (713)
92 396 100 276 Equity Tier 1 capital 103 047 95 177 5 973 3 162 Perpetual subordinated loan capital securities 1) 2) 3 162 6 159
98 370 103 439 Tier 1 capital 106 209 101 336 4 153 3 804 Perpetual subordinated loan capital 3 804 4 153
12 773 12 848 Term subordinated loan capital 2) 13 081 13 230 Deductions
(1 022) (392) 50 per cent of investments in other financial institutions (538) (1 022) (648) (415) 50 per cent of expected losses exceeding actual losses, IRB portfolios (626) (835)
Additions0 0 45 per cent of unrealised gains on fixed assets 18 18
15 256 15 846 Tier 2 capital 15 740 15 544 113 625 119 285 Total eligible primary capital 3) 121 949 116 879 874 786 874 840 Risk-weighted volume 984 137 1 018 586 69 983 69 987 Minimum capital requirement 78 731 81 487
10.6 11.5 Equity Tier 1 capital ratio (%) 10.5 9.3 11.2 11.8 Tier 1 capital ratio (%) 10.8 9.9 13.0 13.6 Capital ratio (%) 12.4 11.5
1) Perpetual subordinated loan capital securities can represent up to 15 per cent of Tier 1 capital. The excess will qualify as Tier 2 capital. 2) As at 31 December 2012, calculations of capital adequacy for the banking group included a total of NOK 233 million in subordinated loan capital
in associated companies. 3) Primary capital and nominal amounts used in calculating risk-weighted volume deviate from figures in the consolidated accounts since a different
consolidation method is used. Associated companies are consolidated according to the pro-rata method in the capital adequacy calculations while the equity method is used in the accounts.
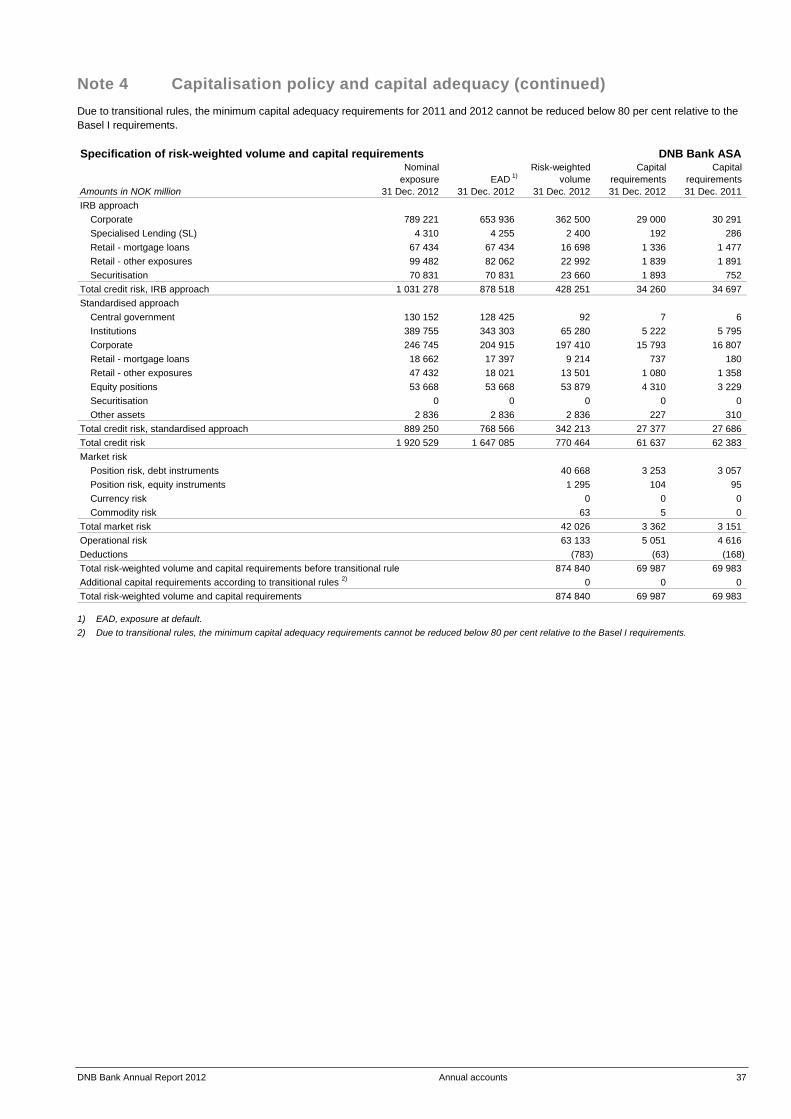
DNB Bank Annual Report 2012 Annual accounts 37
Note 4 Capitalisation policy and capital adequacy (continued) Due to transitional rules, the minimum capital adequacy requirements for 2011 and 2012 cannot be reduced below 80 per cent relative to the Basel I requirements. Specification of risk-weighted volume and capital requirements DNB Bank ASA
Nominal Risk-weighted Capital Capital exposure EAD 1) volume requirements requirements
Amounts in NOK million 31 Dec. 2012 31 Dec. 2012 31 Dec. 2012 31 Dec. 2012 31 Dec. 2011IRB approach
Corporate 789 221 653 936 362 500 29 000 30 291 Specialised Lending (SL) 4 310 4 255 2 400 192 286 Retail - mortgage loans 67 434 67 434 16 698 1 336 1 477 Retail - other exposures 99 482 82 062 22 992 1 839 1 891 Securitisation 70 831 70 831 23 660 1 893 752
Total credit risk, IRB approach 1 031 278 878 518 428 251 34 260 34 697 Standardised approach
Central government 130 152 128 425 92 7 6 Institutions 389 755 343 303 65 280 5 222 5 795 Corporate 246 745 204 915 197 410 15 793 16 807 Retail - mortgage loans 18 662 17 397 9 214 737 180 Retail - other exposures 47 432 18 021 13 501 1 080 1 358 Equity positions 53 668 53 668 53 879 4 310 3 229 Securitisation 0 0 0 0 0 Other assets 2 836 2 836 2 836 227 310
Total credit risk, standardised approach 889 250 768 566 342 213 27 377 27 686 Total credit risk 1 920 529 1 647 085 770 464 61 637 62 383 Market risk
Position risk, debt instruments 40 668 3 253 3 057 Position risk, equity instruments 1 295 104 95 Currency risk 0 0 0 Commodity risk 63 5 0
Total market risk 42 026 3 362 3 151 Operational risk 63 133 5 051 4 616 Deductions (783) (63) (168) Total risk-weighted volume and capital requirements before transitional rule 874 840 69 987 69 983 Additional capital requirements according to transitional rules 2) 0 0 0 Total risk-weighted volume and capital requirements 874 840 69 987 69 983
1) EAD, exposure at default. 2) Due to transitional rules, the minimum capital adequacy requirements cannot be reduced below 80 per cent relative to the Basel I requirements.
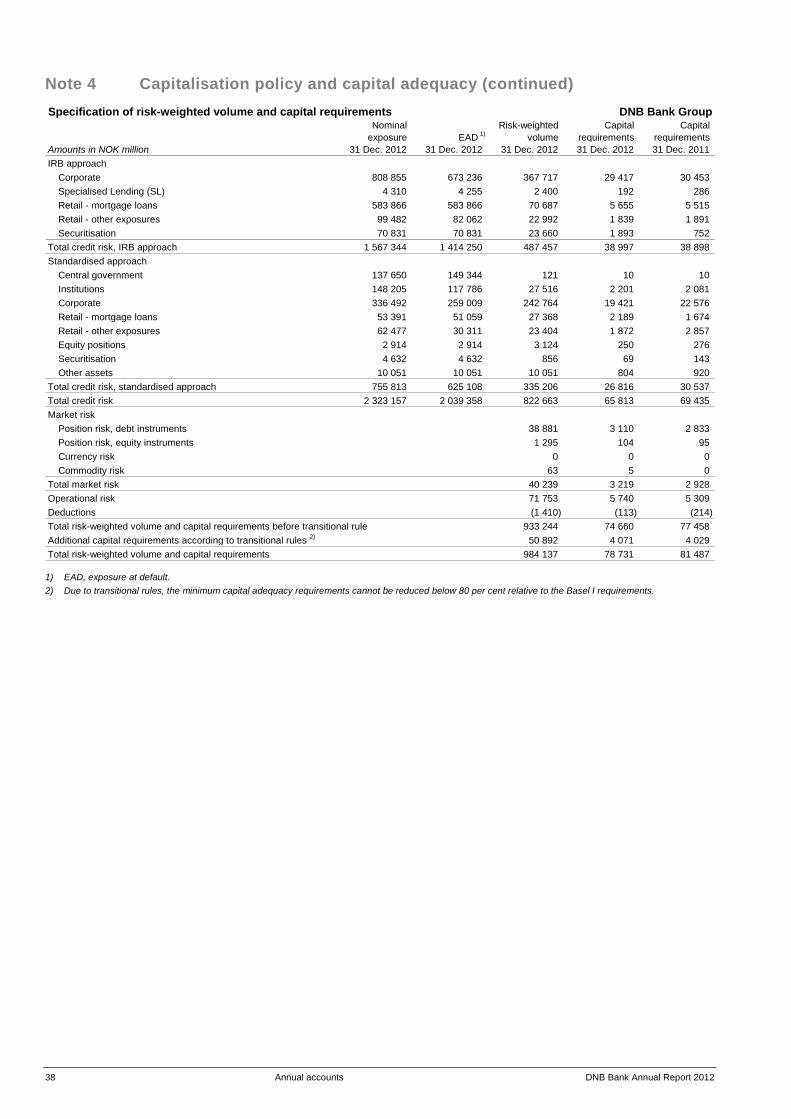
38 Annual accounts DNB Bank Annual Report 2012
Note 4 Capitalisation policy and capital adequacy (continued) Specification of risk-weighted volume and capital requirements DNB Bank Group
Nominal Risk-weighted Capital Capital exposure EAD 1) volume requirements requirements
Amounts in NOK million 31 Dec. 2012 31 Dec. 2012 31 Dec. 2012 31 Dec. 2012 31 Dec. 2011IRB approach
Corporate 808 855 673 236 367 717 29 417 30 453 Specialised Lending (SL) 4 310 4 255 2 400 192 286 Retail - mortgage loans 583 866 583 866 70 687 5 655 5 515 Retail - other exposures 99 482 82 062 22 992 1 839 1 891 Securitisation 70 831 70 831 23 660 1 893 752
Total credit risk, IRB approach 1 567 344 1 414 250 487 457 38 997 38 898 Standardised approach
Central government 137 650 149 344 121 10 10 Institutions 148 205 117 786 27 516 2 201 2 081 Corporate 336 492 259 009 242 764 19 421 22 576 Retail - mortgage loans 53 391 51 059 27 368 2 189 1 674 Retail - other exposures 62 477 30 311 23 404 1 872 2 857 Equity positions 2 914 2 914 3 124 250 276 Securitisation 4 632 4 632 856 69 143 Other assets 10 051 10 051 10 051 804 920
Total credit risk, standardised approach 755 813 625 108 335 206 26 816 30 537 Total credit risk 2 323 157 2 039 358 822 663 65 813 69 435 Market risk
Position risk, debt instruments 38 881 3 110 2 833 Position risk, equity instruments 1 295 104 95 Currency risk 0 0 0 Commodity risk 63 5 0
Total market risk 40 239 3 219 2 928 Operational risk 71 753 5 740 5 309 Deductions (1 410) (113) (214) Total risk-weighted volume and capital requirements before transitional rule 933 244 74 660 77 458 Additional capital requirements according to transitional rules 2) 50 892 4 071 4 029 Total risk-weighted volume and capital requirements 984 137 78 731 81 487
1) EAD, exposure at default. 2) Due to transitional rules, the minimum capital adequacy requirements cannot be reduced below 80 per cent relative to the Basel I requirements.
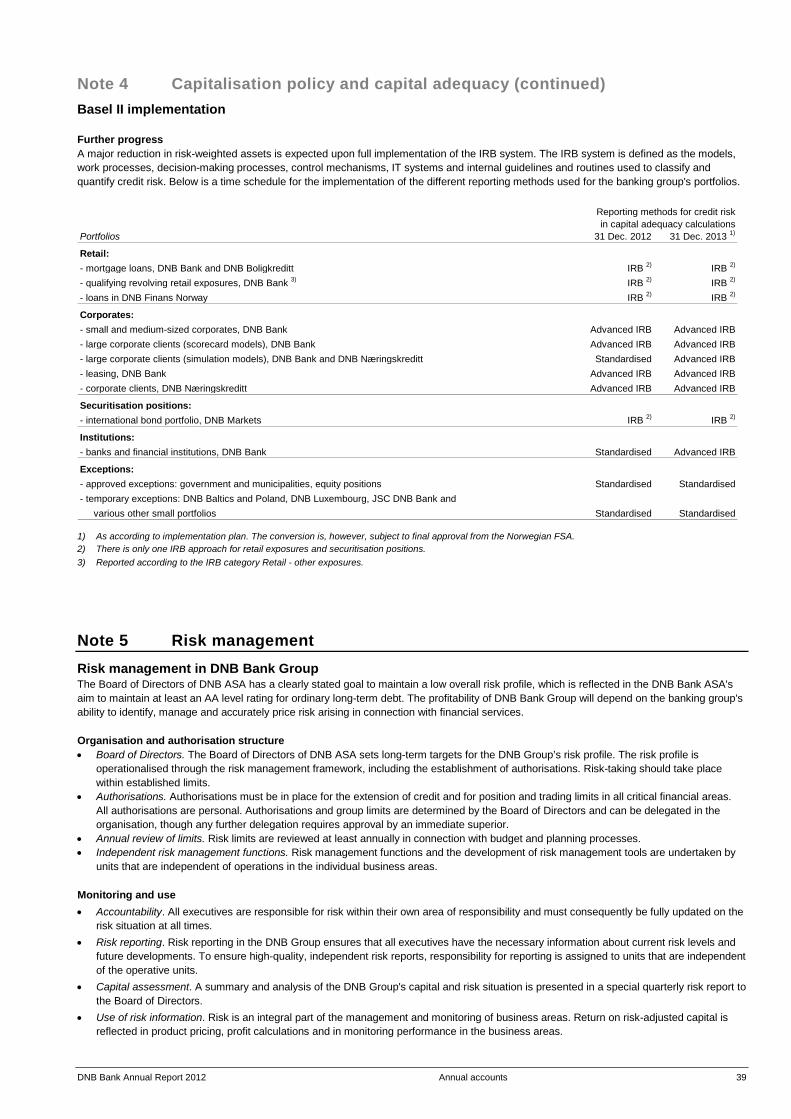
DNB Bank Annual Report 2012 Annual accounts 39
Note 4 Capitalisation policy and capital adequacy (continued) Basel II implementation Further progress A major reduction in risk-weighted assets is expected upon full implementation of the IRB system. The IRB system is defined as the models, work processes, decision-making processes, control mechanisms, IT systems and internal guidelines and routines used to classify and quantify credit risk. Below is a time schedule for the implementation of the different reporting methods used for the banking group's portfolios.
Portfolios 31 Dec. 2012 31 Dec. 2013 1)
Retail:- mortgage loans, DNB Bank and DNB Boligkreditt IRB 2) IRB 2)
- qualifying revolving retail exposures, DNB Bank 3) IRB 2) IRB 2)
- loans in DNB Finans Norway IRB 2) IRB 2)
Corporates:- small and medium-sized corporates, DNB Bank Advanced IRB Advanced IRB- large corporate clients (scorecard models), DNB Bank Advanced IRB Advanced IRB- large corporate clients (simulation models), DNB Bank and DNB Næringskreditt Standardised Advanced IRB- leasing, DNB Bank Advanced IRB Advanced IRB- corporate clients, DNB Næringskreditt Advanced IRB Advanced IRB
Securitisation positions:- international bond portfolio, DNB Markets IRB 2) IRB 2)
Institutions:- banks and financial institutions, DNB Bank Standardised Advanced IRB
Exceptions:- approved exceptions: government and municipalities, equity positions Standardised Standardised- temporary exceptions: DNB Baltics and Poland, DNB Luxembourg, JSC DNB Bank and various other small portfolios Standardised Standardised
Reporting methods for credit riskin capital adequacy calculations
1) As according to implementation plan. The conversion is, however, subject to final approval from the Norwegian FSA. 2) There is only one IRB approach for retail exposures and securitisation positions. 3) Reported according to the IRB category Retail - other exposures.
Note 5 Risk management Risk management in DNB Bank Group The Board of Directors of DNB ASA has a clearly stated goal to maintain a low overall risk profile, which is reflected in the DNB Bank ASA's aim to maintain at least an AA level rating for ordinary long-term debt. The profitability of DNB Bank Group will depend on the banking group's ability to identify, manage and accurately price risk arising in connection with financial services. Organisation and authorisation structure • Board of Directors. The Board of Directors of DNB ASA sets long-term targets for the DNB Group’s risk profile. The risk profile is
operationalised through the risk management framework, including the establishment of authorisations. Risk-taking should take place within established limits.
• Authorisations. Authorisations must be in place for the extension of credit and for position and trading limits in all critical financial areas. All authorisations are personal. Authorisations and group limits are determined by the Board of Directors and can be delegated in the organisation, though any further delegation requires approval by an immediate superior.
• Annual review of limits. Risk limits are reviewed at least annually in connection with budget and planning processes. • Independent risk management functions. Risk management functions and the development of risk management tools are undertaken by
units that are independent of operations in the individual business areas.
Monitoring and use • Accountability. All executives are responsible for risk within their own area of responsibility and must consequently be fully updated on the
risk situation at all times. • Risk reporting. Risk reporting in the DNB Group ensures that all executives have the necessary information about current risk levels and
future developments. To ensure high-quality, independent risk reports, responsibility for reporting is assigned to units that are independent of the operative units.
• Capital assessment. A summary and analysis of the DNB Group's capital and risk situation is presented in a special quarterly risk report to the Board of Directors.
• Use of risk information. Risk is an integral part of the management and monitoring of business areas. Return on risk-adjusted capital is reflected in product pricing, profit calculations and in monitoring performance in the business areas.

40 Annual accounts DNB Bank Annual Report 2012
Note 5 Risk management (continued) Relevant risk measures • A common risk measure for the banking group. The banking group's risk is measured in the form of risk-adjusted capital, calculated for all
of the banking group's business areas and main risk categories, with the exception of liquidity risk. See the paragraph on ”Risk-adjusted capital for the DNB Bank Group” for more information.
• Supplementary risk measure. In addition, risk is followed up through supplementary risk measures adapted to operations in the various business areas, for example monitoring of positions relative to limits, key figures and portfolio risk targets.
• Risk appetite. With effect from January 2013, the DNB Group will monitor risk through defined targets. The risk appetite framework consists of 13 statements covering the risk dimensions which are considered to be significant for the DNB Group, and which added up give a good view of the total risk. Developments in the target figures are monitored and reported to DNB’s Board of Directors on a monthly basis.
Risk categories For risk management purposes, DNB distinguishes between the following risk categories: • Credit risk is the risk of losses due to failure on the part of the banking group's counterparties or customers to meet their payment
obligations towards the DNB Bank Group. Credit risk refers to all claims against counterparties or customers, including credit risk in trading operations, country risk and settlement risk. Note 6 contains an assessment of the DNB Group's credit risk at year-end 2011 and 2012.
• Market risk is the risk of losses or reduced future income due to fluctuations in market prices or exchange rates. The risk arises as a consequence of the bank's unhedged transactions and exposure in the foreign exchange, interest rate, commodity and equity markets. Notes 13-16 contain an assessment of the banking group's market risk at year-end 2011 and 2012.
• Liquidity risk is the risk that the banking group will be unable to meet its obligations as they fall due, and risk that the banking group will be unable to meet its liquidity obligations without a substantial rise in appurtenant costs. In a broader perspective, liquidity risk also includes the risk that the banking group will be unable to finance increases in assets as its funding requirements rise. Note 17 contains an assessment of the banking group's liquidity risk at year-end 2011 and 2012.
• Operational risk is the risk of losses due to deficiencies or errors in processes and systems, errors made by employees or external events. • Business risk is the risk of losses due to changes in external factors such as the market situation or government regulations. This risk
category also includes reputational risk.
Risk-adjusted capital for the DNB Bank Group Risk-adjusted capital is a measure of the risk of losses generated by various business operations. Risk-adjusted capital makes it possible to compare risk across risk categories and business areas. Average losses over a normal business cycle represent expected costs which should primarily be covered through correct pricing of the banking group's products. Risk-adjusted capital should cover unexpected losses. The quantification of risk-adjusted capital is based on statistical probability calculations for the various risk categories on the basis of historical data. As it is impossible to guard against all potential losses, DNB has stipulated that risk-adjusted capital should cover 99.97 per cent of potential losses within a one-year horizon. This level is in accordance with an AA level rating target for the ordinary long-term debt in DNB Bank ASA. Risk-adjusted capital and average losses over a normal business cycle are elements in calculations of risk-adjusted return, which is a key financial management parameter in the internal management of the DNB Bank Group. The calculations are included in the financial planning for the business areas and are reported each month. Risk-adjusted return is a measurement parameter in the pricing model and is reported monthly in automated management systems. Risk-adjusted capital is also used as decision support for risk management. The similarities between the framework for risk-adjusted capital and the capital adequacy regulations gradually become greater as a larger part of the banking group’s exposures are reported according to the IRB approach. The underlying risk drivers for credit, and partly for operational risk, are largely the same. However, there are different confidence levels, and calculations based on risk-adjusted capital are more conservative. The DNB Bank Group quantifies risk-adjusted capital for the following risk categories: credit risk, market risk, operational risk and business risk. A significant diversification or portfolio effect arises when the various risks are considered together, as it is unlikely that all losses will occur at the same time. An economic downturn will normally have a negative effect on most areas, but there will be a diversification effect, as not all areas will be hit equally hard. The diversification effect between risk categories and business areas implies that the DNB Bank Group's risk-adjusted capital will be much lower than if the business areas had been independent companies. At end-December 2012, net risk-adjusted capital for the DNB Bank Group was estimated at NOK 76.1 billion, an increase of NOK 5.1 billion from end-December 2011.
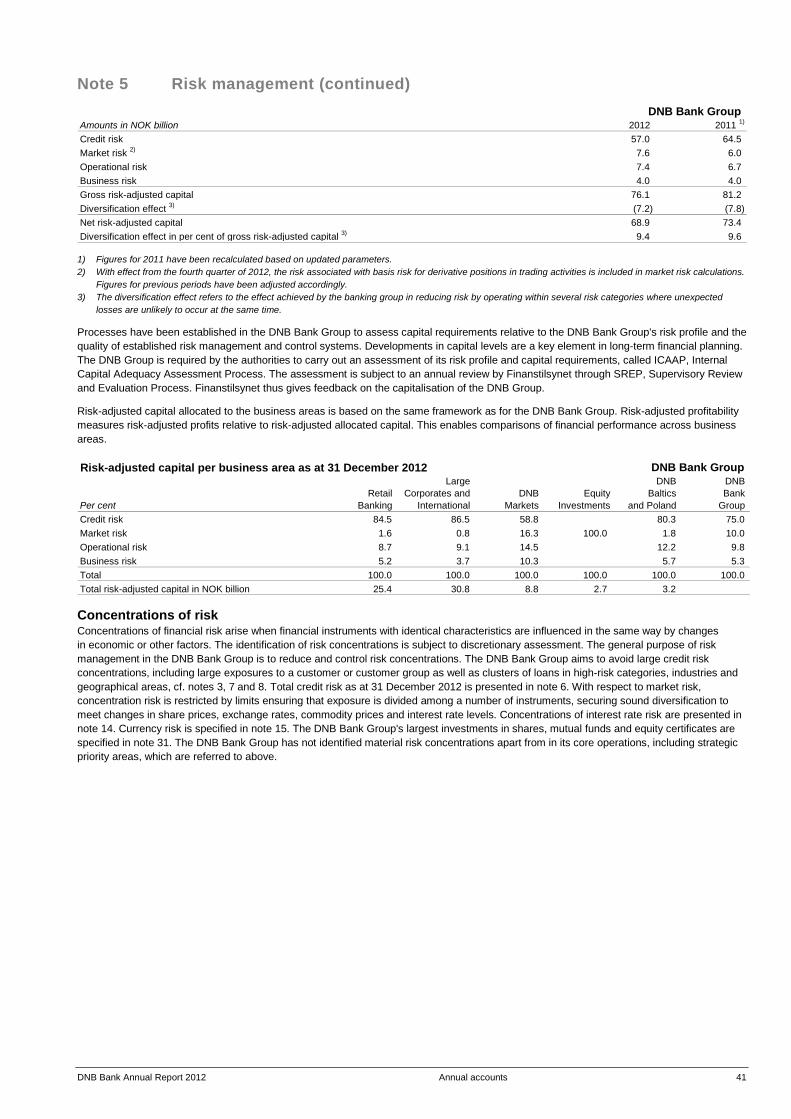
DNB Bank Annual Report 2012 Annual accounts 41
Note 5 Risk management (continued) DNB Bank Group
Amounts in NOK billion 2012 2011 1)
Credit risk 57.0 64.5 Market risk 2) 7.6 6.0 Operational risk 7.4 6.7 Business risk 4.0 4.0 Gross risk-adjusted capital 76.1 81.2 Diversification effect 3) (7.2) (7.8) Net risk-adjusted capital 68.9 73.4 Diversification effect in per cent of gross risk-adjusted capital 3) 9.4 9.6
1) Figures for 2011 have been recalculated based on updated parameters. 2) With effect from the fourth quarter of 2012, the risk associated with basis risk for derivative positions in trading activities is included in market risk calculations.
Figures for previous periods have been adjusted accordingly. 3) The diversification effect refers to the effect achieved by the banking group in reducing risk by operating within several risk categories where unexpected
losses are unlikely to occur at the same time. Processes have been established in the DNB Bank Group to assess capital requirements relative to the DNB Bank Group's risk profile and the quality of established risk management and control systems. Developments in capital levels are a key element in long-term financial planning. The DNB Group is required by the authorities to carry out an assessment of its risk profile and capital requirements, called ICAAP, Internal Capital Adequacy Assessment Process. The assessment is subject to an annual review by Finanstilsynet through SREP, Supervisory Review and Evaluation Process. Finanstilsynet thus gives feedback on the capitalisation of the DNB Group. Risk-adjusted capital allocated to the business areas is based on the same framework as for the DNB Bank Group. Risk-adjusted profitability measures risk-adjusted profits relative to risk-adjusted allocated capital. This enables comparisons of financial performance across business areas. Risk-adjusted capital per business area as at 31 December 2012 DNB Bank Group
Large DNB DNB Retail Corporates and DNB Equity Baltics Bank
Per cent Banking International Markets Investments and Poland Group Credit risk 84.5 86.5 58.8 80.3 75.0Market risk 1.6 0.8 16.3 100.0 1.8 10.0Operational risk 8.7 9.1 14.5 12.2 9.8Business risk 5.2 3.7 10.3 5.7 5.3Total 100.0 100.0 100.0 100.0 100.0 100.0Total risk-adjusted capital in NOK billion 25.4 30.8 8.8 2.7 3.2 Concentrations of risk Concentrations of financial risk arise when financial instruments with identical characteristics are influenced in the same way by changes in economic or other factors. The identification of risk concentrations is subject to discretionary assessment. The general purpose of risk management in the DNB Bank Group is to reduce and control risk concentrations. The DNB Bank Group aims to avoid large credit risk concentrations, including large exposures to a customer or customer group as well as clusters of loans in high-risk categories, industries and geographical areas, cf. notes 3, 7 and 8. Total credit risk as at 31 December 2012 is presented in note 6. With respect to market risk, concentration risk is restricted by limits ensuring that exposure is divided among a number of instruments, securing sound diversification to meet changes in share prices, exchange rates, commodity prices and interest rate levels. Concentrations of interest rate risk are presented in note 14. Currency risk is specified in note 15. The DNB Bank Group's largest investments in shares, mutual funds and equity certificates are specified in note 31. The DNB Bank Group has not identified material risk concentrations apart from in its core operations, including strategic priority areas, which are referred to above.
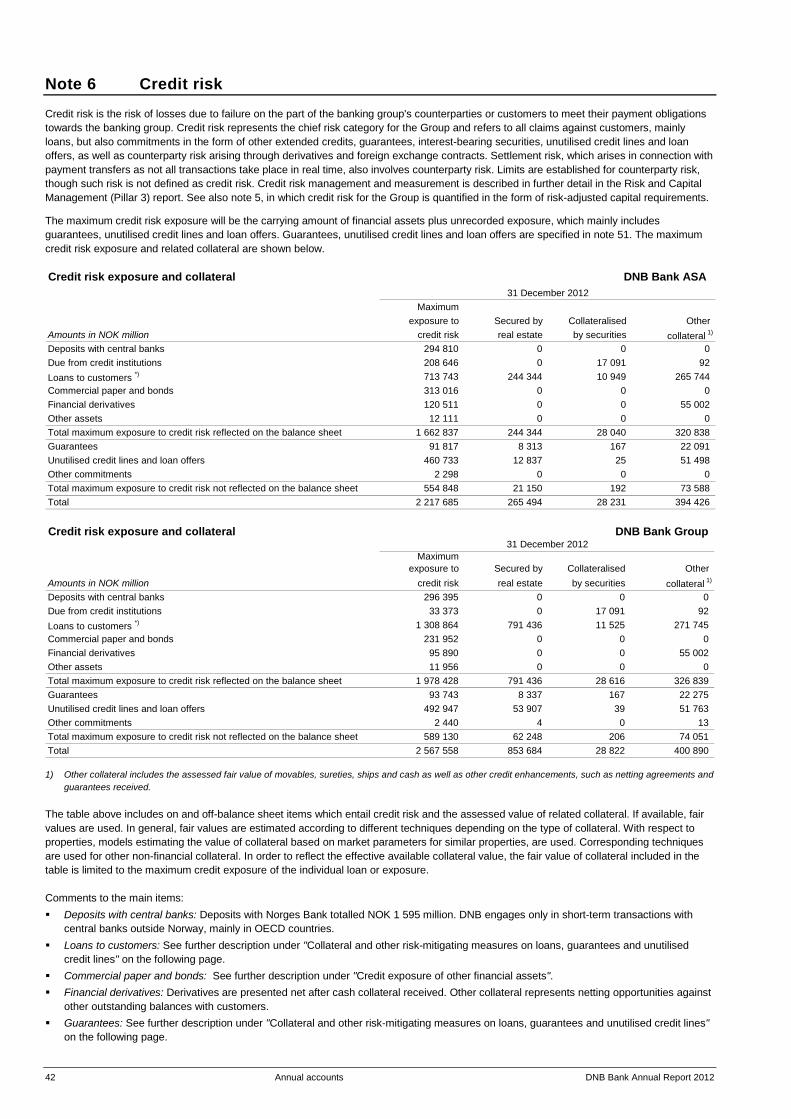
42 Annual accounts DNB Bank Annual Report 2012
Note 6 Credit risk
Credit risk is the risk of losses due to failure on the part of the banking group's counterparties or customers to meet their payment obligations towards the banking group. Credit risk represents the chief risk category for the Group and refers to all claims against customers, mainly loans, but also commitments in the form of other extended credits, guarantees, interest-bearing securities, unutilised credit lines and loan offers, as well as counterparty risk arising through derivatives and foreign exchange contracts. Settlement risk, which arises in connection with payment transfers as not all transactions take place in real time, also involves counterparty risk. Limits are established for counterparty risk, though such risk is not defined as credit risk. Credit risk management and measurement is described in further detail in the Risk and Capital Management (Pillar 3) report. See also note 5, in which credit risk for the Group is quantified in the form of risk-adjusted capital requirements. The maximum credit risk exposure will be the carrying amount of financial assets plus unrecorded exposure, which mainly includes guarantees, unutilised credit lines and loan offers. Guarantees, unutilised credit lines and loan offers are specified in note 51. The maximum credit risk exposure and related collateral are shown below. Credit risk exposure and collateral DNB Bank ASA
Maximum exposure to Secured by Collateralised Other
Amounts in NOK million credit risk real estate by securities collateral 1)
Deposits with central banks 294 810 0 0 0 Due from credit institutions 208 646 0 17 091 92 Loans to customers *) 713 743 244 344 10 949 265 744 Commercial paper and bonds 313 016 0 0 0 Financial derivatives 120 511 0 0 55 002 Other assets 12 111 0 0 0 Total maximum exposure to credit risk reflected on the balance sheet 1 662 837 244 344 28 040 320 838 Guarantees 91 817 8 313 167 22 091 Unutilised credit lines and loan offers 460 733 12 837 25 51 498 Other commitments 2 298 0 0 0 Total maximum exposure to credit risk not reflected on the balance sheet 554 848 21 150 192 73 588 Total 2 217 685 265 494 28 231 394 426
31 December 2012
Credit risk exposure and collateral DNB Bank Group
Maximum exposure to Secured by Collateralised Other
Amounts in NOK million credit risk real estate by securities collateral 1)
Deposits with central banks 296 395 0 0 0 Due from credit institutions 33 373 0 17 091 92 Loans to customers *) 1 308 864 791 436 11 525 271 745 Commercial paper and bonds 231 952 0 0 0 Financial derivatives 95 890 0 0 55 002 Other assets 11 956 0 0 0 Total maximum exposure to credit risk reflected on the balance sheet 1 978 428 791 436 28 616 326 839 Guarantees 93 743 8 337 167 22 275 Unutilised credit lines and loan offers 492 947 53 907 39 51 763 Other commitments 2 440 4 0 13 Total maximum exposure to credit risk not reflected on the balance sheet 589 130 62 248 206 74 051 Total 2 567 558 853 684 28 822 400 890
31 December 2012
1) Other collateral includes the assessed fair value of movables, sureties, ships and cash as well as other credit enhancements, such as netting agreements and
guarantees received. The table above includes on and off-balance sheet items which entail credit risk and the assessed value of related collateral. If available, fair values are used. In general, fair values are estimated according to different techniques depending on the type of collateral. With respect to properties, models estimating the value of collateral based on market parameters for similar properties, are used. Corresponding techniques are used for other non-financial collateral. In order to reflect the effective available collateral value, the fair value of collateral included in the table is limited to the maximum credit exposure of the individual loan or exposure. Comments to the main items: Deposits with central banks: Deposits with Norges Bank totalled NOK 1 595 million. DNB engages only in short-term transactions with
central banks outside Norway, mainly in OECD countries. Loans to customers: See further description under "Collateral and other risk-mitigating measures on loans, guarantees and unutilised
credit lines" on the following page. Commercial paper and bonds: See further description under "Credit exposure of other financial assets". Financial derivatives: Derivatives are presented net after cash collateral received. Other collateral represents netting opportunities against
other outstanding balances with customers. Guarantees: See further description under "Collateral and other risk-mitigating measures on loans, guarantees and unutilised credit lines"
on the following page.
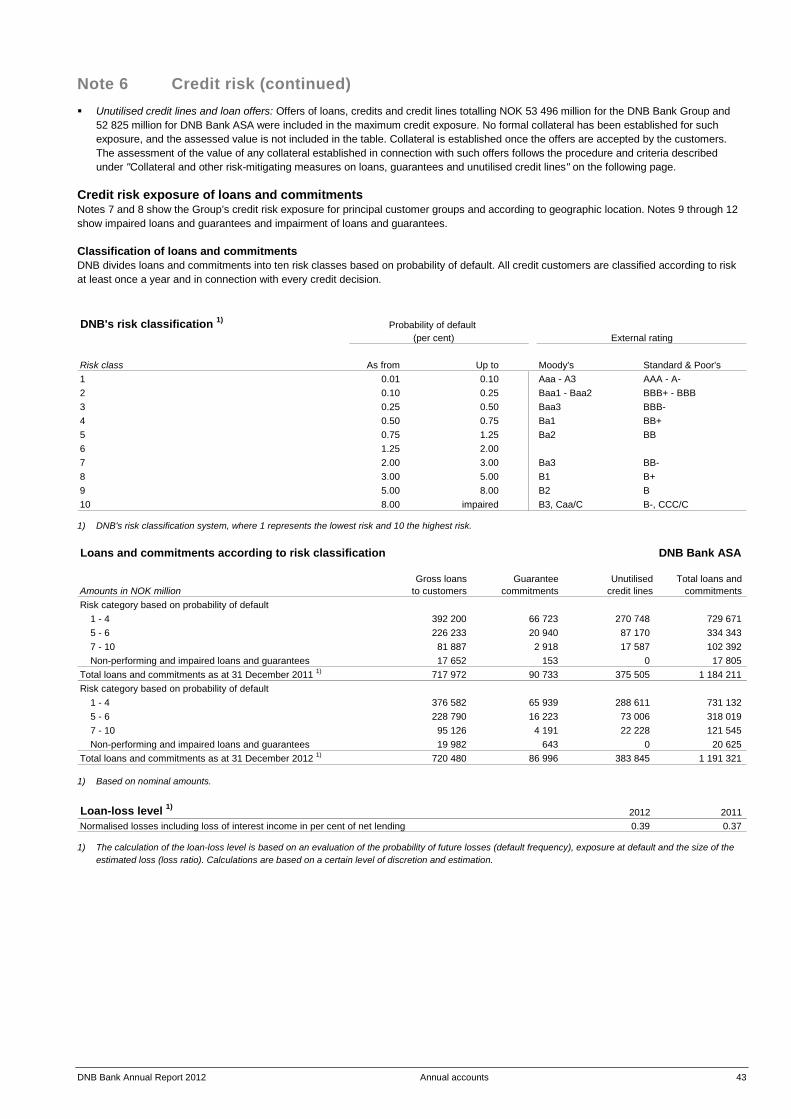
DNB Bank Annual Report 2012 Annual accounts 43
Note 6 Credit risk (continued) Unutilised credit lines and loan offers: Offers of loans, credits and credit lines totalling NOK 53 496 million for the DNB Bank Group and
52 825 million for DNB Bank ASA were included in the maximum credit exposure. No formal collateral has been established for such exposure, and the assessed value is not included in the table. Collateral is established once the offers are accepted by the customers. The assessment of the value of any collateral established in connection with such offers follows the procedure and criteria described under "Collateral and other risk-mitigating measures on loans, guarantees and unutilised credit lines" on the following page.
Credit risk exposure of loans and commitments Notes 7 and 8 show the Group’s credit risk exposure for principal customer groups and according to geographic location. Notes 9 through 12 show impaired loans and guarantees and impairment of loans and guarantees. Classification of loans and commitments DNB divides loans and commitments into ten risk classes based on probability of default. All credit customers are classified according to risk at least once a year and in connection with every credit decision. DNB's risk classification 1)
Risk class As from Up to Moody's Standard & Poor's1 0.01 0.10 Aaa - A3 AAA - A-2 0.10 0.25 Baa1 - Baa2 BBB+ - BBB3 0.25 0.50 Baa3 BBB-4 0.50 0.75 Ba1 BB+5 0.75 1.25 Ba2 BB6 1.25 2.007 2.00 3.00 Ba3 BB-8 3.00 5.00 B1 B+9 5.00 8.00 B2 B10 8.00 impaired B3, Caa/C B-, CCC/C
(per cent) External rating Probability of default
1) DNB's risk classification system, where 1 represents the lowest risk and 10 the highest risk. Loans and commitments according to risk classification DNB Bank ASA
Gross loans Guarantee Unutilised Total loans and Amounts in NOK million to customers commitments credit lines commitments Risk category based on probability of default
1 - 4 392 200 66 723 270 748 729 671 5 - 6 226 233 20 940 87 170 334 343 7 - 10 81 887 2 918 17 587 102 392 Non-performing and impaired loans and guarantees 17 652 153 0 17 805
Total loans and commitments as at 31 December 2011 1) 717 972 90 733 375 505 1 184 211 Risk category based on probability of default
1 - 4 376 582 65 939 288 611 731 132 5 - 6 228 790 16 223 73 006 318 019 7 - 10 95 126 4 191 22 228 121 545 Non-performing and impaired loans and guarantees 19 982 643 0 20 625
Total loans and commitments as at 31 December 2012 1) 720 480 86 996 383 845 1 191 321 1) Based on nominal amounts. Loan-loss level 1)
2012 2011 Normalised losses including loss of interest income in per cent of net lending 0.39 0.37
1) The calculation of the loan-loss level is based on an evaluation of the probability of future losses (default frequency), exposure at default and the size of the estimated loss (loss ratio). Calculations are based on a certain level of discretion and estimation.
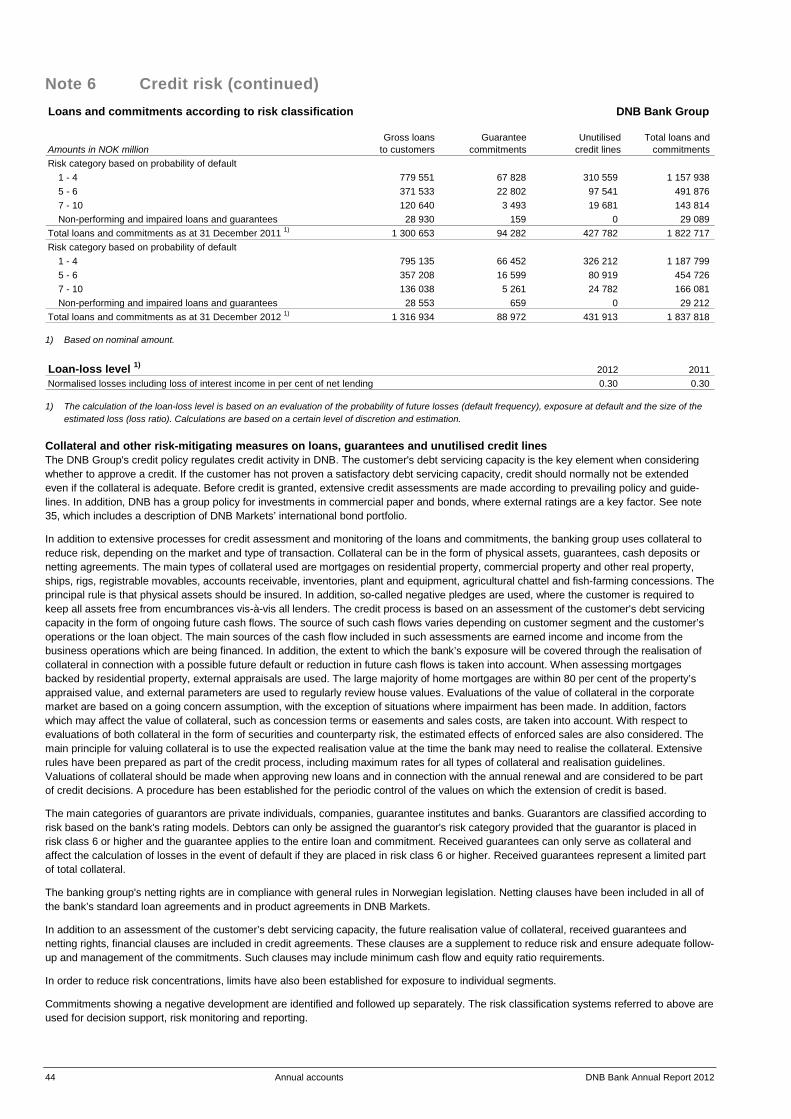
44 Annual accounts DNB Bank Annual Report 2012
Note 6 Credit risk (continued) Loans and commitments according to risk classification DNB Bank Group
Gross loans Guarantee Unutilised Total loans and Amounts in NOK million to customers commitments credit lines commitments Risk category based on probability of default
1 - 4 779 551 67 828 310 559 1 157 938 5 - 6 371 533 22 802 97 541 491 876 7 - 10 120 640 3 493 19 681 143 814 Non-performing and impaired loans and guarantees 28 930 159 0 29 089
Total loans and commitments as at 31 December 2011 1) 1 300 653 94 282 427 782 1 822 717 Risk category based on probability of default
1 - 4 795 135 66 452 326 212 1 187 799 5 - 6 357 208 16 599 80 919 454 726 7 - 10 136 038 5 261 24 782 166 081 Non-performing and impaired loans and guarantees 28 553 659 0 29 212
Total loans and commitments as at 31 December 2012 1) 1 316 934 88 972 431 913 1 837 818 1) Based on nominal amount. Loan-loss level 1) 2012 2011 Normalised losses including loss of interest income in per cent of net lending 0.30 0.30
1) The calculation of the loan-loss level is based on an evaluation of the probability of future losses (default frequency), exposure at default and the size of the
estimated loss (loss ratio). Calculations are based on a certain level of discretion and estimation. Collateral and other risk-mitigating measures on loans, guarantees and unutilised credit lines The DNB Group's credit policy regulates credit activity in DNB. The customer's debt servicing capacity is the key element when considering whether to approve a credit. If the customer has not proven a satisfactory debt servicing capacity, credit should normally not be extended even if the collateral is adequate. Before credit is granted, extensive credit assessments are made according to prevailing policy and guide-lines. In addition, DNB has a group policy for investments in commercial paper and bonds, where external ratings are a key factor. See note 35, which includes a description of DNB Markets’ international bond portfolio. In addition to extensive processes for credit assessment and monitoring of the loans and commitments, the banking group uses collateral to reduce risk, depending on the market and type of transaction. Collateral can be in the form of physical assets, guarantees, cash deposits or netting agreements. The main types of collateral used are mortgages on residential property, commercial property and other real property, ships, rigs, registrable movables, accounts receivable, inventories, plant and equipment, agricultural chattel and fish-farming concessions. The principal rule is that physical assets should be insured. In addition, so-called negative pledges are used, where the customer is required to keep all assets free from encumbrances vis-à-vis all lenders. The credit process is based on an assessment of the customer's debt servicing capacity in the form of ongoing future cash flows. The source of such cash flows varies depending on customer segment and the customer’s operations or the loan object. The main sources of the cash flow included in such assessments are earned income and income from the business operations which are being financed. In addition, the extent to which the bank’s exposure will be covered through the realisation of collateral in connection with a possible future default or reduction in future cash flows is taken into account. When assessing mortgages backed by residential property, external appraisals are used. The large majority of home mortgages are within 80 per cent of the property’s appraised value, and external parameters are used to regularly review house values. Evaluations of the value of collateral in the corporate market are based on a going concern assumption, with the exception of situations where impairment has been made. In addition, factors which may affect the value of collateral, such as concession terms or easements and sales costs, are taken into account. With respect to evaluations of both collateral in the form of securities and counterparty risk, the estimated effects of enforced sales are also considered. The main principle for valuing collateral is to use the expected realisation value at the time the bank may need to realise the collateral. Extensive rules have been prepared as part of the credit process, including maximum rates for all types of collateral and realisation guidelines. Valuations of collateral should be made when approving new loans and in connection with the annual renewal and are considered to be part of credit decisions. A procedure has been established for the periodic control of the values on which the extension of credit is based. The main categories of guarantors are private individuals, companies, guarantee institutes and banks. Guarantors are classified according to risk based on the bank's rating models. Debtors can only be assigned the guarantor's risk category provided that the guarantor is placed in risk class 6 or higher and the guarantee applies to the entire loan and commitment. Received guarantees can only serve as collateral and affect the calculation of losses in the event of default if they are placed in risk class 6 or higher. Received guarantees represent a limited part of total collateral. The banking group's netting rights are in compliance with general rules in Norwegian legislation. Netting clauses have been included in all of the bank’s standard loan agreements and in product agreements in DNB Markets. In addition to an assessment of the customer’s debt servicing capacity, the future realisation value of collateral, received guarantees and netting rights, financial clauses are included in credit agreements. These clauses are a supplement to reduce risk and ensure adequate follow-up and management of the commitments. Such clauses may include minimum cash flow and equity ratio requirements. In order to reduce risk concentrations, limits have also been established for exposure to individual segments. Commitments showing a negative development are identified and followed up separately. The risk classification systems referred to above are used for decision support, risk monitoring and reporting.
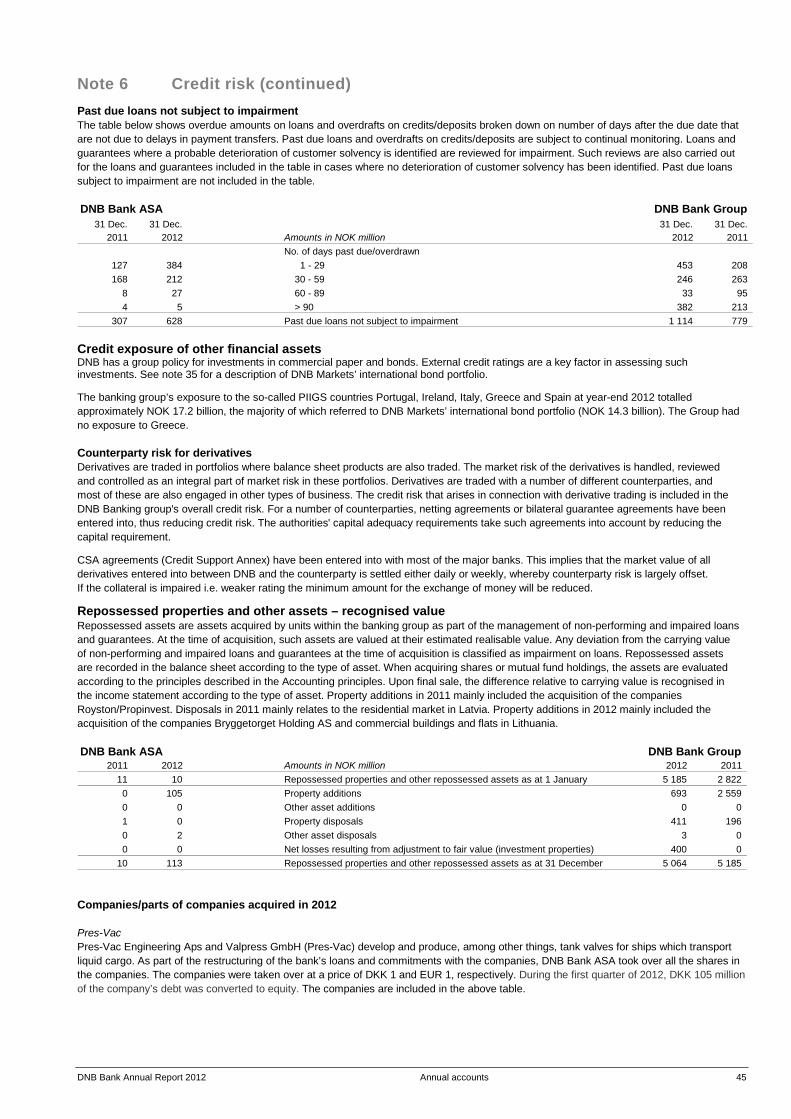
DNB Bank Annual Report 2012 Annual accounts 45
Note 6 Credit risk (continued) Past due loans not subject to impairment The table below shows overdue amounts on loans and overdrafts on credits/deposits broken down on number of days after the due date that are not due to delays in payment transfers. Past due loans and overdrafts on credits/deposits are subject to continual monitoring. Loans and guarantees where a probable deterioration of customer solvency is identified are reviewed for impairment. Such reviews are also carried out for the loans and guarantees included in the table in cases where no deterioration of customer solvency has been identified. Past due loans subject to impairment are not included in the table. DNB Bank ASA DNB Bank Group
31 Dec. 31 Dec. 31 Dec. 31 Dec.2011 2012 Amounts in NOK million 2012 2011
No. of days past due/overdrawn127 384 1 - 29 453 208 168 212 30 - 59 246 263
8 27 60 - 89 33 95 4 5 > 90 382 213
307 628 Past due loans not subject to impairment 1 114 779 Credit exposure of other financial assets DNB has a group policy for investments in commercial paper and bonds. External credit ratings are a key factor in assessing such investments. See note 35 for a description of DNB Markets’ international bond portfolio. The banking group’s exposure to the so-called PIIGS countries Portugal, Ireland, Italy, Greece and Spain at year-end 2012 totalled approximately NOK 17.2 billion, the majority of which referred to DNB Markets’ international bond portfolio (NOK 14.3 billion). The Group had no exposure to Greece. Counterparty risk for derivatives Derivatives are traded in portfolios where balance sheet products are also traded. The market risk of the derivatives is handled, reviewed and controlled as an integral part of market risk in these portfolios. Derivatives are traded with a number of different counterparties, and most of these are also engaged in other types of business. The credit risk that arises in connection with derivative trading is included in the DNB Banking group's overall credit risk. For a number of counterparties, netting agreements or bilateral guarantee agreements have been entered into, thus reducing credit risk. The authorities' capital adequacy requirements take such agreements into account by reducing the capital requirement. CSA agreements (Credit Support Annex) have been entered into with most of the major banks. This implies that the market value of all derivatives entered into between DNB and the counterparty is settled either daily or weekly, whereby counterparty risk is largely offset. If the collateral is impaired i.e. weaker rating the minimum amount for the exchange of money will be reduced.
Repossessed properties and other assets – recognised value Repossessed assets are assets acquired by units within the banking group as part of the management of non-performing and impaired loans and guarantees. At the time of acquisition, such assets are valued at their estimated realisable value. Any deviation from the carrying value of non-performing and impaired loans and guarantees at the time of acquisition is classified as impairment on loans. Repossessed assets are recorded in the balance sheet according to the type of asset. When acquiring shares or mutual fund holdings, the assets are evaluated according to the principles described in the Accounting principles. Upon final sale, the difference relative to carrying value is recognised in the income statement according to the type of asset. Property additions in 2011 mainly included the acquisition of the companies Royston/Propinvest. Disposals in 2011 mainly relates to the residential market in Latvia. Property additions in 2012 mainly included the acquisition of the companies Bryggetorget Holding AS and commercial buildings and flats in Lithuania. DNB Bank ASA DNB Bank Group
2011 2012 Amounts in NOK million 2012 2011 11 10 Repossessed properties and other repossessed assets as at 1 January 5 185 2 822 0 105 Property additions 693 2 559 0 0 Other asset additions 0 0 1 0 Property disposals 411 196 0 2 Other asset disposals 3 0 0 0 Net losses resulting from adjustment to fair value (investment properties) 400 0
10 113 Repossessed properties and other repossessed assets as at 31 December 5 064 5 185 Companies/parts of companies acquired in 2012 Pres-Vac Pres-Vac Engineering Aps and Valpress GmbH (Pres-Vac) develop and produce, among other things, tank valves for ships which transport liquid cargo. As part of the restructuring of the bank’s loans and commitments with the companies, DNB Bank ASA took over all the shares in the companies. The companies were taken over at a price of DKK 1 and EUR 1, respectively. During the first quarter of 2012, DKK 105 million of the company’s debt was converted to equity. The companies are included in the above table.

46 Annual accounts DNB Bank Annual Report 2012
Note 6 Credit risk (continued) Bryggetorget Holding AS After Faktor Eiendom ASA went into liquidation, Bryggetorget Holding AS, which is owned by DNB Bank ASA, took over Skurufjellet Eiendom AS, Trysiltunet Eiendom AS and Trysilfjell Apartment Eiendom AS from the estate in the first quarter of 2012. In addition, 31 holiday apart-ments in Uvdal organised as a housing cooperative were taken over. The properties were acquired at fair value. After the acquisition, the balance sheet value of the properties in Bryggetorget Holding was NOK 222 million. The property values are included in the above table. Companies/parts of companies acquired in 2011 Royston/Propinvest On 16 June 2011, DnB NOR Bank ASA took over all the shares in Royston Norway from Propinvest Ltd. as part of the restructuring of the bank's loans and commitments with the company. In addition, a company in Sweden and another in Finland were acquired. On the acquisition date the companies owned a total of 62 commercial properties, of which 55 are located in Norway, four in Sweden and three in Finland. The fair value of the properties was estimated at approximately NOK 1.8 billion on the acquisition date. The property values are included in the above table. Relacom AB As part of the restructuring of the Realcom Group, the creditors took over all shares in Realcom AB in April 2011. Debt totalling SEK 2.3 billion was thereafter converted to equity capital. See note 37 Investments in associated companies for more information. The investment is not included in the above table. Loans and deposits designated as at fair value
DNB Bank ASA DNB Bank Group 31 Dec. 2011 31 Dec. 2012 Amounts in NOK million 31 Dec. 2012 31 Dec. 2011
98 993 74 861 Loans and deposits designated as at fair value 137 644 109 103 98 993 74 861 Total exposure to credit risk 137 644 109 103
493 498 Value adjustment from credit risk 1) 665 611 (54) 4 Value adjustment from change in credit risk 54 (17)
1) Credit risk reflected in fair value measurements is based on normalised losses and changes in normalised losses in the relevant portfolio. Effects of changes in credit margins Overall, there was a positive financial market trend through 2012. The central banks within the EU and in the US made extensive purchases of sovereign debt. In addition, confidence in the banking system increased in the EU in consequence of the plans to establish a banking union. In the second half of the year, risk premiums in the money and capital markets were reduced to the levels prevailing in the first half of 2011. Reduced credit margins affected a number of items in the DNB Bank Group’s balance sheet. As part of ongoing liquidity management, DNB Markets invests in an international covered bond portfolio. The holding of such bonds increased through 2012. Reduced margin requirements resulted in unrealised gains in this portfolio of NOK 685 million at end-December 2012, compared with unrealised losses of NOK 487 million at year-end 2011. The unrealised gains and losses will be reversed over the remaining term to maturity, provided that there are no changes in the credit status of the bonds. The DNB Bank Group has a 40 per cent ownership interest in Eksportfinans, and the company is recognised in the group accounts according to the equity method. Large parts of Eksportfinans’ liabilities are carried at fair value through profit or loss. Moody’s and Standard and Poor’s downgrades of Eksportfinans’ credit rating in the fourth quarter of 2011 resulted in sizeable unrealised gains on the company’s long-term funding. The effect of such unrealised gains on DNB Bank ASA’s holding, after tax, represented NOK 11.8 billion. After reviewing the fair value of the company, DNB Bank ASA’s wrote down the value by an amount corresponding to unrealised gains on Eksportfinans’ own debt in the fourth quarter of 2011. In 2012, the required rate of return in the market has been reduced, and Eksportfinans has sizeable unrealised losses on own debt. The impairment loss recorded by DNB in the fourth quarter of 2011 has been reversed by an amount corresponding to these unrealised losses. The reversal represented just under NOK 7.5 billion of DNB’s holding after tax. The impairment loss in 2011 and the reversal in 2012 have been reported on the line ”Profit from companies accounted for by the equity method” along with DNB’s share of profits from the company. The DNB Bank Group’s long-term borrowings in Norwegian kroner are carried at fair value through profit or loss. Due to the positive financial market trend throughout the second half of 2012, investors’ margin requirements were reduced. At end-December 2012, there were unrealised losses of NOK 571 million on long-term borrowings, compared with unrealised gains of NOK 536 million at year-end 2011. Unrealised gains and losses on the DNB Bank Group’s liabilities will be reversed over the remaining term to maturity.
The DNB Bank Group’s fixed-rate loans in Norwegian kroner and parts of the portfolio of margin loans in Norwegian kroner are carried at fair value through profit or loss. Unrealised losses resulting from increased margin requirements on these loans came to NOK 226 million at year-end 2012, compared with unrealised losses of NOK 115 million at end-December 2011. The unrealised gains and losses will be reversed over the remaining term to maturity, provided that there are no changes in the credit status of the loans.
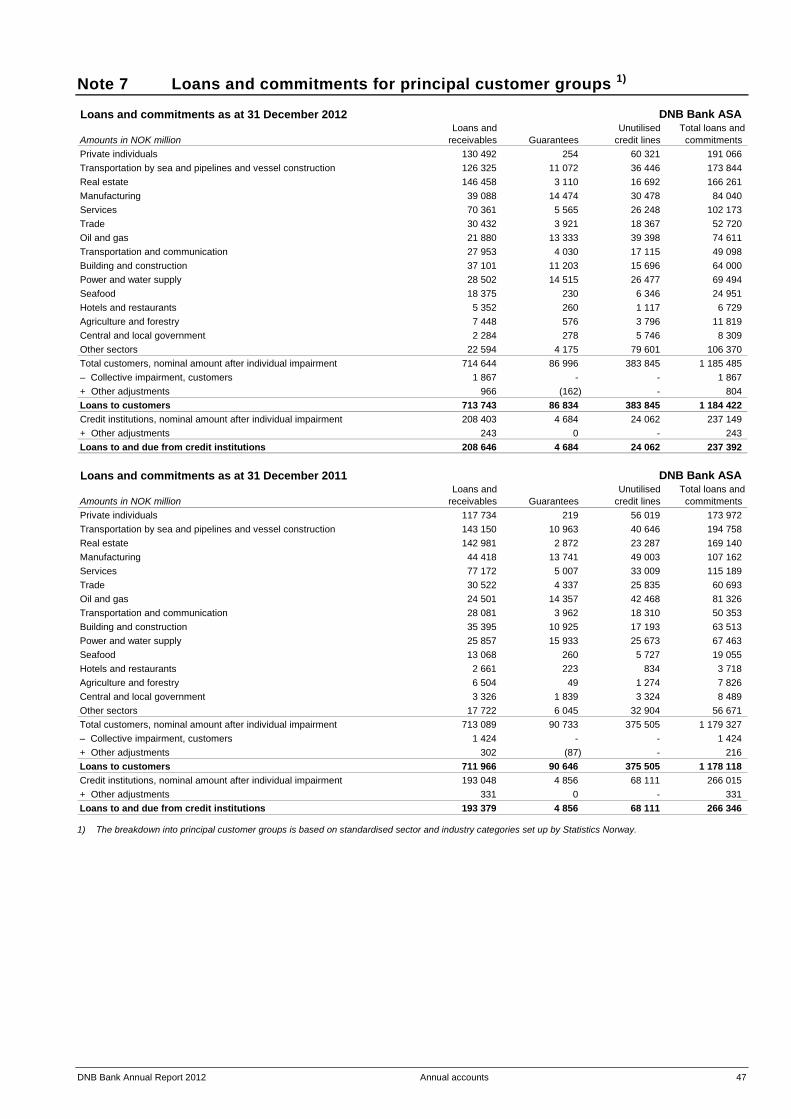
DNB Bank Annual Report 2012 Annual accounts 47
Note 7 Loans and commitments for principal customer groups 1)
Loans and commitments as at 31 December 2012 DNB Bank ASA Loans and Unutilised Total loans and
Amounts in NOK million receivables Guarantees credit lines commitments Private individuals 130 492 254 60 321 191 066 Transportation by sea and pipelines and vessel construction 126 325 11 072 36 446 173 844 Real estate 146 458 3 110 16 692 166 261 Manufacturing 39 088 14 474 30 478 84 040 Services 70 361 5 565 26 248 102 173 Trade 30 432 3 921 18 367 52 720 Oil and gas 21 880 13 333 39 398 74 611 Transportation and communication 27 953 4 030 17 115 49 098 Building and construction 37 101 11 203 15 696 64 000 Power and water supply 28 502 14 515 26 477 69 494 Seafood 18 375 230 6 346 24 951 Hotels and restaurants 5 352 260 1 117 6 729 Agriculture and forestry 7 448 576 3 796 11 819 Central and local government 2 284 278 5 746 8 309 Other sectors 22 594 4 175 79 601 106 370 Total customers, nominal amount after individual impairment 714 644 86 996 383 845 1 185 485 – Collective impairment, customers 1 867 - - 1 867 + Other adjustments 966 (162) - 804 Loans to customers 713 743 86 834 383 845 1 184 422 Credit institutions, nominal amount after individual impairment 208 403 4 684 24 062 237 149 + Other adjustments 243 0 - 243 Loans to and due from credit institutions 208 646 4 684 24 062 237 392 Loans and commitments as at 31 December 2011 DNB Bank ASA
Loans and Unutilised Total loans andAmounts in NOK million receivables Guarantees credit lines commitments Private individuals 117 734 219 56 019 173 972 Transportation by sea and pipelines and vessel construction 143 150 10 963 40 646 194 758 Real estate 142 981 2 872 23 287 169 140 Manufacturing 44 418 13 741 49 003 107 162 Services 77 172 5 007 33 009 115 189 Trade 30 522 4 337 25 835 60 693 Oil and gas 24 501 14 357 42 468 81 326 Transportation and communication 28 081 3 962 18 310 50 353 Building and construction 35 395 10 925 17 193 63 513 Power and water supply 25 857 15 933 25 673 67 463 Seafood 13 068 260 5 727 19 055 Hotels and restaurants 2 661 223 834 3 718 Agriculture and forestry 6 504 49 1 274 7 826 Central and local government 3 326 1 839 3 324 8 489 Other sectors 17 722 6 045 32 904 56 671 Total customers, nominal amount after individual impairment 713 089 90 733 375 505 1 179 327 – Collective impairment, customers 1 424 - - 1 424 + Other adjustments 302 (87) - 216 Loans to customers 711 966 90 646 375 505 1 178 118 Credit institutions, nominal amount after individual impairment 193 048 4 856 68 111 266 015 + Other adjustments 331 0 - 331 Loans to and due from credit institutions 193 379 4 856 68 111 266 346
1) The breakdown into principal customer groups is based on standardised sector and industry categories set up by Statistics Norway.
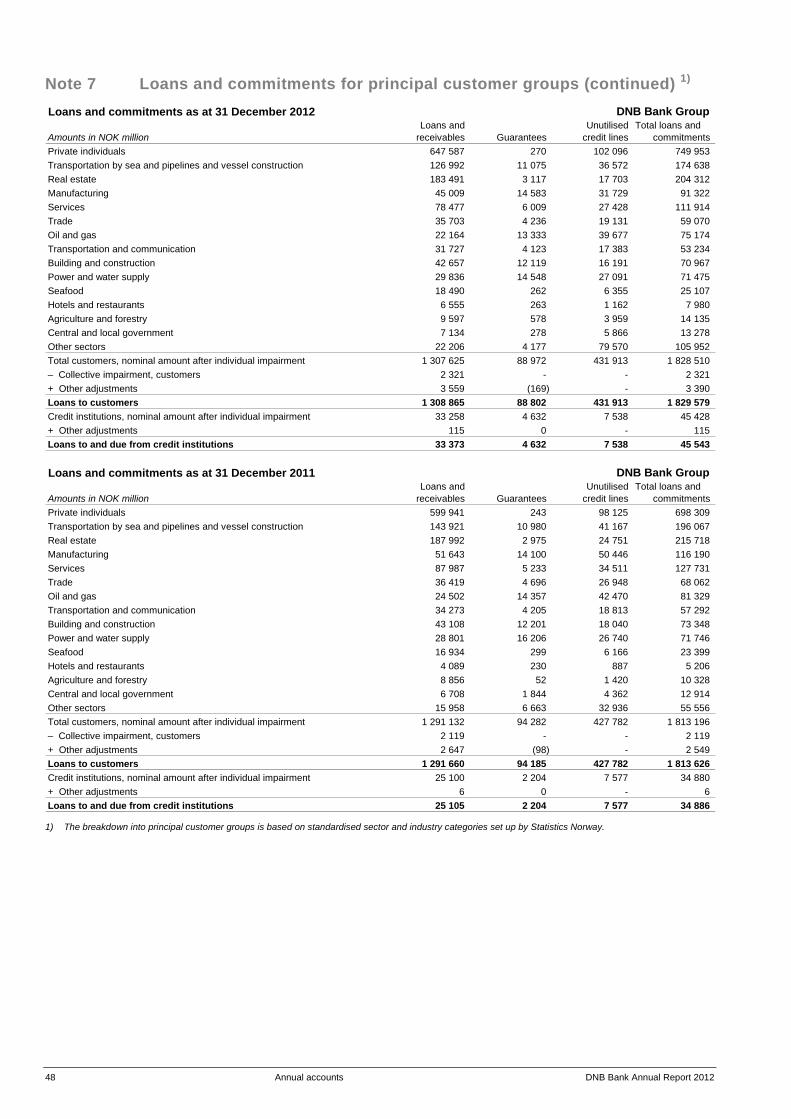
48 Annual accounts DNB Bank Annual Report 2012
Note 7 Loans and commitments for principal customer groups (continued) 1) Loans and commitments as at 31 December 2012 DNB Bank Group
Loans and Unutilised Total loans andAmounts in NOK million receivables Guarantees credit lines commitments Private individuals 647 587 270 102 096 749 953 Transportation by sea and pipelines and vessel construction 126 992 11 075 36 572 174 638 Real estate 183 491 3 117 17 703 204 312 Manufacturing 45 009 14 583 31 729 91 322 Services 78 477 6 009 27 428 111 914 Trade 35 703 4 236 19 131 59 070 Oil and gas 22 164 13 333 39 677 75 174 Transportation and communication 31 727 4 123 17 383 53 234 Building and construction 42 657 12 119 16 191 70 967 Power and water supply 29 836 14 548 27 091 71 475 Seafood 18 490 262 6 355 25 107 Hotels and restaurants 6 555 263 1 162 7 980 Agriculture and forestry 9 597 578 3 959 14 135 Central and local government 7 134 278 5 866 13 278 Other sectors 22 206 4 177 79 570 105 952 Total customers, nominal amount after individual impairment 1 307 625 88 972 431 913 1 828 510 – Collective impairment, customers 2 321 - - 2 321 + Other adjustments 3 559 (169) - 3 390 Loans to customers 1 308 865 88 802 431 913 1 829 579 Credit institutions, nominal amount after individual impairment 33 258 4 632 7 538 45 428 + Other adjustments 115 0 - 115 Loans to and due from credit institutions 33 373 4 632 7 538 45 543 Loans and commitments as at 31 December 2011 DNB Bank Group
Loans and Unutilised Total loans andAmounts in NOK million receivables Guarantees credit lines commitments Private individuals 599 941 243 98 125 698 309 Transportation by sea and pipelines and vessel construction 143 921 10 980 41 167 196 067 Real estate 187 992 2 975 24 751 215 718 Manufacturing 51 643 14 100 50 446 116 190 Services 87 987 5 233 34 511 127 731 Trade 36 419 4 696 26 948 68 062 Oil and gas 24 502 14 357 42 470 81 329 Transportation and communication 34 273 4 205 18 813 57 292 Building and construction 43 108 12 201 18 040 73 348 Power and water supply 28 801 16 206 26 740 71 746 Seafood 16 934 299 6 166 23 399 Hotels and restaurants 4 089 230 887 5 206 Agriculture and forestry 8 856 52 1 420 10 328 Central and local government 6 708 1 844 4 362 12 914 Other sectors 15 958 6 663 32 936 55 556 Total customers, nominal amount after individual impairment 1 291 132 94 282 427 782 1 813 196 – Collective impairment, customers 2 119 - - 2 119 + Other adjustments 2 647 (98) - 2 549 Loans to customers 1 291 660 94 185 427 782 1 813 626 Credit institutions, nominal amount after individual impairment 25 100 2 204 7 577 34 880 + Other adjustments 6 0 - 6 Loans to and due from credit institutions 25 105 2 204 7 577 34 886
1) The breakdown into principal customer groups is based on standardised sector and industry categories set up by Statistics Norway.
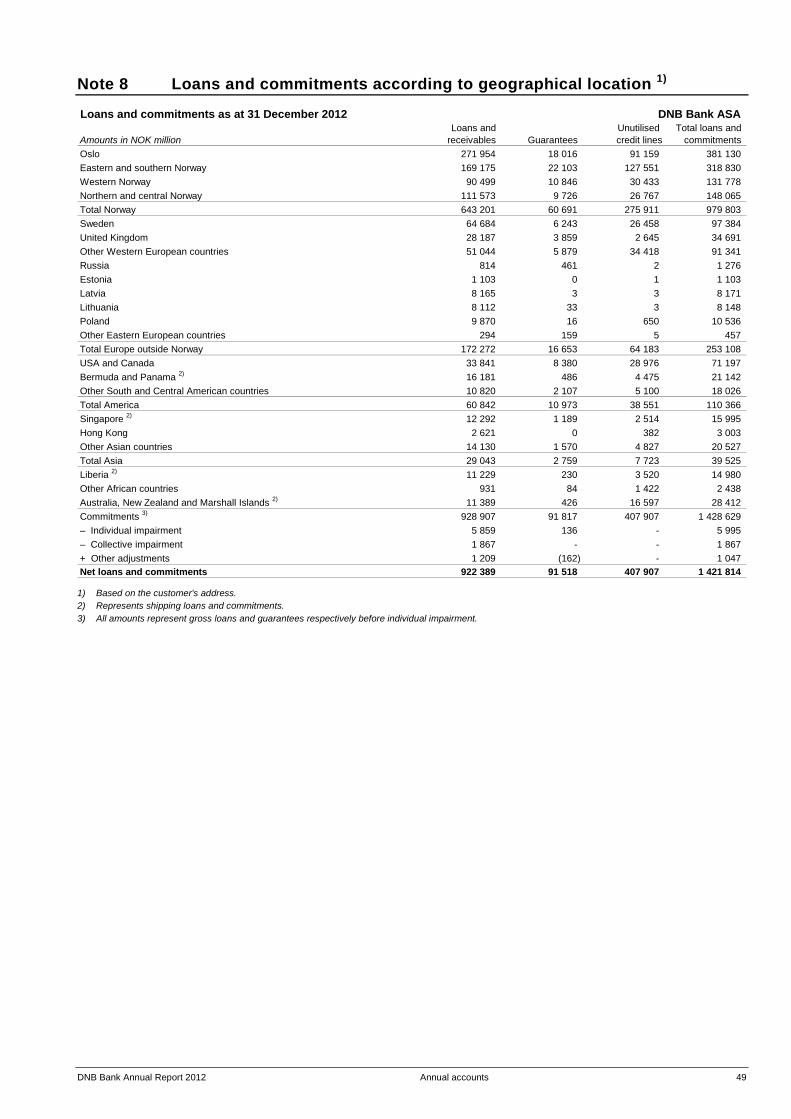
DNB Bank Annual Report 2012 Annual accounts 49
Note 8 Loans and commitments according to geographical location 1)
Loans and commitments as at 31 December 2012 DNB Bank ASA Loans and Unutilised Total loans and
Amounts in NOK million receivables Guarantees credit lines commitments Oslo 271 954 18 016 91 159 381 130 Eastern and southern Norway 169 175 22 103 127 551 318 830 Western Norway 90 499 10 846 30 433 131 778 Northern and central Norway 111 573 9 726 26 767 148 065 Total Norway 643 201 60 691 275 911 979 803 Sweden 64 684 6 243 26 458 97 384 United Kingdom 28 187 3 859 2 645 34 691 Other Western European countries 51 044 5 879 34 418 91 341 Russia 814 461 2 1 276 Estonia 1 103 0 1 1 103 Latvia 8 165 3 3 8 171 Lithuania 8 112 33 3 8 148 Poland 9 870 16 650 10 536 Other Eastern European countries 294 159 5 457 Total Europe outside Norway 172 272 16 653 64 183 253 108 USA and Canada 33 841 8 380 28 976 71 197 Bermuda and Panama 2) 16 181 486 4 475 21 142 Other South and Central American countries 10 820 2 107 5 100 18 026 Total America 60 842 10 973 38 551 110 366 Singapore 2) 12 292 1 189 2 514 15 995 Hong Kong 2 621 0 382 3 003 Other Asian countries 14 130 1 570 4 827 20 527 Total Asia 29 043 2 759 7 723 39 525 Liberia 2) 11 229 230 3 520 14 980 Other African countries 931 84 1 422 2 438 Australia, New Zealand and Marshall Islands 2) 11 389 426 16 597 28 412 Commitments 3) 928 907 91 817 407 907 1 428 629 – Individual impairment 5 859 136 - 5 995 – Collective impairment 1 867 - - 1 867 + Other adjustments 1 209 (162) - 1 047 Net loans and commitments 922 389 91 518 407 907 1 421 814
1) Based on the customer's address. 2) Represents shipping loans and commitments. 3) All amounts represent gross loans and guarantees respectively before individual impairment.
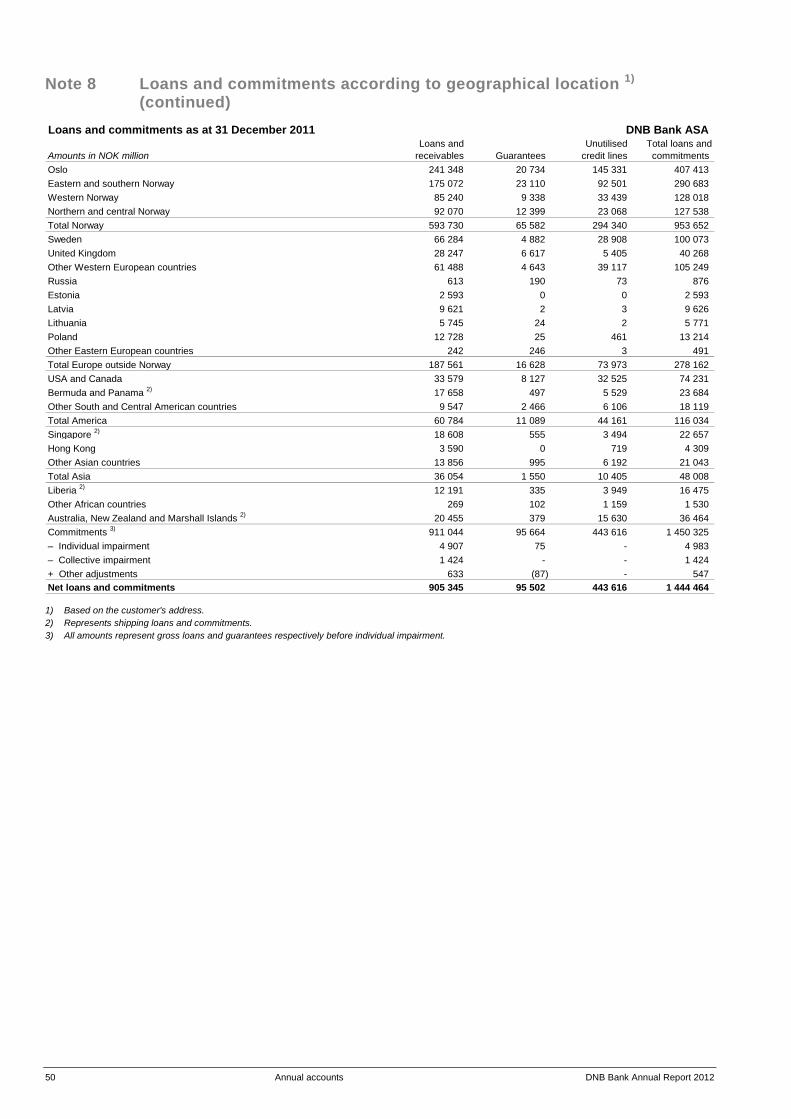
50 Annual accounts DNB Bank Annual Report 2012
Note 8 Loans and commitments according to geographical location 1) (continued)
Loans and commitments as at 31 December 2011 DNB Bank ASA Loans and Unutilised Total loans and
Amounts in NOK million receivables Guarantees credit lines commitments Oslo 241 348 20 734 145 331 407 413 Eastern and southern Norway 175 072 23 110 92 501 290 683 Western Norway 85 240 9 338 33 439 128 018 Northern and central Norway 92 070 12 399 23 068 127 538 Total Norway 593 730 65 582 294 340 953 652 Sweden 66 284 4 882 28 908 100 073 United Kingdom 28 247 6 617 5 405 40 268 Other Western European countries 61 488 4 643 39 117 105 249 Russia 613 190 73 876 Estonia 2 593 0 0 2 593 Latvia 9 621 2 3 9 626 Lithuania 5 745 24 2 5 771 Poland 12 728 25 461 13 214 Other Eastern European countries 242 246 3 491 Total Europe outside Norway 187 561 16 628 73 973 278 162 USA and Canada 33 579 8 127 32 525 74 231 Bermuda and Panama 2) 17 658 497 5 529 23 684 Other South and Central American countries 9 547 2 466 6 106 18 119 Total America 60 784 11 089 44 161 116 034 Singapore 2) 18 608 555 3 494 22 657 Hong Kong 3 590 0 719 4 309 Other Asian countries 13 856 995 6 192 21 043 Total Asia 36 054 1 550 10 405 48 008 Liberia 2) 12 191 335 3 949 16 475 Other African countries 269 102 1 159 1 530 Australia, New Zealand and Marshall Islands 2) 20 455 379 15 630 36 464 Commitments 3) 911 044 95 664 443 616 1 450 325 – Individual impairment 4 907 75 - 4 983 – Collective impairment 1 424 - - 1 424 + Other adjustments 633 (87) - 547 Net loans and commitments 905 345 95 502 443 616 1 444 464
1) Based on the customer's address. 2) Represents shipping loans and commitments. 3) All amounts represent gross loans and guarantees respectively before individual impairment.

DNB Bank Annual Report 2012 Annual accounts 51
Note 8 Loans and commitments according to geographical location 1) (continued)
Loans and commitments as at 31 December 2012 DNB Bank Group Loans and Unutilised Total loans and
Amounts in NOK million receivables Guarantees credit lines commitments Oslo 247 852 18 016 84 096 349 963 Eastern and southern Norway 437 406 22 103 148 392 607 902 Western Norway 167 532 10 846 37 799 216 176 Northern and central Norway 182 526 9 726 31 599 223 851 Total Norway 1 035 316 60 691 301 885 1 397 891 Sweden 63 410 6 243 26 472 96 125 United Kingdom 27 985 3 859 2 666 34 511 Other Western European countries 48 371 5 894 35 183 89 448 Russia 1 950 518 183 2 651 Estonia 3 581 61 135 3 778 Latvia 15 847 503 1 345 17 695 Lithuania 20 340 732 1 138 22 210 Poland 18 797 610 2 115 21 522 Other Eastern European countries 323 159 10 492 Total Europe outside Norway 200 606 18 579 69 247 288 432 USA and Canada 34 111 8 380 29 065 71 557 Bermuda and Panama 2) 16 181 486 4 475 21 142 Other South and Central American countries 10 853 2 107 5 108 18 068 Total America 61 145 10 973 38 649 110 767 Singapore 2) 12 663 1 189 2 547 16 399 Hong Kong 2 643 0 388 3 030 Other Asian countries 14 044 1 570 5 026 20 641 Total Asia 29 350 2 759 7 961 40 070 Liberia 2) 11 229 230 3 520 14 980 Other African countries 970 84 1 428 2 483 Australia, New Zealand and Marshall Islands 2) 11 600 426 16 762 28 788 Commitments 3) 1 350 217 93 742 439 451 1 883 409 – Individual impairment 9 333 139 - 9 472 – Collective impairment 2 321 - - 2 321 + Other adjustments 3 674 (169) - 3 505 Net loans and commitments 1 342 237 93 434 439 451 1 875 122
1) Based on the customer's address. 2) Represents shipping loans and commitments. 3) All amounts represent gross loans and guarantees respectively before individual impairment.
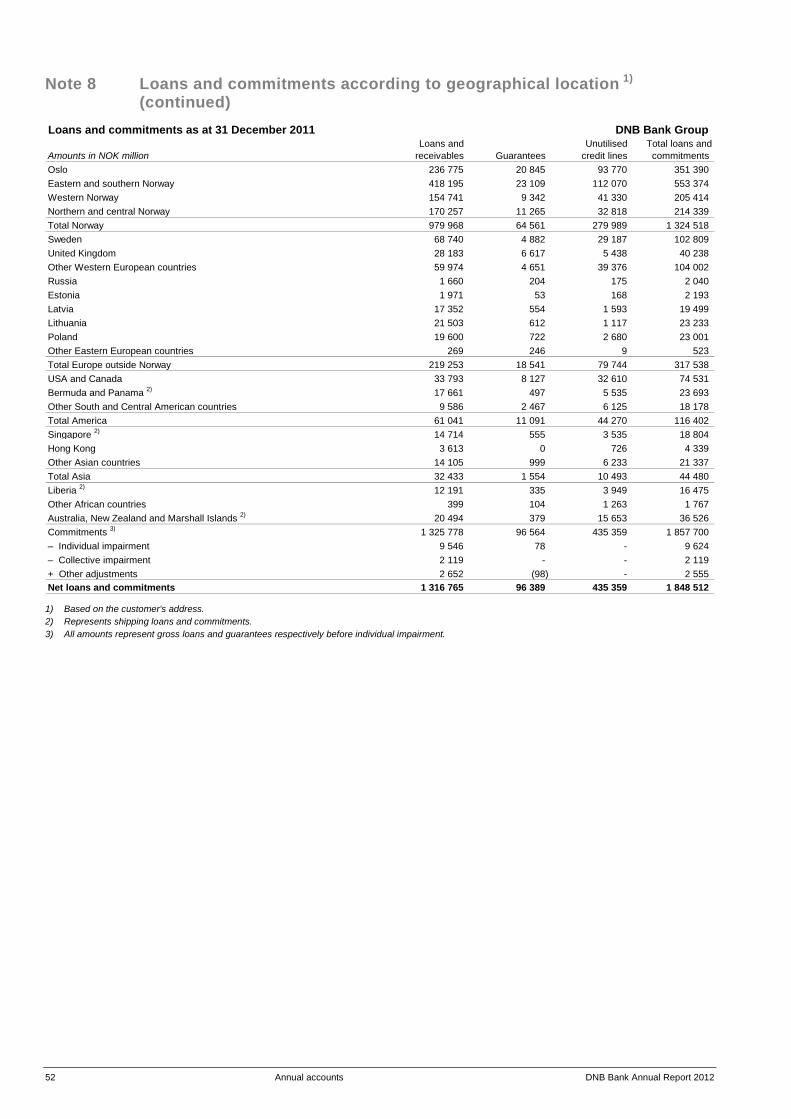
52 Annual accounts DNB Bank Annual Report 2012
Note 8 Loans and commitments according to geographical location 1) (continued)
Loans and commitments as at 31 December 2011 DNB Bank Group Loans and Unutilised Total loans and
Amounts in NOK million receivables Guarantees credit lines commitments Oslo 236 775 20 845 93 770 351 390 Eastern and southern Norway 418 195 23 109 112 070 553 374 Western Norway 154 741 9 342 41 330 205 414 Northern and central Norway 170 257 11 265 32 818 214 339 Total Norway 979 968 64 561 279 989 1 324 518 Sweden 68 740 4 882 29 187 102 809 United Kingdom 28 183 6 617 5 438 40 238 Other Western European countries 59 974 4 651 39 376 104 002 Russia 1 660 204 175 2 040 Estonia 1 971 53 168 2 193 Latvia 17 352 554 1 593 19 499 Lithuania 21 503 612 1 117 23 233 Poland 19 600 722 2 680 23 001 Other Eastern European countries 269 246 9 523 Total Europe outside Norway 219 253 18 541 79 744 317 538 USA and Canada 33 793 8 127 32 610 74 531 Bermuda and Panama 2) 17 661 497 5 535 23 693 Other South and Central American countries 9 586 2 467 6 125 18 178 Total America 61 041 11 091 44 270 116 402 Singapore 2) 14 714 555 3 535 18 804 Hong Kong 3 613 0 726 4 339 Other Asian countries 14 105 999 6 233 21 337 Total Asia 32 433 1 554 10 493 44 480 Liberia 2) 12 191 335 3 949 16 475 Other African countries 399 104 1 263 1 767 Australia, New Zealand and Marshall Islands 2) 20 494 379 15 653 36 526 Commitments 3) 1 325 778 96 564 435 359 1 857 700 – Individual impairment 9 546 78 - 9 624 – Collective impairment 2 119 - - 2 119 + Other adjustments 2 652 (98) - 2 555 Net loans and commitments 1 316 765 96 389 435 359 1 848 512
1) Based on the customer's address. 2) Represents shipping loans and commitments. 3) All amounts represent gross loans and guarantees respectively before individual impairment.
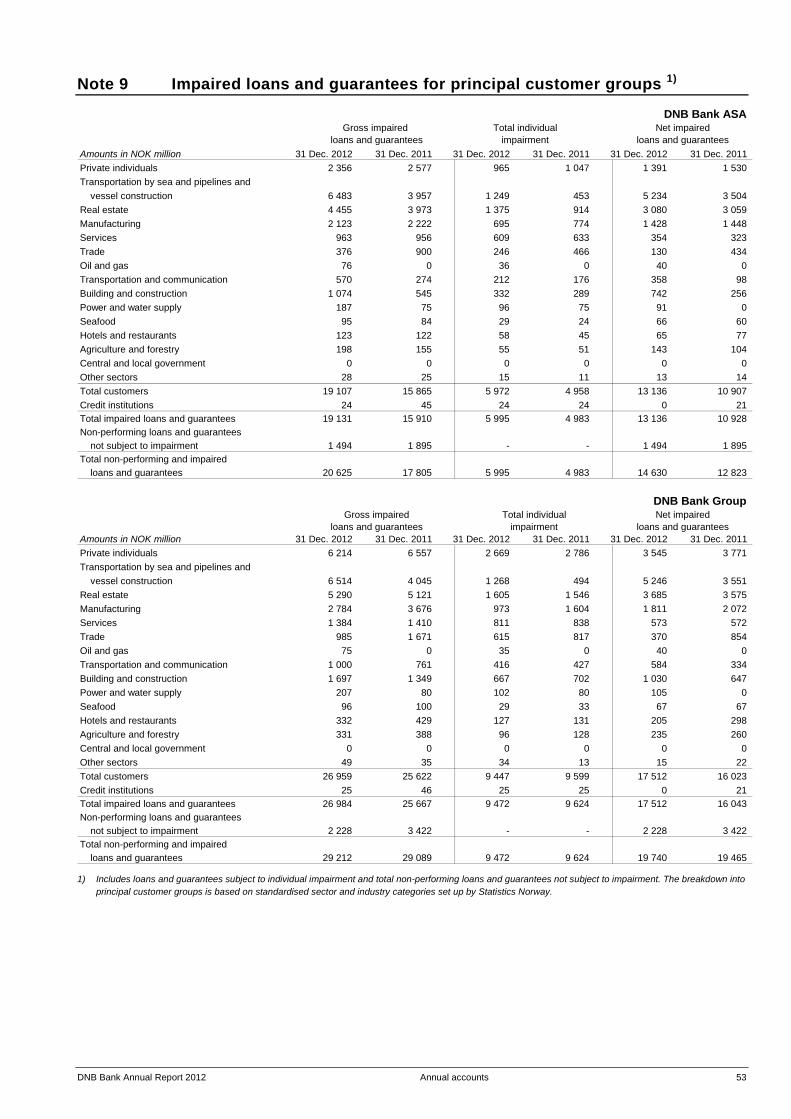
DNB Bank Annual Report 2012 Annual accounts 53
Note 9 Impaired loans and guarantees for principal customer groups 1)
DNB Bank ASA
Amounts in NOK million 31 Dec. 2012 31 Dec. 2011 31 Dec. 2012 31 Dec. 2011 31 Dec. 2012 31 Dec. 2011 Private individuals 2 356 2 577 965 1 047 1 391 1 530 Transportation by sea and pipelines and
vessel construction 6 483 3 957 1 249 453 5 234 3 504 Real estate 4 455 3 973 1 375 914 3 080 3 059 Manufacturing 2 123 2 222 695 774 1 428 1 448 Services 963 956 609 633 354 323 Trade 376 900 246 466 130 434 Oil and gas 76 0 36 0 40 0 Transportation and communication 570 274 212 176 358 98 Building and construction 1 074 545 332 289 742 256 Power and water supply 187 75 96 75 91 0 Seafood 95 84 29 24 66 60 Hotels and restaurants 123 122 58 45 65 77 Agriculture and forestry 198 155 55 51 143 104 Central and local government 0 0 0 0 0 0 Other sectors 28 25 15 11 13 14 Total customers 19 107 15 865 5 972 4 958 13 136 10 907 Credit institutions 24 45 24 24 0 21 Total impaired loans and guarantees 19 131 15 910 5 995 4 983 13 136 10 928 Non-performing loans and guarantees
not subject to impairment 1 494 1 895 - - 1 494 1 895 Total non-performing and impaired
loans and guarantees 20 625 17 805 5 995 4 983 14 630 12 823
Gross impaired loans and guarantees
Total individualimpairment
Net impairedloans and guarantees
DNB Bank Group
Amounts in NOK million 31 Dec. 2012 31 Dec. 2011 31 Dec. 2012 31 Dec. 2011 31 Dec. 2012 31 Dec. 2011 Private individuals 6 214 6 557 2 669 2 786 3 545 3 771 Transportation by sea and pipelines and
vessel construction 6 514 4 045 1 268 494 5 246 3 551 Real estate 5 290 5 121 1 605 1 546 3 685 3 575 Manufacturing 2 784 3 676 973 1 604 1 811 2 072 Services 1 384 1 410 811 838 573 572 Trade 985 1 671 615 817 370 854 Oil and gas 75 0 35 0 40 0 Transportation and communication 1 000 761 416 427 584 334 Building and construction 1 697 1 349 667 702 1 030 647 Power and water supply 207 80 102 80 105 0 Seafood 96 100 29 33 67 67 Hotels and restaurants 332 429 127 131 205 298 Agriculture and forestry 331 388 96 128 235 260 Central and local government 0 0 0 0 0 0 Other sectors 49 35 34 13 15 22 Total customers 26 959 25 622 9 447 9 599 17 512 16 023 Credit institutions 25 46 25 25 0 21 Total impaired loans and guarantees 26 984 25 667 9 472 9 624 17 512 16 043 Non-performing loans and guarantees
not subject to impairment 2 228 3 422 - - 2 228 3 422 Total non-performing and impaired
loans and guarantees 29 212 29 089 9 472 9 624 19 740 19 465
loans and guaranteesNet impairedGross impaired
loans and guaranteesTotal individual
impairment
1) Includes loans and guarantees subject to individual impairment and total non-performing loans and guarantees not subject to impairment. The breakdown into principal customer groups is based on standardised sector and industry categories set up by Statistics Norway.
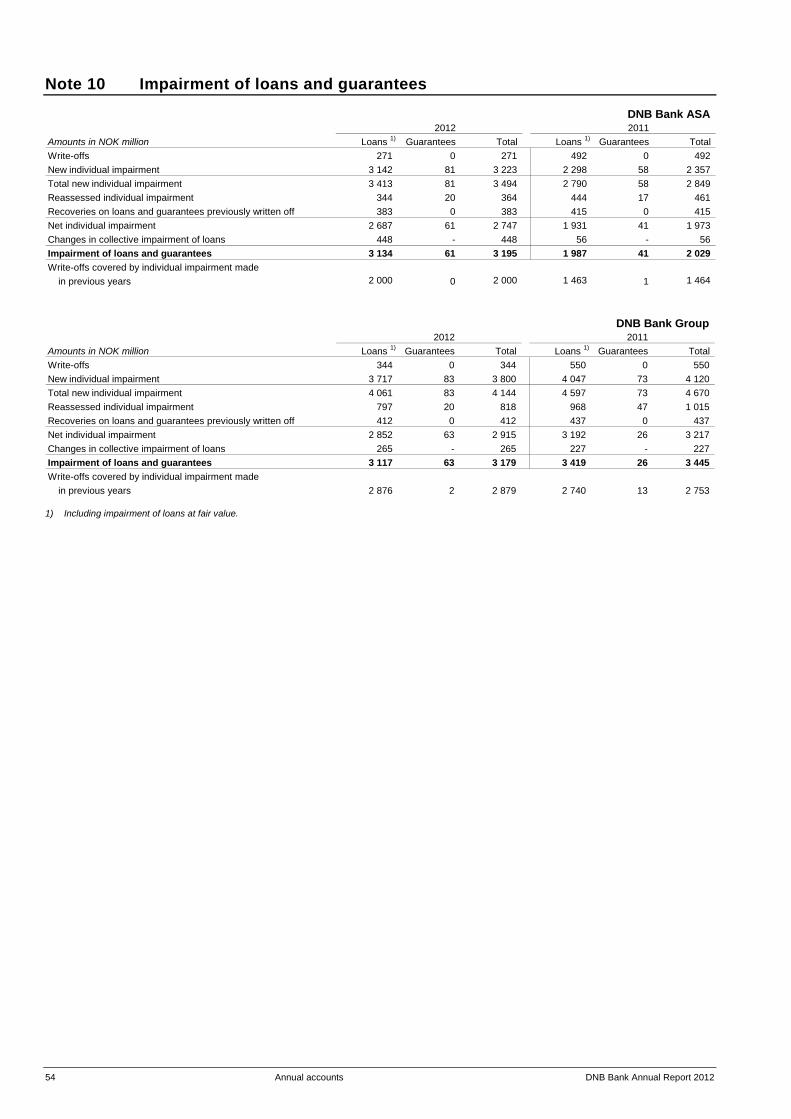
54 Annual accounts DNB Bank Annual Report 2012
Note 10 Impairment of loans and guarantees
DNB Bank ASA 2012 2011
Amounts in NOK million Loans 1) Guarantees Total Loans 1) Guarantees Total Write-offs 271 0 271 492 0 492 New individual impairment 3 142 81 3 223 2 298 58 2 357 Total new individual impairment 3 413 81 3 494 2 790 58 2 849 Reassessed individual impairment 344 20 364 444 17 461 Recoveries on loans and guarantees previously written off 383 0 383 415 0 415 Net individual impairment 2 687 61 2 747 1 931 41 1 973 Changes in collective impairment of loans 448 - 448 56 - 56 Impairment of loans and guarantees 3 134 61 3 195 1 987 41 2 029 Write-offs covered by individual impairment made
in previous years 2 000 0 2 000 1 463 1 1 464
DNB Bank Group 2012 2011
Amounts in NOK million Loans 1) Guarantees Total Loans 1) Guarantees Total Write-offs 344 0 344 550 0 550 New individual impairment 3 717 83 3 800 4 047 73 4 120 Total new individual impairment 4 061 83 4 144 4 597 73 4 670 Reassessed individual impairment 797 20 818 968 47 1 015 Recoveries on loans and guarantees previously written off 412 0 412 437 0 437 Net individual impairment 2 852 63 2 915 3 192 26 3 217 Changes in collective impairment of loans 265 - 265 227 - 227 Impairment of loans and guarantees 3 117 63 3 179 3 419 26 3 445 Write-offs covered by individual impairment made
in previous years 2 876 2 2 879 2 740 13 2 753 1) Including impairment of loans at fair value.

DNB Bank Annual Report 2012 Annual accounts 55
Note 11 Impairment of loans and guarantees for principal customer groups 1)
DNB Bank ASA
Recoveries on Recoveries on loans and loans and
New Reassessed guarantees New Reassessed guarantees individual individual previously Net individual individual previously Net
Amounts in NOK million impairment impairment written off impairment impairment impairment written off impairment
Private individuals 688 8 358 321 742 6 347 389 Transportation by sea and pipelines
and wessel construction 1 128 0 2 1 125 409 77 4 327 Real estate 740 147 6 586 528 81 11 435 Manufacturing 97 89 1 7 125 28 1 96 Services 251 41 3 206 136 51 3 82 Trade 121 25 4 92 314 145 4 165 Oil and gas 35 0 0 35 0 0 0 0 Transportation and communication 88 2 3 84 32 20 6 6 Building and construction 166 26 2 138 467 25 5 438 Power and water supply 98 0 0 98 2 8 0 (6) Seafood 7 1 0 6 19 1 0 18 Hotels and restaurants 29 9 0 20 24 12 0 12 Agriculture and forestry 29 13 1 16 22 7 0 15 Central and local government 0 0 0 (0) 0 0 0 0 Other sectors 17 0 1 16 3 0 2 1 Total customers 3 494 362 383 2 749 2 823 461 385 1 978 Credit institutions 0 2 0 (2) 26 0 31 (5) Change in collective impairment of loans - - - 448 - - - 56 Impairment of loans and guarantees 3 494 364 383 3 195 2 849 461 415 2 029
Of which individual impairmentof guarantees 81 20 0 61 58 17 0 41
2012 2011
DNB Bank Group
Recoveries on Recoveries on loans and loans and
New Reassessed guarantees New Reassessed guarantees individual individual previously Net individual individual previously Net
Amounts in NOK million impairment impairment written off impairment impairment impairment written off impairment
Private individuals 1 072 68 378 626 1 758 225 360 1 174 Transportation by sea and pipelines
and wessel construction 1 146 1 2 1 142 417 77 4 336 Real estate 631 186 12 434 917 167 12 738 Manufacturing 147 217 2 (71) 281 109 1 171 Services 279 128 3 147 213 73 4 135 Trade 220 76 4 139 316 105 7 203 Oil and gas 35 0 0 35 1 0 0 1 Transportation and communication 121 22 3 96 74 52 7 15 Building and construction 269 58 3 208 527 105 5 416 Power and water supply 99 0 0 98 3 10 0 (7) Seafood 9 3 0 6 24 20 0 3 Hotels and restaurants 51 16 0 35 48 27 0 20 Agriculture and forestry 45 39 1 6 59 43 1 16 Central and local government 0 0 2 (2) 0 0 0 0 Other sectors 20 0 2 18 8 1 5 2 Total customers 4 144 816 412 2 917 4 644 1 015 406 3 222 Credit institutions 0 2 0 (2) 26 0 31 (5) Change in collective impairment of loans - - - 265 - - - 227 Impairment of loans and guarantees 4 144 818 412 3 179 4 670 1 015 437 3 445
Of which individual impairmentof guarantees 83 20 0 63 73 47 0 26
20112012
1) The breakdown into principal customer groups is based on standardised sector and industry categories set up by Statistics Norway.
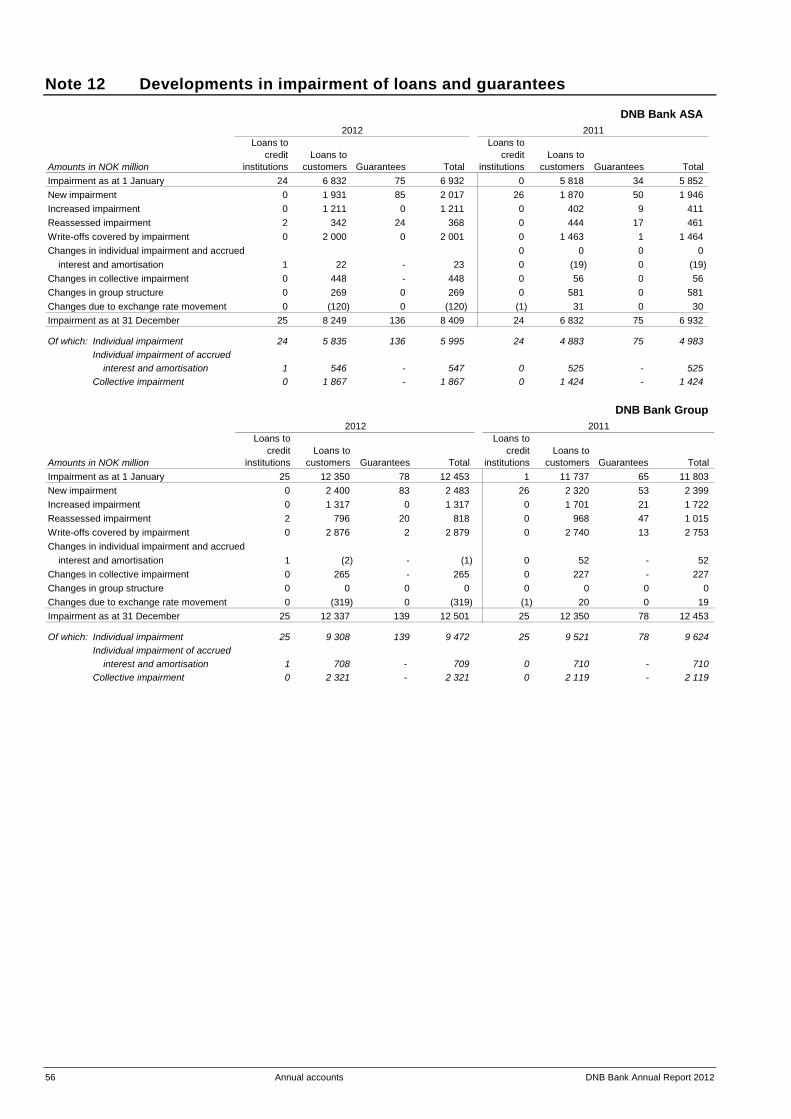
56 Annual accounts DNB Bank Annual Report 2012
Note 12 Developments in impairment of loans and guarantees
DNB Bank ASA
Loans to Loans to credit Loans to credit Loans to
Amounts in NOK million institutions customers Guarantees Total institutions customers Guarantees Total Impairment as at 1 January 24 6 832 75 6 932 0 5 818 34 5 852 New impairment 0 1 931 85 2 017 26 1 870 50 1 946 Increased impairment 0 1 211 0 1 211 0 402 9 411 Reassessed impairment 2 342 24 368 0 444 17 461 Write-offs covered by impairment 0 2 000 0 2 001 0 1 463 1 1 464 Changes in individual impairment and accrued 0 0 0 0
interest and amortisation 1 22 - 23 0 (19) 0 (19) Changes in collective impairment 0 448 - 448 0 56 0 56 Changes in group structure 0 269 0 269 0 581 0 581 Changes due to exchange rate movement 0 (120) 0 (120) (1) 31 0 30 Impairment as at 31 December 25 8 249 136 8 409 24 6 832 75 6 932
Of which: Individual impairment 24 5 835 136 5 995 24 4 883 75 4 983 Individual impairment of accrued
interest and amortisation 1 546 - 547 0 525 - 525 Collective impairment 0 1 867 - 1 867 0 1 424 - 1 424
2012 2011
DNB Bank Group
Loans to Loans to credit Loans to credit Loans to
Amounts in NOK million institutions customers Guarantees Total institutions customers Guarantees Total Impairment as at 1 January 25 12 350 78 12 453 1 11 737 65 11 803 New impairment 0 2 400 83 2 483 26 2 320 53 2 399 Increased impairment 0 1 317 0 1 317 0 1 701 21 1 722 Reassessed impairment 2 796 20 818 0 968 47 1 015 Write-offs covered by impairment 0 2 876 2 2 879 0 2 740 13 2 753 Changes in individual impairment and accrued
interest and amortisation 1 (2) - (1) 0 52 - 52 Changes in collective impairment 0 265 - 265 0 227 - 227 Changes in group structure 0 0 0 0 0 0 0 0 Changes due to exchange rate movement 0 (319) 0 (319) (1) 20 0 19 Impairment as at 31 December 25 12 337 139 12 501 25 12 350 78 12 453
Of which: Individual impairment 25 9 308 139 9 472 25 9 521 78 9 624 Individual impairment of accrued
interest and amortisation 1 708 - 709 0 710 - 710 Collective impairment 0 2 321 - 2 321 0 2 119 - 2 119
2012 2011
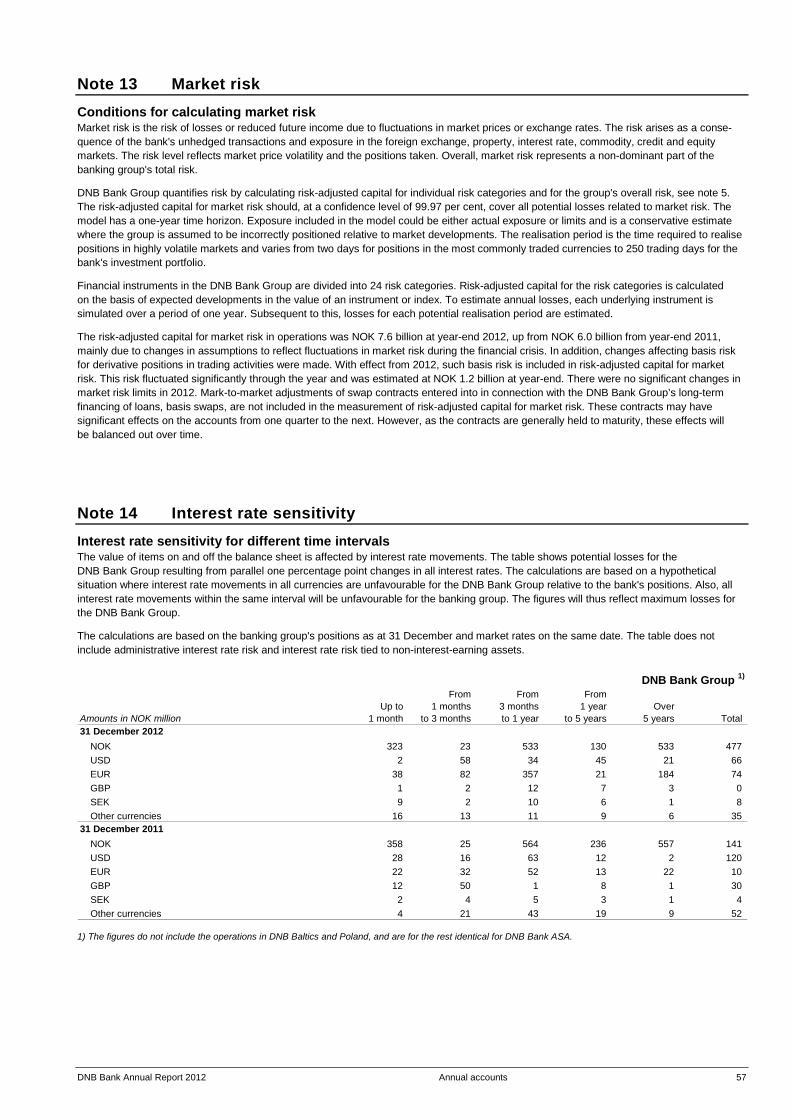
DNB Bank Annual Report 2012 Annual accounts 57
Note 13 Market risk Conditions for calculating market risk Market risk is the risk of losses or reduced future income due to fluctuations in market prices or exchange rates. The risk arises as a conse-quence of the bank's unhedged transactions and exposure in the foreign exchange, property, interest rate, commodity, credit and equity markets. The risk level reflects market price volatility and the positions taken. Overall, market risk represents a non-dominant part of the banking group's total risk. DNB Bank Group quantifies risk by calculating risk-adjusted capital for individual risk categories and for the group's overall risk, see note 5. The risk-adjusted capital for market risk should, at a confidence level of 99.97 per cent, cover all potential losses related to market risk. The model has a one-year time horizon. Exposure included in the model could be either actual exposure or limits and is a conservative estimate where the group is assumed to be incorrectly positioned relative to market developments. The realisation period is the time required to realise positions in highly volatile markets and varies from two days for positions in the most commonly traded currencies to 250 trading days for the bank's investment portfolio. Financial instruments in the DNB Bank Group are divided into 24 risk categories. Risk-adjusted capital for the risk categories is calculated on the basis of expected developments in the value of an instrument or index. To estimate annual losses, each underlying instrument is simulated over a period of one year. Subsequent to this, losses for each potential realisation period are estimated. The risk-adjusted capital for market risk in operations was NOK 7.6 billion at year-end 2012, up from NOK 6.0 billion from year-end 2011, mainly due to changes in assumptions to reflect fluctuations in market risk during the financial crisis. In addition, changes affecting basis risk for derivative positions in trading activities were made. With effect from 2012, such basis risk is included in risk-adjusted capital for market risk. This risk fluctuated significantly through the year and was estimated at NOK 1.2 billion at year-end. There were no significant changes in market risk limits in 2012. Mark-to-market adjustments of swap contracts entered into in connection with the DNB Bank Group’s long-term financing of loans, basis swaps, are not included in the measurement of risk-adjusted capital for market risk. These contracts may have significant effects on the accounts from one quarter to the next. However, as the contracts are generally held to maturity, these effects will be balanced out over time.
Note 14 Interest rate sensitivity Interest rate sensitivity for different time intervals The value of items on and off the balance sheet is affected by interest rate movements. The table shows potential losses for the DNB Bank Group resulting from parallel one percentage point changes in all interest rates. The calculations are based on a hypothetical situation where interest rate movements in all currencies are unfavourable for the DNB Bank Group relative to the bank's positions. Also, all interest rate movements within the same interval will be unfavourable for the banking group. The figures will thus reflect maximum losses for the DNB Bank Group. The calculations are based on the banking group's positions as at 31 December and market rates on the same date. The table does not include administrative interest rate risk and interest rate risk tied to non-interest-earning assets.
DNB Bank Group 1)
From From From Up to 1 months 3 months 1 year Over
Amounts in NOK million 1 month to 3 months to 1 year to 5 years 5 years Total 31 December 2012
NOK 323 23 533 130 533 477 USD 2 58 34 45 21 66 EUR 38 82 357 21 184 74 GBP 1 2 12 7 3 0 SEK 9 2 10 6 1 8 Other currencies 16 13 11 9 6 35
31 December 2011NOK 358 25 564 236 557 141 USD 28 16 63 12 2 120 EUR 22 32 52 13 22 10 GBP 12 50 1 8 1 30 SEK 2 4 5 3 1 4 Other currencies 4 21 43 19 9 52
1) The figures do not include the operations in DNB Baltics and Poland, and are for the rest identical for DNB Bank ASA.
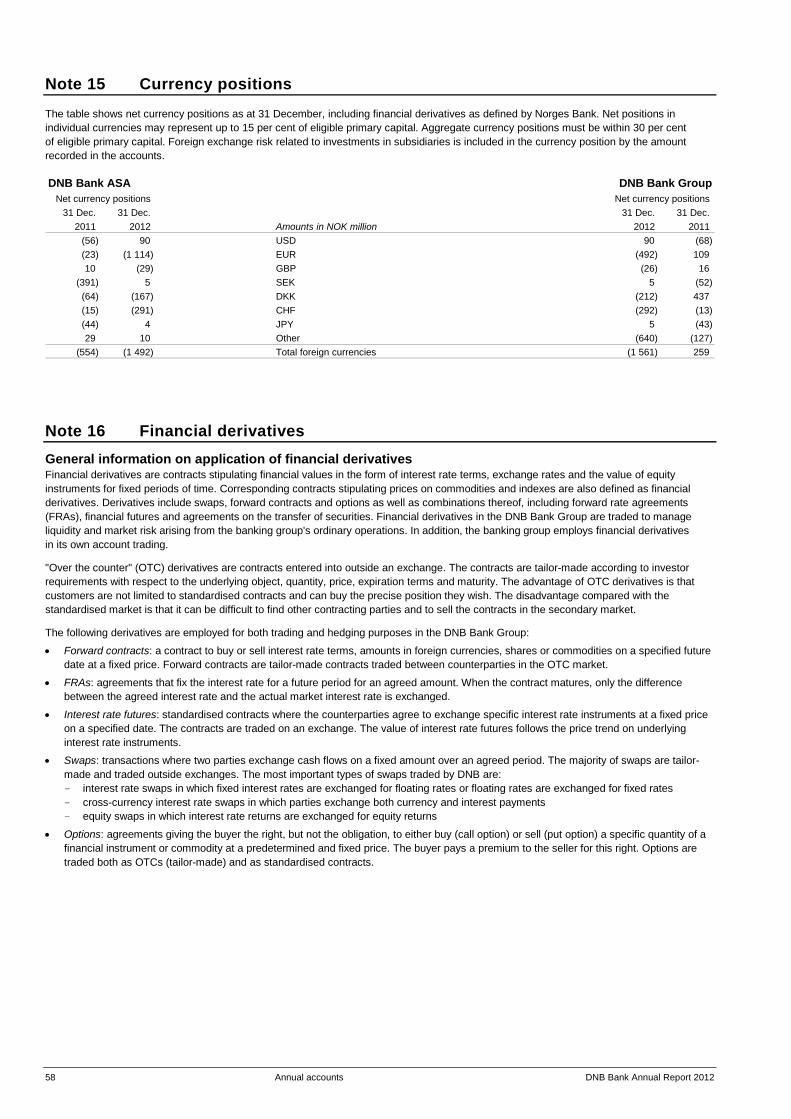
58 Annual accounts DNB Bank Annual Report 2012
Note 15 Currency positions
The table shows net currency positions as at 31 December, including financial derivatives as defined by Norges Bank. Net positions in individual currencies may represent up to 15 per cent of eligible primary capital. Aggregate currency positions must be within 30 per cent of eligible primary capital. Foreign exchange risk related to investments in subsidiaries is included in the currency position by the amount recorded in the accounts. DNB Bank ASA DNB Bank Group
Net currency positions Net currency positions 31 Dec. 31 Dec. 31 Dec. 31 Dec.
2011 2012 Amounts in NOK million 2012 2011 (56) 90 USD 90 (68) (23) (1 114) EUR (492) 109 10 (29) GBP (26) 16
(391) 5 SEK 5 (52) (64) (167) DKK (212) 437 (15) (291) CHF (292) (13) (44) 4 JPY 5 (43) 29 10 Other (640) (127)
(554) (1 492) Total foreign currencies (1 561) 259
Note 16 Financial derivatives General information on application of financial derivatives Financial derivatives are contracts stipulating financial values in the form of interest rate terms, exchange rates and the value of equity instruments for fixed periods of time. Corresponding contracts stipulating prices on commodities and indexes are also defined as financial derivatives. Derivatives include swaps, forward contracts and options as well as combinations thereof, including forward rate agreements (FRAs), financial futures and agreements on the transfer of securities. Financial derivatives in the DNB Bank Group are traded to manage liquidity and market risk arising from the banking group's ordinary operations. In addition, the banking group employs financial derivatives in its own account trading. "Over the counter" (OTC) derivatives are contracts entered into outside an exchange. The contracts are tailor-made according to investor requirements with respect to the underlying object, quantity, price, expiration terms and maturity. The advantage of OTC derivatives is that customers are not limited to standardised contracts and can buy the precise position they wish. The disadvantage compared with the standardised market is that it can be difficult to find other contracting parties and to sell the contracts in the secondary market. The following derivatives are employed for both trading and hedging purposes in the DNB Bank Group:
• Forward contracts: a contract to buy or sell interest rate terms, amounts in foreign currencies, shares or commodities on a specified future date at a fixed price. Forward contracts are tailor-made contracts traded between counterparties in the OTC market.
• FRAs: agreements that fix the interest rate for a future period for an agreed amount. When the contract matures, only the difference between the agreed interest rate and the actual market interest rate is exchanged.
• Interest rate futures: standardised contracts where the counterparties agree to exchange specific interest rate instruments at a fixed price on a specified date. The contracts are traded on an exchange. The value of interest rate futures follows the price trend on underlying interest rate instruments.
• Swaps: transactions where two parties exchange cash flows on a fixed amount over an agreed period. The majority of swaps are tailor-made and traded outside exchanges. The most important types of swaps traded by DNB are: - interest rate swaps in which fixed interest rates are exchanged for floating rates or floating rates are exchanged for fixed rates - cross-currency interest rate swaps in which parties exchange both currency and interest payments - equity swaps in which interest rate returns are exchanged for equity returns
• Options: agreements giving the buyer the right, but not the obligation, to either buy (call option) or sell (put option) a specific quantity of a financial instrument or commodity at a predetermined and fixed price. The buyer pays a premium to the seller for this right. Options are traded both as OTCs (tailor-made) and as standardised contracts.

DNB Bank Annual Report 2012 Annual accounts 59
Note 16 Financial derivatives (continued) The tables show nominal values on financial derivatives according to type of derivative as well as positive and negative market values. Positive market values are entered as assets in the balance sheet, whereas negative market values are entered as liabilities. See Accounting principles for a more detailed description of measurement of financial derivatives.
DNB Bank ASA
Total Positive Negative Total Positive Negative nominal market market nominal market market
Amounts in NOK million values value value values value value
Interest rate contractsFRA-contracts 1 836 268 1 212 1 551 2 178 901 1 517 1 993 Swaps 2 860 783 104 366 68 690 2 459 894 78 741 47 171 OTC options, bought and sold 66 566 837 589 70 874 225 126 Other OTC contracts 1 562 0 0 1 562 22 0 Total OTC derivatives 4 765 180 106 415 70 830 4 711 231 80 505 49 290 Exchange-traded contracts - futures, bought and sold 56 449 0 0 311 0 0 Total interest rate contracts 4 821 629 106 415 70 830 4 711 542 80 505 49 290
Foreign exchange contractsForward contracts 913 079 1 452 1 937 1 017 526 1 903 2 592 Swaps 915 975 33 267 47 931 831 342 45 247 56 833 OTC options, bought and sold 42 921 503 503 26 544 284 273 Total foreign exchange contracts 1 871 974 35 223 50 370 1 875 413 47 433 59 699
Equity-related contractsForward contracts 4 405 686 705 5 342 185 220 OTC options, bought and sold 1 696 286 57 4 239 83 73 Total OTC derivatives 6 102 972 762 9 581 268 293 Futures, bought and sold 584 15 8 748 0 0 Options, bought and sold 1 055 13 15 1 864 20 23 Total exchange-traded contracts 1 639 29 23 2 612 20 23 Total equity-related contracts 7 740 1 000 785 12 193 288 316 Equity related derivatives recorded as shareholdings 0 0 (230) (258)
Commodity-related contractsSwaps 64 709 2 153 1 827 53 097 1 882 1 700 Total commodity related contracts 64 709 2 153 1 827 53 097 1 882 1 700
Collaterals received/paidTotal collaterals received/paid (24 280) (31 160) (21 372) (22 540) Total financial derivatives 6 766 053 120 511 92 653 6 652 244 108 506 88 207
Of which: Applied for hedging purposes 70 419 11 673 1 336 39 508 2 690 1 476
- Interest rate swaps 10 705 598 1 312 456 - Interest rate and currency swaps 968 739 1 377 1 021
31 December 2012 31 December 2011

60 Annual accounts DNB Bank Annual Report 2012
Note 16 Financial derivatives (continued) DNB Bank Group
Total Positive Negative Total Positive Negative nominal market market nominal market market
Amounts in NOK million values value value values value value
Interest rate contractsFRA-contracts 1 835 276 1 212 1 551 2 179 282 1 519 1 993 Swaps 2 520 169 101 829 49 403 2 372 248 77 289 43 340 OTC options, bought and sold 68 697 858 607 75 113 245 155 Other OTC contracts 1 562 0 0 1 562 22 0 Total OTC derivatives 4 425 705 103 899 51 561 4 628 205 79 074 45 488 Exchange-traded contracts - futures, bought and sold 56 449 0 0 311 0 0 Total interest rate contracts 4 482 154 103 899 51 561 4 628 516 79 074 45 488
Foreign exchange contractsForward contracts 910 378 1 416 1 951 1 018 201 1 953 2 594 Swaps 674 973 11 197 37 728 624 225 34 383 35 557 OTC options, bought and sold 42 937 504 503 26 586 284 274 Total foreign exchange contracts 1 628 287 13 116 40 182 1 669 013 36 620 38 425
Equity-related contractsForward contracts 4 405 686 705 5 342 185 220 OTC options, bought and sold 1 741 286 56 4 336 83 72 Total OTC derivatives 6 146 972 761 9 679 268 292 Futures, bought and sold 584 15 8 748 0 0 Options, bought and sold 1 055 13 15 1 864 20 23 Total exchange-traded contracts 1 639 29 23 2 612 20 23 Total equity-related contracts 7 785 1 000 783 12 290 288 316 Equity related derivatives recorded as shareholdings 0 0 (230) (258)
Commodity-related contractsSwaps 64 722 2 154 1 827 52 996 1 883 1 700 Total commodity related contracts 64 722 2 154 1 827 52 996 1 883 1 700
Collaterals received/paidTotal collaterals received/paid (24 280) (31 160) (21 372) (22 540) Total financial derivatives 6 182 949 95 890 63 193 6 362 815 96 264 63 130
Of which: Applied for hedging purposes 345 282 31 531 2 149 244 619 11 479 1 498
- Interest rate swaps 28 670 964 10 097 462 - Interest rate and currency swaps 2 861 1 185 1 381 1 036
31 December 2012 31 December 2011
Use of financial derivatives in DNB Markets DNB Markets acts as market maker and is obliged to furnish both offer and bid prices for specified option, forward or futures series with a maximum differential between the offer and bid price, together with a minimum volume. Market makers always trade for their own account. The purpose of own account trading, in addition to being a market maker, is position taking, which means intentional risk-taking within the foreign exchange, interest rate and equity markets to achieve profits arising from favourable price, exchange rate and index fluctuations. Arbitrage, that is profit taking from fluctuations in prices, exchange rates and indices for the same product in various markets, is also part of own-account trading. Customer trading entails structuring and marketing financial derivatives for customers, enabling them to transfer, modify, take or reduce prevailing or expected risk. The majority of derivative transactions relate to customer trading. The DNB Bank Group uses interest rate and currency swaps to convert foreign currency borrowings into the desired currency. As a typical example, the bank raises a loan in euro, which is swapped to US dollars through a basis swap. In this case, the bank will pay a US dollar interest rate based on a swap curve and receive a euro interest rate reduced or increased by a margin. These derivatives are carried at fair value. There may be significant variations in the value of the basis swaps from day to day, due to changes in basis swap spreads. This unhedged risk causes unrealised gains and losses. For the year 2012, there was a NOK 1 687 million decrease in value (negative effect on profits), compared with a NOK 3 031 million increase in value (positive effect on profits) in 2011. Use of financial derivatives in DNB Boligkreditt The purpose of employing financial derivatives in DNB Boligkreditt is to uncover and reduce foreign exchange and interest rate risk. Risk related to financial derivatives Derivatives are traded in portfolios which also include balance sheet products. The market risk on derivatives is handled, monitored and controlled as an integral part of the market risk of these portfolios. See notes 5 and 13. Derivatives are traded with many different counter-parties and most of these are also engaged in other types of business with DNB. The credit risk arising in connection with derivatives trading is included in the total credit risk of the DNB Bank Group. Netting agreements or bilateral agreements on collateral are entered into with a number of counterparties, thus reducing credit risk. The authorities' capital adequacy requirements take into account such agreements, resulting in a reduction of capital adequacy requirements. See note 6 Credit risk for a description of counter-party risk.
DNB Bank Annual Report 2012 Annual accounts 61
Note 17 Liquidity risk
Liquidity risk is the risk that the DNB Bank Group will be unable to meet its payment obligations. Overall liquidity management in the banking group implies that DNB Bank ASA is responsible for funding domestic subsidiaries, as well as international branches and subsidiaries. Liquidity risk is managed and measured by means of various measurement techniques. The Board of Directors has approved internal limits which restrict the short-term maturity of liabilities within different time frames. The various maturities are subject to stress testing based on a bank-specific crisis and a systemic crisis and a combination thereof, and a contingency plan has been established to handle market events. In addition, limits have been approved for structural liquidity risk, which implies that lending to customers should largely be financed through customer deposits, subordinated capital and long-term funding. Senior bond debt and covered bonds are the major sources of long-term funding. The banking group's ratio of deposits to net loans was 62.6 per cent at year-end 2012, up from 58.1 per cent a year earlier. The ratio of deposits to net loans in DNB Bank ASA was 110.3 per cent at year-end 2012. Throughout 2012, the short-term funding markets were generally sound for banks with good credit ratings. DNB had ample access to short-term funding, and investors showed increasing interest in longer maturities during the second half of the year. The markets are less selective than before, and an increasing number of banks are regarded as financially strong and have good access to capital. DNB is still one of these banks. There was a very high level of activity in the long-term funding markets during the first half of the year, and banks with strong credit ratings had particularly good access to these markets. Prices of long-term funding gradually improved during the January through June period, partly due to the fact that measures launched by the European Central Bank, ECB, the so-called LTRO programme, provided European banks with considerable long-term funding. As the summer was approaching, there was increasing uncertainty regarding European sovereign debt, and very few transactions were completed during the second half of the year. Towards the end of the year, investors showed renewed interest in long-term funding, while the banks had a limited need for new funding. Thus, there was a reduction in funding costs in the second half of the year for both new covered bonds and senior bond debt. The DNB Bank Group completed most of its annual long-term funding activities during the first half of the year, but also raised some funding in the second half of the year to cover parts of its funding requirement for 2013. The average remaining term to maturity for the portfolio of senior bond debt was 4.6 years at year-end 2012, compared with 4.5 years a year earlier. The banking group aims to achieve a sound and stable maturity structure for funding over the next five years.
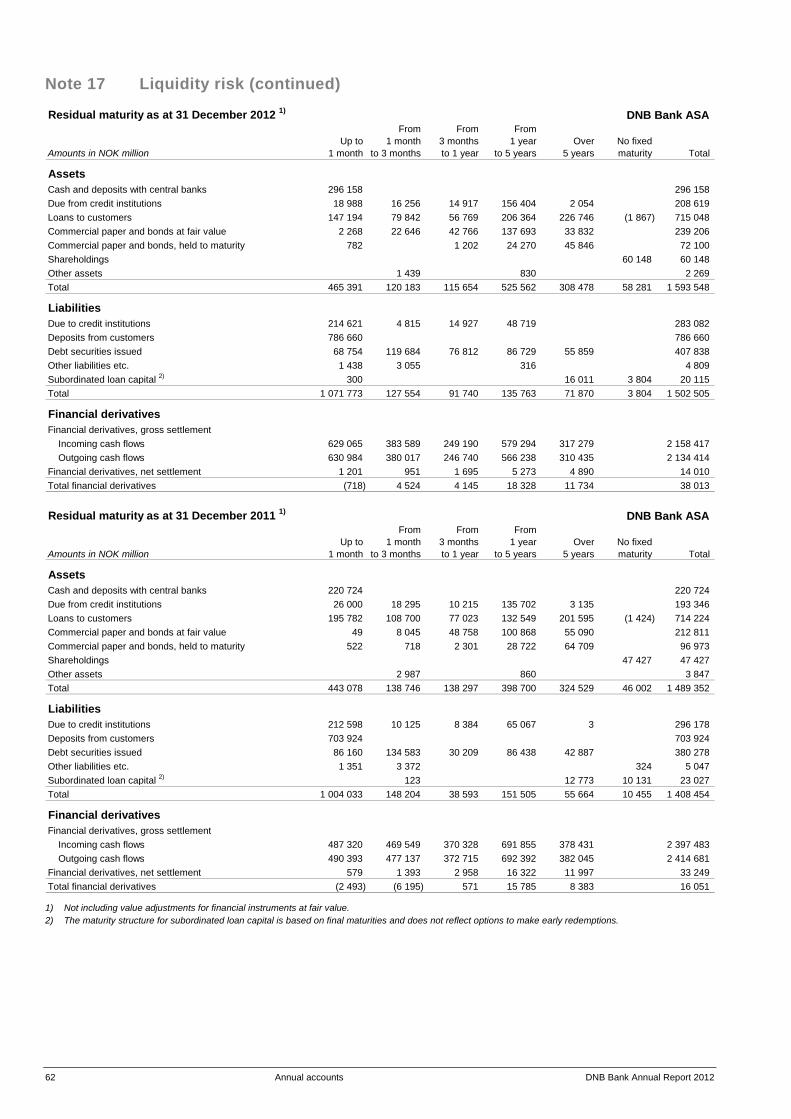
62 Annual accounts DNB Bank Annual Report 2012
Note 17 Liquidity risk (continued)
Residual maturity as at 31 December 2012 1) DNB Bank ASA From From From
Up to 1 month 3 months 1 year Over No fixed Amounts in NOK million 1 month to 3 months to 1 year to 5 years 5 years maturity Total
AssetsCash and deposits with central banks 296 158 296 158 Due from credit institutions 18 988 16 256 14 917 156 404 2 054 208 619 Loans to customers 147 194 79 842 56 769 206 364 226 746 (1 867) 715 048 Commercial paper and bonds at fair value 2 268 22 646 42 766 137 693 33 832 239 206 Commercial paper and bonds, held to maturity 782 1 202 24 270 45 846 72 100 Shareholdings 60 148 60 148 Other assets 1 439 830 2 269 Total 465 391 120 183 115 654 525 562 308 478 58 281 1 593 548
LiabilitiesDue to credit institutions 214 621 4 815 14 927 48 719 283 082 Deposits from customers 786 660 786 660 Debt securities issued 68 754 119 684 76 812 86 729 55 859 407 838 Other liabilities etc. 1 438 3 055 316 4 809 Subordinated loan capital 2) 300 16 011 3 804 20 115 Total 1 071 773 127 554 91 740 135 763 71 870 3 804 1 502 505
Financial derivativesFinancial derivatives, gross settlement
Incoming cash flows 629 065 383 589 249 190 579 294 317 279 2 158 417 Outgoing cash flows 630 984 380 017 246 740 566 238 310 435 2 134 414
Financial derivatives, net settlement 1 201 951 1 695 5 273 4 890 14 010 Total financial derivatives (718) 4 524 4 145 18 328 11 734 38 013 Residual maturity as at 31 December 2011 1) DNB Bank ASA
From From From Up to 1 month 3 months 1 year Over No fixed
Amounts in NOK million 1 month to 3 months to 1 year to 5 years 5 years maturity Total
AssetsCash and deposits with central banks 220 724 220 724 Due from credit institutions 26 000 18 295 10 215 135 702 3 135 193 346 Loans to customers 195 782 108 700 77 023 132 549 201 595 (1 424) 714 224 Commercial paper and bonds at fair value 49 8 045 48 758 100 868 55 090 212 811 Commercial paper and bonds, held to maturity 522 718 2 301 28 722 64 709 96 973 Shareholdings 47 427 47 427 Other assets 2 987 860 3 847 Total 443 078 138 746 138 297 398 700 324 529 46 002 1 489 352
LiabilitiesDue to credit institutions 212 598 10 125 8 384 65 067 3 296 178 Deposits from customers 703 924 703 924 Debt securities issued 86 160 134 583 30 209 86 438 42 887 380 278 Other liabilities etc. 1 351 3 372 324 5 047 Subordinated loan capital 2) 123 12 773 10 131 23 027 Total 1 004 033 148 204 38 593 151 505 55 664 10 455 1 408 454
Financial derivativesFinancial derivatives, gross settlement
Incoming cash flows 487 320 469 549 370 328 691 855 378 431 2 397 483 Outgoing cash flows 490 393 477 137 372 715 692 392 382 045 2 414 681
Financial derivatives, net settlement 579 1 393 2 958 16 322 11 997 33 249 Total financial derivatives (2 493) (6 195) 571 15 785 8 383 16 051
1) Not including value adjustments for financial instruments at fair value. 2) The maturity structure for subordinated loan capital is based on final maturities and does not reflect options to make early redemptions.
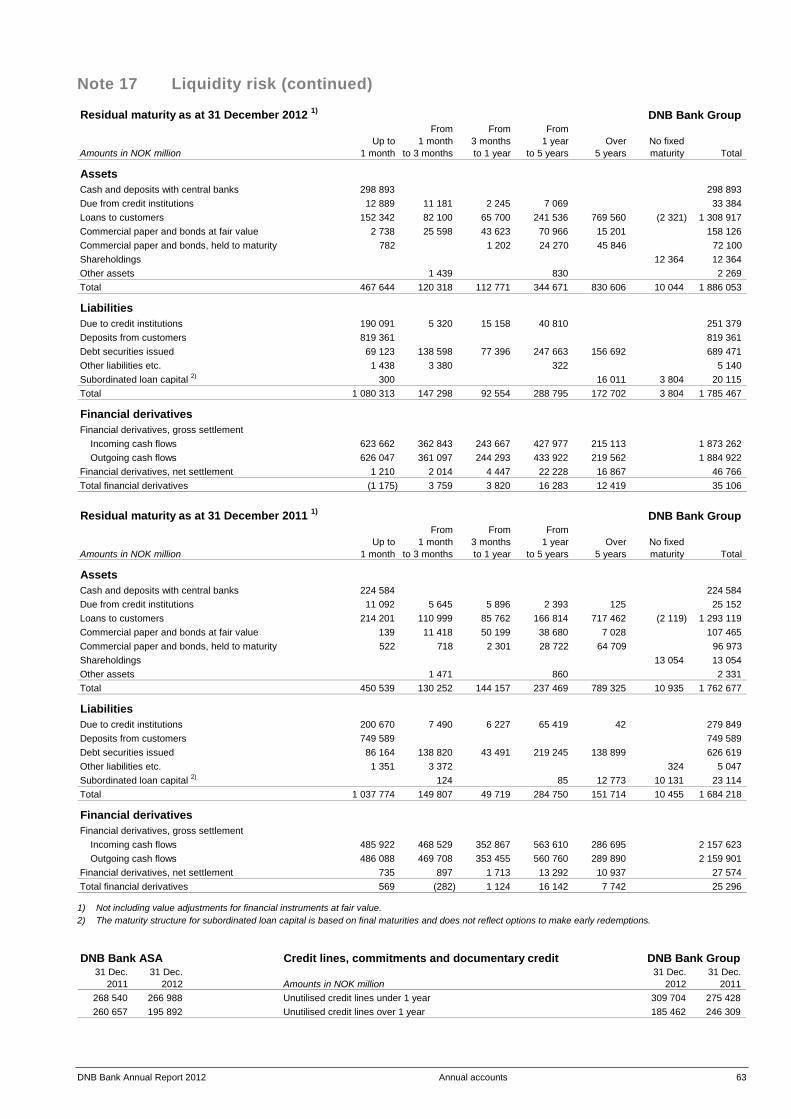
DNB Bank Annual Report 2012 Annual accounts 63
Note 17 Liquidity risk (continued)
Residual maturity as at 31 December 2012 1) DNB Bank Group From From From
Up to 1 month 3 months 1 year Over No fixed Amounts in NOK million 1 month to 3 months to 1 year to 5 years 5 years maturity Total
AssetsCash and deposits with central banks 298 893 298 893 Due from credit institutions 12 889 11 181 2 245 7 069 33 384 Loans to customers 152 342 82 100 65 700 241 536 769 560 (2 321) 1 308 917 Commercial paper and bonds at fair value 2 738 25 598 43 623 70 966 15 201 158 126 Commercial paper and bonds, held to maturity 782 1 202 24 270 45 846 72 100 Shareholdings 12 364 12 364 Other assets 1 439 830 2 269 Total 467 644 120 318 112 771 344 671 830 606 10 044 1 886 053
LiabilitiesDue to credit institutions 190 091 5 320 15 158 40 810 251 379 Deposits from customers 819 361 819 361 Debt securities issued 69 123 138 598 77 396 247 663 156 692 689 471 Other liabilities etc. 1 438 3 380 322 5 140 Subordinated loan capital 2) 300 16 011 3 804 20 115 Total 1 080 313 147 298 92 554 288 795 172 702 3 804 1 785 467
Financial derivativesFinancial derivatives, gross settlement
Incoming cash flows 623 662 362 843 243 667 427 977 215 113 1 873 262 Outgoing cash flows 626 047 361 097 244 293 433 922 219 562 1 884 922
Financial derivatives, net settlement 1 210 2 014 4 447 22 228 16 867 46 766 Total financial derivatives (1 175) 3 759 3 820 16 283 12 419 35 106 Residual maturity as at 31 December 2011 1) DNB Bank Group
From From From Up to 1 month 3 months 1 year Over No fixed
Amounts in NOK million 1 month to 3 months to 1 year to 5 years 5 years maturity Total
AssetsCash and deposits with central banks 224 584 224 584 Due from credit institutions 11 092 5 645 5 896 2 393 125 25 152 Loans to customers 214 201 110 999 85 762 166 814 717 462 (2 119) 1 293 119 Commercial paper and bonds at fair value 139 11 418 50 199 38 680 7 028 107 465 Commercial paper and bonds, held to maturity 522 718 2 301 28 722 64 709 96 973 Shareholdings 13 054 13 054 Other assets 1 471 860 2 331 Total 450 539 130 252 144 157 237 469 789 325 10 935 1 762 677
LiabilitiesDue to credit institutions 200 670 7 490 6 227 65 419 42 279 849 Deposits from customers 749 589 749 589 Debt securities issued 86 164 138 820 43 491 219 245 138 899 626 619 Other liabilities etc. 1 351 3 372 324 5 047 Subordinated loan capital 2) 124 85 12 773 10 131 23 114 Total 1 037 774 149 807 49 719 284 750 151 714 10 455 1 684 218
Financial derivativesFinancial derivatives, gross settlement
Incoming cash flows 485 922 468 529 352 867 563 610 286 695 2 157 623 Outgoing cash flows 486 088 469 708 353 455 560 760 289 890 2 159 901
Financial derivatives, net settlement 735 897 1 713 13 292 10 937 27 574 Total financial derivatives 569 (282) 1 124 16 142 7 742 25 296
1) Not including value adjustments for financial instruments at fair value. 2) The maturity structure for subordinated loan capital is based on final maturities and does not reflect options to make early redemptions. DNB Bank ASA Credit lines, commitments and documentary credit DNB Bank Group
31 Dec. 31 Dec. 31 Dec. 31 Dec. 2011 2012 Amounts in NOK million 2012 2011
268 540 266 988 Unutilised credit lines under 1 year 309 704 275 428 260 657 195 892 Unutilised credit lines over 1 year 185 462 246 309
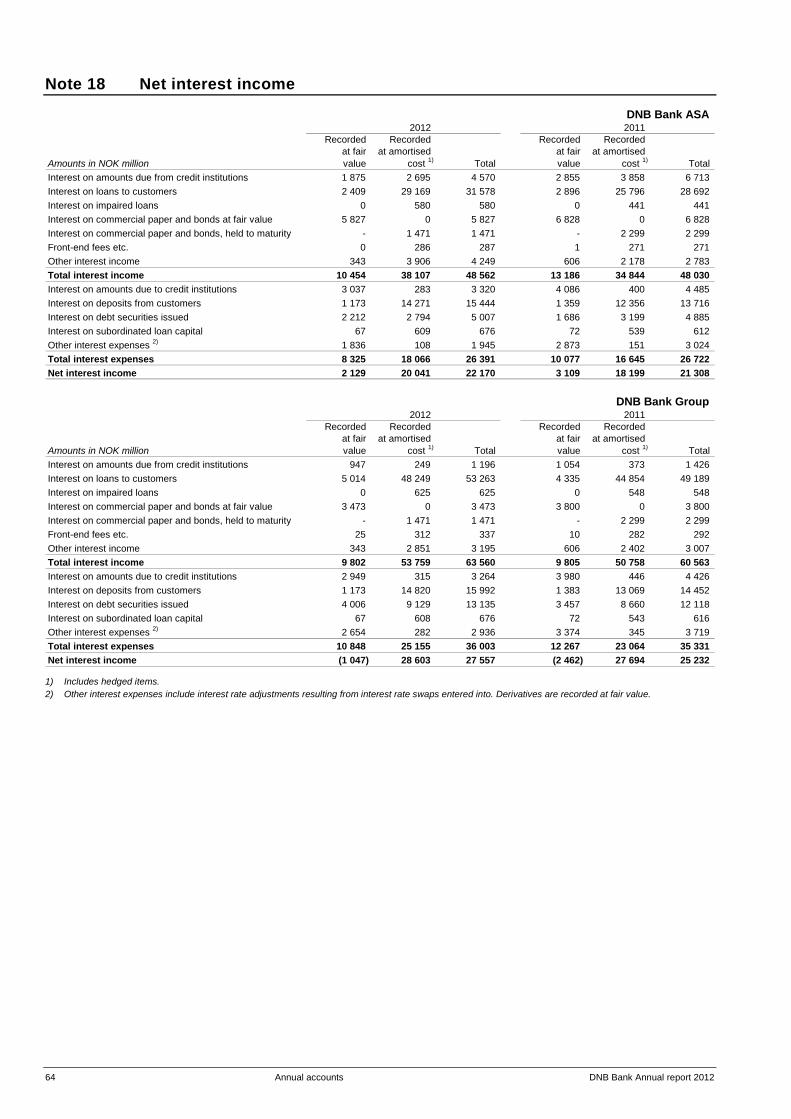
64 Annual accounts DNB Bank Annual report 2012
Note 18 Net interest income
DNB Bank ASA 2012 2011
Recorded Recorded Recorded Recorded at fair at amortised at fair at amortised
Amounts in NOK million value cost 1) Total value cost 1) Total Interest on amounts due from credit institutions 1 875 2 695 4 570 2 855 3 858 6 713 Interest on loans to customers 2 409 29 169 31 578 2 896 25 796 28 692 Interest on impaired loans 0 580 580 0 441 441 Interest on commercial paper and bonds at fair value 5 827 0 5 827 6 828 0 6 828 Interest on commercial paper and bonds, held to maturity - 1 471 1 471 - 2 299 2 299 Front-end fees etc. 0 286 287 1 271 271 Other interest income 343 3 906 4 249 606 2 178 2 783 Total interest income 10 454 38 107 48 562 13 186 34 844 48 030 Interest on amounts due to credit institutions 3 037 283 3 320 4 086 400 4 485 Interest on deposits from customers 1 173 14 271 15 444 1 359 12 356 13 716 Interest on debt securities issued 2 212 2 794 5 007 1 686 3 199 4 885 Interest on subordinated loan capital 67 609 676 72 539 612 Other interest expenses 2) 1 836 108 1 945 2 873 151 3 024 Total interest expenses 8 325 18 066 26 391 10 077 16 645 26 722 Net interest income 2 129 20 041 22 170 3 109 18 199 21 308
DNB Bank Group 2012 2011
Recorded Recorded Recorded Recorded at fair at amortised at fair at amortised
Amounts in NOK million value cost 1) Total value cost 1) Total Interest on amounts due from credit institutions 947 249 1 196 1 054 373 1 426 Interest on loans to customers 5 014 48 249 53 263 4 335 44 854 49 189 Interest on impaired loans 0 625 625 0 548 548 Interest on commercial paper and bonds at fair value 3 473 0 3 473 3 800 0 3 800 Interest on commercial paper and bonds, held to maturity - 1 471 1 471 - 2 299 2 299 Front-end fees etc. 25 312 337 10 282 292 Other interest income 343 2 851 3 195 606 2 402 3 007 Total interest income 9 802 53 759 63 560 9 805 50 758 60 563 Interest on amounts due to credit institutions 2 949 315 3 264 3 980 446 4 426 Interest on deposits from customers 1 173 14 820 15 992 1 383 13 069 14 452 Interest on debt securities issued 4 006 9 129 13 135 3 457 8 660 12 118 Interest on subordinated loan capital 67 608 676 72 543 616 Other interest expenses 2) 2 654 282 2 936 3 374 345 3 719 Total interest expenses 10 848 25 155 36 003 12 267 23 064 35 331 Net interest income (1 047) 28 603 27 557 (2 462) 27 694 25 232
1) Includes hedged items. 2) Other interest expenses include interest rate adjustments resulting from interest rate swaps entered into. Derivatives are recorded at fair value.
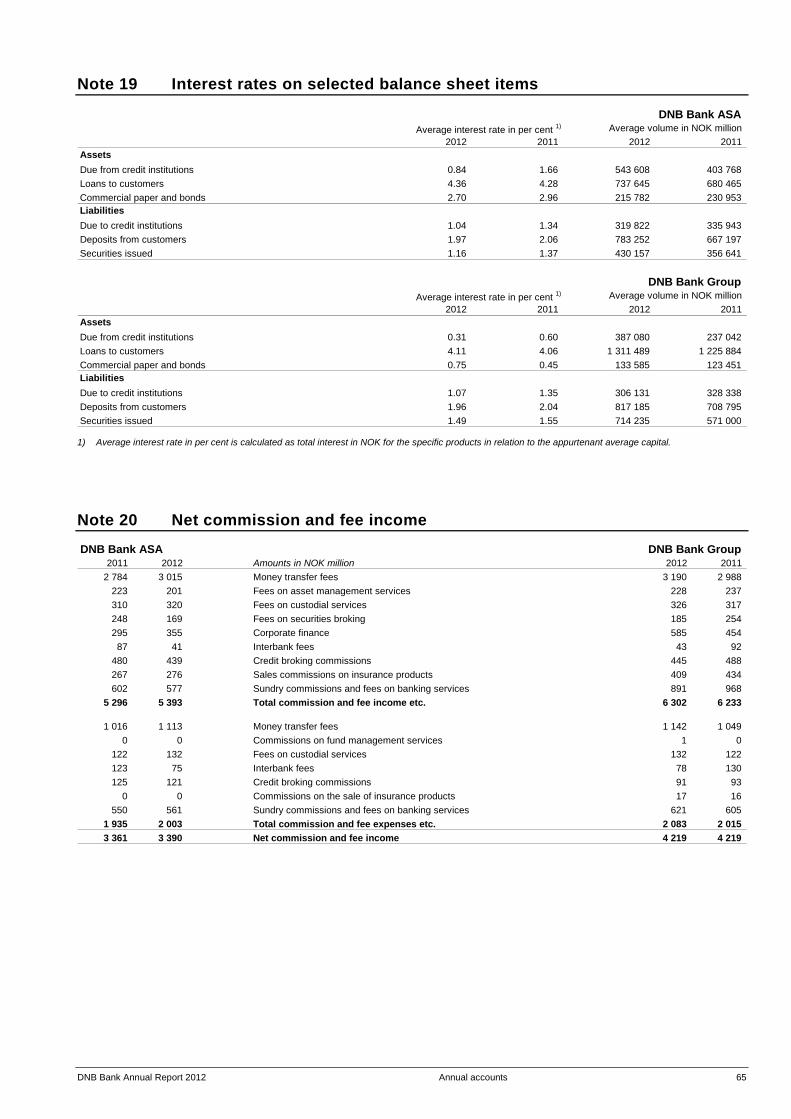
DNB Bank Annual Report 2012 Annual accounts 65
Note 19 Interest rates on selected balance sheet items
DNB Bank ASA
2012 2011 2012 2011 AssetsDue from credit institutions 0.84 1.66 543 608 403 768 Loans to customers 4.36 4.28 737 645 680 465 Commercial paper and bonds 2.70 2.96 215 782 230 953 LiabilitiesDue to credit institutions 1.04 1.34 319 822 335 943 Deposits from customers 1.97 2.06 783 252 667 197 Securities issued 1.16 1.37 430 157 356 641
Average interest rate in per cent 1) Average volume in NOK million
DNB Bank Group
2012 2011 2012 2011 AssetsDue from credit institutions 0.31 0.60 387 080 237 042 Loans to customers 4.11 4.06 1 311 489 1 225 884 Commercial paper and bonds 0.75 0.45 133 585 123 451 LiabilitiesDue to credit institutions 1.07 1.35 306 131 328 338 Deposits from customers 1.96 2.04 817 185 708 795 Securities issued 1.49 1.55 714 235 571 000
Average interest rate in per cent 1) Average volume in NOK million
1) Average interest rate in per cent is calculated as total interest in NOK for the specific products in relation to the appurtenant average capital.
Note 20 Net commission and fee income DNB Bank ASA DNB Bank Group
2011 2012 Amounts in NOK million 2012 2011 2 784 3 015 Money transfer fees 3 190 2 988
223 201 Fees on asset management services 228 237 310 320 Fees on custodial services 326 317 248 169 Fees on securities broking 185 254 295 355 Corporate finance 585 454 87 41 Interbank fees 43 92
480 439 Credit broking commissions 445 488 267 276 Sales commissions on insurance products 409 434 602 577 Sundry commissions and fees on banking services 891 968
5 296 5 393 Total commission and fee income etc. 6 302 6 233
1 016 1 113 Money transfer fees 1 142 1 049 0 0 Commissions on fund management services 1 0
122 132 Fees on custodial services 132 122 123 75 Interbank fees 78 130 125 121 Credit broking commissions 91 93
0 0 Commissions on the sale of insurance products 17 16 550 561 Sundry commissions and fees on banking services 621 605
1 935 2 003 Total commission and fee expenses etc. 2 083 2 015 3 361 3 390 Net commission and fee income 4 219 4 219
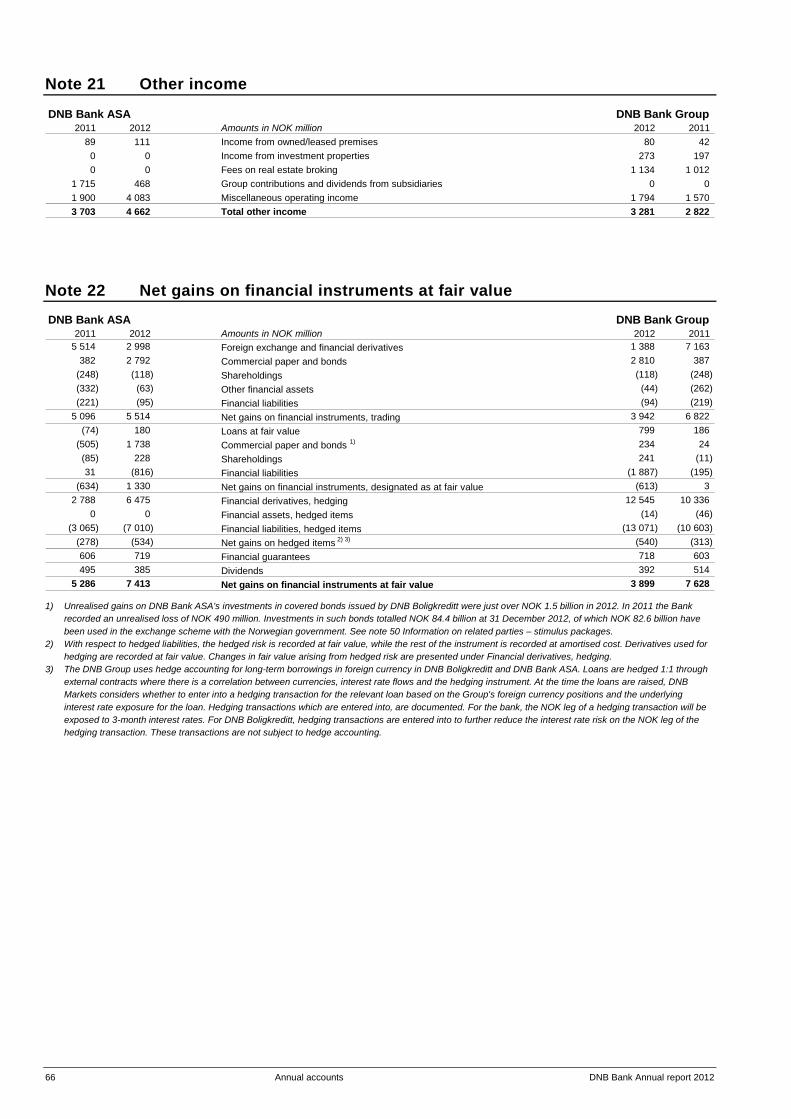
66 Annual accounts DNB Bank Annual report 2012
Note 21 Other income
DNB Bank ASA DNB Bank Group 2011 2012 Amounts in NOK million 2012 2011
89 111 Income from owned/leased premises 80 42 0 0 Income from investment properties 273 197 0 0 Fees on real estate broking 1 134 1 012
1 715 468 Group contributions and dividends from subsidiaries 0 0 1 900 4 083 Miscellaneous operating income 1 794 1 570 3 703 4 662 Total other income 3 281 2 822
Note 22 Net gains on financial instruments at fair value DNB Bank ASA DNB Bank Group
2011 2012 Amounts in NOK million 2012 2011 5 514 2 998 Foreign exchange and financial derivatives 1 388 7 163
382 2 792 Commercial paper and bonds 2 810 387 (248) (118) Shareholdings (118) (248) (332) (63) Other financial assets (44) (262) (221) (95) Financial liabilities (94) (219)
5 096 5 514 Net gains on financial instruments, trading 3 942 6 822 (74) 180 Loans at fair value 799 186
(505) 1 738 Commercial paper and bonds 1) 234 24 (85) 228 Shareholdings 241 (11) 31 (816) Financial liabilities (1 887) (195)
(634) 1 330 Net gains on financial instruments, designated as at fair value (613) 3 2 788 6 475 Financial derivatives, hedging 12 545 10 336
0 0 Financial assets, hedged items (14) (46) (3 065) (7 010) Financial liabilities, hedged items (13 071) (10 603)
(278) (534) Net gains on hedged items 2) 3) (540) (313) 606 719 Financial guarantees 718 603 495 385 Dividends 392 514
5 286 7 413 Net gains on financial instruments at fair value 3 899 7 628
1) Unrealised gains on DNB Bank ASA's investments in covered bonds issued by DNB Boligkreditt were just over NOK 1.5 billion in 2012. In 2011 the Bank recorded an unrealised loss of NOK 490 million. Investments in such bonds totalled NOK 84.4 billion at 31 December 2012, of which NOK 82.6 billion have been used in the exchange scheme with the Norwegian government. See note 50 Information on related parties – stimulus packages.
2) With respect to hedged liabilities, the hedged risk is recorded at fair value, while the rest of the instrument is recorded at amortised cost. Derivatives used for hedging are recorded at fair value. Changes in fair value arising from hedged risk are presented under Financial derivatives, hedging.
3) The DNB Group uses hedge accounting for long-term borrowings in foreign currency in DNB Boligkreditt and DNB Bank ASA. Loans are hedged 1:1 through external contracts where there is a correlation between currencies, interest rate flows and the hedging instrument. At the time the loans are raised, DNB Markets considers whether to enter into a hedging transaction for the relevant loan based on the Group's foreign currency positions and the underlying interest rate exposure for the loan. Hedging transactions which are entered into, are documented. For the bank, the NOK leg of a hedging transaction will be exposed to 3-month interest rates. For DNB Boligkreditt, hedging transactions are entered into to further reduce the interest rate risk on the NOK leg of the hedging transaction. These transactions are not subject to hedge accounting.
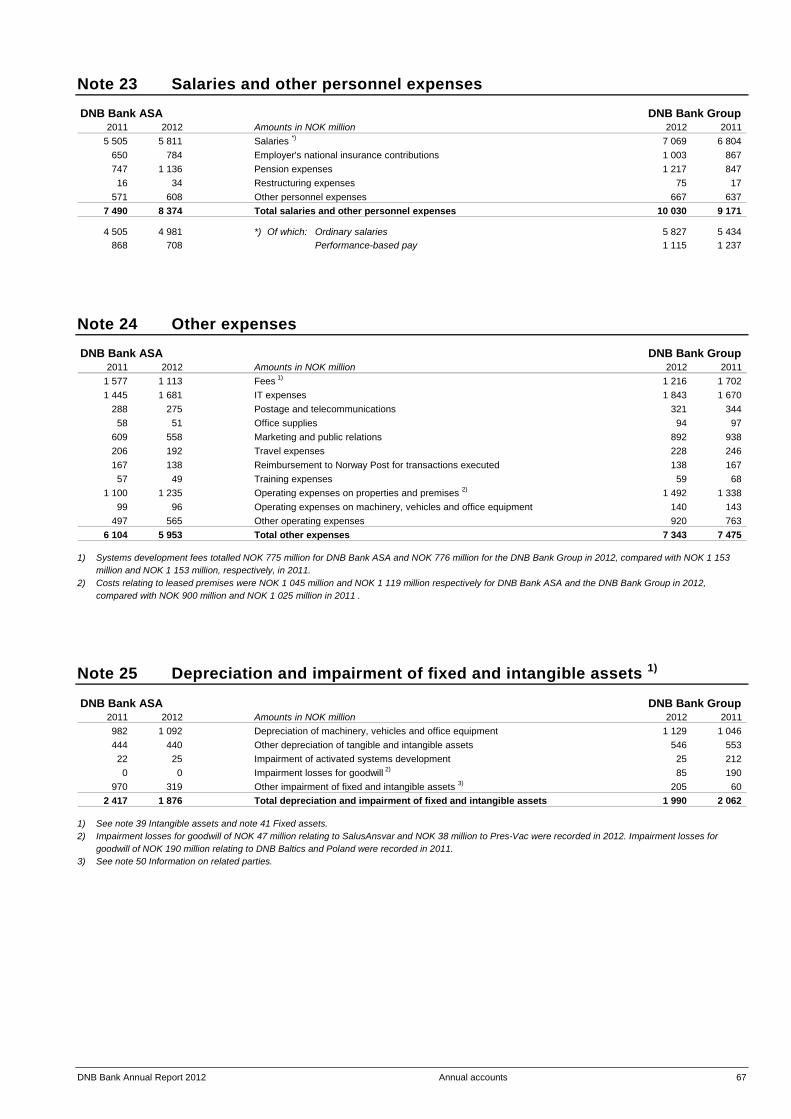
DNB Bank Annual Report 2012 Annual accounts 67
Note 23 Salaries and other personnel expenses
DNB Bank ASA DNB Bank Group 2011 2012 Amounts in NOK million 2012 2011
5 505 5 811 Salaries *) 7 069 6 804 650 784 Employer's national insurance contributions 1 003 867 747 1 136 Pension expenses 1 217 847 16 34 Restructuring expenses 75 17
571 608 Other personnel expenses 667 637 7 490 8 374 Total salaries and other personnel expenses 10 030 9 171
4 505 4 981 *) Of which: Ordinary salaries 5 827 5 434 868 708 Performance-based pay 1 115 1 237
Note 24 Other expenses DNB Bank ASA DNB Bank Group
2011 2012 Amounts in NOK million 2012 2011 1 577 1 113 Fees 1) 1 216 1 702 1 445 1 681 IT expenses 1 843 1 670
288 275 Postage and telecommunications 321 344 58 51 Office supplies 94 97
609 558 Marketing and public relations 892 938 206 192 Travel expenses 228 246 167 138 Reimbursement to Norway Post for transactions executed 138 167 57 49 Training expenses 59 68
1 100 1 235 Operating expenses on properties and premises 2) 1 492 1 338 99 96 Operating expenses on machinery, vehicles and office equipment 140 143
497 565 Other operating expenses 920 763 6 104 5 953 Total other expenses 7 343 7 475
1) Systems development fees totalled NOK 775 million for DNB Bank ASA and NOK 776 million for the DNB Bank Group in 2012, compared with NOK 1 153
million and NOK 1 153 million, respectively, in 2011. 2) Costs relating to leased premises were NOK 1 045 million and NOK 1 119 million respectively for DNB Bank ASA and the DNB Bank Group in 2012,
compared with NOK 900 million and NOK 1 025 million in 2011 .
Note 25 Depreciation and impairment of fixed and intangible assets 1)
DNB Bank ASA DNB Bank Group 2011 2012 Amounts in NOK million 2012 2011 982 1 092 Depreciation of machinery, vehicles and office equipment 1 129 1 046 444 440 Other depreciation of tangible and intangible assets 546 553 22 25 Impairment of activated systems development 25 212 0 0 Impairment losses for goodwill 2) 85 190
970 319 Other impairment of fixed and intangible assets 3) 205 60 2 417 1 876 Total depreciation and impairment of fixed and intangible assets 1 990 2 062
1) See note 39 Intangible assets and note 41 Fixed assets. 2) Impairment losses for goodwill of NOK 47 million relating to SalusAnsvar and NOK 38 million to Pres-Vac were recorded in 2012. Impairment losses for
goodwill of NOK 190 million relating to DNB Baltics and Poland were recorded in 2011. 3) See note 50 Information on related parties.

68 Annual accounts DNB Bank Annual report 2012
Note 26 Pensions Description of the pension schemes Up until year-end 2010, the DNB Bank Group had a defined benefit occupational pension scheme for all employees in Norway in the form of a group pension scheme funded by DNB Livsforsikring. Pension benefits included retirement pensions, disability pensions and pensions for spouses and dependent children, which supplemented benefits from the National Insurance Scheme. Full pension entitlements required 30 years of pensionable service and gave the right to a retirement pension corresponding to the difference between 70 per cent of the employee's salary and estimated benefits from the National Insurance Scheme. The pension scheme was in compliance with the Act on Occupational Pensions. The defined benefit scheme for retirement and disability pensions for employees in Norway was closed as at 31 December 2010. As from 1 January 2011, employees who take up employment in DNB Bank are included in a newly established defined contribution scheme for retirement pensions and a new defined benefit scheme for disability coverage. The banking group has no defined contribution scheme for salaries exceeding 12G (12 times the National Insurance basic amount). The premium rates for defined contribution pensions are in line with the statutory maximum rates: • Salary representing 1-6 times the National Insurance basic amount: 5 per cent • Salary representing 6-12 times the National Insurance basic amount: 8 per cent In addition, around 500 employees in the former Postbanken are covered by a closed group pension plan in the Norwegian Public Service Pension Fund. The banking group also has commitments related to the top salary pension scheme for salaries exceeding 12G and early retirement agree-ments. Commitments relating to salaries exceeding 12G and early retirement agreements are funded through the companies' operations. The top salary pension scheme was closed for employees who joined the banking group after 30 June 2008. Further restrictions were introduced as at 30 April 2011. Those who did not have salaries exceeding 12G on that date will not be encompassed by the scheme even if their salaries exceed 12G at a later date. With effect from 1 July 2011, employees with salaries exceeding 12G are covered by a special life level term insurance which represents 2.9 times annual salary, maximum 80G. With effect from 1 January 2011, the pension scheme no longer provides coverage for dependants' and children's pensions, which were replaced by an extended dependants' and child allowance in the group pension scheme as from the same date. With respect to employees born prior to 1 January 1956 who die after becoming pensioners, their dependants will still receive a pension. The Norwegian companies in the banking group are part of the contractual pension (CPA) scheme for the private sector. In addition, the banking group has an agreement on contractual pensions according to public sector rules for employees who are members of the Public Service Pension Fund. The private CPA scheme gives a life-long supplement to ordinary pension payments. The employees can opt for the CPA scheme from the age of 62 and can choose to combine pension payments with continued employment. The private CPA scheme should be recorded as a defined benefit multi-company scheme in the accounts and will be funded by an annual premium representing a percentage of salaries between 1 and 7.1G. The premium for 2013 is set at 2.0 per cent (2012: 1.75 per cent). Thus far, no details have been presented on how the new commitments should be recorded in the accounts. All Norwegian companies in the banking group are members of the private CPA scheme. For members of the Norwegian Public Service Pension Fund, the CPA scheme will continue unchanged in 2013. Employer's contributions are included in pension expenses and commitments. In pension schemes where pension funds exceed pension commitments, no allocation has been made for employer's contributions. Subsidiaries and branches outside Norway have separate schemes for their employees, mainly in the form of defined-contribution schemes. Pension expenses for employees outside Norway represent NOK 110 million of the banking group's total pension expenses of NOK 1 136 million.
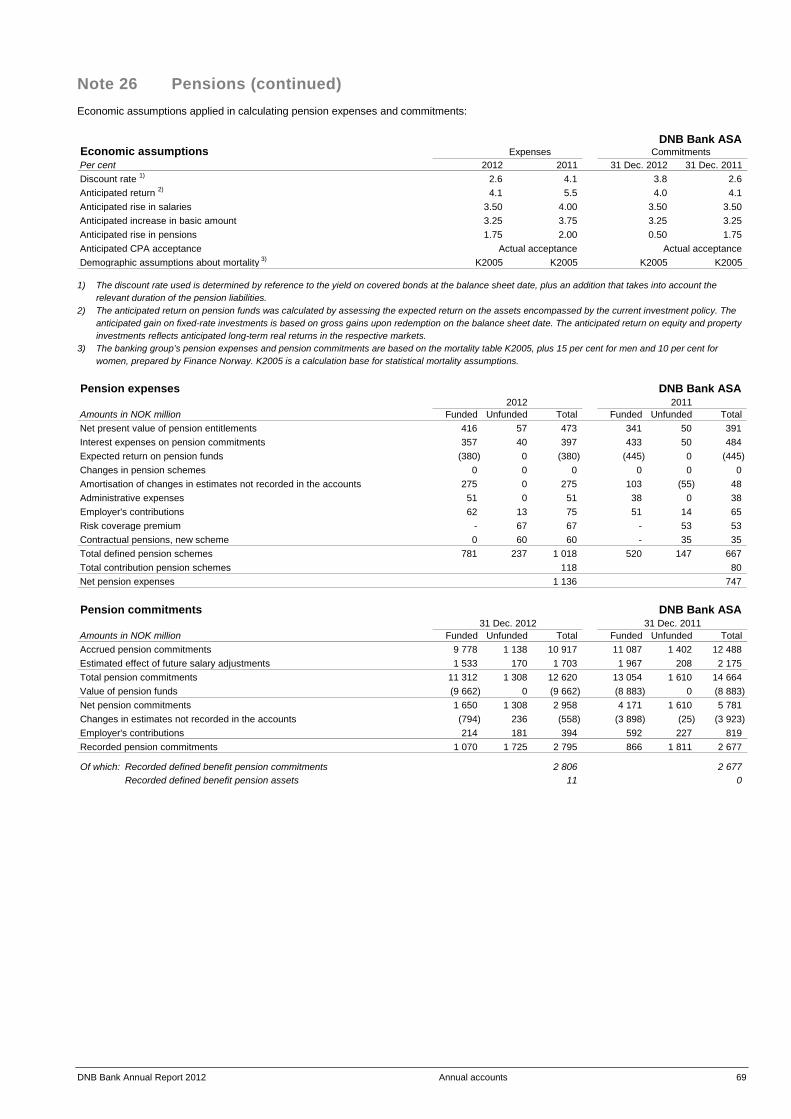
DNB Bank Annual Report 2012 Annual accounts 69
Note 26 Pensions (continued) Economic assumptions applied in calculating pension expenses and commitments:
DNB Bank ASA Economic assumptionsPer cent 2012 2011 31 Dec. 2012 31 Dec. 2011 Discount rate 1) 2.6 4.1 3.8 2.6 Anticipated return 2) 4.1 5.5 4.0 4.1 Anticipated rise in salaries 3.50 4.00 3.50 3.50 Anticipated increase in basic amount 3.25 3.75 3.25 3.25 Anticipated rise in pensions 1.75 2.00 0.50 1.75 Anticipated CPA acceptance Actual acceptance Actual acceptanceDemographic assumptions about mortality 3) K2005 K2005 K2005 K2005
Commitments Expenses
1) The discount rate used is determined by reference to the yield on covered bonds at the balance sheet date, plus an addition that takes into account the
relevant duration of the pension liabilities. 2) The anticipated return on pension funds was calculated by assessing the expected return on the assets encompassed by the current investment policy. The
anticipated gain on fixed-rate investments is based on gross gains upon redemption on the balance sheet date. The anticipated return on equity and property investments reflects anticipated long-term real returns in the respective markets.
3) The banking group’s pension expenses and pension commitments are based on the mortality table K2005, plus 15 per cent for men and 10 per cent for women, prepared by Finance Norway. K2005 is a calculation base for statistical mortality assumptions.
Pension expenses DNB Bank ASA
2012 2011 Amounts in NOK million Funded Unfunded Total Funded Unfunded Total Net present value of pension entitlements 416 57 473 341 50 391 Interest expenses on pension commitments 357 40 397 433 50 484 Expected return on pension funds (380) 0 (380) (445) 0 (445) Changes in pension schemes 0 0 0 0 0 0 Amortisation of changes in estimates not recorded in the accounts 275 0 275 103 (55) 48 Administrative expenses 51 0 51 38 0 38 Employer's contributions 62 13 75 51 14 65 Risk coverage premium - 67 67 - 53 53 Contractual pensions, new scheme 0 60 60 - 35 35 Total defined pension schemes 781 237 1 018 520 147 667 Total contribution pension schemes 118 80 Net pension expenses 1 136 747 Pension commitments DNB Bank ASA
Amounts in NOK million Funded Unfunded Total Funded Unfunded Total Accrued pension commitments 9 778 1 138 10 917 11 087 1 402 12 488 Estimated effect of future salary adjustments 1 533 170 1 703 1 967 208 2 175 Total pension commitments 11 312 1 308 12 620 13 054 1 610 14 664 Value of pension funds (9 662) 0 (9 662) (8 883) 0 (8 883) Net pension commitments 1 650 1 308 2 958 4 171 1 610 5 781 Changes in estimates not recorded in the accounts (794) 236 (558) (3 898) (25) (3 923) Employer's contributions 214 181 394 592 227 819 Recorded pension commitments 1 070 1 725 2 795 866 1 811 2 677
Of which: Recorded defined benefit pension commitments 2 806 2 677 Recorded defined benefit pension assets 11 0
31 Dec. 2012 31 Dec. 2011
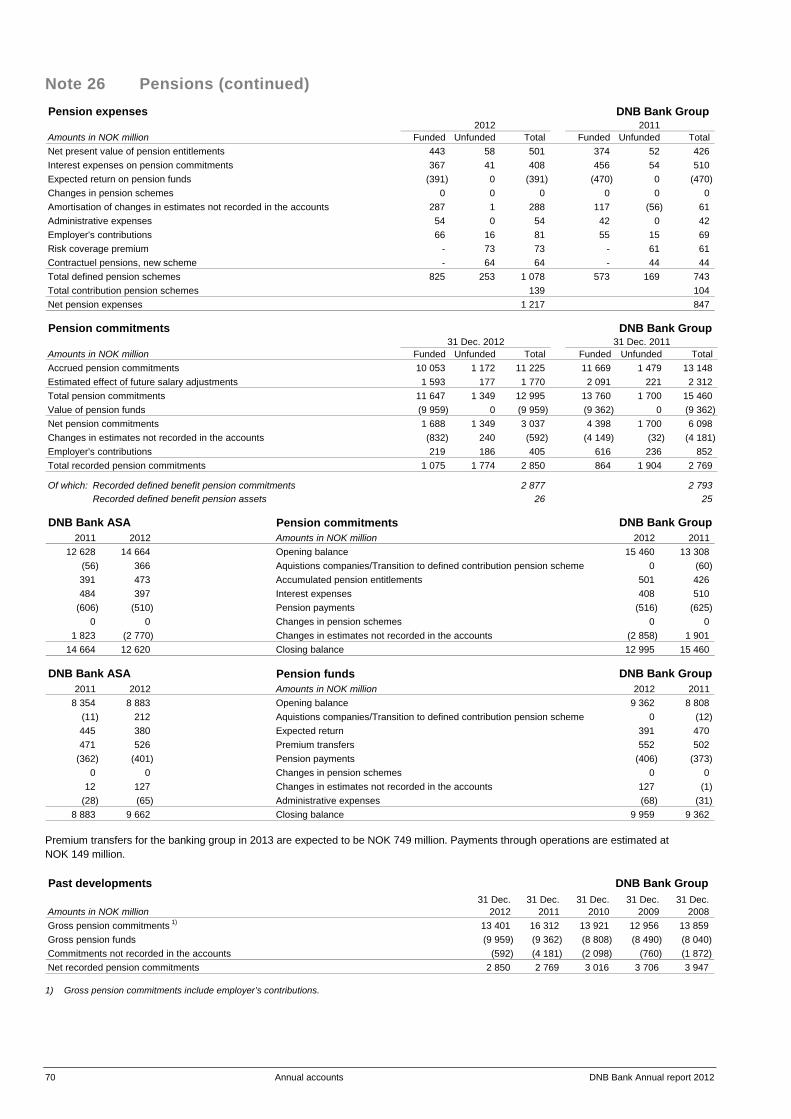
70 Annual accounts DNB Bank Annual report 2012
Note 26 Pensions (continued) Pension expenses DNB Bank Group
2012 2011 Amounts in NOK million Funded Unfunded Total Funded Unfunded Total Net present value of pension entitlements 443 58 501 374 52 426 Interest expenses on pension commitments 367 41 408 456 54 510 Expected return on pension funds (391) 0 (391) (470) 0 (470) Changes in pension schemes 0 0 0 0 0 0 Amortisation of changes in estimates not recorded in the accounts 287 1 288 117 (56) 61 Administrative expenses 54 0 54 42 0 42 Employer's contributions 66 16 81 55 15 69 Risk coverage premium - 73 73 - 61 61 Contractuel pensions, new scheme - 64 64 - 44 44 Total defined pension schemes 825 253 1 078 573 169 743 Total contribution pension schemes 139 104 Net pension expenses 1 217 847
Pension commitments DNB Bank Group
Amounts in NOK million Funded Unfunded Total Funded Unfunded Total Accrued pension commitments 10 053 1 172 11 225 11 669 1 479 13 148 Estimated effect of future salary adjustments 1 593 177 1 770 2 091 221 2 312 Total pension commitments 11 647 1 349 12 995 13 760 1 700 15 460 Value of pension funds (9 959) 0 (9 959) (9 362) 0 (9 362) Net pension commitments 1 688 1 349 3 037 4 398 1 700 6 098 Changes in estimates not recorded in the accounts (832) 240 (592) (4 149) (32) (4 181) Employer's contributions 219 186 405 616 236 852 Total recorded pension commitments 1 075 1 774 2 850 864 1 904 2 769
Of which: Recorded defined benefit pension commitments 2 877 2 793 Recorded defined benefit pension assets 26 25
31 Dec. 201131 Dec. 2012
DNB Bank ASA Pension commitments DNB Bank Group2011 2012 Amounts in NOK million 2012 2011
12 628 14 664 Opening balance 15 460 13 308 (56) 366 Aquistions companies/Transition to defined contribution pension scheme 0 (60) 391 473 Accumulated pension entitlements 501 426 484 397 Interest expenses 408 510
(606) (510) Pension payments (516) (625) 0 0 Changes in pension schemes 0 0
1 823 (2 770) Changes in estimates not recorded in the accounts (2 858) 1 901 14 664 12 620 Closing balance 12 995 15 460
DNB Bank ASA Pension funds DNB Bank Group2011 2012 Amounts in NOK million 2012 2011
8 354 8 883 Opening balance 9 362 8 808 (11) 212 Aquistions companies/Transition to defined contribution pension scheme 0 (12) 445 380 Expected return 391 470 471 526 Premium transfers 552 502
(362) (401) Pension payments (406) (373) 0 0 Changes in pension schemes 0 0
12 127 Changes in estimates not recorded in the accounts 127 (1) (28) (65) Administrative expenses (68) (31)
8 883 9 662 Closing balance 9 959 9 362 Premium transfers for the banking group in 2013 are expected to be NOK 749 million. Payments through operations are estimated at NOK 149 million. Past developments DNB Bank Group
31 Dec. 31 Dec. 31 Dec. 31 Dec. 31 Dec. Amounts in NOK million 2012 2011 2010 2009 2008 Gross pension commitments 1) 13 401 16 312 13 921 12 956 13 859 Gross pension funds (9 959) (9 362) (8 808) (8 490) (8 040) Commitments not recorded in the accounts (592) (4 181) (2 098) (760) (1 872) Net recorded pension commitments 2 850 2 769 3 016 3 706 3 947
1) Gross pension commitments include employer’s contributions.
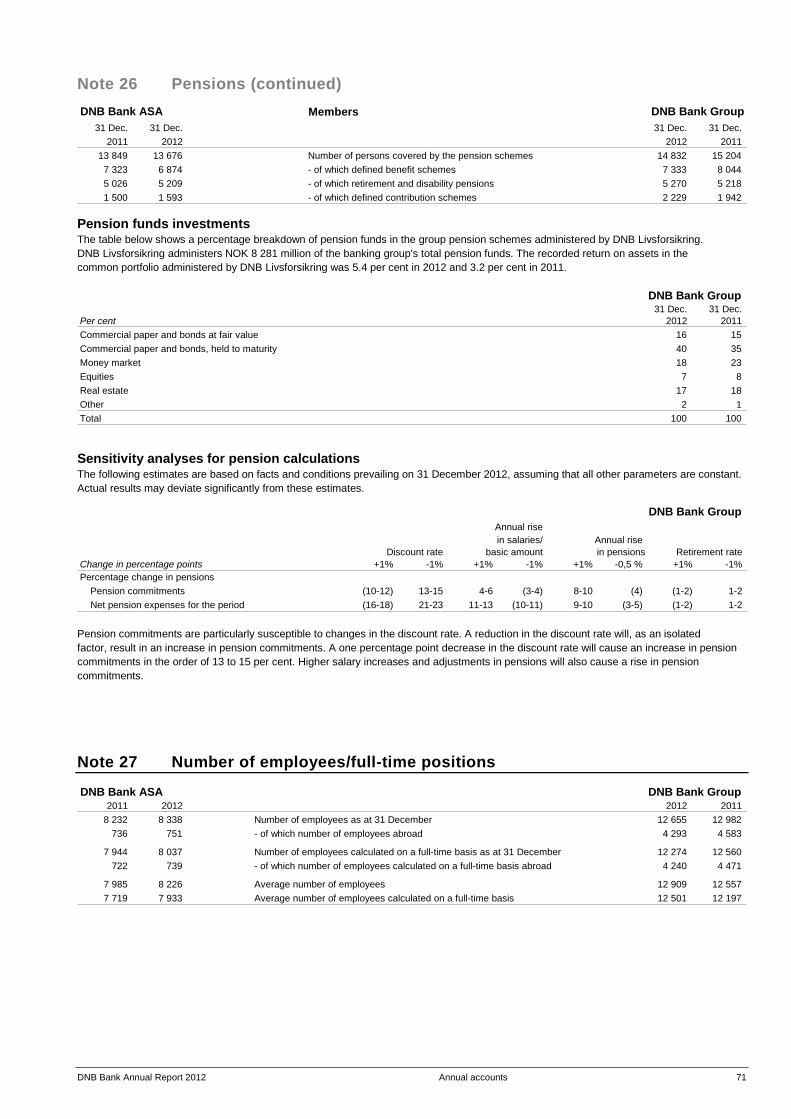
DNB Bank Annual Report 2012 Annual accounts 71
Note 26 Pensions (continued) DNB Bank ASA Members DNB Bank Group
31 Dec. 31 Dec. 31 Dec. 31 Dec. 2011 2012 2012 2011
13 849 13 676 Number of persons covered by the pension schemes 14 832 15 204 7 323 6 874 - of which defined benefit schemes 7 333 8 044 5 026 5 209 - of which retirement and disability pensions 5 270 5 218 1 500 1 593 - of which defined contribution schemes 2 229 1 942
Pension funds investments The table below shows a percentage breakdown of pension funds in the group pension schemes administered by DNB Livsforsikring. DNB Livsforsikring administers NOK 8 281 million of the banking group's total pension funds. The recorded return on assets in the common portfolio administered by DNB Livsforsikring was 5.4 per cent in 2012 and 3.2 per cent in 2011.
DNB Bank Group 31 Dec. 31 Dec.
Per cent 2012 2011 Commercial paper and bonds at fair value 16 15 Commercial paper and bonds, held to maturity 40 35 Money market 18 23 Equities 7 8 Real estate 17 18 Other 2 1 Total 100 100 Sensitivity analyses for pension calculations The following estimates are based on facts and conditions prevailing on 31 December 2012, assuming that all other parameters are constant. Actual results may deviate significantly from these estimates.
DNB Bank Group
Change in percentage points +1% -1% +1% -1% +1% -0,5 % +1% -1% Percentage change in pensions
Pension commitments (10-12) 13-15 4-6 (3-4) 8-10 (4) (1-2) 1-2 Net pension expenses for the period (16-18) 21-23 11-13 (10-11) 9-10 (3-5) (1-2) 1-2
Annual rise in salaries/ Annual rise
Discount rate basic amount in pensions Retirement rate
Pension commitments are particularly susceptible to changes in the discount rate. A reduction in the discount rate will, as an isolated factor, result in an increase in pension commitments. A one percentage point decrease in the discount rate will cause an increase in pension commitments in the order of 13 to 15 per cent. Higher salary increases and adjustments in pensions will also cause a rise in pension commitments.
Note 27 Number of employees/full-time positions
DNB Bank ASA DNB Bank Group 2011 2012 2012 2011
8 232 8 338 Number of employees as at 31 December 12 655 12 982 736 751 - of which number of employees abroad 4 293 4 583
7 944 8 037 Number of employees calculated on a full-time basis as at 31 December 12 274 12 560 722 739 - of which number of employees calculated on a full-time basis abroad 4 240 4 471
7 985 8 226 Average number of employees 12 909 12 557 7 719 7 933 Average number of employees calculated on a full-time basis 12 501 12 197
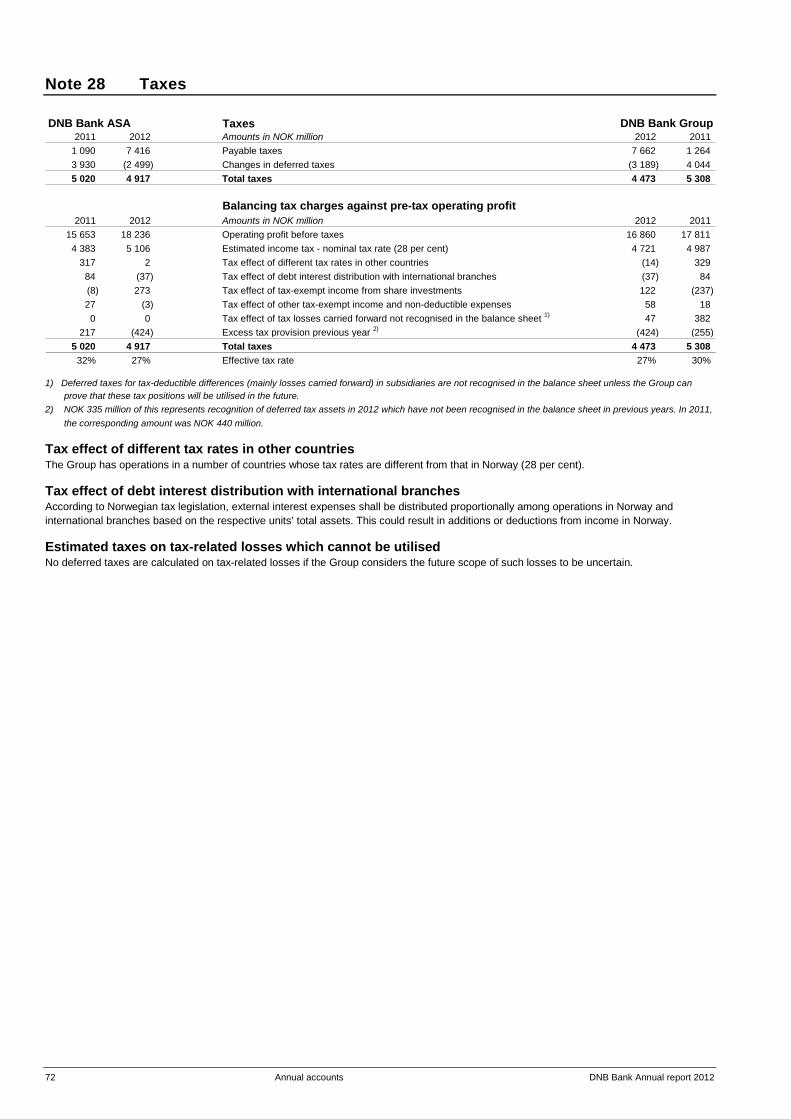
72 Annual accounts DNB Bank Annual report 2012
Note 28 Taxes
DNB Bank ASA Taxes DNB Bank Group2011 2012 Amounts in NOK million 2012 2011
1 090 7 416 Payable taxes 7 662 1 264 3 930 (2 499) Changes in deferred taxes (3 189) 4 044 5 020 4 917 Total taxes 4 473 5 308
Balancing tax charges against pre-tax operating profit2011 2012 Amounts in NOK million 2012 2011
15 653 18 236 Operating profit before taxes 16 860 17 811 4 383 5 106 Estimated income tax - nominal tax rate (28 per cent) 4 721 4 987
317 2 Tax effect of different tax rates in other countries (14) 329 84 (37) Tax effect of debt interest distribution with international branches (37) 84 (8) 273 Tax effect of tax-exempt income from share investments 122 (237) 27 (3) Tax effect of other tax-exempt income and non-deductible expenses 58 18 0 0 Tax effect of tax losses carried forward not recognised in the balance sheet 1) 47 382
217 (424) Excess tax provision previous year 2) (424) (255) 5 020 4 917 Total taxes 4 473 5 308 32% 27% Effective tax rate 27% 30%
1) Deferred taxes for tax-deductible differences (mainly losses carried forward) in subsidiaries are not recognised in the balance sheet unless the Group can
prove that these tax positions will be utilised in the future. 2) NOK 335 million of this represents recognition of deferred tax assets in 2012 which have not been recognised in the balance sheet in previous years. In 2011,
the corresponding amount was NOK 440 million. Tax effect of different tax rates in other countries The Group has operations in a number of countries whose tax rates are different from that in Norway (28 per cent). Tax effect of debt interest distribution with international branches According to Norwegian tax legislation, external interest expenses shall be distributed proportionally among operations in Norway and international branches based on the respective units’ total assets. This could result in additions or deductions from income in Norway. Estimated taxes on tax-related losses which cannot be utilised No deferred taxes are calculated on tax-related losses if the Group considers the future scope of such losses to be uncertain.
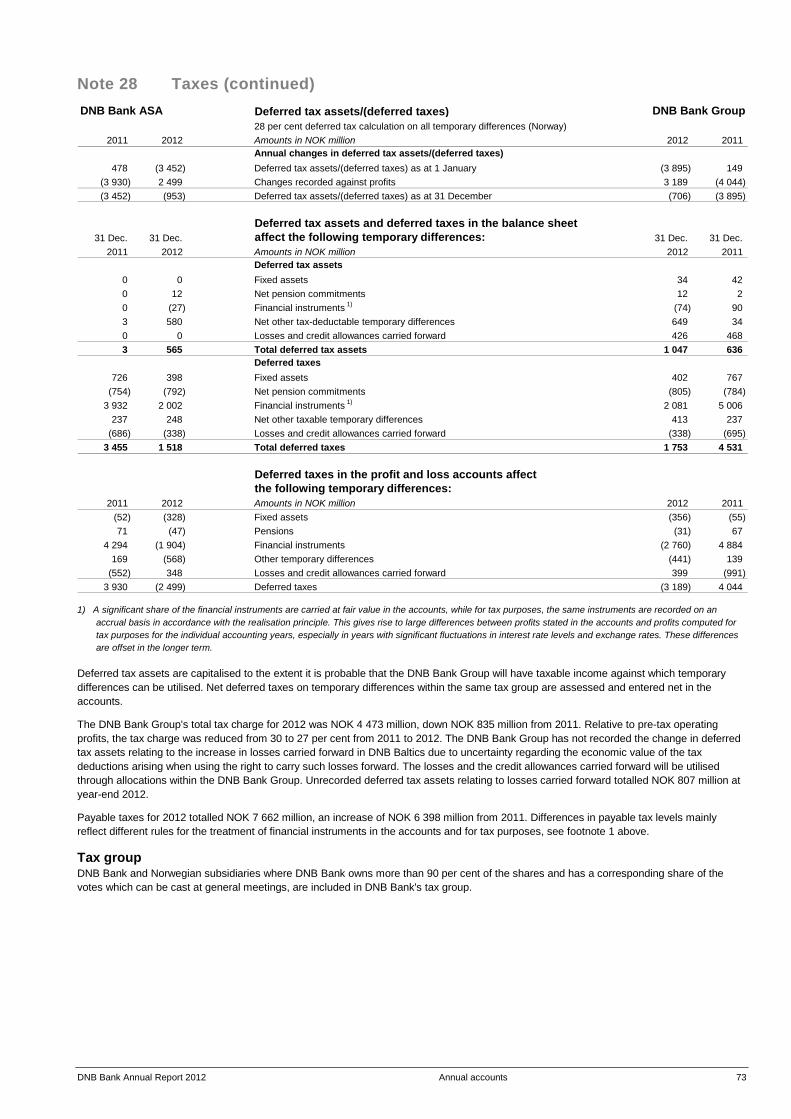
DNB Bank Annual Report 2012 Annual accounts 73
Note 28 Taxes (continued) DNB Bank ASA Deferred tax assets/(deferred taxes) DNB Bank Group
28 per cent deferred tax calculation on all temporary differences (Norway)2011 2012 Amounts in NOK million 2012 2011
Annual changes in deferred tax assets/(deferred taxes)478 (3 452) Deferred tax assets/(deferred taxes) as at 1 January (3 895) 149
(3 930) 2 499 Changes recorded against profits 3 189 (4 044) (3 452) (953) Deferred tax assets/(deferred taxes) as at 31 December (706) (3 895)
Deferred tax assets and deferred taxes in the balance sheet 31 Dec. 31 Dec. affect the following temporary differences: 31 Dec. 31 Dec.
2011 2012 Amounts in NOK million 2012 2011 Deferred tax assets
0 0 Fixed assets 34 42 0 12 Net pension commitments 12 2 0 (27) Financial instruments 1) (74) 90 3 580 Net other tax-deductable temporary differences 649 34 0 0 Losses and credit allowances carried forward 426 468 3 565 Total deferred tax assets 1 047 636
Deferred taxes726 398 Fixed assets 402 767
(754) (792) Net pension commitments (805) (784) 3 932 2 002 Financial instruments 1) 2 081 5 006
237 248 Net other taxable temporary differences 413 237 (686) (338) Losses and credit allowances carried forward (338) (695)
3 455 1 518 Total deferred taxes 1 753 4 531
Deferred taxes in the profit and loss accounts affect the following temporary differences:
2011 2012 Amounts in NOK million 2012 2011 (52) (328) Fixed assets (356) (55) 71 (47) Pensions (31) 67
4 294 (1 904) Financial instruments (2 760) 4 884 169 (568) Other temporary differences (441) 139
(552) 348 Losses and credit allowances carried forward 399 (991) 3 930 (2 499) Deferred taxes (3 189) 4 044
1) A significant share of the financial instruments are carried at fair value in the accounts, while for tax purposes, the same instruments are recorded on an
accrual basis in accordance with the realisation principle. This gives rise to large differences between profits stated in the accounts and profits computed for tax purposes for the individual accounting years, especially in years with significant fluctuations in interest rate levels and exchange rates. These differences are offset in the longer term.
Deferred tax assets are capitalised to the extent it is probable that the DNB Bank Group will have taxable income against which temporary differences can be utilised. Net deferred taxes on temporary differences within the same tax group are assessed and entered net in the accounts. The DNB Bank Group's total tax charge for 2012 was NOK 4 473 million, down NOK 835 million from 2011. Relative to pre-tax operating profits, the tax charge was reduced from 30 to 27 per cent from 2011 to 2012. The DNB Bank Group has not recorded the change in deferred tax assets relating to the increase in losses carried forward in DNB Baltics due to uncertainty regarding the economic value of the tax deductions arising when using the right to carry such losses forward. The losses and the credit allowances carried forward will be utilised through allocations within the DNB Bank Group. Unrecorded deferred tax assets relating to losses carried forward totalled NOK 807 million at year-end 2012. Payable taxes for 2012 totalled NOK 7 662 million, an increase of NOK 6 398 million from 2011. Differences in payable tax levels mainly reflect different rules for the treatment of financial instruments in the accounts and for tax purposes, see footnote 1 above. Tax group DNB Bank and Norwegian subsidiaries where DNB Bank owns more than 90 per cent of the shares and has a corresponding share of the votes which can be cast at general meetings, are included in DNB Bank's tax group.
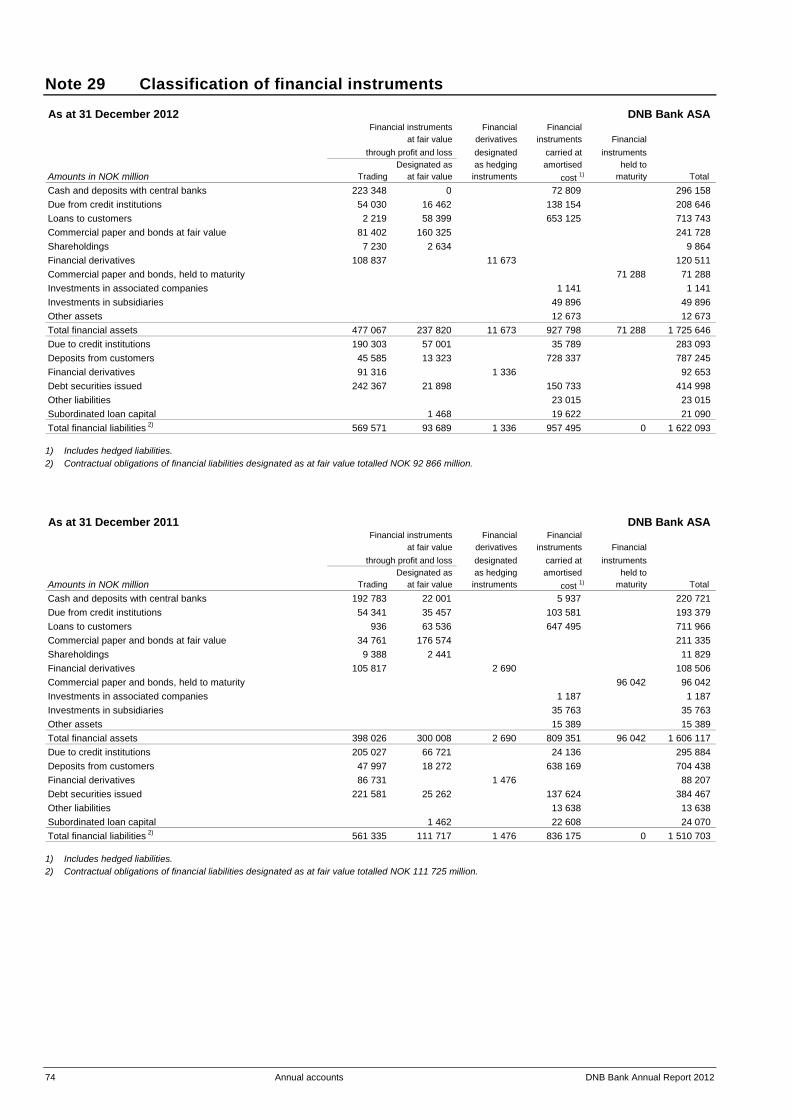
74 Annual accounts DNB Bank Annual Report 2012
Note 29 Classification of financial instruments
As at 31 December 2012 DNB Bank ASA Financial Financial
derivatives instruments Financial designated carried at instruments
Designated as as hedging amortised held to Amounts in NOK million Trading at fair value instruments cost 1) maturity Total Cash and deposits with central banks 223 348 0 72 809 296 158Due from credit institutions 54 030 16 462 138 154 208 646Loans to customers 2 219 58 399 653 125 713 743Commercial paper and bonds at fair value 81 402 160 325 241 728Shareholdings 7 230 2 634 9 864Financial derivatives 108 837 11 673 120 511Commercial paper and bonds, held to maturity 71 288 71 288Investments in associated companies 1 141 1 141Investments in subsidiaries 49 896 49 896Other assets 12 673 12 673Total financial assets 477 067 237 820 11 673 927 798 71 288 1 725 646Due to credit institutions 190 303 57 001 35 789 283 093Deposits from customers 45 585 13 323 728 337 787 245Financial derivatives 91 316 1 336 92 653Debt securities issued 242 367 21 898 150 733 414 998Other liabilities 23 015 23 015Subordinated loan capital 1 468 19 622 21 090Total financial liabilities 2) 569 571 93 689 1 336 957 495 0 1 622 093
Financial instruments at fair value
through profit and loss
1) Includes hedged liabilities. 2) Contractual obligations of financial liabilities designated as at fair value totalled NOK 92 866 million. As at 31 December 2011 DNB Bank ASA
Financial Financial derivatives instruments Financial designated carried at instruments
Designated as as hedging amortised held to Amounts in NOK million Trading at fair value instruments cost 1) maturity Total Cash and deposits with central banks 192 783 22 001 5 937 220 721Due from credit institutions 54 341 35 457 103 581 193 379Loans to customers 936 63 536 647 495 711 966Commercial paper and bonds at fair value 34 761 176 574 211 335Shareholdings 9 388 2 441 11 829Financial derivatives 105 817 2 690 108 506Commercial paper and bonds, held to maturity 96 042 96 042Investments in associated companies 1 187 1 187Investments in subsidiaries 35 763 35 763Other assets 15 389 15 389Total financial assets 398 026 300 008 2 690 809 351 96 042 1 606 117Due to credit institutions 205 027 66 721 24 136 295 884Deposits from customers 47 997 18 272 638 169 704 438Financial derivatives 86 731 1 476 88 207Debt securities issued 221 581 25 262 137 624 384 467Other liabilities 13 638 13 638Subordinated loan capital 1 462 22 608 24 070Total financial liabilities 2) 561 335 111 717 1 476 836 175 0 1 510 703
Financial instruments at fair value
through profit and loss
1) Includes hedged liabilities. 2) Contractual obligations of financial liabilities designated as at fair value totalled NOK 111 725 million.
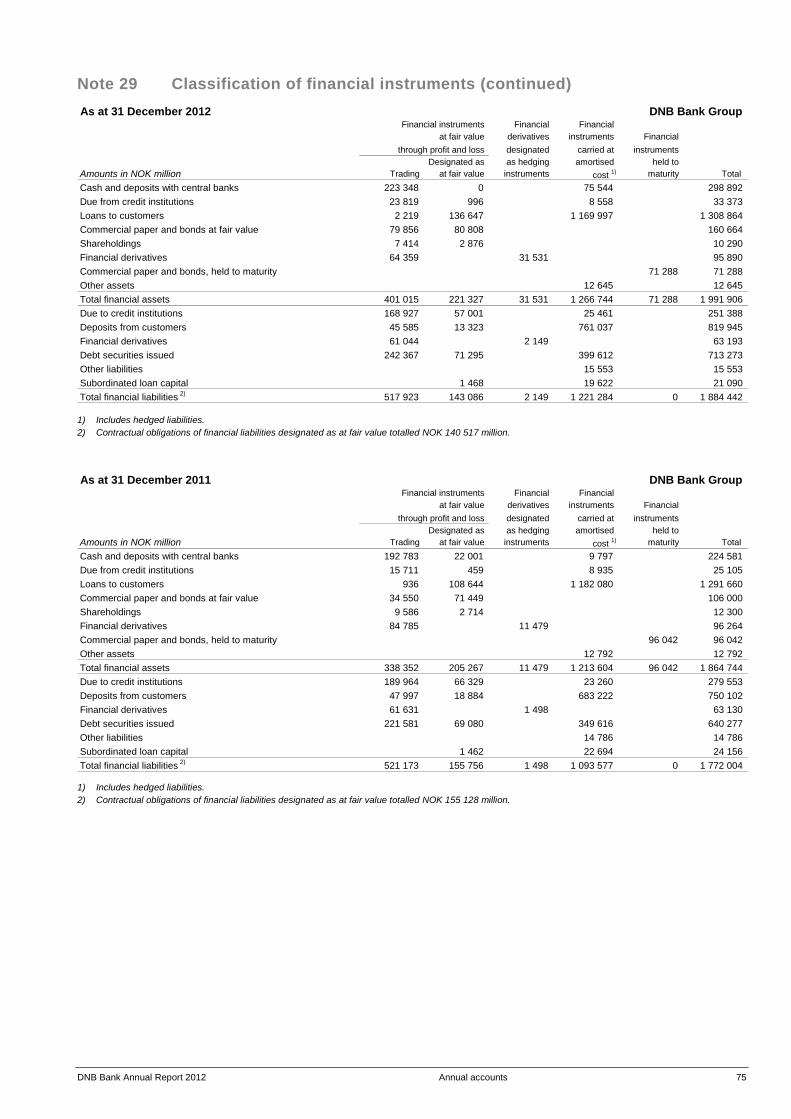
DNB Bank Annual Report 2012 Annual accounts 75
Note 29 Classification of financial instruments (continued) As at 31 December 2012 DNB Bank Group
Financial Financial derivatives instruments Financial designated carried at instruments
Designated as as hedging amortised held to Amounts in NOK million Trading at fair value instruments cost 1) maturity Total Cash and deposits with central banks 223 348 0 75 544 298 892Due from credit institutions 23 819 996 8 558 33 373Loans to customers 2 219 136 647 1 169 997 1 308 864Commercial paper and bonds at fair value 79 856 80 808 160 664Shareholdings 7 414 2 876 10 290Financial derivatives 64 359 31 531 95 890Commercial paper and bonds, held to maturity 71 288 71 288Other assets 12 645 12 645Total financial assets 401 015 221 327 31 531 1 266 744 71 288 1 991 906Due to credit institutions 168 927 57 001 25 461 251 388Deposits from customers 45 585 13 323 761 037 819 945Financial derivatives 61 044 2 149 63 193Debt securities issued 242 367 71 295 399 612 713 273Other liabilities 15 553 15 553Subordinated loan capital 1 468 19 622 21 090Total financial liabilities 2) 517 923 143 086 2 149 1 221 284 0 1 884 442
Financial instruments at fair value
through profit and loss
1) Includes hedged liabilities. 2) Contractual obligations of financial liabilities designated as at fair value totalled NOK 140 517 million. As at 31 December 2011 DNB Bank Group
Financial Financial derivatives instruments Financial designated carried at instruments
Designated as as hedging amortised held to Amounts in NOK million Trading at fair value instruments cost 1) maturity Total Cash and deposits with central banks 192 783 22 001 9 797 224 581Due from credit institutions 15 711 459 8 935 25 105Loans to customers 936 108 644 1 182 080 1 291 660Commercial paper and bonds at fair value 34 550 71 449 106 000Shareholdings 9 586 2 714 12 300Financial derivatives 84 785 11 479 96 264Commercial paper and bonds, held to maturity 96 042 96 042Other assets 12 792 12 792Total financial assets 338 352 205 267 11 479 1 213 604 96 042 1 864 744Due to credit institutions 189 964 66 329 23 260 279 553Deposits from customers 47 997 18 884 683 222 750 102Financial derivatives 61 631 1 498 63 130Debt securities issued 221 581 69 080 349 616 640 277Other liabilities 14 786 14 786Subordinated loan capital 1 462 22 694 24 156Total financial liabilities 2) 521 173 155 756 1 498 1 093 577 0 1 772 004
Financial instruments at fair value
through profit and loss
1) Includes hedged liabilities. 2) Contractual obligations of financial liabilities designated as at fair value totalled NOK 155 128 million.
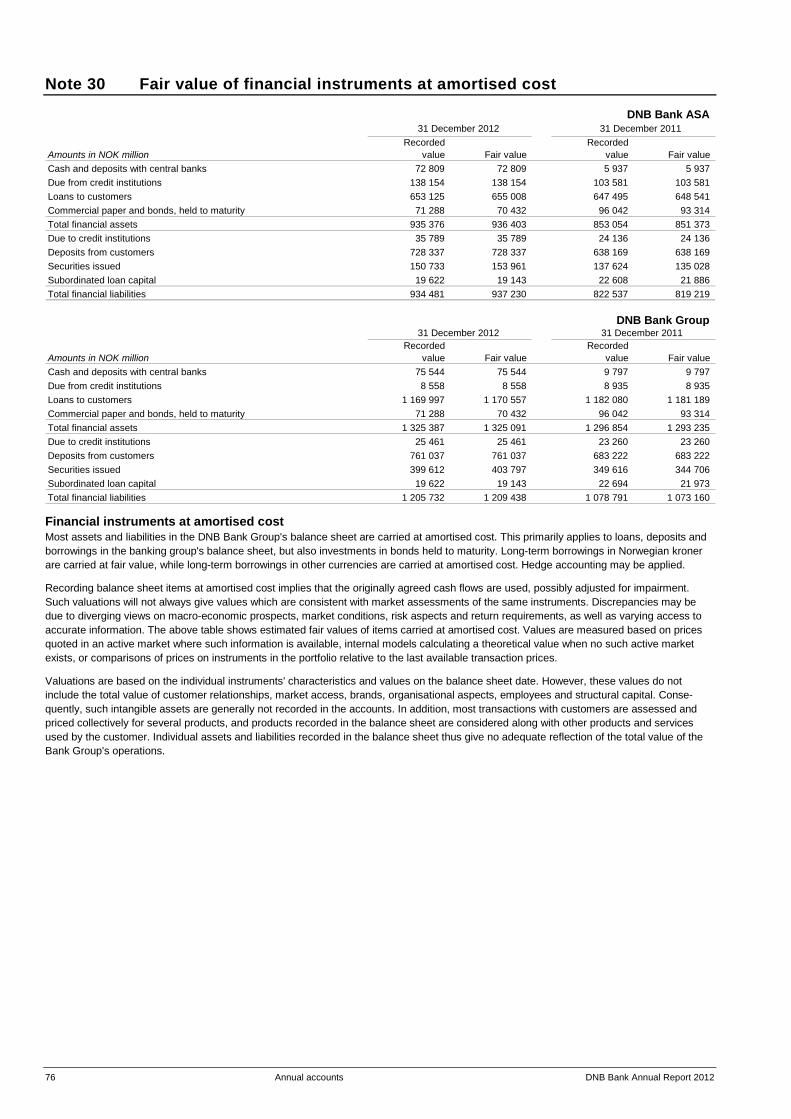
76 Annual accounts DNB Bank Annual Report 2012
Note 30 Fair value of financial instruments at amortised cost
DNB Bank ASA
Recorded Recorded Amounts in NOK million value Fair value value Fair value Cash and deposits with central banks 72 809 72 809 5 937 5 937 Due from credit institutions 138 154 138 154 103 581 103 581 Loans to customers 653 125 655 008 647 495 648 541 Commercial paper and bonds, held to maturity 71 288 70 432 96 042 93 314 Total financial assets 935 376 936 403 853 054 851 373 Due to credit institutions 35 789 35 789 24 136 24 136 Deposits from customers 728 337 728 337 638 169 638 169 Securities issued 150 733 153 961 137 624 135 028 Subordinated loan capital 19 622 19 143 22 608 21 886 Total financial liabilities 934 481 937 230 822 537 819 219
31 December 2012 31 December 2011
DNB Bank Group
Recorded Recorded Amounts in NOK million value Fair value value Fair value Cash and deposits with central banks 75 544 75 544 9 797 9 797 Due from credit institutions 8 558 8 558 8 935 8 935 Loans to customers 1 169 997 1 170 557 1 182 080 1 181 189 Commercial paper and bonds, held to maturity 71 288 70 432 96 042 93 314 Total financial assets 1 325 387 1 325 091 1 296 854 1 293 235 Due to credit institutions 25 461 25 461 23 260 23 260 Deposits from customers 761 037 761 037 683 222 683 222 Securities issued 399 612 403 797 349 616 344 706 Subordinated loan capital 19 622 19 143 22 694 21 973 Total financial liabilities 1 205 732 1 209 438 1 078 791 1 073 160
31 December 2012 31 December 2011
Financial instruments at amortised cost Most assets and liabilities in the DNB Bank Group's balance sheet are carried at amortised cost. This primarily applies to loans, deposits and borrowings in the banking group's balance sheet, but also investments in bonds held to maturity. Long-term borrowings in Norwegian kroner are carried at fair value, while long-term borrowings in other currencies are carried at amortised cost. Hedge accounting may be applied. Recording balance sheet items at amortised cost implies that the originally agreed cash flows are used, possibly adjusted for impairment. Such valuations will not always give values which are consistent with market assessments of the same instruments. Discrepancies may be due to diverging views on macro-economic prospects, market conditions, risk aspects and return requirements, as well as varying access to accurate information. The above table shows estimated fair values of items carried at amortised cost. Values are measured based on prices quoted in an active market where such information is available, internal models calculating a theoretical value when no such active market exists, or comparisons of prices on instruments in the portfolio relative to the last available transaction prices. Valuations are based on the individual instruments' characteristics and values on the balance sheet date. However, these values do not include the total value of customer relationships, market access, brands, organisational aspects, employees and structural capital. Conse-quently, such intangible assets are generally not recorded in the accounts. In addition, most transactions with customers are assessed and priced collectively for several products, and products recorded in the balance sheet are considered along with other products and services used by the customer. Individual assets and liabilities recorded in the balance sheet thus give no adequate reflection of the total value of the Bank Group's operations.

DNB Bank Annual Report 2012 Annual accounts 77
Note 30 Fair value of financial instruments at amortised cost (continued) Due from credit institutions and loans to customers The market for the purchase and sale of loan portfolios was restricted at year-end 2012. When valuing loans, the loan portfolio has been divided into the following categories: retail customers, shipping/offshore/logistics, energy, international corporates, Nordic corporates, regional corporate clients, credit institutions and DNB Finans. In addition, separate calculations have been made for DNB Baltics and Poland. The valuations are based on average margins in December, considered relative to the business units' best estimate of the potential margin requirement at year-end 2012 if the loans had been extended at that time. Differentiated margin requirements have been calculated for each category, as specified above, based on estimated costs related to lending. The margin requirement includes costs covering normalised losses, which, as opposed to impairment recorded in the annual accounts, represent a long-term assessment of loss levels. Normalised losses for shipping, offshore and logistics are above the DNB Bank Group's average normalised losses. Average credit margins increased in 2012 and are roughly on a level with the DNB Bank Group's margin requirements. In DNB Baltics and Poland loan terms, especially in Poland, are much longer than for other units in the banking group. These calculations are based on the units' best estimates for duration and market terms. There is fierce competition in the Norwegian retail market. There were no notified interest rate adjustments which had not been implemented in this market at year-end 2012. The fair value of retail loans and deposits at current prices has thus been set at amortised cost. With respect to impaired loans, an assessment has been made of potential cash flows for the loans discounted by the effective rate of interest adjusted for changes in market conditions for corresponding non-impaired loans. Loan rates prior to provisions being made reflect the increased credit risk of the commitment. Given the general uncertainty in fair value measurements, the banking group believes that the impaired value gives a good reflection of the fair value of these loans. Customers will often use loan products which are carried partly at amortised cost and partly at fair value. The profitability of a customer relationship is considered on an aggregate basis, and prices are set based on an overall evaluation. Correspondingly, a possible reduction in the customer relationship value is based on an overall assessment of all products. Any decline or change in the value of products recorded at fair value is assessed based on the difference between the agreed price and the corresponding price of new products on the balance sheet date. Any decline in value apart from price changes on specific products is included in the overall assessment of credits in the relevant customer relationship. Any reduction in the total customer relationship value is measured on the basis of amortised cost and reported under impairment on loans. Commercial paper and bonds, held to maturity (see note 35 Commercial paper and bonds, held to maturity) The portfolio has been measured at fair value according to models used for financial instruments not traded in an active market. The model applied is based on a regression analysis whereby historical market data (explanatory variables) which have been observable even during the financial turmoil are used. Due to credit institutions and deposits from customers The estimated fair value equals the balance sheet value for credit institutions. With respect to deposits from customers, fair value is assessed to equal amortised cost. Securities issued and subordinated loan capital Fair value measurement of securities issued and subordinated loan capital raised in foreign currency is based on future cash flows and assessed credit risk on the balance sheet date. The valuation is based on broker quotes. Values in connection with potential new issues are used, in the same way as for loans.

78 Annual accounts DNB Bank Annual Report 2012
Note 31 Financial instruments at fair value
DNB Bank ASA Valuation Valuation based on Valuation based on
quoted prices based on other than in an active observable observable
market market data market data Accrued Amounts in NOK million Level 1 Level 2 Level 3 interest 1) Total
Assets as at 31 December 2012Deposits with central banks 0 223 348 0 0 223 348 Due from credit institutions 0 70 291 0 201 70 492 Loans to customers 0 2 219 58 058 341 60 618 Commercial paper and bonds at fair value 65 332 174 157 589 1 649 241 728 Shareholdings 2) 6 591 128 3 144 9 864 Financial derivatives 29 119 605 877 120 511
Liabilities as at 31 December 2012Due to credit institutions 0 246 909 0 394 247 304 Deposits from customers 0 58 755 0 153 58 908 Debt securities issued 0 263 978 0 287 264 265 Subordinated loan capital 0 1 456 0 12 1 468 Financial derivatives 23 92 023 607 92 653
Assets as at 31 December 2011Deposits with central banks 0 214 775 0 9 214 784 Due from credit institutions 0 89 536 0 262 89 798 Loans to customers 0 936 63 104 433 64 472 Commercial paper and bonds at fair value 53 560 150 087 6 462 1 226 211 335 Shareholdings 2) 8 732 133 2 963 11 829 Financial derivatives 0 107 992 514 108 506
Liabilities as at 31 December 2011Due to credit institutions 0 271 427 0 321 271 748 Deposits from customers 0 66 086 0 183 66 269 Debt securities issued 0 246 475 0 368 246 842 Subordinated loan capital 0 1 450 0 12 1 462 Financial derivatives 0 87 808 399 88 207
1) Accrued interest on financial derivatives is included in the amounts in levels 2 and 3. 2) In 2011 equity-related derivatives linked to DNB Markets' market-making activities were included in Shareholdings (level 2). In 2012 equity-related derivatives
are presented in Financial derivatives.
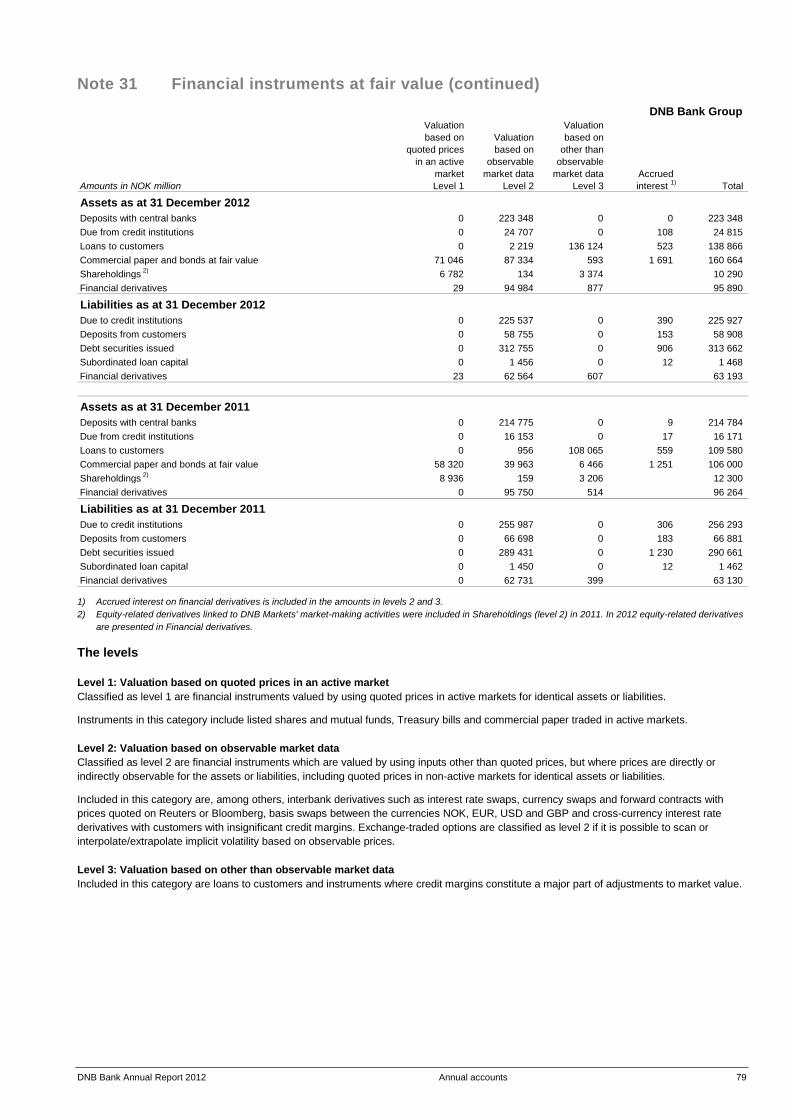
DNB Bank Annual Report 2012 Annual accounts 79
Note 31 Financial instruments at fair value (continued) DNB Bank Group
Valuation Valuation based on Valuation based on
quoted prices based on other than in an active observable observable
market market data market data Accrued Amounts in NOK million Level 1 Level 2 Level 3 interest 1) Total
Assets as at 31 December 2012Deposits with central banks 0 223 348 0 0 223 348 Due from credit institutions 0 24 707 0 108 24 815 Loans to customers 0 2 219 136 124 523 138 866 Commercial paper and bonds at fair value 71 046 87 334 593 1 691 160 664 Shareholdings 2) 6 782 134 3 374 10 290 Financial derivatives 29 94 984 877 95 890
Liabilities as at 31 December 2012Due to credit institutions 0 225 537 0 390 225 927 Deposits from customers 0 58 755 0 153 58 908 Debt securities issued 0 312 755 0 906 313 662 Subordinated loan capital 0 1 456 0 12 1 468 Financial derivatives 23 62 564 607 63 193
Assets as at 31 December 2011Deposits with central banks 0 214 775 0 9 214 784 Due from credit institutions 0 16 153 0 17 16 171 Loans to customers 0 956 108 065 559 109 580 Commercial paper and bonds at fair value 58 320 39 963 6 466 1 251 106 000 Shareholdings 2) 8 936 159 3 206 12 300 Financial derivatives 0 95 750 514 96 264
Liabilities as at 31 December 2011Due to credit institutions 0 255 987 0 306 256 293 Deposits from customers 0 66 698 0 183 66 881 Debt securities issued 0 289 431 0 1 230 290 661 Subordinated loan capital 0 1 450 0 12 1 462 Financial derivatives 0 62 731 399 63 130
1) Accrued interest on financial derivatives is included in the amounts in levels 2 and 3. 2) Equity-related derivatives linked to DNB Markets' market-making activities were included in Shareholdings (level 2) in 2011. In 2012 equity-related derivatives
are presented in Financial derivatives. The levels Level 1: Valuation based on quoted prices in an active market Classified as level 1 are financial instruments valued by using quoted prices in active markets for identical assets or liabilities. Instruments in this category include listed shares and mutual funds, Treasury bills and commercial paper traded in active markets. Level 2: Valuation based on observable market data Classified as level 2 are financial instruments which are valued by using inputs other than quoted prices, but where prices are directly or indirectly observable for the assets or liabilities, including quoted prices in non-active markets for identical assets or liabilities. Included in this category are, among others, interbank derivatives such as interest rate swaps, currency swaps and forward contracts with prices quoted on Reuters or Bloomberg, basis swaps between the currencies NOK, EUR, USD and GBP and cross-currency interest rate derivatives with customers with insignificant credit margins. Exchange-traded options are classified as level 2 if it is possible to scan or interpolate/extrapolate implicit volatility based on observable prices. Level 3: Valuation based on other than observable market data Included in this category are loans to customers and instruments where credit margins constitute a major part of adjustments to market value.
80 Annual accounts DNB Bank Annual Report 2012
Note 31 Financial instruments at fair value (continued) The instruments in the different levels Due from credit institutions (level 2) The item is primarily relevant for DNB Markets. The valuation of loans to and deposits with credit institutions is mainly based on agreed interest rate terms measured against a swap curve. The fixed-rate period is relatively short. Loans to customers (level 3) Loans consist primarily of fixed-rate loans in Norwegian kroner and parts of the portfolio of margin loans in Norwegian kroner. The value of fixed-rate loans is determined by discounting agreed interest flows over the term of the loan, using a discount factor adjusted for margin requirements. A margin requirement is calculated for margin loans, and the difference between the margin requirement and the agreed margin is discounted over the average expected time to the repricing of the loan. In addition, DNB Baltics and Poland has a small portfolio of loans carried at fair value. Commercial paper and bonds (levels 2 and 3) The valuation in level 2 is primarily based on observable market data in the form of interest rate curves, exchange rates and credit margins related to the individual credit and the characteristics of the bond or commercial paper. For paper classified as level 3, the valuation is based on indicative prices from third parties or comparable paper. Equities including mutual fund holdings (levels 2 and 3) Equities in level 2 comprise mutual fund holdings where the underlying investments are quoted equities, as well as a small volume of other mutual funds. Instruments which are classified as level 3 essentially comprise property funds, limited partnership units, private equity investments and investments in unquoted equities. Financial derivatives (levels 2 and 3) Financial derivatives classified as level 2 are primarily currency forward contracts and interest rate and currency swaps. The valuation is based on swap curves, and credit margins constitute a minor part of the value. In addition, the item comprises derivatives related to commodities and forward rate agreements. These are valued based on observable market prices. Derivatives classified as level 2 also comprise equity derivatives used in DNB Markets' market-making activities. Most of these derivatives are related to the most traded equities on Oslo Børs, and the valuation is based on the price development of the relevant/underlying equity and observable or estimated volatility. Financial derivatives classified as level 3 are primarily connected to currency options, interest rate options in Norwegian kroner, as well as index derivatives. The valuation is based on indicative prices from third parties. Due to credit institutions (level 2) See "Due from credit institutions" above. The item also includes borrowings from Norges Bank in connection with the Norwegian government's covered bonds exchange scheme. The funding obtained through this scheme totalled NOK 50.0 billion at year-end 2012. See note 50 Information on related parties. Deposits from customers (level 2) Deposits carried at fair value include special-term deposits. The valuation is primarily based on measurement in relation to a swap curve, and changes in credit margins have an insignificant effect. Debt securities issued (level 2) The valuation is primarily based on observable market data in the form of interest rate curves and credit margins. The item consists mainly of funding in Norwegian kroner. For foreign currency funding, hedge accounting is used where hedges are entered into. In all other respects, debt securities issued are carried at amortised cost. Subordinated loan capital (level 2) Subordinated loans carried at fair value consist of two loans in Norwegian kroner, and the valuation is based on observable interest rate curves and credit margins.
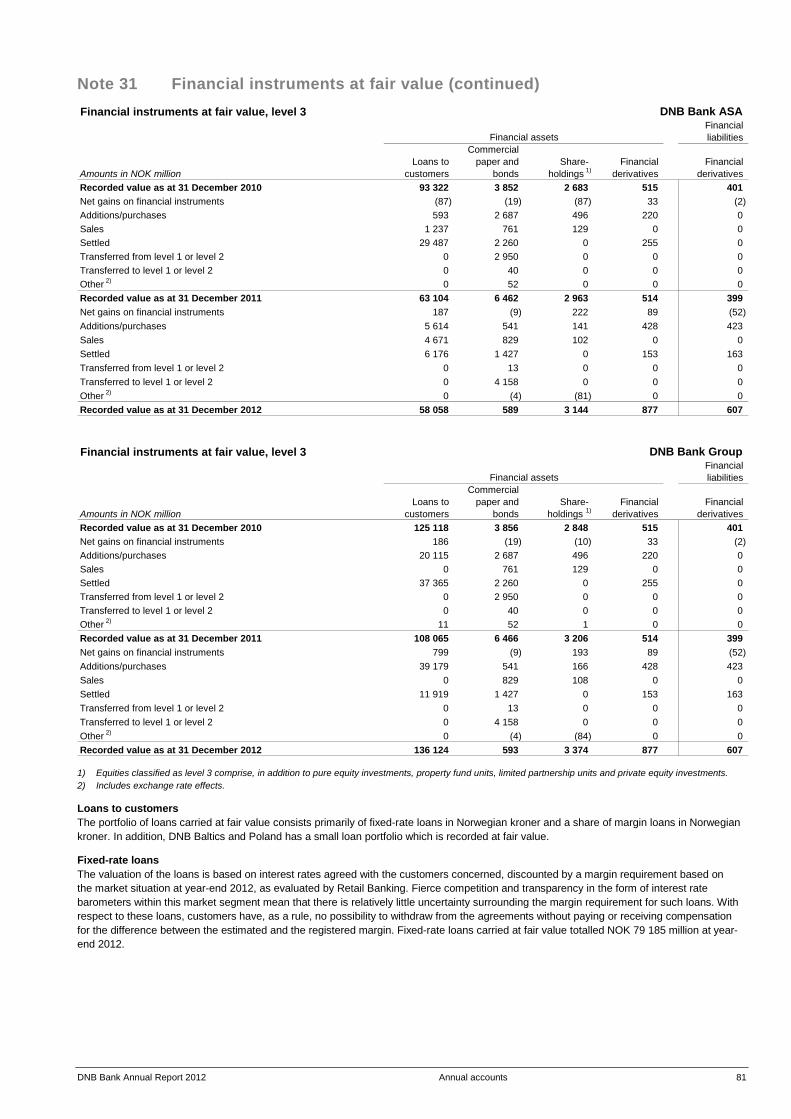
DNB Bank Annual Report 2012 Annual accounts 81
Note 31 Financial instruments at fair value (continued) Financial instruments at fair value, level 3 DNB Bank ASA
Financial liabilities
Commercial Loans to paper and Share- Financial Financial
Amounts in NOK million customers bonds holdings 1) derivatives derivatives Recorded value as at 31 December 2010 93 322 3 852 2 683 515 401 Net gains on financial instruments (87) (19) (87) 33 (2) Additions/purchases 593 2 687 496 220 0 Sales 1 237 761 129 0 0 Settled 29 487 2 260 0 255 0 Transferred from level 1 or level 2 0 2 950 0 0 0 Transferred to level 1 or level 2 0 40 0 0 0 Other 2) 0 52 0 0 0 Recorded value as at 31 December 2011 63 104 6 462 2 963 514 399 Net gains on financial instruments 187 (9) 222 89 (52) Additions/purchases 5 614 541 141 428 423 Sales 4 671 829 102 0 0 Settled 6 176 1 427 0 153 163 Transferred from level 1 or level 2 0 13 0 0 0 Transferred to level 1 or level 2 0 4 158 0 0 0 Other 2) 0 (4) (81) 0 0 Recorded value as at 31 December 2012 58 058 589 3 144 877 607
Financial assets
Financial instruments at fair value, level 3 DNB Bank Group
Financial liabilities
Commercial Loans to paper and Share- Financial Financial
Amounts in NOK million customers bonds holdings 1) derivatives derivatives Recorded value as at 31 December 2010 125 118 3 856 2 848 515 401 Net gains on financial instruments 186 (19) (10) 33 (2) Additions/purchases 20 115 2 687 496 220 0 Sales 0 761 129 0 0 Settled 37 365 2 260 0 255 0 Transferred from level 1 or level 2 0 2 950 0 0 0 Transferred to level 1 or level 2 0 40 0 0 0 Other 2) 11 52 1 0 0 Recorded value as at 31 December 2011 108 065 6 466 3 206 514 399 Net gains on financial instruments 799 (9) 193 89 (52) Additions/purchases 39 179 541 166 428 423 Sales 0 829 108 0 0 Settled 11 919 1 427 0 153 163 Transferred from level 1 or level 2 0 13 0 0 0 Transferred to level 1 or level 2 0 4 158 0 0 0 Other 2) 0 (4) (84) 0 0 Recorded value as at 31 December 2012 136 124 593 3 374 877 607
Financial assets
1) Equities classified as level 3 comprise, in addition to pure equity investments, property fund units, limited partnership units and private equity investments. 2) Includes exchange rate effects.
Loans to customers The portfolio of loans carried at fair value consists primarily of fixed-rate loans in Norwegian kroner and a share of margin loans in Norwegian kroner. In addition, DNB Baltics and Poland has a small loan portfolio which is recorded at fair value.
Fixed-rate loans The valuation of the loans is based on interest rates agreed with the customers concerned, discounted by a margin requirement based on the market situation at year-end 2012, as evaluated by Retail Banking. Fierce competition and transparency in the form of interest rate barometers within this market segment mean that there is relatively little uncertainty surrounding the margin requirement for such loans. With respect to these loans, customers have, as a rule, no possibility to withdraw from the agreements without paying or receiving compensation for the difference between the estimated and the registered margin. Fixed-rate loans carried at fair value totalled NOK 79 185 million at year-end 2012.
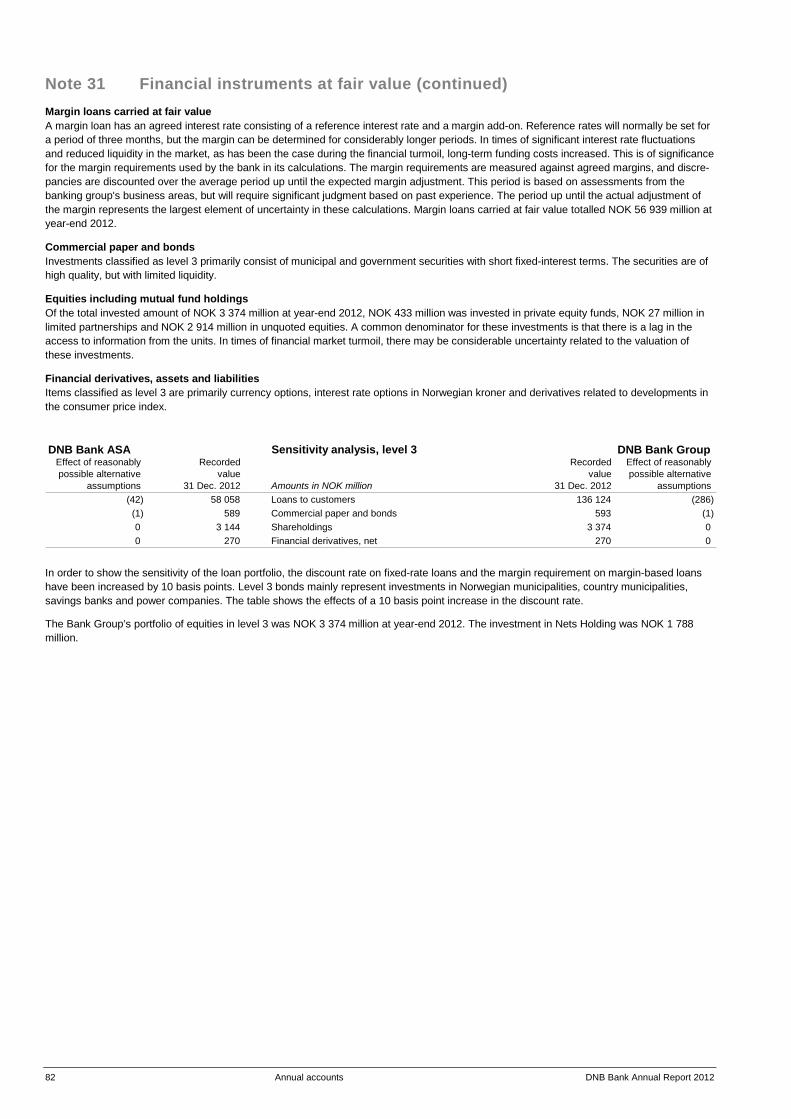
82 Annual accounts DNB Bank Annual Report 2012
Note 31 Financial instruments at fair value (continued) Margin loans carried at fair value A margin loan has an agreed interest rate consisting of a reference interest rate and a margin add-on. Reference rates will normally be set for a period of three months, but the margin can be determined for considerably longer periods. In times of significant interest rate fluctuations and reduced liquidity in the market, as has been the case during the financial turmoil, long-term funding costs increased. This is of significance for the margin requirements used by the bank in its calculations. The margin requirements are measured against agreed margins, and discre-pancies are discounted over the average period up until the expected margin adjustment. This period is based on assessments from the banking group's business areas, but will require significant judgment based on past experience. The period up until the actual adjustment of the margin represents the largest element of uncertainty in these calculations. Margin loans carried at fair value totalled NOK 56 939 million at year-end 2012.
Commercial paper and bonds Investments classified as level 3 primarily consist of municipal and government securities with short fixed-interest terms. The securities are of high quality, but with limited liquidity.
Equities including mutual fund holdings Of the total invested amount of NOK 3 374 million at year-end 2012, NOK 433 million was invested in private equity funds, NOK 27 million in limited partnerships and NOK 2 914 million in unquoted equities. A common denominator for these investments is that there is a lag in the access to information from the units. In times of financial market turmoil, there may be considerable uncertainty related to the valuation of these investments.
Financial derivatives, assets and liabilities Items classified as level 3 are primarily currency options, interest rate options in Norwegian kroner and derivatives related to developments in the consumer price index. DNB Bank ASA Sensitivity analysis, level 3 DNB Bank Group
Effect of reasonably Recorded Recorded Effect of reasonably possible alternative value value possible alternative
assumptions 31 Dec. 2012 Amounts in NOK million 31 Dec. 2012 assumptions (42) 58 058 Loans to customers 136 124 (286)
(1) 589 Commercial paper and bonds 593 (1) 0 3 144 Shareholdings 3 374 0 0 270 Financial derivatives, net 270 0
In order to show the sensitivity of the loan portfolio, the discount rate on fixed-rate loans and the margin requirement on margin-based loans have been increased by 10 basis points. Level 3 bonds mainly represent investments in Norwegian municipalities, country municipalities, savings banks and power companies. The table shows the effects of a 10 basis point increase in the discount rate. The Bank Group’s portfolio of equities in level 3 was NOK 3 374 million at year-end 2012. The investment in Nets Holding was NOK 1 788 million.

DNB Bank Annual Report 2012 Annual accounts 83
Note 32 Shareholdings Investments in shares, mutual funds and equity certificates 1)
DNB Bank ASA DNB Bank Group 31 Dec. 31 Dec. 31 Dec. 31 Dec.
2011 2012 Amounts in NOK million 2012 2011 11 829 9 864 Total investments in shares, mutual funds and equity certificates 10 290 12 300
Specification of the largest investments in shares, mutual funds and equity certificates as at 31 December 2012
DNB Bank ASA Ownership
Number share in RecordedRecorded value in NOK 1 000 of shares per cent 2) value
Financial institutionsGjensidige Forsikring 3) 397 896 0.1 31 593 Storebrand 3) 657 623 0.1 17 637 Other financial institutions 144 954 Total financial institutions 194 185
Norwegian companiesAlgeta 3) 260 675 0.6 40 352 Cermaq 3) 4 346 000 4.7 363 977 DNB Eiendomsinvest I 3) 5 253 854 14.5 363 167 DNO International 3) 6 420 228 0.6 59 804 E6 Logistikk 3) 1 388 979 96.5 118 063 IT Fornebu Properties 16 198 752 12.6 207 930 Marine Harvest 3) 107 392 288 2.9 549 849 Norsk Hydro 3) 6 458 455 0.3 180 062 Odfjell ASA 3) 2 366 070 11.2 53 710 Odfjell SE 3) 5 878 344 8.9 141 080 Orkla 3) 3 036 235 0.3 147 257 Statoil 3) 2 850 432 0.1 396 210 Telenor 3) 1 371 269 0.1 153 856 Yara International 3) 1 459 646 0.5 399 651 Other Norwegian companies 570 358 Total Norwegian companies 3 745 328
Companies based abroadCalpine 3) 1 650 000 0.3 165 772 Deep Sea Supply 3) 4 500 105 3.5 44 596 Golar 3) 875 000 7.5 182 000 Nets Holding 33 547 173 18.2 1 787 577 North Atlantic Drilling 3) 3 557 220 1.5 209 876 Pacific Drilling 3) 4 551 600 6.6 237 458 Prosafe 3) 260 846 0.1 12 343 Rowan Cos. 3) 6 050 000 4.9 1 045 169 Royal Caribbean Cruises 3) 172 362 0.1 31 715 Seadrill 3) 7 314 240 1.6 1 486 985 Subsea 7 3) 400 522 0.1 52 909 Other companies based abroad 77 921 Total companies based abroad 5 334 321
Mutual fundsInterest funds 0 Combination funds 0 Mutual funds 117 014 Private equity funds 433 389
Other funds 39 287 Total mutual funds 589 690
Total investments in shares, mutual funds and equity sertificates 9 863 524
DNB Bank Group Ownership
Number share in RecordedRecorded value in NOK 1 000 of shares per cent 2) value
Financial institutionsGjensidige Forsikring 3) 397 896 0.1 31 593 Storebrand 3) 657 623 0.1 17 637 Other financial institutions 148 048 Total financial institutions 197 279
Norwegian companiesAlgeta 3) 260 675 0.6 40 352 Alpinco 315 495 18.1 63 099 Cermaq 3) 4 346 000 4.7 363 977 DNB Eiendomsinvest I 3) 5 253 854 14.5 363 167 DNO International 3) 6 420 228 0.6 59 804
E6 Logistikk 3) 1 388 979 96.5 118 063 Finn Eiendom 755 7.6 82 318 IT Fornebu Properties 16 198 752 12.6 207 930 Marine Harvest 3) 107 392 288 2.9 549 849 Norsk Hydro 3) 6 458 455 0.3 180 062 Odfjell ASA 3) 2 366 070 11.2 53 710 Odfjell SE 3) 5 878 344 8.9 141 080 Orkla 3) 3 036 235 0.3 147 257 Statoil 3) 2 850 432 0.1 396 210 Telenor 3) 1 371 269 0.1 153 856 Yara International 3) 1 459 646 0.5 399 651 Other Norwegian companies 571 056 Total Norwegian companies 3 891 442
Companies based abroadCalpine 3) 1 650 000 0.3 165 772 Cape Investment 9 261 13.9 84 122 Deep Sea Supply 3) 4 500 105 3.5 44 596 Golar 3) 875 000 7.5 182 000 Nets Holding 33 547 173 18.2 1 787 577 North Atlantic Drilling 3) 3 557 220 1.5 209 876 Pacific Drilling 3) 4 551 600 6.6 237 458 Prosafe 3) 260 846 0.1 12 343 Rowan Cos. 3) 6 050 000 4.9 1 045 169 Royal Caribbean Cruises 3) 172 362 0.1 31 715 Seadrill 3) 7 314 240 1.6 1 486 985 Subsea 7 3) 400 522 0.1 52 909 Other companies based abroad 79 608 Total companies based abroad 5 420 130
Mutual fundsInterest funds 5 421 Combination funds 1 374 Mutual funds 117 014 Private equity funds 433 389 Other funds 223 898 Total mutual funds 781 096
Total investments in shares, mutual funds and equity sertificates 10 289 947 1) Equity certificates represent investments in savings banks. 2) Ownership share in per cent is based on the company's total share capital and does not include derivative contracts. 3) Shares and funds carried at fair value in DNB Markets totalled NOK 7 230 million at year-end 2012. DNB Markets' equity investment are mainly an instrument
in hedging its equity derivative exposure through the business area's market making activities. Value at Risk for the equity operations in DNB Markets represented approximately NOK 5.6 million at year-end 2012.
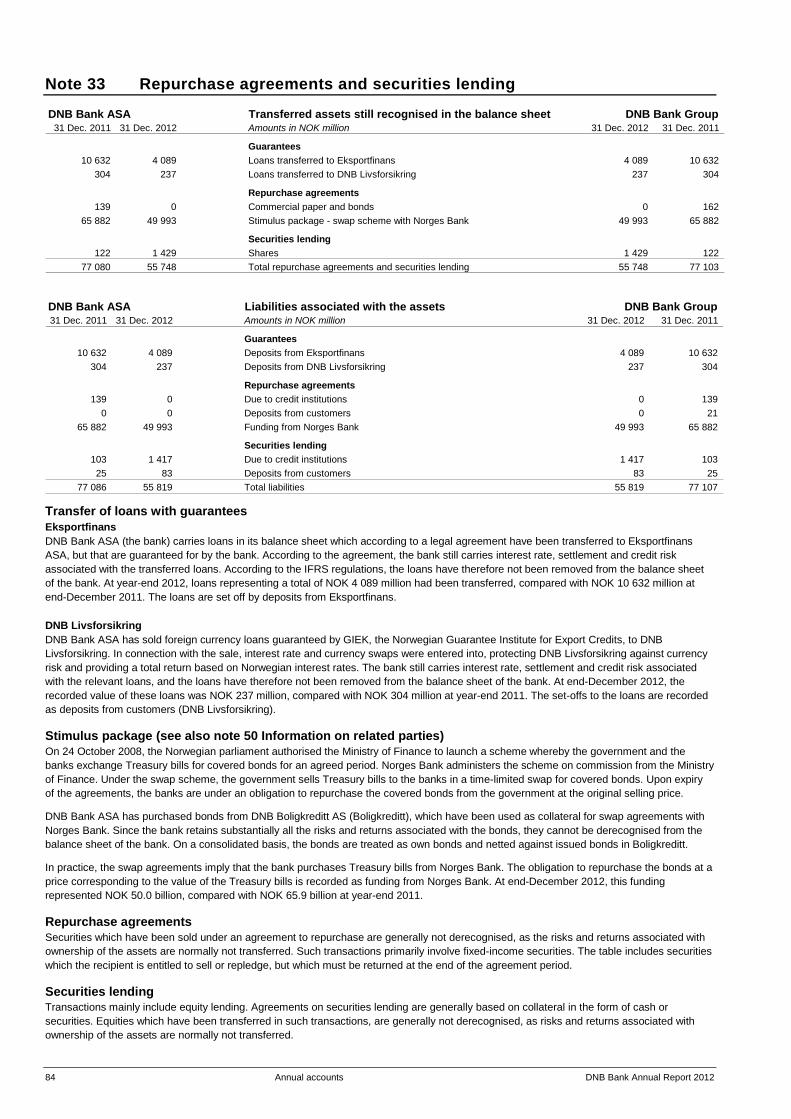
84 Annual accounts DNB Bank Annual Report 2012
Note 33 Repurchase agreements and securities lending
DNB Bank ASA Transferred assets still recognised in the balance sheet DNB Bank Group 31 Dec. 2011 31 Dec. 2012 Amounts in NOK million 31 Dec. 2012 31 Dec. 2011
Guarantees10 632 4 089 Loans transferred to Eksportfinans 4 089 10 632
304 237 Loans transferred to DNB Livsforsikring 237 304
Repurchase agreements139 0 Commercial paper and bonds 0 162
65 882 49 993 Stimulus package - swap scheme with Norges Bank 49 993 65 882
Securities lending 122 1 429 Shares 1 429 122
77 080 55 748 Total repurchase agreements and securities lending 55 748 77 103 DNB Bank ASA Liabilities associated with the assets DNB Bank Group 31 Dec. 2011 31 Dec. 2012 Amounts in NOK million 31 Dec. 2012 31 Dec. 2011
Guarantees10 632 4 089 Deposits from Eksportfinans 4 089 10 632
304 237 Deposits from DNB Livsforsikring 237 304
Repurchase agreements139 0 Due to credit institutions 0 139
0 0 Deposits from customers 0 21 65 882 49 993 Funding from Norges Bank 49 993 65 882
Securities lending 103 1 417 Due to credit institutions 1 417 103 25 83 Deposits from customers 83 25
77 086 55 819 Total liabilities 55 819 77 107 Transfer of loans with guarantees Eksportfinans DNB Bank ASA (the bank) carries loans in its balance sheet which according to a legal agreement have been transferred to Eksportfinans ASA, but that are guaranteed for by the bank. According to the agreement, the bank still carries interest rate, settlement and credit risk associated with the transferred loans. According to the IFRS regulations, the loans have therefore not been removed from the balance sheet of the bank. At year-end 2012, loans representing a total of NOK 4 089 million had been transferred, compared with NOK 10 632 million at end-December 2011. The loans are set off by deposits from Eksportfinans. DNB Livsforsikring DNB Bank ASA has sold foreign currency loans guaranteed by GIEK, the Norwegian Guarantee Institute for Export Credits, to DNB Livsforsikring. In connection with the sale, interest rate and currency swaps were entered into, protecting DNB Livsforsikring against currency risk and providing a total return based on Norwegian interest rates. The bank still carries interest rate, settlement and credit risk associated with the relevant loans, and the loans have therefore not been removed from the balance sheet of the bank. At end-December 2012, the recorded value of these loans was NOK 237 million, compared with NOK 304 million at year-end 2011. The set-offs to the loans are recorded as deposits from customers (DNB Livsforsikring). Stimulus package (see also note 50 Information on related parties) On 24 October 2008, the Norwegian parliament authorised the Ministry of Finance to launch a scheme whereby the government and the banks exchange Treasury bills for covered bonds for an agreed period. Norges Bank administers the scheme on commission from the Ministry of Finance. Under the swap scheme, the government sells Treasury bills to the banks in a time-limited swap for covered bonds. Upon expiry of the agreements, the banks are under an obligation to repurchase the covered bonds from the government at the original selling price. DNB Bank ASA has purchased bonds from DNB Boligkreditt AS (Boligkreditt), which have been used as collateral for swap agreements with Norges Bank. Since the bank retains substantially all the risks and returns associated with the bonds, they cannot be derecognised from the balance sheet of the bank. On a consolidated basis, the bonds are treated as own bonds and netted against issued bonds in Boligkreditt. In practice, the swap agreements imply that the bank purchases Treasury bills from Norges Bank. The obligation to repurchase the bonds at a price corresponding to the value of the Treasury bills is recorded as funding from Norges Bank. At end-December 2012, this funding represented NOK 50.0 billion, compared with NOK 65.9 billion at year-end 2011. Repurchase agreements Securities which have been sold under an agreement to repurchase are generally not derecognised, as the risks and returns associated with ownership of the assets are normally not transferred. Such transactions primarily involve fixed-income securities. The table includes securities which the recipient is entitled to sell or repledge, but which must be returned at the end of the agreement period. Securities lending Transactions mainly include equity lending. Agreements on securities lending are generally based on collateral in the form of cash or securities. Equities which have been transferred in such transactions, are generally not derecognised, as risks and returns associated with ownership of the assets are normally not transferred.
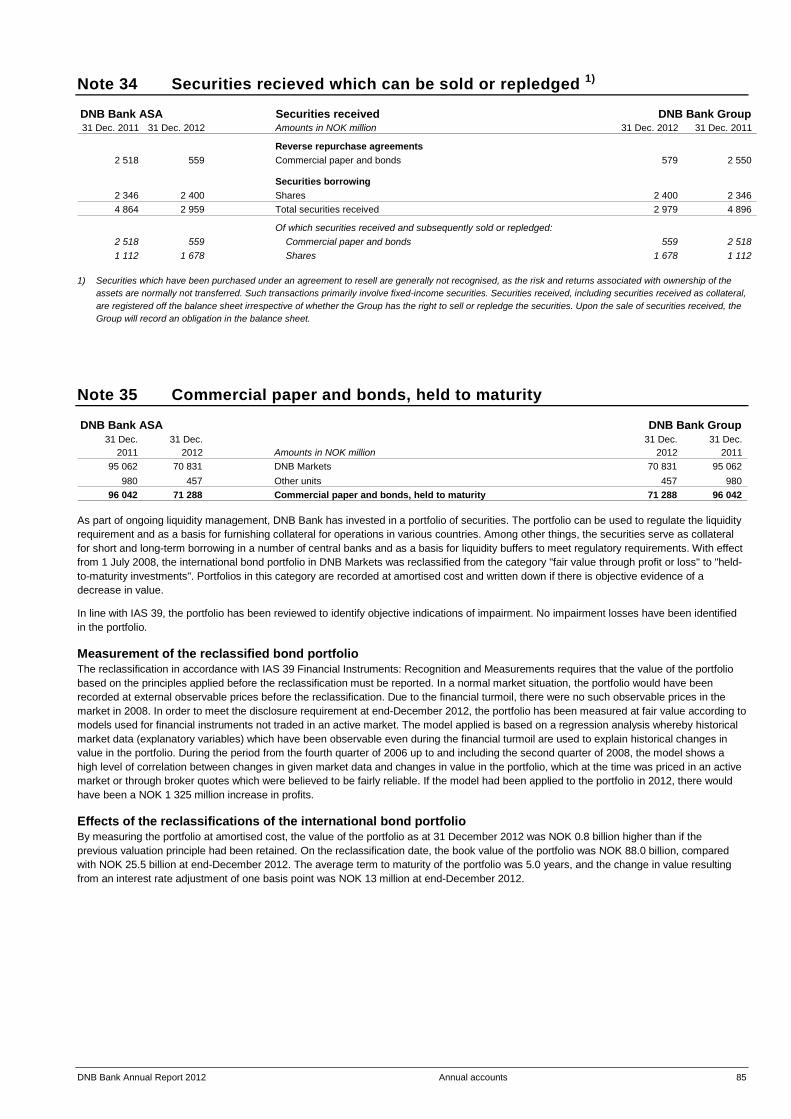
DNB Bank Annual Report 2012 Annual accounts 85
Note 34 Securities recieved which can be sold or repledged 1)
DNB Bank ASA Securities received DNB Bank Group 31 Dec. 2011 31 Dec. 2012 Amounts in NOK million 31 Dec. 2012 31 Dec. 2011
Reverse repurchase agreements2 518 559 Commercial paper and bonds 579 2 550
Securities borrowing 2 346 2 400 Shares 2 400 2 346 4 864 2 959 Total securities received 2 979 4 896
Of which securities received and subsequently sold or repledged:2 518 559 Commercial paper and bonds 559 2 518 1 112 1 678 Shares 1 678 1 112
1) Securities which have been purchased under an agreement to resell are generally not recognised, as the risk and returns associated with ownership of the
assets are normally not transferred. Such transactions primarily involve fixed-income securities. Securities received, including securities received as collateral, are registered off the balance sheet irrespective of whether the Group has the right to sell or repledge the securities. Upon the sale of securities received, the Group will record an obligation in the balance sheet.
Note 35 Commercial paper and bonds, held to maturity
DNB Bank ASA DNB Bank Group 31 Dec. 31 Dec. 31 Dec. 31 Dec.
2011 2012 Amounts in NOK million 2012 2011 95 062 70 831 DNB Markets 70 831 95 062
980 457 Other units 457 980 96 042 71 288 Commercial paper and bonds, held to maturity 71 288 96 042
As part of ongoing liquidity management, DNB Bank has invested in a portfolio of securities. The portfolio can be used to regulate the liquidity requirement and as a basis for furnishing collateral for operations in various countries. Among other things, the securities serve as collateral for short and long-term borrowing in a number of central banks and as a basis for liquidity buffers to meet regulatory requirements. With effect from 1 July 2008, the international bond portfolio in DNB Markets was reclassified from the category "fair value through profit or loss" to "held-to-maturity investments". Portfolios in this category are recorded at amortised cost and written down if there is objective evidence of a decrease in value. In line with IAS 39, the portfolio has been reviewed to identify objective indications of impairment. No impairment losses have been identified in the portfolio. Measurement of the reclassified bond portfolio The reclassification in accordance with IAS 39 Financial Instruments: Recognition and Measurements requires that the value of the portfolio based on the principles applied before the reclassification must be reported. In a normal market situation, the portfolio would have been recorded at external observable prices before the reclassification. Due to the financial turmoil, there were no such observable prices in the market in 2008. In order to meet the disclosure requirement at end-December 2012, the portfolio has been measured at fair value according to models used for financial instruments not traded in an active market. The model applied is based on a regression analysis whereby historical market data (explanatory variables) which have been observable even during the financial turmoil are used to explain historical changes in value in the portfolio. During the period from the fourth quarter of 2006 up to and including the second quarter of 2008, the model shows a high level of correlation between changes in given market data and changes in value in the portfolio, which at the time was priced in an active market or through broker quotes which were believed to be fairly reliable. If the model had been applied to the portfolio in 2012, there would have been a NOK 1 325 million increase in profits. Effects of the reclassifications of the international bond portfolio By measuring the portfolio at amortised cost, the value of the portfolio as at 31 December 2012 was NOK 0.8 billion higher than if the previous valuation principle had been retained. On the reclassification date, the book value of the portfolio was NOK 88.0 billion, compared with NOK 25.5 billion at end-December 2012. The average term to maturity of the portfolio was 5.0 years, and the change in value resulting from an interest rate adjustment of one basis point was NOK 13 million at end-December 2012.
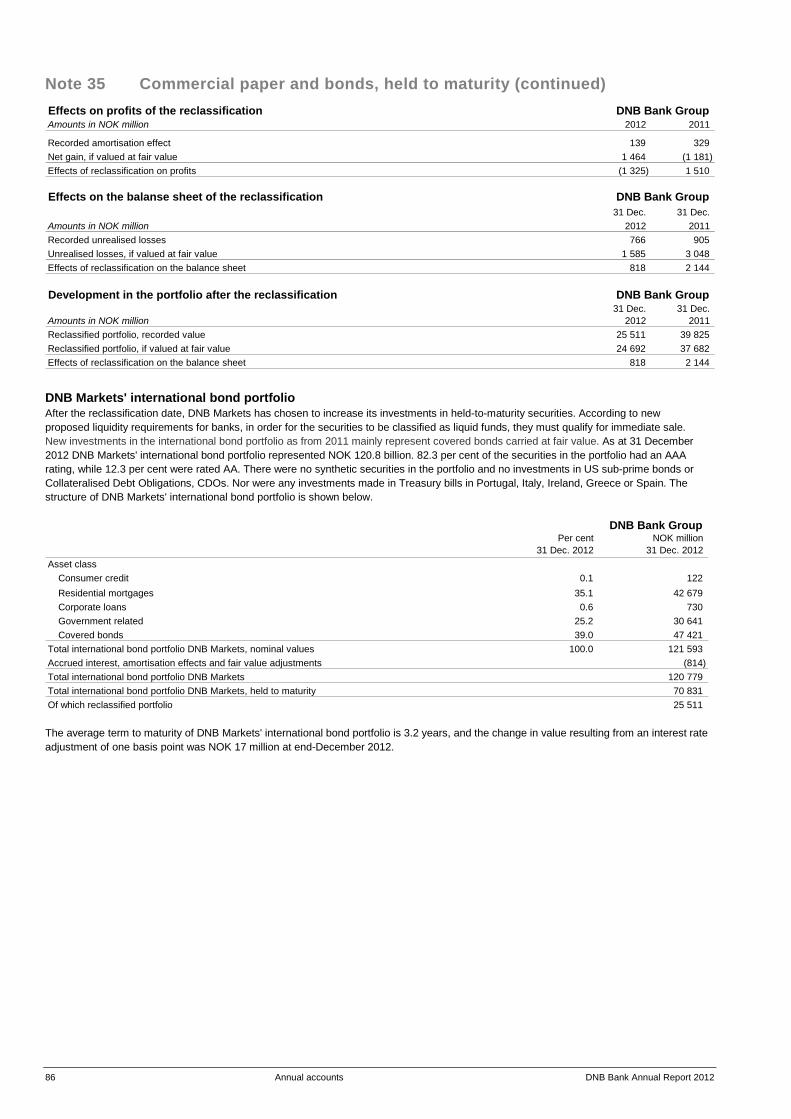
86 Annual accounts DNB Bank Annual Report 2012
Note 35 Commercial paper and bonds, held to maturity (continued) Effects on profits of the reclassification DNB Bank Group Amounts in NOK million 2012 2011
Recorded amortisation effect 139 329 Net gain, if valued at fair value 1 464 (1 181) Effects of reclassification on profits (1 325) 1 510
Effects on the balanse sheet of the reclassification DNB Bank Group 31 Dec. 31 Dec.
Amounts in NOK million 2012 2011 Recorded unrealised losses 766 905 Unrealised losses, if valued at fair value 1 585 3 048 Effects of reclassification on the balance sheet 818 2 144
Development in the portfolio after the reclassification DNB Bank Group 31 Dec. 31 Dec.
Amounts in NOK million 2012 2011 Reclassified portfolio, recorded value 25 511 39 825 Reclassified portfolio, if valued at fair value 24 692 37 682 Effects of reclassification on the balance sheet 818 2 144 DNB Markets' international bond portfolio After the reclassification date, DNB Markets has chosen to increase its investments in held-to-maturity securities. According to new proposed liquidity requirements for banks, in order for the securities to be classified as liquid funds, they must qualify for immediate sale. New investments in the international bond portfolio as from 2011 mainly represent covered bonds carried at fair value. As at 31 December 2012 DNB Markets' international bond portfolio represented NOK 120.8 billion. 82.3 per cent of the securities in the portfolio had an AAA rating, while 12.3 per cent were rated AA. There were no synthetic securities in the portfolio and no investments in US sub-prime bonds or Collateralised Debt Obligations, CDOs. Nor were any investments made in Treasury bills in Portugal, Italy, Ireland, Greece or Spain. The structure of DNB Markets' international bond portfolio is shown below.
DNB Bank Group Per cent NOK million
31 Dec. 2012 31 Dec. 2012 Asset class
Consumer credit 0.1 122 Residential mortgages 35.1 42 679 Corporate loans 0.6 730 Government related 25.2 30 641 Covered bonds 39.0 47 421
Total international bond portfolio DNB Markets, nominal values 100.0 121 593 Accrued interest, amortisation effects and fair value adjustments (814) Total international bond portfolio DNB Markets 120 779 Total international bond portfolio DNB Markets, held to maturity 70 831 Of which reclassified portfolio 25 511 The average term to maturity of DNB Markets' international bond portfolio is 3.2 years, and the change in value resulting from an interest rate adjustment of one basis point was NOK 17 million at end-December 2012.

DNB Bank Annual Report 2012 Annual accounts 87
Note 36 Investment properties
Amounts included in the income statement DNB Bank Group Amounts in NOK million 2012 2011 Rental income from investment properties 271 130 Direct expenses (including repairs and maintenance) related to investment properties generating rental income 105 53 Direct expenses (including repairs and maintenance) related to investment properties not generating rental income 32 20 Total 134 57 Changes in the value of investment properties DNB Bank Group Amounts in NOK million Investment properties Recorded value as at 31 December 2010 2 872 Additions, purchases of new properties 649 Additions, capitalised investments 39 Additions, acquired companies 1 809 Net gains resulting from adjustment to fair value (31) Disposals 142 Exchange rate movements etc. (32) Recorded value as at 31 December 2011 5 165 Additions, purchases of new properties 338 Additions, capitalised investments 61 Additions, acquired companies 285 Net gains resulting from adjustment to fair value (403) Disposals 237 Exchange rate movements etc. (175) Recorded value as at 31 December 2012 5 034
Contractual commitments related to the acquisition or construction of investment properties, not capitalised as at 31 December 2012 0
Note 37 Investments in associated companies
DNB Bank Group Amounts in NOK million 2012 2011 Recorded value as at 1 January 2 173 2 291 Share of profits after tax (6 704) 11 861 Impairment of the ownership interest in Eksportfinans AS 1) 7 492 (11 785) Additions/disposals (63) 30 Dividends (32) (225) Recorded value as at 31 December 2) 2 866 2 173
DNB Bank Group Ownership Recorded Recorded
Assets Liabilities share (%) value value 31 Dec. 31 Dec. Income Profit 31 Dec. 31 Dec. 31 Dec.
Amounts in NOK million 2012 3) 2012 3) 2012 3) 2012 3) 2012 2012 2011 Eksportfinans AS 1) 157 406 140 468 (24 515) (17 756) 40 2 631 1 878 Amports Inc. 837 211 135 74 30 115 122 Nordito Property AS 271 233 200 199 40 106 85 Other associated companies 14 88 Total 2 866 2 173
1) Moody’s and Standard & Poor’s downgrades of Eksportfinans’ credit rating in the fourth quarter of 2011 resulted in sizeable unrealised gains on the company’s long-term funding. The effect of such unrealised gains on DNB’s holding, after tax, represented NOK 11.8 billion in the fourth quarter of 2011. After reviewing the fair value of the company in connection with the closing of the annual accounts, DNB wrote down the value by an amount corresponding to unrealised gains on Eksportfinans’ own debt in the fourth quarter of 2011. In 2012, the required rate of return in the market has been reduced, and Eksportfinans has sizeable unrealised losses on own debt. The impairment loss recorded by DNB in the fourth quarter of 2011 has been reversed by an amount corresponding to these unrealised losses. The reversal represented just under NOK 7.5 billion of DNB’s holding after tax. The impairment loss in 2011 and the reversal in 2012 have been reported on the line ”Profit from companies accounted for by the equity method” along with DNB’s share of profits from the company. See also note 50 Information on related parties.
2) Include deferred tax positions and value adjustments not reflected in the company's balance sheet. 3) Values in the accounts of associated companies. Preliminary and unaudited accounts have been used.
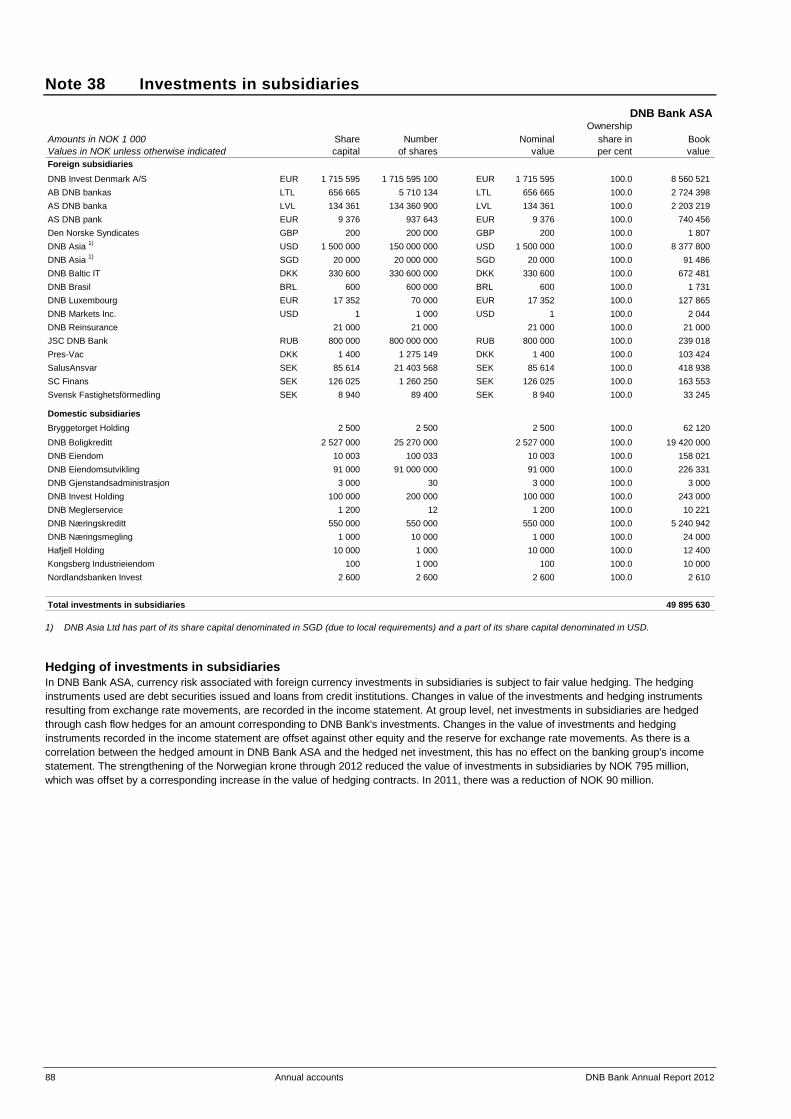
88 Annual accounts DNB Bank Annual Report 2012
Note 38 Investments in subsidiaries DNB Bank ASA
Ownership Amounts in NOK 1 000 Share Number Nominal share in Book Values in NOK unless otherwise indicated capital of shares value per cent value Foreign subsidiariesDNB Invest Denmark A/S EUR 1 715 595 1 715 595 100 EUR 1 715 595 100.0 8 560 521 AB DNB bankas LTL 656 665 5 710 134 LTL 656 665 100.0 2 724 398 AS DNB banka LVL 134 361 134 360 900 LVL 134 361 100.0 2 203 219 AS DNB pank EUR 9 376 937 643 EUR 9 376 100.0 740 456 Den Norske Syndicates GBP 200 200 000 GBP 200 100.0 1 807 DNB Asia 1) USD 1 500 000 150 000 000 USD 1 500 000 100.0 8 377 800 DNB Asia 1) SGD 20 000 20 000 000 SGD 20 000 100.0 91 486 DNB Baltic IT DKK 330 600 330 600 000 DKK 330 600 100.0 672 481 DNB Brasil BRL 600 600 000 BRL 600 100.0 1 731 DNB Luxembourg EUR 17 352 70 000 EUR 17 352 100.0 127 865 DNB Markets Inc. USD 1 1 000 USD 1 100.0 2 044 DNB Reinsurance 21 000 21 000 21 000 100.0 21 000 JSC DNB Bank RUB 800 000 800 000 000 RUB 800 000 100.0 239 018 Pres-Vac DKK 1 400 1 275 149 DKK 1 400 100.0 103 424 SalusAnsvar SEK 85 614 21 403 568 SEK 85 614 100.0 418 938 SC Finans SEK 126 025 1 260 250 SEK 126 025 100.0 163 553 Svensk Fastighetsförmedling SEK 8 940 89 400 SEK 8 940 100.0 33 245
Domestic subsidiaries Bryggetorget Holding 2 500 2 500 2 500 100.0 62 120 DNB Boligkreditt 2 527 000 25 270 000 2 527 000 100.0 19 420 000 DNB Eiendom 10 003 100 033 10 003 100.0 158 021 DNB Eiendomsutvikling 91 000 91 000 000 91 000 100.0 226 331 DNB Gjenstandsadministrasjon 3 000 30 3 000 100.0 3 000 DNB Invest Holding 100 000 200 000 100 000 100.0 243 000 DNB Meglerservice 1 200 12 1 200 100.0 10 221 DNB Næringskreditt 550 000 550 000 550 000 100.0 5 240 942 DNB Næringsmegling 1 000 10 000 1 000 100.0 24 000 Hafjell Holding 10 000 1 000 10 000 100.0 12 400 Kongsberg Industrieiendom 100 1 000 100 100.0 10 000 Nordlandsbanken Invest 2 600 2 600 2 600 100.0 2 610 Total investments in subsidiaries 49 895 630
1) DNB Asia Ltd has part of its share capital denominated in SGD (due to local requirements) and a part of its share capital denominated in USD. Hedging of investments in subsidiaries In DNB Bank ASA, currency risk associated with foreign currency investments in subsidiaries is subject to fair value hedging. The hedging instruments used are debt securities issued and loans from credit institutions. Changes in value of the investments and hedging instruments resulting from exchange rate movements, are recorded in the income statement. At group level, net investments in subsidiaries are hedged through cash flow hedges for an amount corresponding to DNB Bank's investments. Changes in the value of investments and hedging instruments recorded in the income statement are offset against other equity and the reserve for exchange rate movements. As there is a correlation between the hedged amount in DNB Bank ASA and the hedged net investment, this has no effect on the banking group's income statement. The strengthening of the Norwegian krone through 2012 reduced the value of investments in subsidiaries by NOK 795 million, which was offset by a corresponding increase in the value of hedging contracts. In 2011, there was a reduction of NOK 90 million.
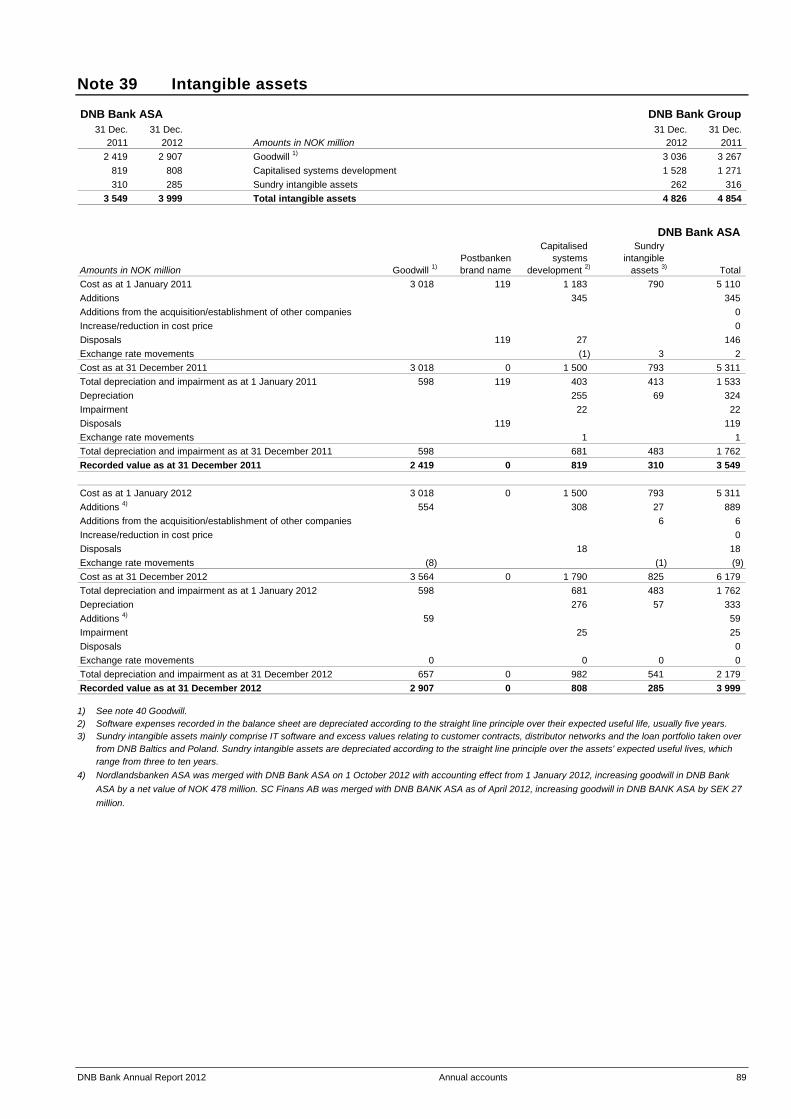
DNB Bank Annual Report 2012 Annual accounts 89
Note 39 Intangible assets
DNB Bank ASA DNB Bank Group 31 Dec. 31 Dec. 31 Dec. 31 Dec.
2011 2012 Amounts in NOK million 2012 2011 2 419 2 907 Goodwill 1) 3 036 3 267
819 808 Capitalised systems development 1 528 1 271 310 285 Sundry intangible assets 262 316
3 549 3 999 Total intangible assets 4 826 4 854
DNB Bank ASA Capitalised Sundry
Postbanken systems intangible Amounts in NOK million Goodwill 1) brand name development 2) assets 3) Total Cost as at 1 January 2011 3 018 119 1 183 790 5 110 Additions 345 345 Additions from the acquisition/establishment of other companies 0 Increase/reduction in cost price 0 Disposals 119 27 146 Exchange rate movements (1) 3 2 Cost as at 31 December 2011 3 018 0 1 500 793 5 311 Total depreciation and impairment as at 1 January 2011 598 119 403 413 1 533 Depreciation 255 69 324 Impairment 22 22 Disposals 119 119 Exchange rate movements 1 1 Total depreciation and impairment as at 31 December 2011 598 681 483 1 762 Recorded value as at 31 December 2011 2 419 0 819 310 3 549
Cost as at 1 January 2012 3 018 0 1 500 793 5 311 Additions 4) 554 308 27 889 Additions from the acquisition/establishment of other companies 6 6 Increase/reduction in cost price 0 Disposals 18 18 Exchange rate movements (8) (1) (9) Cost as at 31 December 2012 3 564 0 1 790 825 6 179 Total depreciation and impairment as at 1 January 2012 598 681 483 1 762 Depreciation 276 57 333 Additions 4) 59 59 Impairment 25 25 Disposals 0 Exchange rate movements 0 0 0 0 Total depreciation and impairment as at 31 December 2012 657 0 982 541 2 179 Recorded value as at 31 December 2012 2 907 0 808 285 3 999
1) See note 40 Goodwill. 2) Software expenses recorded in the balance sheet are depreciated according to the straight line principle over their expected useful life, usually five years. 3) Sundry intangible assets mainly comprise IT software and excess values relating to customer contracts, distributor networks and the loan portfolio taken over
from DNB Baltics and Poland. Sundry intangible assets are depreciated according to the straight line principle over the assets' expected useful lives, which range from three to ten years.
4) Nordlandsbanken ASA was merged with DNB Bank ASA on 1 October 2012 with accounting effect from 1 January 2012, increasing goodwill in DNB Bank ASA by a net value of NOK 478 million. SC Finans AB was merged with DNB BANK ASA as of April 2012, increasing goodwill in DNB BANK ASA by SEK 27 million.

90 Annual accounts DNB Bank Annual Report 2012
Note 39 Intangible assets (continued) DNB Bank Group
Capitalised Sundry Postbanken systems intangible
Amounts in NOK million Goodwill 1) brand name development 2) 3) assets 4) Total Cost as at 1 January 2011 5 169 119 2 047 959 8 294 Additions 23 640 23 687 Additions from the acquisition/establishment of other companies 27 27 Increase/reduction in cost price 0 Disposals 119 28 147 Exchange rate movements (41) (15) (56) Cost as at 31 December 2011 5 151 0 2 644 1 010 8 805 Total depreciation and impairment as at 1 January 2011 1 698 119 886 589 3 292 Depreciation 275 106 381 Impairment 190 213 403 Disposals 119 119 Exchange rate movements (4) (2) (1) (7) Total depreciation and impairment as at 31 December 2011 1 884 1 372 695 3 951 Recorded value as at 31 December 2011 3 267 0 1 271 316 4 854
Cost as at 1 January 2012 5 151 0 2 644 1 010 8 805 Additions 50 878 141 1 070 Additions from the acquisition/establishment of other companies 4 39 43 Increase/reduction in cost price 0 Disposals 5) 333 273 145 751 Exchange rate movements (28) (30) (5) (64) Cost as at 31 December 2012 4 840 0 3 223 1 041 9 103 Total depreciation and impairment as at 1 January 2012 1 884 1 372 695 3 951 Depreciation 297 84 382 Impairment 85 25 110 Disposals 5) 153 153 Exchange rate movements (12) 0 0 (12) Total depreciation and impairment as at 31 December 2012 1 804 0 1 695 779 4 279 Recorded value as at 31 December 2012 3 036 0 1 528 262 4 826
1) See note 40 Goodwill. 2) Software expenses recorded in the balance sheet are depreciated according to the straight line principle over their expected useful life, usually five years. 3) In consequence of lower growth prospects in the Lithuanian market, it was decided to write down the IT solutions by EUR 24.5 million, the equivalent of
NOK 191 million, in 2011. Impairment losses of NOK 22 million were recorded for Postbanken’s IT systems in 2011 following the conversion of Postbanken’s customer accounts to DNB’s IT systems.
4) Sundry intangible assets mainly comprise IT software and excess values relating to customer contracts and distributor networks. Sundry intangible assets are depreciated according to the straight line principle over the assets' expected useful lives, which range from three to ten years.
5) In September 2012, an agreement was signed on the sale of SalusAnsvar AB in Sweden, and the assets were reclassified as “held for sale” as from October 2012. The sale was formally completed in late January 2013.

DNB Bank Annual Report 2012 Annual accounts 91
Note 40 Goodwill
The DNB Bank Group continually reviews whether the value of recorded goodwill and other intangible assets with an indefinite useful life is intact, and a complete impairment test of all cash-generating units is performed at least once a year. In the DNB Bank Group's balance sheet, the individual goodwill items and intangible assets with an indefinite useful life are allocated to cash-generating units according to which units benefit from the acquired asset. The cash-generating unit is chosen based on considerations relating to where it is possible to identify and distinguish cash flows related to the unit. A cash-generating unit may record goodwill from several transactions, and an impairment test is then performed on the total goodwill entered in the accounts in the cash-generating unit. Testing of values and key assumptions used in value in use calculations Impairment testing of capitalised values is done by discounting expected future cash flows from the unit. The assessments are based on value in use of the cash-generating units. The value in use represents the sum total of the estimated present value of expected cash flows for the plan period and projected cash flows after the plan period. Cash flows for the plan period normally have a three-year perspective based on budgets and plans approved by management. It must be possible to prove that budgets and plans based on past performance in the relevant unit are realistic. In the medium term, projections beyond the plan period are based on the expected economic growth rate for the cash-generating units. In the long-term an annual growth of 2.5 per cent is anticipated, which equals the expected long-term inflation rate. When a deviating long-term growth rate is used for cash-generating units, an explanation is provided in the description below. The discount rate is based on an assessment of the market's required rate of return for the type of activity performed in the cash-generating unit. This required rate of return reflects the risk of operations. Impairment tests are generally performed on cash flows after tax in order to be able to directly employ the market's required rate of return. If the test shows that there may be a need for impairment, an assessment is also made of the pre-tax value of the cash flows. In assessments for the 2012 accounting year, a discount rate based on an adjusted capital asset pricing model has been used with a normalized risk-free interest rate in the unit's home market plus a normalized risk premium of 4 per cent. Beta values are estimated for each cash-generating unit. The normalised risk free interest rate is estimated to 5 per cent for units in Norway and Sweden. For units where recorded goodwill approximates the estimated value in use, DNB has carried out sensitivity analyses. These consider whether a change of key assumptions used in valuations of a unit would result in its capitalised value exceeding its value in use. Sensitivity analyses carried out in 2012 showed that probable changes in key assumptions for cash flows did not result in any need for impairment. DNB Bank ASA Goodwill DNB Bank Group
Recorded Recorded Recorded Recorded 31 Dec. 2011 31 Dec. 2012 Unit 31 Dec. 2012 31 Dec. 2011
1 465 1 465 Retail Banking - parent bank 1 465 1 465 502 502 Cresco 502 502 365 365 DNB Finans - car financing in Norway 365 365 367 361 DNB Finans - car financing in Sweden 361 367 221 214 Other 343 568
2 419 2 907 Total goodwill 3 036 3 267 Retail Banking – parent bank The unit encompasses banking operations (loans and deposits) in the regional network in Norway, including the former Nordlandsbanken, and recorded goodwill mainly represents goodwill from the merger between DnB and Gjensidige NOR, the acquisition of Nordlandsbanken, and some goodwill from previously acquired offices in Gjensidige NOR. Key assumptions for cash flows during the plan period are developments in margins, volumes and impairment of loans. The long-term growth factor of 2.5 per cent has been used also in the medium term. A required rate of return corresponding to 12.5 per cent before tax has been used. Cresco The unit encompasses external distribution of credit cards under the Cresco brand. Goodwill stems from the merger between DnB and Gjensidige NOR and the previous acquisition premium from the acquisition of Gjensidige Bank's credit card portfolio. Key assumptions for cash flows during the plan period are developments in margins, volumes and impairment of loans. A medium-term negative growth factor of 2.0 per cent has been used in the calculations. This is due to the fact that the assumption of a gradual increase in money market rates during the period will cause pressure on margins in these operations. A required rate of return corresponding to 12.5 per cent before tax has been used.
92 Annual accounts DNB Bank Annual Report 2012
Note 40 Goodwill (continued) DNB Finans – car financing in Norway The unit encompasses DNB’s car financing operations in Norway, and goodwill stems from DNB’s acquisition of Skandiabanken Bilfinans' operations in Norway with effect from 2008. Critical assumptions for cash flows during the plan period are car sales figures in Norway and DNB Finans' ability to retain customer relations with important car dealers, along with long-term margin developments and the level of impairment of loans. The long-term growth factor of 2.5 per cent has been used also in the medium term. A required rate of return corresponding to 12.5 per cent before tax has been used. DNB Finans – car financing in Sweden The unit encompasses DNB Finans' car financing operations and leasing portfolio in Sweden. Goodwill stems from the previous acquisition of leasing portfolios and operations within vendor-based car financing in Sweden, and from the acquisition of Skandiabanken's car financing operations in Sweden in 2008. Key assumptions for cash flows are car sales figures in Sweden and DNB Finans' ability to retain customer relations with important car dealers, along with long-term margin developments and the level of impairment of loans. The long-term growth factor of 2.5 per cent has been used also in the medium term. A required rate of return corresponding to 12.5 per cent before tax has been used. Recorded impairment losses Impairment losses per unit DNB Bank Group Amounts in NOK million 2012 2011 SalusAnsvar AB 47 Pres-Vac Engineering Aps 38 DNB Baltics and Poland 190 Total impairment losses on intangible assets with indefinite useful life 85 190
SalusAnsvar AB Impairment losses for goodwill related to SalusAnsvar AB of SEK 55 million were recorded in the third quarter of 2012 after an agreement on the sale of the company had been concluded. The sale has been approved by the supervisory authorities and will be reflected in the accounts as from the first quarter of 2013. The remaining goodwill of SEK 210 million and other intangible assets of SEK 80 million were reclassified as “Assets held for sale” in the fourth quarter of 2012. Pres-Vac Engineering Aps Impairment losses for goodwill related to Pres-Vac Engineering Aps of DKK 38 million were recorded in the third quarter of 2012 due to market developments for the company, which, among other things, produces tank valves for ships which transport liquid cargo. DNB Baltics and Poland Remaining goodwill in DNB Baltics and Poland was impaired in 2011. Recorded goodwill was related to operations in Poland. In consequence of lower growth prospects in the Polish market, it was decided to record impairment losses for the remaining goodwill.
DNB Bank Annual Report 2012 Annual accounts 93
Note 41 Fixed assets
DNB Bank ASA DNB Bank Group 31 Dec. 31 Dec. 31 Dec. 31 Dec.
2011 2012 Amounts in NOK million 2012 2011 133 637 Bank buildings and other properties 1 161 690 637 790 Machinery, equipment and vehicles 923 797
4 680 5 075 Fixed assets operating leases 5 081 4 694 47 73 Other fixed assets 146 142
5 497 6 575 Total fixed assets 7 311 6 322
DNB Bank ASA Bank buildings Machinery, Fixed assets
and other equipment and operating Amounts in NOK million properties vehicles 1) leases 1) 2) Total 3)
Accumulated cost as at 31 December 2011 172 3 503 7 662 11 336 Additions 559 611 2 068 3 238 Additions from the mergers/aquisitions/establishment of other companies 0 0 0 0Fixed assets, reclassified as held for sale 0 0 0 0Disposals 4 33 2 944 2 981 Exchange rate movements (1) (3) (59) (63) Cost as at 31 December 2012 725 4 079 6 726 11 530 Total depreciation and impairment as at 31 December 2011 39 2 866 2 982 5 886 Additions from the mergers/aquisitions/establishment of other companies 44 172 0 216Disposals 0 21 2 262 2 283 Depreciation 4) 6 257 935 1 199 Impairment 0 14 0 14 Exchange rate movements 0 1 (4) (3) Total depreciation and impairment as at 31 December 2012 89 3 288 1 651 5 028 Recorded value as at 31 December 2012 637 790 5 075 6 502
DNB Bank Group Bank buildings Machinery, Fixed assets
and other equipment and operating Amounts in NOK million properties vehicles 1) leases 1) 2) Total 3)
Accumulated cost as at 31 December 2011 854 4 225 7 702 12 782Additions 619 495 2 068 3 183Additions from the mergers/aquisitions/establishment of other companies 43 0 0 44Fixed assets, reclassified as held for sale 22 0 0 22Disposals 113 70 2 970 3 152Exchange rate movements 36 15 (57) (6)Cost as at 31 December 2012 1 418 4 665 6 744 12 827Total depreciation and impairment as at 31 December 2011 165 3 428 3 008 6 601Additions from the mergers/aquisitions/establishment of other companies 58 24 0 83Disposals (0) 47 2 280 2 327Depreciation 4) 31 306 938 1 275Impairment 2 32 0 34Exchange rate movements 1 1 (4) (3)Total depreciation and impairment as at 31 December 2012 257 3 743 1 663 5 663Recorded value as at 31 December 2012 1 161 923 5 081 7 165
1) Including computer equipment and related software. 2) With effect from 2012, assets which were previously classified under machinery, equipment and vehicles are classified under operational leasing. 3) The total does not include "Other fixed assets". 4) Based on cost less any residual value, other assets are subject to straight-line depreciation over their expected useful life within the following limits:
Technical installations 10 years Machinery 3-10 years Fixtures and fittings 5-10 years Computer equipment 3-5 years Means of transport 5-7 years
The DNB Bank ASA has not placed any collateral for loans/funding of fixed assets, including property.

94 Annual accounts DNB Bank Annual Report 2012
Note 42 Leasing
DNB Bank ASA Financial leases (as lessor) DNB Bank Group 31 Dec. 31 Dec. 31 Dec. 31 Dec.
2011 2012 Amounts in NOK million 2012 2011 Gross investment in the lease
8 421 8 610 Due within 1 year 9 272 9 341 21 700 22 188 Due in 1-5 years 23 840 22 981 2 267 2 318 Due in more than 5 years 2 354 2 299
32 388 33 117 Total gross investment in the lease 35 466 34 620 Present value of minimum lease payments
8 160 8 344 Due within 1 year 9 102 8 921 17 469 17 862 Due in 1-5 years 19 058 18 584 1 503 1 537 Due in more than 5 years 1 562 1 531
27 132 27 742 Total present value of lease payments 29 722 29 036 5 257 5 375 Unearned financial income 5 745 5 584
47 46 Unguaranteed residual values accruing to the lessor 46 47
1 378 1 345 Accumulated loan-loss provisions 1 492 1 532 37 36 Variable lease payments recognised as income during the period 92 107
DNB Bank ASA Operational leases (as lessor) DNB Bank Group
31 Dec. 31 Dec. 31 Dec. 31 Dec. 2011 2012 Amounts in NOK million 2012 2011
Future minimum lease payments under non-cancellable leases297 320 Due within 1 year 321 297
1 471 1 582 Due in 1-5 years 1 584 1 471 28 31 Due in more than 5 years 31 28
1 796 1 932 Total future minimum lease payments under non-cancellable leases 1 936 1 796 DNB Bank ASA Operational leases (as lessee) DNB Bank Group
31 Dec. 31 Dec. 31 Dec. 31 Dec. 2011 2012 Amounts in NOK million 2012 2011
Minimum future lease payments under non-cancellable leases 149 104 Due within 1 year 114 165
1 154 1 309 Due in 1-5 years 1 396 1 320 7 432 6 463 Due in more than 5 years 6 463 7 466 8 735 7 876 Total minimum future lease payments under non-cancellable leases 7 973 8 950
Total minimum future sublease payments expected to be received under320 382 non-cancellable subleases 217 150
DNB Bank ASA DNB Bank Group 2011 2012 Amounts in NOK million 2012 2011
Leases recognised as an expense during the period826 990 Minimum lease payments 1 033 866
0 0 Variable lease payments 0 0 826 990 Total leases recognised as an expense during the period 1 033 866
29 35 Impairment of leases 35 29 Financial leases (as lessor) The DNB Bank Group's financial leasing operations apply to DNB Bank ASA and DNB Baltics and Poland. Operational leases (as lessor) Comprises operational leasing operations in DNB Bank ASA and DNB Baltics and Poland. Operational leases (as lessee) Mainly comprises premises leased by DNB Bank ASA. The DNB Bank ASA and the DNB Bank Group’s contractual minimum lease payments which are due in more than five years include the contract to lease new headquarters in Bjørvika in Oslo, which will be taken into use in 2012, 2013 and 2014. DNB Livsforsikring entered into a contract in 2012 to purchase the buildings which will become DNB’s new headquarters in Bjørvika. The company will take over the buildings upon completion.
DNB Bank Annual Report 2012 Annual accounts 95
Note 43 Other assets
DNB Bank ASA DNB Bank Group 31 Dec. 31 Dec. 31 Dec. 31 Dec.
2011 2012 Amounts in NOK million 2012 2011 3 452 562 Accrued expenses and prepaid revenues 689 1 793
808 931 Amounts outstanding on documentary credits and other payment services 954 808 5 380 6 473 Unsettled contract notes 6 510 5 380 5 749 4 708 Other amounts outstanding 1) 4 492 4 811
15 389 12 673 Total other assets 2) 12 645 12 792 1) DNB Bank ASA had outstanding group contributions totaling NOK 429 million as at 31 December 2012. 2) Other assets are generally of a short-term nature.
Note 44 Deposits from customers for principal customer groups 1)
DNB Bank ASA DNB Bank Group 31 Dec. 31 Dec. 31 Dec. 31 Dec.
2011 2012 Amounts in NOK million 2012 2011 250 169 283 865 Retail customers 299 274 274 444 54 834 54 825 Transportation by sea and pipelines and vessel construction 55 121 54 942 37 900 39 667 Real estate 41 128 40 249 24 326 25 269 Manufacturing 27 023 26 271
120 933 126 847 Services 132 513 125 747 31 317 35 643 Trade 37 852 33 408 35 338 36 652 Oil and gas 36 681 35 340 20 971 34 949 Transportation and communication 36 427 22 716 16 220 15 520 Building and construction 16 814 18 128 14 389 22 848 Power and water supply 24 211 16 621
4 004 4 152 Seafood 4 218 5 270 1 936 2 556 Hotels and restaurants 2 638 2 075 3 116 3 007 Agriculture and forestry 4 188 4 062
23 434 37 362 Central and local government 38 657 24 658 64 750 63 263 Finance 62 307 65 287
703 636 786 425 Total deposits from customers, nominal amount 819 054 749 218 802 820 Adjustments 891 885
704 438 787 245 Deposits from customers 819 945 750 102
1) The breakdown into principal customer groups is based on standardised sector and industry categories set up by Statistics Norway.
96 Annual accounts DNB Bank Annual report 2012
Note 45 Debt securities issued
DNB Bank ASA 31 Dec. 31 Dec.
Amounts in NOK million 2012 2011 Commercial paper issued, nominal amount 244 088 228 415 Bond debt, nominal amount 1) 160 656 149 165 Adjustments 10 254 6 887 Total debt securities issued 414 998 384 467 Changes in debt securities issued DNB Bank ASA
Balance sheet Matured/ Exchange rate Other Balance sheet 31 Dec. Issued redeemed movements adjustments 31 Dec.
Amounts in NOK million 2012 2012 2012 2012 2012 2011 Commercial paper issued, nominal amount 244 088 814 517 798 843 228 415 Bond debt, nominal amount 1) 160 656 40 230 22 031 (6 708) 149 165 Adjustments 10 254 3 367 6 887 Total debt securities issued 414 998 854 746 820 874 (6 708) 3 367 384 467 Maturity of debt securities issued recorded at amortised cost as at 31 December 2012 1) 2) DNB Bank ASA
Foreign Amounts in NOK million NOK currency Total 2013 0 18 086 18 086 2014 0 33 484 33 484 2015 0 6 970 6 970 2016 0 9 410 9 410 2017 0 23 738 23 738 2018 0 3 751 3 751 2019 and later 0 46 130 46 130 Total bond debt, recorded at amortised cost, nominal amount 0 141 568 141 568
Maturity of debt securities issued recorded at fair value as at 31 December 2012 1) DNB Bank ASA Foreign
Amounts in NOK million NOK currency Total 2013 78 244 010 244 088 Total commercial paper issued, nominal amount 78 244 010 244 088 2013 1 513 0 1 513 2014 8 058 0 8 058 2015 2 0 2 2016 990 0 990 2017 2 625 0 2 625 2018 3 200 0 3 200 2019 and later 2 700 0 2 700 Total bond debt, nominal amount 19 088 0 19 088 Total debt securities issued recorded at fair value, nominal amount 19 166 244 010 263 176
Adjustments 1 053 9 201 10 254 Debt securities issued 20 219 394 778 414 998
1) Minus own bonds. 2) Includes hedged items.
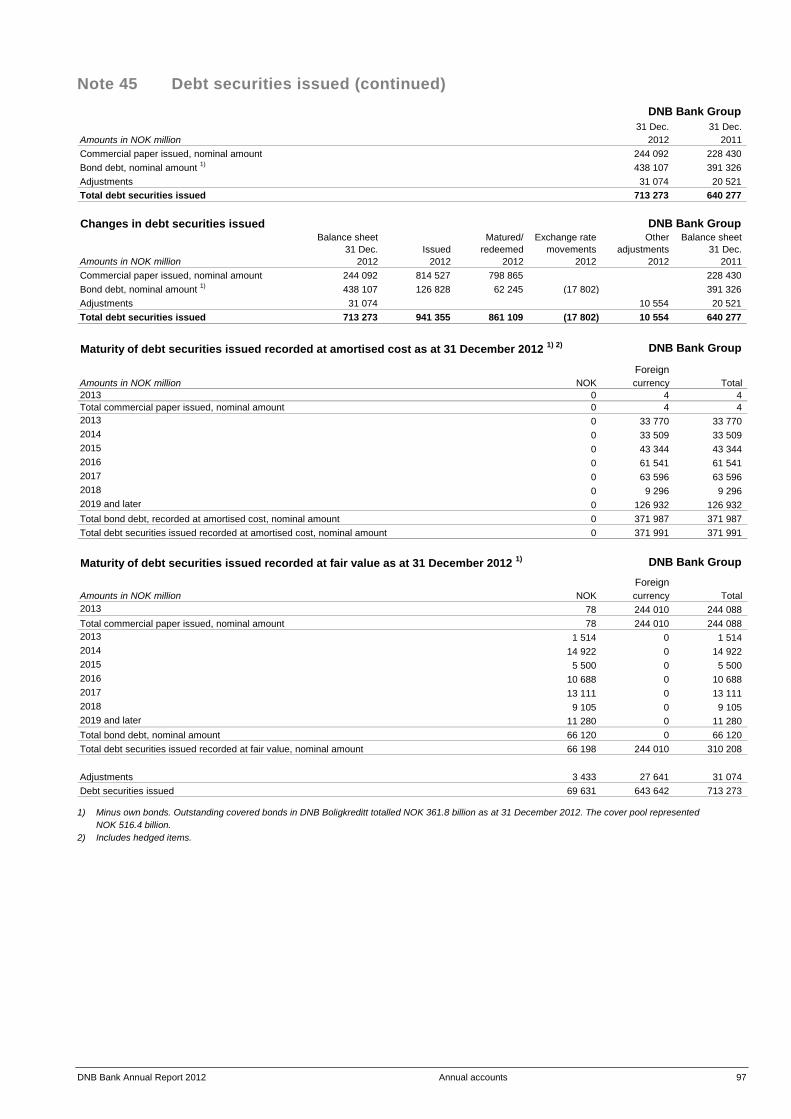
DNB Bank Annual Report 2012 Annual accounts 97
Note 45 Debt securities issued (continued) DNB Bank Group
31 Dec. 31 Dec. Amounts in NOK million 2012 2011 Commercial paper issued, nominal amount 244 092 228 430 Bond debt, nominal amount 1) 438 107 391 326 Adjustments 31 074 20 521 Total debt securities issued 713 273 640 277 Changes in debt securities issued DNB Bank Group
Balance sheet Matured/ Exchange rate Other Balance sheet 31 Dec. Issued redeemed movements adjustments 31 Dec.
Amounts in NOK million 2012 2012 2012 2012 2012 2011 Commercial paper issued, nominal amount 244 092 814 527 798 865 228 430 Bond debt, nominal amount 1) 438 107 126 828 62 245 (17 802) 391 326 Adjustments 31 074 10 554 20 521 Total debt securities issued 713 273 941 355 861 109 (17 802) 10 554 640 277 Maturity of debt securities issued recorded at amortised cost as at 31 December 2012 1) 2) DNB Bank Group
Foreign Amounts in NOK million NOK currency Total 2013 0 4 4 Total commercial paper issued, nominal amount 0 4 4 2013 0 33 770 33 770 2014 0 33 509 33 509 2015 0 43 344 43 344 2016 0 61 541 61 541 2017 0 63 596 63 596 2018 0 9 296 9 296 2019 and later 0 126 932 126 932 Total bond debt, recorded at amortised cost, nominal amount 0 371 987 371 987 Total debt securities issued recorded at amortised cost, nominal amount 0 371 991 371 991
Maturity of debt securities issued recorded at fair value as at 31 December 2012 1) DNB Bank Group
Foreign Amounts in NOK million NOK currency Total 2013 78 244 010 244 088 Total commercial paper issued, nominal amount 78 244 010 244 088 2013 1 514 0 1 514 2014 14 922 0 14 922 2015 5 500 0 5 500 2016 10 688 0 10 688 2017 13 111 0 13 111 2018 9 105 0 9 105 2019 and later 11 280 0 11 280 Total bond debt, nominal amount 66 120 0 66 120 Total debt securities issued recorded at fair value, nominal amount 66 198 244 010 310 208
Adjustments 3 433 27 641 31 074 Debt securities issued 69 631 643 642 713 273
1) Minus own bonds. Outstanding covered bonds in DNB Boligkreditt totalled NOK 361.8 billion as at 31 December 2012. The cover pool represented NOK 516.4 billion.
2) Includes hedged items.
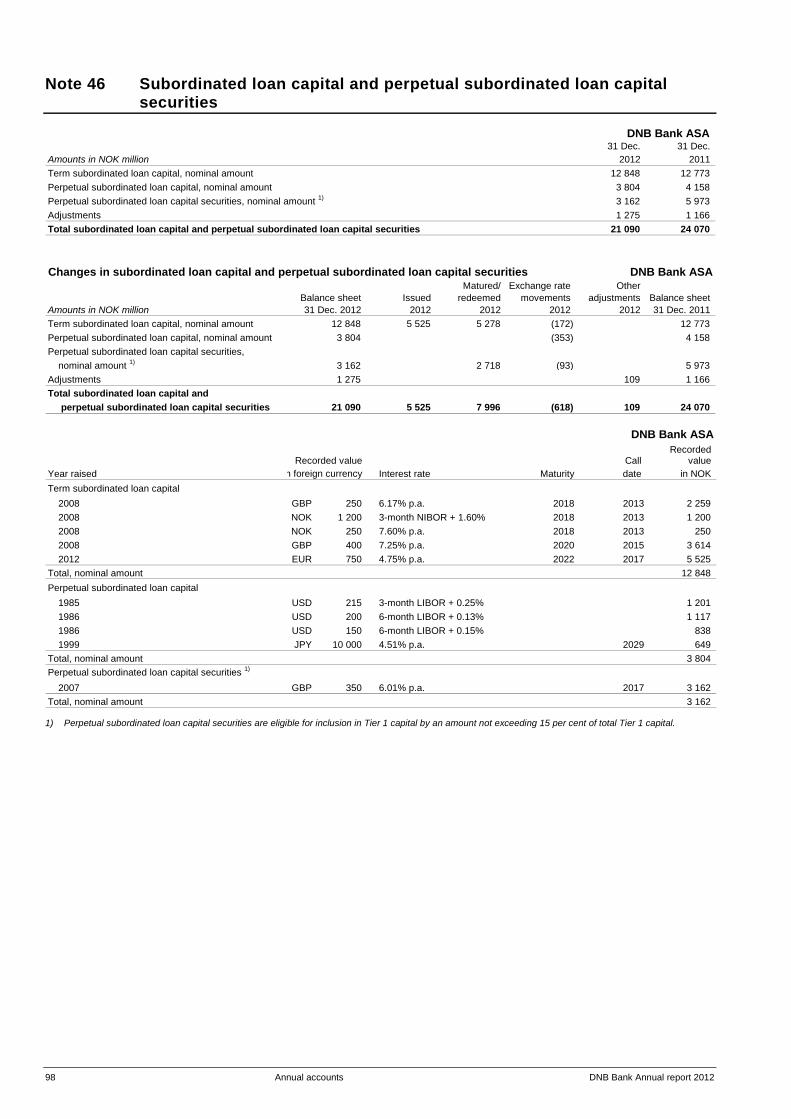
98 Annual accounts DNB Bank Annual report 2012
Note 46 Subordinated loan capital and perpetual subordinated loan capital securities
DNB Bank ASA 31 Dec. 31 Dec.
Amounts in NOK million 2012 2011 Term subordinated loan capital, nominal amount 12 848 12 773 Perpetual subordinated loan capital, nominal amount 3 804 4 158 Perpetual subordinated loan capital securities, nominal amount 1) 3 162 5 973 Adjustments 1 275 1 166 Total subordinated loan capital and perpetual subordinated loan capital securities 21 090 24 070 Changes in subordinated loan capital and perpetual subordinated loan capital securities DNB Bank ASA
Matured/ Exchange rate Other Balance sheet Issued redeemed movements adjustments Balance sheet
Amounts in NOK million 31 Dec. 2012 2012 2012 2012 2012 31 Dec. 2011 Term subordinated loan capital, nominal amount 12 848 5 525 5 278 (172) 12 773 Perpetual subordinated loan capital, nominal amount 3 804 (353) 4 158 Perpetual subordinated loan capital securities,
nominal amount 1) 3 162 2 718 (93) 5 973 Adjustments 1 275 109 1 166 Total subordinated loan capital and
perpetual subordinated loan capital securities 21 090 5 525 7 996 (618) 109 24 070
DNB Bank ASARecorded
Call value Year raised Interest rate Maturity date in NOK Term subordinated loan capital
2008 GBP 250 6.17% p.a. 2018 2013 2 259 2008 NOK 1 200 3-month NIBOR + 1.60% 2018 2013 1 200 2008 NOK 250 7.60% p.a. 2018 2013 250 2008 GBP 400 7.25% p.a. 2020 2015 3 614 2012 EUR 750 4.75% p.a. 2022 2017 5 525
Total, nominal amount 12 848 Perpetual subordinated loan capital
1985 USD 215 3-month LIBOR + 0.25% 1 201 1986 USD 200 6-month LIBOR + 0.13% 1 117 1986 USD 150 6-month LIBOR + 0.15% 838 1999 JPY 10 000 4.51% p.a. 2029 649
Total, nominal amount 3 804 Perpetual subordinated loan capital securities 1)
2007 GBP 350 6.01% p.a. 2017 3 162 Total, nominal amount 3 162
n foreign currency Recorded value
1) Perpetual subordinated loan capital securities are eligible for inclusion in Tier 1 capital by an amount not exceeding 15 per cent of total Tier 1 capital.
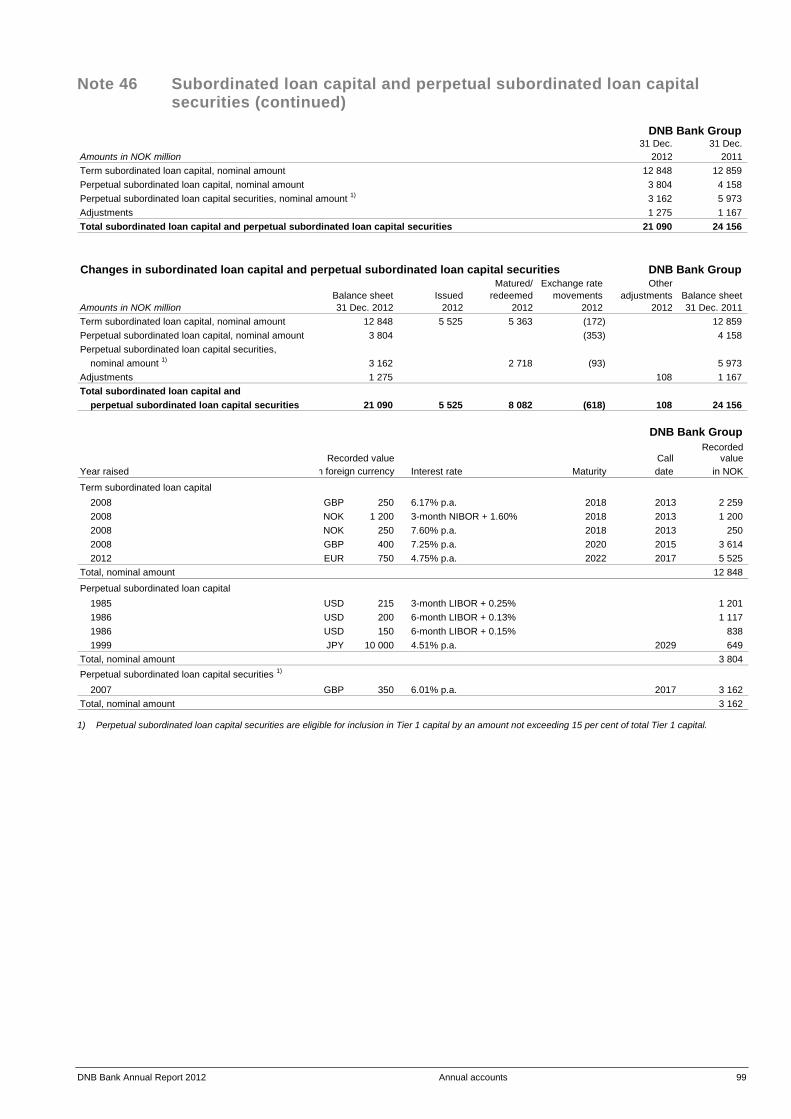
DNB Bank Annual Report 2012 Annual accounts 99
Note 46 Subordinated loan capital and perpetual subordinated loan capital securities (continued)
DNB Bank Group 31 Dec. 31 Dec.
Amounts in NOK million 2012 2011 Term subordinated loan capital, nominal amount 12 848 12 859 Perpetual subordinated loan capital, nominal amount 3 804 4 158 Perpetual subordinated loan capital securities, nominal amount 1) 3 162 5 973 Adjustments 1 275 1 167 Total subordinated loan capital and perpetual subordinated loan capital securities 21 090 24 156 Changes in subordinated loan capital and perpetual subordinated loan capital securities DNB Bank Group
Matured/ Exchange rate Other Balance sheet Issued redeemed movements adjustments Balance sheet
Amounts in NOK million 31 Dec. 2012 2012 2012 2012 2012 31 Dec. 2011 Term subordinated loan capital, nominal amount 12 848 5 525 5 363 (172) 12 859 Perpetual subordinated loan capital, nominal amount 3 804 (353) 4 158 Perpetual subordinated loan capital securities,
nominal amount 1) 3 162 2 718 (93) 5 973 Adjustments 1 275 108 1 167 Total subordinated loan capital and
perpetual subordinated loan capital securities 21 090 5 525 8 082 (618) 108 24 156
DNB Bank Group Recorded
Call value Year raised Interest rate Maturity date in NOK
Term subordinated loan capital2008 GBP 250 6.17% p.a. 2018 2013 2 259 2008 NOK 1 200 3-month NIBOR + 1.60% 2018 2013 1 200 2008 NOK 250 7.60% p.a. 2018 2013 250 2008 GBP 400 7.25% p.a. 2020 2015 3 614 2012 EUR 750 4.75% p.a. 2022 2017 5 525
Total, nominal amount 12 848
Perpetual subordinated loan capital1985 USD 215 3-month LIBOR + 0.25% 1 201 1986 USD 200 6-month LIBOR + 0.13% 1 117 1986 USD 150 6-month LIBOR + 0.15% 838 1999 JPY 10 000 4.51% p.a. 2029 649
Total, nominal amount 3 804 Perpetual subordinated loan capital securities 1)
2007 GBP 350 6.01% p.a. 2017 3 162 Total, nominal amount 3 162
Recorded value n foreign currency
1) Perpetual subordinated loan capital securities are eligible for inclusion in Tier 1 capital by an amount not exceeding 15 per cent of total Tier 1 capital.
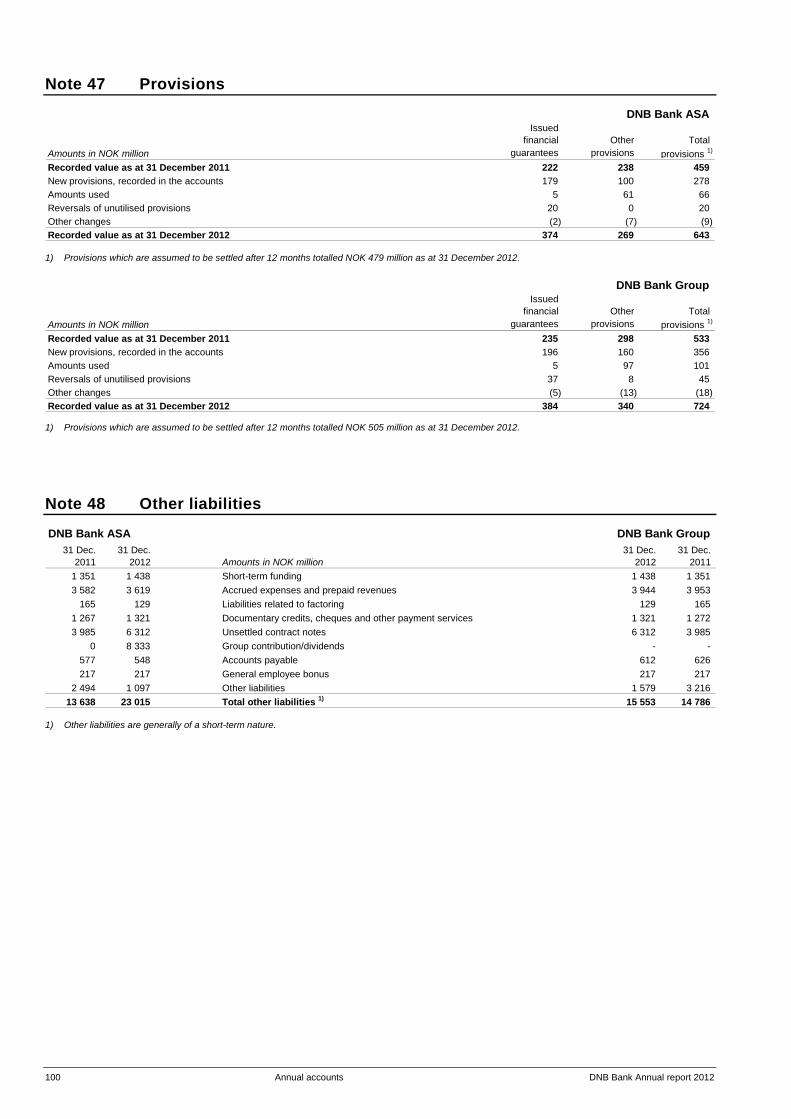
100 Annual accounts DNB Bank Annual report 2012
Note 47 Provisions
DNB Bank ASA Issued
financial Other Total Amounts in NOK million guarantees provisions provisions 1)
Recorded value as at 31 December 2011 222 238 459 New provisions, recorded in the accounts 179 100 278 Amounts used 5 61 66 Reversals of unutilised provisions 20 0 20 Other changes (2) (7) (9) Recorded value as at 31 December 2012 374 269 643
1) Provisions which are assumed to be settled after 12 months totalled NOK 479 million as at 31 December 2012.
DNB Bank Group Issued
financial Other Total Amounts in NOK million guarantees provisions provisions 1)
Recorded value as at 31 December 2011 235 298 533 New provisions, recorded in the accounts 196 160 356 Amounts used 5 97 101 Reversals of unutilised provisions 37 8 45 Other changes (5) (13) (18) Recorded value as at 31 December 2012 384 340 724
1) Provisions which are assumed to be settled after 12 months totalled NOK 505 million as at 31 December 2012.
Note 48 Other liabilities
DNB Bank ASA DNB Bank Group 31 Dec. 31 Dec. 31 Dec. 31 Dec.
2011 2012 Amounts in NOK million 2012 2011 1 351 1 438 Short-term funding 1 438 1 351 3 582 3 619 Accrued expenses and prepaid revenues 3 944 3 953
165 129 Liabilities related to factoring 129 165 1 267 1 321 Documentary credits, cheques and other payment services 1 321 1 272 3 985 6 312 Unsettled contract notes 6 312 3 985
0 8 333 Group contribution/dividends - -577 548 Accounts payable 612 626 217 217 General employee bonus 217 217
2 494 1 097 Other liabilities 1 579 3 216 13 638 23 015 Total other liabilities 1) 15 553 14 786
1) Other liabilities are generally of a short-term nature.

DNB Bank Annual Report 2012 Annual accounts 101
Note 49 Remunerations etc.
Information about DNB’s remuneration scheme Pursuant to the regulations on remuneration schemes in financial institutions etc., issued by the Norwegian Ministry of Finance on 1 December 2010, companies are required to publish information about the main principles for determining remunerations, criteria for the stipulation of any variable remunerations and quantitative information on remuneration to senior executives, employees with responsibilities which are of great importance to the company's risk exposure, employees who are responsible for control functions and elected officers who receive corresponding remunerations. The information in this note, including the Board of Directors' statement on the stipulation of salaries and other remunerations to senior executives below, represents such information, as stipulated in the remuneration regulations.
The group guidelines for remuneration in the DNB Group apply to the total remuneration to all permanent employees in the DnB Group and comprise monetary remuneration (fixed salary, short and long-term incentives), employee benefits (pensions, employer's liability insurance and other employee benefits) and employee development and career measures (courses and development programmes, career programmes and other non-monetary remuneration).
According to the guidelines, total remuneration is to be based on a total evaluation of the performance of the Group, as well as the unit's and each individual's contributions to value creation. Total remuneration should be structured to ensure that it does not expose the Group to unwanted risk. The remuneration should be competitive, but also cost-effective for the Group.
Furthermore, monetary remuneration should consist of a fixed and a variable part where this is appropriate. Fixed salary should be a compensation for the responsibilities and requirements assigned to each position, as well as its complexity, while variable salary should encourage extraordinary performance and desired conduct.
To ensure compliance with the remuneration regulations, DNB implemented new group guidelines for variable remuneration in 2011, including special guidelines for variable remuneration to senior executives, employees with responsibilities which are of great importance to the company's risk exposure (”risk takers”) and employees who are responsible for independent control functions. These guidelines aim to reduce excessive risk taking and promote sound and effective risk management.
Variable remuneration in DNB should promote a long-term profitability and is determined based on financial and non-financial target figures. In addition, an overall assessment should be made based on compliance with the Group's values and leadership principles. The variable remuneration schemes must be documented in a process which establishes, follows up and evaluates targets and target attainment, as well as a process for awarding and paying out variable remuneration. Pursuant to Section 6-16a of the Norwegian Public Limited Companies Act, the Board of Directors will present the following remuneration guidelines to the Annual General Meeting:
"The Board of Directors' statement on the stipulation of salaries and other remunerations to senior executives DNB's guidelines for determining remunerations to the group chief executive and other members of the group management team should, at all times, support prevailing strategy and values, while contributing to the attainment of the Group’s targets. The remuneration should inspire conduct to build the desired corporate culture with respect to performance and profit orientation. In connection with this statement, the Board of Directors has passed a resolution which entails minor changes to the principles for the stipulation of remunerations compared with statements presented previously.
Decision-making process The Board of Directors in DNB ASA has established a compensation committee consisting of three members: the chairman of the Board, the vice-chairman and one board member.
The Compensation Committee prepares matters for the Board of Directors and has the following main responsibilities: Annually evaluate and present its recommendations regarding the total remuneration awarded to the group chief executive Annually prepare a recommendation for the group chief executive’s score card Based on suggestions from the group chief executive, decide the remuneration and other key benefits awarded to the group
executive vice president, Group Audit Act in an advisory capacity to the group chief executive regarding remunerations and other key benefits for members of the group
management team and, when applicable, for others who report to the group chief executive Consider other matters as decided by the Board of Directors and/or the Compensation Committee Evaluate other personnel-related issues which can be assumed to entail great risk to the Group's reputation
A. Guidelines for the coming accounting year Remuneration to the group chief executive The total remuneration to the group chief executive consists of fixed salary (main element), benefits in kind, variable remuneration, and pension and insurance schemes. The total remuneration is determined based on a total evaluation, and the variable part of the remuneration is primarily based on the following elements: financial risk-adjusted profits, the Group’s return on equity, the Group’s equity Tier 1 capital ratio, the Group’s nominal costs and the DNB Group’s customer satisfaction and corporate reputation scores. In addition, the total evaluation will also reflect compliance with the Group's vision, values, code of ethics and leadership principles.
The fixed salary is subject to an annual evaluation and is determined based on general salary levels in the labour market and especially in the financial industry.
Variable salary to the group chief executive is determined based on specific performance measurements of defined target areas stipulated in the group chief executive's score card and an overall assessment. Variable salary cannot exceed 50 per cent of fixed salary. The group chief executive is not awarded performance-based payments other than the stated variable remuneration.
102 Annual accounts DNB Bank Annual Report 2012
Note 49 Remunerations etc. (continued) In addition to variable remuneration, the group chief executive can be granted benefits in kind such as company car, newspapers/-periodicals and telephone/ other communication. Benefits in kind should be relevant to the group chief executive's function or in line with market practice, and should not be significant relative to the group chief executive’s fixed salary.
The Board of Directors will respect the agreement entered into with the group chief executive, whereby his retirement age is 60 years with a pension representing 70 per cent of fixed salary. If employment is terminated prior to the age of 60, the pension will be paid from the age of 60 with the deduction of 1/14 of the pension amount for each full year remaining to his 60th birthday. According to the agreement, the group chief executive is entitled to a termination payment for two years if employment is terminated prior to the age of 60. If, during this period, the group chief executive receives income from other employment, the termination payment will be reduced by an amount corresponding to the salary received from this employment. Benefits in kind will be maintained for a period of three months.
Remuneration to other senior executives The group chief executive determines the remunerations to senior executives in agreement with the Chairman of the Board of Directors. The Board of Directors will honour existing binding agreements.
The total remuneration to senior executives consists of fixed salary (main element), benefits in kind, variable salary, and pension and insurance schemes. The total remuneration is determined based on the need to offer competitive terms in the various business areas. The remunerations should promote the Group's competitiveness in the relevant labour market, as well as the Group's profitability, including the desired trend in income and costs. The total remuneration should take DNB's reputation into consideration and not be market-leading, but should ensure that DNB attracts and retains senior executives with the desired skills and experience.
The fixed salary is subject to an annual evaluation and is determined based on general salary levels in the labour market and especially in the financial industry.
Benefits in kind may be offered to senior executives to the extent the benefits have a relevant connection to the employee's function in the Group or are in line with market practice. The benefits should not be significant relative to the employee's fixed salary.
Group guidelines for variable remuneration DNB implemented group guidelines for variable remuneration in 2011 to ensure compliance with the remuneration regulations and Circular no. 11/2011, dated 21 February 2011, from Finanstilsynet on remuneration schemes in financial institutions, investment firms and management companies for mutual funds.
The intention of DNB’s variable remuneration scheme is to reward conduct and develop a corporate culture which ensures long-term value generation. The scheme is in line with the Group’s general guidelines for variable remuneration approved by the Board of Directors’ Compensation Committee. In line with prevailing guidelines, the group chief executive has overall operational responsibility for the group scheme.
With respect to the Group's international branches and subsidiaries, the respective national authorities have laid down local laws, regula-tions and guidelines. There may be challenges of a legal nature in cases where the Norwegian regulations do not correspond to local legislation and local rules concerning remunerations in financial institutions. In such cases, the Group will seek advice from Finanstilsynet and international experts to ensure that the Group's practices are in compliance with both Norwegian and local regulations.
Variable salary is based on specific performance measurements of defined target areas stipulated in the executive's score card and an overall assessment reflecting compliance with the Group's vision, values, code of ethics and leadership principles. The scheme should be performance-based without exposing the Group to unwanted risk. Furthermore, it should counteract excessive risk taking and promote sound and effective risk management in DNB. Variable remuneration (bonus) for senior executives cannot exceed 50 per cent of fixed salary.
The group guidelines for variable remuneration should ensure that the Group’s schemes counteract excessive risk taking and help the Group achieve and retain a robust capital adequacy ratio and long-term profitability. The scheme should promote sound and effective risk management in DNB and ensure that total remunerations promote the Group’s strategy and interests.
DNB’s variable remuneration scheme applies globally, though non-Norwegian branches and subsidiaries will also be required to comply with local legislation, regulations and guidelines.
Target structure 2013 The Compensation Committee approves principal criteria, principles and limits for variable remuneration. The Compensation Committee has decided that recorded return, the Tier 1 capital ratio and cost levels should constitute the Group’s key figures for 2013. In addition to the financial key figures, measurement criteria include the Group’s customer satisfaction index and reputation scores.
The Group’s financial target figures have been broken down into relevant variables for the various business areas and staff and support units in order to offer optimal support for the implementation of new capital adequacy and liquidity regulations.
The above targets will be used as a basis for the scorecards and be key elements when calculating and paying out the variable remuneration earned for 2013. All financial variables have been defined and communicated to the relevant business areas and staff and support units as part of the work with the scorecards for 2013.
DNB Bank Annual Report 2012 Annual accounts 103
Note 49 Remunerations etc. (continued) Calculation of variable remuneration for 2013 The calculation of the earned variable remuneration for 2013 will consist of the following elements: Approved maximum limits for variable remuneration Assessment of target attainment based on criteria specified in the individual scorecard An overall assessment of compliance with the Group’s values and leadership principles, and a general assessment of the individual’s
contributions to the unit’s target attainment
The Board of Directors will determine a maximum limit for total bonuses for the Group based on the attainment of group targets, combined with a general assessment of other important parameters and the Group’s financial capacity.
Special rules for senior executives, identified risk takers and employees responsible for independent control functions DNB has prepared and implemented special guidelines for identified risk takers, employees responsible for independent control functions and senior executives, hereinafter called risk takers. The special guidelines supplement the general group guidelines for variable remuneration and have been formulated in compliance with the remuneration regulations.
For risk takers, the following main principles apply to variable remuneration: A two-year service period Deferred and conditional payment of minimum 50 per cent of the earned variable remuneration in the form of DNB shares. The
remuneration paid in the form of shares will be divided into three, subject to minimum holding periods (deferred and conditional), with one-third payable each year over a period of three years. The deferred and conditional payments will be in compliance with the stipulations in the remuneration regulations.
Pensions etc. Pension schemes and any agreements on termination payments etc. should be considered relative to other remuneration and should ensure competitive terms. The various components in pension schemes and severance pay, either alone or together, must not be such that they could pose a threat to DNB’s reputation.
As a main rule, senior executives are entitled to a pension at the age of 65, though this can be deviated from. In accordance with the Group's defined benefit pension scheme, pension entitlements should not exceed 70 per cent of fixed salary and should constitute maximum 12 times the National Insurance basic amount. However, the DNB Group will honour existing agreements. A defined contribution scheme was established for the Group with effect from 1 January 2011, whereby pensionable income will be limited to 12 times the National Insurance basic amount. Parallel to this, the Group's defined benefit pension scheme was closed for new members as from 31 December 2010.
As a main rule, no termination payment agreements will be signed. However, the Group will honour existing agreements.
When entering into new agreements, the guidelines generally apply and comprise all senior executives.
See table of remunerations for senior executives below.
B. Binding guidelines for shares, subscription rights, options etc. for the coming accounting year An amount corresponding to 50 per cent of the earned variable salary of the group chief executive and senior executives is invested in shares in DNB ASA. The minimum holding periods are one year for one-third of the shares, two years for one-third of the shares and three years for the final one-third of the shares.
No additional shares, subscription rights, options or other forms of remuneration only linked to shares or only to developments in the share price of the company or other companies within the Group, will be awarded to the group chief executive or senior executives. The group chief executive and senior executives are, however, given the opportunity to participate in a share subscription scheme on the same terms as other employees in the DNB Group.
C. Statement on the senior executive salary policy in the previous account year The group guidelines determined for 2011 have been followed.
D. Statement on the effects for the company and the shareholders of remuneration agreements awarding shares, subscription rights, options etc.
An amount corresponding to 50 per cent of the gross variable salary earned by the group chief executive and senior executives in 2012 is invested in shares in DNB ASA. The Board of Directors believes that the awarding of shares to senior-executives, in view of the total number of shares in the company, will have no negative consequences for the company or the shareholders."
Terms for the chairman of the Board of Directors Anne Carine Tanum received a remuneration of NOK 382 000 in 2012 as a chairman of the Board of Directors of DNB Bank ASA, compared with NOK 364 000 in 2011. In addition, she received NOK 467 000 as chairman of the Board of Directors of DNB ASA, compared with NOK 456 000 in 2011.
Terms for the group chief executive Rune Bjerke received an ordinary salary of NOK 5 213 000 in 2012, compared with NOK 4 901 000 in 2011. The Board of Directors of DNB ASA stipulated the group chief executive's bonus payment for 2012 at NOK 1 713 000, compared with NOK 1 655 000 for 2011. The bonus for 2012 will be paid in 2013. Benefits in kind were estimated at NOK 272 000, compared with NOK 250 000 in 2011. Costs for DNB in connection with the group chief executive’s pension scheme were NOK 4 987 000 for the 2012 accounting year, compared with NOK 3 957 000 in 2011. Costs are divided between DNB ASA and DNB Bank ASA.
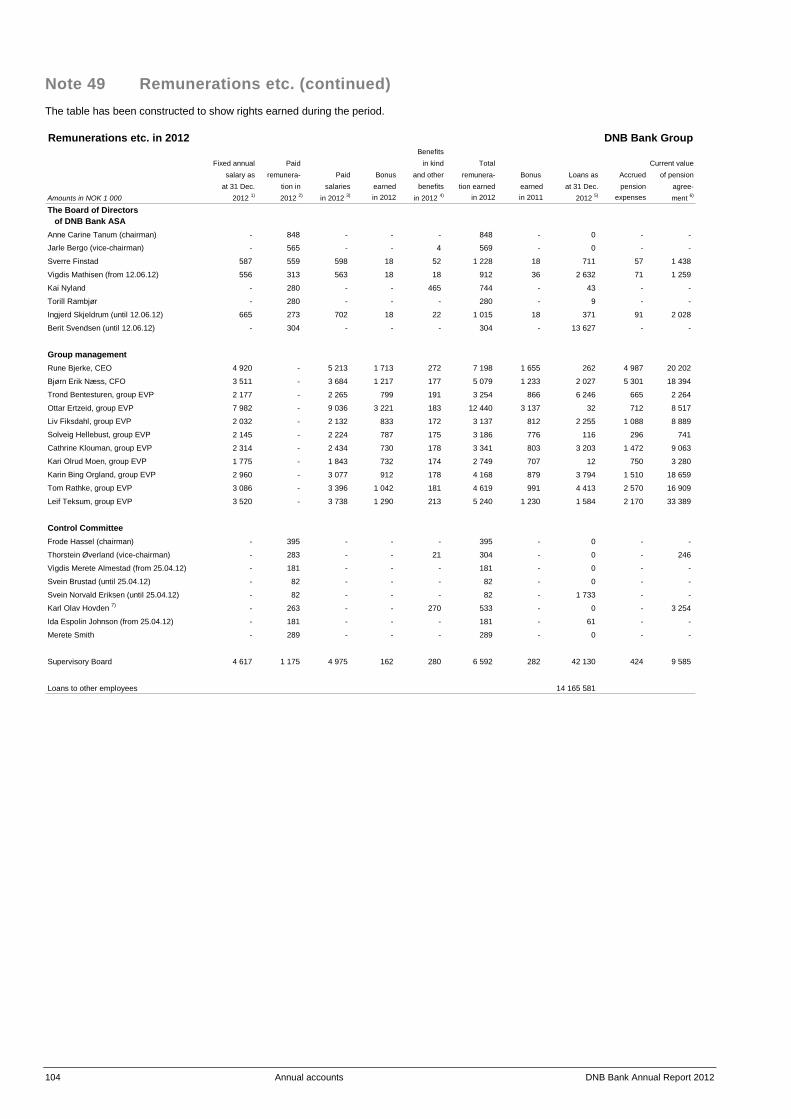
104 Annual accounts DNB Bank Annual Report 2012
Note 49 Remunerations etc. (continued) The table has been constructed to show rights earned during the period. Remunerations etc. in 2012 DNB Bank Group
BenefitsFixed annual Paid in kind Total Current value
salary as remunera- Paid Bonus and other remunera- Bonus Loans as Accrued of pensionat 31 Dec. tion in salaries earned benefits tion earned earned at 31 Dec. pension agree-
Amounts in NOK 1 000 2012 1) 2012 2) in 2012 3) in 2012 in 2012 4) in 2012 in 2011 2012 5) expenses ment 6)
The Board of Directors of DNB Bank ASAAnne Carine Tanum (chairman) - 848 - - - 848 - 0 - -
Jarle Bergo (vice-chairman) - 565 - - 4 569 - 0 - -
Sverre Finstad 587 559 598 18 52 1 228 18 711 57 1 438
Vigdis Mathisen (from 12.06.12) 556 313 563 18 18 912 36 2 632 71 1 259
Kai Nyland - 280 - - 465 744 - 43 - -
Torill Rambjør - 280 - - - 280 - 9 - -
Ingjerd Skjeldrum (until 12.06.12) 665 273 702 18 22 1 015 18 371 91 2 028
Berit Svendsen (until 12.06.12) - 304 - - - 304 - 13 627 - -
Group managementRune Bjerke, CEO 4 920 - 5 213 1 713 272 7 198 1 655 262 4 987 20 202
Bjørn Erik Næss, CFO 3 511 - 3 684 1 217 177 5 079 1 233 2 027 5 301 18 394
Trond Bentesturen, group EVP 2 177 - 2 265 799 191 3 254 866 6 246 665 2 264
Ottar Ertzeid, group EVP 7 982 - 9 036 3 221 183 12 440 3 137 32 712 8 517
Liv Fiksdahl, group EVP 2 032 - 2 132 833 172 3 137 812 2 255 1 088 8 889
Solveig Hellebust, group EVP 2 145 - 2 224 787 175 3 186 776 116 296 741
Cathrine Klouman, group EVP 2 314 - 2 434 730 178 3 341 803 3 203 1 472 9 063
Kari Olrud Moen, group EVP 1 775 - 1 843 732 174 2 749 707 12 750 3 280
Karin Bing Orgland, group EVP 2 960 - 3 077 912 178 4 168 879 3 794 1 510 18 659
Tom Rathke, group EVP 3 086 - 3 396 1 042 181 4 619 991 4 413 2 570 16 909
Leif Teksum, group EVP 3 520 - 3 738 1 290 213 5 240 1 230 1 584 2 170 33 389
Control CommitteeFrode Hassel (chairman) - 395 - - - 395 - 0 - -
Thorstein Øverland (vice-chairman) - 283 - - 21 304 - 0 - 246
Vigdis Merete Almestad (from 25.04.12) - 181 - - - 181 - 0 - -
Svein Brustad (until 25.04.12) - 82 - - - 82 - 0 - -
Svein Norvald Eriksen (until 25.04.12) - 82 - - - 82 - 1 733 - -
Karl Olav Hovden 7) - 263 - - 270 533 - 0 - 3 254
Ida Espolin Johnson (from 25.04.12) - 181 - - - 181 - 61 - -
Merete Smith - 289 - - - 289 - 0 - -
Supervisory Board 4 617 1 175 4 975 162 280 6 592 282 42 130 424 9 585
Loans to other employees 14 165 581
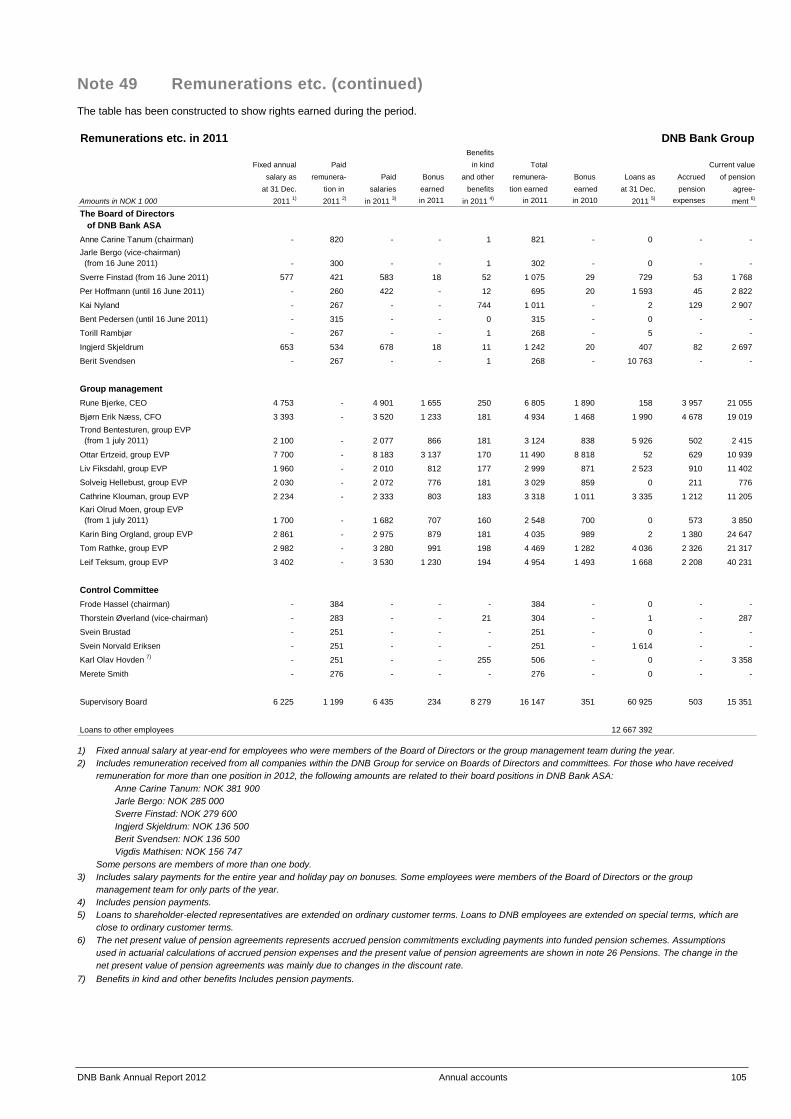
DNB Bank Annual Report 2012 Annual accounts 105
Note 49 Remunerations etc. (continued) The table has been constructed to show rights earned during the period. Remunerations etc. in 2011 DNB Bank Group
BenefitsFixed annual Paid in kind Total Current value
salary as remunera- Paid Bonus and other remunera- Bonus Loans as Accrued of pensionat 31 Dec. tion in salaries earned benefits tion earned earned at 31 Dec. pension agree-
Amounts in NOK 1 000 2011 1) 2011 2) in 2011 3) in 2011 in 2011 4) in 2011 in 2010 2011 5) expenses ment 6)
The Board of Directors of DNB Bank ASAAnne Carine Tanum (chairman) - 820 - - 1 821 - 0 - - Jarle Bergo (vice-chairman) (from 16 June 2011) - 300 - - 1 302 - 0 - -
Sverre Finstad (from 16 June 2011) 577 421 583 18 52 1 075 29 729 53 1 768
Per Hoffmann (until 16 June 2011) - 260 422 - 12 695 20 1 593 45 2 822
Kai Nyland - 267 - - 744 1 011 - 2 129 2 907
Bent Pedersen (until 16 June 2011) - 315 - - 0 315 - 0 - -
Torill Rambjør - 267 - - 1 268 - 5 - -
Ingjerd Skjeldrum 653 534 678 18 11 1 242 20 407 82 2 697
Berit Svendsen - 267 - - 1 268 - 10 763 - -
Group managementRune Bjerke, CEO 4 753 - 4 901 1 655 250 6 805 1 890 158 3 957 21 055
Bjørn Erik Næss, CFO 3 393 - 3 520 1 233 181 4 934 1 468 1 990 4 678 19 019 Trond Bentesturen, group EVP (from 1 july 2011) 2 100 - 2 077 866 181 3 124 838 5 926 502 2 415
Ottar Ertzeid, group EVP 7 700 - 8 183 3 137 170 11 490 8 818 52 629 10 939
Liv Fiksdahl, group EVP 1 960 - 2 010 812 177 2 999 871 2 523 910 11 402
Solveig Hellebust, group EVP 2 030 - 2 072 776 181 3 029 859 0 211 776
Cathrine Klouman, group EVP 2 234 - 2 333 803 183 3 318 1 011 3 335 1 212 11 205 Kari Olrud Moen, group EVP (from 1 july 2011) 1 700 - 1 682 707 160 2 548 700 0 573 3 850
Karin Bing Orgland, group EVP 2 861 - 2 975 879 181 4 035 989 2 1 380 24 647
Tom Rathke, group EVP 2 982 - 3 280 991 198 4 469 1 282 4 036 2 326 21 317
Leif Teksum, group EVP 3 402 - 3 530 1 230 194 4 954 1 493 1 668 2 208 40 231
Control CommitteeFrode Hassel (chairman) - 384 - - - 384 - 0 - -
Thorstein Øverland (vice-chairman) - 283 - - 21 304 - 1 - 287
Svein Brustad - 251 - - - 251 - 0 - -
Svein Norvald Eriksen - 251 - - - 251 - 1 614 - -
Karl Olav Hovden 7) - 251 - - 255 506 - 0 - 3 358
Merete Smith - 276 - - - 276 - 0 - -
Supervisory Board 6 225 1 199 6 435 234 8 279 16 147 351 60 925 503 15 351
Loans to other employees 12 667 392
1) Fixed annual salary at year-end for employees who were members of the Board of Directors or the group management team during the year. 2) Includes remuneration received from all companies within the DNB Group for service on Boards of Directors and committees. For those who have received
remuneration for more than one position in 2012, the following amounts are related to their board positions in DNB Bank ASA: Anne Carine Tanum: NOK 381 900 Jarle Bergo: NOK 285 000 Sverre Finstad: NOK 279 600 Ingjerd Skjeldrum: NOK 136 500 Berit Svendsen: NOK 136 500 Vigdis Mathisen: NOK 156 747
Some persons are members of more than one body. 3) Includes salary payments for the entire year and holiday pay on bonuses. Some employees were members of the Board of Directors or the group
management team for only parts of the year. 4) Includes pension payments. 5) Loans to shareholder-elected representatives are extended on ordinary customer terms. Loans to DNB employees are extended on special terms, which are
close to ordinary customer terms. 6) The net present value of pension agreements represents accrued pension commitments excluding payments into funded pension schemes. Assumptions
used in actuarial calculations of accrued pension expenses and the present value of pension agreements are shown in note 26 Pensions. The change in the net present value of pension agreements was mainly due to changes in the discount rate.
7) Benefits in kind and other benefits Includes pension payments.

106 Annual accounts DNB Bank Annual Report 2012
Note 49 Remunerations etc. (continued) Other information on pension agreements Rune Bjerke has a pension agreement entitling him to a pension representing 70 per cent of pensionable income from the age of 60. Bjørn Erik Næss, Liv Fiksdahl, Cathrine Klouman, Kari Olrud Moen, Tom Rathke and Leif Teksum are entitled to a pension representing 70 per cent of pensionable income from the age of 62. Trond Bentestuen and Karin Bing Orgland are entitled to a pension representing 70 per cent of pensionable income from the age of 65. Ottar Ertzeid has a pension agreement entitling him to pension representing 70 per cent of pensionable income from the age of 62, or 65 at the latest. Solveig Hellebust has a pension agreement entitling her to a pension representing 70 per cent of fixed salary, limited to 12 times the National Insurance basic amount, from the age of 65, with no curtailment from the age of 65 through 67. Subscription rights programme for employees There was no subscription rights programme for employees in the DNB Bank Group at year-end 2012. DNB Bank ASA Remuneration to the statutory auditor DNB Bank Group
2011 2012 Amounts in NOK 1 000 2012 2011 5 594 6 367 Statutory audit 18 154 17 098 2 879 2 407 Other certification services 3 343 4 766 4 667 5 906 Tax-related advice 1) 6 202 4 953
896 3 093 Other services 3 433 1 305 14 036 17 773 Total remuneration to the statutory auditor 31 132 28 122
1) Mainly related to assistance in tax matters for employees outside Norway.
Note 50 Information on related parties
DNB Bank ASA is 100 per cent owned by DNB ASA. The largest owner of the DNB Group is the Norwegian government, represented by the Ministry of Trade and Industry, which owns and controls 34 per cent of the shares in the parent company DNB ASA.
A large number of bank transactions are entered into with related parties as part of ordinary business transactions, comprising loans, deposits and foreign exchange transactions. These transactions are based on market terms. The table below shows transactions with related parties, including balance sheets at year-end and related expenses and income for the year. Related companies in the table are associated companies plus DNB NOR Savings Bank Foundation. See note 37 for a specification of associated companies. Loans to board members and their spouses/partners and under-age children are extended on ordinary customer terms. Loans to group management, like loans to other group employees, are extended on special terms, which are close to ordinary customer terms. Transactions with other DNB Bank Group companies are shown in a separate table. Transactions with related parties DNB Bank Group
Group management and Board of Directors Related companies Amounts in NOK million 2012 2011 2012 2011 Loans as at 1 January 38 29 1 475 1 558 New loans/repayments during the year 17 5 74 (130) Changes in related parties 1) (19) 5 133 47 Loans as at 31 December 35 38 1 682 1 475
Interest income 2 1 53 65
Deposits as at 1 January 2) 21 22 14 230 10 171 Deposits/withdrawals during the year 3 (3) (7 519) 3 996 Changes in related parties 1) 0 2 (109) 63 Deposits as at 31 December 24 21 6 601 14 230
Interest expenses 1 1 113 102
Guarantees 2) - - 20 255 22 566
1) Following the bankruptcy in Faktor Eiendom ASA in 2011, the company is no longer included among the Group’s related parties. As part of the restructuring of the Relacom Group, the creditors took over all shares in Relacom AB in April 2011. Debt totalling SEK 2.3 billion was thereafter converted.
2) DNB Bank ASA carries loans in its balance sheets which according to a legal agreement have been transferred to Eksportfinans and are guaranteed by DNB Bank ASA. According to the agreement, DNB still carries interest rate risk and credit risk associated with the transferred portfolio. These portfolios totalled NOK 4 089 million and NOK 10 632 million respectively at year-end 2012 and 2011. The loans are set off by deposits/payments from Eksportfinans. DNB Bank ASA has also issued guarantees for other loans in Eksportfinans.
No impairments were made on loans to related parties in 2011 and 2012. Reference is made to note 49 for information on loans to group management members and directors. Transactions with deputy members of the Board of Directors are not included in the table above. In general, DNB employee loans should be paid by automatic debit in monthly instalments in arrear. Employee loans are within the term limits applying to general customer relationships. Security is furnished for employee loans in accordance with legal requirements.
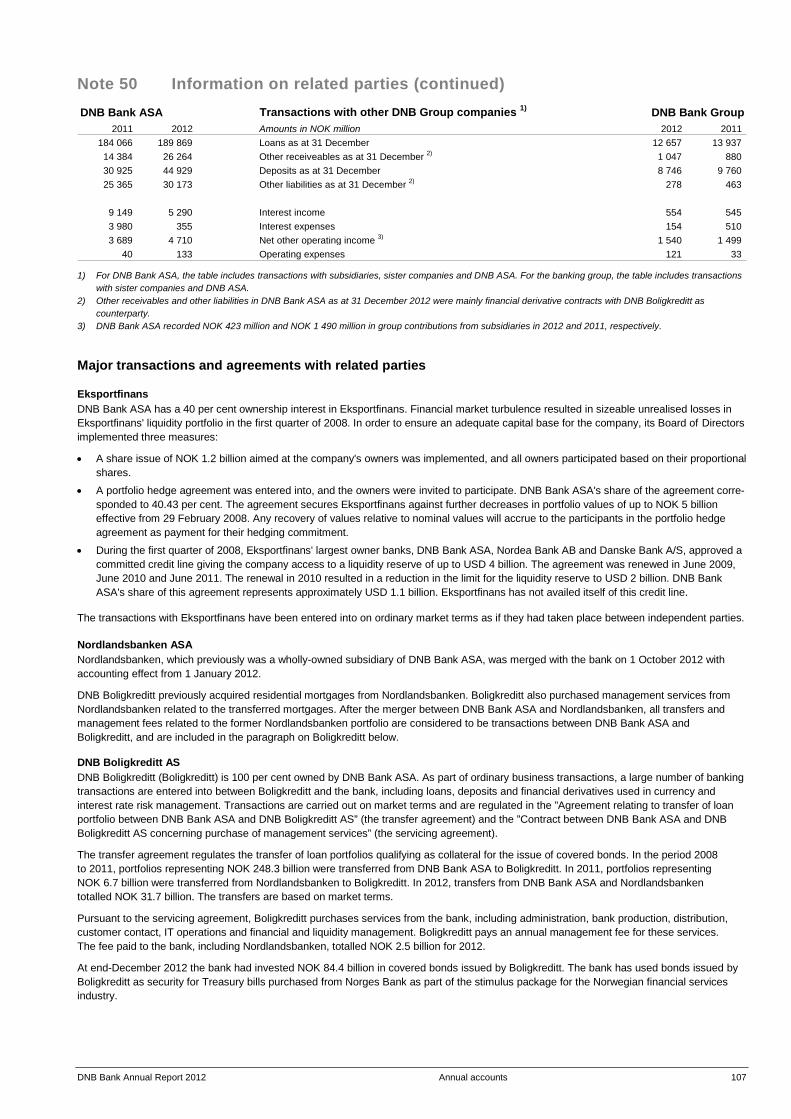
DNB Bank Annual Report 2012 Annual accounts 107
Note 50 Information on related parties (continued) DNB Bank ASA Transactions with other DNB Group companies 1) DNB Bank Group
2011 2012 Amounts in NOK million 2012 2011 184 066 189 869 Loans as at 31 December 12 657 13 937 14 384 26 264 Other receiveables as at 31 December 2) 1 047 880 30 925 44 929 Deposits as at 31 December 8 746 9 760 25 365 30 173 Other liabilities as at 31 December 2) 278 463
9 149 5 290 Interest income 554 545 3 980 355 Interest expenses 154 510 3 689 4 710 Net other operating income 3) 1 540 1 499
40 133 Operating expenses 121 33
1) For DNB Bank ASA, the table includes transactions with subsidiaries, sister companies and DNB ASA. For the banking group, the table includes transactions with sister companies and DNB ASA.
2) Other receivables and other liabilities in DNB Bank ASA as at 31 December 2012 were mainly financial derivative contracts with DNB Boligkreditt as counterparty.
3) DNB Bank ASA recorded NOK 423 million and NOK 1 490 million in group contributions from subsidiaries in 2012 and 2011, respectively. Major transactions and agreements with related parties Eksportfinans DNB Bank ASA has a 40 per cent ownership interest in Eksportfinans. Financial market turbulence resulted in sizeable unrealised losses in Eksportfinans' liquidity portfolio in the first quarter of 2008. In order to ensure an adequate capital base for the company, its Board of Directors implemented three measures:
• A share issue of NOK 1.2 billion aimed at the company's owners was implemented, and all owners participated based on their proportional shares.
• A portfolio hedge agreement was entered into, and the owners were invited to participate. DNB Bank ASA's share of the agreement corre-sponded to 40.43 per cent. The agreement secures Eksportfinans against further decreases in portfolio values of up to NOK 5 billion effective from 29 February 2008. Any recovery of values relative to nominal values will accrue to the participants in the portfolio hedge agreement as payment for their hedging commitment.
• During the first quarter of 2008, Eksportfinans' largest owner banks, DNB Bank ASA, Nordea Bank AB and Danske Bank A/S, approved a committed credit line giving the company access to a liquidity reserve of up to USD 4 billion. The agreement was renewed in June 2009, June 2010 and June 2011. The renewal in 2010 resulted in a reduction in the limit for the liquidity reserve to USD 2 billion. DNB Bank ASA's share of this agreement represents approximately USD 1.1 billion. Eksportfinans has not availed itself of this credit line.
The transactions with Eksportfinans have been entered into on ordinary market terms as if they had taken place between independent parties. Nordlandsbanken ASA Nordlandsbanken, which previously was a wholly-owned subsidiary of DNB Bank ASA, was merged with the bank on 1 October 2012 with accounting effect from 1 January 2012.
DNB Boligkreditt previously acquired residential mortgages from Nordlandsbanken. Boligkreditt also purchased management services from Nordlandsbanken related to the transferred mortgages. After the merger between DNB Bank ASA and Nordlandsbanken, all transfers and management fees related to the former Nordlandsbanken portfolio are considered to be transactions between DNB Bank ASA and Boligkreditt, and are included in the paragraph on Boligkreditt below. DNB Boligkreditt AS DNB Boligkreditt (Boligkreditt) is 100 per cent owned by DNB Bank ASA. As part of ordinary business transactions, a large number of banking transactions are entered into between Boligkreditt and the bank, including loans, deposits and financial derivatives used in currency and interest rate risk management. Transactions are carried out on market terms and are regulated in the ”Agreement relating to transfer of loan portfolio between DNB Bank ASA and DNB Boligkreditt AS” (the transfer agreement) and the ”Contract between DNB Bank ASA and DNB Boligkreditt AS concerning purchase of management services” (the servicing agreement).
The transfer agreement regulates the transfer of loan portfolios qualifying as collateral for the issue of covered bonds. In the period 2008 to 2011, portfolios representing NOK 248.3 billion were transferred from DNB Bank ASA to Boligkreditt. In 2011, portfolios representing NOK 6.7 billion were transferred from Nordlandsbanken to Boligkreditt. In 2012, transfers from DNB Bank ASA and Nordlandsbanken totalled NOK 31.7 billion. The transfers are based on market terms.
Pursuant to the servicing agreement, Boligkreditt purchases services from the bank, including administration, bank production, distribution, customer contact, IT operations and financial and liquidity management. Boligkreditt pays an annual management fee for these services. The fee paid to the bank, including Nordlandsbanken, totalled NOK 2.5 billion for 2012.
At end-December 2012 the bank had invested NOK 84.4 billion in covered bonds issued by Boligkreditt. The bank has used bonds issued by Boligkreditt as security for Treasury bills purchased from Norges Bank as part of the stimulus package for the Norwegian financial services industry.
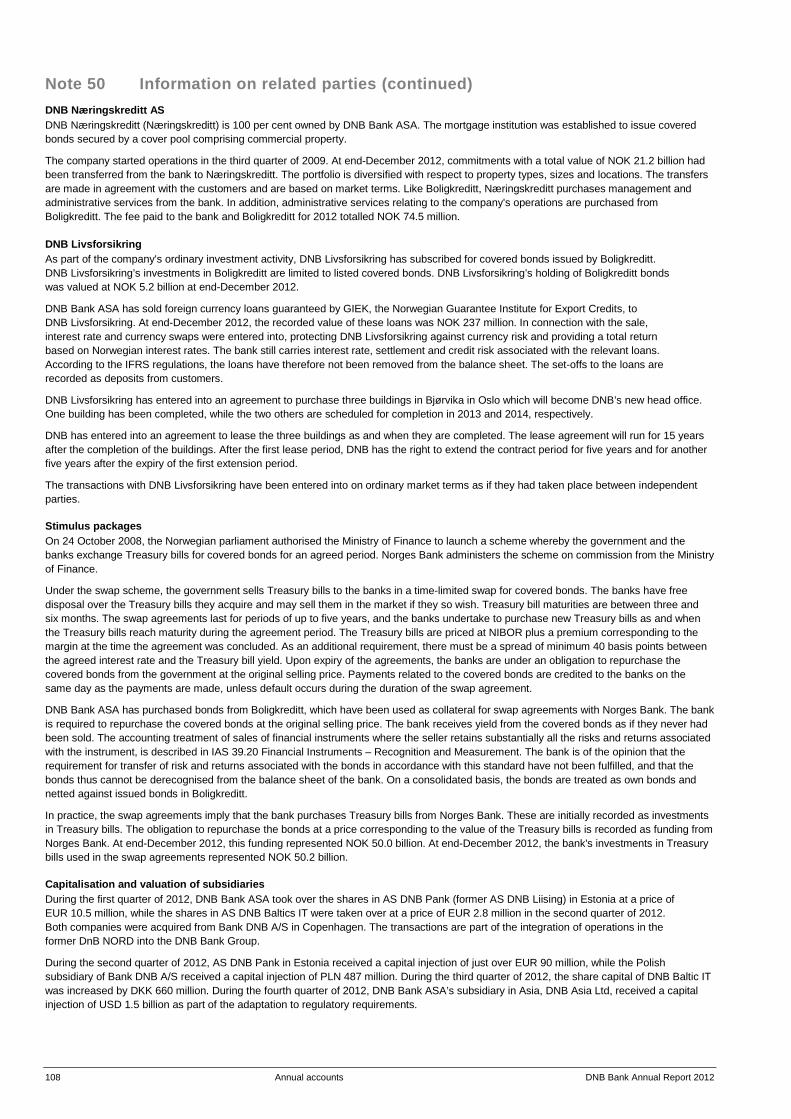
108 Annual accounts DNB Bank Annual Report 2012
Note 50 Information on related parties (continued) DNB Næringskreditt AS DNB Næringskreditt (Næringskreditt) is 100 per cent owned by DNB Bank ASA. The mortgage institution was established to issue covered bonds secured by a cover pool comprising commercial property.
The company started operations in the third quarter of 2009. At end-December 2012, commitments with a total value of NOK 21.2 billion had been transferred from the bank to Næringskreditt. The portfolio is diversified with respect to property types, sizes and locations. The transfers are made in agreement with the customers and are based on market terms. Like Boligkreditt, Næringskreditt purchases management and administrative services from the bank. In addition, administrative services relating to the company's operations are purchased from Boligkreditt. The fee paid to the bank and Boligkreditt for 2012 totalled NOK 74.5 million. DNB Livsforsikring As part of the company's ordinary investment activity, DNB Livsforsikring has subscribed for covered bonds issued by Boligkreditt. DNB Livsforsikring’s investments in Boligkreditt are limited to listed covered bonds. DNB Livsforsikring’s holding of Boligkreditt bonds was valued at NOK 5.2 billion at end-December 2012.
DNB Bank ASA has sold foreign currency loans guaranteed by GIEK, the Norwegian Guarantee Institute for Export Credits, to DNB Livsforsikring. At end-December 2012, the recorded value of these loans was NOK 237 million. In connection with the sale, interest rate and currency swaps were entered into, protecting DNB Livsforsikring against currency risk and providing a total return based on Norwegian interest rates. The bank still carries interest rate, settlement and credit risk associated with the relevant loans. According to the IFRS regulations, the loans have therefore not been removed from the balance sheet. The set-offs to the loans are recorded as deposits from customers.
DNB Livsforsikring has entered into an agreement to purchase three buildings in Bjørvika in Oslo which will become DNB’s new head office. One building has been completed, while the two others are scheduled for completion in 2013 and 2014, respectively.
DNB has entered into an agreement to lease the three buildings as and when they are completed. The lease agreement will run for 15 years after the completion of the buildings. After the first lease period, DNB has the right to extend the contract period for five years and for another five years after the expiry of the first extension period.
The transactions with DNB Livsforsikring have been entered into on ordinary market terms as if they had taken place between independent parties. Stimulus packages On 24 October 2008, the Norwegian parliament authorised the Ministry of Finance to launch a scheme whereby the government and the banks exchange Treasury bills for covered bonds for an agreed period. Norges Bank administers the scheme on commission from the Ministry of Finance.
Under the swap scheme, the government sells Treasury bills to the banks in a time-limited swap for covered bonds. The banks have free disposal over the Treasury bills they acquire and may sell them in the market if they so wish. Treasury bill maturities are between three and six months. The swap agreements last for periods of up to five years, and the banks undertake to purchase new Treasury bills as and when the Treasury bills reach maturity during the agreement period. The Treasury bills are priced at NIBOR plus a premium corresponding to the margin at the time the agreement was concluded. As an additional requirement, there must be a spread of minimum 40 basis points between the agreed interest rate and the Treasury bill yield. Upon expiry of the agreements, the banks are under an obligation to repurchase the covered bonds from the government at the original selling price. Payments related to the covered bonds are credited to the banks on the same day as the payments are made, unless default occurs during the duration of the swap agreement.
DNB Bank ASA has purchased bonds from Boligkreditt, which have been used as collateral for swap agreements with Norges Bank. The bank is required to repurchase the covered bonds at the original selling price. The bank receives yield from the covered bonds as if they never had been sold. The accounting treatment of sales of financial instruments where the seller retains substantially all the risks and returns associated with the instrument, is described in IAS 39.20 Financial Instruments – Recognition and Measurement. The bank is of the opinion that the requirement for transfer of risk and returns associated with the bonds in accordance with this standard have not been fulfilled, and that the bonds thus cannot be derecognised from the balance sheet of the bank. On a consolidated basis, the bonds are treated as own bonds and netted against issued bonds in Boligkreditt.
In practice, the swap agreements imply that the bank purchases Treasury bills from Norges Bank. These are initially recorded as investments in Treasury bills. The obligation to repurchase the bonds at a price corresponding to the value of the Treasury bills is recorded as funding from Norges Bank. At end-December 2012, this funding represented NOK 50.0 billion. At end-December 2012, the bank's investments in Treasury bills used in the swap agreements represented NOK 50.2 billion. Capitalisation and valuation of subsidiaries During the first quarter of 2012, DNB Bank ASA took over the shares in AS DNB Pank (former AS DNB Liising) in Estonia at a price of EUR 10.5 million, while the shares in AS DNB Baltics IT were taken over at a price of EUR 2.8 million in the second quarter of 2012. Both companies were acquired from Bank DNB A/S in Copenhagen. The transactions are part of the integration of operations in the former DnB NORD into the DNB Bank Group.
During the second quarter of 2012, AS DNB Pank in Estonia received a capital injection of just over EUR 90 million, while the Polish subsidiary of Bank DNB A/S received a capital injection of PLN 487 million. During the third quarter of 2012, the share capital of DNB Baltic IT was increased by DKK 660 million. During the fourth quarter of 2012, DNB Bank ASA’s subsidiary in Asia, DNB Asia Ltd, received a capital injection of USD 1.5 billion as part of the adaptation to regulatory requirements.
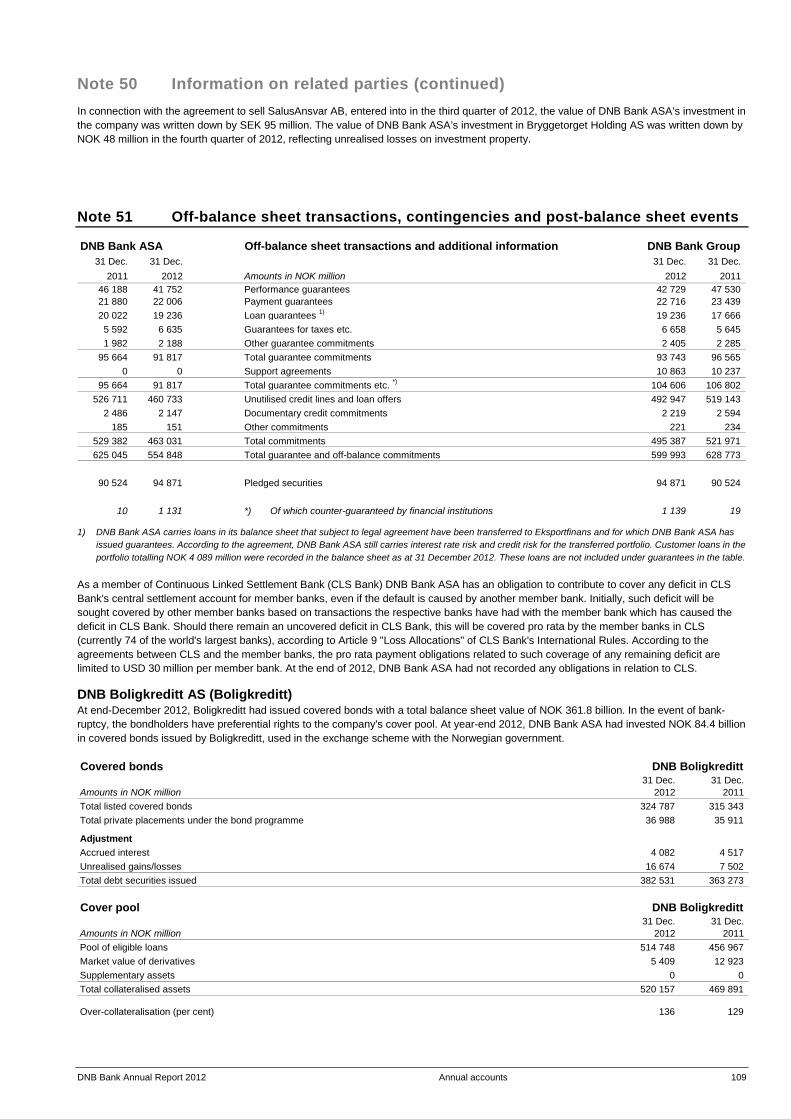
DNB Bank Annual Report 2012 Annual accounts 109
Note 50 Information on related parties (continued) In connection with the agreement to sell SalusAnsvar AB, entered into in the third quarter of 2012, the value of DNB Bank ASA’s investment in the company was written down by SEK 95 million. The value of DNB Bank ASA’s investment in Bryggetorget Holding AS was written down by NOK 48 million in the fourth quarter of 2012, reflecting unrealised losses on investment property.
Note 51 Off-balance sheet transactions, contingencies and post-balance sheet events
DNB Bank ASA Off-balance sheet transactions and additional information DNB Bank Group 31 Dec. 31 Dec. 31 Dec. 31 Dec.
2011 2012 Amounts in NOK million 2012 2011 46 188 41 752 Performance guarantees 42 729 47 530 21 880 22 006 Payment guarantees 22 716 23 439 20 022 19 236 Loan guarantees 1) 19 236 17 666 5 592 6 635 Guarantees for taxes etc. 6 658 5 645 1 982 2 188 Other guarantee commitments 2 405 2 285
95 664 91 817 Total guarantee commitments 93 743 96 565 0 0 Support agreements 10 863 10 237
95 664 91 817 Total guarantee commitments etc. *) 104 606 106 802 526 711 460 733 Unutilised credit lines and loan offers 492 947 519 143
2 486 2 147 Documentary credit commitments 2 219 2 594 185 151 Other commitments 221 234
529 382 463 031 Total commitments 495 387 521 971 625 045 554 848 Total guarantee and off-balance commitments 599 993 628 773
90 524 94 871 Pledged securities 94 871 90 524
10 1 131 *) Of which counter-guaranteed by financial institutions 1 139 19
1) DNB Bank ASA carries loans in its balance sheet that subject to legal agreement have been transferred to Eksportfinans and for which DNB Bank ASA has issued guarantees. According to the agreement, DNB Bank ASA still carries interest rate risk and credit risk for the transferred portfolio. Customer loans in the portfolio totalling NOK 4 089 million were recorded in the balance sheet as at 31 December 2012. These loans are not included under guarantees in the table.
As a member of Continuous Linked Settlement Bank (CLS Bank) DNB Bank ASA has an obligation to contribute to cover any deficit in CLS Bank's central settlement account for member banks, even if the default is caused by another member bank. Initially, such deficit will be sought covered by other member banks based on transactions the respective banks have had with the member bank which has caused the deficit in CLS Bank. Should there remain an uncovered deficit in CLS Bank, this will be covered pro rata by the member banks in CLS (currently 74 of the world's largest banks), according to Article 9 "Loss Allocations" of CLS Bank's International Rules. According to the agreements between CLS and the member banks, the pro rata payment obligations related to such coverage of any remaining deficit are limited to USD 30 million per member bank. At the end of 2012, DNB Bank ASA had not recorded any obligations in relation to CLS. DNB Boligkreditt AS (Boligkreditt) At end-December 2012, Boligkreditt had issued covered bonds with a total balance sheet value of NOK 361.8 billion. In the event of bank-ruptcy, the bondholders have preferential rights to the company's cover pool. At year-end 2012, DNB Bank ASA had invested NOK 84.4 billion in covered bonds issued by Boligkreditt, used in the exchange scheme with the Norwegian government.
Covered bonds DNB Boligkreditt 31 Dec. 31 Dec.
Amounts in NOK million 2012 2011 Total listed covered bonds 324 787 315 343 Total private placements under the bond programme 36 988 35 911
AdjustmentAccrued interest 4 082 4 517 Unrealised gains/losses 16 674 7 502 Total debt securities issued 382 531 363 273
Cover pool DNB Boligkreditt 31 Dec. 31 Dec.
Amounts in NOK million 2012 2011 Pool of eligible loans 514 748 456 967 Market value of derivatives 5 409 12 923 Supplementary assets 0 0 Total collateralised assets 520 157 469 891
Over-collateralisation (per cent) 136 129

110 Annual accounts DNB Bank Annual Report 2012
Note 51 Off-balance sheet transactions, contingencies and post-balance sheet events (continued)
Contingencies Due to its extensive operations in Norway and abroad, the DNB Group will regularly be party to a number of legal actions. None of the current disputes are expected to have any material impact on the Group's financial position.
Ivar Petter Røeggen has instituted legal proceedings against DNB Bank ASA, claiming that two investment agreements for structured products be declared null and void. The Borgarting Court of Appeal found in favour of the bank on 30 September 2011. The disputed amount only applies to the civil action in question, which must be evaluated as a separate case. The judgment has been appealed to the Supreme Court, which is expected to deliver its judgment in March 2013.
In addition to the civil action brought by Ivar Petter Røeggen, a group action against DNB Bank ASA with 19 plaintiffs has been described in previous quarterly reports, relating to the sale of the same structured products as the action brought by Røeggen. The group action has been dismissed in a final judgment. Several of the plaintiffs from the original multi-party action, together with some of the other plaintiffs, have submitted a civil action against DNB Bank ASA in accordance with the rules on joinder of parties. The action has been halted by the Oslo District Court awaiting a final decision in the civil action from Røeggen. Other units in the Group are also involved in legal disputes relating to structured products. The DNB Group contests the claims.
DNB Bank ASA has brought an action against seven Norwegian municipalities for the settlement of interest swaps on commercial terms. The municipalities have stopped their payments under the agreements citing that full settlement took place upon payment of the residual value of the investments made. The bank's total claim in the civil action is NOK 825 million plus interest on overdue payments.
Post-balance sheet events No information has come to light about important circumstances which had occurred on the balance sheet date on 31 December 2012 and up till the Board of Directors' final consideration of the accounts on 13 March 2013. Oslo, 13 March 2013 The Board of Directors of DNB Bank ASA Anne Carine Tanum Jarle Bergo Sverre Finstad (chairman) (vice-chairman) Vigdis Mathisen Kai Nyland Torill Rambjør Rune Bjerke (group chief executive)
DNB Bank Annual Report 2012 Annual account 111
Statement pursuant to Section 5-5 of the Securities Trading Act We hereby confirm that the annual accounts for the banking group and the company for 2012 to the best of our knowledge have been prepared in accordance with applicable accounting standards and give a true and fair view of the assets, liabilities, financial position and profit or loss of the banking group and the company taken as a whole. The directors' report gives a true and fair review of the development and performance of the business and the position of the banking group and the company, as well as a description of the principal risks and uncertainties facing the banking group. Oslo, 13 March 2013 The Board of Directors of DNB Bank ASA Anne Carine Tanum Jarle Bergo Sverre Finstad (chairman) (vice-chairman) Vigdis Mathisen Kai Nyland Torill Rambjør Rune Bjerke Bjørn Erik Næss (group chief executive) (chief financial officer)

112 Auditor’s report DNB Bank Annual Report 2012
Auditor’s report To the Annual General Meeting and Supervisory Board of DNB Bank ASA Report on the financial statements We have audited the accompanying financial statements of DNB Bank ASA, comprising the financial statements for the Parent Company and the Group. The financial statements of the Parent Company and the Group comprise the balance sheet as at 31 December 2012, the statements of income, comprehensive income statements, cash flows and changes in equity for the year then ended and a summary of significant accounting policies and other explanatory information.
The Board of Directors' and Chief Executive Officer's responsibility for the financial statements The Board of Directors and Chief Executive Officer are responsible for the preparation and fair presentation of these financial statements in accordance with the Norwegian Accounting Act and accounting standards and practices generally accepted in Norway for the financial statements of the Parent Company and the International Financial Reporting Standards as adopted by the EU for the financial statements of the Group, and for such internal control as the Board of Directors and Chief Executive Officer determine is necessary to enable the preparation of financial statements that are free from material misstatement, whether due to fraud or error.
Auditor’s responsibility Our responsibility is to express an opinion on these financial statements based on our audit. We conducted our audit in accordance with laws, regulations, and auditing standards and practices generally accepted in Norway, including International Standards on Auditing. Those standards require that we comply with ethical requirements and plan and perform the audit to obtain reasonable assurance about whether the financial statements are free from material misstatement.
An audit involves performing procedures to obtain audit evidence about the amounts and disclosures in the financial statements. The procedures selected depend on the auditor’s judgment, including the assessment of the risks of material misstatement of the financial statements, whether due to fraud or error. In making those risk assessments, the auditor considers internal control relevant to the entity’s preparation and fair presentation of the financial statements in order to design audit procedures that are appropriate in the circumstances, but not for the purpose of expressing an opinion on the effectiveness of the entity’s internal control. An audit also includes evaluating the appropriateness of accounting policies used and the reasonableness of accounting estimates made by management, as well as evaluating the overall presentation of the financial statements.
We believe that the audit evidence we have obtained is sufficient and appropriate to provide a basis for our audit opinion on the financial statements for the Parent Company and the Group.
Opinion on the financial statements of the Parent Company In our opinion, the financial statements of DNB Bank ASA have been prepared in accordance with laws and regulations and present fairly, in all material respects, the financial position of the Company as at 31 December 2012 and its financial performance and cash flows for the year then ended in accordance with the Norwegian Accounting Act and accounting standards and practices generally accepted in Norway.
Opinion on the financial statements of the Group In our opinion, the financial statements of the Group have been prepared in accordance with laws and regulations and present fairly, in all material respects, the financial position of the Group as at 31 December 2012 and its financial performance and cash flows for the year then ended in accordance with the International Financial Reporting Standards as adopted by the EU. Report on other legal and regulatory requirements Opinion on the Board of Directors’ report and the statement on corporate governance Based on our audit of the financial statements as described above, it is our opinion that the information presented in the Directors’ report and the statement on corporate governance concerning the financial statements, the going concern assumption and the proposal for the allocation of the result is consistent with the financial statements and complies with the law and regulations.
Opinion on registration and documentation Based on our audit of the financial statements as described above, and control procedures we have considered necessary in accordance with the International Standard on Assurance Engagements (ISAE) 3000, «Assurance Engagements Other than Audits or Reviews of Historical Financial Information», it is our opinion that the Board of Directors and Chief Executive Officer have fulfilled their duty to ensure that the Company's accounting information is properly recorded and documented as required by law and generally accepted bookkeeping practice in Norway. Oslo, 13 March 2013 ERNST & YOUNG AS Erik Mamelund State Authorised Public Accountant (Norway)

DNB Bank Annual Report 2012 Control Committee's Report 113
Control Committee's report To the Supervisory Board and the Annual General Meeting of DNB Bank ASA The Control Committee has carried out supervision of DNB Bank ASA and the banking group in accordance with law and instructions laid down by the Supervisory Board. In connection with the closing of the accounts for the 2012 financial year, the Control Committee has examined the Directors’ Report, the annual accounts and the Auditor's Report for DNB Bank ASA. The Committee finds that the Board of Directors gives an adequate description of the financial position of DNB Bank and the banking group, and recommends the approval of the Directors’ Report and annual accounts for the 2012 financial year. Oslo, 13 March 2013 Frode Hassel Thorstein Øverland Vigdis Merete Almestad (chairman) (vice-chairman) Karl Olav Hovden Ida Espolin Johnson Merete Smith (deputy) (deputy)
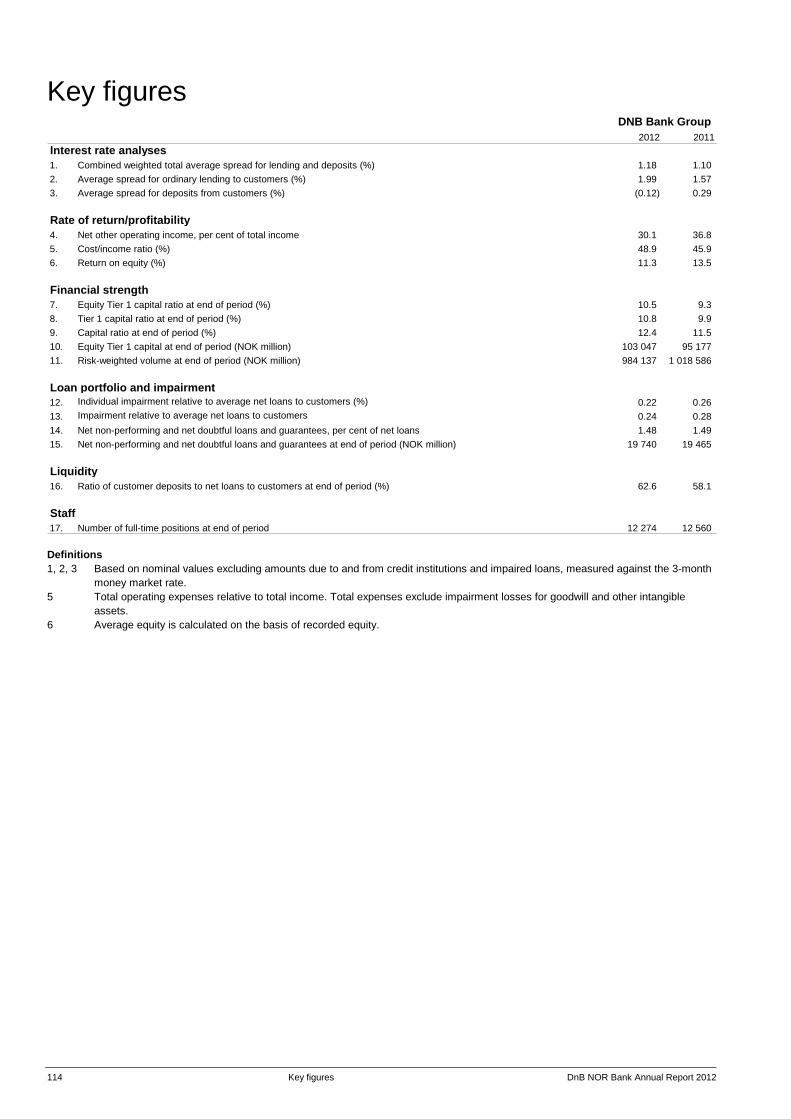
114 Key figures DnB NOR Bank Annual Report 2012
Key figures DNB Bank Group
2012 2011Interest rate analyses1. Combined weighted total average spread for lending and deposits (%) 1.18 1.102. Average spread for ordinary lending to customers (%) 1.99 1.573. Average spread for deposits from customers (%) (0.12) 0.29
Rate of return/profitability4. Net other operating income, per cent of total income 30.1 36.85. Cost/income ratio (%) 48.9 45.96. Return on equity (%) 11.3 13.5
Financial strength7. Equity Tier 1 capital ratio at end of period (%) 10.5 9.38. Tier 1 capital ratio at end of period (%) 10.8 9.99. Capital ratio at end of period (%) 12.4 11.510. Equity Tier 1 capital at end of period (NOK million) 103 047 95 177 11. Risk-weighted volume at end of period (NOK million) 984 137 1 018 586
Loan portfolio and impairment12. Individual impairment relative to average net loans to customers (%) 0.22 0.2613. Impairment relative to average net loans to customers 0.24 0.2814. Net non-performing and net doubtful loans and guarantees, per cent of net loans 1.48 1.4915. Net non-performing and net doubtful loans and guarantees at end of period (NOK million) 19 740 19 465
Liquidity16. Ratio of customer deposits to net loans to customers at end of period (%) 62.6 58.1
Staff17. Number of full-time positions at end of period 12 274 12 560 Definitions 1, 2, 3 Based on nominal values excluding amounts due to and from credit institutions and impaired loans, measured against the 3-month
money market rate. 5 Total operating expenses relative to total income. Total expenses exclude impairment losses for goodwill and other intangible
assets. 6 Average equity is calculated on the basis of recorded equity.

DNB Bank Annual Report 2012 Governing bodies 115
Governing bodies in DNB Bank ASA as at 31 December 2012 Supervisory Board Members elected by shareholders Amund Skarholt, Oslo (chairman) Eldbjørg Løwer, Kongsberg
(vice-chairman) Inge Andersen, Oslo Nils Halvard Bastiansen, Bærum Toril Eidesvik, Bergen Camilla Marianne Grieg, Bergen Leif O. Høegh, Oslo Nalan Koc, Tromsø Tomas Leire, Kristiansand Helge Møgster, Storebø Ole Robert Reitan, Asker Gudrun B. Rollefsen, Hammerfest Merete Smith, Oslo Birger Solberg, Oslo Ståle Svenning, Trondheim Turid M. Sørensen, Sandefjord Randi Eek Thorsen, Gran Gine Wang, Stavanger Hanne Rigmor Egenæss Wiig, Halden Deputies elected by shareholders Erik Buchmann, Oslo Turid Dankertsen, Oslo Rolf Domstein, Måløy Harriet Hagan, Alta Bente Hagem, Ås Rolf Hodne, Stavanger Liv Johannson, Oslo Herman Mehren, Nevnlunghamn Gry Nilsen, Drammen Asbjørn Olsen, Skedsmo Oddbjørn Paulsen, Bodø Anne Bjørg Thoen, Oslo Elsbeth Sande Tronstad, Stabekk Lars Wenaas, Måndalen Members elected by employees Terje Bakken, Alta Randi Bergsveen, Vestre Toten Rune André Bernbo, Ski Lillian Hattrem, Ski Irene Buskum Olsen, Gjøvik Einar Pedersen, Kristiansund Eli Solhaug, Oslo Marianne Steinsbu, Oslo Astrid Waaler, Oslo Arvid Åsen, Bergen 1) Not independent.
Deputies elected by employees Tore Müller Andrésen, Bergen Marion Hagland, Tønsberg Anne Grethe Johnsen, Tromsø Even Jørgensen, Moss Svein-Ove Kvalheim, Bergen Ingvild Rekdal, Oslo Sissel Tove Rist, Svolvær Stian Samuelsen, Svelvik Mia Strand, Eidsvoll Viktor Sæther, Oslo Control Committee Members Frode Hassel, Trondheim (chairman) Thorstein Øverland, Oslo (vice-chairman) Vigdis Merete Almestad, Oslo Karl Olav Hovden, Kolbotn Deputies Ida Miriam Espolin Johnson, Oslo Merete Smith, Oslo Board of Directors Members Anne Carine Tanum, Rømskog
(chairman) Jarle Bergo, Ytre Enebakk
(vice-chairman) Sverre Finstad, Moelv 1) Kai Nyland, Hamar Torill Rambjør, Tjøme Vigdis Mathisen, Oslo 1) Berit Svendsen, Oslo Deputies for the employee representatives Hans-Kristian Sætrum, Oslo 1) Bente Hornsrud Espenes, Oslo 1) Election Committee Amund Skarholt, Oslo (chairman) Eldbjørg Løwer, Kongsberg Frode Helgerud, Akershus Reier Ola Søberg, Oslo
Group management Group chief executive Rune Bjerke CFO Bjørn Erik Næss Group executive vice president Retail Banking Karin Bing Orgland Group executive vice president Large Corporates and International Leif Teksum Group executive vice president DNB Markets Ottar Ertzeid Group executive vice president Insurance and Asset Management Tom Rathke Group executive vice president Operations Liv Fiksdahl Group executive vice president HR Solveig Hellebust Group executive vice president IT Cathrine Klouman Group executive vice president Marketing, Communications and eBusiness Trond Bentestuen Group executive vice president Corporate Centre Kari Olrud Moen Group audit Tor Steenfeldt-Foss External auditor Ernst & Young AS

Cautionary statement regarding forward-looking statements This annual report contains statements regarding the future prospects, including estimates, strategies and objectives. The risks and uncertainties inherent in all forward-looking statements can lead to actual developments and profits differing materially from what has been expressed or implied. The annual report 2012 has been produced by Group Financial Reporting and Corporate Communications in DNB. Design: DNB Cover: Wei Qing, DNB Translation: Gina Fladmoe, Nathalie Samuelsen and Pål Jørgen Bakke, DNB Cover paper: 240 g MultiDesign Original Nature Inside paper: 100 g MultiDesign Original Nature Print: DNB


DN
B Bank Annual R
eport 2012
DNB Mailing address:P.O.Box 1600 SentrumN-0021 Oslo Visiting address:Dronning Eufemias gate 30Bjørvika, Oslo dnb.no
DN
B PRO
FIL & D
ESIGN
WEI Q
ING