Fact Book - DNB - Investor relations
102
Fact Book DNB Group FIRST QUARTER 2016 (Unaudited) Q1
-
Upload
khangminh22 -
Category
Documents
-
view
1 -
download
0
Transcript of Fact Book - DNB - Investor relations
DN
B G
RO
UP
FAC
T B
OO
K F
IRS
T Q
UA
RT
ER
2016
Fact BookDNB Group
FIRST QUARTER 2016(Unaudited)
Q1

Contact informationGroup Chief ExecutiveRune Bjerke
For further information, please contactBjørn Erik Næss, Chief Financial Officer [email protected] +47 4150 5201Merete Stigen, head of Group Financial Reporting [email protected] +47 4790 9878Rune Helland, head of Investor Relations [email protected] +47 2326 8400Amra Koluder, SVP Investor Relations [email protected] +47 2326 8408Kjetil Aga, Investor Relations [email protected] +47 2326 8400 / +47 2326 8408Thor Tellefsen, Investor Relations/Long Funding [email protected] +47 2326 8404
AddressDNB ASA, P.O.Box 1600 Sentrum, N-0021 OsloVisiting address: Dronning Eufemias gate 30, Bjørvika, 0191 Oslo
E-mail Investor Relations: [email protected] switchboard: +47 915 03000
Information on the InternetDNB's Investor Relations page: dnb.no/ir
Financial calendarDistribution of dividends 2016 as of 4 May 2016Q1 2016 28 April 2016Q2 2016 12 July 2016Q3 2016 27 October 2016Q4 2016 2 February 2017Capital markets day 2016 16 November 2016
Annual report 2016 9 March 2017Annual general meeting 2017 25 April 2017Ex-dividend date 2017 26 April 2017Distribution of dividends 2017 as of 5 May 2017Q1 2017 28 April 2017Q2 2017 12 July 2017Q3 2017 26 October 2017Capital markets day 2017 21 November 2017
Statements regarding DNB's relative market positions are, unless otherwise specified, based on internal DNB analyses.
Download DNB's IR app for stock-related information from http://m.euroland.com/n-dnb/en or by scanning the QR code
- 1 -
FACT BOOK DNB - 1Q16 CONTENTS
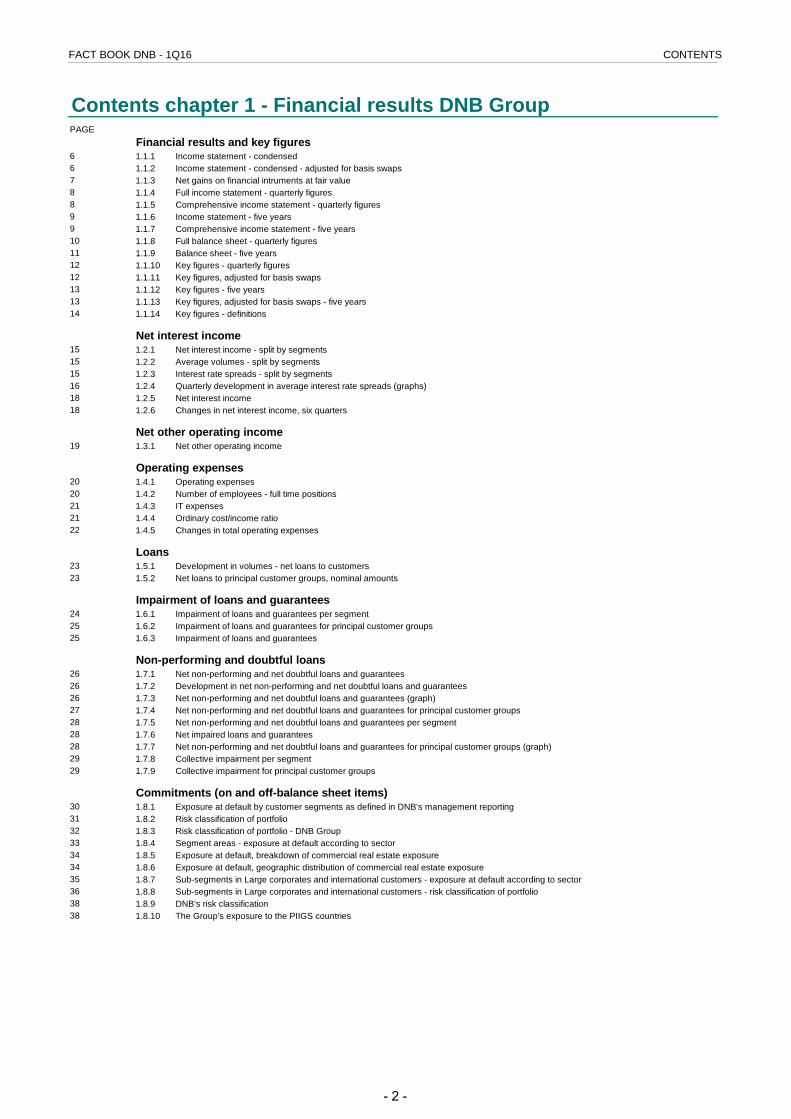
Contents chapter 1 - Financial results DNB GroupPAGE
Financial results and key figures6 1.1.1 Income statement - condensed6 1.1.2 Income statement - condensed - adjusted for basis swaps7 1.1.3 Net gains on financial intruments at fair value8 1.1.4 Full income statement - quarterly figures8 1.1.5 Comprehensive income statement - quarterly figures9 1.1.6 Income statement - five years9 1.1.7 Comprehensive income statement - five years10 1.1.8 Full balance sheet - quarterly figures11 1.1.9 Balance sheet - five years12 1.1.10 Key figures - quarterly figures12 1.1.11 Key figures, adjusted for basis swaps13 1.1.12 Key figures - five years13 1.1.13 Key figures, adjusted for basis swaps - five years14 1.1.14 Key figures - definitions
Net interest income 15 1.2.1 Net interest income - split by segments15 1.2.2 Average volumes - split by segments15 1.2.3 Interest rate spreads - split by segments16 1.2.4 Quarterly development in average interest rate spreads (graphs)18 1.2.5 Net interest income18 1.2.6 Changes in net interest income, six quarters
Net other operating income19 1.3.1 Net other operating income
Operating expenses20 1.4.1 Operating expenses20 1.4.2 Number of employees - full time positions21 1.4.3 IT expenses21 1.4.4 Ordinary cost/income ratio22 1.4.5 Changes in total operating expenses
Loans23 1.5.1 Development in volumes - net loans to customers23 1.5.2 Net loans to principal customer groups, nominal amounts
Impairment of loans and guarantees24 1.6.1 Impairment of loans and guarantees per segment25 1.6.2 Impairment of loans and guarantees for principal customer groups25 1.6.3 Impairment of loans and guarantees
Non-performing and doubtful loans26 1.7.1 Net non-performing and net doubtful loans and guarantees26 1.7.2 Development in net non-performing and net doubtful loans and guarantees26 1.7.3 Net non-performing and net doubtful loans and guarantees (graph)27 1.7.4 Net non-performing and net doubtful loans and guarantees for principal customer groups28 1.7.5 Net non-performing and net doubtful loans and guarantees per segment28 1.7.6 Net impaired loans and guarantees28 1.7.7 Net non-performing and net doubtful loans and guarantees for principal customer groups (graph)29 1.7.8 Collective impairment per segment29 1.7.9 Collective impairment for principal customer groups
Commitments (on and off-balance sheet items)30 1.8.1 Exposure at default by customer segments as defined in DNB's management reporting31 1.8.2 Risk classification of portfolio32 1.8.3 Risk classification of portfolio - DNB Group33 1.8.4 Segment areas - exposure at default according to sector 34 1.8.5 Exposure at default, breakdown of commercial real estate exposure34 1.8.6 Exposure at default, geographic distribution of commercial real estate exposure35 1.8.7 Sub-segments in Large corporates and international customers - exposure at default according to sector36 1.8.8 Sub-segments in Large corporates and international customers - risk classification of portfolio38 1.8.9 DNB's risk classification38 1.8.10 The Group's exposure to the PIIGS countries
- 2 -
FACT BOOK DNB - 1Q16 CONTENTS
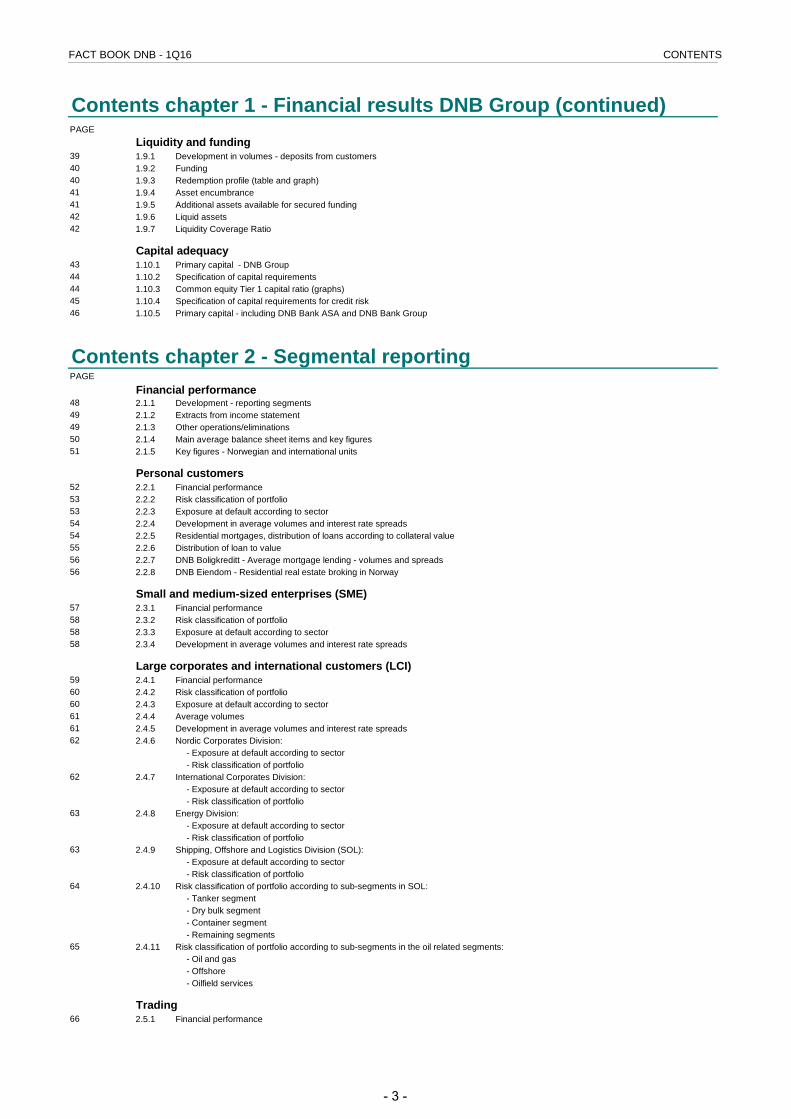
Contents chapter 1 - Financial results DNB Group (continued)PAGE
Liquidity and funding39 1.9.1 Development in volumes - deposits from customers40 1.9.2 Funding40 1.9.3 Redemption profile (table and graph)41 1.9.4 Asset encumbrance41 1.9.5 Additional assets available for secured funding42 1.9.6 Liquid assets42 1.9.7 Liquidity Coverage Ratio
Capital adequacy43 1.10.1 Primary capital - DNB Group44 1.10.2 Specification of capital requirements44 1.10.3 Common equity Tier 1 capital ratio (graphs)45 1.10.4 Specification of capital requirements for credit risk46 1.10.5 Primary capital - including DNB Bank ASA and DNB Bank Group
Contents chapter 2 - Segmental reportingPAGE
Financial performance48 2.1.1 Development - reporting segments49 2.1.2 Extracts from income statement49 2.1.3 Other operations/eliminations50 2.1.4 Main average balance sheet items and key figures51 2.1.5 Key figures - Norwegian and international units
Personal customers52 2.2.1 Financial performance53 2.2.2 Risk classification of portfolio53 2.2.3 Exposure at default according to sector54 2.2.4 Development in average volumes and interest rate spreads54 2.2.5 Residential mortgages, distribution of loans according to collateral value55 2.2.6 Distribution of loan to value56 2.2.7 DNB Boligkreditt - Average mortgage lending - volumes and spreads56 2.2.8 DNB Eiendom - Residential real estate broking in Norway
Small and medium-sized enterprises (SME)57 2.3.1 Financial performance58 2.3.2 Risk classification of portfolio58 2.3.3 Exposure at default according to sector58 2.3.4 Development in average volumes and interest rate spreads
Large corporates and international customers (LCI)59 2.4.1 Financial performance60 2.4.2 Risk classification of portfolio60 2.4.3 Exposure at default according to sector61 2.4.4 Average volumes61 2.4.5 Development in average volumes and interest rate spreads62 2.4.6 Nordic Corporates Division:
- Exposure at default according to sector- Risk classification of portfolio
62 2.4.7 International Corporates Division:- Exposure at default according to sector- Risk classification of portfolio
63 2.4.8 Energy Division:- Exposure at default according to sector- Risk classification of portfolio
63 2.4.9 Shipping, Offshore and Logistics Division (SOL):- Exposure at default according to sector- Risk classification of portfolio
64 2.4.10 Risk classification of portfolio according to sub-segments in SOL:- Tanker segment- Dry bulk segment- Container segment- Remaining segments
65 2.4.11 Risk classification of portfolio according to sub-segments in the oil related segments:- Oil and gas- Offshore- Oilfield services
Trading66 2.5.1 Financial performance
- 3 -
FACT BOOK DNB - 1Q16 CONTENTS
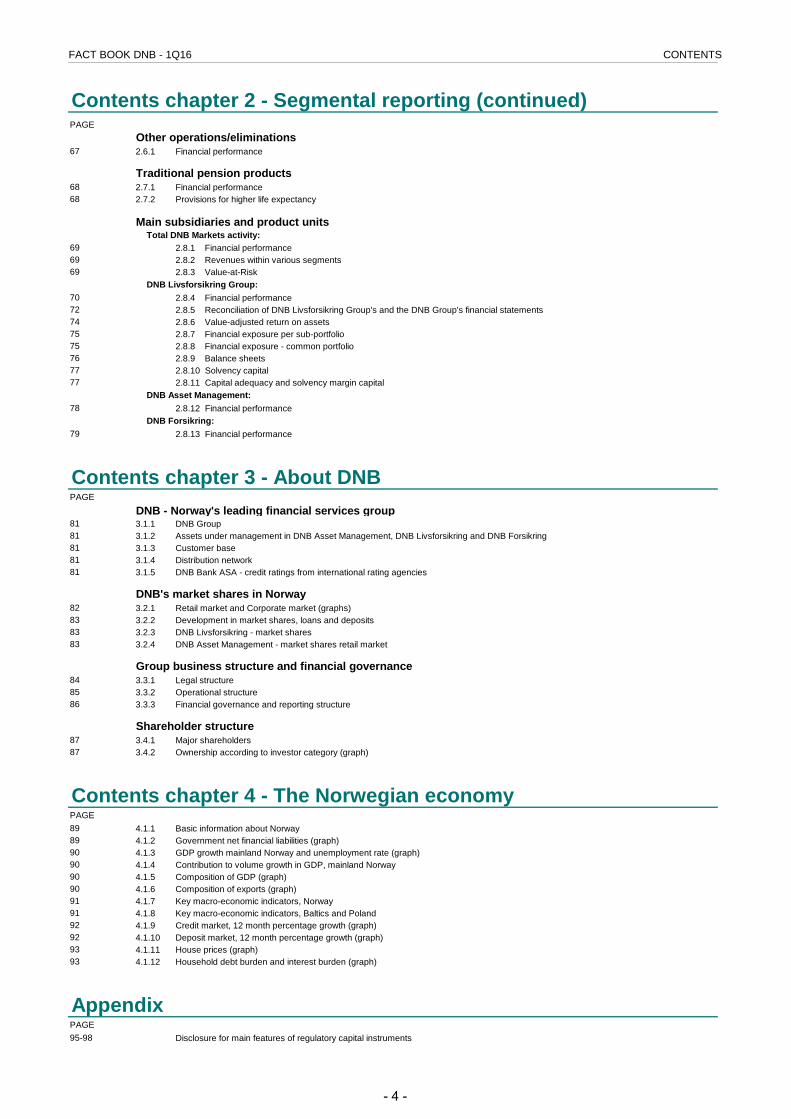
Contents chapter 2 - Segmental reporting (continued)PAGE
Other operations/eliminations67 2.6.1 Financial performance
Traditional pension products68 2.7.1 Financial performance68 2.7.2 Provisions for higher life expectancy
Main subsidiaries and product unitsTotal DNB Markets activity:
69 2.8.1 Financial performance 69 2.8.2 Revenues within various segments69 2.8.3 Value-at-Risk
DNB Livsforsikring Group:70 2.8.4 Financial performance72 2.8.5 Reconciliation of DNB Livsforsikring Group's and the DNB Group's financial statements74 2.8.6 Value-adjusted return on assets75 2.8.7 Financial exposure per sub-portfolio75 2.8.8 Financial exposure - common portfolio76 2.8.9 Balance sheets77 2.8.10 Solvency capital77 2.8.11 Capital adequacy and solvency margin capital
DNB Asset Management:78 2.8.12 Financial performance
DNB Forsikring:79 2.8.13 Financial performance
Contents chapter 3 - About DNBPAGE
DNB - Norway's leading financial services group81 3.1.1 DNB Group81 3.1.2 Assets under management in DNB Asset Management, DNB Livsforsikring and DNB Forsikring81 3.1.3 Customer base81 3.1.4 Distribution network81 3.1.5 DNB Bank ASA - credit ratings from international rating agencies
DNB's market shares in Norway82 3.2.1 Retail market and Corporate market (graphs)83 3.2.2 Development in market shares, loans and deposits83 3.2.3 DNB Livsforsikring - market shares83 3.2.4 DNB Asset Management - market shares retail market
Group business structure and financial governance84 3.3.1 Legal structure85 3.3.2 Operational structure86 3.3.3 Financial governance and reporting structure
Shareholder structure87 3.4.1 Major shareholders87 3.4.2 Ownership according to investor category (graph)
Contents chapter 4 - The Norwegian economyPAGE89 4.1.1 Basic information about Norway89 4.1.2 Government net financial liabilities (graph)90 4.1.3 GDP growth mainland Norway and unemployment rate (graph)90 4.1.4 Contribution to volume growth in GDP, mainland Norway90 4.1.5 Composition of GDP (graph)90 4.1.6 Composition of exports (graph)91 4.1.7 Key macro-economic indicators, Norway91 4.1.8 Key macro-economic indicators, Baltics and Poland92 4.1.9 Credit market, 12 month percentage growth (graph)92 4.1.10 Deposit market, 12 month percentage growth (graph)93 4.1.11 House prices (graph)93 4.1.12 Household debt burden and interest burden (graph)
AppendixPAGE95-98 Disclosure for main features of regulatory capital instruments
- 4 -
FACT BOOK DNB - 1Q16
Chapter 1 - Financial results DNB GroupFinancial results
Net interest income
Net other operating income
Operating expenses
Loans
Impairment of loans and guarantees
Non-performing and doubtful loans
Commitments (on and off-balance sheet items)
Liquidity and funding
Capital adequacy
- 5 -
FACT BOOK DNB - 1Q16 CHAPTER 1 FINANCIAL RESULTS DNB GROUP
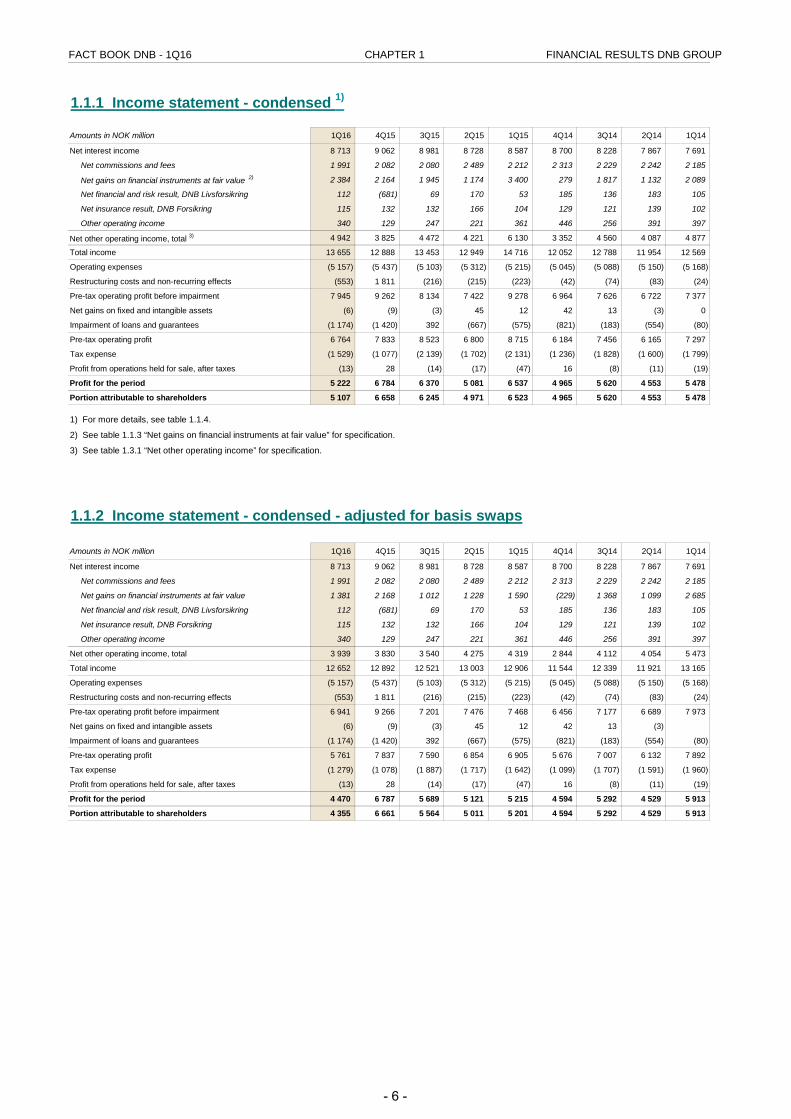
1.1.1 Income statement - condensed 1)
Amounts in NOK million 1Q16 4Q15 3Q15 2Q15 1Q15 4Q14 3Q14 2Q14 1Q14
Net interest income 8 713 9 062 8 981 8 728 8 587 8 700 8 228 7 867 7 691
Net commissions and fees 1 991 2 082 2 080 2 489 2 212 2 313 2 229 2 242 2 185
Net gains on financial instruments at fair value 2) 2 384 2 164 1 945 1 174 3 400 279 1 817 1 132 2 089
Net financial and risk result, DNB Livsforsikring 112 (681) 69 170 53 185 136 183 105
Net insurance result, DNB Forsikring 115 132 132 166 104 129 121 139 102
Other operating income 340 129 247 221 361 446 256 391 397
Net other operating income, total 3) 4 942 3 825 4 472 4 221 6 130 3 352 4 560 4 087 4 877
Total income 13 655 12 888 13 453 12 949 14 716 12 052 12 788 11 954 12 569
Operating expenses (5 157) (5 437) (5 103) (5 312) (5 215) (5 045) (5 088) (5 150) (5 168)
Restructuring costs and non-recurring effects (553) 1 811 (216) (215) (223) (42) (74) (83) (24)
Pre-tax operating profit before impairment 7 945 9 262 8 134 7 422 9 278 6 964 7 626 6 722 7 377
Net gains on fixed and intangible assets (6) (9) (3) 45 12 42 13 (3) 0
Impairment of loans and guarantees (1 174) (1 420) 392 (667) (575) (821) (183) (554) (80)
Pre-tax operating profit 6 764 7 833 8 523 6 800 8 715 6 184 7 456 6 165 7 297
Tax expense (1 529) (1 077) (2 139) (1 702) (2 131) (1 236) (1 828) (1 600) (1 799)
Profit from operations held for sale, after taxes (13) 28 (14) (17) (47) 16 (8) (11) (19)
Profit for the period 5 222 6 784 6 370 5 081 6 537 4 965 5 620 4 553 5 478
Portion attributable to shareholders 5 107 6 658 6 245 4 971 6 523 4 965 5 620 4 553 5 478
1.1.2 Income statement - condensed - adjusted for basis swaps
Amounts in NOK million 1Q16 4Q15 3Q15 2Q15 1Q15 4Q14 3Q14 2Q14 1Q14
Net interest income 8 713 9 062 8 981 8 728 8 587 8 700 8 228 7 867 7 691
Net commissions and fees 1 991 2 082 2 080 2 489 2 212 2 313 2 229 2 242 2 185
Net gains on financial instruments at fair value 1 381 2 168 1 012 1 228 1 590 (229) 1 368 1 099 2 685
Net financial and risk result, DNB Livsforsikring 112 (681) 69 170 53 185 136 183 105
Net insurance result, DNB Forsikring 115 132 132 166 104 129 121 139 102
Other operating income 340 129 247 221 361 446 256 391 397
Net other operating income, total 3 939 3 830 3 540 4 275 4 319 2 844 4 112 4 054 5 473
Total income 12 652 12 892 12 521 13 003 12 906 11 544 12 339 11 921 13 165
Operating expenses (5 157) (5 437) (5 103) (5 312) (5 215) (5 045) (5 088) (5 150) (5 168)
Restructuring costs and non-recurring effects (553) 1 811 (216) (215) (223) (42) (74) (83) (24)
Pre-tax operating profit before impairment 6 941 9 266 7 201 7 476 7 468 6 456 7 177 6 689 7 973
Net gains on fixed and intangible assets (6) (9) (3) 45 12 42 13 (3)
Impairment of loans and guarantees (1 174) (1 420) 392 (667) (575) (821) (183) (554) (80)
Pre-tax operating profit 5 761 7 837 7 590 6 854 6 905 5 676 7 007 6 132 7 892
Tax expense (1 279) (1 078) (1 887) (1 717) (1 642) (1 099) (1 707) (1 591) (1 960)
Profit from operations held for sale, after taxes (13) 28 (14) (17) (47) 16 (8) (11) (19)
Profit for the period 4 470 6 787 5 689 5 121 5 215 4 594 5 292 4 529 5 913
Portion attributable to shareholders 4 355 6 661 5 564 5 011 5 201 4 594 5 292 4 529 5 913
1) For more details, see table 1.1.4.
2) See table 1.1.3 “Net gains on financial instruments at fair value” for specification.
3) See table 1.3.1 “Net other operating income” for specification.
- 6 -
FACT BOOK DNB - 1Q16 CHAPTER 1 FINANCIAL RESULTS DNB GROUP
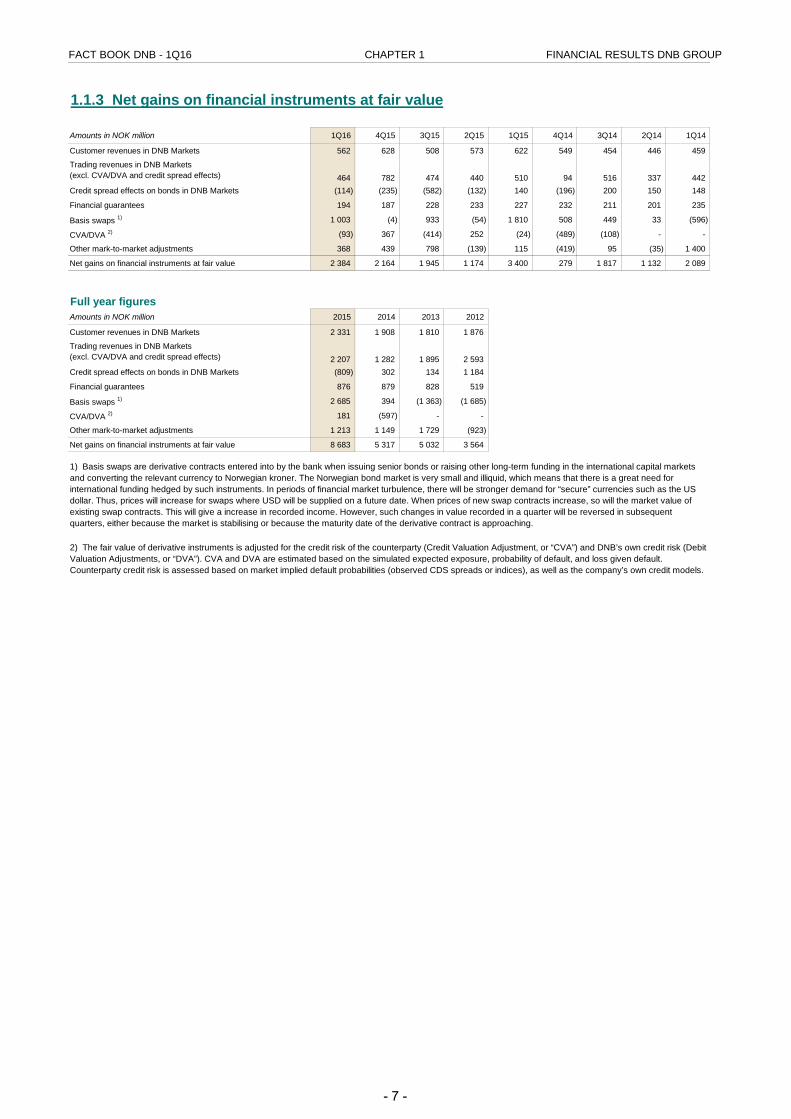
1.1.3 Net gains on financial instruments at fair value
Amounts in NOK million 1Q16 4Q15 3Q15 2Q15 1Q15 4Q14 3Q14 2Q14 1Q14
Customer revenues in DNB Markets 562 628 508 573 622 549 454 446 459
464 782 474 440 510 94 516 337 442 Credit spread effects on bonds in DNB Markets (114) (235) (582) (132) 140 (196) 200 150 148
Financial guarantees 194 187 228 233 227 232 211 201 235
Basis swaps 1) 1 003 (4) 933 (54) 1 810 508 449 33 (596)
CVA/DVA 2) (93) 367 (414) 252 (24) (489) (108) - -
Other mark-to-market adjustments 368 439 798 (139) 115 (419) 95 (35) 1 400
Net gains on financial instruments at fair value 2 384 2 164 1 945 1 174 3 400 279 1 817 1 132 2 089
Full year figuresAmounts in NOK million 2015 2014 2013 2012
Customer revenues in DNB Markets 2 331 1 908 1 810 1 876
2 207 1 282 1 895 2 593 Credit spread effects on bonds in DNB Markets (809) 302 134 1 184
Financial guarantees 876 879 828 519
Basis swaps 1) 2 685 394 (1 363) (1 685)
CVA/DVA 2) 181 (597) - -
Other mark-to-market adjustments 1 213 1 149 1 729 (923)
Net gains on financial instruments at fair value 8 683 5 317 5 032 3 564
2) The fair value of derivative instruments is adjusted for the credit risk of the counterparty (Credit Valuation Adjustment, or “CVA”) and DNB’s own credit risk (Debit Valuation Adjustments, or “DVA”). CVA and DVA are estimated based on the simulated expected exposure, probability of default, and loss given default. Counterparty credit risk is assessed based on market implied default probabilities (observed CDS spreads or indices), as well as the company’s own credit models.
1) Basis swaps are derivative contracts entered into by the bank when issuing senior bonds or raising other long-term funding in the international capital markets and converting the relevant currency to Norwegian kroner. The Norwegian bond market is very small and illiquid, which means that there is a great need for international funding hedged by such instruments. In periods of financial market turbulence, there will be stronger demand for “secure” currencies such as the US dollar. Thus, prices will increase for swaps where USD will be supplied on a future date. When prices of new swap contracts increase, so will the market value of existing swap contracts. This will give a increase in recorded income. However, such changes in value recorded in a quarter will be reversed in subsequent quarters, either because the market is stabilising or because the maturity date of the derivative contract is approaching.
Trading revenues in DNB Markets (excl. CVA/DVA and credit spread effects)
Trading revenues in DNB Markets (excl. CVA/DVA and credit spread effects)
- 7 -
FACT BOOK DNB - 1Q16 CHAPTER 1 FINANCIAL RESULTS DNB GROUP
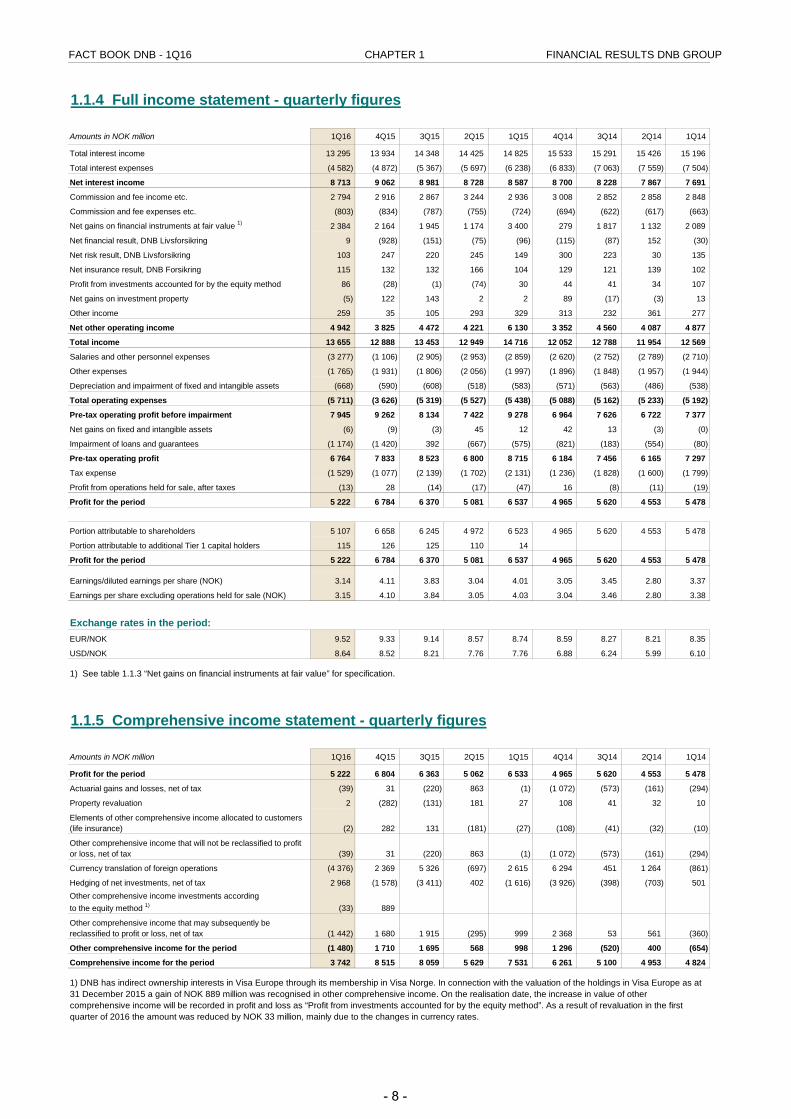
1.1.4 Full income statement - quarterly figures
Amounts in NOK million 1Q16 4Q15 3Q15 2Q15 1Q15 4Q14 3Q14 2Q14 1Q14
Total interest income 13 295 13 934 14 348 14 425 14 825 15 533 15 291 15 426 15 196
Total interest expenses (4 582) (4 872) (5 367) (5 697) (6 238) (6 833) (7 063) (7 559) (7 504)
Net interest income 8 713 9 062 8 981 8 728 8 587 8 700 8 228 7 867 7 691
Commission and fee income etc. 2 794 2 916 2 867 3 244 2 936 3 008 2 852 2 858 2 848
Commission and fee expenses etc. (803) (834) (787) (755) (724) (694) (622) (617) (663)
Net gains on financial instruments at fair value 1) 2 384 2 164 1 945 1 174 3 400 279 1 817 1 132 2 089
Net financial result, DNB Livsforsikring 9 (928) (151) (75) (96) (115) (87) 152 (30)
Net risk result, DNB Livsforsikring 103 247 220 245 149 300 223 30 135
Net insurance result, DNB Forsikring 115 132 132 166 104 129 121 139 102
Profit from investments accounted for by the equity method 86 (28) (1) (74) 30 44 41 34 107
Net gains on investment property (5) 122 143 2 2 89 (17) (3) 13
Other income 259 35 105 293 329 313 232 361 277
Net other operating income 4 942 3 825 4 472 4 221 6 130 3 352 4 560 4 087 4 877
Total income 13 655 12 888 13 453 12 949 14 716 12 052 12 788 11 954 12 569
Salaries and other personnel expenses (3 277) (1 106) (2 905) (2 953) (2 859) (2 620) (2 752) (2 789) (2 710)
Other expenses (1 765) (1 931) (1 806) (2 056) (1 997) (1 896) (1 848) (1 957) (1 944)
Depreciation and impairment of fixed and intangible assets (668) (590) (608) (518) (583) (571) (563) (486) (538)
Total operating expenses (5 711) (3 626) (5 319) (5 527) (5 438) (5 088) (5 162) (5 233) (5 192)
Pre-tax operating profit before impairment 7 945 9 262 8 134 7 422 9 278 6 964 7 626 6 722 7 377
Net gains on fixed and intangible assets (6) (9) (3) 45 12 42 13 (3) (0)
Impairment of loans and guarantees (1 174) (1 420) 392 (667) (575) (821) (183) (554) (80)
Pre-tax operating profit 6 764 7 833 8 523 6 800 8 715 6 184 7 456 6 165 7 297
Tax expense (1 529) (1 077) (2 139) (1 702) (2 131) (1 236) (1 828) (1 600) (1 799)
Profit from operations held for sale, after taxes (13) 28 (14) (17) (47) 16 (8) (11) (19)
Profit for the period 5 222 6 784 6 370 5 081 6 537 4 965 5 620 4 553 5 478
5 107 6 658 6 245 4 972 6 523 4 965 5 620 4 553 5 478
Portion attributable to additional Tier 1 capital holders 115 126 125 110 14
Profit for the period 5 222 6 784 6 370 5 081 6 537 4 965 5 620 4 553 5 478
Earnings/diluted earnings per share (NOK) 3.14 4.11 3.83 3.04 4.01 3.05 3.45 2.80 3.37
Earnings per share excluding operations held for sale (NOK) 3.15 4.10 3.84 3.05 4.03 3.04 3.46 2.80 3.38
Exchange rates in the period:EUR/NOK 9.52 9.33 9.14 8.57 8.74 8.59 8.27 8.21 8.35
USD/NOK 8.64 8.52 8.21 7.76 7.76 6.88 6.24 5.99 6.10
1.1.5 Comprehensive income statement - quarterly figures
Amounts in NOK million 1Q16 4Q15 3Q15 2Q15 1Q15 4Q14 3Q14 2Q14 1Q14
Profit for the period 5 222 6 804 6 363 5 062 6 533 4 965 5 620 4 553 5 478
Actuarial gains and losses, net of tax (39) 31 (220) 863 (1) (1 072) (573) (161) (294)
Property revaluation 2 (282) (131) 181 27 108 41 32 10
(2) 282 131 (181) (27) (108) (41) (32) (10)
(39) 31 (220) 863 (1) (1 072) (573) (161) (294)
Currency translation of foreign operations (4 376) 2 369 5 326 (697) 2 615 6 294 451 1 264 (861)
Hedging of net investments, net of tax 2 968 (1 578) (3 411) 402 (1 616) (3 926) (398) (703) 501
(33) 889
(1 442) 1 680 1 915 (295) 999 2 368 53 561 (360)
Other comprehensive income for the period (1 480) 1 710 1 695 568 998 1 296 (520) 400 (654)
Comprehensive income for the period 3 742 8 515 8 059 5 629 7 531 6 261 5 100 4 953 4 824
1) See table 1.1.3 “Net gains on financial instruments at fair value” for specification.
Other comprehensive income investments according to the equity method 1)
Portion attributable to shareholders
Elements of other comprehensive income allocated to customers (life insurance)
Other comprehensive income that will not be reclassified to profit or loss, net of tax
Other comprehensive income that may subsequently be reclassified to profit or loss, net of tax
1) DNB has indirect ownership interests in Visa Europe through its membership in Visa Norge. In connection with the valuation of the holdings in Visa Europe as at 31 December 2015 a gain of NOK 889 million was recognised in other comprehensive income. On the realisation date, the increase in value of other comprehensive income will be recorded in profit and loss as “Profit from investments accounted for by the equity method”. As a result of revaluation in the first quarter of 2016 the amount was reduced by NOK 33 million, mainly due to the changes in currency rates.
- 8 -
FACT BOOK DNB - 1Q16 CHAPTER 1 FINANCIAL RESULTS DNB GROUP
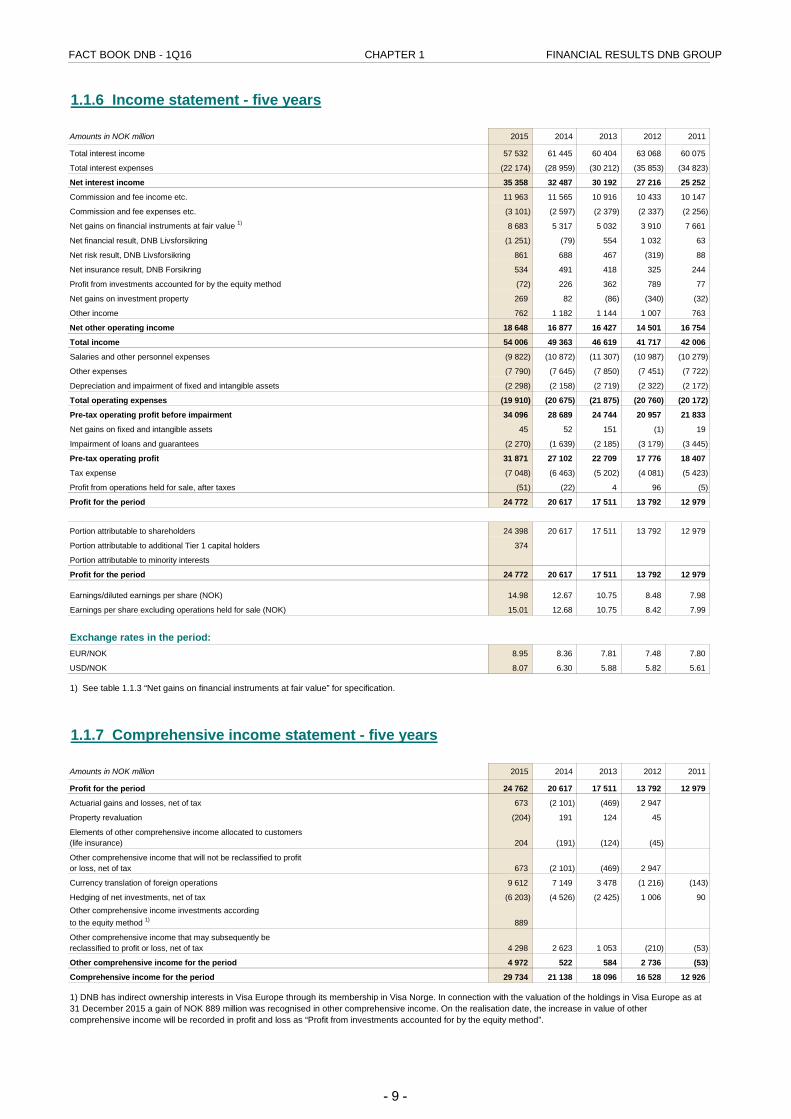
1.1.6 Income statement - five years
Amounts in NOK million 2015 2014 2013 2012 2011
Total interest income 57 532 61 445 60 404 63 068 60 075
Total interest expenses (22 174) (28 959) (30 212) (35 853) (34 823)
Net interest income 35 358 32 487 30 192 27 216 25 252
Commission and fee income etc. 11 963 11 565 10 916 10 433 10 147
Commission and fee expenses etc. (3 101) (2 597) (2 379) (2 337) (2 256)
Net gains on financial instruments at fair value 1) 8 683 5 317 5 032 3 910 7 661
Net financial result, DNB Livsforsikring (1 251) (79) 554 1 032 63
Net risk result, DNB Livsforsikring 861 688 467 (319) 88
Net insurance result, DNB Forsikring 534 491 418 325 244
Profit from investments accounted for by the equity method (72) 226 362 789 77
Net gains on investment property 269 82 (86) (340) (32)
Other income 762 1 182 1 144 1 007 763
Net other operating income 18 648 16 877 16 427 14 501 16 754
Total income 54 006 49 363 46 619 41 717 42 006
Salaries and other personnel expenses (9 822) (10 872) (11 307) (10 987) (10 279)
Other expenses (7 790) (7 645) (7 850) (7 451) (7 722)
Depreciation and impairment of fixed and intangible assets (2 298) (2 158) (2 719) (2 322) (2 172)
Total operating expenses (19 910) (20 675) (21 875) (20 760) (20 172)
Pre-tax operating profit before impairment 34 096 28 689 24 744 20 957 21 833
Net gains on fixed and intangible assets 45 52 151 (1) 19
Impairment of loans and guarantees (2 270) (1 639) (2 185) (3 179) (3 445)
Pre-tax operating profit 31 871 27 102 22 709 17 776 18 407
Tax expense (7 048) (6 463) (5 202) (4 081) (5 423)
Profit from operations held for sale, after taxes (51) (22) 4 96 (5)
Profit for the period 24 772 20 617 17 511 13 792 12 979
24 398 20 617 17 511 13 792 12 979
Portion attributable to additional Tier 1 capital holders 374
Portion attributable to minority interests
Profit for the period 24 772 20 617 17 511 13 792 12 979
Earnings/diluted earnings per share (NOK) 14.98 12.67 10.75 8.48 7.98
Earnings per share excluding operations held for sale (NOK) 15.01 12.68 10.75 8.42 7.99
Exchange rates in the period:EUR/NOK 8.95 8.36 7.81 7.48 7.80
USD/NOK 8.07 6.30 5.88 5.82 5.61
1.1.7 Comprehensive income statement - five years
Amounts in NOK million 2015 2014 2013 2012 2011
Profit for the period 24 762 20 617 17 511 13 792 12 979
Actuarial gains and losses, net of tax 673 (2 101) (469) 2 947
Property revaluation (204) 191 124 45
204 (191) (124) (45)
673 (2 101) (469) 2 947
Currency translation of foreign operations 9 612 7 149 3 478 (1 216) (143)
Hedging of net investments, net of tax (6 203) (4 526) (2 425) 1 006 90
889
4 298 2 623 1 053 (210) (53)
Other comprehensive income for the period 4 972 522 584 2 736 (53)
Comprehensive income for the period 29 734 21 138 18 096 16 528 12 926
1) See table 1.1.3 “Net gains on financial instruments at fair value” for specification.
Other comprehensive income investments according to the equity method 1)
Portion attributable to shareholders
Elements of other comprehensive income allocated to customers (life insurance)
Other comprehensive income that will not be reclassified to profit or loss, net of tax
1) DNB has indirect ownership interests in Visa Europe through its membership in Visa Norge. In connection with the valuation of the holdings in Visa Europe as at 31 December 2015 a gain of NOK 889 million was recognised in other comprehensive income. On the realisation date, the increase in value of other comprehensive income will be recorded in profit and loss as “Profit from investments accounted for by the equity method”.
Other comprehensive income that may subsequently be reclassified to profit or loss, net of tax
- 9 -
FACT BOOK DNB - 1Q16 CHAPTER 1 FINANCIAL RESULTS DNB GROUP
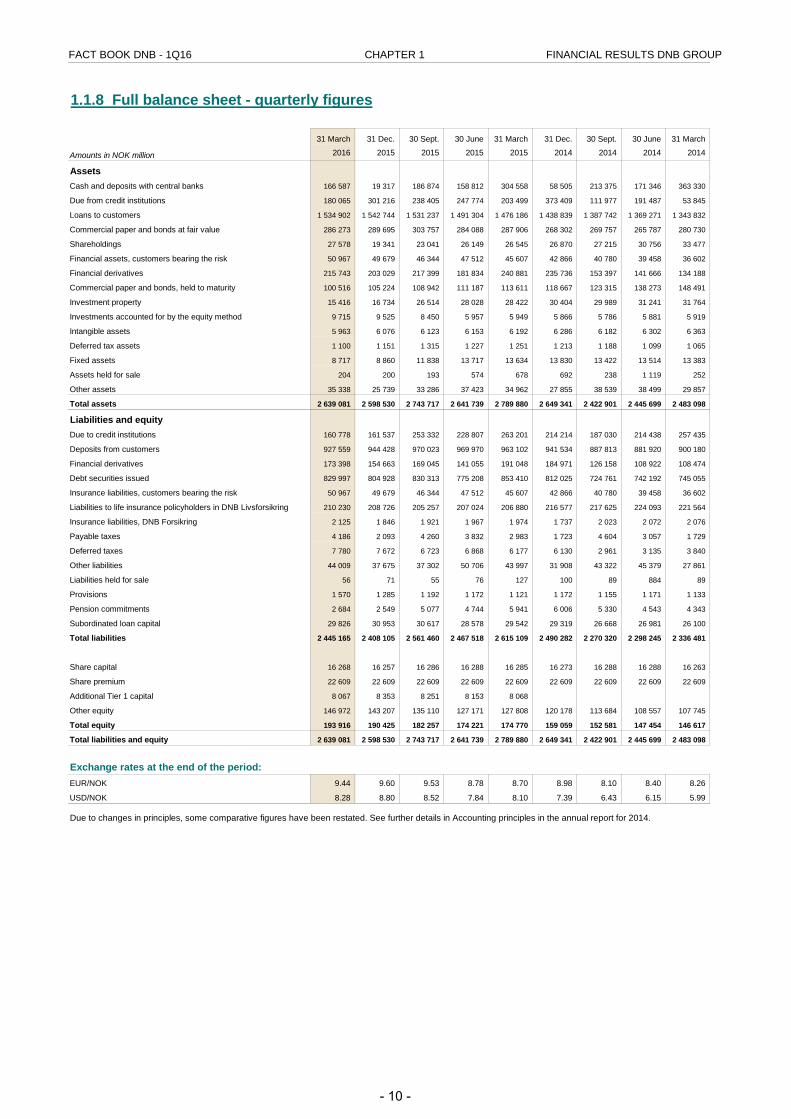
1.1.8 Full balance sheet - quarterly figures
31 March 31 Dec. 30 Sept. 30 June 31 March 31 Dec. 30 Sept. 30 June 31 March
Amounts in NOK million 2016 2015 2015 2015 2015 2014 2014 2014 2014
AssetsCash and deposits with central banks 166 587 19 317 186 874 158 812 304 558 58 505 213 375 171 346 363 330
Due from credit institutions 180 065 301 216 238 405 247 774 203 499 373 409 111 977 191 487 53 845
Loans to customers 1 534 902 1 542 744 1 531 237 1 491 304 1 476 186 1 438 839 1 387 742 1 369 271 1 343 832
Commercial paper and bonds at fair value 286 273 289 695 303 757 284 088 287 906 268 302 269 757 265 787 280 730
Shareholdings 27 578 19 341 23 041 26 149 26 545 26 870 27 215 30 756 33 477
Financial assets, customers bearing the risk 50 967 49 679 46 344 47 512 45 607 42 866 40 780 39 458 36 602
Financial derivatives 215 743 203 029 217 399 181 834 240 881 235 736 153 397 141 666 134 188
Commercial paper and bonds, held to maturity 100 516 105 224 108 942 111 187 113 611 118 667 123 315 138 273 148 491
Investment property 15 416 16 734 26 514 28 028 28 422 30 404 29 989 31 241 31 764
Investments accounted for by the equity method 9 715 9 525 8 450 5 957 5 949 5 866 5 786 5 881 5 919
Intangible assets 5 963 6 076 6 123 6 153 6 192 6 286 6 182 6 302 6 363
Deferred tax assets 1 100 1 151 1 315 1 227 1 251 1 213 1 188 1 099 1 065
Fixed assets 8 717 8 860 11 838 13 717 13 634 13 830 13 422 13 514 13 383
Assets held for sale 204 200 193 574 678 692 238 1 119 252
Other assets 35 338 25 739 33 286 37 423 34 962 27 855 38 539 38 499 29 857
Total assets 2 639 081 2 598 530 2 743 717 2 641 739 2 789 880 2 649 341 2 422 901 2 445 699 2 483 098
Liabilities and equityDue to credit institutions 160 778 161 537 253 332 228 807 263 201 214 214 187 030 214 438 257 435
Deposits from customers 927 559 944 428 970 023 969 970 963 102 941 534 887 813 881 920 900 180
Financial derivatives 173 398 154 663 169 045 141 055 191 048 184 971 126 158 108 922 108 474
Debt securities issued 829 997 804 928 830 313 775 208 853 410 812 025 724 761 742 192 745 055
Insurance liabilities, customers bearing the risk 50 967 49 679 46 344 47 512 45 607 42 866 40 780 39 458 36 602
Liabilities to life insurance policyholders in DNB Livsforsikring 210 230 208 726 205 257 207 024 206 880 216 577 217 625 224 093 221 564
Insurance liabilities, DNB Forsikring 2 125 1 846 1 921 1 967 1 974 1 737 2 023 2 072 2 076
Payable taxes 4 186 2 093 4 260 3 832 2 983 1 723 4 604 3 057 1 729
Deferred taxes 7 780 7 672 6 723 6 868 6 177 6 130 2 961 3 135 3 840
Other liabilities 44 009 37 675 37 302 50 706 43 997 31 908 43 322 45 379 27 861
Liabilities held for sale 56 71 55 76 127 100 89 884 89
Provisions 1 570 1 285 1 192 1 172 1 121 1 172 1 155 1 171 1 133
Pension commitments 2 684 2 549 5 077 4 744 5 941 6 006 5 330 4 543 4 343
Subordinated loan capital 29 826 30 953 30 617 28 578 29 542 29 319 26 668 26 981 26 100
Total liabilities 2 445 165 2 408 105 2 561 460 2 467 518 2 615 109 2 490 282 2 270 320 2 298 245 2 336 481
Share capital 16 268 16 257 16 286 16 288 16 285 16 273 16 288 16 288 16 263
Share premium 22 609 22 609 22 609 22 609 22 609 22 609 22 609 22 609 22 609
Additional Tier 1 capital 8 067 8 353 8 251 8 153 8 068
Other equity 146 972 143 207 135 110 127 171 127 808 120 178 113 684 108 557 107 745
Total equity 193 916 190 425 182 257 174 221 174 770 159 059 152 581 147 454 146 617
Total liabilities and equity 2 639 081 2 598 530 2 743 717 2 641 739 2 789 880 2 649 341 2 422 901 2 445 699 2 483 098
Exchange rates at the end of the period:EUR/NOK 9.44 9.60 9.53 8.78 8.70 8.98 8.10 8.40 8.26
USD/NOK 8.28 8.80 8.52 7.84 8.10 7.39 6.43 6.15 5.99
Due to changes in principles, some comparative figures have been restated. See further details in Accounting principles in the annual report for 2014.
- 10 -
FACT BOOK DNB - 1Q16 CHAPTER 1 FINANCIAL RESULTS DNB GROUP
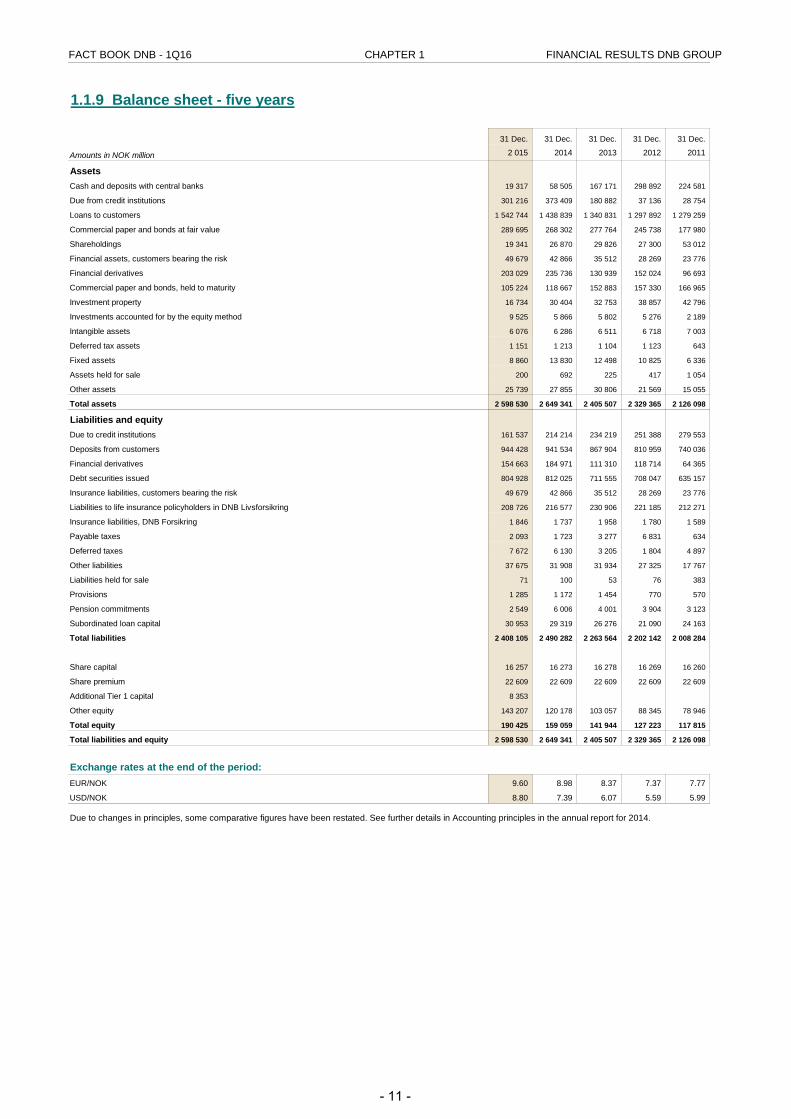
1.1.9 Balance sheet - five years
31 Dec. 31 Dec. 31 Dec. 31 Dec. 31 Dec.
Amounts in NOK million 2 015 2014 2013 2012 2011
AssetsCash and deposits with central banks 19 317 58 505 167 171 298 892 224 581
Due from credit institutions 301 216 373 409 180 882 37 136 28 754
Loans to customers 1 542 744 1 438 839 1 340 831 1 297 892 1 279 259
Commercial paper and bonds at fair value 289 695 268 302 277 764 245 738 177 980
Shareholdings 19 341 26 870 29 826 27 300 53 012
Financial assets, customers bearing the risk 49 679 42 866 35 512 28 269 23 776
Financial derivatives 203 029 235 736 130 939 152 024 96 693
Commercial paper and bonds, held to maturity 105 224 118 667 152 883 157 330 166 965
Investment property 16 734 30 404 32 753 38 857 42 796
Investments accounted for by the equity method 9 525 5 866 5 802 5 276 2 189
Intangible assets 6 076 6 286 6 511 6 718 7 003
Deferred tax assets 1 151 1 213 1 104 1 123 643
Fixed assets 8 860 13 830 12 498 10 825 6 336
Assets held for sale 200 692 225 417 1 054
Other assets 25 739 27 855 30 806 21 569 15 055
Total assets 2 598 530 2 649 341 2 405 507 2 329 365 2 126 098
Liabilities and equityDue to credit institutions 161 537 214 214 234 219 251 388 279 553
Deposits from customers 944 428 941 534 867 904 810 959 740 036
Financial derivatives 154 663 184 971 111 310 118 714 64 365
Debt securities issued 804 928 812 025 711 555 708 047 635 157
Insurance liabilities, customers bearing the risk 49 679 42 866 35 512 28 269 23 776
Liabilities to life insurance policyholders in DNB Livsforsikring 208 726 216 577 230 906 221 185 212 271
Insurance liabilities, DNB Forsikring 1 846 1 737 1 958 1 780 1 589
Payable taxes 2 093 1 723 3 277 6 831 634
Deferred taxes 7 672 6 130 3 205 1 804 4 897
Other liabilities 37 675 31 908 31 934 27 325 17 767
Liabilities held for sale 71 100 53 76 383
Provisions 1 285 1 172 1 454 770 570
Pension commitments 2 549 6 006 4 001 3 904 3 123
Subordinated loan capital 30 953 29 319 26 276 21 090 24 163
Total liabilities 2 408 105 2 490 282 2 263 564 2 202 142 2 008 284
Share capital 16 257 16 273 16 278 16 269 16 260
Share premium 22 609 22 609 22 609 22 609 22 609
Additional Tier 1 capital 8 353
Other equity 143 207 120 178 103 057 88 345 78 946
Total equity 190 425 159 059 141 944 127 223 117 815
Total liabilities and equity 2 598 530 2 649 341 2 405 507 2 329 365 2 126 098
Exchange rates at the end of the period:EUR/NOK 9.60 8.98 8.37 7.37 7.77
USD/NOK 8.80 7.39 6.07 5.59 5.99
Due to changes in principles, some comparative figures have been restated. See further details in Accounting principles in the annual report for 2014.
- 11 -
FACT BOOK DNB - 1Q16 CHAPTER 1 FINANCIAL RESULTS DNB GROUP
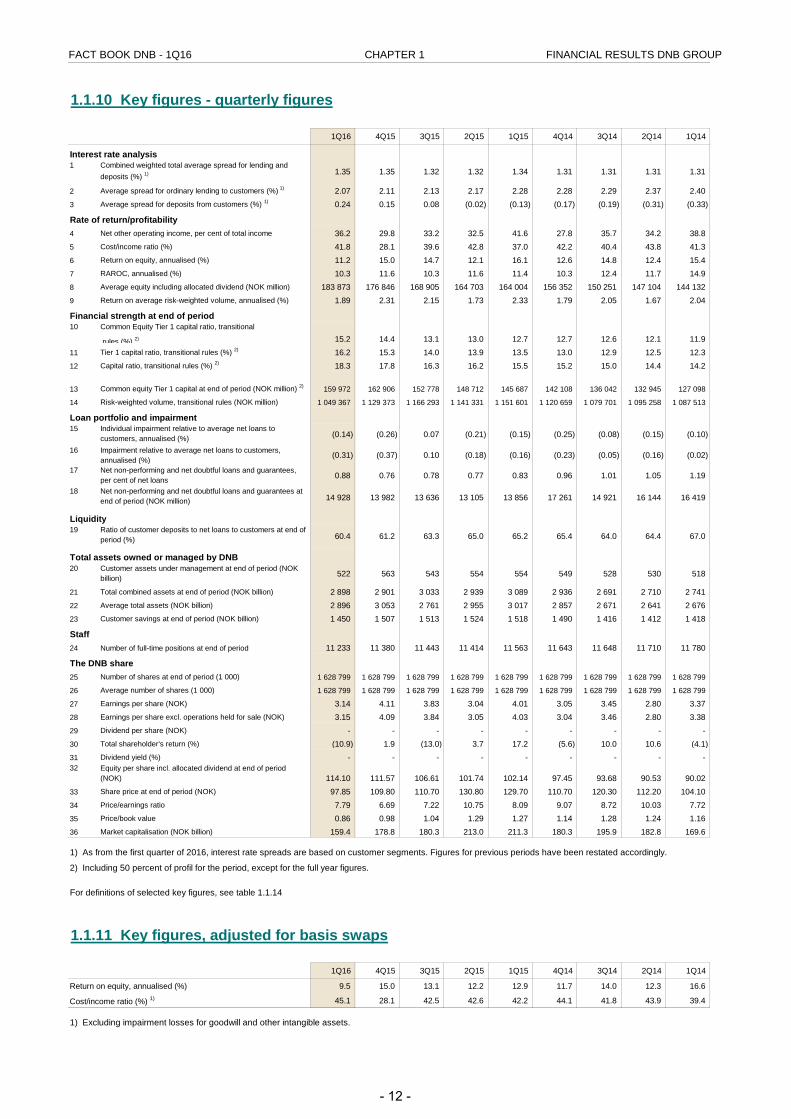
1.1.10 Key figures - quarterly figures
1Q16 4Q15 3Q15 2Q15 1Q15 4Q14 3Q14 2Q14 1Q14
Interest rate analysis1 Combined weighted total average spread for lending and
deposits (%) 1) 1.35 1.35 1.32 1.32 1.34 1.31 1.31 1.31 1.31
2 Average spread for ordinary lending to customers (%) 1) 2.07 2.11 2.13 2.17 2.28 2.28 2.29 2.37 2.403 Average spread for deposits from customers (%) 1) 0.24 0.15 0.08 (0.02) (0.13) (0.17) (0.19) (0.31) (0.33)
Rate of return/profitability4 Net other operating income, per cent of total income 36.2 29.8 33.2 32.5 41.6 27.8 35.7 34.2 38.85 Cost/income ratio (%) 41.8 28.1 39.6 42.8 37.0 42.2 40.4 43.8 41.36 Return on equity, annualised (%) 11.2 15.0 14.7 12.1 16.1 12.6 14.8 12.4 15.47 RAROC, annualised (%) 10.3 11.6 10.3 11.6 11.4 10.3 12.4 11.7 14.98 Average equity including allocated dividend (NOK million) 183 873 176 846 168 905 164 703 164 004 156 352 150 251 147 104 144 132 9 Return on average risk-weighted volume, annualised (%) 1.89 2.31 2.15 1.73 2.33 1.79 2.05 1.67 2.04
Financial strength at end of period10 Common Equity Tier 1 capital ratio, transitional
rules (%) 2) 15.2 14.4 13.1 13.0 12.7 12.7 12.6 12.1 11.9
11 Tier 1 capital ratio, transitional rules (%) 2) 16.2 15.3 14.0 13.9 13.5 13.0 12.9 12.5 12.312 Capital ratio, transitional rules (%) 2) 18.3 17.8 16.3 16.2 15.5 15.2 15.0 14.4 14.2
13 Common equity Tier 1 capital at end of period (NOK million) 2) 159 972 162 906 152 778 148 712 145 687 142 108 136 042 132 945 127 098
14 Risk-weighted volume, transitional rules (NOK million) 1 049 367 1 129 373 1 166 293 1 141 331 1 151 601 1 120 659 1 079 701 1 095 258 1 087 513
Loan portfolio and impairment15 Individual impairment relative to average net loans to
customers, annualised (%) (0.14) (0.26) 0.07 (0.21) (0.15) (0.25) (0.08) (0.15) (0.10)
16 Impairment relative to average net loans to customers, annualised (%) (0.31) (0.37) 0.10 (0.18) (0.16) (0.23) (0.05) (0.16) (0.02)
17 Net non-performing and net doubtful loans and guarantees, per cent of net loans 0.88 0.76 0.78 0.77 0.83 0.96 1.01 1.05 1.19
18 Net non-performing and net doubtful loans and guarantees at end of period (NOK million) 14 928 13 982 13 636 13 105 13 856 17 261 14 921 16 144 16 419
Liquidity19 Ratio of customer deposits to net loans to customers at end of
period (%) 60.4 61.2 63.3 65.0 65.2 65.4 64.0 64.4 67.0
20 Customer assets under management at end of period (NOK billion) 522 563 543 554 554 549 528 530 518
21 Total combined assets at end of period (NOK billion) 2 898 2 901 3 033 2 939 3 089 2 936 2 691 2 710 2 741 22 Average total assets (NOK billion) 2 896 3 053 2 761 2 955 3 017 2 857 2 671 2 641 2 676 23 Customer savings at end of period (NOK billion) 1 450 1 507 1 513 1 524 1 518 1 490 1 416 1 412 1 418
Staff24 Number of full-time positions at end of period 11 233 11 380 11 443 11 414 11 563 11 643 11 648 11 710 11 780
The DNB share25 Number of shares at end of period (1 000) 1 628 799 1 628 799 1 628 799 1 628 799 1 628 799 1 628 799 1 628 799 1 628 799 1 628 799
26 Average number of shares (1 000) 1 628 799 1 628 799 1 628 799 1 628 799 1 628 799 1 628 799 1 628 799 1 628 799 1 628 799
27 Earnings per share (NOK) 3.14 4.11 3.83 3.04 4.01 3.05 3.45 2.80 3.3728 Earnings per share excl. operations held for sale (NOK) 3.15 4.09 3.84 3.05 4.03 3.04 3.46 2.80 3.3829 Dividend per share (NOK) - - - - - - - - -30 Total shareholder's return (%) (10.9) 1.9 (13.0) 3.7 17.2 (5.6) 10.0 10.6 (4.1)31 Dividend yield (%) - - - - - - - - -32 Equity per share incl. allocated dividend at end of period
(NOK) 114.10 111.57 106.61 101.74 102.14 97.45 93.68 90.53 90.0233 Share price at end of period (NOK) 97.85 109.80 110.70 130.80 129.70 110.70 120.30 112.20 104.1034 Price/earnings ratio 7.79 6.69 7.22 10.75 8.09 9.07 8.72 10.03 7.7235 Price/book value 0.86 0.98 1.04 1.29 1.27 1.14 1.28 1.24 1.1636 Market capitalisation (NOK billion) 159.4 178.8 180.3 213.0 211.3 180.3 195.9 182.8 169.6
For definitions of selected key figures, see table 1.1.14
1.1.11 Key figures, adjusted for basis swaps
1Q16 4Q15 3Q15 2Q15 1Q15 4Q14 3Q14 2Q14 1Q14
Return on equity, annualised (%) 9.5 15.0 13.1 12.2 12.9 11.7 14.0 12.3 16.6
Cost/income ratio (%) 1) 45.1 28.1 42.5 42.6 42.2 44.1 41.8 43.9 39.4
Total assets owned or managed by DNB
2) Including 50 percent of profil for the period, except for the full year figures.
1) Excluding impairment losses for goodwill and other intangible assets.
1) As from the first quarter of 2016, interest rate spreads are based on customer segments. Figures for previous periods have been restated accordingly.
- 12 -
FACT BOOK DNB - 1Q16 CHAPTER 1 FINANCIAL RESULTS DNB GROUP
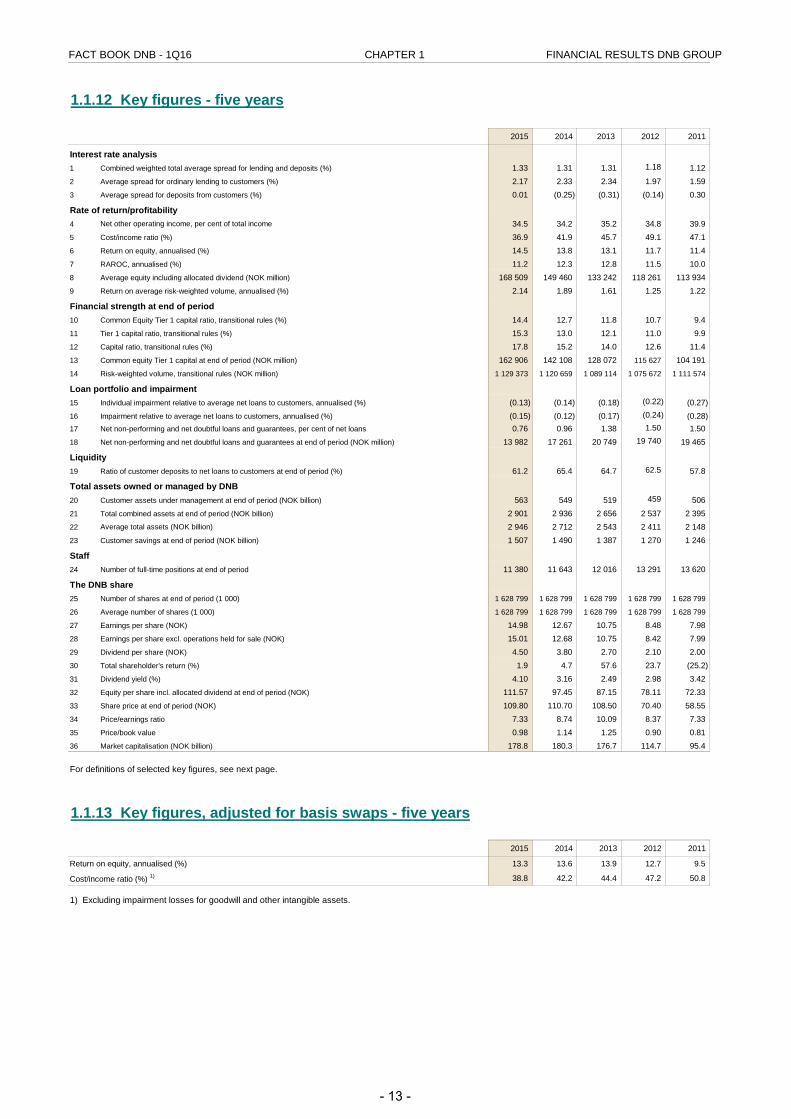
1.1.12 Key figures - five years
2015 2014 2013 2012 2011
Interest rate analysis1 Combined weighted total average spread for lending and deposits (%) 1.33 1.31 1.31 1.18 1.122 Average spread for ordinary lending to customers (%) 2.17 2.33 2.34 1.97 1.593 Average spread for deposits from customers (%) 0.01 (0.25) (0.31) (0.14) 0.30
Rate of return/profitability4 Net other operating income, per cent of total income 34.5 34.2 35.2 34.8 39.95 Cost/income ratio (%) 36.9 41.9 45.7 49.1 47.16 Return on equity, annualised (%) 14.5 13.8 13.1 11.7 11.47 RAROC, annualised (%) 11.2 12.3 12.8 11.5 10.08 Average equity including allocated dividend (NOK million) 168 509 149 460 133 242 118 261 113 934 9 Return on average risk-weighted volume, annualised (%) 2.14 1.89 1.61 1.25 1.22
Financial strength at end of period10 Common Equity Tier 1 capital ratio, transitional rules (%) 14.4 12.7 11.8 10.7 9.411 Tier 1 capital ratio, transitional rules (%) 15.3 13.0 12.1 11.0 9.912 Capital ratio, transitional rules (%) 17.8 15.2 14.0 12.6 11.413 Common equity Tier 1 capital at end of period (NOK million) 162 906 142 108 128 072 115 627 104 191 14 Risk-weighted volume, transitional rules (NOK million) 1 129 373 1 120 659 1 089 114 1 075 672 1 111 574
Loan portfolio and impairment15 Individual impairment relative to average net loans to customers, annualised (%) (0.13) (0.14) (0.18) (0.22) (0.27)16 Impairment relative to average net loans to customers, annualised (%) (0.15) (0.12) (0.17) (0.24) (0.28)17 Net non-performing and net doubtful loans and guarantees, per cent of net loans 0.76 0.96 1.38 1.50 1.5018 Net non-performing and net doubtful loans and guarantees at end of period (NOK million) 13 982 17 261 20 749 19 740 19 465
Liquidity19 Ratio of customer deposits to net loans to customers at end of period (%) 61.2 65.4 64.7 62.5 57.8
20 Customer assets under management at end of period (NOK billion) 563 549 519 459 506 21 Total combined assets at end of period (NOK billion) 2 901 2 936 2 656 2 537 2 395 22 Average total assets (NOK billion) 2 946 2 712 2 543 2 411 2 148 23 Customer savings at end of period (NOK billion) 1 507 1 490 1 387 1 270 1 246
Staff24 Number of full-time positions at end of period 11 380 11 643 12 016 13 291 13 620
The DNB share25 Number of shares at end of period (1 000) 1 628 799 1 628 799 1 628 799 1 628 799 1 628 799
26 Average number of shares (1 000) 1 628 799 1 628 799 1 628 799 1 628 799 1 628 799
27 Earnings per share (NOK) 14.98 12.67 10.75 8.48 7.9828 Earnings per share excl. operations held for sale (NOK) 15.01 12.68 10.75 8.42 7.9929 Dividend per share (NOK) 4.50 3.80 2.70 2.10 2.0030 Total shareholder's return (%) 1.9 4.7 57.6 23.7 (25.2)31 Dividend yield (%) 4.10 3.16 2.49 2.98 3.4232 Equity per share incl. allocated dividend at end of period (NOK) 111.57 97.45 87.15 78.11 72.3333 Share price at end of period (NOK) 109.80 110.70 108.50 70.40 58.5534 Price/earnings ratio 7.33 8.74 10.09 8.37 7.3335 Price/book value 0.98 1.14 1.25 0.90 0.8136 Market capitalisation (NOK billion) 178.8 180.3 176.7 114.7 95.4
For definitions of selected key figures, see next page.
1.1.13 Key figures, adjusted for basis swaps - five years
2015 2014 2013 2012 2011
Return on equity, annualised (%) 13.3 13.6 13.9 12.7 9.5
Cost/income ratio (%) 1) 38.8 42.2 44.4 47.2 50.8
1) Excluding impairment losses for goodwill and other intangible assets.
Total assets owned or managed by DNB
- 13 -
FACT BOOK DNB - 1Q16 CHAPTER 1 FINANCIAL RESULTS DNB GROUP
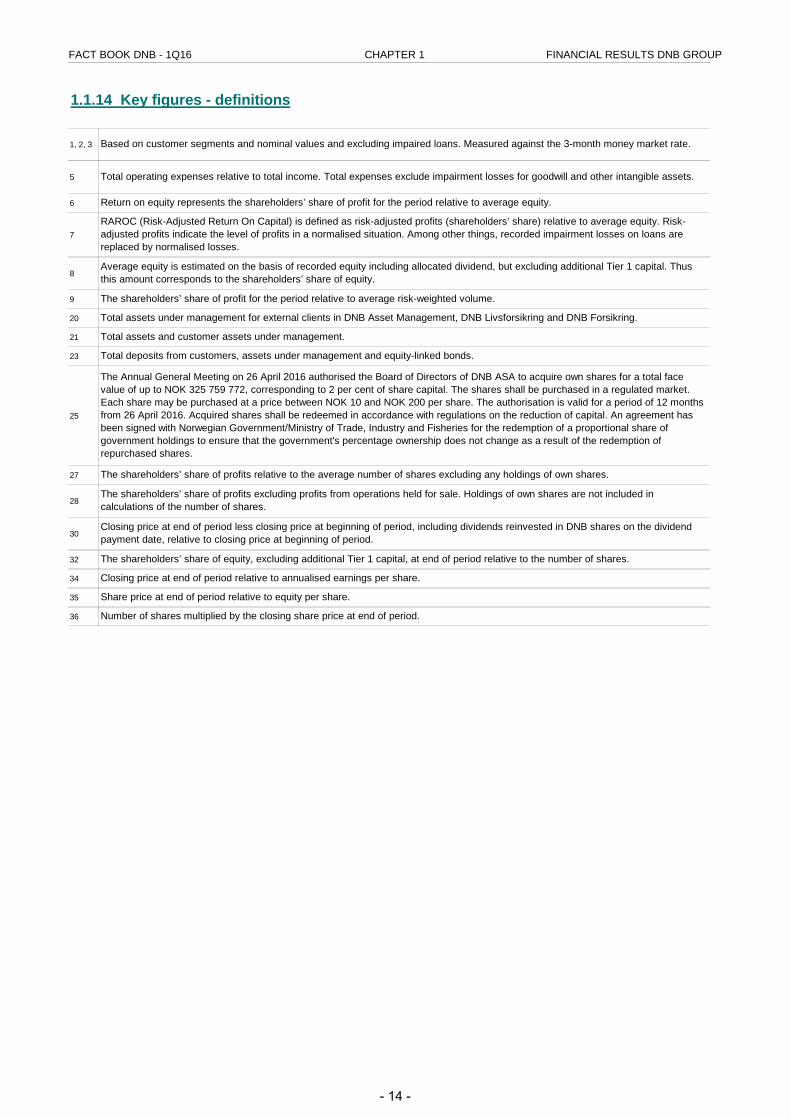
1.1.14 Key figures - definitions
1, 2, 3
5
6
7
8
9
20
21
23
25
27
28
30
32
34
35
36
Based on customer segments and nominal values and excluding impaired loans. Measured against the 3-month money market rate.
Total operating expenses relative to total income. Total expenses exclude impairment losses for goodwill and other intangible assets.
Number of shares multiplied by the closing share price at end of period.
The Annual General Meeting on 26 April 2016 authorised the Board of Directors of DNB ASA to acquire own shares for a total face value of up to NOK 325 759 772, corresponding to 2 per cent of share capital. The shares shall be purchased in a regulated market. Each share may be purchased at a price between NOK 10 and NOK 200 per share. The authorisation is valid for a period of 12 months from 26 April 2016. Acquired shares shall be redeemed in accordance with regulations on the reduction of capital. An agreement has been signed with Norwegian Government/Ministry of Trade, Industry and Fisheries for the redemption of a proportional share of government holdings to ensure that the government's percentage ownership does not change as a result of the redemption of repurchased shares.
The shareholders’ share of profits relative to the average number of shares excluding any holdings of own shares.
The shareholders’ share of profits excluding profits from operations held for sale. Holdings of own shares are not included in calculations of the number of shares.
Closing price at end of period less closing price at beginning of period, including dividends reinvested in DNB shares on the dividend payment date, relative to closing price at beginning of period.
The shareholders’ share of equity, excluding additional Tier 1 capital, at end of period relative to the number of shares.
Closing price at end of period relative to annualised earnings per share.
Share price at end of period relative to equity per share.
The shareholders’ share of profit for the period relative to average risk-weighted volume.
Total assets under management for external clients in DNB Asset Management, DNB Livsforsikring and DNB Forsikring.
Total assets and customer assets under management.
Total deposits from customers, assets under management and equity-linked bonds.
Return on equity represents the shareholders’ share of profit for the period relative to average equity.
RAROC (Risk-Adjusted Return On Capital) is defined as risk-adjusted profits (shareholders’ share) relative to average equity. Risk-adjusted profits indicate the level of profits in a normalised situation. Among other things, recorded impairment losses on loans are replaced by normalised losses.
Average equity is estimated on the basis of recorded equity including allocated dividend, but excluding additional Tier 1 capital. Thus this amount corresponds to the shareholders’ share of equity.
- 14 -
FACT BOOK DNB - 1Q16 CHAPTER 1 FINANCIAL RESULTS DNB GROUP
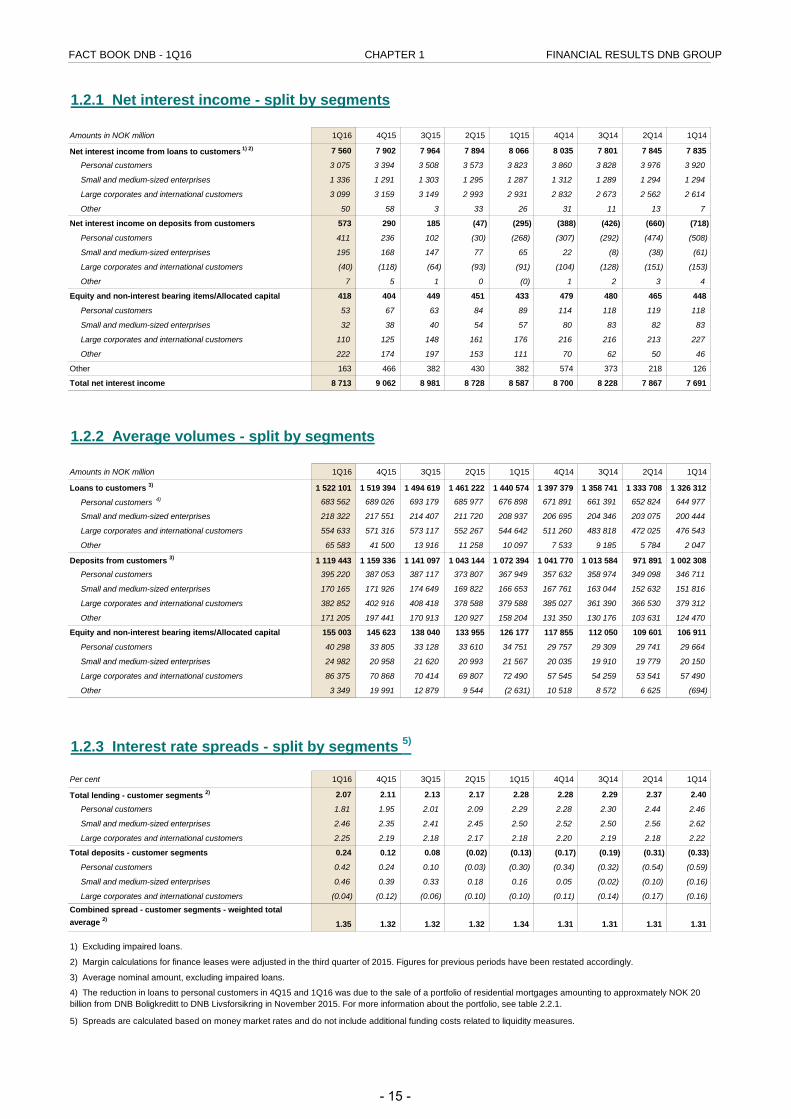
1.2.1 Net interest income - split by segments
Amounts in NOK million 1Q16 4Q15 3Q15 2Q15 1Q15 4Q14 3Q14 2Q14 1Q14
Net interest income from loans to customers 1) 2) 7 560 7 902 7 964 7 894 8 066 8 035 7 801 7 845 7 835
Personal customers 3 075 3 394 3 508 3 573 3 823 3 860 3 828 3 976 3 920
Small and medium-sized enterprises 1 336 1 291 1 303 1 295 1 287 1 312 1 289 1 294 1 294
Large corporates and international customers 3 099 3 159 3 149 2 993 2 931 2 832 2 673 2 562 2 614
Other 50 58 3 33 26 31 11 13 7
Net interest income on deposits from customers 573 290 185 (47) (295) (388) (426) (660) (718)
Personal customers 411 236 102 (30) (268) (307) (292) (474) (508)
Small and medium-sized enterprises 195 168 147 77 65 22 (8) (38) (61)
Large corporates and international customers (40) (118) (64) (93) (91) (104) (128) (151) (153)
Other 7 5 1 0 (0) 1 2 3 4
Equity and non-interest bearing items/Allocated capital 418 404 449 451 433 479 480 465 448
Personal customers 53 67 63 84 89 114 118 119 118
Small and medium-sized enterprises 32 38 40 54 57 80 83 82 83
Large corporates and international customers 110 125 148 161 176 216 216 213 227
Other 222 174 197 153 111 70 62 50 46
Other 163 466 382 430 382 574 373 218 126
Total net interest income 8 713 9 062 8 981 8 728 8 587 8 700 8 228 7 867 7 691
1.2.2 Average volumes - split by segments
Amounts in NOK million 1Q16 4Q15 3Q15 2Q15 1Q15 4Q14 3Q14 2Q14 1Q14
Loans to customers 3) 1 522 101 1 519 394 1 494 619 1 461 222 1 440 574 1 397 379 1 358 741 1 333 708 1 326 312
Personal customers 4) 683 562 689 026 693 179 685 977 676 898 671 891 661 391 652 824 644 977
Small and medium-sized enterprises 218 322 217 551 214 407 211 720 208 937 206 695 204 346 203 075 200 444
Large corporates and international customers 554 633 571 316 573 117 552 267 544 642 511 260 483 818 472 025 476 543
Other 65 583 41 500 13 916 11 258 10 097 7 533 9 185 5 784 2 047
Deposits from customers 3) 1 119 443 1 159 336 1 141 097 1 043 144 1 072 394 1 041 770 1 013 584 971 891 1 002 308Personal customers 395 220 387 053 387 117 373 807 367 949 357 632 358 974 349 098 346 711
Small and medium-sized enterprises 170 165 171 926 174 649 169 822 166 653 167 761 163 044 152 632 151 816
Large corporates and international customers 382 852 402 916 408 418 378 588 379 588 385 027 361 390 366 530 379 312
Other 171 205 197 441 170 913 120 927 158 204 131 350 130 176 103 631 124 470
Equity and non-interest bearing items/Allocated capital 155 003 145 623 138 040 133 955 126 177 117 855 112 050 109 601 106 911
Personal customers 40 298 33 805 33 128 33 610 34 751 29 757 29 309 29 741 29 664
Small and medium-sized enterprises 24 982 20 958 21 620 20 993 21 567 20 035 19 910 19 779 20 150
Large corporates and international customers 86 375 70 868 70 414 69 807 72 490 57 545 54 259 53 541 57 490
Other 3 349 19 991 12 879 9 544 (2 631) 10 518 8 572 6 625 (694)
1.2.3 Interest rate spreads - split by segments 5)
Per cent 1Q16 4Q15 3Q15 2Q15 1Q15 4Q14 3Q14 2Q14 1Q14
Total lending - customer segments 2) 2.07 2.11 2.13 2.17 2.28 2.28 2.29 2.37 2.40
Personal customers 1.81 1.95 2.01 2.09 2.29 2.28 2.30 2.44 2.46
Small and medium-sized enterprises 2.46 2.35 2.41 2.45 2.50 2.52 2.50 2.56 2.62
Large corporates and international customers 2.25 2.19 2.18 2.17 2.18 2.20 2.19 2.18 2.22
Total deposits - customer segments 0.24 0.12 0.08 (0.02) (0.13) (0.17) (0.19) (0.31) (0.33)
Personal customers 0.42 0.24 0.10 (0.03) (0.30) (0.34) (0.32) (0.54) (0.59)
Small and medium-sized enterprises 0.46 0.39 0.33 0.18 0.16 0.05 (0.02) (0.10) (0.16)
Large corporates and international customers (0.04) (0.12) (0.06) (0.10) (0.10) (0.11) (0.14) (0.17) (0.16)Combined spread - customer segments - weighted total average 2)
1.35 1.32 1.32 1.32 1.34 1.31 1.31 1.31 1.31
2) Margin calculations for finance leases were adjusted in the third quarter of 2015. Figures for previous periods have been restated accordingly.
5) Spreads are calculated based on money market rates and do not include additional funding costs related to liquidity measures.
3) Average nominal amount, excluding impaired loans.
1) Excluding impaired loans.
4) The reduction in loans to personal customers in 4Q15 and 1Q16 was due to the sale of a portfolio of residential mortgages amounting to approxmately NOK 20 billion from DNB Boligkreditt to DNB Livsforsikring in November 2015. For more information about the portfolio, see table 2.2.1.
- 15 -
FACT BOOK DNB - 1Q16 CHAPTER 1 FINANCIAL RESULTS DNB GROUP
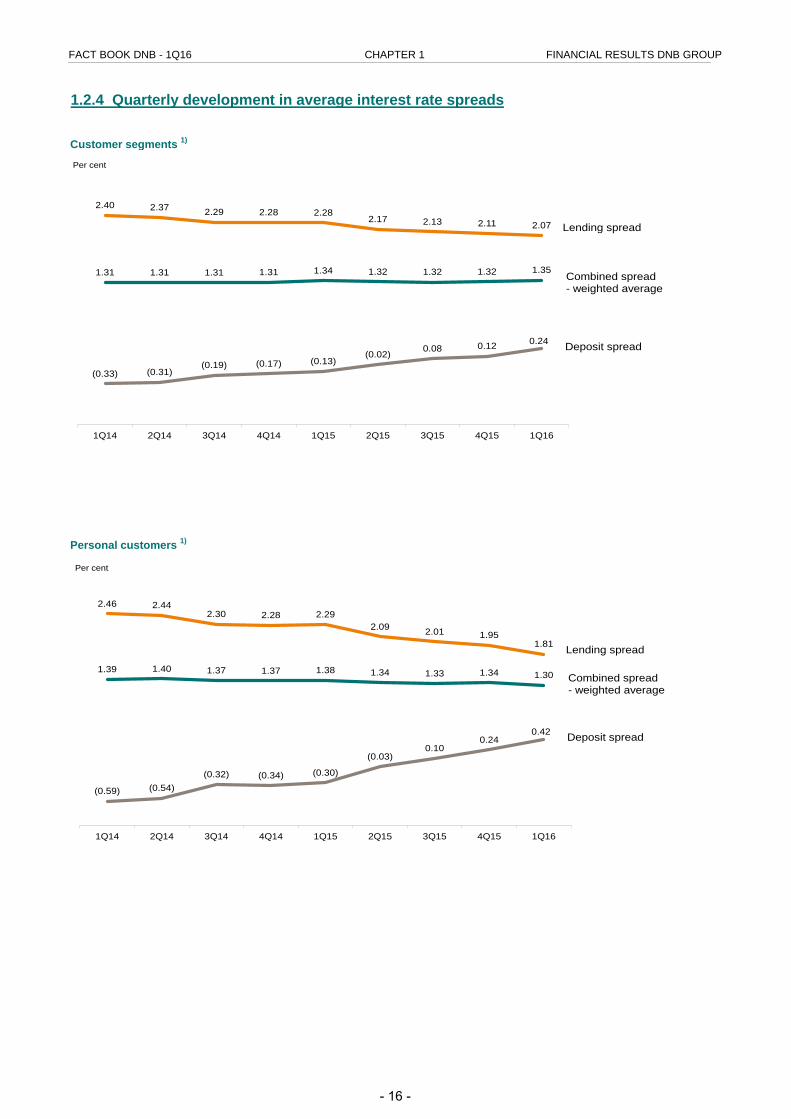
1.2.4 Quarterly development in average interest rate spreads
Customer segments 1)
Personal customers 1)
2.46 2.442.30 2.28 2.29
2.09 2.01 1.951.81
(0.59) (0.54)(0.32) (0.34) (0.30)
(0.03)0.10
0.240.42
1.39 1.40 1.37 1.37 1.38 1.34 1.33 1.34 1.30
1Q14 2Q14 3Q14 4Q14 1Q15 2Q15 3Q15 4Q15 1Q16
Lending spread
Deposit spread
Combined spread- weighted average
Per cent
2.40 2.37 2.29 2.28 2.282.17 2.13 2.11 2.07
(0.33) (0.31)(0.19) (0.17) (0.13)
(0.02) 0.08 0.12 0.24
1.31 1.31 1.31 1.31 1.34 1.32 1.32 1.32 1.35
1Q14 2Q14 3Q14 4Q14 1Q15 2Q15 3Q15 4Q15 1Q16
Lending spread
Deposit spread
Combined spread- weighted average
Per cent
- 16 -
FACT BOOK DNB - 1Q16 CHAPTER 1 FINANCIAL RESULTS DNB GROUP
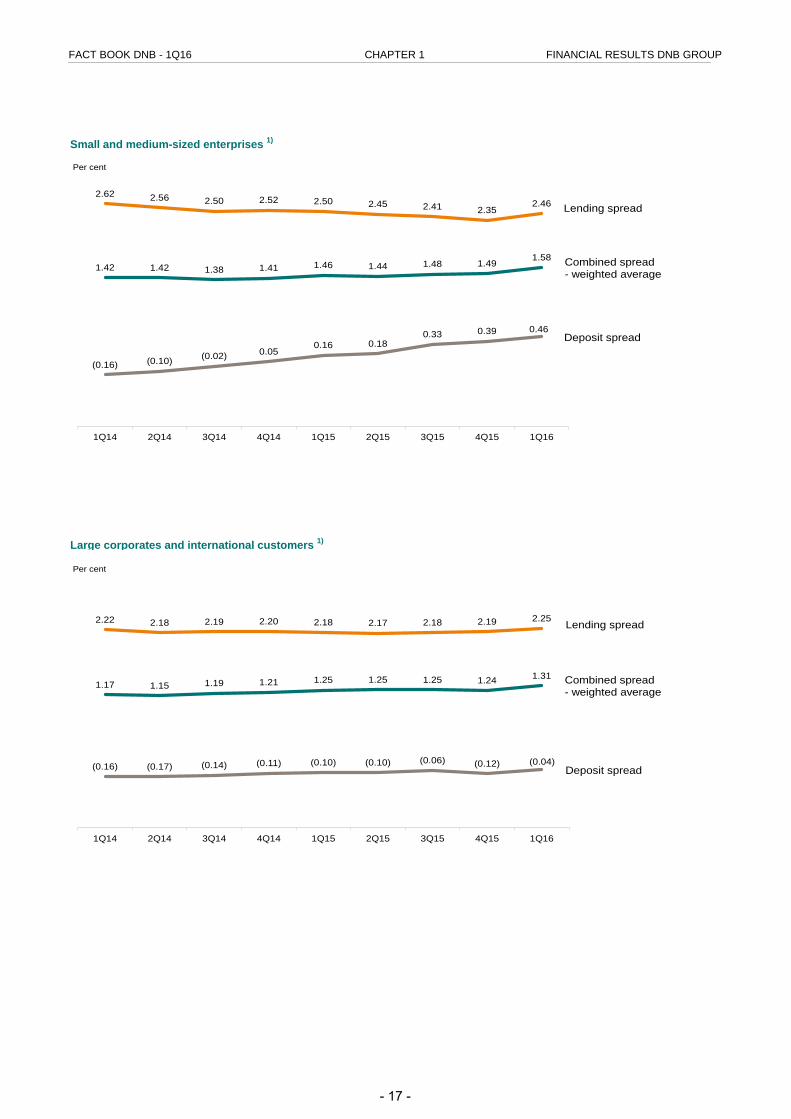
Small and medium-sized enterprises 1)
Large corporates and international customers 1)
1) Margin calculations for finance leases were adjusted in the third quarter of 2015. Figures for previous periods have been restated accordingly.
2.62 2.56 2.50 2.52 2.50 2.45 2.41 2.352.46
(0.16) (0.10) (0.02) 0.050.16 0.18
0.33 0.39 0.46
1.42 1.42 1.38 1.41 1.46 1.44 1.48 1.491.58
1Q14 2Q14 3Q14 4Q14 1Q15 2Q15 3Q15 4Q15 1Q16
Lending spread
Deposit spread
Combined spread- weighted average
Per cent
2.22 2.18 2.19 2.20 2.18 2.17 2.18 2.19 2.25
(0.16) (0.17) (0.14) (0.11) (0.10) (0.10) (0.06) (0.12) (0.04)
1.17 1.15 1.19 1.21 1.25 1.25 1.25 1.24 1.31
1Q14 2Q14 3Q14 4Q14 1Q15 2Q15 3Q15 4Q15 1Q16
Lending spread
Deposit spread
Combined spread- weighted average
Per cent
- 17 -
FACT BOOK DNB - 1Q16 CHAPTER 1 FINANCIAL RESULTS DNB GROUP
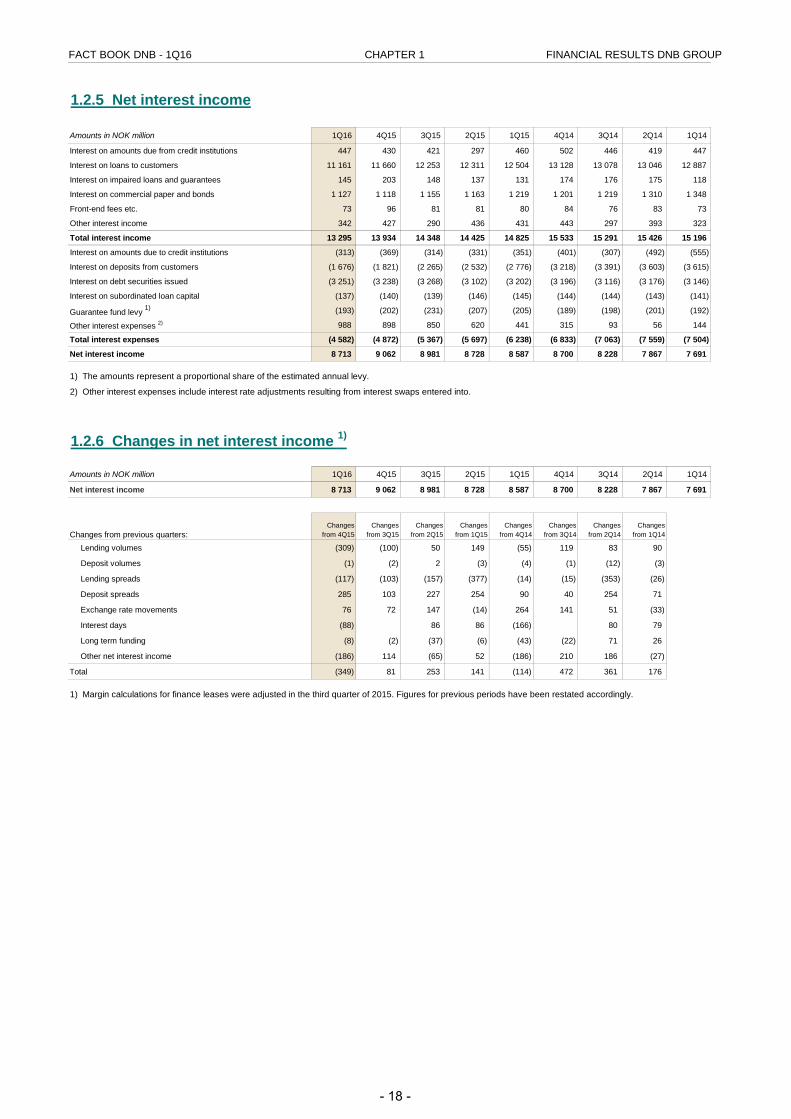
1.2.5 Net interest income
Amounts in NOK million 1Q16 4Q15 3Q15 2Q15 1Q15 4Q14 3Q14 2Q14 1Q14
Interest on amounts due from credit institutions 447 430 421 297 460 502 446 419 447
Interest on loans to customers 11 161 11 660 12 253 12 311 12 504 13 128 13 078 13 046 12 887
Interest on impaired loans and guarantees 145 203 148 137 131 174 176 175 118
Interest on commercial paper and bonds 1 127 1 118 1 155 1 163 1 219 1 201 1 219 1 310 1 348
Front-end fees etc. 73 96 81 81 80 84 76 83 73
Other interest income 342 427 290 436 431 443 297 393 323
Total interest income 13 295 13 934 14 348 14 425 14 825 15 533 15 291 15 426 15 196
Interest on amounts due to credit institutions (313) (369) (314) (331) (351) (401) (307) (492) (555)
Interest on deposits from customers (1 676) (1 821) (2 265) (2 532) (2 776) (3 218) (3 391) (3 603) (3 615)
Interest on debt securities issued (3 251) (3 238) (3 268) (3 102) (3 202) (3 196) (3 116) (3 176) (3 146)
Interest on subordinated loan capital (137) (140) (139) (146) (145) (144) (144) (143) (141)
Guarantee fund levy 1) (193) (202) (231) (207) (205) (189) (198) (201) (192)
Other interest expenses 2) 988 898 850 620 441 315 93 56 144
Total interest expenses (4 582) (4 872) (5 367) (5 697) (6 238) (6 833) (7 063) (7 559) (7 504)
Net interest income 8 713 9 062 8 981 8 728 8 587 8 700 8 228 7 867 7 691 1) The amounts represent a proportional share of the estimated annual levy.
2) Other interest expenses include interest rate adjustments resulting from interest swaps entered into.
1.2.6 Changes in net interest income 1)
Amounts in NOK million 1Q16 4Q15 3Q15 2Q15 1Q15 4Q14 3Q14 2Q14 1Q14
Net interest income 8 713 9 062 8 981 8 728 8 587 8 700 8 228 7 867 7 691
Changes from previous quarters:Changes
from 4Q15Changes
from 3Q15Changes
from 2Q15Changes
from 1Q15Changes
from 4Q14Changes
from 3Q14Changes
from 2Q14Changes
from 1Q14
Lending volumes (309) (100) 50 149 (55) 119 83 90
Deposit volumes (1) (2) 2 (3) (4) (1) (12) (3)
Lending spreads (117) (103) (157) (377) (14) (15) (353) (26)
Deposit spreads 285 103 227 254 90 40 254 71
Exchange rate movements 76 72 147 (14) 264 141 51 (33)
Interest days (88) 86 86 (166) 80 79
Long term funding (8) (2) (37) (6) (43) (22) 71 26
Other net interest income (186) 114 (65) 52 (186) 210 186 (27)
Total (349) 81 253 141 (114) 472 361 176
1) Margin calculations for finance leases were adjusted in the third quarter of 2015. Figures for previous periods have been restated accordingly.
- 18 -
FACT BOOK DNB - 1Q16 CHAPTER 1 FINANCIAL RESULTS DNB GROUP
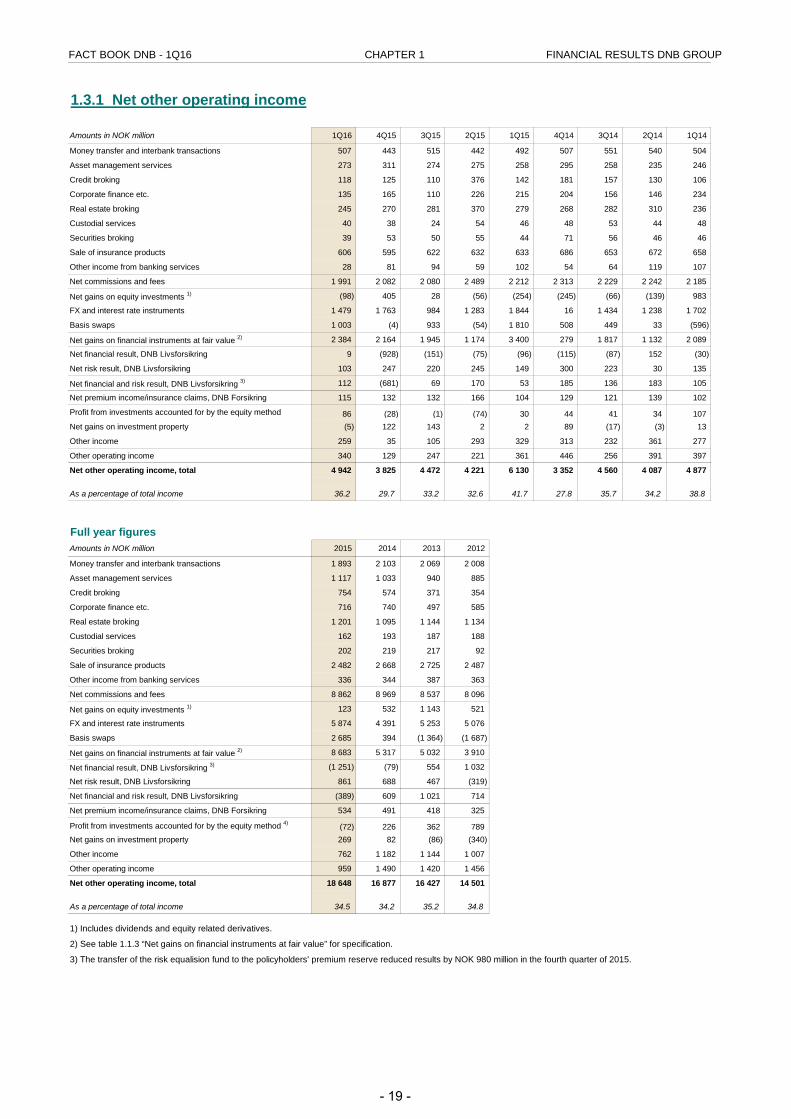
1.3.1 Net other operating income
Amounts in NOK million 1Q16 4Q15 3Q15 2Q15 1Q15 4Q14 3Q14 2Q14 1Q14
Money transfer and interbank transactions 507 443 515 442 492 507 551 540 504
Asset management services 273 311 274 275 258 295 258 235 246
Credit broking 118 125 110 376 142 181 157 130 106
Corporate finance etc. 135 165 110 226 215 204 156 146 234
Real estate broking 245 270 281 370 279 268 282 310 236
Custodial services 40 38 24 54 46 48 53 44 48
Securities broking 39 53 50 55 44 71 56 46 46
Sale of insurance products 606 595 622 632 633 686 653 672 658
Other income from banking services 28 81 94 59 102 54 64 119 107
Net commissions and fees 1 991 2 082 2 080 2 489 2 212 2 313 2 229 2 242 2 185
Net gains on equity investments 1) (98) 405 28 (56) (254) (245) (66) (139) 983
FX and interest rate instruments 1 479 1 763 984 1 283 1 844 16 1 434 1 238 1 702
Basis swaps 1 003 (4) 933 (54) 1 810 508 449 33 (596)
Net gains on financial instruments at fair value 2) 2 384 2 164 1 945 1 174 3 400 279 1 817 1 132 2 089
Net financial result, DNB Livsforsikring 9 (928) (151) (75) (96) (115) (87) 152 (30)
Net risk result, DNB Livsforsikring 103 247 220 245 149 300 223 30 135
Net financial and risk result, DNB Livsforsikring 3) 112 (681) 69 170 53 185 136 183 105
Net premium income/insurance claims, DNB Forsikring 115 132 132 166 104 129 121 139 102
Profit from investments accounted for by the equity method 86 (28) (1) (74) 30 44 41 34 107 Net gains on investment property (5) 122 143 2 2 89 (17) (3) 13
Other income 259 35 105 293 329 313 232 361 277
Other operating income 340 129 247 221 361 446 256 391 397
Net other operating income, total 4 942 3 825 4 472 4 221 6 130 3 352 4 560 4 087 4 877
As a percentage of total income 36.2 29.7 33.2 32.6 41.7 27.8 35.7 34.2 38.8
Full year figuresAmounts in NOK million 2015 2014 2013 2012
Money transfer and interbank transactions 1 893 2 103 2 069 2 008
Asset management services 1 117 1 033 940 885
Credit broking 754 574 371 354
Corporate finance etc. 716 740 497 585
Real estate broking 1 201 1 095 1 144 1 134
Custodial services 162 193 187 188
Securities broking 202 219 217 92
Sale of insurance products 2 482 2 668 2 725 2 487
Other income from banking services 336 344 387 363
Net commissions and fees 8 862 8 969 8 537 8 096
Net gains on equity investments 1) 123 532 1 143 521
FX and interest rate instruments 5 874 4 391 5 253 5 076
Basis swaps 2 685 394 (1 364) (1 687)
Net gains on financial instruments at fair value 2) 8 683 5 317 5 032 3 910
Net financial result, DNB Livsforsikring 3) (1 251) (79) 554 1 032
Net risk result, DNB Livsforsikring 861 688 467 (319)
Net financial and risk result, DNB Livsforsikring (389) 609 1 021 714
Net premium income/insurance claims, DNB Forsikring 534 491 418 325
Profit from investments accounted for by the equity method 4) (72) 226 362 789 Net gains on investment property 269 82 (86) (340)
Other income 762 1 182 1 144 1 007
Other operating income 959 1 490 1 420 1 456
Net other operating income, total 18 648 16 877 16 427 14 501
As a percentage of total income 34.5 34.2 35.2 34.8
1) Includes dividends and equity related derivatives.
2) See table 1.1.3 “Net gains on financial instruments at fair value” for specification.
3) The transfer of the risk equalision fund to the policyholders' premium reserve reduced results by NOK 980 million in the fourth quarter of 2015.
- 19 -
FACT BOOK DNB - 1Q16 CHAPTER 1 FINANCIAL RESULTS DNB GROUP
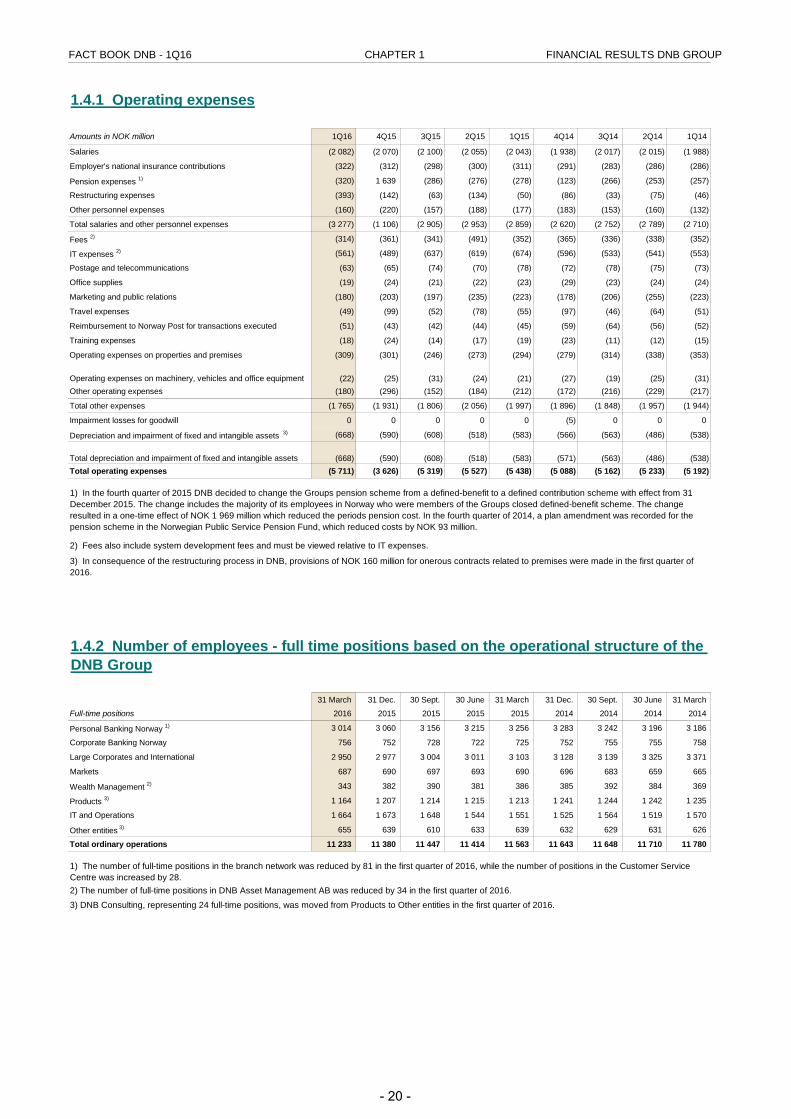
1.4.1 Operating expenses
Amounts in NOK million 1Q16 4Q15 3Q15 2Q15 1Q15 4Q14 3Q14 2Q14 1Q14
Salaries (2 082) (2 070) (2 100) (2 055) (2 043) (1 938) (2 017) (2 015) (1 988)
Employer's national insurance contributions (322) (312) (298) (300) (311) (291) (283) (286) (286)
Pension expenses 1) (320) 1 639 (286) (276) (278) (123) (266) (253) (257)
Restructuring expenses (393) (142) (63) (134) (50) (86) (33) (75) (46)
Other personnel expenses (160) (220) (157) (188) (177) (183) (153) (160) (132)
Total salaries and other personnel expenses (3 277) (1 106) (2 905) (2 953) (2 859) (2 620) (2 752) (2 789) (2 710)
Fees 2) (314) (361) (341) (491) (352) (365) (336) (338) (352)
IT expenses 2) (561) (489) (637) (619) (674) (596) (533) (541) (553)
Postage and telecommunications (63) (65) (74) (70) (78) (72) (78) (75) (73)
Office supplies (19) (24) (21) (22) (23) (29) (23) (24) (24)
Marketing and public relations (180) (203) (197) (235) (223) (178) (206) (255) (223)
Travel expenses (49) (99) (52) (78) (55) (97) (46) (64) (51)
Reimbursement to Norway Post for transactions executed (51) (43) (42) (44) (45) (59) (64) (56) (52)
Training expenses (18) (24) (14) (17) (19) (23) (11) (12) (15)
Operating expenses on properties and premises (309) (301) (246) (273) (294) (279) (314) (338) (353)
Operating expenses on machinery, vehicles and office equipment (22) (25) (31) (24) (21) (27) (19) (25) (31) Other operating expenses (180) (296) (152) (184) (212) (172) (216) (229) (217)
Total other expenses (1 765) (1 931) (1 806) (2 056) (1 997) (1 896) (1 848) (1 957) (1 944)
Impairment losses for goodwill 0 0 0 0 0 (5) 0 0 0
Depreciation and impairment of fixed and intangible assets 3) (668) (590) (608) (518) (583) (566) (563) (486) (538)
Total depreciation and impairment of fixed and intangible assets (668) (590) (608) (518) (583) (571) (563) (486) (538) Total operating expenses (5 711) (3 626) (5 319) (5 527) (5 438) (5 088) (5 162) (5 233) (5 192)
31 March 31 Dec. 30 Sept. 30 June 31 March 31 Dec. 30 Sept. 30 June 31 March
Full-time positions 2016 2015 2015 2015 2015 2014 2014 2014 2014
Personal Banking Norway 1) 3 014 3 060 3 156 3 215 3 256 3 283 3 242 3 196 3 186
Corporate Banking Norway 756 752 728 722 725 752 755 755 758
Large Corporates and International 2 950 2 977 3 004 3 011 3 103 3 128 3 139 3 325 3 371
Markets 687 690 697 693 690 696 683 659 665
Wealth Management 2) 343 382 390 381 386 385 392 384 369
Products 3) 1 164 1 207 1 214 1 215 1 213 1 241 1 244 1 242 1 235
IT and Operations 1 664 1 673 1 648 1 544 1 551 1 525 1 564 1 519 1 570
Other entities 3) 655 639 610 633 639 632 629 631 626
Total ordinary operations 11 233 11 380 11 447 11 414 11 563 11 643 11 648 11 710 11 780
1.4.2 Number of employees - full time positions based on the operational structure of the DNB Group
1) The number of full-time positions in the branch network was reduced by 81 in the first quarter of 2016, while the number of positions in the Customer Service Centre was increased by 28.2) The number of full-time positions in DNB Asset Management AB was reduced by 34 in the first quarter of 2016.3) DNB Consulting, representing 24 full-time positions, was moved from Products to Other entities in the first quarter of 2016.
1) In the fourth quarter of 2015 DNB decided to change the Groups pension scheme from a defined-benefit to a defined contribution scheme with effect from 31 December 2015. The change includes the majority of its employees in Norway who were members of the Groups closed defined-benefit scheme. The change resulted in a one-time effect of NOK 1 969 million which reduced the periods pension cost. In the fourth quarter of 2014, a plan amendment was recorded for the pension scheme in the Norwegian Public Service Pension Fund, which reduced costs by NOK 93 million.
2) Fees also include system development fees and must be viewed relative to IT expenses.
3) In consequence of the restructuring process in DNB, provisions of NOK 160 million for onerous contracts related to premises were made in the first quarter of 2016.
- 20 -
FACT BOOK DNB - 1Q16 CHAPTER 1 FINANCIAL RESULTS DNB GROUP
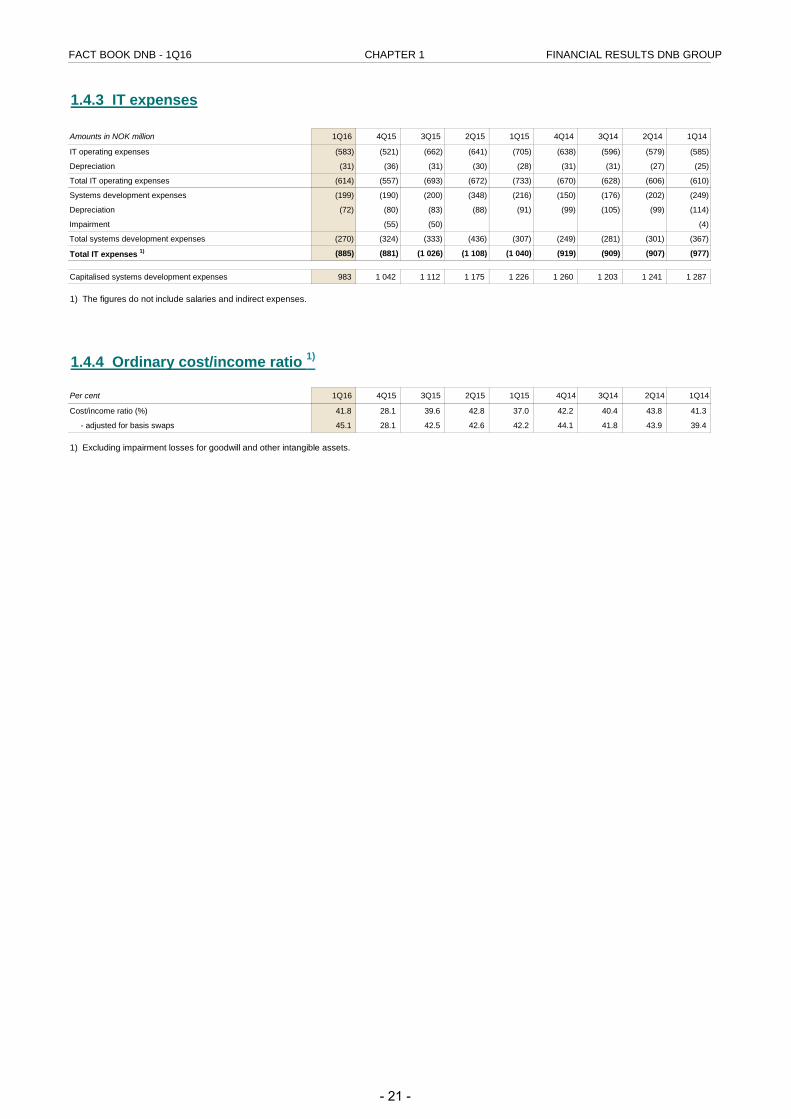
1.4.3 IT expenses
Amounts in NOK million 1Q16 4Q15 3Q15 2Q15 1Q15 4Q14 3Q14 2Q14 1Q14
IT operating expenses (583) (521) (662) (641) (705) (638) (596) (579) (585)
Depreciation (31) (36) (31) (30) (28) (31) (31) (27) (25)
Total IT operating expenses (614) (557) (693) (672) (733) (670) (628) (606) (610)
Systems development expenses (199) (190) (200) (348) (216) (150) (176) (202) (249)
Depreciation (72) (80) (83) (88) (91) (99) (105) (99) (114)
Impairment (55) (50) (4)
Total systems development expenses (270) (324) (333) (436) (307) (249) (281) (301) (367)
Total IT expenses 1) (885) (881) (1 026) (1 108) (1 040) (919) (909) (907) (977)
Capitalised systems development expenses 983 1 042 1 112 1 175 1 226 1 260 1 203 1 241 1 287
1.4.4 Ordinary cost/income ratio 1)
Per cent 1Q16 4Q15 3Q15 2Q15 1Q15 4Q14 3Q14 2Q14 1Q14
Cost/income ratio (%) 41.8 28.1 39.6 42.8 37.0 42.2 40.4 43.8 41.3
- adjusted for basis swaps 45.1 28.1 42.5 42.6 42.2 44.1 41.8 43.9 39.4
1) Excluding impairment losses for goodwill and other intangible assets.
1) The figures do not include salaries and indirect expenses.
- 21 -
FACT BOOK DNB - 1Q16 CHAPTER 1 FINANCIAL RESULTS DNB GROUP
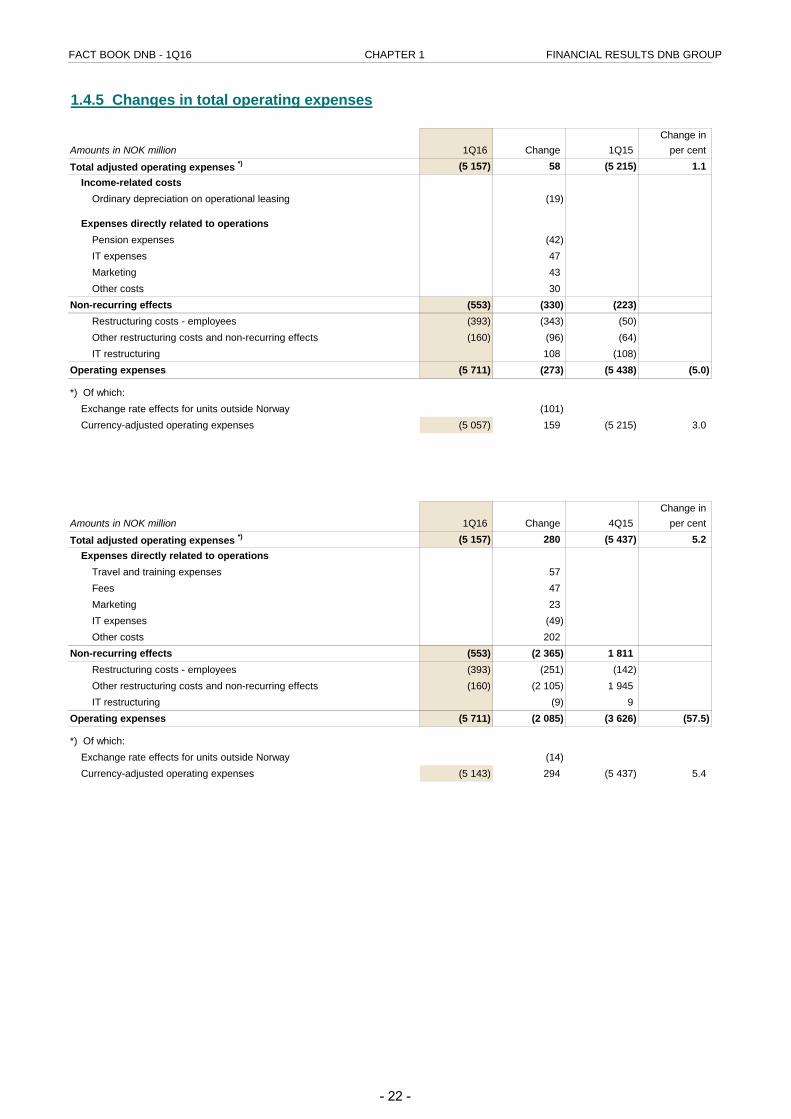
1.4.5 Changes in total operating expenses
Change inAmounts in NOK million 1Q16 Change 1Q15 per cent
Total adjusted operating expenses *) (5 157) 58 (5 215) 1.1Income-related costs
Ordinary depreciation on operational leasing (19)
Expenses directly related to operationsPension expenses (42) IT expenses 47 Marketing 43 Other costs 30
Non-recurring effects (553) (330) (223) Restructuring costs - employees (393) (343) (50) Other restructuring costs and non-recurring effects (160) (96) (64) IT restructuring 108 (108)
Operating expenses (5 711) (273) (5 438) (5.0)
*) Of which: Exchange rate effects for units outside Norway (101) Currency-adjusted operating expenses (5 057) 159 (5 215) 3.0
Change inAmounts in NOK million 1Q16 Change 4Q15 per cent
Total adjusted operating expenses *) (5 157) 280 (5 437) 5.2Expenses directly related to operations
Travel and training expenses 57 Fees 47 Marketing 23 IT expenses (49) Other costs 202
Non-recurring effects (553) (2 365) 1 811 Restructuring costs - employees (393) (251) (142) Other restructuring costs and non-recurring effects (160) (2 105) 1 945 IT restructuring (9) 9
Operating expenses (5 711) (2 085) (3 626) (57.5)
*) Of which: Exchange rate effects for units outside Norway (14) Currency-adjusted operating expenses (5 143) 294 (5 437) 5.4
- 22 -
FACT BOOK DNB - 1Q16 CHAPTER 1 FINANCIAL RESULTS DNB GROUP
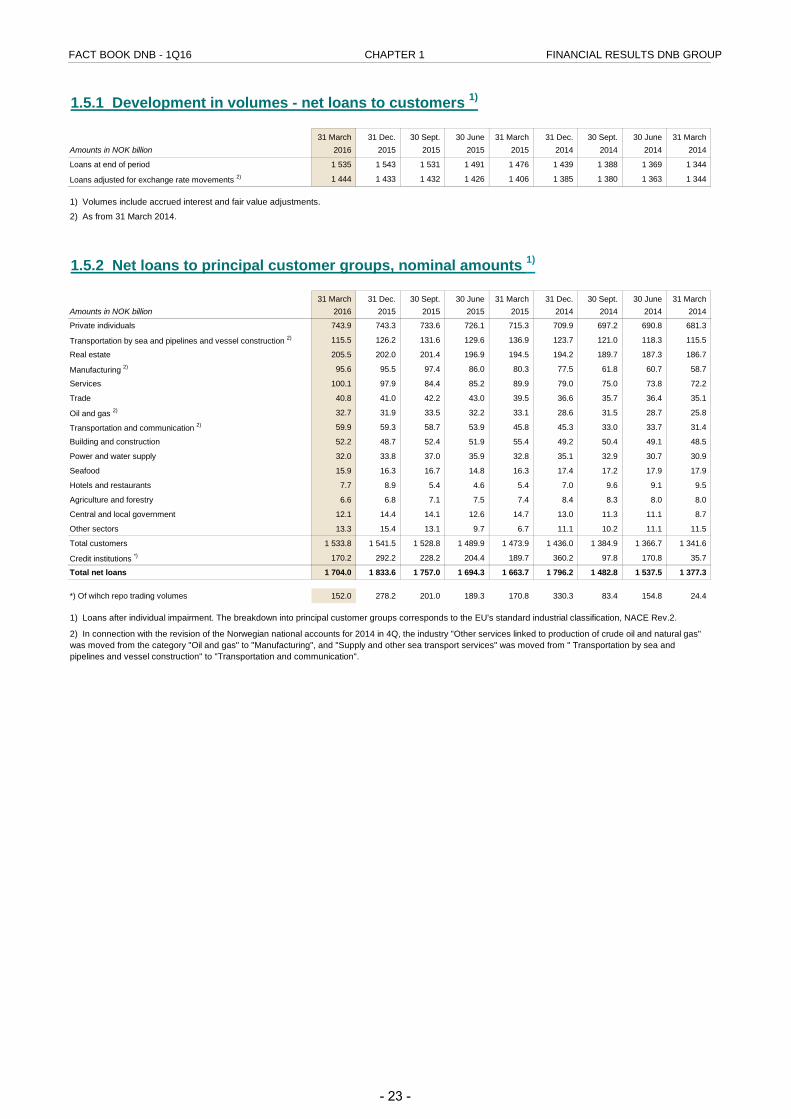
1.5.1 Development in volumes - net loans to customers 1)
31 March 31 Dec. 30 Sept. 30 June 31 March 31 Dec. 30 Sept. 30 June 31 MarchAmounts in NOK billion 2016 2015 2015 2015 2015 2014 2014 2014 2014
Loans at end of period 1 535 1 543 1 531 1 491 1 476 1 439 1 388 1 369 1 344
Loans adjusted for exchange rate movements 2) 1 444 1 433 1 432 1 426 1 406 1 385 1 380 1 363 1 344
1.5.2 Net loans to principal customer groups, nominal amounts 1)
31 March 31 Dec. 30 Sept. 30 June 31 March 31 Dec. 30 Sept. 30 June 31 MarchAmounts in NOK billion 2016 2015 2015 2015 2015 2014 2014 2014 2014
Private individuals 743.9 743.3 733.6 726.1 715.3 709.9 697.2 690.8 681.3
Transportation by sea and pipelines and vessel construction 2) 115.5 126.2 131.6 129.6 136.9 123.7 121.0 118.3 115.5
Real estate 205.5 202.0 201.4 196.9 194.5 194.2 189.7 187.3 186.7
Manufacturing 2) 95.6 95.5 97.4 86.0 80.3 77.5 61.8 60.7 58.7
Services 100.1 97.9 84.4 85.2 89.9 79.0 75.0 73.8 72.2
Trade 40.8 41.0 42.2 43.0 39.5 36.6 35.7 36.4 35.1
Oil and gas 2) 32.7 31.9 33.5 32.2 33.1 28.6 31.5 28.7 25.8
Transportation and communication 2) 59.9 59.3 58.7 53.9 45.8 45.3 33.0 33.7 31.4
Building and construction 52.2 48.7 52.4 51.9 55.4 49.2 50.4 49.1 48.5
Power and water supply 32.0 33.8 37.0 35.9 32.8 35.1 32.9 30.7 30.9
Seafood 15.9 16.3 16.7 14.8 16.3 17.4 17.2 17.9 17.9
Hotels and restaurants 7.7 8.9 5.4 4.6 5.4 7.0 9.6 9.1 9.5
Agriculture and forestry 6.6 6.8 7.1 7.5 7.4 8.4 8.3 8.0 8.0
Central and local government 12.1 14.4 14.1 12.6 14.7 13.0 11.3 11.1 8.7
Other sectors 13.3 15.4 13.1 9.7 6.7 11.1 10.2 11.1 11.5
Total customers 1 533.8 1 541.5 1 528.8 1 489.9 1 473.9 1 436.0 1 384.9 1 366.7 1 341.6
Credit institutions *) 170.2 292.2 228.2 204.4 189.7 360.2 97.8 170.8 35.7
Total net loans 1 704.0 1 833.6 1 757.0 1 694.3 1 663.7 1 796.2 1 482.8 1 537.5 1 377.3
*) Of wihch repo trading volumes 152.0 278.2 201.0 189.3 170.8 330.3 83.4 154.8 24.4
1) Volumes include accrued interest and fair value adjustments.
1) Loans after individual impairment. The breakdown into principal customer groups corresponds to the EU's standard industrial classification, NACE Rev.2.
2) As from 31 March 2014.
2) In connection with the revision of the Norwegian national accounts for 2014 in 4Q, the industry "Other services linked to production of crude oil and natural gas" was moved from the category "Oil and gas" to "Manufacturing", and "Supply and other sea transport services" was moved from " Transportation by sea and pipelines and vessel construction" to "Transportation and communication".
- 23 -
FACT BOOK DNB - 1Q16 CHAPTER 1 FINANCIAL RESULTS DNB GROUP
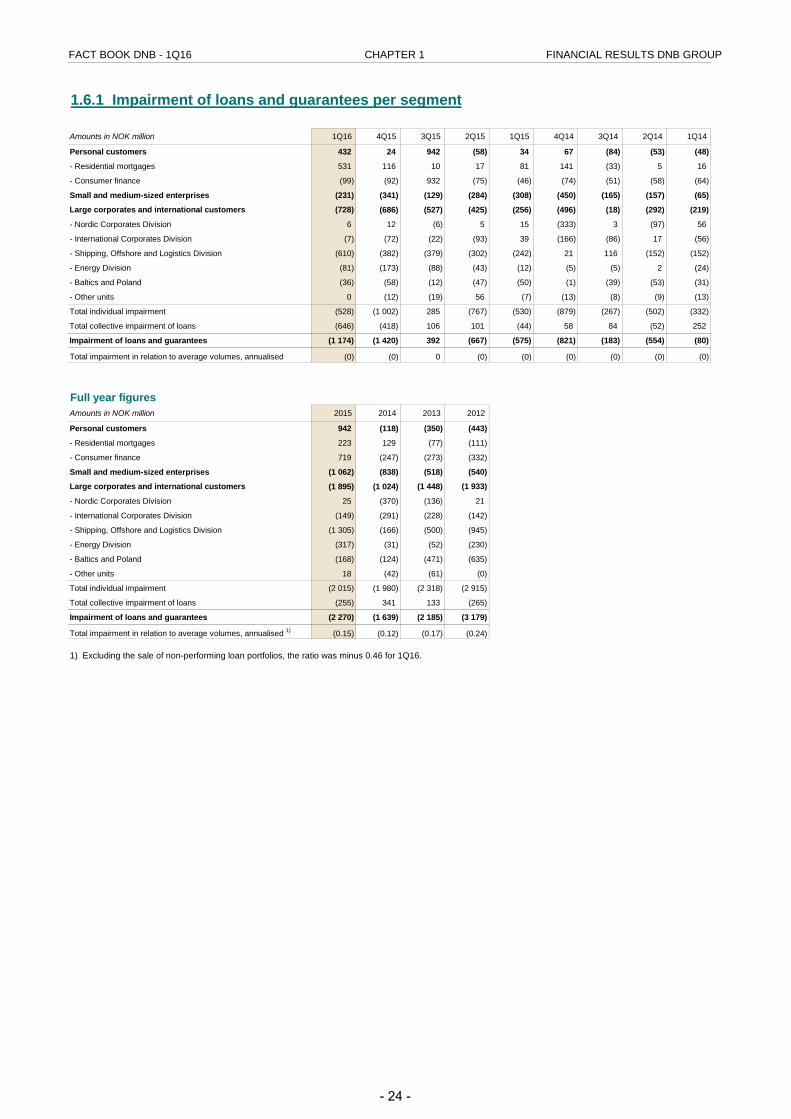
1.6.1 Impairment of loans and guarantees per segment
Amounts in NOK million 1Q16 4Q15 3Q15 2Q15 1Q15 4Q14 3Q14 2Q14 1Q14
Personal customers 432 24 942 (58) 34 67 (84) (53) (48)
- Residential mortgages 531 116 10 17 81 141 (33) 5 16
- Consumer finance (99) (92) 932 (75) (46) (74) (51) (58) (64)
Small and medium-sized enterprises (231) (341) (129) (284) (308) (450) (165) (157) (65)
Large corporates and international customers (728) (686) (527) (425) (256) (496) (18) (292) (219)
- Nordic Corporates Division 6 12 (6) 5 15 (333) 3 (97) 56
- International Corporates Division (7) (72) (22) (93) 39 (166) (86) 17 (56)
- Shipping, Offshore and Logistics Division (610) (382) (379) (302) (242) 21 116 (152) (152)
- Energy Division (81) (173) (88) (43) (12) (5) (5) 2 (24)
- Baltics and Poland (36) (58) (12) (47) (50) (1) (39) (53) (31)
- Other units 0 (12) (19) 56 (7) (13) (8) (9) (13)
Total individual impairment (528) (1 002) 285 (767) (530) (879) (267) (502) (332)
Total collective impairment of loans (646) (418) 106 101 (44) 58 84 (52) 252
Impairment of loans and guarantees (1 174) (1 420) 392 (667) (575) (821) (183) (554) (80)
Total impairment in relation to average volumes, annualised (0) (0) 0 (0) (0) (0) (0) (0) (0)
Full year figuresAmounts in NOK million 2015 2014 2013 2012
Personal customers 942 (118) (350) (443)
- Residential mortgages 223 129 (77) (111)
- Consumer finance 719 (247) (273) (332)
Small and medium-sized enterprises (1 062) (838) (518) (540)
Large corporates and international customers (1 895) (1 024) (1 448) (1 933)
- Nordic Corporates Division 25 (370) (136) 21
- International Corporates Division (149) (291) (228) (142)
- Shipping, Offshore and Logistics Division (1 305) (166) (500) (945)
- Energy Division (317) (31) (52) (230)
- Baltics and Poland (168) (124) (471) (635)
- Other units 18 (42) (61) (0)
Total individual impairment (2 015) (1 980) (2 318) (2 915)
Total collective impairment of loans (255) 341 133 (265)
Impairment of loans and guarantees (2 270) (1 639) (2 185) (3 179)
Total impairment in relation to average volumes, annualised 1) (0.15) (0.12) (0.17) (0.24)
1) Excluding the sale of non-performing loan portfolios, the ratio was minus 0.46 for 1Q16.
- 24 -
FACT BOOK DNB - 1Q16 CHAPTER 1 FINANCIAL RESULTS DNB GROUP
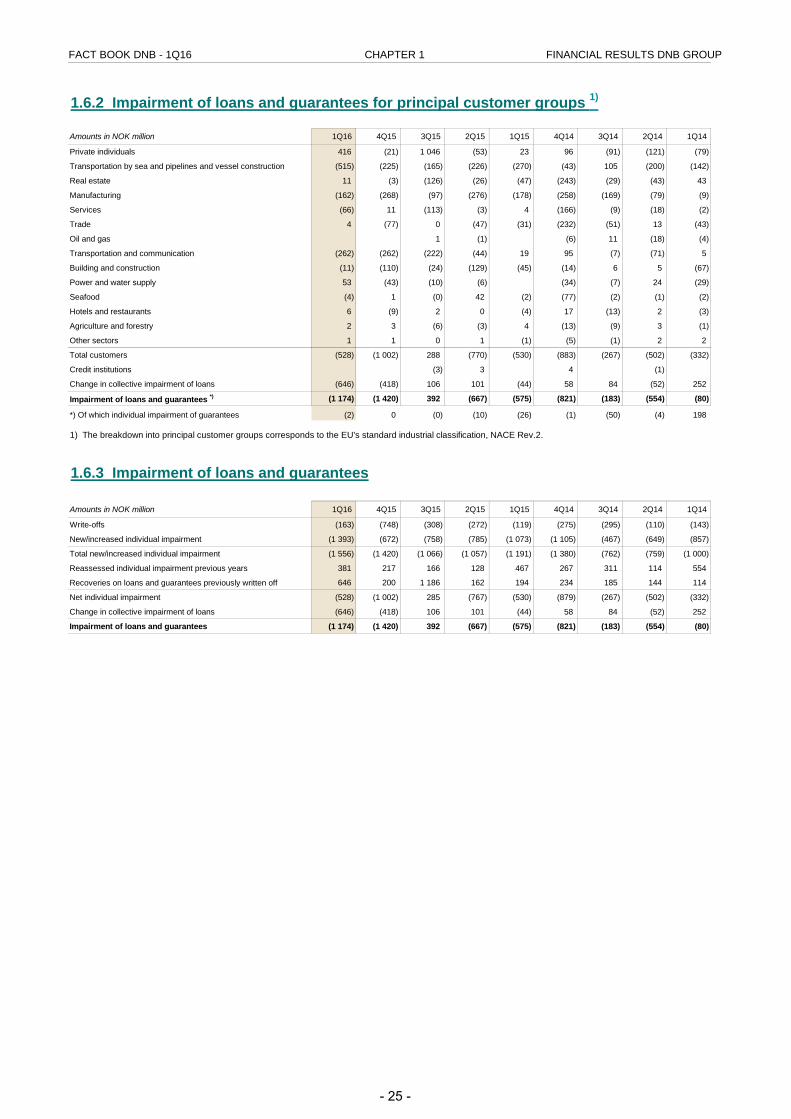
1.6.2 Impairment of loans and guarantees for principal customer groups 1)
Amounts in NOK million 1Q16 4Q15 3Q15 2Q15 1Q15 4Q14 3Q14 2Q14 1Q14
Private individuals 416 (21) 1 046 (53) 23 96 (91) (121) (79)
Transportation by sea and pipelines and vessel construction (515) (225) (165) (226) (270) (43) 105 (200) (142)
Real estate 11 (3) (126) (26) (47) (243) (29) (43) 43
Manufacturing (162) (268) (97) (276) (178) (258) (169) (79) (9)
Services (66) 11 (113) (3) 4 (166) (9) (18) (2)
Trade 4 (77) 0 (47) (31) (232) (51) 13 (43)
Oil and gas 1 (1) (6) 11 (18) (4)
Transportation and communication (262) (262) (222) (44) 19 95 (7) (71) 5
Building and construction (11) (110) (24) (129) (45) (14) 6 5 (67)
Power and water supply 53 (43) (10) (6) (34) (7) 24 (29)
Seafood (4) 1 (0) 42 (2) (77) (2) (1) (2)
Hotels and restaurants 6 (9) 2 0 (4) 17 (13) 2 (3)
Agriculture and forestry 2 3 (6) (3) 4 (13) (9) 3 (1)
Other sectors 1 1 0 1 (1) (5) (1) 2 2
Total customers (528) (1 002) 288 (770) (530) (883) (267) (502) (332)
Credit institutions (3) 3 4 (1)
Change in collective impairment of loans (646) (418) 106 101 (44) 58 84 (52) 252
Impairment of loans and guarantees *) (1 174) (1 420) 392 (667) (575) (821) (183) (554) (80)
*) Of which individual impairment of guarantees (2) 0 (0) (10) (26) (1) (50) (4) 198
1.6.3 Impairment of loans and guarantees
Amounts in NOK million 1Q16 4Q15 3Q15 2Q15 1Q15 4Q14 3Q14 2Q14 1Q14
Write-offs (163) (748) (308) (272) (119) (275) (295) (110) (143)
New/increased individual impairment (1 393) (672) (758) (785) (1 073) (1 105) (467) (649) (857)
Total new/increased individual impairment (1 556) (1 420) (1 066) (1 057) (1 191) (1 380) (762) (759) (1 000)
Reassessed individual impairment previous years 381 217 166 128 467 267 311 114 554
Recoveries on loans and guarantees previously written off 646 200 1 186 162 194 234 185 144 114
Net individual impairment (528) (1 002) 285 (767) (530) (879) (267) (502) (332)
Change in collective impairment of loans (646) (418) 106 101 (44) 58 84 (52) 252
Impairment of loans and guarantees (1 174) (1 420) 392 (667) (575) (821) (183) (554) (80)
1) The breakdown into principal customer groups corresponds to the EU's standard industrial classification, NACE Rev.2.
- 25 -
FACT BOOK DNB - 1Q16 CHAPTER 1 FINANCIAL RESULTS DNB GROUP
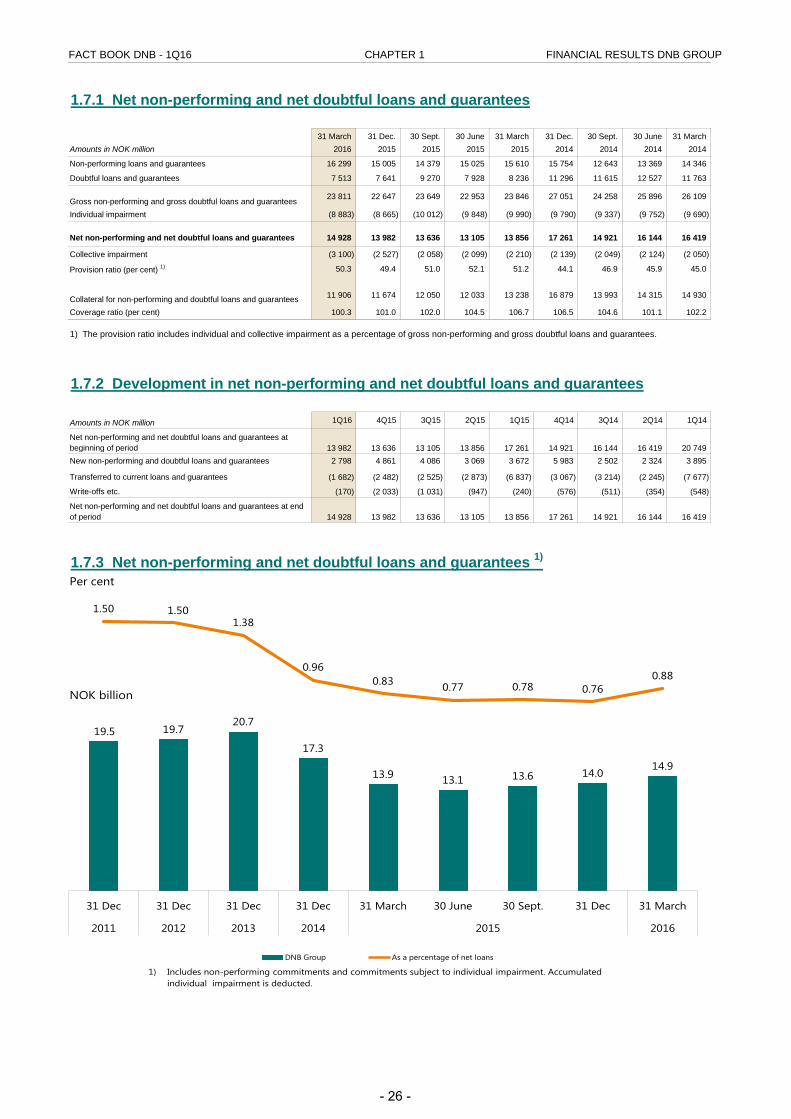
1.7.1 Net non-performing and net doubtful loans and guarantees
31 March 31 Dec. 30 Sept. 30 June 31 March 31 Dec. 30 Sept. 30 June 31 MarchAmounts in NOK million 2016 2015 2015 2015 2015 2014 2014 2014 2014
Non-performing loans and guarantees 16 299 15 005 14 379 15 025 15 610 15 754 12 643 13 369 14 346
Doubtful loans and guarantees 7 513 7 641 9 270 7 928 8 236 11 296 11 615 12 527 11 763
Gross non-performing and gross doubtful loans and guarantees 23 811 22 647 23 649 22 953 23 846 27 051 24 258 25 896 26 109
Individual impairment (8 883) (8 665) (10 012) (9 848) (9 990) (9 790) (9 337) (9 752) (9 690)
Net non-performing and net doubtful loans and guarantees 14 928 13 982 13 636 13 105 13 856 17 261 14 921 16 144 16 419
Collective impairment (3 100) (2 527) (2 058) (2 099) (2 210) (2 139) (2 049) (2 124) (2 050)
Provision ratio (per cent) 1) 50.3 49.4 51.0 52.1 51.2 44.1 46.9 45.9 45.0
Collateral for non-performing and doubtful loans and guarantees 11 906 11 674 12 050 12 033 13 238 16 879 13 993 14 315 14 930
Coverage ratio (per cent) 100.3 101.0 102.0 104.5 106.7 106.5 104.6 101.1 102.2
Amounts in NOK million 1Q16 4Q15 3Q15 2Q15 1Q15 4Q14 3Q14 2Q14 1Q14
Net non-performing and net doubtful loans and guarantees at beginning of period 13 982 13 636 13 105 13 856 17 261 14 921 16 144 16 419 20 749 New non-performing and doubtful loans and guarantees 2 798 4 861 4 086 3 069 3 672 5 983 2 502 2 324 3 895
Transferred to current loans and guarantees (1 682) (2 482) (2 525) (2 873) (6 837) (3 067) (3 214) (2 245) (7 677)
Write-offs etc. (170) (2 033) (1 031) (947) (240) (576) (511) (354) (548)
Net non-performing and net doubtful loans and guarantees at end of period 14 928 13 982 13 636 13 105 13 856 17 261 14 921 16 144 16 419
1) The provision ratio includes individual and collective impairment as a percentage of gross non-performing and gross doubtful loans and guarantees.
1.7.2 Development in net non-performing and net doubtful loans and guarantees
1.7.3 Net non-performing and net doubtful loans and guarantees 1)
19.5 19.720.7
17.3
13.9 13.1 13.6 14.014.9
1.50 1.501.38
0.960.83 0.77 0.78 0.76
0.88
31 Dec 31 Dec 31 Dec 31 Dec 31 March 30 June 30 Sept. 31 Dec 31 March
2011 2012 2013 2014 2015 2016
DNB Group As a percentage of net loans
Per cent
NOK billion
1) Includes non-performing commitments and commitments subject to individual impairment. Accumulated individual impairment is deducted.
- 26 -
FACT BOOK DNB - 1Q16 CHAPTER 1 FINANCIAL RESULTS DNB GROUP
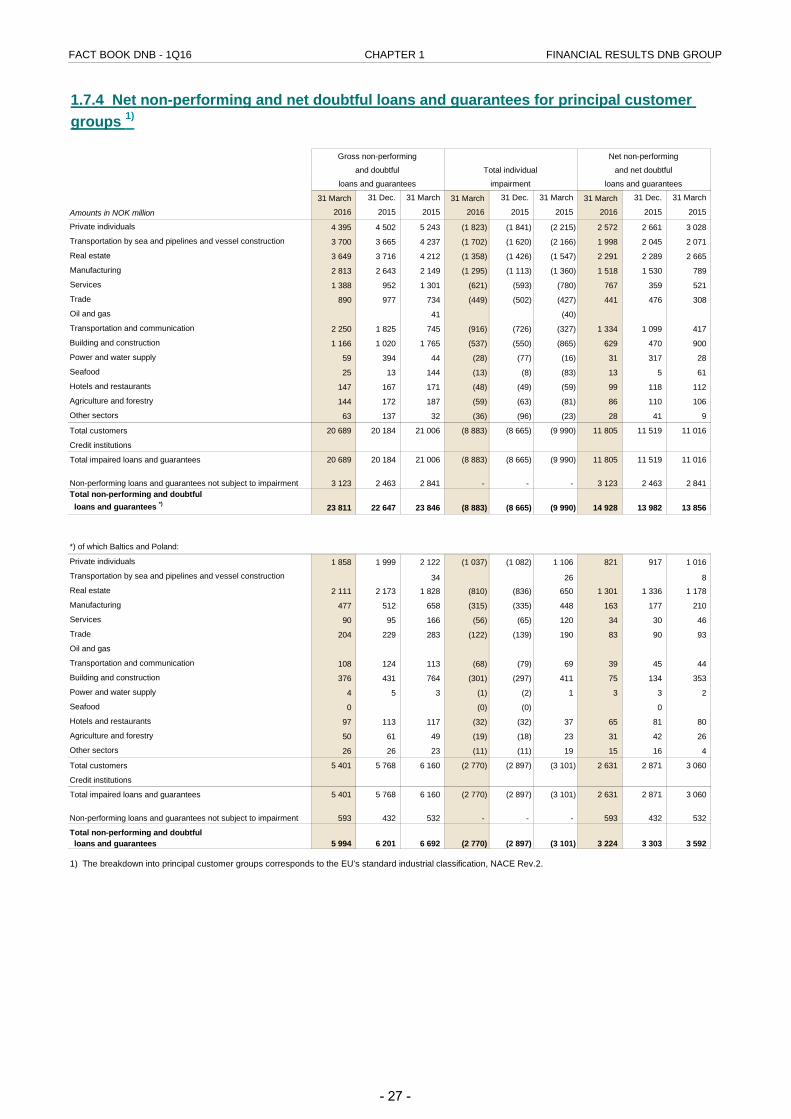
31 March 31 Dec. 31 March 31 March 31 Dec. 31 March 31 March 31 Dec. 31 March
Amounts in NOK million 2016 2015 2015 2016 2015 2015 2016 2015 2015
Private individuals 4 395 4 502 5 243 (1 823) (1 841) (2 215) 2 572 2 661 3 028
Transportation by sea and pipelines and vessel construction 3 700 3 665 4 237 (1 702) (1 620) (2 166) 1 998 2 045 2 071
Real estate 3 649 3 716 4 212 (1 358) (1 426) (1 547) 2 291 2 289 2 665
Manufacturing 2 813 2 643 2 149 (1 295) (1 113) (1 360) 1 518 1 530 789
Services 1 388 952 1 301 (621) (593) (780) 767 359 521
Trade 890 977 734 (449) (502) (427) 441 476 308
Oil and gas 41 (40)
Transportation and communication 2 250 1 825 745 (916) (726) (327) 1 334 1 099 417
Building and construction 1 166 1 020 1 765 (537) (550) (865) 629 470 900
Power and water supply 59 394 44 (28) (77) (16) 31 317 28
Seafood 25 13 144 (13) (8) (83) 13 5 61
Hotels and restaurants 147 167 171 (48) (49) (59) 99 118 112
Agriculture and forestry 144 172 187 (59) (63) (81) 86 110 106
Other sectors 63 137 32 (36) (96) (23) 28 41 9
Total customers 20 689 20 184 21 006 (8 883) (8 665) (9 990) 11 805 11 519 11 016
Credit institutions
Total impaired loans and guarantees 20 689 20 184 21 006 (8 883) (8 665) (9 990) 11 805 11 519 11 016
Non-performing loans and guarantees not subject to impairment 3 123 2 463 2 841 - - - 3 123 2 463 2 841 Total non-performing and doubtful loans and guarantees *) 23 811 22 647 23 846 (8 883) (8 665) (9 990) 14 928 13 982 13 856
*) of which Baltics and Poland:
Private individuals 1 858 1 999 2 122 (1 037) (1 082) 1 106 821 917 1 016
Transportation by sea and pipelines and vessel construction 34 26 8 Real estate 2 111 2 173 1 828 (810) (836) 650 1 301 1 336 1 178
Manufacturing 477 512 658 (315) (335) 448 163 177 210
Services 90 95 166 (56) (65) 120 34 30 46
Trade 204 229 283 (122) (139) 190 83 90 93
Oil and gas
Transportation and communication 108 124 113 (68) (79) 69 39 45 44
Building and construction 376 431 764 (301) (297) 411 75 134 353
Power and water supply 4 5 3 (1) (2) 1 3 3 2
Seafood 0 (0) (0) 0
Hotels and restaurants 97 113 117 (32) (32) 37 65 81 80
Agriculture and forestry 50 61 49 (19) (18) 23 31 42 26
Other sectors 26 26 23 (11) (11) 19 15 16 4
Total customers 5 401 5 768 6 160 (2 770) (2 897) (3 101) 2 631 2 871 3 060
Credit institutions
Total impaired loans and guarantees 5 401 5 768 6 160 (2 770) (2 897) (3 101) 2 631 2 871 3 060
Non-performing loans and guarantees not subject to impairment 593 432 532 - - - 593 432 532
Total non-performing and doubtful loans and guarantees 5 994 6 201 6 692 (2 770) (2 897) (3 101) 3 224 3 303 3 592
1) The breakdown into principal customer groups corresponds to the EU's standard industrial classification, NACE Rev.2.
loans and guarantees impairment loans and guarantees
and doubtful Total individual and net doubtful
1.7.4 Net non-performing and net doubtful loans and guarantees for principal customer groups 1)
Gross non-performing Net non-performing
- 27 -
FACT BOOK DNB - 1Q16 CHAPTER 1 FINANCIAL RESULTS DNB GROUP
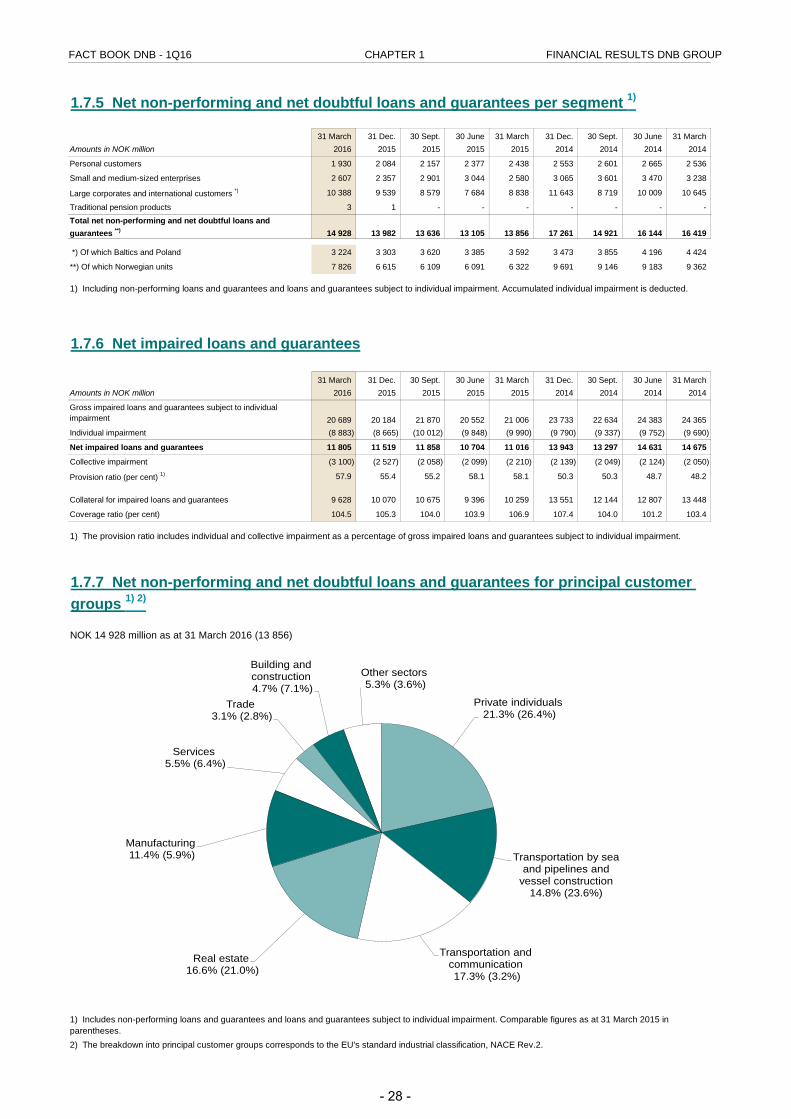
31 March 31 Dec. 30 Sept. 30 June 31 March 31 Dec. 30 Sept. 30 June 31 MarchAmounts in NOK million 2016 2015 2015 2015 2015 2014 2014 2014 2014
Personal customers 1 930 2 084 2 157 2 377 2 438 2 553 2 601 2 665 2 536
Small and medium-sized enterprises 2 607 2 357 2 901 3 044 2 580 3 065 3 601 3 470 3 238
Large corporates and international customers *) 10 388 9 539 8 579 7 684 8 838 11 643 8 719 10 009 10 645
Traditional pension products 3 1 - - - - - - - Total net non-performing and net doubtful loans and guarantees **) 14 928 13 982 13 636 13 105 13 856 17 261 14 921 16 144 16 419
*) Of which Baltics and Poland 3 224 3 303 3 620 3 385 3 592 3 473 3 855 4 196 4 424
**) Of which Norwegian units 7 826 6 615 6 109 6 091 6 322 9 691 9 146 9 183 9 362
1.7.6 Net impaired loans and guarantees
31 March 31 Dec. 30 Sept. 30 June 31 March 31 Dec. 30 Sept. 30 June 31 MarchAmounts in NOK million 2016 2015 2015 2015 2015 2014 2014 2014 2014
Gross impaired loans and guarantees subject to individual impairment 20 689 20 184 21 870 20 552 21 006 23 733 22 634 24 383 24 365 Individual impairment (8 883) (8 665) (10 012) (9 848) (9 990) (9 790) (9 337) (9 752) (9 690)
Net impaired loans and guarantees 11 805 11 519 11 858 10 704 11 016 13 943 13 297 14 631 14 675
Collective impairment (3 100) (2 527) (2 058) (2 099) (2 210) (2 139) (2 049) (2 124) (2 050)
Provision ratio (per cent) 1) 57.9 55.4 55.2 58.1 58.1 50.3 50.3 48.7 48.2
Collateral for impaired loans and guarantees 9 628 10 070 10 675 9 396 10 259 13 551 12 144 12 807 13 448
Coverage ratio (per cent) 104.5 105.3 104.0 103.9 106.9 107.4 104.0 101.2 103.4
NOK 14 928 million as at 31 March 2016 (13 856)
2) The breakdown into principal customer groups corresponds to the EU's standard industrial classification, NACE Rev.2.
1) Includes non-performing loans and guarantees and loans and guarantees subject to individual impairment. Comparable figures as at 31 March 2015 in parentheses.
1.7.7 Net non-performing and net doubtful loans and guarantees for principal customer groups 1) 2)
1.7.5 Net non-performing and net doubtful loans and guarantees per segment 1)
1) Including non-performing loans and guarantees and loans and guarantees subject to individual impairment. Accumulated individual impairment is deducted.
1) The provision ratio includes individual and collective impairment as a percentage of gross impaired loans and guarantees subject to individual impairment.
Private individuals21.3% (26.4%)
Transportation by sea and pipelines and
vessel construction 14.8% (23.6%)
Transportation and communication17.3% (3.2%)
Real estate16.6% (21.0%)
Manufacturing11.4% (5.9%)
Services 5.5% (6.4%)
Trade3.1% (2.8%)
Building and construction4.7% (7.1%)
Other sectors5.3% (3.6%)
- 28 -
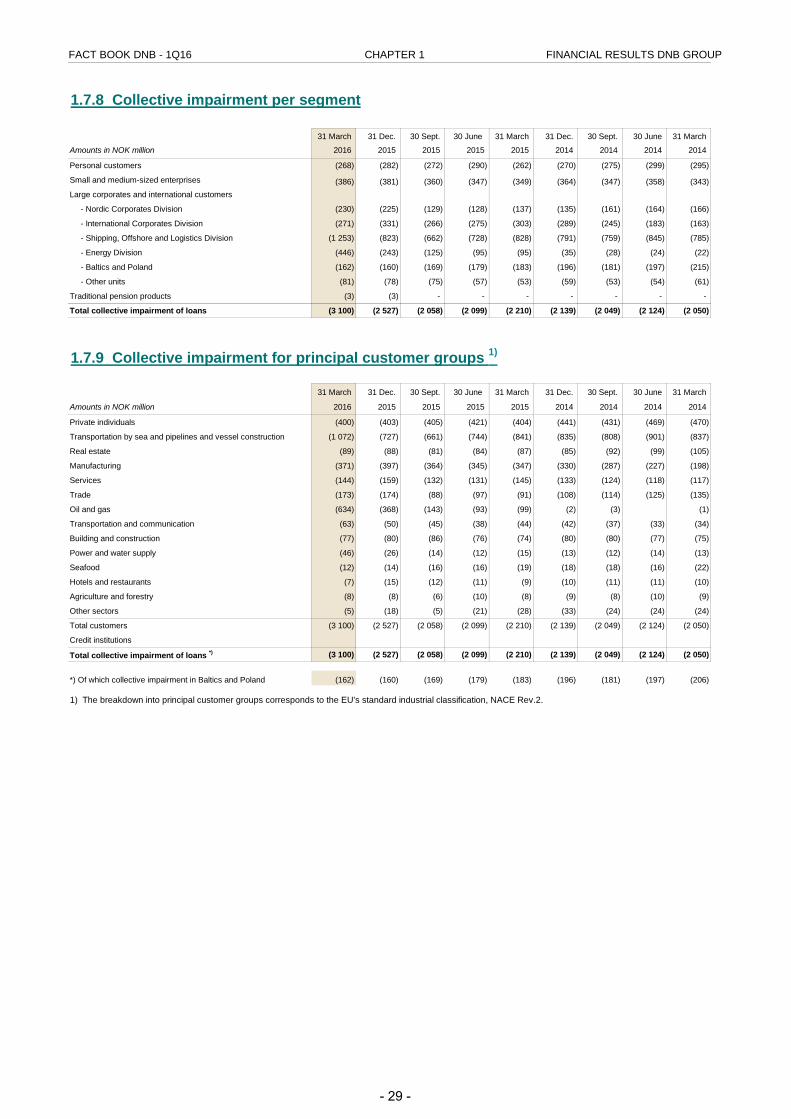
FACT BOOK DNB - 1Q16 CHAPTER 1 FINANCIAL RESULTS DNB GROUP
1.7.8 Collective impairment per segment
31 March 31 Dec. 30 Sept. 30 June 31 March 31 Dec. 30 Sept. 30 June 31 March
Amounts in NOK million 2016 2015 2015 2015 2015 2014 2014 2014 2014
Personal customers (268) (282) (272) (290) (262) (270) (275) (299) (295)
Small and medium-sized enterprises (386) (381) (360) (347) (349) (364) (347) (358) (343) Large corporates and international customers
- Nordic Corporates Division (230) (225) (129) (128) (137) (135) (161) (164) (166)
- International Corporates Division (271) (331) (266) (275) (303) (289) (245) (183) (163)
- Shipping, Offshore and Logistics Division (1 253) (823) (662) (728) (828) (791) (759) (845) (785)
- Energy Division (446) (243) (125) (95) (95) (35) (28) (24) (22)
- Baltics and Poland (162) (160) (169) (179) (183) (196) (181) (197) (215)
- Other units (81) (78) (75) (57) (53) (59) (53) (54) (61)
Traditional pension products (3) (3) - - - - - - -
Total collective impairment of loans (3 100) (2 527) (2 058) (2 099) (2 210) (2 139) (2 049) (2 124) (2 050)
1.7.9 Collective impairment for principal customer groups 1)
31 March 31 Dec. 30 Sept. 30 June 31 March 31 Dec. 30 Sept. 30 June 31 March
Amounts in NOK million 2016 2015 2015 2015 2015 2014 2014 2014 2014
Private individuals (400) (403) (405) (421) (404) (441) (431) (469) (470)
Transportation by sea and pipelines and vessel construction (1 072) (727) (661) (744) (841) (835) (808) (901) (837)
Real estate (89) (88) (81) (84) (87) (85) (92) (99) (105)
Manufacturing (371) (397) (364) (345) (347) (330) (287) (227) (198)
Services (144) (159) (132) (131) (145) (133) (124) (118) (117)
Trade (173) (174) (88) (97) (91) (108) (114) (125) (135)
Oil and gas (634) (368) (143) (93) (99) (2) (3) (1)
Transportation and communication (63) (50) (45) (38) (44) (42) (37) (33) (34)
Building and construction (77) (80) (86) (76) (74) (80) (80) (77) (75)
Power and water supply (46) (26) (14) (12) (15) (13) (12) (14) (13)
Seafood (12) (14) (16) (16) (19) (18) (18) (16) (22)
Hotels and restaurants (7) (15) (12) (11) (9) (10) (11) (11) (10)
Agriculture and forestry (8) (8) (6) (10) (8) (9) (8) (10) (9)
Other sectors (5) (18) (5) (21) (28) (33) (24) (24) (24)
Total customers (3 100) (2 527) (2 058) (2 099) (2 210) (2 139) (2 049) (2 124) (2 050)
Credit institutions
Total collective impairment of loans *) (3 100) (2 527) (2 058) (2 099) (2 210) (2 139) (2 049) (2 124) (2 050)
*) Of which collective impairment in Baltics and Poland (162) (160) (169) (179) (183) (196) (181) (197) (206)
1) The breakdown into principal customer groups corresponds to the EU's standard industrial classification, NACE Rev.2.
- 29 -
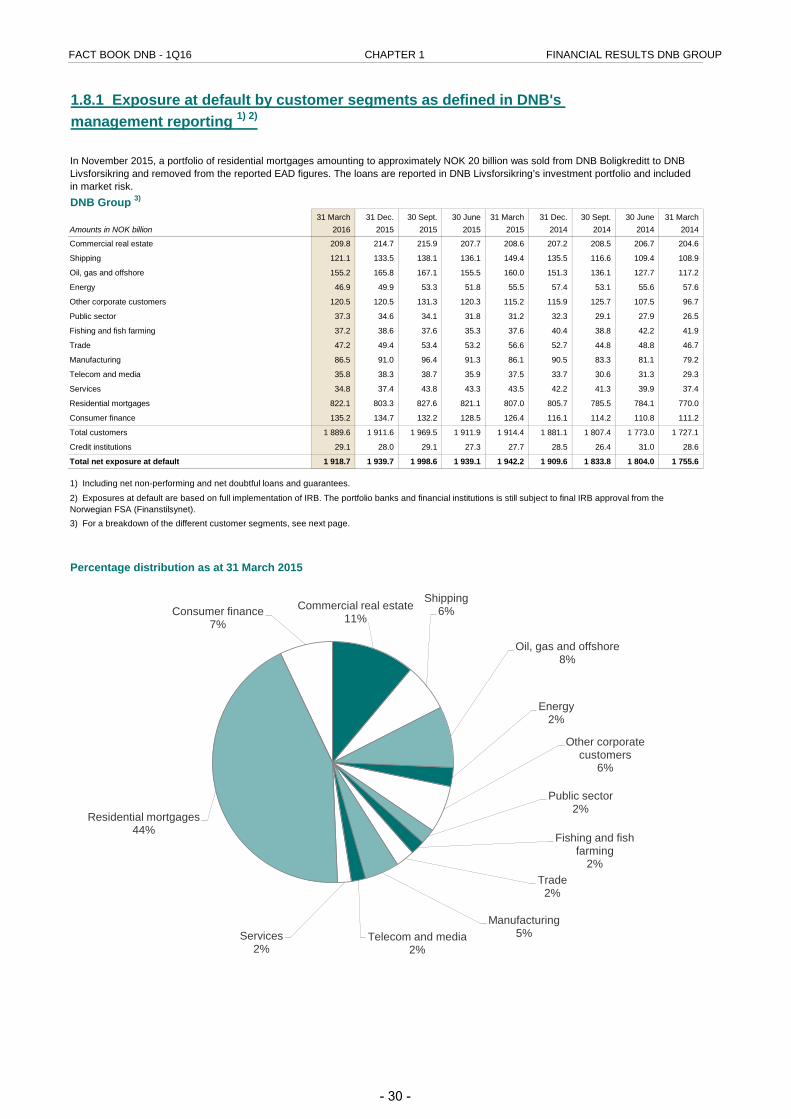
FACT BOOK DNB - 1Q16 CHAPTER 1 FINANCIAL RESULTS DNB GROUP
DNB Group 3)
31 March 31 Dec. 30 Sept. 30 June 31 March 31 Dec. 30 Sept. 30 June 31 MarchAmounts in NOK billion 2016 2015 2015 2015 2015 2014 2014 2014 2014
Commercial real estate 209.8 214.7 215.9 207.7 208.6 207.2 208.5 206.7 204.6
Shipping 121.1 133.5 138.1 136.1 149.4 135.5 116.6 109.4 108.9
Oil, gas and offshore 155.2 165.8 167.1 155.5 160.0 151.3 136.1 127.7 117.2
Energy 46.9 49.9 53.3 51.8 55.5 57.4 53.1 55.6 57.6
Other corporate customers 120.5 120.5 131.3 120.3 115.2 115.9 125.7 107.5 96.7
Public sector 37.3 34.6 34.1 31.8 31.2 32.3 29.1 27.9 26.5
Fishing and fish farming 37.2 38.6 37.6 35.3 37.6 40.4 38.8 42.2 41.9
Trade 47.2 49.4 53.4 53.2 56.6 52.7 44.8 48.8 46.7
Manufacturing 86.5 91.0 96.4 91.3 86.1 90.5 83.3 81.1 79.2
Telecom and media 35.8 38.3 38.7 35.9 37.5 33.7 30.6 31.3 29.3
Services 34.8 37.4 43.8 43.3 43.5 42.2 41.3 39.9 37.4
Residential mortgages 822.1 803.3 827.6 821.1 807.0 805.7 785.5 784.1 770.0
Consumer finance 135.2 134.7 132.2 128.5 126.4 116.1 114.2 110.8 111.2
Total customers 1 889.6 1 911.6 1 969.5 1 911.9 1 914.4 1 881.1 1 807.4 1 773.0 1 727.1
Credit institutions 29.1 28.0 29.1 27.3 27.7 28.5 26.4 31.0 28.6
Total net exposure at default 1 918.7 1 939.7 1 998.6 1 939.1 1 942.2 1 909.6 1 833.8 1 804.0 1 755.6
Percentage distribution as at 31 March 2015
In November 2015, a portfolio of residential mortgages amounting to approximately NOK 20 billion was sold from DNB Boligkreditt to DNB Livsforsikring and removed from the reported EAD figures. The loans are reported in DNB Livsforsikring’s investment portfolio and included in market risk.
1.8.1 Exposure at default by customer segments as defined in DNB's management reporting 1) 2)
1) Including net non-performing and net doubtful loans and guarantees.
3) For a breakdown of the different customer segments, see next page.
2) Exposures at default are based on full implementation of IRB. The portfolio banks and financial institutions is still subject to final IRB approval from the Norwegian FSA (Finanstilsynet).
Commercial real estate 11%
Shipping 6%
Oil, gas and offshore 8%
Energy 2%
Other corporate customers
6%
Public sector 2%
Fishing and fish farming
2% Trade
2%
Manufacturing 5% Telecom and media
2% Services
2%
Residential mortgages 44%
Consumer finance 7%
- 30 -
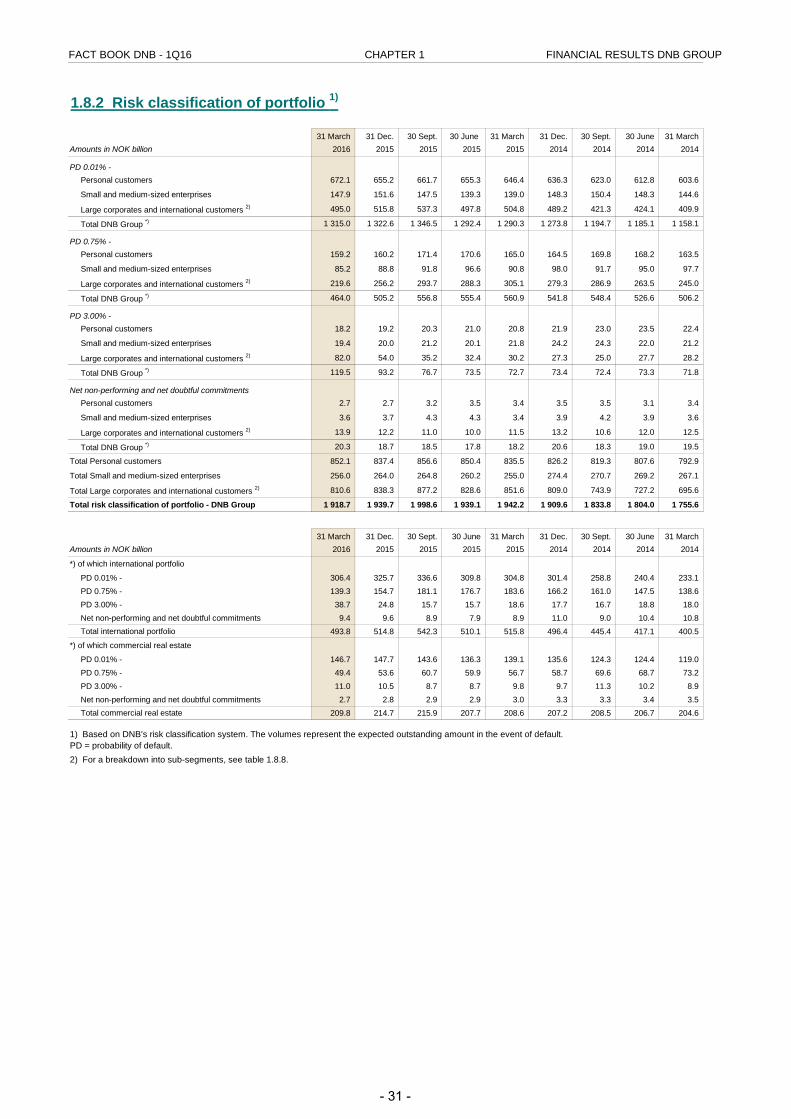
FACT BOOK DNB - 1Q16 CHAPTER 1 FINANCIAL RESULTS DNB GROUP
31 March 31 Dec. 30 Sept. 30 June 31 March 31 Dec. 30 Sept. 30 June 31 MarchAmounts in NOK billion 2016 2015 2015 2015 2015 2014 2014 2014 2014
PD 0.01% -Personal customers 672.1 655.2 661.7 655.3 646.4 636.3 623.0 612.8 603.6
Small and medium-sized enterprises 147.9 151.6 147.5 139.3 139.0 148.3 150.4 148.3 144.6
Large corporates and international customers 2) 495.0 515.8 537.3 497.8 504.8 489.2 421.3 424.1 409.9
Total DNB Group *) 1 315.0 1 322.6 1 346.5 1 292.4 1 290.3 1 273.8 1 194.7 1 185.1 1 158.1
PD 0.75% -Personal customers 159.2 160.2 171.4 170.6 165.0 164.5 169.8 168.2 163.5
Small and medium-sized enterprises 85.2 88.8 91.8 96.6 90.8 98.0 91.7 95.0 97.7
Large corporates and international customers 2) 219.6 256.2 293.7 288.3 305.1 279.3 286.9 263.5 245.0
Total DNB Group *) 464.0 505.2 556.8 555.4 560.9 541.8 548.4 526.6 506.2
PD 3.00% -Personal customers 18.2 19.2 20.3 21.0 20.8 21.9 23.0 23.5 22.4
Small and medium-sized enterprises 19.4 20.0 21.2 20.1 21.8 24.2 24.3 22.0 21.2
Large corporates and international customers 2) 82.0 54.0 35.2 32.4 30.2 27.3 25.0 27.7 28.2
Total DNB Group *) 119.5 93.2 76.7 73.5 72.7 73.4 72.4 73.3 71.8
Net non-performing and net doubtful commitmentsPersonal customers 2.7 2.7 3.2 3.5 3.4 3.5 3.5 3.1 3.4
Small and medium-sized enterprises 3.6 3.7 4.3 4.3 3.4 3.9 4.2 3.9 3.6
Large corporates and international customers 2) 13.9 12.2 11.0 10.0 11.5 13.2 10.6 12.0 12.5
Total DNB Group *) 20.3 18.7 18.5 17.8 18.2 20.6 18.3 19.0 19.5
Total Personal customers 852.1 837.4 856.6 850.4 835.5 826.2 819.3 807.6 792.9
Total Small and medium-sized enterprises 256.0 264.0 264.8 260.2 255.0 274.4 270.7 269.2 267.1
Total Large corporates and international customers 2) 810.6 838.3 877.2 828.6 851.6 809.0 743.9 727.2 695.6
Total risk classification of portfolio - DNB Group 1 918.7 1 939.7 1 998.6 1 939.1 1 942.2 1 909.6 1 833.8 1 804.0 1 755.6
31 March 31 Dec. 30 Sept. 30 June 31 March 31 Dec. 30 Sept. 30 June 31 MarchAmounts in NOK billion 2016 2015 2015 2015 2015 2014 2014 2014 2014
*) of which international portfolio
PD 0.01% - 306.4 325.7 336.6 309.8 304.8 301.4 258.8 240.4 233.1 PD 0.75% - 139.3 154.7 181.1 176.7 183.6 166.2 161.0 147.5 138.6 PD 3.00% - 38.7 24.8 15.7 15.7 18.6 17.7 16.7 18.8 18.0 Net non-performing and net doubtful commitments 9.4 9.6 8.9 7.9 8.9 11.0 9.0 10.4 10.8 Total international portfolio 493.8 514.8 542.3 510.1 515.8 496.4 445.4 417.1 400.5
*) of which commercial real estate
PD 0.01% - 146.7 147.7 143.6 136.3 139.1 135.6 124.3 124.4 119.0 PD 0.75% - 49.4 53.6 60.7 59.9 56.7 58.7 69.6 68.7 73.2 PD 3.00% - 11.0 10.5 8.7 8.7 9.8 9.7 11.3 10.2 8.9 Net non-performing and net doubtful commitments 2.7 2.8 2.9 2.9 3.0 3.3 3.3 3.4 3.5 Total commercial real estate 209.8 214.7 215.9 207.7 208.6 207.2 208.5 206.7 204.6
1.8.2 Risk classification of portfolio 1)
1) Based on DNB's risk classification system. The volumes represent the expected outstanding amount in the event of default. PD = probability of default.2) For a breakdown into sub-segments, see table 1.8.8.
- 31 -
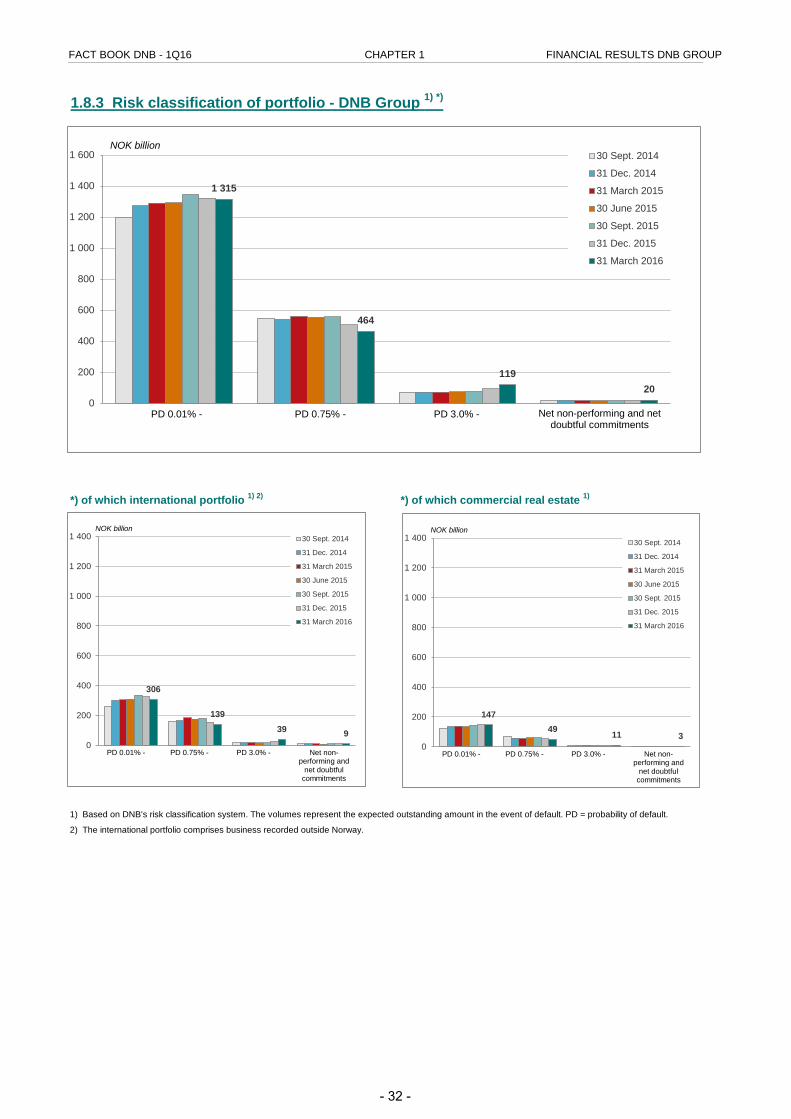
FACT BOOK DNB - 1Q16 CHAPTER 1 FINANCIAL RESULTS DNB GROUP
*) of which international portfolio 1) 2) *) of which commercial real estate 1)
1.8.3 Risk classification of portfolio - DNB Group 1) *)
1) Based on DNB's risk classification system. The volumes represent the expected outstanding amount in the event of default. PD = probability of default.
2) The international portfolio comprises business recorded outside Norway.
1 315
464
119 20
0
200
400
600
800
1 000
1 200
1 400
1 600 30 Sept. 2014
31 Dec. 2014
31 March 2015
30 June 2015
30 Sept. 2015
31 Dec. 2015
31 March 2016
Net non-performing and net doubtful commitments
NOK billion
PD 0.01% - PD 0.75% - PD 3.0% -
306
139 39 9
0
200
400
600
800
1 000
1 200
1 400 30 Sept. 2014
31 Dec. 2014
31 March 2015
30 June 2015
30 Sept. 2015
31 Dec. 2015
31 March 2016
Net non-performing and
net doubtful commitments
NOK billion
PD 0.01% - PD 0.75% - PD 3.0% -
147 49 11 3
0
200
400
600
800
1 000
1 200
1 400 30 Sept. 2014
31 Dec. 2014
31 March 2015
30 June 2015
30 Sept. 2015
31 Dec. 2015
31 March 2016
Net non-performing and
net doubtful commitments
NOK billion
PD 0.01% - PD 0.75% - PD 3.0% -
- 32 -
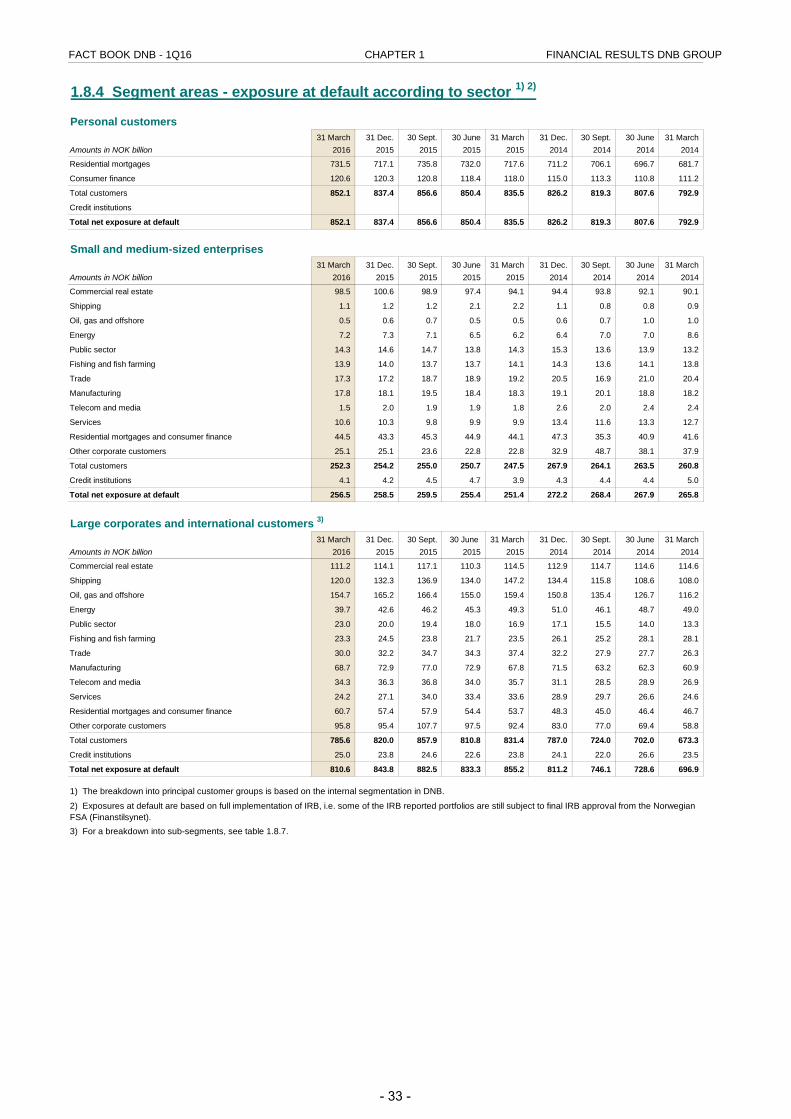
FACT BOOK DNB - 1Q16 CHAPTER 1 FINANCIAL RESULTS DNB GROUP
Personal customers31 March 31 Dec. 30 Sept. 30 June 31 March 31 Dec. 30 Sept. 30 June 31 March
Amounts in NOK billion 2016 2015 2015 2015 2015 2014 2014 2014 2014
Residential mortgages 731.5 717.1 735.8 732.0 717.6 711.2 706.1 696.7 681.7
Consumer finance 120.6 120.3 120.8 118.4 118.0 115.0 113.3 110.8 111.2
Total customers 852.1 837.4 856.6 850.4 835.5 826.2 819.3 807.6 792.9
Credit institutions
Total net exposure at default 852.1 837.4 856.6 850.4 835.5 826.2 819.3 807.6 792.9
Small and medium-sized enterprises31 March 31 Dec. 30 Sept. 30 June 31 March 31 Dec. 30 Sept. 30 June 31 March
Amounts in NOK billion 2016 2015 2015 2015 2015 2014 2014 2014 2014
Commercial real estate 98.5 100.6 98.9 97.4 94.1 94.4 93.8 92.1 90.1
Shipping 1.1 1.2 1.2 2.1 2.2 1.1 0.8 0.8 0.9
Oil, gas and offshore 0.5 0.6 0.7 0.5 0.5 0.6 0.7 1.0 1.0
Energy 7.2 7.3 7.1 6.5 6.2 6.4 7.0 7.0 8.6
Public sector 14.3 14.6 14.7 13.8 14.3 15.3 13.6 13.9 13.2
Fishing and fish farming 13.9 14.0 13.7 13.7 14.1 14.3 13.6 14.1 13.8
Trade 17.3 17.2 18.7 18.9 19.2 20.5 16.9 21.0 20.4
Manufacturing 17.8 18.1 19.5 18.4 18.3 19.1 20.1 18.8 18.2
Telecom and media 1.5 2.0 1.9 1.9 1.8 2.6 2.0 2.4 2.4
Services 10.6 10.3 9.8 9.9 9.9 13.4 11.6 13.3 12.7
Residential mortgages and consumer finance 44.5 43.3 45.3 44.9 44.1 47.3 35.3 40.9 41.6
Other corporate customers 25.1 25.1 23.6 22.8 22.8 32.9 48.7 38.1 37.9
Total customers 252.3 254.2 255.0 250.7 247.5 267.9 264.1 263.5 260.8
Credit institutions 4.1 4.2 4.5 4.7 3.9 4.3 4.4 4.4 5.0
Total net exposure at default 256.5 258.5 259.5 255.4 251.4 272.2 268.4 267.9 265.8
Large corporates and international customers 3)
31 March 31 Dec. 30 Sept. 30 June 31 March 31 Dec. 30 Sept. 30 June 31 MarchAmounts in NOK billion 2016 2015 2015 2015 2015 2014 2014 2014 2014
Commercial real estate 111.2 114.1 117.1 110.3 114.5 112.9 114.7 114.6 114.6
Shipping 120.0 132.3 136.9 134.0 147.2 134.4 115.8 108.6 108.0
Oil, gas and offshore 154.7 165.2 166.4 155.0 159.4 150.8 135.4 126.7 116.2
Energy 39.7 42.6 46.2 45.3 49.3 51.0 46.1 48.7 49.0
Public sector 23.0 20.0 19.4 18.0 16.9 17.1 15.5 14.0 13.3
Fishing and fish farming 23.3 24.5 23.8 21.7 23.5 26.1 25.2 28.1 28.1
Trade 30.0 32.2 34.7 34.3 37.4 32.2 27.9 27.7 26.3
Manufacturing 68.7 72.9 77.0 72.9 67.8 71.5 63.2 62.3 60.9
Telecom and media 34.3 36.3 36.8 34.0 35.7 31.1 28.5 28.9 26.9
Services 24.2 27.1 34.0 33.4 33.6 28.9 29.7 26.6 24.6
Residential mortgages and consumer finance 60.7 57.4 57.9 54.4 53.7 48.3 45.0 46.4 46.7
Other corporate customers 95.8 95.4 107.7 97.5 92.4 83.0 77.0 69.4 58.8
Total customers 785.6 820.0 857.9 810.8 831.4 787.0 724.0 702.0 673.3
Credit institutions 25.0 23.8 24.6 22.6 23.8 24.1 22.0 26.6 23.5
Total net exposure at default 810.6 843.8 882.5 833.3 855.2 811.2 746.1 728.6 696.9
1) The breakdown into principal customer groups is based on the internal segmentation in DNB.
3) For a breakdown into sub-segments, see table 1.8.7.
1.8.4 Segment areas - exposure at default according to sector 1) 2)
2) Exposures at default are based on full implementation of IRB, i.e. some of the IRB reported portfolios are still subject to final IRB approval from the Norwegian FSA (Finanstilsynet).
- 33 -
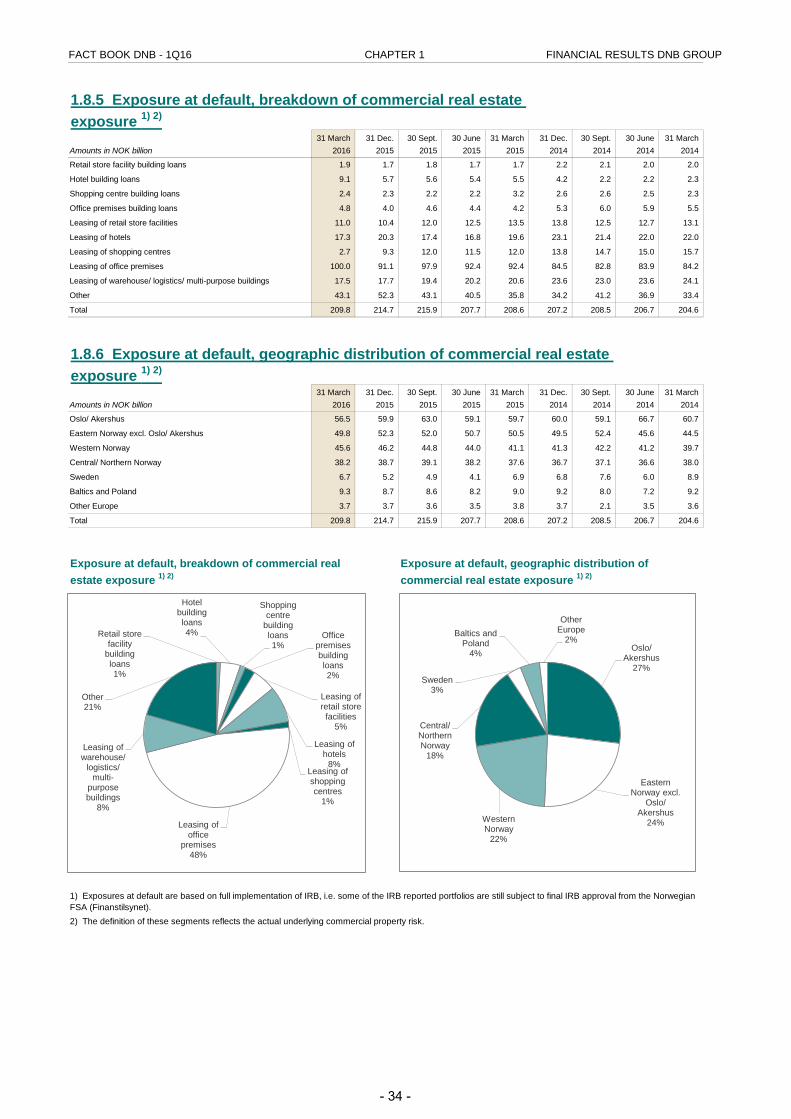
FACT BOOK DNB - 1Q16 CHAPTER 1 FINANCIAL RESULTS DNB GROUP
31 March 31 Dec. 30 Sept. 30 June 31 March 31 Dec. 30 Sept. 30 June 31 MarchAmounts in NOK billion 2016 2015 2015 2015 2015 2014 2014 2014 2014
Retail store facility building loans 1.9 1.7 1.8 1.7 1.7 2.2 2.1 2.0 2.0
Hotel building loans 9.1 5.7 5.6 5.4 5.5 4.2 2.2 2.2 2.3
Shopping centre building loans 2.4 2.3 2.2 2.2 3.2 2.6 2.6 2.5 2.3
Office premises building loans 4.8 4.0 4.6 4.4 4.2 5.3 6.0 5.9 5.5
Leasing of retail store facilities 11.0 10.4 12.0 12.5 13.5 13.8 12.5 12.7 13.1
Leasing of hotels 17.3 20.3 17.4 16.8 19.6 23.1 21.4 22.0 22.0
Leasing of shopping centres 2.7 9.3 12.0 11.5 12.0 13.8 14.7 15.0 15.7
Leasing of office premises 100.0 91.1 97.9 92.4 92.4 84.5 82.8 83.9 84.2
Leasing of warehouse/ logistics/ multi-purpose buildings 17.5 17.7 19.4 20.2 20.6 23.6 23.0 23.6 24.1
Other 43.1 52.3 43.1 40.5 35.8 34.2 41.2 36.9 33.4
Total 209.8 214.7 215.9 207.7 208.6 207.2 208.5 206.7 204.6
31 March 31 Dec. 30 Sept. 30 June 31 March 31 Dec. 30 Sept. 30 June 31 MarchAmounts in NOK billion 2016 2015 2015 2015 2015 2014 2014 2014 2014
Oslo/ Akershus 56.5 59.9 63.0 59.1 59.7 60.0 59.1 66.7 60.7
Eastern Norway excl. Oslo/ Akershus 49.8 52.3 52.0 50.7 50.5 49.5 52.4 45.6 44.5
Western Norway 45.6 46.2 44.8 44.0 41.1 41.3 42.2 41.2 39.7
Central/ Northern Norway 38.2 38.7 39.1 38.2 37.6 36.7 37.1 36.6 38.0
Sweden 6.7 5.2 4.9 4.1 6.9 6.8 7.6 6.0 8.9
Baltics and Poland 9.3 8.7 8.6 8.2 9.0 9.2 8.0 7.2 9.2
Other Europe 3.7 3.7 3.6 3.5 3.8 3.7 2.1 3.5 3.6
Total 209.8 214.7 215.9 207.7 208.6 207.2 208.5 206.7 204.6
2) The definition of these segments reflects the actual underlying commercial property risk.
1.8.5 Exposure at default, breakdown of commercial real estate exposure 1) 2)
1) Exposures at default are based on full implementation of IRB, i.e. some of the IRB reported portfolios are still subject to final IRB approval from the Norwegian FSA (Finanstilsynet).
1.8.6 Exposure at default, geographic distribution of commercial real estate exposure 1) 2)
Exposure at default, breakdown of commercial real estate exposure 1) 2)
Exposure at default, geographic distribution of commercial real estate exposure 1) 2)
Retail store facility
building loans 1%
Hotel building loans 4%
Shopping centre
building loans 1%
Office premises building loans 2%
Leasing of retail store facilities
5%
Leasing of hotels
8% Leasing of shopping centres
1%
Leasing of office
premises 48%
Leasing of warehouse/
logistics/ multi-
purpose buildings
8%
Other 21%
Oslo/ Akershus
27%
Eastern Norway excl.
Oslo/ Akershus
24% Western Norway
22%
Central/ Northern Norway
18%
Sweden 3%
Baltics and Poland
4%
Other Europe
2%
- 34 -
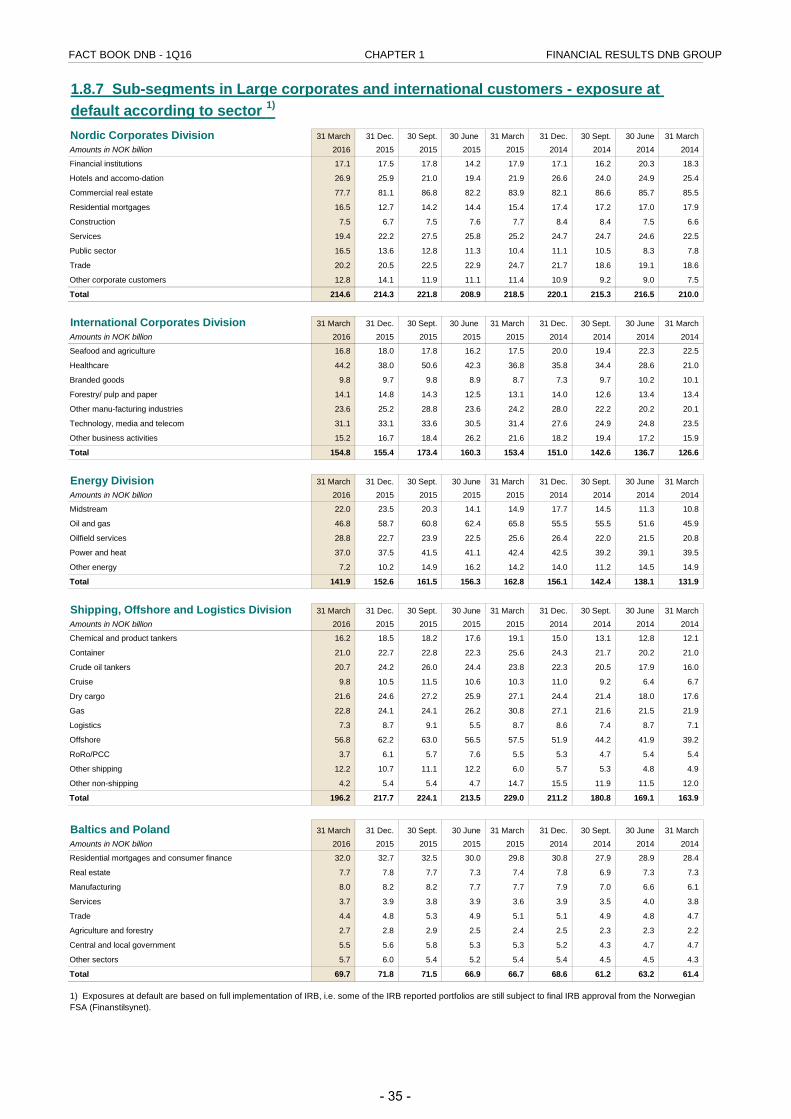
FACT BOOK DNB - 1Q16 CHAPTER 1 FINANCIAL RESULTS DNB GROUP
Nordic Corporates Division 31 March 31 Dec. 30 Sept. 30 June 31 March 31 Dec. 30 Sept. 30 June 31 MarchAmounts in NOK billion 2016 2015 2015 2015 2015 2014 2014 2014 2014
Financial institutions 17.1 17.5 17.8 14.2 17.9 17.1 16.2 20.3 18.3
Hotels and accomo-dation 26.9 25.9 21.0 19.4 21.9 26.6 24.0 24.9 25.4
Commercial real estate 77.7 81.1 86.8 82.2 83.9 82.1 86.6 85.7 85.5
Residential mortgages 16.5 12.7 14.2 14.4 15.4 17.4 17.2 17.0 17.9
Construction 7.5 6.7 7.5 7.6 7.7 8.4 8.4 7.5 6.6
Services 19.4 22.2 27.5 25.8 25.2 24.7 24.7 24.6 22.5
Public sector 16.5 13.6 12.8 11.3 10.4 11.1 10.5 8.3 7.8
Trade 20.2 20.5 22.5 22.9 24.7 21.7 18.6 19.1 18.6
Other corporate customers 12.8 14.1 11.9 11.1 11.4 10.9 9.2 9.0 7.5
Total 214.6 214.3 221.8 208.9 218.5 220.1 215.3 216.5 210.0
International Corporates Division 31 March 31 Dec. 30 Sept. 30 June 31 March 31 Dec. 30 Sept. 30 June 31 MarchAmounts in NOK billion 2016 2015 2015 2015 2015 2014 2014 2014 2014
Seafood and agriculture 16.8 18.0 17.8 16.2 17.5 20.0 19.4 22.3 22.5
Healthcare 44.2 38.0 50.6 42.3 36.8 35.8 34.4 28.6 21.0
Branded goods 9.8 9.7 9.8 8.9 8.7 7.3 9.7 10.2 10.1
Forestry/ pulp and paper 14.1 14.8 14.3 12.5 13.1 14.0 12.6 13.4 13.4
Other manu-facturing industries 23.6 25.2 28.8 23.6 24.2 28.0 22.2 20.2 20.1
Technology, media and telecom 31.1 33.1 33.6 30.5 31.4 27.6 24.9 24.8 23.5
Other business activities 15.2 16.7 18.4 26.2 21.6 18.2 19.4 17.2 15.9
Total 154.8 155.4 173.4 160.3 153.4 151.0 142.6 136.7 126.6
Energy Division 31 March 31 Dec. 30 Sept. 30 June 31 March 31 Dec. 30 Sept. 30 June 31 MarchAmounts in NOK billion 2016 2015 2015 2015 2015 2014 2014 2014 2014
Midstream 22.0 23.5 20.3 14.1 14.9 17.7 14.5 11.3 10.8
Oil and gas 46.8 58.7 60.8 62.4 65.8 55.5 55.5 51.6 45.9
Oilfield services 28.8 22.7 23.9 22.5 25.6 26.4 22.0 21.5 20.8
Power and heat 37.0 37.5 41.5 41.1 42.4 42.5 39.2 39.1 39.5
Other energy 7.2 10.2 14.9 16.2 14.2 14.0 11.2 14.5 14.9
Total 141.9 152.6 161.5 156.3 162.8 156.1 142.4 138.1 131.9
Shipping, Offshore and Logistics Division 31 March 31 Dec. 30 Sept. 30 June 31 March 31 Dec. 30 Sept. 30 June 31 MarchAmounts in NOK billion 2016 2015 2015 2015 2015 2014 2014 2014 2014
Chemical and product tankers 16.2 18.5 18.2 17.6 19.1 15.0 13.1 12.8 12.1
Container 21.0 22.7 22.8 22.3 25.6 24.3 21.7 20.2 21.0
Crude oil tankers 20.7 24.2 26.0 24.4 23.8 22.3 20.5 17.9 16.0
Cruise 9.8 10.5 11.5 10.6 10.3 11.0 9.2 6.4 6.7
Dry cargo 21.6 24.6 27.2 25.9 27.1 24.4 21.4 18.0 17.6
Gas 22.8 24.1 24.1 26.2 30.8 27.1 21.6 21.5 21.9
Logistics 7.3 8.7 9.1 5.5 8.7 8.6 7.4 8.7 7.1
Offshore 56.8 62.2 63.0 56.5 57.5 51.9 44.2 41.9 39.2
RoRo/PCC 3.7 6.1 5.7 7.6 5.5 5.3 4.7 5.4 5.4
Other shipping 12.2 10.7 11.1 12.2 6.0 5.7 5.3 4.8 4.9
Other non-shipping 4.2 5.4 5.4 4.7 14.7 15.5 11.9 11.5 12.0
Total 196.2 217.7 224.1 213.5 229.0 211.2 180.8 169.1 163.9
Baltics and Poland 31 March 31 Dec. 30 Sept. 30 June 31 March 31 Dec. 30 Sept. 30 June 31 MarchAmounts in NOK billion 2016 2015 2015 2015 2015 2014 2014 2014 2014
Residential mortgages and consumer finance 32.0 32.7 32.5 30.0 29.8 30.8 27.9 28.9 28.4
Real estate 7.7 7.8 7.7 7.3 7.4 7.8 6.9 7.3 7.3
Manufacturing 8.0 8.2 8.2 7.7 7.7 7.9 7.0 6.6 6.1
Services 3.7 3.9 3.8 3.9 3.6 3.9 3.5 4.0 3.8
Trade 4.4 4.8 5.3 4.9 5.1 5.1 4.9 4.8 4.7
Agriculture and forestry 2.7 2.8 2.9 2.5 2.4 2.5 2.3 2.3 2.2
Central and local government 5.5 5.6 5.8 5.3 5.3 5.2 4.3 4.7 4.7
Other sectors 5.7 6.0 5.4 5.2 5.4 5.4 4.5 4.5 4.3
Total 69.7 71.8 71.5 66.9 66.7 68.6 61.2 63.2 61.4
1) Exposures at default are based on full implementation of IRB, i.e. some of the IRB reported portfolios are still subject to final IRB approval from the Norwegian FSA (Finanstilsynet).
1.8.7 Sub-segments in Large corporates and international customers - exposure at default according to sector 1)
- 35 -
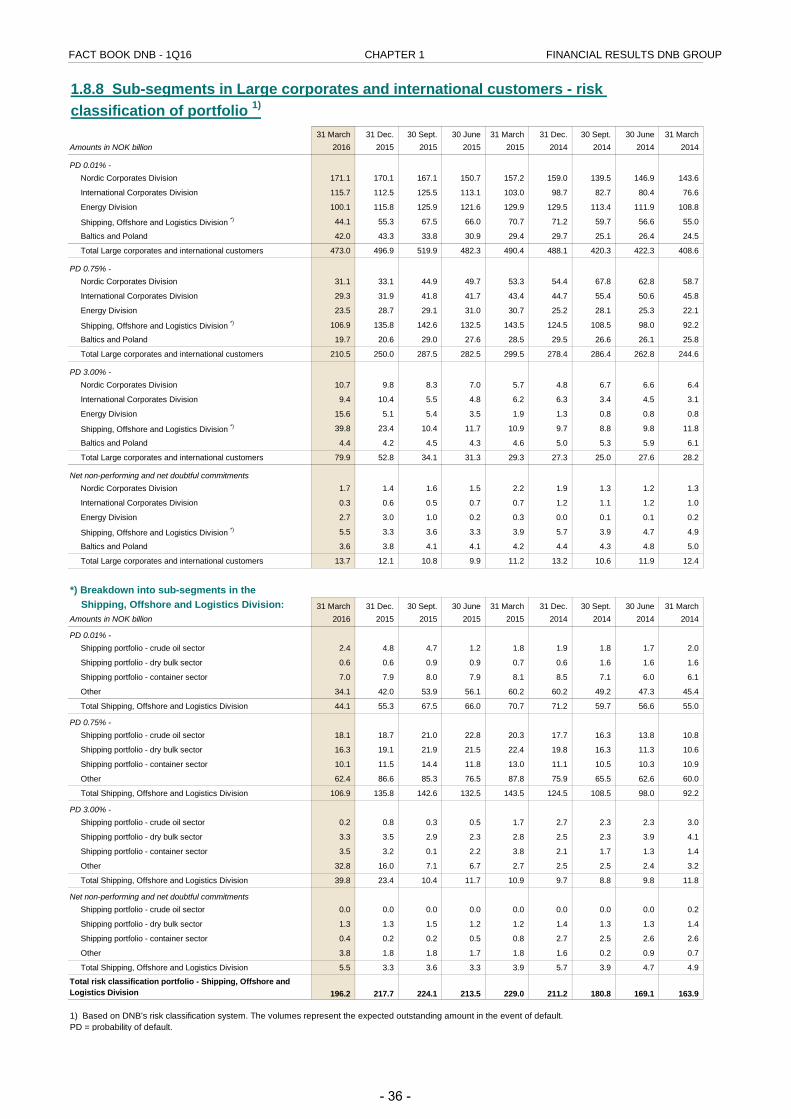
FACT BOOK DNB - 1Q16 CHAPTER 1 FINANCIAL RESULTS DNB GROUP
31 March 31 Dec. 230 Sept. 30 June 231 March 31 Dec. 230 Sept. 30 June 231 March 31 March 31 Dec. 30 Sept. 30 June 31 March 31 Dec. 30 Sept. 30 June 31 March
Amounts in NOK billion 2016 2015 2015 2015 2015 2014 2014 2014 2014
PD 0.01% -Nordic Corporates Division 171.1 170.1 167.1 150.7 157.2 159.0 139.5 146.9 143.6
International Corporates Division 115.7 112.5 125.5 113.1 103.0 98.7 82.7 80.4 76.6
Energy Division 100.1 115.8 125.9 121.6 129.9 129.5 113.4 111.9 108.8
Shipping, Offshore and Logistics Division *) 44.1 55.3 67.5 66.0 70.7 71.2 59.7 56.6 55.0
Baltics and Poland 42.0 43.3 33.8 30.9 29.4 29.7 25.1 26.4 24.5
Total Large corporates and international customers 473.0 496.9 519.9 482.3 490.4 488.1 420.3 422.3 408.6
PD 0.75% -Nordic Corporates Division 31.1 33.1 44.9 49.7 53.3 54.4 67.8 62.8 58.7
International Corporates Division 29.3 31.9 41.8 41.7 43.4 44.7 55.4 50.6 45.8
Energy Division 23.5 28.7 29.1 31.0 30.7 25.2 28.1 25.3 22.1
Shipping, Offshore and Logistics Division *) 106.9 135.8 142.6 132.5 143.5 124.5 108.5 98.0 92.2
Baltics and Poland 19.7 20.6 29.0 27.6 28.5 29.5 26.6 26.1 25.8
Total Large corporates and international customers 210.5 250.0 287.5 282.5 299.5 278.4 286.4 262.8 244.6
PD 3.00% -Nordic Corporates Division 10.7 9.8 8.3 7.0 5.7 4.8 6.7 6.6 6.4
International Corporates Division 9.4 10.4 5.5 4.8 6.2 6.3 3.4 4.5 3.1
Energy Division 15.6 5.1 5.4 3.5 1.9 1.3 0.8 0.8 0.8
Shipping, Offshore and Logistics Division *) 39.8 23.4 10.4 11.7 10.9 9.7 8.8 9.8 11.8
Baltics and Poland 4.4 4.2 4.5 4.3 4.6 5.0 5.3 5.9 6.1
Total Large corporates and international customers 79.9 52.8 34.1 31.3 29.3 27.3 25.0 27.6 28.2
Net non-performing and net doubtful commitmentsNordic Corporates Division 1.7 1.4 1.6 1.5 2.2 1.9 1.3 1.2 1.3
International Corporates Division 0.3 0.6 0.5 0.7 0.7 1.2 1.1 1.2 1.0
Energy Division 2.7 3.0 1.0 0.2 0.3 0.0 0.1 0.1 0.2
Shipping, Offshore and Logistics Division *) 5.5 3.3 3.6 3.3 3.9 5.7 3.9 4.7 4.9
Baltics and Poland 3.6 3.8 4.1 4.1 4.2 4.4 4.3 4.8 5.0
Total Large corporates and international customers 13.7 12.1 10.8 9.9 11.2 13.2 10.6 11.9 12.4
*) Breakdown into sub-segments in theShipping, Offshore and Logistics Division: 31 March 31 Dec. 30 Sept. 30 June 31 March 31 Dec. 30 Sept. 30 June 31 March
Amounts in NOK billion 2016 2015 2015 2015 2015 2014 2014 2014 2014
PD 0.01% -Shipping portfolio - crude oil sector 2.4 4.8 4.7 1.2 1.8 1.9 1.8 1.7 2.0
Shipping portfolio - dry bulk sector 0.6 0.6 0.9 0.9 0.7 0.6 1.6 1.6 1.6
Shipping portfolio - container sector 7.0 7.9 8.0 7.9 8.1 8.5 7.1 6.0 6.1
Other 34.1 42.0 53.9 56.1 60.2 60.2 49.2 47.3 45.4
Total Shipping, Offshore and Logistics Division 44.1 55.3 67.5 66.0 70.7 71.2 59.7 56.6 55.0
PD 0.75% -Shipping portfolio - crude oil sector 18.1 18.7 21.0 22.8 20.3 17.7 16.3 13.8 10.8
Shipping portfolio - dry bulk sector 16.3 19.1 21.9 21.5 22.4 19.8 16.3 11.3 10.6
Shipping portfolio - container sector 10.1 11.5 14.4 11.8 13.0 11.1 10.5 10.3 10.9
Other 62.4 86.6 85.3 76.5 87.8 75.9 65.5 62.6 60.0
Total Shipping, Offshore and Logistics Division 106.9 135.8 142.6 132.5 143.5 124.5 108.5 98.0 92.2
PD 3.00% -Shipping portfolio - crude oil sector 0.2 0.8 0.3 0.5 1.7 2.7 2.3 2.3 3.0
Shipping portfolio - dry bulk sector 3.3 3.5 2.9 2.3 2.8 2.5 2.3 3.9 4.1
Shipping portfolio - container sector 3.5 3.2 0.1 2.2 3.8 2.1 1.7 1.3 1.4
Other 32.8 16.0 7.1 6.7 2.7 2.5 2.5 2.4 3.2
Total Shipping, Offshore and Logistics Division 39.8 23.4 10.4 11.7 10.9 9.7 8.8 9.8 11.8
Net non-performing and net doubtful commitmentsShipping portfolio - crude oil sector 0.0 0.0 0.0 0.0 0.0 0.0 0.0 0.0 0.2
Shipping portfolio - dry bulk sector 1.3 1.3 1.5 1.2 1.2 1.4 1.3 1.3 1.4
Shipping portfolio - container sector 0.4 0.2 0.2 0.5 0.8 2.7 2.5 2.6 2.6
Other 3.8 1.8 1.8 1.7 1.8 1.6 0.2 0.9 0.7
Total Shipping, Offshore and Logistics Division 5.5 3.3 3.6 3.3 3.9 5.7 3.9 4.7 4.9
Total risk classification portfolio - Shipping, Offshore and Logistics Division 196.2 217.7 224.1 213.5 229.0 211.2 180.8 169.1 163.9
1) Based on DNB's risk classification system. The volumes represent the expected outstanding amount in the event of default.PD = probability of default.
1.8.8 Sub-segments in Large corporates and international customers - risk classification of portfolio 1)
- 36 -
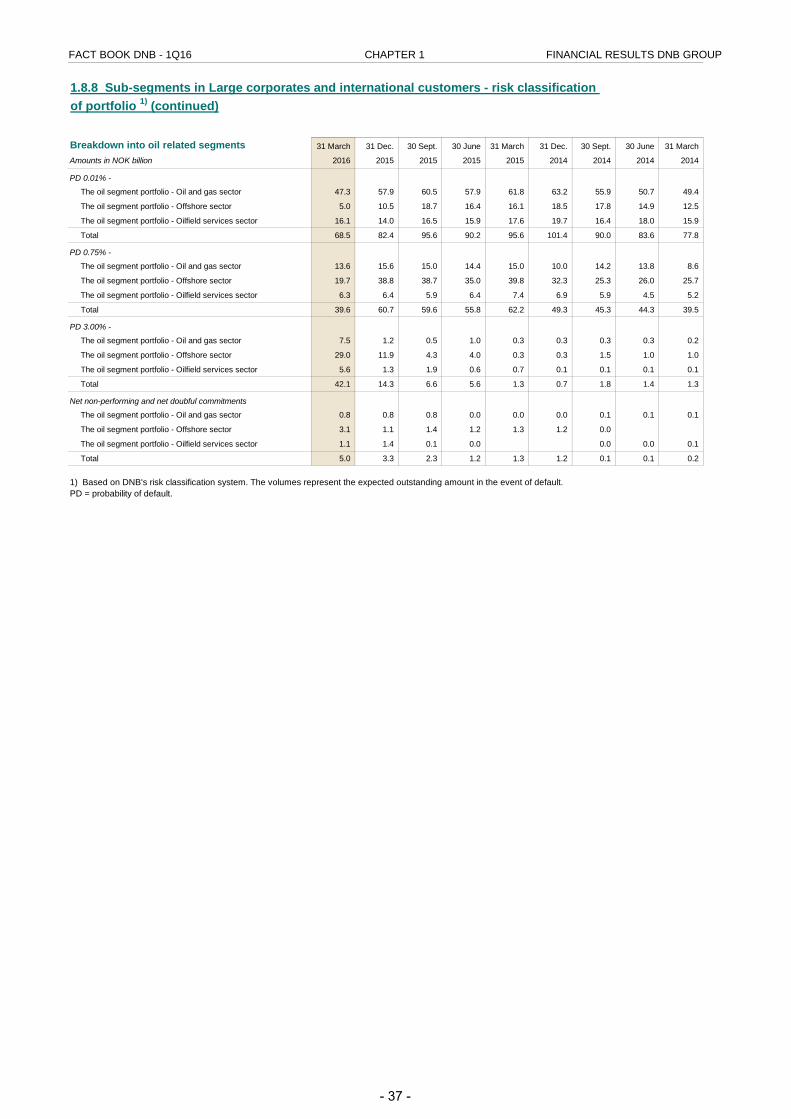
FACT BOOK DNB - 1Q16 CHAPTER 1 FINANCIAL RESULTS DNB GROUP
Breakdown into oil related segments 31 March 31 Dec. 30 Sept. 30 June 31 March 31 Dec. 30 Sept. 30 June 31 March
Amounts in NOK billion 2016 2015 2015 2015 2015 2014 2014 2014 2014
PD 0.01% -
The oil segment portfolio - Oil and gas sector 47.3 57.9 60.5 57.9 61.8 63.2 55.9 50.7 49.4
The oil segment portfolio - Offshore sector 5.0 10.5 18.7 16.4 16.1 18.5 17.8 14.9 12.5
The oil segment portfolio - Oilfield services sector 16.1 14.0 16.5 15.9 17.6 19.7 16.4 18.0 15.9
Total 68.5 82.4 95.6 90.2 95.6 101.4 90.0 83.6 77.8
PD 0.75% -
The oil segment portfolio - Oil and gas sector 13.6 15.6 15.0 14.4 15.0 10.0 14.2 13.8 8.6
The oil segment portfolio - Offshore sector 19.7 38.8 38.7 35.0 39.8 32.3 25.3 26.0 25.7
The oil segment portfolio - Oilfield services sector 6.3 6.4 5.9 6.4 7.4 6.9 5.9 4.5 5.2
Total 39.6 60.7 59.6 55.8 62.2 49.3 45.3 44.3 39.5
PD 3.00% -
The oil segment portfolio - Oil and gas sector 7.5 1.2 0.5 1.0 0.3 0.3 0.3 0.3 0.2
The oil segment portfolio - Offshore sector 29.0 11.9 4.3 4.0 0.3 0.3 1.5 1.0 1.0
The oil segment portfolio - Oilfield services sector 5.6 1.3 1.9 0.6 0.7 0.1 0.1 0.1 0.1
Total 42.1 14.3 6.6 5.6 1.3 0.7 1.8 1.4 1.3
Net non-performing and net doubful commitments
The oil segment portfolio - Oil and gas sector 0.8 0.8 0.8 0.0 0.0 0.0 0.1 0.1 0.1
The oil segment portfolio - Offshore sector 3.1 1.1 1.4 1.2 1.3 1.2 0.0
The oil segment portfolio - Oilfield services sector 1.1 1.4 0.1 0.0 0.0 0.0 0.1
Total 5.0 3.3 2.3 1.2 1.3 1.2 0.1 0.1 0.2
1) Based on DNB's risk classification system. The volumes represent the expected outstanding amount in the event of default.PD = probability of default.
1.8.8 Sub-segments in Large corporates and international customers - risk classification of portfolio 1) (continued)
- 37 -
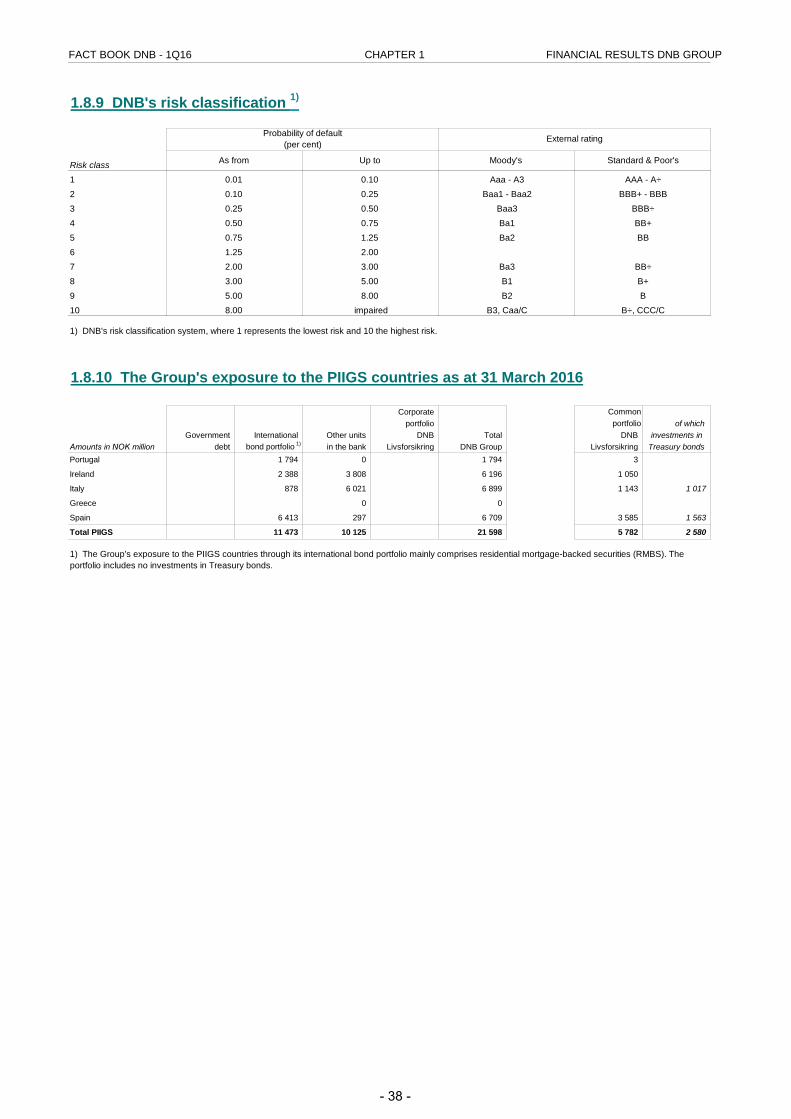
FACT BOOK DNB - 1Q16 CHAPTER 1 FINANCIAL RESULTS DNB GROUP
1.8.9 DNB's risk classification 1)
Risk class
12345678910
1.8.10 The Group's exposure to the PIIGS countries as at 31 March 2016
Corporate Common portfolio portfolio of which
Government International Other units DNB Total DNB investments in debt bond portfolio 1) in the bank Livsforsikring DNB Group Livsforsikring Treasury bonds
Portugal 1 794 0 1 794 3
Ireland 2 388 3 808 6 196 1 050
Italy 878 6 021 6 899 1 143 1 017
Greece 0 0
Spain 6 413 297 6 709 3 585 1 563
Total PIIGS 11 473 10 125 21 598 5 782 2 580
Amounts in NOK million
1) The Group's exposure to the PIIGS countries through its international bond portfolio mainly comprises residential mortgage-backed securities (RMBS). The portfolio includes no investments in Treasury bonds.
Probability of default(per cent) External rating
As from Up to Moody's Standard & Poor's
0.01 0.10 Aaa - A3 AAA - A÷0.10 0.25 Baa1 - Baa2 BBB+ - BBB0.25 0.50 Baa3 BBB÷0.50 0.75 Ba1 BB+0.75 1.25 Ba2 BB1.25 2.002.00 3.00 Ba3 BB÷3.00 5.00 B1 B+
1) DNB's risk classification system, where 1 represents the lowest risk and 10 the highest risk.
5.00 8.00 B2 B8.00 impaired B3, Caa/C B÷, CCC/C
- 38 -
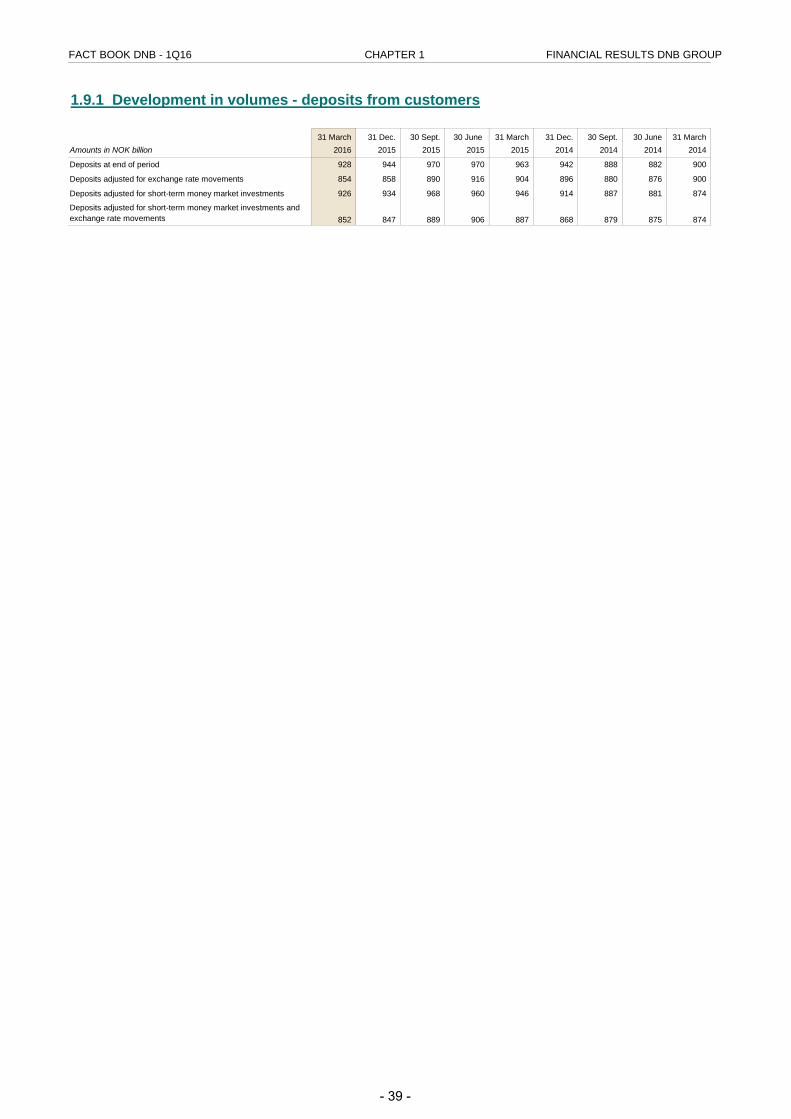
FACT BOOK DNB - 1Q16 CHAPTER 1 FINANCIAL RESULTS DNB GROUP
1.9.1 Development in volumes - deposits from customers
31 March 31 Dec. 30 Sept. 30 June 31 March 31 Dec. 30 Sept. 30 June 31 MarchAmounts in NOK billion 2016 2015 2015 2015 2015 2014 2014 2014 2014
Deposits at end of period 928 944 970 970 963 942 888 882 900
Deposits adjusted for exchange rate movements 854 858 890 916 904 896 880 876 900
Deposits adjusted for short-term money market investments 926 934 968 960 946 914 887 881 874
Deposits adjusted for short-term money market investments and exchange rate movements 852 847 889 906 887 868 879 875 874
- 39 -
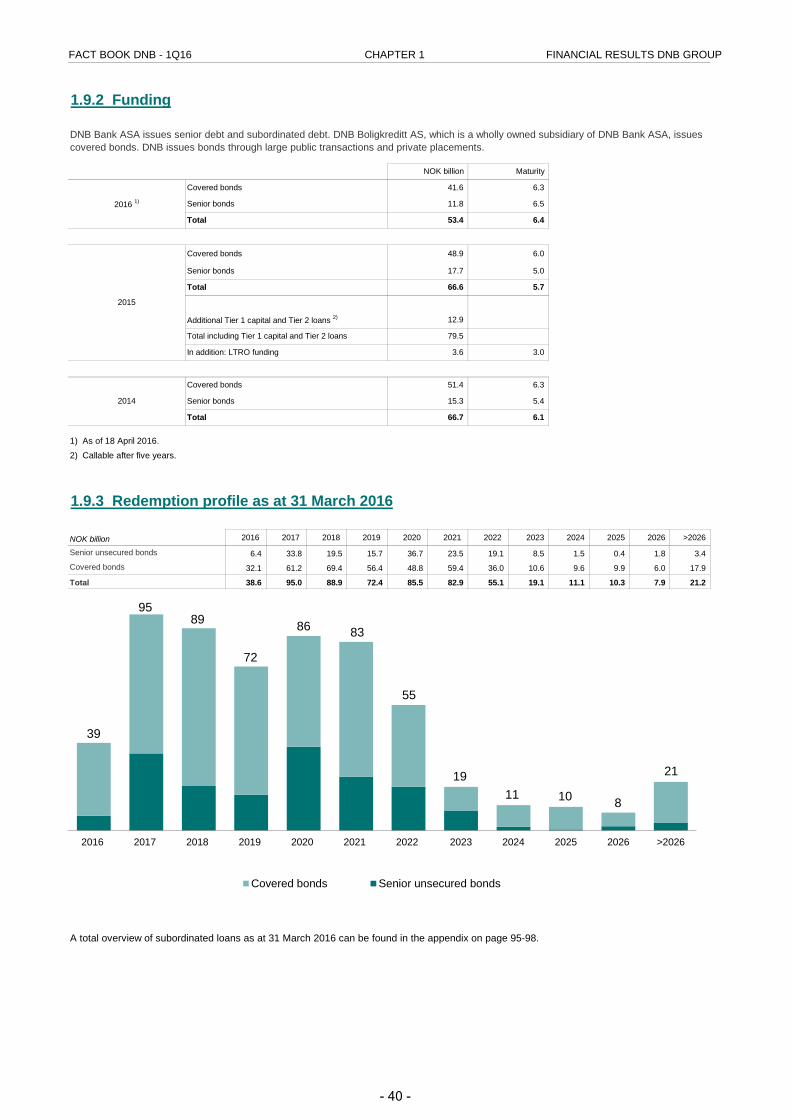
FACT BOOK DNB - 1Q16 CHAPTER 1 FINANCIAL RESULTS DNB GROUP
1.9.2 Funding
1.9.3 Redemption profile as at 31 March 2016
NOK billion 2016 2017 2018 2019 2020 2021 2022 2023 2024 2025 2026 >2026
Senior unsecured bonds 6.4 33.8 19.5 15.7 36.7 23.5 19.1 8.5 1.5 0.4 1.8 3.4Covered bonds 32.1 61.2 69.4 56.4 48.8 59.4 36.0 10.6 9.6 9.9 6.0 17.9
Total 38.6 95.0 88.9 72.4 85.5 82.9 55.1 19.1 11.1 10.3 7.9 21.2
0 39 95 89 72 86 83 55 19 11 10 8 21
A total overview of subordinated loans as at 31 March 2016 can be found in the appendix on page 95-98.
1) As of 18 April 2016.2) Callable after five years.
Covered bonds
Senior bonds
Total
2014
6.3
5.4
6.1
NOK billion
51.4
15.3
66.7
12.9
66.6 5.7
DNB Bank ASA issues senior debt and subordinated debt. DNB Boligkreditt AS, which is a wholly owned subsidiary of DNB Bank ASA, issues covered bonds. DNB issues bonds through large public transactions and private placements.
2015
Covered bonds 48.9 6.0
Senior bonds 17.7 5.0
Maturity
Total
Additional Tier 1 capital and Tier 2 loans 2)
In addition: LTRO funding 3.6 3.0
Total including Tier 1 capital and Tier 2 loans 79.5
2016 1)
Covered bonds 41.6 6.3
Senior bonds 11.8 6.5
Total 53.4 6.4
2016 2017 2018 2019 2020 2021 2022 2023 2024 2025 2026 >2026
Covered bonds Senior unsecured bonds
39
95 89
72
86 83
55
19 11 10
21
8
- 40 -
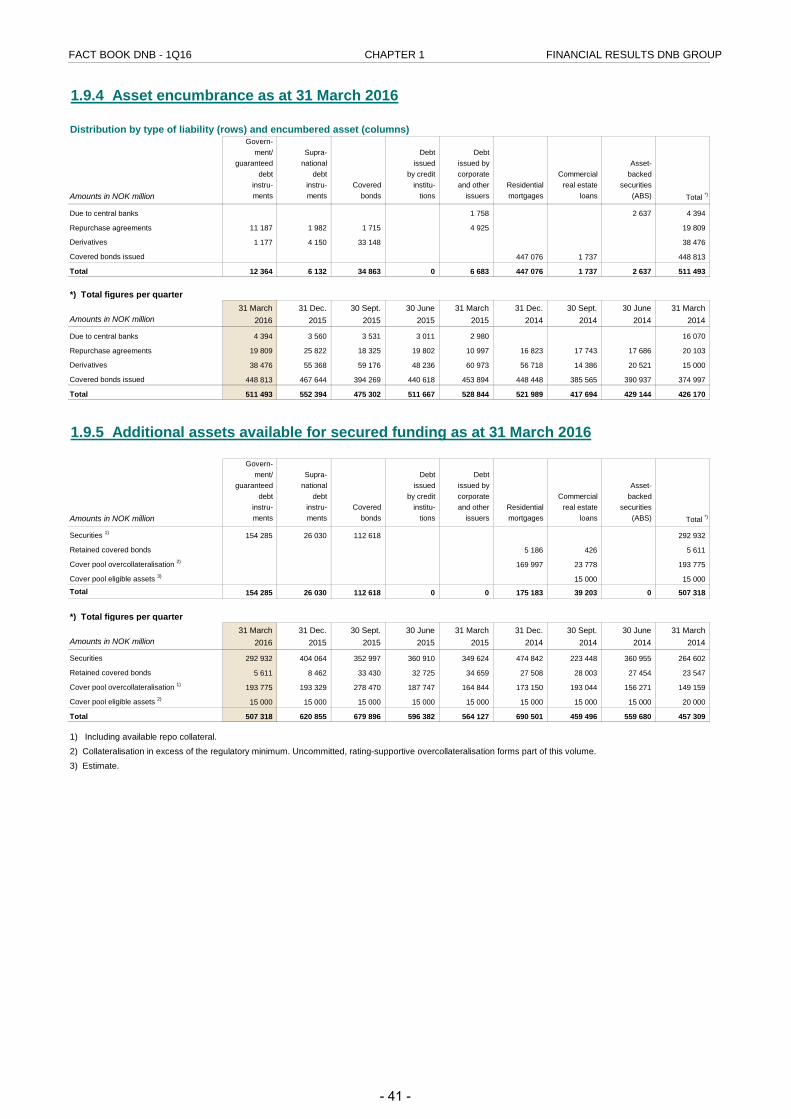
FACT BOOK DNB - 1Q16 CHAPTER 1 FINANCIAL RESULTS DNB GROUP
1.9.4 Asset encumbrance as at 31 March 2016
Distribution by type of liability (rows) and encumbered asset (columns) Govern-
ment/ Supra- Debt Debt guaranteed national issued issued by Asset-
debt debt by credit corporate Commercial backed instru- instru- Covered institu- and other Residential real estate securities
Amounts in NOK million ments ments bonds tions issuers mortgages loans (ABS) Total *)
Due to central banks 1 758 2 637 4 394
Repurchase agreements 11 187 1 982 1 715 4 925 19 809
Derivatives 1 177 4 150 33 148 38 476
Covered bonds issued 447 076 1 737 448 813
Total 12 364 6 132 34 863 0 6 683 447 076 1 737 2 637 511 493
*) Total figures per quarter31 March 31 Dec. 30 Sept. 30 June 31 March 31 Dec. 30 Sept. 30 June 31 March
Amounts in NOK million 2016 2015 2015 2015 2015 2014 2014 2014 2014
Due to central banks 4 394 3 560 3 531 3 011 2 980 16 070
Repurchase agreements 19 809 25 822 18 325 19 802 10 997 16 823 17 743 17 686 20 103
Derivatives 38 476 55 368 59 176 48 236 60 973 56 718 14 386 20 521 15 000
Covered bonds issued 448 813 467 644 394 269 440 618 453 894 448 448 385 565 390 937 374 997
Total 511 493 552 394 475 302 511 667 528 844 521 989 417 694 429 144 426 170
1.9.5 Additional assets available for secured funding as at 31 March 2016
Govern- ment/ Supra- Debt Debt
guaranteed national issued issued by Asset- debt debt by credit corporate Commercial backed
instru- instru- Covered institu- and other Residential real estate securities Amounts in NOK million ments ments bonds tions issuers mortgages loans (ABS) Total *)
Securities 1) 154 285 26 030 112 618 292 932
Retained covered bonds 5 186 426 5 611
Cover pool overcollateralisation 2) 169 997 23 778 193 775
Cover pool eligible assets 3) 15 000 15 000 Total 154 285 26 030 112 618 0 0 175 183 39 203 0 507 318
*) Total figures per quarter31 March 31 Dec. 30 Sept. 30 June 31 March 31 Dec. 30 Sept. 30 June 31 March
Amounts in NOK million 2016 2015 2015 2015 2015 2014 2014 2014 2014
Securities 292 932 404 064 352 997 360 910 349 624 474 842 223 448 360 955 264 602
Retained covered bonds 5 611 8 462 33 430 32 725 34 659 27 508 28 003 27 454 23 547
Cover pool overcollateralisation 1) 193 775 193 329 278 470 187 747 164 844 173 150 193 044 156 271 149 159
Cover pool eligible assets 2) 15 000 15 000 15 000 15 000 15 000 15 000 15 000 15 000 20 000
Total 507 318 620 855 679 896 596 382 564 127 690 501 459 496 559 680 457 309
1) Including available repo collateral.2) Collateralisation in excess of the regulatory minimum. Uncommitted, rating-supportive overcollateralisation forms part of this volume.3) Estimate.
- 41 -
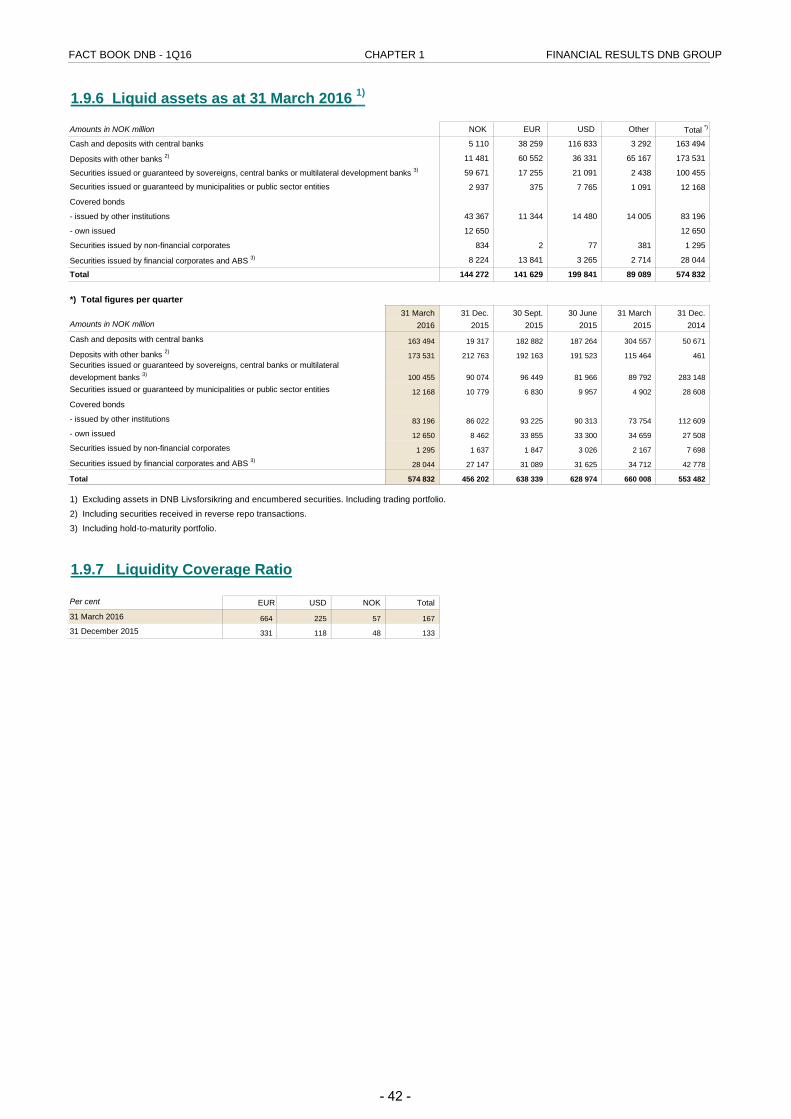
FACT BOOK DNB - 1Q16 CHAPTER 1 FINANCIAL RESULTS DNB GROUP
1.9.6 Liquid assets as at 31 March 2016 1)
Amounts in NOK million NOK EUR USD Other Total *)
Cash and deposits with central banks 5 110 38 259 116 833 3 292 163 494
Deposits with other banks 2) 11 481 60 552 36 331 65 167 173 531
59 671 17 255 21 091 2 438 100 455
2 937 375 7 765 1 091 12 168
Covered bonds
- issued by other institutions 43 367 11 344 14 480 14 005 83 196
- own issued 12 650 12 650
Securities issued by non-financial corporates 834 2 77 381 1 295
Securities issued by financial corporates and ABS 3) 8 224 13 841 3 265 2 714 28 044
Total 144 272 141 629 199 841 89 089 574 832
*) Total figures per quarter31 March 31 Dec. 30 Sept. 30 June 31 March 31 Dec.
Amounts in NOK million 2016 2015 2015 2015 2015 2014
Cash and deposits with central banks 163 494 19 317 182 882 187 264 304 557 50 671
Deposits with other banks 2) 173 531 212 763 192 163 191 523 115 464 461
100 455 90 074 96 449 81 966 89 792 283 148
12 168 10 779 6 830 9 957 4 902 28 608
Covered bonds
- issued by other institutions 83 196 86 022 93 225 90 313 73 754 112 609
- own issued 12 650 8 462 33 855 33 300 34 659 27 508
Securities issued by non-financial corporates 1 295 1 637 1 847 3 026 2 167 7 698
Securities issued by financial corporates and ABS 3) 28 044 27 147 31 089 31 625 34 712 42 778
Total 574 832 456 202 638 339 628 974 660 008 553 482
1) Excluding assets in DNB Livsforsikring and encumbered securities. Including trading portfolio.2) Including securities received in reverse repo transactions. 3) Including hold-to-maturity portfolio.
1.9.7 Liquidity Coverage Ratio
Per cent EUR USD NOK Total
31 March 2016 664 225 57 167
31 December 2015 331 118 48 133
Securities issued or guaranteed by sovereigns, central banks or multilateral development banks 3)
Securities issued or guaranteed by municipalities or public sector entities
Securities issued or guaranteed by sovereigns, central banks or multilateral development banks 3)
Securities issued or guaranteed by municipalities or public sector entities
- 42 -
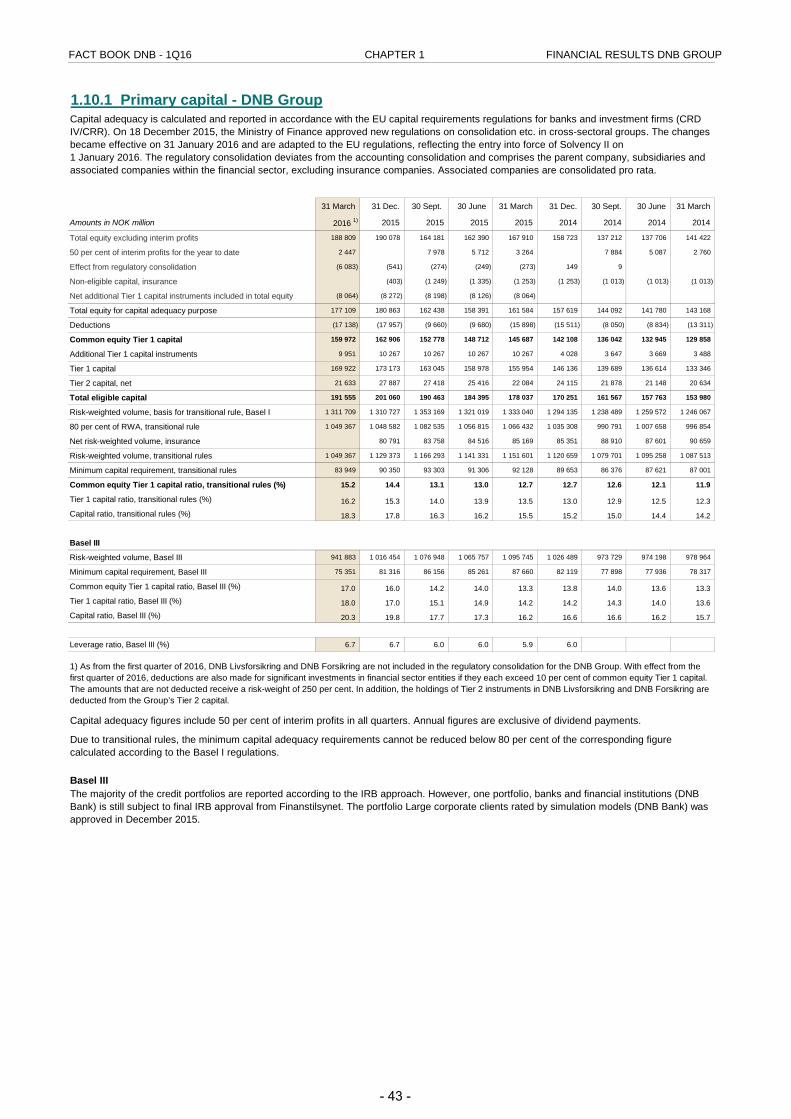
FACT BOOK DNB - 1Q16 CHAPTER 1 FINANCIAL RESULTS DNB GROUP
1.10.1 Primary capital - DNB Group
31 March 31 Dec. 30 Sept. 30 June 31 March 31 Dec. 30 Sept. 30 June 31 March
Amounts in NOK million 2016 1) 2015 2015 2015 2015 2014 2014 2014 2014
Total equity excluding interim profits 188 809 190 078 164 181 162 390 167 910 158 723 137 212 137 706 141 422
50 per cent of interim profits for the year to date 2 447 7 978 5 712 3 264 7 884 5 087 2 760
Effect from regulatory consolidation (6 083) (541) (274) (249) (273) 149 9
Non-eligible capital, insurance (403) (1 249) (1 335) (1 253) (1 253) (1 013) (1 013) (1 013)
Net additional Tier 1 capital instruments included in total equity (8 064) (8 272) (8 198) (8 126) (8 064)
Total equity for capital adequacy purpose 177 109 180 863 162 438 158 391 161 584 157 619 144 092 141 780 143 168
Deductions (17 138) (17 957) (9 660) (9 680) (15 898) (15 511) (8 050) (8 834) (13 311)
Common equity Tier 1 capital 159 972 162 906 152 778 148 712 145 687 142 108 136 042 132 945 129 858
Additional Tier 1 capital instruments 9 951 10 267 10 267 10 267 10 267 4 028 3 647 3 669 3 488
Tier 1 capital 169 922 173 173 163 045 158 978 155 954 146 136 139 689 136 614 133 346
Tier 2 capital, net 21 633 27 887 27 418 25 416 22 084 24 115 21 878 21 148 20 634
Total eligible capital 191 555 201 060 190 463 184 395 178 037 170 251 161 567 157 763 153 980
Risk-weighted volume, basis for transitional rule, Basel I 1 311 709 1 310 727 1 353 169 1 321 019 1 333 040 1 294 135 1 238 489 1 259 572 1 246 067
80 per cent of RWA, transitional rule 1 049 367 1 048 582 1 082 535 1 056 815 1 066 432 1 035 308 990 791 1 007 658 996 854
Net risk-weighted volume, insurance 80 791 83 758 84 516 85 169 85 351 88 910 87 601 90 659
Risk-weighted volume, transitional rules 1 049 367 1 129 373 1 166 293 1 141 331 1 151 601 1 120 659 1 079 701 1 095 258 1 087 513
Minimum capital requirement, transitional rules 83 949 90 350 93 303 91 306 92 128 89 653 86 376 87 621 87 001
Common equity Tier 1 capital ratio, transitional rules (%) 15.2 14.4 13.1 13.0 12.7 12.7 12.6 12.1 11.9
Tier 1 capital ratio, transitional rules (%) 16.2 15.3 14.0 13.9 13.5 13.0 12.9 12.5 12.3
Capital ratio, transitional rules (%) 18.3 17.8 16.3 16.2 15.5 15.2 15.0 14.4 14.2
Basel III
Risk-weighted volume, Basel III 941 883 1 016 454 1 076 948 1 065 757 1 095 745 1 026 489 973 729 974 198 978 964
Minimum capital requirement, Basel III 75 351 81 316 86 156 85 261 87 660 82 119 77 898 77 936 78 317
Common equity Tier 1 capital ratio, Basel III (%) 17.0 16.0 14.2 14.0 13.3 13.8 14.0 13.6 13.3
Tier 1 capital ratio, Basel III (%) 18.0 17.0 15.1 14.9 14.2 14.2 14.3 14.0 13.6
Capital ratio, Basel III (%) 20.3 19.8 17.7 17.3 16.2 16.6 16.6 16.2 15.7
Leverage ratio, Basel III (%) 6.7 6.7 6.0 6.0 5.9 6.0
Basel III
Due to transitional rules, the minimum capital adequacy requirements cannot be reduced below 80 per cent of the corresponding figure calculated according to the Basel I regulations.
Capital adequacy is calculated and reported in accordance with the EU capital requirements regulations for banks and investment firms (CRD IV/CRR). On 18 December 2015, the Ministry of Finance approved new regulations on consolidation etc. in cross-sectoral groups. The changes became effective on 31 January 2016 and are adapted to the EU regulations, reflecting the entry into force of Solvency II on 1 January 2016. The regulatory consolidation deviates from the accounting consolidation and comprises the parent company, subsidiaries and associated companies within the financial sector, excluding insurance companies. Associated companies are consolidated pro rata.
The majority of the credit portfolios are reported according to the IRB approach. However, one portfolio, banks and financial institutions (DNB Bank) is still subject to final IRB approval from Finanstilsynet. The portfolio Large corporate clients rated by simulation models (DNB Bank) was approved in December 2015.
Capital adequacy figures include 50 per cent of interim profits in all quarters. Annual figures are exclusive of dividend payments.
1) As from the first quarter of 2016, DNB Livsforsikring and DNB Forsikring are not included in the regulatory consolidation for the DNB Group. With effect from the first quarter of 2016, deductions are also made for significant investments in financial sector entities if they each exceed 10 per cent of common equity Tier 1 capital. The amounts that are not deducted receive a risk-weight of 250 per cent. In addition, the holdings of Tier 2 instruments in DNB Livsforsikring and DNB Forsikring are deducted from the Group’s Tier 2 capital.
- 43 -
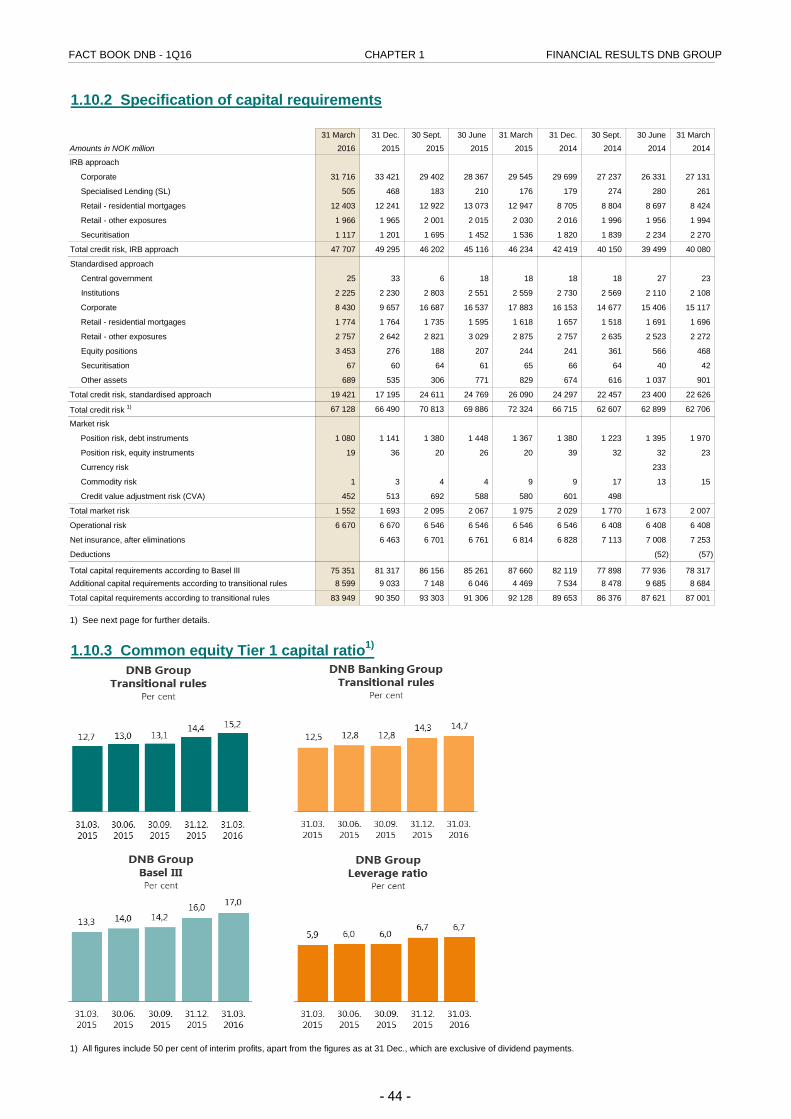
FACT BOOK DNB - 1Q16 CHAPTER 1 FINANCIAL RESULTS DNB GROUP
1.10.2 Specification of capital requirements
31 March 31 Dec. 30 Sept. 30 June 31 March 31 Dec. 30 Sept. 30 June 31 MarchAmounts in NOK million 2016 2015 2015 2015 2015 2014 2014 2014 2014
IRB approach
Corporate 31 716 33 421 29 402 28 367 29 545 29 699 27 237 26 331 27 131
Specialised Lending (SL) 505 468 183 210 176 179 274 280 261
Retail - residential mortgages 12 403 12 241 12 922 13 073 12 947 8 705 8 804 8 697 8 424
Retail - other exposures 1 966 1 965 2 001 2 015 2 030 2 016 1 996 1 956 1 994
Securitisation 1 117 1 201 1 695 1 452 1 536 1 820 1 839 2 234 2 270
Total credit risk, IRB approach 47 707 49 295 46 202 45 116 46 234 42 419 40 150 39 499 40 080
Standardised approach
Central government 25 33 6 18 18 18 18 27 23
Institutions 2 225 2 230 2 803 2 551 2 559 2 730 2 569 2 110 2 108
Corporate 8 430 9 657 16 687 16 537 17 883 16 153 14 677 15 406 15 117
Retail - residential mortgages 1 774 1 764 1 735 1 595 1 618 1 657 1 518 1 691 1 696
Retail - other exposures 2 757 2 642 2 821 3 029 2 875 2 757 2 635 2 523 2 272
Equity positions 3 453 276 188 207 244 241 361 566 468
Securitisation 67 60 64 61 65 66 64 40 42
Other assets 689 535 306 771 829 674 616 1 037 901
Total credit risk, standardised approach 19 421 17 195 24 611 24 769 26 090 24 297 22 457 23 400 22 626
Total credit risk 1) 67 128 66 490 70 813 69 886 72 324 66 715 62 607 62 899 62 706
Market risk
Position risk, debt instruments 1 080 1 141 1 380 1 448 1 367 1 380 1 223 1 395 1 970
Position risk, equity instruments 19 36 20 26 20 39 32 32 23
Currency risk 233
Commodity risk 1 3 4 4 9 9 17 13 15
Credit value adjustment risk (CVA) 452 513 692 588 580 601 498
Total market risk 1 552 1 693 2 095 2 067 1 975 2 029 1 770 1 673 2 007
Operational risk 6 670 6 670 6 546 6 546 6 546 6 546 6 408 6 408 6 408
Net insurance, after eliminations 6 463 6 701 6 761 6 814 6 828 7 113 7 008 7 253
Deductions (52) (57)
Total capital requirements according to Basel III 75 351 81 317 86 156 85 261 87 660 82 119 77 898 77 936 78 317 Additional capital requirements according to transitional rules 8 599 9 033 7 148 6 046 4 469 7 534 8 478 9 685 8 684
Total capital requirements according to transitional rules 83 949 90 350 93 303 91 306 92 128 89 653 86 376 87 621 87 001
1) See next page for further details.
1.10.3 Common equity Tier 1 capital ratio1)
1) All figures include 50 per cent of interim profits, apart from the figures as at 31 Dec., which are exclusive of dividend payments.
- 44 -
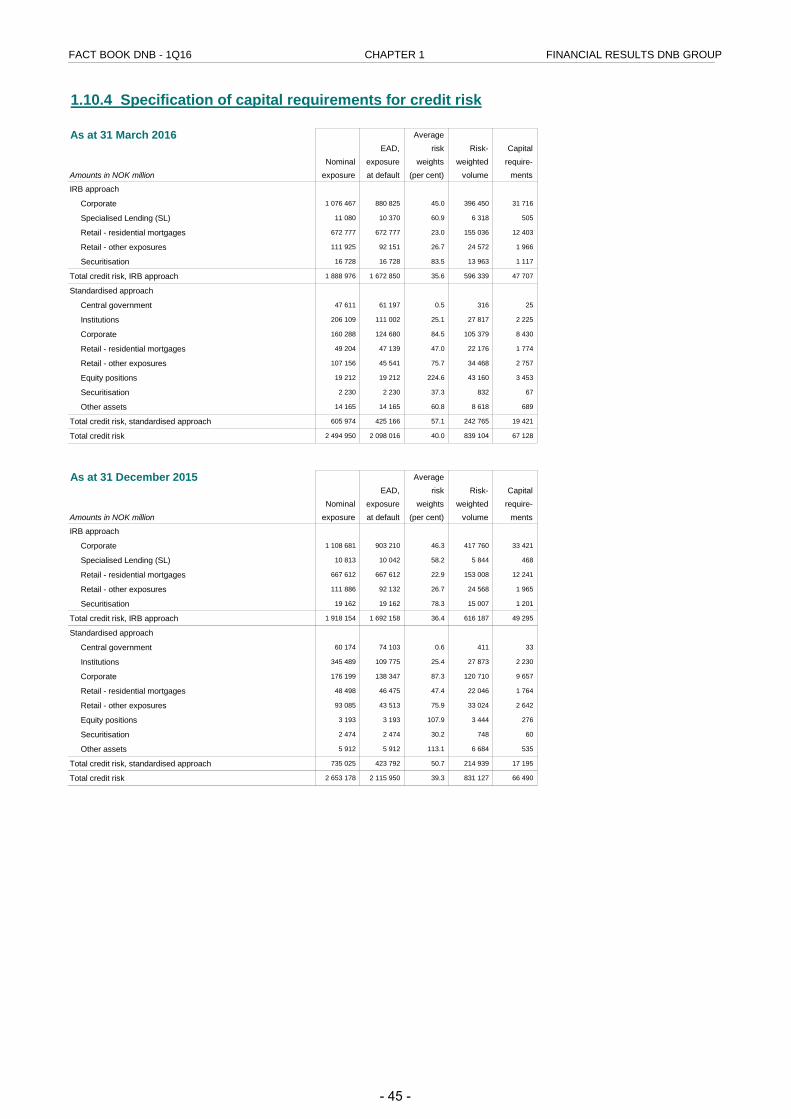
FACT BOOK DNB - 1Q16 CHAPTER 1 FINANCIAL RESULTS DNB GROUP
1.10.4 Specification of capital requirements for credit risk
As at 31 March 2016 AverageEAD, risk Risk- Capital
Nominal exposure weights weighted require-Amounts in NOK million exposure at default (per cent) volume ments
IRB approach
Corporate 1 076 467 880 825 45.0 396 450 31 716
Specialised Lending (SL) 11 080 10 370 60.9 6 318 505
Retail - residential mortgages 672 777 672 777 23.0 155 036 12 403
Retail - other exposures 111 925 92 151 26.7 24 572 1 966
Securitisation 16 728 16 728 83.5 13 963 1 117
Total credit risk, IRB approach 1 888 976 1 672 850 35.6 596 339 47 707
Standardised approach
Central government 47 611 61 197 0.5 316 25
Institutions 206 109 111 002 25.1 27 817 2 225
Corporate 160 288 124 680 84.5 105 379 8 430
Retail - residential mortgages 49 204 47 139 47.0 22 176 1 774
Retail - other exposures 107 156 45 541 75.7 34 468 2 757
Equity positions 19 212 19 212 224.6 43 160 3 453
Securitisation 2 230 2 230 37.3 832 67
Other assets 14 165 14 165 60.8 8 618 689
Total credit risk, standardised approach 605 974 425 166 57.1 242 765 19 421
Total credit risk 2 494 950 2 098 016 40.0 839 104 67 128
As at 31 December 2015 AverageEAD, risk Risk- Capital
Nominal exposure weights weighted require-Amounts in NOK million exposure at default (per cent) volume ments
IRB approach
Corporate 1 108 681 903 210 46.3 417 760 33 421
Specialised Lending (SL) 10 813 10 042 58.2 5 844 468
Retail - residential mortgages 667 612 667 612 22.9 153 008 12 241
Retail - other exposures 111 886 92 132 26.7 24 568 1 965
Securitisation 19 162 19 162 78.3 15 007 1 201
Total credit risk, IRB approach 1 918 154 1 692 158 36.4 616 187 49 295
Standardised approach
Central government 60 174 74 103 0.6 411 33
Institutions 345 489 109 775 25.4 27 873 2 230
Corporate 176 199 138 347 87.3 120 710 9 657
Retail - residential mortgages 48 498 46 475 47.4 22 046 1 764
Retail - other exposures 93 085 43 513 75.9 33 024 2 642
Equity positions 3 193 3 193 107.9 3 444 276
Securitisation 2 474 2 474 30.2 748 60
Other assets 5 912 5 912 113.1 6 684 535
Total credit risk, standardised approach 735 025 423 792 50.7 214 939 17 195
Total credit risk 2 653 178 2 115 950 39.3 831 127 66 490
- 45 -
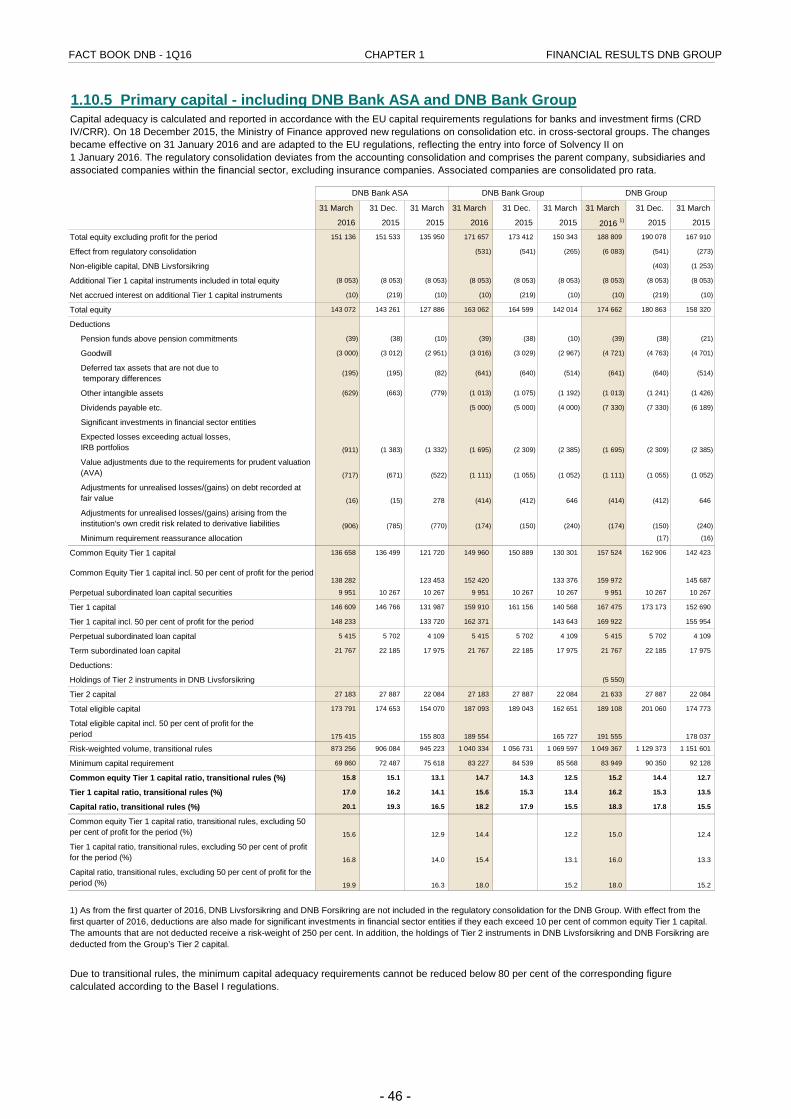
FACT BOOK DNB - 1Q16 CHAPTER 1 FINANCIAL RESULTS DNB GROUP
1.10.5 Primary capital - including DNB Bank ASA and DNB Bank Group
31 March 31 Dec. 31 March 31 March 31 Dec. 31 March 31 March 31 Dec. 31 March
2016 2015 2015 2016 2015 2015 2016 1) 2015 2015
Total equity excluding profit for the period 151 136 151 533 135 950 171 657 173 412 150 343 188 809 190 078 167 910
Effect from regulatory consolidation (531) (541) (265) (6 083) (541) (273)
Non-eligible capital, DNB Livsforsikring (403) (1 253)
Additional Tier 1 capital instruments included in total equity (8 053) (8 053) (8 053) (8 053) (8 053) (8 053) (8 053) (8 053) (8 053)
Net accrued interest on additional Tier 1 capital instruments (10) (219) (10) (10) (219) (10) (10) (219) (10)
Total equity 143 072 143 261 127 886 163 062 164 599 142 014 174 662 180 863 158 320
Deductions
Pension funds above pension commitments (39) (38) (10) (39) (38) (10) (39) (38) (21)
Goodwill (3 000) (3 012) (2 951) (3 016) (3 029) (2 967) (4 721) (4 763) (4 701)
Deferred tax assets that are not due to temporary differences
(195) (195) (82) (641) (640) (514) (641) (640) (514)
Other intangible assets (629) (663) (779) (1 013) (1 075) (1 192) (1 013) (1 241) (1 426)
Dividends payable etc. (5 000) (5 000) (4 000) (7 330) (7 330) (6 189)
Significant investments in financial sector entities
Expected losses exceeding actual losses,IRB portfolios (911) (1 383) (1 332) (1 695) (2 309) (2 385) (1 695) (2 309) (2 385)
Value adjustments due to the requirements for prudent valuation (AVA) (717) (671) (522) (1 111) (1 055) (1 052) (1 111) (1 055) (1 052)
Adjustments for unrealised losses/(gains) on debt recorded at fair value (16) (15) 278 (414) (412) 646 (414) (412) 646
Adjustments for unrealised losses/(gains) arising from the institution's own credit risk related to derivative liabilities (906) (785) (770) (174) (150) (240) (174) (150) (240)
Minimum requirement reassurance allocation (17) (16)
Common Equity Tier 1 capital 136 658 136 499 121 720 149 960 150 889 130 301 157 524 162 906 142 423
Common Equity Tier 1 capital incl. 50 per cent of profit for the period138 282 123 453 152 420 133 376 159 972 145 687
Perpetual subordinated loan capital securities 9 951 10 267 10 267 9 951 10 267 10 267 9 951 10 267 10 267
Tier 1 capital 146 609 146 766 131 987 159 910 161 156 140 568 167 475 173 173 152 690
Tier 1 capital incl. 50 per cent of profit for the period 148 233 133 720 162 371 143 643 169 922 155 954
Perpetual subordinated loan capital 5 415 5 702 4 109 5 415 5 702 4 109 5 415 5 702 4 109
Term subordinated loan capital 21 767 22 185 17 975 21 767 22 185 17 975 21 767 22 185 17 975
Deductions:
Holdings of Tier 2 instruments in DNB Livsforsikring (5 550)
Tier 2 capital 27 183 27 887 22 084 27 183 27 887 22 084 21 633 27 887 22 084
Total eligible capital 173 791 174 653 154 070 187 093 189 043 162 651 189 108 201 060 174 773
Total eligible capital incl. 50 per cent of profit for the period 175 415 155 803 189 554 165 727 191 555 178 037
Risk-weighted volume, transitional rules 873 256 906 084 945 223 1 040 334 1 056 731 1 069 597 1 049 367 1 129 373 1 151 601
Minimum capital requirement 69 860 72 487 75 618 83 227 84 539 85 568 83 949 90 350 92 128
Common equity Tier 1 capital ratio, transitional rules (%) 15.8 15.1 13.1 14.7 14.3 12.5 15.2 14.4 12.7
Tier 1 capital ratio, transitional rules (%) 17.0 16.2 14.1 15.6 15.3 13.4 16.2 15.3 13.5
Capital ratio, transitional rules (%) 20.1 19.3 16.5 18.2 17.9 15.5 18.3 17.8 15.5
Common equity Tier 1 capital ratio, transitional rules, excluding 50 per cent of profit for the period (%) 15.6 12.9 14.4 12.2 15.0 12.4
Tier 1 capital ratio, transitional rules, excluding 50 per cent of profit for the period (%) 16.8 14.0 15.4 13.1 16.0 13.3
Capital ratio, transitional rules, excluding 50 per cent of profit for the period (%) 19.9 16.3 18.0 15.2 18.0 15.2
Due to transitional rules, the minimum capital adequacy requirements cannot be reduced below 80 per cent of the corresponding figure calculated according to the Basel I regulations.
DNB Bank ASA DNB Bank Group DNB Group
Capital adequacy is calculated and reported in accordance with the EU capital requirements regulations for banks and investment firms (CRD IV/CRR). On 18 December 2015, the Ministry of Finance approved new regulations on consolidation etc. in cross-sectoral groups. The changes became effective on 31 January 2016 and are adapted to the EU regulations, reflecting the entry into force of Solvency II on 1 January 2016. The regulatory consolidation deviates from the accounting consolidation and comprises the parent company, subsidiaries and associated companies within the financial sector, excluding insurance companies. Associated companies are consolidated pro rata.
1) As from the first quarter of 2016, DNB Livsforsikring and DNB Forsikring are not included in the regulatory consolidation for the DNB Group. With effect from the first quarter of 2016, deductions are also made for significant investments in financial sector entities if they each exceed 10 per cent of common equity Tier 1 capital. The amounts that are not deducted receive a risk-weight of 250 per cent. In addition, the holdings of Tier 2 instruments in DNB Livsforsikring and DNB Forsikring are deducted from the Group’s Tier 2 capital.
- 46 -
FACT BOOK DNB - 1Q16
Chapter 2 - Segmental reportingFinancial performance
Personal customers
Small and medium-sized enterprises
Large corporates and international customers
Trading
Other operations/eliminations
Traditional pension products
Main subsidiaries and product units
- 47 -
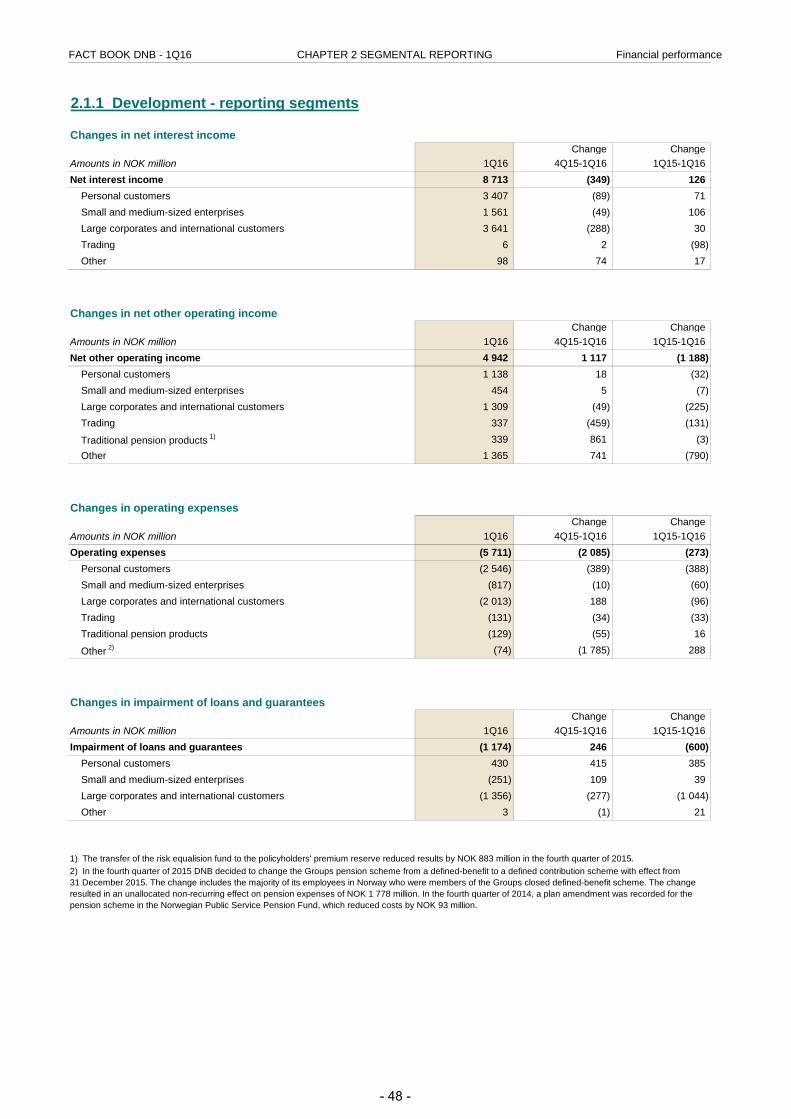
FACT BOOK DNB - 1Q16 CHAPTER 2 SEGMENTAL REPORTING Financial performance
2.1.1 Development - reporting segments
Changes in net interest incomeChange Change
Amounts in NOK million 1Q16 4Q15-1Q16 1Q15-1Q16Net interest income 8 713 (349) 126
Personal customers 3 407 (89) 71 Small and medium-sized enterprises 1 561 (49) 106 Large corporates and international customers 3 641 (288) 30 Trading 6 2 (98) Other 98 74 17
Changes in net other operating incomeChange Change
Amounts in NOK million 1Q16 4Q15-1Q16 1Q15-1Q16Net other operating income 4 942 1 117 (1 188)
Personal customers 1 138 18 (32) Small and medium-sized enterprises 454 5 (7) Large corporates and international customers 1 309 (49) (225) Trading 337 (459) (131)
Traditional pension products 1) 339 861 (3) Other 1 365 741 (790)
Changes in operating expensesChange Change
Amounts in NOK million 1Q16 4Q15-1Q16 1Q15-1Q16Operating expenses (5 711) (2 085) (273)
Personal customers (2 546) (389) (388) Small and medium-sized enterprises (817) (10) (60) Large corporates and international customers (2 013) 188 (96) Trading (131) (34) (33) Traditional pension products (129) (55) 16
Other 2) (74) (1 785) 288
Changes in impairment of loans and guaranteesChange Change
Amounts in NOK million 1Q16 4Q15-1Q16 1Q15-1Q16Impairment of loans and guarantees (1 174) 246 (600)
Personal customers 430 415 385 Small and medium-sized enterprises (251) 109 39 Large corporates and international customers (1 356) (277) (1 044) Other 3 (1) 21
1) The transfer of the risk equalision fund to the policyholders' premium reserve reduced results by NOK 883 million in the fourth quarter of 2015.2) In the fourth quarter of 2015 DNB decided to change the Groups pension scheme from a defined-benefit to a defined contribution scheme with effect from31 December 2015. The change includes the majority of its employees in Norway who were members of the Groups closed defined-benefit scheme. The change resulted in an unallocated non-recurring effect on pension expenses of NOK 1 778 million. In the fourth quarter of 2014, a plan amendment was recorded for the pension scheme in the Norwegian Public Service Pension Fund, which reduced costs by NOK 93 million.
- 48 -
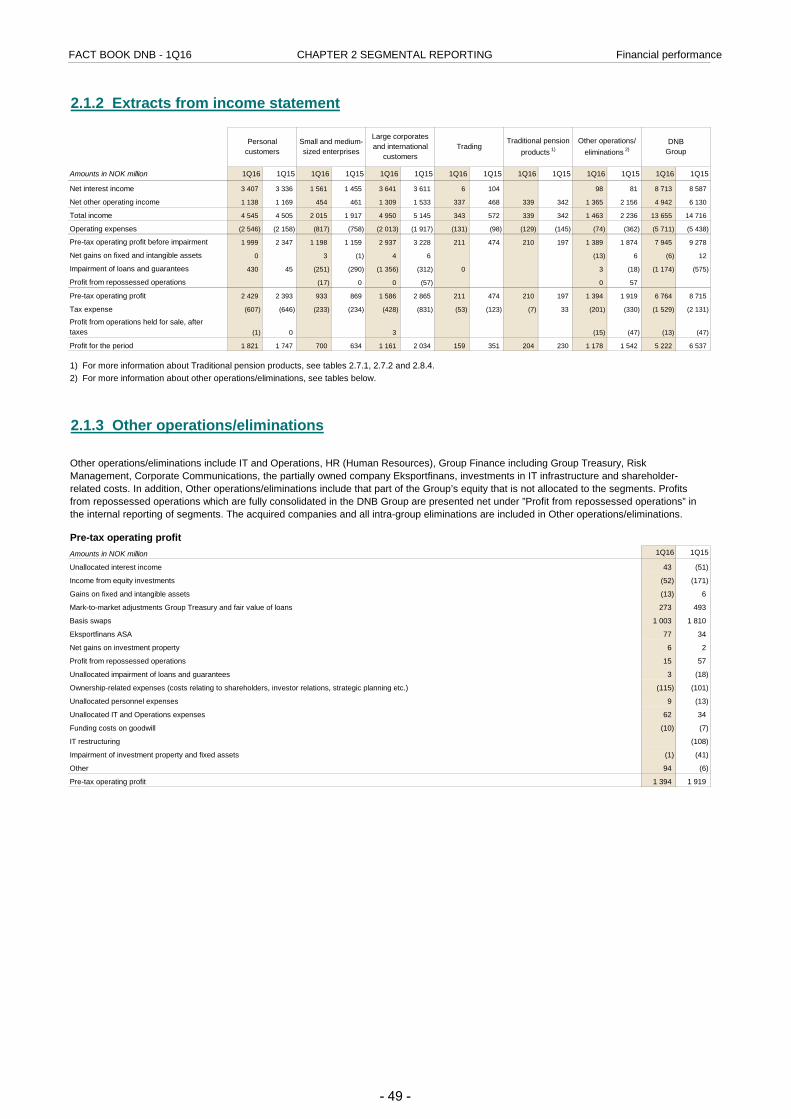
FACT BOOK DNB - 1Q16 CHAPTER 2 SEGMENTAL REPORTING Financial performance
2.1.2 Extracts from income statement
Amounts in NOK million 1Q16 1Q15 1Q16 1Q15 1Q16 1Q15 1Q16 1Q15 1Q16 1Q15 1Q16 1Q15 1Q16 1Q15
Net interest income 3 407 3 336 1 561 1 455 3 641 3 611 6 104 98 81 8 713 8 587
Net other operating income 1 138 1 169 454 461 1 309 1 533 337 468 339 342 1 365 2 156 4 942 6 130
Total income 4 545 4 505 2 015 1 917 4 950 5 145 343 572 339 342 1 463 2 236 13 655 14 716
Operating expenses (2 546) (2 158) (817) (758) (2 013) (1 917) (131) (98) (129) (145) (74) (362) (5 711) (5 438)
Pre-tax operating profit before impairment 1 999 2 347 1 198 1 159 2 937 3 228 211 474 210 197 1 389 1 874 7 945 9 278
Net gains on fixed and intangible assets 0 3 (1) 4 6 (13) 6 (6) 12
Impairment of loans and guarantees 430 45 (251) (290) (1 356) (312) 0 3 (18) (1 174) (575)
Profit from repossessed operations (17) 0 0 (57) 0 57
Pre-tax operating profit 2 429 2 393 933 869 1 586 2 865 211 474 210 197 1 394 1 919 6 764 8 715
Tax expense (607) (646) (233) (234) (428) (831) (53) (123) (7) 33 (201) (330) (1 529) (2 131)
Profit from operations held for sale, after taxes (1) 0 3 (15) (47) (13) (47)
Profit for the period 1 821 1 747 700 634 1 161 2 034 159 351 204 230 1 178 1 542 5 222 6 537
2.1.3 Other operations/eliminations
Pre-tax operating profitAmounts in NOK million 1Q16 1Q15
Unallocated interest income 43 (51)
Income from equity investments (52) (171)
Gains on fixed and intangible assets (13) 6
Mark-to-market adjustments Group Treasury and fair value of loans 273 493
Basis swaps 1 003 1 810
Eksportfinans ASA 77 34
Net gains on investment property 6 2
Profit from repossessed operations 15 57
Unallocated impairment of loans and guarantees 3 (18)
Ownership-related expenses (costs relating to shareholders, investor relations, strategic planning etc.) (115) (101)
Unallocated personnel expenses 9 (13)
Unallocated IT and Operations expenses 62 34
Funding costs on goodwill (10) (7)
IT restructuring (108)
Impairment of investment property and fixed assets (1) (41)
Other 94 (6)
Pre-tax operating profit 1 394 1 919
Personalcustomers
Small and medium-sized enterprises
Large corporates and international
customersTrading
Traditional pension products 1)
DNBGroup
Other operations/ eliminations 2)
1) For more information about Traditional pension products, see tables 2.7.1, 2.7.2 and 2.8.4.
Other operations/eliminations include IT and Operations, HR (Human Resources), Group Finance including Group Treasury, Risk Management, Corporate Communications, the partially owned company Eksportfinans, investments in IT infrastructure and shareholder-related costs. In addition, Other operations/eliminations include that part of the Group’s equity that is not allocated to the segments. Profits from repossessed operations which are fully consolidated in the DNB Group are presented net under ”Profit from repossessed operations” in the internal reporting of segments. The acquired companies and all intra-group eliminations are included in Other operations/eliminations.
2) For more information about other operations/eliminations, see tables below.
- 49 -
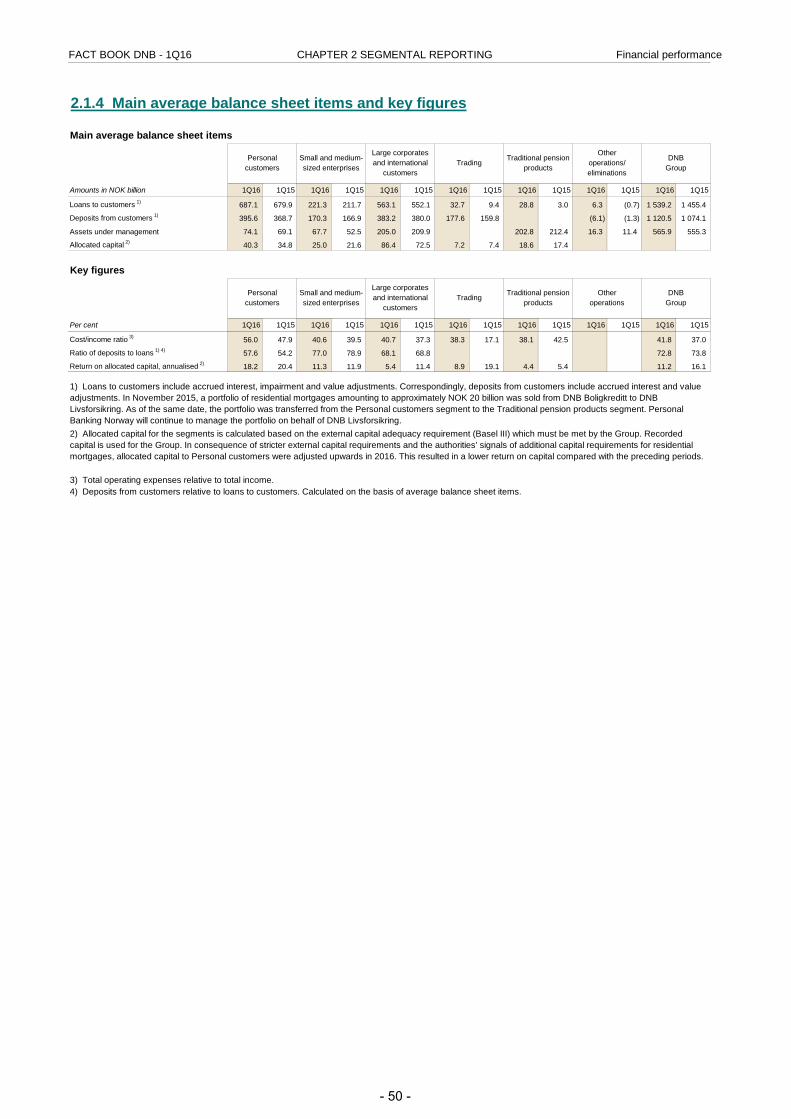
FACT BOOK DNB - 1Q16 CHAPTER 2 SEGMENTAL REPORTING Financial performance
2.1.4 Main average balance sheet items and key figures
Main average balance sheet items
Amounts in NOK billion 1Q16 1Q15 1Q16 1Q15 1Q16 1Q15 1Q16 1Q15 1Q16 1Q15 1Q16 1Q15 1Q16 1Q15
Loans to customers 1) 687.1 679.9 221.3 211.7 563.1 552.1 32.7 9.4 28.8 3.0 6.3 (0.7) 1 539.2 1 455.4
Deposits from customers 1) 395.6 368.7 170.3 166.9 383.2 380.0 177.6 159.8 (6.1) (1.3) 1 120.5 1 074.1
Assets under management 74.1 69.1 67.7 52.5 205.0 209.9 202.8 212.4 16.3 11.4 565.9 555.3
Allocated capital 2) 40.3 34.8 25.0 21.6 86.4 72.5 7.2 7.4 18.6 17.4
Key figures
Per cent 1Q16 1Q15 1Q16 1Q15 1Q16 1Q15 1Q16 1Q15 1Q16 1Q15 1Q16 1Q15 1Q16 1Q15
Cost/income ratio 3) 56.0 47.9 40.6 39.5 40.7 37.3 38.3 17.1 38.1 42.5 41.8 37.0
Ratio of deposits to loans 1) 4) 57.6 54.2 77.0 78.9 68.1 68.8 72.8 73.8
Return on allocated capital, annualised 2) 18.2 20.4 11.3 11.9 5.4 11.4 8.9 19.1 4.4 5.4 11.2 16.1
1) Loans to customers include accrued interest, impairment and value adjustments. Correspondingly, deposits from customers include accrued interest and value adjustments. In November 2015, a portfolio of residential mortgages amounting to approximately NOK 20 billion was sold from DNB Boligkreditt to DNB Livsforsikring. As of the same date, the portfolio was transferred from the Personal customers segment to the Traditional pension products segment. Personal Banking Norway will continue to manage the portfolio on behalf of DNB Livsforsikring.
Otheroperations/eliminations
Trading Traditional pension products
3) Total operating expenses relative to total income.4) Deposits from customers relative to loans to customers. Calculated on the basis of average balance sheet items.
2) Allocated capital for the segments is calculated based on the external capital adequacy requirement (Basel III) which must be met by the Group. Recorded capital is used for the Group. In consequence of stricter external capital requirements and the authorities’ signals of additional capital requirements for residential mortgages, allocated capital to Personal customers were adjusted upwards in 2016. This resulted in a lower return on capital compared with the preceding periods.
DNBGroup
Personalcustomers
Small and medium-sized enterprises
Large corporates and international
customersTrading Traditional pension
productsOther
operationsDNB
Group
Personalcustomers
Small and medium-sized enterprises
Large corporates and international
customers
- 50 -
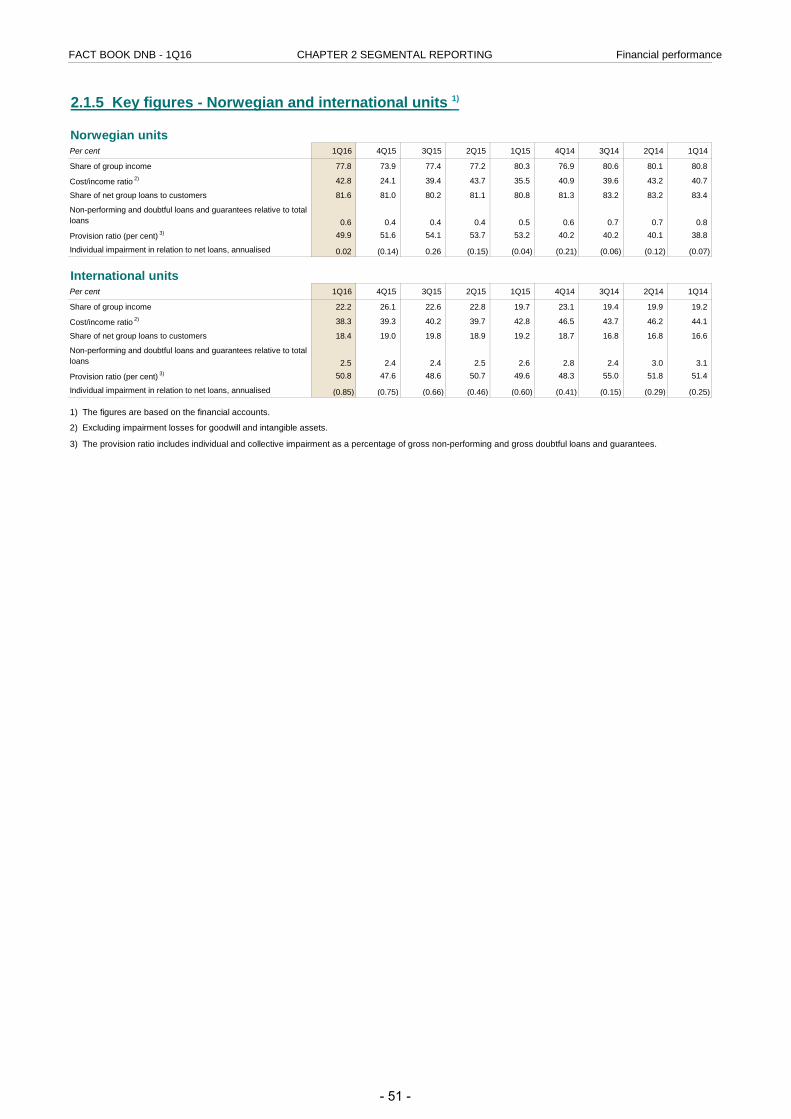
FACT BOOK DNB - 1Q16 CHAPTER 2 SEGMENTAL REPORTING Financial performance
2.1.5 Key figures - Norwegian and international units 1)
Norwegian unitsPer cent 1Q16 4Q15 3Q15 2Q15 1Q15 4Q14 3Q14 2Q14 1Q14
Share of group income 77.8 73.9 77.4 77.2 80.3 76.9 80.6 80.1 80.8
Cost/income ratio 2) 42.8 24.1 39.4 43.7 35.5 40.9 39.6 43.2 40.7
Share of net group loans to customers 81.6 81.0 80.2 81.1 80.8 81.3 83.2 83.2 83.4
Non-performing and doubtful loans and guarantees relative to total loans 0.6 0.4 0.4 0.4 0.5 0.6 0.7 0.7 0.8
Provision ratio (per cent) 3) 49.9 51.6 54.1 53.7 53.2 40.2 40.2 40.1 38.8
Individual impairment in relation to net loans, annualised 0.02 (0.14) 0.26 (0.15) (0.04) (0.21) (0.06) (0.12) (0.07)
International unitsPer cent 1Q16 4Q15 3Q15 2Q15 1Q15 4Q14 3Q14 2Q14 1Q14
Share of group income 22.2 26.1 22.6 22.8 19.7 23.1 19.4 19.9 19.2
Cost/income ratio 2) 38.3 39.3 40.2 39.7 42.8 46.5 43.7 46.2 44.1
Share of net group loans to customers 18.4 19.0 19.8 18.9 19.2 18.7 16.8 16.8 16.6
Non-performing and doubtful loans and guarantees relative to total loans 2.5 2.4 2.4 2.5 2.6 2.8 2.4 3.0 3.1
Provision ratio (per cent) 3) 50.8 47.6 48.6 50.7 49.6 48.3 55.0 51.8 51.4
Individual impairment in relation to net loans, annualised (0.85) (0.75) (0.66) (0.46) (0.60) (0.41) (0.15) (0.29) (0.25)
2) Excluding impairment losses for goodwill and intangible assets.
3) The provision ratio includes individual and collective impairment as a percentage of gross non-performing and gross doubtful loans and guarantees.
1) The figures are based on the financial accounts.
- 51 -
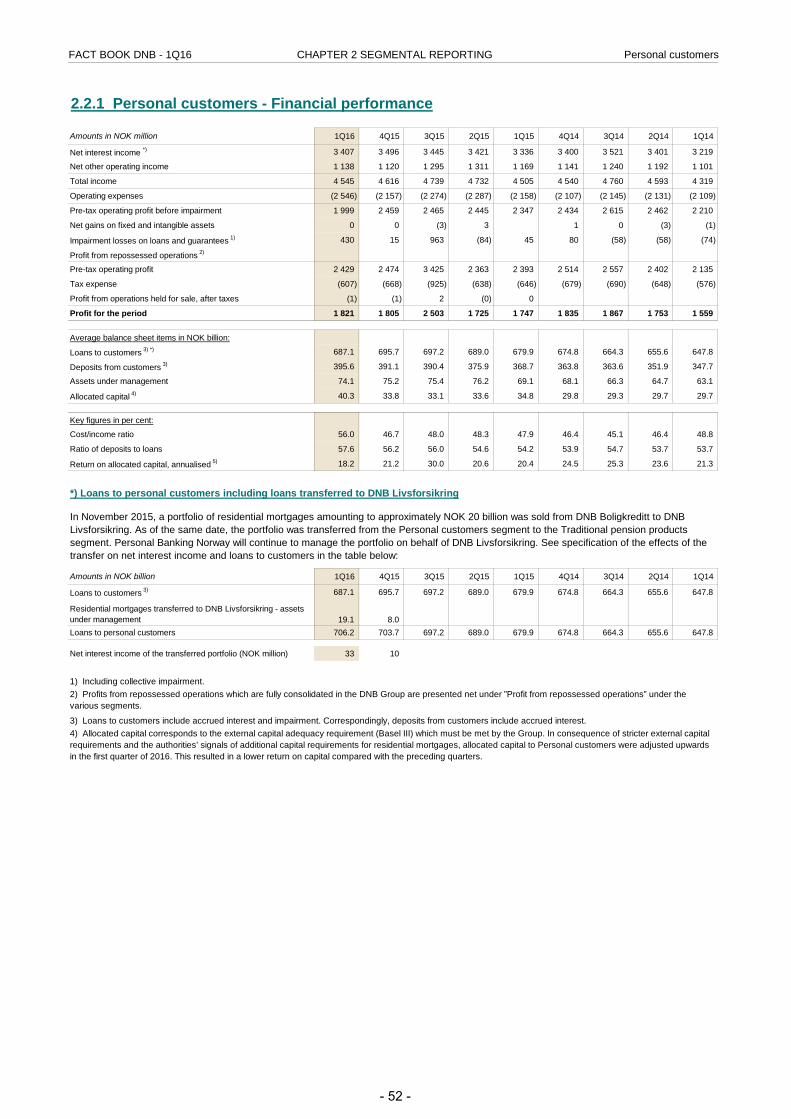
FACT BOOK DNB - 1Q16 CHAPTER 2 SEGMENTAL REPORTING Personal customers
2.2.1 Personal customers - Financial performance
Amounts in NOK million 1Q16 4Q15 3Q15 2Q15 1Q15 4Q14 3Q14 2Q14 1Q14
Net interest income *) 3 407 3 496 3 445 3 421 3 336 3 400 3 521 3 401 3 219
Net other operating income 1 138 1 120 1 295 1 311 1 169 1 141 1 240 1 192 1 101
Total income 4 545 4 616 4 739 4 732 4 505 4 540 4 760 4 593 4 319
Operating expenses (2 546) (2 157) (2 274) (2 287) (2 158) (2 107) (2 145) (2 131) (2 109)
Pre-tax operating profit before impairment 1 999 2 459 2 465 2 445 2 347 2 434 2 615 2 462 2 210
Net gains on fixed and intangible assets 0 0 (3) 3 1 0 (3) (1)
Impairment losses on loans and guarantees 1) 430 15 963 (84) 45 80 (58) (58) (74)
Profit from repossessed operations 2)
Pre-tax operating profit 2 429 2 474 3 425 2 363 2 393 2 514 2 557 2 402 2 135
Tax expense (607) (668) (925) (638) (646) (679) (690) (648) (576)
Profit from operations held for sale, after taxes (1) (1) 2 (0) 0
Profit for the period 1 821 1 805 2 503 1 725 1 747 1 835 1 867 1 753 1 559
Average balance sheet items in NOK billion:
Loans to customers 3) *) 687.1 695.7 697.2 689.0 679.9 674.8 664.3 655.6 647.8
Deposits from customers 3) 395.6 391.1 390.4 375.9 368.7 363.8 363.6 351.9 347.7
Assets under management 74.1 75.2 75.4 76.2 69.1 68.1 66.3 64.7 63.1
Allocated capital 4) 40.3 33.8 33.1 33.6 34.8 29.8 29.3 29.7 29.7
Key figures in per cent:
Cost/income ratio 56.0 46.7 48.0 48.3 47.9 46.4 45.1 46.4 48.8
Ratio of deposits to loans 57.6 56.2 56.0 54.6 54.2 53.9 54.7 53.7 53.7
Return on allocated capital, annualised 5) 18.2 21.2 30.0 20.6 20.4 24.5 25.3 23.6 21.3
*) Loans to personal customers including loans transferred to DNB Livsforsikring
Amounts in NOK billion 1Q16 4Q15 3Q15 2Q15 1Q15 4Q14 3Q14 2Q14 1Q14
Loans to customers 3) 687.1 695.7 697.2 689.0 679.9 674.8 664.3 655.6 647.8
Residential mortgages transferred to DNB Livsforsikring - assets under management 19.1 8.0Loans to personal customers 706.2 703.7 697.2 689.0 679.9 674.8 664.3 655.6 647.8
Net interest income of the transferred portfolio (NOK million) 33 10
In November 2015, a portfolio of residential mortgages amounting to approximately NOK 20 billion was sold from DNB Boligkreditt to DNB Livsforsikring. As of the same date, the portfolio was transferred from the Personal customers segment to the Traditional pension products segment. Personal Banking Norway will continue to manage the portfolio on behalf of DNB Livsforsikring. See specification of the effects of the transfer on net interest income and loans to customers in the table below:
4) Allocated capital corresponds to the external capital adequacy requirement (Basel III) which must be met by the Group. In consequence of stricter external capital requirements and the authorities’ signals of additional capital requirements for residential mortgages, allocated capital to Personal customers were adjusted upwards in the first quarter of 2016. This resulted in a lower return on capital compared with the preceding quarters.
2) Profits from repossessed operations which are fully consolidated in the DNB Group are presented net under ”Profit from repossessed operations” under the various segments.
3) Loans to customers include accrued interest and impairment. Correspondingly, deposits from customers include accrued interest.
1) Including collective impairment.
- 52 -
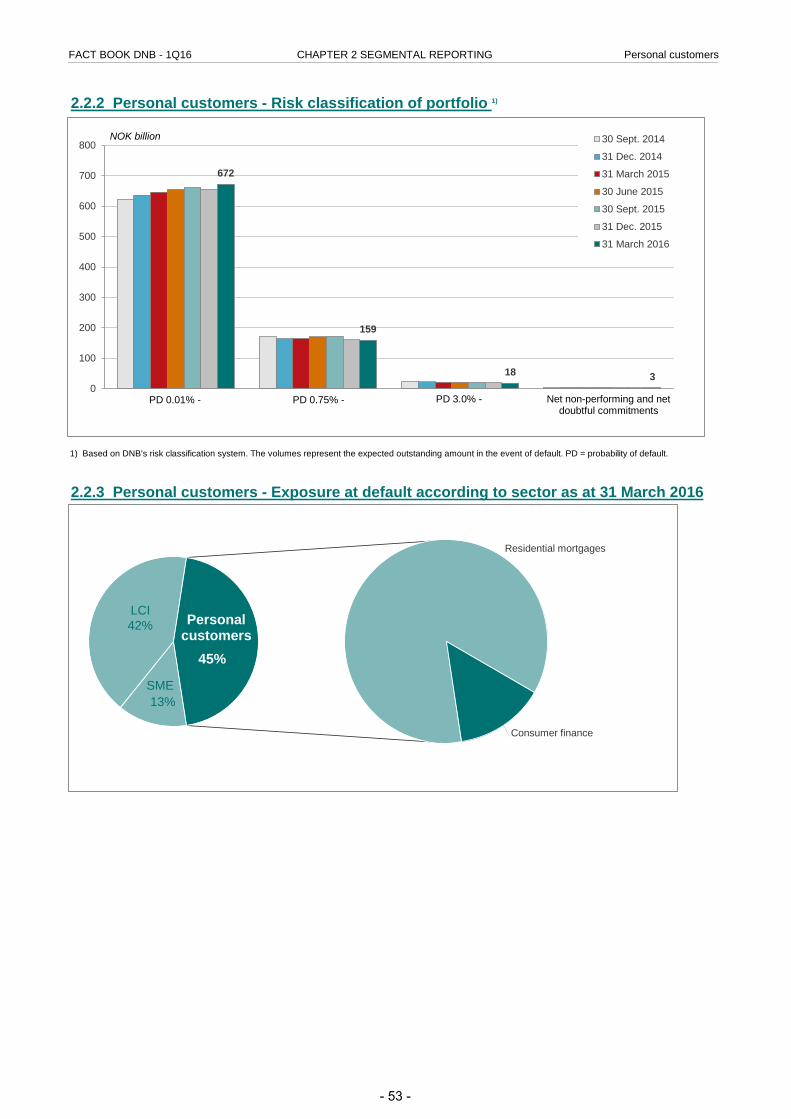
FACT BOOK DNB - 1Q16 CHAPTER 2 SEGMENTAL REPORTING Personal customers
2.2.2 Personal customers - Risk classification of portfolio 1)
2.2.3 Personal customers - Exposure at default according to sector as at 31 March 2016
1) Based on DNB's risk classification system. The volumes represent the expected outstanding amount in the event of default. PD = probability of default.
672
159
18 3 0
100
200
300
400
500
600
700
800 30 Sept. 2014
31 Dec. 2014
31 March 2015
30 June 2015
30 Sept. 2015
31 Dec. 2015
31 March 2016
Net non-performing and net doubtful commitments
NOK billion
PD 0.01% - PD 0.75% - PD 3.0% -
Residential mortgages
Consumer finance
45%
Personal customers
13%
42% LCI
SME
- 53 -
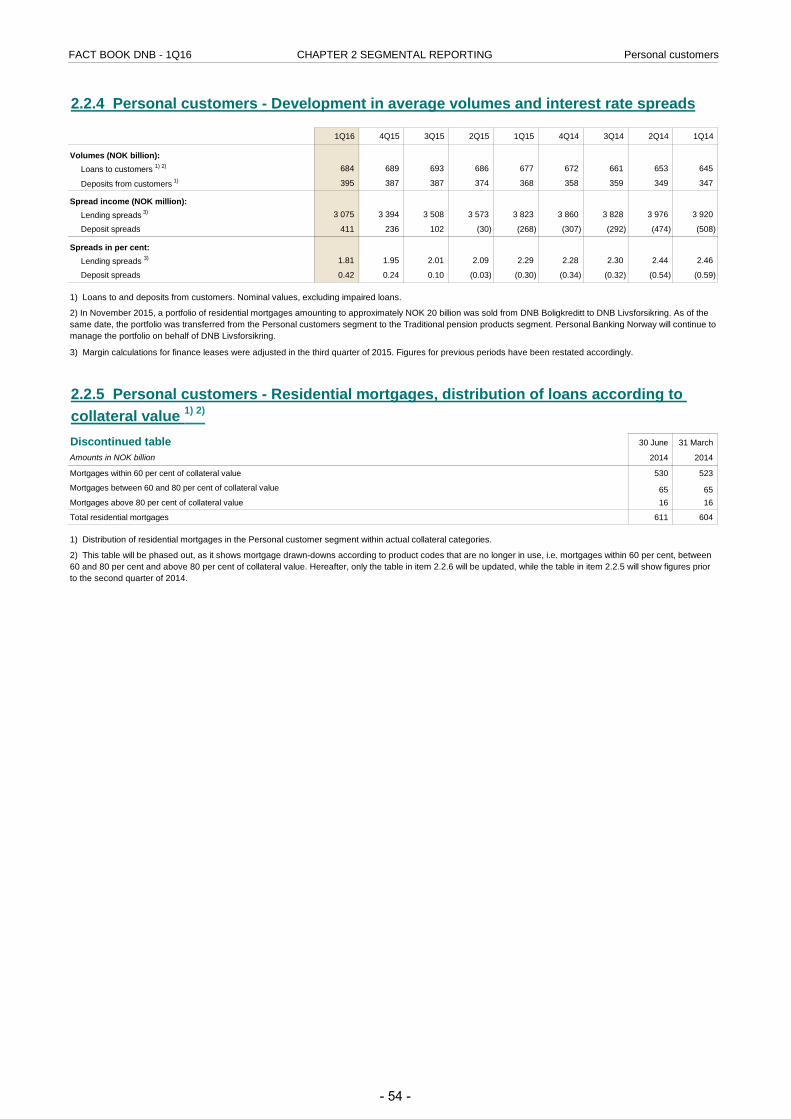
FACT BOOK DNB - 1Q16 CHAPTER 2 SEGMENTAL REPORTING Personal customers
2.2.4 Personal customers - Development in average volumes and interest rate spreads
1Q16 4Q15 3Q15 2Q15 1Q15 4Q14 3Q14 2Q14 1Q14
Volumes (NOK billion):Loans to customers 1) 2) 684 689 693 686 677 672 661 653 645
Deposits from customers 1) 395 387 387 374 368 358 359 349 347
Spread income (NOK million):Lending spreads 3) 3 075 3 394 3 508 3 573 3 823 3 860 3 828 3 976 3 920
Deposit spreads 411 236 102 (30) (268) (307) (292) (474) (508)
Spreads in per cent:Lending spreads 3) 1.81 1.95 2.01 2.09 2.29 2.28 2.30 2.44 2.46
Deposit spreads 0.42 0.24 0.10 (0.03) (0.30) (0.34) (0.32) (0.54) (0.59)
Discontinued table 30 June 31 March
Amounts in NOK billion 2014 2014
Mortgages within 60 per cent of collateral value 530 523
Mortgages between 60 and 80 per cent of collateral value 65 65 Mortgages above 80 per cent of collateral value 16 16
Total residential mortgages 611 604
2) In November 2015, a portfolio of residential mortgages amounting to approximately NOK 20 billion was sold from DNB Boligkreditt to DNB Livsforsikring. As of the same date, the portfolio was transferred from the Personal customers segment to the Traditional pension products segment. Personal Banking Norway will continue to manage the portfolio on behalf of DNB Livsforsikring.
1) Distribution of residential mortgages in the Personal customer segment within actual collateral categories.
2.2.5 Personal customers - Residential mortgages, distribution of loans according to collateral value 1) 2)
1) Loans to and deposits from customers. Nominal values, excluding impaired loans.
2) This table will be phased out, as it shows mortgage drawn-downs according to product codes that are no longer in use, i.e. mortgages within 60 per cent, between 60 and 80 per cent and above 80 per cent of collateral value. Hereafter, only the table in item 2.2.6 will be updated, while the table in item 2.2.5 will show figures prior to the second quarter of 2014.
3) Margin calculations for finance leases were adjusted in the third quarter of 2015. Figures for previous periods have been restated accordingly.
- 54 -
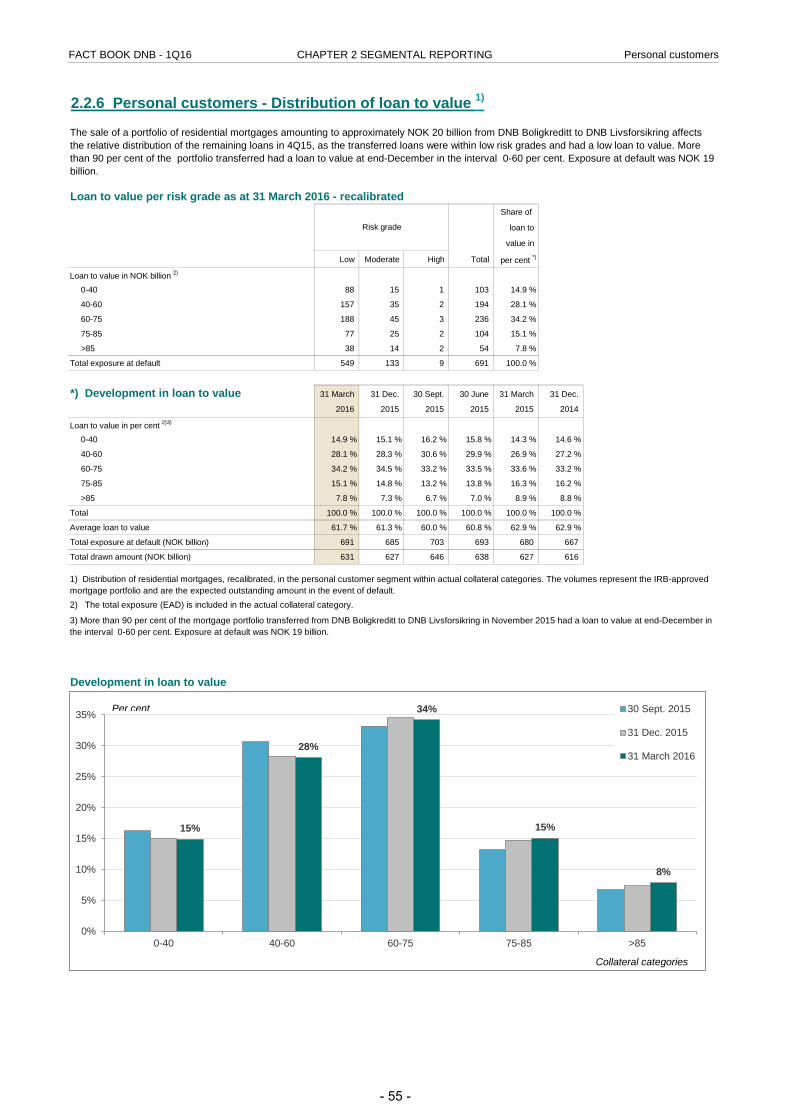
FACT BOOK DNB - 1Q16 CHAPTER 2 SEGMENTAL REPORTING Personal customers
2.2.6 Personal customers - Distribution of loan to value 1)
Loan to value per risk grade as at 31 March 2016 - recalibratedShare of
loan to
value in
Low Moderate High Total per cent *)
Loan to value in NOK billion 2)
0-40 88 15 1 103 14.9 %
40-60 157 35 2 194 28.1 %
60-75 188 45 3 236 34.2 %
75-85 77 25 2 104 15.1 %
>85 38 14 2 54 7.8 %
Total exposure at default 549 133 9 691 100.0 %
31 March 2031 Dec. 201530 Sept. 20130 June 201 31 March 2031 Dec. 2014 30 June 201
*) Development in loan to value 31 March 31 Dec. 30 Sept. 30 June 31 March 31 Dec.
2016 2015 2015 2015 2015 2014
Loan to value in per cent 2)3)
0-40 14.9 % 15.1 % 16.2 % 15.8 % 14.3 % 14.6 %
40-60 28.1 % 28.3 % 30.6 % 29.9 % 26.9 % 27.2 %
60-75 34.2 % 34.5 % 33.2 % 33.5 % 33.6 % 33.2 %
75-85 15.1 % 14.8 % 13.2 % 13.8 % 16.3 % 16.2 %
>85 7.8 % 7.3 % 6.7 % 7.0 % 8.9 % 8.8 %
Total 100.0 % 100.0 % 100.0 % 100.0 % 100.0 % 100.0 %
Average loan to value 61.7 % 61.3 % 60.0 % 60.8 % 62.9 % 62.9 %
Total exposure at default (NOK billion) 691 685 703 693 680 667
Total drawn amount (NOK billion) 631 627 646 638 627 616
Development in loan to value
1) Distribution of residential mortgages, recalibrated, in the personal customer segment within actual collateral categories. The volumes represent the IRB-approved mortgage portfolio and are the expected outstanding amount in the event of default.2) The total exposure (EAD) is included in the actual collateral category.
Risk grade
3) More than 90 per cent of the mortgage portfolio transferred from DNB Boligkreditt to DNB Livsforsikring in November 2015 had a loan to value at end-December in the interval 0-60 per cent. Exposure at default was NOK 19 billion.
The sale of a portfolio of residential mortgages amounting to approximately NOK 20 billion from DNB Boligkreditt to DNB Livsforsikring affects the relative distribution of the remaining loans in 4Q15, as the transferred loans were within low risk grades and had a low loan to value. More than 90 per cent of the portfolio transferred had a loan to value at end-December in the interval 0-60 per cent. Exposure at default was NOK 19 billion.
15%
28%
34%
15%
8%
0%
5%
10%
15%
20%
25%
30%
35%
0-40 40-60 60-75 75-85 >85
30 Sept. 2015
31 Dec. 2015
31 March 2016
Per cent
Collateral categories
- 55 -
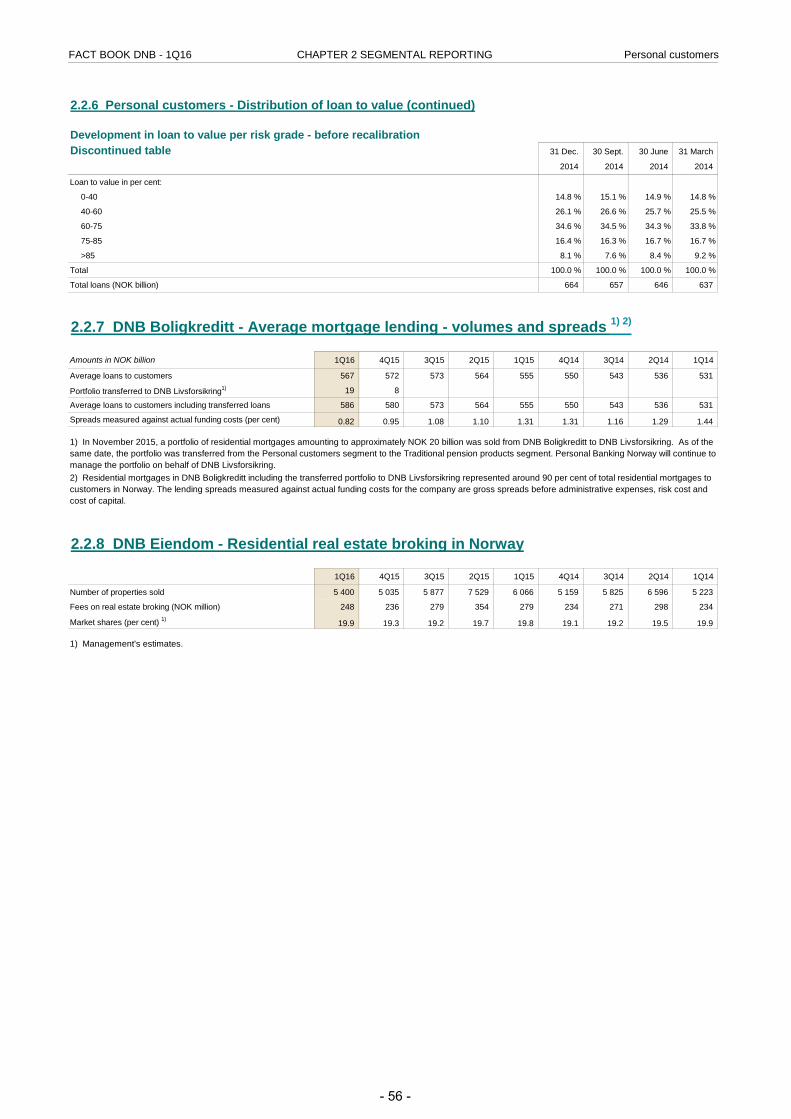
FACT BOOK DNB - 1Q16 CHAPTER 2 SEGMENTAL REPORTING Personal customers
2.2.6 Personal customers - Distribution of loan to value (continued)
Discontinued table 31 Dec. 30 Sept. 30 June 31 March
2014 2014 2014 2014
Loan to value in per cent:
0-40 14.8 % 15.1 % 14.9 % 14.8 %
40-60 26.1 % 26.6 % 25.7 % 25.5 %
60-75 34.6 % 34.5 % 34.3 % 33.8 %
75-85 16.4 % 16.3 % 16.7 % 16.7 %
>85 8.1 % 7.6 % 8.4 % 9.2 %
Total 100.0 % 100.0 % 100.0 % 100.0 %
Total loans (NOK billion) 664 657 646 637
2.2.7 DNB Boligkreditt - Average mortgage lending - volumes and spreads 1) 2)
Amounts in NOK billion 1Q16 4Q15 3Q15 2Q15 1Q15 4Q14 3Q14 2Q14 1Q14
Average loans to customers 567 572 573 564 555 550 543 536 531
Portfolio transferred to DNB Livsforsikring1) 19 8
Average loans to customers including transferred loans 586 580 573 564 555 550 543 536 531
Spreads measured against actual funding costs (per cent) 0.82 0.95 1.08 1.10 1.31 1.31 1.16 1.29 1.44
2.2.8 DNB Eiendom - Residential real estate broking in Norway
1Q16 4Q15 3Q15 2Q15 1Q15 4Q14 3Q14 2Q14 1Q14
Number of properties sold 5 400 5 035 5 877 7 529 6 066 5 159 5 825 6 596 5 223
Fees on real estate broking (NOK million) 248 236 279 354 279 234 271 298 234
Market shares (per cent) 1) 19.9 19.3 19.2 19.7 19.8 19.1 19.2 19.5 19.9
1) Management's estimates.
2) Residential mortgages in DNB Boligkreditt including the transferred portfolio to DNB Livsforsikring represented around 90 per cent of total residential mortgages to customers in Norway. The lending spreads measured against actual funding costs for the company are gross spreads before administrative expenses, risk cost and cost of capital.
1) In November 2015, a portfolio of residential mortgages amounting to approximately NOK 20 billion was sold from DNB Boligkreditt to DNB Livsforsikring. As of the same date, the portfolio was transferred from the Personal customers segment to the Traditional pension products segment. Personal Banking Norway will continue to manage the portfolio on behalf of DNB Livsforsikring.
Development in loan to value per risk grade - before recalibration
- 56 -
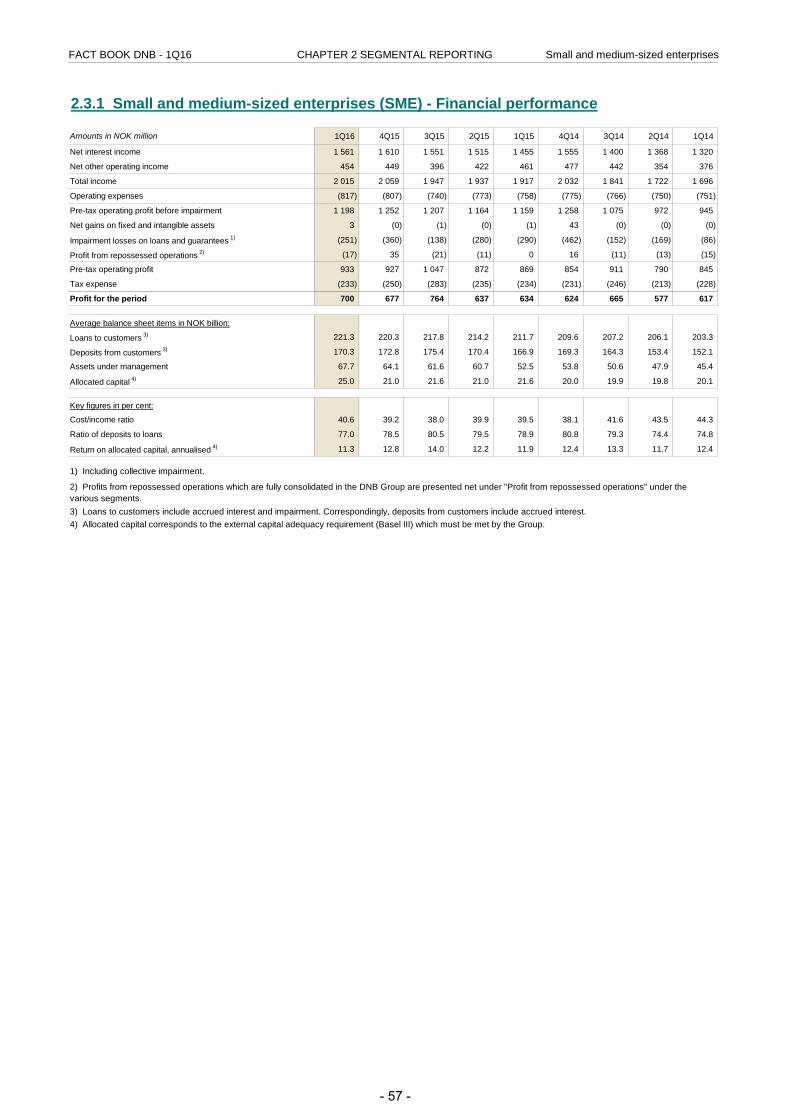
FACT BOOK DNB - 1Q16 CHAPTER 2 SEGMENTAL REPORTING Small and medium-sized enterprises
2.3.1 Small and medium-sized enterprises (SME) - Financial performance
Amounts in NOK million 1Q16 4Q15 3Q15 2Q15 1Q15 4Q14 3Q14 2Q14 1Q14
Net interest income 1 561 1 610 1 551 1 515 1 455 1 555 1 400 1 368 1 320
Net other operating income 454 449 396 422 461 477 442 354 376
Total income 2 015 2 059 1 947 1 937 1 917 2 032 1 841 1 722 1 696
Operating expenses (817) (807) (740) (773) (758) (775) (766) (750) (751)
Pre-tax operating profit before impairment 1 198 1 252 1 207 1 164 1 159 1 258 1 075 972 945
Net gains on fixed and intangible assets 3 (0) (1) (0) (1) 43 (0) (0) (0)
Impairment losses on loans and guarantees 1) (251) (360) (138) (280) (290) (462) (152) (169) (86)
Profit from repossessed operations 2) (17) 35 (21) (11) 0 16 (11) (13) (15)
Pre-tax operating profit 933 927 1 047 872 869 854 911 790 845
Tax expense (233) (250) (283) (235) (234) (231) (246) (213) (228)
Profit for the period 700 677 764 637 634 624 665 577 617
Average balance sheet items in NOK billion:
Loans to customers 3) 221.3 220.3 217.8 214.2 211.7 209.6 207.2 206.1 203.3
Deposits from customers 3) 170.3 172.8 175.4 170.4 166.9 169.3 164.3 153.4 152.1
Assets under management 67.7 64.1 61.6 60.7 52.5 53.8 50.6 47.9 45.4
Allocated capital 4) 25.0 21.0 21.6 21.0 21.6 20.0 19.9 19.8 20.1
Key figures in per cent:
Cost/income ratio 40.6 39.2 38.0 39.9 39.5 38.1 41.6 43.5 44.3
Ratio of deposits to loans 77.0 78.5 80.5 79.5 78.9 80.8 79.3 74.4 74.8
Return on allocated capital, annualised 4) 11.3 12.8 14.0 12.2 11.9 12.4 13.3 11.7 12.4
4) Allocated capital corresponds to the external capital adequacy requirement (Basel III) which must be met by the Group.
1) Including collective impairment.
2) Profits from repossessed operations which are fully consolidated in the DNB Group are presented net under "Profit from repossessed operations" under the various segments.3) Loans to customers include accrued interest and impairment. Correspondingly, deposits from customers include accrued interest.
- 57 -
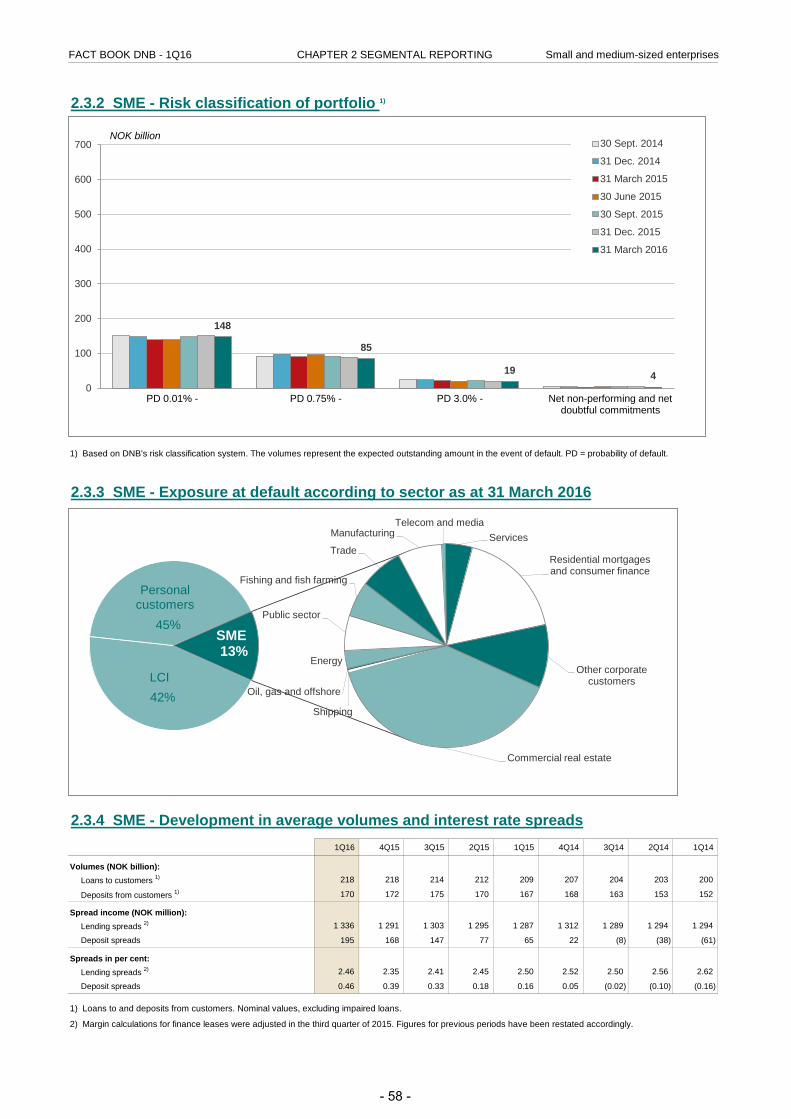
FACT BOOK DNB - 1Q16 CHAPTER 2 SEGMENTAL REPORTING Small and medium-sized enterprises
2.3.2 SME - Risk classification of portfolio 1)
2.3.3 SME - Exposure at default according to sector as at 31 March 2016
2.3.4 SME - Development in average volumes and interest rate spreads1Q16 4Q15 3Q15 2Q15 1Q15 4Q14 3Q14 2Q14 1Q14
Volumes (NOK billion):Loans to customers 1) 218 218 214 212 209 207 204 203 200
Deposits from customers 1) 170 172 175 170 167 168 163 153 152
Spread income (NOK million):Lending spreads 2) 1 336 1 291 1 303 1 295 1 287 1 312 1 289 1 294 1 294
Deposit spreads 195 168 147 77 65 22 (8) (38) (61)
Spreads in per cent:Lending spreads 2) 2.46 2.35 2.41 2.45 2.50 2.52 2.50 2.56 2.62
Deposit spreads 0.46 0.39 0.33 0.18 0.16 0.05 (0.02) (0.10) (0.16)
2) Margin calculations for finance leases were adjusted in the third quarter of 2015. Figures for previous periods have been restated accordingly.
1) Loans to and deposits from customers. Nominal values, excluding impaired loans.
1) Based on DNB's risk classification system. The volumes represent the expected outstanding amount in the event of default. PD = probability of default.
148
85
19 4 0
100
200
300
400
500
600
700 30 Sept. 2014
31 Dec. 2014
31 March 2015
30 June 2015
30 Sept. 2015
31 Dec. 2015
31 March 2016
Net non-performing and net doubtful commitments
NOK billion
PD 0.01% - PD 0.75% - PD 3.0% -
Commercial real estate
Shipping
Oil, gas and offshore
Energy
Public sector
Fishing and fish farming
Trade
Manufacturing Telecom and media
Services
Residential mortgages and consumer finance
Other corporate customers
45%
Personal customers
13%
42% LCI
SME
- 58 -
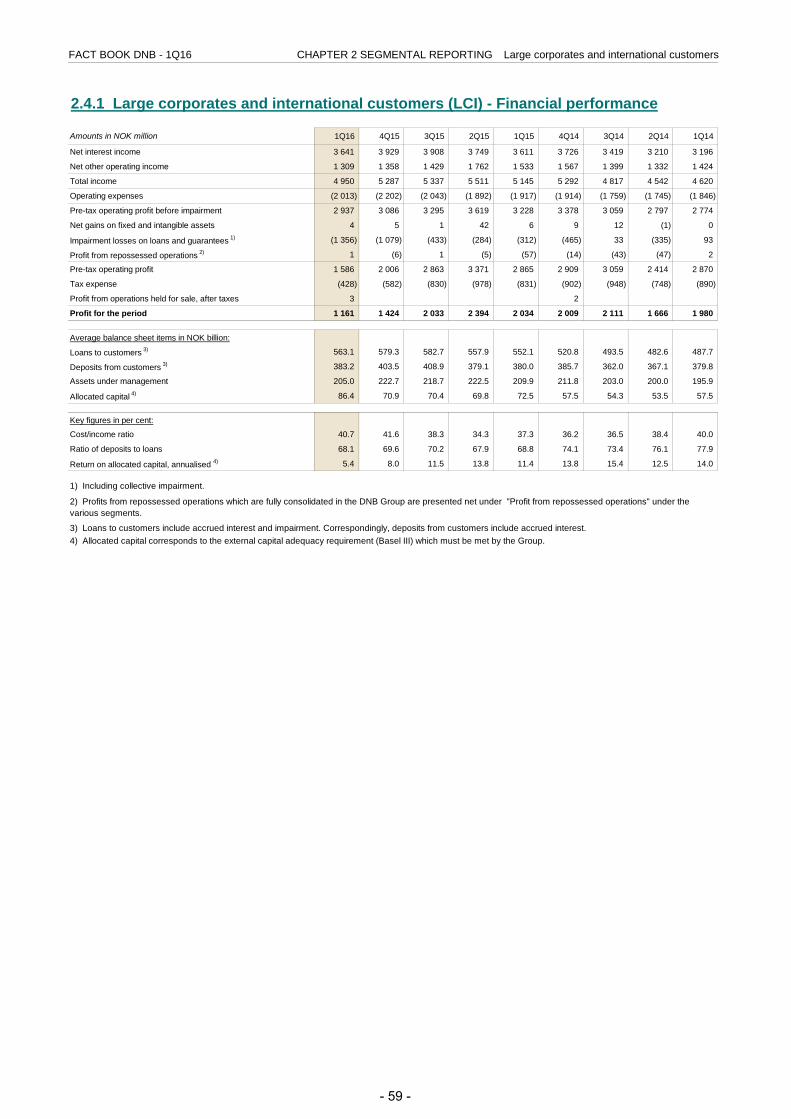
FACT BOOK DNB - 1Q16 CHAPTER 2 SEGMENTAL REPORTING Large corporates and international customers
2.4.1 Large corporates and international customers (LCI) - Financial performance
Amounts in NOK million 1Q16 4Q15 3Q15 2Q15 1Q15 4Q14 3Q14 2Q14 1Q14
Net interest income 3 641 3 929 3 908 3 749 3 611 3 726 3 419 3 210 3 196
Net other operating income 1 309 1 358 1 429 1 762 1 533 1 567 1 399 1 332 1 424
Total income 4 950 5 287 5 337 5 511 5 145 5 292 4 817 4 542 4 620
Operating expenses (2 013) (2 202) (2 043) (1 892) (1 917) (1 914) (1 759) (1 745) (1 846)
Pre-tax operating profit before impairment 2 937 3 086 3 295 3 619 3 228 3 378 3 059 2 797 2 774
Net gains on fixed and intangible assets 4 5 1 42 6 9 12 (1) 0
Impairment losses on loans and guarantees 1) (1 356) (1 079) (433) (284) (312) (465) 33 (335) 93
Profit from repossessed operations 2) 1 (6) 1 (5) (57) (14) (43) (47) 2
Pre-tax operating profit 1 586 2 006 2 863 3 371 2 865 2 909 3 059 2 414 2 870
Tax expense (428) (582) (830) (978) (831) (902) (948) (748) (890)
Profit from operations held for sale, after taxes 3 2
Profit for the period 1 161 1 424 2 033 2 394 2 034 2 009 2 111 1 666 1 980
Average balance sheet items in NOK billion:
Loans to customers 3) 563.1 579.3 582.7 557.9 552.1 520.8 493.5 482.6 487.7
Deposits from customers 3) 383.2 403.5 408.9 379.1 380.0 385.7 362.0 367.1 379.8
Assets under management 205.0 222.7 218.7 222.5 209.9 211.8 203.0 200.0 195.9
Allocated capital 4) 86.4 70.9 70.4 69.8 72.5 57.5 54.3 53.5 57.5
Key figures in per cent:
Cost/income ratio 40.7 41.6 38.3 34.3 37.3 36.2 36.5 38.4 40.0
Ratio of deposits to loans 68.1 69.6 70.2 67.9 68.8 74.1 73.4 76.1 77.9
Return on allocated capital, annualised 4) 5.4 8.0 11.5 13.8 11.4 13.8 15.4 12.5 14.0
4) Allocated capital corresponds to the external capital adequacy requirement (Basel III) which must be met by the Group.
1) Including collective impairment.
2) Profits from repossessed operations which are fully consolidated in the DNB Group are presented net under "Profit from repossessed operations" under the various segments.
3) Loans to customers include accrued interest and impairment. Correspondingly, deposits from customers include accrued interest.
- 59 -
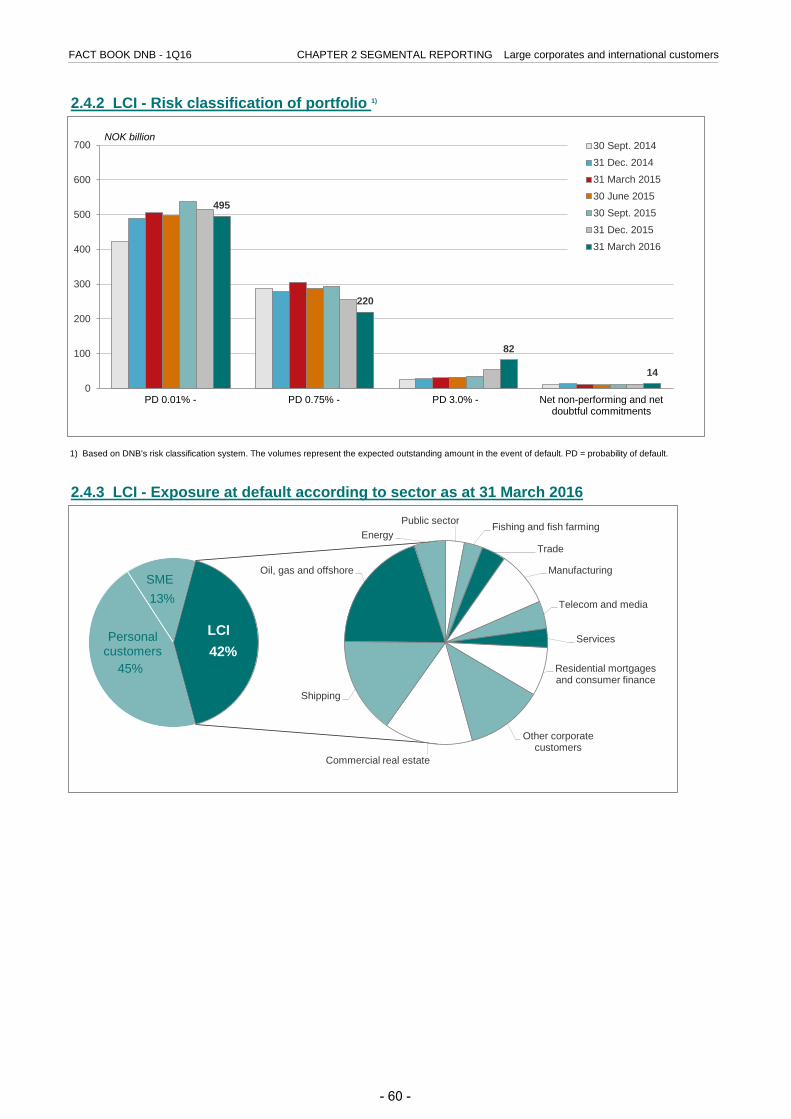
FACT BOOK DNB - 1Q16 CHAPTER 2 SEGMENTAL REPORTING Large corporates and international customers
2.4.2 LCI - Risk classification of portfolio 1)
2.4.3 LCI - Exposure at default according to sector as at 31 March 2016
1) Based on DNB's risk classification system. The volumes represent the expected outstanding amount in the event of default. PD = probability of default.
495
220
82
14 0
100
200
300
400
500
600
700 30 Sept. 201431 Dec. 201431 March 201530 June 201530 Sept. 201531 Dec. 201531 March 2016
Net non-performing and net doubtful commitments
NOK billion
PD 0.01% - PD 0.75% - PD 3.0% -
Commercial real estate
Shipping
Oil, gas and offshore
Energy Public sector Fishing and fish farming
Trade
Manufacturing
Telecom and media
Services
Residential mortgages and consumer finance
Other corporate customers
45%
Personal customers
13%
42% LCI
SME
- 60 -
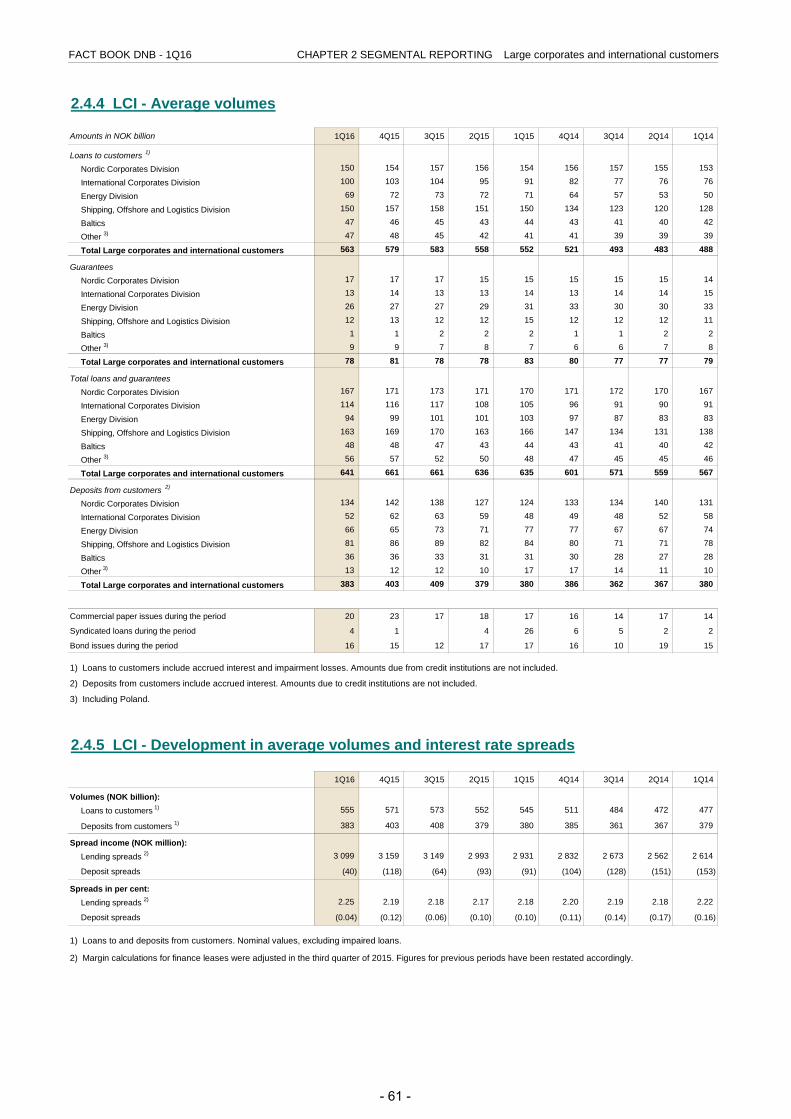
FACT BOOK DNB - 1Q16 CHAPTER 2 SEGMENTAL REPORTING Large corporates and international customers
2.4.4 LCI - Average volumes
Amounts in NOK billion 1Q16 4Q15 3Q15 2Q15 1Q15 4Q14 3Q14 2Q14 1Q14
Loans to customers 1)
Nordic Corporates Division 150 154 157 156 154 156 157 155 153
International Corporates Division 100 103 104 95 91 82 77 76 76
Energy Division 69 72 73 72 71 64 57 53 50
Shipping, Offshore and Logistics Division 150 157 158 151 150 134 123 120 128
Baltics 47 46 45 43 44 43 41 40 42
Other 3) 47 48 45 42 41 41 39 39 39
Total Large corporates and international customers 563 579 583 558 552 521 493 483 488
GuaranteesNordic Corporates Division 17 17 17 15 15 15 15 15 14
International Corporates Division 13 14 13 13 14 13 14 14 15
Energy Division 26 27 27 29 31 33 30 30 33
Shipping, Offshore and Logistics Division 12 13 12 12 15 12 12 12 11
Baltics 1 1 2 2 2 1 1 2 2
Other 3) 9 9 7 8 7 6 6 7 8
Total Large corporates and international customers 78 81 78 78 83 80 77 77 79
Total loans and guaranteesNordic Corporates Division 167 171 173 171 170 171 172 170 167
International Corporates Division 114 116 117 108 105 96 91 90 91
Energy Division 94 99 101 101 103 97 87 83 83
Shipping, Offshore and Logistics Division 163 169 170 163 166 147 134 131 138
Baltics 48 48 47 43 44 43 41 40 42
Other 3) 56 57 52 50 48 47 45 45 46
Total Large corporates and international customers 641 661 661 636 635 601 571 559 567
Deposits from customers 2)
Nordic Corporates Division 134 142 138 127 124 133 134 140 131
International Corporates Division 52 62 63 59 48 49 48 52 58
Energy Division 66 65 73 71 77 77 67 67 74
Shipping, Offshore and Logistics Division 81 86 89 82 84 80 71 71 78
Baltics 36 36 33 31 31 30 28 27 28
Other 3) 13 12 12 10 17 17 14 11 10
Total Large corporates and international customers 383 403 409 379 380 386 362 367 380
Commercial paper issues during the period 20 23 17 18 17 16 14 17 14
Syndicated loans during the period 4 1 4 26 6 5 2 2
Bond issues during the period 16 15 12 17 17 16 10 19 15
2.4.5 LCI - Development in average volumes and interest rate spreads
1Q16 4Q15 3Q15 2Q15 1Q15 4Q14 3Q14 2Q14 1Q14
Volumes (NOK billion):Loans to customers 1) 555 571 573 552 545 511 484 472 477
Deposits from customers 1) 383 403 408 379 380 385 361 367 379
Spread income (NOK million):Lending spreads 2) 3 099 3 159 3 149 2 993 2 931 2 832 2 673 2 562 2 614
Deposit spreads (40) (118) (64) (93) (91) (104) (128) (151) (153)
Spreads in per cent:Lending spreads 2) 2.25 2.19 2.18 2.17 2.18 2.20 2.19 2.18 2.22
Deposit spreads (0.04) (0.12) (0.06) (0.10) (0.10) (0.11) (0.14) (0.17) (0.16)
1) Loans to and deposits from customers. Nominal values, excluding impaired loans.
2) Margin calculations for finance leases were adjusted in the third quarter of 2015. Figures for previous periods have been restated accordingly.
3) Including Poland.
1) Loans to customers include accrued interest and impairment losses. Amounts due from credit institutions are not included.
2) Deposits from customers include accrued interest. Amounts due to credit institutions are not included.
- 61 -
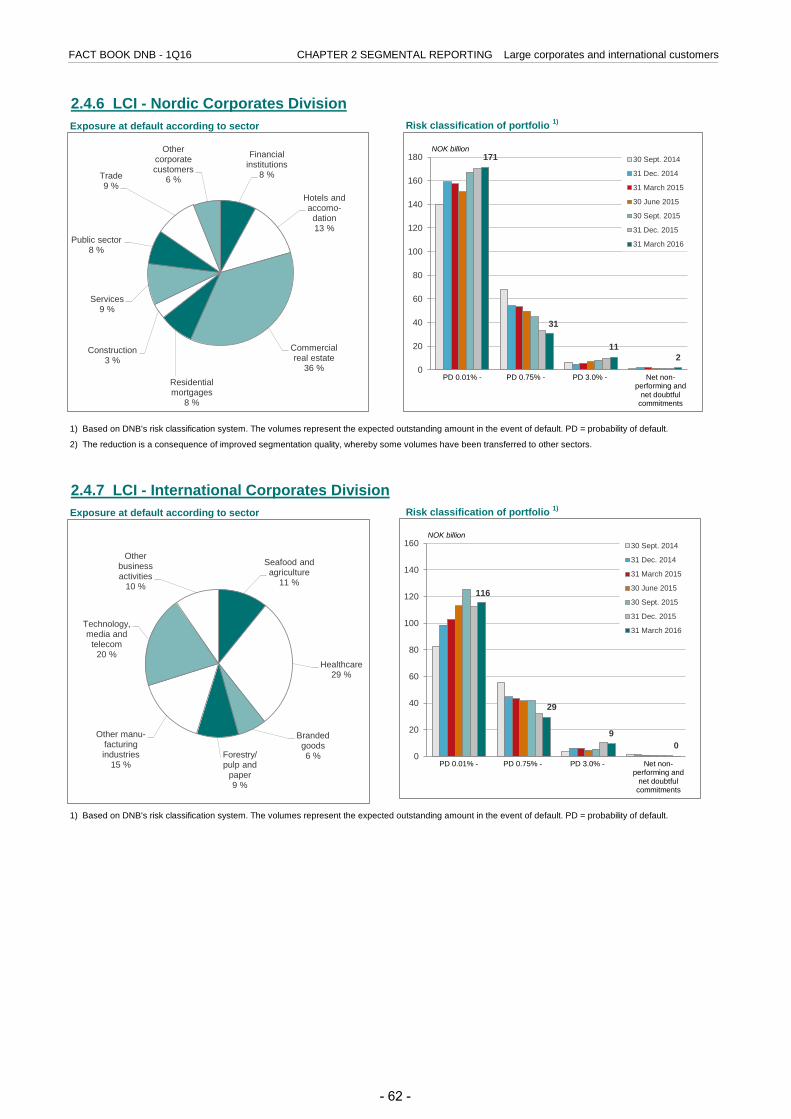
FACT BOOK DNB - 1Q16 CHAPTER 2 SEGMENTAL REPORTING Large corporates and international customers
2.4.6 LCI - Nordic Corporates DivisionExposure at default according to sector Risk classification of portfolio 1)
2.4.7 LCI - International Corporates DivisionExposure at default according to sector Risk classification of portfolio 1)
1) Based on DNB's risk classification system. The volumes represent the expected outstanding amount in the event of default. PD = probability of default.
1) Based on DNB's risk classification system. The volumes represent the expected outstanding amount in the event of default. PD = probability of default.
2) The reduction is a consequence of improved segmentation quality, whereby some volumes have been transferred to other sectors.
Financial institutions
8 %
Hotels and accomo-
dation 13 %
Commercial real estate
36 % Residential mortgages
8 %
Construction 3 %
Services 9 %
Public sector 8 %
Trade 9 %
Other corporate customers
6 %
171
31
11 2
0
20
40
60
80
100
120
140
160
180 30 Sept. 2014
31 Dec. 2014
31 March 2015
30 June 2015
30 Sept. 2015
31 Dec. 2015
31 March 2016
Net non-performing and
net doubtful commitments
NOK billion
PD 0.01% - PD 0.75% - PD 3.0% -
Seafood and agriculture
11 %
Healthcare 29 %
Branded goods 6 % Forestry/
pulp and paper 9 %
Other manu-facturing industries
15 %
Technology, media and
telecom 20 %
Other business activities
10 % 116
29
9 0
0
20
40
60
80
100
120
140
160 30 Sept. 2014
31 Dec. 2014
31 March 2015
30 June 2015
30 Sept. 2015
31 Dec. 2015
31 March 2016
Net non-performing and
net doubtful commitments
NOK billion
PD 0.01% - PD 0.75% - PD 3.0% -
- 62 -
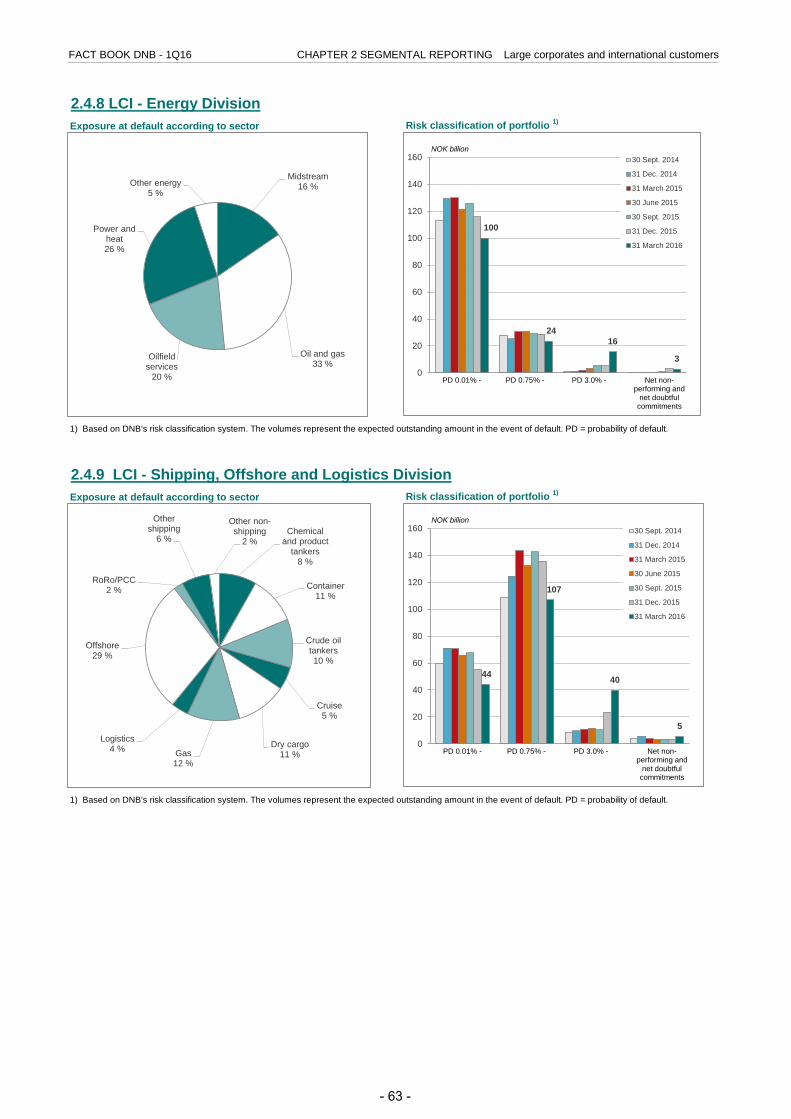
FACT BOOK DNB - 1Q16 CHAPTER 2 SEGMENTAL REPORTING Large corporates and international customers
2.4.8 LCI - Energy DivisionExposure at default according to sector Risk classification of portfolio 1)
2.4.9 LCI - Shipping, Offshore and Logistics DivisionExposure at default according to sector Risk classification of portfolio 1)
1) Based on DNB's risk classification system. The volumes represent the expected outstanding amount in the event of default. PD = probability of default.
1) Based on DNB's risk classification system. The volumes represent the expected outstanding amount in the event of default. PD = probability of default.
Midstream 16 %
Oil and gas 33 %
Oilfield services
20 %
Power and heat 26 %
Other energy 5 %
100
24 16
3 0
20
40
60
80
100
120
140
160 30 Sept. 2014
31 Dec. 2014
31 March 2015
30 June 2015
30 Sept. 2015
31 Dec. 2015
31 March 2016
Net non-performing and
net doubtful commitments
NOK billion
PD 0.01% - PD 0.75% - PD 3.0% -
Chemical and product
tankers 8 %
Container 11 %
Crude oil tankers 10 %
Cruise 5 %
Dry cargo 11 % Gas
12 %
Logistics 4 %
Offshore 29 %
RoRo/PCC 2 %
Other shipping
6 %
Other non-shipping
2 %
44
107
40
5
0
20
40
60
80
100
120
140
160 30 Sept. 2014
31 Dec. 2014
31 March 2015
30 June 2015
30 Sept. 2015
31 Dec. 2015
31 March 2016
Net non-performing and
net doubtful commitments
NOK billion
PD 0.01% - PD 0.75% - PD 3.0% -
- 63 -
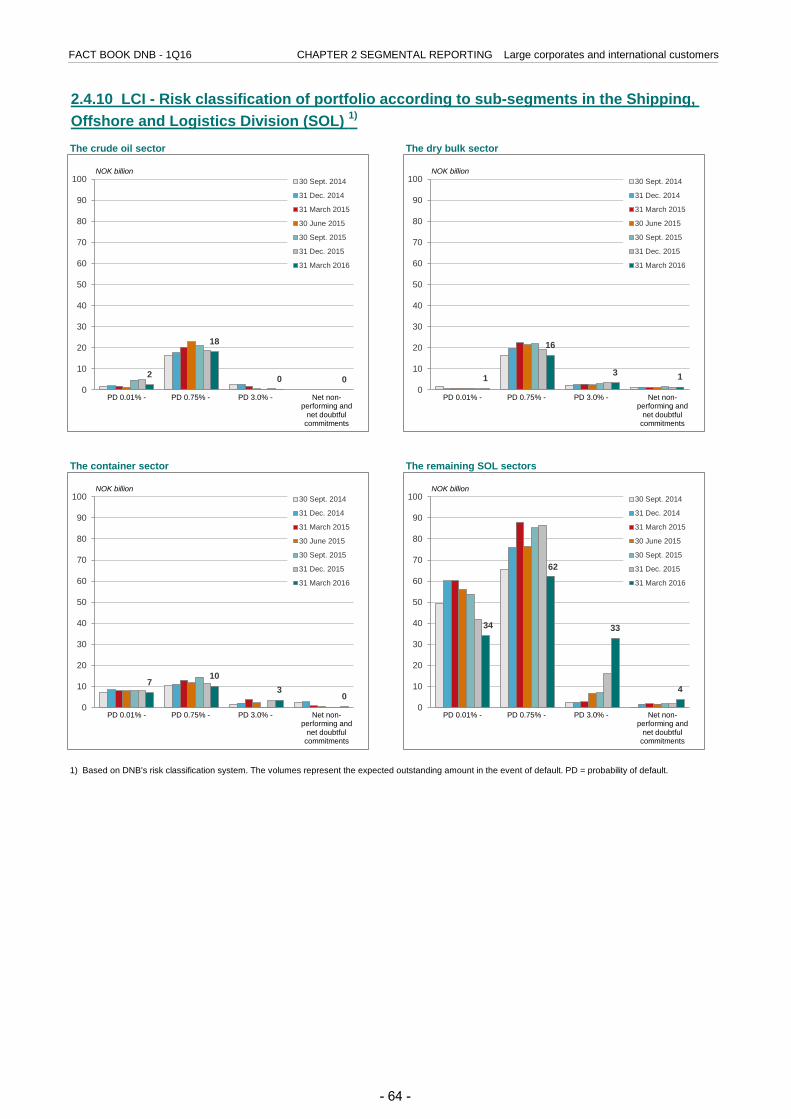
FACT BOOK DNB - 1Q16 CHAPTER 2 SEGMENTAL REPORTING Large corporates and international customers
The crude oil sector The dry bulk sector
The container sector The remaining SOL sectors
1) Based on DNB's risk classification system. The volumes represent the expected outstanding amount in the event of default. PD = probability of default.
2.4.10 LCI - Risk classification of portfolio according to sub-segments in the Shipping, Offshore and Logistics Division (SOL) 1)
2
18
0 0 0
10
20
30
40
50
60
70
80
90
100 30 Sept. 2014
31 Dec. 2014
31 March 2015
30 June 2015
30 Sept. 2015
31 Dec. 2015
31 March 2016
Net non-performing and
net doubtful commitments
NOK billion
PD 0.01% - PD 0.75% - PD 3.0% -
1
16
3 1 0
10
20
30
40
50
60
70
80
90
100 30 Sept. 2014
31 Dec. 2014
31 March 2015
30 June 2015
30 Sept. 2015
31 Dec. 2015
31 March 2016
Net non-performing and
net doubtful commitments
NOK billion
PD 0.01% - PD 0.75% - PD 3.0% -
7 10
3 0
0
10
20
30
40
50
60
70
80
90
100 30 Sept. 2014
31 Dec. 2014
31 March 2015
30 June 2015
30 Sept. 2015
31 Dec. 2015
31 March 2016
Net non-performing and
net doubtful commitments
NOK billion
PD 0.01% - PD 0.75% - PD 3.0% -
34
62
33
4
0
10
20
30
40
50
60
70
80
90
100 30 Sept. 2014
31 Dec. 2014
31 March 2015
30 June 2015
30 Sept. 2015
31 Dec. 2015
31 March 2016
Net non-performing and
net doubtful commitments
NOK billion
PD 0.01% - PD 0.75% - PD 3.0% -
- 64 -
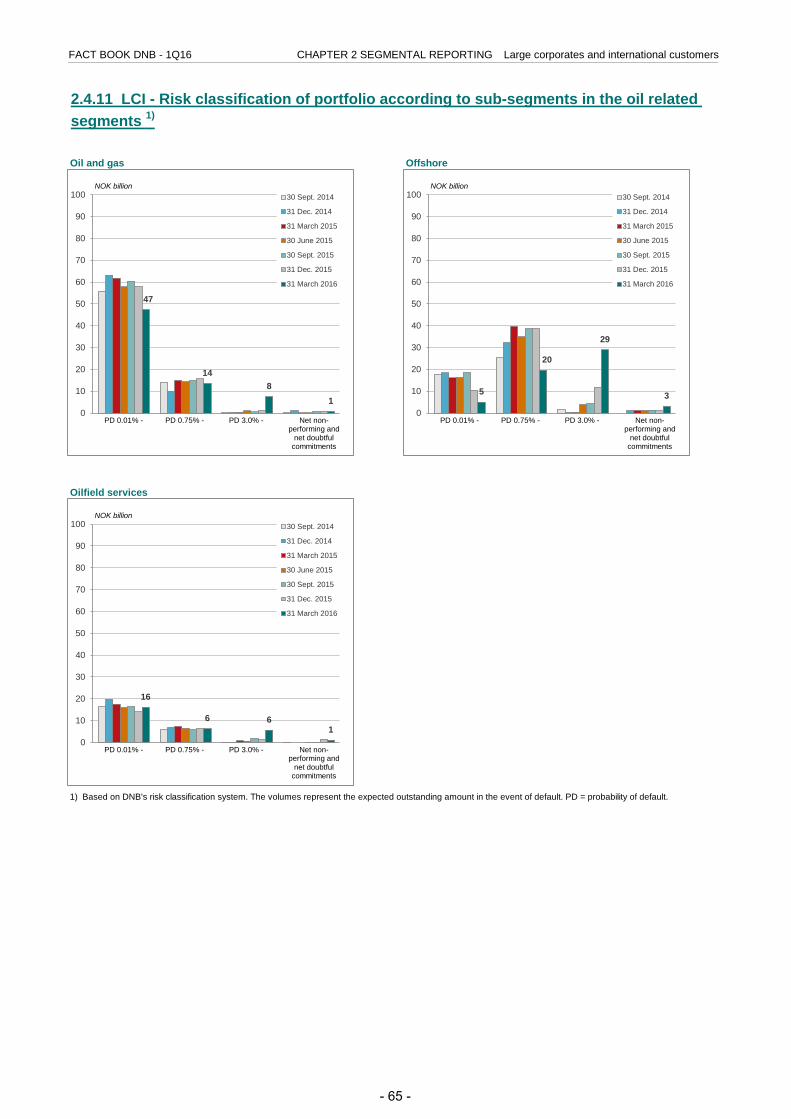
FACT BOOK DNB - 1Q16 CHAPTER 2 SEGMENTAL REPORTING Large corporates and international customers
Oil and gas Offshore
Oilfield services
2.4.11 LCI - Risk classification of portfolio according to sub-segments in the oil related segments 1)
1) Based on DNB's risk classification system. The volumes represent the expected outstanding amount in the event of default. PD = probability of default.
47
14 8
1 0
10
20
30
40
50
60
70
80
90
100 30 Sept. 2014
31 Dec. 2014
31 March 2015
30 June 2015
30 Sept. 2015
31 Dec. 2015
31 March 2016
Net non-performing and
net doubtful commitments
NOK billion
PD 0.01% - PD 0.75% - PD 3.0% -
5
20
29
3
0
10
20
30
40
50
60
70
80
90
100 30 Sept. 2014
31 Dec. 2014
31 March 2015
30 June 2015
30 Sept. 2015
31 Dec. 2015
31 March 2016
Net non-performing and
net doubtful commitments
NOK billion
PD 0.01% - PD 0.75% - PD 3.0% -
16
6 6 1
0
10
20
30
40
50
60
70
80
90
100 30 Sept. 2014
31 Dec. 2014
31 March 2015
30 June 2015
30 Sept. 2015
31 Dec. 2015
31 March 2016
Net non-performing and
net doubtful commitments
NOK billion
PD 0.01% - PD 0.75% - PD 3.0% -
- 65 -
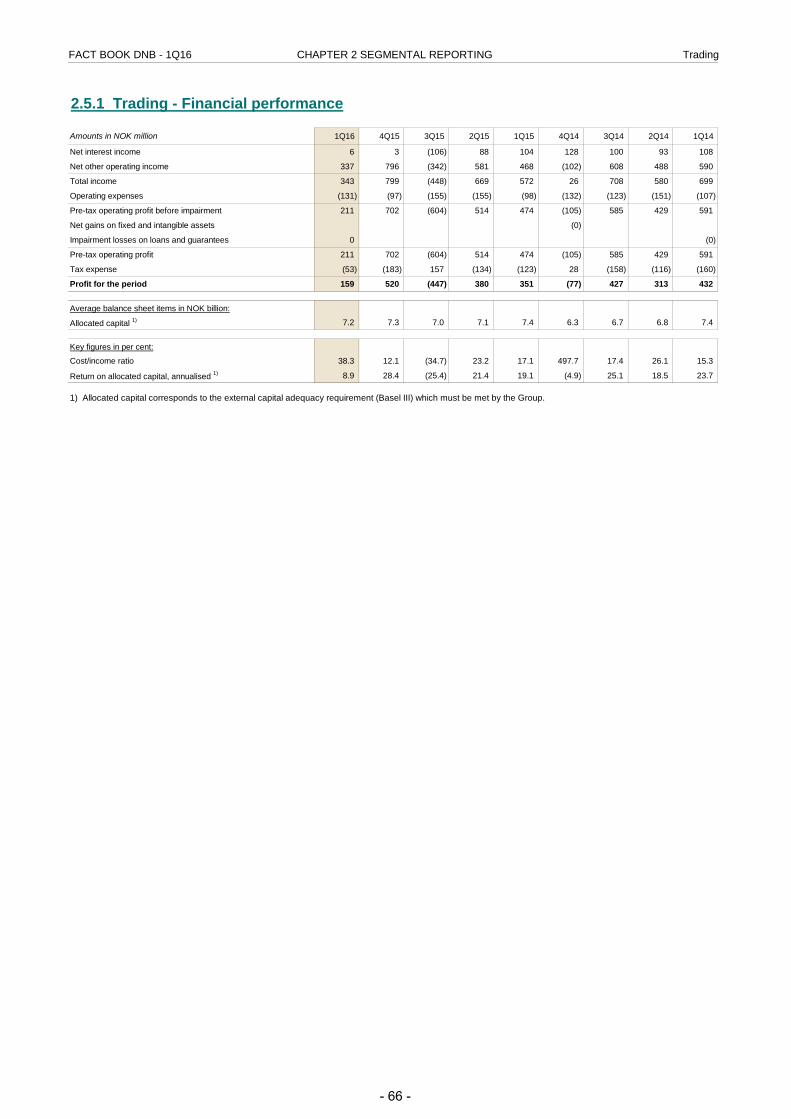
FACT BOOK DNB - 1Q16 CHAPTER 2 SEGMENTAL REPORTING Trading
2.5.1 Trading - Financial performance
Amounts in NOK million 1Q16 4Q15 3Q15 2Q15 1Q15 4Q14 3Q14 2Q14 1Q14
Net interest income 6 3 (106) 88 104 128 100 93 108
Net other operating income 337 796 (342) 581 468 (102) 608 488 590
Total income 343 799 (448) 669 572 26 708 580 699
Operating expenses (131) (97) (155) (155) (98) (132) (123) (151) (107)
Pre-tax operating profit before impairment 211 702 (604) 514 474 (105) 585 429 591
Net gains on fixed and intangible assets (0)
Impairment losses on loans and guarantees 0 (0)
Pre-tax operating profit 211 702 (604) 514 474 (105) 585 429 591
Tax expense (53) (183) 157 (134) (123) 28 (158) (116) (160)
Profit for the period 159 520 (447) 380 351 (77) 427 313 432
Average balance sheet items in NOK billion:
Allocated capital 1) 7.2 7.3 7.0 7.1 7.4 6.3 6.7 6.8 7.4
Key figures in per cent:
Cost/income ratio 38.3 12.1 (34.7) 23.2 17.1 497.7 17.4 26.1 15.3
Return on allocated capital, annualised 1) 8.9 28.4 (25.4) 21.4 19.1 (4.9) 25.1 18.5 23.7
1) Allocated capital corresponds to the external capital adequacy requirement (Basel III) which must be met by the Group.
- 66 -
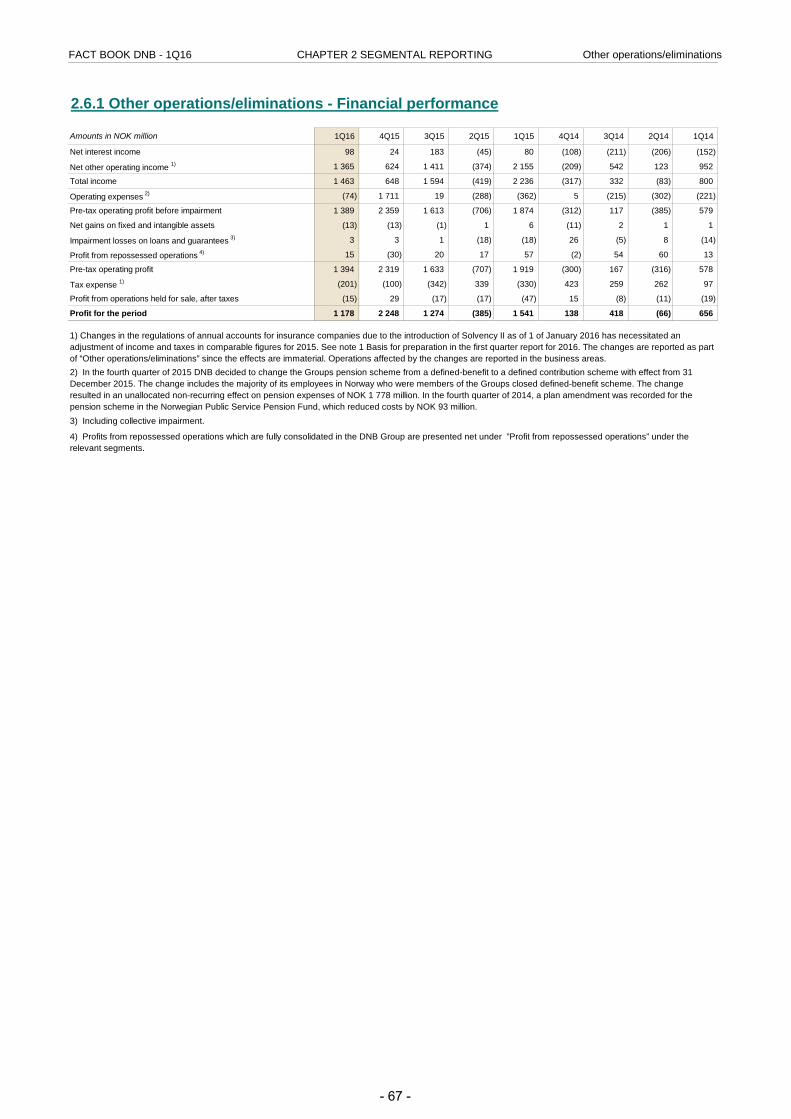
FACT BOOK DNB - 1Q16 CHAPTER 2 SEGMENTAL REPORTING Other operations/eliminations
2.6.1 Other operations/eliminations - Financial performance
Amounts in NOK million 1Q16 4Q15 3Q15 2Q15 1Q15 4Q14 3Q14 2Q14 1Q14
Net interest income 98 24 183 (45) 80 (108) (211) (206) (152)
Net other operating income 1) 1 365 624 1 411 (374) 2 155 (209) 542 123 952
Total income 1 463 648 1 594 (419) 2 236 (317) 332 (83) 800
Operating expenses 2) (74) 1 711 19 (288) (362) 5 (215) (302) (221)
Pre-tax operating profit before impairment 1 389 2 359 1 613 (706) 1 874 (312) 117 (385) 579
Net gains on fixed and intangible assets (13) (13) (1) 1 6 (11) 2 1 1
Impairment losses on loans and guarantees 3) 3 3 1 (18) (18) 26 (5) 8 (14)
Profit from repossessed operations 4) 15 (30) 20 17 57 (2) 54 60 13
Pre-tax operating profit 1 394 2 319 1 633 (707) 1 919 (300) 167 (316) 578
Tax expense 1) (201) (100) (342) 339 (330) 423 259 262 97
Profit from operations held for sale, after taxes (15) 29 (17) (17) (47) 15 (8) (11) (19)
Profit for the period 1 178 2 248 1 274 (385) 1 541 138 418 (66) 656
2) In the fourth quarter of 2015 DNB decided to change the Groups pension scheme from a defined-benefit to a defined contribution scheme with effect from 31 December 2015. The change includes the majority of its employees in Norway who were members of the Groups closed defined-benefit scheme. The change resulted in an unallocated non-recurring effect on pension expenses of NOK 1 778 million. In the fourth quarter of 2014, a plan amendment was recorded for the pension scheme in the Norwegian Public Service Pension Fund, which reduced costs by NOK 93 million.3) Including collective impairment.
4) Profits from repossessed operations which are fully consolidated in the DNB Group are presented net under ”Profit from repossessed operations” under the relevant segments.
1) Changes in the regulations of annual accounts for insurance companies due to the introduction of Solvency II as of 1 of January 2016 has necessitated an adjustment of income and taxes in comparable figures for 2015. See note 1 Basis for preparation in the first quarter report for 2016. The changes are reported as part of “Other operations/eliminations” since the effects are immaterial. Operations affected by the changes are reported in the business areas.
- 67 -
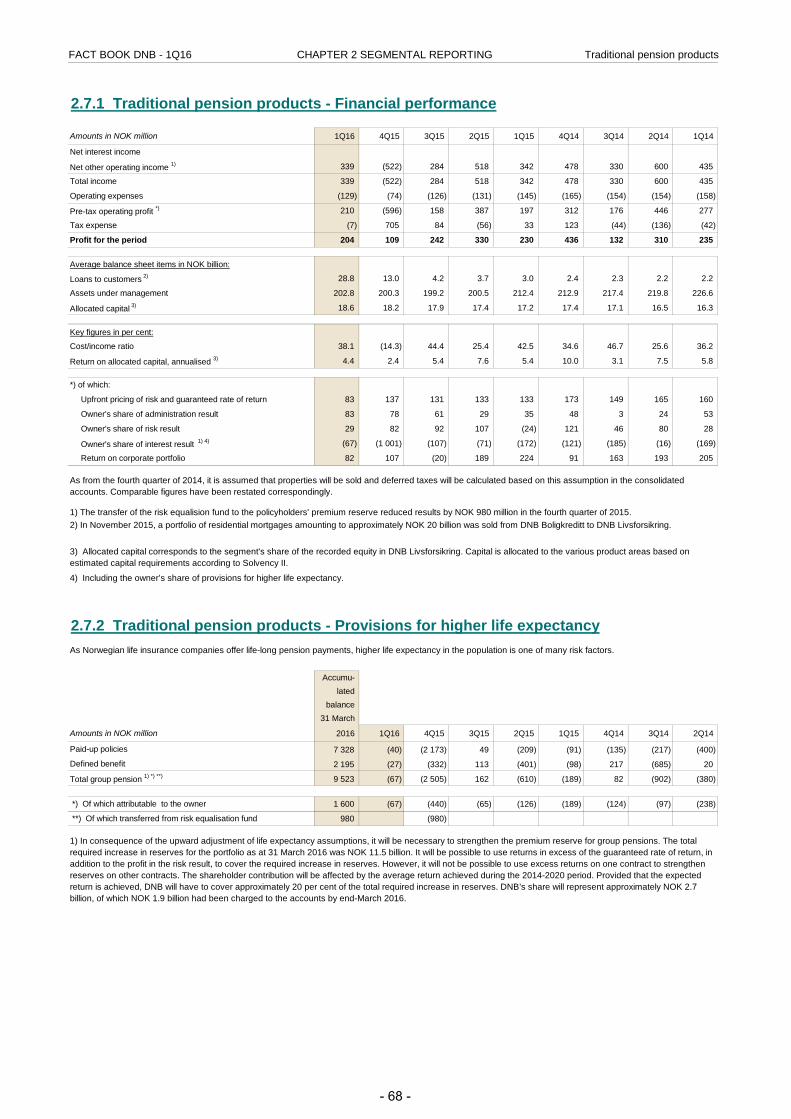
FACT BOOK DNB - 1Q16 CHAPTER 2 SEGMENTAL REPORTING Traditional pension products
2.7.1 Traditional pension products - Financial performance
Amounts in NOK million 1Q16 4Q15 3Q15 2Q15 1Q15 4Q14 3Q14 2Q14 1Q14
Net interest income
Net other operating income 1) 339 (522) 284 518 342 478 330 600 435
Total income 339 (522) 284 518 342 478 330 600 435
Operating expenses (129) (74) (126) (131) (145) (165) (154) (154) (158)
Pre-tax operating profit *) 210 (596) 158 387 197 312 176 446 277
Tax expense (7) 705 84 (56) 33 123 (44) (136) (42)
Profit for the period 204 109 242 330 230 436 132 310 235
Average balance sheet items in NOK billion:
Loans to customers 2) 28.8 13.0 4.2 3.7 3.0 2.4 2.3 2.2 2.2
Assets under management 202.8 200.3 199.2 200.5 212.4 212.9 217.4 219.8 226.6
Allocated capital 3) 18.6 18.2 17.9 17.4 17.2 17.4 17.1 16.5 16.3
Key figures in per cent:
Cost/income ratio 38.1 (14.3) 44.4 25.4 42.5 34.6 46.7 25.6 36.2
Return on allocated capital, annualised 3) 4.4 2.4 5.4 7.6 5.4 10.0 3.1 7.5 5.8
*) of which:
Upfront pricing of risk and guaranteed rate of return 83 137 131 133 133 173 149 165 160
Owner's share of administration result 83 78 61 29 35 48 3 24 53
Owner's share of risk result 29 82 92 107 (24) 121 46 80 28
Owner's share of interest result 1) 4) (67) (1 001) (107) (71) (172) (121) (185) (16) (169)
Return on corporate portfolio 82 107 (20) 189 224 91 163 193 205
2.7.2 Traditional pension products - Provisions for higher life expectancy
Accumu- lated
balance 31 March
Amounts in NOK million 2016 1Q16 4Q15 3Q15 2Q15 1Q15 4Q14 3Q14 2Q14
Paid-up policies 7 328 (40) (2 173) 49 (209) (91) (135) (217) (400)
Defined benefit 2 195 (27) (332) 113 (401) (98) 217 (685) 20
Total group pension 1) *) **) 9 523 (67) (2 505) 162 (610) (189) 82 (902) (380)
*) Of which attributable to the owner 1 600 (67) (440) (65) (126) (189) (124) (97) (238)
**) Of which transferred from risk equalisation fund 980 (980)
As from the fourth quarter of 2014, it is assumed that properties will be sold and deferred taxes will be calculated based on this assumption in the consolidated accounts. Comparable figures have been restated correspondingly.
3) Allocated capital corresponds to the segment's share of the recorded equity in DNB Livsforsikring. Capital is allocated to the various product areas based on estimated capital requirements according to Solvency II.
As Norwegian life insurance companies offer life-long pension payments, higher life expectancy in the population is one of many risk factors.
1) In consequence of the upward adjustment of life expectancy assumptions, it will be necessary to strengthen the premium reserve for group pensions. The total required increase in reserves for the portfolio as at 31 March 2016 was NOK 11.5 billion. It will be possible to use returns in excess of the guaranteed rate of return, in addition to the profit in the risk result, to cover the required increase in reserves. However, it will not be possible to use excess returns on one contract to strengthen reserves on other contracts. The shareholder contribution will be affected by the average return achieved during the 2014-2020 period. Provided that the expected return is achieved, DNB will have to cover approximately 20 per cent of the total required increase in reserves. DNB’s share will represent approximately NOK 2.7 billion, of which NOK 1.9 billion had been charged to the accounts by end-March 2016.
4) Including the owner’s share of provisions for higher life expectancy.
2) In November 2015, a portfolio of residential mortgages amounting to approximately NOK 20 billion was sold from DNB Boligkreditt to DNB Livsforsikring.1) The transfer of the risk equalision fund to the policyholders' premium reserve reduced results by NOK 980 million in the fourth quarter of 2015.
- 68 -
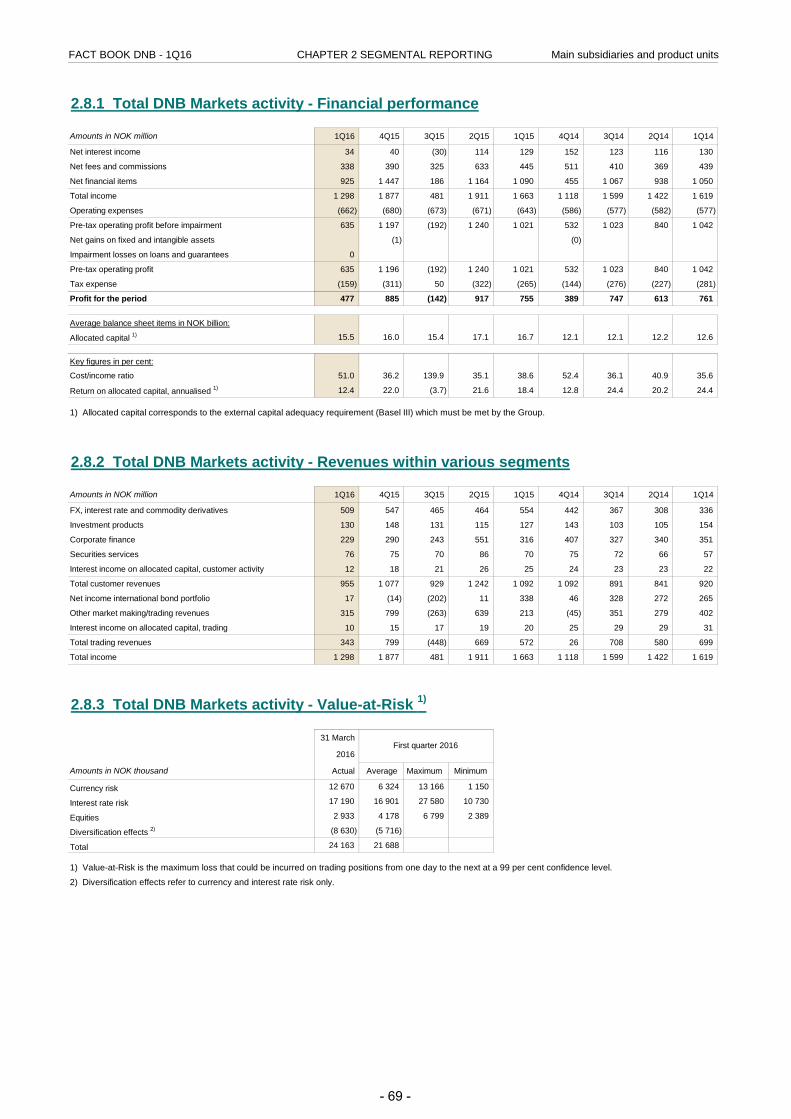
FACT BOOK DNB - 1Q16 CHAPTER 2 SEGMENTAL REPORTING Main subsidiaries and product units
2.8.1 Total DNB Markets activity - Financial performance
Amounts in NOK million 1Q16 4Q15 3Q15 2Q15 1Q15 4Q14 3Q14 2Q14 1Q14
Net interest income 34 40 (30) 114 129 152 123 116 130
Net fees and commissions 338 390 325 633 445 511 410 369 439
Net financial items 925 1 447 186 1 164 1 090 455 1 067 938 1 050
Total income 1 298 1 877 481 1 911 1 663 1 118 1 599 1 422 1 619
Operating expenses (662) (680) (673) (671) (643) (586) (577) (582) (577)
Pre-tax operating profit before impairment 635 1 197 (192) 1 240 1 021 532 1 023 840 1 042
Net gains on fixed and intangible assets (1) (0)
Impairment losses on loans and guarantees 0
Pre-tax operating profit 635 1 196 (192) 1 240 1 021 532 1 023 840 1 042
Tax expense (159) (311) 50 (322) (265) (144) (276) (227) (281)
Profit for the period 477 885 (142) 917 755 389 747 613 761
Average balance sheet items in NOK billion:
Allocated capital 1) 15.5 16.0 15.4 17.1 16.7 12.1 12.1 12.2 12.6
Key figures in per cent:
Cost/income ratio 51.0 36.2 139.9 35.1 38.6 52.4 36.1 40.9 35.6
Return on allocated capital, annualised 1) 12.4 22.0 (3.7) 21.6 18.4 12.8 24.4 20.2 24.4
2.8.2 Total DNB Markets activity - Revenues within various segments
Amounts in NOK million 1Q16 4Q15 3Q15 2Q15 1Q15 4Q14 3Q14 2Q14 1Q14
FX, interest rate and commodity derivatives 509 547 465 464 554 442 367 308 336
Investment products 130 148 131 115 127 143 103 105 154
Corporate finance 229 290 243 551 316 407 327 340 351
Securities services 76 75 70 86 70 75 72 66 57
Interest income on allocated capital, customer activity 12 18 21 26 25 24 23 23 22
Total customer revenues 955 1 077 929 1 242 1 092 1 092 891 841 920
Net income international bond portfolio 17 (14) (202) 11 338 46 328 272 265
Other market making/trading revenues 315 799 (263) 639 213 (45) 351 279 402
Interest income on allocated capital, trading 10 15 17 19 20 25 29 29 31
Total trading revenues 343 799 (448) 669 572 26 708 580 699
Total income 1 298 1 877 481 1 911 1 663 1 118 1 599 1 422 1 619
2.8.3 Total DNB Markets activity - Value-at-Risk 1)
31 March
2016
Amounts in NOK thousand Actual Average Maximum Minimum
Currency risk 12 670 6 324 13 166 1 150
Interest rate risk 17 190 16 901 27 580 10 730
Equities 2 933 4 178 6 799 2 389
Diversification effects 2) (8 630) (5 716)
Total 24 163 21 688
1) Allocated capital corresponds to the external capital adequacy requirement (Basel III) which must be met by the Group.
First quarter 2016
1) Value-at-Risk is the maximum loss that could be incurred on trading positions from one day to the next at a 99 per cent confidence level.
2) Diversification effects refer to currency and interest rate risk only.
- 69 -
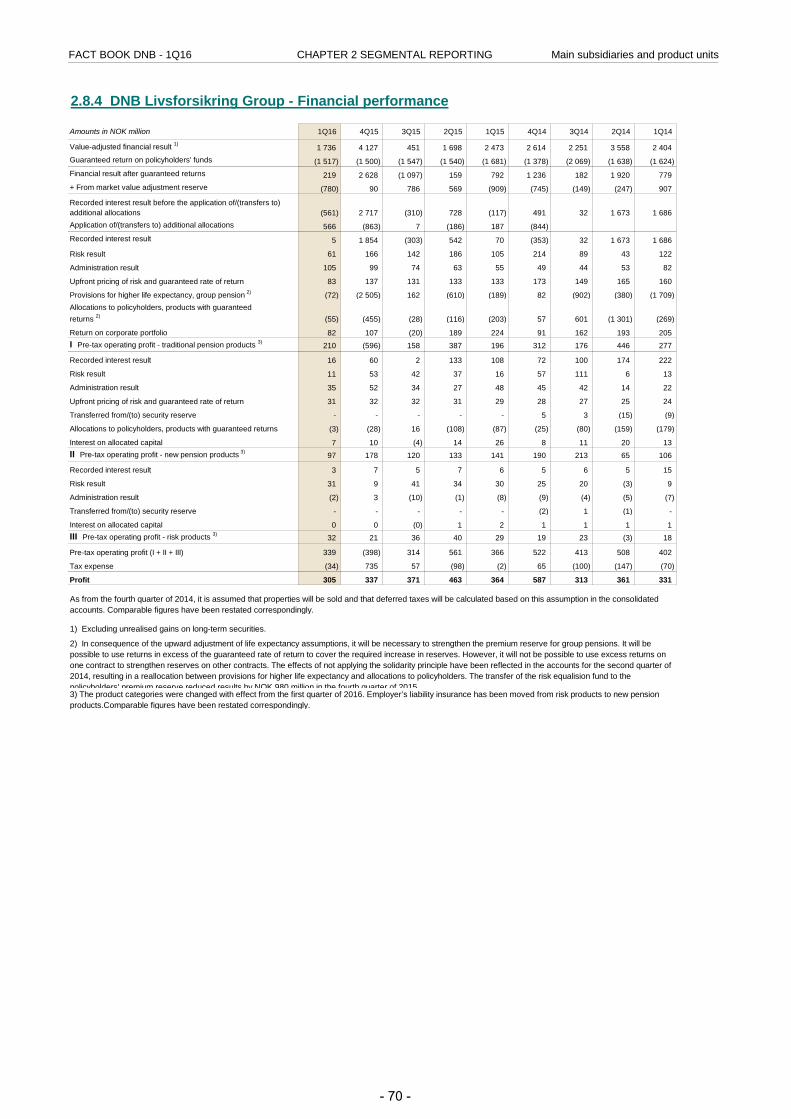
FACT BOOK DNB - 1Q16 CHAPTER 2 SEGMENTAL REPORTING Main subsidiaries and product units
2.8.4 DNB Livsforsikring Group - Financial performance
Amounts in NOK million 1Q16 4Q15 3Q15 2Q15 1Q15 4Q14 3Q14 2Q14 1Q14
Value-adjusted financial result 1) 1 736 4 127 451 1 698 2 473 2 614 2 251 3 558 2 404 Guaranteed return on policyholders' funds (1 517) (1 500) (1 547) (1 540) (1 681) (1 378) (2 069) (1 638) (1 624) Financial result after guaranteed returns 219 2 628 (1 097) 159 792 1 236 182 1 920 779 + From market value adjustment reserve (780) 90 786 569 (909) (745) (149) (247) 907
Recorded interest result before the application of/(transfers to) additional allocations (561) 2 717 (310) 728 (117) 491 32 1 673 1 686 Application of/(transfers to) additional allocations 566 (863) 7 (186) 187 (844) Recorded interest result 5 1 854 (303) 542 70 (353) 32 1 673 1 686
Risk result 61 166 142 186 105 214 89 43 122
Administration result 105 99 74 63 55 49 44 53 82
Upfront pricing of risk and guaranteed rate of return 83 137 131 133 133 173 149 165 160
Provisions for higher life expectancy, group pension 2) (72) (2 505) 162 (610) (189) 82 (902) (380) (1 709) Allocations to policyholders, products with guaranteed returns 2) (55) (455) (28) (116) (203) 57 601 (1 301) (269)
Return on corporate portfolio 82 107 (20) 189 224 91 162 193 205 I Pre-tax operating profit - traditional pension products 3) 210 (596) 158 387 196 312 176 446 277
Recorded interest result 16 60 2 133 108 72 100 174 222
Risk result 11 53 42 37 16 57 111 6 13
Administration result 35 52 34 27 48 45 42 14 22
Upfront pricing of risk and guaranteed rate of return 31 32 32 31 29 28 27 25 24
Transferred from/(to) security reserve - - - - - 5 3 (15) (9)
Allocations to policyholders, products with guaranteed returns (3) (28) 16 (108) (87) (25) (80) (159) (179)
Interest on allocated capital 7 10 (4) 14 26 8 11 20 13 II Pre-tax operating profit - new pension products 3) 97 178 120 133 141 190 213 65 106
Recorded interest result 3 7 5 7 6 5 6 5 15
Risk result 31 9 41 34 30 25 20 (3) 9
Administration result (2) 3 (10) (1) (8) (9) (4) (5) (7)
Transferred from/(to) security reserve - - - - - (2) 1 (1) -
Interest on allocated capital 0 0 (0) 1 2 1 1 1 1 III Pre-tax operating profit - risk products 3) 32 21 36 40 29 19 23 (3) 18
Pre-tax operating profit (I + II + III) 339 (398) 314 561 366 522 413 508 402
Tax expense (34) 735 57 (98) (2) 65 (100) (147) (70)
Profit 305 337 371 463 364 587 313 361 331
As from the fourth quarter of 2014, it is assumed that properties will be sold and that deferred taxes will be calculated based on this assumption in the consolidated accounts. Comparable figures have been restated correspondingly.
1) Excluding unrealised gains on long-term securities.
2) In consequence of the upward adjustment of life expectancy assumptions, it will be necessary to strengthen the premium reserve for group pensions. It will be possible to use returns in excess of the guaranteed rate of return to cover the required increase in reserves. However, it will not be possible to use excess returns on one contract to strengthen reserves on other contracts. The effects of not applying the solidarity principle have been reflected in the accounts for the second quarter of 2014, resulting in a reallocation between provisions for higher life expectancy and allocations to policyholders. The transfer of the risk equalision fund to the policyholders' premium reserve reduced results by NOK 980 million in the fourth quarter of 20153) The product categories were changed with effect from the first quarter of 2016. Employer’s liability insurance has been moved from risk products to new pension products.Comparable figures have been restated correspondingly.
- 70 -

FACT BOOK DNB - 1Q16 CHAPTER 2 SEGMENTAL REPORTING Main subsidiaries and product units
2.8.4 DNB Livsforsikring Group - Financial performance (continued)
Amounts in NOK million 2015 2014 2013 2012
Value-adjusted financial result 1) 8 749 10 826 10 458 11 341 Guaranteed return on policyholders' funds (6 268) (6 710) (6 885) (6 801) Financial result after guaranteed returns 2 481 4 116 3 573 4 539 + From market value adjustment reserve 537 (235) (1 497) (636)
3 018 3 882 2 077 3 904 Application of/(transfers to) additional allocations (855) (844) (10) Recorded interest result 2 163 3 038 2 066 3 904
Risk result 599 468 321 (105)
Administration result 291 228 124 18
Upfront pricing of risk and guaranteed rate of return 535 647 682 500
Provisions for higher life expectancy, group pension (3 141) (2 909) (1 798) (3 323)
Allocations to policyholders, products with guaranteed returns (802) (913) (355) (324)
Return on corporate portfolio 500 652 559 511 I Pre-tax operating profit - traditional pension products 145 1 212 1 599 1 181
Recorded interest result 303 568 332 447
Risk result 148 186 80 (140)
Administration result 167 123 107 (5)
Upfront pricing of risk and guaranteed rate of return 123 104 106 80
Transferred from/(to) security reserve - (16) 4 (16)
Allocations to policyholders, products with guaranteed returns (207) (442) (231) (339)
Interest on allocated capital 45 52 36 33 II Pre-tax operating profit - new pension products 2) 579 575 435 59
Recorded interest result 26 31 31 36
Risk result 114 51 51 (54)
Administration result (23) (27) 5 11
Transferred from/(to) security reserve - (2) 10 (3)
Allocations to policyholders, products with guaranteed returns - - (2) 45
Interest on allocated capital 3 4 3 3 III Pre-tax operating profit - risk products 2) 119 57 98 39
Pre-tax operating profit (I + II + III) 843 1 844 2 132 1 279
Tax expense 692 (252) (256) 355
Profit 1 535 1 592 1 876 1 634
Recorded interest result before the application of/(transfers to) additional allocations
1) Excluding unrealised gains on long-term securities.
As from the fourth quarter of 2014, it is assumed that properties will be sold and that deferred taxes will be calculated based on this assumption in the consolidated accounts. Comparable figures have been restated correspondingly.
2) The product categories were changed with effect from the first quarter of 2016. Employer’s liability insurance has been moved from risk products to new pension products.Comparable figures have been restated correspondingly.
- 71 -
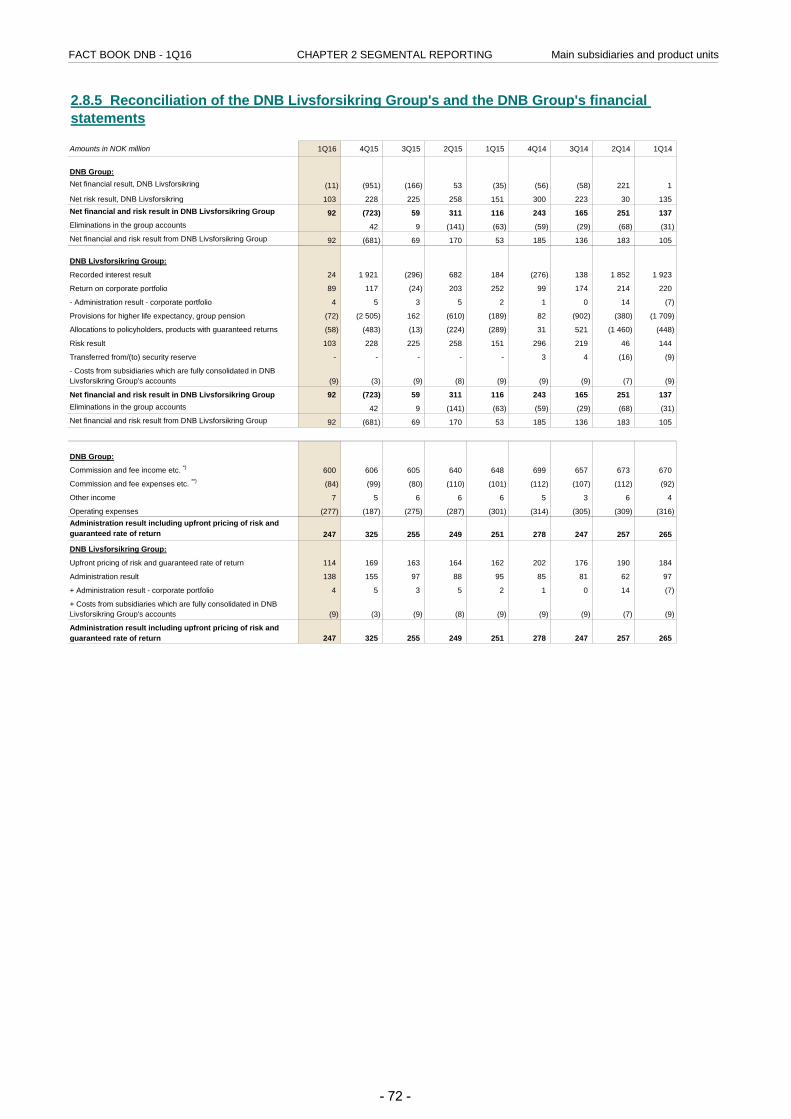
FACT BOOK DNB - 1Q16 CHAPTER 2 SEGMENTAL REPORTING Main subsidiaries and product units
Amounts in NOK million 1Q16 4Q15 3Q15 2Q15 1Q15 4Q14 3Q14 2Q14 1Q14
DNB Group:Net financial result, DNB Livsforsikring (11) (951) (166) 53 (35) (56) (58) 221 1
Net risk result, DNB Livsforsikring 103 228 225 258 151 300 223 30 135 Net financial and risk result in DNB Livsforsikring Group 92 (723) 59 311 116 243 165 251 137 Eliminations in the group accounts 42 9 (141) (63) (59) (29) (68) (31) Net financial and risk result from DNB Livsforsikring Group 92 (681) 69 170 53 185 136 183 105
DNB Livsforsikring Group:
Recorded interest result 24 1 921 (296) 682 184 (276) 138 1 852 1 923
Return on corporate portfolio 89 117 (24) 203 252 99 174 214 220
- Administration result - corporate portfolio 4 5 3 5 2 1 0 14 (7)
Provisions for higher life expectancy, group pension (72) (2 505) 162 (610) (189) 82 (902) (380) (1 709)
Allocations to policyholders, products with guaranteed returns (58) (483) (13) (224) (289) 31 521 (1 460) (448)
Risk result 103 228 225 258 151 296 219 46 144
Transferred from/(to) security reserve - - - - - 3 4 (16) (9)
- Costs from subsidiaries which are fully consolidated in DNB Livsforsikring Group's accounts (9) (3) (9) (8) (9) (9) (9) (7) (9)
Net financial and risk result in DNB Livsforsikring Group 92 (723) 59 311 116 243 165 251 137 Eliminations in the group accounts 42 9 (141) (63) (59) (29) (68) (31) Net financial and risk result from DNB Livsforsikring Group 92 (681) 69 170 53 185 136 183 105
DNB Group:
Commission and fee income etc. *) 600 606 605 640 648 699 657 673 670
Commission and fee expenses etc. **) (84) (99) (80) (110) (101) (112) (107) (112) (92)
Other income 7 5 6 6 6 5 3 6 4
Operating expenses (277) (187) (275) (287) (301) (314) (305) (309) (316) Administration result including upfront pricing of risk and guaranteed rate of return 247 325 255 249 251 278 247 257 265
DNB Livsforsikring Group:
Upfront pricing of risk and guaranteed rate of return 114 169 163 164 162 202 176 190 184
Administration result 138 155 97 88 95 85 81 62 97
+ Administration result - corporate portfolio 4 5 3 5 2 1 0 14 (7)
+ Costs from subsidiaries which are fully consolidated in DNB Livsforsikring Group's accounts (9) (3) (9) (8) (9) (9) (9) (7) (9)
Administration result including upfront pricing of risk and guaranteed rate of return 247 325 255 249 251 278 247 257 265
2.8.5 Reconciliation of the DNB Livsforsikring Group's and the DNB Group's financial statements
- 72 -
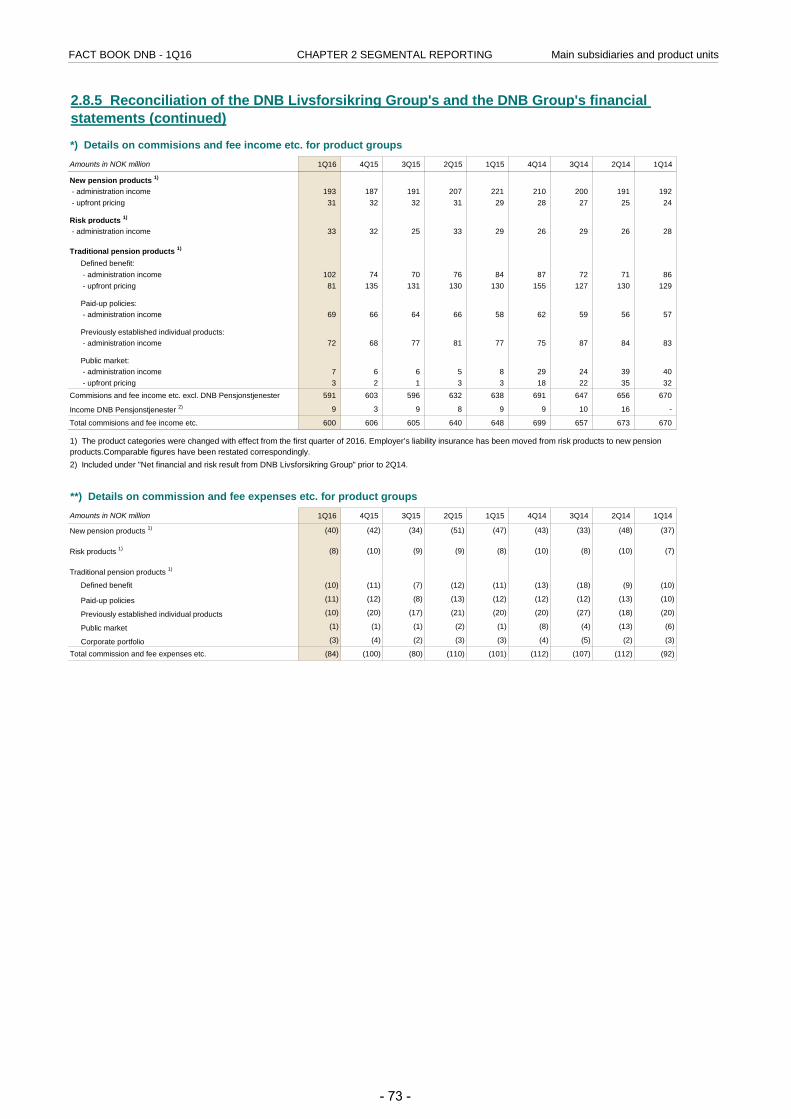
FACT BOOK DNB - 1Q16 CHAPTER 2 SEGMENTAL REPORTING Main subsidiaries and product units
Amounts in NOK million 1Q16 4Q15 3Q15 2Q15 1Q15 4Q14 3Q14 2Q14 1Q14
New pension products 1)
- administration income 193 187 191 207 221 210 200 191 192 - upfront pricing 31 32 32 31 29 28 27 25 24
Risk products 1)
- administration income 33 32 25 33 29 26 29 26 28
Traditional pension products 1)
Defined benefit: - administration income 102 74 70 76 84 87 72 71 86 - upfront pricing 81 135 131 130 130 155 127 130 129
Paid-up policies: - administration income 69 66 64 66 58 62 59 56 57
Previously established individual products: - administration income 72 68 77 81 77 75 87 84 83
Public market: - administration income 7 6 6 5 8 29 24 39 40 - upfront pricing 3 2 1 3 3 18 22 35 32
Commisions and fee income etc. excl. DNB Pensjonstjenester 591 603 596 632 638 691 647 656 670
Income DNB Pensjonstjenester 2) 9 3 9 8 9 9 10 16 -
Total commisions and fee income etc. 600 606 605 640 648 699 657 673 670
Amounts in NOK million 1Q16 4Q15 3Q15 2Q15 1Q15 4Q14 3Q14 2Q14 1Q14
New pension products 1) (40) (42) (34) (51) (47) (43) (33) (48) (37)
Risk products 1) (8) (10) (9) (9) (8) (10) (8) (10) (7)
Traditional pension products 1)
Defined benefit (10) (11) (7) (12) (11) (13) (18) (9) (10)
Paid-up policies (11) (12) (8) (13) (12) (12) (12) (13) (10)
Previously established individual products (10) (20) (17) (21) (20) (20) (27) (18) (20)
Public market (1) (1) (1) (2) (1) (8) (4) (13) (6)
Corporate portfolio (3) (4) (2) (3) (3) (4) (5) (2) (3)
Total commission and fee expenses etc. (84) (100) (80) (110) (101) (112) (107) (112) (92)
1) The product categories were changed with effect from the first quarter of 2016. Employer’s liability insurance has been moved from risk products to new pension products.Comparable figures have been restated correspondingly.
**) Details on commission and fee expenses etc. for product groups
2.8.5 Reconciliation of the DNB Livsforsikring Group's and the DNB Group's financial statements (continued)
*) Details on commisions and fee income etc. for product groups
2) Included under "Net financial and risk result from DNB Livsforsikring Group" prior to 2Q14.
- 73 -
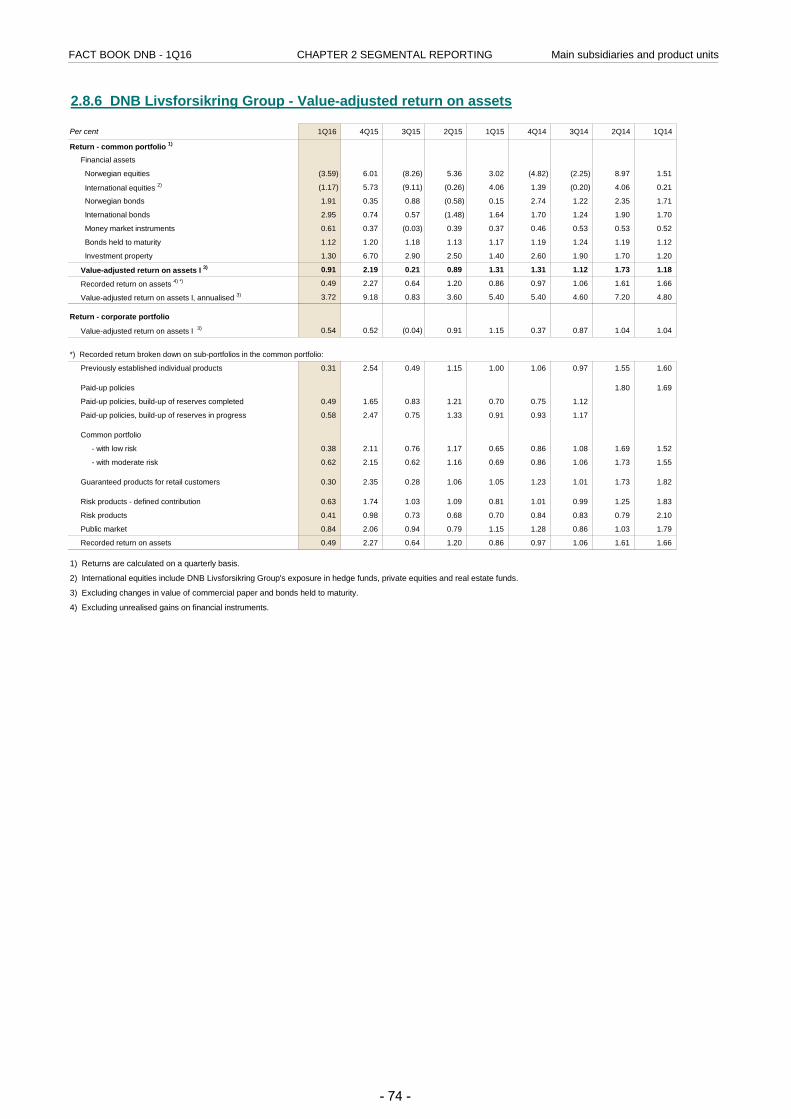
FACT BOOK DNB - 1Q16 CHAPTER 2 SEGMENTAL REPORTING Main subsidiaries and product units
2.8.6 DNB Livsforsikring Group - Value-adjusted return on assets
Per cent 1Q16 4Q15 3Q15 2Q15 1Q15 4Q14 3Q14 2Q14 1Q14
Return - common portfolio 1)
Financial assets
Norwegian equities (3.59) 6.01 (8.26) 5.36 3.02 (4.82) (2.25) 8.97 1.51
International equities 2) (1.17) 5.73 (9.11) (0.26) 4.06 1.39 (0.20) 4.06 0.21
Norwegian bonds 1.91 0.35 0.88 (0.58) 0.15 2.74 1.22 2.35 1.71
International bonds 2.95 0.74 0.57 (1.48) 1.64 1.70 1.24 1.90 1.70
Money market instruments 0.61 0.37 (0.03) 0.39 0.37 0.46 0.53 0.53 0.52
Bonds held to maturity 1.12 1.20 1.18 1.13 1.17 1.19 1.24 1.19 1.12
Investment property 1.30 6.70 2.90 2.50 1.40 2.60 1.90 1.70 1.20
Value-adjusted return on assets I 3) 0.91 2.19 0.21 0.89 1.31 1.31 1.12 1.73 1.18
Recorded return on assets 4) *) 0.49 2.27 0.64 1.20 0.86 0.97 1.06 1.61 1.66
Value-adjusted return on assets I, annualised 3) 3.72 9.18 0.83 3.60 5.40 5.40 4.60 7.20 4.80
Return - corporate portfolio
Value-adjusted return on assets I 3) 0.54 0.52 (0.04) 0.91 1.15 0.37 0.87 1.04 1.04
*) Recorded return broken down on sub-portfolios in the common portfolio:
Previously established individual products 0.31 2.54 0.49 1.15 1.00 1.06 0.97 1.55 1.60
Paid-up policies 1.80 1.69
Paid-up policies, build-up of reserves completed 0.49 1.65 0.83 1.21 0.70 0.75 1.12
Paid-up policies, build-up of reserves in progress 0.58 2.47 0.75 1.33 0.91 0.93 1.17
Common portfolio
- with low risk 0.38 2.11 0.76 1.17 0.65 0.86 1.08 1.69 1.52
- with moderate risk 0.62 2.15 0.62 1.16 0.69 0.86 1.06 1.73 1.55
Guaranteed products for retail customers 0.30 2.35 0.28 1.06 1.05 1.23 1.01 1.73 1.82
Risk products - defined contribution 0.63 1.74 1.03 1.09 0.81 1.01 0.99 1.25 1.83
Risk products 0.41 0.98 0.73 0.68 0.70 0.84 0.83 0.79 2.10
Public market 0.84 2.06 0.94 0.79 1.15 1.28 0.86 1.03 1.79
Recorded return on assets 0.49 2.27 0.64 1.20 0.86 0.97 1.06 1.61 1.66
3) Excluding changes in value of commercial paper and bonds held to maturity.
4) Excluding unrealised gains on financial instruments.
2) International equities include DNB Livsforsikring Group's exposure in hedge funds, private equities and real estate funds.
1) Returns are calculated on a quarterly basis.
- 74 -
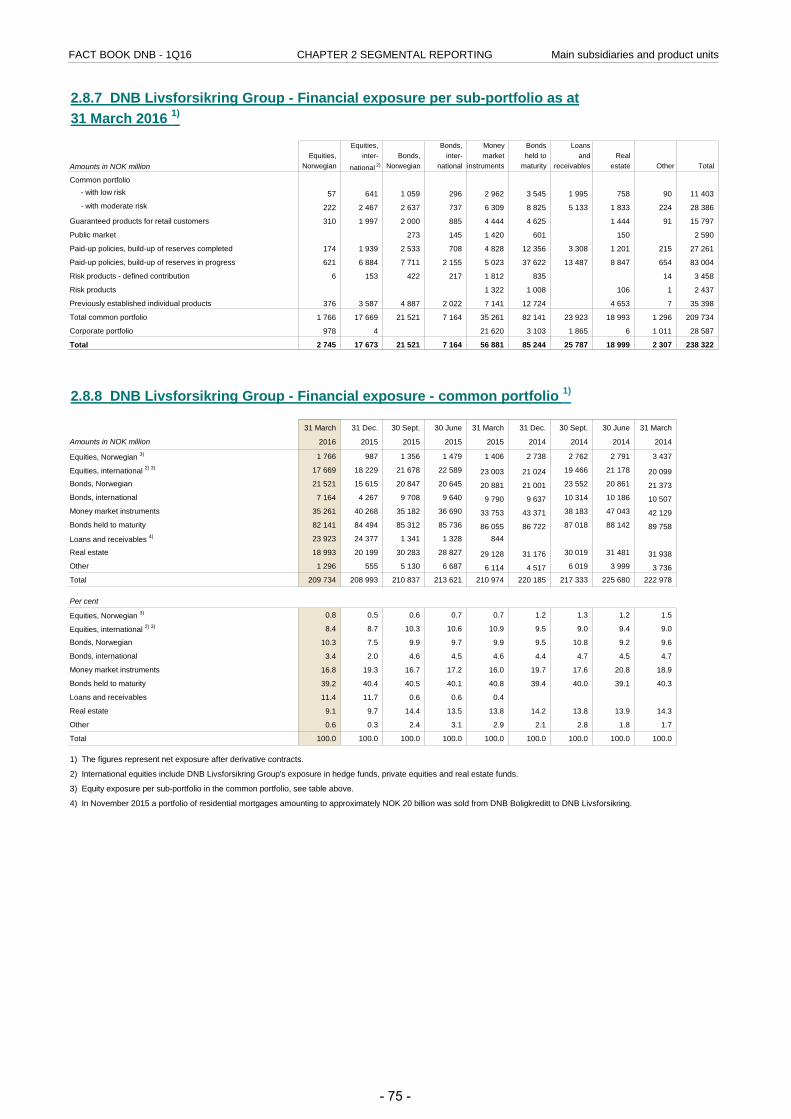
FACT BOOK DNB - 1Q16 CHAPTER 2 SEGMENTAL REPORTING Main subsidiaries and product units
Equities, Bonds, Money Bonds LoansEquities, inter- Bonds, inter- market held to and Real
Amounts in NOK million Norwegian national 2) Norwegian national instruments maturity receivables estate Other Total
Common portfolio - with low risk 57 641 1 059 296 2 962 3 545 1 995 758 90 11 403 - with moderate risk 222 2 467 2 637 737 6 309 8 825 5 133 1 833 224 28 386
Guaranteed products for retail customers 310 1 997 2 000 885 4 444 4 625 1 444 91 15 797
Public market 273 145 1 420 601 150 2 590
Paid-up policies, build-up of reserves completed 174 1 939 2 533 708 4 828 12 356 3 308 1 201 215 27 261
Paid-up policies, build-up of reserves in progress 621 6 884 7 711 2 155 5 023 37 622 13 487 8 847 654 83 004
Risk products - defined contribution 6 153 422 217 1 812 835 14 3 458
Risk products 1 322 1 008 106 1 2 437
Previously established individual products 376 3 587 4 887 2 022 7 141 12 724 4 653 7 35 398
Total common portfolio 1 766 17 669 21 521 7 164 35 261 82 141 23 923 18 993 1 296 209 734
Corporate portfolio 978 4 21 620 3 103 1 865 6 1 011 28 587
Total 2 745 17 673 21 521 7 164 56 881 85 244 25 787 18 999 2 307 238 322
2.8.8 DNB Livsforsikring Group - Financial exposure - common portfolio 1)
31 March 31 Dec. 30 Sept. 30 June 31 March 31 Dec. 30 Sept. 30 June 31 March
Amounts in NOK million 2016 2015 2015 2015 2015 2014 2014 2014 2014
Equities, Norwegian 3) 1 766 987 1 356 1 479 1 406 2 738 2 762 2 791 3 437
Equities, international 2) 3) 17 669 18 229 21 678 22 589 23 003 21 024 19 466 21 178 20 099 Bonds, Norwegian 21 521 15 615 20 847 20 645 20 881 21 001 23 552 20 861 21 373 Bonds, international 7 164 4 267 9 708 9 640 9 790 9 637 10 314 10 186 10 507 Money market instruments 35 261 40 268 35 182 36 690 33 753 43 371 38 183 47 043 42 129 Bonds held to maturity 82 141 84 494 85 312 85 736 86 055 86 722 87 018 88 142 89 758
Loans and receivables 4) 23 923 24 377 1 341 1 328 844
Real estate 18 993 20 199 30 283 28 827 29 128 31 176 30 019 31 481 31 938 Other 1 296 555 5 130 6 687 6 114 4 517 6 019 3 999 3 736 Total 209 734 208 993 210 837 213 621 210 974 220 185 217 333 225 680 222 978
Per cent
Equities, Norwegian 3) 0.8 0.5 0.6 0.7 0.7 1.2 1.3 1.2 1.5
Equities, international 2) 3) 8.4 8.7 10.3 10.6 10.9 9.5 9.0 9.4 9.0
Bonds, Norwegian 10.3 7.5 9.9 9.7 9.9 9.5 10.8 9.2 9.6
Bonds, international 3.4 2.0 4.6 4.5 4.6 4.4 4.7 4.5 4.7
Money market instruments 16.8 19.3 16.7 17.2 16.0 19.7 17.6 20.8 18.9
Bonds held to maturity 39.2 40.4 40.5 40.1 40.8 39.4 40.0 39.1 40.3
Loans and receivables 11.4 11.7 0.6 0.6 0.4
Real estate 9.1 9.7 14.4 13.5 13.8 14.2 13.8 13.9 14.3
Other 0.6 0.3 2.4 3.1 2.9 2.1 2.8 1.8 1.7
Total 100.0 100.0 100.0 100.0 100.0 100.0 100.0 100.0 100.0
1) The figures represent net exposure after derivative contracts.
2) International equities include DNB Livsforsikring Group's exposure in hedge funds, private equities and real estate funds.
4) In November 2015 a portfolio of residential mortgages amounting to approximately NOK 20 billion was sold from DNB Boligkreditt to DNB Livsforsikring.
3) Equity exposure per sub-portfolio in the common portfolio, see table above.
2.8.7 DNB Livsforsikring Group - Financial exposure per sub-portfolio as at31 March 2016 1)
- 75 -
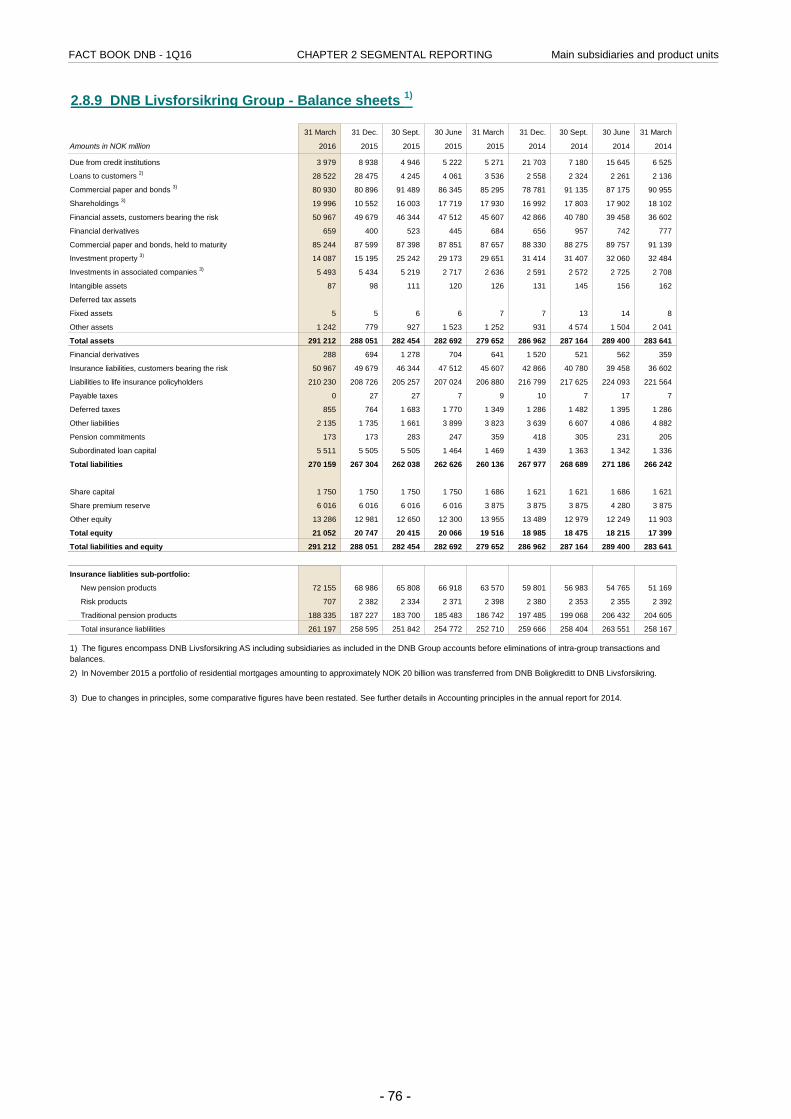
FACT BOOK DNB - 1Q16 CHAPTER 2 SEGMENTAL REPORTING Main subsidiaries and product units
2.8.9 DNB Livsforsikring Group - Balance sheets 1)
31 March 31 Dec. 30 Sept. 30 June 31 March 31 Dec. 30 Sept. 30 June 31 March
Amounts in NOK million 2016 2015 2015 2015 2015 2014 2014 2014 2014
Due from credit institutions 3 979 8 938 4 946 5 222 5 271 21 703 7 180 15 645 6 525
Loans to customers 2) 28 522 28 475 4 245 4 061 3 536 2 558 2 324 2 261 2 136
Commercial paper and bonds 3) 80 930 80 896 91 489 86 345 85 295 78 781 91 135 87 175 90 955
Shareholdings 3) 19 996 10 552 16 003 17 719 17 930 16 992 17 803 17 902 18 102
Financial assets, customers bearing the risk 50 967 49 679 46 344 47 512 45 607 42 866 40 780 39 458 36 602
Financial derivatives 659 400 523 445 684 656 957 742 777
Commercial paper and bonds, held to maturity 85 244 87 599 87 398 87 851 87 657 88 330 88 275 89 757 91 139
Investment property 3) 14 087 15 195 25 242 29 173 29 651 31 414 31 407 32 060 32 484
Investments in associated companies 3) 5 493 5 434 5 219 2 717 2 636 2 591 2 572 2 725 2 708
Intangible assets 87 98 111 120 126 131 145 156 162
Deferred tax assets
Fixed assets 5 5 6 6 7 7 13 14 8
Other assets 1 242 779 927 1 523 1 252 931 4 574 1 504 2 041
Total assets 291 212 288 051 282 454 282 692 279 652 286 962 287 164 289 400 283 641
Financial derivatives 288 694 1 278 704 641 1 520 521 562 359
Insurance liabilities, customers bearing the risk 50 967 49 679 46 344 47 512 45 607 42 866 40 780 39 458 36 602
Liabilities to life insurance policyholders 210 230 208 726 205 257 207 024 206 880 216 799 217 625 224 093 221 564
Payable taxes 0 27 27 7 9 10 7 17 7
Deferred taxes 855 764 1 683 1 770 1 349 1 286 1 482 1 395 1 286
Other liabilities 2 135 1 735 1 661 3 899 3 823 3 639 6 607 4 086 4 882
Pension commitments 173 173 283 247 359 418 305 231 205
Subordinated loan capital 5 511 5 505 5 505 1 464 1 469 1 439 1 363 1 342 1 336
Total liabilities 270 159 267 304 262 038 262 626 260 136 267 977 268 689 271 186 266 242
Share capital 1 750 1 750 1 750 1 750 1 686 1 621 1 621 1 686 1 621
Share premium reserve 6 016 6 016 6 016 6 016 3 875 3 875 3 875 4 280 3 875
Other equity 13 286 12 981 12 650 12 300 13 955 13 489 12 979 12 249 11 903
Total equity 21 052 20 747 20 415 20 066 19 516 18 985 18 475 18 215 17 399
Total liabilities and equity 291 212 288 051 282 454 282 692 279 652 286 962 287 164 289 400 283 641
Insurance liablities sub-portfolio:
New pension products 72 155 68 986 65 808 66 918 63 570 59 801 56 983 54 765 51 169
Risk products 707 2 382 2 334 2 371 2 398 2 380 2 353 2 355 2 392
Traditional pension products 188 335 187 227 183 700 185 483 186 742 197 485 199 068 206 432 204 605
Total insurance liablilities 261 197 258 595 251 842 254 772 252 710 259 666 258 404 263 551 258 167
1) The figures encompass DNB Livsforsikring AS including subsidiaries as included in the DNB Group accounts before eliminations of intra-group transactions and balances.
2) In November 2015 a portfolio of residential mortgages amounting to approximately NOK 20 billion was transferred from DNB Boligkreditt to DNB Livsforsikring.
3) Due to changes in principles, some comparative figures have been restated. See further details in Accounting principles in the annual report for 2014.
- 76 -
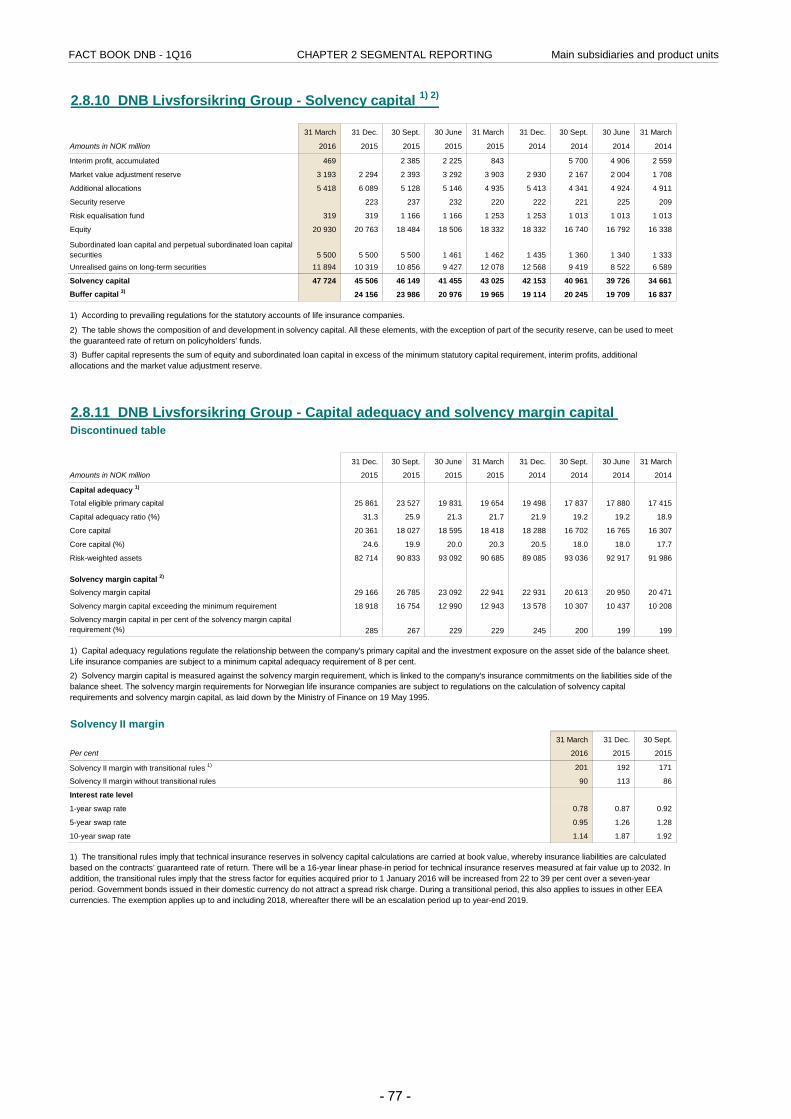
FACT BOOK DNB - 1Q16 CHAPTER 2 SEGMENTAL REPORTING Main subsidiaries and product units
2.8.10 DNB Livsforsikring Group - Solvency capital 1) 2)
31 March 31 Dec. 30 Sept. 30 June 31 March 31 Dec. 30 Sept. 30 June 31 March
Amounts in NOK million 2016 2015 2015 2015 2015 2014 2014 2014 2014
Interim profit, accumulated 469 2 385 2 225 843 5 700 4 906 2 559
Market value adjustment reserve 3 193 2 294 2 393 3 292 3 903 2 930 2 167 2 004 1 708
Additional allocations 5 418 6 089 5 128 5 146 4 935 5 413 4 341 4 924 4 911
Security reserve 223 237 232 220 222 221 225 209
Risk equalisation fund 319 319 1 166 1 166 1 253 1 253 1 013 1 013 1 013
Equity 20 930 20 763 18 484 18 506 18 332 18 332 16 740 16 792 16 338
Subordinated loan capital and perpetual subordinated loan capital securities 5 500 5 500 5 500 1 461 1 462 1 435 1 360 1 340 1 333 Unrealised gains on long-term securities 11 894 10 319 10 856 9 427 12 078 12 568 9 419 8 522 6 589
Solvency capital 47 724 45 506 46 149 41 455 43 025 42 153 40 961 39 726 34 661
Buffer capital 3) 24 156 23 986 20 976 19 965 19 114 20 245 19 709 16 837
Discontinued table
31 Dec. 30 Sept. 30 June 31 March 31 Dec. 30 Sept. 30 June 31 March
Amounts in NOK million 2015 2015 2015 2015 2014 2014 2014 2014
Capital adequacy 1)
Total eligible primary capital 25 861 23 527 19 831 19 654 19 498 17 837 17 880 17 415
Capital adequacy ratio (%) 31.3 25.9 21.3 21.7 21.9 19.2 19.2 18.9
Core capital 20 361 18 027 18 595 18 418 18 288 16 702 16 765 16 307
Core capital (%) 24.6 19.9 20.0 20.3 20.5 18.0 18.0 17.7
Risk-weighted assets 82 714 90 833 93 092 90 685 89 085 93 036 92 917 91 986
Solvency margin capital 2)
Solvency margin capital 29 166 26 785 23 092 22 941 22 931 20 613 20 950 20 471
Solvency margin capital exceeding the minimum requirement 18 918 16 754 12 990 12 943 13 578 10 307 10 437 10 208
Solvency margin capital in per cent of the solvency margin capital requirement (%) 285 267 229 229 245 200 199 199
31 March 31 Dec. 30 Sept.
Per cent 2016 2015 2015
Solvency II margin with transitional rules 1) 201 192 171
Solvency II margin without transitional rules 90 113 86
Interest rate level
1-year swap rate 0.78 0.87 0.92
5-year swap rate 0.95 1.26 1.28
10-year swap rate 1.14 1.87 1.92
Solvency II margin
1) The transitional rules imply that technical insurance reserves in solvency capital calculations are carried at book value, whereby insurance liabilities are calculated based on the contracts’ guaranteed rate of return. There will be a 16-year linear phase-in period for technical insurance reserves measured at fair value up to 2032. In addition, the transitional rules imply that the stress factor for equities acquired prior to 1 January 2016 will be increased from 22 to 39 per cent over a seven-year period. Government bonds issued in their domestic currency do not attract a spread risk charge. During a transitional period, this also applies to issues in other EEA currencies. The exemption applies up to and including 2018, whereafter there will be an escalation period up to year-end 2019.
2) Solvency margin capital is measured against the solvency margin requirement, which is linked to the company's insurance commitments on the liabilities side of the balance sheet. The solvency margin requirements for Norwegian life insurance companies are subject to regulations on the calculation of solvency capital requirements and solvency margin capital, as laid down by the Ministry of Finance on 19 May 1995.
1) According to prevailing regulations for the statutory accounts of life insurance companies.
2) The table shows the composition of and development in solvency capital. All these elements, with the exception of part of the security reserve, can be used to meet the guaranteed rate of return on policyholders' funds.
3) Buffer capital represents the sum of equity and subordinated loan capital in excess of the minimum statutory capital requirement, interim profits, additional allocations and the market value adjustment reserve.
2.8.11 DNB Livsforsikring Group - Capital adequacy and solvency margin capital
1) Capital adequacy regulations regulate the relationship between the company's primary capital and the investment exposure on the asset side of the balance sheet. Life insurance companies are subject to a minimum capital adequacy requirement of 8 per cent.
- 77 -
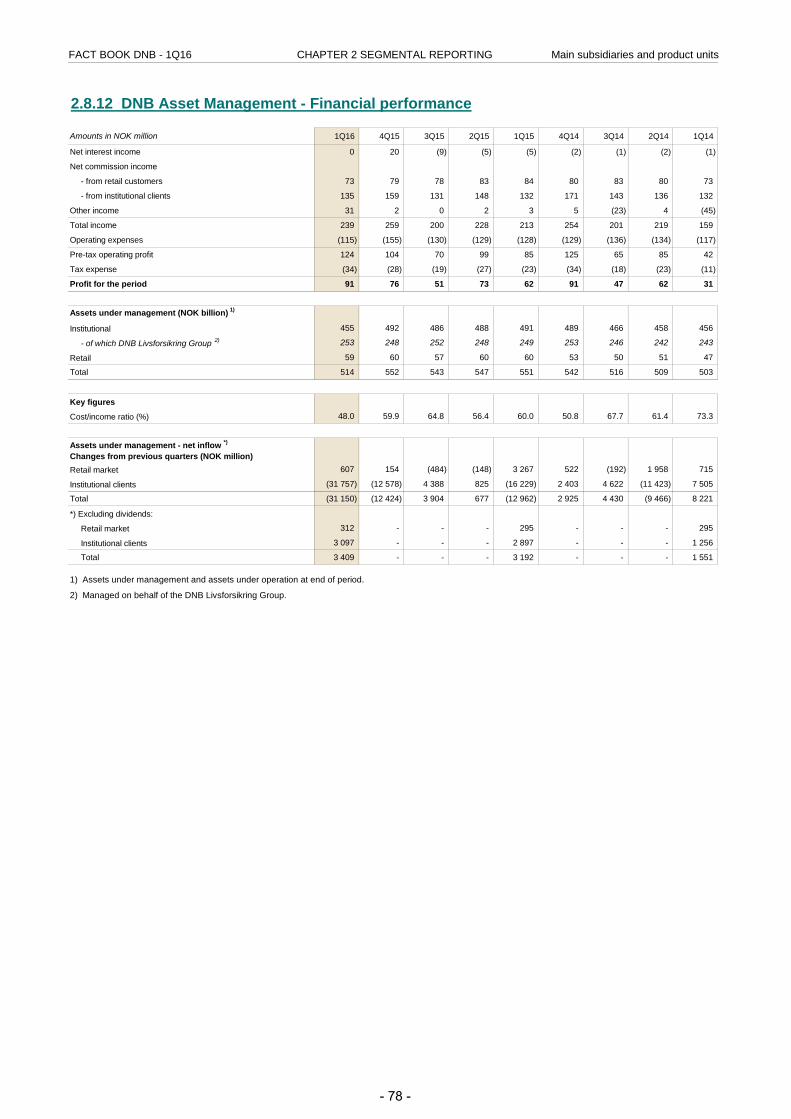
FACT BOOK DNB - 1Q16 CHAPTER 2 SEGMENTAL REPORTING Main subsidiaries and product units
2.8.12 DNB Asset Management - Financial performance
Amounts in NOK million 1Q16 4Q15 3Q15 2Q15 1Q15 4Q14 3Q14 2Q14 1Q14
Net interest income 0 20 (9) (5) (5) (2) (1) (2) (1)
Net commission income
- from retail customers 73 79 78 83 84 80 83 80 73
- from institutional clients 135 159 131 148 132 171 143 136 132
Other income 31 2 0 2 3 5 (23) 4 (45)
Total income 239 259 200 228 213 254 201 219 159
Operating expenses (115) (155) (130) (129) (128) (129) (136) (134) (117)
Pre-tax operating profit 124 104 70 99 85 125 65 85 42
Tax expense (34) (28) (19) (27) (23) (34) (18) (23) (11)
Profit for the period 91 76 51 73 62 91 47 62 31
Assets under management (NOK billion) 1)
Institutional 455 492 486 488 491 489 466 458 456
- of which DNB Livsforsikring Group 2) 253 248 252 248 249 253 246 242 243
Retail 59 60 57 60 60 53 50 51 47
Total 514 552 543 547 551 542 516 509 503
Key figures
Cost/income ratio (%) 48.0 59.9 64.8 56.4 60.0 50.8 67.7 61.4 73.3
Assets under management - net inflow *)
Changes from previous quarters (NOK million)Retail market 607 154 (484) (148) 3 267 522 (192) 1 958 715
Institutional clients (31 757) (12 578) 4 388 825 (16 229) 2 403 4 622 (11 423) 7 505
Total (31 150) (12 424) 3 904 677 (12 962) 2 925 4 430 (9 466) 8 221
*) Excluding dividends:
Retail market 312 - - - 295 - - - 295
Institutional clients 3 097 - - - 2 897 - - - 1 256
Total 3 409 - - - 3 192 - - - 1 551
1) Assets under management and assets under operation at end of period.
2) Managed on behalf of the DNB Livsforsikring Group.
- 78 -
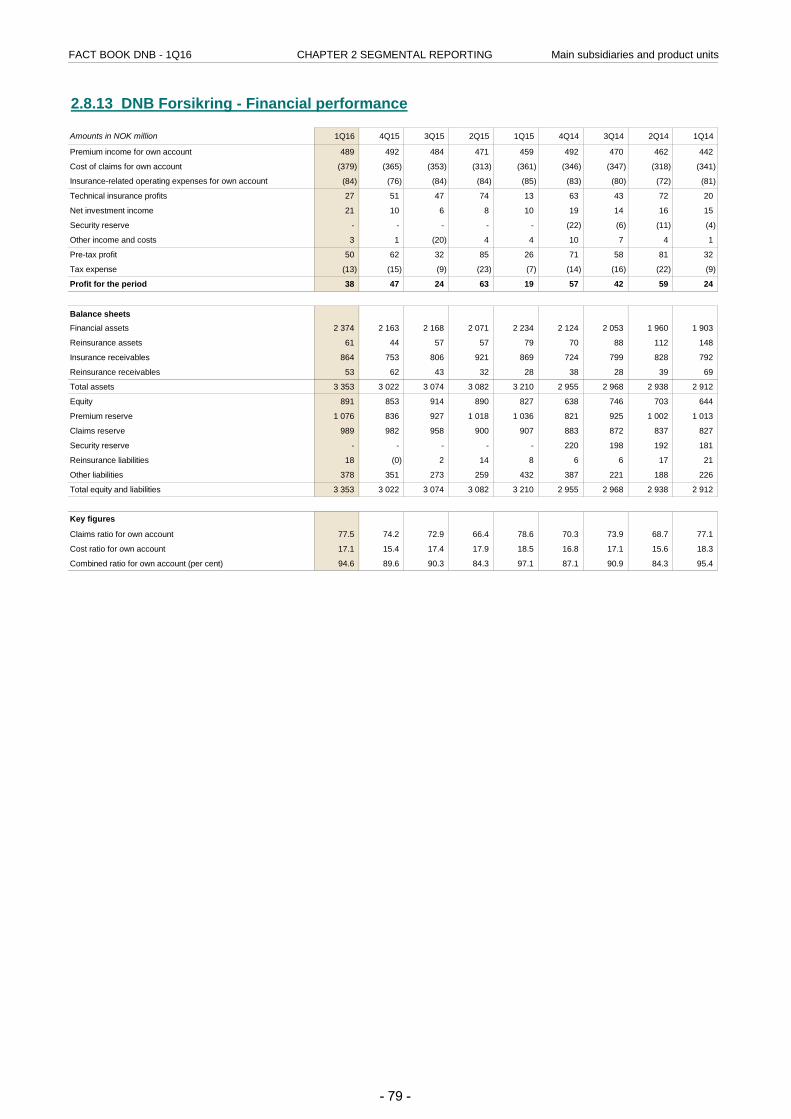
FACT BOOK DNB - 1Q16 CHAPTER 2 SEGMENTAL REPORTING Main subsidiaries and product units
2.8.13 DNB Forsikring - Financial performance
Amounts in NOK million 1Q16 4Q15 3Q15 2Q15 1Q15 4Q14 3Q14 2Q14 1Q14
Premium income for own account 489 492 484 471 459 492 470 462 442
Cost of claims for own account (379) (365) (353) (313) (361) (346) (347) (318) (341)
Insurance-related operating expenses for own account (84) (76) (84) (84) (85) (83) (80) (72) (81)
Technical insurance profits 27 51 47 74 13 63 43 72 20
Net investment income 21 10 6 8 10 19 14 16 15
Security reserve - - - - - (22) (6) (11) (4)
Other income and costs 3 1 (20) 4 4 10 7 4 1
Pre-tax profit 50 62 32 85 26 71 58 81 32
Tax expense (13) (15) (9) (23) (7) (14) (16) (22) (9)
Profit for the period 38 47 24 63 19 57 42 59 24
Balance sheets
Financial assets 2 374 2 163 2 168 2 071 2 234 2 124 2 053 1 960 1 903
Reinsurance assets 61 44 57 57 79 70 88 112 148
Insurance receivables 864 753 806 921 869 724 799 828 792
Reinsurance receivables 53 62 43 32 28 38 28 39 69
Total assets 3 353 3 022 3 074 3 082 3 210 2 955 2 968 2 938 2 912
Equity 891 853 914 890 827 638 746 703 644
Premium reserve 1 076 836 927 1 018 1 036 821 925 1 002 1 013
Claims reserve 989 982 958 900 907 883 872 837 827
Security reserve - - - - - 220 198 192 181
Reinsurance liabilities 18 (0) 2 14 8 6 6 17 21
Other liabilities 378 351 273 259 432 387 221 188 226
Total equity and liabilities 3 353 3 022 3 074 3 082 3 210 2 955 2 968 2 938 2 912
Key figures
Claims ratio for own account 77.5 74.2 72.9 66.4 78.6 70.3 73.9 68.7 77.1
Cost ratio for own account 17.1 15.4 17.4 17.9 18.5 16.8 17.1 15.6 18.3
Combined ratio for own account (per cent) 94.6 89.6 90.3 84.3 97.1 87.1 90.9 84.3 95.4
- 79 -
FACT BOOK DNB - 1Q16
Chapter 3 - About DNBDNB - Norway's leading financial services group
DNB's market shares in Norway
Group business structures and financial governance
Shareholder structure
- 80 -
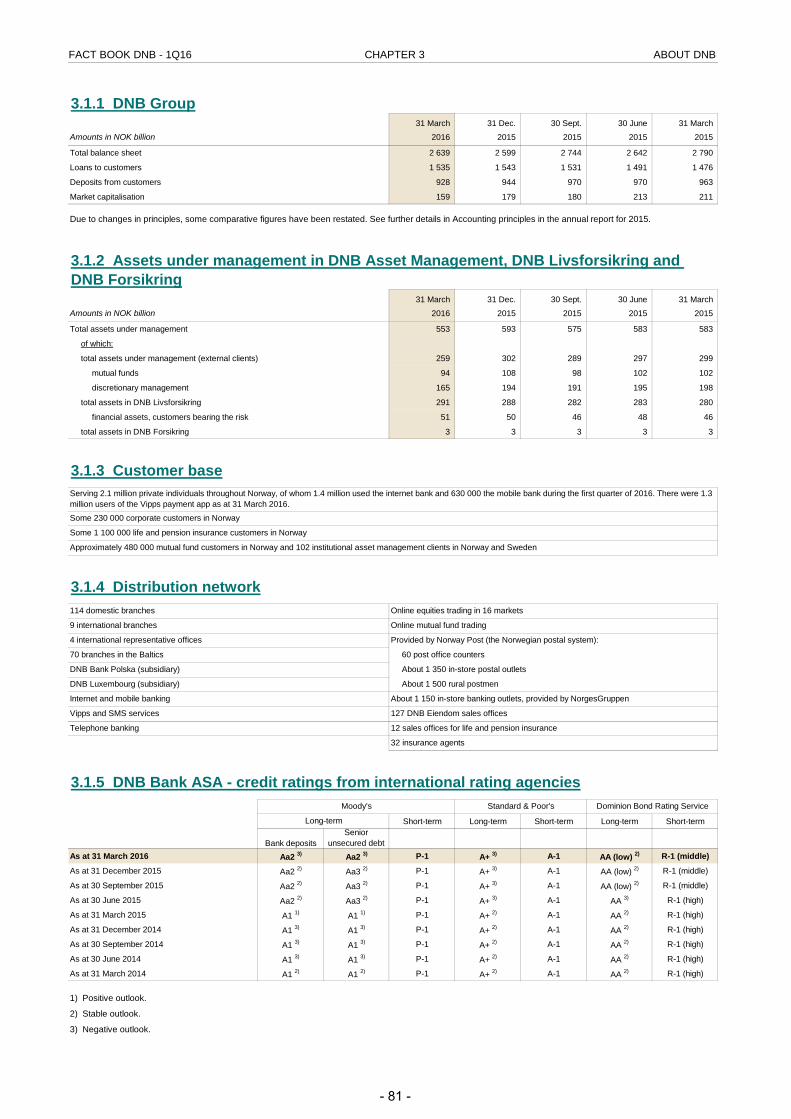
FACT BOOK DNB - 1Q16 CHAPTER 3 ABOUT DNB
3.1.1 DNB Group31 March 31 Dec. 30 Sept. 30 June 31 March
Amounts in NOK billion 2016 2015 2015 2015 2015
Total balance sheet 2 639 2 599 2 744 2 642 2 790
Loans to customers 1 535 1 543 1 531 1 491 1 476
Deposits from customers 928 944 970 970 963
Market capitalisation 159 179 180 213 211
31 March 31 Dec. 30 Sept. 30 June 31 MarchAmounts in NOK billion 2016 2015 2015 2015 2015
Total assets under management 553 593 575 583 583
of which:
total assets under management (external clients) 259 302 289 297 299
mutual funds 94 108 98 102 102
discretionary management 165 194 191 195 198
total assets in DNB Livsforsikring 291 288 282 283 280
financial assets, customers bearing the risk 51 50 46 48 46
total assets in DNB Forsikring 3 3 3 3 3
3.1.3 Customer base
3.1.4 Distribution network
3.1.5 DNB Bank ASA - credit ratings from international rating agencies
Short-term Long-term Short-term Long-term Short-term
Bank depositsSenior
unsecured debtAs at 31 March 2016 Aa2 3) Aa2 3) P-1 A+ 3) A-1 AA (low) 2) R-1 (middle)
As at 31 December 2015 Aa2 2) Aa3 2) P-1 A+ 3) A-1 AA (low) 2) R-1 (middle)
As at 30 September 2015 Aa2 2) Aa3 2) P-1 A+ 3) A-1 AA (low) 2) R-1 (middle)
As at 30 June 2015 Aa2 2) Aa3 2) P-1 A+ 3) A-1 AA 3) R-1 (high)
As at 31 March 2015 A1 1) A1 1) P-1 A+ 2) A-1 AA 2) R-1 (high)
As at 31 December 2014 A1 3) A1 3) P-1 A+ 2) A-1 AA 2) R-1 (high)
As at 30 September 2014 A1 3) A1 3) P-1 A+ 2) A-1 AA 2) R-1 (high)
As at 30 June 2014 A1 3) A1 3) P-1 A+ 2) A-1 AA 2) R-1 (high)
As at 31 March 2014 A1 2) A1 2) P-1 A+ 2) A-1 AA 2) R-1 (high)
1) Positive outlook.
2) Stable outlook.
3) Negative outlook.
Moody's Standard & Poor's Dominion Bond Rating Service
Telephone banking 12 sales offices for life and pension insurance
32 insurance agents
DNB Luxembourg (subsidiary)
Internet and mobile banking
Vipps and SMS services
About 1 350 in-store postal outlets
About 1 500 rural postmen
About 1 150 in-store banking outlets, provided by NorgesGruppen
127 DNB Eiendom sales offices
Long-term
Due to changes in principles, some comparative figures have been restated. See further details in Accounting principles in the annual report for 2015.
Approximately 480 000 mutual fund customers in Norway and 102 institutional asset management clients in Norway and Sweden
Serving 2.1 million private individuals throughout Norway, of whom 1.4 million used the internet bank and 630 000 the mobile bank during the first quarter of 2016. There were 1.3 million users of the Vipps payment app as at 31 March 2016.
Some 230 000 corporate customers in Norway
Some 1 100 000 life and pension insurance customers in Norway
3.1.2 Assets under management in DNB Asset Management, DNB Livsforsikring and DNB Forsikring
114 domestic branches Online equities trading in 16 markets
9 international branches
4 international representative offices
70 branches in the Baltics
Online mutual fund trading
Provided by Norway Post (the Norwegian postal system):
60 post office counters
DNB Bank Polska (subsidiary)
- 81 -
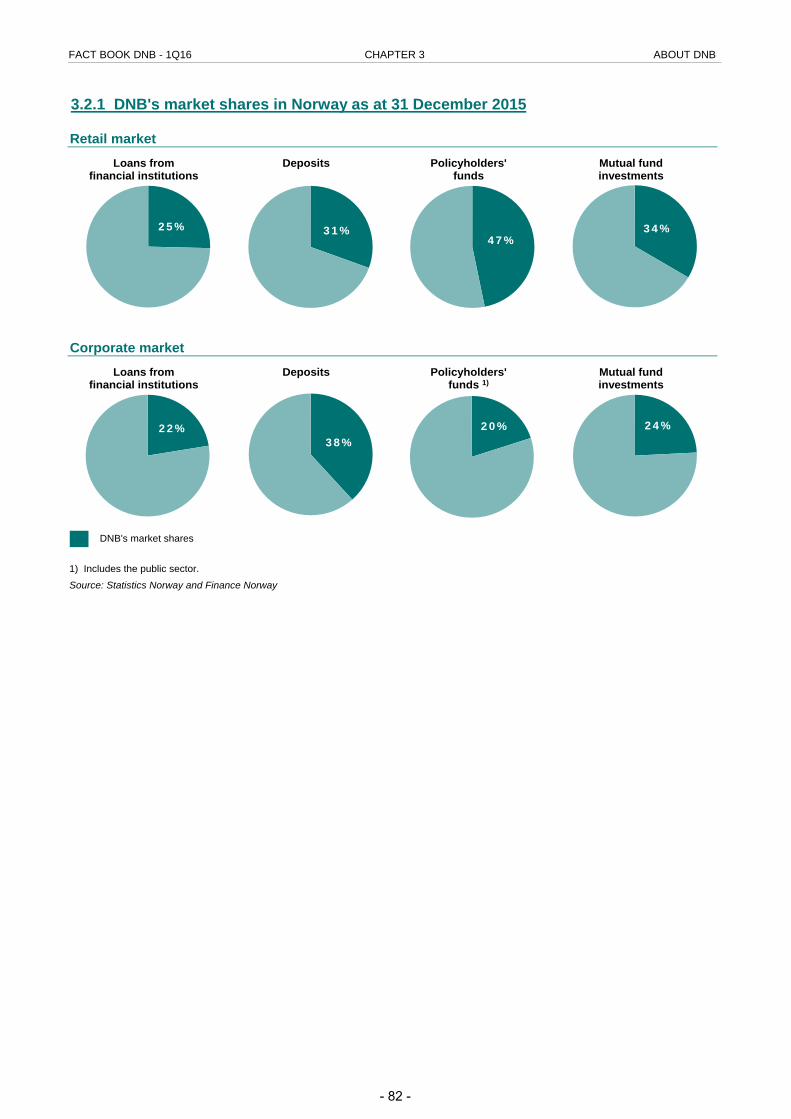
FACT BOOK DNB - 1Q16 CHAPTER 3 ABOUT DNB
3.2.1 DNB's market shares in Norway as at 31 December 2015
Retail market
Corporate market
DNB's market shares
1) Includes the public sector.
Source: Statistics Norway and Finance Norway
Loans fromfinancial institutions
25%
Deposits
31%
Policyholders'funds
47%
Mutual fundinvestments
34%
Loans fromfinancial institutions
22%
Deposits
38%
Policyholders'funds 1)
20%
Mutual fundinvestments
24%
- 82 -
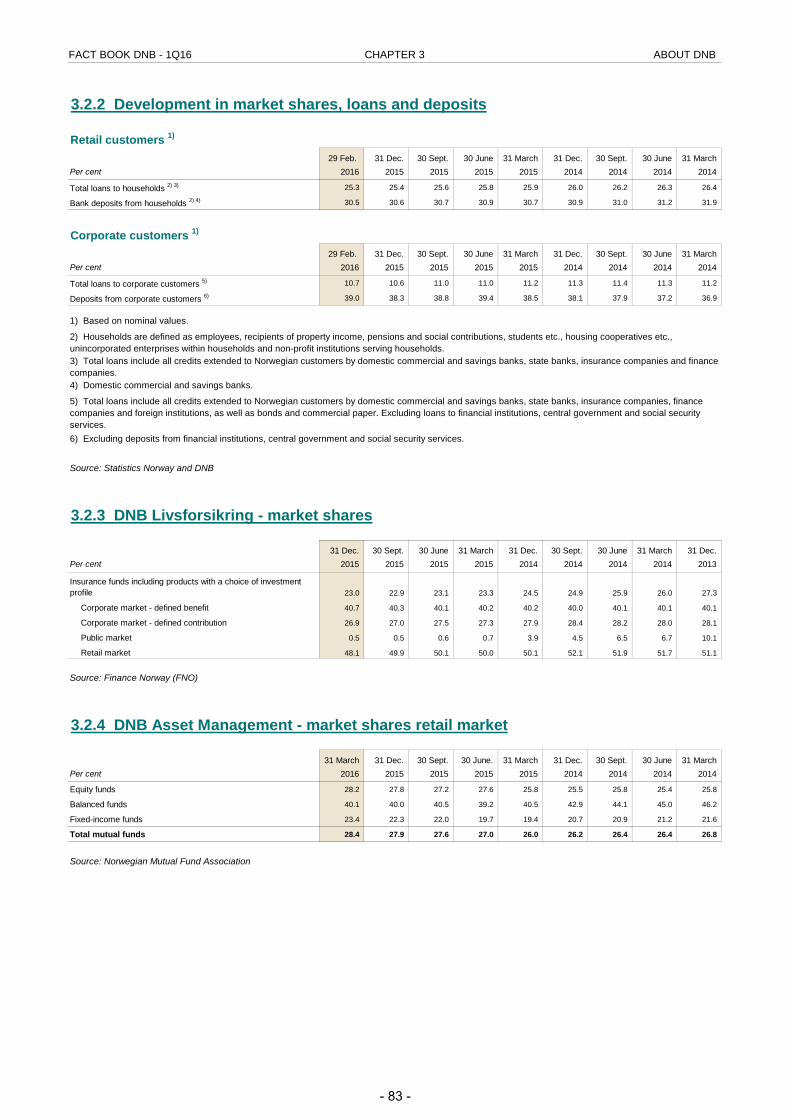
FACT BOOK DNB - 1Q16 CHAPTER 3 ABOUT DNB
3.2.2 Development in market shares, loans and deposits
Retail customers 1)
29 Feb. 31 Dec. 30 Sept. 30 June 31 March 31 Dec. 30 Sept. 30 June 31 MarchPer cent 2016 2015 2015 2015 2015 2014 2014 2014 2014
Total loans to households 2) 3) 25.3 25.4 25.6 25.8 25.9 26.0 26.2 26.3 26.4
Bank deposits from households 2) 4) 30.5 30.6 30.7 30.9 30.7 30.9 31.0 31.2 31.9
Corporate customers 1)
29 Feb. 31 Dec. 30 Sept. 30 June 31 March 31 Dec. 30 Sept. 30 June 31 MarchPer cent 2016 2015 2015 2015 2015 2014 2014 2014 2014
Total loans to corporate customers 5) 10.7 10.6 11.0 11.0 11.2 11.3 11.4 11.3 11.2
Deposits from corporate customers 6) 39.0 38.3 38.8 39.4 38.5 38.1 37.9 37.2 36.9
Source: Statistics Norway and DNB
3.2.3 DNB Livsforsikring - market shares
31 Dec. 30 Sept. 30 June 31 March 31 Dec. 30 Sept. 30 June 31 March 31 Dec.Per cent 2015 2015 2015 2015 2014 2014 2014 2014 2013
Insurance funds including products with a choice of investment profile 23.0 22.9 23.1 23.3 24.5 24.9 25.9 26.0 27.3
Corporate market - defined benefit 40.7 40.3 40.1 40.2 40.2 40.0 40.1 40.1 40.1
Corporate market - defined contribution 26.9 27.0 27.5 27.3 27.9 28.4 28.2 28.0 28.1
Public market 0.5 0.5 0.6 0.7 3.9 4.5 6.5 6.7 10.1
Retail market 48.1 49.9 50.1 50.0 50.1 52.1 51.9 51.7 51.1
Source: Finance Norway (FNO)
3.2.4 DNB Asset Management - market shares retail market
31 March 31 Dec. 30 Sept. 30 June. 31 March 31 Dec. 30 Sept. 30 June 31 MarchPer cent 2016 2015 2015 2015 2015 2014 2014 2014 2014
Equity funds 28.2 27.8 27.2 27.6 25.8 25.5 25.8 25.4 25.8
Balanced funds 40.1 40.0 40.5 39.2 40.5 42.9 44.1 45.0 46.2
Fixed-income funds 23.4 22.3 22.0 19.7 19.4 20.7 20.9 21.2 21.6
Total mutual funds 28.4 27.9 27.6 27.0 26.0 26.2 26.4 26.4 26.8
Source: Norwegian Mutual Fund Association
6) Excluding deposits from financial institutions, central government and social security services.
1) Based on nominal values.
2) Households are defined as employees, recipients of property income, pensions and social contributions, students etc., housing cooperatives etc., unincorporated enterprises within households and non-profit institutions serving households.3) Total loans include all credits extended to Norwegian customers by domestic commercial and savings banks, state banks, insurance companies and finance companies.4) Domestic commercial and savings banks.
5) Total loans include all credits extended to Norwegian customers by domestic commercial and savings banks, state banks, insurance companies, finance companies and foreign institutions, as well as bonds and commercial paper. Excluding loans to financial institutions, central government and social security services.
- 83 -
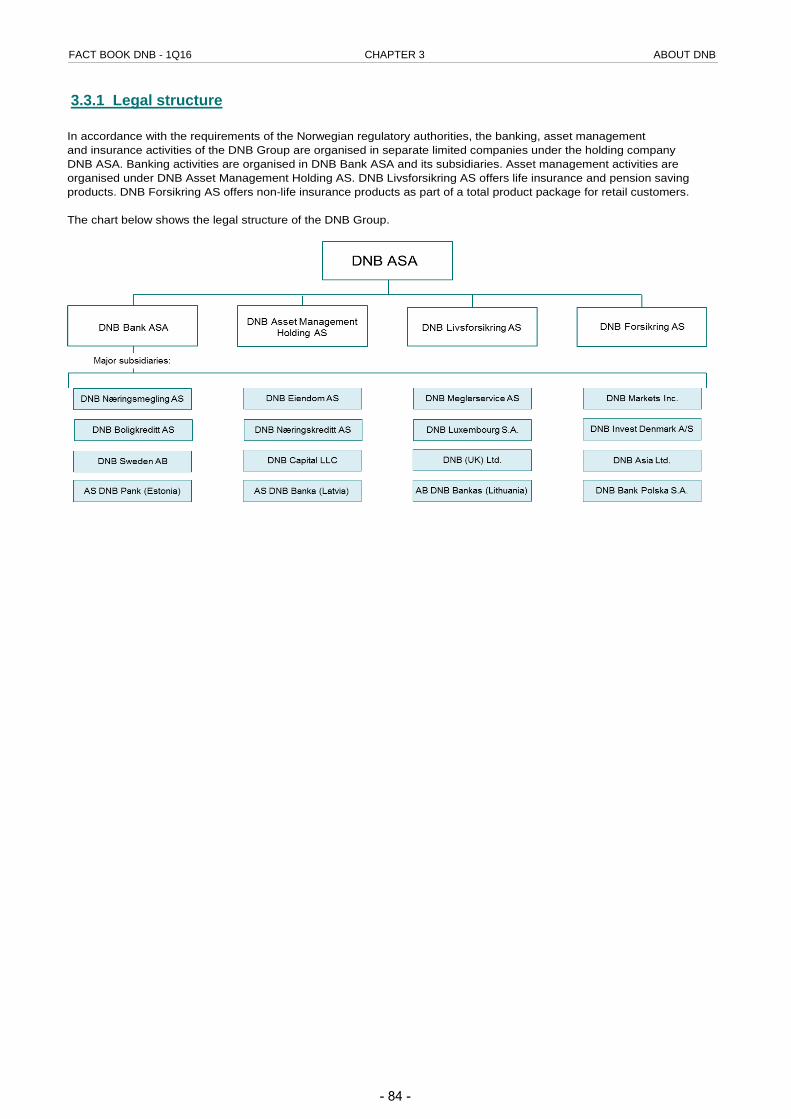
FACT BOOK DNB - 1Q16 CHAPTER 3 ABOUT DNB
3.3.1 Legal structure
In accordance with the requirements of the Norwegian regulatory authorities, the banking, asset management and insurance activities of the DNB Group are organised in separate limited companies under the holding company DNB ASA. Banking activities are organised in DNB Bank ASA and its subsidiaries. Asset management activities are organised under DNB Asset Management Holding AS. DNB Livsforsikring AS offers life insurance and pension saving products. DNB Forsikring AS offers non-life insurance products as part of a total product package for retail customers. The chart below shows the legal structure of the DNB Group.
- 84 -
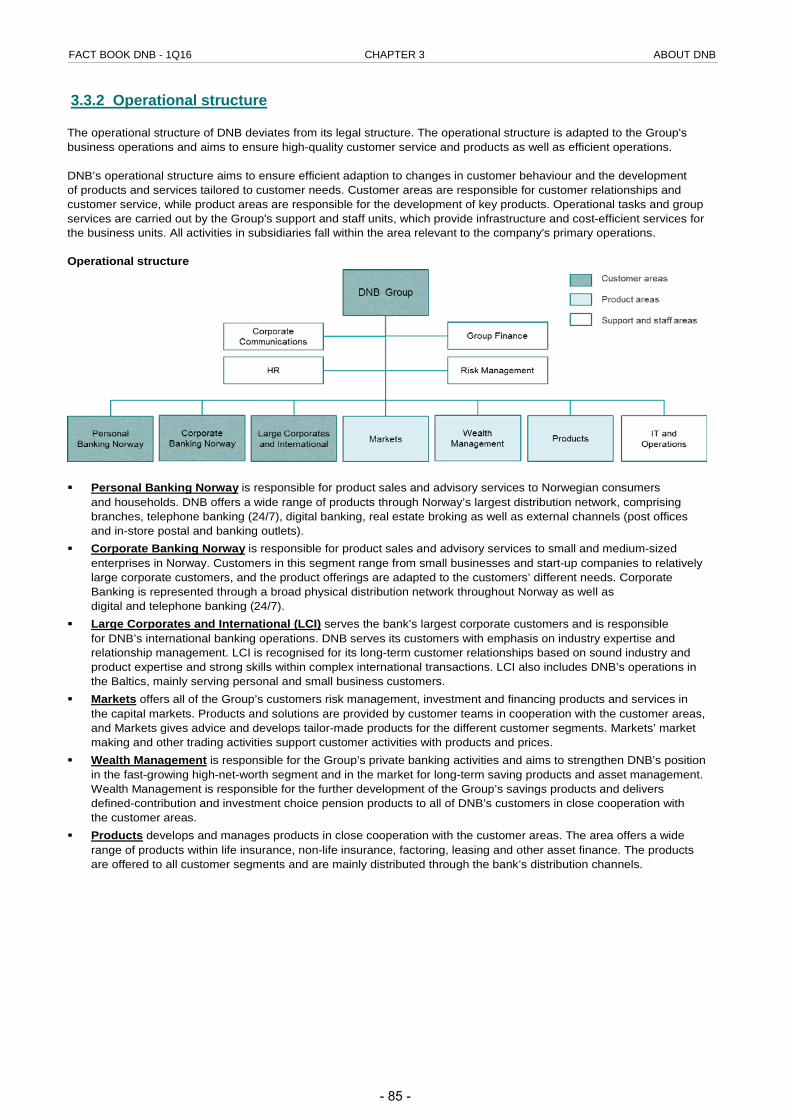
FACT BOOK DNB - 1Q16 CHAPTER 3 ABOUT DNB
3.3.2 Operational structure
The operational structure of DNB deviates from its legal structure. The operational structure is adapted to the Group's business operations and aims to ensure high-quality customer service and products as well as efficient operations. DNB’s operational structure aims to ensure efficient adaption to changes in customer behaviour and the development of products and services tailored to customer needs. Customer areas are responsible for customer relationships and customer service, while product areas are responsible for the development of key products. Operational tasks and group services are carried out by the Group's support and staff units, which provide infrastructure and cost-efficient services for the business units. All activities in subsidiaries fall within the area relevant to the company's primary operations. Operational structure
Personal Banking Norway is responsible for product sales and advisory services to Norwegian consumers
and households. DNB offers a wide range of products through Norway’s largest distribution network, comprising branches, telephone banking (24/7), digital banking, real estate broking as well as external channels (post offices and in-store postal and banking outlets).
Corporate Banking Norway is responsible for product sales and advisory services to small and medium-sized enterprises in Norway. Customers in this segment range from small businesses and start-up companies to relatively large corporate customers, and the product offerings are adapted to the customers’ different needs. Corporate Banking is represented through a broad physical distribution network throughout Norway as well as digital and telephone banking (24/7).
Large Corporates and International (LCI) serves the bank’s largest corporate customers and is responsible for DNB’s international banking operations. DNB serves its customers with emphasis on industry expertise and relationship management. LCI is recognised for its long-term customer relationships based on sound industry and product expertise and strong skills within complex international transactions. LCI also includes DNB’s operations in the Baltics, mainly serving personal and small business customers.
Markets offers all of the Group’s customers risk management, investment and financing products and services in the capital markets. Products and solutions are provided by customer teams in cooperation with the customer areas, and Markets gives advice and develops tailor-made products for the different customer segments. Markets’ market making and other trading activities support customer activities with products and prices.
Wealth Management is responsible for the Group’s private banking activities and aims to strengthen DNB’s position in the fast-growing high-net-worth segment and in the market for long-term saving products and asset management. Wealth Management is responsible for the further development of the Group’s savings products and delivers defined-contribution and investment choice pension products to all of DNB’s customers in close cooperation with the customer areas.
Products develops and manages products in close cooperation with the customer areas. The area offers a wide range of products within life insurance, non-life insurance, factoring, leasing and other asset finance. The products are offered to all customer segments and are mainly distributed through the bank’s distribution channels.
- 85 -
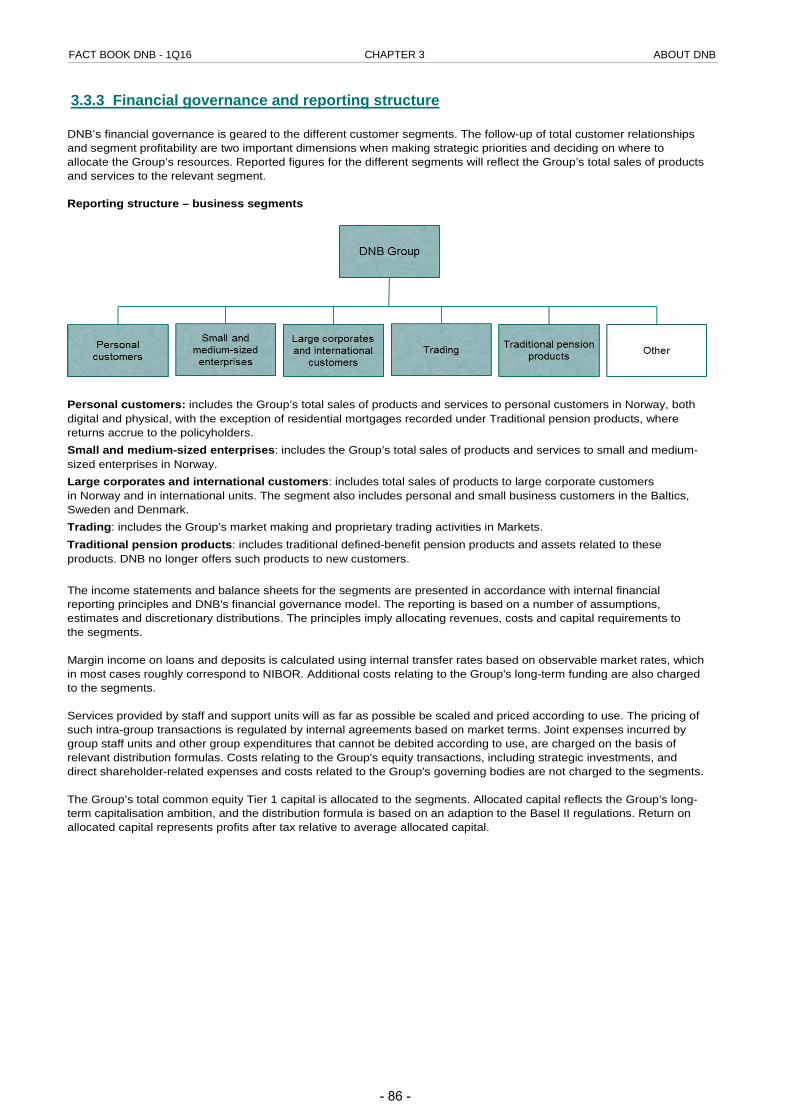
FACT BOOK DNB - 1Q16 CHAPTER 3 ABOUT DNB
3.3.3 Financial governance and reporting structure
DNB’s financial governance is geared to the different customer segments. The follow-up of total customer relationships and segment profitability are two important dimensions when making strategic priorities and deciding on where to allocate the Group’s resources. Reported figures for the different segments will reflect the Group’s total sales of products and services to the relevant segment. Reporting structure – business segments
Personal customers: includes the Group’s total sales of products and services to personal customers in Norway, both digital and physical, with the exception of residential mortgages recorded under Traditional pension products, where returns accrue to the policyholders. Small and medium-sized enterprises: includes the Group’s total sales of products and services to small and medium-sized enterprises in Norway. Large corporates and international customers: includes total sales of products to large corporate customers in Norway and in international units. The segment also includes personal and small business customers in the Baltics, Sweden and Denmark. Trading: includes the Group’s market making and proprietary trading activities in Markets. Traditional pension products: includes traditional defined-benefit pension products and assets related to these products. DNB no longer offers such products to new customers. The income statements and balance sheets for the segments are presented in accordance with internal financial reporting principles and DNB's financial governance model. The reporting is based on a number of assumptions, estimates and discretionary distributions. The principles imply allocating revenues, costs and capital requirements to the segments. Margin income on loans and deposits is calculated using internal transfer rates based on observable market rates, which in most cases roughly correspond to NIBOR. Additional costs relating to the Group's long-term funding are also charged to the segments. Services provided by staff and support units will as far as possible be scaled and priced according to use. The pricing of such intra-group transactions is regulated by internal agreements based on market terms. Joint expenses incurred by group staff units and other group expenditures that cannot be debited according to use, are charged on the basis of relevant distribution formulas. Costs relating to the Group's equity transactions, including strategic investments, and direct shareholder-related expenses and costs related to the Group's governing bodies are not charged to the segments. The Group’s total common equity Tier 1 capital is allocated to the segments. Allocated capital reflects the Group’s long-term capitalisation ambition, and the distribution formula is based on an adaption to the Basel II regulations. Return on allocated capital represents profits after tax relative to average allocated capital.
- 86 -
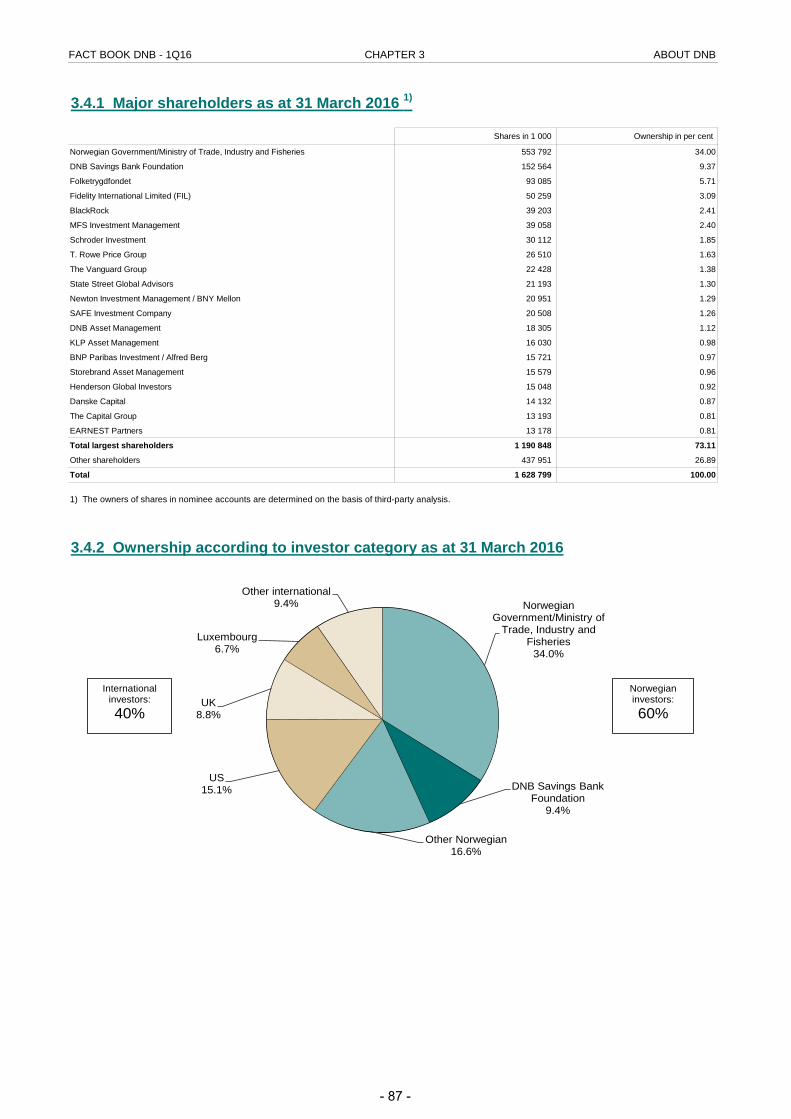
FACT BOOK DNB - 1Q16 CHAPTER 3 ABOUT DNB
3.4.1 Major shareholders as at 31 March 2016 1)
Shares in 1 000 Ownership in per cent
Norwegian Government/Ministry of Trade, Industry and Fisheries 553 792 34.00
DNB Savings Bank Foundation 152 564 9.37
Folketrygdfondet 93 085 5.71
Fidelity International Limited (FIL) 50 259 3.09
BlackRock 39 203 2.41
MFS Investment Management 39 058 2.40
Schroder Investment 30 112 1.85
T. Rowe Price Group 26 510 1.63
The Vanguard Group 22 428 1.38
State Street Global Advisors 21 193 1.30
Newton Investment Management / BNY Mellon 20 951 1.29
SAFE Investment Company 20 508 1.26
DNB Asset Management 18 305 1.12
KLP Asset Management 16 030 0.98
BNP Paribas Investment / Alfred Berg 15 721 0.97
Storebrand Asset Management 15 579 0.96
Henderson Global Investors 15 048 0.92
Danske Capital 14 132 0.87
The Capital Group 13 193 0.81
EARNEST Partners 13 178 0.81
Total largest shareholders 1 190 848 73.11
Other shareholders 437 951 26.89
Total 1 628 799 100.00
1) The owners of shares in nominee accounts are determined on the basis of third-party analysis.
3.4.2 Ownership according to investor category as at 31 March 2016
Norwegian Government/Ministry of
Trade, Industry and Fisheries
34.0%
DNB Savings Bank Foundation
9.4%
Other Norwegian16.6%
US15.1%
UK8.8%
Luxembourg6.7%
Other international9.4%
Norwegianinvestors:
60%
Internationalinvestors:
40%
- 87 -
FACT BOOK DNB - 1Q16
Chapter 4 - The Norwegian economy
- 88 -
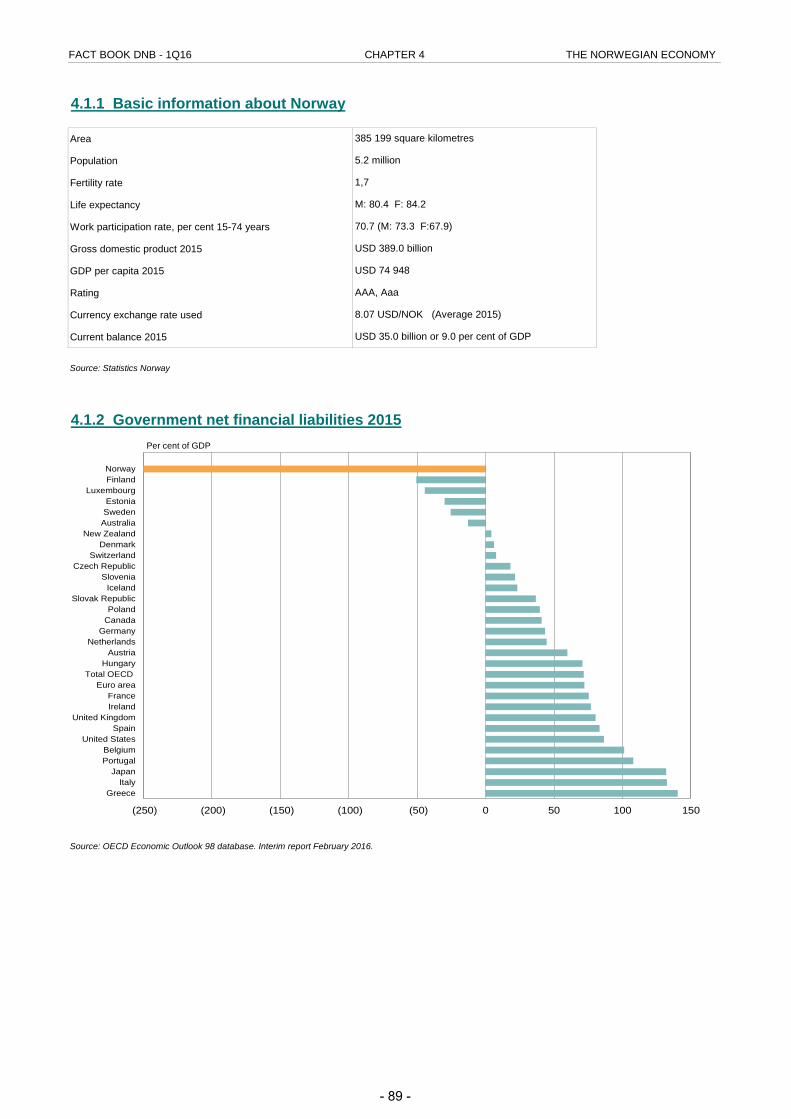
FACT BOOK DNB - 1Q16 CHAPTER 4 THE NORWEGIAN ECONOMY
4.1.1 Basic information about Norway
Area
Population
Fertility rate
Life expectancy
Work participation rate, per cent 15-74 years
Gross domestic product 2015
GDP per capita 2015
Rating
Currency exchange rate used
Current balance 2015
Source: Statistics Norway
4.1.2 Government net financial liabilities 2015 Per cent of GDP
Source: OECD Economic Outlook 98 database. Interim report February 2016.
USD 74 948
AAA, Aaa
8.07 USD/NOK (Average 2015)
USD 35.0 billion or 9.0 per cent of GDP
385 199 square kilometres
5.2 million
1,7
M: 80.4 F: 84.2
USD 389.0 billion
70.7 (M: 73.3 F:67.9)
(250) (200) (150) (100) (50) 0 50 100 150
GreeceItaly
JapanPortugalBelgium
United StatesSpain
United KingdomIrelandFrance
Euro areaTotal OECD
HungaryAustria
NetherlandsGermany
CanadaPoland
Slovak RepublicIceland
SloveniaCzech Republic
SwitzerlandDenmark
New ZealandAustraliaSwedenEstonia
LuxembourgFinlandNorway
- 89 -
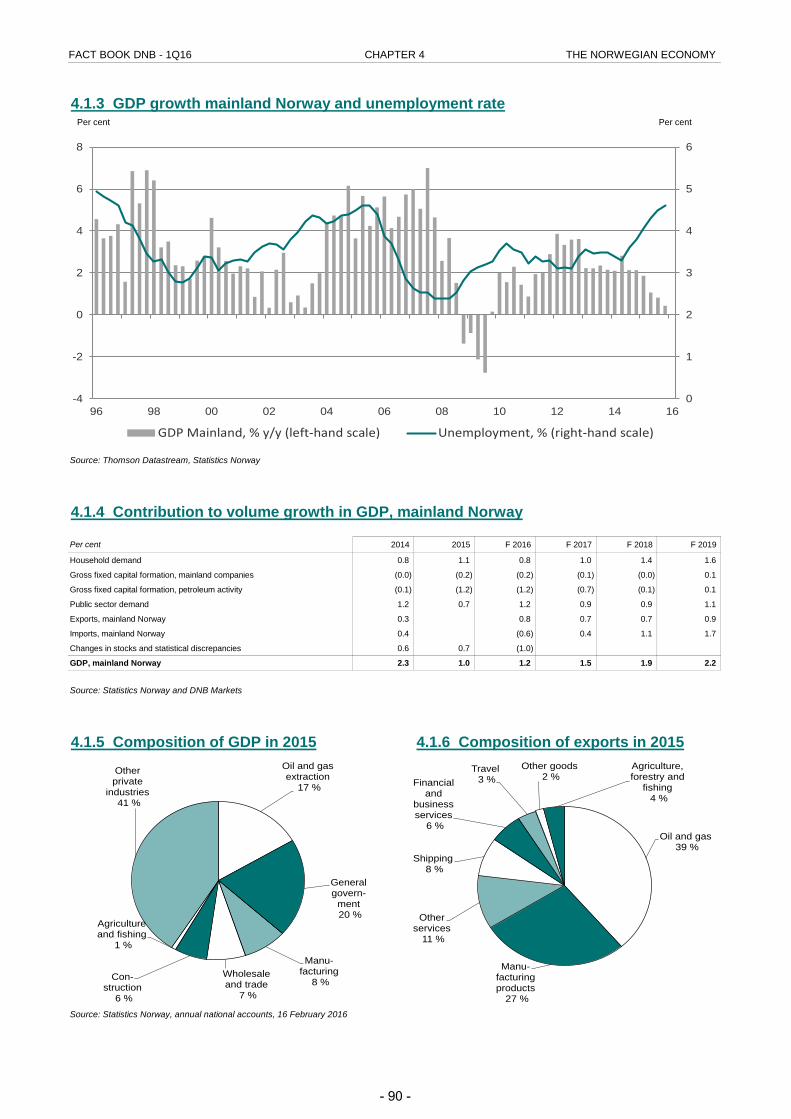
FACT BOOK DNB - 1Q16 CHAPTER 4 THE NORWEGIAN ECONOMY
4.1.3 GDP growth mainland Norway and unemployment rate Per cent Per cent
Source: Thomson Datastream, Statistics Norway
4.1.4 Contribution to volume growth in GDP, mainland Norway
Per cent 2014 2015 F 2016 F 2017 F 2018 F 2019
Household demand 0.8 1.1 0.8 1.0 1.4 1.6
Gross fixed capital formation, mainland companies (0.0) (0.2) (0.2) (0.1) (0.0) 0.1
Gross fixed capital formation, petroleum activity (0.1) (1.2) (1.2) (0.7) (0.1) 0.1
Public sector demand 1.2 0.7 1.2 0.9 0.9 1.1
Exports, mainland Norway 0.3 0.8 0.7 0.7 0.9
Imports, mainland Norway 0.4 (0.6) 0.4 1.1 1.7
Changes in stocks and statistical discrepancies 0.6 0.7 (1.0)
GDP, mainland Norway 2.3 1.0 1.2 1.5 1.9 2.2
Source: Statistics Norway and DNB Markets
4.1.5 Composition of GDP in 2015 4.1.6 Composition of exports in 2015
Source: Statistics Norway, annual national accounts, 16 February 2016
0
1
2
3
4
5
6
-4
-2
0
2
4
6
8
96 98 00 02 04 06 08 10 12 14 16
GDP Mainland, % y/y (left-hand scale) Unemployment, % (right-hand scale)
Oil and gas extraction
17 %
General govern-
ment20 %
Manu-facturing
8 %Wholesale and trade
7 %
Con-struction
6 %
Agriculture and fishing
1 %
Other private
industries41 %
Oil and gas39 %
Manu-facturing products
27 %
Other services
11 %
Shipping8 %
Financial and
business services
6 %
Travel3 %
Other goods2 %
Agriculture, forestry and
fishing4 %
- 90 -
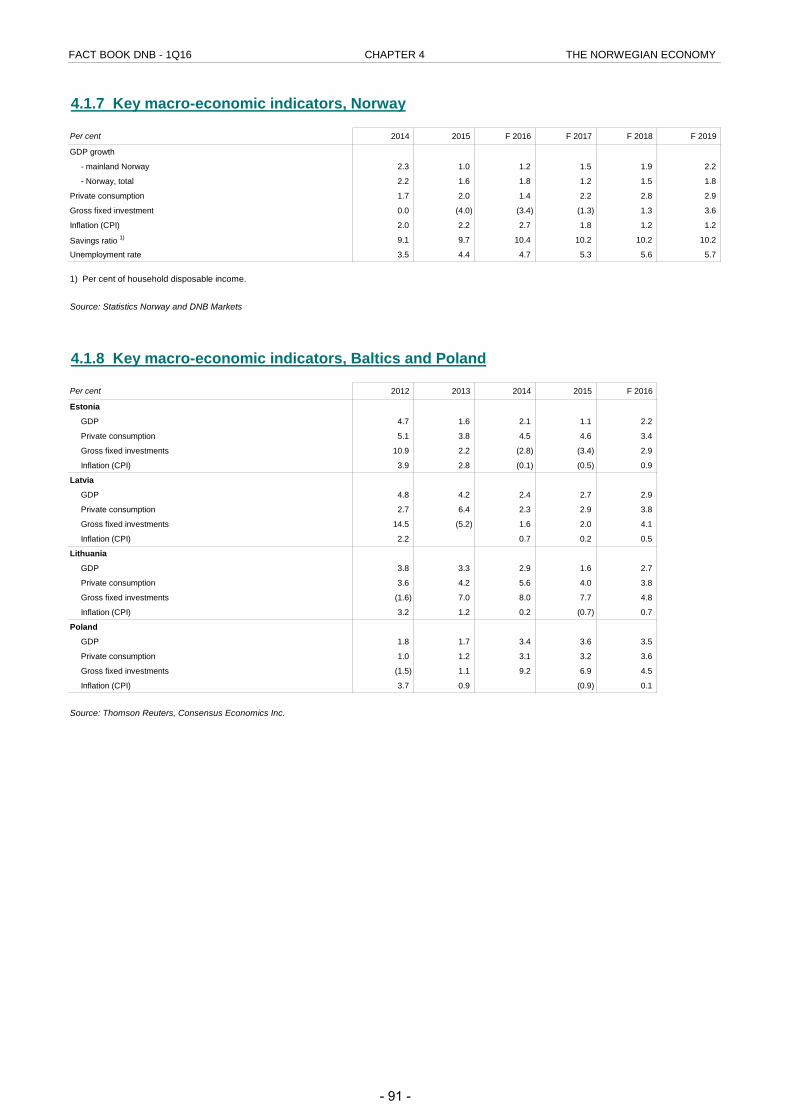
FACT BOOK DNB - 1Q16 CHAPTER 4 THE NORWEGIAN ECONOMY
4.1.7 Key macro-economic indicators, Norway
Per cent 2014 2015 F 2016 F 2017 F 2018 F 2019
GDP growth
- mainland Norway 2.3 1.0 1.2 1.5 1.9 2.2
- Norway, total 2.2 1.6 1.8 1.2 1.5 1.8
Private consumption 1.7 2.0 1.4 2.2 2.8 2.9
Gross fixed investment 0.0 (4.0) (3.4) (1.3) 1.3 3.6
Inflation (CPI) 2.0 2.2 2.7 1.8 1.2 1.2
Savings ratio 1) 9.1 9.7 10.4 10.2 10.2 10.2
Unemployment rate 3.5 4.4 4.7 5.3 5.6 5.7
1) Per cent of household disposable income.
Source: Statistics Norway and DNB Markets
4.1.8 Key macro-economic indicators, Baltics and Poland
Per cent 2012 2013 2014 2015 F 2016
Estonia
GDP 4.7 1.6 2.1 1.1 2.2
Private consumption 5.1 3.8 4.5 4.6 3.4
Gross fixed investments 10.9 2.2 (2.8) (3.4) 2.9
Inflation (CPI) 3.9 2.8 (0.1) (0.5) 0.9
Latvia
GDP 4.8 4.2 2.4 2.7 2.9
Private consumption 2.7 6.4 2.3 2.9 3.8
Gross fixed investments 14.5 (5.2) 1.6 2.0 4.1
Inflation (CPI) 2.2 0.7 0.2 0.5
Lithuania
GDP 3.8 3.3 2.9 1.6 2.7
Private consumption 3.6 4.2 5.6 4.0 3.8
Gross fixed investments (1.6) 7.0 8.0 7.7 4.8
Inflation (CPI) 3.2 1.2 0.2 (0.7) 0.7
Poland
GDP 1.8 1.7 3.4 3.6 3.5
Private consumption 1.0 1.2 3.1 3.2 3.6
Gross fixed investments (1.5) 1.1 9.2 6.9 4.5
Inflation (CPI) 3.7 0.9 (0.9) 0.1
Source: Thomson Reuters, Consensus Economics Inc.
- 91 -
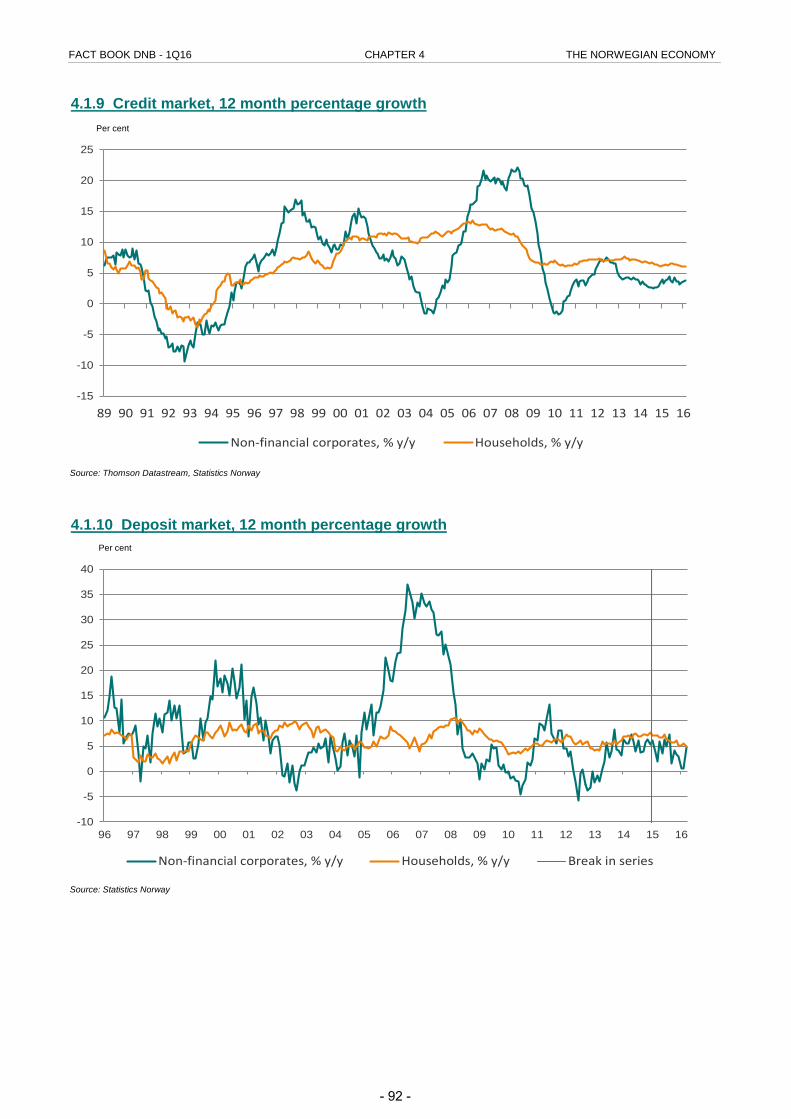
FACT BOOK DNB - 1Q16 CHAPTER 4 THE NORWEGIAN ECONOMY
4.1.9 Credit market, 12 month percentage growth Per cent
Source: Thomson Datastream, Statistics Norway
4.1.10 Deposit market, 12 month percentage growth Per cent
Source: Statistics Norway
-15
-10
-5
0
5
10
15
20
25
89 90 91 92 93 94 95 96 97 98 99 00 01 02 03 04 05 06 07 08 09 10 11 12 13 14 15 16
Non-financial corporates, % y/y Households, % y/y
-10
-5
0
5
10
15
20
25
30
35
40
96 97 98 99 00 01 02 03 04 05 06 07 08 09 10 11 12 13 14 15 16
Non-financial corporates, % y/y Households, % y/y Break in series
- 92 -
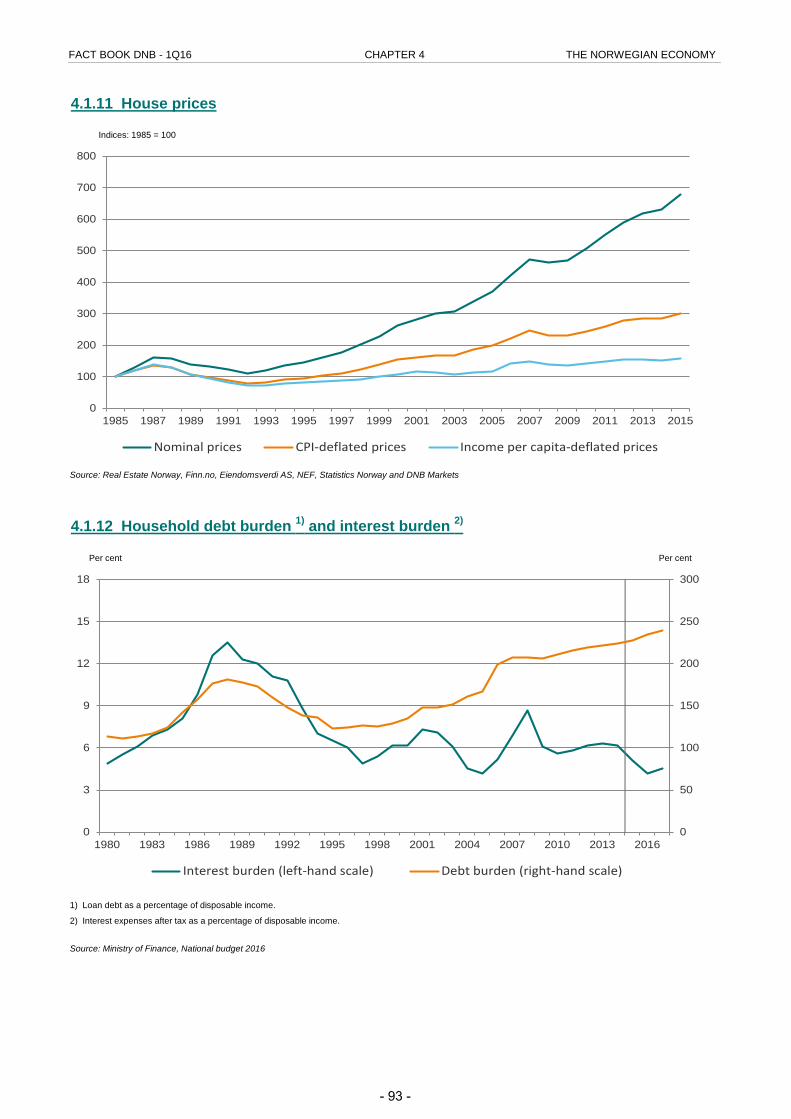
FACT BOOK DNB - 1Q16 CHAPTER 4 THE NORWEGIAN ECONOMY
4.1.11 House prices
Indices: 1985 = 100
Source: Real Estate Norway, Finn.no, Eiendomsverdi AS, NEF, Statistics Norway and DNB Markets
4.1.12 Household debt burden 1) and interest burden 2)
Per cent Per cent
1) Loan debt as a percentage of disposable income.
2) Interest expenses after tax as a percentage of disposable income.
Source: Ministry of Finance, National budget 2016
0
100
200
300
400
500
600
700
800
1985 1987 1989 1991 1993 1995 1997 1999 2001 2003 2005 2007 2009 2011 2013 2015
Nominal prices CPI-deflated prices Income per capita-deflated prices
0
50
100
150
200
250
300
0
3
6
9
12
15
18
1980 1983 1986 1989 1992 1995 1998 2001 2004 2007 2010 2013 2016
Interest burden (left-hand scale) Debt burden (right-hand scale)
- 93 -
FACT BOOK DNB - 1Q16
AppendixDisclosure for main features of regulatory capital instruments
- 94 -
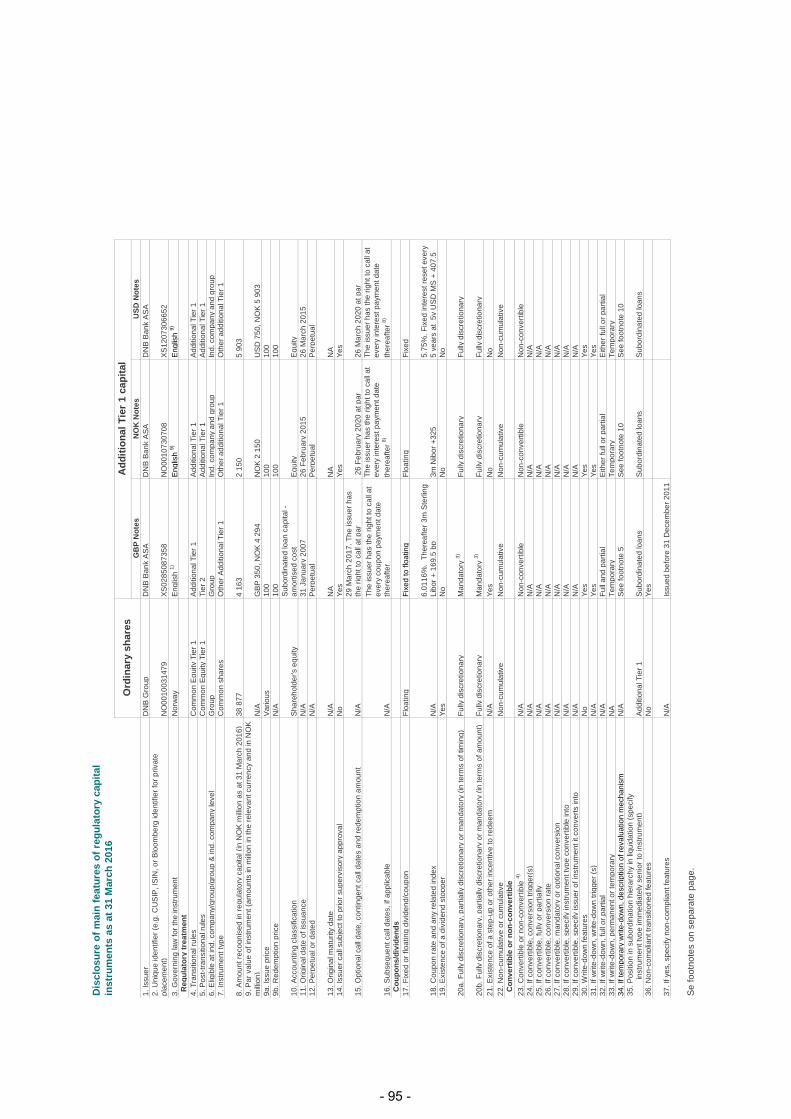
Dis
clos
ure
of m
ain
feat
ures
of r
egul
ator
y ca
pita
l in
stru
men
ts a
s at
31
Mar
ch 2
016
GB
P N
otes
NO
K N
otes
USD
Not
es1.
Issu
erD
NB
Gro
upD
NB
Ban
k A
SA
DN
B B
ank
AS
AD
NB
Ban
k A
SA
2. U
niqu
e id
entif
ier (
e.g.
CU
SIP
, IS
IN, o
r Blo
ombe
rg id
entif
ier f
or p
rivat
e pl
acem
ent)
NO
0010
0314
79XS
0285
0873
58N
O00
1073
0708
XS12
0730
6652
3. G
over
ning
law
for t
he in
stru
men
tN
orw
ayE
nglis
h 1)
Eng
lish
9)E
nglis
h 9)
Reg
ulat
ory
trea
tmen
t 4.
Tra
nsiti
onal
rule
sC
omm
on E
quity
Tie
r 1A
dditi
onal
Tie
r 1A
dditi
onal
Tie
r 1A
dditi
onal
Tie
r 15.
Pos
t-tra
nsiti
onal
rule
sC
omm
on E
quity
Tie
r 1Ti
er 2
Add
ition
al T
ier 1
Add
ition
al T
ier 1
6. E
ligib
le a
t ind
. com
pany
/gro
up/g
roup
& in
d. c
ompa
ny le
vel
Gro
up
Gro
up
Ind.
com
pany
and
gro
upIn
d. c
ompa
ny a
nd g
roup
7. In
stru
men
t typ
eC
omm
on s
hare
sO
ther
Add
ition
al T
ier 1
Oth
er a
dditi
onal
Tie
r 1O
ther
add
ition
al T
ier 1
8. A
mou
nt re
cogn
ised
in re
gula
tory
cap
ital (
in N
OK
milli
on a
s at
31
Mar
ch 2
016)
38 8
774
163
2 15
05
903
9. P
ar v
alue
of i
nstru
men
t (am
ount
s in
millo
n in
the
rele
vant
cur
renc
y an
d in
NO
K
milli
on)
N/A
GB
P 3
50, N
OK
4 2
94N
OK
2 1
50U
SD
750
, NO
K 5
903
9a. I
ssue
pric
eV
ario
us10
010
010
09b
. Red
empt
ion
pric
eN
/A10
010
010
0
10. A
ccou
ntin
g cl
assi
ficat
ion
Sha
reho
lder
's e
quity
Sub
ordi
nate
d lo
an c
apita
l -
amor
tised
cos
tE
quity
Equ
ity11
. Orig
inal
dat
e of
issu
ance
N/A
31 J
anua
ry 2
007
26 F
ebru
ary
2015
26 M
arch
201
512
. Per
petu
al o
r dat
edN
/AP
erpe
tual
Per
petu
alP
erpe
tual
13. O
rigin
al m
atur
ity d
ate
N/A
NA
NA
NA
14. I
ssue
r cal
l sub
ject
to p
rior s
uper
viso
ry a
ppro
val
No
Yes
Yes
Yes
15. O
ptio
nal c
all d
ate,
con
tinge
nt c
all d
ates
and
rede
mpt
ion
amou
ntN
/A29
Mar
ch 2
017.
The
issu
er h
as
the
right
to c
all a
t par
26
Febr
uary
202
0 at
par
26 M
arch
202
0 at
par
16. S
ubse
quen
t cal
l dat
es, i
f app
licab
leN
/A
The
issu
er h
as th
e rig
ht to
cal
l at
ever
y co
upon
pay
men
t dat
e th
erea
fter
The
issu
er h
as th
e rig
ht to
cal
l at
ever
y in
tere
st p
aym
ent d
ate
ther
eafte
r 8)
The
issu
er h
as th
e rig
ht to
cal
l at
ever
y in
tere
st p
aym
ent d
ate
ther
eafte
r 8)
Cou
pons
/div
iden
ds17
. Fix
ed o
r flo
atin
g di
vide
nd/c
oupo
nFl
oatin
gFi
xed
to fl
oatin
gFl
oatin
gFi
xed
18. C
oupo
n ra
te a
nd a
ny re
late
d in
dex
N/A
6.01
16%
. Th
erea
fter 3
m S
terli
ng
Libo
r + 1
69.5
bp
3m N
ibor
+32
55.
75%
. Fix
ed in
tere
st re
set e
very
5
year
s at
5y
US
D M
S +
407
.519
. Exi
sten
ce o
f a d
ivid
end
stop
per
Yes
No
No
No
20a.
Ful
ly d
iscr
etio
nary
, par
tially
dis
cret
iona
ry o
r man
dato
ry (i
n te
rms
of ti
min
g)Fu
lly d
iscr
etio
nary
M
anda
tory
3)Fu
lly d
iscr
etio
nary
Fully
dis
cret
iona
ry
20b.
Ful
ly d
iscr
etio
nary
, par
tially
dis
cret
iona
ry o
r man
dato
ry (i
n te
rms
of a
mou
nt)
Fully
dis
cret
iona
ry
Man
dato
ry 3)
Fully
dis
cret
iona
ryFu
lly d
iscr
etio
nary
21. E
xist
ence
of a
ste
p-up
or o
ther
ince
ntiv
e to
rede
emN
/AYe
sN
oN
o22
. Non
-cum
ulat
ive
or c
umul
ativ
eN
on-c
umul
ativ
eN
on-c
umul
ativ
eN
on-c
umul
ativ
eN
on-c
umul
ativ
e C
onve
rtib
le o
r non
-con
vert
ible
23. C
onve
rtibl
e or
non
-con
verti
ble
4)N
/AN
on-c
onve
rtibl
eN
on-c
onve
rtibl
eN
on-c
onve
rtibl
e24
. If c
onve
rtibl
e, c
onve
rsio
n tri
gger
(s)
N/A
N/A
N/A
N/A
25. I
f con
verti
ble,
fully
or p
artia
llyN
/AN
/AN
/AN
/A26
. If c
onve
rtibl
e, c
onve
rsio
n ra
teN
/AN
/AN
/AN
/A27
. If c
onve
rtibl
e, m
anda
tory
or o
ptio
nal c
onve
rsio
nN
/AN
/AN
/AN
/A28
. If c
onve
rtibl
e, s
peci
fy in
stru
men
t typ
e co
nver
tible
into
N/A
N/A
N/A
N/A
29. I
f con
verti
ble,
spe
cify
issu
er o
f ins
trum
ent i
t con
verts
into
N/A
N/A
N/A
N/A
30. W
rite-
dow
n fe
atur
esN
oYe
sYe
sYe
s31
. If w
rite-
dow
n, w
rite-
dow
n tri
gger
(s)
N/A
Yes
Yes
Yes
32. I
f writ
e-do
wn,
full
or p
artia
lN
/AFu
ll an
d pa
rtial
Eith
er fu
ll or
par
tial
Eith
er fu
ll or
par
tial
33. I
f writ
e-do
wn,
per
man
ent o
r tem
pora
ryN
ATe
mpo
rary
Tem
pora
ryTe
mpo
rary
34. I
f tem
pora
ry w
rite-
dow
n, d
escr
iptio
n of
reva
luat
ion
mec
hani
smN
/AS
ee fo
otno
te 5
See
foot
note
10
See
foot
note
10
35. P
ositi
on in
sub
ordi
natio
n hi
erar
chy
in li
quid
atio
n (s
peci
fy
i
nstru
men
t typ
e im
med
iate
ly s
enio
r to
inst
rum
ent)
Add
ition
al T
ier 1
Sub
ordi
nate
d lo
ans
Sub
ordi
nate
d lo
ans
Sub
ordi
nate
d lo
ans
36. N
on-c
ompl
iant
tran
sitio
ned
feat
ures
No
Yes
37. I
f yes
, spe
cify
non
-com
plia
nt fe
atur
esN
/AIs
sued
bef
ore
31 D
ecem
ber 2
011
Se
foot
note
s on
sep
arat
e pa
ge.
Add
ition
al T
ier 1
cap
ital
Ord
inar
y sh
ares
- 95 -
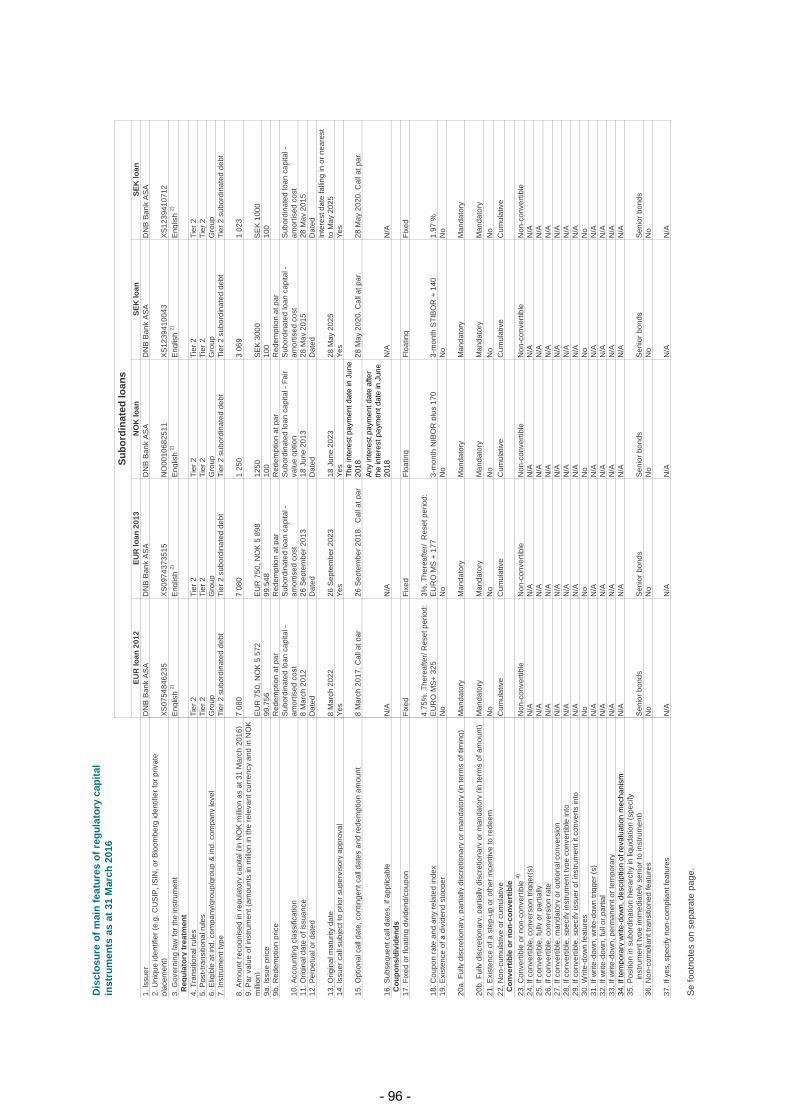
Dis
clos
ure
of m
ain
feat
ures
of r
egul
ator
y ca
pita
l in
stru
men
ts a
s at
31
Mar
ch 2
016
1. Is
suer
2. U
niqu
e id
entif
ier (
e.g.
CU
SIP
, IS
IN, o
r Blo
ombe
rg id
entif
ier f
or p
rivat
e pl
acem
ent)
3. G
over
ning
law
for t
he in
stru
men
t R
egul
ator
y tr
eatm
ent
4. T
rans
ition
al ru
les
5. P
ost-t
rans
ition
al ru
les
6. E
ligib
le a
t ind
. com
pany
/gro
up/g
roup
& in
d. c
ompa
ny le
vel
7. In
stru
men
t typ
e
8. A
mou
nt re
cogn
ised
in re
gula
tory
cap
ital (
in N
OK
milli
on a
s at
31
Mar
ch 2
016)
9. P
ar v
alue
of i
nstru
men
t (am
ount
s in
millo
n in
the
rele
vant
cur
renc
y an
d in
NO
K
milli
on)
9a. I
ssue
pric
e9b
. Red
empt
ion
pric
e
10. A
ccou
ntin
g cl
assi
ficat
ion
11. O
rigin
al d
ate
of is
suan
ce12
. Per
petu
al o
r dat
ed
13. O
rigin
al m
atur
ity d
ate
14. I
ssue
r cal
l sub
ject
to p
rior s
uper
viso
ry a
ppro
val
15. O
ptio
nal c
all d
ate,
con
tinge
nt c
all d
ates
and
rede
mpt
ion
amou
nt
16. S
ubse
quen
t cal
l dat
es, i
f app
licab
le C
oupo
ns/d
ivid
ends
17. F
ixed
or f
loat
ing
divi
dend
/cou
pon
18. C
oupo
n ra
te a
nd a
ny re
late
d in
dex
19. E
xist
ence
of a
div
iden
d st
oppe
r
20a.
Ful
ly d
iscr
etio
nary
, par
tially
dis
cret
iona
ry o
r man
dato
ry (i
n te
rms
of ti
min
g)
20b.
Ful
ly d
iscr
etio
nary
, par
tially
dis
cret
iona
ry o
r man
dato
ry (i
n te
rms
of a
mou
nt)
21. E
xist
ence
of a
ste
p-up
or o
ther
ince
ntiv
e to
rede
em22
. Non
-cum
ulat
ive
or c
umul
ativ
e C
onve
rtib
le o
r non
-con
vert
ible
23. C
onve
rtibl
e or
non
-con
verti
ble
4)
24. I
f con
verti
ble,
con
vers
ion
trigg
er(s
)25
. If c
onve
rtibl
e, fu
lly o
r par
tially
26. I
f con
verti
ble,
con
vers
ion
rate
27. I
f con
verti
ble,
man
dato
ry o
r opt
iona
l con
vers
ion
28. I
f con
verti
ble,
spe
cify
inst
rum
ent t
ype
conv
ertib
le in
to29
. If c
onve
rtibl
e, s
peci
fy is
suer
of i
nstru
men
t it c
onve
rts in
to30
. Writ
e-do
wn
feat
ures
31. I
f writ
e-do
wn,
writ
e-do
wn
trigg
er (s
) 32
. If w
rite-
dow
n, fu
ll or
par
tial
33. I
f writ
e-do
wn,
per
man
ent o
r tem
pora
ry34
. If t
empo
rary
writ
e-do
wn,
des
crip
tion
of re
valu
atio
n m
echa
nism
35. P
ositi
on in
sub
ordi
natio
n hi
erar
chy
in li
quid
atio
n (s
peci
fy
i
nstru
men
t typ
e im
med
iate
ly s
enio
r to
inst
rum
ent)
36. N
on-c
ompl
iant
tran
sitio
ned
feat
ures
37. I
f yes
, spe
cify
non
-com
plia
nt fe
atur
es
Se
foot
note
s on
sep
arat
e pa
ge.
EUR
loan
201
2EU
R lo
an 2
013
NO
K lo
anSE
K lo
anSE
K lo
anD
NB
Ban
k A
SA
DN
B B
ank
AS
AD
NB
Ban
k A
SA
DN
B B
ank
AS
AD
NB
Ban
k A
SA
XS07
5484
6235
XS09
7437
3515
NO
0010
6825
11XS
1239
4100
43XS
1239
4107
12E
nglis
h 2)
Eng
lish
2)E
nglis
h 2)
Eng
lish
2)E
nglis
h 2)
Tier
2Ti
er 2
Tier
2Ti
er 2
Tier
2Ti
er 2
Tier
2Ti
er 2
Tier
2Ti
er 2
Gro
up
Gro
up
Gro
up
Gro
up
Gro
up
Tier
2 s
ubor
dina
ted
debt
Tier
2 s
ubor
dina
ted
debt
Tier
2 s
ubor
dina
ted
debt
Tier
2 s
ubor
dina
ted
debt
Tier
2 s
ubor
dina
ted
debt
7 08
07
080
1 25
03
069
1 02
3
EU
R 7
50, N
OK
5 5
72E
UR
750
, NO
K 5
898
1250
SE
K 3
000
SE
K 1
000
99.7
5699
.548
100
100
100
Red
empt
ion
at p
arR
edem
ptio
n at
par
Red
empt
ion
at p
arR
edem
ptio
n at
par
Sub
ordi
nate
d lo
an c
apita
l -
amor
tised
cos
tS
ubor
dina
ted
loan
cap
ital -
am
ortis
ed c
ost
Sub
ordi
nate
d lo
an c
apita
l - F
air
valu
e op
tion
Sub
ordi
nate
d lo
an c
apita
l -
amor
tised
cos
tS
ubor
dina
ted
loan
cap
ital -
am
ortis
ed c
ost
8 M
arch
201
226
Sep
tem
ber 2
013
18 J
une
2013
28 M
ay 2
015
28 M
ay 2
015
Dat
edD
ated
Dat
edD
ated
Dat
ed
8 M
arch
202
226
Sep
tem
ber 2
023
18 J
une
2023
28 M
ay 2
025
Inte
rest
dat
e fa
lling
in o
r nea
rest
to
May
202
5Ye
sYe
sYe
sYe
sYe
s
8 M
arch
201
7. C
all a
t par
26 S
epte
mbe
r 201
8. C
all a
t par
The
inte
rest
pay
men
t dat
e in
Jun
e 20
18
28 M
ay 2
020.
Cal
l at p
ar.
28 M
ay 2
020.
Cal
l at p
ar.
N/A
N/A
Any
inte
rest
pay
men
t dat
e af
ter
the
inte
rest
pay
men
t dat
e in
Jun
e 20
18N
/AN
/A
Fixe
dFi
xed
Floa
ting
Floa
ting
Fixe
d
4.75
%. T
here
afte
r/ R
eset
per
iod:
E
UR
O M
S+
325
3%. T
here
afte
r/ R
eset
per
iod:
E
UR
O M
S +
177
3-m
onth
NIB
OR
plu
s 17
03-
mon
th S
TIB
OR
+ 1
401.
97 %
No
No
No
No
No
Man
dato
ryM
anda
tory
Man
dato
ryM
anda
tory
Man
dato
ry
Man
dato
ryM
anda
tory
Man
dato
ryM
anda
tory
Man
dato
ryN
oN
oN
oN
oN
oC
umul
ativ
eC
umul
ativ
eC
umul
ativ
eC
umul
ativ
eC
umul
ativ
e
Non
-con
verti
ble
Non
-con
verti
ble
Non
-con
verti
ble
Non
-con
verti
ble
Non
-con
verti
ble
N/A
N/A
N/A
N/A
N/A
N/A
N/A
N/A
N/A
N/A
N/A
N/A
N/A
N/A
N/A
N/A
N/A
N/A
N/A
N/A
N/A
N/A
N/A
N/A
N/A
N/A
N/A
N/A
N/A
N/A
No
No
No
No
No
N/A
N/A
N/A
N/A
N/A
N/A
N/A
N/A
N/A
N/A
N/A
N/A
N/A
N/A
N/A
N/A
N/A
N/A
N/A
N/A
Sen
ior b
onds
Sen
ior b
onds
Sen
ior b
onds
Sen
ior b
onds
Sen
ior b
onds
No
No
No
No
No
N/A
N/A
N/A
N/A
N/A
Subo
rdin
ated
loan
s
- 96 -
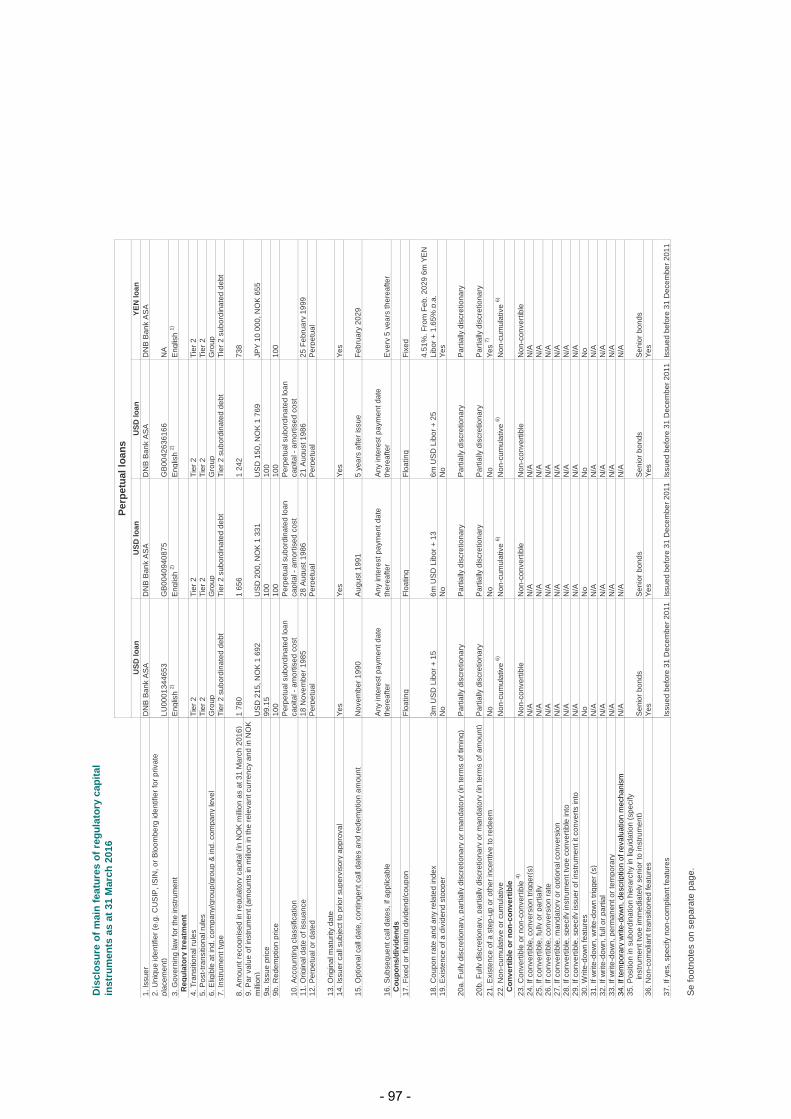
Dis
clos
ure
of m
ain
feat
ures
of r
egul
ator
y ca
pita
l in
stru
men
ts a
s at
31
Mar
ch 2
016
1. Is
suer
2. U
niqu
e id
entif
ier (
e.g.
CU
SIP
, IS
IN, o
r Blo
ombe
rg id
entif
ier f
or p
rivat
e pl
acem
ent)
3. G
over
ning
law
for t
he in
stru
men
t R
egul
ator
y tr
eatm
ent
4. T
rans
ition
al ru
les
5. P
ost-t
rans
ition
al ru
les
6. E
ligib
le a
t ind
. com
pany
/gro
up/g
roup
& in
d. c
ompa
ny le
vel
7. In
stru
men
t typ
e
8. A
mou
nt re
cogn
ised
in re
gula
tory
cap
ital (
in N
OK
milli
on a
s at
31
Mar
ch 2
016)
9. P
ar v
alue
of i
nstru
men
t (am
ount
s in
millo
n in
the
rele
vant
cur
renc
y an
d in
NO
K
milli
on)
9a. I
ssue
pric
e9b
. Red
empt
ion
pric
e
10. A
ccou
ntin
g cl
assi
ficat
ion
11. O
rigin
al d
ate
of is
suan
ce12
. Per
petu
al o
r dat
ed
13. O
rigin
al m
atur
ity d
ate
14. I
ssue
r cal
l sub
ject
to p
rior s
uper
viso
ry a
ppro
val
15. O
ptio
nal c
all d
ate,
con
tinge
nt c
all d
ates
and
rede
mpt
ion
amou
nt
16. S
ubse
quen
t cal
l dat
es, i
f app
licab
le C
oupo
ns/d
ivid
ends
17. F
ixed
or f
loat
ing
divi
dend
/cou
pon
18. C
oupo
n ra
te a
nd a
ny re
late
d in
dex
19. E
xist
ence
of a
div
iden
d st
oppe
r
20a.
Ful
ly d
iscr
etio
nary
, par
tially
dis
cret
iona
ry o
r man
dato
ry (i
n te
rms
of ti
min
g)
20b.
Ful
ly d
iscr
etio
nary
, par
tially
dis
cret
iona
ry o
r man
dato
ry (i
n te
rms
of a
mou
nt)
21. E
xist
ence
of a
ste
p-up
or o
ther
ince
ntiv
e to
rede
em22
. Non
-cum
ulat
ive
or c
umul
ativ
e C
onve
rtib
le o
r non
-con
vert
ible
23. C
onve
rtibl
e or
non
-con
verti
ble
4)
24. I
f con
verti
ble,
con
vers
ion
trigg
er(s
)25
. If c
onve
rtibl
e, fu
lly o
r par
tially
26. I
f con
verti
ble,
con
vers
ion
rate
27. I
f con
verti
ble,
man
dato
ry o
r opt
iona
l con
vers
ion
28. I
f con
verti
ble,
spe
cify
inst
rum
ent t
ype
conv
ertib
le in
to29
. If c
onve
rtibl
e, s
peci
fy is
suer
of i
nstru
men
t it c
onve
rts in
to30
. Writ
e-do
wn
feat
ures
31. I
f writ
e-do
wn,
writ
e-do
wn
trigg
er (s
) 32
. If w
rite-
dow
n, fu
ll or
par
tial
33. I
f writ
e-do
wn,
per
man
ent o
r tem
pora
ry34
. If t
empo
rary
writ
e-do
wn,
des
crip
tion
of re
valu
atio
n m
echa
nism
35. P
ositi
on in
sub
ordi
natio
n hi
erar
chy
in li
quid
atio
n (s
peci
fy
i
nstru
men
t typ
e im
med
iate
ly s
enio
r to
inst
rum
ent)
36. N
on-c
ompl
iant
tran
sitio
ned
feat
ures
37. I
f yes
, spe
cify
non
-com
plia
nt fe
atur
es
Se
foot
note
s on
sep
arat
e pa
ge.
USD
loan
USD
loan
USD
loan
YEN
loan
DN
B B
ank
AS
AD
NB
Ban
k A
SA
DN
B B
ank
AS
AD
NB
Ban
k A
SA
LU00
0134
4653
GB
0040
9408
75G
B00
4263
6166
NA
Eng
lish
2)E
nglis
h 2)
Eng
lish
2)E
nglis
h 1)
Tier
2Ti
er 2
Tier
2Ti
er 2
Tier
2Ti
er 2
Tier
2Ti
er 2
Gro
up
Gro
up
Gro
up
Gro
up
Tier
2 s
ubor
dina
ted
debt
Tier
2 s
ubor
dina
ted
debt
Tier
2 s
ubor
dina
ted
debt
Tier
2 s
ubor
dina
ted
debt
1 78
01
656
1 24
273
8
US
D 2
15, N
OK
1 6
92U
SD
200
, NO
K 1
331
US
D 1
50, N
OK
1 7
69JP
Y 10
000
, NO
K 6
5599
.15
100
100
100
100
100
100
Per
petu
al s
ubor
dina
ted
loan
ca
pita
l - a
mor
tised
cos
tP
erpe
tual
sub
ordi
nate
d lo
an
capi
tal -
am
ortis
ed c
ost
Per
petu
al s
ubor
dina
ted
loan
ca
pita
l - a
mor
tised
cos
t18
Nov
embe
r 198
528
Aug
ust 1
986
21 A
ugus
t 198
625
Feb
ruar
y 19
99P
erpe
tual
Per
petu
alP
erpe
tual
Per
petu
al
Yes
Yes
Yes
Yes
Nov
embe
r 199
0A
ugus
t 199
15
year
s af
ter i
ssue
Febr
uary
202
9
Any
inte
rest
pay
men
t dat
e th
erea
fter
Any
inte
rest
pay
men
t dat
e th
erea
fter
Any
inte
rest
pay
men
t dat
e th
erea
fter
Eve
ry 5
yea
rs th
erea
fter
Floa
ting
Floa
ting
Floa
ting
Fixe
d
3m U
SD
Lib
or +
15
6m U
SD
Lib
or +
13
6m U
SD
Lib
or +
25
4.51
%. F
rom
Feb
. 202
9 6m
YE
N
Libo
r + 1
.65%
p.a
.N
oN
oN
oYe
s
Par
tially
dis
cret
iona
ryP
artia
lly d
iscr
etio
nary
Par
tially
dis
cret
iona
ryP
artia
lly d
iscr
etio
nary
Par
tially
dis
cret
iona
ryP
artia
lly d
iscr
etio
nary
Par
tially
dis
cret
iona
ryP
artia
lly d
iscr
etio
nary
No
No
No
Yes
7)
Non
-cum
ulat
ive
6)N
on-c
umul
ativ
e 6)
Non
-cum
ulat
ive
6)N
on-c
umul
ativ
e 6)
Non
-con
verti
ble
Non
-con
verti
ble
Non
-con
verti
ble
Non
-con
verti
ble
N/A
N/A
N/A
N/A
N/A
N/A
N/A
N/A
N/A
N/A
N/A
N/A
N/A
N/A
N/A
N/A
N/A
N/A
N/A
N/A
N/A
N/A
N/A
N/A
No
No
No
No
N/A
N/A
N/A
N/A
N/A
N/A
N/A
N/A
N/A
N/A
N/A
N/A
N/A
N/A
N/A
N/A
Sen
ior b
onds
Sen
ior b
onds
Sen
ior b
onds
Sen
ior b
onds
Yes
Yes
Yes
Yes
Issu
ed b
efor
e 31
Dec
embe
r 201
1Is
sued
bef
ore
31 D
ecem
ber 2
011
Issu
ed b
efor
e 31
Dec
embe
r 201
1Is
sued
bef
ore
31 D
ecem
ber 2
011
Perp
etua
l loa
ns
- 97 -
Dis
clos
ure
of m
ain
feat
ures
of r
egul
ator
y ca
pita
l ins
trum
ents
as
at 3
1 M
arch
201
6 - F
ootn
otes
1) E
xcep
t for
the
subo
rdin
atio
n pr
ovis
ions
and
cer
tain
pro
visi
ons
rela
ting
to th
e pa
ymen
t of i
nter
est a
nd p
rinci
pal,
whi
ch w
ill be
gov
erne
d by
the
law
s of
Nor
way
.
2) E
xcep
t for
sta
tus
and
subo
rdin
atio
n w
hich
will
be g
over
ned
by th
e la
ws
of N
orw
ay.
3) U
nder
cer
tain
circ
umst
ance
s th
ere
will
be n
o co
upon
pay
men
t if c
apita
l req
uire
men
ts.a
re b
reac
hed.
4) A
ll su
bord
inat
ed d
ebt m
ight
be
writ
ten
dow
n or
con
verte
d ac
cord
ing
to th
e G
uara
ntee
Sch
emes
Act
.
6) N
on-c
umul
ativ
e bu
t cum
ulat
ive
unde
r cer
tain
circ
umst
ance
s, e
.g. d
ivid
end
paym
ent.
8) S
ubje
ct to
the
outs
tand
ing
prin
cipa
l am
ount
of t
he n
otes
bei
ng e
qual
to th
eir o
rigin
al p
rinci
pal a
mou
nt.
10) F
ully
dis
cret
iona
ry re
inst
atem
ent p
ro ra
ta w
ith a
ny w
ritte
n-do
wn
AT1
inst
rum
ents
that
are
to b
e re
inst
ated
out
of t
he s
ame
prof
its. S
ubje
ct to
the
max
imum
writ
e-up
am
ount
and
to th
e
9) T
he N
otes
and
any
non
-con
tract
ual o
blig
atio
ns a
risin
g ou
t of o
r in
conn
ectio
n w
ith th
e N
otes
will
be g
over
ned
by, a
nd c
onst
rued
in a
ccor
danc
e w
ith, E
nglis
h la
w e
xcep
t tha
t (i)
the
prov
isio
ns re
latin
g to
su
bord
inat
ion,
Writ
e-D
own
and
Dis
cret
iona
ry R
eins
tate
men
t and
any
non
-con
tract
ual o
blig
atio
ns a
risin
g ou
t of o
r in
conn
ectio
n w
ith s
uch
prov
isio
ns a
nd (i
i) an
y ot
her w
rite-
dow
n or
con
vers
ion
of th
e N
otes
in
acco
rdan
ce w
ith N
orw
egia
n la
w a
nd re
gula
tion
appl
icab
le to
the
Bank
from
tim
e to
tim
e, w
ill in
eac
h ca
se b
e go
vern
ed b
y, a
nd c
onst
rued
in a
ccor
danc
e w
ith, N
orw
egia
n la
w.
7) T
he b
orro
wer
und
erta
kes
not t
o m
ake
any
dist
ribut
ion
to H
olde
rs o
f Prim
ary
Cap
ital c
ertif
icat
es o
f the
Bor
row
er o
r to
othe
r cre
dito
rs ra
nkin
g ju
nior
to th
e Le
nder
whi
le a
ny a
rrea
rs o
f int
eres
t (in
clud
ing
any
corr
espo
ndin
g ad
ditio
nal i
nter
est a
mou
nt) r
emai
ns o
utst
andi
ng in
resp
ect o
f the
loan
.
5) S
ubje
ct to
the
avai
labi
lity
of A
vaila
ble
Dis
tribu
tabl
e Fu
nds,
the
Issu
er u
nder
take
s to
rein
stat
e al
l Con
verte
d Am
ount
s as
Not
es u
pon
the
occu
rren
ce o
f any
of t
he fo
llow
ing
even
ts: (
i) th
e Is
suer
or D
NB
ASA
decl
ares
or m
akes
a d
ivid
end
(in th
e fo
rm o
f cas
h, s
tock
or a
noth
er in
stru
men
t), a
n in
tere
st p
aym
ent o
r any
oth
er p
aym
ent o
n an
y sh
are
capi
tal o
r any
obl
igat
ions
of t
he Is
suer
rank
ing
or e
xpre
ssed
to ra
nk ju
nior
to
the
Not
es; o
r (ii)
the
Issu
er o
r DN
B AS
A (a
s ap
plic
able
) red
eem
s, re
purc
hase
s or
oth
erw
ise
acqu
ires
any
of it
s re
spec
tive
shar
e ca
pita
l, or
any
Par
ity T
ier 1
Sec
uriti
es o
r any
obl
igat
ions
of t
he Is
suer
rank
ing
or
expr
esse
d to
rank
juni
or to
the
Not
es o
r pay
sor m
akes
ava
ilabl
e an
y m
oney
s to
a s
inki
ng fu
nd o
r for
rede
mpt
ion
of a
ny s
uch
shar
e ca
pita
l, Pa
rity
Tier
1 S
ecur
ities
or o
blig
atio
ns o
ther
than
as
set o
ut in
Con
ditio
n 3
of th
e "T
erm
s an
d C
ondi
tions
of t
he N
otes
".
- 98 -


DN
B G
RO
UP
FAC
T B
OO
K F
IRS
T Q
UA
RT
ER
2016
DNBMailing address:P.O.Box 1600 SentrumN-0021 Oslo
Visiting address:Dronning Eufemias gate 30Bjørvika, Oslo
dnb.no
Here for you. Every day.When it matters the most.