Fact Book Q3 2019 - Nykredit
73
Fact Book Q3 2019 The Nykredit Group Unaudited
-
Upload
khangminh22 -
Category
Documents
-
view
1 -
download
0
Transcript of Fact Book Q3 2019 - Nykredit

Fact Book Q3 2019
The Nykredit Group
Unaudited

�����������������
Group chart 3 Risk relating to mortgage lending 32
Contacts and other information 4 LTV 34
Nykredit Group history 5 Expiry of interest-only period 35
Rating 6 Impairment provisions and write-offs 36
Market share 7 Impairment provisions and charges 37
Nykredit Group 8 Geographical distribution of write-offs 38
Results 8 Write-offs 39
Balance sheet summary 9 Bank lending 40
Lending and deposits 10 Loans, advances and guarantees 40
Breakdown of income 12 Impairment provisions 41
Breakdown of costs 13 Non-performing loans (NPL) 42
Nykredit Realkredit Group 14 Market value derivatives 42
Results 14 Weak customers and non-performing loans (NPL) – mortgage lending 43
Balance sheet summary 15 Business areas 44
Nykredit Bank Group 16 Income – business areas 45
Results 16 Personal Banking 46
Balance sheet summary 17 Business Banking 47
Totalkredit A/S 18 Corportates & Institutions 48
Results 18 Totalkredit Partners 49
Balance sheet summary 19 Wealth Management 50
Key figures and ratios 20 Group items 51
Key figures and financial ratios 20 The Danish economy 52
Risk weights and capital ratios - the Nykredit Group 21 Regional housing prices 52
CET1, MDA and ADI 22 Key figures 53
Bond portfolio 23 Covered Bond Investor Report - the Nykredit Realkredit Group 54
Mortgage lending 24 Overview 55
Mortgage lending by property type 25 Concepts and calculations 57
Mortgage lending by geography 26 Mortgage lending 58
Mortgage lending by loan and interest type 28 Current LTV 68
Arrears 29 LTV owner-occupied dwellings 71
Geographical distribution of arrears 30 Definitions 73
Repossessed properties and forced sales 31
������������� ���������������������� ���

�����������
������������ �
���
������������������
���
����������������� ����
Nykredit A/S
��������� ���������������
��������������
�������������������
Totalkredit A/SNykredit Mægler
A/S
Ejendoms-selskabet
Kalvebod A/S
Nykredit Realkredit A/S
Nykredit Leasing A/S
Investor consortium
Østifterne f.m.b.a
Ownership 1.63%
PKA
Ownership 2.40%
AP Pension
Ownership 1.63%
MP Pension
Ownership 0.44%
Industriens Fond
Ownership 0.34%
Forenet Kredit f.m.b.a
Ownership 78.90%
PRAS A/S
Ownership 2.25%
PFA Pension
Ownership 10.03%
PensionDanmark
Ownership 2.40%
Sparinvest A/S(75% of shares)
Nykredit Portefølje Adm.
A/S
Nykredit Bank A/S
������������� ���������������������� ��
!�����������������������"�����
Morten Bækmand Nielsen Hanne Søgaard Foss
Head of Investor Relations Asset Liability Manager
Tel: +45 44 55 15 21 Tel: +45 44 55 12 36
Mobile: +45 23 39 41 68 Mobile: +45 26 36 89 18
E-mail: [email protected] E-mail: [email protected]
Our investor website www.nykredit.com/ir contains:
� General information
� Press releases
� Financial and CSR reports
� Risk and capital reports
� Bond data
� Prospectuses
� Publications on markets
� Cover pool data
������������� ���������������������� ���

����������������������
Forenet Kredit1
1.
2.
3.
4.
Committee of Representatives
1) Forenet Kredit is the former Foreningen Nykredit.
The Committee of Representatives elects the Board
of Directors of Forenet Kredit and approves annual
reports and amendments to the Articles of
Associations.
Mortgage customers of Totalkredit
(optional)
Customers with secured
homeowner loans placed in
Totalkredit (optional)
Forenet Kredit (Association behind
Nykredit and Totalkredit) owns just
below 80% of Nykredit and is thus the
largest shareholder.
Members
Mortgage customers of Nykredit
Realkredit
Customers with facilities with
Nykredit Bank of at least DKK
50,000
The ultimate authority of Forenet Kredit is the
Committee of Representatives, which has 104
representatives. 100 representatives are elected by
and among the members of Forenet Kredit and bond-
/securityholders of Nykredit Rrealkredit and
Totalkredit bonds and other securities. Four
representatives are elected by and among the
employees of Nykredit A/S.
1972
16 mortgage associations
merge into two
1851-1972
Establishment of various mortgage
associations
1985
Two mortgage associations merge
into
1989
Deregulation of the Danish
mortgage sector
2019
Nykredit is one of Denmark's leading financial services
groups
Development in activities
1989 Set-up of estate agency business
1994 Set-up of Nykredit Bank
1998 Set-up of Markets and Asset Management
1998 Set-up of Nykredit Forsikring
2000 Merger with Østifterne Forsikring
2003 Acquisition of Totalkredit
2008 Acquisition of Forstædernes Bank
2010 Sale of Nykredit Forsikring
2017 New source of equity funding established (investor solution)
2019 Acquisition of 75% shares in Sparinvest
������������� ���������������������� ���

����#
Nykredit Realkredit A/S
Long-term Short-term Outlook Long-term Short-term Outlook
Issuer credit rating A A-1 Positive A F1 Stable
Resolution Counterparty Rating A+ A-1
Senior unsecured preferred debt A A-1 A+ F1
Senior unsecured non-preferred debt BBB+ A
Tier 2 subordinated debt BBB A-
Tier 2 contingent capital BBB BBB
Additional Tier 1 capital BB+ BB+
Covered bonds (SDO)1
AAA Stable
Covered bonds (RO)2
AAA Stable
Senior secured debt3
AA- Positive
1 SDO = Særligt Dækkede Obligationer, issued out of capital centres E and H
2 RO = Realkreditobligationer, issued out of capital centres General, C, D, G and I
3 Also known as Junior Covered Bonds (JCB) or Section 15 bonds, issued out of capital centre H
Nykredit Bank A/S
Long-term Short-term Outlook Long-term Short-term Outlook
Issuer credit rating A A-1 Positive A F1 Stable
Resolution Counterparty Rating A+ A-1
Senior unsecured preferred debt A A-1 A+ F1
Deposits A+ F1
Totalkredit A/S
Long-term Short-term Outlook
Covered bonds (RO)4
AAA Stable
4 RO = Realkreditobligationer issued out of capital centre C
S&P Global Ratings
S&P Global Ratings Fitch Ratings
S&P Global Ratings Fitch Ratings
������������� ���������������������� ���

$������������%�������#
Market share1
% Q3/2018 Q4/2018 Q1/2019 Q2/2019 Q3/2019
Bank lending 5.4% 5.6% 5.5% 5.7% 5.6%
Mortgage lending 41.3% 41.3% 41.5% 41.7% 42.0%
Total 31.4% 31.5% 31.6% 31.8% 32.2%1 MFI statistics – lending and distribution of market share in Denmark. Bank lending excl. reverse transactions. Mortgage lending at fair value excl. monetary and financial institutions.
0%
5%
10%
15%
20%
25%
30%
35%
40%
45%
50%
2014 2015 2016 2017 2018 Q3/20192%
3%
4%
5%
6%
7%
8%
9%
10%
11%
12%
MortgageBank
Market share, Lending, %
Bank lending (rhs) Mortgage lending (lhs) Total (lhs)
������������� ���������������������� ���

�������%���������������
Nykredit GroupDKK million Q3/2018 Q4/2018 Q1/2019 Q2/2019 Q3/2019
Net interest income 2,339 2,330 2,283 2,310 2,337
Net fee income 494 430 484 671 853
Wealth management income 355 336 350 369 397
Net interest from capitalisation -88 -92 -89 -84 -90
Net income relating to customer benefits programmes1 -68 -73 -80 -23 -19
Trading, investment portfolio and other income -14 -264 679 623 -137
Income 3,019 2,667 3,627 3,865 3,340
Costs 1,203 1,273 1,230 1,273 1,309
Business profit before impairment charges 1,816 1,394 2,397 2,593 2,032
Impairment charges on mortgage lending 127 5 159 177 161
Impairment charges on bank lending -17 162 61 36 71
Business profit 1,706 1,225 2,178 2,379 1,800
Legacy derivatives 164 -104 -219 -50 -328
Profit before tax 1,870 1,122 1,959 2,329 1,472
Tax 372 114 329 352 233
Profit for the period 1,498 1,009 1,629 1,977 1,239
1 Nykredit's customer benefits programmes were launched in Q3/2017, awarding customers a cash discount on their loan administration margin. The programmes are available to both personal and business
customers and are called “KundeKroner”, “ErhvervsKroner” and "MineMål", respectively. The programmes do not impact profit after tax, as the Nykredit Group and Forenet Kredit are jointly taxed.
Note: Sparinvest has been included in Nykredit’s financial reporting from 1 September 2019.
������������� ���������������������� ��

����������������""����%���������������
Nykredit GroupDKK million Q3/2018 Q4/2018 Q1/2019 Q2/2019 Q3/2019
Assets
Receivables from credit institutions and central banks 29,526 29,691 37,744 43,475 71,304
Mortgage loans at fair value 1,183,494 1,193,667 1,217,330 1,232,135 1,256,233
Bank lending - excl. reverse transactions 58,749 60,566 60,723 63,505 63,289
Bonds and equities 92,412 99,444 105,368 117,650 122,535
Remaining assets 61,047 64,608 67,528 83,929 89,220
Total assets 1,425,228 1,447,976 1,488,693 1,540,695 1,602,582
Liabilities and equity
Payables to credit institutions and central banks 18,498 15,692 21,653 26,647 23,422
Deposits 72,688 76,918 79,634 79,940 83,449
Bonds in issue at fair value 1,184,320 1,196,229 1,215,506 1,263,666 1,319,545
Subordinated debt 10,940 11,011 11,034 11,077 11,084
Remaining liabilities 59,861 68,243 82,184 78,796 83,216
Equity 78,921 79,883 78,681 80,569 81,866
Total liabilities and equity 1,425,228 1,447,976 1,488,693 1,540,695 1,602,582
Note: Sparinvest has been included in Nykredit’s financial reporting from 1 September 2019.
58.7 58.7
65.571.0
78.8 79.9 81.9
0
10
20
30
40
50
60
70
80
90
2013 2014 2015 2016 2017 2018 Q3/2019
Equity, DKKbn
������������� ���������������������� ���

&�����#��������������%���������������
Note: Mortgage lending based on fair value. Bank lending excludes reverse transactions. Note: Sparinvest has been included in Nykredit’s financial reporting from 1 September 2019.
5047
5047
55 5661
63
54
65 6563
65
76 77
83
0
10
20
30
40
50
60
70
80
90
2012 2013 2014 2015 2016 2017 2018 Q3/2019
Bank lending and bank deposits, fair value DKKbn
Bank lending incl. secured homeowner loans Bank deposits
������
��� ���
���
��� ������ ���
���
���
���
���
���
���
���
�
���
���
���
���
���
���
���
���
���
������� ������� ������� ������� �������
Assets under administration and under management, DKKbn
Assets under administration Assets under management
1,186 1,184 1,188 1,166 1,1801,220
1,2541,320
0
200
400
600
800
1,000
1,200
1,400
2012 2013 2014 2015 2016 2017 2018 Q3/2019
Total lending, fair value DKKbn
1,136 1,137 1,137 1,119 1,1251,164 1,194
1,256
0
200
400
600
800
1,000
1,200
1,400
2012 2013 2014 2015 2016 2017 2018 Q3/2019
Mortgage lending, fair value DKKbn
������������� ���������������������� ���

&�����#��������������%���������������
Note: Secured homeowner loans above include loans from both the Nykredit Bank Group and Totalkredit A/S.
736 744 752 766 784
424 428 431 431 438
1,160 1,171 1,183 1,197 1,221
0
200
400
600
800
1,000
1,200
1,400
Q3/2018 Q4/2018 Q1/2019 Q2/2019 Q3/2019
Mortgage lending, nominal value DKKbn
Personal Business
59 61 61 64 63
73 77 80 80
83
0
10
20
30
40
50
60
70
80
90
Q3/2018 Q4/2018 Q1/2019 Q2/2019 Q3/2019
Bank lending and bank deposits, DKKbn
Bank lending incl. secured homeowner loans Bank deposits
19 19 19 19 19 57 59 59 61 61
1,144 1,154 1,165 1,178 1,204
0
200
400
600
800
1,000
1,200
1,400
Q3/2018 Q4/2018 Q1/2019 Q2/2019 Q3/2019
Total lending by category, DKKbn
Secured homeowner loans
Bank lending excl. secured homeowner loans
Mortgage lending excl. secured homeowner loans
17 17 17 17 17
2 2 2 2 2
19 19 19 19 19
0
2
4
6
8
10
12
14
16
18
20
22
Q3/2018 Q4/2018 Q1/2019 Q2/2019 Q3/2019
Secured homeowner loans, DKKbn
Secured homeowner loans
Secured homeowner loans in bank lending
Secured homeowner loans in mortgage lending
������������� ���������������������� ��

�������'���������"��%���������������
Note: Sparinvest has been included in Nykredit’s financial reporting from 1 September 2019.
2,339 2,330 2,283 2,310 2,337
494 430 484 671 853355 336 350
369397
-88 -92 -89 -84 -90
679623
-137
3,0192,667
3,6273,865
3,340
-68-73
-80 -23
-1,000
0
1,000
2,000
3,000
4,000
5,000
Q3/2018 Q4/2018 Q1/2019 Q2/2019 Q3/2019
Net interest income Net fee income Wealth management income Net interest from capitalisation Trading, investment portfolio and other income Net income relating to customer benefits programmes
Income from business operations, DKKm
1,184 1,174 1,178
675 697 703
391 406 413
33 33 29
264 339 392
100 170 123
121 152 188
117 123 118
- -
203 220 225
-52 -57 -50-40 -47 -44 -27 -31 -31-11
68
-85
69 77
-13
1,502
1,646 1,553
752 814 814
581 629
586
244 267 263
-400
-200
0
200
400
600
800
1,000
1,200
1,400
1,600
1,800
2,000
Q1/2019 Q2/2019 Q3/2019 Q1/2019 Q2/2019 Q3/2019 Q1/2019 Q2/2019 Q3/2019 Q1/2019 Q2/2019 Q3/2019
Retail Totalkredit Partners C&I Wealth Management
Income from business operations by business area excl. Group items, DKKm
Net interest income Net fee income Wealth management income Net interest from capitalisation Trading, investment portfolio and other income
������������� ���������������������� ���

�������'�����������%���������������
Nykredit GroupDKK million Q3/2018 Q4/2018 Q1/2019 Q2/2019 Q3/2019
Staff costs1
748 767 767 797 800
IT costs 208 186 215 217 248
Facility costs 67 83 77 77 70
Bank levies and other expenses 180 237 171 181 191
Provisions for restructuring - - - - -
Total costs 1,203 1,273 1,230 1,273 1,3101
Staff costs incl. IT staff costs.
Note: Operating costs, depreciation and amortisation, incl. mortgage business contribution to
Resolution Fund and provisions for restructuring.
Note: Sparinvest has been included in Nykredit’s financial reporting from 1 September 2019.
The increase in the average number of full-time employees in 2019 is mainly due to the inclusion of the
Shared Valuation unit.
3,757 3,6483,505
3,382 3,443
0
500
1,000
1,500
2,000
2,500
3,000
3,500
4,000
2015 2016 2017 2018 Q3/2019
Average number of full-time employees
5,0715,285
5,0674,890
3,812
40.9% 39.4%36.2%
40.7%
35.2%
0
1,000
2,000
3,000
4,000
5,000
6,000
0%
10%
20%
30%
40%
50%
60%
70%
80%
2015 2016 2017 2018 YTD Q3/2019
Cost:income ratio, %
Total costs Cost:income ratio
������������� ���������������������� ��
�������%���������� ���������������
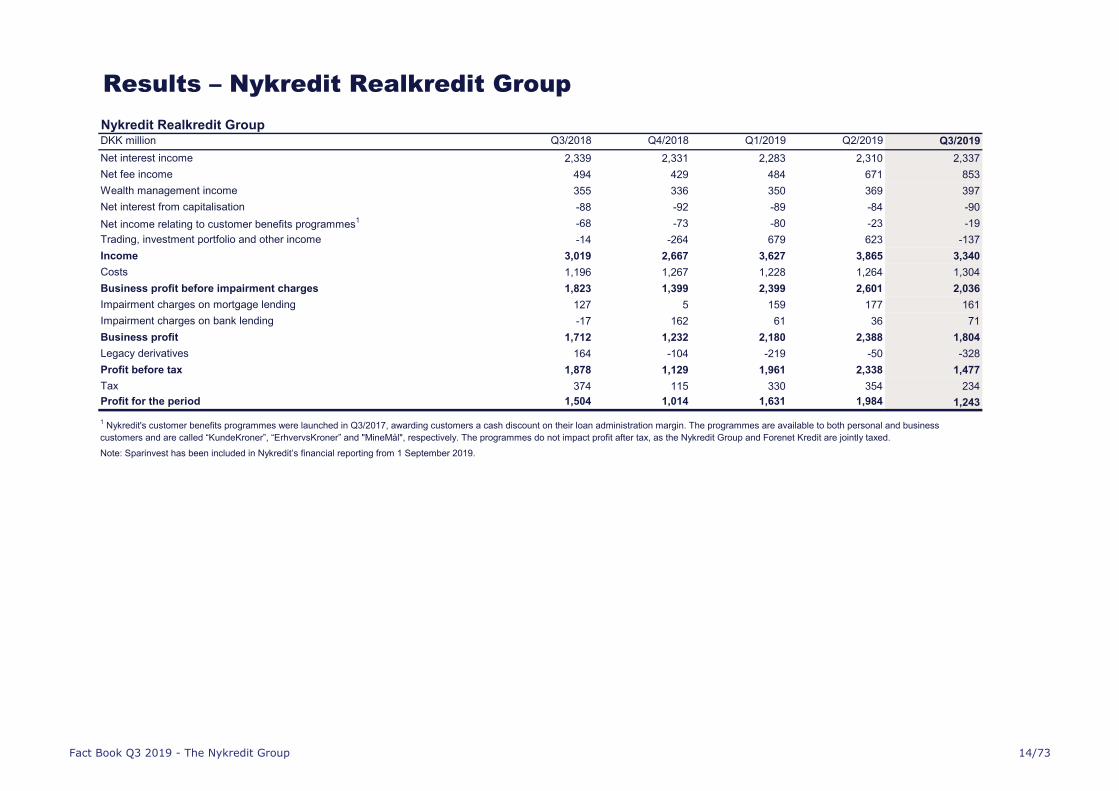
Nykredit Realkredit GroupDKK million Q3/2018 Q4/2018 Q1/2019 Q2/2019 Q3/2019
Net interest income 2,339 2,331 2,283 2,310 2,337
Net fee income 494 429 484 671 853
Wealth management income 355 336 350 369 397
Net interest from capitalisation -88 -92 -89 -84 -90
Net income relating to customer benefits programmes1 -68 -73 -80 -23 -19
Trading, investment portfolio and other income -14 -264 679 623 -137
Income 3,019 2,667 3,627 3,865 3,340
Costs 1,196 1,267 1,228 1,264 1,304
Business profit before impairment charges 1,823 1,399 2,399 2,601 2,036
Impairment charges on mortgage lending 127 5 159 177 161
Impairment charges on bank lending -17 162 61 36 71
Business profit 1,712 1,232 2,180 2,388 1,804
Legacy derivatives 164 -104 -219 -50 -328
Profit before tax 1,878 1,129 1,961 2,338 1,477
Tax 374 115 330 354 234
Profit for the period 1,504 1,014 1,631 1,984 1,243
1 Nykredit's customer benefits programmes were launched in Q3/2017, awarding customers a cash discount on their loan administration margin. The programmes are available to both personal and business
customers and are called “KundeKroner”, “ErhvervsKroner” and "MineMål", respectively. The programmes do not impact profit after tax, as the Nykredit Group and Forenet Kredit are jointly taxed.
Note: Sparinvest has been included in Nykredit’s financial reporting from 1 September 2019.
������������� ���������������������� ���

����������������""����%���������� ���������������
Nykredit Realkredit GroupDKK million Q3/2018 Q4/2018 Q1/2019 Q2/2019 Q3/2019
Assets
Receivables from credit institutions and central banks 29,526 29,691 37,744 43,475 71,304
Mortgage loans at fair value 1,183,494 1,193,667 1,217,330 1,232,135 1,256,233
Bank lending - excl. reverse transactions 58,749 60,566 60,723 63,505 63,289
Bonds and equities 92,412 99,444 105,368 117,650 122,535
Remaining assets 61,057 64,624 67,543 83,943 89,235
Total assets 1,425,238 1,447,991 1,488,708 1,540,708 1,602,597
Liabilities and equity
Payables to credit institutions and central banks 18,498 15,692 21,653 26,647 23,422
Deposits 72,715 76,946 79,682 79,959 83,466
Bonds in issue at fair value 1,184,320 1,196,229 1,215,506 1,263,666 1,319,545
Subordinated debt 10,940 11,011 11,034 11,077 11,084
Remaining liabilities 59,854 68,236 82,154 78,786 83,206
Equity 78,912 79,878 78,678 80,573 81,873
Total liabilities and equity 1,425,238 1,447,991 1,488,708 1,540,708 1,602,597
Nykredit Realkredit Group
Supervisory diamond (calculated at parent level)Q3/2018 Q4/2018 Q1/2019 Q2/2019 Q3/2019
Lending growth (limit value <15%) <4.3 <5.7 <4.9 <5.2 <7.4
Borrower's interest rate risk (limit value <25%) 14.6 14.2 13.9 13.4 12.9
Interest-only lending (limit value <10%) 9.1 8.8 8.5 8.2 7.9
Short-term funding (year) (limit value <25%) 15.6 13.3 13.4 11.9 11.8
Short-term funding (quarter) (limit value <12.5%) 3.7 2.1 3.4 2.9 3.6
Large exposures (limit value <100%) 36.2 35.3 35.6 35.9 36.7
Note: Lending growth (limit value<15%) indicates the segment with the highest lending growth. For a segment breakdown, please see latest Financial Statements.
Note: Sparinvest has been included in Nykredit’s financial reporting from 1 September 2019.
������������� ���������������������� ���

�������%��������������������
Nykredit Bank GroupDKK million Q3/2018 Q4/2018 Q1/2019 Q2/2019 Q3/2019
Net interest income 408 373 369 373 375
Net fee income 123 125 128 139 138
Wealth management income 355 336 350 369 397
Net interest from capitalisation -8 -7 -7 -7 -7
Trading, investment portfolio and other income 216 17 129 220 46
Income 1,094 844 969 1,093 948
Costs 480 562 520 528 551
Business profit before impairment charges 614 283 448 565 397
Impairment charges on bank lending -17 162 61 36 71
Business profit 631 120 387 529 327
Legacy derivatives 164 -104 -219 -50 -328
Profit before tax 795 16 168 479 -1
Tax 173 4 37 104 -2
Profit for the period 623 12 131 375 1
Note: Sparinvest has been included in Nykredit’s financial reporting from 1 September 2019.
������������� ���������������������� ���

����������������""����%��������������������
Nykredit Bank GroupDKK million Q3/2018 Q4/2018 Q1/2019 Q2/2019 Q3/2019
Assets
Cash balance and receivables from credit institutions and central banks 14,182 17,909 26,493 24,385 38,693
Reverse repurchase lending* 32,669 37,427 36,548 49,147 50,008
Loans, advances and other receivables at amortised cost 58,749 60,566 60,723 63,505 63,289
Bonds at fair value and equities 42,332 49,289 44,933 49,041 53,076
Remaining assets 21,219 21,943 24,261 28,555 32,261
Total assets 169,151 187,135 192,958 214,634 237,327
Liabilities and equity
Payables to credit institutions and central banks 43,484 54,620 49,098 77,760 92,481
Deposits and other payables 72,780 77,119 79,856 80,088 83,601
Bonds in issue at amortised cost 4,544 5,411 4,849 5,511 4,470
Repo deposits* 4,952 5,745 10,475 3,216 2,673
Other non-derivative financial liabilities at fair value 6,958 7,618 11,363 9,411 11,472
Remaining payables 14,136 13,236 13,765 14,751 16,647
Provisions 263 290 326 295 316
Subordinated debt 2,000 2,000 2,000 2,000 2,000
Equity 21,083 21,095 21,226 21,601 23,666
Total liabilities and equity 169,151 187,135 192,958 214,634 237,327
* Reverse repurchase transactions and repo deposits are measured at amortised cost.
Nykredit Bank A/SSupervisory diamond (calculated at parent level)
Q3/2018 Q4/2018 Q1/2019 Q2/2019 Q3/2019
Lending growth (limit value <20%) 2.3 8.9 6.6 9.2 8.1
Large exposures (limit value <175%) 98.6 91.7 92.9 99.4 106.0
Property exposure (limit value <25%) 11.4 10.7 10.9 10.0 10.4
Funding ratio (limit value < 1.0) 0.6 0.6 0.6 0.6 0.6
Liquidity benchmark (limit value >100%) 162.8 183.8 146.9 172.0 173.9
Note: Sparinvest has been included in Nykredit’s financial reporting from 1 September 2019.
������������� ���������������������� ���

�������%�������������(�)
Totalkredit A/SDKK million Q3/2018 Q4/2018 Q1/2019 Q2/2019 Q3/2019
Net interest income 804 838 797 825 863
Net fee income 122 98 109 200 225
Wealth management income - - - - -
Net interest from capitalisation -8 -99 -23 -35 -33
Net income relating to customer benefits programmes1 -51 -55 -55 -10 -13
Trading, investment portfolio and other income -19 -48 22 0 -72
Income 847 735 849 981 969
Costs 155 179 180 184 191
Business profit before impairment charges 692 555 670 797 778
Impairment charges on mortgage lending 17 119 46 29 -61
Business profit 675 436 623 768 840
Legacy derivatives - - - - -
Profit before tax 675 436 623 768 840
Tax 75 42 84 105 118
Profit for the period 599 394 539 663 7211 Nykredit's customer benefits programmes were launched in Q3/2017, awarding mortgage customers a cash discount on their loan administration margin. The programme is available to both personal and
business customers and is called “KundeKroner”. The program does not impact profit after tax, as the Nykredit Group and Forenet Kredit are jointly taxed.
������������� ���������������������� ��

����������������""����%�������������(�)
Totalkredit A/SDKK million Q3/2018 Q4/2018* Q1/2019 Q2/2019 Q3/2019
Assets
Receivables from credit institutions 9,358 18,186 7,423 24,778 42,020
Mortgage loans at fair value 673,878 684,542 705,081 721,848 741,549
Bonds and equities 66,721 53,107 65,471 100,643 93,450
Remaining assets 2,113 1,462 1,895 1,476 1,872
Total assets 752,070 757,297 779,869 848,745 878,891
Liabilities and equity
Payables to credit institutions 709,518 714,551 736,643 804,548 834,998
Bonds in issue at fair value 7,834 7,486 7,139 6,832 6,470
Remaining liabilities 4,833 5,030 5,367 6,028 5,413
Subordinated debt 2,000 2,000 2,000 2,000 2,000
Equity 27,884 28,229 28,720 29,336 30,010
Total liabilities and equity 752,070 757,297 779,869 848,745 878,891
* Reverse repurchase transactions and repo deposits are measured at amortised cost.
������������� ���������������������� ���
*�����#�������������������������
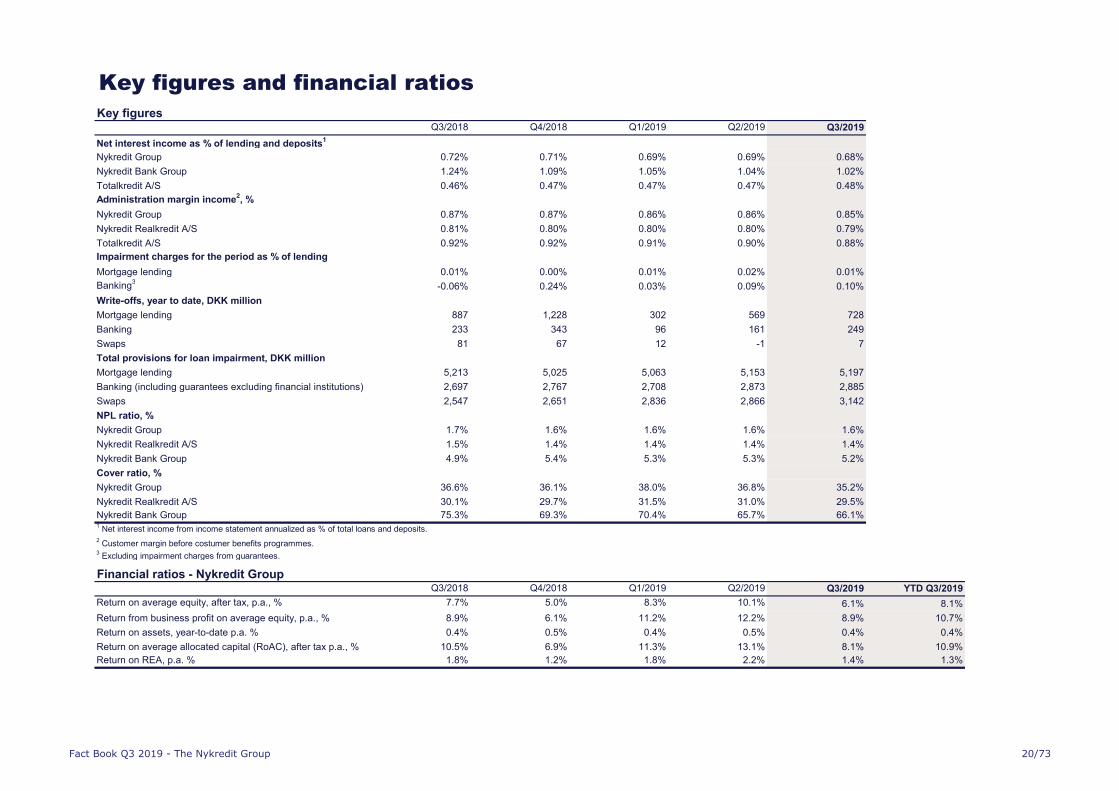
Key figuresQ3/2018 Q4/2018 Q1/2019 Q2/2019 Q3/2019
Net interest income as % of lending and deposits1
Nykredit Group 0.72% 0.71% 0.69% 0.69% 0.68%
Nykredit Bank Group 1.24% 1.09% 1.05% 1.04% 1.02%
Totalkredit A/S 0.46% 0.47% 0.47% 0.47% 0.48%
Administration margin income2, %
Nykredit Group 0.87% 0.87% 0.86% 0.86% 0.85%
Nykredit Realkredit A/S 0.81% 0.80% 0.80% 0.80% 0.79%
Totalkredit A/S 0.92% 0.92% 0.91% 0.90% 0.88%
Impairment charges for the period as % of lending
Mortgage lending 0.01% 0.00% 0.01% 0.02% 0.01%
Banking3
-0.06% 0.24% 0.03% 0.09% 0.10%
Write-offs, year to date, DKK million
Mortgage lending 887 1,228 302 569 728
Banking 233 343 96 161 249
Swaps 81 67 12 -1 7
Total provisions for loan impairment, DKK million
Mortgage lending 5,213 5,025 5,063 5,153 5,197
Banking (including guarantees excluding financial institutions) 2,697 2,767 2,708 2,873 2,885
Swaps 2,547 2,651 2,836 2,866 3,142
NPL ratio, %
Nykredit Group 1.7% 1.6% 1.6% 1.6% 1.6%
Nykredit Realkredit A/S 1.5% 1.4% 1.4% 1.4% 1.4%
Nykredit Bank Group 4.9% 5.4% 5.3% 5.3% 5.2%
Cover ratio, %
Nykredit Group 36.6% 36.1% 38.0% 36.8% 35.2%
Nykredit Realkredit A/S 30.1% 29.7% 31.5% 31.0% 29.5%
Nykredit Bank Group 75.3% 69.3% 70.4% 65.7% 66.1%1 Net interest income from income statement annualized as % of total loans and deposits.
2 Customer margin before costumer benefits programmes.
3 Excluding impairment charges from guarantees.
Financial ratios - Nykredit GroupQ3/2018 Q4/2018 Q1/2019 Q2/2019 Q3/2019 YTD Q3/2019
Return on average equity, after tax, p.a., % 7.7% 5.0% 8.3% 10.1% 6.1% 8.1%
Return from business profit on average equity, p.a., % 8.9% 6.1% 11.2% 12.2% 8.9% 10.7%
Return on assets, year-to-date p.a. % 0.4% 0.5% 0.4% 0.5% 0.4% 0.4%
Return on average allocated capital (RoAC), after tax p.a., % 10.5% 6.9% 11.3% 13.1% 8.1% 10.9%
Return on REA, p.a. % 1.8% 1.2% 1.8% 2.2% 1.4% 1.3%
������������� ���������������������� ����

����'��#�����������������������+�������������������
Exposure - weighted average risk weights (A-IRB method)% Q3/2018 Q4/2018 Q1/2019 Q2/2019 Q3/2019
Retail - Mortgage 12.5% 12.6% 12.4% 12.3% 12.3%
Commercial - Mortgage 24.2% 23.3% 25.0% 24.7% 24.4%
Total Mortgage 16.0% 15.8% 16.4% 16.1% 16.1%
Retail - Banking 42.2% 43.0% 41.6% 41.4% 41.7%
Commercial - Banking excl. reverse transactions 89.7% 57.1% 57.4% 55.1% 55.2%
Reverse transactions 1.6% 1.9% 1.5% 2.3% 2.0%
Retail - Group 13.5% 13.6% 13.3% 13.3% 13.2%
Commercial - Group 32.1% 31.4% 32.8% 32.7% 32.3%
Note: The shown risk weights only relates to credit risk. Pillar II and operational risk is therefore not included.
Capital ratios% Q3/2018 Q4/2018 Q1/2019 Q2/2019 Q3/2019
Total capital ratio, % 22.0% 23.5% 22.7% 23.2% 22.2%
Common Equity Tier 1 (CET1) capital ratio, % 21.0% 21.0% 20.4% 20.5% 19.4%
Leverage ratio, % 4.8% 4.8% 4.8% 4.7% 4.3%
������������� ���������������������� � ��

*�����#����,�!-��.�$/(�����(/0
DKK million Q3/2018 Q4/2018 Q1/2019 Q2/2019 Q3/2019
Nykredit Group
CET1, fully loaded1
71,464 72,404 72,313 74,128 72,492
Distance to MDA, not fully loaded2
40,351 41,152 34,532 35,612 30,829
Distance to MDA, fully loaded1, 3
33,466 34,194 30,994 32,004 27,101
Available Distributable Items (ADI) 45,748 46,537 44,861 47,345 45,248
Nykredit Realkredit Group
CET1, fully loaded1
71,556 72,701 72,552 74,433 72,624
Distance to MDA, not fully loaded2
40,340 41,348 34,852 35,796 30,834
Distance to MDA, fully loaded1, 3
33,433 34,367 31,302 32,177 27,094
Available Distributable Items (ADI) 38,289 53,210 51,530 53,001 50,166
Asset encumbrance 86.0% 84.1% 85.3% 81.9% -
Nykredit Realkredit A/S
Internal capital adequacy requirement, % 8.9% 8.9% 8.9% 8.9% 8.9%
CET1, fully loaded1
71,635 72,657 72,610 74,339 74,497
Distance to MDA, not fully loaded2
36,313 37,454 29,825 30,562 26,341
Distance to MDA, fully loaded1, 3
27,878 29,047 25,549 26,186 21,757
Available Distributable Items (ADI) 49,072 50,198 49,029 49,801 48,2761 In the above table CET1 CRR fully loaded is calculated under the assumption that all deductions are taken in CET1.
2 Maximum Distributable Amount (MDA): Estimated MDA buffers calculated under the assumption that AT1 and T2 requirements are covered by relevant capital instruments and that the CET1 requirement is 10.676% for both
Nykredit Group and Nykredit Realkredit Group and 10.004% for Nykredit Realkredit A/S. 3 Maximum Distributable Amount (MDA): Estimated MDA buffers calculated under the assumption that AT1 and T2 requirements are covered by relevant capital instruments and that the CET1 requirement is 11.676% for both
Nykredit Group and Nykredit Realkredit Group and 11.004% for Nykredit Realkredit A/S (CET1 requirements are fully implemented, and the countercyclical buffer is included at currently known level and under the assumption
that Pillar II level is equal to the current level).
������������� ���������������������� ����
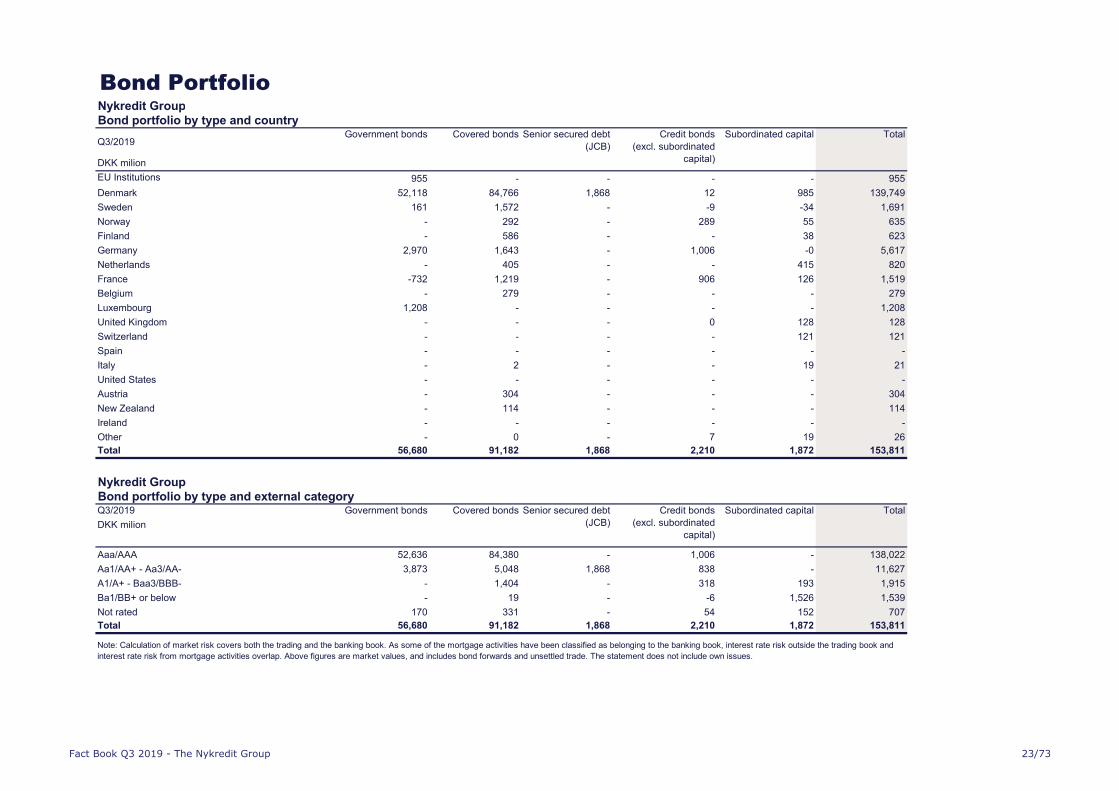
�����1��������Nykredit GroupBond portfolio by type and country
DKK milion
EU Institutions 955 - - - - 955
Denmark 52,118 84,766 1,868 12 985 139,749
Sweden 161 1,572 - -9 -34 1,691
Norway - 292 - 289 55 635
Finland - 586 - - 38 623
Germany 2,970 1,643 - 1,006 -0 5,617
Netherlands - 405 - - 415 820
France -732 1,219 - 906 126 1,519
Belgium - 279 - - - 279
Luxembourg 1,208 - - - - 1,208
United Kingdom - - - 0 128 128
Switzerland - - - - 121 121
Spain - - - - - -
Italy - 2 - - 19 21
United States - - - - - -
Austria - 304 - - - 304
New Zealand - 114 - - - 114
Ireland - - - - - -
Other - 0 - 7 19 26
Total 56,680 91,182 1,868 2,210 1,872 153,811
Nykredit GroupBond portfolio by type and external categoryQ3/2019
DKK milion
Aaa/AAA 52,636 84,380 - 1,006 - 138,022
Aa1/AA+ - Aa3/AA- 3,873 5,048 1,868 838 - 11,627
A1/A+ - Baa3/BBB- - 1,404 - 318 193 1,915
Ba1/BB+ or below - 19 - -6 1,526 1,539
Not rated 170 331 - 54 152 707
Total 56,680 91,182 1,868 2,210 1,872 153,811
Government bonds Covered bonds Senior secured debt
(JCB)
Credit bonds
(excl. subordinated
capital)
Total
Government bonds Covered bonds Senior secured debt
(JCB)
Subordinated capital Total
Subordinated capitalQ3/2019
Credit bonds
(excl. subordinated
capital)
Note: Calculation of market risk covers both the trading and the banking book. As some of the mortgage activities have been classified as belonging to the banking book, interest rate risk outside the trading book and
interest rate risk from mortgage activities overlap. Above figures are market values, and includes bond forwards and unsettled trade. The statement does not include own issues.
������������� ���������������������� ���

$���#�#��������#
�
�
���
���
���
���
���
���
���
���
���
������� ������� ������� ������� �������
Mortgage lending, nominal value, DKKbn
����� �!!������������"# ��$��
�
��
��
��
��
���
���
���
������� ������� ������� ������� �������
Mortgage lending by property type (excl. owner-occupied dwellings), nominal value, DKKbn
%��&��������� '���#�����������# �((�!���������� )"��!������ %�*��!$��#��" +��������&�$��#��" ��$��
������������� ���������������������� ����

$���#�#��������#
Mortgage lending – by property typeDKK million, nominal value Q3/2018 Q4/2018 Q1/2019 Q2/2019 Q3/2019 Average impairment
charges Q4/2018 -
Q3/2019
Average write-offs
Q4/2018 - Q3/2019
Owner-occupied dwellings 727,779 735,678 744,127 757,974 775,726 0.00% 0.02%
Private rental 93,525 96,734 98,838 99,609 104,067 -0.03% 0.01%
Industry and trades 21,250 21,531 21,990 23,189 23,360 -0.01% 0.00%
Office and retail 114,374 115,033 116,539 115,964 117,689 -0.04% 0.01%
Agriculture 90,047 89,575 88,953 88,714 88,847 -0.04% 0.05%
Public housing 63,545 63,309 63,142 62,627 62,160 -0.01% -0.00%
Cooperative housing 35,498 35,618 35,494 35,326 35,574 -0.05% 0.01%
Other 14,426 13,970 13,791 13,261 13,987 -0.01% 0.03%
Total 1,160,443 1,171,449 1,182,875 1,196,664 1,221,411 -0.01% 0.01%
Owner-occupied dwellings
63%
Private rental9%
Industry and trades
2%
Office and retail10%
Agriculture 7%
Public housing5%
Cooperative housing
3%Other1%
������������� ���������������������� ����

$���#�#��������#
Mortgage lending at nominal value by geographyDKK billion Q3/2018 Q4/2018 Q1/2019 Q2/2019 Q3/2019
Copenhagen 114 117 119 121 126
Outskirts of Copenhagen 215 218 222 227 234
Remaining Sealand 98 98 98 99 100
Faroe Islands and Greenland 2 2 2 2 2
Eastern Jutland 239 242 245 248 254
Funen 88 88 89 90 91
Northern Jutland 192 194 194 195 196
Southern Jutland 41 41 42 42 42
Western Jutland 112 111 111 113 114
Foreign lending 58 59 60 60 62
Total 1,160 1,171 1,183 1,197 1,221
Copenhagen10%
Outskirts of Copenhagen
19%
Remaining Sealand
8%Faroe
Islands and Greenland
0%
Eastern Jutland
21%
Funen8%
Northern Jutland
16%
Southern Jutland
4%
Western Jutland
9%
Foreign lending
5%
Q3/2019 (DKK billion)
������������� ���������������������� ����

$���#�#��������#
Nykredit Group
Mortgage lending at nominal value
Q3/2019, DKK billion
Capital Region of Denmark 199.2 32.4 2.7 33.8 2.1 22.6 19.4 5.5 317.7
Region Zealand 99.2 5.3 2.2 11.4 12.5 7.1 3.3 0.9 141.8
North Denmark Region 106.1 10.3 2.8 8.8 22.5 7.3 3.3 1.1 162.3
Central Denmark Region 193.2 22.4 6.3 21.6 27.7 12.1 4.9 4.1 292.2
Region of Southern Denmark 165.3 13.6 3.8 16.0 24.0 13.1 4.6 2.4 242.8
Total foreign mortgage lending 12.8 20.0 5.5 26.1 0.0 - 0.1 0.0 64.6
Faroe Islands and Greenland 2.1 0.2 - 0.1 - - 0.1 0.0 2.5
Finland - 0.6 0.3 2.5 - - - - 3.4
France 4.7 - - - - - - - 4.7
Germany 0.1 10.4 1.1 1.0 - - - - 12.6
Norway - - - - - - - - -
Poland - - - - - - - - -
Spain 5.9 - - - - - - - 5.9
Sweden - 8.9 2.5 22.4 - - - - 33.8
United Kingdom - - 1.6 0.0 0.0 - - - 1.7
Total mortgage lending 775.7 104.1 23.4 117.7 88.8 62.2 35.6 14.0 1,221.4
Public housing Cooperative
housing
Other TotalOwner-occ.
dwellings
Private rental Industry and
trades
Office and retail Agriculture
������������� ���������������������� ����

$���#�#��������#
Variable-rate loans with refinancing within one year (ARMs, money marked-linked), debt
outstanding with maturity less than 1 year, all segments, variable-rate loans.
53% 54% 54%
47% 46% 46%
0%
10%
20%
30%
40%
50%
60%
70%
80%
90%
100%
Q1/2019 Q2/2019 Q3/2019
Bond debt outstanding by loan and interest type, all segments
Loans excl interest-only option Loans with interest-only option
51%
32%
17%
Mortgage lending by loan type, private residential properties, Q3/2019
Fixed-rate loans
Adjustable-rate mortgageloans (ARMs)
Money market-linked loans
0%
2%
4%
6%
8%
10%
12%
14%
16%
18%
0
50,000
100,000
150,000
200,000
250,000
Q3/2018 Q4/2018 Q1/2019 Q2/2019 Q3/2019
Debt (DKK million) Total share of debt (%)
21%
28%
51%
Mortgage lending by loan type, commercial, Q3/2019
Fixed-rate loans
Adjustable-rate mortgageloans (ARMs)
Money market-linked loans
������������� ���������������������� � ��

(�������%�"���#�#��������#
�
0.0%
0.1%
0.2%
0.3%
0.4%
0.5%
0.6%
0%
1%
2%
3%
4%
5%
6%
7%
8%
Ju
n-0
1
De
c-0
1
Ju
n-0
2
De
c-0
2
Ju
n-0
3
De
c-0
3
Ju
n-0
4
De
c-0
4
Ju
n-0
5
De
c-0
5
Ju
n-0
6
De
c-0
6
Ju
n-0
7
De
c-0
7
Ju
n-0
8
De
c-0
8
Ju
n-0
9
De
c-0
9
Ju
n-1
0
De
c-1
0
Ju
n-1
1
De
c-1
1
Ju
n-1
2
De
c-1
2
Ju
n-1
3
De
c-1
3
Ju
n-1
4
De
c-1
4
Ju
n-1
5
De
c-1
5
Ju
n-1
6
De
c-1
6
Ju
n-1
7
De
c-1
7
Ju
n-1
8
De
c-1
8
Ju
n-1
9
Arrears, 75 days past due, %
Cooperative housing Owner-occupied dwellings Industry and trades
Office and retail Agriculture Public housing
Other Private residential rental
�!�"
�!�"
!�"
!�"
�!�"
�!�"
!�"
!�"
�!�"
0.0%
0.1%
0.2%
0.3%
0.4%
0.5%
0.6%
0.7%
0.8%
0.9%
1.0%Ju
n-0
1
De
c-0
1Ju
n-0
2D
ec-0
2
Ju
n-0
3D
ec-0
3Ju
n-0
4
De
c-0
4Ju
n-0
5D
ec-0
5
Ju
n-0
6D
ec-0
6Ju
n-0
7
De
c-0
7Ju
n-0
8D
ec-0
8
Ju
n-0
9D
ec-0
9Ju
n-1
0
De
c-1
0Ju
n-1
1D
ec-1
1Ju
n-1
2
De
c-1
2Ju
n-1
3D
ec-1
3
Ju
n-1
4D
ec-1
4Ju
n-1
5
De
c-1
5Ju
n-1
6D
ec-1
6
Ju
n-1
7D
ec-1
7Ju
n-1
8
De
c-1
8Ju
n-1
9
Arrears - 75 days past due, %
Nykredit Realkredit Group Write-offs, Nykredit Realkredit Group
������������� ���������������������� ����

�
���#���������������������������������������"���#�#��������#�%�
�'���+����������'�����#�.�"���#�#��������#
75 day-arrears, Q3/2018 75 day-arrears, Q3/2019
������������� ���������������������� ���

��������������������������������������
�
44 54 62
83 100
47
19 13 7
57
163
273
347 356
322
238
159
107
51 35
22
237 196
117
80 59
26 20 13 0
50
100
150
200
250
300
350
400
1999 2000 2001 2002 2003 2004 2005 2006 2007 2008 2009 2010 2011 2012 2013 2014 2015 2016 2017 2018 Q3/2019
Repossessions in Denmark, The Nykredit Group
Stock Stock, owner-occupied dwellings
424 483 482 574 604 657 395
192 186 359
850
1,258 1,282 1,611 1,621
1,185 1,100 898 816
619 407
2,397 2,584 2,682
3,041 3,039
2,640
1,874
1,231 1,392
2,840
4,140
5,222 5,002 5,130
4,439
3,499 3,544
2,818 2,657 2,774
559
0
1,000
2,000
3,000
4,000
5,000
6,000
1999 2000 2001 2002 2003 2004 2005 2006 2007 2008 2009 2010 2011 2012 2013 2014 2015 2016 2017 2018 Q3/2019
Forced sales in Denmark
The Nykredit Group Market
������������� ���������������������� ��

�����������#����"���#�#��������#�
Debt outstanding by LTV bracket, Q3/2019
DKK million 0-40 40-60 60-80 80-100 Over 100 Total LTV-median Average LTV
% %
Owner-occupied dwellings 498,745 186,827 104,082 10,287 1,751 801,691 31 67
Private rental 94,091 30,898 13,053 1,586 488 140,115 28 62
Industry and trades 19,180 3,529 261 27 16 23,012 21 46
Office and retail 89,044 24,194 2,375 460 188 116,261 25 53
Agriculture 59,546 20,119 7,170 1,227 743 88,805 29 63
Other 11,257 2,059 668 58 44 14,086 21 50
Total Q3/2019 771,863 267,625 127,608 13,645 3,230 1,256,233 29 62
Total Q3/2018 730,680 250,154 116,801 13,169 3,367 1,183,494 29 62
% 0-40 40-60 60-80 80-100 Over 100 80%*
Owner-occupied dwellings 62 23 13 1 0
Private rental 67 22 9 1 0 80%
Industry and trades 83 15 1 0 0 80%
Office and retail 77 21 2 0 0 80%
Agriculture 67 23 8 1 1 80%
Other 80 15 5 0 0 80%
Total Q3/2019 65 23 11 1 0 60%
75%
60%
60%
60%
60%
40%
(**) The LTV limit may be extended up to 70%. For office, retail, industry and trade properties the limit may be extended against
supplementary collateral for the part in excess in 60%.
Note: The average LTV is determined as the top part of the debt outstanding relative to estimated property values. The figures are
actual LTV ratios including any financed costs. Public authority guarantees reduce the credit risk relating to subsidised housing that
forms part of lending to the public housing segment. For this reason, LTVs of public housing offer no relevant risk data.
(*) Some loan types offered for residential properties are subject to a lower LTV limit than 80%, but no supplementary collateral is
required unless the LTV ratio subsequently exceeds 80%.
Properties used for social, cultural or
educational purposes
Holiday homes
Agricultural and forestry properties,
market gardens etc**
Private residential property for all-year
habitation
Youth housing
Senior housing
Private cooperative housing
Private residential rental properties
Public housing
Industry and trades properties**
Utilites
Other properties - including undeveloped
land
Office and retail properties**
1 In these tables mortgage lending is distributed according to which part of lending falls within each LTV bracket as a continuous distribution. As an
example a mortgage on DKKm 0.8 in a property valued at DKKm 1 will be shown in the following brackets: DKKm 0.4 in LTV bracket 0-40, DKKm
0.2 in LTV bracket 40-60 and finally DKKm 0.2 in LTV bracket 60-80.
Fair value 2019 LTV (loan-to-value), the Nykredit Group
continous distribution, the Nykredit Group
Debt outstanding by LTV bracket, Q3/2019
-
Public housing
-
-
-
-
-
72,263
69,325
Statutory LTV limits by
property category
2.18% of total lending is outside
statutory LTV limits
������������� ���������������������� ���

�����������#����"���#�#��������#�
DKK million 0-40 40-60 60-80 80-100 Over 100 Total LTV-median Average LTV
% %
Owner-occupied dwellings 89,880 185,814 348,598 164,189 13,209 801,691 31 67
Private rental 40,441 49,638 39,697 7,709 2,631 140,115 28 62
Industry and trades 12,612 7,692 2,529 105 73 23,012 21 46
Office and retail 42,282 61,016 10,349 1,648 967 116,261 25 53
Agriculture 36,821 32,228 14,810 3,485 1,460 88,805 29 63
Other 8,348 3,891 1,526 185 136 14,086 21 50
Total Q3/2019 230,384 340,279 417,511 177,320 18,477 1,256,233 29 62
Total Q3/2018 226,505 325,210 414,169 126,005 22,280 1,183,494 29 62
% 0-40 40-60 60-80 80-100 Over 100 80%*
Owner-occupied dwellings 11 23 43 20 2
Private rental 29 35 28 6 2 80%
Industry and trades 55 33 11 0 0 80%
Office and retail 36 52 9 1 1 80%
Agriculture 41 36 17 4 2 80%
Other 59 28 11 1 1 80%
Total Q3/2019 19 29 35 15 2 60%
75%
60%
60%
60%
60%
40%
Statutory LTV limits by
property category
Private residential property for all-year
habitation
Debt outstanding by LTV bracket, Q3/2019, the Nykredit Group
-
-
-
-
72,263
17,91% of total lending is
outside statutory LTV limits
2 In these tables mortgage lending is distributed according to which LTV bracket the top part of each mortgage falls withing. As an example a morgage
on DKKm 0.8 in a propery valued at DKKm 1 will solely be shown in the LTV bracket 60-80.
Debt outstanding by LTV bracket, Q3/2019
Other properties - including undeveloped
land
(*) Some loan types offered for residential properties are subject to a lower LTV limit than 80%, but no supplementary collateral is required
unless the LTV ratio subsequently exceeds 80%.
Note: The average LTV is determined as the top part of the debt outstanding relative to estimated property values. The figures are actual
LTV ratios including any financed costs. Public authority guarantees reduce the credit risk relating to subsidised housing that forms part of
lending to the public housing segment. For this reason, LTVs of public housing offer no relevant risk data.
Properties used for social, cultural or
educational purposes
Public housing
Youth housing
Senior housing
Fair value 2019 LTV (loan-to-value), the Nykredit GroupPublic housing
-
-
69,325
Private cooperative housing
Private residential rental properties
(**) The LTV limit may be extended up to 70%. For office, retail, industry and trade properties the limit may be extended against
supplementary collateral for the part in excess in 60%.
Holiday homes
Agricultural and forestry properties,
market gardens etc**
Office and retail properties**
Industry and trades properties**
Utilites
������������� ���������������������� ��

&�2
65.1
64.2
63.8
63.563.2
62.7
63.5
62.8
62.462.3 62.4 62.3 62.3
60
61
62
63
64
65
66
Q3/2016 Q4/2016 Q1/2017 Q2/2017 Q3/2017 Q4/2017 Q1/2018 Q2/2018 Q3/2018 Q4/2018 Q1/2019 Q2/2019 Q3/2019
Average LTV - all segments, %
70.8
69.769.2
68.968.6
68.3
67.7
67.267.0 66.9
67.1 67.2 67.2
64
65
66
67
68
69
70
71
72
Q3/2016 Q4/2016 Q1/2017 Q2/2017 Q3/2017 Q4/2017 Q1/2018 Q2/2018 Q3/2018 Q4/2018 Q1/2019 Q2/2019 Q3/2019
Average LTV - private residential properties, %
������������� ���������������������� ���

-3����������������+������������%�"���#�#��������#
�
11.1
37.3
52.4
43.9
36.3
54.6
47.3
62.2
72.368.6
0
10
20
30
40
50
60
70
80
90
2019 2020 2021 2022 2023 2024 2025 2026 2027 2028
LTV distribution - size of loans by interest-only expiry, DKKbn
LTV <60% LTV 60-80% LTV 80-100% LTV >100%
0.5
1.2
1.1
0.7
0.5 0.50.4
0.6
0.8
0.7
0.0
0.2
0.4
0.6
0.8
1.0
1.2
1.4
2019 2020 2021 2022 2023 2024 2025 2026 2027 2028
Debt outstanding over 80% LTV with expiry of interest-only period, by year, DKKbn (Only the amount of the loan that exceeds 80%)
������������� ���������������������� ���

0"����"�������4�����������'����+�����%�"���#�#��������#
�
����#�$������%%&�%������ ����&�'���(��'��''��)�*��
0
1,000
2,000
3,000
4,000
5,000
6,000
7,000
Impairment provisions and write-offs, DKKm
Total provisions Write-offs
0.43%
0.01%
0.0%
0.2%
0.4%
0.6%
0.8%
1.0%
1.2%
Provisions and write-offs as % of loans and advances
Provisions Write-offs
������������� ���������������������� ���
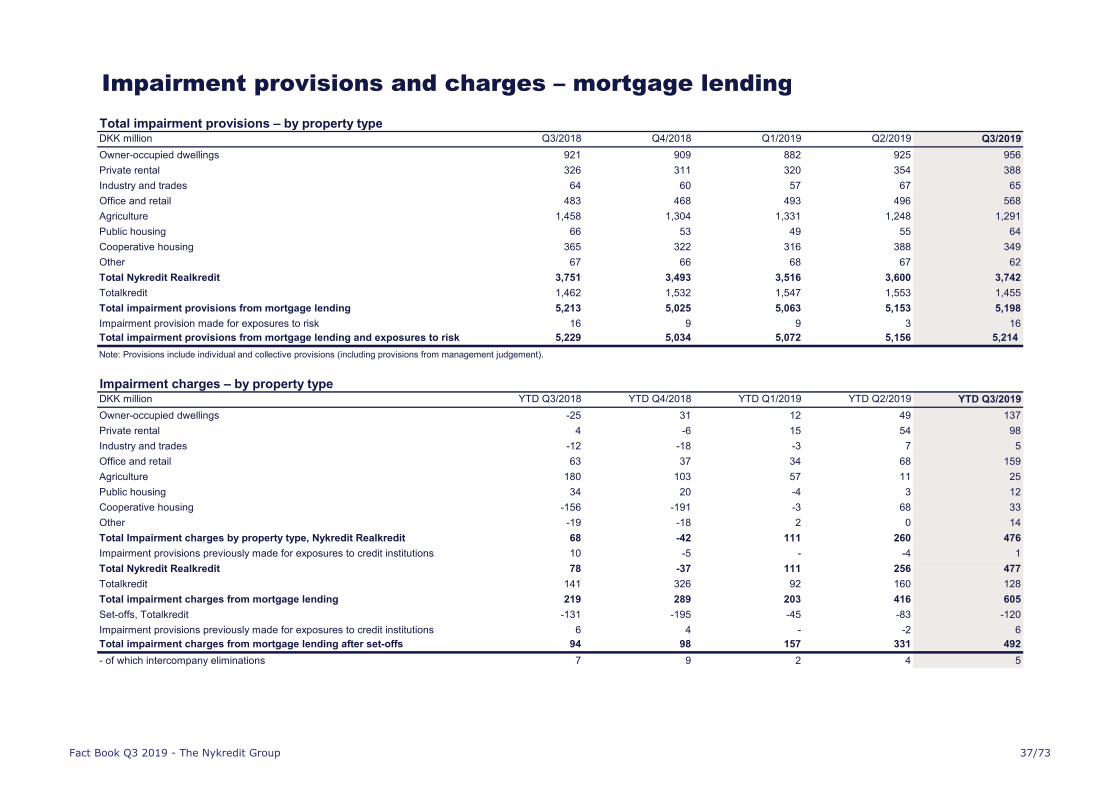
0"����"�������4���������������#���%�"���#�#��������#
Total impairment provisions – by property typeDKK million Q3/2018 Q4/2018 Q1/2019 Q2/2019 Q3/2019
Owner-occupied dwellings 921 909 882 925 956
Private rental 326 311 320 354 388
Industry and trades 64 60 57 67 65
Office and retail 483 468 493 496 568
Agriculture 1,458 1,304 1,331 1,248 1,291
Public housing 66 53 49 55 64
Cooperative housing 365 322 316 388 349
Other 67 66 68 67 62
Total Nykredit Realkredit 3,751 3,493 3,516 3,600 3,742
Totalkredit 1,462 1,532 1,547 1,553 1,455
Total impairment provisions from mortgage lending 5,213 5,025 5,063 5,153 5,198
Impairment provision made for exposures to risk 16 9 9 3 16
Total impairment provisions from mortgage lending and exposures to risk 5,229 5,034 5,072 5,156 5,214
Note: Provisions include individual and collective provisions (including provisions from management judgement).
Impairment charges – by property typeDKK million YTD Q3/2018 YTD Q4/2018 YTD Q1/2019 YTD Q2/2019 YTD Q3/2019
Owner-occupied dwellings -25 31 12 49 137
Private rental 4 -6 15 54 98
Industry and trades -12 -18 -3 7 5
Office and retail 63 37 34 68 159
Agriculture 180 103 57 11 25
Public housing 34 20 -4 3 12
Cooperative housing -156 -191 -3 68 33
Other -19 -18 2 0 14
Total Impairment charges by property type, Nykredit Realkredit 68 -42 111 260 476
Impairment provisions previously made for exposures to credit institutions 10 -5 - -4 1
Total Nykredit Realkredit 78 -37 111 256 477
Totalkredit 141 326 92 160 128
Total impairment charges from mortgage lending 219 289 203 416 605
Set-offs, Totalkredit -131 -195 -45 -83 -120
Impairment provisions previously made for exposures to credit institutions 6 4 - -2 6
Total impairment charges from mortgage lending after set-offs 94 98 157 331 492
- of which intercompany eliminations 7 9 2 4 5
������������� ���������������������� ���

�
���#�������������������������'����+�����������"���#�#��������#��������
���+�����%��'���+����������'�����#�.�"���#�#��������#
Loss as % of total mortgage lending last 4 quarters, Q3/2018 Loss as % of total mortgage lending last 4 quarters, Q3/2019
������������� ���������������������� ��

5����+�����%�"���#�#��������#
Write-offs after set-offs – by property typeDKK million YTD Q3/2018 YTD Q4/2018 YTD Q1/2019 YTD Q2/2019 YTD Q3/2019
Owner-occupied dwellings 106 184 1 66 91
Private rental 57 62 39 7 21
Industry and trades 13 10 -0 0 4
Office and retail 68 54 10 40 55
Agriculture 85 143 42 80 149
Public housing 3 - - - -
Cooperative housing 11 18 0 0 0
Other 33 33 - 3 15
Total Nykredit Realkredit 376 505 92 196 336
Totalkredit 277 416 90 174 358
Total write-offs from mortgage lending 652 921 182 370 694
Set-offs, Totalkredit 145 194 42 83 -114
Total write-offs from mortgage lending after set-offs 797 1,115 225 453 534
- of which intercompany eliminations 0 - - 0 0
Note: Write-offs for the year regardless whether the loan has been recognised through profit or loss for the same year. Q3 2019 has not been annualized.
Note: Relative to previous years’ Fact Books, amounts offset have been adjusted for intercompany eliminations.
������������� ���������������������� ���
�����&�����#,�&����.���4����������#���������
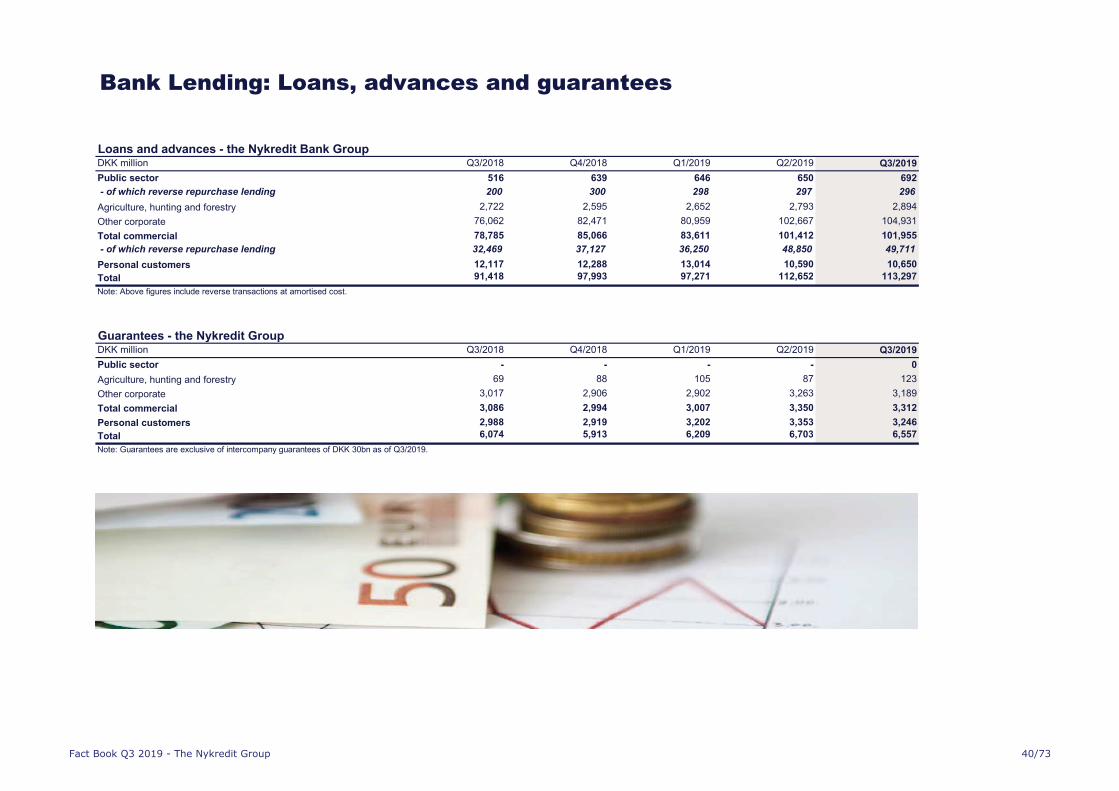
Loans and advances - the Nykredit Bank GroupDKK million Q3/2018 Q4/2018 Q1/2019 Q2/2019 Q3/2019
Public sector 516 639 646 650 692
- of which reverse repurchase lending 200 300 298 297 296
Agriculture, hunting and forestry 2,722 2,595 2,652 2,793 2,894
Other corporate 76,062 82,471 80,959 102,667 104,931
Total commercial 78,785 85,066 83,611 101,412 101,955
- of which reverse repurchase lending 32,469 37,127 36,250 48,850 49,711
Personal customers 12,117 12,288 13,014 10,590 10,650
Total 91,418 97,993 97,271 112,652 113,297
Guarantees - the Nykredit GroupDKK million Q3/2018 Q4/2018 Q1/2019 Q2/2019 Q3/2019
Public sector - - - - 0
Agriculture, hunting and forestry 69 88 105 87 123
Other corporate 3,017 2,906 2,902 3,263 3,189
Total commercial 3,086 2,994 3,007 3,350 3,312
Personal customers 2,988 2,919 3,202 3,353 3,246
Total 6,074 5,913 6,209 6,703 6,557
Note: Above figures include reverse transactions at amortised cost.
Note: Guarantees are exclusive of intercompany guarantees of DKK 30bn as of Q3/2019.
������������� ���������������������� ����

�����������#,�0"����"�������4������
DKK million Q3/2018 Q4/2018 Q1/2019 Q2/2019 Q3/2019
Public sector 0 1 2 0 0
Agriculture, hunting and forestry 79 97 116 117 129
Other corporate 1,543 1,651 1,702 1,637 1,610
Total commercial 1,622 1,748 1,817 1,754 1,739
Personal customers 568 525 463 443 431
Total 2,190 2,274 2,282 2,198 2,170
DKK million Q3/2018 Q4/2018 Q1/2019 Q2/2019 Q3/2019
Public sector 2 1 1 1 3
Agriculture, hunting and forestry 25 24 26 28 29
Other corporate 367 350 323 411 447
Total commercial 392 374 350 439 476
Personal customers 113 117 76 104 102
Total 507 492 426 544 580
Total impairment provisionsDKK million Q3/2018 Q4/2018 Q1/2019 Q2/2019 Q3/2019
Public sector 2 3 3 1 3
Agriculture, hunting and forestry 104 121 142 145 158
Other corporate 1,910 2,000 2,025 2,048 2,057
Total commercial 2,014 2,121 2,167 2,193 2,215
Personal customers 680 643 538 547 533
Total 2,697 2,767 2,708 2,741 2,751
From Q1 2018 impairment provisions are determined according to the IFRS 9 principles.
Stage 3
Stage 1-2
Stage 1-3
������������� ���������������������� � ��

�����������#,����+������"��#�������6�1&7
Non-performing bank loans (rating NPL)DKK million Q3/2018 Q4/2018 Q1/2019 Q2/2019 Q3/2019
Impairment provisions, IFRS 9 stage 3 2,190 2,274 2,282 2,198 2,170
Non-performing loans1
2,908 3,283 3,239 3,347 3,285
Individual impairment provisions as % of loans and advances subject
to individual impairment provisioning 75.3% 69.3% 70.4% 65.7% 66.1%
Non-performing loans, % 4.9% 5.4% 5.3% 5.3% 5.2%1
Non-performing loans are not limited to stage 3 loans, but also include some stage 2 loans.
$������4������������4���4��Nykredit Bank Group
Q3/2019DKK billion / % Negative market
value
Total impairment
provisions2
Total impairment
provision as %
of market value
Housing cooperatives 7.4 2.3 31%
Agriculture 0.9 0.2 25%
Other 8.8 0.6 7%
Total 17.1 3.1 18%2 Individual value adjustments, management judgement and CVA.
From Q1/2018 impairment provisions are determined according to the IFRS 9 principles.
������������� ���������������������� ����

Exposure to weak customers (rating 0)DKK million Q3/2018 Q4/2018 Q1/2019 Q2/2019 Q3/2019
Total impairment provisions, rating 0 (DKK million) 351 302 315 253 202
Bond debt outstanding with OEI (DKK million) 11,786 11,539 11,580 8,327 7,594
Total bond debt outstanding (DKK million) 1,160,443 1,171,449 1,182,875 1,196,664 1,221,411
Bond debt outstanding with OEI/total bond debt outstanding
(%)
1.02% 0.98% 0.98% 0.70% 0.62%
Non-performing loans (rating -1)DKK million Q3/2018 Q4/2018 Q1/2019 Q2/2019 Q3/2019
Total impairment provisions, NPL (DKK million) 2,418 2,292 2,078 2,029 2,070
Bond debt outstanding, NPL (DKK million)1 17,330 16,937 16,092 16,608 17,620
Total bond debt outstanding (DKK million) 1,160,443 1,171,449 1,182,875 1,196,664 1,221,411
Cover ratio 30.08% 29.67% 31.46% 31.03% 29.50%
Bond debt outstanding, NPL/total bond debt outstanding (%) 1.49% 1.45% 1.36% 1.39% 1.44%
$���#�#��������#,�5���������"�����������+������"��#�������6�1&7From Q1 2018 impairment provisions are determined according to the IFRS 9 principles.
������������� ���������������������� ���

The Nykredit Group
RetailPersonal customers and SMEs (small and medium-sized
enterprises)
Corporates & Institutions Corporate & Institutional Banking (CIB) and Nykredit Markets.
Totalkredit PartnersMortgage lending to personal and business customers
arranged by local and regional banks.
Wealth ManagementNykredit Asset Management, Nykredit Portefølje
Administration, Sparinvest and Private Banking Elite.
Group ItemsIncome and costs not allocated to the business areas as well
as core income from securities, investment portfolio income
and net income relating to customer benefits programmes.
��������������
������������� ���������������������� ����

0���"��%���������������
The Nykredit Group - business areasDKK million Q3/2018 Q4/2018 Q1/2019 Q2/2019 Q3/2019
Income
Personal Banking 713 635 651 705 774
Business Banking 947 817 852 942 926
C&I 577 566 581 629 596
Totalkredit Partners 764 767 752 814 877
Wealth Management 237 204 244 267 286
Group items -219 -322 548 509 -128
Total income from business areas 3,019 2,667 3,627 3,865 3,340
Lending and deposits – business areasDKK million Q3/2018 Q4/2018 Q1/2019 Q2/2019 Q3/2019
Mortgage lending (nominal)
Personal Banking 173,525 172,678 171,788 172,453 173,590
-of which Nykredit Realkredit 77,081 74,190 71,155 68,706 65,541
-of which Totalkredit 96,444 98,488 100,634 103,747 108,049
Business Banking 230,808 230,194 229,405 228,097 229,079
-of which Nykredit Realkredit 230,808 230,194 229,405 228,097 229,079
-of which Totalkredit - - - - -
C&I 190,064 193,360 196,971 197,674 203,283
Totalkredit Partners 557,593 566,552 575,791 589,908 606,475
Wealth Management 8,454 8,663 8,920 8,532 8,983
-of which Totalkredit 6,744 7,103 - - -
Total mortgage lending 1,160,443 1,171,449 1,182,875 1,196,664 1,221,411
Bank lending
Personal Banking 11,567 11,507 11,747 11,953 11,893
Business Banking 20,856 21,236 22,306 22,565 23,252
C&I 22,298 23,342 22,515 25,040 24,049
Wealth Management 3,549 3,955 4,013 4,239 3,949
Group items 479 526 142 -290 147
Total bank lending 58,749 60,566 60,723 63,508 63,289
Deposits
Personal Banking 29,055 30,332 30,788 33,185 33,573
Business Banking 17,927 19,055 18,121 19,406 20,933
C&I 8,908 11,708 10,162 8,585 10,285
Wealth Management 12,124 12,090 13,457 16,598 15,575
Group items 4,729 3,787 7,202 2,314 3,235
Total deposits 72,742 76,974 79,730 80,088 83,601
Note: Sparinvest has been included in Nykredit’s financial reporting from 1 September 2019.
������������� ���������������������� ����

���������������%�1��������������#
Result – Personal BankingDKK million Q3/2018 Q4/2018 Q1/2019 Q2/2019 Q3/2019
Net interest income 488 473 467 462 460
Net fee income 146 112 115 174 228
Wealth Management income 96 88 83 84 88
Net interest from capitalisation -16 -19 -16 -17 -17
Trading, investment portfolio and other income -1 -18 1 3 15
Income 713 635 651 705 774
Costs 490 567 478 511 490
Business profit before impairment charges 223 68 172 193 284
Impairment charges on mortgage lending -6 -3 15 25 153
Impairment charges on bank lending -32 -28 27 -21 11Business profit 261 99 130 189 120
Activity – Personal BankingDKK million Q3/2018 Q4/2018 Q1/2019 Q2/2019 Q3/2019
Mortgage lending
Gross new lending, year-to-date 16,452 21,781 5,455 14,591 28,531
Portfolio at nominal value, end of period 173,525 172,678 171,788 172,453 173,590
Impairment charges for the period as % of lending -0.00% -0.00% 0.01% 0.01% 0.09%
Total impairment provisions, stage 1-3, end of period 1,178 1,124 1,117 959 1,287
Total impairment provisions as % of lending 0.67% 0.65% 0.65% 0.55% 0.74%
Banking
Lending, end of period 11,567 11,507 11,747 11,953 11,893
Deposits, end of period 29,055 30,332 30,788 33,185 33,573
Impairment charges for the period as % of lending* -0.28% -0.21% 0.04% -0.05% 0.02%
Total impairment provisions, stage 1-3, end of period 793 749 762 766 764
Total impairment provisions as % of lending 6.26% 6.37% 6.09% 6.02% 6.05%
Guarantees, end of period 2,313 2,093 2,298 20,768 26,867Provisions for guarantees, end of period 56 54 76 62 69
*Excluding impairment charges from guarantees.
Note: From Q1 2018 impairment provisions is determined according to the new IFRS 9 principles.
������������� ���������������������� ����
���������������%����������������#
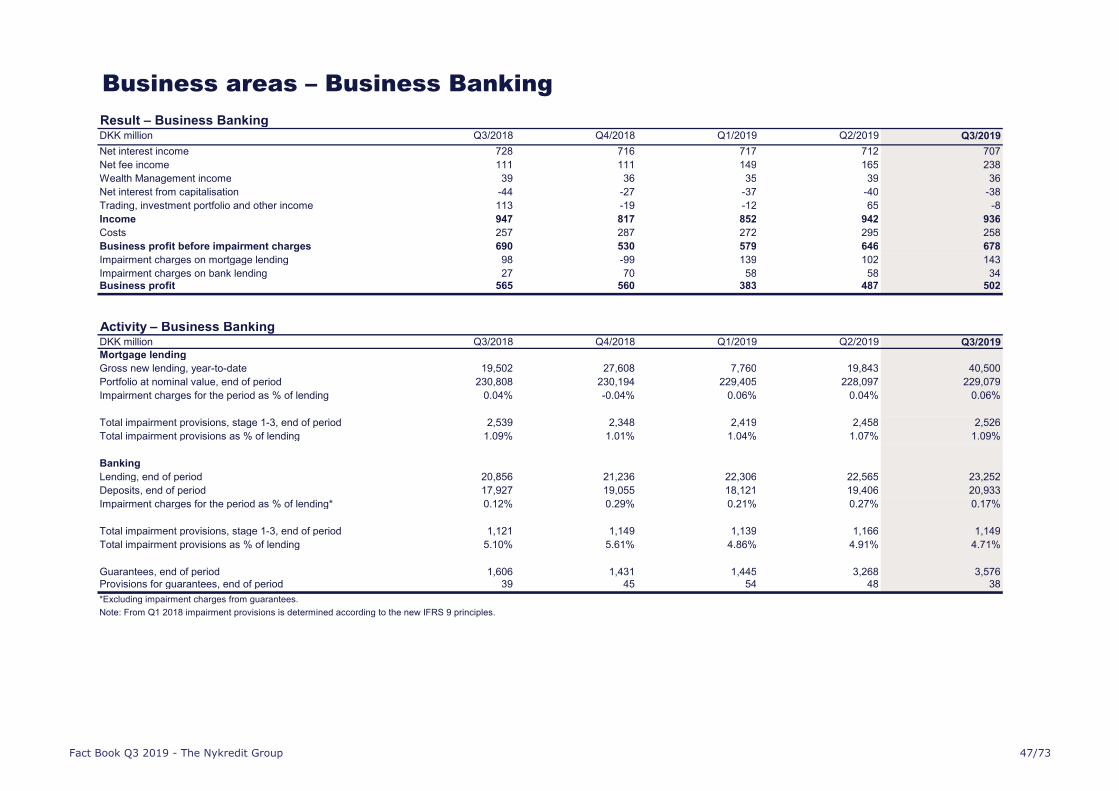
Result – Business BankingDKK million Q3/2018 Q4/2018 Q1/2019 Q2/2019 Q3/2019
Net interest income 728 716 717 712 707
Net fee income 111 111 149 165 238
Wealth Management income 39 36 35 39 36
Net interest from capitalisation -44 -27 -37 -40 -38
Trading, investment portfolio and other income 113 -19 -12 65 -8
Income 947 817 852 942 936
Costs 257 287 272 295 258
Business profit before impairment charges 690 530 579 646 678
Impairment charges on mortgage lending 98 -99 139 102 143
Impairment charges on bank lending 27 70 58 58 34Business profit 565 560 383 487 502
Activity – Business BankingDKK million Q3/2018 Q4/2018 Q1/2019 Q2/2019 Q3/2019
Mortgage lending
Gross new lending, year-to-date 19,502 27,608 7,760 19,843 40,500
Portfolio at nominal value, end of period 230,808 230,194 229,405 228,097 229,079
Impairment charges for the period as % of lending 0.04% -0.04% 0.06% 0.04% 0.06%
Total impairment provisions, stage 1-3, end of period 2,539 2,348 2,419 2,458 2,526
Total impairment provisions as % of lending 1.09% 1.01% 1.04% 1.07% 1.09%
Banking
Lending, end of period 20,856 21,236 22,306 22,565 23,252
Deposits, end of period 17,927 19,055 18,121 19,406 20,933
Impairment charges for the period as % of lending* 0.12% 0.29% 0.21% 0.27% 0.17%
Total impairment provisions, stage 1-3, end of period 1,121 1,149 1,139 1,166 1,149
Total impairment provisions as % of lending 5.10% 5.61% 4.86% 4.91% 4.71%
Guarantees, end of period 1,606 1,431 1,445 3,268 3,576Provisions for guarantees, end of period 39 45 54 48 38
*Excluding impairment charges from guarantees.
Note: From Q1 2018 impairment provisions is determined according to the new IFRS 9 principles.
������������� ���������������������� ����

���������������%�!����������8�0�����������
Result – Corporates & InstitutionsDKK million Q3/2018 Q4/2018 Q1/2019 Q2/2019 Q3/2019
Net interest income 408 392 391 406 413
Net fee income 115 128 121 152 188
Wealth Management income 19 40 27 24 28
Net interest from capitalisation -25 -38 -27 -31 -31
Trading, investment portfolio and other income 60 44 69 77 -3
Income 577 566 581 629 596
Costs 143 168 144 164 135
Business profit before impairment charges 434 398 438 465 460
Impairment charges on mortgage lending 15 -35 -19 17 33
Impairment charges on bank lending -2 126 -49 21 35
Business profit 421 306 506 428 392
Activity – Corporates & InstitutionsDKK million Q3/2018 Q4/2018 Q1/2019 Q2/2019 Q3/2019
Mortgage lending
Gross new lending, year-to-date 23,411 36,223 8,882 23,949 38,536
Portfolio at nominal value, end of period 190,064 193,360 196,971 197,674 203,283
Impairment charges for the period as % of lending - - - 0.01% 0.02%
Total impairment provisions, stage 1-3, end of period 223 186 166 188 220
Total impairment provisions as % of lending 0.12% 0.10% 0.08% 0.10% 0.11%
Banking
Lending, end of period 22,298 23,342 22,515 25,040 24,049
Deposits, end of period 8,908 11,708 10,162 8,585 10,285
Impairment charges for the period as % of lending 0.00% 0.00% 0.00% 0.08% 0.12%
Total impairment provisions, stage 1-3, end of period 704 794 717 738 773
Total impairment provisions as % of lending 3.06% 3.29% 3.08% 2.86% 3.11%
Guarantees, end of period 706 860 864 1,389 2,672Provisions for guarantees, end of period 10 9 13 14 19
*Excluding impairment charges from guarantees.
Note: From Q1 2018 impairment provisions is determined according to the new IFRS 9 principles.
������������� ���������������������� � ��
���������������%�������������1�������
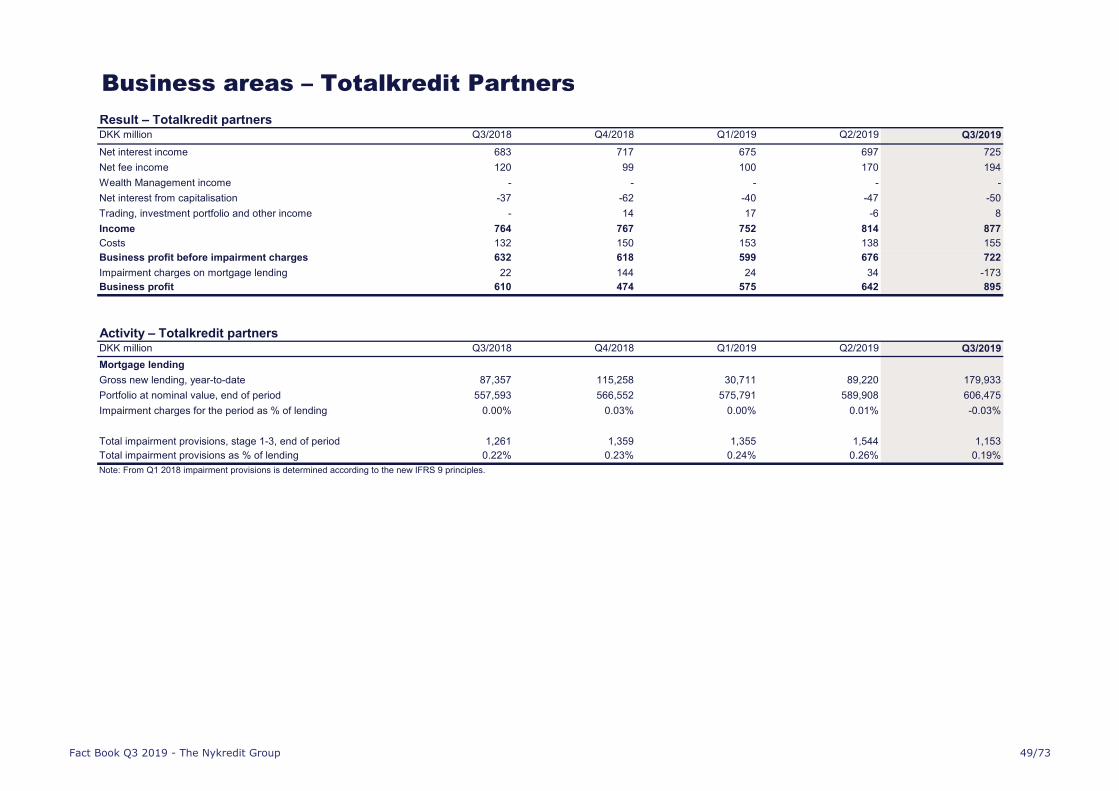
Result – Totalkredit partnersDKK million Q3/2018 Q4/2018 Q1/2019 Q2/2019 Q3/2019
Net interest income 683 717 675 697 725
Net fee income 120 99 100 170 194
Wealth Management income - - - - -
Net interest from capitalisation -37 -62 -40 -47 -50
Trading, investment portfolio and other income - 14 17 -6 8
Income 764 767 752 814 877
Costs 132 150 153 138 155
Business profit before impairment charges 632 618 599 676 722
Impairment charges on mortgage lending 22 144 24 34 -173
Business profit 610 474 575 642 895
Activity – Totalkredit partnersDKK million Q3/2018 Q4/2018 Q1/2019 Q2/2019 Q3/2019
Mortgage lending
Gross new lending, year-to-date 87,357 115,258 30,711 89,220 179,933
Portfolio at nominal value, end of period 557,593 566,552 575,791 589,908 606,475
Impairment charges for the period as % of lending 0.00% 0.03% 0.00% 0.01% -0.03%
Total impairment provisions, stage 1-3, end of period 1,261 1,359 1,355 1,544 1,153
Total impairment provisions as % of lending 0.22% 0.23% 0.24% 0.26% 0.19%
Note: From Q1 2018 impairment provisions is determined according to the new IFRS 9 principles.
������������� ���������������������� ����

���������������%�5������$���#�"���
Result – Wealth Management
DKK million Q3/2018 Q4/2018 Q1/2019 Q2/2019 Q3/2019
Net interest income 31 32 33 33 29
Net fee income 7 5 5 10 13
Wealth Management income 199 166 203 220 242
Net interest from capitalisation -2 -3 -2 -2 -2
Trading, investment portfolio and other income 2 5 6 7 5
Income 237 204 244 267 286
Costs 112 131 118 116 181
Business profit before impairment charges 125 73 126 150 105
Impairment charges on mortgage lending -2 -2 0 0 5
Impairment charges on bank lending 5 -3 19 -24 -1
Business profit 122 78 107 174 101
Activity – Wealth Management
DKK million Q3/2018 Q4/2018 Q1/2019 Q2/2019 Q3/2019
Mortgage lending
Gross new lending, year-to-date 1,226 1,399 376 1,072 2,330
Portfolio at nominal value, end of period 8,454 8,663 8,920 8,532 8,983
Impairment charges for the period as % of lending -0.02% -0.03% 0.00% 0.00% 0.05%
Total impairment provisions, stage 1-3, end of period 13 8 6 8 11
Total impairment provisions as % of lending 0.16% 0.10% 0.07% 0.09% 0.12%
Banking
Lending, end of period 3,549 3,955 4,013 4,239 3,949
Deposits, end of period 12,124 12,090 13,457 16,598 15,575
Impairment charges for the period as % of lending* 0.07% -0.07% 0.40% -0.46% -0.11%
Total impairment provisions, stage 1-3, end of period 77 72 89 67 62
Total impairment provisions as % of lending 2.12% 1.79% 2.16% 1.58% 1.56%
Guarantees, end of period 1,163 1,262 1,354 2,778 3,245
Provisions for guarantees, end of period 8 8 11 7 7
Assets under management 210,000 210,623 230,297 232,852 326,984
of which the investment funds of the Nykredit Group 70,247 68,758 74,837 78,069 157,798
Assets under administration in Nykredit Portefølje Administration A/S 697,000 664,590 734,513 755,342 852,774
*Excluding impairment charges from guarantees.
Note: As from Q1 2018 impairment provisions are determined according to the new IFRS 9 principles.
Note: Sparinvest has been included in Nykredit’s financial reporting from 1 September 2019.
������������� ���������������������� ����

���������������%����������"�
Result – Group itemsDKK million Q3/2018 Q4/2018 Q1/2019 Q2/2019 Q3/2019
Net interest income 2 1 - - 2
Net fee income -5 -24 -6 -1 -9
Wealth Management income 3 6 3 2 3
Net interest from capitalisation 37 57 33 54 50
Net income relating to customer benefits programmes1
-68 -73 -80 -23 -19
Trading, investment portfolio and other income -188 291 598 478 -154
Income -218 -323 548 509 -129
Costs 70 -31 65 47 89
Business profit before impairment charges -288 -292 483 462 -219
Impairment charges on mortgage lending - 0 - - -
Impairment charges on bank lending -15 -2 6 2 -8
Business profit -272 -289 478 460 -210
Activity – Group itemsDKK million Q3/2018 Q4/2018 Q1/2019 Q2/2019 Q3/2019
Banking
Lending, end of period 479 526 142 -290 147
Deposits, end of period 4,729 3,787 7,202 2,314 3,235
Total impairment provisions, stage 1-3, end of period 2 2 2 5 2
Total impairment provisions as % of lending 0.46% 0.35% 1.52% -1.84% 1.62%
Guarantees, end of period 287 266 249 266 203
Note: As from Q1 2018 impairment provisions are determined according to the new IFRS 9 principles.1 Nykredit's customer benefits programmes were launched in Q3/2017, awarding mortgage customers a cash discount on their loan administration margin. The programmes are available to both personal and business
customers and are called “KundeKroner”, “ErhvervsKroner” and "MineMål", respectively. The programmes do not impact profit after tax, as the Nykredit Group and Forenet Kredit are jointly taxed.
������������� ���������������������� � ��

����/�����������"�
Nykredit's regional housing price forecasts% 2017 2018 2019F 2020F 2021F
Houses – Denmark 4.7 4.1 3.8 3.0 2.1
Copenhagen 8.8 5.1 4.6 4.1 3.0
North Sealand 6.2 3.7 4.6 2.9 2.5
East Sealand 5.5 5.4 4.1 4.0 2.6
West and South Sealand 8.0 4.7 4.7 3.3 2.3
Bornholm 6.9 9.1 2.0 2.9 1.7
Funen 2.2 5.9 4.3 2.8 1.8
South Jutland 2.3 3.4 3.1 2.8 1.6
East Jutland 2.8 4.6 4.0 3.3 2.0
West Jutland 3.2 3.1 4.0 2.5 1.6
North Jutland 3.0 1.1 1.2 2.2 1.7
Owner-occupied flats – Denmark 8.4 5.7 1.5 2.5 0.2
Copenhagen 10.5 5.3 -0.6 1.2 -2.5
Municipality of Aarhus 5.4 3.8 0.4 0.8 -1.3
Holiday homes - Denmark 4.1 4.8 4.2 2.2 2.0
Note: F indicates forecast.
Price growth is stated as annual averages. Selected regions.
������������� ���������������������� ����

����/�����������"�
Danish economy - key figures% 2014 2015 2016 2017 2018
Real GDP growth (2010 chained volume) 1.6% 2.3% 2.4% 2.3% 1.4%
Inflation 0.6% 0.5% 0.3% 1.1% 0.8%
Public deficit as % of nominal GDP 1.1% -1.3% -0.1% 1.4% 0.5%
Balance of payment as % of nominal GDP* 8.9% 8.2% 7.9% 8.0% 5.9%
Net unemployment 4.0% 3.8% 3.3% 3.3% 3.1%
Government net foreign assets (DKKm) 858,461 680,457 1,145,889 1,207,760 1,402,739
Note: Actual 2019 year data is not yet available
Source: www.statistikbanken.dk.
* The balance of payments as a percentage of nominal GDP has been revised for Q3/2016 and is consequently no longer comparable with Fact Books from and earlier than Q3/2016.
The above key figures present a general overview of the Danish economy. For household financial indicators, please refer to the economic statement and budget report, August 2019 (Økonomisk Redegørelse, August
2019), pp 89-122 (in Danish), of the Danish Ministry of Economics and Interior given by the link below:
https://www.fm.dk/publikationer/2019/oekonomisk-redegoerelse-aug-19
������������� ���������������������� ���

!�4����������0�4������ �������� ��
��������� ���������������
������������� ���������������������� ����

94��4��'
Nykredit Realkredit A/SCapital Centre C D E G H I Other Nykredit In General Total
Bond type RO RO SDO RO SDO RO RO RO
Risk weight (standard approach) 10% 10% / 20%* 10% 20%* 10% 20%* 10% 10%
Weight large exposures - 0% / 58%* - 68%* - 66,6%* - -
Mortgage loans at fair value (DKK million) 694 19,044 92,018 68,777 279,173 6,624 47,998 447 514,775
Number of loans 2,888 22,670 27,738 19,949 87,534 1,534 9,777 1,823 173,913
Number of properties 2,602 21,209 24,274 15,578 72,851 1,493 5,303 1,587 144,897
Rating S&P AAA AAA AAA AAA AAA AAA - AAA -
* RO bonds issued after 1 January 2008 carry a 20% risk weight and a higher weight for Danish financial institutions calculating large exposures.
Bonds issued prior to this date are treated as CRD-compliant covered bonds via grandfathering and therefore attracts a 10% risk weight and a 0% weight for calculation of large exposures.
Joint funding
Loans in Totalkredit's capital centres D, E, G, H and I are joint funded through Nykredit Realkredit's capital centres D, E, G, H and I respectively.
For more information about the joint funding model log on to our web page www.nykredit.com/investor
Totalkredit A/S
Capital Centre C D E G H I Other Nykredit In General Total
Bond type RO - - - - - - RO
Risk weight (standard approach) 10% - - - - - - 10%
Weight large exposures - - - - - - - -
Mortgage loans at fair value (DKK million) 6,052 4,085 385,542 937 344,024 816 - 3 741,458
Number of loans 12,311 6,229 304,860 2,734 282,976 5,652 - 23 614,785
Number of properties 12,215 6,169 296,445 2,724 253,141 5,644 - 23 576,361
Rating S&P AAA - - - - - - - -
������������� ���������������������� ����

94��4��'
Junior Covered Bonds
Capital Centre C D E G H I OtherNykredit In
GeneralTotal
Junior Covered Bonds at fair value (DKKm) - - - - -1,162 - - - -1,162
Rating S&P - AA- AA- - AA- - - - -
Investment of Junior Covered Bond proceeds
Capital Centre D E H
Danish government bonds - - -
Triple A rated Scandinavian covered bonds 100% 79% 100%
Double A rated Scandinavian covered bonds - - -
Triple A rated core European covered bonds - 21% -
Double A rated core European covered bonds - - -
Eligible senior exposures to credit institutions rated at least Single A - - -
Other assets - - -
Total 100% 100% 100%
������������� ���������������������� ����

!�����������������������
• LTV is calculated on each property on a loan-by-loan basis.
• LTV is calculated based on prior-ranking loans and mortgage loans at fair value relative to the estimated property value.
• Average and median LTV ratios are weighted against the fair value of the loan.
• Average LTV ratios are calculated on the basis of the top part of debts outstanding relative to estimated property values.
• Median LTV ratios are calculated on the basis of the mid-part of debts outstanding relative to estimated property values.
•
• Entire loan entered under the top LTV bracket: The full amount of the loan of the example above is included in the 20-40% LTV bracket.
•
•
LTV calculation
• Prior ranking loans = all loans secured on prior mortgages on the property – including loans raised in other credit institutions.
• Fair value = nominal bond debt outstanding * current market price.
Estimated property values
• Estimated property values are always based on local property valuations and inspections.
•
• Projection models are used for the ongoing estimation of property values in Industry and trade, Office and rental and Agriculture.
• Statistical valuations and projections are performed centrally and supplemented by ongoing local valuations and LTV monitoring.
• Property values are updated with the price development of Q1/2019.
Estimated property value
Statistical models are used for the ongoing estimation of property values in owner-occupied dwellings. These models are approved by the Danish FSA and based on indicies from
Boligmarkedsstatistikken. For further information, please see: http://www.realkreditraadet.dk/Statistics/Prices_and_trades_of_owner_occupied_homes.aspx
Public authority guarantees reduce the credit risk relating to subsidised housing that is included in the lending for the category "Public housing". For this reason, LTV figures for public
housing contain no relevant information on risk.
Loans at fair value distributed continuously by LTV range up to the top LTV bracket: In the table, loans with security covering for example between 0% and 30% of the mortgageable value
are distributed with two thirds of the debt outstanding in the LTV range of 0-20% and one third in the LTV range of 20-40%.
LTV =Prior ranking loans + Mortgage loan at fair value
Mortgages may include loan costs. Eg a fully mortgaged owner-occupied dwelling with financed costs of 2% of the principal will appear at 82% in the following table.
������������� ���������������������� ����

$���#�#��&�����#
Calculation date: 30-09-2019
Reporting date: 05-11-2019
The Nykredit Realkredit Group
DKK million
Owner-occupied
dwellings
Nykredit
Owner-occupied
dwellings
Totalkredit
Private rentalPublic
housing1)
Industry and
trades
Office and
retailAgriculture Other
Total DKKm/
number3)
Mortgage loans
- Mortgage loans at fair value 60,232 741,458 140,115 72,263 23,012 116,261 88,805 14,086 1,256,233
- Mortgage loans at fair value (%) 5% 59% 11% 6% 2% 9% 7% 1% 100%
- Number of loans 72,981 614,785 32,270 14,601 2,613 18,976 30,449 2,023 788,698
- Number of properties 65,156 543,811 21,039 5,416 1,763 12,316 13,923 1,200 664,624
- Average current LTV2)
58.9 67.9 62.1 - 46.2 52.8 62.8 49.9 62.3
Bond debt outstanding by loans involving
- Public guaranties 293 - 447 43,590 3 4 122 89 44,550
- Bank guaranties - 36,718 - - - - - - 36,718
- Set-off agreement with banks - 157,522 - - - - - - 157,522
- No guarantee 59,939 547,218 139,668 28,673 23,009 116,257 88,683 13,997 1,017,444
Total 60,232 741,458 140,115 72,263 23,012 116,261 88,805 14,086 1,256,233
Mortgage loans at fair value by loan type
Fixed-rate loans
- repayment loans 6,458 275,828 19,811 16,467 4,971 15,612 6,349 3,667 349,163
- interest-only option 480 112,251 13,722 10 9 2,766 8,502 134 137,874
Adjustable-rate mortgages (ARMs)
- repayment loans 16,529 83,068 13,337 31,810 2,545 14,492 10,126 1,160 173,066
- interest-only option 13,531 144,370 27,079 19 3,380 10,800 12,793 129 212,100
Money market-linked loans
Capped
- repayment loans 10,702 23,808 771 74 59 566 1,407 277 37,663
- interest-only option 2,257 15,047 235 - 3 66 670 5 18,283
Uncapped
- repayment loans 2,379 28,643 12,472 316 5,567 24,027 18,927 4,726 97,056
- interest-only option 7,898 58,444 50,904 94 6,479 47,928 30,019 3,898 205,664
Index-linked loans 0 - 1,784 23,473 - 4 12 91 25,365
Total 60,232 741,458 140,115 72,263 23,012 116,261 88,805 14,086 1,256,233
2) Average current LTV is calculated on the basis of the top LTV bracket for lending granted by the Nykredit Realkredit Group.
1) All mortgages granted in the public housing segment are subject to speciel Danish legislation as well as public authority guarantees. Therefore, LTV figures do not give relevant risk information. Public authority guarantees
currently amount to DKK 36.4bn in total.
3) The sum of mortage lending includes intercompany lending and may therefore differ from the Nykredit Realkredit Group balance of mortgage loans at fair value.
������������� ���������������������� � ��

$���#�#��&�����#Calculation date: 30-09-2019
Reporting date: 05-11-2019
The Nykredit Realkredit Group
DKK million
Owner-occupied
dwellings
Nykredit
Owner-occupied
dwellings
Totalkredit
Private rentalPublic
housing1)
Industry and
trades
Office and
retailAgriculture Other
Total DKKm/
number2)
Mortgage loans at fair value by geographic area
- City of Copenhagen (incl Frb.) 1,748 58,899 36,808 10,554 62 19,919 - 2,223 130,214
- Suburban municipalities 12,862 164,860 17,703 18,269 2,793 18,231 3,232 3,290 241,242
- Remaining Sealand, etc 7,499 61,855 6,259 5,673 2,118 6,902 11,473 919 102,698
- Funen 3,974 63,535 8,469 5,179 982 3,624 7,625 605 93,993
- Northern Jutland 6,618 123,501 16,773 11,086 3,155 10,697 27,697 1,576 201,103
- Western Jutland 4,687 73,372 6,618 5,635 3,384 8,072 14,009 1,674 117,451
- Eastern Jutland 8,447 170,103 25,149 11,734 4,126 19,921 18,075 3,182 260,737
- Southern Jutland 1,634 25,247 2,025 4,132 836 2,538 6,660 617 43,689
- Faroe Islands and Greenland 2,115 86 237 - - 119 - 0 2,558
- International 10,649 - 20,073 - 5,555 26,238 34 - 62,549
Total 60,232 741,458 140,115 72,263 23,012 116,261 88,805 14,086 1,256,233
Mortgage loans at fair value by size, DKK million
0 - 2 42,132 477,107 17,186 5,022 1,286 9,739 15,483 768 568,722
2 - 5 12,102 238,636 20,653 7,208 1,850 12,271 28,438 1,513 322,671
5 - 20 5,049 24,364 42,343 25,587 3,132 23,087 39,453 4,073 167,087
20 - 50 748 1,129 21,582 19,702 1,787 15,197 4,914 2,625 67,685
50 - 100 100 222 11,298 9,723 1,075 13,341 518 1,005 37,283
100 and above 102 - 27,053 5,021 13,882 42,626 - 4,103 92,786
Total 60,232 741,458 140,115 72,263 23,012 116,261 88,805 14,086 1,256,233
Mortgage loans at fair value by remaining loan term, years
0 - 10 2,694 16,015 19,403 4,458 5,445 33,020 1,494 712 83,239
10 - 15 4,688 27,104 7,463 8,682 5,074 23,241 3,277 1,465 80,995
15 - 20 24,006 91,600 21,920 7,748 11,620 36,646 16,157 3,486 213,183
20 - 25 23,694 113,452 23,898 21,604 845 8,370 15,935 3,845 211,643
25 - 30 5,150 493,288 67,313 28,533 28 14,984 51,942 4,577 665,815
30 - 35 - - 119 1,238 - - - - 1,357
35 and above - - 1 0 - - - - 1
Total 60,232 741,458 140,115 72,263 23,012 116,261 88,805 14,086 1,256,2331)
All mortgages granted in the public housing segment are subject to speciel Danish legislation as well as public authority guarantees. Therefore, LTV figures do not give relevant risk information. Public authority
guarantees currently amount to DKK 36.4bn in total.
2) The sum of mortage lending includes intercompany lending and may therefore differ from the Nykredit Realkredit Group balance of mortgage loans at fair value.
������������� ���������������������� ����

$���#�#��&�����#�+�!�������!������/
Calculation date: 30-09-2019
Reporting date: 05-11-2019
The Nykredit Realkredit Group
DKK million
Owner-occupied
dwellings
Nykredit
Owner-occupied
dwellings
Totalkredit
Private rentalPublic
housing1)
Industry and
trades
Office and
retailAgriculture Other
Total DKKm/
number
Mortgage loans
- Mortgage loans at fair value 8,143 4,085 2,946 525 4,357 1,331 1,157 585 23,129
- Mortgage loans at fair value (%) 35% 18% 13% 2% 19% 6% 5% 3% 100%
- Number of loans 17,249 6,229 1,367 810 255 1,317 1,324 348 28,899
- Number of properties 16,344 6,169 1,259 611 225 1,238 1,245 314 27,405
- Average current LTV2)
45 65 57 - 47 41 30 37 48
Bond debt outstanding by loans involving
- Public guaranties 0 - 5 57 - - 8 14 84
- Bank guaranties - 154 - - - - - - 154
- Set-off agreement with banks - 960 - - - - - - 960
- No guarantee 8,143 2,971 2,942 469 4,357 1,331 1,149 570 21,930
Total 8,143 4,085 2,946 525 4,357 1,331 1,157 585 23,129
Mortgage loans at fair value by loan type
Fixed-rate loans
- repayment loans 1,950 1,109 278 450 48 263 204 108 4,410
- interest-only option - - - - - - - - -
Adjustable-rate mortgages (ARMs)
- repayment loans - - 386 1 184 299 138 127 1,135
- interest-only option - - 826 - 816 169 120 6 1,936
Money market-linked loans
Capped
- repayment loans 6,173 2,976 414 74 35 275 668 219 10,835
- interest-only option 6 - 2 - - - 8 - 17
Uncapped
- repayment loans 13 - 217 - 352 320 14 125 1,042
- interest-only option - - 823 - 2,922 4 5 - 3,754
Index-linked loans - - - - - - - - -
Total 8,143 4,085 2,946 525 4,357 1,331 1,157 585 23,1291)
All mortgages granted in the public housing segment are subject to speciel Danish legislation as well as public authority guarantees. Therefore, LTV figures do not give relevant risk information. Public authority guarantees
currently amount to DKK 0.2bn in Capital Centre D.2)
Average current LTV is calculated on the basis of the top LTV bracket for the loans in the capital centre.
������������� ���������������������� ����

$���#�#��&�����#�+�!�������!������/
Calculation date: 30-09-2019
Reporting date: 05-11-2019
The Nykredit Realkredit Group
DKK million
Owner-occupied
dwellings
Nykredit
Owner-occupied
dwellings
Totalkredit
Private rentalPublic
housing1)
Industry and
trades
Office and
retailAgriculture Other
Total DKKm/
number
Mortgage loans at fair value by geographic area
- City of Copenhagen (incl Frb.) 287 50 817 72 0 42 - 10 1,279
- Suburban municipalities 1,868 491 363 54 84 225 76 22 3,182
- Remaining Sealand, etc 1,669 849 326 29 800 203 171 71 4,117
- Funen 759 565 302 71 33 119 102 70 2,020
- Northern Jutland 1,050 654 318 99 201 194 268 87 2,870
- Western Jutland 738 495 194 46 82 154 238 107 2,056
- Eastern Jutland 1,294 666 508 120 117 312 231 139 3,388
- Southern Jutland 365 305 100 35 118 81 70 79 1,152
- Faroe Islands and Greenland 21 11 17 - - 1 - 0 50
- International 92 - - - 2,922 - - - 3,014
Total 8,143 4,085 2,946 525 4,357 1,331 1,157 585 23,129
Mortgage loans at fair value by size, DKK million
0 - 2 7,845 3,779 658 318 89 598 755 141 14,182
2 - 5 298 295 550 132 108 286 264 151 2,085
5 - 20 - 11 1,106 76 213 249 137 222 2,015
20 - 50 - - 386 - 288 84 - 71 829
50 - 100 - - 247 - - 113 - - 360
100 and above - - - - 3,658 - - - 3,658
Total 8,143 4,085 2,946 525 4,357 1,331 1,157 585 23,129
Mortgage loans at fair value by remaining loan term, years
0 - 10 860 216 172 311 1,113 675 133 167 3,647
10 - 15 868 45 352 134 59 226 140 108 1,932
15 - 20 6,415 3,824 1,678 81 2,369 347 715 310 15,738
20 - 25 - - 661 - 816 74 151 - 1,702
25 - 30 - - 83 - - 9 18 - 109
30 - 35 - - - - - - - - -
35 and above - - - - - - - - -
Total 8,143 4,085 2,946 525 4,357 1,331 1,157 585 23,1291)
All mortgages granted in the public housing segment are subject to speciel Danish legislation as well as public authority guarantees. Therefore, LTV figures do not give relevant risk information. Public authority guarantees
currently amount to DKK 0.2bn in Capital Centre D.
������������� ���������������������� � ��

$���#�#��&�����#�+�!�������!������-
Calculation date: 30-09-2019
Reporting date: 05-11-2019
The Nykredit Realkredit Group
DKK million
Owner-occupied
dwellings
Nykredit
Owner-occupied
dwellings
Totalkredit
Private rentalPublic
housing1)
Industry and
trades
Office and
retailAgriculture Other
Total DKKm/
number
Mortgage loans
- Mortgage loans at fair value 6,022 385,542 33,611 15,144 1,960 18,108 14,024 3,148 477,560
- Mortgage loans at fair value (%) 1% 81% 7% 3% 0% 4% 3% 1% 100%
- Number of loans 8,534 304,860 7,005 3,486 512 3,578 4,133 490 332,598
- Number of properties 8,436 296,445 6,277 1,832 489 3,355 3,580 432 320,846
- Average current LTV2)
60.2 69.3 49.1 - 45.8 46.6 45.9 43.6 64.5
Bond debt outstanding by loans involving
- Public guaranties 292 - 31 4,539 - 2 - 61 4,925
- Bank guaranties - 18,029 - - - - - - 18,029
- Set-off agreement with banks - 100,165 - - - - - - 100,165
- No guarantee 5,730 267,348 33,580 10,606 1,960 18,106 14,024 3,087 354,440
Total 6,022 385,542 33,611 15,144 1,960 18,108 14,024 3,148 477,560
Mortgage loans at fair value by loan type
Fixed-rate loans
- repayment loans 3,965 272,235 17,974 15,130 1,922 14,613 5,375 2,985 334,198
- interest-only option 480 109,449 13,722 10 9 2,766 8,502 134 135,071
Adjustable-rate mortgages (ARMs)
- repayment loans 20 139 61 5 1 65 2 0 294
- interest-only option 58 233 946 - - 268 17 - 1,521
Money market-linked loans
Capped
- repayment loans 471 1,127 21 - 2 13 32 2 1,668
- interest-only option 1,024 2,360 58 - 0 24 89 3 3,558
Uncapped
- repayment loans 4 - 132 - 26 237 6 16 421
- interest-only option - - 696 - - 122 1 8 827
Index-linked loans - - - - - - - - -
Total 6,022 385,542 33,611 15,144 1,960 18,108 14,024 3,148 477,5601)
All mortgages granted in the public housing segment are subject to speciel Danish legislation as well as public authority guarantees. Therefore, LTV figures do not give relevant risk information. Public authority guarantees
currently amount to DKK 12.5bn in Capital Centre E.2)
Average current LTV is calculated on the basis of the top LTV bracket for the loans in the capital centre.
������������� ���������������������� ����
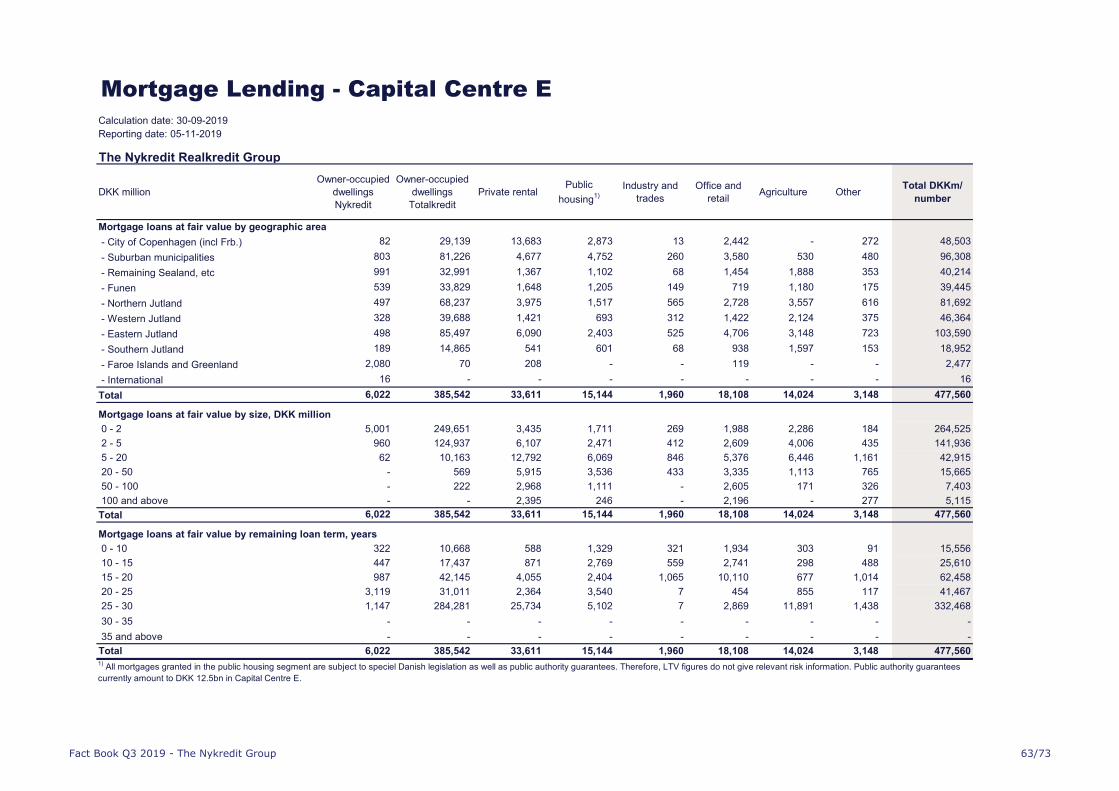
$���#�#��&�����#�+�!�������!������-
Calculation date: 30-09-2019
Reporting date: 05-11-2019
The Nykredit Realkredit Group
DKK million
Owner-occupied
dwellings
Nykredit
Owner-occupied
dwellings
Totalkredit
Private rentalPublic
housing1)
Industry and
trades
Office and
retailAgriculture Other
Total DKKm/
number
Mortgage loans at fair value by geographic area
- City of Copenhagen (incl Frb.) 82 29,139 13,683 2,873 13 2,442 - 272 48,503
- Suburban municipalities 803 81,226 4,677 4,752 260 3,580 530 480 96,308
- Remaining Sealand, etc 991 32,991 1,367 1,102 68 1,454 1,888 353 40,214
- Funen 539 33,829 1,648 1,205 149 719 1,180 175 39,445
- Northern Jutland 497 68,237 3,975 1,517 565 2,728 3,557 616 81,692
- Western Jutland 328 39,688 1,421 693 312 1,422 2,124 375 46,364
- Eastern Jutland 498 85,497 6,090 2,403 525 4,706 3,148 723 103,590
- Southern Jutland 189 14,865 541 601 68 938 1,597 153 18,952
- Faroe Islands and Greenland 2,080 70 208 - - 119 - - 2,477
- International 16 - - - - - - - 16
Total 6,022 385,542 33,611 15,144 1,960 18,108 14,024 3,148 477,560
Mortgage loans at fair value by size, DKK million
0 - 2 5,001 249,651 3,435 1,711 269 1,988 2,286 184 264,525
2 - 5 960 124,937 6,107 2,471 412 2,609 4,006 435 141,936
5 - 20 62 10,163 12,792 6,069 846 5,376 6,446 1,161 42,915
20 - 50 - 569 5,915 3,536 433 3,335 1,113 765 15,665
50 - 100 - 222 2,968 1,111 - 2,605 171 326 7,403
100 and above - - 2,395 246 - 2,196 - 277 5,115
Total 6,022 385,542 33,611 15,144 1,960 18,108 14,024 3,148 477,560
Mortgage loans at fair value by remaining loan term, years
0 - 10 322 10,668 588 1,329 321 1,934 303 91 15,556
10 - 15 447 17,437 871 2,769 559 2,741 298 488 25,610
15 - 20 987 42,145 4,055 2,404 1,065 10,110 677 1,014 62,458
20 - 25 3,119 31,011 2,364 3,540 7 454 855 117 41,467
25 - 30 1,147 284,281 25,734 5,102 7 2,869 11,891 1,438 332,468
30 - 35 - - - - - - - - -
35 and above - - - - - - - - -
Total 6,022 385,542 33,611 15,144 1,960 18,108 14,024 3,148 477,5601)
All mortgages granted in the public housing segment are subject to speciel Danish legislation as well as public authority guarantees. Therefore, LTV figures do not give relevant risk information. Public authority guarantees
currently amount to DKK 12.5bn in Capital Centre E.
������������� ���������������������� ���

$���#�#��&�����#�+�!�������!�������
Calculation date: 30-09-2019
Reporting date: 05-11-2019
The Nykredit Realkredit Group
DKK million
Owner-occupied
dwellings
Nykredit
Owner-occupied
dwellings
Totalkredit
Private rentalPublic
housing1)
Industry and
trades
Office and
retailAgriculture Other
Total DKKm/
number
Mortgage loans
- Mortgage loans at fair value 153 937 18,249 141 6,893 16,489 23,040 3,812 69,714
- Mortgage loans at fair value (%) 0% 1% 26% 0% 10% 24% 33% 5% 100%
- Number of loans 288 2,734 6,244 20 781 4,648 7,460 508 22,683
- Number of properties 285 2,724 5,541 20 679 4,150 4,633 351 18,383
- Average current LTV2)
71.5 65.7 69.9 - 44.7 54.4 67.6 49.6 61.7
Bond debt outstanding by loans involving
- Public guaranties - - 17 11 3 - 19 7 57
- Bank guaranties - 28 - - - - - - 28
- Set-off agreement with banks - 511 - - - - - - 511
- No guarantee 153 398 18,233 130 6,889 16,489 23,021 3,805 69,118
Total 153 937 18,249 141 6,893 16,489 23,040 3,812 69,714
Mortgage loans at fair value by loan type
Fixed-rate loans
- repayment loans - - 6 1 - 2 1 - 9
- interest-only option - - - - - - - - -
Adjustable-rate mortgages (ARMs)
- repayment loans 2 173 4,525 - 1,005 3,930 3,968 378 13,982
- interest-only option 1 - 412 - 1,066 230 353 14 2,076
Money market-linked loans
Capped
- repayment loans 67 559 26 - 2 12 26 - 692
- interest-only option - - - - - - - - -
Uncapped
- repayment loans 74 205 7,429 99 3,511 10,001 14,378 2,796 38,493
- interest-only option 8 - 5,850 42 1,308 2,314 4,314 624 14,461
Index-linked loans - - - - - - - - -
Total 153 937 18,249 141 6,893 16,489 23,040 3,812 69,7141)
All mortgages granted in the public housing segment are subject to speciel Danish legislation as well as public authority guarantees. Therefore, LTV figures do not give relevant risk information. Public authority guarantees
currently amount to DKK 0.0bn in Capital Centre G.2)
Average current LTV is calculated on the basis of the top LTV bracket for the loans in the capital centre.
������������� ���������������������� ����

$���#�#��&�����#�+�!�������!�������
Calculation date: 30-09-2019
Reporting date: 05-11-2019
The Nykredit Realkredit Group
DKK million
Owner-occupied
dwellings
Nykredit
Owner-occupied
dwellings
Totalkredit
Private rentalPublic
housing1)
Industry and
trades
Office and
retailAgriculture Other
Total DKKm/
number
Mortgage loans at fair value by geographic area
- City of Copenhagen (incl Frb.) 10 38 4,365 - 9 3,588 - 615 8,624
- Suburban municipalities 27 163 2,354 40 1,150 3,503 655 816 8,708
- Remaining Sealand, etc 30 68 1,217 1 759 1,302 2,227 286 5,890
- Funen 19 90 1,332 - 274 709 2,003 207 4,635
- Northern Jutland 18 142 3,353 87 1,429 1,968 7,805 252 15,054
- Western Jutland 22 125 1,045 10 830 1,370 4,419 444 8,264
- Eastern Jutland 24 278 4,322 4 974 3,592 4,071 963 14,228
- Southern Jutland 3 33 239 - 91 457 1,860 229 2,912
- Faroe Islands and Greenland - - 2 - - - - - 2
- International - - 20 - 1,377 - - - 1,397
Total 153 937 18,249 141 6,893 16,489 23,040 3,812 69,714
Mortgage loans at fair value by size, DKK million
0 - 2 115 621 3,155 1 390 2,457 3,809 196 10,743
2 - 5 33 159 3,520 22 495 2,866 7,918 447 15,458
5 - 20 6 109 6,696 119 806 4,625 10,036 1,217 23,615
20 - 50 - 49 3,379 - 302 2,477 1,153 778 8,138
50 - 100 - - 541 - 505 2,224 124 - 3,395
100 and above - - 957 - 4,395 1,840 - 1,174 8,366
Total 153 937 18,249 141 6,893 16,489 23,040 3,812 69,714
Mortgage loans at fair value by remaining loan term, years
0 - 10 10 118 355 40 2,325 2,240 313 192 5,593
10 - 15 4 27 750 20 2,260 3,347 818 363 7,588
15 - 20 83 255 7,152 39 2,305 6,122 8,114 1,242 25,312
20 - 25 56 448 3,711 1 3 1,482 3,801 528 10,029
25 - 30 0 89 6,282 42 - 3,298 9,993 1,488 21,192
30 - 35 - - - - - - - - -
35 and above - - - - - - - - -
Total 153 937 18,249 141 6,893 16,489 23,040 3,812 69,7141)
All mortgages granted in the public housing segment are subject to speciel Danish legislation as well as public authority guarantees. Therefore, LTV figures do not give relevant risk information. Public authority guarantees
currently amount to DKK 0.0bn in Capital Centre G.
������������� ���������������������� ����

$���#�#��&�����#�+�!�������!������:
Calculation date: 30-09-2019
Reporting date: 05-11-2019
The Nykredit Realkredit Group
DKK million
Owner-occupied
dwellings
Nykredit
Owner-occupied
dwellings
Totalkredit
Private rentalPublic
housing1)
Industry and
trades
Office and
retailAgriculture Other
Total DKKm/
number
Mortgage loans
- Mortgage loans at fair value 45,371 344,024 81,972 9,756 6,801 79,595 49,802 5,876 623,197
- Mortgage loans at fair value (%) 7% 55% 13% 2% 1% 13% 8% 1% 100%
- Number of loans 43,033 282,976 16,584 1,057 1,000 9,091 16,276 493 370,510
- Number of properties 39,068 253,141 14,206 742 898 7,772 10,119 383 326,329
- Average current LTV2)
61.0 64.7 55.0 - 31.2 46.6 49.9 34.9 58.6
Bond debt outstanding by loans involving
- Public guaranties - - 52 5,389 - - 92 1 5,534
- Bank guaranties - 18,351 - - - - - - 18,351
- Set-off agreement with banks - 53,796 - - - - - - 53,796
- No guarantee 45,371 271,876 81,920 4,367 6,801 79,595 49,711 5,875 545,516
Total 45,371 344,024 81,972 9,756 6,801 79,595 49,802 5,876 623,197
Mortgage loans at fair value by loan type
Fixed-rate loans
- repayment loans - 198 - - - - - - 198
- interest-only option - 2,802 - - - - - - 2,802
Adjustable-rate mortgages (ARMs)
- repayment loans 16,506 82,756 8,364 9,467 1,355 10,197 6,018 654 135,318
- interest-only option 13,472 144,137 24,895 19 1,498 10,133 12,303 110 206,567
Money market-linked loans
Capped
- repayment loans 3,990 14,561 310 - 19 266 681 56 19,883
- interest-only option 1,226 12,687 175 - 2 42 573 2 14,708
Uncapped
- repayment loans 2,287 28,438 4,694 217 1,678 13,468 4,528 1,789 57,099
- interest-only option 7,890 58,444 43,534 52 2,249 45,488 25,699 3,265 186,622
Index-linked loans - - - - - - - - -
Total 45,371 344,024 81,972 9,756 6,801 79,595 49,802 5,876 623,1971)
All mortgages granted in the public housing segment are subject to speciel Danish legislation as well as public authority guarantees. Therefore, LTV figures do not give relevant risk information. Public authority guarantees
currently amount to DKK 12.6bn in Capital Centre H.2)
Average current LTV is calculated on the basis of the top LTV bracket for the loans in the capital centre.
������������� ���������������������� ����

$���#�#��&�����#�+�!�������!������:
Calculation date: 30-09-2019
Reporting date: 05-11-2019
The Nykredit Realkredit Group
DKK million
Owner-occupied
dwellings
Nykredit
Owner-occupied
dwellings
Totalkredit
Private rentalPublic
housing1)
Industry and
trades
Office and
retailAgriculture Other
Total DKKm/
number
Mortgage loans at fair value by geographic area
- City of Copenhagen (incl Frb.) 1,351 29,543 17,647 778 40 13,751 - 1,300 64,410
- Suburban municipalities 10,075 82,082 10,132 2,357 1,293 10,819 1,944 1,899 120,600
- Remaining Sealand, etc 4,730 26,825 2,858 753 469 3,883 7,128 187 46,834
- Funen 2,584 28,311 4,552 750 520 2,032 4,274 140 43,163
- Northern Jutland 4,953 53,096 8,726 1,766 913 5,667 15,817 554 91,493
- Western Jutland 3,547 32,194 3,562 986 679 5,106 7,106 719 53,900
- Eastern Jutland 6,543 82,398 13,524 1,902 1,074 11,049 10,465 926 127,881
- Southern Jutland 1,031 9,569 908 464 555 1,050 3,035 151 16,763
- Faroe Islands and Greenland 14 5 10 - - - - - 29
- International 10,541 - 20,053 - 1,256 26,238 34 - 58,123
Total 45,371 344,024 81,972 9,756 6,801 79,595 49,802 5,876 623,197
Mortgage loans at fair value by size, DKK million
0 - 2 28,628 216,394 9,601 203 518 4,572 8,292 176 268,384
2 - 5 10,812 113,080 9,730 622 805 6,374 16,050 390 157,861
5 - 20 4,981 14,038 19,813 3,760 1,255 12,610 22,613 1,339 80,410
20 - 50 748 512 11,704 2,982 677 9,209 2,625 980 29,436
50 - 100 100 - 7,542 1,171 507 8,241 223 534 18,317
100 and above 102 - 23,582 1,019 3,039 38,590 - 2,457 68,789
Total 45,371 344,024 81,972 9,756 6,801 79,595 49,802 5,876 623,197
Mortgage loans at fair value by remaining loan term, years
0 - 10 1,124 3,917 18,227 900 1,659 28,083 629 172 54,711
10 - 15 3,225 8,143 5,462 3,634 2,186 16,866 2,006 481 42,004
15 - 20 16,519 41,278 8,909 1,511 2,916 19,707 6,521 871 98,233
20 - 25 20,500 81,778 16,207 1,839 20 6,346 11,045 3,054 140,788
25 - 30 4,003 208,908 33,167 1,871 21 8,593 29,601 1,297 287,461
30 - 35 - - - - - - - - -
35 and above - - - - - - - - -
Total 45,371 344,024 81,972 9,756 6,801 79,595 49,802 5,876 623,1971)
All mortgages granted in the public housing segment are subject to speciel Danish legislation as well as public authority guarantees. Therefore, LTV figures do not give relevant risk information. Public authority guarantees
currently amount to DKK 12.6bn in Capital Centre H.
������������� ���������������������� ����

!�������&�2The Nykredit Realkredit Group
Calculation date: 30-09-2019
Reporting date: 05-11-2019
Mortgage loans at fair value relative to estimated property values
Loans at fair value distributed continuously by LTV range up to the top LTV bracket
Current LTV (loan-to-value)
DKK million 0-20% 20-40% 40-60% 60-70% 70-80% 80-85% 85-90% 90-95% 95-100% Above 100% Total
Owner-occupied dwellings 262,662 236,083 186,827 64,589 39,493 6,322 1,989 1,197 778 1,751 801,691
Nykredit 24,834 18,107 11,119 3,003 1,696 438 287 198 140 410 60,232
Totalkredit 237,828 217,976 175,708 61,586 37,796 5,884 1,703 999 638 1,340 741,458
Private rental 51,365 42,726 30,898 8,738 4,315 705 401 286 194 488 140,115
Public housing1)
- - - - - - - - - - 72,263
Industry and trades 11,276 7,904 3,529 225 35 10 7 5 4 16 23,012
Office and retail 48,272 40,772 24,194 1,773 602 169 130 91 70 188 116,261
Agriculture 31,856 27,691 20,119 5,210 1,961 520 320 226 161 743 88,805
Other 6,785 4,472 2,059 583 85 21 18 11 10 44 14,086
Total 412,215 359,648 267,625 81,118 46,490 7,747 2,865 1,817 1,217 3,230 1,256,233
Mortgage loans at fair value relative to estimated property values
Loans at fair value distributed continuously by LTV range up to the top LTV bracket
Current LTV (loan-to-value)
% 0-20% 20-40% 40-60% 60-70% 70-80% 80-85% 85-90% 90-95% 95-100% Above 100% Median LTV
Owner-occupied dwellings 32.8 29.4 23.3 8.1 4.9 0.8 0.2 0.1 0.1 0.2 31.3
Nykredit 41.2 30.1 18.5 5.0 2.8 0.7 0.5 0.3 0.2 0.7 25.3
Totalkredit 32.1 29.4 23.7 8.3 5.1 0.8 0.2 0.1 0.1 0.2 32.1
Private rental 36.7 30.5 22.1 6.2 3.1 0.5 0.3 0.2 0.1 0.3 28.4
Public housing1)
- - - - - - - - - - -
Industry and trades 49.0 34.3 15.3 1.0 0.2 0.0 0.0 0.0 0.0 0.1 20.7
Office and retail 41.5 35.1 20.8 1.5 0.5 0.1 0.1 0.1 0.1 0.2 24.7
Agriculture 35.9 31.2 22.7 5.9 2.2 0.6 0.4 0.3 0.2 0.8 28.8
Other 48.2 31.7 14.6 4.1 0.6 0.1 0.1 0.1 0.1 0.3 21.0
Total 34.8 30.4 22.6 6.9 3.9 0.7 0.2 0.2 0.1 0.3 28.7
1) All mortgages granted in the public housing segment are subject to speciel Danish legislation as well as public authority guarantees. Therefore, LTV figures do not give relevant risk information. Public authority guarantees
currently amount to DKK 33.4bn in total.
������������� ���������������������� � ��

!�������&�2The Nykredit Realkredit Group
Calculation date: 30-09-2019
Reporting date: 05-11-2019
Mortgage loans at fair value relative to estimated property values
Entire loan entered under the top LTV bracket
Current LTV (loan-to-value)
DKK million 0-20% 20-40% 40-60% 60-70% 70-80% 80-85% 85-90% 90-95% 95-100% Above 100% Total
Owner-occupied dwellings 15,495 74,385 185,814 138,328 210,270 128,692 20,722 8,867 5,907 13,209 801,691
Nykredit 4,114 11,131 17,496 9,346 8,065 3,519 1,857 1,246 834 2,625 60,232
Totalkredit 11,381 63,254 168,318 128,982 202,205 125,174 18,866 7,621 5,073 10,584 741,458
Private rental 9,926 30,515 49,638 25,595 14,102 3,969 1,785 1,051 903 2,631 140,115
Public housing1)
- - - - - - - - - - 72,263
Industry and trades 4,172 8,440 7,692 2,427 102 51 32 21 1 73 23,012
Office and retail 9,429 32,852 61,016 8,168 2,181 442 716 260 231 967 116,261
Agriculture 12,363 24,458 32,228 9,804 5,007 1,506 912 543 524 1,460 88,805
Other 3,412 4,936 3,891 1,281 245 60 16 67 42 136 14,086
Total 54,798 175,586 340,279 185,603 231,908 134,720 24,183 10,809 7,608 18,477 1,256,233
Mortgage loans at fair value relative to estimated property values
Entire loan entered under the top LTV bracket
Current LTV (loan-to-value)
% 0-20% 20-40% 40-60% 60-70% 70-80% 80-85% 85-90% 90-95% 95-100% Above 100% Average LTV2)
Owner-occupied dwellings 1.9 9.3 23.2 17.3 26.2 16.1 2.6 1.1 0.7 1.6 67.2
Nykredit 6.8 18.5 29.0 15.5 13.4 5.8 3.1 2.1 1.4 4.4 58.9
Totalkredit 1.5 8.5 22.7 17.4 27.3 16.9 2.5 1.0 0.7 1.4 67.9
Private rental 7.1 21.8 35.4 18.3 10.1 2.8 1.3 0.7 0.6 1.9 62.1
Public housing1)
- - - - - - - - - - -
Industry and trades 18.1 36.7 33.4 10.5 0.4 0.2 0.1 0.1 0.0 0.3 46.2
Office and retail 8.1 28.3 52.5 7.0 1.9 0.4 0.6 0.2 0.2 0.8 52.8
Agriculture 13.9 27.5 36.3 11.0 5.6 1.7 1.0 0.6 0.6 1.6 62.8
Other 24.2 35.0 27.6 9.1 1.7 0.4 0.1 0.5 0.3 1.0 49.9
Total 4.6 14.8 28.7 15.7 19.6 11.4 2.0 0.9 0.6 1.6 62.3
1) All mortgages granted in the public housing segment are subject to speciel Danish legislation as well as public authority guarantees. Therefore, LTV figures do not give relevant risk information. Public authority guarantees
currently amount to DKK 33.4bn in total.
2) Average LTV is calculated on the basis of the top LTV bracket for the loans granted by the Nykredit Realkredit Group.
������������� ���������������������� ����

!�������&�2
The Nykredit Realkredit Group
Calculation date: 30-09-2019
Reporting date: 05-11-2019
Number of loans in each LTV bracket
Loan entered under the top LTV bracket
Current LTV (loan-to-value)
Number of loans 0-20% 20-40% 40-60% 60-70% 70-80% 80-85% 85-90% 90-95% 95-100% Above 100% Total
Owner-occupied dwellings 45,292 95,289 169,793 108,607 148,736 80,592 15,354 7,304 4,931 11,868 687,766
Nykredit 16,102 17,843 17,706 7,539 5,778 2,206 1,426 1,067 800 2,514 72,981
Totalkredit 29,190 77,446 152,087 101,068 142,958 78,386 13,928 6,237 4,131 9,354 614,785
Private rental 3,095 5,167 9,312 5,730 5,297 1,664 572 315 234 884 32,270
Public housing1)
9,431 2,259 1,108 436 1,367 - - - - - 14,601
Industry and trades 576 963 868 112 46 12 11 8 2 15 2,613
Office and retail 2,775 6,255 7,438 1,320 555 128 120 74 62 249 18,976
Agriculture 7,437 7,890 9,272 3,321 1,397 340 212 135 109 336 30,449
Other 609 673 527 96 45 12 7 12 6 36 2,023
Total 69,215 118,496 198,318 119,622 157,443 82,748 16,276 7,848 5,344 13,388 788,698
1) All mortgages granted in the public housing segment are subject to speciel Danish legislation as well as public authority guarantees. Therefore, LTV figures do not give relevant risk information. Public authority guarantees
currently amount to DKK 33.4bn in total.
������������� ���������������������� ����

&�2��'���+����������'�����#�������������� ���������������
Calculation date: 30-09-2019
Reporting date: 05-11-2019
Mortgage loans at fair value relative to estimated property values by geographic area in Nykredit and Totalkredit Capital Centres D (Intercompany funding)
Entire loan entered under the top LTV bracket
Current LTV (loan-to-value)
DKK million 0-20% 20-40% 40-60% 60-70% 70-80% 80-85% 85-90% 90-95% 95-100% Above 100% Total Avg LTV1)
City of Copenhagen (incl Frb.) 124 133 72 2 5 - - - - 1 337 28.9
Suburban municipalities 403 694 590 184 151 47 38 29 16 53 2,205 43.6
Remaining Sealand, etc 112 425 711 329 268 126 107 99 58 283 2,518 64.3
Funen 111 336 441 165 119 44 33 33 8 35 1,324 51.9
Northern Jutland 126 496 625 193 131 58 24 15 10 26 1,703 49.0
Western Jutland 85 340 438 166 102 35 24 18 6 21 1,234 50.3
Eastern Jutland 210 609 594 197 151 66 51 33 16 32 1,960 48.3
Southern Jutland 36 131 222 107 70 30 28 9 11 27 670 56.9
Faroe Islands and Greenland 3 14 4 6 5 - - - - - 32 43.2
International 4 9 21 20 11 8 13 1 - 3 92 64.3
Total 1,212 3,187 3,718 1,369 1,014 414 318 237 125 480 12,074 51.4
Mortgage loans at fair value relative to estimated property values by geographic area in Nykredit and Totalkredit Capital Centres E (Intercompany funding)
Entire loan entered under the top LTV bracket
Current LTV (loan-to-value)
DKK million 0-20% 20-40% 40-60% 60-70% 70-80% 80-85% 85-90% 90-95% 95-100% Above 100% Total Avg LTV1)
City of Copenhagen (incl Frb.) 551 3,074 7,180 5,349 6,445 6,232 341 19 6 25 29,221 64.3
Suburban municipalities 1,504 7,772 18,388 14,607 21,621 16,773 775 168 140 280 82,029 65.4
Remaining Sealand, etc 275 1,761 6,092 5,429 8,931 7,632 1,410 587 518 1,348 33,982 71.4
Funen 269 1,844 5,961 5,985 9,548 8,225 1,245 412 257 621 34,368 70.3
Northern Jutland 416 3,276 10,587 10,948 19,193 18,968 3,447 810 410 680 68,734 71.2
Western Jutland 240 1,870 6,464 6,422 12,070 10,378 1,279 483 311 500 40,016 70.9
Eastern Jutland 713 4,869 14,325 13,263 22,795 24,538 3,291 790 528 882 85,995 70.4
Southern Jutland 93 761 2,357 2,251 4,384 3,582 656 310 196 463 15,054 71.8
Faroe Islands and Greenland 13 154 991 381 468 136 - 1 2 5 2,150 58.4
International - 0 2 2 1 - - 3 2 5 16 91.9
Total 4,073 25,382 72,347 64,636 105,455 96,464 12,445 3,584 2,370 4,807 391,564 69.2
1) Average LTV is calculated on the basis of the top LTV bracket for the loans granted by the Nykredit Realkredit Group.
������������� ���������������������� � ��

&�2��'���+����������'�����#�������������� ���������������
Calculation date: 30-09-2019
Reporting date: 05-11-2019
Mortgage loans at fair value relative to estimated property values by geographic area in Nykredit and Totalkredit Capital Centres H (Intercompany funding)
Entire loan entered under the top LTV bracket
Current LTV (loan-to-value)
DKK million 0-20% 20-40% 40-60% 60-70% 70-80% 80-85% 85-90% 90-95% 95-100% Above 100% Total Avg LTV1)
City of Copenhagen (incl Frb.) - 1,146 5,395 10,250 6,199 6,592 1,254 28 4 5 21 57.7
Suburban municipalities - 3,633 14,713 31,288 18,088 19,415 2,802 777 483 314 646 58.6
Remaining Sealand, etc - 494 2,523 7,260 5,255 7,111 2,999 1,322 1,136 935 2,519 70.5
Funen - 539 2,716 7,672 5,780 8,816 2,605 858 606 377 925 66.8
Northern Jutland - 867 4,572 13,770 10,345 18,142 7,328 1,251 667 385 724 67.0
Western Jutland - 637 3,214 9,343 6,240 11,084 3,133 829 452 287 524 65.7
Eastern Jutland - 1,794 8,492 22,142 15,492 27,140 8,902 1,886 1,102 711 1,280 65.9
Southern Jutland - 186 1,001 2,523 1,719 2,728 1,091 402 318 211 420 67.9
Faroe Islands and Greenland - 1 2 13 2 - 2 - - - - 53.4
International - 74 661 2,401 2,250 2,110 1,505 482 194 129 735 71.0
Total - 9,370 43,289 106,662 71,369 103,137 31,621 7,835 4,963 3,354 7,794 64.3
Mortgage loans at fair value relative to estimated property values by geographic area in Nykredit Realkredit Group
Entire loan entered under the top LTV bracket
Current LTV (loan-to-value)
DKK million 0-20% 20-40% 40-60% 60-70% 70-80% 80-85% 85-90% 90-95% 95-100% Above 100% Total Avg LTV1)
City of Copenhagen (incl Frb.) - 1,858 8,658 17,566 11,572 13,055 7,486 370 24 10 47 61.9
Suburban municipalities - 5,707 23,652 50,692 33,002 41,267 19,644 1,601 692 477 988 62.6
Remaining Sealand, etc - 957 4,923 14,525 11,201 16,469 10,804 2,871 1,851 1,535 4,216 71.2
Funen - 1,019 5,172 14,402 12,027 18,552 10,887 2,146 1,060 649 1,593 68.8
Northern Jutland - 1,572 8,895 25,596 21,620 37,566 26,383 4,733 1,503 810 1,441 69.3
Western Jutland - 1,047 5,740 16,675 12,934 23,333 13,570 2,140 958 606 1,055 68.5
Eastern Jutland - 2,881 14,491 37,591 29,160 50,203 33,547 5,273 1,937 1,261 2,204 68.6
Southern Jutland - 358 2,013 5,335 4,149 7,229 4,718 1,093 642 424 919 70.3
Faroe Islands and Greenland - 16 170 1,007 390 473 138 - 1 2 5 58.2
International - 79 670 2,425 2,271 2,122 1,513 495 199 132 742 71.0
Total - 15,495 74,385 185,814 138,328 210,270 128,692 20,722 8,867 5,907 13,209 67.2
1) Average LTV is calculated on the basis of the top LTV bracket for the loans granted by the Nykredit Realkredit Group.
������������� ���������������������� ����
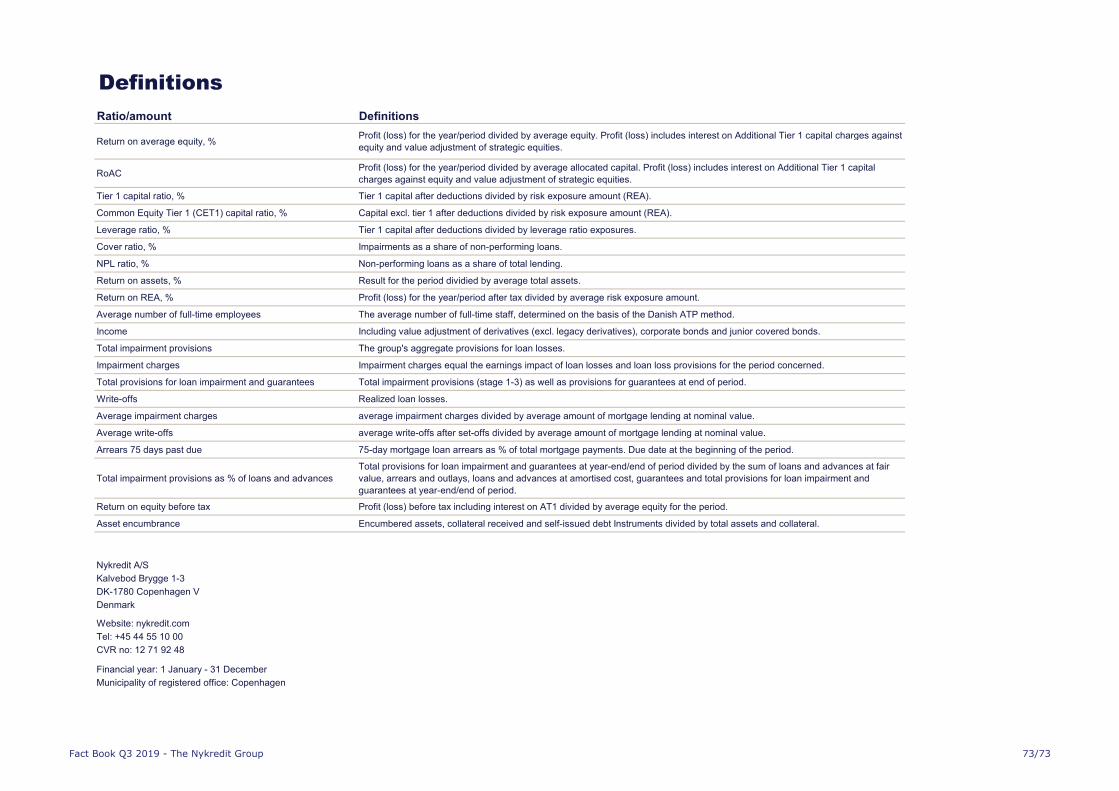
/����������
Ratio/amount Definitions
Return on average equity, %Profit (loss) for the year/period divided by average equity. Profit (loss) includes interest on Additional Tier 1 capital charges against
equity and value adjustment of strategic equities.
RoACProfit (loss) for the year/period divided by average allocated capital. Profit (loss) includes interest on Additional Tier 1 capital
charges against equity and value adjustment of strategic equities.
Tier 1 capital ratio, % Tier 1 capital after deductions divided by risk exposure amount (REA).
Common Equity Tier 1 (CET1) capital ratio, % Capital excl. tier 1 after deductions divided by risk exposure amount (REA).
Leverage ratio, % Tier 1 capital after deductions divided by leverage ratio exposures.
Cover ratio, % Impairments as a share of non-performing loans.
NPL ratio, % Non-performing loans as a share of total lending.
Return on assets, % Result for the period dividied by average total assets.
Return on REA, % Profit (loss) for the year/period after tax divided by average risk exposure amount.
Average number of full-time employees The average number of full-time staff, determined on the basis of the Danish ATP method.
Income Including value adjustment of derivatives (excl. legacy derivatives), corporate bonds and junior covered bonds.
Total impairment provisions The group's aggregate provisions for loan losses.
Impairment charges Impairment charges equal the earnings impact of loan losses and loan loss provisions for the period concerned.
Total provisions for loan impairment and guarantees Total impairment provisions (stage 1-3) as well as provisions for guarantees at end of period.
Write-offs Realized loan losses.
Average impairment charges average impairment charges divided by average amount of mortgage lending at nominal value.
Average write-offs average write-offs after set-offs divided by average amount of mortgage lending at nominal value.
Arrears 75 days past due 75-day mortgage loan arrears as % of total mortgage payments. Due date at the beginning of the period.
Total impairment provisions as % of loans and advances
Total provisions for loan impairment and guarantees at year-end/end of period divided by the sum of loans and advances at fair
value, arrears and outlays, loans and advances at amortised cost, guarantees and total provisions for loan impairment and
guarantees at year-end/end of period.
Return on equity before tax Profit (loss) before tax including interest on AT1 divided by average equity for the period.
Asset encumbrance Encumbered assets, collateral received and self-issued debt Instruments divided by total assets and collateral.
Nykredit A/S
Kalvebod Brygge 1-3
DK-1780 Copenhagen V
Denmark
Website: nykredit.com
Tel: +45 44 55 10 00
CVR no: 12 71 92 48
Financial year: 1 January - 31 December
Municipality of registered office: Copenhagen
������������� ���������������������� ���