Quarterly Financial Statements Q3 2018 - Pilipinas Shell ...
44
-
Upload
khangminh22 -
Category
Documents
-
view
0 -
download
0
Transcript of Quarterly Financial Statements Q3 2018 - Pilipinas Shell ...


Confidential
COVER SHEET
1 4 8 2 9
S.E.C. Registration Number
P I L I P I N A S S H E L L P E T R O L E U M
C O R P O R A T I O N
(Company’s Full Name)
1 5 6 V A L E R O S T S A L C E D O V I L L A G E
B A R A N G A Y
B E L - A I R M A K A T I C I T Y
(Business Address, No. Street City/Town/Province)
Jose Jerome R. Pascual III +632499-4001
Contact Person Company Telephone Number
0 9 3 0 1 7 - Q 0 5 0 3
Month Day FORM TYPE Month Day 3rd Tuesday of May Fiscal Year Annual General
Meeting as per By-Laws
CERTIFICATE OF PERMIT TO OFFER SECURITIES FOR SALE DATED 14 OCTOBER 2016
Secondary License Type, If Applicable
C G F D
Dept. Requiring this Doc.
Amended Articles Number/Section
Total Amount of Borrowings
313 16,615,000,000
Total No. of Stockholders (As of 30 September 2018)
Domestic Foreign
----------------------------------------------------------------------------------------------------------------------------- -------------------
To be accomplished by SEC Personnel concerned
______________________
File Number LCU
______________________
Document I. D. Cashier
STAMPS

2
SECURITIES AND EXCHANGE COMMISSION
SEC FORM 17-Q
QUARTERLY REPORT PURSUANT TO SECTION 17 OF THE SECURITIES REGULATION CODE AND SRC RULE 17(2)(b) THEREUNDER
1. For the quarterly period ended
2. Commission identification number
3. BIR Tax Identification Number
4. Exact name of issuer as specified in its chapter
5. Province, country, or other jurisdiction of incorporation or organization
6. Industry Classification Code: (SEC Use Only)
7. Address of issuer’s principal office Postal code
8. Issuer’s telephone number, including area code
9. Former name, former address, and formal fiscal year, if changed since last report
10. Securities registered pursuant to Sections 8 and 12 of the Code, or sections 4 and 8 of RSA
Title of Class Number of shares common
stock outstanding and amount of debt outstanding
11. Are any or all of the securities listed on a Stock Exchange? Yes [ X ] No [ ]
If yes, state the name of such stock exchange and the classes of securities listed therein: Philippines Stock Exchange - Common Shares
12. Indicate by check mark whether the registrant
(a) has filed all reports required to be filed with Section 17 of the Code and SRC Rule 17 thereunder or Sections 11 of the RSA and RSA Rule 11(a)-1 thereunder, and Sections 26 and 141 of the Corporation Code of the Philippines, during the preceding twelve (12) months (or for such shorter period the registrant was required to file such reports)
Yes [ X ] No [ ]
(b) has been subject to such filing requirements for the past ninety (90) days
Yes [ X ] No [ ]
September 30, 2018
14829
000-164-757
PILIPINAS SHELL PETROLEUM CORPORATION
Philippines
Shell House, 156 Valero Street, Salcedo Village, Barangay Bel-Air, Makati City 1227
(632) 4994001
N/A
Common Stock
Total Liabilities
1,613,444,202
46,009,970,166

3
TABLE OF CONTENTS
Page No. PART I – FINANCIAL INFORMATION Item 1. Financial Statements Pilipinas Shell Petroleum Corporation
Unaudited Statement of Financial Position As at 30 September 2018 and Audited Statement of Financial Position As at 31 December 2017
4
Pilipinas Shell Petroleum Corporation
Unaudited Statement of Income For the period ended 30 September 2018 and 2017
5
Pilipinas Shell Petroleum Corporation Unaudited Statement of Comprehensive Income For the period ended 30 September 2018 and 2017 6
Pilipinas Shell Petroleum Corporation Unaudited Statement of Changes in Stockholder’s Equity For the period ended 30 September 2018 and 2017 Pilipinas Shell Petroleum Corporation Unaudited Statement of Cash Flows For the period ended 30 September 2018 and 2017 Selected Notes to Financial Statements
7 8
9-36
Item 2. Management’s Discussion and Analysis of Financial Position and Statement of Income
37-41
PART II – OTHER INFORMATION This is not applicable. There are no disclosures not made under SEC Form 17-C.
SIGNATURES
42

4
PART I – FINANCIAL INFORMATION ITEM 1
PILIPINAS SHELL PETROLEUM CORPORATION Statements of Financial Position
As at 30 September 2018 With Comparative Figures for 31 December 2017
(All amounts in thousands Philippine Peso, except par value per share)
Note September 2018
Unaudited December 2017
Audited
ASSETS Current Assets
Cash 2 5,429,403 6,163,261 Trade and other receivables, net 3 15,148,071 10,865,099 Inventories, net 4 26,996,152 21,671,210 Prepayments and other current assets 5 2,349,275 7,176,689
Total Current Assets 49,922,901 45,876,259
Noncurrent Assets
Long-term receivables, rentals and investments, net 6 4,504,042 4,304,486
Property and equipment, net 26,409,167 25,434,373
Other assets, net 8 6,251,068 6,261,887
Total Noncurrent Assets 37,164,277 36,000,746
TOTAL ASSETS 87,087,178 81,877,005
LIABILITIES AND EQUITY Current Liabilities
Trade and other payables 9 25,273,223 21,163,783
Tax Payable 522,913 -
Dividends Payable 18,376 14,216
Short term loans 10 7,615,000 4,057,000
Current portion of long-term debt 11 - 6,000,000
Total Current Liabilities 33,429,512 31,234,999
Noncurrent Liabilities Long-term debt, net of current portion 11 9,000,000 5,000,000
Deferred tax liabilities, net 7 716,159 702,049
Provisions and other liabilities 2,864,298 2,804,569
Total Noncurrent Liabilities 12,580,457 8,506,618
Total liabilities 46,009,969 39,741,617
Equity
Share capital - P1 par value 12 1,681,058 1,681,058 Share premium 12 26,161,736 26,161,736
Treasury stock 12 (507,106) (507,106)
Retained earnings 13 13,199,885 14,339,453
Other reserves 541,636 460,247
Total Equity 41,077,209 42,135,388
TOTAL LIABILITIES AND EQUITY 87,087,178 81,877,005
Certified by: JOSE JEROME R. PASCUAL III
Vice President – Finance and Treasurer

5
PILIPINAS SHELL PETROLEUM CORPORATION Unaudited Statement of Income
For the period ended 30 September 2018 and 2017 (All amounts in thousands Philippine Peso, except earnings per share)
3Q 3Q YTD 3Q YTD 3Q
2018 2017 2018 2017
57,768,144 41,188,311 Net sales 161,876,048
123,428,408
(51,371,251) (34,424,560) Cost of sales
(141,087,484)
(104,814,455)
6,396,893 6,763,751 Gross profit 20,788,564 18,613,953
(3,827,908) (3,644,424)
Selling, general and (10,667,655) (8,885,537) administrative expenses
320,284 406,613 Other operating income, net 828,278 444,346
2,889,269 3,525,940 Income from operations 10,949,187 10,172,762
(269,389) (30,017) Finance expense, net (1,061,042) (641,215)
2,619,880 3,495,923 Income before income tax 9,888,145 9,531,547
(867,366) (1,053,148) Provision for income tax (2,691,993) (2,897,743)
1,752,514 2,442,775 Net income 7,196,152 6,633,804
1.09 1.51 Earnings per share - Basic and Diluted 4.46 4.11
*Basic earnings per share is calculated by dividing the profit attributable to shareholders of the Company by the weighted average number of common shares in issue during the year, excluding common shares purchased by the Company and held as treasury shares. Diluted earnings per share is calculated by adjusting the weighted average number of common shares outstanding to assume conversion of all dilutive potential common shares. Weighted average number of Common Shares, excluding Treasury Shares, for 3Q 2018 and for 3Q 2017 is 1,613,444,202 respectively.
Certified by: JOSE JEROME R. PASCUAL III
Vice President – Finance and Treasurer

6
PILIPINAS SHELL PETROLEUM CORPORATION Unaudited Statement of Comprehensive Income
For the period ended 30 September 2018 and 2017 (All amounts in thousands Philippine Peso)
3Q 3Q YTD 3Q YTD 3Q
2018 2017 2018 2017
1,752,514 2,442,775 Net Income 7,196,152 6,633,804
Other comprehensive income:
Items to be reclassified to income or loss in subsequent periods:
(100,351) 2,761 (Decrease)/Increase in fair value of equity
81,389 15,850
1,652,163 2,445,536 Total comprehensive income 7,277,541 6,649,654
Certified by: JOSE JEROME R. PASCUAL III
Vice President – Finance and Treasurer
7
PILIPINAS SHELL PETROLEUM CORPORATION Unaudited Statement of Changes in Stockholder’s Equity
For the period ended 30 September 2018 and 2017 (All amounts in thousands Philippine Peso)
Other Reserves
Share Share Treasury
Retained Share-based Fair value
Capital Premium Stock Earnings Reserve Reserve Total
Notes 15 15 15 16 10, 24 10
Balances at January 1, 2017
1,681,058 26,161,736 (507,106) 5,111,868 173,260 307,457 32,928,273
Income for the period - - - 6,633,804 - - 6,633,804 Other comprehensive
income:
Increase in fair value of AFS financial assets
- - - - - 15,850 15,850
Total comprehensive income for the period
- - - 6,633,804 - 15,850 6,649,654
Transactions with owners Cash dividends - - - (2,662,183) - - (2,662,183)
Total transactions with owners for the period
- - - (2,662,183) - - (2,662,183)
Balances at September 30, 2017
1,681,058 26,161,736 (507,106) 9,083,489 173,260 323,307 36,915,744
Balances as at January 1, 2018 (as previously published)
1,681,058 26,161,736 (507,106) 14,339,453 138,200 322,047 42,135,388
Impact of IFRS 9* - - - (42,617) - - (42,617)
Income for the period -
-
- 7,196,152 -
- 7,196,152 Other comprehensive
income:
Increase in fair value of
AFS financial assets -
-
-
- -
81,389
81,389
Total comprehensive income for the period -
-
- 7,196,152 -
81,389 7,277,541
Transactions with owners Cash dividends - - - (8,293,103) - - (8,293,103)
Total transactions with owners for the period -
-
-
(8,293,103) -
-
(8,293,103)
Balances at September 30, 2018 1,681,058
26,161,736
(507,106)
13,199,885
138,200
403,436 41,077,209
* Refer to “Basis of Preparation”
Certified by: JOSE JEROME R. PASCUAL III
Vice President – Finance and Treasurer

8
PILIPINAS SHELL PETROLEUM CORPORATION Unaudited Statement of Cash Flows
For the period ended 30 September 2018 and 2017 (All amounts in thousands Philippine Peso)
September 2018
September 2017
Cash flows from operating activities
Income before income tax 9,888,145 9,531,547
Adjustments:
Depreciation and amortization 1,473,237 1,425,405
Amortization of prepaid lease payments 1,232,696 1,126,043
Interest and finance charges 459,729 372,266
Unrealized mark-to-market (gain) loss, net 4,698 93,561
Unrealized foreign exchange loss, net 21,019 (246,692)
Pension expense 98,215 105,643
Accretion expense 60,225 43,240
(Gain) Loss on disposal of property and equipment (36,536) 14,659
Intangibles and fixed assets written off - -
Share based compensation - -
Reversals of provisions for ARO and remediation and demolition costs
- (86,848)
Interest Income (1,882) (4,460)
Share in profit of associates (26,685) (32,359)
Reversal for legal case, net - (1,379,168)
Operating income before working capital changes 13,172,861 10,962,837
Increase in assets other than cash (8,113,603) (3,909,678)
Increase in liabilities other than provisions, dividends payable, short-term borrowings and loans payable
3,760,939 1,006,621
Cash generated from operations 8,820,197 8,059,780
Pension contributions paid (17,529) (133,823)
Net cash from operating activities 8,802,668 7,925,957
Cash flows from investing activities
Additions to property and equipment (2,341,709) (3,039,054)
Increase in long term receivables and rentals, net (320,664) (248,895)
Proceeds from sale of property and equipment 132,730 6,947
Dividend received 34,912 19,040
Interest received 1,882 4,460
Net cash used in investing activities (2,492,849) (3,257,502)
Cash flows from financing activities
Repayment of long term loan (2,000,000) -
Dividends paid (8,293,103) (2,662,183)
Net proceeds (settlements of) from short-term borrowings 3,558,000 (811,000)
Interest and finance charges paid (468,254) (370,646)
Net cash used in financing activities (7,203,357) (3,843,829)
Net increase in cash (893,538) 824,626
Cash at the beginning of the period 6,163,261 4,274,266
Effect of exchange rate changes on cash 159,680 44,637
Cash at the end of the period 5,429,403 5,143,529
Certified by: JOSE JEROME R. PASCUAL III
Vice President – Finance and Treasurer

9
PILIPINAS SHELL PETROLEUM CORPORATION NOTES TO FINANCIAL STATEMENTS As at 30 September 2018 and 31 December 2017 and for the nine-month period ended 30 September 2018 and 2017 (All amounts in table are shown in thousand Philippine Peso except per share data and unless otherwise stated) Note 1 - General information Pilipinas Shell Petroleum Corporation (the “Company”) was incorporated in the Philippines and registered with the Securities and Exchange Commission (SEC) on 9 January 1959 primarily to engage in the refining and marketing of petroleum products. On 5 December 2008, the SEC approved the extension of the corporate term of the Company for another fifty (50) years from 9 January 2009 to 8 January 2059. Prior to its initial public offering (IPO), the Company was 68% owned by Shell Overseas Investments BV (“SOIBV”), a corporation registered under the laws of the Netherlands and 32% owned by Filipino and other foreign shareholders. The ultimate parent of the Company is Royal Dutch Shell plc. (“RDS”), incorporated in the United Kingdom. The Company conducted its IPO to list in Philippine Stock Exchange on 03 November 2016. The offer was composed of a Primary Offer of 27,500,000 Common Shares and Secondary Offer of 247,500,000 Common Shares with an over-allotment option of up to 16,000,000 Common Shares, with an Offer Price of P67.0 (USD1.39) per Share. After the IPO, Shell Overseas Investments BV owns 55% of the total outstanding shares of the Company. The Company used the net proceeds from the Primary Offer to fund capital expenditure, working capital and general corporate expenses. Net proceeds amounted to P1.36 billion (USD 0.03 billion). The IPO proceeds have been fully utilized as at 31 December 2017.
The Company’s registered office, which is also its principal place of business, is located at Shell House, 156 Valero Street, Salcedo Village, Makati City. The Company owns an oil refinery in Tabangao, Batangas and various oil depots and installations all over the Philippines. The Company has 698 regular employees as at 30 September 2018 (31 December 2017 - 699). Note 2 - Cash The account as at 30 September 2018 and 31 December 2017 consists of cash in banks which are earning interest at the prevailing bank deposit rates. The Company maintains cash deposits with universal and commercial banks in the Philippines. Universal and commercial banks represent the largest single group, resource-wise, of financial institutions in the country. Cash as at 30 September 2018 and 31 December 2017 is maintained with the following type of financial institutions:
30 September 2018
31 December 2017
Universal banks
3,139,034 2,934,109
Commercial banks
2,290,369 3,229,152
5,429,403 6,163,261

10
Note 3 – Trade and other receivables, net The account as at 30 September 2018 and 31 December 2017 consists of:
30 September
2018 31 December
2017
Trade receivables
Third parties 11,143,151 9,279,213
Related parties 1,946,014 593,441 Provision for impairment of trade receivables
from third parties (157,859)
(135,653)
12,931,306 9,737,001
Non-trade receivables from related parties 67,759 85,566
Other receivables
Claims from government agencies:
Creditable Withholding tax 455,991 324,954
Duty drawback and other claims 292,100 21,099
Miscellaneous 1,448,805 742,318 Provision for impairment of other receivables (47,890) (45,839)
2,149,006 1,042,532
15,148,071
10,865,099
Miscellaneous receivables pertain to rental from co-locators in retail service stations cost recoveries from affiliated companies and other non-trade receivables. The Company holds collaterals for trade receivables from third parties as at 30 September 2018 valued at P3.4 billion (31 December 2017 – P3.2 billion) consisting of cash securities, letters of credit or bank guarantees and Real Estate Mortgages (REM). These securities can be applied once the related customer defaults on settlement of the Company’s receivables based on agreed credit terms. The maximum exposure of the Company is P9.6 billion as at 30 September 2018 (31 December 2017 – P6.6 billion) (see Note 19.1.2). These balances relate to a number of customers with no recent history of default. (a) Past due receivables but not impaired The aging of past due trade receivables, net of provision from third parties as at 30 September 2018 and 31 December 2017 are as follows:
30 September
2018 31 December 2017
Less than 30 days 195,801 129,286
31 - 60 days 40,589 89,006
61 - 90 days 38,744 22,328
Greater than 90 days 179,723 110,960
454,857 351,580
These balances relate to a number of independent customers for majority of whom there is no recent history of default.

11
(b) Impaired receivables The maximum exposure to credit risk at the reporting date is the carrying amount of each class of receivables mentioned above. Impaired receivables are fully provided and movements in the provision for impairment of the receivables are presented in the table below.
Trade Others Total
At 1 January 2017 123,844 46,127 169,971
Provisions (Reversals) 18,989 (288) 18,701
Write Off (7,180) - (7,180)
At 31 December 2017 135,653 45,839 181,492
Provisions (Reversals) 23,233 2,051* 25,284
Write Off (1,027) - (1,027)
At 30 September 2018 157,859 47,890 205,749
For the nine-month period ended 30 September 2018, trade receivables written-off directly to statement of income amounted to P6.1 million (30 September 2017 –P2.5 million) based on the Company’s assessment of recoverability. *Provision (reversals) includes the IFRS 9 impact for the period. (c) Neither past due nor impaired The credit quality of trade receivables from third parties at 30 September 2018 and 31 December 2017 that are neither past due nor impaired has been assessed by reference to historical information about counterparty default rates:
Trade receivables (counterparties with internal credit rating)
30 September 2018
31 December 2017
A 1,400,035 1,691,753
B 2,215,160 3,006,618
C 5,368,925 2,880,566
D 1,546,315 1,213,043
Total trade receivables 10,530,435 8,791,980
A Customers with strong financial performance and with low probability of default. B Customers with good financial strength but with some elements of risk in one or more
financial or non-financial inputs. C Customers with low credit risk and balance is secured with post-dated checks and other
collaterals. D Customers with a medium risk of default, however, concerned group of customers have been
historically able to faithfully settle their balances. The receivables are deemed performing hence impairment provision is not necessary.
Trade and non-trade receivables from related parties are all current in age. The other classes and remaining balances within trade and other receivables do not contain impaired assets. There are no receivables that are neither past due nor impaired that have been renegotiated for the nine-month period ended 30 September 2018 and for the year ended 31 December 2017.

12
Note 4 - Inventories, net The account as at 30 September 2018 and 31 December 2017 consists of:
30 September 2018
31 December 2017
Crude oil and finished products, net 26,705,828 21,361,758
Materials and supplies, net 290,324 309,452
26,996,152 21,671,210
Details of and changes in allowance for inventory write-down and obsolescence as at and for the nine-month period ended 30 September 2018 and for the year ended 31 December 2017 are as follows
Crude oil and
finished products Materials and
supplies Total
At 1 January 2017 28,620 11,469 40,089 Reversals, net (2,168) (11,469) (13,637)
At 31 December 2017 26,452 - 26,452
Provision, net 2,831 - 2,831
At 30 September 2018 29,283 - 29,283
The provision for inventory resulting from the write-down of crude and finished products to net realizable value amounted to P0.03 million and P29.2 million relates to obsolescence of finished products as at 30 September 2018 (31 December 2017 – P13.9 million and P12.6 million). Of the total amount of inventories, the inventories with a value of P20.6 million as at 30 September 2018 (31 December 2017 – P125.5 million) are carried at net realizable value, this being lower than cost which approximates the inventories fair value less cost to sell. Cost of inventories included as part of cost of sales amounted to P121.6 billion for the nine-month period ended 30 September 2018 (30 September 2017 – P95.5 billion). Note 5 - Prepayments and other current assets The account as at 30 September 2018 and 31 December 2017 consists of:
30 September
2018 31 December
2017
Input value added tax (VAT), net of Output VAT (a) 878,927 2,943,233
Prepaid corporate income tax (b) - 1,467,026
Prepaid specific tax (c) 483,326 1,764,018
Advance rentals 645,429 606,113
Derivatives (d) 232,383 289,590
Prepaid duties and taxes 3,573 32,725
Prepaid insurance 7,841 680
Others 97,796 73,304
2,349,275 7,176,689
(a) Input VAT, net of output VAT
Input VAT represents the taxes paid on purchases of goods and services which can be recovered as tax credit against future output VAT liability of the Company.

13
(b) Prepaid corporate income tax
Creditable withholding taxes, which are claimed against income tax due, represent amounts that were withheld from income tax payments and carried over in the succeeding period for the same purpose.
(c) Prepaid specific tax
These are excise tax deposits made to the BIR and utilized upon removal of taxable products from the refinery.
(d) Derivatives
The Company enters into commodity forward contracts to hedge the commodity price risks arising from its crude oil and other oil products requirements. As at 30 September 2018, the notional principal amount of the outstanding commodity forward contracts amounted to P3.9 billion (31 December 2017 – P2.1 billion). As at 30 September 2018, the fair value of the derivative assets from outstanding commodity forward contracts amounted to P232.4 million (31 December 2017 – P289.6 million). For the nine-month period ended 30 September 2018, the Company’s fair value of settled derivatives amounted to gain of P376.0 million (30 September 2017 – gain of P174.9 million). For the nine-month period ended 30 September 2018, net fair value changes of the outstanding commodity forward contracts amounting to a loss of P4.7 million (30 September 2017 – loss of P93.6 million) were recognized in ‘Other operating income, net’.
Note 6 - Long-term receivables, rentals and investments, net The account as at 30 September 2018 and 31 December 2017 consists of:
30 September
2018 31 December
2017
Advance rentals 1,045,951 1,023,156
Customer Grants (b) 52,702 69,561
Investments in associates (c) 57,301 65,528
1,155,954 1,158,245
Long-term receivables (a) 3,845,405 3,644,008
Provision for impairment of long-term receivables (497,317) (497,767)
3,348,088 3,146,241
4,504,042 4,304,486
(a) Long-term receivables and advances to a related party
Long-term receivables include claims from government agencies amounting to P3.7 billion as at 30 September 2018 (31 December 2017 - P3.5 billion) representing the amount to be recovered from the government on various taxes paid. Included in this P3.7 billion is P1.1 billion of excise duties and VAT paid under protest for Alkylate shipment. The management has assessed that its recoverability is beyond 12 months from the reporting date and hence has been classified as non-current for the nine-month period ended 30 September 2018 and year ended 31 December 2017. As at 30 September 2018, long-term receivables of P497.3 million (31 December 2017 – P497.8 million) were impaired and fully provided.

14
Movements in provision for impairment of long-term receivable is as follows:
Other long-term
receivables
At 1 January 2017 359,036
Provision 383,996
Reclassification (244,615)
Reversal (650)
At 31 December 2017 497,767
Reversal (450)
At 30 September 2018 497,317
As at 30 September 2018 and 31 December 2017, there are no other long-term receivables that are past due but not impaired. The other classes and balances within long-term receivables, rental and investments are fully performing.
The maximum exposure to credit risk at the reporting date is the carrying value of each class of receivable mentioned above. The carrying amount of long-term receivables approximate their fair value.
(b) Customer Grants
Customer grants consist of business development funds used to help customers expand their operations. The payments of the funds are secured by long-term sales contracts with the customers. The carrying amount of customer grant approximate their fair value.
(c) Investments in associates
30 September 2018 31 December 2017
Cost 23,073 23,073
The details of assets, liabilities and results of operations of associates, all of which are incorporated in the Philippines, are as follows:
Interest Assets Liabilities Net Assets Income Share of
Profit
30 September 2018
Bonifacio Gas Corporation
44% 253,146 125,406 127,741 81,603 35,905
Kamayan Realty Corporation
40% 19,599 3,677 15,922 4,726 1,890
31 December 2017
Bonifacio Gas Corporation
44% 219,379 94,013 125,365 80,022 35,210
Kamayan Realty Corporation
40% 40,829 4,697 36,132 24,925 9,970
Bonifacio Gas Corporation is an entity engaged in wholesale distribution of LPG and was established to operate a centralized gas distribution system within the Bonifacio Global City. Kamayan Realty Corporation is an entity engaged in leasing and selling of real properties.
There are no contingent liabilities relating to the Company’s interest in the associates.

15
Note 7 - Provision for income tax; deferred tax liabilities Deferred income tax assets and liabilities are offset when there is a legally enforceable right to offset current tax assets against current tax liabilities and when the deferred income taxes relate to the same fiscal authority. The offset amounts at 30 September 2018 and 31 December 2017 are as follows:
30 September
2018 31 December
2017
Deferred income tax assets (liabilities) Asset retirement obligation 368,086 332,390
Unamortized past service cost, net 256,382 311,784
Operating lease - effect of straight lining 293,474 293,816
Provision for remediation costs 99,018 142,720
Provision for doubtful debts 207,515 199,000
Share-based compensation 44,811 61,357
Provision for inventory losses 9,444 8,574
Unrealized foreign exchange gain (88,752) (92,074)
Unrealized mark-to-market gain (66,433) (67,842)
Prepaid duties and taxes (411,868) (419,658)
Retirement benefit asset (1,710,938) (1,713,383)
Other provisions 283,102 241,267
(716,159) (702,049)
NOLCO - -
MCIT - -
Deferred income tax (liabilities) assets, net (716,159) (702,049)
The gross movements in net deferred income tax (liabilities) assets are as follows:
30 September
2018 31 December
2017
At 1 January (702,049) 330,310 Credited to profit and loss (17,986) 100,103 Credited to other comprehensive income 3,876 (652,086) Application of excess MCIT - (480,376)
At 30 September 2018 and 31 December 2017 (716,159) (702,049)
Realization of the future benefits related to the deferred income tax assets is dependent on many factors, including the Company’s ability to generate taxable income in the future. The Company’s Management has considered these factors in arriving at its conclusion that the deferred income tax assets as at 30 September 2018 and 31 December 2017 are fully realizable.
Year of incurrence
Year of expiration
NOLCO MCIT
2017 2016 2015 2018 2017 2016 2015 2014
2013 2016 – – – - - 182,328 182,328 182,328 2014 2017 – 6,857,670 9,984,281 - 22,876 22,876 22,876 22,876 2015 2018 – – – - 330,340 330,340 330,340 – 2016 2019 – – – - 127,160 127,160 – – 2017 2020 – – – - – – – – 2018 2021 – – – – – – – –
– 6,857,670 9,984,281 - 480,376 662,704 535,544 205,204 Expired – – – - – (182,328) – – Applied – (6,857,670). (3,126,611) - (480,376) – - - – – 6,857,670 - – 480,376 535,544 205,204 Tax rate 30% 30% 30% - – – – –
– – 2,057,301 - – 480,376 535,544 205,204
16
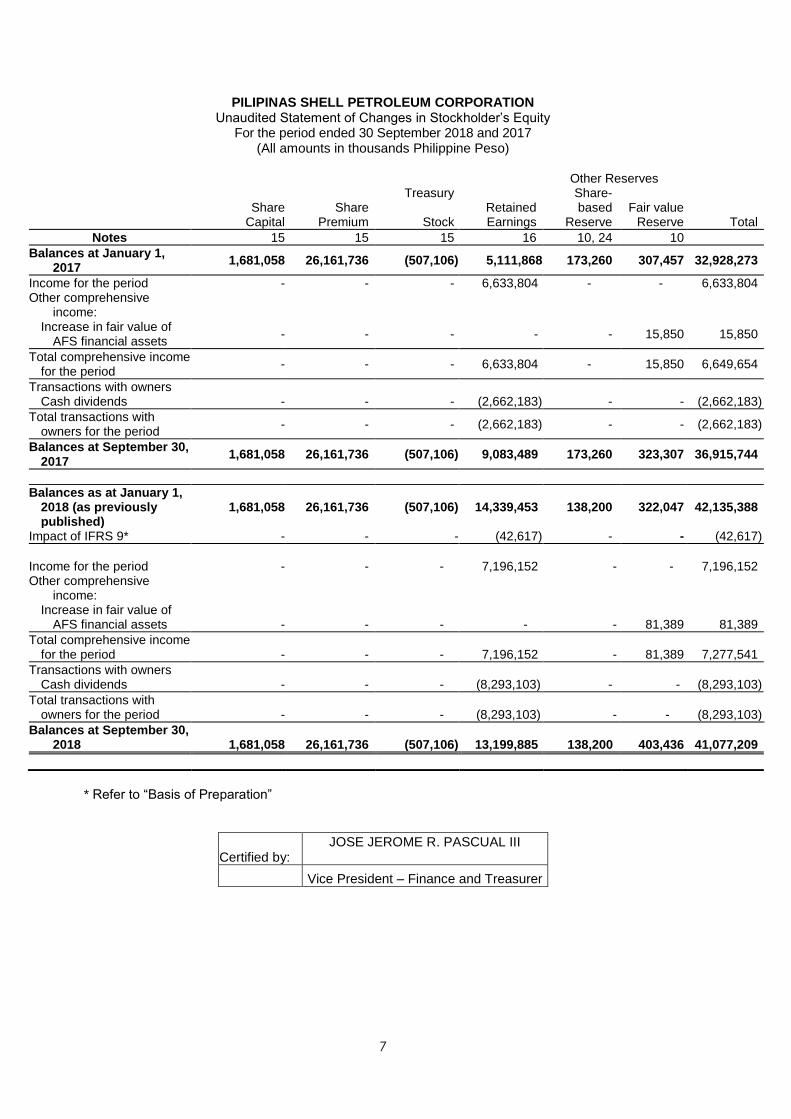
On December 20, 2017, the Company filed its ITH Financial Statements as a requirement of the BOI to recognize the ITH benefits from 2016 results of operations. The Company was granted income tax holiday (ITH) in line with its registration as an existing industry participant with new investments in the modernization of the Tabangao Refinery with the Board of Investments in 09 May 2014 to produce Euro IV products. BOI issued a Certificate of ITH Entitlement on 03 April 2017 for the taxable year 2016. ITH benefits for the year-ended 2017 and 2016 have been recognized in 2017. The Company has availed ITH benefit to arrive at tax liability as of September 30, 2018. The details of provision for income tax for the nine-month period ended 30 September 2018 and 2017 are as follows:
30 September
2018 30 September
2017
Current 2,674,007 2,023,094 Deferred 17,986 874,649
2,691,993 2,897,743
The reconciliation of provision for income tax computed at the statutory rate to actual provision for income tax shown in the statements of income is shown below:
30 September
2018 30 September
2017
Income tax at statutory income tax rate at 30% 2,966,444 2,859,464 Income tax effect of: Non-deductible expenses 45,003 41,390 Limitation on deductible interest expense 50 65 Interest income subjected to final tax (147) (196) Non-taxable income (332,355) (7,166) Income subjected to 8% final tax (5,450) (11,785)
Provision for income tax before final taxes 2,673,545 2,881,772 Final taxes on interest and other charges 18,448 15,971
Provision for income tax at effective tax rate 2,691,993 2,897,743
Note 8 - Other assets, net The account as at 30 September 2018 and 31 December 2017 consists of:
30 September
2018 31 December
2017
Pension asset 5,640,028 5,716,045
Equity through OCI (a) 428,442 348,247
Deferred input VAT (b) 125,280 136,688
Intangible assets (c) 57,318 60,907
6,251,068 6,261,887

17
(a) Equity through OCI Equity through OCI mainly represent equity securities and proprietary club shares which are carried at fair value. Details of the account as at 30 September 2018 and 31 December 2017 are as follows:
30 September
2018 31 December
2017
Cost 27,994 27,994
Fair value adjustments recognized directly in other comprehensive income 1 January 322,047 307,457
Changes during the period 81,389 14,590
Reclassified to intangible asset (1,194) -
402,242 322,047
30 September 2018 and 31 December 2017 430,236 350,041
Current portion (1,794) (1,794)
Non-current portion 428,442 348,247
As of 30 September 2018 and 31 December 2017, the Company intends to sell equity instrument with fair value of P1.8 million within 12 months. Correspondingly, such amount was reclassified to current assets. Based on reassessment the company reclassified P1.2 million club shares to intangible asset. (b) Deferred Input VAT Deferred input VAT will be recovered 12 months after reporting date. Hence, the same is presented as non-current asset as at 30 September 2018 and 31 December 2017. (c) Intangible asset Intangible asset consists of program software and others. As at 30 September 2018 and 31 December 2017 the movements in the accounts for the years consist of:
30 September
2018 31 December
2017
At cost 1 January 949,129 916,682
Reclassifications from AUC - 55,757 Reclassification from available for sale
financial assets 1,193 -
Write off - (23,310)
Balance at the end 950,322 949,129
Accumulated amortization
1 January (888,222) (906,072)
Amortization for the period (4,782) (5,460)
Write off - 23,310
Balance at the end (893,004) (888,222)
Net book value 57,318 60,907

18
Note 9 – Trade and other payables The account as at 30 September 2018 and 31 December 2017 consists of:
30 September
2018 31 December
2017
Trade Payables Third parties 6,154,713 5,150,064
Related parties 13,903,381 10,864,331
20,058,094 16,014,395
Non-trade payables from related parties 720,368 351,917
Other payables
Rent and utilities 1,304,088 1,482,961
Project-related costs and advances 977,716 736,729
Employee benefits 501,785 412,371
Provision for remediation 221,399 395,384
Supply and distribution 127,501 148,187
Advertising and promotions 416,688 429,222
Duties and taxes 144,441 179,629
Derivatives (a) 10,940 63,448
Others (b) 790,203 949,540
25,273,223 21,163,783
(a) As at 30 September 2018, the fair value of the derivative liabilities from outstanding commodity
forward contracts amounted to P10.9 million (31 December 2017 – P63.4 million).
(b) Others include the current portion of asset retirement obligation and various other accruals. Note 10 - Short-term borrowings The account as at 30 September 2018 consists of unsecured short-term loans from bank as per below intended for working capital requirements and corporate expenses.
BANK Loan Value Maturity date Tenure
Development Bank of Philippines 3,747,000 1 October 2018 4 days
Development Bank of Philippines 1,246,000 1 October 2018 3 days
Development Bank of Philippines 2,500,000 2 October 2018 4 days
Metropolitan Bank and Trust Company Philippines 122,000 1 October 2018 4 days
7,615,000
As at 31 December 2017, unsecured short-term loan amounted to P4,057.0 million from Development Bank of the Philippines with tenure of 5 days which matured on 03 January 2018. The average interest rate on local borrowings for the nine-month period ended 30 September 2018 was 3.27% (30 September 2017 – 2.52%). Total interest expense charged to operations for the nine-month period ended 30 September 2018 arising from short-term loans amounted to P260.2 million (30 September 2017 – P69.6 million).
19
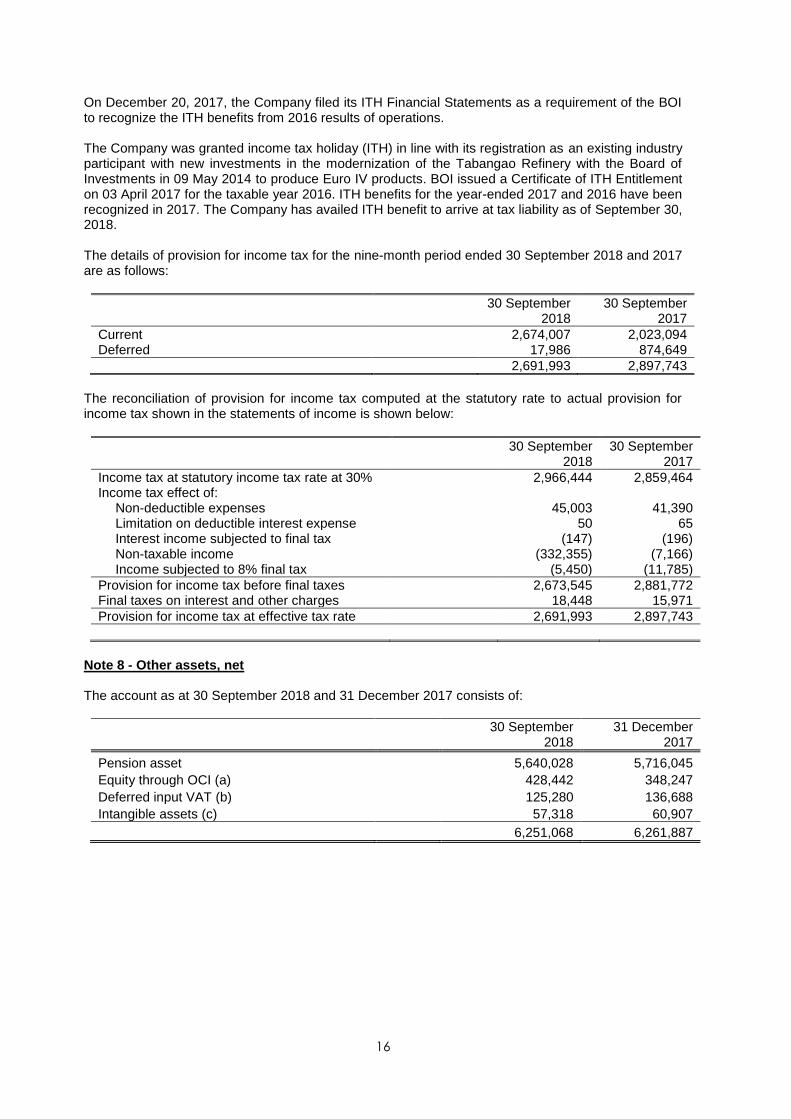
Note 11 - Loans payable Details of the loan agreements with Bank of the Philippine Islands (BPI) as at 30 September 2018 and 31 December 2017 follow:
30 September 2018
31 December 2017
Interest Terms
- 6,000,000 3.53% as at 31 December 2017 effective until next re-pricing
Payable after thirty-six (36) months reckoned from the drawdown date on 2 March 2015. Principal is payable in lump sum at maturity date. Interest is re-priced every three (3) months. Original amount of the loan was P11.0 billion but a principal prepayment of P5.0 billion was made on 1 July 2015.
- 5,000,000 3.67% as at 31 December 2017 effective until next re-pricing.
Payable after sixty (60) months reckoned from the drawdown date on 02 March 2015. Principal is payable in lump sum at maturity date. Interest is re-priced every three (3) months.
9,000,000
- 4.08% as at 30th September 2018 effective until next re-pricing
Payable after sixty (60) months reckoned from the drawdown date on 08 March 2018. Principal is payable in lump sum at maturity date. Interest is re-priced every three (3) months.
30 September 2018 31 December 2017
Loans Current - 6,000,000 Non-current 9,000,000 5,000,000
Total 9,000,000 11,000,000
Total interest expense charged to operations for the nine-month period ended 30 September 2018 arising from these loans amounted to P197.9 million (30 September 2017 – P302.7 million). There are no borrowings related to acquisition, construction or production of a qualifying asset as at 30 September 2018 and 31 December 2017. The borrowings are intended solely for working capital requirements. There are no collaterals pledged as security against these borrowings. Under the loan agreements, the Company is required to comply with certain covenants, as follows:
• Maintenance of the Company’s legal status.
• Ensure that at all times the loans rank at least pari passu with the claims of all other unsecured and in subordinated creditors except those whose claims are preferred by any bankruptcy, insolvency, liquidation or other similar laws of general application.
• The Company shall not create or permit to subsist any encumbrance over all or any of its present or future revenues or assets other than permitted encumbrance as defined in the loan agreements.
• The Company shall duly pay and discharge all taxes, assessment and charges of whatsoever nature levied upon or against it, or against its properties, revenues and assets prior to the date on which penalties attach thereto, and to the extent only that the same shall be contested in good faith and by appropriate legal proceedings.
The Company is in compliance with the covenants as at reporting periods presented.

20
Note 12 - Share capital; Treasury shares; Share premium Capital stock and treasury shares as at 30 September 2018 and 31 December 2017 consist of:
30 September 2018 31 December 2017
Number of
shares Amount Number of
shares Amount
Authorized capital stock, common shares at P1 par value per share
2.5 billion 2,500,000 2.5 billion 2,500,000
Issued shares 1,681,058,291 1,681,058 1,681,058,291 1,681,058 Treasury shares (67,614,089) (507,106) (67,614,089) (507,106)
Issued and outstanding shares 1,613,444,202 1,173,952 1,613,444,202 1,173,952
As at 30 September 2018, the Company has 313 shareholders, excluding treasury shares, (31 December 2017 - 319), 276 of whom hold at least 100 shares of the Company’s common shares (31 December 2017 - 285). Note 13 - Retained earnings; Dividends Retained earnings as at 30 September 2018 and 31 December 2017 consist of:
At the special meeting of the Board held on 20 April 2017, the Board approved the distribution of a cash dividend to stockholders on record as of 18 May 2017 amounting to P2.7 billion out of the unrestricted retained earnings available for cash dividends as of 31 December 2016. At the special meeting of the Board held on 14 March 2018, the Board approved the distribution of cash dividend to stockholders on record as of 28 March 2018 amounting to P8.3 billion out of the unrestricted retained earnings available for cash dividends as of 31 December 2017. Cash dividends declared and paid in 2018 and 2017
Date
Declared Paid Per share 2018 2017
14 March 2018 19 April 2018 5.14 8,293,103 -
20 April 2017 18 May 2017 1.65 - 2,662,183
8,293,103 2,662,183
As at 30 September 2018, cost of treasury shares, the accumulated earnings of its associates and unrealised mark-to-market gains are not available for dividend declaration.
30 September
2018 31 December
2017
Unappropriated retained earnings, unadjusted 10,752,576 11,892,146
Re-measurement gains on net defined benefit obligation, net of tax, closed to retained earnings
2,447,309 2,447,307
Unappropriated Retained Earnings 13,199,885 14,339,453

21
Note 14 - Earnings per share Computation of earnings per share (EPS) for the nine-month period ended 30 September follow:
YTD 3Q 2018 YTD 3Q 2017
Earnings available to stockholders:
Profit for the period 7,196,152 6,633,804
Weighted average number of shares
1,681,058,291 1,681,058,291
Treasury shares (67,614,089) (67,614,089)
1,613,444,202 1,613,444,202
Basic and diluted EPS 4.46 4.11
As at 30 September 2018 and 2017, the Company does not have any potentially dilutive stocks. Trailing Earnings per share
2018 2017
(Trailing 12 months) (Trailing 12 months)
Earnings available to stockholders:
Profit for the period 10,930,582 7,717,938
Weighted average number of shares
1,681,058,291 1,678,948,702
Treasury shares (67,614,089) (67,614,089)
1,613,444,202 1,611,334,613
Basic and diluted EPS 6.77 4.79
Trailing 12 months Earnings/(Loss) per Share (Basic) = Trailing 12 months Net Income/(Loss) – Dividends Paid on Preferred Stock/Weighted Ave. No. of Common Shares Outstanding. Trailing 12 months Net Income/(Loss) = Current Year-to-date Net Income/(Loss) + Latest Annual Net Income/(Loss) – Previous Year-to-date Net Income/(Loss). Note 15 – Classification of other operating and non-operating income and finance expense
YTD 3Q 2018 YTD 3Q 2017
Other operating income 928,453 691,325
Other operating expense (100,175) (246,979)
Other operating income, net 828,278 444,346
Finance income 1,882 251,153
Finance expenses (1,062,924) (892,368)
Finance expenses, net (1,061,042) (641,215)
Other operating income, net comprises rental income and franchise commission from non-fuel retail business, mark to market loss or gain from hedge settlements, loss on disposal of fixed assets and others.

22
Note 16 – Contingencies
(a) Excise tax on Importations of Catalytic Cracked Gasoline (CCG) and Light Catalytic Cracked Gasoline (LCCG)
Pilipinas Shell Petroleum Corporation vs. Commissioner of Customs, Collector of Customs of the Port of Batangas, Bureau of Customs and Bureau of Internal Revenue SC G.R. Nos. 227651 & 227087
Matter Summary: From 2004 to 2009, the Company imported shipments of CCG and LCCG into the Philippines in accordance with the BIR Authority to Release Imported Goods (ATRIG) stating that the importation of CCG and LCCG is not subject to excise tax. Upon payment of VAT as assessed in the ATRIGs, the Bureau of Customs (BOC) allowed the entry of the imported CCG and LCCG without payment of excise tax. CCG and LCCG, being intermediate or raw gasoline components, are then blended with refinery products to produce unleaded gasoline that is compliant with applicable Philippine regulatory standards, particularly the Clean Air Act of 1999 and the Philippine National Standards (the “resulting product”). Prior to the withdrawal of the resulting product from the Company’s refinery, the Company paid the corresponding excise taxes. In 2009, the District Collector of the Port of Batangas issued a letter demanding from the Company the payment of deficiency excise tax, VAT and penalties covering importation entries from 2006 to 2008. The Company requested the cancellation of the demand letter for lack of factual and legal basis. The District Collector of the Port of Batangas denied the request of the Company and declared that the law mandated the payment of excise tax on importation of unleaded gasoline and that it made no distinction or qualification on whether or not it was for consumption or sale to the domestic market. The District Collector of the Port of Batangas then reiterated his previous demand and threatened enforcement of Section 1508 of the Tariff and Customs Code of the Philippines (TCCP) which would hold the delivery or release of imported articles when an importer has an outstanding and demandable account.
The Company appealed before the Commissioner of Customs (COC). In the meantime, the Director of the DOE-Oil Industry Management Bureau issued a letter reiterating the earlier DOE finding that CCG and LCCG imports were raw materials or blending components in the production or processing of gasoline in its finished form. The then BIR Commissioner issued a memorandum confirming and reiterating the initial ruling in 2004 to the effect that CCG and LCCG are intermediate products or blending components which are not subject to excise tax under Section 148 of the NIRC.
The COC denied the appeal of the Company and demanded the payment of excise tax and VAT for the Company’s CCG and LCCG importations this time from 2004 to 2009. The Company filed a motion for reconsideration of the Letter-Decision, which was denied by the COC. The COC then ordered the Company to pay the principal amount of P7.35 billion and pay the excise tax and VAT on all incoming CCG and LCCG shipments.
The Company thereafter filed a petition for review with the Court of Tax Appeals (CTA) for the purpose of appealing the ruling of the COC as well as to apply for the issuance of a temporary restraining order (TRO) to immediately prevent the COC from seizing future shipments of the Company pursuant to Section 1508 of the TCCP. The Company likewise applied for the issuance of a suspension order for the purpose of ensuring the preservation of the status quo while the merits of the appeal are being heard by the CTA.
While the case was pending in the CTA, the BIR Commissioner at that time issued on 15 December 2009 a Letter-Ruling declaring that the CCG and LCCG imports of the Company were subject to excise tax on the ground that the law did not make any distinction or qualification on whether or not the imports were intended for consumption or for blending with other substances. The ruling effectively reversed the earlier rulings of former BIR Commissioners.

23
Following the reversal of the ruling by the BIR Commissioner, the BOC started collecting excise taxes in January 2010 on shipments of the Company. The Company paid the BOC assessments under protest and on 27 January 2010, filed a Supplemental Petition seeking to annul the 15 December 2009 ruling by the BIR Commissioner.
In view of the paramount public interest, the government agreed not to exercise Section 1508 of the TCCP on condition that the Company posts a surety bond.
On 04 March 2010, the CTA approved the surety bond posted by the Company and enjoined the COC, the Collector of Customs at the Port of Batangas, the BOC and all persons acting under their direction or authority from undertaking any actions under Section 1508 of the TCCP and/or from all remedies to collect from petitioner the excise taxes and VAT, with increments, subject of the case.
On 27 November 2012, the CTA 3rd Division issued a Resolution granting the Company’s Motion for Summary Judgment. The Court deemed that BOC’s demand for the payment of excise taxes on importations of LCCG/CCG during the period 2004 to 2009 without merit, rendering the discussion on whether the CCG/LCCG are properly classified (under Section 148(e) or Section 148(f) of the NIRC, as amended) moot and academic. The CTA 3rd Division ruled in favour of the Company and respondent was prohibited from collecting the alleged unpaid excise taxes and VAT thereon, on the Company’s importations of CCG/LCCG for the relevant periods in 2004 to 2009. The BOC filed a Petition for Review with the CTA en banc. Meanwhile, the Company filed its own Petition for Review with the CTA en banc because the CTA did not invalidate the 15 December 2009 Ruling of the CIR with respect to double taxation - first, upon importation and the other upon withdrawal of the finished grade products from the refinery.
In its 28 September 2015 decision, the CTA en banc reversed the CTA Third Division, ruled partially in favour of the BOC and the BIR and held that the Company is liable to pay excise taxes and VAT on the importation of CCG and LCCG but only for the period from 2006 to 2009. The CTA en banc recognized the Company’s defense of amnesty applied for periods from 2004 to 2005, thereby partially reducing the liability to shipments made from 2006 to 2009. Both parties filed motions for reconsideration of the CTA en banc decision. The BIR and BOC filed an Omnibus Motion for Partial Reconsideration and Clarification to question the decision of the CTA en banc in relation to the assessment of the unpaid excise taxes, VAT and penalties for the years 2004 and 2005. The Company, in turn, filed an Opposition to the said motion. The Company likewise filed a motion for reconsideration of the CTA en banc decision in relation to the assessment of the unpaid excise taxes, VAT and penalties for the years 2006 to 2009.
On 21 September 2016, the Company received an Amended Decision of the CTA en banc upholding its 28 September 2015 ruling and holding that the Company is liable to pay the Government for alleged unpaid taxes for the importation of CCG and LCCG for the period from 2006 to 2009 totalling P5.72 billion.
On 06 October 2016, the Company filed the appropriate appeal with the Supreme Court. The BOC and the BIR also filed their Petition for Review on Certiorari seeking to bring back the liability of the company to P7.35 billion plus interest and surcharges. Status: The Supreme Court consolidated the said petitions and the parties have filed their respective Comments. The Government and the Company filed their Reply on 22 January 2018 and 06 June 2018, respectively.
Management believes that provision should not be recognized as at 30 September 2018 and 31 December 2017 since it is the Company’s assessment that liability arising is not probable because the Company’s factual and legal positions are strong. The Company continues to take appropriate legal action and remediation with respect to such case.
24
(b) Excise tax on Importations of Alkylate
Pilipinas Shell Petroleum Corporation vs. Commissioner of Internal Revenue et al. CTA Case No. 8535, Court of Tax Appeals, 1st Division Filed 24 August 2012
Matter Summary: Following the ruling of the BIR authorizing the collection of excise taxes on CCG/LCCG importations, the Company began importing Alkylate as its blending component. The COC issued Customs Memorandum Circular No. 164-2012 directing the BOC and its officers to take the “appropriate action” in relation to BIR Ruling dated 29 June 2012 (Ruling No. M-059-2012) issued by the BIR Commissioner. In the ruling dated 29 June 2012, the BIR Commissioner held that Alkylate is also subject to excise tax upon importation. The BIR Ruling further held that the Company is liable for the amount of P1.9 billion representing the unpaid taxes, on the importations of Alkylate from 2010.
A Petition for Review of the BIR ruling was filed with the CTA. On 18 September 2012, the Company filed a Motion for the Issuance of a Suspension Order to stop the implementation of Ruling No. M-059-2012.
On 22 October 2012, the CTA issued a Resolution approving the issuance of a Suspension Order stopping the collection of alleged deficiency excise taxes (and VAT) for the period from 2010 to June 2012, upon the posting by the Company of a surety bond. Said bond was duly filed and the CTA approved the same on 30 October 2012.
In a Resolution dated 28 January 2013, the CTA denied the BIR/BOC Motion to Dismiss the case. Subsequent appeals (Petitions for Certiorari) from the denial of the Motion to Dismiss have been filed by the BOC and the BIR with Supreme Court. On 02 June 2014, the Company filed a Petition for Certiorari with Application for the Issuance of a Temporary Restraining Order and/or Writ of Preliminary Injunction with the SC questioning the denial of its application for the issuance of a suspension order against the assessment and collection of excise taxes on its March 2014 alkylate shipment. On 7 July 2014, the SC issued a temporary restraining order enjoining the CTA and the tax-collecting agencies of the government from imposing excise taxes on incoming alkylate importations of the Company.
Meanwhile, in the main case before the CTA, on 31 July 2014, the Company filed a Motion for Judgment on the Pleadings. This Motion was denied by the tax court on 13 February 2015. On 16 March 2015, the Company filed a Motion for Reconsideration from this denial of the Motion for Judgment on the Pleadings.
As disclosed in Note 6, the Company has excise duties and VAT paid under protest amounting to P1.1 billion for certain Alkylate shipments. Status: Trial continues. The CTA denied PSPC’s application to present additional witness and request for the issuance of subpoena for the production of additional documents PSPC filed a motion for the reconsideration of the CTA’s resolution, and the BOC and BIR are due to file their Comment. The CTA has not set the subsequent hearing dates pending the resolution of PSPC’s motion.
Management believes that provision should not be recognized as at 30 September 2018 and 31 December 2017 since it is the Company’s assessment that liability arising is not probable because the Company’s factual and legal positions are strong.

25
(c) Tax Credit Certificates Cases Commissioner of Internal Revenue vs. Pilipinas Shell Petroleum Corporation SC GR No. 204119-20, Supreme Court 2nd Division Filed 05 December 2012
Matter Summary: This is an appeal from the Decision of the Court of Appeals which affirmed the Court of Tax Appeals in setting aside the CIR’s demand for payment of the sum of P1.7 billion as the Company’s excise tax liabilities for the years 1992, 1994-1997, which were paid by the Company through TCCs and TDMs.
Status: The Supreme Court rejected the Bureau of Internal Revenue's effort to collect taxes totalling ~ $37 million, which Pilipinas Shell (PSPC) had paid using Tax Credit Certificates (TCCs) acquired from other companies. According to the SC, PSPC obtained the TCCs in good faith and for value and used them in accordance with the applicable laws and rules.
Commissioner of Internal Revenue vs. Pilipinas Shell Petroleum Corporation SC-G.R. No. 197945, Supreme Court Filed 04 October 2011
Matter Summary: From 1988 to 1997, the Company paid some of its excise tax liabilities with Tax Credit Certificates duly assigned and transferred to it by other BOI-registered entities. In 1998, the BIR sent a collection letter to the Company demanding payment of allegedly unpaid excise taxes. CIR sought to collect from the Company the amount of P235 million. This became the subject of several protests which led to various cases before the CTA.
This is an appeal from the Decision dated 22 February 2011 of the Court of Tax Appeals in CTA EB Case No. 535 which denied the CIR's petition for lack of merit and ruling that the Company has duly settled its excise tax liabilities by utilizing valid and genuine TCC/TDMs, obtained in good faith and for value, and in accordance with the applicable laws and rules.
Status: The Supreme Court rejected the Bureau of Internal Revenue's effort to collect taxes totalling ~ $37 million, which Pilipinas Shell (PSPC) had paid using Tax Credit Certificates (TCCs) acquired from other companies. According to the SC, PSPC obtained the TCCs in good faith and for value and used them in accordance with the applicable laws and rules.
Republic of the Philippines rep. by Bureau of Customs vs. Pilipinas Shell Petroleum Corporation & Filipino Way Industries SC G.R. No. 209324 Supreme Court Civil Case No. 02-103191, Regional Trial Court of Manila
Matter Summary: Sometime in March 1996, TCCs were issued to Filway Industries for customs duties and taxes allegedly paid on raw materials used in the manufacture, processing or production of knitted fabrics. In 1997, Filway executed a deed of assignment over the TCCs in favour of the company. The Company then utilized said TCCs to settle its customs duties and taxes on oil importations.
According to the government, it was discovered that the said credit memos were fake and spurious as they did not conform to the records. Thus, the TCCS were cancelled and BOC is demanding anew for the payment of custom duties and taxes for the Company’s importations.

26
The Court of Appeals had earlier upheld the dismissal of the case by the RTC Manila Branch 49 that dismissed the case. In a Decision dated 09 December 2015, the Supreme Court remanded the case to the RTC for the conduct of the trial proceedings so that the Bureau of Customs could attempt to prove the alleged fraudulent acquisition and use of TCCs.
Status: Republic concluded the presentation of its evidence. PSPC has filed a demurrer to evidence. Awaiting resolution.
(d) Excise Tax Refund Case There are also tax cases filed by the Company for its claims from the government amounting to P733.1 million that are pending as at 30 September 2018 and 31 December 2017 in the CTA and SC. Management believes that the ultimate outcome of such cases will not have a material impact on the Company’s financial statements.
(e) Other significant cases
(i) Cases Filed by the West Tower Condominium Corporation (WTCC)
(a) West Tower Condominium Corp. et al. vs. Judge Elpidio R. Calis et al SC G.R. No. 215901, Supreme Court
Matter Summary: The Company is a respondent in this Petition for Certiorari filed by West Tower Condominium Corp, et al. to challenge the ruling of Judge Calis requiring the payment of filing fees in the civil case for damages earlier brought by WTCC in connection with the leak in White Oil Pipeline. The issue is whether the case filed with the lower court is exempt from payment of filing fees. The trial court judge earlier ruled that the claim is an ordinary claim for damages.
Status: In a Decision dated 30 June 2014, the Court of Appeals affirmed the ruling of the Regional Trial Court requiring the payment of filing fees. FPIC and its Board of Directors and Officers asked the Court of Appeals to reconsider the part of its Decision retaining the party-complainants previously dropped as parties to the case arguing that the court has no jurisdiction to reinstate these party-complainants. West Tower Condominium Corporation, et al. filed its Motion for Reconsideration arguing that they have satisfied all the requirements in order that this case may be treated as an environmental case which does not necessitate the payment of the filing fees.
On 26 September 2014, the Company asked the Court of Appeals to deny the motion for reconsideration filed by West Tower Condominium Corporation, et al. for lack of merit. In its resolution dated 11 December 2014, the Court of Appeals denied the motion for reconsideration filed by the West Tower Condominium Corporation, et al. West Tower Condominium Corporation, et al.'s filed with the Supreme Court the present petition dated 11 February 2015 seeking a review of the decision of the Court of Appeals. The Company has filed its Comment with Opposition dated 18 September 2015 asking the Supreme Court to dismiss the petition and to deny the application for a temporary restraining order. Awaiting Supreme Court's action.

27
(b) West Tower Condominium Corp. vs. Garde, et al (Criminal Negligence) PS No. XV-05-INV-11J-02709, Department of Justice Filed 25 October 2011
Matter Summary: This is a complaint for criminal negligence against the 11 Directors of the Company and 2 Officers of the Company who were also directors of FPIC at the time of the pipeline leak incident. Aside from the other Directors and Officers of FPIC, also charged were Directors of First Gen Corp. and Directors of Chevron.
Each of the Company’s Directors (11) and Officers (2) filed their respective Counter-affidavits on the 19 January 2011. The Directors asserted that there is no basis to find them culpable for negligence. The City Prosecutor will make a determination as to the existence of probable cause, which is necessary before the Respondents can be indicted.
Status: In its Resolution dated 22 February 2018, the Office of the City Prosecutor of Manila dismissed the Complaint for lack of probable cause. The Resolution stated that the directors and officers of the Corporation were not under obligation to operate and maintain the pipeline belonging to FPIC. Complainants did not file an appeal thus, the Resolution has attained finality and the case shall be considered closed.
(iii) Others
Cecilio Abenion, et al vs. Dow Chemical Co, et al. SC G.R. No. 202295, Supreme Court, 1st Division SC-G.R. Case 199182-89, Supreme Court, 2nd Division Filed 23 December 2011
Matter Summary: In 1996, an action for damages was filed against several U.S. corporations, including Shell Oil Company, alleged to be manufacturers and users of pesticides used in plantations in Davao City. A global compromise agreement was reached between Shell Oil Company (among others) and the claimants. In August 2009, a Davao City trial court issued a Notice of Garnishment of the Company’s funds in a bank. The Company sought and obtained protective relief from the Court of Appeals on the basis that it was not a party to the case nor to the compromise agreement subject of the case. The Court of Appeals further ordered the judge who issued the execution and garnishment against the Company’s assets to recuse himself from further presiding in the proceedings in the trial court. Status: Two separate petitions for review of the Court of Appeals’ decision were filed by the claimants with the Supreme Court. One of the petitions (SC G.R. No. 202295) was dismissed by the Supreme Court in 2012 and the company recently received the Supreme Court’s Resolution dated 5 June 2017 which also dismisses the other set of petitions (SC G.R. No. 199182-89). In a Supreme Court Resolution dated 7 March 2018, the petitioners’ appeal has been dismissed with finality.

28
Note 17 - Deregulation Law On 10 February 1998, RA No. 8479, otherwise known as the Downstream Oil Industry Deregulation Act 1998 (the “Act”) was signed into law. The law provides, among others, for oil refiners to list and offer at least 10% of their shares to the public within three years from the effectivity of the said law. In a letter to the Department of Energy (DOE) dated 12 February 2001, the Department of Justice (DOJ) rendered an opinion that the 3 year period in Section 22 of RA 8479 for oil refineries to make a public offering is only directory and not mandatory. As to when it should be accomplished is subject of reasonable regulation by the DOE. On 3 November 2016, the Company became a publicly-listed company with the Philippine Stock Exchange, in compliance with Philippine Republic Act No. 8479, otherwise known as the Downstream Oil Industry Deregulation Act of 1998 and it’s implementing rules and regulations. Note 18 - Summary of significant accounting policies 18.1 Basis of preparation Basis of Preparation: The accompanying financial statements have been prepared on a historical cost basis, except for available-for-sale financial assets and derivatives which have been measured at fair value. The financial statements are presented in Philippine peso, the functional and presentation currency of the Company. All amounts are rounded off to the nearest thousand peso unit unless otherwise indicated. Statement of Compliance: The financial statements have been prepared in compliance with Philippine Financial Reporting Standards (PFRS). Changes in Accounting Policies and Disclosures: The accounting policies adopted are consistent with those of the previous financial year except for the adoption of the following amendments to previously issued PAS and PFRS, which were adopted as at 01 January 2018.
• Amendments to PFRS 12, Disclosure of Interests in Other Entities, Clarification of the Scope of the Standard (Part of Annual Improvements to PFRSs 2014 - 2016 Cycle)
• Amendments to PAS 7, Statement of Cash Flows, Disclosure Initiative
• Amendments to PAS 12, Income Taxes, Recognition of Deferred Tax Assets for Unrealized Losses
• Amendments to PFRS 9, Financial Instruments sets out the requirements for recognizing and measuring financial assets, financial liabilities and certain contracts to buy or sell non-financial items. Furthermore, the standard facilitates use of hedge accounting and also results in different income recognition upon the sale of certain investments in securities. The adoption of PFRS 9 resulted in a decrease of Php42.6 million in equity at January 1, 2018, mainly representing the recognition of additional provisions for impairment of receivables under the expected loss model.
Standards Issued But Not Yet Effective The standards and interpretations that are issued, but not yet effective, up to the date of issuance of the Company’s financial statements are listed below. The Company intends to adopt these standards when they become effective. Adoption of these standards and interpretations are not expected to have any significant impact on the financial statements of the Company.

29
Effective beginning on or after 01 January 2018
• Amendments to PFRS 2, Share-based Payment, Classification and Measurement of Share-based Payment Transactions
• Amendments to PFRS 4, Insurance Contracts, Applying PFRS 9, Financial Instruments, with PFRS 4
• PFRS 15, Revenue from Contracts with Customers
• Amendments to PAS 28, Measuring an Associate or Joint Venture at Fair Value (Part of Annual Improvements to PFRSs 2014 - 2016 Cycle)
• Amendments to PAS 40, Investment Property, Transfers of Investment Property
• Philippine Interpretation IFRIC-22, Foreign Currency Transactions and Advance Consideration
Effective beginning on or after 01 January 2019
• Amendments to PFRS 9, Prepayment Features with Negative Compensation
• Amendments to PAS 28, Long-term Interests in Associates and Joint Ventures
• Philippine Interpretation IFRIC-23, Uncertainty over Income Tax Treatments
Deferred effectivity
• Amendments to PFRS 10 and PAS 28, Sale or Contribution of Assets between an Investor and its Associate or Joint Venture
The impact of the major standards that are effective on or after 01 January 2018 is as below:
PFRS 15, Revenue from Contracts with Customers PFRS 15 establishes a new five-step model that will apply to revenue arising from contracts with customers. Under PFRS 15, revenue is recognized at an amount that reflects the consideration to which an entity expects to be entitled in exchange for transferring goods or services to a customer. The principles in PFRS 15 provide a more structured approach to measuring and recognizing revenue. The new revenue standard is applicable to all entities and will supersede all current revenue recognition requirements under PFRSs. Either a full retrospective application or a modified retrospective application is required for annual periods beginning on or after January 1, 2018. Early adoption is permitted. The Company plans to adopt the new standard on the required effective date using the full retrospective method. Based on its initial assessment, the requirements of PFRS 15 on the following may have an impact on the Company’s financial position, performance and disclosures:
• Identification of performance obligations, particularly on the loyalty programs offered by the Company
• Variable considerations such as volume rebates
The impact is however assessed to be immaterial to the Company. In addition, as the presentation and disclosure requirements in PFRS 15 are more detailed than under current PFRSs, the Company is currently assessing the impact of PFRS 15. The recognition and measurement requirements in PFRS 15 also apply to gains or losses on disposal of non-financial assets (such as items of property and equipment and intangible assets), when that disposal is not in the ordinary course of business. However, on transition, the effect of these changes is not expected to be material for the Company. Standards issued but not yet effective: The standards and interpretations that are issued but not yet effective up to the date of issuance of the Company’s financial statements are disclosed below. The Company intends to adopt these standards, if applicable, when they become effective. PFRS 16 Leases

30
PFRS 16 will replace PAS 17 Leases, and the related interpretations. PFRS 16 sets out the principles for the recognition, measurement, presentation and disclosure of leases and requires lessees to account for all leases under a single on-balance sheet model similar to the accounting for finance leases under PAS 17. At the commencement date of a lease, a lessee will recognise a liability to make lease payments and an asset representing the right to use the underlying asset during the lease term. Lessees will be required to recognise interest expense on the lease liability and the depreciation expense on the right-of-use asset. Lessor accounting under PFRS 16 is substantially the same as the accounting under PAS 17. Lessors will continue to classify all leases using the same classification principle as in PAS 17 and distinguish between two types of leases: operating and finance leases. PFRS 16 is effective for annual periods beginning on or after 01 January 2019. Early application is permitted but not before an entity applies PFRS 15. A lessee can choose to apply the standard using either a full retrospective or a modified retrospective approach. The Company will assess the impact of adoption of the new standard and will adopt the new standard on the required effective date. (a) Classification and measurement Debt securities currently held as available-for-sale (AFS) under PAS 39 are expected to be classified as at fair value through other comprehensive income (FVOCI) as these are held both to collect contractual cash flows and to sell. Trade and other receivables are held to collect contractual cash flows and thus qualify for amortized cost measurement. However, the Company is still finalizing its assessment on whether the contractual cash flows of these debt financial assets are solely payments of principal and interest (SPPI) to be able to conclude that these instruments are eligible for amortized cost or FVOCI measurement. Investments in unquoted equity shares currently carried at cost under PAS 39 are intended to be held for the foreseeable future. As such, the Company intends to apply the option to present fair value changes for these investments in OCI. The Company is in the process of determining how to measure the fair value of these unquoted investments. Quoted equity shares currently held as AFS are expected to be measured at fair value through profit or loss, which will increase volatility in profit or loss. (b) Impairment
PFRS 9 requires the Company to record expected credit losses on all of its debt financial assets. The Company plans to apply the simplified approach and to record lifetime expected losses on all trade receivables that do not contain significant financing component. For the Company’s debt securities and other receivables that will be measured at amortized cost or at FVOCI, the general approach for measuring expected credit losses is required to be applied. Thus, credit losses for these financial assets will be measured either on 12-month or lifetime basis depending on the extent of the deterioration of their credit quality. The Company is currently quantifying the impact of the change in measuring credit losses. (c) Hedge accounting The Company has determined that all existing hedge relationships that are currently designated in effective edging relationships under PAS 39 will continue to qualify for hedge accounting under PFRS 9. On transition, the Company will not retrospectively apply PFRS 9 to the hedges where the Company excluded the forward points from the hedge designation under PAS 39. As PFRS 9 does not change the general principles of how an entity accounts for effective hedges, applying the hedging requirements of PFRS 9 will not have a significant impact on the Company’s financial statements.
31
The significant accounting policies applied in the preparation of the financial statements are set out below. These policies have been consistently applied to all the years presented, unless otherwise stated. 18.2 Offsetting financial instruments Financial assets and liabilities are offset and the net amount reported in the statement of financial position when there is a legally enforceable right to offset the recognized amounts and there is an intention to settle on a net basis, or realize the asset and settle the liability simultaneously. The Company assesses that it has a currently enforceable right of offset if the right is not contingent on a future event, and is legally enforceable in the normal course of business, event of default, and event of insolvency or bankruptcy of the Company and all of the counterparties. As at 30 September 2018 and 31 December 2017, there are no financial assets and financial liabilities that were offset. Note 19 - Financial risk management 19.1 Financial risk factors The Company’s operations expose it to a variety of financial risks: market risk (including foreign currency risk, cash flow and fair value interest risk, and price risk), credit risk and liquidity risk. The Company’s overall risk management program focuses on the unpredictability of financial markets and seeks to minimize potential adverse effects on the Company’s financial performance. Risk management is carried out by its Regional Treasury - Shell Treasury Centre East (STCE) under policies approved by the Board of Directors. STCE identifies, evaluates and hedges financial risks in close cooperation with the Company’s operating units. The Board of Directors provides written principles for overall risk management, as well as written policies covering specific areas, such as foreign exchange risk, interest rate risk, credit risk and investing excess liquidity. 19.1.1 Market risk Market risk is the possibility that changes in currency exchange rates, interest rates or the prices of crude oil and refined products will adversely affect the value of the Company’s assets, liabilities or expected future cash flows. i. Foreign exchange risk The Company operates internationally and is exposed to foreign currency exchange risk arising from currency fluctuations, primarily with respect to the importations of crude and finished products denominated in US dollar. Foreign currency exchange risk may also arise from future commercial transactions and recognized assets and liabilities denominated in a currency other than the Company’s functional currency. Foreign exchange currency risks are not hedged and the Company does not enter into significant derivative contracts to manage foreign currency risks. Since foreign currency exposure is significantly concentrated on purchase of crude, the Company manages foreign currency risk by planning the timing of its importation settlements with related parties and considering the forecast of foreign exchange rates. Management considers that there are no significant foreign exchange risks with respect to other currencies. ii. Cash flow and fair value interest rate risk Cash flow and fair value interest risk is the risk that future cash flows andfair value, respectively, of a financial instrument will fluctuate because of changes in market interest rates. The Company has no significant exposure to fair value interest rate risk as the Company has no significant interest-earning assets and interest-bearing liabilities subject to fixed interest rates.

32
The Company’s interest-rate risk arises from its borrowings. Borrowings issued at variable rates expose the Company to cash flow interest-rate risk. As at 30 September 2018 and 31 December 2017, the Company’s short-term borrowings and loans payable carry floating rates based on a certain index plus applicable premium. The Company does not enter into significant hedging activities or derivative contracts to cover risk associated with borrowings. For the year ended 30 September 2018, if interest rates on Philippine peso-denominated borrowings had been 100 basis points (assessment threshold used by management) higher/lower with all other variables held constant, post-tax profit for the year would have been P116.3 million (31 December 2017 – P105.4 million) lower/higher, mainly as a result of higher/lower interest expense on floating rate borrowings. Management uses 100 basis points as threshold in assessing the potential impact of interest rate movements in its operations. iii. Commodity and Other Price risks Commodity price risk is the risk that future cash flows from a financial instrument will fluctuate because of changes in market prices. The Company is affected by price volatility of certain commodities such as crude oil required in its operating activities. To minimize the Company’s risk of potential losses due to volatility of international crude and petroleum product prices, the Company may implement commodity hedging for crude and petroleum products. The hedges are intended to protect crude inventories from risk of downward prices and squeezing margins. This allows stability in prices, thus offsetting the risk of volatile market fluctuations. Through hedging, prices of commodities are fixed at levels acceptable to the Company, thus protecting raw material cost and preserving margins. For consumer (buy) hedging transactions, if prices go down, hedge positions may show marked-to-market losses; however, any loss in the marked-to-market position is offset by the resulting lower physical raw material cost. While for producer (sell) hedges, if prices go down, hedge positions may show marked-to-market gains; however, any gain in the marked-to-market position is offset by the resulting lower selling price. The Company is not significantly exposed to price risk on equity securities and proprietary club shares as investments held by the Company classified in the statement of financial position as available-for-sale financial assets are not considered material in the financial statements. 19.1.2 Credit risk Credit risk arises from deposits with banks and financial institutions, as well as credit exposure to trade and non-trade receivables. The Company maintains cash and certain other financial instruments with various major financial institutions. To minimize this risk, the Company performs periodic evaluations of the relative credit standing of these financial institutions and where appropriate, places limits on the amount of credit exposure with any one institution. Additional information is presented in Note 2. The Company has policies in place to ensure that sales of products are made to customers with acceptable creditworthiness. Counterparty credit risk is managed within a framework of individual credit limits with utilization being regularly reviewed. Credit checks are performed by a department independent of sales department and are undertaken before contractual commitment. Where appropriate, cash on delivery terms are used to manage the specific credit risk. Also, there are collaterals and security deposits from customers taken which enables to manage the risk. There is no concentration of credit risks as at statement of financial position dates as the Company deals with a large number of homogenous trade customers. Additional information is presented in Note 3. Where there is a legally enforceable right to offset under trading agreements and net settlement is regularly applied, the net asset or liability is recognized in the statement of financial position, otherwise assets and liabilities are presented at gross. As at 30 September 2018 and 31 December 2017, the Company has the following:

33
Gross amounts
before offset Amounts
offset
Net Amounts as
presented Credit
enhancement Net amount
30 September 2018 Financial assets:
Receivables 12,999,065 - 12,999,065 3,354,000 9,645,065
31 December 2017 Financial assets: Receivables 9,822,567 - 9,822,567 3,217,839 6,604,728
19.1.3 Liquidity risk Liquidity risk is the risk that suitable sources of funding for the Company’s business activities may not be available. The Company has access to sufficient external debt funding sources (banks credit lines) to meet currently foreseeable borrowing requirements. The Treasury group centrally monitors bank borrowings, foreign exchange requirements and cash flow position. Surplus cash is invested into a range of short-dated money market instruments, time deposits and money funds, which seek to ensure the security and liquidity of investments while optimizing yield. Availability of funding to settle the Company’s payables are ensured since the Company has unused credit lines and undrawn borrowing facilities at floating rate amounting to P64.4 billion as at 30 September 2018 (31 December 2017 – P70.7 billion) which is expiring within one year. 19.2 Capital management The Company manages its business to deliver strong cash flows to fund capital expenditures and growth based on cautious assumptions relating to crude oil prices. Strong cash position and operational cash flow provide the Company financial flexibility both to fund capital investment and return on equity. Total capital is calculated as ‘equity’ as shown in the balance sheet less other reserves plus net debt. i. Cash flow from operating activities Cash flow from operating activities is considered a measure that reflects the Company’s ability to generate funding from operations for its investing and financing activities and is representative of the realization of value for shareholders from the Company’s operations. The statement of cash flows shows the components of cash flow. Management uses this analysis to decide whether to obtain additional borrowings or additional capital infusion to manage its capital requirements. ii. Gearing ratio The gearing ratio is a measure of the Company’s financial leverage reflecting the degree to which the operations of the Company are financed by debt. The amount of debt that the Company will commit depends on cash inflow from operations, divestment proceeds and cash outflow in the form of capital investment, dividend payments and share repurchase. The Company aims to maintain an efficient statement of financial position to be able to finance investment and growth, after the funding of dividends. The gearing ratio is calculated as net debt divided by total capital. Net debt is calculated as total loans and borrowings less cash and cash equivalents. The Company does not have a fixed gearing target and management considers whether the present gearing level is commercially acceptable based on the ability of the Company to operate on a stand-alone basis and is set after appropriate advice has been taken from Tax, Treasury and Legal advisors.
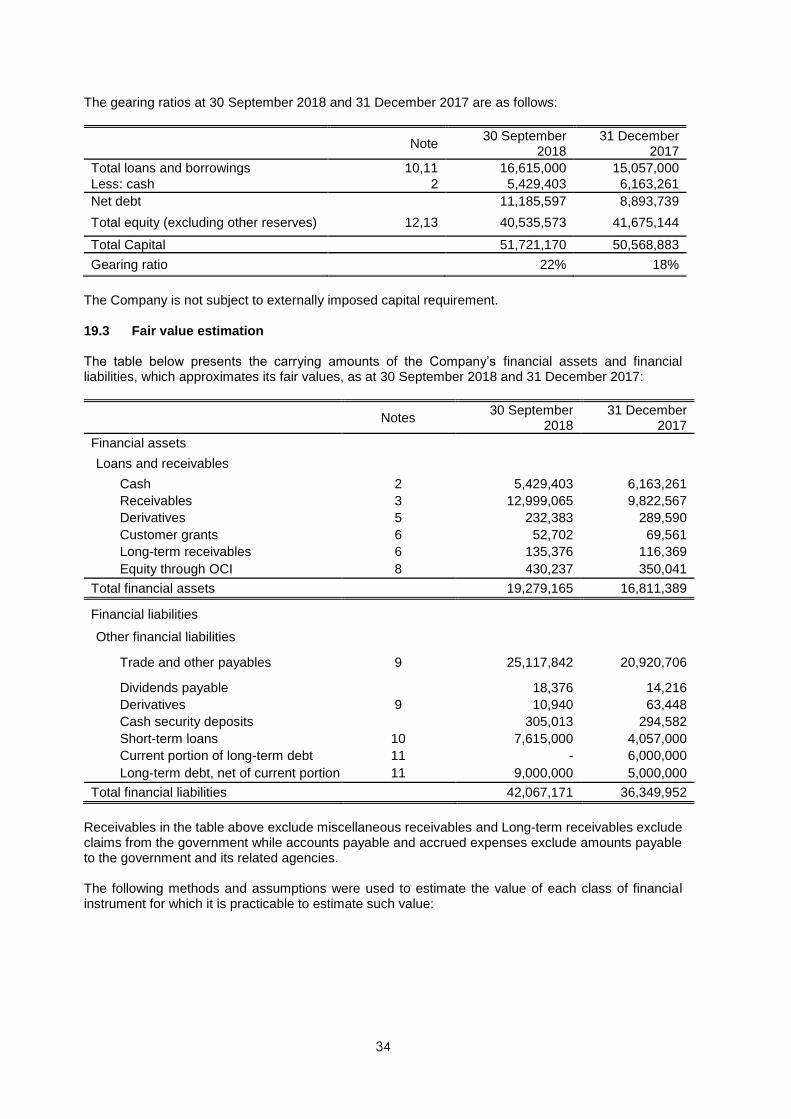
34
The gearing ratios at 30 September 2018 and 31 December 2017 are as follows:
Note 30 September
2018 31 December
2017
Total loans and borrowings 10,11 16,615,000 15,057,000
Less: cash 2 5,429,403 6,163,261
Net debt 11,185,597 8,893,739
Total equity (excluding other reserves) 12,13 40,535,573 41,675,144
Total Capital 51,721,170 50,568,883
Gearing ratio 22% 18%
The Company is not subject to externally imposed capital requirement. 19.3 Fair value estimation The table below presents the carrying amounts of the Company’s financial assets and financial liabilities, which approximates its fair values, as at 30 September 2018 and 31 December 2017:
Notes 30 September
2018 31 December
2017
Financial assets
Loans and receivables
Cash 2 5,429,403 6,163,261
Receivables 3 12,999,065 9,822,567
Derivatives 5 232,383 289,590
Customer grants 6 52,702 69,561
Long-term receivables 6 135,376 116,369
Equity through OCI 8 430,237 350,041
Total financial assets 19,279,165 16,811,389
Financial liabilities
Other financial liabilities
Trade and other payables 9 25,117,842 20,920,706
Dividends payable 18,376 14,216
Derivatives 9 10,940 63,448
Cash security deposits 305,013 294,582
Short-term loans 10 7,615,000 4,057,000
Current portion of long-term debt 11 - 6,000,000
Long-term debt, net of current portion 11 9,000,000 5,000,000
Total financial liabilities 42,067,171 36,349,952
Receivables in the table above exclude miscellaneous receivables and Long-term receivables exclude claims from the government while accounts payable and accrued expenses exclude amounts payable to the government and its related agencies. The following methods and assumptions were used to estimate the value of each class of financial instrument for which it is practicable to estimate such value:

35
i. Current financial assets and liabilities Due to the short-term nature of the accounts, the fair value of cash and cash equivalents, receivables, deposits, accounts payable (excluding derivative financial liabilities) and short-term borrowings approximate the amount of consideration at the time of initial recognition. ii. Financial assets and liabilities carried at cost Staff car loans, market investment loans, other long-term receivables and payables, are carried at cost which is the repayable amount. iii. Financial assets and liabilities carried at fair value The Company’s equity securities classified as available-for-sale financial assets are marked-to-market if traded and quoted. The predominant source used in the determining the fair value of the available-for-sale financial assets is the quoted price and is considered categorized under Level 1 of the fair value hierarchy. For unquoted equity securities, the fair values could not be reliably determined due to the unpredictable nature of future cash flows and the lack of suitable methods of carrying at a reliable fair value. These are carried at cost less any allowance for impairment losses. These are not significant in relation to the Company’s portfolio of financial instruments. Fair values of derivative assets and liabilities are calculated by reference to the fixed price and the relevant index price as of the statement of financial position date. The fair values of the derivatives are categorized under Level 2 of the fair value hierarchy. iv. Loans payable The carrying values of long-term loans payable approximates their fair value because of regular interest reprising based on market conditions. Note 20 –Changes in estimates of amounts There were no changes in estimates of amounts reported in prior interim periods of the current financial year or changes in estimates of amounts reported in prior financial years that would have a material effect in the current interim period. Note 21 – Issuances, repurchases, and repayments of debt and equity securities There were no issuances, repurchases of debt and equity securities during the quarter. Note 22 – Material events subsequent to the end of the interim period that have not been reflected in the financial statements for the interim period There were no material events subsequent to the end of the interim period that has not been reflected in the financial statements for the interim period. Note 23 – Changes in the composition of the issuer during the interim period, including business combinations, acquisition or disposal of subsidiaries and long-term investments, restructurings, and discontinuing operations There were no changes of material amount in the composition of the Company during the interim period. Note 24 – Changes in contingent liabilities or contingent assets There were no changes of material amount in contingent liabilities or contingent assets since the last annual balance sheet date.

36
Note 25 – Existence of material contingencies There were no material contingencies, events or transactions that existed that materially impact the current interim period except those disclosed in the contingencies note. Note 26 – Other Matters
a. There were no seasonal aspects during the interim period that have a material effect on the financialresults of operations.
b. The Company has reviewed the known trends, demands, developments, commitments, events or uncertainties during the reporting period and is of the opinion that there are no items which will have a material impact on the issuer’s liquidity.
c. There were no material or significant events during the reporting period that will trigger direct or contingent financial obligations that are material to Pilipinas Shell Petroleum Corporation except for the cases enumerated under Note 16 - Contingencies.
d. There were no material off-balance sheet transactions, arrangements, obligations and other relationships of the company with unconsolidated entities or other persons created during the reporting period.
e. For the year 2018, a budget of P4.3 billion has been approved for capital expenditures. Bulk of the capital expenditures will be allocated mainly for establishment of new retail service stations and growth projects, and the improvement of existing supply and distribution sites.
f. Global developments, particularly the volatility in oil prices, will continue to impact crude oil supply, both internationally and in the domestic market.
g. There were no significant elements of income or loss that did not arise from the Company’s continuing operations.

37
ITEM 2 Management’s Discussion and Analysis of Financial Performance and Financial Condition The Statements of Financial Position and Statements of Income for the period ended 30 September 2018 and 2017, are shown in Million Philippine Pesos.
Financial condition as of the nine-month period ended 30 September 2018 compared with the period ended 31 December 2017
30 September 31 December %Increase
(decrease) 2018 2017
Current assets 49,922.9 45,876.3 8.8%
Non-Current assets 37,164.3 36,000.7 3.2%
Total assets 87,087.2 81,877.0 6.4%
Current Liabilities 33,429.5 31,235.0 7.0%
Non-Current Liabilities 12,580.5 8,506.6 47.9%
Total Liabilities 46,010.0 39,741.6 15.8%
Equity 41,077.2 42,135.4 -2.5%
Current assets PSPC’s current assets increased from P45,876.3 million as of 31 December 2017 to P49,922.9 million as of 30 September 2018 primarily due to the following: Trade and other receivables, net increased by P4,283.0 million, or 39.4% from P10,865.1 million as of 31 December 2017 to P15,148.1 million as of 30 September 2018 primarily driven by general increase in oil prices and imposition of higher excise tax on petroleum products.
Inventories, net increased by P5,324.9 million, or 24.6% from P21,671.2 million as of 31 December 2017 to P26,996.1 million as of 30 September 2018 driven by increase in prices of crude and finished products. Cash decreased by 733.9 million, or 11.9% from P6,163.3 million as of 31 December 2017 to 5,429.4 million as of 30 September 2018 as a result of dividend payments and settlement of long-term borrowings. This was partially offset by cash generated from operations.
Prepayments and other current assets decreased by P4,827.4 million, or 67.3% from P7,176.7 million as of 31 December 2017 to P2,349.3 million as of 30 September 2018 mainly driven by reduction in excess input VAT and other assets.
Non-Current Assets
PSPC’s non-current assets increased from P36,000.7 million as of 31 December 2017 to P37,164.3 million as of 30 September 2018 primarily due to the following:
Property and equipment, net increased by P974.8 million, or 3.8% from P25,434.4 million as of 31 December 2017 to P26,409.2 million as of 30 September 2018 primarily due to additional capital spend on new retail stations and refinery investments.
38
Current Liabilities
PSPC’s current liabilities increased from P31,235.0 million as of 31 December 2017 to P33,429.5 million as of 30 September 2018 primarily due to the following:
Trade and other payables increased by P4,109.4 million, or 19.4% from P21,163.8 million as of 31 December 2017 to P25,273.2 million as of 30 September 2018 primarily due to increase in trade payables as a result of increase in crude oil prices.
Short-term loans increased by P3,558.0 million, or 87.7% from P4,057.0 million as of 31 December 2017 to P7,615.0 million as of 30 September 2018 primarily due to higher short-term borrowings for working capital requirements. Current portion of long-term debt decreased by P6,000.0 million, or 100% as of 30 September 2018 mainly due to repayment of loan in 1Q 2018.
Non-Current Liabilities
PSPC’s non-current liabilities increased from P8,506.6 million as of 31 December 2017 to P12,580.5 million as of 30 September 2018 primarily due to the following:
Long-term debt, net of current portion increased by P4,000.0 million or 80.0% from P5,000.0 million as of 31 December 2017 to P9,000.0 million as of 30 September 2018 mainly due to the repayment of P5,000.0 million long-term loan refinanced with P9,000.0 million long-term loan in 1Q 2018.
Equity PSPC’s total equity decreased from P42,135.4 million as of 31 December 2017 to P41,077.2 million as of 30 September 2018 primarily due to the decrease in retained earnings from P14,339.5 million as of 31 December 2017 to P13,199.9 million as of 30 September 2018. The 7.9% or P1,139.6 decrease in retained earnings is mainly driven by cash dividend declared and paid amounting to P8,293.1 million partially offset by strong profits earned.

39
Financial Performance
YTD 3Q YTD 3Q %Increase
(decrease) 2018 2017
Net Sales 161,876.0 123,428.4 31.1%
Sales Volumes (M liters) 4,166.5 4,167.0 -0.01%
Cost of sales 141,087.5 104,814.5 34.6%
Gross profit 20,788.6 18,614.0 11.7%
Selling, General and administrative expenses 10,667.7 8,885.5 20.1%
Other operating income, net 828.3 444.3 86.4%
Finance expenses, net 1,061.0 641.2 65.5%
EBITDA Adjusted for COSA 6,414.0 9,889.2 -35.1%
EBITDA 11,879.5 11,368.2 4.5%
Provision for income tax 2,692.0 2,897.7 -7.1%
Net Income 7,196.2 6,633.8 8.5%
Results of operations for the period ended 30 September 2018 compared with the period ended 30 September 2017 Net sales increased by P38,447.6 million, or 31.1%, from P123,428.4 million for the period ended 30 September 2017 to P161,876.0 million for the period ended 30 September 2018 primarily due to higher product prices driven by the general increase in average global oil prices as against YTD 3Q 2017. Cost of sales increased by P36,273.0 million, or 34.6%, from P104,814.5 million for the period ended 30 September 2017 to P141,087.5 million for the period ended 30 September 2018, primarily as a result increase in average global oil prices. Selling, General and Administrative expenses increased by P1,782.1 million, or 20.1% from P8,885.5 million for the year ended 30 September 2017 to Php10,667.6 million for the year ended 30 September 2018 driven by the reversal in 2017 of the legal provision from the abandonment case after obtaining a favorable decision on the case. Part of the increase is attributable to higher depreciation and amortization from additional capital investments. Other operating income, net increased significantly by P383.9 million from P444.4 million for the period ended 30 September 2017 to P828.3 million for the period ended 30 September 2018. This increase is primarily due to rise in net mark to market gain in 2018 as compared to 2017 arising from favorable settlement deals and increase in non-fuel retail income. Finance expense, net increased by P419.8 million, or 65.5%, from P641.2 million for the period ended 30 September 2017 to P1,061.0 million for the period ended 30 September 2018. This is mainly driven by increase in interest rates coupled with higher borrowings and weakening of Philippine peso. EBITDA Adjusted for COSA decreased by P3,475.2 million or 35.1% from P9,889.2 million for the period ended 30 September 2017 to P6,414.0 million for the period ended 30 September 2018 primarily driven by lower refining margin environment, planned refinery pitstop in 2Q 2018. This is partially offset by the sustained margin growth from the marketing businesses slightly tempered by higher inflation that affected consumer demand in Q3. 2017 performance was impacted positively by the reversal of the abandonment case provision partially offset by the planned refinery turnaround. EBITDA increased by P511.4 million or 4.5% from P11,368.1 million for the period ended 30 September 2017 to P11,879.5 million for the period ended 30 September 2018 mainly due to impact of pre-tax inventory holding gains of P5,465.5 million in YTD 3Q 2018 against P1,478.9 million in YTD 3Q 2017.

40
Key financial ratios
YTD 3Q 2018 (unaudited)
FY 2017 (Audited)
Current Ratio (a) 1.49 1.47
Debt Ratio (b) 0.13 0.11
Debt to Equity (c) 0.28 0.21
Asset to equity ratio (d) 2.15 1.96
Interest coverage ratio (e) 22.51 28.72
Return on Assets (f) 8.26% 12.66%
Return on Equity (g) 17.75% 24.88%
Return on average capital employed (h) 18.12% 26.92%
a. Current ratio is computed by dividing current assets over current liabilities. b. Debt ratio is computed by dividing net debt (short-term and long-term borrowings less cash)
over total assets. c. Debt to equity ratio is derived by dividing net debt (short-term and long-term borrowings
less cash) over stockholder’s equity (exclusive of Other Reserves). d. Asset to equity ratio is derived by dividing total assets over stockholder’s equity (exclusive
of Other Reserves). e. Interest coverage ratio is derived by dividing earnings before interest expense and taxes
over interest expense. f. Return on assets is computed as Profit (Loss) for the year divided by total assets. g. Return on equity is computed as Profit (Loss) for the year divided by stockholder’s equity
(exclusive of Other Reserves). h. Return on average capital employed is defined as EBIT as a percentage of the average
capital employed for the period. Capital employed consists of total equity, short-term borrowings and loans payable. Average capital is calculated as the mean of the opening and closing balances of capital employed for that period.
(Please note that the numbers for 2018 are only for YTD 3Q 2018 while those for 2017 are for the full year, as audited).

41
OTHER FINANCIAL DATA Reconciliation from statutory profit for the year to EBIT and EBITDA
YTD 3Q 2018 YTD 3Q 2017
Profit for the period 7,196.2 6,633.8
Add:
Provision for income tax
2,692.0 2,897.7
Finance expense 520.0 415.7
Depreciation and amortization 1,473.2 1,425.4
Less:
Finance income 1.9 4.5
EBITDA1 11,879.5 11,368.1
Less:
Depreciation and amortization 1,473.2 1,425.4
EBIT1 10,406.3 9,942.7
YTD 3Q 2018 YTD 3Q 2017
EBITDA 11,879.5 11,368.1 Less:
Cost of Sales Adjustment (COSA)2 5,465.5 1,478.9
EBITDA (adjusted for COSA)3 6,414.0 9,889.2
Less:
Depreciation and amortization 1,473.2 1,425.4
EBIT (adjusted for COSA)3 4,940.8 8,463.8
__________________________________________ 1 EBIT indicates profit for the period excluding interest income, interest and finance charges (and accretion) expense and benefit from (provision for) income tax. EBITDA indicates profit for the period excluding interest income, interest and finance charges (and accretion) expense, benefit from (provision for) income tax and depreciation and amortization. EBIT and EBITDA are not measurements of financial performance under PFRS and investors should not consider them in isolation or as an alternative to profit or loss for the period, income or loss from operations, an indicator of PSPC’s operating performance, cash flow from operating, investing and financing activities, or as a measure of liquidity or any other measures of performance under PFRS. Because there are various EBIT and EBITDA calculation methods, PSPC’s presentation of this measure may not be comparable to similarly titled measures used by other companies. EBIT and EBITDA above are both unaudited figures for YTD 3Q 2018. 2 The COSA provides an approximate measure of PSPC’s performance on a current cost of supplies basis, and is a financial measure used by PSPC in managing its day-to-day operations such as (but not limited to) allocating resources and assessing performance. The COSA is an adjustment that reflects PSPC’s cost of sales using the current cost of supplies sold, rather than FIFO inventory accounting which is the actual standard applied by PSPC in preparing its PFRS financial statements. As such, the COSA excludes the accounting effect of changes in the oil price on inventory carrying amounts. The COSA as applied to EBIT and EBITA is applied on a pre-tax basis to arrive at adjusted EBIT and adjusted EBITDA. Prospective investors are cautioned that COSA, EBITDA, and EBIT (and any adjustments thereto) are in all cases not measurements of financial performance under PFRS and investors should not consider them in isolation or as an alternative to profit or loss for the year, income or loss from operations, or as an indicator of PSPC’s operating performance, cash flow from operating, investing and financing activities, or as a measure of liquidity or any other measures of performance under PFRS. Although other oil refiners use similar measures, prospective investors are cautioned that there are various calculation methods, and PSPC’s presentation of COSA may not be comparable to similarly titled measures used by other companies. 3 These figures have been adjusted to remove the effects of changes in oil prices on inventory carrying amounts, which adjustment is referred to herein as the cost of sales adjustment.