IBM Quarterly Executive Service Q3 1998
35
IBM QUARTERLY EXECUTIVE SERVICE BELGIUM Q3 1998 Preliminary Forecast 1999 Check us out on the World Wide Web! http://www.idcresearch.com Quoting IDC Information and Data: Internal Documents and Presentations—Quoting individual sentences and paragraphs for use in your company’s internal communications does not require permission from IDC. The use of large portions or the reproduction of any IDC document in its entirety does require prior written approval and may involve some financial consideration. External Publication—Any IDC information that is to be used in advertising, press releases, or promotional materials requires prior written approval from the appropriate IDC Vice President or Country Manager. A draft of the proposed document should accompany any such request. Copyright 1997 International Data Corporation. Reproduction is forbidden unless authorized. Printed on recycled materials. 0 Analyst: Lode Goukens Filing Information January 1999 IDC SPECIAL REPORT Vol.
Transcript of IBM Quarterly Executive Service Q3 1998

IBM QUARTERLY EXECUTIVE SERVICE
BELGIUM Q3 1998
Preliminary Forecast 1999
Check us out on the World Wide Web! http://www.idcresearch.com
Quoting IDC Information and Data: Internal Documents and Presentations—Quoting individual sentences and paragraphs for use in your company’s internal communications does not require permission from IDC. The use of large portions or the reproduction of any IDC document in its entirety does require prior written approval and may involve some financial consideration. External Publication—Any IDC information that is to be used in advertising, press releases, or promotional materials requires prior written approval from the appropriate IDC Vice President or Country Manager. A draft of the proposed document should accompany any such request.
Copyright 1997 International Data Corporation. Reproduction is forbidden unless authorized.
Printed on recycled materials. 0
Analyst: Lode Goukens Filing Information
January 1999 IDC SPECIAL REPORT Vol.

European Quarterly Executive Service Q4 1998 -‐ Belgium
Table of Contents Q3 1998
Objectives, Methodology, Definitions ............................................................................................................................. 1
Objective ...................................................................................................................................................................................... 1
IDC Project Staff ....................................................................................................................................................................... 2
Deliverables ............................................................................................................................................................................... 3
1. Country Reports ............................................................................................................................................................... 3
2. Hot-‐line ................................................................................................................................................................................ 3
Data Tables Methodology And Definitions ................................................................................................................... 5
Chapter 1 IDC's Perception and Analysis of IT Market Trends in Q3 1998 ................................................... 7
Main drivers and Inhibitors in Q3 1998 ........................................................................................................................ 7
Systems Market drivers/inhibitors .............................................................................................................................. 11
Software Market drivers/inhibitors ............................................................................................................................ 11
Services Market drivers/inhibitors .............................................................................................................................. 12
Chapter 2 Competitive Environment in Q3 1998 ................................................................................................... 15
Performance of top IT suppliers .................................................................................................................................... 15
Key moves activities ............................................................................................................................................................ 15
Successes, failures and strategy assessment ............................................................................................................ 16
IDC Recommendations for IBM Strategy for the Next Quarter ........................................................................ 17
Chapter 3 Channels Environment in Q3 1998 ......................................................................................................... 19
Overview of Major Channel Trends in Belgium in Q3 1998 .............................................................................. 19
Systems Integrators -‐ Trends and Performance in Q3 1998 ............................................................................. 20
Value Added Providers -‐ Trends and Performance in Q3 1998 ....................................................................... 21
Resellers -‐Trends and Performance in Q3 1998 ..................................................................................................... 22
Retailers -‐ Trends and Performance in Q3 1998 .................................................................................................... 23
Wholesale Distributors -‐ Trends and Performance in Q3 1998 ....................................................................... 24
European Quarterly Executive Service Q3 1998 -‐ Belgium
A International Data Corporation -‐ -‐ special report 1
Objectives, Methodology, Definitions Objective This European Quarterly Executive Service aims at providing IBM with a strategic overview of the key dynamics driving European and Middle East country markets. The dynamics are spelled out in terms of drivers/inhibitors and critical areas and opportunities for each national business environment. Three major changes have been made compared with the reports provided during 1997 : • A detailed analysis of market trends for each major market
segment on a 1998 annual basis. This analysis will be updated quarterly so that each operational division of IBM can analyze trends and data on its specific market segment.
• Trends in distribution channels. This analysis, based on research conducted at the country level as well as through IDC’s European distribution expertise center, will include detailed channel market data for each of IBM’s major market and business, as well as a "qualitative" analysis and feedback on the market. This information should allow IBM to benchmark its sales performance against trends observed in key channels, and to maintain a watch over key channel developments.
• Strategic analysis of key players by country. On the basis of the list of players provided by IBM, IDC will provide estimates of quarterly performance for the key players by country, as well as a "qualitative" analysis of strengths and weaknesses of those players. This information will allow IBM to monitor its own performance agains its top five competitors on each market, and to anticipate key marketing events and moves on the market.
• For this quarter, IDC has placed special emphasis on the forecasts by country. These forecasts are the result of work carried out in cooperation with IDC's local research offices and IT Expertise Centers. It is clear that these forecasts may be modified in Q4 1998 because of the importance of the last three months of the year.
European Quarterly Executive Service Q4 1998 -‐ Belgium
special report -‐ -‐ A International Data Corporation 2
IDC Project Staff (The names of consultants and analysts responsible for each country and region is provided in alphabetical order of countries) • Austria : Steve Frantzen • Belgium : Ron Sharis • Bulgaria : Christo Georgiev/ Steve Frantzen • Croatia: Boris Zitnik/ Steve Frantzen • Czech Republic : Nick Kaufmann/ Steve Frantzen • Denmark : Per Andersen • Eastern Europe (other): Steve Frantzen • Finland : Per Andersen • France : Eric Ochs • Germany : Steve Frantzen • Greece: Philip Fersht/Stephen Minton • Hungary : Zolt Varkony/ Steve Frantzen • Israel: Philip Fersht/Stephen Minton • Italy: Antonio Romano • MEA (other): Philip Fersht/Stephen Minton • Netherlands: Ron Sharis • Norway : Per Andersen • Poland : Andrjez Jarosz • Portugal : Philip Fersht/Stephen Minton • Russia : Robert Farish/ Steve Frantzen • Slovakia. Nick Kaufmann/ Steve Frantzen • South Africa : Philip Fersht/Stephen Minton • Spain: Eric Ochs • Sweden : Per Andersen • Switzerland: Steve Frantzen • Turkey : Philip Fersht/Stephen Minton • UK: Philip Fersht/Stephen Minton
European Quarterly Executive Service Q3 1998 -‐ Belgium
A International Data Corporation -‐ -‐ special report 3
Deliverables IDC data, analysis and analyst opinion are provided in three formats: country reports, hot-‐line support, and pesentations
1. Country Reports Country reports provide IDC’s latest views and trends on the national markets. Comments/trends are presented in bullet points and tables. Coverage and detail will vary as follows: • Countries "A" for which coverage is more detailed: UK,
Germany, Netherlands, France, Italy, Denmark, Sweden, Spain, especially in terms of vendor analysis and channel trends
• Countries "B" for which coverage is less detailed: Belgium, Austria, Switzerland, Portugal, Greece, Finland, Norway, especially in terms of vendor analysis and channel trends
• Countries "C" : Russia, Poland, Hungary, Czech Republic, Slovakia, others Eastern Europe
• Countries "D" : for which coverage of existing research is limited and which will be excluded from some parts of the analysis: South Africa, Turkey, Israel, Others MEA, Portugal, Greece.
2. Hot-‐line • IBM has access to a Hot Line service as described below: • Direct access to IDC analysts for inquiries of 1 hour (please see
the IDC contacts by country in the table below) • For more complex questions, IBM should contact IBM Europe
which will manage the inquiry directly with IDC.

European Quarterly Executive Service Q4 1998 -‐ Belgium
special report -‐ -‐ A International Data Corporation 4
COUNTRY/REGION IDC Contact Phone Numbers Fax Email
Belgium Lode Goukens 31 20 40 89 514 32 – 779 46 05 [email protected]
The Netherlands Peter Vermeulen 31-‐20-‐40 89 514 31 20 617 55 66 [email protected]
France Corinne Huron 33 1 49 04 80 05 33 1 49 04 80 19 [email protected]
Spain Eric Ochs 33 1 49 04 80 03 33 1 49 04 80 19 [email protected]
Italy Antonio Romano Luisa Bordoni
39 228 457 301 39 228 457 332
39 228 457 333 [email protected] [email protected]
Scandinavia Per Andersen 45 39 16 22 30 45 39 45 31 18 [email protected]
Germany Alexander Hemzal 49 61 73 70 980 49 61 73 70 98 30 [email protected]
Eastern Europe Steven Frantzen 420 2 573 281 24 420 2 544 073
420 2 573 281 25 420 2 542 940
Middle East and Africa Doug Mc Leod 44 1 987 72 32 44 1 81 747 02 12 [email protected]
Sylvie Merkling 33 1 49 04 80 09 33 1 49 04 80 19
European Quarterly Executive Service Q3 1998 -‐ Belgium
A International Data Corporation -‐ -‐ special report 5
Data Tables Methodology And Definitions IDC’s IT spending market figures are obtained through the review and forecast analysis of IDC’s European Expertise Centres in close cooperation with IDC Europe local analysts. Different methodologies are used for each technology to better reflect market drivers and environment. In particular the key approaches used to size and forecast markets are as follows: • Commercial systems, workstations, personal computers, data
com hardware: data collection of unit shipments and average system prices by model at regional and local level. Assumptions driving forecast models include price changes, new technology launches, markets saturation, installed base renewal rates, emerging new user markets, competition from other technologies.
• Storage: revenue and unit shipments data collection at regional level. Assumptions driving forecast models include price changes, new technology launches, markets saturation, installed base renewal rates.
• Software: revenue data collection at regional and local level by type of application and type of user license. Assumptions driving forecast models include price changes, new technology launches, markets saturation, installed base renewal rates, impact of outsourcing, competition from concurrent technologies/services, piracy rates, user trade-‐off between off-‐the-‐shelf and customised solutions.
• Services: user spending based model combining estimates on supply of services activities cross-‐validated with estimates of end-‐user demand for services categories. The model is based on demographics of companies by vertical industries and employees size classes, combined with parameters related to IT services spending by IS department and business departments by major services categories and activities. Forecasts are extrapolated through year-‐by-‐year update of key parameters. End-‐user model data on size and especially forecasts are cross validated with supply side findings on vendor revenue, IS services supply of skills and average annual charge out rates, key outsourcing contract trends. Hardware installed base evolution and assumptions from estimated impact of new technology also contribute to determining services size and growth trends.
European Quarterly Executive Service Q4 1998 -‐ Belgium
special report -‐ -‐ A International Data Corporation 6
The European Quarterly Executive Service Data Tables provide the latest IDC European Expertise Centres published data. While some technology segments reflect exactly IDC data, for some other some changes have been operated to better reflect IBM internal technology definitions.

European Quarterly Executive Service Q3 1998 -‐ Belgium
A International Data Corporation -‐ -‐ special report 7
Chapter 1 IDC's Perception and Analysis of IT Market Trends in Q3 1998
Highlights • The Belgian economy is posted a healthy growth of 2.2% in
GDP in 1998. Versus 2.9% in 1997. The Federal Plan Bureau expects a 2.2% growth in 1999. The FPB warns nevertheless for an increased savings rate (resulting in lower consumer spending). In that case a 2% growth of GDP would be unlikely.
• This economic expansion may be depending on private consumption, which is set to rise in line with increases in employment and disposable income. The past three years the growth of the GDP decreased from 3.1% tot 2.2% while household savings were at an all time low.
• IDC expects total IT spending to grow by 10.4% in 1998. Belgium’s large companies are engaging in a wave of mergers and acquisitions. This restructuring process, which is being echoed to some extent in the SME segment, will see expenditure on IT increase by 9.7% in 1998.
• Preparations for the Y2K and the Euro are driving investments in software and services. It however remains a temporary issue taking an end in 2000. Since the government imposed the electronic filing of certain employment data (Dimona) starting Q1 1999 Internet, digital certificates and e-‐commerce gained momentum.
• The main obstacle to double digit growth in IT spending is the slow down observed in the server market as vendors reposition their high-‐end and midrange offerings in relation to lower-‐cost platforms.
• The PC market also shows an unusual increase in unit shipments compared to the average for Western Europe. This trend in due to schools spending millions of dollars of government money on pcs, lans and Internet.
Main drivers and Inhibitors in Q3 1998
Economic situation The Belgian economy grew by 2.9% in 1998. Household spending kept in line with 2.8% growth. While economic growth fell from 3% in the prior year, household spending jumped 0.7%. Company investments accelerated 0.9% to 5.3% annual growth. Government investing slowed down drastically from 19.1% growth in 1997 to a mere 6.6%.
European Quarterly Executive Service Q4 1998 -‐ Belgium
special report -‐ -‐ A International Data Corporation 8
So far, the FPB expected a continued growth. According to the National Institute of Statistics (NIS) the number of bankrupties keeps going down with an average of 3% per year. In the construction business however this trend was broken. Combined with the fact that the number of new houses built fell sharply in 1998, this might indicate an imminent end to the increased domestic spending. The bonanzas at initial public offerings illustrate only a conversion from low earning savings into equities with a potential high return. Job-‐creation should contribute substantially to the income growth of households during 1999. Employment should increase by about 28,000 people (or about 0.3%). About a quarter of the job creation can be attributed to special programmes, which are mainly taking place in enterprises. Moreover, wage moderation, as well as further cuts in employers’ contributions to social security contribute to a more labour-‐intensive growth and an improvement of competitiveness. Most job-‐creation however is due to the trade cycle. Structural job-‐creation remains hard to achieve. The business investment rate should continue to climb, but remains relatively low compared to the end of the 80's. The wage evolution in 1999 remains dependent on the "Wage norm". Wage moderation in the neighbouring countries constraints the wage evolution in Belgium. Gross hourly wages in the private sector are expected to increase by 1.2% in real terms in 1999. The risk of wage inflation is therefore limited, even though labour market shortages could emerge. Somewhat stronger import price increases and a slightly positive output gap lead to a small rise in the inflation rates in 1999 (1.3%, compared to 1.1% in 1998). Interest rates remain stable in Euroland. One novelty in Belgium is the sudden availability of private equity and venture capital. Thanks to a recent stream of very successful ipo’s or acquisitions (exits) the rich and affluent open up their stockings and hand over money to high tech startups or spin-‐offs.
Large accounts situation The merger and acquisition wave urged by the creation of Euroland keeps large companies pushing to become bigger within the home country. Increasingly the mergers and acquisitions will cross national borders (the largest Belgian employer Petrofina merged with Total of France). In some cases this can result in fierce acquisition battles and massive layoffs (downsizing). Compared to the third quarter of 1998, many large Belgian companies experience a downward trend in revenue and profit growth. Large companies are the first to be affected by the economic crisis in Asia Latin-‐America and Russia. Often the effect is directly a result of decreased sales in those areas. Increasingly the sales to regions such as the US seem to be affected. Asian products have become much cheaper. Fluctuations of the

European Quarterly Executive Service Q3 1998 -‐ Belgium
A International Data Corporation -‐ -‐ special report 9
exchange rate of the euro versus the dollar might have a positive or negative impact on the trade balance. The proverbial Belgian salesman will have to work overtime. As a result of the financial challenges, large companies tend to get more careful with their IT investments. This may drive some companies towards outsourcing, but for most companies it means a more conservative attitude. Postponing decisions.
Medium accounts situation The number of medium-‐sized industrial companies has grown significantly due to a continued downsizing the past decade. Especially in the automotive and the petrochemical industry a large number of suppliers has nested near giants such as General Motors, Volvo or Ford. The implementation of supply chain management and ERP-‐solutions at these large accounts as triggered an increasing pressure to implement the same solutions in these medium-‐sized companies. ISO9001-‐certification only strengthens this tendency..
Small accounts situation Small companies in Belgium are lagging behind the medium and large companies. These – mostly family businesses -‐ are increasingly experiencing competition from larger companies that have scale advantages. A lot of small companies will have to choose between consolidation or considerable investments. If any, specifically small companies will face problems with year 2000. Adding this to the traditional problems with succession and shrinking margins it seems clear that part of the small accounts will take the first blow went the trade cycle gets a downturn.
Domestic market situation For Belgium 1998 was a good year. Belgium was allowed to enter the euro. Tax revenues were higher than expected and the budget was proclamed to be in control. The Flemish government even bragged about a surplus. The largest political party, CVP, ended the year with an early election campaign advertising that the average Flemish citizen earns 7 percent more than his Dutch neighbor. Opposition countered this by adding “before taxes and social security”. Nevertheless consumer confidence is high. Unemployment decreased by January 1999 to 12.2%. Foreign investments rose considerably (especially in Antwerp and Limburg). The only discordant note on the growing foreign investments came from a minister of the Walloon government. Jean-‐Pierre Vancauwenberghe warned for the perverse effect of attracting foreign industrial companies by offering them guaranteed reductions on social security and taxes to keep the labor-‐cost low. Local governments also fund large investments up to 50%. Existing Belgian companies pay the full price and sponsor in this way their newly arrived competitors. The job-‐creation might not be structural and on the long term result in struggling domestic companies.

European Quarterly Executive Service Q4 1998 -‐ Belgium
special report -‐ -‐ A International Data Corporation 10
Another problem according to the popular entrepreneur and investor Aimé Desimpel is the scarcity of industrial grounds and the number of company sites built in zones reserved for living or recreation. All these factories, warehouses or offices are threatened by demolition at their own expense. The numerous Belgian governments also intend to cut the costly paperwork.
Euro and Year 2000 situation IDC estimates the total Year 2000 problem concerning IT (not including embedded software) to be about BEF 120 Billion. More than 60% of the costs will be internal spending, since most companies are very careful in outsourcing these projects with such a deadly deadline. More than half of the Belgian organizations are planning to solve the Year 2000 problem mainly by implementing Y2K compliant application solutions. This means that a lot of spending to overcome the problem is hidden in projects such as ERP implementation and other application solutions. As IDC expected 1998 proved to be the year of the biggest Y2K activity. Since a lot of companies needed to resolve this before 1999 -‐ “99” is often used as “missing value” or “end of file”-‐ 1999 should show a decrease in large Y2K projects. Cap Gemini already experienced a sharp decline in Y2K revenues in Belgium. Most of it’s Top 500-‐customers dealt with the problems in the first half or 1998. The government keeps campaigning to alert the small and medium sized companies. The result is that more and more other IT projects are being put on hold to solve the Y2K problem first. The federal government itself claims to be on track with the Admi-‐euro and Admi-‐2000 projects. On December 4th the federal government prioritized the Admi-‐euro project by ordering all ICT-‐staff to change their schedules if necessary. Only a limited number of companies converted their savings and bank accounts to the euro. Large and medium sized companies on the other hand did convert faster than expected. The banking industry worked overtime between Christmas and New Year. The euro-‐conversion went flawless. KBC announced that 14,000 bank accounts were converted on New Year’s eve. Mostly big businesses said a spokesman. A survey by the BBL in July showed that small and medium sized enterprises are not that far behind. The survey of 412 SMEs showed that 42% of the respondents with a revenue of more than BEF 150 Million would change its bank accounts into euros compared to 33% of the smaller companies. One fifth of the companies will change at 1-‐1-‐1999, and the other 22% in the course of 1999. The companies will first change the billing and pricing. 56% Intents to bill both in euros and Francs starting 1-‐1-‐1999. Accounting software firm Solid Data planned to organize 3 full day workshops in December, but had to deliver 9 with an average attendance of 100 customers. Apparently a lot of companies considered changing to the euro in 1999. The ones with a fiscal

European Quarterly Executive Service Q3 1998 -‐ Belgium
A International Data Corporation -‐ -‐ special report 11
year starting in April or October 1999 will probably take the leap forward. (e.g. Siemens starts accounting in the euro October 1st 1999). The majority however decided to wait until January 2000 because of the late communication of the official exchange rates. The fact that accounting departments need to finish fiscal year 1998 to be able to start properly with a new (separate) accounting file in euros (the Belgian franc being considered a foreign currency). Adding the fact that January already is a busy month due to VAT-‐filings and a modified social security administration.
Systems Market drivers/inhibitors The high-‐end segment is expected to drop further in unit shipments and value in 1998. CMOS technology is the main reason for strong price decreases in this segment and will continue to drive prices down. Consequently, a lot of the 390 systems will not be reflected in the high-‐end segment but in the midrange segment. With Internet, and e-‐commerce being the driving forces, and with general price declines in the high-‐end segment leading to a different classification of certain systems, the midrange segment is expected to continue this growth in 1998 but only at a moderate level. IDC expects the midrange market to grow by 5.2% while the low-‐end server market will grow by only 4.6%. This slow down in the server market is due in part to vendors having to reposition their UNIX offerings in the face of stronger competition from Windows NT. A similar situation is evident in the workstation market. Although Hewlett Packard announced that their Unix workstations’ segment performed above expectations, Unix workstation growth almost came to a full stop in Q4 1997, In contrast, the personal workstation market (mainly Intel/NT) is being fueled by new models from Compaq, and Hewlett Packard with lower price points. For 1998 the picture will not be much different with Unix workstation shipments showing little or no growth.
Software Market drivers/inhibitors Application tools remain the largest part of total software investments to 2001. The system infrastructure market shows the largest growth, although growth within the different software areas does not differ that much. SMEs are increasingly pushed by suppliers and industrial customers to start implementing application software. In the automotive industry supply chain solutions or ERP packages are gaining momentum in smaller organizations. Another trend being observed is the introduction of ICT-‐solutions in the construction, transport and shipping sectors. New regulation concerning human resources and the compulsory daily electronic filing triggered the demand for HRM-‐applications, Internet-‐access and security software. Suppliers of construction materials such as Dyka (Tessenderlo Group), Desco and Eternit (Etex Group) started distributing custom applications for making specifications. The latter two groups are considering an extranet.

European Quarterly Executive Service Q4 1998 -‐ Belgium
special report -‐ -‐ A International Data Corporation 12
Services Market drivers/inhibitors The Belgian services market is characterized by a dominance of international services vendors. Global companies such as IBM and EDS are the market leaders. The Belgian services market is at risk of being sold even more to foreign companies as the global players are always looking for acquisition. Belgium is seen as a strategic country because of the presence of the EC, and Dutch and French companies see a Belgian acquisition as a first step in international expansion (no language barriers). CMG announced in December to start expanding in Belgium (both through acquisitions and internal growth). But also EDS has announced that it is looking for further Belgian acquisitions. In Q4 Cockerill-‐Sambre sold it’s IBT unit to Sylis from France. Only a few Belgian companies have the power to buy instead of being bought. Real Software started a buying frenzy after its listing. Another important trend has been electronic banking, where Belgian banks are leading in technology. State-‐owned venture capital fund GIMV entered the capital of e-‐banking specialist Fics Group. Fics plans to file for an IPO in 1999. The Belgian outsourcing market will experience a few mega-‐deals in next year. The Flemish government is looking for outsourcing partners and started talking on an exclusive base with Siemens. De Post has decided to outsource the IS department.

European Quarterly Executive Service Q3 1998 -‐ Belgium
A International Data Corporation -‐ -‐ special report 13
Highlights Forecast 1999

European Quarterly Executive Service Q4 1998 -‐ Belgium
special report -‐ -‐ A International Data Corporation 14
Table 1
IT Spending Growth Rate
1 -‐ IT Spending by Technology 1998/97 1999/98 %1997 %1998 %1999
High-‐end Servers (1+M$) -‐6.4% -‐6.7% 2.8% 2.4% 2.0%
Medium-‐end Servers (100k-‐999k$) 35.1% 15.7% 2.5% 3.0% 3.2%
Low-‐end Servers (<100K$) 6.2% 6.0% 4.0% 3.8% 3.7%
PC Servers 28.3% 7.9% 0.7% 0.8% 0.8%
Total Server 10.1% 5.9% 9.2% 9.2% 8.9%
Server Add-‐ons (storage, printers, other add-‐ons) 8.8% 3.6% 5.7% 5.6% 5.3%
Workstations -‐7.7% -‐3.7% 1.5% 1.3% 1.1%
PC Clients 7.9% 4.3% 16.2% 15.9% 15.1%
Total Client 6.5% 3.7% 17.8% 17.2% 16.2%
PC/Ws Add-‐ons (storage,other add-‐ons) 14.2% 10.4% 2.5% 2.6% 2.6%
PC/Ws Printers for Information Only -‐9.2% -‐3.0% 3.3% 2.8% 2.4%
Data Communications Equipment 23.7% 10.7% 4.6% 5.1% 5.2%
Hardware 8.6% 5.0% 43.1% 42.5% 40.7%
System Level Software 13.5% 13.5% 6.2% 6.4% 6.6%
Middleware 12.9% 13.1% 7.3% 7.5% 7.8%
Application Solutions 13.0% 13.1% 11.5% 11.8% 12.2%
Software 13.1% 13.2% 25.1% 25.7% 26.5%
Education and Training 7.1% 11.3% 4.6% 4.5% 4.6%
IT outsourcing 14.6% 14.7% 2.5% 2.6% 2.7%
Systems Integration 7.6% 20.6% 7.6% 7.4% 8.1%
Network outsourcing 10.3% 16.2% 1.1% 1.1% 1.2%
Hardware Maintenance 15.5% 9.5% 8.6% 9.0% 9.0%
Systems Management Network 14.6% 14.7% 0.2% 0.2% 0.2%
Site and Connectivity 21.7% 19.1% 1.0% 1.2% 1.3%
Business Recovery 14.6% 14.7% 0.7% 0.8% 0.8%
Other Services 5.0% 4.6% 5.4% 5.1% 4.9%
Services 10.6% 12.7% 31.8% 31.9% 32.8%
Total 10.4% 9.6% 100.0% 100.0% 100.0%
2 -‐ IT Spending By End-‐user Type 1998/97 1999/98 %1997 %1998 %1999
Large > 1,000 employees 12.6% 10.7% 20.5% 21.0% 21.2%
Small/Medium < 1,000 employees 9.8% 9.3% 74.3% 73.9% 73.7%
Consumer 9.9% 8.9% 5.2% 5.2% 5.1%

European Quarterly Executive Service Q3 1998 -‐ Belgium
A International Data Corporation -‐ -‐ special report 15
Chapter 2 Competitive Environment in Q3 1998
Highlights • Siemens wants to strengthen its position in the business and
government market by branding its refocused business. • Microsoft maintains successful product sales and increases
customers binding by certified training and certification exams on the Belgian market.
• Close co-‐operation with local administrations and extensive shared marketing efforts with retailers, distributors or partners are essential to the business success of both Microsoft and SNI.
Performance of top IT suppliers
Table 3 Belgium
Performance of the Top IT Suppliers, 1997-‐1998
Companies Turnover 1997
US$ Millions
Turnover Growth ( IDC estimates )
Q1 1998 Q2 1998 Q3 1998 Q4 1998 Year 1998
SNI 337 7% 7% 7% 10% 8%
Microsoft 129 25% 25% 30% 35% 30%
Source: International Data Corporation, 1998
Key moves activities
Siemens Nixdorf The Flemish government negotiates exclusively with Siemens for their major outsourcing deal. Siemens has entered the final round in the outsourcing negotiations about the IT of the Flemish government. The involved contract represents a value of BEF 10 Billion (EUR 248 Million). The deal would be for 5 years. According to Siemens, a consortium led by Siemens and supported by KPN Telecom and Belgacom is the only party on the shortlist for providing all telecommunication and information technology at the European Championship to be held in the Benelux in 2000.

European Quarterly Executive Service Q4 1998 -‐ Belgium
special report -‐ -‐ A International Data Corporation 16
The "Vlaamse Dienst voor Arbeidsbemiddeling" (VDAB), the Flemish labour exchange has chosen not to extend the five-‐year outsourcing agreement with EDS. Instead it chooses to use 4 specialized outsourcing partners: -‐ Econocom will be responsible for the IS management -‐ Alcatel: LAN and WAN management -‐ ACSE: application management -‐ Siemens business solutions: infrastructure management
(value BEF 140 Million).
Microsoft Microsoft Benelux launched the Euro Office Plus to help businesses cope with the Y2K and the euro. At the same time Microsoft introduced new consumer software and hardware. New Microsoft software products include new games, graphic software and Microsoft Works, including, amongst others, word processing, database and spreadsheet functionality. New Microsoft hardware includes the Digital Sound System, mice and a new natural keyboard.
Successes, failures and strategy assessment
Siemens Nixdorf Siemens is committed to spread new technology. The new notebook series contains the high-‐end Scenic 800. Siemens wants this machine to show what the company is capable of. The wireless keyboard didn’t only serve for posturing, but seduced the European Commission. EC-‐employees can easily switch between Azerty, Qwerty or Greek keyboards. The company started installing systems at secondary schools in Brussels. The public sector is a stable market to Siemens and the high amount of orders caused by the PC-‐Kadee-‐project of the Flemish government (equipping schools annually with 278 million francs worth of computers and services; giving schools a free choice to spend the money) even strengthened their market share. The company mainly generates growth in the business market. It is especially strong in servers. The Siemens Groep in Belgium reported a turnover of 53,270 million BEF. For the first time in four year the number of employees increased (from 6,320 in 1997 to 6457). Investments grew even faster. Siemens invested 2.5 billion francs compared to 2 billion francs in 1997. The largest part of the investments went into Siemens-‐Nixdorf (772 million francs). Spending on R&D jumped to an all-‐time high of 3.8 billion francs since its first presence in Belgium a century ago. In the break-‐up of the turnover information technology accounts for 21% and telecommunications for 33%. Siemens announced that 70% of the turnover was realized with products and systems that didn’t exist five years ago. Another factoid of importance is that 30% of the
European Quarterly Executive Service Q3 1998 -‐ Belgium
A International Data Corporation -‐ -‐ special report 17
turnover in Belgium and Luxemburg is destined for export. Siemens-‐Nixdorf’s orders grew 20% in 1998.
Microsoft Microsoft started an aggressive certification-‐policy. Through a closely monitored group of training companies it tries to set a standard with the Microsoft certified professionals (MCP). Only a few education companies went along. Trainers have to be employed (not freelancing) and Microsoft provides the manuals and courses. Flexcom from Malines gives these courses and Sylvan Prometric takes the exams. Contrary to the Dutch market employees still don’t ask for certification. Only a limited number of Belgian employers considers certification as a tool for lowering employee turnover-‐rates. Some as Unisys do. Microsoft’s training programmes have proved to be successful not only on the Dutch, but also on the Belgian market. Through the European Scholar Program, Microsoft co-‐operates with employment agencies all over Europe to offer unemployed the chance to get retrained as Microsoft Certified Professionals (MCPs). VDAB entered a number of these projects. Further education is offered to become system specialist (Microsoft Certified Systems Engineer) or developer (Microsoft Certified Solution Developer). In 1998 a total of 500 unemployed in the Netherlands and 600 unemployed in Belgium will be trained as part of the European Scholar Program. Unisys together with the VDAB and the BDAB (Brussels flavor of VDAB) continues another ongoing project to retrain longtime unemployed.
IDC Recommendations for IBM Strategy for the Next Quarter • There is a continuing demand for integrated IT solutions on
the Belgian market. Companies are demanding solution bundles instead of separate technologies to effectively deal with the problems within their business.
• Vertical market knowledge is becoming increasingly important now that companies demand solutions that have been tailored to the business processes in their specific branch of industry. Companies let the choice of their competitors influence their choice. Time to market becomes more and more important.
• Considering that skills are the key to success in the IT industry, the shortage of skilled IT personnel on the labor market may be considered as a serious problem, that deserves significant attention. Managing the turnover of employees and educating them might prove to be less expensive than headhunting. In Belgium a company can recuperate 50% of all training costs when an employee leaves (if it’s written in the contract). This cost might be a good dissuasive.
European Quarterly Executive Service Q4 1998 -‐ Belgium
special report -‐ -‐ A International Data Corporation 18
• Be careful with hiring large numbers of staff for secondment. The market for secondment will be the first to feel an economic slowdown.
• Because the unions consider IBM’s flexible pay as a good test-‐case, strikes might become an increasing risk. Pickets with agitators from outside the company can be a threat. IBM could lose its status of employer of preference with the already scarce ict-‐staff. A negative perception of the social peace within IBM can deter prospective customers.
In response to the various opportunities and threats in the IT market, IBM should focus on expertise in vertical markets, bundled solutions and the recruitment of highly qualified IT personnel. Alliances with strategic partners will be crucial in dealing effectively with these issues.

European Quarterly Executive Service Q3 1998 -‐ Belgium
A International Data Corporation -‐ -‐ special report 19
Chapter 3 Channels Environment in Q3 1998
Highlights • Corporate demands for hardware configuration, software
installation, network integration and cabling, and desktop services are now the mainstay of Belgium’s large resellers. Despite the slow down in the market for PC servers and desktops and the strong challenge from Dell, the corporate resellers are experiencing strong growth.
• As forecast last quarter, channel consolidation is gathering pace. During Q3 MBS announced its merger with Dutch reseller the Computer Company and became a member of a new global reseller association, IT International.
• CHS’s abortive bid to acquire Vobis has not had any measurable impact on the overall performance of the retail channel. The situation is still not clear, however, as Metro is reported to be still looking to sell its computer store business
• The leading distributors will experience strong growth in 1998 because of the sustained demand from business and the ongoing trend to rationalize IT purchasing by selecting preferred suppliers.
• Although Ingram Micro’s European headquarters are situated in Belgium the distributor has clearly opted for the Netherlands as the hub of its Pan-‐European assembly and distribution activities.
• Ingram Micro retains the advantage in the assembly of white boxes since CHS has been deprived of Vobis' PC assembly capacity. This lead is not likely to last long. IDC believes that, given CHS's stated ambitions on the white box market, the distributor will either acquire another amajor assembler or build its own production facility.
Overview of Major Channel Trends in Belgium in Q3 1998 During Q3 most PC vendors as well as PC distributors/retailers targeted the SME market. Compaq (whole Benelux) and Siemens Nixdorf (Belgium) led the most aggressive campaigns. SNI's presence on the PC market has been stimulated by such campaigns and by the company’s current distribution strategy, which is based on indirect sales through various distribution partners. SNI has also been successful in the widespread deployment of its products in the field of computer services with high added value. In Belgium the IRS implemented a tight fiscal policy on PC Private Purchase schemes in which the employee had to use the new PC

European Quarterly Executive Service Q4 1998 -‐ Belgium
special report -‐ -‐ A International Data Corporation 20
for educational purposes. While the larger resellers may also benefit from local variants of the employee PC purchase schemes being implemented by large corporations in Sweden and the Netherlands, the channel as a whole will have to fight hard to maintain revenue growth. Consumer Internet penetration is not yet that high in Belgium but increasing acceptance of E-‐Commerce in general can be noticed, partly due to low sales costs involved. Once the Internet receives more recognition as a viable distribution channel, the small dealer market is likely to become even more fragmented. Despite the dealer channel’s unhealthy condition the retailers are not yet large enough to seriously weaken its hold on the SOHO market. The prospect of major employee PC purchasing schemes could have damaging results on the sales of both these channels to the home market in Q4 1998. The leading distributors will also experience strong growth in 1998 because of the sustained demand from business and the ongoing trend to rationalize IT purchasing by selecting preferred suppliers. Channel assembly programs have been slow to develop in Belgium despite chronic problems of product availability, with the market fluctuating between scarcity and glut due to dumping of excess stock. The CTO programs being implemented by the leading PC vendors in the Benelux region should start to have a positive impact on the availability of products on the Belgian market in 1998. Ingram Micro, which has its European Headquarters in Belgium, is expected to establish an assembly facility on the Continent in 1998. During Q3 most PC vendors as well as PC distributors/retailers targeted the SME market. Compaq (whole Benelux) and Siemens Nixdorf (Belgium) led the most aggressive campaigns. SNI's presence on the PC market has been stimulated by such campaigns and by the company’s current distribution strategy, which is based on indirect sales through various distribution partners. SNI has also been successful in the widespread deployment of its products in the field of computer services with high added value.
Systems Integrators -‐ Trends and Performance in Q3 1998 Systems Integrators and VARs and will be the principal beneficiaries of IT investment in software and services in 1998. The leading corporate resellers should also encounter strong growth despite the slow down in the market for PC servers and desktops and Dell’s rapid growth. This will nevertheless prompt both diversification and further channel consolidation. The main Systems Integrators such as EDS, Andersen Consulting, Origin, and Wang competing for major solutions and platform integration contracts, notably in the banking, telecommunications and transport sectors. The complexity of such projects is encouraging them to work with large VARs and Corporate Resellers such as Dolmen and Systemat.

European Quarterly Executive Service Q3 1998 -‐ Belgium
A International Data Corporation -‐ -‐ special report 21
Simac Techniek, a publicly quoted company, is one of the leading specialists in the Benelux in network and system integration, network services, maintenance and consulting. The company registered turnover growth of 67% in 1997. Much of this growth came from large outsourcing contracts and partnership with software vendor Baan. The company also acquired several companies including HA, IC&C, Lorje, Netbuilding, and TSS. This strong performance enabled it to consolidate its presence in the Benelux region as well as in France, Germany and the UK.
Table 1 Belgium
Performance of the Top 3 Systems Integrators, 1997-‐1998
Companies Turnover 1997 US$ Millions IDC estimate
Turnover Growth ( IDC estimates )
Q1 1998 Q2 1998 Q3 1998 Q4 1998 Year 1998
Syntegra 710 40% 35% 35% 45% 40%
Simac Techniek 294 90% 85%/A 80% 55% 85%
N/A N/A N/A N/A N/A N/A N/A
Source: International Data Corporation, 1998
Value Added Providers -‐ Trends and Performance in Q3 1998 IDC is expecting an average turnover growth of between 25% to 30% for the VAR channel in 1998. The major VARs such as Dolmen, Orda-‐B, Axi, Experteam, Comsol, Europdata Systems, DSC and Axxam are experiencing strong demand from government and international organisations in connection with Euro, the Year 2000, the integration of UNIX and mainframe systems and the migration from 16-‐bit to 32-‐bit WiNTel solutions. Costs are comparatively high since their service strategy is geared to providing a full range of services to meet multi-‐language requirements (Flemish, Wallon and English). This fragmentation of an already small market between three official languages enables smaller VARs serving regional clienteles to survive and IDC expects the number of VARs to increase significantly in1998. The appearance of new Telcos and ISPs, both at the national and regional level (notably in Flanders), is creating new business opportunities for VARs and distributors such as Telindus specializing in network integration and telephony. Dolmen Computer Applications, spawned from the DP-‐department of the parent the Colruyt group, focuses on offering total solutions in PC, midrange and mainframe environments. In July 1997 the company’s external customer activities, which grew by almost 16% to attain US$108 million in 1997, were reallocated to a separate limited company, Dolmen Engineering. Dolmen

European Quarterly Executive Service Q4 1998 -‐ Belgium
special report -‐ -‐ A International Data Corporation 22
Computer Applications has subsidiaries in the Netherlands and France and is the Belgian partner of the GlobalServe reseller assocation.
Table 2 Belgium
Performance of the Top 3 Value Added Providers, 1997-‐1998
Companies Turnover 1997 US$ Millions IDC estimate
Turnover Growth ( IDC estimates )
Q1 1998 Q2 1998 Q3 1998 Q4 1998 Year 1998
Dolmen Computer Applications
139.8 15% 10% 15% 10% 13%
Axxam N/A N/A N/A N/A N/A N/A
Telindus N/A N/A N/A N/A N/A N/A
Source: International Data Corporation, 1998
Resellers -‐Trends and Performance in Q3 1998 Most of the leading Corporate Resellers belong to the ACCODIT trade association. This group will be the driving force behind channel growth which will focus increasingly around telecommunications and network integration and management. Corporate demands for hardware configuration, software installation, network integration and cabling are now the mainstay of Info'Products (with an estimated turnover of US$33 million in 1997) and other large resellers. Few Belgian players, however, have the financial resources to fuel expansion and only Systemat& Datarelay, after a successful flotation on the Brussels stock exchange in April 1997, has shown any signs of strongly developing its activities throughout the Benelux countries and into neighboring France. Systemat & Datarelay is a member and shareholder of the ICG internal reseller association and is responsible for serving Belgium and Luxembourg. Systemat’s bid to accelerate its European expansion by buying up Ista, France’s leading reseller, was countered by GE Capital IT Solutions. But Belgium’s largest reseller is reported to be still on the lookout for suitable partners in France. Parallel to this, the company continues to diversify its service activities following the acquisition of training company Software Efficiency and the creation of subsidiaries Infomat and Syremat, its leasing department. Given the continuing strong demand from its large account and SME customers, the reseller expects its turnover to increase from US$165 million in 1997 to approximately US$211 million in 1998. In order to match its logistics capacity with its planned growth, the company is investing heavily in its Technical Integration Center (TIC) situated

European Quarterly Executive Service Q3 1998 -‐ Belgium
A International Data Corporation -‐ -‐ special report 23
at Jument. Enhancing the TIC was a prerequisite for becoming IBM’s first channel assembly partner in Belgium. The turnover rate in the dealer channel remains high. Most companies prefer working with stable business partners. As the majority of the smaller dealers lack the skills and the financial solidity to play a role in the large and medium accounts market they have lost direct relationships with the leading vendors. Their heavy dependence on PC hardware products implies a further weakening of their financial situation in 1998 and the likelihood of numerous mergers and acquisitions. Early in Q3 reseller MBS announced its merger with Dutch reseller/retailer the Computer Company and became a member of a new global reseller association, IT International. Prior to the takeover, MBS employed 170 people and was expecting a turnover of about US$65 million in 1998. The new Computer Company/MBS employs 750 people and expects a turnover of US$355 million.
Table 3 Belgium
Performance of the Top 3 Resellers, 1997-‐1998
Companies Turnover 1997 US$ Millions IDC estimate
Turnover Growth ( IDC estimates )
Q1 1998 Q2 1998 Q3 1998 Q4 1998 Year 1998
Systemat & Datarelay 165 25% 25% 25% 29% 26%
Econocom 110 17% 17% 20% 25% 20%
ECS 56 15% 15% 10% 12% 13%
Source: International Data Corporation, 1998
Retailers -‐ Trends and Performance in Q3 1998 The Belgian retail channel already has a strong international flavor as companies such as Metro, Vobis, FNAC, Carrefour and Auchan compete with local players such as Vandea Borre in the consumer market. This channel will find it harder to grow revenue in 1998 as the leading PC vendors put sub $1000 on the market and as retail franchise chains like Exell ( with 25 outlets covering most of Belgium ) target the SOHO and VSB market. The possibility of major PC purchase schemes in the second half of 1998 constitutes another threat to the retail channel’s sales to consumers CHS’s abortive attempt to purchase Vobis has had negligible impact on the Belgian retail channel but it has raised the possibility of a major shake up in the future. Since it began operating in Belgium in 1991, Vobis has slowly built up a network of 15 stores ( 10 affiliates, 3 franchises and 2 Superstores ).
European Quarterly Executive Service Q4 1998 -‐ Belgium
special report -‐ -‐ A International Data Corporation 24
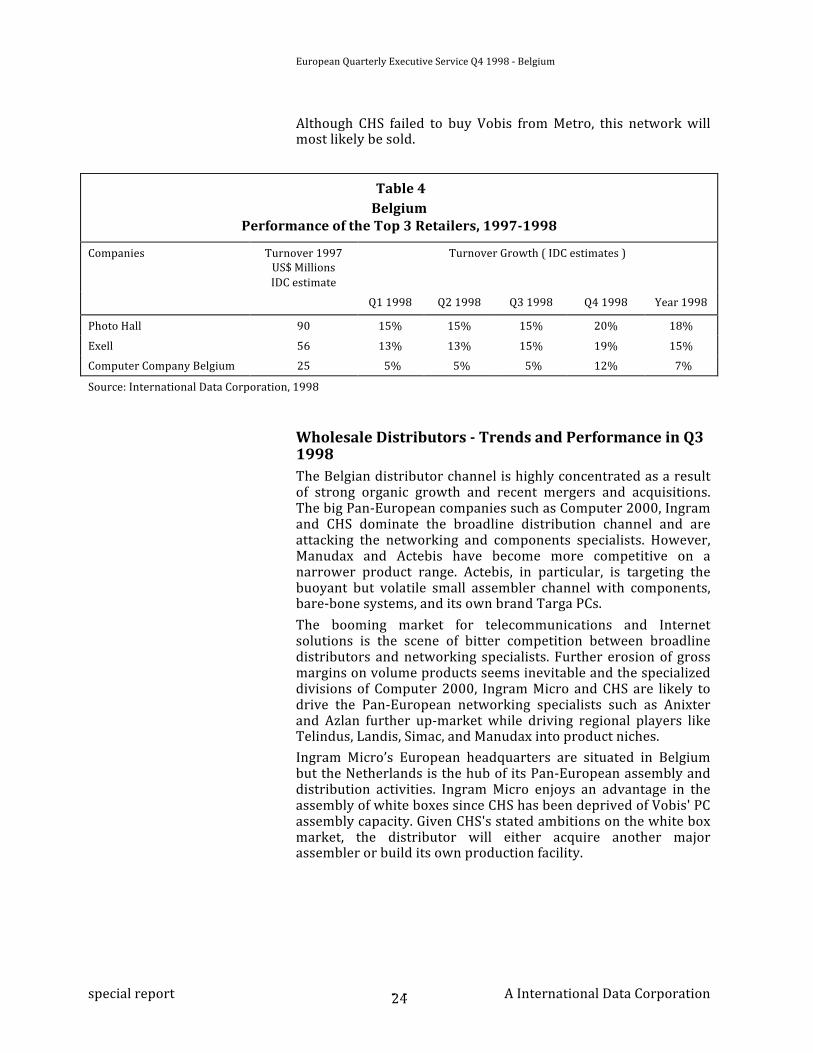
Although CHS failed to buy Vobis from Metro, this network will most likely be sold.
Table 4 Belgium
Performance of the Top 3 Retailers, 1997-‐1998
Companies Turnover 1997 US$ Millions IDC estimate
Turnover Growth ( IDC estimates )
Q1 1998 Q2 1998 Q3 1998 Q4 1998 Year 1998
Photo Hall 90 15% 15% 15% 20% 18%
Exell 56 13% 13% 15% 19% 15%
Computer Company Belgium 25 5% 5% 5% 12% 7%
Source: International Data Corporation, 1998
Wholesale Distributors -‐ Trends and Performance in Q3 1998 The Belgian distributor channel is highly concentrated as a result of strong organic growth and recent mergers and acquisitions. The big Pan-‐European companies such as Computer 2000, Ingram and CHS dominate the broadline distribution channel and are attacking the networking and components specialists. However, Manudax and Actebis have become more competitive on a narrower product range. Actebis, in particular, is targeting the buoyant but volatile small assembler channel with components, bare-‐bone systems, and its own brand Targa PCs. The booming market for telecommunications and Internet solutions is the scene of bitter competition between broadline distributors and networking specialists. Further erosion of gross margins on volume products seems inevitable and the specialized divisions of Computer 2000, Ingram Micro and CHS are likely to drive the Pan-‐European networking specialists such as Anixter and Azlan further up-‐market while driving regional players like Telindus, Landis, Simac, and Manudax into product niches. Ingram Micro’s European headquarters are situated in Belgium but the Netherlands is the hub of its Pan-‐European assembly and distribution activities. Ingram Micro enjoys an advantage in the assembly of white boxes since CHS has been deprived of Vobis' PC assembly capacity. Given CHS's stated ambitions on the white box market, the distributor will either acquire another major assembler or build its own production facility.

European Quarterly Executive Service Q3 1998 -‐ Belgium
A International Data Corporation -‐ -‐ special report 25
Table 5 Belgium
Performance of the Top Wholesale Distributors, 1997-‐1998
Companies Turnover 1997 US$ Millions IDC estimate
Turnover Growth ( IDC estimates )
Q1 1998 Q2 1998 Q3 1998 Q4 1998 Year 1998
Ingram Micr 246 20% 20% 25% 25% 23%
Computer 2000 223 15% 15% 18% 23% 20%
Manudax 145 13% 13% 15% 24% 18%
Source: International Data Corporation, 1998

European Quarterly Executive Service Q4 1998 -‐ Belgium
special report -‐ -‐ A International Data Corporation 26
Table 6 Belgium
High-‐end Servers ( 1+M$)
IT Spending by Distribution Channel
% Share 1997
% Share 1998
Total 100.0 100.0
Direct Channels 99.7 99.5
Direct Response 0.0 0.0
Other Direct 99.7 99.5
Indirect Channels 0.3 0.5
Systems Integrators 0.0 0.0
Value Added Providers 0.0 0.0
Corporate Resellers 0.3 0.5
Dealers 0.0 0.0
Retailers 0.0 0.0
Wholesale Distributors 0.0 0.0
Source: International Data Corporation, 1998
Table 7 Belgium
Midrange Servers (100k-‐999k$)
IT Spending by Distribution Channel
% Share 1997
% Share 1998
Total 100.0 100.0
Direct Channels 85.6 85.4
Direct Response 0.0 0.0
Other Direct 85.6 85.4
Indirect Channels 14.4 14.6
Systems Integrators 12.1 11.9
Value Added Providers 1.1 1.3
Corporate Resellers 1.2 1.4
Dealers 0.0 0.0
Retailers 0.0 0.0
Wholesale Distributors 1.2 1.3
Source: International Data Corporation, 1998

European Quarterly Executive Service Q3 1998 -‐ Belgium
A International Data Corporation -‐ -‐ special report 27
Table 8 Belgium
Low-‐end Servers (<100K$)
IT Spending by Distribution Channel
% Share 1997
% Share 1998
Total 100.0 100.0
Direct Channels 36.7 35.3
Direct Response 0.1 0.2
Other Direct 36.1 34.3
Indirect Channels 63.3 64.7
Systems Integrators 9.3 9.6
Value Added Providers 19.8 20.1
Corporate Resellers 23.0 23.6
Dealers 11.2 11.4
Retailers 0.0 0.0
Wholesale Distributors 25.7 26.8
Source: International Data Corporation, 1998
Table 9 Belgium PC Servers
IT Spending by Distribution Channel
% Share 1997
% Share 1998
Total 100.0 100.0
Direct Channels 10.6 9.5
Direct Response 4.7 5.0
Other Direct 5.9 4.5
Indirect Channels 89.4 90.5
Systems Integrators 5.4 5.3
Value Added Providers 26.7 27.0
Corporate Resellers 28.2 28.6
Dealers 28.8 29.2
Retailers 0.3 0.4
Wholesale Distributors 43.3 45.2
Source: International Data Corporation, 1998
European Quarterly Executive Service Q4 1998 -‐ Belgium
special report -‐ -‐ A International Data Corporation 28
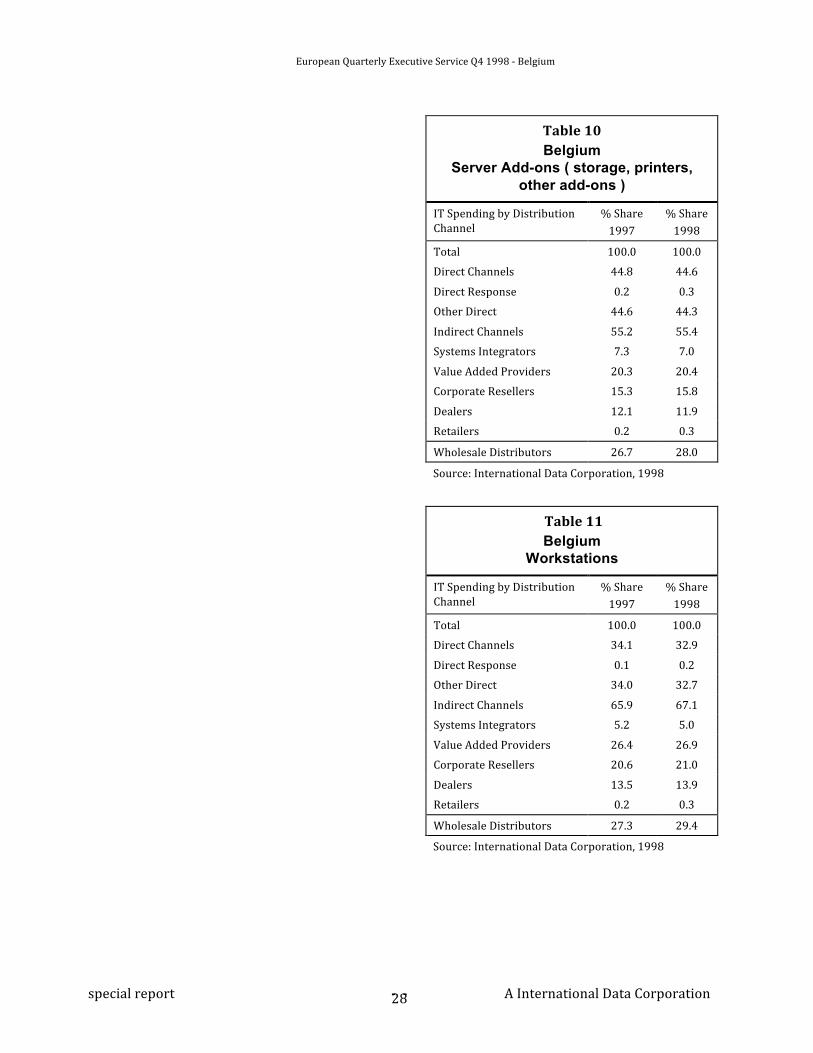
Table 10 Belgium
Server Add-ons ( storage, printers, other add-ons )
IT Spending by Distribution Channel
% Share 1997
% Share 1998
Total 100.0 100.0
Direct Channels 44.8 44.6
Direct Response 0.2 0.3
Other Direct 44.6 44.3
Indirect Channels 55.2 55.4
Systems Integrators 7.3 7.0
Value Added Providers 20.3 20.4
Corporate Resellers 15.3 15.8
Dealers 12.1 11.9
Retailers 0.2 0.3
Wholesale Distributors 26.7 28.0
Source: International Data Corporation, 1998
Table 11 Belgium
Workstations
IT Spending by Distribution Channel
% Share 1997
% Share 1998
Total 100.0 100.0
Direct Channels 34.1 32.9
Direct Response 0.1 0.2
Other Direct 34.0 32.7
Indirect Channels 65.9 67.1
Systems Integrators 5.2 5.0
Value Added Providers 26.4 26.9
Corporate Resellers 20.6 21.0
Dealers 13.5 13.9
Retailers 0.2 0.3
Wholesale Distributors 27.3 29.4
Source: International Data Corporation, 1998
European Quarterly Executive Service Q3 1998 -‐ Belgium
A International Data Corporation -‐ -‐ special report 29
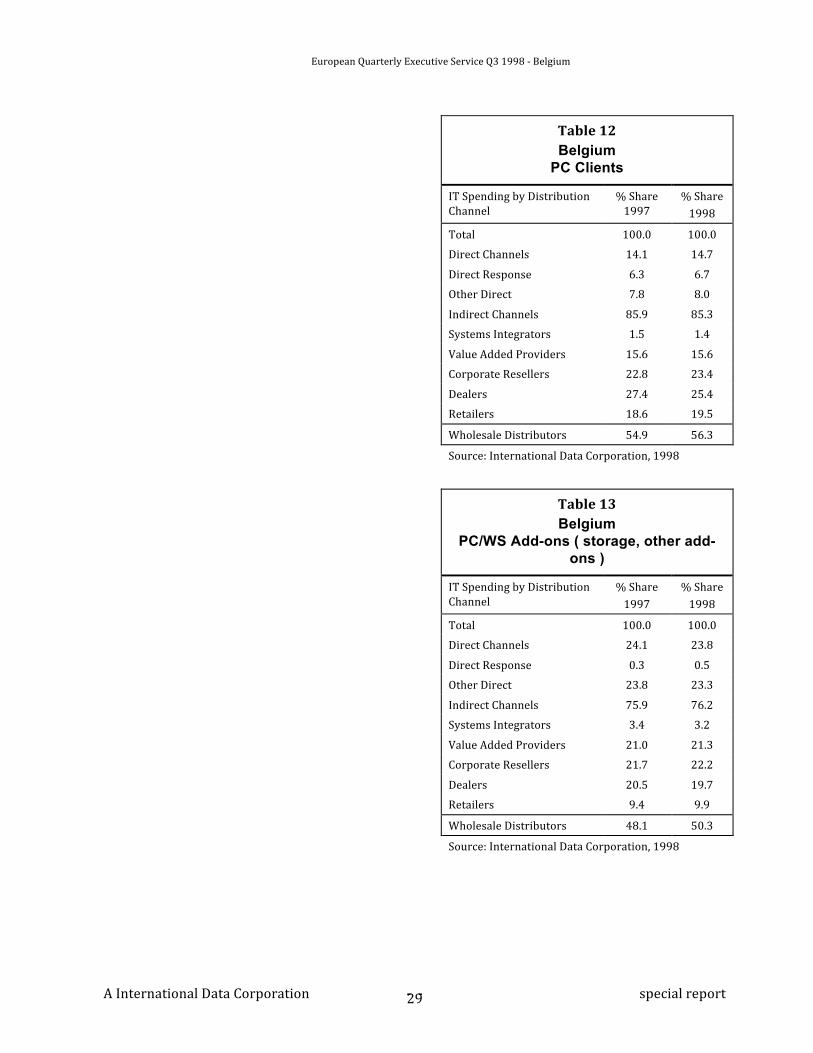
Table 12 Belgium
PC Clients
IT Spending by Distribution Channel
% Share 1997
% Share 1998
Total 100.0 100.0
Direct Channels 14.1 14.7
Direct Response 6.3 6.7
Other Direct 7.8 8.0
Indirect Channels 85.9 85.3
Systems Integrators 1.5 1.4
Value Added Providers 15.6 15.6
Corporate Resellers 22.8 23.4
Dealers 27.4 25.4
Retailers 18.6 19.5
Wholesale Distributors 54.9 56.3
Source: International Data Corporation, 1998
Table 13 Belgium
PC/WS Add-ons ( storage, other add-ons )
IT Spending by Distribution Channel
% Share 1997
% Share 1998
Total 100.0 100.0
Direct Channels 24.1 23.8
Direct Response 0.3 0.5
Other Direct 23.8 23.3
Indirect Channels 75.9 76.2
Systems Integrators 3.4 3.2
Value Added Providers 21.0 21.3
Corporate Resellers 21.7 22.2
Dealers 20.5 19.7
Retailers 9.4 9.9
Wholesale Distributors 48.1 50.3
Source: International Data Corporation, 1998

European Quarterly Executive Service Q4 1998 -‐ Belgium
special report -‐ -‐ A International Data Corporation 30
Table 14 Belgium
PC/WS Printers
IT Spending by Distribution Channel
% Share 1997
% Share 1998
Total 100.0 100.0
Direct Channels 11.6 12.1
Direct Response 0.9 0.9
Other Direct 10.8 11.2
Indirect Channels 88.4 87.9
Systems Integrators 0.6 0.5
Value Added Providers 19.1 18.8
Corporate Resellers 23.4 23.1
Dealers 22.3 22.0
Retailers 23.0 23.5
Wholesale Distributors 55.0 56.7
Source: International Data Corporation, 1998
Table 15 Belgium
Data Communication Equipment
IT Spending by Distribution Channel
% Share 1997
% Share 1998
Total 100.0 100.0
Direct Channels 25.3 24.7
Direct Response 0.1 0.2
Other Direct 25.2 24.5
Indirect Channels 74.7 75.3
Systems Integrators 0.5 0.4
Value Added Providers 23.4 23.4
Corporate Resellers 25.5 26.3
Dealers 24.1 23.9
Retailers 1.2 1.3
Wholesale Distributors 58.6 59.0
Source: International Data Corporation, 1998

European Quarterly Executive Service Q3 1998 -‐ Belgium
A International Data Corporation -‐ -‐ special report 31
Table 16 Belgium
System Level Software
IT Spending by Distribution Channel
% Share 1997
% Share 1998
Total 100.0 100.0
Direct Channels 29.7 29.4
Indirect Channels 70.3 70.6
Source: International Data Corporation, 1998
Table 17 Belgium
Middleware
IT Spending by Distribution Channel
% Share 1997
% Share 1998
Total 100.0 100.0
Direct Channels 69.8 69.1
Indirect Channels 30.2 30.9
Source: International Data Corporation, 1998
Table 18 Belgium
Application Solutions
IT Spending by Distribution Channel
% Share 1997
% Share 1998
Total 100.0 100.0
Direct Channels 33.2 32.2
Indirect Channels 66.8 67.8
Source: International Data Corporation, 1998
European Quarterly Executive Service Q4 1998 -‐ Belgium
special report -‐ -‐ A International Data Corporation 32
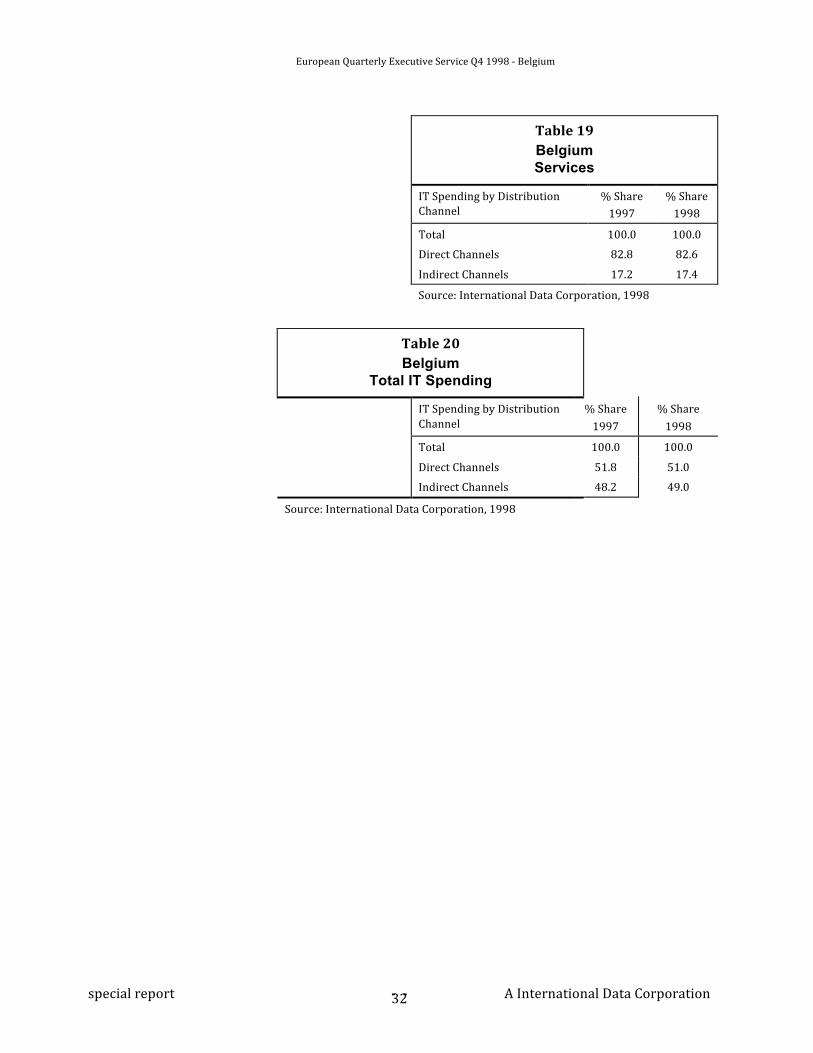
Table 19 Belgium Services
IT Spending by Distribution Channel
% Share 1997
% Share 1998
Total 100.0 100.0
Direct Channels 82.8 82.6
Indirect Channels 17.2 17.4
Source: International Data Corporation, 1998
Table 20 Belgium
Total IT Spending
IT Spending by Distribution Channel
% Share 1997
% Share 1998
Total 100.0 100.0
Direct Channels 51.8 51.0
Indirect Channels 48.2 49.0
Source: International Data Corporation, 1998

European Quarterly Executive Service Q3 1998 -‐ Belgium
A International Data Corporation -‐ -‐ special report 33