Quarterly Report - MediaNama
18
-
Upload
khangminh22 -
Category
Documents
-
view
2 -
download
0
Transcript of Quarterly Report - MediaNama


Quarterly Report Mar’21 Page 2 of 18
Unless stated otherwise, the financial data in this report is derived from our un-audited / audited financial
statements prepared in accordance with Ind AS adopted in Q1FY17, with transition date of April 01, 2015. Our
financial year ends on 31st March of each year, so all references to a particular financial year are to the twelve
months ending March 31 of that year. In this report, any discrepancies in any table between the total and the sums
of the amounts listed are due to rounding-off. There are significant differences between Indian GAAP, IFRS, Ind AS
and U.S. GAAP; accordingly, the degree to which the Ind AS financial statements will provide meaningful
information is dependent on the reader’s familiarity with Indian accounting practices. Any reliance by persons not
familiar with Indian accounting practices on the financial information presented in this report should accordingly
be limited. We have not attempted to explain such differences or quantify their impact on the financial data
included herein.
Unless stated otherwise, industry data used throughout this report has been obtained from industry publications.
Industry publications generally state that the information contained in those publications has been obtained from
sources believed to be reliable but that their accuracy and completeness are not guaranteed and their reliability
cannot be assured. Although we believe that industry data used in this report is reliable, it has not been
independently verified.
Actual results may differ materially from those suggested by the forward-looking statements due to risks or
uncertainties associated with our expectations with respect to, but not limited to, our ability to successfully
implement our strategy, our growth and expansion, technological changes, our exposure to market risks, general
economic and political conditions in India which have an impact on our business activities or investments, the
monetary and interest policies of India, inflation, deflation, unanticipated turbulence in interest rates, foreign
exchange rates, equity prices or other rates or prices, the performance of the financial markets in India and
globally, changes in domestic and foreign laws, regulations and taxes and changes in competition in the industry.
1. An Overview 3
2. Our Strengths 6
3. Financial Highlights 9
4. Key Performance Indicators 11
5. Management Discussion & Analysis 12
6. Stock Market Highlights 15
7. Shareholding Pattern 15
8. Glossary 16

Quarterly Report Mar’21 Page 3 of 18
Vodafone India Limited has merged into Idea Cellular Limited (ICL) on August 31, 2018. Consequently,
the name of the company has been changed from ICL to Vodafone Idea Limited. Vodafone Idea Limited
is an Aditya Birla Group and Vodafone Group partnership. The company offers Voice and Data services
on 2G, 3G and 4G technologies across 22 service areas in India. With its large spectrum portfolio to
support the growing demand for data and voice, the company is committed to deliver delightful
customer experiences and contribute towards creating a truly ‘Digital India’ by enabling millions of
citizens to connect and build a better tomorrow. The company is developing world-class infrastructure
to introduce newer and smarter technologies, making both retail and enterprise customers future ready
with innovative offerings, conveniently accessible through an ecosystem of digital channels as well as
extensive on the ground presence. The company is listed on the National Stock Exchange (NSE) and the
BSE in India.
Promoter Groups
Vodafone Group is a leading technology communications company in Europe and Africa. The Group is
the largest mobile and fixed network operator in Europe and a leading global IoT connectivity provider.
The Group operates mobile and fixed networks in 21 countries and partners with mobile networks in 49
more. As of March 31, 2021, the group had over 300 million mobile customers, more than 28 million
fixed broadband customers, over 22 million TV customers and connected more than 123 million IoT
devices.
Aditya Birla Group, with a turnover of US$46 billion (FY20), is one of the largest business groups in India.
The Aditya Birla Group is a leading multinational conglomerate, in the league of Fortune 500, with
operations in 36 countries and a presence spanning diverse sectors like cement, metals and mining,
mobile telecommunications, fashion retail, financial services, textiles, carbon black, trading, chemicals
and renewables. Over 50% of the Group’s revenues flow from overseas operations across North and
South America, Africa and Asia.

Quarterly Report Mar’21 Page 4 of 18
Corporate Structure
Other subsidiaries (Insignificant business / non-operating)
Vodafone Idea Technology Solutions Limited
Connect India Mobile Technologies Private Limited
Vodafone M-Pesa Limited
Business Segments
a. Mobility
Voice Business – Vodafone Idea offers Voice services in all 22 service areas. The company covers
more than 1.2 billion Indians in over 487,000 Census towns and villages with its Voice services.
The company has also introduced 4G VoLTE across all 22 circles to provide enhanced voice
experience to its 4G subscribers as well as Voice over WiFi (VoWiFi) in select circles.
Broadband Services – The broadband services of Vodafone Idea on 3G and 4G platforms are
available in all 22 service areas of India. The company’s broadband coverage is available in over
331,000 Census towns and villages with population coverage of more than a billion Indians. The
population coverage on 4G is more than 1 billion as well, as of March 31, 2021.
Content and Digital Offerings – Vodafone Idea Limited has launched several digital initiatives to
address the changing requirements of today’s digital society enabling individuals and enterprises
to get a range of benefits and value-adds. Vi will offer not just enriched connectivity but also an
array of digital products and services to complement the core business.
To provide best in class content to its customers through the application Vi Movies and TV, the
company has tied up with various content creators and OTT apps like Voot Select, Fireworks, Sun
NXT, Shemaroo Me, Hoichoi, Lionsgate Play, Hungama, TV Today, Discovery and others. The app
provides a range of content including Movies, Live TV, TV shows, latest originals and short formats
Vodafone
Idea
Manpower
Services
Limited
Vodafone Idea
Business
Services
Limited
Vodafone Idea
Communication
Systems Limited
Vodafone Idea
Shared
Services
Limited
You
Broadband
India Limited
Vodafone
Foundation
Vodafone Idea
Telecom
Infrastructre
Limited
Firefly
Networks
Limited
Manpower
Services
Data Centre,
OSP Services
Trading of
communication
devices
Shared
service center
Fixed line
Broadband
Section 8
Company -
CSR
activities
Fibre assets
Wi-Fi Site
Acquisitions,
Installation,
Maintenance

Quarterly Report Mar’21 Page 5 of 18
videos in 16+ languages. Additionally, the company has tie ups with leading content providers like
Amazon Prime, Hotstar, Zee5 and Netflix for its premium customers.
In recent partnerships, Vi has collaborated with Hungama to launch Pay Per View Model for
premiering digital films from Hollywood at a onetime cost. This unique offering is available only
on Vi amongst telecom operators and provides a library of 380 titles in 4 languages. This offering
is available for post-paid android users.
VIL has also entered into strategic partnerships with key players in the areas of Learning &
Upskilling, Health & Wellness, and Business help to offer unique benefits to the new age
customers. The company has forged partnerships with upGrad, Udemy, Pedagogy, cure.fit, 1mg,
MFine, Eunimart, Hubbler and Fiskl - and plans to on-board more partners under each of these
areas to enable Vi users get exclusive offers from these players.
b. Enterprise Services
Vi business provides total communications solutions to empower global and Indian corporations,
public sector & government bodies, small & medium enterprises and start-ups. With market-leading
enterprise mobility, robust fixed line connectivity, world-class IoT solutions and insightful business
analytics & digital solutions, the company brings the smartest and newest technologies to serve
businesses in the digital era. With the advantage of its global expertise and knowledge of local
markets, Vi business endeavours to be a trusted and valued partner for businesses in a digital world.

Quarterly Report Mar’21 Page 6 of 18
Spectrum Portfolio
Vodafone Idea has a total of 1,768.4 MHz of spectrum across difference frequency bands out of
which 1,738.4 MHz spectrum is liberalised and can be used towards deployment of any technology
(2G, 3G, 4G or 5G). Vi recently acquired 23.6 MHz of spectrum in March 2021 auction. With this
spectrum purchase, 1,340.4 MHz of spectrum has been acquired through auctions between year
2014 and 2021 and is having the validity until 2034 to 2041. This large spectrum portfolio across 22
circles allows the company to create enormous broadband capacity and ability to offer superior
customer experience.
Large Customer Base
Vodafone Idea had over 267.8 million subscribers as of March 31, 2021. As the company is
expanding its broadband coverage and capacity, specifically 4G, this large subscriber base
provides a great platform for the company to upgrade voice only customers to users of data
services and digital offerings.
Andhra Pradesh 5.0 6.6 5.0 - 10.0 43.2
Assam - 25.0 5.0 - 20.0 80.0
Bihar - 13.4 5.0 - 10.0 46.8
Delhi 10.0 10.6 5.0 - 20.0 71.2
Gujarat 11.0 20.8 10.0 - 30.0 113.6
Haryana 12.2 15.8 15.0 - 20.0 106.0
Himachal Pradesh - 11.2 5.0 - 10.0 42.4
Jammu & Kashmir - 17.0 5.0 - 10.0 54.0
Karnataka 5.0 15.0 5.0 - - 50.0
Kerala 12.4 20.0 10.0 10.0 20.0 114.8
Kolkata 7.0 15.0 10.0 - 20.0 84.0
Madhya Pradesh 7.4 18.6 5.0 10.0 20.0 92.0
Maharashtra 14.0 12.4 15.0 10.0 30.0 122.8
Mumbai 11.0 10.2 10.0 - 20.0 82.4
North East - 25.8 5.0 - 20.0 81.6
Orissa 5.0 17.0 5.0 - 20.0 74.0
Punjab 5.6 15.0 10.0 - 10.0 71.2
Rajasthan 6.4 10.0 15.0 - 20.0 82.8
Tamil Nadu 5.0 11.4 15.0 - - 62.8
Uttar Pradesh (East) 5.6 10.0 20.0 - 20.0 91.2
Uttar Pradesh (West) 5.0 15.0 10.0 - 20.0 80.0
West Bengal 7.4 23.4 5.0 - 20.0 91.6
Administrative spectrum 6.2 8.8 30.0

Quarterly Report Mar’21 Page 7 of 18
Robust Network Infrastructure
The company has large network assets in the form of 2G, 3G, 4G equipment and country wide
optical fibre cable (OFC). The company has presence in over 180,000 unique locations and has
nearly 453,000 broadband (3G+4G) sites. Its 4G population coverage is over ~1 billion Indians as
of March 31, 2021. The company has a portfolio of nearly ~376,000 km of OFC including own built,
IRU OFC and common routes. Post consolidation of spectrum with each site using spectrum of
both the erstwhile entities, this coupled with the deployment of TDD sites, DSR, Small Cells and
Massive MIMO has enabled further capacity enhancement.
Strong Brand
The new brand has already garnered strong awareness and continues to build brand affinity
across all customer segments in the country. Vi™ powered by GIGAnet - continues to be the fastest
4G network in the country with the best download & upload speeds, as per Ookla, consecutively
for last 3 quarters. It also has the highest rated voice quality, as per TRAI between November 2020
and April 2021.
During the quarter, the company made extensive progress on the marketing front by
communicating key differentiators and entering into various alliances, introducing various
innovative products and services. Building a competitive advantage by leveraging the Ookla
certification of being the fastest 4G in the country, the company launched #SpeedSeBadho
campaign - that showcases how one could thrive in life by getting ahead with speed using Vi
powered by GIGAnet - the fastest 4G of India. The campaign was extensively promoted on TV &
Digital. The company has also launched “Unlimited Night Data” and “Weekend Data Rollover”
offerings. These differentiated and unique propositions are aimed at creating stronger network
perception, improving customer engagement as well as brand affinity.
Enterprise Offerings
The company is well positioned in enterprise offerings across industry verticals. The company has
built strong relationships with its enterprise customers by providing Enterprise grade solutions
and services over last several years. The strong relationship with customers and global know how
of Vodafone Group provide strong platform for future growth in this segment. The wide range of
Enterprise solutions are powered by GIGAnet, born out of the world’s largest network integration
process. Vi Business continues to maintain a clear leadership in IoT offerings which is an emerging
segment and has potential to grow multi fold in the near future amid government’s push towards
‘Digital India’ and ‘Smart Cities’. With the launch of Vi Integrated IoT Solutions, Vi business is the

Quarterly Report Mar’21 Page 8 of 18
only telecom company in India to offer a secure end-to-end IoT solution across industries, for
Smart Infrastructure, Smart Mobility and Smart Utilities. Vi Business offers managed security
services to serve growing security needs of enterprises as they embrace digital ways of operations.
Vi Business is strengthened by a verticalised operating model, enabling a future fit organization
with faster go-to-market across all segments and enhanced agility to serve customers.
Vi Business continues to support enterprises, SMEs and vaccine ecosystem with our techco
solutions during the pandemic. Vi Business Plus, an industry leading mobility solution, enables
today’s mobile workforce to connect, communicate, collaborate and do a lot more with their
postpaid plans. Our robust suite of products and services are enabling enterprises to adopt digital
in a secure manner, fostering remote working while ensuring workforce safety and promote
employee collaboration. In collaboration with partners, Vi Business offers a range of digital
solutions across workflow and business process automation, digital business financing, and access
to global marketplaces. The comprehensive Carrier Services offerings power the digital
infrastructure of some of the largest OTT service providers in the country. Our digital experience
offerings such as Vi App, Vi business-Wireline self-care & Vi business-Mobility are allowing
organizations to manage from anywhere and at any time with least manual intervention.
Our enterprise digital platform for Vi business mobility, has been recognized by a global jury at
ICMG Global awards 2020, for having the best customer centricity and architectural design. Vi
Business has been chosen as the preferred partner of choice for Internet of Things (IoT), SIP Trunk,
Telecom Carrier (Mobile Access) and Managed Mobility Services in the CIO Choice 2021, on the
basis of an extensive pan-India CIO referral voting process that spans across industry verticals.

Quarterly Report Mar’21 Page 9 of 18
Gross Revenue 117,542 106,593 107,912 108,941 96,076
Opex 73,741 65,609 66,388 66,079 51,989
EBITDA 43,801 40,984 41,524 42,862 44,087
EBITDA Margin 37.3% 38.4% 38.5% 39.3% 45.9%
Depreciation & Amortisation 60,388 59,757 60,286 58,241 58,101
EBIT (16,587) (18,773) (18,762) (15,379) (14,014)
Interest and Financing Cost (net) 40,108 37,486 46,609 47,480 46,664
Share of Profit/(Loss) of joint ventures 678 889 857 570 (2)
Exceptional Items
- Impairment (non-cash) (1,871) (263) (2,937) (1,142) (9,185)
- Other Exceptional Items (59,538) (198,969) (4,734) 18,107 (558)
PBT (117,426) (254,602) (72,185) (45,324) (70,423)
Tax Expenses (991) (2) (3) (3) (195)
PAT (116,435) (254,600) (72,182) (45,321) (70,228)
Other comprehensive income (net of Tax) 158 (70) 148 (87) 377
Total comprehensive income for the period (116,277) (254,670) (72,034) (45,408) (69,851)

Quarterly Report Mar’21 Page 10 of 18
Assets
Non-current assets
Property, plant and equipment (including RoU assets) 663,113 575,704
Capital work-in-progress 10,415 5,996
Investment property 660 -
Other Intangible assets 1,194,592 1,099,200
Intangible assets under development 966 63
Investments accounted for using the equity method 15,244 41
Financial assets
Other non-current financial assets 82,459 77,323
Deferred Tax Assets (net) 20 23
Other non-current assets 134,866 135,461
Total non-current assets (A) 2,102,335 1,893,811
Current assets
Inventories 25 6
Financial assets
Current investments 4,548 -
Trade receivables 30,943 25,070
Cash and cash equivalents 3,708 3,503
Bank balance other than cash and cash equivalents 22,922 18,662
Short term loans 9 9
Other current financial assets 23,033 2,117
Other current assets 81,673 90,975
Total current assets (B) 166,861 140,342
Assets classified as held for sale (C) 653
Total Assets (A+B+C) 2,269,196 2,034,806
Equity and liabilities
Equity
Equity share capital 287,354 287,354
Other equity (227,555) (669,634)
Total equity (A) 59,799 (382,280)
Non-Current Liabilities:
Financial liabilities
Long term borrowings
Loans from banks and others 86,279 64,846
Deferred payment obligations 876,525 1,509,309
Trade payables 6,660 1,268
Other non-current financial liabilities 274,073 172,819
Long term provisions 3,421 416
Deferred tax liabilities (net) 38 22
Other non-current liabilities 4,611 4,381
Total Non-Current Liabilities (B) 1,251,607 1,753,061
Current Liabilities:
Financial liabilities
Short term borrowings 322 -
Trade payable 117,672 132,757
Current maturities of long term debt 186,829 228,948
Other current financial liabilities 190,306 237,871
Other current liabilities 462,168 63,991
Short term provisions 493 458
Total Current Liabilities (C) 957,790 664,025
Liabilities classified as held for sale (D)
Total equity and liabilities (A+B+C+D) 2,269,196 2,034,806
Quarterly Report Mar’21 Page 11 of 18
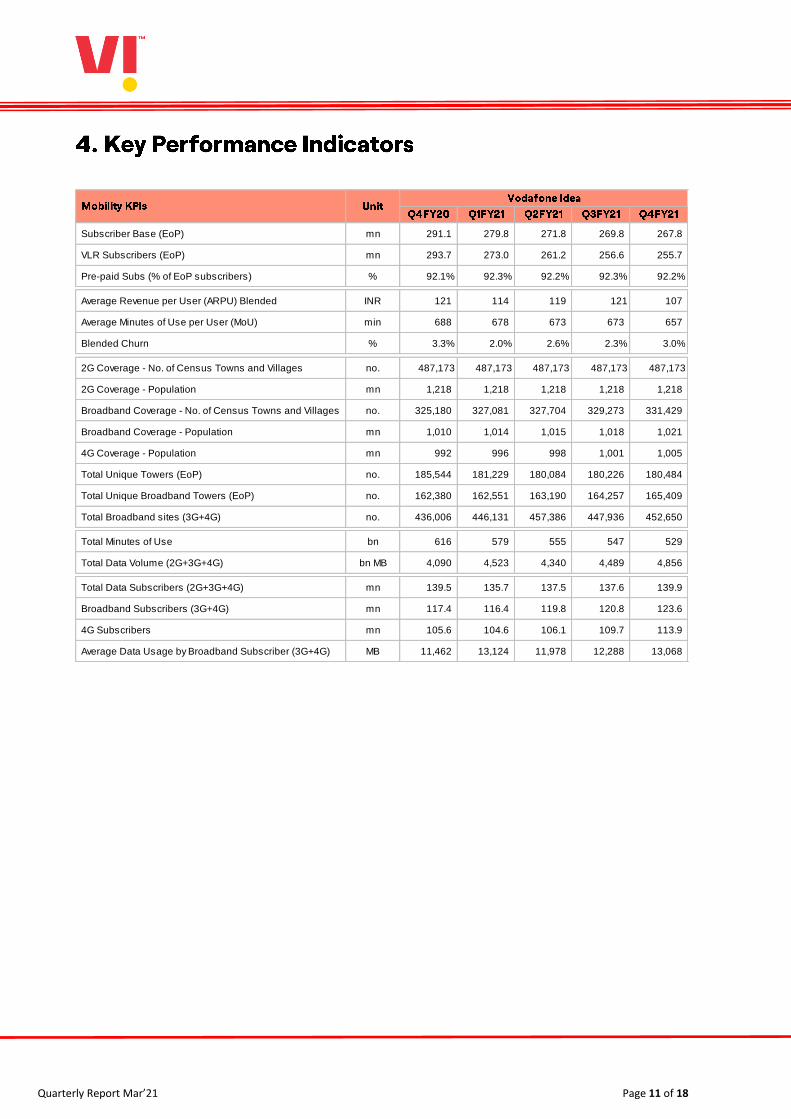
Subscriber Base (EoP) mn 291.1 279.8 271.8 269.8 267.8
VLR Subscribers (EoP) mn 293.7 273.0 261.2 256.6 255.7
Pre-paid Subs (% of EoP subscribers) % 92.1% 92.3% 92.2% 92.3% 92.2%
Average Revenue per User (ARPU) Blended INR 121 114 119 121 107
Average Minutes of Use per User (MoU) min 688 678 673 673 657
Blended Churn % 3.3% 2.0% 2.6% 2.3% 3.0%
2G Coverage - No. of Census Towns and Villages no. 487,173 487,173 487,173 487,173 487,173
2G Coverage - Population mn 1,218 1,218 1,218 1,218 1,218
Broadband Coverage - No. of Census Towns and Villages no. 325,180 327,081 327,704 329,273 331,429
Broadband Coverage - Population mn 1,010 1,014 1,015 1,018 1,021
4G Coverage - Population mn 992 996 998 1,001 1,005
Total Unique Towers (EoP) no. 185,544 181,229 180,084 180,226 180,484
Total Unique Broadband Towers (EoP) no. 162,380 162,551 163,190 164,257 165,409
Total Broadband sites (3G+4G) no. 436,006 446,131 457,386 447,936 452,650
Total Minutes of Use bn 616 579 555 547 529
Total Data Volume (2G+3G+4G) bn MB 4,090 4,523 4,340 4,489 4,856
Total Data Subscribers (2G+3G+4G) mn 139.5 135.7 137.5 137.6 139.9
Broadband Subscribers (3G+4G) mn 117.4 116.4 119.8 120.8 123.6
4G Subscribers mn 105.6 104.6 106.1 109.7 113.9
Average Data Usage by Broadband Subscriber (3G+4G) MB 11,462 13,124 11,978 12,288 13,068

Quarterly Report Mar’21 Page 12 of 18
Financial highlights
Revenue for the quarter was Rs. 96.1 billion, a decline of 11.8% QoQ out of which 9.6% was on account of
abolishment of domestic IUC effective from January 1, 2021 and 2.2% was on account of lower number of
days in the quarter. Average daily revenue, adjusted for IUC impact was flat QoQ. On a reported basis, EBITDA
for the quarter was Rs. 44.1 billion, with EBITDA margins at 45.9% vs 39.3% in Q3FY21. Post adoption of
IndAS 116, the accounting for operating lease expenses has changed from rentals to depreciation on the
right-of-use asset and finance cost for interest accrued on lease liability. Accordingly, this has an impact
of Rs. 22.0 billion and Rs. 0.4 billion on Network expenses and Other expenses respectively. EBITDA
excluding IndAS 116 impact was Rs. 21.7 billion, compared to Rs. 21.1 billion in Q3FY21. This quarter had one-
off of Rs. 4.5 billion primarily in network and IT costs.
Further, Depreciation & Amortisation expenses and Finance costs (Net) for the quarter are Rs. 58.1
billion and Rs. 46.7 billion respectively. Excluding the impact of IndAS 116, the Depreciation &
Amortisation expenses and Finance costs (Net) for the quarter stands at Rs. 43.5 billion and Rs. 41.9
billion.
Capex spend in Q4FY21 was Rs. 15.4 billion vs Rs. 9.7 billion in Q3FY21. Total capex spend for FY21 stands at
Rs. 41.5 billion.
For FY21, Revenue and EBITDA was Rs. 419.5 billion and Rs. 169.5 billion respectively. The total revenue,
excluding IUC revenue, declined by 3.3% YoY. FY21 EBITDA, excluding IndAS 116 impact, at Rs. 80.4 billion,
significantly improved on YoY basis, compared to Rs. 58.1 billion in FY20, on account of several cost
optimization initiatives as well as due to amortisation of subscriber acquisition cost over the average
expected customer life starting Q3FY21.
Gross debt (excluding lease liabilities) as of March 31, 2021 was Rs. 1,803.1 billion, comprising of deferred
spectrum payment obligations of Rs. 962.7 billion and AGR liability of Rs. 609.6 billion that are due to the
Government and debt from banks and financial institutions of Rs. 230.8 billion. The AGR liability is currently
taken without considering any impact of corrections which may arise out of the Modification Application filed
by the Company. Cash & cash equivalents were Rs. 3.5 billion and net debt stood at Rs. 1,799.6 billion.
Operational highlights
We continue to invest in 4G to increase our coverage and capacity. We have also started to actively upgrade
our 3G network to 4G. During the year, we added ~43,500 4G FDD sites primarily through refarming of 2G/3G

Quarterly Report Mar’21 Page 13 of 18
spectrum to expand our 4G coverage and capacity. Till date, we have deployed over ~62,000 TDD sites in
addition to the deployment of ~13,600 Massive MIMO sites and ~12,600 small cells. Our overall broadband
site count stood at 452,650 as of March 31, 2021 compared to 436,006 a year ago. We have shut down over
30,000 3G sites during the year while we added over 47,000 4G sites. We continue to expand our LTE 900
presence in 11 circles at select locations, including through dynamic spectrum refarming, to improve
customer experience. Our 4G network covers over 1 billion Indians as of March 31, 2021 (4G coverage is the
population reached/covered by Vi with its 4G network).
These network investment initiatives continue to deliver a significant capacity uplift throughout the year,
enabling us to offer superior customer experience. Our relentless pursuit to have the best 4G network in the
country, through integration and incremental network investments post-merger, are clearly visible through
our top rankings in various third party reports. As per Ookla*, the global leader in Internet Performance
Testing, we remain the fastest 4G network in the country for 3 consecutive quarters, since Q2FY21. We also
have the highest rated voice quality in the country as per TRAI’s “MyCall” app data for 6 months consecutively
between November 2020 and April 2021.
Our unified brand “Vi”, which was launched in September 2020, has already garnered strong awareness and
continues to build brand affinity across all customer segments in the country. This coupled with our superior
network performance is resulting in improving operating performance over the last few quarters. The
subscriber base stands at 267.8 million in Q4FY21, a QoQ decline of 2.0 million. The gross additions continued
to improve this quarter as well. Subscriber churn was 3.0% in Q4FY21 vs 2.3% in Q3FY21. ARPU for Q4FY21
declined to Rs. 107 compared to Rs. 121 in Q3FY21, on account of removal of IUC, adjusting for which ARPU
was broadly flat this quarter.
At the end of the quarter, the 4G subscriber base was 113.9 million (vs 109.7 million in Q3), an increase of
4.2 million in the quarter. The data volumes witnessed healthy growth of 8.2% QoQ, driven by higher 4G
additions.
Cost optimization initiative underway
After successfully achieving targeted merger opex synergies of Rs. 84 billion, we have undertaken the cost
optimization exercise across the company in line with the evolving industry structure and business model.
We target to achieve Rs. 40 billion of annualized cost savings by end of this calendar year. Through several
initiatives, we have already achieved ~65% of the targeted annualised savings on a run-rate basis by the end
of Q4FY21.
*Based on analysis by Ookla® of Speedtest Intelligence ® data of average 4G download speeds on 4G LTE devices in India for Q3 2020, Q4 2020
and Q1 2021. Ookla trademarks used under license and reprinted with permission. Visit myvi.in for more details.

Quarterly Report Mar’21 Page 14 of 18
March 2021 Spectrum auction
Vodafone Idea participated in Spectrum Auction conducted by Department of Telecommunications (DoT) in
March, 2021 and acquired 23.6 MHz of spectrum across 900 and 1800 MHz in Tamil Nadu, Karnataka, UP
East, UP West, and West Bengal at an aggregate value of Rs. 19.93 billion. We have also optimized spectrum
holding in some of the circles. Post March 2021 spectrum auction, our overall spectrum holding is 1,768.4
MHz across different frequency bands out of which 1,738.4 MHz spectrum is liberalised and can be used
towards deployment of any technology (2G, 3G, 4G or 5G).

Quarterly Report Mar’21 Page 15 of 18
Vodafone Idea Daily Stock Price (NSE) & Volume (Combined of BSE & NSE) Movement
Volume (no. of Shares in mn) Closing Price (INR)
BSE Code 532822
NSE Symbol IDEA
Reuters IDEA.NS
No of Shares Outstanding (31/03/2021) mn 28735.4
Closing Market Price - NSE (31/03/2021) INR/share 9.25
Combined Volume (NSE & BSE) (01/01/2021 to 31/03/2021) mn/day 383.1
Combined Value (NSE & BSE) (01/01/2021 to 31/03/2021) INR mn/day 4442.3
Market Capitalisation (31/03/2021) INR bn 266
Enterprise Value (31/03/2021) INR bn 2065
Promoter and Promoter Group No. of Shares % holding
Aditya Birla Group 7,948,341,627 27.66%
Vodafone Group 12,755,576,455 44.39%
Total Promoter Holding 20,703,918,082 72.05%
Public Shareholding No. of Shares % holding
Institutional Holding 1,630,464,803 5.67%
Non-Institutional Holding 6,401,006,355 22.28%
Total 28,735,389,240 100.00%

Quarterly Report Mar’21 Page 16 of 18
Definitions/Abbreviation Description/Full Form
ARPU (Average Revenue
Per User)
Is calculated by dividing services revenue (exclusive of infrastructure, fixed
line and device revenues) for the relevant period by the average number of
subscribers during the period. The result obtained is divided by the number
of months in that period to arrive at the ARPU per month figure.
Broadband Subscriber Any subscriber with data usage of more than 0KB on 3G or 4G network or
VoLTE usage.
4G Subscriber Any subscriber with data usage of more than 0KB on 4G network or VoLTE
usage.
Churn Is calculated by dividing the difference in gross add and net add for the
relevant period by the average number of subscribers during the period.
The result obtained is divided by the number of months in that period to
arrive at the monthly churn.
Data Subscriber Broadband subscriber plus any subscriber with data usage on 2G Network
of more than 0KB.
EBITDA (Earnings before
interest, tax,
depreciation and
amortisation)
This is the amount after deducting operating expenditure from Revenue
from operations, which is comprised of Service revenue, Sales of trading
goods and Other operating income. Operating expenditure is comprised of
Cost of trading goods, Employee benefit expenses, Network expenses and IT
outsourcing costs, License fees and spectrum usage charges, Roaming and
access charges, Marketing, content, customer acquisition & service costs,
and other expenses.
Enterprise Value Is the summation of Market Capitalisation and consolidated Net Debt
EPS Earnings per share, is calculated by dividing the Profit after Tax for the
period by the weighted average number of outstanding equity shares.
EoP End of period
FY Financial year ending March 31
GSM Global System for Mobile communications, the most popular standard for
mobile telephony in the world
Gross Revenue Is the summation of service revenue, revenue from sale of trading goods
and other income
Ind AS Indian Accounting Standard
Indian GAAP Indian Generally Accepted Accounting Principles
Market Capitalisation Number of outstanding shares at end of the period multiplied by closing market price (NSE) at end of the period
Net Adds Refers to net customer additions which is calculated as the difference
between the closing and the opening customer base for the period

Quarterly Report Mar’21 Page 17 of 18
Definitions/Abbreviation Description/Full Form
Net Debt Total loan funds including deferred spectrum payment obligations due to the
Government but excluding the finance lease obligations, reduced by cash and
cash equivalents
Net Worth Calculated as the summation of Share Capital and Reserves & Surplus
reduced by debit balance of Profit & Loss account (if any)
Price to Earning Is calculated by dividing the closing market price (NSE) at the end of the
period by the annualised EPS
Site Represents unique combination of Technology and Spectrum band
(frequency). Site count does not include Massive MIMO and Small Cells
Service Area/ Circle Unless otherwise specifically mentioned, means telecom service areas in
India as defined by the DoT

Quarterly Report Mar’21 Page 18 of 18
For any clarification kindly contact