2021 Quarterly Report (Unaudited) - iShares
159
2021 Quarterly Report (Unaudited) iShares Trust NOVEMBER 30, 2021 NM0122U-1995964-1/159
-
Upload
khangminh22 -
Category
Documents
-
view
0 -
download
0
Transcript of 2021 Quarterly Report (Unaudited) - iShares

2021 Quarterly Report(Unaudited)
iShares Trust
NOVEMBER 30, 2021
NM0122U-1995964-1/159

Page
iShares� Currency Hedged MSCI Canada ETF . . . . . . . . . . . . . . . . . . . . . . . . . . . . . . . . . . . . . . . . . . . . . . . . . . . . . . . . . . . . . . . . . . . . . . . . . . . . . . . . . . . . . . . . . . . . . . . . . . . . . . . . . . . . . . . . . . . . . . . . . . . . . . . 1iShares� Currency Hedged MSCI Eurozone ETF . . . . . . . . . . . . . . . . . . . . . . . . . . . . . . . . . . . . . . . . . . . . . . . . . . . . . . . . . . . . . . . . . . . . . . . . . . . . . . . . . . . . . . . . . . . . . . . . . . . . . . . . . . . . . . . . . . . . . . . . . . . . . 3iShares� Currency Hedged MSCI Germany ETF . . . . . . . . . . . . . . . . . . . . . . . . . . . . . . . . . . . . . . . . . . . . . . . . . . . . . . . . . . . . . . . . . . . . . . . . . . . . . . . . . . . . . . . . . . . . . . . . . . . . . . . . . . . . . . . . . . . . . . . . . . . . . 6iShares� Currency Hedged MSCI Japan ETF . . . . . . . . . . . . . . . . . . . . . . . . . . . . . . . . . . . . . . . . . . . . . . . . . . . . . . . . . . . . . . . . . . . . . . . . . . . . . . . . . . . . . . . . . . . . . . . . . . . . . . . . . . . . . . . . . . . . . . . . . . . . . . . . 9iShares� Currency Hedged MSCI United Kingdom ETF . . . . . . . . . . . . . . . . . . . . . . . . . . . . . . . . . . . . . . . . . . . . . . . . . . . . . . . . . . . . . . . . . . . . . . . . . . . . . . . . . . . . . . . . . . . . . . . . . . . . . . . . . . . . . . . . . . . . . . . 11iShares� ESG Advanced MSCI EAFE ETF . . . . . . . . . . . . . . . . . . . . . . . . . . . . . . . . . . . . . . . . . . . . . . . . . . . . . . . . . . . . . . . . . . . . . . . . . . . . . . . . . . . . . . . . . . . . . . . . . . . . . . . . . . . . . . . . . . . . . . . . . . . . . . . . . . . 13iShares� ESG Advanced MSCI EM ETF . . . . . . . . . . . . . . . . . . . . . . . . . . . . . . . . . . . . . . . . . . . . . . . . . . . . . . . . . . . . . . . . . . . . . . . . . . . . . . . . . . . . . . . . . . . . . . . . . . . . . . . . . . . . . . . . . . . . . . . . . . . . . . . . . . . . . 20iShares� ESG Advanced MSCI USA ETF . . . . . . . . . . . . . . . . . . . . . . . . . . . . . . . . . . . . . . . . . . . . . . . . . . . . . . . . . . . . . . . . . . . . . . . . . . . . . . . . . . . . . . . . . . . . . . . . . . . . . . . . . . . . . . . . . . . . . . . . . . . . . . . . . . . . 26iShares� ESG Aware MSCI EAFE ETF . . . . . . . . . . . . . . . . . . . . . . . . . . . . . . . . . . . . . . . . . . . . . . . . . . . . . . . . . . . . . . . . . . . . . . . . . . . . . . . . . . . . . . . . . . . . . . . . . . . . . . . . . . . . . . . . . . . . . . . . . . . . . . . . . . . . . . 32iShares� ESG Aware MSCI USA ETF . . . . . . . . . . . . . . . . . . . . . . . . . . . . . . . . . . . . . . . . . . . . . . . . . . . . . . . . . . . . . . . . . . . . . . . . . . . . . . . . . . . . . . . . . . . . . . . . . . . . . . . . . . . . . . . . . . . . . . . . . . . . . . . . . . . . . . . . 38iShares� ESG Aware MSCI USA Small-Cap ETF . . . . . . . . . . . . . . . . . . . . . . . . . . . . . . . . . . . . . . . . . . . . . . . . . . . . . . . . . . . . . . . . . . . . . . . . . . . . . . . . . . . . . . . . . . . . . . . . . . . . . . . . . . . . . . . . . . . . . . . . . . . . . 44iShares� ESG MSCI EM Leaders ETF . . . . . . . . . . . . . . . . . . . . . . . . . . . . . . . . . . . . . . . . . . . . . . . . . . . . . . . . . . . . . . . . . . . . . . . . . . . . . . . . . . . . . . . . . . . . . . . . . . . . . . . . . . . . . . . . . . . . . . . . . . . . . . . . . . . . . . . 56iShares� ESG MSCI USA Leaders ETF . . . . . . . . . . . . . . . . . . . . . . . . . . . . . . . . . . . . . . . . . . . . . . . . . . . . . . . . . . . . . . . . . . . . . . . . . . . . . . . . . . . . . . . . . . . . . . . . . . . . . . . . . . . . . . . . . . . . . . . . . . . . . . . . . . . . . . 63iShares� MSCI Argentina and Global Exposure ETF . . . . . . . . . . . . . . . . . . . . . . . . . . . . . . . . . . . . . . . . . . . . . . . . . . . . . . . . . . . . . . . . . . . . . . . . . . . . . . . . . . . . . . . . . . . . . . . . . . . . . . . . . . . . . . . . . . . . . . . . . . 68iShares� MSCI Brazil Small-Cap ETF . . . . . . . . . . . . . . . . . . . . . . . . . . . . . . . . . . . . . . . . . . . . . . . . . . . . . . . . . . . . . . . . . . . . . . . . . . . . . . . . . . . . . . . . . . . . . . . . . . . . . . . . . . . . . . . . . . . . . . . . . . . . . . . . . . . . . . . . 70iShares� MSCI China ETF . . . . . . . . . . . . . . . . . . . . . . . . . . . . . . . . . . . . . . . . . . . . . . . . . . . . . . . . . . . . . . . . . . . . . . . . . . . . . . . . . . . . . . . . . . . . . . . . . . . . . . . . . . . . . . . . . . . . . . . . . . . . . . . . . . . . . . . . . . . . . . . . . . 74iShares� MSCI China Small-Cap ETF . . . . . . . . . . . . . . . . . . . . . . . . . . . . . . . . . . . . . . . . . . . . . . . . . . . . . . . . . . . . . . . . . . . . . . . . . . . . . . . . . . . . . . . . . . . . . . . . . . . . . . . . . . . . . . . . . . . . . . . . . . . . . . . . . . . . . . . 83iShares� MSCI Denmark ETF . . . . . . . . . . . . . . . . . . . . . . . . . . . . . . . . . . . . . . . . . . . . . . . . . . . . . . . . . . . . . . . . . . . . . . . . . . . . . . . . . . . . . . . . . . . . . . . . . . . . . . . . . . . . . . . . . . . . . . . . . . . . . . . . . . . . . . . . . . . . . . . 89iShares� MSCI Finland ETF . . . . . . . . . . . . . . . . . . . . . . . . . . . . . . . . . . . . . . . . . . . . . . . . . . . . . . . . . . . . . . . . . . . . . . . . . . . . . . . . . . . . . . . . . . . . . . . . . . . . . . . . . . . . . . . . . . . . . . . . . . . . . . . . . . . . . . . . . . . . . . . . . 92iShares� MSCI Germany Small-Cap ETF . . . . . . . . . . . . . . . . . . . . . . . . . . . . . . . . . . . . . . . . . . . . . . . . . . . . . . . . . . . . . . . . . . . . . . . . . . . . . . . . . . . . . . . . . . . . . . . . . . . . . . . . . . . . . . . . . . . . . . . . . . . . . . . . . . . . 95iShares� MSCI Global Impact ETF . . . . . . . . . . . . . . . . . . . . . . . . . . . . . . . . . . . . . . . . . . . . . . . . . . . . . . . . . . . . . . . . . . . . . . . . . . . . . . . . . . . . . . . . . . . . . . . . . . . . . . . . . . . . . . . . . . . . . . . . . . . . . . . . . . . . . . . . . . 99iShares� MSCI India ETF . . . . . . . . . . . . . . . . . . . . . . . . . . . . . . . . . . . . . . . . . . . . . . . . . . . . . . . . . . . . . . . . . . . . . . . . . . . . . . . . . . . . . . . . . . . . . . . . . . . . . . . . . . . . . . . . . . . . . . . . . . . . . . . . . . . . . . . . . . . . . . . . . . . 103iShares� MSCI India Small-Cap ETF . . . . . . . . . . . . . . . . . . . . . . . . . . . . . . . . . . . . . . . . . . . . . . . . . . . . . . . . . . . . . . . . . . . . . . . . . . . . . . . . . . . . . . . . . . . . . . . . . . . . . . . . . . . . . . . . . . . . . . . . . . . . . . . . . . . . . . . . 106iShares� MSCI Indonesia ETF . . . . . . . . . . . . . . . . . . . . . . . . . . . . . . . . . . . . . . . . . . . . . . . . . . . . . . . . . . . . . . . . . . . . . . . . . . . . . . . . . . . . . . . . . . . . . . . . . . . . . . . . . . . . . . . . . . . . . . . . . . . . . . . . . . . . . . . . . . . . . . 112iShares� MSCI Ireland ETF . . . . . . . . . . . . . . . . . . . . . . . . . . . . . . . . . . . . . . . . . . . . . . . . . . . . . . . . . . . . . . . . . . . . . . . . . . . . . . . . . . . . . . . . . . . . . . . . . . . . . . . . . . . . . . . . . . . . . . . . . . . . . . . . . . . . . . . . . . . . . . . . . 115iShares� MSCI Japan Equal Weighted ETF . . . . . . . . . . . . . . . . . . . . . . . . . . . . . . . . . . . . . . . . . . . . . . . . . . . . . . . . . . . . . . . . . . . . . . . . . . . . . . . . . . . . . . . . . . . . . . . . . . . . . . . . . . . . . . . . . . . . . . . . . . . . . . . . . . 117iShares� MSCI Japan Value ETF . . . . . . . . . . . . . . . . . . . . . . . . . . . . . . . . . . . . . . . . . . . . . . . . . . . . . . . . . . . . . . . . . . . . . . . . . . . . . . . . . . . . . . . . . . . . . . . . . . . . . . . . . . . . . . . . . . . . . . . . . . . . . . . . . . . . . . . . . . . . 122iShares� MSCI Kuwait ETF . . . . . . . . . . . . . . . . . . . . . . . . . . . . . . . . . . . . . . . . . . . . . . . . . . . . . . . . . . . . . . . . . . . . . . . . . . . . . . . . . . . . . . . . . . . . . . . . . . . . . . . . . . . . . . . . . . . . . . . . . . . . . . . . . . . . . . . . . . . . . . . . . 126iShares� MSCI New Zealand ETF . . . . . . . . . . . . . . . . . . . . . . . . . . . . . . . . . . . . . . . . . . . . . . . . . . . . . . . . . . . . . . . . . . . . . . . . . . . . . . . . . . . . . . . . . . . . . . . . . . . . . . . . . . . . . . . . . . . . . . . . . . . . . . . . . . . . . . . . . . . 128iShares� MSCI Norway ETF . . . . . . . . . . . . . . . . . . . . . . . . . . . . . . . . . . . . . . . . . . . . . . . . . . . . . . . . . . . . . . . . . . . . . . . . . . . . . . . . . . . . . . . . . . . . . . . . . . . . . . . . . . . . . . . . . . . . . . . . . . . . . . . . . . . . . . . . . . . . . . . . 130iShares� MSCI Peru ETF . . . . . . . . . . . . . . . . . . . . . . . . . . . . . . . . . . . . . . . . . . . . . . . . . . . . . . . . . . . . . . . . . . . . . . . . . . . . . . . . . . . . . . . . . . . . . . . . . . . . . . . . . . . . . . . . . . . . . . . . . . . . . . . . . . . . . . . . . . . . . . . . . . . 133iShares� MSCI Philippines ETF . . . . . . . . . . . . . . . . . . . . . . . . . . . . . . . . . . . . . . . . . . . . . . . . . . . . . . . . . . . . . . . . . . . . . . . . . . . . . . . . . . . . . . . . . . . . . . . . . . . . . . . . . . . . . . . . . . . . . . . . . . . . . . . . . . . . . . . . . . . . . 135iShares� MSCI Poland ETF . . . . . . . . . . . . . . . . . . . . . . . . . . . . . . . . . . . . . . . . . . . . . . . . . . . . . . . . . . . . . . . . . . . . . . . . . . . . . . . . . . . . . . . . . . . . . . . . . . . . . . . . . . . . . . . . . . . . . . . . . . . . . . . . . . . . . . . . . . . . . . . . . 138iShares� MSCI Qatar ETF . . . . . . . . . . . . . . . . . . . . . . . . . . . . . . . . . . . . . . . . . . . . . . . . . . . . . . . . . . . . . . . . . . . . . . . . . . . . . . . . . . . . . . . . . . . . . . . . . . . . . . . . . . . . . . . . . . . . . . . . . . . . . . . . . . . . . . . . . . . . . . . . . . 141iShares� MSCI Saudi Arabia ETF . . . . . . . . . . . . . . . . . . . . . . . . . . . . . . . . . . . . . . . . . . . . . . . . . . . . . . . . . . . . . . . . . . . . . . . . . . . . . . . . . . . . . . . . . . . . . . . . . . . . . . . . . . . . . . . . . . . . . . . . . . . . . . . . . . . . . . . . . . . 143iShares� MSCI UAE ETF . . . . . . . . . . . . . . . . . . . . . . . . . . . . . . . . . . . . . . . . . . . . . . . . . . . . . . . . . . . . . . . . . . . . . . . . . . . . . . . . . . . . . . . . . . . . . . . . . . . . . . . . . . . . . . . . . . . . . . . . . . . . . . . . . . . . . . . . . . . . . . . . . . . 146iShares� MSCI United Kingdom ETF . . . . . . . . . . . . . . . . . . . . . . . . . . . . . . . . . . . . . . . . . . . . . . . . . . . . . . . . . . . . . . . . . . . . . . . . . . . . . . . . . . . . . . . . . . . . . . . . . . . . . . . . . . . . . . . . . . . . . . . . . . . . . . . . . . . . . . . . 149iShares� MSCI United Kingdom Small-Cap ETF . . . . . . . . . . . . . . . . . . . . . . . . . . . . . . . . . . . . . . . . . . . . . . . . . . . . . . . . . . . . . . . . . . . . . . . . . . . . . . . . . . . . . . . . . . . . . . . . . . . . . . . . . . . . . . . . . . . . . . . . . . . . . . 152
Table of Contents
NM0122U-1995964-2/159

Security Shares
Value
Investment CompaniesExchange-Traded Funds — 100.3%iShares MSCI Canada ETF(a). . . . . . . . . . . . . . . . . . . . . . . . . . . . . . . . . 433,621 $ 16,208,753
Total Investment Companies — 100.3%(Cost: $14,508,630). . . . . . . . . . . . . . . . . . . . . . . . . . . . . . . . . . . . . . . . . . . . . . . . . 16,208,753
Short-Term InvestmentsMoney Market Funds — 2.5%BlackRock Cash Funds: Treasury, SL Agency Shares,
0.00%(a)(b) . . . . . . . . . . . . . . . . . . . . . . . . . . . . . . . . . . . . . . . . . . . . . . . . 410,000 410,000
Total Short-Term Investments — 2.5%(Cost: $410,000). . . . . . . . . . . . . . . . . . . . . . . . . . . . . . . . . . . . . . . . . . . . . . . . . . . . 410,000
Total Investments in Securities — 102.8%(Cost: $14,918,630). . . . . . . . . . . . . . . . . . . . . . . . . . . . . . . . . . . . . . . . . . . . . . . . . 16,618,753
Other Assets, Less Liabilities — (2.8)% . . . . . . . . . . . . . . . . . . . . . . . . . . . . . . . (459,338)
Net Assets — 100.0% . . . . . . . . . . . . . . . . . . . . . . . . . . . . . . . . . . . . . . . . . . . . . . . . . $ 16,159,415
(a) Affiliate of the Fund.(b) Annualized 7-day yield as of period end.
Affiliates
Investments in issuers considered to be affiliate(s) of the Fund during the period ended November 30, 2021 for purposes of Section 2(a)(3) of the Investment Company Actof 1940, as amended, were as follows:
Affiliated IssuerValue at
08/31/21Purchases
at CostProceeds
from SalesNet Realized
Gain (Loss)
Change inUnrealized
Appreciation(Depreciation)
Value at11/30/21
SharesHeld at
11/30/21 Income
CapitalGain
Distributionsfrom
UnderlyingFunds
BlackRock Cash Funds: Treasury, SL AgencyShares . . . . . . . . . . . . . . . . . . . . . . . . . . . . . . . . . . . . . . . . . . $ 420,000 $ — $ (10,000)(a) $ — $ — $ 410,000 410,000 $ — $ —
iShares MSCI Canada ETF . . . . . . . . . . . . . . . . . . . . . . . . . 16,587,362 2,279,346 (2,774,629) 637,719 (521,045) 16,208,753 433,621 — —
$ 637,719 $ (521,045) $16,618,753 $ — $ —
(a) Represents net amount purchased (sold).
Derivative Financial Instruments Outstanding as of Period End
Forward Foreign Currency Exchange Contracts
Currency Purchased Currency Sold Counterparty Settlement Date
UnrealizedAppreciation
(Depreciation)
CAD 20,493,000 USD 15,975,211 MS 12/02/21 . . . . . . . . . . . . . . . . . . . . . . . . . . . . . . . . . . . . . . . . . . . . . . . . . . . . . . . . . . . . . . . . . . . . . . . . . . . . . . . . . . . $ 66,879
USD 16,528,676 CAD 20,493,000 MS 12/02/21 . . . . . . . . . . . . . . . . . . . . . . . . . . . . . . . . . . . . . . . . . . . . . . . . . . . . . . . . . . . . . . . . . . . . . . . . . . . . . . . . . . . 486,586
553,465
USD 16,555,167 CAD 21,228,000 MS 01/04/22 . . . . . . . . . . . . . . . . . . . . . . . . . . . . . . . . . . . . . . . . . . . . . . . . . . . . . . . . . . . . . . . . . . . . . . . . . . . . . . . . . . . (70,382)
Net unrealized appreciation . . . . . . . . . . . . . . . . . . . . . . . . . . . . . . . . . . . . . . . . . . . . . . . . . . . . . . . . . . . . . . . . . . . . . . . . . . . . . . . . . . . . . . . . . . . . . . . . . . . . . . . . . . . . . . . . . . . . . . . $ 483,083
Fair Value Measurements
Various inputs are used in determining the fair value of financial instruments. These inputs to valuation techniques are categorized into a fair value hierarchy consisting ofthree broad levels for financial reporting purposes as follows:
• Level 1 – Unadjusted price quotations in active markets/exchanges for identical assets or liabilities that each Fund has the ability to access;
Schedule of Investments (unaudited)
November 30, 2021
iShares� Currency Hedged MSCI Canada ETF(Percentages shown are based on Net Assets)
1NM0122U-1995964-3/159

Fair Value Measurements (continued)
• Level 2 – Other observable inputs (including, but not limited to, quoted prices for similar assets or liabilities in markets that are active, quoted prices for identical orsimilar assets or liabilities in markets that are not active, inputs other than quoted prices that are observable for the assets or liabilities (such as interest rates, yieldcurves, volatilities, prepayment speeds, loss severities, credit risks and default rates) or other market-corroborated inputs); and
• Level 3 – Unobservable inputs based on the best information available in the circumstances, to the extent observable inputs are not available (including the BlackRockGlobal Valuation Methodologies Committee’s (the “Global Valuation Committee’s”) assumptions used in determining the fair value of financial instruments).
The hierarchy gives the highest priority to unadjusted quoted prices in active markets for identical assets or liabilities (Level 1 measurements) and the lowest priority tounobservable inputs (Level 3 measurements). Accordingly, the degree of judgment exercised in determining fair value is greatest for instruments categorized in Level 3. Theinputs used to measure fair value may fall into different levels of the fair value hierarchy. In such cases, for disclosure purposes, the fair value hierarchy classification isdetermined based on the lowest level input that is significant to the fair value measurement in its entirety. Investments classified within Level 3 have significant unobservableinputs used by the Global Valuation Committee in determining the price for Fair Valued Investments. Level 3 investments include equity or debt issued by privately heldcompanies or funds. There may not be a secondary market, and/or there are a limited number of investors. The categorization of a value determined for financial instrumentsis based on the pricing transparency of the financial instruments and is not necessarily an indication of the risks associated with investing in those securities. For informationabout the Fund’s policy regarding valuation of financial instruments, refer to its most recent financial statements.
The following table summarizes the Fund’s financial instruments categorized in the fair value hierarchy. The breakdown of the Fund’s financial instruments into majorcategories is disclosed in the Schedule of Investments above.
Level 1 Level 2 Level 3 Total
InvestmentsAssets
Investment Companies . . . . . . . . . . . . . . . . . . . . . . . . . . . . . . . . . . . . . . . . . . . . . . . . . . . . . . . . . . . . . . . . . . . . . . . . . . . . . . . . . . $16,208,753 $ — $ — $16,208,753Money Market Funds . . . . . . . . . . . . . . . . . . . . . . . . . . . . . . . . . . . . . . . . . . . . . . . . . . . . . . . . . . . . . . . . . . . . . . . . . . . . . . . . . . . . 410,000 — — 410,000
$16,618,753 $ — $ — $16,618,753
Derivative financial instruments(a)
AssetsForward Foreign Currency Exchange Contracts. . . . . . . . . . . . . . . . . . . . . . . . . . . . . . . . . . . . . . . . . . . . . . . . . . . . . . . . . . . $ — $ 553,465 $ — $ 553,465
LiabilitiesForward Foreign Currency Exchange Contracts. . . . . . . . . . . . . . . . . . . . . . . . . . . . . . . . . . . . . . . . . . . . . . . . . . . . . . . . . . . — (70,382) — (70,382)
$ — $ 483,083 $ — $ 483,083
(a) Derivative financial instruments are forward foreign currency exchange contracts. Forward foreign currency exchange contracts are valued at the unrealized appreciation(depreciation) on the instrument.
Counterparty Abbreviations
MS. . . . . . . . . . . . . . . Morgan Stanley & Co. International PLC
Currency Abbreviations
CAD . . . . . . . . . . . . . Canadian DollarUSD . . . . . . . . . . . . . United States Dollar
Schedule of Investments (unaudited) (continued)
November 30, 2021
iShares� Currency Hedged MSCI Canada ETF
2 NM0122U-1995964-4/159

Security Shares
Value
Investment CompaniesExchange-Traded Funds — 100.7%iShares MSCI Eurozone ETF(a) . . . . . . . . . . . . . . . . . . . . . . . . . . . 14,861,954 $ 707,429,010
Total Investment Companies — 100.7%(Cost: $694,149,673) . . . . . . . . . . . . . . . . . . . . . . . . . . . . . . . . . . . . . . . . . . . . . . 707,429,010
Short-Term InvestmentsMoney Market Funds — 0.3%BlackRock Cash Funds: Treasury, SL Agency Shares,
0.00%(a)(b) . . . . . . . . . . . . . . . . . . . . . . . . . . . . . . . . . . . . . . . . . . . . 2,230,000 2,230,000
Total Short-Term Investments — 0.3%(Cost: $2,230,000). . . . . . . . . . . . . . . . . . . . . . . . . . . . . . . . . . . . . . . . . . . . . . . . . 2,230,000
Total Investments in Securities — 101.0%(Cost: $696,379,673) . . . . . . . . . . . . . . . . . . . . . . . . . . . . . . . . . . . . . . . . . . . . . . 709,659,010
Other Assets, Less Liabilities — (1.0)%. . . . . . . . . . . . . . . . . . . . . . . . . . . . . . (6,949,695)
Net Assets — 100.0% . . . . . . . . . . . . . . . . . . . . . . . . . . . . . . . . . . . . . . . . . . . . . . . . $ 702,709,315
(a) Affiliate of the Fund.(b) Annualized 7-day yield as of period end.
Affiliates
Investments in issuers considered to be affiliate(s) of the Fund during the period ended November 30, 2021 for purposes of Section 2(a)(3) of the Investment Company Actof 1940, as amended, were as follows:
Affiliated IssuerValue at
08/31/21Purchases
at CostProceeds
from SalesNet Realized
Gain (Loss)
Change inUnrealized
Appreciation(Depreciation)
Value at11/30/21
SharesHeld at
11/30/21 Income
CapitalGain
Distributionsfrom
UnderlyingFunds
BlackRock Cash Funds: Treasury, SL AgencyShares . . . . . . . . . . . . . . . . . . . . . . . . . . . . . . . . . . $ 1,160,000 $ 1,070,000(a) $ — $ — $ — $ 2,230,000 2,230,000 $ 10 $ —
iShares MSCI Eurozone ETF . . . . . . . . . . . . . . . . 744,520,226 64,756,883 (55,439,484) 6,734,302 (53,142,917) 707,429,010 14,861,954 (47) —
$ 6,734,302 $ (53,142,917) $709,659,010 $ (37) $ —
(a) Represents net amount purchased (sold).
Derivative Financial Instruments Outstanding as of Period End
Forward Foreign Currency Exchange Contracts
Currency Purchased Currency Sold Counterparty Settlement Date
UnrealizedAppreciation
(Depreciation)
EUR 569,278,511 USD 640,773,630 BNP 12/03/21. . . . . . . . . . . . . . . . . . . . . . . . . . . . . . . . . . . . . . . . . . . . . . . . . . . . . . . . . . . . . . . . . . . . . . . . . . . . . . . . . . $ 4,857,175
EUR 4,841,000 USD 5,461,240 CITI 12/03/21. . . . . . . . . . . . . . . . . . . . . . . . . . . . . . . . . . . . . . . . . . . . . . . . . . . . . . . . . . . . . . . . . . . . . . . . . . . . . . . . . . 29,040
EUR 55,423,834 USD 62,385,710 MS 12/03/21. . . . . . . . . . . . . . . . . . . . . . . . . . . . . . . . . . . . . . . . . . . . . . . . . . . . . . . . . . . . . . . . . . . . . . . . . . . . . . . . . . 471,632
USD 23,705,079 EUR 20,472,000 BBP 12/03/21. . . . . . . . . . . . . . . . . . . . . . . . . . . . . . . . . . . . . . . . . . . . . . . . . . . . . . . . . . . . . . . . . . . . . . . . . . . . . . . . . . 487,351
USD 1,912,208 EUR 1,654,000 JPM 12/03/21. . . . . . . . . . . . . . . . . . . . . . . . . . . . . . . . . . . . . . . . . . . . . . . . . . . . . . . . . . . . . . . . . . . . . . . . . . . . . . . . . . 36,372
USD 69,819,729 EUR 60,301,834 MS 12/03/21. . . . . . . . . . . . . . . . . . . . . . . . . . . . . . . . . . . . . . . . . . . . . . . . . . . . . . . . . . . . . . . . . . . . . . . . . . . . . . . . . . 1,430,143
USD 629,525,045 EUR 543,666,511 SSB 12/03/21. . . . . . . . . . . . . . . . . . . . . . . . . . . . . . . . . . . . . . . . . . . . . . . . . . . . . . . . . . . . . . . . . . . . . . . . . . . . . . . . . . 12,941,351
USD 1,923,321 EUR 1,658,000 UBS 12/03/21. . . . . . . . . . . . . . . . . . . . . . . . . . . . . . . . . . . . . . . . . . . . . . . . . . . . . . . . . . . . . . . . . . . . . . . . . . . . . . . . . . 42,949
EUR 4,064,000 USD 4,581,384 DB 01/05/22. . . . . . . . . . . . . . . . . . . . . . . . . . . . . . . . . . . . . . . . . . . . . . . . . . . . . . . . . . . . . . . . . . . . . . . . . . . . . . . . . . 34,489
20,330,502
EUR 3,312,000 USD 3,803,418 JPM 12/03/21. . . . . . . . . . . . . . . . . . . . . . . . . . . . . . . . . . . . . . . . . . . . . . . . . . . . . . . . . . . . . . . . . . . . . . . . . . . . . . . . . . (47,209)
USD 3,844,372 EUR 3,408,000 JPM 12/03/21. . . . . . . . . . . . . . . . . . . . . . . . . . . . . . . . . . . . . . . . . . . . . . . . . . . . . . . . . . . . . . . . . . . . . . . . . . . . . . . . . . (20,713)
Schedule of Investments (unaudited)
November 30, 2021
iShares� Currency Hedged MSCI Eurozone ETF(Percentages shown are based on Net Assets)
3NM0122U-1995964-5/159

Forward Foreign Currency Exchange Contracts (continued)
Currency Purchased Currency Sold Counterparty Settlement Date
UnrealizedAppreciation
(Depreciation)
USD 1,920,168 EUR 1,695,000 MS 12/03/21. . . . . . . . . . . . . . . . . . . . . . . . . . . . . . . . . . . . . . . . . . . . . . . . . . . . . . . . . . . . . . . . . . . . . . . . . . . . . . . . . . $ (2,168)
USD 641,727,171 EUR 569,278,511 BNP 01/05/22. . . . . . . . . . . . . . . . . . . . . . . . . . . . . . . . . . . . . . . . . . . . . . . . . . . . . . . . . . . . . . . . . . . . . . . . . . . . . . . . . . (4,856,720)
USD 62,477,127 EUR 55,423,834 MS 01/05/22. . . . . . . . . . . . . . . . . . . . . . . . . . . . . . . . . . . . . . . . . . . . . . . . . . . . . . . . . . . . . . . . . . . . . . . . . . . . . . . . . . (473,007)
USD 9,849,897 EUR 8,695,000 SSB 01/05/22. . . . . . . . . . . . . . . . . . . . . . . . . . . . . . . . . . . . . . . . . . . . . . . . . . . . . . . . . . . . . . . . . . . . . . . . . . . . . . . . . . (25,844)
(5,425,661)
Net unrealized appreciation . . . . . . . . . . . . . . . . . . . . . . . . . . . . . . . . . . . . . . . . . . . . . . . . . . . . . . . . . . . . . . . . . . . . . . . . . . . . . . . . . . . . . . . . . . . . . . . . . . . . . . . . . . . . . . . . . . . . . . . $ 14,904,841
Fair Value Measurements
Various inputs are used in determining the fair value of financial instruments. These inputs to valuation techniques are categorized into a fair value hierarchy consisting ofthree broad levels for financial reporting purposes as follows:
• Level 1 – Unadjusted price quotations in active markets/exchanges for identical assets or liabilities that each Fund has the ability to access;• Level 2 – Other observable inputs (including, but not limited to, quoted prices for similar assets or liabilities in markets that are active, quoted prices for identical or
similar assets or liabilities in markets that are not active, inputs other than quoted prices that are observable for the assets or liabilities (such as interest rates, yieldcurves, volatilities, prepayment speeds, loss severities, credit risks and default rates) or other market-corroborated inputs); and
• Level 3 – Unobservable inputs based on the best information available in the circumstances, to the extent observable inputs are not available (including the BlackRockGlobal Valuation Methodologies Committee’s (the “Global Valuation Committee’s”) assumptions used in determining the fair value of financial instruments).
The hierarchy gives the highest priority to unadjusted quoted prices in active markets for identical assets or liabilities (Level 1 measurements) and the lowest priority tounobservable inputs (Level 3 measurements). Accordingly, the degree of judgment exercised in determining fair value is greatest for instruments categorized in Level 3. Theinputs used to measure fair value may fall into different levels of the fair value hierarchy. In such cases, for disclosure purposes, the fair value hierarchy classification isdetermined based on the lowest level input that is significant to the fair value measurement in its entirety. Investments classified within Level 3 have significant unobservableinputs used by the Global Valuation Committee in determining the price for Fair Valued Investments. Level 3 investments include equity or debt issued by privately heldcompanies or funds. There may not be a secondary market, and/or there are a limited number of investors. The categorization of a value determined for financial instrumentsis based on the pricing transparency of the financial instruments and is not necessarily an indication of the risks associated with investing in those securities. For informationabout the Fund’s policy regarding valuation of financial instruments, refer to its most recent financial statements.
The following table summarizes the Fund’s financial instruments categorized in the fair value hierarchy. The breakdown of the Fund’s financial instruments into majorcategories is disclosed in the Schedule of Investments above.
Level 1 Level 2 Level 3 Total
InvestmentsAssets
Investment Companies . . . . . . . . . . . . . . . . . . . . . . . . . . . . . . . . . . . . . . . . . . . . . . . . . . . . . . . . . . . . . . . . . . . . . . . . . . . . . $707,429,010 $ — $ — $707,429,010Money Market Funds . . . . . . . . . . . . . . . . . . . . . . . . . . . . . . . . . . . . . . . . . . . . . . . . . . . . . . . . . . . . . . . . . . . . . . . . . . . . . . . 2,230,000 — — 2,230,000
$709,659,010 $ — $ — $709,659,010
Derivative financial instruments(a)
AssetsForward Foreign Currency Exchange Contracts . . . . . . . . . . . . . . . . . . . . . . . . . . . . . . . . . . . . . . . . . . . . . . . . . . . . . . $ — $ 20,330,502 $ — $ 20,330,502
LiabilitiesForward Foreign Currency Exchange Contracts . . . . . . . . . . . . . . . . . . . . . . . . . . . . . . . . . . . . . . . . . . . . . . . . . . . . . . — (5,425,661) — (5,425,661)
$ — $ 14,904,841 $ — $ 14,904,841
(a) Derivative financial instruments are forward foreign currency exchange contracts. Forward foreign currency exchange contracts are valued at the unrealized appreciation(depreciation) on the instrument.
Counterparty Abbreviations
BBP. . . . . . . . . . . . . . Barclays Bank PLC WholesaleBNP . . . . . . . . . . . . . BNP Paribas SACITI . . . . . . . . . . . . . . Citibank N.A.DB . . . . . . . . . . . . . . . Deutsche Bank AG London
JPM. . . . . . . . . . . . . . JPMorgan Chase Bank N.A.MS. . . . . . . . . . . . . . . Morgan Stanley & Co. International PLCSSB. . . . . . . . . . . . . . State Street Bank and Trust Co.UBS . . . . . . . . . . . . . UBS AG
Schedule of Investments (unaudited) (continued)
November 30, 2021
iShares� Currency Hedged MSCI Eurozone ETF
4 NM0122U-1995964-6/159

Currency Abbreviations
EUR . . . . . . . . . . . . . EuroUSD . . . . . . . . . . . . . United States Dollar
Schedule of Investments (unaudited) (continued)
November 30, 2021
iShares� Currency Hedged MSCI Eurozone ETF
5NM0122U-1995964-7/159

Security Shares
Value
Investment CompaniesExchange-Traded Funds — 100.7%iShares MSCI Germany ETF(a). . . . . . . . . . . . . . . . . . . . . . . . . . . . . . 1,958,045 $ 62,285,411
Total Investment Companies — 100.7%(Cost: $68,413,432). . . . . . . . . . . . . . . . . . . . . . . . . . . . . . . . . . . . . . . . . . . . . . . . . 62,285,411
Short-Term InvestmentsMoney Market Funds — 0.0%BlackRock Cash Funds: Treasury, SL Agency Shares,
0.00%(a)(b) . . . . . . . . . . . . . . . . . . . . . . . . . . . . . . . . . . . . . . . . . . . . . . 20,000 20,000
Total Short-Term Investments — 0.0%(Cost: $20,000) . . . . . . . . . . . . . . . . . . . . . . . . . . . . . . . . . . . . . . . . . . . . . . . . . . . . . 20,000
Total Investments in Securities — 100.7%(Cost: $68,433,432). . . . . . . . . . . . . . . . . . . . . . . . . . . . . . . . . . . . . . . . . . . . . . . . . 62,305,411
Other Assets, Less Liabilities — (0.7)% . . . . . . . . . . . . . . . . . . . . . . . . . . . . . . . (449,172)
Net Assets — 100.0% . . . . . . . . . . . . . . . . . . . . . . . . . . . . . . . . . . . . . . . . . . . . . . . . . $ 61,856,239
(a) Affiliate of the Fund.(b) Annualized 7-day yield as of period end.
Affiliates
Investments in issuers considered to be affiliate(s) of the Fund during the period ended November 30, 2021 for purposes of Section 2(a)(3) of the Investment Company Actof 1940, as amended, were as follows:
Affiliated IssuerValue at
08/31/21Purchases
at CostProceeds
from SalesNet Realized
Gain (Loss)
Change inUnrealized
Appreciation(Depreciation)
Value at11/30/21
SharesHeld at
11/30/21 Income
CapitalGain
Distributionsfrom
UnderlyingFunds
BlackRock Cash Funds: Treasury, SL AgencyShares . . . . . . . . . . . . . . . . . . . . . . . . . . . . . . . . . . . . . . $ 30,000 $ — $ (10,000)(a) $ — $ — $ 20,000 20,000 $ — $ —
iShares MSCI Germany ETF . . . . . . . . . . . . . . . . . . . . 63,381,021 58,834,432 (53,983,866) (299,918) (5,646,258) 62,285,411 1,958,045 — —
$ (299,918) $ (5,646,258) $62,305,411 $ — $ —
(a) Represents net amount purchased (sold).
Derivative Financial Instruments Outstanding as of Period End
Forward Foreign Currency Exchange Contracts
Currency Purchased Currency Sold Counterparty Settlement Date
UnrealizedAppreciation
(Depreciation)
EUR 50,152,600 USD 56,451,215 BNP 12/03/21 . . . . . . . . . . . . . . . . . . . . . . . . . . . . . . . . . . . . . . . . . . . . . . . . . . . . . . . . . . . . . . . . . . . . . . . . . . . . . . . . . . . $ 427,910
EUR 5,283,400 USD 5,947,056 MS 12/03/21 . . . . . . . . . . . . . . . . . . . . . . . . . . . . . . . . . . . . . . . . . . . . . . . . . . . . . . . . . . . . . . . . . . . . . . . . . . . . . . . . . . . 44,959
EUR 134,000 USD 151,024 RBS 12/03/21 . . . . . . . . . . . . . . . . . . . . . . . . . . . . . . . . . . . . . . . . . . . . . . . . . . . . . . . . . . . . . . . . . . . . . . . . . . . . . . . . . . . 949
EUR 4,448,000 USD 4,983,650 UBS 12/03/21 . . . . . . . . . . . . . . . . . . . . . . . . . . . . . . . . . . . . . . . . . . . . . . . . . . . . . . . . . . . . . . . . . . . . . . . . . . . . . . . . . . . 60,920
USD 37,489 EUR 33,000 JPM 12/03/21 . . . . . . . . . . . . . . . . . . . . . . . . . . . . . . . . . . . . . . . . . . . . . . . . . . . . . . . . . . . . . . . . . . . . . . . . . . . . . . . . . . . 63
USD 6,253,187 EUR 5,400,400 MS 12/03/21 . . . . . . . . . . . . . . . . . . . . . . . . . . . . . . . . . . . . . . . . . . . . . . . . . . . . . . . . . . . . . . . . . . . . . . . . . . . . . . . . . . . 128,479
USD 56,371,225 EUR 48,678,600 SSB 12/03/21 . . . . . . . . . . . . . . . . . . . . . . . . . . . . . . . . . . . . . . . . . . . . . . . . . . . . . . . . . . . . . . . . . . . . . . . . . . . . . . . . . . . 1,163,795
USD 3,369,151 EUR 2,905,000 UBS 12/03/21 . . . . . . . . . . . . . . . . . . . . . . . . . . . . . . . . . . . . . . . . . . . . . . . . . . . . . . . . . . . . . . . . . . . . . . . . . . . . . . . . . . . 74,529
EUR 450,000 USD 507,283 BOA 01/05/22 . . . . . . . . . . . . . . . . . . . . . . . . . . . . . . . . . . . . . . . . . . . . . . . . . . . . . . . . . . . . . . . . . . . . . . . . . . . . . . . . . . . 3,825
1,905,429
EUR 1,455,000 USD 1,682,143 BNP 12/03/21 . . . . . . . . . . . . . . . . . . . . . . . . . . . . . . . . . . . . . . . . . . . . . . . . . . . . . . . . . . . . . . . . . . . . . . . . . . . . . . . . . . . (31,996)
EUR 2,929,000 USD 3,363,588 HSBC 12/03/21 . . . . . . . . . . . . . . . . . . . . . . . . . . . . . . . . . . . . . . . . . . . . . . . . . . . . . . . . . . . . . . . . . . . . . . . . . . . . . . . . . . . (41,747)
Schedule of Investments (unaudited)
November 30, 2021
iShares� Currency Hedged MSCI Germany ETF(Percentages shown are based on Net Assets)
6 NM0122U-1995964-8/159

Forward Foreign Currency Exchange Contracts (continued)
Currency Purchased Currency Sold Counterparty Settlement Date
UnrealizedAppreciation
(Depreciation)
USD 3,184,632 EUR 2,823,000 BOA 12/03/21 . . . . . . . . . . . . . . . . . . . . . . . . . . . . . . . . . . . . . . . . . . . . . . . . . . . . . . . . . . . . . . . . . . . . . . . . . . . . . . . . . . . $ (16,992)
USD 82,155 EUR 73,000 CITI 12/03/21 . . . . . . . . . . . . . . . . . . . . . . . . . . . . . . . . . . . . . . . . . . . . . . . . . . . . . . . . . . . . . . . . . . . . . . . . . . . . . . . . . . . (636)
USD 3,380,147 EUR 2,994,000 HSBC 12/03/21 . . . . . . . . . . . . . . . . . . . . . . . . . . . . . . . . . . . . . . . . . . . . . . . . . . . . . . . . . . . . . . . . . . . . . . . . . . . . . . . . . . . (15,412)
USD 1,692,714 EUR 1,495,000 JPM 12/03/21 . . . . . . . . . . . . . . . . . . . . . . . . . . . . . . . . . . . . . . . . . . . . . . . . . . . . . . . . . . . . . . . . . . . . . . . . . . . . . . . . . . . (2,797)
USD 56,535,220 EUR 50,152,600 BNP 01/05/22 . . . . . . . . . . . . . . . . . . . . . . . . . . . . . . . . . . . . . . . . . . . . . . . . . . . . . . . . . . . . . . . . . . . . . . . . . . . . . . . . . . . (427,870)
USD 5,955,771 EUR 5,283,400 MS 01/05/22 . . . . . . . . . . . . . . . . . . . . . . . . . . . . . . . . . . . . . . . . . . . . . . . . . . . . . . . . . . . . . . . . . . . . . . . . . . . . . . . . . . . (45,091)
USD 666,100 EUR 588,000 SSB 01/05/22 . . . . . . . . . . . . . . . . . . . . . . . . . . . . . . . . . . . . . . . . . . . . . . . . . . . . . . . . . . . . . . . . . . . . . . . . . . . . . . . . . . . (1,748)
(584,289)
Net unrealized appreciation . . . . . . . . . . . . . . . . . . . . . . . . . . . . . . . . . . . . . . . . . . . . . . . . . . . . . . . . . . . . . . . . . . . . . . . . . . . . . . . . . . . . . . . . . . . . . . . . . . . . . . . . . . . . . . . . . . . . . . . $ 1,321,140
Fair Value Measurements
Various inputs are used in determining the fair value of financial instruments. These inputs to valuation techniques are categorized into a fair value hierarchy consisting ofthree broad levels for financial reporting purposes as follows:
• Level 1 – Unadjusted price quotations in active markets/exchanges for identical assets or liabilities that each Fund has the ability to access;• Level 2 – Other observable inputs (including, but not limited to, quoted prices for similar assets or liabilities in markets that are active, quoted prices for identical or
similar assets or liabilities in markets that are not active, inputs other than quoted prices that are observable for the assets or liabilities (such as interest rates, yieldcurves, volatilities, prepayment speeds, loss severities, credit risks and default rates) or other market-corroborated inputs); and
• Level 3 – Unobservable inputs based on the best information available in the circumstances, to the extent observable inputs are not available (including the BlackRockGlobal Valuation Methodologies Committee’s (the “Global Valuation Committee’s”) assumptions used in determining the fair value of financial instruments).
The hierarchy gives the highest priority to unadjusted quoted prices in active markets for identical assets or liabilities (Level 1 measurements) and the lowest priority tounobservable inputs (Level 3 measurements). Accordingly, the degree of judgment exercised in determining fair value is greatest for instruments categorized in Level 3. Theinputs used to measure fair value may fall into different levels of the fair value hierarchy. In such cases, for disclosure purposes, the fair value hierarchy classification isdetermined based on the lowest level input that is significant to the fair value measurement in its entirety. Investments classified within Level 3 have significant unobservableinputs used by the Global Valuation Committee in determining the price for Fair Valued Investments. Level 3 investments include equity or debt issued by privately heldcompanies or funds. There may not be a secondary market, and/or there are a limited number of investors. The categorization of a value determined for financial instrumentsis based on the pricing transparency of the financial instruments and is not necessarily an indication of the risks associated with investing in those securities. For informationabout the Fund’s policy regarding valuation of financial instruments, refer to its most recent financial statements.
The following table summarizes the Fund’s financial instruments categorized in the fair value hierarchy. The breakdown of the Fund’s financial instruments into majorcategories is disclosed in the Schedule of Investments above.
Level 1 Level 2 Level 3 Total
InvestmentsAssets
Investment Companies . . . . . . . . . . . . . . . . . . . . . . . . . . . . . . . . . . . . . . . . . . . . . . . . . . . . . . . . . . . . . . . . . . . . . . . . . . . . . . . . . . $62,285,411 $ — $ — $62,285,411Money Market Funds . . . . . . . . . . . . . . . . . . . . . . . . . . . . . . . . . . . . . . . . . . . . . . . . . . . . . . . . . . . . . . . . . . . . . . . . . . . . . . . . . . . . 20,000 — — 20,000
$62,305,411 $ — $ — $62,305,411
Derivative financial instruments(a)
AssetsForward Foreign Currency Exchange Contracts. . . . . . . . . . . . . . . . . . . . . . . . . . . . . . . . . . . . . . . . . . . . . . . . . . . . . . . . . . . $ — $ 1,905,429 $ — $ 1,905,429
LiabilitiesForward Foreign Currency Exchange Contracts. . . . . . . . . . . . . . . . . . . . . . . . . . . . . . . . . . . . . . . . . . . . . . . . . . . . . . . . . . . — (584,289) — (584,289)
$ — $ 1,321,140 $ — $ 1,321,140
(a) Derivative financial instruments are forward foreign currency exchange contracts. Forward foreign currency exchange contracts are valued at the unrealized appreciation(depreciation) on the instrument.
Counterparty Abbreviations
BNP . . . . . . . . . . . . . BNP Paribas SABOA . . . . . . . . . . . . . Bank of America N.A.CITI . . . . . . . . . . . . . . Citibank N.A.HSBC . . . . . . . . . . . . HSBC Bank PLCJPM. . . . . . . . . . . . . . JPMorgan Chase Bank N.A.
MS. . . . . . . . . . . . . . . Morgan Stanley & Co. International PLCRBS . . . . . . . . . . . . . Royal Bank of Scotland PLCSSB. . . . . . . . . . . . . . State Street Bank and Trust Co.UBS . . . . . . . . . . . . . UBS AG
Schedule of Investments (unaudited) (continued)
November 30, 2021
iShares� Currency Hedged MSCI Germany ETF
7NM0122U-1995964-9/159

Currency Abbreviations
EUR . . . . . . . . . . . . . EuroUSD . . . . . . . . . . . . . United States Dollar
Schedule of Investments (unaudited) (continued)
November 30, 2021
iShares� Currency Hedged MSCI Germany ETF
8 NM0122U-1995964-10/159

Security Shares
Value
Investment CompaniesExchange-Traded Funds — 100.4%iShares MSCI Japan ETF(a) . . . . . . . . . . . . . . . . . . . . . . . . . . . . . . . 8,660,312 $ 574,438,495
Total Investment Companies — 100.4%(Cost: $588,477,087) . . . . . . . . . . . . . . . . . . . . . . . . . . . . . . . . . . . . . . . . . . . . . . 574,438,495
Total Investments in Securities — 100.4%(Cost: $588,477,087) . . . . . . . . . . . . . . . . . . . . . . . . . . . . . . . . . . . . . . . . . . . . . . 574,438,495
Other Assets, Less Liabilities — (0.4)%. . . . . . . . . . . . . . . . . . . . . . . . . . . . . . (2,354,555)
Net Assets — 100.0% . . . . . . . . . . . . . . . . . . . . . . . . . . . . . . . . . . . . . . . . . . . . . . . . $ 572,083,940
(a) Affiliate of the Fund.
Affiliates
Investments in issuers considered to be affiliate(s) of the Fund during the period ended November 30, 2021 for purposes of Section 2(a)(3) of the Investment Company Actof 1940, as amended, were as follows:
Affiliated IssuerValue at
08/31/21Purchases
at CostProceeds
from SalesNet Realized
Gain (Loss)
Change inUnrealized
Appreciation(Depreciation)
Value at11/30/21
SharesHeld at
11/30/21 Income
CapitalGain
Distributionsfrom
UnderlyingFunds
BlackRock Cash Funds: Treasury, SL AgencyShares(a) . . . . . . . . . . . . . . . . . . . . . . . . . . . . . . . . $ 210,000 $ — $ (210,000)(b) $ — $ — $ — — $ 8 $ —
iShares MSCI Japan ETF . . . . . . . . . . . . . . . . . . . 534,387,175 107,786,452 (49,292,884) 6,473,996 (24,916,244) 574,438,495 8,660,312 (52) —
$ 6,473,996 $ (24,916,244) $574,438,495 $ (44) $ —
(a) As of period end, the entity is no longer held.(b) Represents net amount purchased (sold).
Derivative Financial Instruments Outstanding as of Period End
Forward Foreign Currency Exchange Contracts
Currency Purchased Currency Sold Counterparty Settlement Date
UnrealizedAppreciation
(Depreciation)
JPY 922,447,000 USD 8,098,472 BNP 12/03/21 . . . . . . . . . . . . . . . . . . . . . . . . . . . . . . . . . . . . . . . . . . . . . . . . . . . . . . . . . . . . . . . . . . . . . . . . $ 62,281
JPY 61,487,290,400 USD 541,523,540 BOA 12/03/21 . . . . . . . . . . . . . . . . . . . . . . . . . . . . . . . . . . . . . . . . . . . . . . . . . . . . . . . . . . . . . . . . . . . . . . . . 2,445,522
JPY 931,738,000 USD 8,194,461 HSBC 12/03/21 . . . . . . . . . . . . . . . . . . . . . . . . . . . . . . . . . . . . . . . . . . . . . . . . . . . . . . . . . . . . . . . . . . . . . . . . 48,489
JPY 6,102,868,600 USD 53,749,101 MS 12/03/21 . . . . . . . . . . . . . . . . . . . . . . . . . . . . . . . . . . . . . . . . . . . . . . . . . . . . . . . . . . . . . . . . . . . . . . . . 242,085
JPY 1,120,914,000 USD 9,850,709 UBS 12/03/21 . . . . . . . . . . . . . . . . . . . . . . . . . . . . . . . . . . . . . . . . . . . . . . . . . . . . . . . . . . . . . . . . . . . . . . . . 65,853
JPY 2,236,169,000 USD 19,709,681 BNP 01/06/22 . . . . . . . . . . . . . . . . . . . . . . . . . . . . . . . . . . . . . . . . . . . . . . . . . . . . . . . . . . . . . . . . . . . . . . . . 88,485
2,952,715
USD 1,987,977 JPY 226,435,000 BNP 12/03/21 . . . . . . . . . . . . . . . . . . . . . . . . . . . . . . . . . . . . . . . . . . . . . . . . . . . . . . . . . . . . . . . . . . . . . . . . (15,260)
USD 56,579 JPY 6,453,000 BSCH 12/03/21 . . . . . . . . . . . . . . . . . . . . . . . . . . . . . . . . . . . . . . . . . . . . . . . . . . . . . . . . . . . . . . . . . . . . . . . . (510)
USD 4,076,682 JPY 467,969,000 HSBC 12/03/21 . . . . . . . . . . . . . . . . . . . . . . . . . . . . . . . . . . . . . . . . . . . . . . . . . . . . . . . . . . . . . . . . . . . . . . . . (63,371)
USD 6,429,326 JPY 734,824,000 JPM 12/03/21 . . . . . . . . . . . . . . . . . . . . . . . . . . . . . . . . . . . . . . . . . . . . . . . . . . . . . . . . . . . . . . . . . . . . . . . . (71,554)
USD 55,601,083 JPY 6,338,909,600 MS 12/03/21 . . . . . . . . . . . . . . . . . . . . . . . . . . . . . . . . . . . . . . . . . . . . . . . . . . . . . . . . . . . . . . . . . . . . . . . . (478,323)
USD 540,610,573 JPY 61,631,733,400 SSB 12/03/21 . . . . . . . . . . . . . . . . . . . . . . . . . . . . . . . . . . . . . . . . . . . . . . . . . . . . . . . . . . . . . . . . . . . . . . . . (4,636,355)
USD 10,144,915 JPY 1,158,934,000 UBS 12/03/21 . . . . . . . . . . . . . . . . . . . . . . . . . . . . . . . . . . . . . . . . . . . . . . . . . . . . . . . . . . . . . . . . . . . . . . . . (108,004)
USD 541,931,618 JPY 61,487,290,400 BOA 01/06/22 . . . . . . . . . . . . . . . . . . . . . . . . . . . . . . . . . . . . . . . . . . . . . . . . . . . . . . . . . . . . . . . . . . . . . . . . (2,452,822)
USD 53,789,472 JPY 6,102,868,600 MS 01/06/22 . . . . . . . . . . . . . . . . . . . . . . . . . . . . . . . . . . . . . . . . . . . . . . . . . . . . . . . . . . . . . . . . . . . . . . . . (242,942)
Schedule of Investments (unaudited)
November 30, 2021
iShares� Currency Hedged MSCI Japan ETF(Percentages shown are based on Net Assets)
9NM0122U-1995964-11/159

Forward Foreign Currency Exchange Contracts (continued)
Currency Purchased Currency Sold Counterparty Settlement Date
UnrealizedAppreciation
(Depreciation)
USD 5,987,010 JPY 677,156,000 UBS 01/06/22 . . . . . . . . . . . . . . . . . . . . . . . . . . . . . . . . . . . . . . . . . . . . . . . . . . . . . . . . . . . . . . . . . . . . . . . . $ (8,264)
(8,077,405)
Net unrealized depreciation . . . . . . . . . . . . . . . . . . . . . . . . . . . . . . . . . . . . . . . . . . . . . . . . . . . . . . . . . . . . . . . . . . . . . . . . . . . . . . . . . . . . . . . . . . . . . . . . . . . . . . . . . . . . . . . . . . . . . . . $ (5,124,690)
Fair Value Measurements
Various inputs are used in determining the fair value of financial instruments. These inputs to valuation techniques are categorized into a fair value hierarchy consisting ofthree broad levels for financial reporting purposes as follows:
• Level 1 – Unadjusted price quotations in active markets/exchanges for identical assets or liabilities that each Fund has the ability to access;• Level 2 – Other observable inputs (including, but not limited to, quoted prices for similar assets or liabilities in markets that are active, quoted prices for identical or
similar assets or liabilities in markets that are not active, inputs other than quoted prices that are observable for the assets or liabilities (such as interest rates, yieldcurves, volatilities, prepayment speeds, loss severities, credit risks and default rates) or other market-corroborated inputs); and
• Level 3 – Unobservable inputs based on the best information available in the circumstances, to the extent observable inputs are not available (including the BlackRockGlobal Valuation Methodologies Committee’s (the “Global Valuation Committee’s”) assumptions used in determining the fair value of financial instruments).
The hierarchy gives the highest priority to unadjusted quoted prices in active markets for identical assets or liabilities (Level 1 measurements) and the lowest priority tounobservable inputs (Level 3 measurements). Accordingly, the degree of judgment exercised in determining fair value is greatest for instruments categorized in Level 3. Theinputs used to measure fair value may fall into different levels of the fair value hierarchy. In such cases, for disclosure purposes, the fair value hierarchy classification isdetermined based on the lowest level input that is significant to the fair value measurement in its entirety. Investments classified within Level 3 have significant unobservableinputs used by the Global Valuation Committee in determining the price for Fair Valued Investments. Level 3 investments include equity or debt issued by privately heldcompanies or funds. There may not be a secondary market, and/or there are a limited number of investors. The categorization of a value determined for financial instrumentsis based on the pricing transparency of the financial instruments and is not necessarily an indication of the risks associated with investing in those securities. For informationabout the Fund’s policy regarding valuation of financial instruments, refer to its most recent financial statements.
The following table summarizes the Fund’s financial instruments categorized in the fair value hierarchy. The breakdown of the Fund’s financial instruments into majorcategories is disclosed in the Schedule of Investments above.
Level 1 Level 2 Level 3 Total
InvestmentsAssets
Investment Companies . . . . . . . . . . . . . . . . . . . . . . . . . . . . . . . . . . . . . . . . . . . . . . . . . . . . . . . . . . . . . . . . . . . . . . . . . . . . . $574,438,495 $ — $ — $574,438,495
Derivative financial instruments(a)
AssetsForward Foreign Currency Exchange Contracts . . . . . . . . . . . . . . . . . . . . . . . . . . . . . . . . . . . . . . . . . . . . . . . . . . . . . . $ — $ 2,952,715 $ — $ 2,952,715
LiabilitiesForward Foreign Currency Exchange Contracts . . . . . . . . . . . . . . . . . . . . . . . . . . . . . . . . . . . . . . . . . . . . . . . . . . . . . . — (8,077,405) — (8,077,405)
$ — $ (5,124,690) $ — $ (5,124,690)
(a) Derivative financial instruments are forward foreign currency exchange contracts. Forward foreign currency exchange contracts are valued at the unrealized appreciation(depreciation) on the instrument.
Counterparty Abbreviations
BNP . . . . . . . . . . . . . BNP Paribas SABOA . . . . . . . . . . . . . Bank of America N.A.BSCH . . . . . . . . . . . . Banco Santander Central HispanoHSBC . . . . . . . . . . . . HSBC Bank PLC
JPM. . . . . . . . . . . . . . JPMorgan Chase Bank N.A.MS. . . . . . . . . . . . . . . Morgan Stanley & Co. International PLCSSB. . . . . . . . . . . . . . State Street Bank and Trust Co.UBS . . . . . . . . . . . . . UBS AG
Currency Abbreviations
JPY . . . . . . . . . . . . . . Japanese YenUSD . . . . . . . . . . . . . United States Dollar
Schedule of Investments (unaudited) (continued)
November 30, 2021
iShares� Currency Hedged MSCI Japan ETF
10 NM0122U-1995964-12/159
Security Shares
Value
Investment CompaniesExchange-Traded Funds — 100.4%iShares MSCI United Kingdom ETF(a) . . . . . . . . . . . . . . . . . . . . . . . . . 412,192 $ 13,206,632
Total Investment Companies — 100.4%(Cost: $13,696,947). . . . . . . . . . . . . . . . . . . . . . . . . . . . . . . . . . . . . . . . . . . . . . . . . 13,206,632
Total Investments in Securities — 100.4%(Cost: $13,696,947). . . . . . . . . . . . . . . . . . . . . . . . . . . . . . . . . . . . . . . . . . . . . . . . . 13,206,632
Other Assets, Less Liabilities — (0.4)% . . . . . . . . . . . . . . . . . . . . . . . . . . . . . . . (58,289)
Net Assets — 100.0% . . . . . . . . . . . . . . . . . . . . . . . . . . . . . . . . . . . . . . . . . . . . . . . . . $ 13,148,343
(a) Affiliate of the Fund.
Affiliates
Investments in issuers considered to be affiliate(s) of the Fund during the period ended November 30, 2021 for purposes of Section 2(a)(3) of the Investment Company Actof 1940, as amended, were as follows:
Affiliated IssuerValue at
08/31/21Purchases
at CostProceeds
from SalesNet Realized
Gain (Loss)
Change inUnrealized
Appreciation(Depreciation)
Value at11/30/21
SharesHeld at
11/30/21 Income
CapitalGain
Distributionsfrom
UnderlyingFunds
BlackRock Cash Funds: Treasury, SL Agency Shares(a). $ — $ 0(b) $ — $ — $ — $ — — $ — $ —iShares MSCI United Kingdom ETF. . . . . . . . . . . . . . . . . . . . 8,253,193 5,637,204 (249,385) (6,576) (427,804) 13,206,632 412,192 — —
$ (6,576) $ (427,804) $13,206,632 $ — $ —
(a) As of period end, the entity is no longer held.(b) Represents net amount purchased (sold).
Derivative Financial Instruments Outstanding as of Period End
Forward Foreign Currency Exchange Contracts
Currency Purchased Currency Sold Counterparty Settlement Date
UnrealizedAppreciation
(Depreciation)
GBP 9,792,000 USD 12,954,732 MS 12/03/21 . . . . . . . . . . . . . . . . . . . . . . . . . . . . . . . . . . . . . . . . . . . . . . . . . . . . . . . . . . . . . . . . . . . . . . . . . . . . . . . . . . . $ 68,152
USD 13,429,452 GBP 9,797,000 MS 12/03/21 . . . . . . . . . . . . . . . . . . . . . . . . . . . . . . . . . . . . . . . . . . . . . . . . . . . . . . . . . . . . . . . . . . . . . . . . . . . . . . . . . . . 399,919
468,071
GBP 5,000 USD 6,849 MS 12/03/21 . . . . . . . . . . . . . . . . . . . . . . . . . . . . . . . . . . . . . . . . . . . . . . . . . . . . . . . . . . . . . . . . . . . . . . . . . . . . . . . . . . . (199)
USD 13,261,794 GBP 10,015,000 MS 01/05/22 . . . . . . . . . . . . . . . . . . . . . . . . . . . . . . . . . . . . . . . . . . . . . . . . . . . . . . . . . . . . . . . . . . . . . . . . . . . . . . . . . . . (69,026)
(69,225)
Net unrealized appreciation . . . . . . . . . . . . . . . . . . . . . . . . . . . . . . . . . . . . . . . . . . . . . . . . . . . . . . . . . . . . . . . . . . . . . . . . . . . . . . . . . . . . . . . . . . . . . . . . . . . . . . . . . . . . . . . . . . . . . . . $ 398,846
Fair Value Measurements
Various inputs are used in determining the fair value of financial instruments. These inputs to valuation techniques are categorized into a fair value hierarchy consisting ofthree broad levels for financial reporting purposes as follows:
• Level 1 – Unadjusted price quotations in active markets/exchanges for identical assets or liabilities that each Fund has the ability to access;• Level 2 – Other observable inputs (including, but not limited to, quoted prices for similar assets or liabilities in markets that are active, quoted prices for identical or
similar assets or liabilities in markets that are not active, inputs other than quoted prices that are observable for the assets or liabilities (such as interest rates, yieldcurves, volatilities, prepayment speeds, loss severities, credit risks and default rates) or other market-corroborated inputs); and
• Level 3 – Unobservable inputs based on the best information available in the circumstances, to the extent observable inputs are not available (including the BlackRockGlobal Valuation Methodologies Committee’s (the “Global Valuation Committee’s”) assumptions used in determining the fair value of financial instruments).
Schedule of Investments (unaudited)
November 30, 2021
iShares� Currency Hedged MSCI United Kingdom ETF(Percentages shown are based on Net Assets)
11NM0122U-1995964-13/159

Fair Value Measurements (continued)
The hierarchy gives the highest priority to unadjusted quoted prices in active markets for identical assets or liabilities (Level 1 measurements) and the lowest priority tounobservable inputs (Level 3 measurements). Accordingly, the degree of judgment exercised in determining fair value is greatest for instruments categorized in Level 3. Theinputs used to measure fair value may fall into different levels of the fair value hierarchy. In such cases, for disclosure purposes, the fair value hierarchy classification isdetermined based on the lowest level input that is significant to the fair value measurement in its entirety. Investments classified within Level 3 have significant unobservableinputs used by the Global Valuation Committee in determining the price for Fair Valued Investments. Level 3 investments include equity or debt issued by privately heldcompanies or funds. There may not be a secondary market, and/or there are a limited number of investors. The categorization of a value determined for financial instrumentsis based on the pricing transparency of the financial instruments and is not necessarily an indication of the risks associated with investing in those securities. For informationabout the Fund’s policy regarding valuation of financial instruments, refer to its most recent financial statements.
The following table summarizes the Fund’s financial instruments categorized in the fair value hierarchy. The breakdown of the Fund’s financial instruments into majorcategories is disclosed in the Schedule of Investments above.
Level 1 Level 2 Level 3 Total
InvestmentsAssets
Investment Companies . . . . . . . . . . . . . . . . . . . . . . . . . . . . . . . . . . . . . . . . . . . . . . . . . . . . . . . . . . . . . . . . . . . . . . . . . . . . . . . . . . $13,206,632 $ — $ — $13,206,632
Derivative financial instruments(a)
AssetsForward Foreign Currency Exchange Contracts. . . . . . . . . . . . . . . . . . . . . . . . . . . . . . . . . . . . . . . . . . . . . . . . . . . . . . . . . . . $ — $ 468,071 $ — $ 468,071
LiabilitiesForward Foreign Currency Exchange Contracts. . . . . . . . . . . . . . . . . . . . . . . . . . . . . . . . . . . . . . . . . . . . . . . . . . . . . . . . . . . — (69,225) — (69,225)
$ — $ 398,846 $ — $ 398,846
(a) Derivative financial instruments are forward foreign currency exchange contracts. Forward foreign currency exchange contracts are valued at the unrealized appreciation(depreciation) on the instrument.
Counterparty Abbreviations
MS. . . . . . . . . . . . . . . Morgan Stanley & Co. International PLC
Currency Abbreviations
GBP . . . . . . . . . . . . . British PoundUSD . . . . . . . . . . . . . United States Dollar
Schedule of Investments (unaudited) (continued)
November 30, 2021
iShares� Currency Hedged MSCI United Kingdom ETF
12 NM0122U-1995964-14/159

Security Shares
Value
Common StocksAustralia — 5.4%Afterpay Ltd.(a) . . . . . . . . . . . . . . . . . . . . . . . . . . . . . . . . . . . . . . . . . . . . 7,021 $ 537,673ASX Ltd.. . . . . . . . . . . . . . . . . . . . . . . . . . . . . . . . . . . . . . . . . . . . . . . . . . 6,665 425,978Aurizon Holdings Ltd. . . . . . . . . . . . . . . . . . . . . . . . . . . . . . . . . . . . . . 67,055 160,360Australia & New Zealand Banking Group Ltd.. . . . . . . . . . . . . . . 94,321 1,782,863BlueScope Steel Ltd. . . . . . . . . . . . . . . . . . . . . . . . . . . . . . . . . . . . . . . 15,718 218,469Brambles Ltd.. . . . . . . . . . . . . . . . . . . . . . . . . . . . . . . . . . . . . . . . . . . . . 47,260 334,822Cochlear Ltd. . . . . . . . . . . . . . . . . . . . . . . . . . . . . . . . . . . . . . . . . . . . . . 2,124 326,604Computershare Ltd. . . . . . . . . . . . . . . . . . . . . . . . . . . . . . . . . . . . . . . . 15,587 210,667CSL Ltd.. . . . . . . . . . . . . . . . . . . . . . . . . . . . . . . . . . . . . . . . . . . . . . . . . . 14,806 3,219,379Dexus . . . . . . . . . . . . . . . . . . . . . . . . . . . . . . . . . . . . . . . . . . . . . . . . . . . . 31,819 251,511Evolution Mining Ltd. . . . . . . . . . . . . . . . . . . . . . . . . . . . . . . . . . . . . . . 57,531 164,427Fortescue Metals Group Ltd. . . . . . . . . . . . . . . . . . . . . . . . . . . . . . . 54,767 657,684Goodman Group . . . . . . . . . . . . . . . . . . . . . . . . . . . . . . . . . . . . . . . . . . 54,777 956,088GPT Group (The) . . . . . . . . . . . . . . . . . . . . . . . . . . . . . . . . . . . . . . . . . 60,218 224,688IDP Education Ltd. . . . . . . . . . . . . . . . . . . . . . . . . . . . . . . . . . . . . . . . . 6,651 165,846Insurance Australia Group Ltd.. . . . . . . . . . . . . . . . . . . . . . . . . . . . . 77,317 242,861James Hardie Industries PLC. . . . . . . . . . . . . . . . . . . . . . . . . . . . . . 14,176 555,620Lendlease Corp. Ltd. . . . . . . . . . . . . . . . . . . . . . . . . . . . . . . . . . . . . . . 21,330 160,762Magellan Financial Group Ltd. . . . . . . . . . . . . . . . . . . . . . . . . . . . . . 5,365 125,578Medibank Pvt Ltd.. . . . . . . . . . . . . . . . . . . . . . . . . . . . . . . . . . . . . . . . . 85,328 208,481Mirvac Group . . . . . . . . . . . . . . . . . . . . . . . . . . . . . . . . . . . . . . . . . . . . . 118,808 240,551Newcrest Mining Ltd. . . . . . . . . . . . . . . . . . . . . . . . . . . . . . . . . . . . . . . 25,433 421,892Northern Star Resources Ltd.. . . . . . . . . . . . . . . . . . . . . . . . . . . . . . 38,586 257,594Orica Ltd.. . . . . . . . . . . . . . . . . . . . . . . . . . . . . . . . . . . . . . . . . . . . . . . . . 12,114 121,253QBE Insurance Group Ltd. . . . . . . . . . . . . . . . . . . . . . . . . . . . . . . . . 47,076 387,323Ramsay Health Care Ltd.. . . . . . . . . . . . . . . . . . . . . . . . . . . . . . . . . . 5,721 270,785REA Group Ltd. . . . . . . . . . . . . . . . . . . . . . . . . . . . . . . . . . . . . . . . . . . . 1,675 191,747Reece Ltd.. . . . . . . . . . . . . . . . . . . . . . . . . . . . . . . . . . . . . . . . . . . . . . . . 9,720 160,642Scentre Group . . . . . . . . . . . . . . . . . . . . . . . . . . . . . . . . . . . . . . . . . . . . 159,124 348,262SEEK Ltd. . . . . . . . . . . . . . . . . . . . . . . . . . . . . . . . . . . . . . . . . . . . . . . . . 11,306 277,422Sonic Healthcare Ltd. . . . . . . . . . . . . . . . . . . . . . . . . . . . . . . . . . . . . . 14,631 442,405Stockland. . . . . . . . . . . . . . . . . . . . . . . . . . . . . . . . . . . . . . . . . . . . . . . . . 74,841 231,056Suncorp Group Ltd. . . . . . . . . . . . . . . . . . . . . . . . . . . . . . . . . . . . . . . . 44,918 344,165Sydney Airport(a) . . . . . . . . . . . . . . . . . . . . . . . . . . . . . . . . . . . . . . . . . . 42,055 247,691Transurban Group . . . . . . . . . . . . . . . . . . . . . . . . . . . . . . . . . . . . . . . . 100,663 971,703Vicinity Centres . . . . . . . . . . . . . . . . . . . . . . . . . . . . . . . . . . . . . . . . . . . 118,669 142,217WiseTech Global Ltd. . . . . . . . . . . . . . . . . . . . . . . . . . . . . . . . . . . . . . 4,417 161,806
16,148,875Austria — 0.2%Erste Group Bank AG . . . . . . . . . . . . . . . . . . . . . . . . . . . . . . . . . . . . . 11,164 489,130Raiffeisen Bank International AG. . . . . . . . . . . . . . . . . . . . . . . . . . . 4,190 124,610voestalpine AG . . . . . . . . . . . . . . . . . . . . . . . . . . . . . . . . . . . . . . . . . . . 3,522 118,859
732,599Belgium — 0.7%Ageas SA/NV. . . . . . . . . . . . . . . . . . . . . . . . . . . . . . . . . . . . . . . . . . . . . 5,895 304,860Elia Group SA/NV. . . . . . . . . . . . . . . . . . . . . . . . . . . . . . . . . . . . . . . . . 1,181 147,130Groupe Bruxelles Lambert SA . . . . . . . . . . . . . . . . . . . . . . . . . . . . . 3,656 397,039KBC Group NV . . . . . . . . . . . . . . . . . . . . . . . . . . . . . . . . . . . . . . . . . . . 8,101 680,001Proximus SADP . . . . . . . . . . . . . . . . . . . . . . . . . . . . . . . . . . . . . . . . . . 4,050 73,617Solvay SA . . . . . . . . . . . . . . . . . . . . . . . . . . . . . . . . . . . . . . . . . . . . . . . . 2,395 267,973Umicore SA . . . . . . . . . . . . . . . . . . . . . . . . . . . . . . . . . . . . . . . . . . . . . . 6,207 303,516
2,174,136China — 0.1%Chow Tai Fook Jewellery Group Ltd. . . . . . . . . . . . . . . . . . . . . . . . 62,800 112,286SITC International Holdings Co. Ltd. . . . . . . . . . . . . . . . . . . . . . . . 43,000 171,672
283,958
Security Shares
Value
Denmark — 4.0%Ambu A/S, Class B(b). . . . . . . . . . . . . . . . . . . . . . . . . . . . . . . . . . . . . . 4,635 $ 131,461AP Moller - Maersk A/S, Class A . . . . . . . . . . . . . . . . . . . . . . . . . . . 92 263,299AP Moller - Maersk A/S, Class B, NVS . . . . . . . . . . . . . . . . . . . . . 185 556,993Chr Hansen Holding A/S . . . . . . . . . . . . . . . . . . . . . . . . . . . . . . . . . . 3,376 251,174Demant A/S(a) . . . . . . . . . . . . . . . . . . . . . . . . . . . . . . . . . . . . . . . . . . . . 3,376 161,908DSV A/S. . . . . . . . . . . . . . . . . . . . . . . . . . . . . . . . . . . . . . . . . . . . . . . . . . 6,503 1,415,870Genmab A/S(a) . . . . . . . . . . . . . . . . . . . . . . . . . . . . . . . . . . . . . . . . . . . . 2,153 834,377GN Store Nord A/S. . . . . . . . . . . . . . . . . . . . . . . . . . . . . . . . . . . . . . . . 4,150 238,999Novo Nordisk A/S, Class B . . . . . . . . . . . . . . . . . . . . . . . . . . . . . . . . 54,320 5,814,954Novozymes A/S, Class B . . . . . . . . . . . . . . . . . . . . . . . . . . . . . . . . . . 6,672 506,701Pandora A/S . . . . . . . . . . . . . . . . . . . . . . . . . . . . . . . . . . . . . . . . . . . . . . 3,288 409,101Rockwool International A/S, Class B . . . . . . . . . . . . . . . . . . . . . . . 276 114,712Tryg A/S . . . . . . . . . . . . . . . . . . . . . . . . . . . . . . . . . . . . . . . . . . . . . . . . . . 11,265 273,214Vestas Wind Systems A/S . . . . . . . . . . . . . . . . . . . . . . . . . . . . . . . . . 32,740 1,099,303
12,072,066Finland — 1.7%Elisa OYJ. . . . . . . . . . . . . . . . . . . . . . . . . . . . . . . . . . . . . . . . . . . . . . . . . 5,090 305,639Kesko OYJ, Class B . . . . . . . . . . . . . . . . . . . . . . . . . . . . . . . . . . . . . . 9,047 284,051Kone OYJ, Class B . . . . . . . . . . . . . . . . . . . . . . . . . . . . . . . . . . . . . . . 11,162 733,284Nokia OYJ(a). . . . . . . . . . . . . . . . . . . . . . . . . . . . . . . . . . . . . . . . . . . . . . 175,337 982,703Nordea Bank Abp . . . . . . . . . . . . . . . . . . . . . . . . . . . . . . . . . . . . . . . . . 104,785 1,240,965Orion OYJ, Class B . . . . . . . . . . . . . . . . . . . . . . . . . . . . . . . . . . . . . . . 3,161 130,120Sampo OYJ, Class A. . . . . . . . . . . . . . . . . . . . . . . . . . . . . . . . . . . . . . 16,390 804,214Stora Enso OYJ, Class R. . . . . . . . . . . . . . . . . . . . . . . . . . . . . . . . . . 18,998 321,621Wartsila OYJ Abp . . . . . . . . . . . . . . . . . . . . . . . . . . . . . . . . . . . . . . . . . 15,095 209,114
5,011,711France — 9.7%Accor SA(a) . . . . . . . . . . . . . . . . . . . . . . . . . . . . . . . . . . . . . . . . . . . . . . . 5,806 172,116Aeroports de Paris(a) . . . . . . . . . . . . . . . . . . . . . . . . . . . . . . . . . . . . . . 1,064 124,391Air Liquide SA . . . . . . . . . . . . . . . . . . . . . . . . . . . . . . . . . . . . . . . . . . . . 15,266 2,521,066Amundi SA(c) . . . . . . . . . . . . . . . . . . . . . . . . . . . . . . . . . . . . . . . . . . . . . 1,972 164,058Arkema SA . . . . . . . . . . . . . . . . . . . . . . . . . . . . . . . . . . . . . . . . . . . . . . . 2,079 272,602BioMerieux . . . . . . . . . . . . . . . . . . . . . . . . . . . . . . . . . . . . . . . . . . . . . . . 1,352 191,312BNP Paribas SA . . . . . . . . . . . . . . . . . . . . . . . . . . . . . . . . . . . . . . . . . . 36,688 2,280,145Bouygues SA . . . . . . . . . . . . . . . . . . . . . . . . . . . . . . . . . . . . . . . . . . . . . 7,300 246,557Bureau Veritas SA . . . . . . . . . . . . . . . . . . . . . . . . . . . . . . . . . . . . . . . . 9,138 289,403Capgemini SE . . . . . . . . . . . . . . . . . . . . . . . . . . . . . . . . . . . . . . . . . . . . 5,325 1,229,391Carrefour SA . . . . . . . . . . . . . . . . . . . . . . . . . . . . . . . . . . . . . . . . . . . . . 19,261 318,583Cie. Generale des Etablissements Michelin SCA . . . . . . . . . . . 5,611 828,017CNP Assurances. . . . . . . . . . . . . . . . . . . . . . . . . . . . . . . . . . . . . . . . . . 5,638 137,449Covivio . . . . . . . . . . . . . . . . . . . . . . . . . . . . . . . . . . . . . . . . . . . . . . . . . . . 1,716 142,194Credit Agricole SA . . . . . . . . . . . . . . . . . . . . . . . . . . . . . . . . . . . . . . . . 37,826 515,066Danone SA . . . . . . . . . . . . . . . . . . . . . . . . . . . . . . . . . . . . . . . . . . . . . . . 21,703 1,276,430Dassault Systemes SE . . . . . . . . . . . . . . . . . . . . . . . . . . . . . . . . . . . . 21,789 1,313,462Edenred . . . . . . . . . . . . . . . . . . . . . . . . . . . . . . . . . . . . . . . . . . . . . . . . . . 8,293 370,974Eiffage SA . . . . . . . . . . . . . . . . . . . . . . . . . . . . . . . . . . . . . . . . . . . . . . . . 2,617 243,739Eurazeo SE . . . . . . . . . . . . . . . . . . . . . . . . . . . . . . . . . . . . . . . . . . . . . . 1,396 114,482Eurofins Scientific SE . . . . . . . . . . . . . . . . . . . . . . . . . . . . . . . . . . . . . 4,255 544,341Gecina SA. . . . . . . . . . . . . . . . . . . . . . . . . . . . . . . . . . . . . . . . . . . . . . . . 1,355 182,573Getlink SE . . . . . . . . . . . . . . . . . . . . . . . . . . . . . . . . . . . . . . . . . . . . . . . . 14,060 207,737Hermes International . . . . . . . . . . . . . . . . . . . . . . . . . . . . . . . . . . . . . . 1,027 1,927,273Ipsen SA . . . . . . . . . . . . . . . . . . . . . . . . . . . . . . . . . . . . . . . . . . . . . . . . . 1,229 119,944Klepierre SA . . . . . . . . . . . . . . . . . . . . . . . . . . . . . . . . . . . . . . . . . . . . . . 6,448 135,684Legrand SA. . . . . . . . . . . . . . . . . . . . . . . . . . . . . . . . . . . . . . . . . . . . . . . 9,006 989,354L'Oreal SA. . . . . . . . . . . . . . . . . . . . . . . . . . . . . . . . . . . . . . . . . . . . . . . . 8,108 3,661,066Orpea SA. . . . . . . . . . . . . . . . . . . . . . . . . . . . . . . . . . . . . . . . . . . . . . . . . 1,718 162,338Publicis Groupe SA . . . . . . . . . . . . . . . . . . . . . . . . . . . . . . . . . . . . . . . 6,885 445,520Sartorius Stedim Biotech . . . . . . . . . . . . . . . . . . . . . . . . . . . . . . . . . . 900 531,338Schneider Electric SE . . . . . . . . . . . . . . . . . . . . . . . . . . . . . . . . . . . . . 17,436 3,094,435
Schedule of Investments (unaudited)
November 30, 2021
iShares� ESG Advanced MSCI EAFE ETF(Percentages shown are based on Net Assets)
13NM0122U-1995964-15/159

Security Shares
Value
France (continued)SEB SA . . . . . . . . . . . . . . . . . . . . . . . . . . . . . . . . . . . . . . . . . . . . . . . . . . 900 $ 133,391Societe Generale SA. . . . . . . . . . . . . . . . . . . . . . . . . . . . . . . . . . . . . . 26,732 831,828Sodexo SA(a) . . . . . . . . . . . . . . . . . . . . . . . . . . . . . . . . . . . . . . . . . . . . . 2,934 246,860Suez SA. . . . . . . . . . . . . . . . . . . . . . . . . . . . . . . . . . . . . . . . . . . . . . . . . . 11,031 246,890Ubisoft Entertainment SA(a). . . . . . . . . . . . . . . . . . . . . . . . . . . . . . . . 2,953 151,360Unibail-Rodamco-Westfield(a). . . . . . . . . . . . . . . . . . . . . . . . . . . . . . 4,010 263,941Valeo. . . . . . . . . . . . . . . . . . . . . . . . . . . . . . . . . . . . . . . . . . . . . . . . . . . . . 7,789 224,516Vinci SA . . . . . . . . . . . . . . . . . . . . . . . . . . . . . . . . . . . . . . . . . . . . . . . . . . 17,137 1,625,939Vivendi SE . . . . . . . . . . . . . . . . . . . . . . . . . . . . . . . . . . . . . . . . . . . . . . . 22,500 286,535Wendel SE . . . . . . . . . . . . . . . . . . . . . . . . . . . . . . . . . . . . . . . . . . . . . . . 905 103,479Worldline SA(a)(c). . . . . . . . . . . . . . . . . . . . . . . . . . . . . . . . . . . . . . . . . . 7,703 403,866
29,271,645Germany — 7.2%adidas AG . . . . . . . . . . . . . . . . . . . . . . . . . . . . . . . . . . . . . . . . . . . . . . . . 6,243 1,805,586Allianz SE, Registered . . . . . . . . . . . . . . . . . . . . . . . . . . . . . . . . . . . . 13,293 2,884,942Aroundtown SA . . . . . . . . . . . . . . . . . . . . . . . . . . . . . . . . . . . . . . . . . . . 31,831 191,328Bayerische Motoren Werke AG . . . . . . . . . . . . . . . . . . . . . . . . . . . . 10,845 1,039,530Bechtle AG . . . . . . . . . . . . . . . . . . . . . . . . . . . . . . . . . . . . . . . . . . . . . . . 2,850 205,455Beiersdorf AG. . . . . . . . . . . . . . . . . . . . . . . . . . . . . . . . . . . . . . . . . . . . . 3,215 319,771Brenntag SE. . . . . . . . . . . . . . . . . . . . . . . . . . . . . . . . . . . . . . . . . . . . . . 4,908 420,372Carl Zeiss Meditec AG, Bearer. . . . . . . . . . . . . . . . . . . . . . . . . . . . . 1,350 270,472Commerzbank AG(a) . . . . . . . . . . . . . . . . . . . . . . . . . . . . . . . . . . . . . . 33,185 233,075Covestro AG(c) . . . . . . . . . . . . . . . . . . . . . . . . . . . . . . . . . . . . . . . . . . . . 6,350 358,143Delivery Hero SE(a)(c) . . . . . . . . . . . . . . . . . . . . . . . . . . . . . . . . . . . . . 5,161 688,909Deutsche Boerse AG. . . . . . . . . . . . . . . . . . . . . . . . . . . . . . . . . . . . . . 6,301 989,402Deutsche Post AG, Registered . . . . . . . . . . . . . . . . . . . . . . . . . . . . 32,917 1,944,129Evonik Industries AG . . . . . . . . . . . . . . . . . . . . . . . . . . . . . . . . . . . . . . 7,246 217,868GEA Group AG . . . . . . . . . . . . . . . . . . . . . . . . . . . . . . . . . . . . . . . . . . . 4,545 230,012Hannover Rueck SE . . . . . . . . . . . . . . . . . . . . . . . . . . . . . . . . . . . . . . 1,984 346,766HeidelbergCement AG . . . . . . . . . . . . . . . . . . . . . . . . . . . . . . . . . . . . 4,597 305,845HelloFresh SE(a) . . . . . . . . . . . . . . . . . . . . . . . . . . . . . . . . . . . . . . . . . . 5,454 553,143Henkel AG & Co. KGaA . . . . . . . . . . . . . . . . . . . . . . . . . . . . . . . . . . . 3,384 251,319Infineon Technologies AG . . . . . . . . . . . . . . . . . . . . . . . . . . . . . . . . . 41,886 1,893,811KION Group AG . . . . . . . . . . . . . . . . . . . . . . . . . . . . . . . . . . . . . . . . . . 2,115 227,403Knorr-Bremse AG . . . . . . . . . . . . . . . . . . . . . . . . . . . . . . . . . . . . . . . . . 2,215 220,335LANXESS AG . . . . . . . . . . . . . . . . . . . . . . . . . . . . . . . . . . . . . . . . . . . . 2,990 173,156LEG Immobilien SE . . . . . . . . . . . . . . . . . . . . . . . . . . . . . . . . . . . . . . . 2,215 309,924Merck KGaA. . . . . . . . . . . . . . . . . . . . . . . . . . . . . . . . . . . . . . . . . . . . . . 4,258 1,052,386Muenchener Rueckversicherungs-Gesellschaft AG in
Muenchen, Registered . . . . . . . . . . . . . . . . . . . . . . . . . . . . . . . . . 4,718 1,268,597Nemetschek SE . . . . . . . . . . . . . . . . . . . . . . . . . . . . . . . . . . . . . . . . . . 1,714 216,620Puma SE . . . . . . . . . . . . . . . . . . . . . . . . . . . . . . . . . . . . . . . . . . . . . . . . . 3,391 409,705Rational AG . . . . . . . . . . . . . . . . . . . . . . . . . . . . . . . . . . . . . . . . . . . . . . 138 127,121Scout24 SE(c). . . . . . . . . . . . . . . . . . . . . . . . . . . . . . . . . . . . . . . . . . . . . 2,856 189,544Symrise AG. . . . . . . . . . . . . . . . . . . . . . . . . . . . . . . . . . . . . . . . . . . . . . . 4,103 577,177Telefonica Deutschland Holding AG . . . . . . . . . . . . . . . . . . . . . . . . 30,831 82,230Vonovia SE . . . . . . . . . . . . . . . . . . . . . . . . . . . . . . . . . . . . . . . . . . . . . . . 17,928 994,933Zalando SE(a)(c) . . . . . . . . . . . . . . . . . . . . . . . . . . . . . . . . . . . . . . . . . . . 7,263 660,523
21,659,532Hong Kong — 3.6%AIA Group Ltd. . . . . . . . . . . . . . . . . . . . . . . . . . . . . . . . . . . . . . . . . . . . . 396,000 4,168,867BOC Hong Kong Holdings Ltd. . . . . . . . . . . . . . . . . . . . . . . . . . . . . 116,000 350,646CK Asset Holdings Ltd. . . . . . . . . . . . . . . . . . . . . . . . . . . . . . . . . . . . . 64,000 366,043ESR Cayman Ltd.(a)(c) . . . . . . . . . . . . . . . . . . . . . . . . . . . . . . . . . . . . . 65,600 216,558Hang Lung Properties Ltd.. . . . . . . . . . . . . . . . . . . . . . . . . . . . . . . . . 92,000 182,396Hang Seng Bank Ltd. . . . . . . . . . . . . . . . . . . . . . . . . . . . . . . . . . . . . . 27,000 477,450HKT Trust & HKT Ltd., Class SS . . . . . . . . . . . . . . . . . . . . . . . . . . . 135,000 182,729Hong Kong Exchanges & Clearing Ltd.. . . . . . . . . . . . . . . . . . . . . 35,800 1,968,693Link REIT. . . . . . . . . . . . . . . . . . . . . . . . . . . . . . . . . . . . . . . . . . . . . . . . . 67,400 584,275
Security Shares
Value
Hong Kong (continued)MTR Corp. Ltd.(b) . . . . . . . . . . . . . . . . . . . . . . . . . . . . . . . . . . . . . . . . . 48,500 $ 258,317New World Development Co. Ltd. . . . . . . . . . . . . . . . . . . . . . . . . . . 45,000 177,680Sino Land Co. Ltd. . . . . . . . . . . . . . . . . . . . . . . . . . . . . . . . . . . . . . . . . 106,000 126,198Sun Hung Kai Properties Ltd. . . . . . . . . . . . . . . . . . . . . . . . . . . . . . . 46,000 560,127Swire Properties Ltd. . . . . . . . . . . . . . . . . . . . . . . . . . . . . . . . . . . . . . . 36,000 85,446Techtronic Industries Co. Ltd. . . . . . . . . . . . . . . . . . . . . . . . . . . . . . . 45,000 925,502Wharf Real Estate Investment Co. Ltd. . . . . . . . . . . . . . . . . . . . . . 47,000 237,271
10,868,198Ireland — 0.8%CRH PLC. . . . . . . . . . . . . . . . . . . . . . . . . . . . . . . . . . . . . . . . . . . . . . . . . 25,900 1,259,120Kerry Group PLC, Class A. . . . . . . . . . . . . . . . . . . . . . . . . . . . . . . . . 5,182 638,232Smurfit Kappa Group PLC. . . . . . . . . . . . . . . . . . . . . . . . . . . . . . . . . 7,609 390,000
2,287,352Israel — 0.9%Bank Hapoalim BM . . . . . . . . . . . . . . . . . . . . . . . . . . . . . . . . . . . . . . . 25,410 247,029Bank Leumi Le-Israel BM. . . . . . . . . . . . . . . . . . . . . . . . . . . . . . . . . . 42,631 410,222Check Point Software Technologies Ltd.(a). . . . . . . . . . . . . . . . . . 3,385 376,784CyberArk Software Ltd.(a)(b). . . . . . . . . . . . . . . . . . . . . . . . . . . . . . . . 1,260 217,791Fiverr International Ltd.(a). . . . . . . . . . . . . . . . . . . . . . . . . . . . . . . . . . 932 131,990Israel Discount Bank Ltd., Class A(a) . . . . . . . . . . . . . . . . . . . . . . . 36,816 224,976Mizrahi Tefahot Bank Ltd. . . . . . . . . . . . . . . . . . . . . . . . . . . . . . . . . . 3,648 134,141Nice Ltd.(a) . . . . . . . . . . . . . . . . . . . . . . . . . . . . . . . . . . . . . . . . . . . . . . . 2,116 614,676Wix.com Ltd.(a)(b) . . . . . . . . . . . . . . . . . . . . . . . . . . . . . . . . . . . . . . . . . 1,821 278,249
2,635,858Italy — 1.6%Amplifon SpA . . . . . . . . . . . . . . . . . . . . . . . . . . . . . . . . . . . . . . . . . . . . . 3,653 177,919Assicurazioni Generali SpA. . . . . . . . . . . . . . . . . . . . . . . . . . . . . . . . 37,102 743,241DiaSorin SpA . . . . . . . . . . . . . . . . . . . . . . . . . . . . . . . . . . . . . . . . . . . . . 905 193,132Ferrari NV . . . . . . . . . . . . . . . . . . . . . . . . . . . . . . . . . . . . . . . . . . . . . . . . 4,117 1,077,315FinecoBank Banca Fineco SpA . . . . . . . . . . . . . . . . . . . . . . . . . . . . 17,232 301,801Infrastrutture Wireless Italiane SpA(c) . . . . . . . . . . . . . . . . . . . . . . 10,176 116,704Mediobanca Banca di Credito Finanziario SpA . . . . . . . . . . . . . 19,788 219,254Moncler SpA. . . . . . . . . . . . . . . . . . . . . . . . . . . . . . . . . . . . . . . . . . . . . . 6,573 474,548Nexi SpA(a)(c) . . . . . . . . . . . . . . . . . . . . . . . . . . . . . . . . . . . . . . . . . . . . . 14,719 225,198Poste Italiane SpA(c) . . . . . . . . . . . . . . . . . . . . . . . . . . . . . . . . . . . . . . 17,378 218,542Prysmian SpA . . . . . . . . . . . . . . . . . . . . . . . . . . . . . . . . . . . . . . . . . . . . 8,191 303,680Recordati Industria Chimica e Farmaceutica SpA . . . . . . . . . . . 3,162 198,387Telecom Italia SpA/Milano . . . . . . . . . . . . . . . . . . . . . . . . . . . . . . . . . 302,047 156,939Terna - Rete Elettrica Nazionale . . . . . . . . . . . . . . . . . . . . . . . . . . . 54,594 405,981
4,812,641Japan — 27.9%Advantest Corp. . . . . . . . . . . . . . . . . . . . . . . . . . . . . . . . . . . . . . . . . . . 5,100 445,233Aeon Co. Ltd. . . . . . . . . . . . . . . . . . . . . . . . . . . . . . . . . . . . . . . . . . . . . . 22,500 524,777Ajinomoto Co. Inc. . . . . . . . . . . . . . . . . . . . . . . . . . . . . . . . . . . . . . . . . 13,500 404,786ANA Holdings Inc.(a). . . . . . . . . . . . . . . . . . . . . . . . . . . . . . . . . . . . . . . 4,600 90,519Asahi Kasei Corp.. . . . . . . . . . . . . . . . . . . . . . . . . . . . . . . . . . . . . . . . . 41,400 387,088Astellas Pharma Inc. . . . . . . . . . . . . . . . . . . . . . . . . . . . . . . . . . . . . . . 60,700 951,797Azbil Corp. . . . . . . . . . . . . . . . . . . . . . . . . . . . . . . . . . . . . . . . . . . . . . . . 4,500 198,361Bridgestone Corp.. . . . . . . . . . . . . . . . . . . . . . . . . . . . . . . . . . . . . . . . . 18,700 749,843Brother Industries Ltd.. . . . . . . . . . . . . . . . . . . . . . . . . . . . . . . . . . . . . 9,000 154,462Canon Inc.. . . . . . . . . . . . . . . . . . . . . . . . . . . . . . . . . . . . . . . . . . . . . . . . 32,200 708,166Capcom Co. Ltd. . . . . . . . . . . . . . . . . . . . . . . . . . . . . . . . . . . . . . . . . . . 9,000 224,013Central Japan Railway Co. . . . . . . . . . . . . . . . . . . . . . . . . . . . . . . . . 4,500 618,640Chiba Bank Ltd. (The) . . . . . . . . . . . . . . . . . . . . . . . . . . . . . . . . . . . . . 18,000 104,441Chugai Pharmaceutical Co. Ltd. . . . . . . . . . . . . . . . . . . . . . . . . . . . 22,500 728,860CyberAgent Inc. . . . . . . . . . . . . . . . . . . . . . . . . . . . . . . . . . . . . . . . . . . 12,100 222,701Dai Nippon Printing Co. Ltd. . . . . . . . . . . . . . . . . . . . . . . . . . . . . . . . 9,000 211,231Daifuku Co. Ltd. . . . . . . . . . . . . . . . . . . . . . . . . . . . . . . . . . . . . . . . . . . 4,500 359,555Dai-ichi Life Holdings Inc. . . . . . . . . . . . . . . . . . . . . . . . . . . . . . . . . . 32,300 647,117
Schedule of Investments (unaudited) (continued)
November 30, 2021
iShares� ESG Advanced MSCI EAFE ETF(Percentages shown are based on Net Assets)
14 NM0122U-1995964-16/159
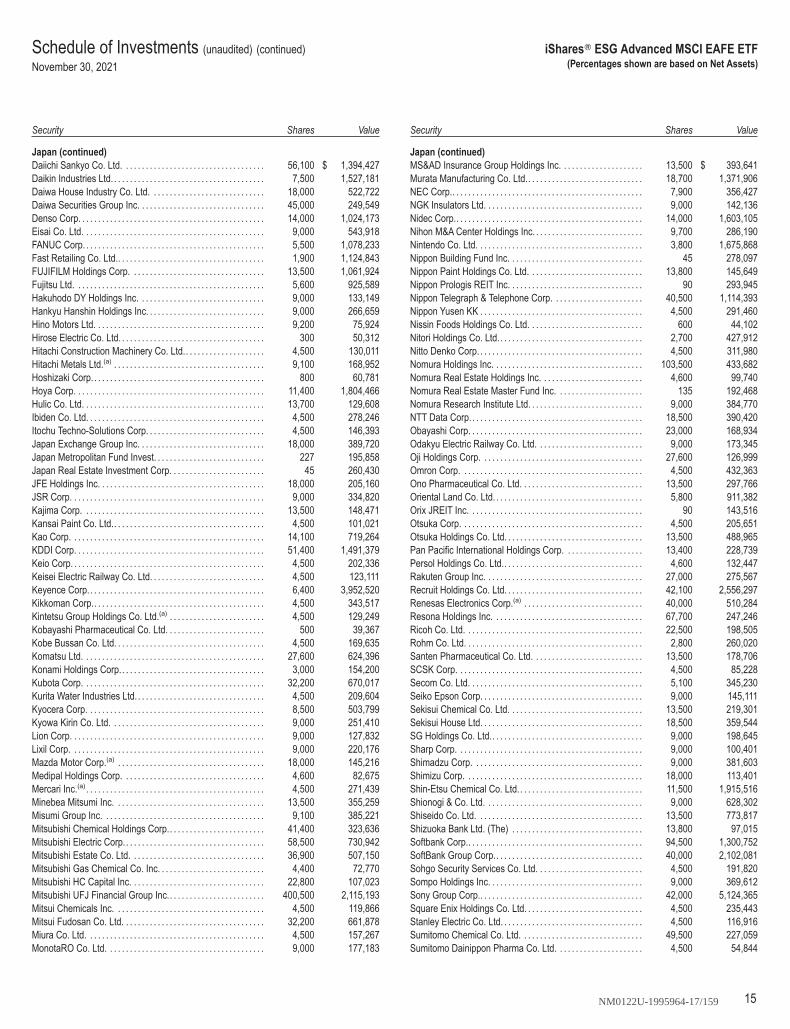
Security Shares
Value
Japan (continued)Daiichi Sankyo Co. Ltd. . . . . . . . . . . . . . . . . . . . . . . . . . . . . . . . . . . . 56,100 $ 1,394,427Daikin Industries Ltd. . . . . . . . . . . . . . . . . . . . . . . . . . . . . . . . . . . . . . . 7,500 1,527,181Daiwa House Industry Co. Ltd. . . . . . . . . . . . . . . . . . . . . . . . . . . . . 18,000 522,722Daiwa Securities Group Inc. . . . . . . . . . . . . . . . . . . . . . . . . . . . . . . . 45,000 249,549Denso Corp. . . . . . . . . . . . . . . . . . . . . . . . . . . . . . . . . . . . . . . . . . . . . . . 14,000 1,024,173Eisai Co. Ltd. . . . . . . . . . . . . . . . . . . . . . . . . . . . . . . . . . . . . . . . . . . . . . 9,000 543,918FANUC Corp. . . . . . . . . . . . . . . . . . . . . . . . . . . . . . . . . . . . . . . . . . . . . . 5,500 1,078,233Fast Retailing Co. Ltd.. . . . . . . . . . . . . . . . . . . . . . . . . . . . . . . . . . . . . 1,900 1,124,843FUJIFILM Holdings Corp. . . . . . . . . . . . . . . . . . . . . . . . . . . . . . . . . . 13,500 1,061,924Fujitsu Ltd. . . . . . . . . . . . . . . . . . . . . . . . . . . . . . . . . . . . . . . . . . . . . . . . 5,600 925,589Hakuhodo DY Holdings Inc. . . . . . . . . . . . . . . . . . . . . . . . . . . . . . . . 9,000 133,149Hankyu Hanshin Holdings Inc. . . . . . . . . . . . . . . . . . . . . . . . . . . . . . 9,000 266,659Hino Motors Ltd. . . . . . . . . . . . . . . . . . . . . . . . . . . . . . . . . . . . . . . . . . . 9,200 75,924Hirose Electric Co. Ltd. . . . . . . . . . . . . . . . . . . . . . . . . . . . . . . . . . . . . 300 50,312Hitachi Construction Machinery Co. Ltd.. . . . . . . . . . . . . . . . . . . . 4,500 130,011Hitachi Metals Ltd.(a) . . . . . . . . . . . . . . . . . . . . . . . . . . . . . . . . . . . . . . 9,100 168,952Hoshizaki Corp.. . . . . . . . . . . . . . . . . . . . . . . . . . . . . . . . . . . . . . . . . . . 800 60,781Hoya Corp. . . . . . . . . . . . . . . . . . . . . . . . . . . . . . . . . . . . . . . . . . . . . . . . 11,400 1,804,466Hulic Co. Ltd. . . . . . . . . . . . . . . . . . . . . . . . . . . . . . . . . . . . . . . . . . . . . . 13,700 129,608Ibiden Co. Ltd. . . . . . . . . . . . . . . . . . . . . . . . . . . . . . . . . . . . . . . . . . . . . 4,500 278,246Itochu Techno-Solutions Corp. . . . . . . . . . . . . . . . . . . . . . . . . . . . . . 4,500 146,393Japan Exchange Group Inc. . . . . . . . . . . . . . . . . . . . . . . . . . . . . . . . 18,000 389,720Japan Metropolitan Fund Invest. . . . . . . . . . . . . . . . . . . . . . . . . . . . 227 195,858Japan Real Estate Investment Corp. . . . . . . . . . . . . . . . . . . . . . . . 45 260,430JFE Holdings Inc. . . . . . . . . . . . . . . . . . . . . . . . . . . . . . . . . . . . . . . . . . 18,000 205,160JSR Corp. . . . . . . . . . . . . . . . . . . . . . . . . . . . . . . . . . . . . . . . . . . . . . . . . 9,000 334,820Kajima Corp. . . . . . . . . . . . . . . . . . . . . . . . . . . . . . . . . . . . . . . . . . . . . . 13,500 148,471Kansai Paint Co. Ltd.. . . . . . . . . . . . . . . . . . . . . . . . . . . . . . . . . . . . . . 4,500 101,021Kao Corp. . . . . . . . . . . . . . . . . . . . . . . . . . . . . . . . . . . . . . . . . . . . . . . . . 14,100 719,264KDDI Corp. . . . . . . . . . . . . . . . . . . . . . . . . . . . . . . . . . . . . . . . . . . . . . . . 51,400 1,491,379Keio Corp. . . . . . . . . . . . . . . . . . . . . . . . . . . . . . . . . . . . . . . . . . . . . . . . . 4,500 202,336Keisei Electric Railway Co. Ltd. . . . . . . . . . . . . . . . . . . . . . . . . . . . . 4,500 123,111Keyence Corp.. . . . . . . . . . . . . . . . . . . . . . . . . . . . . . . . . . . . . . . . . . . . 6,400 3,952,520Kikkoman Corp.. . . . . . . . . . . . . . . . . . . . . . . . . . . . . . . . . . . . . . . . . . . 4,500 343,517Kintetsu Group Holdings Co. Ltd.(a) . . . . . . . . . . . . . . . . . . . . . . . . 4,500 129,249Kobayashi Pharmaceutical Co. Ltd. . . . . . . . . . . . . . . . . . . . . . . . . 500 39,367Kobe Bussan Co. Ltd. . . . . . . . . . . . . . . . . . . . . . . . . . . . . . . . . . . . . . 4,500 169,635Komatsu Ltd. . . . . . . . . . . . . . . . . . . . . . . . . . . . . . . . . . . . . . . . . . . . . . 27,600 624,396Konami Holdings Corp.. . . . . . . . . . . . . . . . . . . . . . . . . . . . . . . . . . . . 3,000 154,200Kubota Corp. . . . . . . . . . . . . . . . . . . . . . . . . . . . . . . . . . . . . . . . . . . . . . 32,200 670,017Kurita Water Industries Ltd. . . . . . . . . . . . . . . . . . . . . . . . . . . . . . . . . 4,500 209,604Kyocera Corp. . . . . . . . . . . . . . . . . . . . . . . . . . . . . . . . . . . . . . . . . . . . . 8,500 503,799Kyowa Kirin Co. Ltd. . . . . . . . . . . . . . . . . . . . . . . . . . . . . . . . . . . . . . . 9,000 251,410Lion Corp. . . . . . . . . . . . . . . . . . . . . . . . . . . . . . . . . . . . . . . . . . . . . . . . . 9,000 127,832Lixil Corp. . . . . . . . . . . . . . . . . . . . . . . . . . . . . . . . . . . . . . . . . . . . . . . . . 9,000 220,176Mazda Motor Corp.(a) . . . . . . . . . . . . . . . . . . . . . . . . . . . . . . . . . . . . . 18,000 145,216Medipal Holdings Corp. . . . . . . . . . . . . . . . . . . . . . . . . . . . . . . . . . . . 4,600 82,675Mercari Inc.(a) . . . . . . . . . . . . . . . . . . . . . . . . . . . . . . . . . . . . . . . . . . . . . 4,500 271,439Minebea Mitsumi Inc. . . . . . . . . . . . . . . . . . . . . . . . . . . . . . . . . . . . . . 13,500 355,259Misumi Group Inc. . . . . . . . . . . . . . . . . . . . . . . . . . . . . . . . . . . . . . . . . 9,100 385,221Mitsubishi Chemical Holdings Corp.. . . . . . . . . . . . . . . . . . . . . . . . 41,400 323,636Mitsubishi Electric Corp.. . . . . . . . . . . . . . . . . . . . . . . . . . . . . . . . . . . 58,500 730,942Mitsubishi Estate Co. Ltd. . . . . . . . . . . . . . . . . . . . . . . . . . . . . . . . . . 36,900 507,150Mitsubishi Gas Chemical Co. Inc. . . . . . . . . . . . . . . . . . . . . . . . . . . 4,400 72,770Mitsubishi HC Capital Inc. . . . . . . . . . . . . . . . . . . . . . . . . . . . . . . . . . 22,800 107,023Mitsubishi UFJ Financial Group Inc.. . . . . . . . . . . . . . . . . . . . . . . . 400,500 2,115,193Mitsui Chemicals Inc. . . . . . . . . . . . . . . . . . . . . . . . . . . . . . . . . . . . . . 4,500 119,866Mitsui Fudosan Co. Ltd. . . . . . . . . . . . . . . . . . . . . . . . . . . . . . . . . . . . 32,200 661,878Miura Co. Ltd. . . . . . . . . . . . . . . . . . . . . . . . . . . . . . . . . . . . . . . . . . . . . 4,500 157,267MonotaRO Co. Ltd. . . . . . . . . . . . . . . . . . . . . . . . . . . . . . . . . . . . . . . . 9,000 177,183
Security Shares
Value
Japan (continued)MS&AD Insurance Group Holdings Inc. . . . . . . . . . . . . . . . . . . . . 13,500 $ 393,641Murata Manufacturing Co. Ltd.. . . . . . . . . . . . . . . . . . . . . . . . . . . . . 18,700 1,371,906NEC Corp.. . . . . . . . . . . . . . . . . . . . . . . . . . . . . . . . . . . . . . . . . . . . . . . . 7,900 356,427NGK Insulators Ltd. . . . . . . . . . . . . . . . . . . . . . . . . . . . . . . . . . . . . . . . 9,000 142,136Nidec Corp.. . . . . . . . . . . . . . . . . . . . . . . . . . . . . . . . . . . . . . . . . . . . . . . 14,000 1,603,105Nihon M&A Center Holdings Inc. . . . . . . . . . . . . . . . . . . . . . . . . . . . 9,700 286,190Nintendo Co. Ltd. . . . . . . . . . . . . . . . . . . . . . . . . . . . . . . . . . . . . . . . . . 3,800 1,675,868Nippon Building Fund Inc. . . . . . . . . . . . . . . . . . . . . . . . . . . . . . . . . . 45 278,097Nippon Paint Holdings Co. Ltd. . . . . . . . . . . . . . . . . . . . . . . . . . . . . 13,800 145,649Nippon Prologis REIT Inc. . . . . . . . . . . . . . . . . . . . . . . . . . . . . . . . . . 90 293,945Nippon Telegraph & Telephone Corp. . . . . . . . . . . . . . . . . . . . . . . 40,500 1,114,393Nippon Yusen KK . . . . . . . . . . . . . . . . . . . . . . . . . . . . . . . . . . . . . . . . . 4,500 291,460Nissin Foods Holdings Co. Ltd. . . . . . . . . . . . . . . . . . . . . . . . . . . . . 600 44,102Nitori Holdings Co. Ltd.. . . . . . . . . . . . . . . . . . . . . . . . . . . . . . . . . . . . 2,700 427,912Nitto Denko Corp. . . . . . . . . . . . . . . . . . . . . . . . . . . . . . . . . . . . . . . . . . 4,500 311,980Nomura Holdings Inc. . . . . . . . . . . . . . . . . . . . . . . . . . . . . . . . . . . . . . 103,500 433,682Nomura Real Estate Holdings Inc. . . . . . . . . . . . . . . . . . . . . . . . . . 4,600 99,740Nomura Real Estate Master Fund Inc. . . . . . . . . . . . . . . . . . . . . . 135 192,468Nomura Research Institute Ltd. . . . . . . . . . . . . . . . . . . . . . . . . . . . . 9,000 384,770NTT Data Corp. . . . . . . . . . . . . . . . . . . . . . . . . . . . . . . . . . . . . . . . . . . . 18,500 390,420Obayashi Corp. . . . . . . . . . . . . . . . . . . . . . . . . . . . . . . . . . . . . . . . . . . . 23,000 168,934Odakyu Electric Railway Co. Ltd. . . . . . . . . . . . . . . . . . . . . . . . . . . 9,000 173,345Oji Holdings Corp. . . . . . . . . . . . . . . . . . . . . . . . . . . . . . . . . . . . . . . . . 27,600 126,999Omron Corp. . . . . . . . . . . . . . . . . . . . . . . . . . . . . . . . . . . . . . . . . . . . . . 4,500 432,363Ono Pharmaceutical Co. Ltd. . . . . . . . . . . . . . . . . . . . . . . . . . . . . . . 13,500 297,766Oriental Land Co. Ltd. . . . . . . . . . . . . . . . . . . . . . . . . . . . . . . . . . . . . . 5,800 911,382Orix JREIT Inc. . . . . . . . . . . . . . . . . . . . . . . . . . . . . . . . . . . . . . . . . . . . 90 143,516Otsuka Corp. . . . . . . . . . . . . . . . . . . . . . . . . . . . . . . . . . . . . . . . . . . . . . 4,500 205,651Otsuka Holdings Co. Ltd. . . . . . . . . . . . . . . . . . . . . . . . . . . . . . . . . . . 13,500 488,965Pan Pacific International Holdings Corp. . . . . . . . . . . . . . . . . . . . 13,400 228,739Persol Holdings Co. Ltd.. . . . . . . . . . . . . . . . . . . . . . . . . . . . . . . . . . . 4,600 132,447Rakuten Group Inc. . . . . . . . . . . . . . . . . . . . . . . . . . . . . . . . . . . . . . . . 27,000 275,567Recruit Holdings Co. Ltd. . . . . . . . . . . . . . . . . . . . . . . . . . . . . . . . . . . 42,100 2,556,297Renesas Electronics Corp.(a) . . . . . . . . . . . . . . . . . . . . . . . . . . . . . . 40,000 510,284Resona Holdings Inc. . . . . . . . . . . . . . . . . . . . . . . . . . . . . . . . . . . . . . 67,700 247,246Ricoh Co. Ltd. . . . . . . . . . . . . . . . . . . . . . . . . . . . . . . . . . . . . . . . . . . . . 22,500 198,505Rohm Co. Ltd. . . . . . . . . . . . . . . . . . . . . . . . . . . . . . . . . . . . . . . . . . . . . 2,800 260,020Santen Pharmaceutical Co. Ltd. . . . . . . . . . . . . . . . . . . . . . . . . . . . 13,500 178,706SCSK Corp. . . . . . . . . . . . . . . . . . . . . . . . . . . . . . . . . . . . . . . . . . . . . . . 4,500 85,228Secom Co. Ltd. . . . . . . . . . . . . . . . . . . . . . . . . . . . . . . . . . . . . . . . . . . . 5,100 345,230Seiko Epson Corp. . . . . . . . . . . . . . . . . . . . . . . . . . . . . . . . . . . . . . . . . 9,000 145,111Sekisui Chemical Co. Ltd. . . . . . . . . . . . . . . . . . . . . . . . . . . . . . . . . . 13,500 219,301Sekisui House Ltd. . . . . . . . . . . . . . . . . . . . . . . . . . . . . . . . . . . . . . . . . 18,500 359,544SG Holdings Co. Ltd.. . . . . . . . . . . . . . . . . . . . . . . . . . . . . . . . . . . . . . 9,000 198,645Sharp Corp. . . . . . . . . . . . . . . . . . . . . . . . . . . . . . . . . . . . . . . . . . . . . . . 9,000 100,401Shimadzu Corp. . . . . . . . . . . . . . . . . . . . . . . . . . . . . . . . . . . . . . . . . . . 9,000 381,603Shimizu Corp. . . . . . . . . . . . . . . . . . . . . . . . . . . . . . . . . . . . . . . . . . . . . 18,000 113,401Shin-Etsu Chemical Co. Ltd.. . . . . . . . . . . . . . . . . . . . . . . . . . . . . . . 11,500 1,915,516Shionogi & Co. Ltd. . . . . . . . . . . . . . . . . . . . . . . . . . . . . . . . . . . . . . . . 9,000 628,302Shiseido Co. Ltd. . . . . . . . . . . . . . . . . . . . . . . . . . . . . . . . . . . . . . . . . . 13,500 773,817Shizuoka Bank Ltd. (The) . . . . . . . . . . . . . . . . . . . . . . . . . . . . . . . . . 13,800 97,015Softbank Corp.. . . . . . . . . . . . . . . . . . . . . . . . . . . . . . . . . . . . . . . . . . . . 94,500 1,300,752SoftBank Group Corp.. . . . . . . . . . . . . . . . . . . . . . . . . . . . . . . . . . . . . 40,000 2,102,081Sohgo Security Services Co. Ltd. . . . . . . . . . . . . . . . . . . . . . . . . . . 4,500 191,820Sompo Holdings Inc. . . . . . . . . . . . . . . . . . . . . . . . . . . . . . . . . . . . . . . 9,000 369,612Sony Group Corp.. . . . . . . . . . . . . . . . . . . . . . . . . . . . . . . . . . . . . . . . . 42,000 5,124,365Square Enix Holdings Co. Ltd. . . . . . . . . . . . . . . . . . . . . . . . . . . . . . 4,500 235,443Stanley Electric Co. Ltd. . . . . . . . . . . . . . . . . . . . . . . . . . . . . . . . . . . . 4,500 116,916Sumitomo Chemical Co. Ltd. . . . . . . . . . . . . . . . . . . . . . . . . . . . . . . 49,500 227,059Sumitomo Dainippon Pharma Co. Ltd. . . . . . . . . . . . . . . . . . . . . . 4,500 54,844
Schedule of Investments (unaudited) (continued)
November 30, 2021
iShares� ESG Advanced MSCI EAFE ETF(Percentages shown are based on Net Assets)
15NM0122U-1995964-17/159

Security Shares
Value
Japan (continued)Sumitomo Metal Mining Co. Ltd. . . . . . . . . . . . . . . . . . . . . . . . . . . . 9,000 $ 332,653Sumitomo Mitsui Financial Group Inc. . . . . . . . . . . . . . . . . . . . . . . 40,500 1,317,664Sumitomo Realty & Development Co. Ltd.. . . . . . . . . . . . . . . . . . 9,900 309,958Suntory Beverage & Food Ltd. . . . . . . . . . . . . . . . . . . . . . . . . . . . . . 4,500 158,746Sysmex Corp. . . . . . . . . . . . . . . . . . . . . . . . . . . . . . . . . . . . . . . . . . . . . 4,500 559,722T&D Holdings Inc.. . . . . . . . . . . . . . . . . . . . . . . . . . . . . . . . . . . . . . . . . 18,000 211,557Taisei Corp.. . . . . . . . . . . . . . . . . . . . . . . . . . . . . . . . . . . . . . . . . . . . . . . 4,500 131,000TDK Corp. . . . . . . . . . . . . . . . . . . . . . . . . . . . . . . . . . . . . . . . . . . . . . . . . 13,500 534,052Terumo Corp. . . . . . . . . . . . . . . . . . . . . . . . . . . . . . . . . . . . . . . . . . . . . . 22,500 916,294TIS Inc.. . . . . . . . . . . . . . . . . . . . . . . . . . . . . . . . . . . . . . . . . . . . . . . . . . . 9,000 277,422Tobu Railway Co. Ltd. . . . . . . . . . . . . . . . . . . . . . . . . . . . . . . . . . . . . . 4,500 101,700Tokio Marine Holdings Inc. . . . . . . . . . . . . . . . . . . . . . . . . . . . . . . . . 18,700 939,101Tokyo Electron Ltd.. . . . . . . . . . . . . . . . . . . . . . . . . . . . . . . . . . . . . . . . 4,700 2,469,708Tokyu Corp. . . . . . . . . . . . . . . . . . . . . . . . . . . . . . . . . . . . . . . . . . . . . . . 18,000 248,793Toppan Inc. . . . . . . . . . . . . . . . . . . . . . . . . . . . . . . . . . . . . . . . . . . . . . . . 9,000 136,422Toray Industries Inc.. . . . . . . . . . . . . . . . . . . . . . . . . . . . . . . . . . . . . . . 45,000 260,190Tosoh Corp. . . . . . . . . . . . . . . . . . . . . . . . . . . . . . . . . . . . . . . . . . . . . . . 9,000 128,667TOTO Ltd. . . . . . . . . . . . . . . . . . . . . . . . . . . . . . . . . . . . . . . . . . . . . . . . . 4,500 199,066Toyo Suisan Kaisha Ltd.. . . . . . . . . . . . . . . . . . . . . . . . . . . . . . . . . . . 4,500 182,090Trend Micro Inc. . . . . . . . . . . . . . . . . . . . . . . . . . . . . . . . . . . . . . . . . . . 4,300 249,171Unicharm Corp. . . . . . . . . . . . . . . . . . . . . . . . . . . . . . . . . . . . . . . . . . . . 13,500 584,769USS Co. Ltd. . . . . . . . . . . . . . . . . . . . . . . . . . . . . . . . . . . . . . . . . . . . . . 9,000 132,034Welcia Holdings Co. Ltd. . . . . . . . . . . . . . . . . . . . . . . . . . . . . . . . . . . 3,000 106,825West Japan Railway Co. . . . . . . . . . . . . . . . . . . . . . . . . . . . . . . . . . . 9,000 387,835Yakult Honsha Co. Ltd. . . . . . . . . . . . . . . . . . . . . . . . . . . . . . . . . . . . . 4,500 225,814Yamaha Corp. . . . . . . . . . . . . . . . . . . . . . . . . . . . . . . . . . . . . . . . . . . . . 4,500 230,950Yamaha Motor Co. Ltd.. . . . . . . . . . . . . . . . . . . . . . . . . . . . . . . . . . . . 9,000 226,337Yaskawa Electric Corp.. . . . . . . . . . . . . . . . . . . . . . . . . . . . . . . . . . . . 9,000 401,707Yokogawa Electric Corp. . . . . . . . . . . . . . . . . . . . . . . . . . . . . . . . . . . 9,000 168,714Z Holdings Corp. . . . . . . . . . . . . . . . . . . . . . . . . . . . . . . . . . . . . . . . . . . 87,900 581,758ZOZO Inc. . . . . . . . . . . . . . . . . . . . . . . . . . . . . . . . . . . . . . . . . . . . . . . . . 4,500 142,630
83,922,638Netherlands — 8.5%ABN AMRO Bank NV, CVA(c) . . . . . . . . . . . . . . . . . . . . . . . . . . . . . . 14,062 200,706Adyen NV(a)(c) . . . . . . . . . . . . . . . . . . . . . . . . . . . . . . . . . . . . . . . . . . . . 630 1,744,996Akzo Nobel NV . . . . . . . . . . . . . . . . . . . . . . . . . . . . . . . . . . . . . . . . . . . 6,077 639,461Argenx SE(a). . . . . . . . . . . . . . . . . . . . . . . . . . . . . . . . . . . . . . . . . . . . . . 1,488 416,872ASM International NV . . . . . . . . . . . . . . . . . . . . . . . . . . . . . . . . . . . . . 1,550 696,713ASML Holding NV. . . . . . . . . . . . . . . . . . . . . . . . . . . . . . . . . . . . . . . . . 13,329 10,461,671CNH Industrial NV . . . . . . . . . . . . . . . . . . . . . . . . . . . . . . . . . . . . . . . . 32,584 534,839Euronext NV(c) . . . . . . . . . . . . . . . . . . . . . . . . . . . . . . . . . . . . . . . . . . . . 2,730 268,896EXOR NV . . . . . . . . . . . . . . . . . . . . . . . . . . . . . . . . . . . . . . . . . . . . . . . . 3,430 300,712IMCD NV . . . . . . . . . . . . . . . . . . . . . . . . . . . . . . . . . . . . . . . . . . . . . . . . . 1,816 403,873ING Groep NV . . . . . . . . . . . . . . . . . . . . . . . . . . . . . . . . . . . . . . . . . . . . 126,757 1,750,951JDE Peet's NV. . . . . . . . . . . . . . . . . . . . . . . . . . . . . . . . . . . . . . . . . . . . 3,198 87,160Just Eat Takeaway.com NV(a)(c) . . . . . . . . . . . . . . . . . . . . . . . . . . . . 5,739 359,378Koninklijke Ahold Delhaize NV . . . . . . . . . . . . . . . . . . . . . . . . . . . . . 34,648 1,165,897Koninklijke DSM NV. . . . . . . . . . . . . . . . . . . . . . . . . . . . . . . . . . . . . . . 5,794 1,247,080NN Group NV. . . . . . . . . . . . . . . . . . . . . . . . . . . . . . . . . . . . . . . . . . . . . 8,649 429,764Prosus NV. . . . . . . . . . . . . . . . . . . . . . . . . . . . . . . . . . . . . . . . . . . . . . . . 30,125 2,420,931QIAGEN NV(a) . . . . . . . . . . . . . . . . . . . . . . . . . . . . . . . . . . . . . . . . . . . . 7,348 405,996Randstad NV . . . . . . . . . . . . . . . . . . . . . . . . . . . . . . . . . . . . . . . . . . . . . 3,559 224,576Universal Music Group NV . . . . . . . . . . . . . . . . . . . . . . . . . . . . . . . . 23,392 671,446Wolters Kluwer NV . . . . . . . . . . . . . . . . . . . . . . . . . . . . . . . . . . . . . . . . 8,866 997,078
25,428,996New Zealand — 0.5%a2 Milk Co. Ltd. (The)(a) . . . . . . . . . . . . . . . . . . . . . . . . . . . . . . . . . . . 72 300Auckland International Airport Ltd.(a) . . . . . . . . . . . . . . . . . . . . . . . 42,801 229,571Fisher & Paykel Healthcare Corp. Ltd. . . . . . . . . . . . . . . . . . . . . . 18,594 420,700
Security Shares
Value
New Zealand (continued)Mercury NZ Ltd. . . . . . . . . . . . . . . . . . . . . . . . . . . . . . . . . . . . . . . . . . . 27,230 $ 111,274Meridian Energy Ltd. . . . . . . . . . . . . . . . . . . . . . . . . . . . . . . . . . . . . . . 40,602 130,572Ryman Healthcare Ltd. . . . . . . . . . . . . . . . . . . . . . . . . . . . . . . . . . . . . 14,400 120,355Spark New Zealand Ltd.. . . . . . . . . . . . . . . . . . . . . . . . . . . . . . . . . . . 60,397 188,896Xero Ltd.(a) . . . . . . . . . . . . . . . . . . . . . . . . . . . . . . . . . . . . . . . . . . . . . . . 4,323 439,076
1,640,744Norway — 0.7%Adevinta ASA(a) . . . . . . . . . . . . . . . . . . . . . . . . . . . . . . . . . . . . . . . . . . . 8,874 126,466DNB Bank ASA . . . . . . . . . . . . . . . . . . . . . . . . . . . . . . . . . . . . . . . . . . . 29,477 643,334Gjensidige Forsikring ASA. . . . . . . . . . . . . . . . . . . . . . . . . . . . . . . . . 6,535 148,034Mowi ASA . . . . . . . . . . . . . . . . . . . . . . . . . . . . . . . . . . . . . . . . . . . . . . . . 11,938 271,434Orkla ASA . . . . . . . . . . . . . . . . . . . . . . . . . . . . . . . . . . . . . . . . . . . . . . . . 23,105 211,198Schibsted ASA, Class A . . . . . . . . . . . . . . . . . . . . . . . . . . . . . . . . . . . 2,701 120,349Schibsted ASA, Class B . . . . . . . . . . . . . . . . . . . . . . . . . . . . . . . . . . . 2,839 109,673Telenor ASA . . . . . . . . . . . . . . . . . . . . . . . . . . . . . . . . . . . . . . . . . . . . . . 22,330 329,954Yara International ASA . . . . . . . . . . . . . . . . . . . . . . . . . . . . . . . . . . . . 5,793 284,380
2,244,822Portugal — 0.1%EDP Renovaveis SA . . . . . . . . . . . . . . . . . . . . . . . . . . . . . . . . . . . . . . 9,675 248,842Jeronimo Martins SGPS SA . . . . . . . . . . . . . . . . . . . . . . . . . . . . . . . 8,644 188,368
437,210Singapore — 1.5%Ascendas REIT . . . . . . . . . . . . . . . . . . . . . . . . . . . . . . . . . . . . . . . . . . . 117,199 250,469CapitaLand Integrated Commercial Trust . . . . . . . . . . . . . . . . . . . 161,181 248,453Capitaland Investment Ltd/Singapore(a) . . . . . . . . . . . . . . . . . . . . 77,200 190,094City Developments Ltd.. . . . . . . . . . . . . . . . . . . . . . . . . . . . . . . . . . . . 13,900 71,349DBS Group Holdings Ltd.. . . . . . . . . . . . . . . . . . . . . . . . . . . . . . . . . . 57,300 1,248,143Oversea-Chinese Banking Corp. Ltd. . . . . . . . . . . . . . . . . . . . . . . 113,100 906,406Singapore Airlines Ltd.(a)(b) . . . . . . . . . . . . . . . . . . . . . . . . . . . . . . . . 45,800 163,095Singapore Exchange Ltd.. . . . . . . . . . . . . . . . . . . . . . . . . . . . . . . . . . 1,400 9,140Singapore Telecommunications Ltd.. . . . . . . . . . . . . . . . . . . . . . . . 279,700 481,619United Overseas Bank Ltd. . . . . . . . . . . . . . . . . . . . . . . . . . . . . . . . . 40,500 758,003UOL Group Ltd. . . . . . . . . . . . . . . . . . . . . . . . . . . . . . . . . . . . . . . . . . . . 18,400 92,486Venture Corp. Ltd. . . . . . . . . . . . . . . . . . . . . . . . . . . . . . . . . . . . . . . . . 8,800 119,371
4,538,628Spain — 1.8%Aena SME SA(a)(c) . . . . . . . . . . . . . . . . . . . . . . . . . . . . . . . . . . . . . . . . 2,493 366,137Amadeus IT Group SA(a) . . . . . . . . . . . . . . . . . . . . . . . . . . . . . . . . . . 14,821 948,924CaixaBank SA . . . . . . . . . . . . . . . . . . . . . . . . . . . . . . . . . . . . . . . . . . . . 152,847 394,631Cellnex Telecom SA(c) . . . . . . . . . . . . . . . . . . . . . . . . . . . . . . . . . . . . . 16,773 989,203Ferrovial SA . . . . . . . . . . . . . . . . . . . . . . . . . . . . . . . . . . . . . . . . . . . . . . 16,499 459,405Grifols SA . . . . . . . . . . . . . . . . . . . . . . . . . . . . . . . . . . . . . . . . . . . . . . . . 10,441 187,445Industria de Diseno Textil SA . . . . . . . . . . . . . . . . . . . . . . . . . . . . . . 36,794 1,163,084Red Electrica Corp. SA. . . . . . . . . . . . . . . . . . . . . . . . . . . . . . . . . . . . 111 2,359Telefonica SA. . . . . . . . . . . . . . . . . . . . . . . . . . . . . . . . . . . . . . . . . . . . . 170,442 773,302
5,284,490Sweden — 5.1%Assa Abloy AB, Class B . . . . . . . . . . . . . . . . . . . . . . . . . . . . . . . . . . . 32,392 907,612Atlas Copco AB, Class A . . . . . . . . . . . . . . . . . . . . . . . . . . . . . . . . . . 22,135 1,354,194Atlas Copco AB, Class B . . . . . . . . . . . . . . . . . . . . . . . . . . . . . . . . . . 12,238 635,636Electrolux AB, Class B . . . . . . . . . . . . . . . . . . . . . . . . . . . . . . . . . . . . 6,425 144,254Epiroc AB, Class A . . . . . . . . . . . . . . . . . . . . . . . . . . . . . . . . . . . . . . . . 20,996 510,956Epiroc AB, Class B . . . . . . . . . . . . . . . . . . . . . . . . . . . . . . . . . . . . . . . . 12,425 250,967EQT AB . . . . . . . . . . . . . . . . . . . . . . . . . . . . . . . . . . . . . . . . . . . . . . . . . . 9,503 558,723Essity AB, Class B . . . . . . . . . . . . . . . . . . . . . . . . . . . . . . . . . . . . . . . . 19,486 622,228Fastighets AB Balder, Class B(a) . . . . . . . . . . . . . . . . . . . . . . . . . . . 3,334 249,040Getinge AB, Class B . . . . . . . . . . . . . . . . . . . . . . . . . . . . . . . . . . . . . . 7,288 306,297H & M Hennes & Mauritz AB, Class B . . . . . . . . . . . . . . . . . . . . . . 23,973 422,585Hexagon AB, Class B . . . . . . . . . . . . . . . . . . . . . . . . . . . . . . . . . . . . . 65,151 947,469
Schedule of Investments (unaudited) (continued)
November 30, 2021
iShares� ESG Advanced MSCI EAFE ETF(Percentages shown are based on Net Assets)
16 NM0122U-1995964-18/159

Security Shares
Value
Sweden (continued)Husqvarna AB, Class B . . . . . . . . . . . . . . . . . . . . . . . . . . . . . . . . . . . 12,721 $ 179,093ICA Gruppen AB . . . . . . . . . . . . . . . . . . . . . . . . . . . . . . . . . . . . . . . . . . 3,621 214,477Industrivarden AB, Class A . . . . . . . . . . . . . . . . . . . . . . . . . . . . . . . . 4,358 129,378Industrivarden AB, Class C . . . . . . . . . . . . . . . . . . . . . . . . . . . . . . . . 5,896 173,781Investment AB Latour, Class B. . . . . . . . . . . . . . . . . . . . . . . . . . . . . 4,725 178,099Investor AB . . . . . . . . . . . . . . . . . . . . . . . . . . . . . . . . . . . . . . . . . . . . . . . 15,246 368,319Investor AB, Class B . . . . . . . . . . . . . . . . . . . . . . . . . . . . . . . . . . . . . . 59,879 1,391,380Kinnevik AB, Class B(a) . . . . . . . . . . . . . . . . . . . . . . . . . . . . . . . . . . . . 7,654 272,890L E Lundbergforetagen AB, Class B. . . . . . . . . . . . . . . . . . . . . . . . 2,262 124,064Lifco AB, Class B . . . . . . . . . . . . . . . . . . . . . . . . . . . . . . . . . . . . . . . . . 7,427 202,079Nibe Industrier AB, Class B . . . . . . . . . . . . . . . . . . . . . . . . . . . . . . . . 45,290 645,543Sagax AB, Class B . . . . . . . . . . . . . . . . . . . . . . . . . . . . . . . . . . . . . . . . 5,131 201,017Sandvik AB . . . . . . . . . . . . . . . . . . . . . . . . . . . . . . . . . . . . . . . . . . . . . . . 36,866 910,193Sinch AB(a)(c) . . . . . . . . . . . . . . . . . . . . . . . . . . . . . . . . . . . . . . . . . . . . . 16,430 218,476Skandinaviska Enskilda Banken AB, Class A . . . . . . . . . . . . . . . 52,508 763,568SKF AB, Class B. . . . . . . . . . . . . . . . . . . . . . . . . . . . . . . . . . . . . . . . . . 12,145 277,230Svenska Cellulosa AB SCA, Class B . . . . . . . . . . . . . . . . . . . . . . . 18,908 307,548Svenska Handelsbanken AB, Class A . . . . . . . . . . . . . . . . . . . . . . 45,949 486,139Tele2 AB, Class B. . . . . . . . . . . . . . . . . . . . . . . . . . . . . . . . . . . . . . . . . 16,607 236,992Telefonaktiebolaget LM Ericsson, Class B . . . . . . . . . . . . . . . . . . 95,988 964,916Telia Co. AB . . . . . . . . . . . . . . . . . . . . . . . . . . . . . . . . . . . . . . . . . . . . . . 85,280 329,605
15,484,748Switzerland — 7.0%ABB Ltd., Registered. . . . . . . . . . . . . . . . . . . . . . . . . . . . . . . . . . . . . . 53,426 1,847,620Adecco Group AG, Registered. . . . . . . . . . . . . . . . . . . . . . . . . . . . . 5,303 245,759Alcon Inc.. . . . . . . . . . . . . . . . . . . . . . . . . . . . . . . . . . . . . . . . . . . . . . . . . 16,435 1,298,180Bachem Holding AG, Class B, Registered . . . . . . . . . . . . . . . . . . 197 142,485Baloise Holding AG, Registered. . . . . . . . . . . . . . . . . . . . . . . . . . . . 1,308 195,127Clariant AG, Registered . . . . . . . . . . . . . . . . . . . . . . . . . . . . . . . . . . . 6,754 132,253Coca-Cola HBC AG, Class DI . . . . . . . . . . . . . . . . . . . . . . . . . . . . . 6,265 192,933Geberit AG, Registered. . . . . . . . . . . . . . . . . . . . . . . . . . . . . . . . . . . . 1,181 901,706Givaudan SA, Registered . . . . . . . . . . . . . . . . . . . . . . . . . . . . . . . . . 305 1,491,068Julius Baer Group Ltd. . . . . . . . . . . . . . . . . . . . . . . . . . . . . . . . . . . . . 7,375 457,722Kuehne + Nagel International AG, Registered . . . . . . . . . . . . . . 1,766 504,844Logitech International SA, Registered . . . . . . . . . . . . . . . . . . . . . . 5,669 452,124Lonza Group AG, Registered . . . . . . . . . . . . . . . . . . . . . . . . . . . . . . 2,393 1,929,589Partners Group Holding AG. . . . . . . . . . . . . . . . . . . . . . . . . . . . . . . . 720 1,242,610SGS SA, Registered . . . . . . . . . . . . . . . . . . . . . . . . . . . . . . . . . . . . . . 187 564,136Sika AG, Registered . . . . . . . . . . . . . . . . . . . . . . . . . . . . . . . . . . . . . . 4,629 1,807,629Sonova Holding AG, Registered . . . . . . . . . . . . . . . . . . . . . . . . . . . 1,812 680,983STMicroelectronics NV . . . . . . . . . . . . . . . . . . . . . . . . . . . . . . . . . . . . 22,633 1,102,268Straumann Holding AG, Registered . . . . . . . . . . . . . . . . . . . . . . . . 323 686,681Swiss Life Holding AG, Registered . . . . . . . . . . . . . . . . . . . . . . . . . 998 572,792Swiss Prime Site AG, Registered . . . . . . . . . . . . . . . . . . . . . . . . . . 2,465 233,499Swiss Re AG . . . . . . . . . . . . . . . . . . . . . . . . . . . . . . . . . . . . . . . . . . . . . 10,044 942,735Swisscom AG, Registered . . . . . . . . . . . . . . . . . . . . . . . . . . . . . . . . . 860 477,739Temenos AG, Registered . . . . . . . . . . . . . . . . . . . . . . . . . . . . . . . . . . 2,123 271,520VAT Group AG(c) . . . . . . . . . . . . . . . . . . . . . . . . . . . . . . . . . . . . . . . . . . 860 414,988Vifor Pharma AG. . . . . . . . . . . . . . . . . . . . . . . . . . . . . . . . . . . . . . . . . . 1,489 166,931Zurich Insurance Group AG. . . . . . . . . . . . . . . . . . . . . . . . . . . . . . . . 4,917 2,021,426
20,977,347United Kingdom — 10.1%3i Group PLC . . . . . . . . . . . . . . . . . . . . . . . . . . . . . . . . . . . . . . . . . . . . . 31,377 575,703Abrdn PLC . . . . . . . . . . . . . . . . . . . . . . . . . . . . . . . . . . . . . . . . . . . . . . . 76,770 237,374Admiral Group PLC . . . . . . . . . . . . . . . . . . . . . . . . . . . . . . . . . . . . . . . 6,030 237,064Antofagasta PLC. . . . . . . . . . . . . . . . . . . . . . . . . . . . . . . . . . . . . . . . . . 12,874 235,373Ashtead Group PLC. . . . . . . . . . . . . . . . . . . . . . . . . . . . . . . . . . . . . . . 14,527 1,168,669Auto Trader Group PLC(c) . . . . . . . . . . . . . . . . . . . . . . . . . . . . . . . . . 31,457 305,562AVEVA Group PLC. . . . . . . . . . . . . . . . . . . . . . . . . . . . . . . . . . . . . . . . 3,745 159,848
Security Shares
Value
United Kingdom (continued)Barratt Developments PLC . . . . . . . . . . . . . . . . . . . . . . . . . . . . . . . . 32,323 $ 299,338Berkeley Group Holdings PLC . . . . . . . . . . . . . . . . . . . . . . . . . . . . . 3,576 203,566British Land Co. PLC (The) . . . . . . . . . . . . . . . . . . . . . . . . . . . . . . . . 27,406 185,302BT Group PLC(a) . . . . . . . . . . . . . . . . . . . . . . . . . . . . . . . . . . . . . . . . . . 297,791 626,878Bunzl PLC . . . . . . . . . . . . . . . . . . . . . . . . . . . . . . . . . . . . . . . . . . . . . . . . 10,491 399,171Burberry Group PLC . . . . . . . . . . . . . . . . . . . . . . . . . . . . . . . . . . . . . . 13,414 315,053Coca-Cola Europacific Partners PLC. . . . . . . . . . . . . . . . . . . . . . . 6,489 320,362Compass Group PLC(a) . . . . . . . . . . . . . . . . . . . . . . . . . . . . . . . . . . . 57,518 1,122,053Croda International PLC. . . . . . . . . . . . . . . . . . . . . . . . . . . . . . . . . . . 4,545 609,525Ferguson PLC . . . . . . . . . . . . . . . . . . . . . . . . . . . . . . . . . . . . . . . . . . . . 7,338 1,117,046Halma PLC . . . . . . . . . . . . . . . . . . . . . . . . . . . . . . . . . . . . . . . . . . . . . . . 12,129 483,470Hikma Pharmaceuticals PLC . . . . . . . . . . . . . . . . . . . . . . . . . . . . . . 5,359 157,520HSBC Holdings PLC . . . . . . . . . . . . . . . . . . . . . . . . . . . . . . . . . . . . . . 663,169 3,664,936Informa PLC(a) . . . . . . . . . . . . . . . . . . . . . . . . . . . . . . . . . . . . . . . . . . . . 47,074 291,515InterContinental Hotels Group PLC(a) . . . . . . . . . . . . . . . . . . . . . . 6,054 359,719Intertek Group PLC . . . . . . . . . . . . . . . . . . . . . . . . . . . . . . . . . . . . . . . 5,183 367,032J Sainsbury PLC . . . . . . . . . . . . . . . . . . . . . . . . . . . . . . . . . . . . . . . . . . 51,661 189,795JD Sports Fashion PLC . . . . . . . . . . . . . . . . . . . . . . . . . . . . . . . . . . . 82,855 245,029Kingfisher PLC. . . . . . . . . . . . . . . . . . . . . . . . . . . . . . . . . . . . . . . . . . . . 66,470 279,322Land Securities Group PLC. . . . . . . . . . . . . . . . . . . . . . . . . . . . . . . . 21,384 206,129Legal & General Group PLC. . . . . . . . . . . . . . . . . . . . . . . . . . . . . . . 197,258 736,936Lloyds Banking Group PLC. . . . . . . . . . . . . . . . . . . . . . . . . . . . . . . . 2,313,258 1,436,401London Stock Exchange Group PLC . . . . . . . . . . . . . . . . . . . . . . . 10,665 923,917M&G PLC . . . . . . . . . . . . . . . . . . . . . . . . . . . . . . . . . . . . . . . . . . . . . . . . 87,257 216,567Mondi PLC . . . . . . . . . . . . . . . . . . . . . . . . . . . . . . . . . . . . . . . . . . . . . . . 15,077 344,407Next PLC. . . . . . . . . . . . . . . . . . . . . . . . . . . . . . . . . . . . . . . . . . . . . . . . . 4,285 447,675Ocado Group PLC(a) . . . . . . . . . . . . . . . . . . . . . . . . . . . . . . . . . . . . . . 15,548 371,168Pearson PLC . . . . . . . . . . . . . . . . . . . . . . . . . . . . . . . . . . . . . . . . . . . . . 23,767 187,935Persimmon PLC . . . . . . . . . . . . . . . . . . . . . . . . . . . . . . . . . . . . . . . . . . 10,132 368,204Phoenix Group Holdings PLC. . . . . . . . . . . . . . . . . . . . . . . . . . . . . . 21,152 179,612Prudential PLC . . . . . . . . . . . . . . . . . . . . . . . . . . . . . . . . . . . . . . . . . . . 85,374 1,442,074Reckitt Benckiser Group PLC. . . . . . . . . . . . . . . . . . . . . . . . . . . . . . 22,755 1,849,070RELX PLC. . . . . . . . . . . . . . . . . . . . . . . . . . . . . . . . . . . . . . . . . . . . . . . . 62,347 1,934,043Rentokil Initial PLC. . . . . . . . . . . . . . . . . . . . . . . . . . . . . . . . . . . . . . . . 58,778 478,667Sage Group PLC (The). . . . . . . . . . . . . . . . . . . . . . . . . . . . . . . . . . . . 34,201 350,984Schroders PLC . . . . . . . . . . . . . . . . . . . . . . . . . . . . . . . . . . . . . . . . . . . 3,982 181,595Segro PLC . . . . . . . . . . . . . . . . . . . . . . . . . . . . . . . . . . . . . . . . . . . . . . . 39,468 737,624Severn Trent PLC. . . . . . . . . . . . . . . . . . . . . . . . . . . . . . . . . . . . . . . . . 7,661 293,532Spirax-Sarco Engineering PLC . . . . . . . . . . . . . . . . . . . . . . . . . . . . 2,340 485,524St. James's Place PLC . . . . . . . . . . . . . . . . . . . . . . . . . . . . . . . . . . . . 17,403 358,336Taylor Wimpey PLC . . . . . . . . . . . . . . . . . . . . . . . . . . . . . . . . . . . . . . . 115,560 242,704United Utilities Group PLC. . . . . . . . . . . . . . . . . . . . . . . . . . . . . . . . . 22,822 327,789Vodafone Group PLC . . . . . . . . . . . . . . . . . . . . . . . . . . . . . . . . . . . . . 904,004 1,310,640Whitbread PLC(a) . . . . . . . . . . . . . . . . . . . . . . . . . . . . . . . . . . . . . . . . . 6,931 258,357WPP PLC . . . . . . . . . . . . . . . . . . . . . . . . . . . . . . . . . . . . . . . . . . . . . . . . 37,353 518,464
30,344,579
Total Common Stocks — 99.1%(Cost: $293,034,445) . . . . . . . . . . . . . . . . . . . . . . . . . . . . . . . . . . . . . . . . . . . . . . 298,262,773
Preferred StocksGermany — 0.4%Bayerische Motoren Werke AG, Preference Shares, NVS . . . 1,660 130,164Henkel AG & Co. KGaA, Preference Shares, NVS . . . . . . . . . . 5,671 447,445Sartorius AG, Preference Shares, NVS. . . . . . . . . . . . . . . . . . . . . 867 596,436
1,174,045
Schedule of Investments (unaudited) (continued)
November 30, 2021
iShares� ESG Advanced MSCI EAFE ETF(Percentages shown are based on Net Assets)
17NM0122U-1995964-19/159

Security Shares
Value
Italy — 0.0%Telecom Italia SpA/Milano, Preference Shares, NVS . . . . . . . . 14,121 $ 6,896
Total Preferred Stocks — 0.4%(Cost: $1,193,072). . . . . . . . . . . . . . . . . . . . . . . . . . . . . . . . . . . . . . . . . . . . . . . . . 1,180,941
RightsGermany — 0.0%Vonovia SE (Expires 12/07/21)(a) . . . . . . . . . . . . . . . . . . . . . . . . . . 17,781 62,715
Singapore — 0.0%Mapletree Logistics Trust (Expires 12/14/21)(a) . . . . . . . . . . . . . 3,702 54
Total Rights — 0.0%(Cost: $0) . . . . . . . . . . . . . . . . . . . . . . . . . . . . . . . . . . . . . . . . . . . . . . . . . . . . . . . . . 62,769
Short-Term InvestmentsMoney Market Funds — 0.3%BlackRock Cash Funds: Institutional, SL Agency Shares,
0.06%(d)(e)(f) . . . . . . . . . . . . . . . . . . . . . . . . . . . . . . . . . . . . . . . . . . . . 785,538 785,852BlackRock Cash Funds: Treasury, SL Agency Shares,
0.00%(d)(e) . . . . . . . . . . . . . . . . . . . . . . . . . . . . . . . . . . . . . . . . . . . . . 30,000 30,000
815,852
Total Short-Term Investments — 0.3%(Cost: $815,852) . . . . . . . . . . . . . . . . . . . . . . . . . . . . . . . . . . . . . . . . . . . . . . . . . . 815,852
Total Investments in Securities — 99.8%(Cost: $295,043,369) . . . . . . . . . . . . . . . . . . . . . . . . . . . . . . . . . . . . . . . . . . . . . . 300,322,335
Other Assets, Less Liabilities — 0.2% . . . . . . . . . . . . . . . . . . . . . . . . . . . . . . . 616,380
Net Assets — 100.0% . . . . . . . . . . . . . . . . . . . . . . . . . . . . . . . . . . . . . . . . . . . . . . . . $ 300,938,715
(a) Non-income producing security.(b) All or a portion of this security is on loan.(c) Security exempt from registration pursuant to Rule 144A under the Securities Act of
1933, as amended. These securities may be resold in transactions exempt fromregistration to qualified institutional investors.
(d) Affiliate of the Fund.(e) Annualized 7-day yield as of period end.(f) All or a portion of this security was purchased with the cash collateral from loaned
securities.
Affiliates
Investments in issuers considered to be affiliate(s) of the Fund during the period ended November 30, 2021 for purposes of Section 2(a)(3) of the Investment Company Actof 1940, as amended, were as follows:
Affiliated IssuerValue at
08/31/21Purchases
at CostProceeds
from SalesNet Realized
Gain (Loss)
Change inUnrealized
Appreciation(Depreciation)
Value at11/30/21
SharesHeld at
11/30/21 Income
CapitalGain
Distributionsfrom
UnderlyingFunds
BlackRock Cash Funds: Institutional, SL Agency Shares . . . . $ 27,552 $758,314(a) $ — $ (14) $ — $785,852 785,538 $ 910(b) $ —BlackRock Cash Funds: Treasury, SL Agency Shares . . . . . . . 20,000 10,000(a)
— — — 30,000 30,000 1 —
$ (14) $ — $815,852 $ 911 $ —
(a) Represents net amount purchased (sold).(b) All or a portion represents securities lending income earned from the reinvestment of cash collateral from loaned securities, net of fees and collateral investment expenses, and other
payments to and from borrowers of securities.
Schedule of Investments (unaudited) (continued)
November 30, 2021
iShares� ESG Advanced MSCI EAFE ETF(Percentages shown are based on Net Assets)
18 NM0122U-1995964-20/159

Derivative Financial Instruments Outstanding as of Period End
Futures Contracts
DescriptionNumber ofContracts
ExpirationDate
NotionalAmount
(000)
Value/Unrealized
Appreciation(Depreciation)
Long ContractsMini TOPIX Index. . . . . . . . . . . . . . . . . . . . . . . . . . . . . . . . . . . . . . . . . . . . . . . . . . . . . . . . . . . . . . . . . . . . . . . . . . . . . . . . . . . . . . . . . . . . . . . . . . . . 27 12/09/21 $ 450 $ (29,398)Euro STOXX 50 Index . . . . . . . . . . . . . . . . . . . . . . . . . . . . . . . . . . . . . . . . . . . . . . . . . . . . . . . . . . . . . . . . . . . . . . . . . . . . . . . . . . . . . . . . . . . . . . . 15 12/17/21 691 (49,139)
$ (78,537)
Fair Value Measurements
Various inputs are used in determining the fair value of financial instruments. These inputs to valuation techniques are categorized into a fair value hierarchy consisting ofthree broad levels for financial reporting purposes as follows:
• Level 1 – Unadjusted price quotations in active markets/exchanges for identical assets or liabilities that each Fund has the ability to access;• Level 2 – Other observable inputs (including, but not limited to, quoted prices for similar assets or liabilities in markets that are active, quoted prices for identical or
similar assets or liabilities in markets that are not active, inputs other than quoted prices that are observable for the assets or liabilities (such as interest rates, yieldcurves, volatilities, prepayment speeds, loss severities, credit risks and default rates) or other market-corroborated inputs); and
• Level 3 – Unobservable inputs based on the best information available in the circumstances, to the extent observable inputs are not available (including the BlackRockGlobal Valuation Methodologies Committee’s (the “Global Valuation Committee’s”) assumptions used in determining the fair value of financial instruments).
The hierarchy gives the highest priority to unadjusted quoted prices in active markets for identical assets or liabilities (Level 1 measurements) and the lowest priority tounobservable inputs (Level 3 measurements). Accordingly, the degree of judgment exercised in determining fair value is greatest for instruments categorized in Level 3. Theinputs used to measure fair value may fall into different levels of the fair value hierarchy. In such cases, for disclosure purposes, the fair value hierarchy classification isdetermined based on the lowest level input that is significant to the fair value measurement in its entirety. Investments classified within Level 3 have significant unobservableinputs used by the Global Valuation Committee in determining the price for Fair Valued Investments. Level 3 investments include equity or debt issued by privately heldcompanies or funds. There may not be a secondary market, and/or there are a limited number of investors. The categorization of a value determined for financial instrumentsis based on the pricing transparency of the financial instruments and is not necessarily an indication of the risks associated with investing in those securities. For informationabout the Fund’s policy regarding valuation of financial instruments, refer to its most recent financial statements.
The following table summarizes the Fund’s financial instruments categorized in the fair value hierarchy. The breakdown of the Fund’s financial instruments into majorcategories is disclosed in the Schedule of Investments above.
Level 1 Level 2 Level 3 Total
InvestmentsAssets
Common Stocks. . . . . . . . . . . . . . . . . . . . . . . . . . . . . . . . . . . . . . . . . . . . . . . . . . . . . . . . . . . . . . . . . . . . . . . . . . . . . . . . . . . . $ 4,573,690 $293,689,083 $ — $298,262,773Preferred Stocks . . . . . . . . . . . . . . . . . . . . . . . . . . . . . . . . . . . . . . . . . . . . . . . . . . . . . . . . . . . . . . . . . . . . . . . . . . . . . . . . . . . — 1,180,941 — 1,180,941Rights . . . . . . . . . . . . . . . . . . . . . . . . . . . . . . . . . . . . . . . . . . . . . . . . . . . . . . . . . . . . . . . . . . . . . . . . . . . . . . . . . . . . . . . . . . . . . 62,715 54 — 62,769Money Market Funds . . . . . . . . . . . . . . . . . . . . . . . . . . . . . . . . . . . . . . . . . . . . . . . . . . . . . . . . . . . . . . . . . . . . . . . . . . . . . . . 815,852 — — 815,852
$ 5,452,257 $294,870,078 $ — $300,322,335
Derivative financial instruments(a)
LiabilitiesFutures Contracts . . . . . . . . . . . . . . . . . . . . . . . . . . . . . . . . . . . . . . . . . . . . . . . . . . . . . . . . . . . . . . . . . . . . . . . . . . . . . . . . . . $ — $ (78,537) $ — $ (78,537)
(a) Derivative financial instruments are futures contracts. Futures contracts are valued at the unrealized appreciation (depreciation) on the instrument.
Portfolio Abbreviations - Equity
NVS . . . . . . . . . . . . . Non-Voting SharesREIT . . . . . . . . . . . . . Real Estate Investment Trust
Schedule of Investments (unaudited) (continued)
November 30, 2021
iShares� ESG Advanced MSCI EAFE ETF
19NM0122U-1995964-21/159

Security Shares
Value
Common StocksBrazil — 2.6%Americanas SA(a) . . . . . . . . . . . . . . . . . . . . . . . . . . . . . . . . . . . . . . . . . . . . 3,910 $ 21,088Atacadao SA . . . . . . . . . . . . . . . . . . . . . . . . . . . . . . . . . . . . . . . . . . . . . . . . 5,030 13,716B3 SA - Brasil, Bolsa, Balcao . . . . . . . . . . . . . . . . . . . . . . . . . . . . . . . . . 45,605 90,125Banco Bradesco SA. . . . . . . . . . . . . . . . . . . . . . . . . . . . . . . . . . . . . . . . . . 10,450 31,637Banco do Brasil SA . . . . . . . . . . . . . . . . . . . . . . . . . . . . . . . . . . . . . . . . . . 6,905 39,107Banco Santander Brasil SA. . . . . . . . . . . . . . . . . . . . . . . . . . . . . . . . . . . 3,305 19,377CCR SA . . . . . . . . . . . . . . . . . . . . . . . . . . . . . . . . . . . . . . . . . . . . . . . . . . . . . 9,515 20,835Energisa SA . . . . . . . . . . . . . . . . . . . . . . . . . . . . . . . . . . . . . . . . . . . . . . . . . 1,525 12,340Localiza Rent a Car SA . . . . . . . . . . . . . . . . . . . . . . . . . . . . . . . . . . . . . . 4,500 40,911Lojas Renner SA. . . . . . . . . . . . . . . . . . . . . . . . . . . . . . . . . . . . . . . . . . . . . 8,185 41,421Notre Dame Intermedica Participacoes SA . . . . . . . . . . . . . . . . . . . . 4,210 46,025Rumo SA(a) . . . . . . . . . . . . . . . . . . . . . . . . . . . . . . . . . . . . . . . . . . . . . . . . . . 10,275 32,112Telefonica Brasil SA. . . . . . . . . . . . . . . . . . . . . . . . . . . . . . . . . . . . . . . . . . 3,500 31,309TIM SA . . . . . . . . . . . . . . . . . . . . . . . . . . . . . . . . . . . . . . . . . . . . . . . . . . . . . . 5,490 13,476TOTVS SA . . . . . . . . . . . . . . . . . . . . . . . . . . . . . . . . . . . . . . . . . . . . . . . . . . 4,225 23,816Via S/A(a) . . . . . . . . . . . . . . . . . . . . . . . . . . . . . . . . . . . . . . . . . . . . . . . . . . . . 13,465 13,580WEG SA . . . . . . . . . . . . . . . . . . . . . . . . . . . . . . . . . . . . . . . . . . . . . . . . . . . . 12,285 70,430XP Inc.(a) . . . . . . . . . . . . . . . . . . . . . . . . . . . . . . . . . . . . . . . . . . . . . . . . . . . . — 5
561,310Chile — 0.4%Banco de Chile . . . . . . . . . . . . . . . . . . . . . . . . . . . . . . . . . . . . . . . . . . . . . . 313,200 30,284Banco de Credito e Inversiones SA . . . . . . . . . . . . . . . . . . . . . . . . . . . 436 14,755Banco Santander Chile. . . . . . . . . . . . . . . . . . . . . . . . . . . . . . . . . . . . . . . 460,425 20,550Falabella SA. . . . . . . . . . . . . . . . . . . . . . . . . . . . . . . . . . . . . . . . . . . . . . . . . 5,615 17,373
82,962China — 29.9%360 Security Technology Inc., Class A(a). . . . . . . . . . . . . . . . . . . . . . . 6,489 12,1813SBio Inc.(a)(b) . . . . . . . . . . . . . . . . . . . . . . . . . . . . . . . . . . . . . . . . . . . . . . . 12,500 10,692AAC Technologies Holdings Inc. . . . . . . . . . . . . . . . . . . . . . . . . . . . . . . 5,000 21,838Agricultural Bank of China Ltd., Class A . . . . . . . . . . . . . . . . . . . . . . . 19,500 8,905Agricultural Bank of China Ltd., Class H . . . . . . . . . . . . . . . . . . . . . . . 190,000 62,752A-Living Smart City Services Co. Ltd., Class A(b). . . . . . . . . . . . . . . 3,750 8,810Bank of Communications Co. Ltd., Class A . . . . . . . . . . . . . . . . . . . . 10,000 7,172Bank of Communications Co. Ltd., Class H. . . . . . . . . . . . . . . . . . . . 65,000 37,846Bank of Hangzhou Co. Ltd., Class A . . . . . . . . . . . . . . . . . . . . . . . . . . 3,000 6,449Bank of Shanghai Co. Ltd., Class A . . . . . . . . . . . . . . . . . . . . . . . . . . . 5,500 6,170BeiGene Ltd., ADR(a). . . . . . . . . . . . . . . . . . . . . . . . . . . . . . . . . . . . . . . . . 335 116,423Beijing Enterprises Water Group Ltd.. . . . . . . . . . . . . . . . . . . . . . . . . . 30,000 11,159Beijing Shiji Information Technology Co. Ltd., Class A . . . . . . . . . . 520 2,318BYD Co. Ltd., Class A . . . . . . . . . . . . . . . . . . . . . . . . . . . . . . . . . . . . . . . . 1,000 47,941BYD Co. Ltd., Class H. . . . . . . . . . . . . . . . . . . . . . . . . . . . . . . . . . . . . . . . 5,000 196,668BYD Electronic International Co. Ltd.. . . . . . . . . . . . . . . . . . . . . . . . . . 5,000 18,562China Bohai Bank Co. Ltd., Class H(b). . . . . . . . . . . . . . . . . . . . . . . . . 30,000 8,925China CITIC Bank Corp. Ltd., Class H . . . . . . . . . . . . . . . . . . . . . . . . 65,000 27,898China Conch Venture Holdings Ltd. . . . . . . . . . . . . . . . . . . . . . . . . . . . 12,500 61,099China Construction Bank Corp., Class A . . . . . . . . . . . . . . . . . . . . . . 2,000 1,805China Construction Bank Corp., Class H . . . . . . . . . . . . . . . . . . . . . . 680,000 443,092China Education Group Holdings Ltd. . . . . . . . . . . . . . . . . . . . . . . . . . 5,000 9,198China Everbright Bank Co. Ltd., Class A . . . . . . . . . . . . . . . . . . . . . . 17,000 8,932China Everbright Bank Co. Ltd., Class H . . . . . . . . . . . . . . . . . . . . . . 25,000 8,571China Everbright Environment Group Ltd. . . . . . . . . . . . . . . . . . . . . . 40,000 26,457China Galaxy Securities Co. Ltd., Class A . . . . . . . . . . . . . . . . . . . . . 1,000 1,632China Galaxy Securities Co. Ltd., Class H. . . . . . . . . . . . . . . . . . . . . 27,500 15,157China International Capital Corp. Ltd., Class H(b) . . . . . . . . . . . . . . 12,000 29,030China Jushi Co. Ltd., Class A . . . . . . . . . . . . . . . . . . . . . . . . . . . . . . . . . 2,171 5,935China Medical System Holdings Ltd. . . . . . . . . . . . . . . . . . . . . . . . . . . 10,000 16,378China Merchants Bank Co. Ltd., Class A . . . . . . . . . . . . . . . . . . . . . . 8,500 65,999China Merchants Bank Co. Ltd., Class H . . . . . . . . . . . . . . . . . . . . . . 27,500 213,041
Security Shares
Value
China (continued)China Minsheng Banking Corp. Ltd., Class H . . . . . . . . . . . . . . . . . . 55,000 $ 21,147China Molybdenum Co. Ltd., Class A . . . . . . . . . . . . . . . . . . . . . . . . . 5,500 5,090China Molybdenum Co. Ltd., Class H . . . . . . . . . . . . . . . . . . . . . . . . . 30,000 18,405China Resources Land Ltd.. . . . . . . . . . . . . . . . . . . . . . . . . . . . . . . . . . . 20,000 83,226China Resources Mixc Lifestyle Services Ltd.(b) . . . . . . . . . . . . . . . 4,000 19,736China Resources Sanjiu Medical & Pharmaceutical Co. Ltd.,
Class A . . . . . . . . . . . . . . . . . . . . . . . . . . . . . . . . . . . . . . . . . . . . . . . . . . . 1,500 5,752China Vanke Co. Ltd., Class A . . . . . . . . . . . . . . . . . . . . . . . . . . . . . . . . 5,000 14,308China Vanke Co. Ltd., Class H. . . . . . . . . . . . . . . . . . . . . . . . . . . . . . . . 12,000 27,224China Zheshang Bank Co. Ltd., Class A. . . . . . . . . . . . . . . . . . . . . . . 6,000 3,229CIFI Ever Sunshine Services Group Ltd. . . . . . . . . . . . . . . . . . . . . . . 10,000 16,825Contemporary Amperex Technology Co. Ltd., Class A. . . . . . . . . . 1,000 106,745Country Garden Services Holdings Co. Ltd. . . . . . . . . . . . . . . . . . . . 10,000 60,627CSC Financial Co. Ltd., Class A . . . . . . . . . . . . . . . . . . . . . . . . . . . . . . 4,000 17,611CSPC Pharmaceutical Group Ltd. . . . . . . . . . . . . . . . . . . . . . . . . . . . . 70,000 72,573Dali Foods Group Co. Ltd.(b) . . . . . . . . . . . . . . . . . . . . . . . . . . . . . . . . . . 20,000 10,516Dongfeng Motor Group Co. Ltd., Class H. . . . . . . . . . . . . . . . . . . . . . 20,000 18,567Everbright Securities Co. Ltd., Class A . . . . . . . . . . . . . . . . . . . . . . . . 2,044 4,632Fuyao Glass Industry Group Co. Ltd., Class H(b) . . . . . . . . . . . . . . . 6,000 33,047GDS Holdings Ltd., ADR(a) . . . . . . . . . . . . . . . . . . . . . . . . . . . . . . . . . . . 625 35,025Geely Automobile Holdings Ltd.. . . . . . . . . . . . . . . . . . . . . . . . . . . . . . . 45,000 132,904Genscript Biotech Corp.(a) . . . . . . . . . . . . . . . . . . . . . . . . . . . . . . . . . . . . 10,000 52,545Great Wall Motor Co. Ltd., Class A . . . . . . . . . . . . . . . . . . . . . . . . . . . . 2,000 18,805Great Wall Motor Co. Ltd., Class H. . . . . . . . . . . . . . . . . . . . . . . . . . . . 20,000 83,611Greentown Service Group Co. Ltd.. . . . . . . . . . . . . . . . . . . . . . . . . . . . 10,000 9,592Guangzhou Baiyunshan Pharmaceutical Holdings Co. Ltd.,
Class A . . . . . . . . . . . . . . . . . . . . . . . . . . . . . . . . . . . . . . . . . . . . . . . . . . . 1,024 4,723Haitong Securities Co. Ltd., Class A. . . . . . . . . . . . . . . . . . . . . . . . . . . 3,000 5,571Haitong Securities Co. Ltd., Class H . . . . . . . . . . . . . . . . . . . . . . . . . . 20,000 16,792Hangzhou Robam Appliances Co. Ltd., Class A . . . . . . . . . . . . . . . 1,000 4,932Hangzhou Tigermed Consulting Co. Ltd., Class H(b) . . . . . . . . . . . 1,000 15,840HengTen Networks Group Ltd.(a) . . . . . . . . . . . . . . . . . . . . . . . . . . . . . . 40,000 16,927Hopson Development Holdings Ltd. . . . . . . . . . . . . . . . . . . . . . . . . . . . 5,000 12,099Huatai Securities Co. Ltd., Class A. . . . . . . . . . . . . . . . . . . . . . . . . . . . 7,500 18,637Huatai Securities Co. Ltd., Class H(b). . . . . . . . . . . . . . . . . . . . . . . . . . 17,000 24,358Hundsun Technologies Inc., Class A . . . . . . . . . . . . . . . . . . . . . . . . . . 560 5,156I-Mab, ADR(a) . . . . . . . . . . . . . . . . . . . . . . . . . . . . . . . . . . . . . . . . . . . . . . . . 300 18,138Industrial & Commercial Bank of China Ltd., Class A. . . . . . . . . . . 41,500 29,855Industrial & Commercial Bank of China Ltd., Class H. . . . . . . . . . . 385,000 203,411Industrial Bank Co. Ltd., Class A . . . . . . . . . . . . . . . . . . . . . . . . . . . . . . 9,500 26,795Jinxin Fertility Group Ltd.(a)(b) . . . . . . . . . . . . . . . . . . . . . . . . . . . . . . . . . 12,500 17,370Jiumaojiu International Holdings Ltd.(b) . . . . . . . . . . . . . . . . . . . . . . . . 5,000 10,374Kingboard Laminates Holdings Ltd. . . . . . . . . . . . . . . . . . . . . . . . . . . . 7,500 13,150Kingdee International Software Group Co. Ltd.(a) . . . . . . . . . . . . . . 20,000 60,027Kingsoft Cloud Holdings Ltd., ADR(a) . . . . . . . . . . . . . . . . . . . . . . . . . . 390 6,739Lee & Man Paper Manufacturing Ltd. . . . . . . . . . . . . . . . . . . . . . . . . . 10,000 6,863Lenovo Group Ltd. . . . . . . . . . . . . . . . . . . . . . . . . . . . . . . . . . . . . . . . . . . . 50,000 51,200Li Auto Inc., ADR(a). . . . . . . . . . . . . . . . . . . . . . . . . . . . . . . . . . . . . . . . . . . 3,925 139,102Livzon Pharmaceutical Group Inc., Class A. . . . . . . . . . . . . . . . . . . . 1,000 5,658Logan Group Co. Ltd. . . . . . . . . . . . . . . . . . . . . . . . . . . . . . . . . . . . . . . . . 5,000 4,828Longfor Group Holdings Ltd.(b) . . . . . . . . . . . . . . . . . . . . . . . . . . . . . . . . 12,500 59,310LONGi Green Energy Technology Co. Ltd., Class A. . . . . . . . . . . . 2,500 34,625Meituan, Class B(a)(b). . . . . . . . . . . . . . . . . . . . . . . . . . . . . . . . . . . . . . . . . 29,000 881,434Microport Scientific Corp. . . . . . . . . . . . . . . . . . . . . . . . . . . . . . . . . . . . . . 5,000 20,781Ming Yang Smart Energy Group Ltd., Class A . . . . . . . . . . . . . . . . . 500 2,509Ming Yuan Cloud Group Holdings Ltd.. . . . . . . . . . . . . . . . . . . . . . . . . 5,000 14,252NetEase Inc., ADR . . . . . . . . . . . . . . . . . . . . . . . . . . . . . . . . . . . . . . . . . . . 2,935 316,188NIO Inc., ADR(a)(c). . . . . . . . . . . . . . . . . . . . . . . . . . . . . . . . . . . . . . . . . . . . 9,605 375,844Orient Securities Co. Ltd., Class A . . . . . . . . . . . . . . . . . . . . . . . . . . . . 2,500 5,516Ovctek China Inc., Class A . . . . . . . . . . . . . . . . . . . . . . . . . . . . . . . . . . . 20 180
Schedule of Investments (unaudited)
November 30, 2021
iShares� ESG Advanced MSCI EM ETF(Percentages shown are based on Net Assets)
20 NM0122U-1995964-22/159

Security Shares
Value
China (continued)People's Insurance Co. Group of China Ltd. (The), Class H . . . . 55,000 $ 16,081Pharmaron Beijing Co. Ltd., Class A . . . . . . . . . . . . . . . . . . . . . . . . . . 500 14,263Pharmaron Beijing Co. Ltd., Class H(b) . . . . . . . . . . . . . . . . . . . . . . . . 1,000 20,631Ping An Healthcare and Technology Co. Ltd.(a)(b) . . . . . . . . . . . . . . 4,000 15,081Postal Savings Bank of China Co. Ltd., Class A . . . . . . . . . . . . . . . 7,500 5,967Postal Savings Bank of China Co. Ltd., Class H(b) . . . . . . . . . . . . . 55,000 37,259Shandong Weigao Group Medical Polymer Co. Ltd., Class H. . . 18,000 25,327Shanghai Electric Group Co. Ltd., Class A. . . . . . . . . . . . . . . . . . . . . 6,983 5,298Shanghai Fosun Pharmaceutical Group Co. Ltd., Class H. . . . . . 5,000 25,835Shanghai Pharmaceuticals Holding Co. Ltd., Class H . . . . . . . . . . 11,000 20,057Shanghai Pudong Development Bank Co. Ltd., Class A . . . . . . . . 12,000 16,022Shengyi Technology Co. Ltd., Class A. . . . . . . . . . . . . . . . . . . . . . . . . 1,000 3,701Shenzhen Inovance Technology Co. Ltd., Class A . . . . . . . . . . . . . 1,050 10,857Shenzhen Mindray Bio-Medical Electronics Co. Ltd., Class A. . . 1,000 56,299Shenzhou International Group Holdings Ltd.. . . . . . . . . . . . . . . . . . . 6,000 112,667Shimao Services Holdings Ltd.(b) . . . . . . . . . . . . . . . . . . . . . . . . . . . . . 5,000 6,178Sinopharm Group Co. Ltd., Class H . . . . . . . . . . . . . . . . . . . . . . . . . . . 12,000 26,068Sunac Services Holdings Ltd.(a)(b). . . . . . . . . . . . . . . . . . . . . . . . . . . . . 5,000 7,905Sungrow Power Supply Co. Ltd., Class A. . . . . . . . . . . . . . . . . . . . . . 500 12,678Sunny Optical Technology Group Co. Ltd. . . . . . . . . . . . . . . . . . . . . . 5,000 150,604TCL Technology Group Corp., Class A . . . . . . . . . . . . . . . . . . . . . . . . 6,500 6,260Tianfeng Securities Co. Ltd., Class A. . . . . . . . . . . . . . . . . . . . . . . . . . 10,000 6,051Tongcheng-Elong Holdings Ltd.(a) . . . . . . . . . . . . . . . . . . . . . . . . . . . . . 8,000 16,475Transfar Zhilian Co. Ltd., Class A . . . . . . . . . . . . . . . . . . . . . . . . . . . . . 1,500 2,144Unisplendour Corp. Ltd., Class A . . . . . . . . . . . . . . . . . . . . . . . . . . . . . 1,500 6,082Venus MedTech Hangzhou Inc., Class H(a)(b) . . . . . . . . . . . . . . . . . . 2,500 12,407Vinda International Holdings Ltd.. . . . . . . . . . . . . . . . . . . . . . . . . . . . . . 5,000 13,529Wharf Holdings Ltd. (The) . . . . . . . . . . . . . . . . . . . . . . . . . . . . . . . . . . . . 10,000 34,945Wuchan Zhongda Group Co. Ltd., Class A . . . . . . . . . . . . . . . . . . . . 3,000 2,856Wuhu Sanqi Interactive Entertainment Network Technology
Group Co. Ltd., Class A. . . . . . . . . . . . . . . . . . . . . . . . . . . . . . . . . . . . 1,000 3,696WuXi AppTec Co. Ltd., Class A . . . . . . . . . . . . . . . . . . . . . . . . . . . . . . . 1,060 23,990WuXi AppTec Co. Ltd., Class H(b) . . . . . . . . . . . . . . . . . . . . . . . . . . . . . 2,540 56,274Wuxi Biologics Cayman Inc., New(a)(b). . . . . . . . . . . . . . . . . . . . . . . . . 25,000 337,245Xinjiang Goldwind Science & Technology Co. Ltd., Class H . . . . 7,000 15,342Xinyi Solar Holdings Ltd. . . . . . . . . . . . . . . . . . . . . . . . . . . . . . . . . . . . . . 40,000 73,555XPeng Inc., ADR(a)(c) . . . . . . . . . . . . . . . . . . . . . . . . . . . . . . . . . . . . . . . . . 2,755 151,525Yadea Group Holdings Ltd.(b) . . . . . . . . . . . . . . . . . . . . . . . . . . . . . . . . . 10,000 17,928Yonyou Network Technology Co. Ltd., Class A . . . . . . . . . . . . . . . . . 1,500 7,667Yum China Holdings Inc. . . . . . . . . . . . . . . . . . . . . . . . . . . . . . . . . . . . . . 3,030 151,803Yunnan Baiyao Group Co. Ltd., Class A . . . . . . . . . . . . . . . . . . . . . . . 600 8,331Zhongsheng Group Holdings Ltd. . . . . . . . . . . . . . . . . . . . . . . . . . . . . . 5,000 41,132
6,397,976Colombia — 0.2%Bancolombia SA . . . . . . . . . . . . . . . . . . . . . . . . . . . . . . . . . . . . . . . . . . . . . 1,875 15,192Grupo de Inversiones Suramericana SA. . . . . . . . . . . . . . . . . . . . . . . 1,955 12,308Interconexion Electrica SA ESP. . . . . . . . . . . . . . . . . . . . . . . . . . . . . . . 2,770 15,462
42,962Czech Republic — 0.1%Komercni Banka AS. . . . . . . . . . . . . . . . . . . . . . . . . . . . . . . . . . . . . . . . . . 460 17,568Moneta Money Bank AS(a)(b) . . . . . . . . . . . . . . . . . . . . . . . . . . . . . . . . . . 2,445 10,417
27,985Egypt — 0.2%Commercial International Bank Egypt SAE(a) . . . . . . . . . . . . . . . . . . 11,925 38,817
Greece — 0.3%Alpha Services and Holdings SA(a) . . . . . . . . . . . . . . . . . . . . . . . . . . . . 16,275 19,000Eurobank Ergasias Services and Holdings SA, Class A(a) . . . . . . 18,045 17,859
Security Shares
Value
Greece (continued)Hellenic Telecommunications Organization SA . . . . . . . . . . . . . . . . 1,680 $ 29,024
65,883Hong Kong — 0.3%Sino Biopharmaceutical Ltd. . . . . . . . . . . . . . . . . . . . . . . . . . . . . . . . . . . 80,000 58,374
Hungary — 0.6%OTP Bank Nyrt(a). . . . . . . . . . . . . . . . . . . . . . . . . . . . . . . . . . . . . . . . . . . . . 1,615 89,174Richter Gedeon Nyrt . . . . . . . . . . . . . . . . . . . . . . . . . . . . . . . . . . . . . . . . . 1,050 27,945
117,119India — 13.2%Adani Green Energy Ltd.(a) . . . . . . . . . . . . . . . . . . . . . . . . . . . . . . . . . . . 2,725 46,898Asian Paints Ltd. . . . . . . . . . . . . . . . . . . . . . . . . . . . . . . . . . . . . . . . . . . . . . 2,685 112,357Axis Bank Ltd.(a) . . . . . . . . . . . . . . . . . . . . . . . . . . . . . . . . . . . . . . . . . . . . . 16,365 142,517Bajaj Auto Ltd. . . . . . . . . . . . . . . . . . . . . . . . . . . . . . . . . . . . . . . . . . . . . . . . 530 22,879Bajaj Finance Ltd.. . . . . . . . . . . . . . . . . . . . . . . . . . . . . . . . . . . . . . . . . . . . 1,890 176,049Bandhan Bank Ltd.(b). . . . . . . . . . . . . . . . . . . . . . . . . . . . . . . . . . . . . . . . . 4,705 17,022Bharti Airtel Ltd.(a) . . . . . . . . . . . . . . . . . . . . . . . . . . . . . . . . . . . . . . . . . . . . 17,150 166,201Biocon Ltd.(a) . . . . . . . . . . . . . . . . . . . . . . . . . . . . . . . . . . . . . . . . . . . . . . . . 3,075 14,758Cholamandalam Investment and Finance Co. Ltd. . . . . . . . . . . . . . 2,680 19,614Colgate-Palmolive India Ltd. . . . . . . . . . . . . . . . . . . . . . . . . . . . . . . . . . . 1,045 19,936Dabur India Ltd.. . . . . . . . . . . . . . . . . . . . . . . . . . . . . . . . . . . . . . . . . . . . . . 4,015 31,784Eicher Motors Ltd. . . . . . . . . . . . . . . . . . . . . . . . . . . . . . . . . . . . . . . . . . . . 1,055 33,212Havells India Ltd. . . . . . . . . . . . . . . . . . . . . . . . . . . . . . . . . . . . . . . . . . . . . 1,845 33,306HCL Technologies Ltd. . . . . . . . . . . . . . . . . . . . . . . . . . . . . . . . . . . . . . . . 7,585 114,885HDFC Life Insurance Co. Ltd.(b). . . . . . . . . . . . . . . . . . . . . . . . . . . . . . . 6,200 56,182Hero MotoCorp Ltd. . . . . . . . . . . . . . . . . . . . . . . . . . . . . . . . . . . . . . . . . . . 930 30,338Hindustan Unilever Ltd. . . . . . . . . . . . . . . . . . . . . . . . . . . . . . . . . . . . . . . 5,830 179,892ICICI Lombard General Insurance Co. Ltd.(b) . . . . . . . . . . . . . . . . . . 1,465 27,997Info Edge India Ltd. . . . . . . . . . . . . . . . . . . . . . . . . . . . . . . . . . . . . . . . . . . 551 42,569Infosys Ltd. . . . . . . . . . . . . . . . . . . . . . . . . . . . . . . . . . . . . . . . . . . . . . . . . . . 23,845 542,378Kotak Mahindra Bank Ltd. . . . . . . . . . . . . . . . . . . . . . . . . . . . . . . . . . . . . 3,900 101,860Mahindra & Mahindra Ltd. . . . . . . . . . . . . . . . . . . . . . . . . . . . . . . . . . . . . 5,930 65,906Marico Ltd. . . . . . . . . . . . . . . . . . . . . . . . . . . . . . . . . . . . . . . . . . . . . . . . . . . 3,505 25,120Mphasis Ltd. . . . . . . . . . . . . . . . . . . . . . . . . . . . . . . . . . . . . . . . . . . . . . . . . . 530 20,418Nestle India Ltd. . . . . . . . . . . . . . . . . . . . . . . . . . . . . . . . . . . . . . . . . . . . . . 235 59,859Piramal Enterprises Ltd. . . . . . . . . . . . . . . . . . . . . . . . . . . . . . . . . . . . . . . 775 24,897SBI Cards & Payment Services Ltd.(a). . . . . . . . . . . . . . . . . . . . . . . . . 1,590 20,056Shriram Transport Finance Co. Ltd. . . . . . . . . . . . . . . . . . . . . . . . . . . . 1,365 25,575Siemens Ltd. . . . . . . . . . . . . . . . . . . . . . . . . . . . . . . . . . . . . . . . . . . . . . . . . 470 13,449State Bank of India. . . . . . . . . . . . . . . . . . . . . . . . . . . . . . . . . . . . . . . . . . . 12,505 76,500Tata Consultancy Services Ltd. . . . . . . . . . . . . . . . . . . . . . . . . . . . . . . . 6,490 305,012Tech Mahindra Ltd.. . . . . . . . . . . . . . . . . . . . . . . . . . . . . . . . . . . . . . . . . . . 4,325 88,582Titan Co. Ltd. . . . . . . . . . . . . . . . . . . . . . . . . . . . . . . . . . . . . . . . . . . . . . . . . 2,430 76,770Trent Ltd. . . . . . . . . . . . . . . . . . . . . . . . . . . . . . . . . . . . . . . . . . . . . . . . . . . . . 1,340 18,096Wipro Ltd. . . . . . . . . . . . . . . . . . . . . . . . . . . . . . . . . . . . . . . . . . . . . . . . . . . . 9,615 81,040
2,833,914Indonesia — 2.7%Bank Central Asia Tbk PT . . . . . . . . . . . . . . . . . . . . . . . . . . . . . . . . . . . . 380,000 193,089Bank Mandiri Persero Tbk PT. . . . . . . . . . . . . . . . . . . . . . . . . . . . . . . . . 129,500 63,219Bank Negara Indonesia Persero Tbk PT . . . . . . . . . . . . . . . . . . . . . . 52,500 24,850Bank Rakyat Indonesia Persero Tbk PT . . . . . . . . . . . . . . . . . . . . . . . 483,747 137,838Barito Pacific Tbk PT . . . . . . . . . . . . . . . . . . . . . . . . . . . . . . . . . . . . . . . . . 196,500 12,622Kalbe Farma Tbk PT . . . . . . . . . . . . . . . . . . . . . . . . . . . . . . . . . . . . . . . . . 143,500 16,026Telkom Indonesia Persero Tbk PT . . . . . . . . . . . . . . . . . . . . . . . . . . . . 343,500 95,639Tower Bersama Infrastructure Tbk PT . . . . . . . . . . . . . . . . . . . . . . . . . 49,500 10,449Unilever Indonesia Tbk PT . . . . . . . . . . . . . . . . . . . . . . . . . . . . . . . . . . . 63,500 19,896
573,628Kuwait — 0.4%Kuwait Finance House KSCP. . . . . . . . . . . . . . . . . . . . . . . . . . . . . . . . . 31,930 83,553
Schedule of Investments (unaudited) (continued)
November 30, 2021
iShares� ESG Advanced MSCI EM ETF(Percentages shown are based on Net Assets)
21NM0122U-1995964-23/159

Security Shares
Value
Malaysia — 2.1%AMMB Holdings Bhd(a) . . . . . . . . . . . . . . . . . . . . . . . . . . . . . . . . . . . . . . . 14,600 $ 10,955Axiata Group Bhd . . . . . . . . . . . . . . . . . . . . . . . . . . . . . . . . . . . . . . . . . . . . 21,500 19,910CIMB Group Holdings Bhd . . . . . . . . . . . . . . . . . . . . . . . . . . . . . . . . . . . 45,500 55,906DiGi.Com Bhd . . . . . . . . . . . . . . . . . . . . . . . . . . . . . . . . . . . . . . . . . . . . . . . 22,500 22,278Fraser & Neave Holdings Bhd . . . . . . . . . . . . . . . . . . . . . . . . . . . . . . . . 2,000 12,212HAP Seng Consolidated Bhd . . . . . . . . . . . . . . . . . . . . . . . . . . . . . . . . . 4,500 8,121IHH Healthcare Bhd. . . . . . . . . . . . . . . . . . . . . . . . . . . . . . . . . . . . . . . . . . 17,000 26,561Inari Amertron Bhd . . . . . . . . . . . . . . . . . . . . . . . . . . . . . . . . . . . . . . . . . . . 19,500 19,400Kossan Rubber Industries Bhd. . . . . . . . . . . . . . . . . . . . . . . . . . . . . . . . 300 153Kuala Lumpur Kepong Bhd . . . . . . . . . . . . . . . . . . . . . . . . . . . . . . . . . . . 3,000 14,987Malayan Banking Bhd . . . . . . . . . . . . . . . . . . . . . . . . . . . . . . . . . . . . . . . . 30,000 56,831Maxis Bhd . . . . . . . . . . . . . . . . . . . . . . . . . . . . . . . . . . . . . . . . . . . . . . . . . . . 16,000 17,737Nestle Malaysia Bhd . . . . . . . . . . . . . . . . . . . . . . . . . . . . . . . . . . . . . . . . . 500 15,851PPB Group Bhd. . . . . . . . . . . . . . . . . . . . . . . . . . . . . . . . . . . . . . . . . . . . . . 3,500 14,809Press Metal Aluminium Holdings Bhd . . . . . . . . . . . . . . . . . . . . . . . . . 23,000 29,218Public Bank Bhd . . . . . . . . . . . . . . . . . . . . . . . . . . . . . . . . . . . . . . . . . . . . . 104,500 97,763RHB Bank Bhd . . . . . . . . . . . . . . . . . . . . . . . . . . . . . . . . . . . . . . . . . . . . . . 14,000 17,543Sime Darby Bhd . . . . . . . . . . . . . . . . . . . . . . . . . . . . . . . . . . . . . . . . . . . . . 16,000 8,320Telekom Malaysia Bhd . . . . . . . . . . . . . . . . . . . . . . . . . . . . . . . . . . . . . . . 8,000 10,566
459,121Mexico — 0.9%Arca Continental SAB de CV . . . . . . . . . . . . . . . . . . . . . . . . . . . . . . . . . 2,500 15,247Coca-Cola Femsa SAB de CV . . . . . . . . . . . . . . . . . . . . . . . . . . . . . . . . 3,500 17,189Grupo Aeroportuario del Sureste SAB de CV, Class B. . . . . . . . . . 1,400 25,648Grupo Financiero Banorte SAB de CV, Class O. . . . . . . . . . . . . . . . 18,000 107,559Industrias Penoles SAB de CV. . . . . . . . . . . . . . . . . . . . . . . . . . . . . . . . 1,100 13,486Kimberly-Clark de Mexico SAB de CV, Class A . . . . . . . . . . . . . . . . 11,000 17,273
196,402Peru — 0.3%Credicorp Ltd. . . . . . . . . . . . . . . . . . . . . . . . . . . . . . . . . . . . . . . . . . . . . . . . 500 59,000
Philippines — 0.6%Bank of the Philippine Islands . . . . . . . . . . . . . . . . . . . . . . . . . . . . . . . . 12,000 21,705BDO Unibank Inc.. . . . . . . . . . . . . . . . . . . . . . . . . . . . . . . . . . . . . . . . . . . . 14,900 36,613Globe Telecom Inc. . . . . . . . . . . . . . . . . . . . . . . . . . . . . . . . . . . . . . . . . . . 175 11,399SM Prime Holdings Inc. . . . . . . . . . . . . . . . . . . . . . . . . . . . . . . . . . . . . . . 69,500 51,524
121,241Poland — 1.4%Allegro.eu SA(a)(b) . . . . . . . . . . . . . . . . . . . . . . . . . . . . . . . . . . . . . . . . . . . . 2,845 27,268Bank Polska Kasa Opieki SA . . . . . . . . . . . . . . . . . . . . . . . . . . . . . . . . . 1,310 37,829CD Projekt SA . . . . . . . . . . . . . . . . . . . . . . . . . . . . . . . . . . . . . . . . . . . . . . . 565 25,141KGHM Polska Miedz SA . . . . . . . . . . . . . . . . . . . . . . . . . . . . . . . . . . . . . 1,085 37,261LPP SA. . . . . . . . . . . . . . . . . . . . . . . . . . . . . . . . . . . . . . . . . . . . . . . . . . . . . . 10 32,577mBank SA(a) . . . . . . . . . . . . . . . . . . . . . . . . . . . . . . . . . . . . . . . . . . . . . . . . . 95 11,218Orange Polska SA(a) . . . . . . . . . . . . . . . . . . . . . . . . . . . . . . . . . . . . . . . . . 2,280 4,738Powszechna Kasa Oszczednosci Bank Polski SA(a) . . . . . . . . . . . 6,255 66,106Powszechny Zaklad Ubezpieczen SA . . . . . . . . . . . . . . . . . . . . . . . . . 3,980 34,706Santander Bank Polska SA . . . . . . . . . . . . . . . . . . . . . . . . . . . . . . . . . . . 245 21,760
298,604Qatar — 0.9%Commercial Bank PSQC (The) . . . . . . . . . . . . . . . . . . . . . . . . . . . . . . . 12,625 22,553Ooredoo QPSC . . . . . . . . . . . . . . . . . . . . . . . . . . . . . . . . . . . . . . . . . . . . . . 6,780 12,574Qatar National Bank QPSC. . . . . . . . . . . . . . . . . . . . . . . . . . . . . . . . . . . 31,575 166,978
202,105Russia — 1.4%Magnit PJSC, GDR . . . . . . . . . . . . . . . . . . . . . . . . . . . . . . . . . . . . . . . . . . 2,245 34,610Mail.Ru Group Ltd., GDR(a) . . . . . . . . . . . . . . . . . . . . . . . . . . . . . . . . . . . 955 16,147Moscow Exchange MICEX-RTS PJSC . . . . . . . . . . . . . . . . . . . . . . . . 9,900 20,237Novolipetsk Steel PJSC . . . . . . . . . . . . . . . . . . . . . . . . . . . . . . . . . . . . . . 11,250 32,764
Security Shares
Value
Russia (continued)PhosAgro PJSC, GDR . . . . . . . . . . . . . . . . . . . . . . . . . . . . . . . . . . . . . . . 900 $ 19,854Polymetal International PLC . . . . . . . . . . . . . . . . . . . . . . . . . . . . . . . . . . 2,470 46,225Polyus PJSC . . . . . . . . . . . . . . . . . . . . . . . . . . . . . . . . . . . . . . . . . . . . . . . . 230 44,833TCS Group Holding PLC, GDR . . . . . . . . . . . . . . . . . . . . . . . . . . . . . . . 845 82,475
297,145Saudi Arabia — 1.3%Almarai Co. JSC . . . . . . . . . . . . . . . . . . . . . . . . . . . . . . . . . . . . . . . . . . . . . 1,915 24,425Bank AlBilad(a) . . . . . . . . . . . . . . . . . . . . . . . . . . . . . . . . . . . . . . . . . . . . . . . 2,375 27,075Dr Sulaiman Al Habib Medical Services Group Co.. . . . . . . . . . . . . 385 16,833Saudi Basic Industries Corp.. . . . . . . . . . . . . . . . . . . . . . . . . . . . . . . . . . 6,290 180,769Savola Group (The) . . . . . . . . . . . . . . . . . . . . . . . . . . . . . . . . . . . . . . . . . . 2,245 18,588
267,690South Africa — 6.3%Absa Group Ltd. . . . . . . . . . . . . . . . . . . . . . . . . . . . . . . . . . . . . . . . . . . . . . 5,165 43,368Anglo American Platinum Ltd. . . . . . . . . . . . . . . . . . . . . . . . . . . . . . . . . 400 42,429Aspen Pharmacare Holdings Ltd. . . . . . . . . . . . . . . . . . . . . . . . . . . . . . 2,750 41,135Bid Corp. Ltd. . . . . . . . . . . . . . . . . . . . . . . . . . . . . . . . . . . . . . . . . . . . . . . . . 2,430 46,595Bidvest Group Ltd. (The) . . . . . . . . . . . . . . . . . . . . . . . . . . . . . . . . . . . . . 2,095 23,815Capitec Bank Holdings Ltd. . . . . . . . . . . . . . . . . . . . . . . . . . . . . . . . . . . . 565 64,759Clicks Group Ltd. . . . . . . . . . . . . . . . . . . . . . . . . . . . . . . . . . . . . . . . . . . . . 1,900 33,867Discovery Ltd.(a) . . . . . . . . . . . . . . . . . . . . . . . . . . . . . . . . . . . . . . . . . . . . . 3,005 25,181FirstRand Ltd. . . . . . . . . . . . . . . . . . . . . . . . . . . . . . . . . . . . . . . . . . . . . . . . 34,965 122,276Gold Fields Ltd. . . . . . . . . . . . . . . . . . . . . . . . . . . . . . . . . . . . . . . . . . . . . . . 6,110 70,326Growthpoint Properties Ltd.. . . . . . . . . . . . . . . . . . . . . . . . . . . . . . . . . . . 20,130 16,896Impala Platinum Holdings Ltd. . . . . . . . . . . . . . . . . . . . . . . . . . . . . . . . . 5,925 74,207Mr. Price Group Ltd.. . . . . . . . . . . . . . . . . . . . . . . . . . . . . . . . . . . . . . . . . . 1,870 23,397MTN Group Ltd.(a) . . . . . . . . . . . . . . . . . . . . . . . . . . . . . . . . . . . . . . . . . . . 11,805 119,079MultiChoice Group . . . . . . . . . . . . . . . . . . . . . . . . . . . . . . . . . . . . . . . . . . . 2,705 20,921Naspers Ltd., Class N . . . . . . . . . . . . . . . . . . . . . . . . . . . . . . . . . . . . . . . . 1,550 239,564Nedbank Group Ltd. . . . . . . . . . . . . . . . . . . . . . . . . . . . . . . . . . . . . . . . . . 3,349 34,781NEPI Rockcastle PLC . . . . . . . . . . . . . . . . . . . . . . . . . . . . . . . . . . . . . . . . 3,060 18,980Old Mutual Ltd. . . . . . . . . . . . . . . . . . . . . . . . . . . . . . . . . . . . . . . . . . . . . . . 32,905 25,136Remgro Ltd. . . . . . . . . . . . . . . . . . . . . . . . . . . . . . . . . . . . . . . . . . . . . . . . . . 3,515 27,740Sanlam Ltd. . . . . . . . . . . . . . . . . . . . . . . . . . . . . . . . . . . . . . . . . . . . . . . . . . 13,485 46,971Shoprite Holdings Ltd.. . . . . . . . . . . . . . . . . . . . . . . . . . . . . . . . . . . . . . . . 3,340 41,403SPAR Group Ltd. (The). . . . . . . . . . . . . . . . . . . . . . . . . . . . . . . . . . . . . . . 1,315 13,444Standard Bank Group Ltd. . . . . . . . . . . . . . . . . . . . . . . . . . . . . . . . . . . . . 9,255 75,175Vodacom Group Ltd. . . . . . . . . . . . . . . . . . . . . . . . . . . . . . . . . . . . . . . . . . 4,410 37,018Woolworths Holdings Ltd. . . . . . . . . . . . . . . . . . . . . . . . . . . . . . . . . . . . . 7,120 23,013
1,351,476South Korea — 7.5%Amorepacific Corp.. . . . . . . . . . . . . . . . . . . . . . . . . . . . . . . . . . . . . . . . . . . 235 31,047AMOREPACIFIC Group . . . . . . . . . . . . . . . . . . . . . . . . . . . . . . . . . . . . . . 300 10,414BGF retail Co. Ltd. . . . . . . . . . . . . . . . . . . . . . . . . . . . . . . . . . . . . . . . . . . . 70 8,603Celltrion Healthcare Co. Ltd.(a) . . . . . . . . . . . . . . . . . . . . . . . . . . . . . . . . 630 42,958CJ CheilJedang Corp. . . . . . . . . . . . . . . . . . . . . . . . . . . . . . . . . . . . . . . . . 60 17,882CJ Corp.. . . . . . . . . . . . . . . . . . . . . . . . . . . . . . . . . . . . . . . . . . . . . . . . . . . . . 100 6,731Coway Co. Ltd. . . . . . . . . . . . . . . . . . . . . . . . . . . . . . . . . . . . . . . . . . . . . . . 395 22,537DB Insurance Co. Ltd.. . . . . . . . . . . . . . . . . . . . . . . . . . . . . . . . . . . . . . . . 325 14,730GS Engineering & Construction Corp. . . . . . . . . . . . . . . . . . . . . . . . . . 465 14,353Hana Financial Group Inc. . . . . . . . . . . . . . . . . . . . . . . . . . . . . . . . . . . . . 2,090 69,466Hankook Tire & Technology Co. Ltd. . . . . . . . . . . . . . . . . . . . . . . . . . . 555 17,995HYBE Co. Ltd.(a) . . . . . . . . . . . . . . . . . . . . . . . . . . . . . . . . . . . . . . . . . . . . . 105 32,152Kakao Corp. . . . . . . . . . . . . . . . . . . . . . . . . . . . . . . . . . . . . . . . . . . . . . . . . . 2,190 224,059KB Financial Group Inc. . . . . . . . . . . . . . . . . . . . . . . . . . . . . . . . . . . . . . . 2,705 120,232LG Corp. . . . . . . . . . . . . . . . . . . . . . . . . . . . . . . . . . . . . . . . . . . . . . . . . . . . . 615 40,699LG Display Co. Ltd.(a) . . . . . . . . . . . . . . . . . . . . . . . . . . . . . . . . . . . . . . . . 1,560 26,092LG Electronics Inc. . . . . . . . . . . . . . . . . . . . . . . . . . . . . . . . . . . . . . . . . . . . 745 72,513LG Household & Health Care Ltd.. . . . . . . . . . . . . . . . . . . . . . . . . . . . . 70 62,079
Schedule of Investments (unaudited) (continued)
November 30, 2021
iShares� ESG Advanced MSCI EM ETF(Percentages shown are based on Net Assets)
22 NM0122U-1995964-24/159

Security Shares
Value
South Korea (continued)LG Innotek Co. Ltd. . . . . . . . . . . . . . . . . . . . . . . . . . . . . . . . . . . . . . . . . . . 95 $ 24,248Mirae Asset Securities Co. Ltd. . . . . . . . . . . . . . . . . . . . . . . . . . . . . . . . 1,300 9,368NCSoft Corp. . . . . . . . . . . . . . . . . . . . . . . . . . . . . . . . . . . . . . . . . . . . . . . . . 115 65,655Netmarble Corp.(b) . . . . . . . . . . . . . . . . . . . . . . . . . . . . . . . . . . . . . . . . . . . 145 14,241Samsung Fire & Marine Insurance Co. Ltd. . . . . . . . . . . . . . . . . . . . . 200 34,028Samsung Life Insurance Co. Ltd. . . . . . . . . . . . . . . . . . . . . . . . . . . . . . 535 26,819Samsung SDS Co. Ltd.. . . . . . . . . . . . . . . . . . . . . . . . . . . . . . . . . . . . . . . 285 34,248Samsung Securities Co. Ltd. . . . . . . . . . . . . . . . . . . . . . . . . . . . . . . . . . 285 10,616Shinhan Financial Group Co. Ltd. . . . . . . . . . . . . . . . . . . . . . . . . . . . . . 3,070 89,280SK Biopharmaceuticals Co. Ltd.(a) . . . . . . . . . . . . . . . . . . . . . . . . . . . . 195 15,657SK Hynix Inc. . . . . . . . . . . . . . . . . . . . . . . . . . . . . . . . . . . . . . . . . . . . . . . . . 3,820 365,196SK Square Co. Ltd.(a) . . . . . . . . . . . . . . . . . . . . . . . . . . . . . . . . . . . . . . . . 206 11,792SK Telecom Co. Ltd. . . . . . . . . . . . . . . . . . . . . . . . . . . . . . . . . . . . . . . . . . 318 14,561Woori Financial Group Inc. . . . . . . . . . . . . . . . . . . . . . . . . . . . . . . . . . . . 3,495 36,992Yuhan Corp. . . . . . . . . . . . . . . . . . . . . . . . . . . . . . . . . . . . . . . . . . . . . . . . . . 400 19,474
1,606,717Taiwan — 19.3%Accton Technology Corp. . . . . . . . . . . . . . . . . . . . . . . . . . . . . . . . . . . . . . 5,000 51,934Acer Inc.. . . . . . . . . . . . . . . . . . . . . . . . . . . . . . . . . . . . . . . . . . . . . . . . . . . . . 20,000 19,878ASE Technology Holding Co. Ltd. . . . . . . . . . . . . . . . . . . . . . . . . . . . . . 25,000 91,131Asustek Computer Inc. . . . . . . . . . . . . . . . . . . . . . . . . . . . . . . . . . . . . . . . 5,000 63,215AU Optronics Corp. . . . . . . . . . . . . . . . . . . . . . . . . . . . . . . . . . . . . . . . . . . 60,000 43,223Catcher Technology Co. Ltd.. . . . . . . . . . . . . . . . . . . . . . . . . . . . . . . . . . 5,000 27,768Cathay Financial Holding Co. Ltd.. . . . . . . . . . . . . . . . . . . . . . . . . . . . . 55,000 118,161Chailease Holding Co. Ltd. . . . . . . . . . . . . . . . . . . . . . . . . . . . . . . . . . . . 10,300 91,124Chang Hwa Commercial Bank Ltd.. . . . . . . . . . . . . . . . . . . . . . . . . . . . 30,000 17,665China Development Financial Holding Corp.. . . . . . . . . . . . . . . . . . . 95,000 55,775China Life Insurance Co. Ltd. . . . . . . . . . . . . . . . . . . . . . . . . . . . . . . . . . 15,600 17,169China Steel Corp. . . . . . . . . . . . . . . . . . . . . . . . . . . . . . . . . . . . . . . . . . . . . 85,000 99,167Chunghwa Telecom Co. Ltd. . . . . . . . . . . . . . . . . . . . . . . . . . . . . . . . . . . 26,000 104,600Compal Electronics Inc. . . . . . . . . . . . . . . . . . . . . . . . . . . . . . . . . . . . . . . 30,000 24,911CTBC Financial Holding Co. Ltd.. . . . . . . . . . . . . . . . . . . . . . . . . . . . . . 130,000 113,805Delta Electronics Inc.. . . . . . . . . . . . . . . . . . . . . . . . . . . . . . . . . . . . . . . . . 15,000 137,894E.Sun Financial Holding Co. Ltd.. . . . . . . . . . . . . . . . . . . . . . . . . . . . . . 85,116 82,263Evergreen Marine Corp. Taiwan Ltd. . . . . . . . . . . . . . . . . . . . . . . . . . . 20,000 88,584Far Eastern New Century Corp.. . . . . . . . . . . . . . . . . . . . . . . . . . . . . . . 20,000 20,001Far EasTone Telecommunications Co. Ltd. . . . . . . . . . . . . . . . . . . . . 10,000 22,114First Financial Holding Co. Ltd. . . . . . . . . . . . . . . . . . . . . . . . . . . . . . . . 75,450 62,663Foxconn Technology Co. Ltd. . . . . . . . . . . . . . . . . . . . . . . . . . . . . . . . . . 5,000 11,681Fubon Financial Holding Co. Ltd. . . . . . . . . . . . . . . . . . . . . . . . . . . . . . 56,143 147,156Hiwin Technologies Corp.. . . . . . . . . . . . . . . . . . . . . . . . . . . . . . . . . . . . . 5,150 52,678Hotai Motor Co. Ltd.. . . . . . . . . . . . . . . . . . . . . . . . . . . . . . . . . . . . . . . . . . 1,000 21,795Hua Nan Financial Holdings Co. Ltd. . . . . . . . . . . . . . . . . . . . . . . . . . . 61,584 44,667Innolux Corp. . . . . . . . . . . . . . . . . . . . . . . . . . . . . . . . . . . . . . . . . . . . . . . . . 65,000 40,559Inventec Corp. . . . . . . . . . . . . . . . . . . . . . . . . . . . . . . . . . . . . . . . . . . . . . . . 15,000 13,853Lite-On Technology Corp. . . . . . . . . . . . . . . . . . . . . . . . . . . . . . . . . . . . . 15,000 32,430MediaTek Inc.. . . . . . . . . . . . . . . . . . . . . . . . . . . . . . . . . . . . . . . . . . . . . . . . 10,000 362,506Mega Financial Holding Co. Ltd. . . . . . . . . . . . . . . . . . . . . . . . . . . . . . . 75,000 92,164Micro-Star International Co. Ltd. . . . . . . . . . . . . . . . . . . . . . . . . . . . . . . 5,000 29,258President Chain Store Corp. . . . . . . . . . . . . . . . . . . . . . . . . . . . . . . . . . . 5,000 48,384Quanta Computer Inc.. . . . . . . . . . . . . . . . . . . . . . . . . . . . . . . . . . . . . . . . 20,000 61,618Shanghai Commercial & Savings Bank Ltd. (The). . . . . . . . . . . . . . 25,000 41,587SinoPac Financial Holdings Co. Ltd. . . . . . . . . . . . . . . . . . . . . . . . . . . 70,000 38,407Taishin Financial Holding Co. Ltd. . . . . . . . . . . . . . . . . . . . . . . . . . . . . . 71,907 48,016Taiwan Cooperative Financial Holding Co. Ltd. . . . . . . . . . . . . . . . . 65,840 56,124Taiwan Mobile Co. Ltd. . . . . . . . . . . . . . . . . . . . . . . . . . . . . . . . . . . . . . . . 10,000 34,867Taiwan Semiconductor Manufacturing Co. Ltd. . . . . . . . . . . . . . . . . 50,000 1,063,434Unimicron Technology Corp. . . . . . . . . . . . . . . . . . . . . . . . . . . . . . . . . . . 10,000 81,660United Microelectronics Corp.. . . . . . . . . . . . . . . . . . . . . . . . . . . . . . . . . 85,000 194,589Vanguard International Semiconductor Corp. . . . . . . . . . . . . . . . . . . 5,000 27,856
Security Shares
Value
Taiwan (continued)Win Semiconductors Corp. . . . . . . . . . . . . . . . . . . . . . . . . . . . . . . . . . . . 2,000 $ 26,016Wistron Corp. . . . . . . . . . . . . . . . . . . . . . . . . . . . . . . . . . . . . . . . . . . . . . . . . 20,000 20,548Yageo Corp. . . . . . . . . . . . . . . . . . . . . . . . . . . . . . . . . . . . . . . . . . . . . . . . . . 5,000 81,674Yang Ming Marine Transport Corp.(a) . . . . . . . . . . . . . . . . . . . . . . . . . . 10,000 41,064Yuanta Financial Holding Co. Ltd. . . . . . . . . . . . . . . . . . . . . . . . . . . . . . 70,000 59,475
4,127,111Thailand — 2.5%Advanced Info Service PCL, NVDR . . . . . . . . . . . . . . . . . . . . . . . . . . . 8,500 51,883Airports of Thailand PCL, NVDR . . . . . . . . . . . . . . . . . . . . . . . . . . . . . . 31,000 54,903Asset World Corp. PCL, NVDR(a) . . . . . . . . . . . . . . . . . . . . . . . . . . . . . 67,000 8,474Bangkok Dusit Medical Services PCL, NVDR. . . . . . . . . . . . . . . . . . 76,000 50,211BTS Group Holdings PCL, NVDR . . . . . . . . . . . . . . . . . . . . . . . . . . . . . 64,000 17,448Bumrungrad Hospital PCL, NVDR . . . . . . . . . . . . . . . . . . . . . . . . . . . . 4,500 19,163Central Pattana PCL, NVDR. . . . . . . . . . . . . . . . . . . . . . . . . . . . . . . . . . 14,500 22,357Charoen Pokphand Foods PCL, NVDR . . . . . . . . . . . . . . . . . . . . . . . 31,500 22,205CP ALL PCL, NVDR. . . . . . . . . . . . . . . . . . . . . . . . . . . . . . . . . . . . . . . . . . 42,000 72,758Energy Absolute PCL, NVDR . . . . . . . . . . . . . . . . . . . . . . . . . . . . . . . . . 11,000 26,719Home Product Center PCL, NVDR. . . . . . . . . . . . . . . . . . . . . . . . . . . . 37,500 15,124Indorama Ventures PCL, NVDR . . . . . . . . . . . . . . . . . . . . . . . . . . . . . . 14,000 16,255Intouch Holdings PCL, NVDR. . . . . . . . . . . . . . . . . . . . . . . . . . . . . . . . . 8,000 17,261Krungthai Card PCL, NVDR . . . . . . . . . . . . . . . . . . . . . . . . . . . . . . . . . . 6,500 10,309Minor International PCL, NVDR(a) . . . . . . . . . . . . . . . . . . . . . . . . . . . . . 22,500 18,157Siam Cement PCL (The), NVDR . . . . . . . . . . . . . . . . . . . . . . . . . . . . . . 5,500 60,631Siam Commercial Bank PCL (The), NVDR . . . . . . . . . . . . . . . . . . . . 6,000 21,661Sri Trang Gloves Thailand PCL, NVDR. . . . . . . . . . . . . . . . . . . . . . . . 10,500 9,348Thai Union Group PCL, NVDR. . . . . . . . . . . . . . . . . . . . . . . . . . . . . . . . 21,000 12,277True Corp. PCL, NVDR. . . . . . . . . . . . . . . . . . . . . . . . . . . . . . . . . . . . . . . 93,000 12,441
539,585Turkey — 0.2%Akbank TAS . . . . . . . . . . . . . . . . . . . . . . . . . . . . . . . . . . . . . . . . . . . . . . . . . 21,505 10,243Turkcell Iletisim Hizmetleri AS . . . . . . . . . . . . . . . . . . . . . . . . . . . . . . . . 8,410 11,764Turkiye Garanti Bankasi AS. . . . . . . . . . . . . . . . . . . . . . . . . . . . . . . . . . . 16,200 13,516Turkiye Is Bankasi AS, Class C . . . . . . . . . . . . . . . . . . . . . . . . . . . . . . . 11,545 5,536
41,059United Arab Emirates — 2.2%Abu Dhabi Commercial Bank PJSC . . . . . . . . . . . . . . . . . . . . . . . . . . . 21,060 48,674Abu Dhabi Islamic Bank PJSC. . . . . . . . . . . . . . . . . . . . . . . . . . . . . . . . 6,855 12,094Emirates NBD Bank PJSC. . . . . . . . . . . . . . . . . . . . . . . . . . . . . . . . . . . . 18,165 65,304Emirates Telecommunications Group Co. PJSC . . . . . . . . . . . . . . . 20,742 180,379First Abu Dhabi Bank PJSC . . . . . . . . . . . . . . . . . . . . . . . . . . . . . . . . . . 30,600 159,378
465,829
Total Common Stocks — 97.8%(Cost: $19,400,963). . . . . . . . . . . . . . . . . . . . . . . . . . . . . . . . . . . . . . . . . . . . . . . . . 20,917,568
Preferred StocksBrazil — 1.2%Banco Bradesco SA, Preference Shares, NVS . . . . . . . . . . . . . . . . 35,490 125,689Itau Unibanco Holding SA, Preference Shares, NVS . . . . . . . . . . . 35,105 139,750
265,439Chile — 0.3%Sociedad Quimica y Minera de Chile SA, Class B, Preference
Shares, NVS . . . . . . . . . . . . . . . . . . . . . . . . . . . . . . . . . . . . . . . . . . . . . . 925 58,238
Colombia — 0.1%Bancolombia SA, Preference Shares, NVS . . . . . . . . . . . . . . . . . . . . 3,070 24,898
Schedule of Investments (unaudited) (continued)
November 30, 2021
iShares� ESG Advanced MSCI EM ETF(Percentages shown are based on Net Assets)
23NM0122U-1995964-25/159

Security Shares
Value
South Korea — 0.0%LG Household & Health Care Ltd., Preference Shares, NVS . . . 10 $ 5,008
Total Preferred Stocks — 1.6%(Cost: $356,624). . . . . . . . . . . . . . . . . . . . . . . . . . . . . . . . . . . . . . . . . . . . . . . . . . . . 353,583
RightsThailand — 0.0%Charoen Pokphand Foods PCL (Expires 12/31/21)(a) . . . . . . . . . . 207 —CP All PCL (Expires 12/31/21)(a) . . . . . . . . . . . . . . . . . . . . . . . . . . . . . . 2,866 —
—
Total Rights — 0.0%(Cost: $0) . . . . . . . . . . . . . . . . . . . . . . . . . . . . . . . . . . . . . . . . . . . . . . . . . . . . . . . . . . —
WarrantsThailand — 0.0%BTS Group Holdings PCL (Expires 11/20/26)(a) . . . . . . . . . . . . . . . . 8,800 —BTS Group Holdings PCL (Expires 11/07/24)(a) . . . . . . . . . . . . . . . . 4,400 67
67
Total Warrants — 0.0%(Cost: $0) . . . . . . . . . . . . . . . . . . . . . . . . . . . . . . . . . . . . . . . . . . . . . . . . . . . . . . . . . . 67
Short-Term InvestmentsMoney Market Funds — 2.8%BlackRock Cash Funds: Institutional, SL Agency Shares,
0.06%(d)(e)(f) . . . . . . . . . . . . . . . . . . . . . . . . . . . . . . . . . . . . . . . . . . . . . . . 535,346 535,560
Security Shares
Value
Money Market Funds (continued)BlackRock Cash Funds: Treasury, SL Agency Shares,
0.00%(d)(e) . . . . . . . . . . . . . . . . . . . . . . . . . . . . . . . . . . . . . . . . . . . . . . . . 60,000 $ 60,000
595,560
Total Short-Term Investments — 2.8%(Cost: $595,560). . . . . . . . . . . . . . . . . . . . . . . . . . . . . . . . . . . . . . . . . . . . . . . . . . . . 595,560
Total Investments in Securities — 102.2%(Cost: $20,353,147). . . . . . . . . . . . . . . . . . . . . . . . . . . . . . . . . . . . . . . . . . . . . . . . . 21,866,778
Other Assets, Less Liabilities — (2.2)% . . . . . . . . . . . . . . . . . . . . . . . . . . . . . . . (470,333)
Net Assets — 100.0% . . . . . . . . . . . . . . . . . . . . . . . . . . . . . . . . . . . . . . . . . . . . . . . . . $ 21,396,445 (a) Non-income producing security.(b) Security exempt from registration pursuant to Rule 144A under the Securities Act of
1933, as amended. These securities may be resold in transactions exempt fromregistration to qualified institutional investors.
(c) All or a portion of this security is on loan.(d) Affiliate of the Fund.(e) Annualized 7-day yield as of period end.(f) All or a portion of this security was purchased with the cash collateral from loaned
securities.
Affiliates
Investments in issuers considered to be affiliate(s) of the Fund during the period ended November 30, 2021 for purposes of Section 2(a)(3) of the Investment Company Actof 1940, as amended, were as follows:
Affiliated IssuerValue at
08/31/21Purchases
at CostProceeds
from SalesNet Realized
Gain (Loss)
Change inUnrealized
Appreciation(Depreciation)
Value at11/30/21
SharesHeld at
11/30/21 Income
CapitalGain
Distributionsfrom
UnderlyingFunds
BlackRock Cash Funds: Institutional, SL Agency Shares . . . . $ — $535,576(a) $ — $ (15) $ (1) $535,560 535,346 $ 173(b) $ —BlackRock Cash Funds: Treasury, SL Agency Shares . . . . . . . — 60,000(a)
— — — 60,000 60,000 1 —
$ (15) $ (1) $595,560 $ 174 $ —
(a) Represents net amount purchased (sold).(b) All or a portion represents securities lending income earned from the reinvestment of cash collateral from loaned securities, net of fees and collateral investment expenses, and other
payments to and from borrowers of securities.
Derivative Financial Instruments Outstanding as of Period End
Futures Contracts
DescriptionNumber ofContracts
ExpirationDate
NotionalAmount
(000)
Value/Unrealized
Appreciation(Depreciation)
Long ContractsMSCI Emerging Markets Index . . . . . . . . . . . . . . . . . . . . . . . . . . . . . . . . . . . . . . . . . . . . . . . . . . . . . . . . . . . . . . . . . . . . . . . . . . . . . . . . . . . . . . . 1 12/17/21 $ 61 $ (2,413)
Schedule of Investments (unaudited) (continued)
November 30, 2021
iShares� ESG Advanced MSCI EM ETF(Percentages shown are based on Net Assets)
24 NM0122U-1995964-26/159

Fair Value Measurements
Various inputs are used in determining the fair value of financial instruments. These inputs to valuation techniques are categorized into a fair value hierarchy consisting ofthree broad levels for financial reporting purposes as follows:
• Level 1 – Unadjusted price quotations in active markets/exchanges for identical assets or liabilities that each Fund has the ability to access;• Level 2 – Other observable inputs (including, but not limited to, quoted prices for similar assets or liabilities in markets that are active, quoted prices for identical or
similar assets or liabilities in markets that are not active, inputs other than quoted prices that are observable for the assets or liabilities (such as interest rates, yieldcurves, volatilities, prepayment speeds, loss severities, credit risks and default rates) or other market-corroborated inputs); and
• Level 3 – Unobservable inputs based on the best information available in the circumstances, to the extent observable inputs are not available (including the BlackRockGlobal Valuation Methodologies Committee’s (the “Global Valuation Committee’s”) assumptions used in determining the fair value of financial instruments).
The hierarchy gives the highest priority to unadjusted quoted prices in active markets for identical assets or liabilities (Level 1 measurements) and the lowest priority tounobservable inputs (Level 3 measurements). Accordingly, the degree of judgment exercised in determining fair value is greatest for instruments categorized in Level 3. Theinputs used to measure fair value may fall into different levels of the fair value hierarchy. In such cases, for disclosure purposes, the fair value hierarchy classification isdetermined based on the lowest level input that is significant to the fair value measurement in its entirety. Investments classified within Level 3 have significant unobservableinputs used by the Global Valuation Committee in determining the price for Fair Valued Investments. Level 3 investments include equity or debt issued by privately heldcompanies or funds. There may not be a secondary market, and/or there are a limited number of investors. The categorization of a value determined for financial instrumentsis based on the pricing transparency of the financial instruments and is not necessarily an indication of the risks associated with investing in those securities. For informationabout the Fund’s policy regarding valuation of financial instruments, refer to its most recent financial statements.
The following table summarizes the Fund’s financial instruments categorized in the fair value hierarchy. The breakdown of the Fund’s financial instruments into majorcategories is disclosed in the Schedule of Investments above.
Level 1 Level 2 Level 3 Total
InvestmentsAssets
Common Stocks . . . . . . . . . . . . . . . . . . . . . . . . . . . . . . . . . . . . . . . . . . . . . . . . . . . . . . . . . . . . . . . . . . . . . . . . . . . . . . . . . . . . . . . . $ 3,736,737 $17,180,831 $ — $20,917,568Preferred Stocks . . . . . . . . . . . . . . . . . . . . . . . . . . . . . . . . . . . . . . . . . . . . . . . . . . . . . . . . . . . . . . . . . . . . . . . . . . . . . . . . . . . . . . . . 290,337 63,246 — 353,583Rights . . . . . . . . . . . . . . . . . . . . . . . . . . . . . . . . . . . . . . . . . . . . . . . . . . . . . . . . . . . . . . . . . . . . . . . . . . . . . . . . . . . . . . . . . . . . . . . . . . — — — —Warrants. . . . . . . . . . . . . . . . . . . . . . . . . . . . . . . . . . . . . . . . . . . . . . . . . . . . . . . . . . . . . . . . . . . . . . . . . . . . . . . . . . . . . . . . . . . . . . . . 67 — — 67Money Market Funds . . . . . . . . . . . . . . . . . . . . . . . . . . . . . . . . . . . . . . . . . . . . . . . . . . . . . . . . . . . . . . . . . . . . . . . . . . . . . . . . . . . . 595,560 — — 595,560
$ 4,622,701 $17,244,077 $ — $21,866,778
Derivative financial instruments(a)
LiabilitiesFutures Contracts . . . . . . . . . . . . . . . . . . . . . . . . . . . . . . . . . . . . . . . . . . . . . . . . . . . . . . . . . . . . . . . . . . . . . . . . . . . . . . . . . . . . . . . $ (2,413) $ — $ — $ (2,413)
(a) Derivative financial instruments are futures contracts. Futures contracts are valued at the unrealized appreciation (depreciation) on the instrument.
Portfolio Abbreviations - Equity
ADR . . . . . . . . . . . . . American Depositary ReceiptGDR . . . . . . . . . . . . . Global Depositary ReceiptJSC. . . . . . . . . . . . . . Joint Stock CompanyNVDR. . . . . . . . . . . . Non-Voting Depositary ReceiptNVS . . . . . . . . . . . . . Non-Voting SharesPJSC . . . . . . . . . . . . Public Joint Stock Company
Schedule of Investments (unaudited) (continued)
November 30, 2021
iShares� ESG Advanced MSCI EM ETF
25NM0122U-1995964-27/159

Security Shares
Value
Common StocksAerospace & Defense — 0.1%HEICO Corp. . . . . . . . . . . . . . . . . . . . . . . . . . . . . . . . . . . . . . . . . . . . . . 1,246 $ 172,596HEICO Corp., Class A. . . . . . . . . . . . . . . . . . . . . . . . . . . . . . . . . . . . . 2,099 260,696Howmet Aerospace Inc. . . . . . . . . . . . . . . . . . . . . . . . . . . . . . . . . . . . 11,091 311,990
745,282Air Freight & Logistics — 0.2%CH Robinson Worldwide Inc. . . . . . . . . . . . . . . . . . . . . . . . . . . . . . . 3,784 359,821Expeditors International of Washington Inc.. . . . . . . . . . . . . . . . . 4,881 593,627
953,448Auto Components — 0.3%Aptiv PLC(a) . . . . . . . . . . . . . . . . . . . . . . . . . . . . . . . . . . . . . . . . . . . . . . 7,772 1,246,240BorgWarner Inc. . . . . . . . . . . . . . . . . . . . . . . . . . . . . . . . . . . . . . . . . . . 6,890 298,199Lear Corp. . . . . . . . . . . . . . . . . . . . . . . . . . . . . . . . . . . . . . . . . . . . . . . . . 1,716 287,928
1,832,367Banks — 2.2%Citizens Financial Group Inc. . . . . . . . . . . . . . . . . . . . . . . . . . . . . . . 12,242 578,679First Republic Bank/CA. . . . . . . . . . . . . . . . . . . . . . . . . . . . . . . . . . . . 5,079 1,064,863Huntington Bancshares Inc./OH . . . . . . . . . . . . . . . . . . . . . . . . . . . 42,424 629,572KeyCorp. . . . . . . . . . . . . . . . . . . . . . . . . . . . . . . . . . . . . . . . . . . . . . . . . . 27,478 616,606PNC Financial Services Group Inc. (The). . . . . . . . . . . . . . . . . . . 12,211 2,405,567Regions Financial Corp. . . . . . . . . . . . . . . . . . . . . . . . . . . . . . . . . . . . 27,426 623,942SVB Financial Group(a) . . . . . . . . . . . . . . . . . . . . . . . . . . . . . . . . . . . . 1,686 1,167,269Truist Financial Corp. . . . . . . . . . . . . . . . . . . . . . . . . . . . . . . . . . . . . . 38,352 2,274,657U.S. Bancorp.. . . . . . . . . . . . . . . . . . . . . . . . . . . . . . . . . . . . . . . . . . . . . 40,468 2,239,499
11,600,654Beverages — 2.5%Coca-Cola Co. (The) . . . . . . . . . . . . . . . . . . . . . . . . . . . . . . . . . . . . . . 117,915 6,184,642Keurig Dr Pepper Inc. . . . . . . . . . . . . . . . . . . . . . . . . . . . . . . . . . . . . . 20,363 692,138PepsiCo Inc. . . . . . . . . . . . . . . . . . . . . . . . . . . . . . . . . . . . . . . . . . . . . . . 39,711 6,345,024
13,221,804Biotechnology — 1.9%Alnylam Pharmaceuticals Inc.(a) . . . . . . . . . . . . . . . . . . . . . . . . . . . 3,415 627,677Amgen Inc. . . . . . . . . . . . . . . . . . . . . . . . . . . . . . . . . . . . . . . . . . . . . . . . 16,315 3,244,727Biogen Inc.(a) . . . . . . . . . . . . . . . . . . . . . . . . . . . . . . . . . . . . . . . . . . . . . 4,282 1,009,439BioMarin Pharmaceutical Inc.(a) . . . . . . . . . . . . . . . . . . . . . . . . . . . . 5,268 454,576Exact Sciences Corp.(a) . . . . . . . . . . . . . . . . . . . . . . . . . . . . . . . . . . . 4,940 421,728Horizon Therapeutics PLC(a). . . . . . . . . . . . . . . . . . . . . . . . . . . . . . . 6,166 639,784Novavax Inc.(a) . . . . . . . . . . . . . . . . . . . . . . . . . . . . . . . . . . . . . . . . . . . 2,033 424,145Regeneron Pharmaceuticals Inc.(a) . . . . . . . . . . . . . . . . . . . . . . . . 3,020 1,922,320Vertex Pharmaceuticals Inc.(a) . . . . . . . . . . . . . . . . . . . . . . . . . . . . . 7,454 1,393,451
10,137,847Building Products — 0.9%A O Smith Corp. . . . . . . . . . . . . . . . . . . . . . . . . . . . . . . . . . . . . . . . . . . 3,827 302,524Allegion PLC . . . . . . . . . . . . . . . . . . . . . . . . . . . . . . . . . . . . . . . . . . . . . 2,577 318,620Carrier Global Corp.. . . . . . . . . . . . . . . . . . . . . . . . . . . . . . . . . . . . . . . 23,684 1,281,778Fortune Brands Home & Security Inc. . . . . . . . . . . . . . . . . . . . . . . 3,962 398,300Lennox International Inc. . . . . . . . . . . . . . . . . . . . . . . . . . . . . . . . . . . 961 296,968Masco Corp. . . . . . . . . . . . . . . . . . . . . . . . . . . . . . . . . . . . . . . . . . . . . . . 7,101 467,956Owens Corning . . . . . . . . . . . . . . . . . . . . . . . . . . . . . . . . . . . . . . . . . . . 2,963 251,381Trane Technologies PLC . . . . . . . . . . . . . . . . . . . . . . . . . . . . . . . . . . 6,827 1,274,260
4,591,787Capital Markets — 4.7%Ameriprise Financial Inc. . . . . . . . . . . . . . . . . . . . . . . . . . . . . . . . . . . 3,268 946,413Bank of New York Mellon Corp. (The) . . . . . . . . . . . . . . . . . . . . . . 23,560 1,290,852Carlyle Group Inc. (The). . . . . . . . . . . . . . . . . . . . . . . . . . . . . . . . . . . 4,583 250,644Cboe Global Markets Inc. . . . . . . . . . . . . . . . . . . . . . . . . . . . . . . . . . 3,063 394,943Charles Schwab Corp. (The) . . . . . . . . . . . . . . . . . . . . . . . . . . . . . . 41,574 3,217,412CME Group Inc. . . . . . . . . . . . . . . . . . . . . . . . . . . . . . . . . . . . . . . . . . . 10,319 2,275,546
Security Shares
Value
Capital Markets (continued)FactSet Research Systems Inc.. . . . . . . . . . . . . . . . . . . . . . . . . . . . 1,085 $ 508,398Franklin Resources Inc. . . . . . . . . . . . . . . . . . . . . . . . . . . . . . . . . . . . 8,669 280,876Intercontinental Exchange Inc. . . . . . . . . . . . . . . . . . . . . . . . . . . . . . 16,180 2,115,050Invesco Ltd. . . . . . . . . . . . . . . . . . . . . . . . . . . . . . . . . . . . . . . . . . . . . . . 9,942 222,005MarketAxess Holdings Inc. . . . . . . . . . . . . . . . . . . . . . . . . . . . . . . . . 1,092 385,137Moody's Corp. . . . . . . . . . . . . . . . . . . . . . . . . . . . . . . . . . . . . . . . . . . . . 4,815 1,880,932Morgan Stanley . . . . . . . . . . . . . . . . . . . . . . . . . . . . . . . . . . . . . . . . . . . 39,317 3,728,038Nasdaq Inc. . . . . . . . . . . . . . . . . . . . . . . . . . . . . . . . . . . . . . . . . . . . . . . 3,363 683,462Northern Trust Corp. . . . . . . . . . . . . . . . . . . . . . . . . . . . . . . . . . . . . . . 5,688 658,102Raymond James Financial Inc. . . . . . . . . . . . . . . . . . . . . . . . . . . . . 5,321 523,001S&P Global Inc. . . . . . . . . . . . . . . . . . . . . . . . . . . . . . . . . . . . . . . . . . . . 6,924 3,155,474State Street Corp.. . . . . . . . . . . . . . . . . . . . . . . . . . . . . . . . . . . . . . . . . 10,505 934,630T Rowe Price Group Inc. . . . . . . . . . . . . . . . . . . . . . . . . . . . . . . . . . . 6,520 1,303,674
24,754,589Chemicals — 2.5%Air Products & Chemicals Inc. . . . . . . . . . . . . . . . . . . . . . . . . . . . . . 6,360 1,828,118Albemarle Corp. . . . . . . . . . . . . . . . . . . . . . . . . . . . . . . . . . . . . . . . . . . 3,360 895,406DuPont de Nemours Inc. . . . . . . . . . . . . . . . . . . . . . . . . . . . . . . . . . . 15,028 1,111,471FMC Corp. . . . . . . . . . . . . . . . . . . . . . . . . . . . . . . . . . . . . . . . . . . . . . . . 3,698 370,503International Flavors & Fragrances Inc. . . . . . . . . . . . . . . . . . . . . 7,156 1,017,369Linde PLC . . . . . . . . . . . . . . . . . . . . . . . . . . . . . . . . . . . . . . . . . . . . . . . . 14,837 4,720,243PPG Industries Inc. . . . . . . . . . . . . . . . . . . . . . . . . . . . . . . . . . . . . . . . 6,820 1,051,439Sherwin-Williams Co. (The). . . . . . . . . . . . . . . . . . . . . . . . . . . . . . . . 7,187 2,380,622
13,375,171Commercial Services & Supplies — 1.1%Cintas Corp. . . . . . . . . . . . . . . . . . . . . . . . . . . . . . . . . . . . . . . . . . . . . . . 2,663 1,124,292Copart Inc.(a) . . . . . . . . . . . . . . . . . . . . . . . . . . . . . . . . . . . . . . . . . . . . . 6,118 888,089Republic Services Inc.. . . . . . . . . . . . . . . . . . . . . . . . . . . . . . . . . . . . . 6,403 846,861Rollins Inc. . . . . . . . . . . . . . . . . . . . . . . . . . . . . . . . . . . . . . . . . . . . . . . . 6,362 211,727Waste Connections Inc. . . . . . . . . . . . . . . . . . . . . . . . . . . . . . . . . . . . 7,485 995,954Waste Management Inc.. . . . . . . . . . . . . . . . . . . . . . . . . . . . . . . . . . . 12,099 1,943,946
6,010,869Communications Equipment — 1.8%Arista Networks Inc.(a) . . . . . . . . . . . . . . . . . . . . . . . . . . . . . . . . . . . . . 6,613 820,409Cisco Systems Inc.. . . . . . . . . . . . . . . . . . . . . . . . . . . . . . . . . . . . . . . . 121,081 6,640,082F5 Inc.(a) . . . . . . . . . . . . . . . . . . . . . . . . . . . . . . . . . . . . . . . . . . . . . . . . . 1,733 394,396Juniper Networks Inc. . . . . . . . . . . . . . . . . . . . . . . . . . . . . . . . . . . . . . 9,342 290,816Motorola Solutions Inc. . . . . . . . . . . . . . . . . . . . . . . . . . . . . . . . . . . . . 4,865 1,231,721
9,377,424Construction Materials — 0.3%Martin Marietta Materials Inc. . . . . . . . . . . . . . . . . . . . . . . . . . . . . . . 1,792 723,090Vulcan Materials Co. . . . . . . . . . . . . . . . . . . . . . . . . . . . . . . . . . . . . . . 3,812 730,532
1,453,622Consumer Finance — 1.0%Ally Financial Inc. . . . . . . . . . . . . . . . . . . . . . . . . . . . . . . . . . . . . . . . . . 10,359 474,753American Express Co. . . . . . . . . . . . . . . . . . . . . . . . . . . . . . . . . . . . . 19,402 2,954,925Discover Financial Services . . . . . . . . . . . . . . . . . . . . . . . . . . . . . . . 8,604 927,941Synchrony Financial . . . . . . . . . . . . . . . . . . . . . . . . . . . . . . . . . . . . . . 16,368 733,123
5,090,742Containers & Packaging — 0.5%Avery Dennison Corp. . . . . . . . . . . . . . . . . . . . . . . . . . . . . . . . . . . . . . 2,381 488,272Ball Corp.. . . . . . . . . . . . . . . . . . . . . . . . . . . . . . . . . . . . . . . . . . . . . . . . . 9,384 876,935International Paper Co.. . . . . . . . . . . . . . . . . . . . . . . . . . . . . . . . . . . . 10,668 485,607Packaging Corp. of America . . . . . . . . . . . . . . . . . . . . . . . . . . . . . . . 2,729 356,380Sealed Air Corp. . . . . . . . . . . . . . . . . . . . . . . . . . . . . . . . . . . . . . . . . . . 4,307 267,551Westrock Co. . . . . . . . . . . . . . . . . . . . . . . . . . . . . . . . . . . . . . . . . . . . . . 7,672 332,888
2,807,633
Schedule of Investments (unaudited)
November 30, 2021
iShares� ESG Advanced MSCI USA ETF(Percentages shown are based on Net Assets)
26 NM0122U-1995964-28/159

Security Shares
Value
Distributors — 0.3%Genuine Parts Co. . . . . . . . . . . . . . . . . . . . . . . . . . . . . . . . . . . . . . . . . 4,115 $ 525,650LKQ Corp. . . . . . . . . . . . . . . . . . . . . . . . . . . . . . . . . . . . . . . . . . . . . . . . . 8,021 448,374Pool Corp. . . . . . . . . . . . . . . . . . . . . . . . . . . . . . . . . . . . . . . . . . . . . . . . . 1,152 638,346
1,612,370Diversified Telecommunication Services — 1.1%Verizon Communications Inc. . . . . . . . . . . . . . . . . . . . . . . . . . . . . . . 118,953 5,979,767
Electrical Equipment — 0.9%Eaton Corp. PLC. . . . . . . . . . . . . . . . . . . . . . . . . . . . . . . . . . . . . . . . . . 11,452 1,855,911Generac Holdings Inc.(a). . . . . . . . . . . . . . . . . . . . . . . . . . . . . . . . . . . 1,814 764,130Plug Power Inc.(a)(b) . . . . . . . . . . . . . . . . . . . . . . . . . . . . . . . . . . . . . . . 14,852 591,852Rockwell Automation Inc.. . . . . . . . . . . . . . . . . . . . . . . . . . . . . . . . . . 3,334 1,120,891Sensata Technologies Holding PLC(a) . . . . . . . . . . . . . . . . . . . . . . 4,550 253,435Sunrun Inc.(a) . . . . . . . . . . . . . . . . . . . . . . . . . . . . . . . . . . . . . . . . . . . . . 5,029 231,535
4,817,754Electronic Equipment, Instruments & Components — 1.5%Amphenol Corp., Class A. . . . . . . . . . . . . . . . . . . . . . . . . . . . . . . . . . 17,187 1,384,929CDW Corp./DE . . . . . . . . . . . . . . . . . . . . . . . . . . . . . . . . . . . . . . . . . . . 3,950 747,972Cognex Corp.. . . . . . . . . . . . . . . . . . . . . . . . . . . . . . . . . . . . . . . . . . . . . 5,077 392,198Corning Inc. . . . . . . . . . . . . . . . . . . . . . . . . . . . . . . . . . . . . . . . . . . . . . . 23,311 864,605Keysight Technologies Inc.(a) . . . . . . . . . . . . . . . . . . . . . . . . . . . . . . 5,287 1,028,216TE Connectivity Ltd.. . . . . . . . . . . . . . . . . . . . . . . . . . . . . . . . . . . . . . . 9,424 1,450,636Teledyne Technologies Inc.(a) . . . . . . . . . . . . . . . . . . . . . . . . . . . . . . 1,339 556,073Trimble Inc.(a) . . . . . . . . . . . . . . . . . . . . . . . . . . . . . . . . . . . . . . . . . . . . . 7,229 620,754Zebra Technologies Corp., Class A(a). . . . . . . . . . . . . . . . . . . . . . . 1,534 903,189
7,948,572Entertainment — 0.2%Electronic Arts Inc. . . . . . . . . . . . . . . . . . . . . . . . . . . . . . . . . . . . . . . . . 8,177 1,015,747
Equity Real Estate Investment Trusts (REITs) — 4.1%Alexandria Real Estate Equities Inc. . . . . . . . . . . . . . . . . . . . . . . . 4,159 832,091American Tower Corp.. . . . . . . . . . . . . . . . . . . . . . . . . . . . . . . . . . . . . 13,077 3,432,451Boston Properties Inc.. . . . . . . . . . . . . . . . . . . . . . . . . . . . . . . . . . . . . 4,263 459,722Camden Property Trust. . . . . . . . . . . . . . . . . . . . . . . . . . . . . . . . . . . . 2,890 477,457Crown Castle International Corp. . . . . . . . . . . . . . . . . . . . . . . . . . . 12,418 2,255,730Duke Realty Corp. . . . . . . . . . . . . . . . . . . . . . . . . . . . . . . . . . . . . . . . . 10,870 634,047Equinix Inc. . . . . . . . . . . . . . . . . . . . . . . . . . . . . . . . . . . . . . . . . . . . . . . . 2,579 2,094,664Equity Residential. . . . . . . . . . . . . . . . . . . . . . . . . . . . . . . . . . . . . . . . . 10,221 871,954Healthpeak Properties Inc. . . . . . . . . . . . . . . . . . . . . . . . . . . . . . . . . 15,486 508,870Host Hotels & Resorts Inc.(a). . . . . . . . . . . . . . . . . . . . . . . . . . . . . . . 20,514 322,070Iron Mountain Inc.. . . . . . . . . . . . . . . . . . . . . . . . . . . . . . . . . . . . . . . . . 8,317 377,924Prologis Inc. . . . . . . . . . . . . . . . . . . . . . . . . . . . . . . . . . . . . . . . . . . . . . . 21,240 3,201,930Realty Income Corp. . . . . . . . . . . . . . . . . . . . . . . . . . . . . . . . . . . . . . . 15,833 1,075,377Regency Centers Corp. . . . . . . . . . . . . . . . . . . . . . . . . . . . . . . . . . . . 4,393 304,611SBA Communications Corp. . . . . . . . . . . . . . . . . . . . . . . . . . . . . . . . 3,148 1,082,282Simon Property Group Inc. . . . . . . . . . . . . . . . . . . . . . . . . . . . . . . . . 9,442 1,443,115Ventas Inc. . . . . . . . . . . . . . . . . . . . . . . . . . . . . . . . . . . . . . . . . . . . . . . . 11,305 530,431VICI Properties Inc. . . . . . . . . . . . . . . . . . . . . . . . . . . . . . . . . . . . . . . . 17,640 479,808Welltower Inc. . . . . . . . . . . . . . . . . . . . . . . . . . . . . . . . . . . . . . . . . . . . . 12,141 966,666WP Carey Inc. . . . . . . . . . . . . . . . . . . . . . . . . . . . . . . . . . . . . . . . . . . . . 5,314 405,724
21,756,924Food & Staples Retailing — 0.2%Walgreens Boots Alliance Inc. . . . . . . . . . . . . . . . . . . . . . . . . . . . . . 21,125 946,400
Food Products — 0.8%Campbell Soup Co. . . . . . . . . . . . . . . . . . . . . . . . . . . . . . . . . . . . . . . . 5,660 228,268Conagra Brands Inc. . . . . . . . . . . . . . . . . . . . . . . . . . . . . . . . . . . . . . . 13,801 421,621General Mills Inc. . . . . . . . . . . . . . . . . . . . . . . . . . . . . . . . . . . . . . . . . . 17,419 1,075,972Hormel Foods Corp. . . . . . . . . . . . . . . . . . . . . . . . . . . . . . . . . . . . . . . 8,566 354,632JM Smucker Co. (The) . . . . . . . . . . . . . . . . . . . . . . . . . . . . . . . . . . . . 3,113 393,701
Security Shares
Value
Food Products (continued)Kellogg Co. . . . . . . . . . . . . . . . . . . . . . . . . . . . . . . . . . . . . . . . . . . . . . . . 7,346 $ 449,428Kraft Heinz Co. (The) . . . . . . . . . . . . . . . . . . . . . . . . . . . . . . . . . . . . . 19,333 649,782McCormick & Co. Inc./MD, NVS . . . . . . . . . . . . . . . . . . . . . . . . . . . 7,160 614,471
4,187,875Health Care Equipment & Supplies — 1.9%ABIOMED Inc.(a) . . . . . . . . . . . . . . . . . . . . . . . . . . . . . . . . . . . . . . . . . . 1,304 410,473Align Technology Inc.(a). . . . . . . . . . . . . . . . . . . . . . . . . . . . . . . . . . . . 2,157 1,319,070Baxter International Inc. . . . . . . . . . . . . . . . . . . . . . . . . . . . . . . . . . . . 14,363 1,071,049Cooper Companies Inc. (The) . . . . . . . . . . . . . . . . . . . . . . . . . . . . . 1,415 532,705DENTSPLY SIRONA Inc. . . . . . . . . . . . . . . . . . . . . . . . . . . . . . . . . . . 6,279 306,039Dexcom Inc.(a) . . . . . . . . . . . . . . . . . . . . . . . . . . . . . . . . . . . . . . . . . . . . 2,780 1,564,000Hologic Inc.(a) . . . . . . . . . . . . . . . . . . . . . . . . . . . . . . . . . . . . . . . . . . . . . 7,283 544,259IDEXX Laboratories Inc.(a). . . . . . . . . . . . . . . . . . . . . . . . . . . . . . . . . 2,444 1,486,123Insulet Corp.(a) . . . . . . . . . . . . . . . . . . . . . . . . . . . . . . . . . . . . . . . . . . . . 1,979 570,823Novocure Ltd.(a). . . . . . . . . . . . . . . . . . . . . . . . . . . . . . . . . . . . . . . . . . . 2,680 250,955ResMed Inc. . . . . . . . . . . . . . . . . . . . . . . . . . . . . . . . . . . . . . . . . . . . . . . 4,186 1,066,802STERIS PLC . . . . . . . . . . . . . . . . . . . . . . . . . . . . . . . . . . . . . . . . . . . . . 2,866 626,307Teleflex Inc.. . . . . . . . . . . . . . . . . . . . . . . . . . . . . . . . . . . . . . . . . . . . . . . 1,345 400,030
10,148,635Health Care Providers & Services — 1.8%Anthem Inc. . . . . . . . . . . . . . . . . . . . . . . . . . . . . . . . . . . . . . . . . . . . . . . 7,005 2,845,641Centene Corp.(a) . . . . . . . . . . . . . . . . . . . . . . . . . . . . . . . . . . . . . . . . . . 16,752 1,196,260DaVita Inc.(a) . . . . . . . . . . . . . . . . . . . . . . . . . . . . . . . . . . . . . . . . . . . . . 1,957 184,936HCA Healthcare Inc. . . . . . . . . . . . . . . . . . . . . . . . . . . . . . . . . . . . . . . 7,359 1,660,117Henry Schein Inc.(a) . . . . . . . . . . . . . . . . . . . . . . . . . . . . . . . . . . . . . . . 4,014 285,235Humana Inc. . . . . . . . . . . . . . . . . . . . . . . . . . . . . . . . . . . . . . . . . . . . . . . 3,692 1,549,569Laboratory Corp. of America Holdings(a). . . . . . . . . . . . . . . . . . . . 2,770 790,364Molina Healthcare Inc.(a) . . . . . . . . . . . . . . . . . . . . . . . . . . . . . . . . . . 1,678 478,532Oak Street Health Inc.(a). . . . . . . . . . . . . . . . . . . . . . . . . . . . . . . . . . . 2,768 85,670Quest Diagnostics Inc. . . . . . . . . . . . . . . . . . . . . . . . . . . . . . . . . . . . . 3,510 521,867
9,598,191Health Care Technology — 0.2%Cerner Corp.. . . . . . . . . . . . . . . . . . . . . . . . . . . . . . . . . . . . . . . . . . . . . . 8,493 598,332Teladoc Health Inc.(a). . . . . . . . . . . . . . . . . . . . . . . . . . . . . . . . . . . . . . 4,118 416,947
1,015,279Hotels, Restaurants & Leisure — 2.8%Booking Holdings Inc.(a) . . . . . . . . . . . . . . . . . . . . . . . . . . . . . . . . . . . 1,180 2,480,183Darden Restaurants Inc. . . . . . . . . . . . . . . . . . . . . . . . . . . . . . . . . . . 3,744 516,485Domino's Pizza Inc. . . . . . . . . . . . . . . . . . . . . . . . . . . . . . . . . . . . . . . . 1,059 555,064Hilton Worldwide Holdings Inc.(a). . . . . . . . . . . . . . . . . . . . . . . . . . . 8,007 1,081,506McDonald's Corp. . . . . . . . . . . . . . . . . . . . . . . . . . . . . . . . . . . . . . . . . . 21,457 5,248,382Starbucks Corp. . . . . . . . . . . . . . . . . . . . . . . . . . . . . . . . . . . . . . . . . . . 33,878 3,714,384Vail Resorts Inc. . . . . . . . . . . . . . . . . . . . . . . . . . . . . . . . . . . . . . . . . . . 1,157 383,788Yum! Brands Inc. . . . . . . . . . . . . . . . . . . . . . . . . . . . . . . . . . . . . . . . . . 8,494 1,043,403
15,023,195Household Durables — 0.6%DR Horton Inc.. . . . . . . . . . . . . . . . . . . . . . . . . . . . . . . . . . . . . . . . . . . . 9,777 955,213Garmin Ltd.. . . . . . . . . . . . . . . . . . . . . . . . . . . . . . . . . . . . . . . . . . . . . . . 4,421 590,380Newell Brands Inc. . . . . . . . . . . . . . . . . . . . . . . . . . . . . . . . . . . . . . . . . 11,000 236,170NVR Inc.(a) . . . . . . . . . . . . . . . . . . . . . . . . . . . . . . . . . . . . . . . . . . . . . . . 97 506,858PulteGroup Inc. . . . . . . . . . . . . . . . . . . . . . . . . . . . . . . . . . . . . . . . . . . . 7,457 373,074Whirlpool Corp. . . . . . . . . . . . . . . . . . . . . . . . . . . . . . . . . . . . . . . . . . . . 1,802 392,367
3,054,062Household Products — 0.8%Church & Dwight Co. Inc.. . . . . . . . . . . . . . . . . . . . . . . . . . . . . . . . . . 7,055 630,576Clorox Co. (The) . . . . . . . . . . . . . . . . . . . . . . . . . . . . . . . . . . . . . . . . . . 3,529 574,698Colgate-Palmolive Co. . . . . . . . . . . . . . . . . . . . . . . . . . . . . . . . . . . . . 23,024 1,727,260
Schedule of Investments (unaudited) (continued)
November 30, 2021
iShares� ESG Advanced MSCI USA ETF(Percentages shown are based on Net Assets)
27NM0122U-1995964-29/159

Security Shares
Value
Household Products (continued)Kimberly-Clark Corp. . . . . . . . . . . . . . . . . . . . . . . . . . . . . . . . . . . . . . . 9,676 $ 1,260,880
4,193,414Industrial Conglomerates — 0.3%Roper Technologies Inc. . . . . . . . . . . . . . . . . . . . . . . . . . . . . . . . . . . . 3,029 1,405,910
Insurance — 3.0%Aflac Inc. . . . . . . . . . . . . . . . . . . . . . . . . . . . . . . . . . . . . . . . . . . . . . . . . . 18,308 991,195Allstate Corp. (The) . . . . . . . . . . . . . . . . . . . . . . . . . . . . . . . . . . . . . . . 8,495 923,576American International Group Inc. . . . . . . . . . . . . . . . . . . . . . . . . . 24,571 1,292,435Arch Capital Group Ltd.(a) . . . . . . . . . . . . . . . . . . . . . . . . . . . . . . . . . 11,379 459,484Arthur J Gallagher & Co. . . . . . . . . . . . . . . . . . . . . . . . . . . . . . . . . . . 5,940 967,626Assurant Inc. . . . . . . . . . . . . . . . . . . . . . . . . . . . . . . . . . . . . . . . . . . . . . 1,690 257,049Chubb Ltd. . . . . . . . . . . . . . . . . . . . . . . . . . . . . . . . . . . . . . . . . . . . . . . . 12,606 2,262,399Hartford Financial Services Group Inc. (The) . . . . . . . . . . . . . . . 9,975 659,347Lincoln National Corp.. . . . . . . . . . . . . . . . . . . . . . . . . . . . . . . . . . . . . 5,129 340,207Marsh & McLennan Companies Inc. . . . . . . . . . . . . . . . . . . . . . . . 14,556 2,387,475Principal Financial Group Inc.. . . . . . . . . . . . . . . . . . . . . . . . . . . . . . 7,711 528,820Progressive Corp. (The) . . . . . . . . . . . . . . . . . . . . . . . . . . . . . . . . . . . 16,813 1,562,600Prudential Financial Inc. . . . . . . . . . . . . . . . . . . . . . . . . . . . . . . . . . . . 11,090 1,134,063Travelers Companies Inc. (The) . . . . . . . . . . . . . . . . . . . . . . . . . . . 7,168 1,053,338Willis Towers Watson PLC. . . . . . . . . . . . . . . . . . . . . . . . . . . . . . . . . 3,708 837,415
15,657,029Interactive Media & Services — 0.1%ZoomInfo Technologies Inc., Class A(a) . . . . . . . . . . . . . . . . . . . . . 6,458 398,459
Internet & Direct Marketing Retail — 0.8%DoorDash Inc., Class A(a). . . . . . . . . . . . . . . . . . . . . . . . . . . . . . . . . . 3,083 551,148eBay Inc. . . . . . . . . . . . . . . . . . . . . . . . . . . . . . . . . . . . . . . . . . . . . . . . . . 18,677 1,259,950Etsy Inc.(a) . . . . . . . . . . . . . . . . . . . . . . . . . . . . . . . . . . . . . . . . . . . . . . . . 3,637 998,648MercadoLibre Inc.(a). . . . . . . . . . . . . . . . . . . . . . . . . . . . . . . . . . . . . . . 1,285 1,527,107
4,336,853IT Services — 8.2%Akamai Technologies Inc.(a) . . . . . . . . . . . . . . . . . . . . . . . . . . . . . . . 4,678 527,211Automatic Data Processing Inc.. . . . . . . . . . . . . . . . . . . . . . . . . . . . 12,156 2,806,699Broadridge Financial Solutions Inc. . . . . . . . . . . . . . . . . . . . . . . . . 3,338 562,687Cognizant Technology Solutions Corp., Class A . . . . . . . . . . . . 15,101 1,177,576EPAM Systems Inc.(a) . . . . . . . . . . . . . . . . . . . . . . . . . . . . . . . . . . . . . 1,627 990,111Fidelity National Information Services Inc. . . . . . . . . . . . . . . . . . . 17,747 1,854,561Fiserv Inc.(a) . . . . . . . . . . . . . . . . . . . . . . . . . . . . . . . . . . . . . . . . . . . . . . 17,124 1,652,808Gartner Inc.(a). . . . . . . . . . . . . . . . . . . . . . . . . . . . . . . . . . . . . . . . . . . . . 2,403 750,337GoDaddy Inc., Class A(a) . . . . . . . . . . . . . . . . . . . . . . . . . . . . . . . . . . 4,851 340,395Jack Henry & Associates Inc. . . . . . . . . . . . . . . . . . . . . . . . . . . . . . . 2,127 322,517Mastercard Inc., Class A . . . . . . . . . . . . . . . . . . . . . . . . . . . . . . . . . . 25,311 7,970,940MongoDB Inc.(a) . . . . . . . . . . . . . . . . . . . . . . . . . . . . . . . . . . . . . . . . . . 1,670 831,827Okta Inc.(a) . . . . . . . . . . . . . . . . . . . . . . . . . . . . . . . . . . . . . . . . . . . . . . . 3,593 773,321Paychex Inc.. . . . . . . . . . . . . . . . . . . . . . . . . . . . . . . . . . . . . . . . . . . . . . 9,305 1,109,156PayPal Holdings Inc.(a) . . . . . . . . . . . . . . . . . . . . . . . . . . . . . . . . . . . . 32,073 5,929,977Snowflake Inc., Class A(a) . . . . . . . . . . . . . . . . . . . . . . . . . . . . . . . . . 6,052 2,058,588Square Inc., Class A(a) . . . . . . . . . . . . . . . . . . . . . . . . . . . . . . . . . . . . 11,418 2,378,712Twilio Inc., Class A(a) . . . . . . . . . . . . . . . . . . . . . . . . . . . . . . . . . . . . . . 4,796 1,372,375VeriSign Inc.(a) . . . . . . . . . . . . . . . . . . . . . . . . . . . . . . . . . . . . . . . . . . . . 2,893 694,060Visa Inc., Class A . . . . . . . . . . . . . . . . . . . . . . . . . . . . . . . . . . . . . . . . . 48,489 9,395,714Western Union Co. (The) . . . . . . . . . . . . . . . . . . . . . . . . . . . . . . . . . . 11,675 184,698
43,684,270Leisure Products — 0.1%Hasbro Inc. . . . . . . . . . . . . . . . . . . . . . . . . . . . . . . . . . . . . . . . . . . . . . . . 3,758 364,188
Life Sciences Tools & Services — 4.1%Agilent Technologies Inc. . . . . . . . . . . . . . . . . . . . . . . . . . . . . . . . . . . 8,706 1,313,735Avantor Inc.(a). . . . . . . . . . . . . . . . . . . . . . . . . . . . . . . . . . . . . . . . . . . . . 15,106 596,385
Security Shares
Value
Life Sciences Tools & Services (continued)Bio-Techne Corp. . . . . . . . . . . . . . . . . . . . . . . . . . . . . . . . . . . . . . . . . . 1,123 $ 530,090Danaher Corp. . . . . . . . . . . . . . . . . . . . . . . . . . . . . . . . . . . . . . . . . . . . . 18,460 5,937,474Illumina Inc.(a) . . . . . . . . . . . . . . . . . . . . . . . . . . . . . . . . . . . . . . . . . . . . 4,215 1,539,866IQVIA Holdings Inc.(a) . . . . . . . . . . . . . . . . . . . . . . . . . . . . . . . . . . . . . 5,505 1,426,511Mettler-Toledo International Inc.(a). . . . . . . . . . . . . . . . . . . . . . . . . . 664 1,005,382PerkinElmer Inc. . . . . . . . . . . . . . . . . . . . . . . . . . . . . . . . . . . . . . . . . . . 3,221 586,737Thermo Fisher Scientific Inc. . . . . . . . . . . . . . . . . . . . . . . . . . . . . . . 11,304 7,153,510Waters Corp.(a) . . . . . . . . . . . . . . . . . . . . . . . . . . . . . . . . . . . . . . . . . . . 1,763 578,388West Pharmaceutical Services Inc. . . . . . . . . . . . . . . . . . . . . . . . . 2,126 941,095
21,609,173Machinery — 3.2%Caterpillar Inc. . . . . . . . . . . . . . . . . . . . . . . . . . . . . . . . . . . . . . . . . . . . . 15,730 3,041,395Cummins Inc. . . . . . . . . . . . . . . . . . . . . . . . . . . . . . . . . . . . . . . . . . . . . . 4,126 865,428Deere & Co. . . . . . . . . . . . . . . . . . . . . . . . . . . . . . . . . . . . . . . . . . . . . . . 8,463 2,924,305Dover Corp. . . . . . . . . . . . . . . . . . . . . . . . . . . . . . . . . . . . . . . . . . . . . . . 4,136 677,684Fortive Corp.. . . . . . . . . . . . . . . . . . . . . . . . . . . . . . . . . . . . . . . . . . . . . . 9,782 722,596IDEX Corp. . . . . . . . . . . . . . . . . . . . . . . . . . . . . . . . . . . . . . . . . . . . . . . . 2,184 490,505Illinois Tool Works Inc.. . . . . . . . . . . . . . . . . . . . . . . . . . . . . . . . . . . . . 9,050 2,100,957Ingersoll Rand Inc. . . . . . . . . . . . . . . . . . . . . . . . . . . . . . . . . . . . . . . . . 11,644 679,311Nordson Corp. . . . . . . . . . . . . . . . . . . . . . . . . . . . . . . . . . . . . . . . . . . . . 1,503 382,048Otis Worldwide Corp.. . . . . . . . . . . . . . . . . . . . . . . . . . . . . . . . . . . . . . 11,649 936,580PACCAR Inc. . . . . . . . . . . . . . . . . . . . . . . . . . . . . . . . . . . . . . . . . . . . . . 9,975 832,115Parker-Hannifin Corp. . . . . . . . . . . . . . . . . . . . . . . . . . . . . . . . . . . . . . 3,709 1,120,341Pentair PLC . . . . . . . . . . . . . . . . . . . . . . . . . . . . . . . . . . . . . . . . . . . . . . 4,766 351,207Snap-on Inc. . . . . . . . . . . . . . . . . . . . . . . . . . . . . . . . . . . . . . . . . . . . . . . 1,551 319,366Stanley Black & Decker Inc. . . . . . . . . . . . . . . . . . . . . . . . . . . . . . . . 4,682 818,226Xylem Inc./NY . . . . . . . . . . . . . . . . . . . . . . . . . . . . . . . . . . . . . . . . . . . . 5,176 626,865
16,888,929Media — 0.2%Cable One Inc.. . . . . . . . . . . . . . . . . . . . . . . . . . . . . . . . . . . . . . . . . . . . 156 276,441Discovery Inc., Class A(a)(b) . . . . . . . . . . . . . . . . . . . . . . . . . . . . . . . . 4,858 113,046Discovery Inc., Class C, NVS(a) . . . . . . . . . . . . . . . . . . . . . . . . . . . . 9,011 204,640Interpublic Group of Companies Inc. (The) . . . . . . . . . . . . . . . . . 11,309 375,346Sirius XM Holdings Inc.(b). . . . . . . . . . . . . . . . . . . . . . . . . . . . . . . . . . 29,094 177,473
1,146,946Metals & Mining — 0.3%Newmont Corp. . . . . . . . . . . . . . . . . . . . . . . . . . . . . . . . . . . . . . . . . . . . 22,960 1,260,963Steel Dynamics Inc. . . . . . . . . . . . . . . . . . . . . . . . . . . . . . . . . . . . . . . . 5,865 350,727
1,611,690Mortgage Real Estate Investment — 0.1%Annaly Capital Management Inc.. . . . . . . . . . . . . . . . . . . . . . . . . . . 41,496 336,118
Multiline Retail — 0.9%Dollar General Corp. . . . . . . . . . . . . . . . . . . . . . . . . . . . . . . . . . . . . . . 6,703 1,483,374Target Corp. . . . . . . . . . . . . . . . . . . . . . . . . . . . . . . . . . . . . . . . . . . . . . . 14,022 3,419,124
4,902,498Personal Products — 0.4%Estee Lauder Companies Inc. (The), Class A . . . . . . . . . . . . . . . 6,696 2,223,541
Pharmaceuticals — 1.9%Catalent Inc.(a) . . . . . . . . . . . . . . . . . . . . . . . . . . . . . . . . . . . . . . . . . . . . 4,894 629,662Elanco Animal Health Inc.(a) . . . . . . . . . . . . . . . . . . . . . . . . . . . . . . . 12,232 351,548Eli Lilly & Co. . . . . . . . . . . . . . . . . . . . . . . . . . . . . . . . . . . . . . . . . . . . . . 23,362 5,794,710Jazz Pharmaceuticals PLC(a) . . . . . . . . . . . . . . . . . . . . . . . . . . . . . . 1,757 210,611Zoetis Inc. . . . . . . . . . . . . . . . . . . . . . . . . . . . . . . . . . . . . . . . . . . . . . . . . 13,617 3,023,519
10,010,050Professional Services — 0.7%Booz Allen Hamilton Holding Corp.. . . . . . . . . . . . . . . . . . . . . . . . . 3,884 326,023Clarivate PLC(a). . . . . . . . . . . . . . . . . . . . . . . . . . . . . . . . . . . . . . . . . . . 10,113 236,037
Schedule of Investments (unaudited) (continued)
November 30, 2021
iShares� ESG Advanced MSCI USA ETF(Percentages shown are based on Net Assets)
28 NM0122U-1995964-30/159

Security Shares
Value
Professional Services (continued)IHS Markit Ltd.. . . . . . . . . . . . . . . . . . . . . . . . . . . . . . . . . . . . . . . . . . . . 10,880 $ 1,390,682Robert Half International Inc. . . . . . . . . . . . . . . . . . . . . . . . . . . . . . . 3,217 357,634TransUnion . . . . . . . . . . . . . . . . . . . . . . . . . . . . . . . . . . . . . . . . . . . . . . . 5,502 611,767Verisk Analytics Inc. . . . . . . . . . . . . . . . . . . . . . . . . . . . . . . . . . . . . . . . 4,404 990,328
3,912,471Real Estate Management & Development — 0.2%CBRE Group Inc., Class A(a). . . . . . . . . . . . . . . . . . . . . . . . . . . . . . . 9,646 921,868
Road & Rail — 0.3%AMERCO. . . . . . . . . . . . . . . . . . . . . . . . . . . . . . . . . . . . . . . . . . . . . . . . . 282 198,686Knight-Swift Transportation Holdings Inc.. . . . . . . . . . . . . . . . . . . 4,530 259,342Old Dominion Freight Line Inc.. . . . . . . . . . . . . . . . . . . . . . . . . . . . . 2,828 1,004,421
1,462,449Semiconductors & Semiconductor Equipment — 10.7%Advanced Micro Devices Inc.(a) . . . . . . . . . . . . . . . . . . . . . . . . . . . . 34,851 5,519,353Analog Devices Inc. . . . . . . . . . . . . . . . . . . . . . . . . . . . . . . . . . . . . . . . 15,441 2,783,240Applied Materials Inc. . . . . . . . . . . . . . . . . . . . . . . . . . . . . . . . . . . . . . 25,943 3,818,550Enphase Energy Inc.(a) . . . . . . . . . . . . . . . . . . . . . . . . . . . . . . . . . . . . 3,675 918,750Entegris Inc. . . . . . . . . . . . . . . . . . . . . . . . . . . . . . . . . . . . . . . . . . . . . . . 3,896 569,128Lam Research Corp. . . . . . . . . . . . . . . . . . . . . . . . . . . . . . . . . . . . . . . 4,079 2,773,108Marvell Technology Inc. . . . . . . . . . . . . . . . . . . . . . . . . . . . . . . . . . . . 23,663 1,684,096Microchip Technology Inc. . . . . . . . . . . . . . . . . . . . . . . . . . . . . . . . . . 15,747 1,313,772Micron Technology Inc. . . . . . . . . . . . . . . . . . . . . . . . . . . . . . . . . . . . . 32,345 2,716,980NVIDIA Corp.(b) . . . . . . . . . . . . . . . . . . . . . . . . . . . . . . . . . . . . . . . . . . . 71,829 23,470,844NXP Semiconductors NV. . . . . . . . . . . . . . . . . . . . . . . . . . . . . . . . . . 7,618 1,701,556ON Semiconductor Corp.(a) . . . . . . . . . . . . . . . . . . . . . . . . . . . . . . . . 12,370 759,889Qorvo Inc.(a) . . . . . . . . . . . . . . . . . . . . . . . . . . . . . . . . . . . . . . . . . . . . . . 3,193 466,912Skyworks Solutions Inc. . . . . . . . . . . . . . . . . . . . . . . . . . . . . . . . . . . . 4,745 719,627SolarEdge Technologies Inc.(a) . . . . . . . . . . . . . . . . . . . . . . . . . . . . 1,502 492,296Texas Instruments Inc. . . . . . . . . . . . . . . . . . . . . . . . . . . . . . . . . . . . . 26,525 5,102,614Xilinx Inc. . . . . . . . . . . . . . . . . . . . . . . . . . . . . . . . . . . . . . . . . . . . . . . . . . 7,110 1,624,280
56,434,995Software — 21.8%Adobe Inc.(a). . . . . . . . . . . . . . . . . . . . . . . . . . . . . . . . . . . . . . . . . . . . . . 13,688 9,168,907ANSYS Inc.(a). . . . . . . . . . . . . . . . . . . . . . . . . . . . . . . . . . . . . . . . . . . . . 2,507 981,440Asana Inc., Class A(a) . . . . . . . . . . . . . . . . . . . . . . . . . . . . . . . . . . . . . 1,913 198,856Autodesk Inc.(a) . . . . . . . . . . . . . . . . . . . . . . . . . . . . . . . . . . . . . . . . . . . 6,321 1,606,735Bentley Systems Inc., Class B . . . . . . . . . . . . . . . . . . . . . . . . . . . . . 5,044 242,062Bill.com Holdings Inc.(a) . . . . . . . . . . . . . . . . . . . . . . . . . . . . . . . . . . . 2,146 602,704Black Knight Inc.(a) . . . . . . . . . . . . . . . . . . . . . . . . . . . . . . . . . . . . . . . . 4,500 321,615Cadence Design Systems Inc.(a) . . . . . . . . . . . . . . . . . . . . . . . . . . . 7,952 1,411,162Ceridian HCM Holding Inc.(a) . . . . . . . . . . . . . . . . . . . . . . . . . . . . . . 3,875 423,925Citrix Systems Inc. . . . . . . . . . . . . . . . . . . . . . . . . . . . . . . . . . . . . . . . . 3,569 287,055Coupa Software Inc.(a) . . . . . . . . . . . . . . . . . . . . . . . . . . . . . . . . . . . . 2,113 415,543Crowdstrike Holdings Inc., Class A(a) . . . . . . . . . . . . . . . . . . . . . . . 5,438 1,180,807Datadog Inc., Class A(a) . . . . . . . . . . . . . . . . . . . . . . . . . . . . . . . . . . . 5,510 982,378DocuSign Inc.(a). . . . . . . . . . . . . . . . . . . . . . . . . . . . . . . . . . . . . . . . . . . 5,598 1,379,123Dropbox Inc., Class A(a) . . . . . . . . . . . . . . . . . . . . . . . . . . . . . . . . . . . 9,060 222,967Dynatrace Inc.(a) . . . . . . . . . . . . . . . . . . . . . . . . . . . . . . . . . . . . . . . . . . 5,309 333,671Fair Isaac Corp.(a). . . . . . . . . . . . . . . . . . . . . . . . . . . . . . . . . . . . . . . . . 816 288,154Fortinet Inc.(a). . . . . . . . . . . . . . . . . . . . . . . . . . . . . . . . . . . . . . . . . . . . . 3,989 1,324,787Guidewire Software Inc.(a) . . . . . . . . . . . . . . . . . . . . . . . . . . . . . . . . . 2,270 264,092HubSpot Inc.(a) . . . . . . . . . . . . . . . . . . . . . . . . . . . . . . . . . . . . . . . . . . . 1,283 1,035,265Intuit Inc. . . . . . . . . . . . . . . . . . . . . . . . . . . . . . . . . . . . . . . . . . . . . . . . . . 7,851 5,121,207Microsoft Corp. . . . . . . . . . . . . . . . . . . . . . . . . . . . . . . . . . . . . . . . . . . . 205,120 67,810,621NortonLifeLock Inc. . . . . . . . . . . . . . . . . . . . . . . . . . . . . . . . . . . . . . . . 16,713 415,318Nuance Communications Inc.(a). . . . . . . . . . . . . . . . . . . . . . . . . . . . 8,585 476,382Paycom Software Inc.(a) . . . . . . . . . . . . . . . . . . . . . . . . . . . . . . . . . . . 1,468 642,221PTC Inc.(a). . . . . . . . . . . . . . . . . . . . . . . . . . . . . . . . . . . . . . . . . . . . . . . . 3,204 351,094
Security Shares
Value
Software (continued)RingCentral Inc., Class A(a) . . . . . . . . . . . . . . . . . . . . . . . . . . . . . . . . 2,222 $ 479,908salesforce.com Inc.(a) . . . . . . . . . . . . . . . . . . . . . . . . . . . . . . . . . . . . . 28,128 8,015,355ServiceNow Inc.(a) . . . . . . . . . . . . . . . . . . . . . . . . . . . . . . . . . . . . . . . . 5,692 3,686,708Splunk Inc.(a) . . . . . . . . . . . . . . . . . . . . . . . . . . . . . . . . . . . . . . . . . . . . . 4,710 569,910Synopsys Inc.(a). . . . . . . . . . . . . . . . . . . . . . . . . . . . . . . . . . . . . . . . . . . 4,382 1,494,262Tyler Technologies Inc.(a) . . . . . . . . . . . . . . . . . . . . . . . . . . . . . . . . . . 1,174 609,282VMware Inc., Class A . . . . . . . . . . . . . . . . . . . . . . . . . . . . . . . . . . . . . 6,017 702,425Workday Inc., Class A(a) . . . . . . . . . . . . . . . . . . . . . . . . . . . . . . . . . . . 5,488 1,504,974Zendesk Inc.(a). . . . . . . . . . . . . . . . . . . . . . . . . . . . . . . . . . . . . . . . . . . . 3,448 352,075Zscaler Inc.(a) . . . . . . . . . . . . . . . . . . . . . . . . . . . . . . . . . . . . . . . . . . . . . 2,362 819,543
115,722,533Specialty Retail — 3.6%Advance Auto Parts Inc. . . . . . . . . . . . . . . . . . . . . . . . . . . . . . . . . . . . 1,810 399,503Best Buy Co. Inc. . . . . . . . . . . . . . . . . . . . . . . . . . . . . . . . . . . . . . . . . . 6,477 692,132Burlington Stores Inc.(a) . . . . . . . . . . . . . . . . . . . . . . . . . . . . . . . . . . . 1,917 561,930CarMax Inc.(a) . . . . . . . . . . . . . . . . . . . . . . . . . . . . . . . . . . . . . . . . . . . . 4,681 661,191Home Depot Inc. (The) . . . . . . . . . . . . . . . . . . . . . . . . . . . . . . . . . . . . 30,322 12,147,297Ross Stores Inc. . . . . . . . . . . . . . . . . . . . . . . . . . . . . . . . . . . . . . . . . . . 10,261 1,119,373TJX Companies Inc. (The). . . . . . . . . . . . . . . . . . . . . . . . . . . . . . . . . 34,551 2,397,839Tractor Supply Co. . . . . . . . . . . . . . . . . . . . . . . . . . . . . . . . . . . . . . . . . 3,285 740,209Ulta Beauty Inc.(a) . . . . . . . . . . . . . . . . . . . . . . . . . . . . . . . . . . . . . . . . . 1,484 569,782
19,289,256Technology Hardware, Storage & Peripherals — 0.7%Dell Technologies Inc., Class C(a) . . . . . . . . . . . . . . . . . . . . . . . . . . 7,976 450,405Hewlett Packard Enterprise Co.. . . . . . . . . . . . . . . . . . . . . . . . . . . . 37,522 538,441HP Inc. . . . . . . . . . . . . . . . . . . . . . . . . . . . . . . . . . . . . . . . . . . . . . . . . . . . 34,514 1,217,654NetApp Inc.. . . . . . . . . . . . . . . . . . . . . . . . . . . . . . . . . . . . . . . . . . . . . . . 6,436 572,032Seagate Technology Holdings PLC . . . . . . . . . . . . . . . . . . . . . . . . 5,885 604,213Western Digital Corp.(a) . . . . . . . . . . . . . . . . . . . . . . . . . . . . . . . . . . . 8,871 513,098
3,895,843Textiles, Apparel & Luxury Goods — 0.4%Lululemon Athletica Inc.(a) . . . . . . . . . . . . . . . . . . . . . . . . . . . . . . . . . 3,401 1,545,448VF Corp. . . . . . . . . . . . . . . . . . . . . . . . . . . . . . . . . . . . . . . . . . . . . . . . . . 9,589 687,819
2,233,267Trading Companies & Distributors — 0.4%Fastenal Co. . . . . . . . . . . . . . . . . . . . . . . . . . . . . . . . . . . . . . . . . . . . . . . 16,513 977,074United Rentals Inc.(a). . . . . . . . . . . . . . . . . . . . . . . . . . . . . . . . . . . . . . 2,080 704,579WW Grainger Inc. . . . . . . . . . . . . . . . . . . . . . . . . . . . . . . . . . . . . . . . . . 1,272 612,354
2,294,007Water Utilities — 0.2%American Water Works Co. Inc.. . . . . . . . . . . . . . . . . . . . . . . . . . . . 5,215 879,093
Total Common Stocks — 99.8%(Cost: $491,109,906) . . . . . . . . . . . . . . . . . . . . . . . . . . . . . . . . . . . . . . . . . . . . . . 528,872,860
Short-Term InvestmentsMoney Market Funds — 1.1%BlackRock Cash Funds: Institutional, SL Agency Shares,
0.06%(c)(d)(e) . . . . . . . . . . . . . . . . . . . . . . . . . . . . . . . . . . . . . . . . . . . 4,445,589 4,447,367
Schedule of Investments (unaudited) (continued)
November 30, 2021
iShares� ESG Advanced MSCI USA ETF(Percentages shown are based on Net Assets)
29NM0122U-1995964-31/159

Security Shares
Value
Money Market Funds (continued)BlackRock Cash Funds: Treasury, SL Agency Shares,
0.00%(c)(d) . . . . . . . . . . . . . . . . . . . . . . . . . . . . . . . . . . . . . . . . . . . . . 1,100,000 $ 1,100,000
5,547,367
Total Short-Term Investments — 1.1%(Cost: $5,547,367). . . . . . . . . . . . . . . . . . . . . . . . . . . . . . . . . . . . . . . . . . . . . . . . . 5,547,367
Total Investments in Securities — 100.9%(Cost: $496,657,273) . . . . . . . . . . . . . . . . . . . . . . . . . . . . . . . . . . . . . . . . . . . . . . 534,420,227
Other Assets, Less Liabilities — (0.9)%. . . . . . . . . . . . . . . . . . . . . . . . . . . . . . (4,729,238)
Net Assets — 100.0% . . . . . . . . . . . . . . . . . . . . . . . . . . . . . . . . . . . . . . . . . . . . . . . . $ 529,690,989
(a) Non-income producing security.(b) All or a portion of this security is on loan.(c) Affiliate of the Fund.(d) Annualized 7-day yield as of period end.(e) All or a portion of this security was purchased with the cash collateral from loaned
securities.
Affiliates
Investments in issuers considered to be affiliate(s) of the Fund during the period ended November 30, 2021 for purposes of Section 2(a)(3) of the Investment Company Actof 1940, as amended, were as follows:
Affiliated IssuerValue at
08/31/21Purchases
at CostProceeds
from SalesNet Realized
Gain (Loss)
Change inUnrealized
Appreciation(Depreciation)
Value at11/30/21
SharesHeld at
11/30/21 Income
CapitalGain
Distributionsfrom
UnderlyingFunds
BlackRock Cash Funds: Institutional, SL AgencyShares . . . . . . . . . . . . . . . . . . . . . . . . . . . . . . . . . . . . . . . . . . . . $603,291 $3,844,209(a) $ — $ (133) $ — $4,447,367 4,445,589 $ 1,645(b) $ —
BlackRock Cash Funds: Treasury, SL Agency Shares. . . 740,000 360,000(a) — — — 1,100,000 1,100,000 10 —
$ (133) $ — $5,547,367 $ 1,655 $ —
(a) Represents net amount purchased (sold).(b) All or a portion represents securities lending income earned from the reinvestment of cash collateral from loaned securities, net of fees and collateral investment expenses, and other
payments to and from borrowers of securities.
Derivative Financial Instruments Outstanding as of Period End
Futures Contracts
DescriptionNumber ofContracts
ExpirationDate
NotionalAmount
(000)
Value/Unrealized
Appreciation(Depreciation)
Long ContractsS&P 500 E-Mini Index . . . . . . . . . . . . . . . . . . . . . . . . . . . . . . . . . . . . . . . . . . . . . . . . . . . . . . . . . . . . . . . . . . . . . . . . . . . . . . . . . . . . . . . . . . . . . . . 4 12/17/21 $ 913 $ 1,669
Fair Value Measurements
Various inputs are used in determining the fair value of financial instruments. These inputs to valuation techniques are categorized into a fair value hierarchy consisting ofthree broad levels for financial reporting purposes as follows:
• Level 1 – Unadjusted price quotations in active markets/exchanges for identical assets or liabilities that each Fund has the ability to access;• Level 2 – Other observable inputs (including, but not limited to, quoted prices for similar assets or liabilities in markets that are active, quoted prices for identical or
similar assets or liabilities in markets that are not active, inputs other than quoted prices that are observable for the assets or liabilities (such as interest rates, yieldcurves, volatilities, prepayment speeds, loss severities, credit risks and default rates) or other market-corroborated inputs); and
• Level 3 – Unobservable inputs based on the best information available in the circumstances, to the extent observable inputs are not available (including the BlackRockGlobal Valuation Methodologies Committee’s (the “Global Valuation Committee’s”) assumptions used in determining the fair value of financial instruments).
The hierarchy gives the highest priority to unadjusted quoted prices in active markets for identical assets or liabilities (Level 1 measurements) and the lowest priority tounobservable inputs (Level 3 measurements). Accordingly, the degree of judgment exercised in determining fair value is greatest for instruments categorized in Level 3. Theinputs used to measure fair value may fall into different levels of the fair value hierarchy. In such cases, for disclosure purposes, the fair value hierarchy classification isdetermined based on the lowest level input that is significant to the fair value measurement in its entirety. Investments classified within Level 3 have significant unobservable
Schedule of Investments (unaudited) (continued)
November 30, 2021
iShares� ESG Advanced MSCI USA ETF(Percentages shown are based on Net Assets)
30 NM0122U-1995964-32/159

Fair Value Measurements (continued)
inputs used by the Global Valuation Committee in determining the price for Fair Valued Investments. Level 3 investments include equity or debt issued by privately heldcompanies or funds. There may not be a secondary market, and/or there are a limited number of investors. The categorization of a value determined for financial instrumentsis based on the pricing transparency of the financial instruments and is not necessarily an indication of the risks associated with investing in those securities. For informationabout the Fund’s policy regarding valuation of financial instruments, refer to its most recent financial statements.
The following table summarizes the Fund’s financial instruments categorized in the fair value hierarchy. The breakdown of the Fund’s financial instruments into majorcategories is disclosed in the Schedule of Investments above.
Level 1 Level 2 Level 3 Total
InvestmentsAssets
Common Stocks . . . . . . . . . . . . . . . . . . . . . . . . . . . . . . . . . . . . . . . . . . . . . . . . . . . . . . . . . . . . . . . . . . . . . . . . . . . . . . . . . . . . $528,872,860 $ — $ — $528,872,860Money Market Funds . . . . . . . . . . . . . . . . . . . . . . . . . . . . . . . . . . . . . . . . . . . . . . . . . . . . . . . . . . . . . . . . . . . . . . . . . . . . . . . 5,547,367 — — 5,547,367
$534,420,227 $ — $ — $534,420,227
Derivative financial instruments(a)
AssetsFutures Contracts. . . . . . . . . . . . . . . . . . . . . . . . . . . . . . . . . . . . . . . . . . . . . . . . . . . . . . . . . . . . . . . . . . . . . . . . . . . . . . . . . . . $ 1,669 $ — $ — $ 1,669
(a) Derivative financial instruments are futures contracts. Futures contracts are valued at the unrealized appreciation (depreciation) on the instrument.
Portfolio Abbreviations - Equity
NVS . . . . . . . . . . . . . Non-Voting Shares
Schedule of Investments (unaudited) (continued)
November 30, 2021
iShares� ESG Advanced MSCI USA ETF
31NM0122U-1995964-33/159
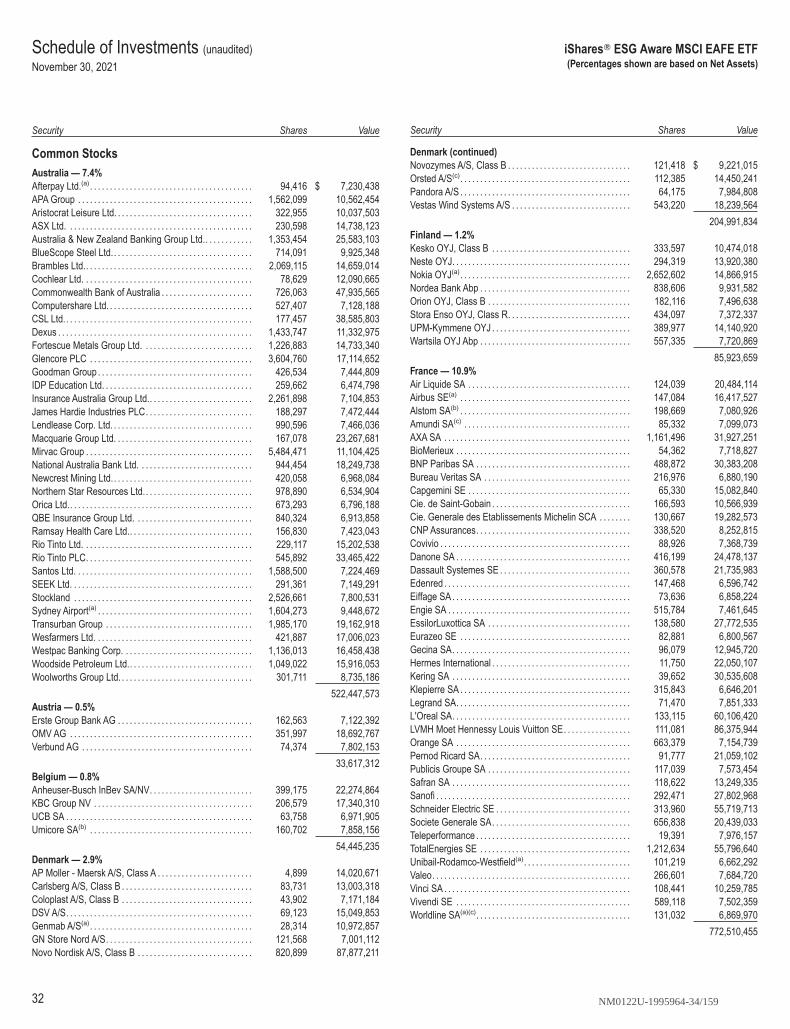
Security Shares
Value
Common StocksAustralia — 7.4%Afterpay Ltd.(a) . . . . . . . . . . . . . . . . . . . . . . . . . . . . . . . . . . . . . . . . . 94,416 $ 7,230,438APA Group . . . . . . . . . . . . . . . . . . . . . . . . . . . . . . . . . . . . . . . . . . . . 1,562,099 10,562,454Aristocrat Leisure Ltd. . . . . . . . . . . . . . . . . . . . . . . . . . . . . . . . . . . 322,955 10,037,503ASX Ltd. . . . . . . . . . . . . . . . . . . . . . . . . . . . . . . . . . . . . . . . . . . . . . . 230,598 14,738,123Australia & New Zealand Banking Group Ltd.. . . . . . . . . . . . 1,353,454 25,583,103BlueScope Steel Ltd.. . . . . . . . . . . . . . . . . . . . . . . . . . . . . . . . . . . 714,091 9,925,348Brambles Ltd.. . . . . . . . . . . . . . . . . . . . . . . . . . . . . . . . . . . . . . . . . . 2,069,115 14,659,014Cochlear Ltd. . . . . . . . . . . . . . . . . . . . . . . . . . . . . . . . . . . . . . . . . . . 78,629 12,090,665Commonwealth Bank of Australia . . . . . . . . . . . . . . . . . . . . . . . 726,063 47,935,565Computershare Ltd. . . . . . . . . . . . . . . . . . . . . . . . . . . . . . . . . . . . . 527,407 7,128,188CSL Ltd.. . . . . . . . . . . . . . . . . . . . . . . . . . . . . . . . . . . . . . . . . . . . . . . 177,457 38,585,803Dexus . . . . . . . . . . . . . . . . . . . . . . . . . . . . . . . . . . . . . . . . . . . . . . . . . 1,433,747 11,332,975Fortescue Metals Group Ltd. . . . . . . . . . . . . . . . . . . . . . . . . . . . 1,226,883 14,733,340Glencore PLC . . . . . . . . . . . . . . . . . . . . . . . . . . . . . . . . . . . . . . . . . 3,604,760 17,114,652Goodman Group . . . . . . . . . . . . . . . . . . . . . . . . . . . . . . . . . . . . . . . 426,534 7,444,809IDP Education Ltd. . . . . . . . . . . . . . . . . . . . . . . . . . . . . . . . . . . . . . 259,662 6,474,798Insurance Australia Group Ltd.. . . . . . . . . . . . . . . . . . . . . . . . . . 2,261,898 7,104,853James Hardie Industries PLC. . . . . . . . . . . . . . . . . . . . . . . . . . . 188,297 7,472,444Lendlease Corp. Ltd. . . . . . . . . . . . . . . . . . . . . . . . . . . . . . . . . . . . 990,596 7,466,036Macquarie Group Ltd. . . . . . . . . . . . . . . . . . . . . . . . . . . . . . . . . . . 167,078 23,267,681Mirvac Group . . . . . . . . . . . . . . . . . . . . . . . . . . . . . . . . . . . . . . . . . . 5,484,471 11,104,425National Australia Bank Ltd. . . . . . . . . . . . . . . . . . . . . . . . . . . . . 944,454 18,249,738Newcrest Mining Ltd.. . . . . . . . . . . . . . . . . . . . . . . . . . . . . . . . . . . 420,058 6,968,084Northern Star Resources Ltd.. . . . . . . . . . . . . . . . . . . . . . . . . . . 978,890 6,534,904Orica Ltd.. . . . . . . . . . . . . . . . . . . . . . . . . . . . . . . . . . . . . . . . . . . . . . 673,293 6,796,188QBE Insurance Group Ltd. . . . . . . . . . . . . . . . . . . . . . . . . . . . . . 840,324 6,913,858Ramsay Health Care Ltd.. . . . . . . . . . . . . . . . . . . . . . . . . . . . . . . 156,830 7,423,043Rio Tinto Ltd. . . . . . . . . . . . . . . . . . . . . . . . . . . . . . . . . . . . . . . . . . . 229,117 15,202,538Rio Tinto PLC. . . . . . . . . . . . . . . . . . . . . . . . . . . . . . . . . . . . . . . . . . 545,892 33,465,422Santos Ltd. . . . . . . . . . . . . . . . . . . . . . . . . . . . . . . . . . . . . . . . . . . . . 1,588,500 7,224,469SEEK Ltd. . . . . . . . . . . . . . . . . . . . . . . . . . . . . . . . . . . . . . . . . . . . . . 291,361 7,149,291Stockland . . . . . . . . . . . . . . . . . . . . . . . . . . . . . . . . . . . . . . . . . . . . . 2,526,661 7,800,531Sydney Airport(a) . . . . . . . . . . . . . . . . . . . . . . . . . . . . . . . . . . . . . . . 1,604,273 9,448,672Transurban Group . . . . . . . . . . . . . . . . . . . . . . . . . . . . . . . . . . . . . 1,985,170 19,162,918Wesfarmers Ltd. . . . . . . . . . . . . . . . . . . . . . . . . . . . . . . . . . . . . . . . 421,887 17,006,023Westpac Banking Corp. . . . . . . . . . . . . . . . . . . . . . . . . . . . . . . . . 1,136,013 16,458,438Woodside Petroleum Ltd.. . . . . . . . . . . . . . . . . . . . . . . . . . . . . . . 1,049,022 15,916,053Woolworths Group Ltd. . . . . . . . . . . . . . . . . . . . . . . . . . . . . . . . . . 301,711 8,735,186
522,447,573Austria — 0.5%Erste Group Bank AG . . . . . . . . . . . . . . . . . . . . . . . . . . . . . . . . . . 162,563 7,122,392OMV AG . . . . . . . . . . . . . . . . . . . . . . . . . . . . . . . . . . . . . . . . . . . . . . 351,997 18,692,767Verbund AG . . . . . . . . . . . . . . . . . . . . . . . . . . . . . . . . . . . . . . . . . . . 74,374 7,802,153
33,617,312Belgium — 0.8%Anheuser-Busch InBev SA/NV. . . . . . . . . . . . . . . . . . . . . . . . . . 399,175 22,274,864KBC Group NV . . . . . . . . . . . . . . . . . . . . . . . . . . . . . . . . . . . . . . . . 206,579 17,340,310UCB SA . . . . . . . . . . . . . . . . . . . . . . . . . . . . . . . . . . . . . . . . . . . . . . . 63,758 6,971,905Umicore SA(b) . . . . . . . . . . . . . . . . . . . . . . . . . . . . . . . . . . . . . . . . . 160,702 7,858,156
54,445,235Denmark — 2.9%AP Moller - Maersk A/S, Class A . . . . . . . . . . . . . . . . . . . . . . . . 4,899 14,020,671Carlsberg A/S, Class B . . . . . . . . . . . . . . . . . . . . . . . . . . . . . . . . . 83,731 13,003,318Coloplast A/S, Class B . . . . . . . . . . . . . . . . . . . . . . . . . . . . . . . . . 43,902 7,171,184DSV A/S. . . . . . . . . . . . . . . . . . . . . . . . . . . . . . . . . . . . . . . . . . . . . . . 69,123 15,049,853Genmab A/S(a). . . . . . . . . . . . . . . . . . . . . . . . . . . . . . . . . . . . . . . . . 28,314 10,972,857GN Store Nord A/S. . . . . . . . . . . . . . . . . . . . . . . . . . . . . . . . . . . . . 121,568 7,001,112Novo Nordisk A/S, Class B . . . . . . . . . . . . . . . . . . . . . . . . . . . . . 820,899 87,877,211
Security Shares
Value
Denmark (continued)Novozymes A/S, Class B . . . . . . . . . . . . . . . . . . . . . . . . . . . . . . . 121,418 $ 9,221,015Orsted A/S(c). . . . . . . . . . . . . . . . . . . . . . . . . . . . . . . . . . . . . . . . . . . 112,385 14,450,241Pandora A/S . . . . . . . . . . . . . . . . . . . . . . . . . . . . . . . . . . . . . . . . . . . 64,175 7,984,808Vestas Wind Systems A/S . . . . . . . . . . . . . . . . . . . . . . . . . . . . . . 543,220 18,239,564
204,991,834Finland — 1.2%Kesko OYJ, Class B . . . . . . . . . . . . . . . . . . . . . . . . . . . . . . . . . . . 333,597 10,474,018Neste OYJ. . . . . . . . . . . . . . . . . . . . . . . . . . . . . . . . . . . . . . . . . . . . . 294,319 13,920,380Nokia OYJ(a). . . . . . . . . . . . . . . . . . . . . . . . . . . . . . . . . . . . . . . . . . . 2,652,602 14,866,915Nordea Bank Abp . . . . . . . . . . . . . . . . . . . . . . . . . . . . . . . . . . . . . . 838,606 9,931,582Orion OYJ, Class B . . . . . . . . . . . . . . . . . . . . . . . . . . . . . . . . . . . . 182,116 7,496,638Stora Enso OYJ, Class R. . . . . . . . . . . . . . . . . . . . . . . . . . . . . . . 434,097 7,372,337UPM-Kymmene OYJ . . . . . . . . . . . . . . . . . . . . . . . . . . . . . . . . . . . 389,977 14,140,920Wartsila OYJ Abp . . . . . . . . . . . . . . . . . . . . . . . . . . . . . . . . . . . . . . 557,335 7,720,869
85,923,659France — 10.9%Air Liquide SA . . . . . . . . . . . . . . . . . . . . . . . . . . . . . . . . . . . . . . . . . 124,039 20,484,114Airbus SE(a) . . . . . . . . . . . . . . . . . . . . . . . . . . . . . . . . . . . . . . . . . . . 147,084 16,417,527Alstom SA(b) . . . . . . . . . . . . . . . . . . . . . . . . . . . . . . . . . . . . . . . . . . . 198,669 7,080,926Amundi SA(c) . . . . . . . . . . . . . . . . . . . . . . . . . . . . . . . . . . . . . . . . . . 85,332 7,099,073AXA SA . . . . . . . . . . . . . . . . . . . . . . . . . . . . . . . . . . . . . . . . . . . . . . . 1,161,496 31,927,251BioMerieux . . . . . . . . . . . . . . . . . . . . . . . . . . . . . . . . . . . . . . . . . . . . 54,362 7,718,827BNP Paribas SA . . . . . . . . . . . . . . . . . . . . . . . . . . . . . . . . . . . . . . . 488,872 30,383,208Bureau Veritas SA . . . . . . . . . . . . . . . . . . . . . . . . . . . . . . . . . . . . . 216,976 6,880,190Capgemini SE . . . . . . . . . . . . . . . . . . . . . . . . . . . . . . . . . . . . . . . . . 65,330 15,082,840Cie. de Saint-Gobain . . . . . . . . . . . . . . . . . . . . . . . . . . . . . . . . . . . 166,593 10,566,939Cie. Generale des Etablissements Michelin SCA . . . . . . . . 130,667 19,282,573CNP Assurances. . . . . . . . . . . . . . . . . . . . . . . . . . . . . . . . . . . . . . . 338,520 8,252,815Covivio . . . . . . . . . . . . . . . . . . . . . . . . . . . . . . . . . . . . . . . . . . . . . . . . 88,926 7,368,739Danone SA . . . . . . . . . . . . . . . . . . . . . . . . . . . . . . . . . . . . . . . . . . . . 416,199 24,478,137Dassault Systemes SE . . . . . . . . . . . . . . . . . . . . . . . . . . . . . . . . . 360,578 21,735,983Edenred . . . . . . . . . . . . . . . . . . . . . . . . . . . . . . . . . . . . . . . . . . . . . . . 147,468 6,596,742Eiffage SA . . . . . . . . . . . . . . . . . . . . . . . . . . . . . . . . . . . . . . . . . . . . . 73,636 6,858,224Engie SA . . . . . . . . . . . . . . . . . . . . . . . . . . . . . . . . . . . . . . . . . . . . . . 515,784 7,461,645EssilorLuxottica SA . . . . . . . . . . . . . . . . . . . . . . . . . . . . . . . . . . . . 138,580 27,772,535Eurazeo SE . . . . . . . . . . . . . . . . . . . . . . . . . . . . . . . . . . . . . . . . . . . 82,881 6,800,567Gecina SA. . . . . . . . . . . . . . . . . . . . . . . . . . . . . . . . . . . . . . . . . . . . . 96,079 12,945,720Hermes International . . . . . . . . . . . . . . . . . . . . . . . . . . . . . . . . . . . 11,750 22,050,107Kering SA . . . . . . . . . . . . . . . . . . . . . . . . . . . . . . . . . . . . . . . . . . . . . 39,652 30,535,608Klepierre SA . . . . . . . . . . . . . . . . . . . . . . . . . . . . . . . . . . . . . . . . . . . 315,843 6,646,201Legrand SA. . . . . . . . . . . . . . . . . . . . . . . . . . . . . . . . . . . . . . . . . . . . 71,470 7,851,333L'Oreal SA. . . . . . . . . . . . . . . . . . . . . . . . . . . . . . . . . . . . . . . . . . . . . 133,115 60,106,420LVMH Moet Hennessy Louis Vuitton SE. . . . . . . . . . . . . . . . . 111,081 86,375,944Orange SA . . . . . . . . . . . . . . . . . . . . . . . . . . . . . . . . . . . . . . . . . . . . 663,379 7,154,739Pernod Ricard SA. . . . . . . . . . . . . . . . . . . . . . . . . . . . . . . . . . . . . . 91,777 21,059,102Publicis Groupe SA . . . . . . . . . . . . . . . . . . . . . . . . . . . . . . . . . . . . 117,039 7,573,454Safran SA . . . . . . . . . . . . . . . . . . . . . . . . . . . . . . . . . . . . . . . . . . . . . 118,622 13,249,335Sanofi . . . . . . . . . . . . . . . . . . . . . . . . . . . . . . . . . . . . . . . . . . . . . . . . . 292,471 27,802,968Schneider Electric SE . . . . . . . . . . . . . . . . . . . . . . . . . . . . . . . . . . 313,960 55,719,713Societe Generale SA. . . . . . . . . . . . . . . . . . . . . . . . . . . . . . . . . . . 656,838 20,439,033Teleperformance . . . . . . . . . . . . . . . . . . . . . . . . . . . . . . . . . . . . . . . 19,391 7,976,157TotalEnergies SE . . . . . . . . . . . . . . . . . . . . . . . . . . . . . . . . . . . . . . 1,212,634 55,796,640Unibail-Rodamco-Westfield(a). . . . . . . . . . . . . . . . . . . . . . . . . . . 101,219 6,662,292Valeo. . . . . . . . . . . . . . . . . . . . . . . . . . . . . . . . . . . . . . . . . . . . . . . . . . 266,601 7,684,720Vinci SA . . . . . . . . . . . . . . . . . . . . . . . . . . . . . . . . . . . . . . . . . . . . . . . 108,441 10,259,785Vivendi SE . . . . . . . . . . . . . . . . . . . . . . . . . . . . . . . . . . . . . . . . . . . . 589,118 7,502,359Worldline SA(a)(c). . . . . . . . . . . . . . . . . . . . . . . . . . . . . . . . . . . . . . . 131,032 6,869,970
772,510,455
Schedule of Investments (unaudited)
November 30, 2021
iShares� ESG Aware MSCI EAFE ETF(Percentages shown are based on Net Assets)
32 NM0122U-1995964-34/159

Security Shares
Value
Germany — 8.2%adidas AG . . . . . . . . . . . . . . . . . . . . . . . . . . . . . . . . . . . . . . . . . . . . . 95,522 $ 27,626,657Allianz SE, Registered . . . . . . . . . . . . . . . . . . . . . . . . . . . . . . . . . 246,029 53,394,983BASF SE . . . . . . . . . . . . . . . . . . . . . . . . . . . . . . . . . . . . . . . . . . . . . . 358,240 23,463,293Bayerische Motoren Werke AG . . . . . . . . . . . . . . . . . . . . . . . . . 186,653 17,891,327Beiersdorf AG . . . . . . . . . . . . . . . . . . . . . . . . . . . . . . . . . . . . . . . . . 69,917 6,954,089Brenntag SE. . . . . . . . . . . . . . . . . . . . . . . . . . . . . . . . . . . . . . . . . . . 84,496 7,237,119Carl Zeiss Meditec AG, Bearer. . . . . . . . . . . . . . . . . . . . . . . . . . 35,752 7,174,679Commerzbank AG(a) . . . . . . . . . . . . . . . . . . . . . . . . . . . . . . . . . . . 944,643 6,634,706Continental AG(a) . . . . . . . . . . . . . . . . . . . . . . . . . . . . . . . . . . . . . . 60,386 6,485,416Daimler AG, Registered . . . . . . . . . . . . . . . . . . . . . . . . . . . . . . . . 407,929 38,203,780Delivery Hero SE(a)(c) . . . . . . . . . . . . . . . . . . . . . . . . . . . . . . . . . . 66,465 8,820,630Deutsche Bank AG, Registered(a) . . . . . . . . . . . . . . . . . . . . . . . 847,686 10,173,781Deutsche Boerse AG. . . . . . . . . . . . . . . . . . . . . . . . . . . . . . . . . . . 144,457 22,683,075Deutsche Post AG, Registered . . . . . . . . . . . . . . . . . . . . . . . . . 372,708 22,012,708Deutsche Telekom AG, Registered. . . . . . . . . . . . . . . . . . . . . . 420,289 7,402,417E.ON SE . . . . . . . . . . . . . . . . . . . . . . . . . . . . . . . . . . . . . . . . . . . . . . 1,254,687 15,478,254Evonik Industries AG. . . . . . . . . . . . . . . . . . . . . . . . . . . . . . . . . . . 233,793 7,055,503GEA Group AG . . . . . . . . . . . . . . . . . . . . . . . . . . . . . . . . . . . . . . . . 144,506 7,330,547HeidelbergCement AG . . . . . . . . . . . . . . . . . . . . . . . . . . . . . . . . . 119,536 7,952,905HelloFresh SE(a) . . . . . . . . . . . . . . . . . . . . . . . . . . . . . . . . . . . . . . . 73,878 7,492,679Henkel AG & Co. KGaA . . . . . . . . . . . . . . . . . . . . . . . . . . . . . . . . 110,426 8,200,999Infineon Technologies AG . . . . . . . . . . . . . . . . . . . . . . . . . . . . . . 655,533 29,638,908LEG Immobilien SE . . . . . . . . . . . . . . . . . . . . . . . . . . . . . . . . . . . . 50,776 7,104,612Merck KGaA. . . . . . . . . . . . . . . . . . . . . . . . . . . . . . . . . . . . . . . . . . . 108,910 26,917,662MTU Aero Engines AG . . . . . . . . . . . . . . . . . . . . . . . . . . . . . . . . . 48,260 8,984,361Muenchener Rueckversicherungs-Gesellschaft AG in
Muenchen, Registered . . . . . . . . . . . . . . . . . . . . . . . . . . . . . . 70,811 19,039,983Puma SE . . . . . . . . . . . . . . . . . . . . . . . . . . . . . . . . . . . . . . . . . . . . . . 102,010 12,324,980SAP SE . . . . . . . . . . . . . . . . . . . . . . . . . . . . . . . . . . . . . . . . . . . . . . . 568,878 72,902,417Siemens AG, Registered . . . . . . . . . . . . . . . . . . . . . . . . . . . . . . . 335,728 53,520,291Volkswagen AG. . . . . . . . . . . . . . . . . . . . . . . . . . . . . . . . . . . . . . . . 27,119 7,556,380Vonovia SE. . . . . . . . . . . . . . . . . . . . . . . . . . . . . . . . . . . . . . . . . . . . 136,497 7,575,040Zalando SE(a)(c) . . . . . . . . . . . . . . . . . . . . . . . . . . . . . . . . . . . . . . . . 128,235 11,662,145
576,896,326Hong Kong — 2.6%AIA Group Ltd. . . . . . . . . . . . . . . . . . . . . . . . . . . . . . . . . . . . . . . . . . 5,968,400 62,831,986BOC Hong Kong Holdings Ltd. . . . . . . . . . . . . . . . . . . . . . . . . . 4,230,500 12,787,988Galaxy Entertainment Group Ltd.(a) . . . . . . . . . . . . . . . . . . . . . 1,252,000 6,847,628Hang Seng Bank Ltd. . . . . . . . . . . . . . . . . . . . . . . . . . . . . . . . . . . 533,800 9,439,359Hong Kong Exchanges & Clearing Ltd.. . . . . . . . . . . . . . . . . . 558,900 30,734,704MTR Corp. Ltd.(b) . . . . . . . . . . . . . . . . . . . . . . . . . . . . . . . . . . . . . . 3,529,000 18,795,925Sands China Ltd.(a) . . . . . . . . . . . . . . . . . . . . . . . . . . . . . . . . . . . . 3,014,000 6,887,918Sun Hung Kai Properties Ltd. . . . . . . . . . . . . . . . . . . . . . . . . . . . 580,000 7,062,475Swire Pacific Ltd., Class A. . . . . . . . . . . . . . . . . . . . . . . . . . . . . . 1,388,500 7,666,082Swire Properties Ltd. . . . . . . . . . . . . . . . . . . . . . . . . . . . . . . . . . . . 5,842,200 13,866,518Techtronic Industries Co. Ltd. . . . . . . . . . . . . . . . . . . . . . . . . . . . 482,500 9,923,435
186,844,018Ireland — 0.9%CRH PLC. . . . . . . . . . . . . . . . . . . . . . . . . . . . . . . . . . . . . . . . . . . . . . 504,707 24,536,157Flutter Entertainment PLC, Class DI(a) . . . . . . . . . . . . . . . . . . 59,506 8,149,332Kerry Group PLC, Class A. . . . . . . . . . . . . . . . . . . . . . . . . . . . . . 124,658 15,353,294Kingspan Group PLC . . . . . . . . . . . . . . . . . . . . . . . . . . . . . . . . . . 66,482 7,708,537Smurfit Kappa Group PLC. . . . . . . . . . . . . . . . . . . . . . . . . . . . . . 140,926 7,195,288
62,942,608Israel — 0.6%Bank Hapoalim BM . . . . . . . . . . . . . . . . . . . . . . . . . . . . . . . . . . . . 1,203,553 11,700,624Bank Leumi Le-Israel BM. . . . . . . . . . . . . . . . . . . . . . . . . . . . . . . 734,971 7,072,341CyberArk Software Ltd.(a)(b). . . . . . . . . . . . . . . . . . . . . . . . . . . . . 37,730 6,521,631Isracard Ltd. . . . . . . . . . . . . . . . . . . . . . . . . . . . . . . . . . . . . . . . . . . . 1 5
Security Shares
Value
Israel (continued)Nice Ltd.(a) . . . . . . . . . . . . . . . . . . . . . . . . . . . . . . . . . . . . . . . . . . . . 30,519 $ 8,865,455Wix.com Ltd.(a) . . . . . . . . . . . . . . . . . . . . . . . . . . . . . . . . . . . . . . . . 45,049 6,883,487
41,043,543Italy — 1.9%Amplifon SpA . . . . . . . . . . . . . . . . . . . . . . . . . . . . . . . . . . . . . . . . . . 145,494 7,086,249Assicurazioni Generali SpA. . . . . . . . . . . . . . . . . . . . . . . . . . . . . 589,497 11,809,028Enel SpA . . . . . . . . . . . . . . . . . . . . . . . . . . . . . . . . . . . . . . . . . . . . . . 5,335,051 40,425,616Eni SpA . . . . . . . . . . . . . . . . . . . . . . . . . . . . . . . . . . . . . . . . . . . . . . . 1,186,300 15,632,804Intesa Sanpaolo SpA. . . . . . . . . . . . . . . . . . . . . . . . . . . . . . . . . . . 16,441,591 39,369,525Nexi SpA(a)(c) . . . . . . . . . . . . . . . . . . . . . . . . . . . . . . . . . . . . . . . . . . 445,274 6,845,079Prysmian SpA . . . . . . . . . . . . . . . . . . . . . . . . . . . . . . . . . . . . . . . . . 185,297 6,890,669UniCredit SpA . . . . . . . . . . . . . . . . . . . . . . . . . . . . . . . . . . . . . . . . . 568,347 6,862,117
134,921,087Japan — 22.8%Advantest Corp. . . . . . . . . . . . . . . . . . . . . . . . . . . . . . . . . . . . . . . . 81,900 7,149,925Aeon Co. Ltd. . . . . . . . . . . . . . . . . . . . . . . . . . . . . . . . . . . . . . . . . . . 378,100 8,818,594Ajinomoto Co. Inc. . . . . . . . . . . . . . . . . . . . . . . . . . . . . . . . . . . . . . 243,300 7,295,147Asahi Group Holdings Ltd.. . . . . . . . . . . . . . . . . . . . . . . . . . . . . . 213,400 7,870,272Asahi Kasei Corp.. . . . . . . . . . . . . . . . . . . . . . . . . . . . . . . . . . . . . . 1,411,100 13,193,705Astellas Pharma Inc. . . . . . . . . . . . . . . . . . . . . . . . . . . . . . . . . . . . 1,220,000 19,130,026Azbil Corp. . . . . . . . . . . . . . . . . . . . . . . . . . . . . . . . . . . . . . . . . . . . . 226,000 9,962,136Bridgestone Corp. . . . . . . . . . . . . . . . . . . . . . . . . . . . . . . . . . . . . . 240,600 9,647,713Canon Inc.. . . . . . . . . . . . . . . . . . . . . . . . . . . . . . . . . . . . . . . . . . . . . 328,300 7,220,211Chugai Pharmaceutical Co. Ltd. . . . . . . . . . . . . . . . . . . . . . . . . 389,400 12,614,133Dai Nippon Printing Co. Ltd. . . . . . . . . . . . . . . . . . . . . . . . . . . . . 309,700 7,268,702Dai-ichi Life Holdings Inc. . . . . . . . . . . . . . . . . . . . . . . . . . . . . . . 537,300 10,764,576Daiichi Sankyo Co. Ltd. . . . . . . . . . . . . . . . . . . . . . . . . . . . . . . . . 872,100 21,677,005Daikin Industries Ltd.. . . . . . . . . . . . . . . . . . . . . . . . . . . . . . . . . . . 130,700 26,613,677Daiwa House Industry Co. Ltd. . . . . . . . . . . . . . . . . . . . . . . . . . 244,900 7,111,922Denso Corp. . . . . . . . . . . . . . . . . . . . . . . . . . . . . . . . . . . . . . . . . . . . 256,000 18,727,737East Japan Railway Co. . . . . . . . . . . . . . . . . . . . . . . . . . . . . . . . . 197,900 12,133,149Eisai Co. Ltd. . . . . . . . . . . . . . . . . . . . . . . . . . . . . . . . . . . . . . . . . . . 171,000 10,334,443ENEOS Holdings Inc. . . . . . . . . . . . . . . . . . . . . . . . . . . . . . . . . . . 4,218,400 15,659,842FANUC Corp. . . . . . . . . . . . . . . . . . . . . . . . . . . . . . . . . . . . . . . . . . . 64,200 12,585,918Fast Retailing Co. Ltd. . . . . . . . . . . . . . . . . . . . . . . . . . . . . . . . . . 28,800 17,050,258FUJIFILM Holdings Corp. . . . . . . . . . . . . . . . . . . . . . . . . . . . . . . 192,000 15,102,925Fujitsu Ltd. . . . . . . . . . . . . . . . . . . . . . . . . . . . . . . . . . . . . . . . . . . . . 135,000 22,313,308Hankyu Hanshin Holdings Inc. . . . . . . . . . . . . . . . . . . . . . . . . . . 515,900 15,285,508Hitachi Construction Machinery Co. Ltd.. . . . . . . . . . . . . . . . . 229,200 6,621,882Hitachi Ltd. . . . . . . . . . . . . . . . . . . . . . . . . . . . . . . . . . . . . . . . . . . . . 470,000 27,531,729Honda Motor Co. Ltd. . . . . . . . . . . . . . . . . . . . . . . . . . . . . . . . . . . 577,500 15,814,701Hoya Corp. . . . . . . . . . . . . . . . . . . . . . . . . . . . . . . . . . . . . . . . . . . . . 155,000 24,534,407Hulic Co. Ltd. . . . . . . . . . . . . . . . . . . . . . . . . . . . . . . . . . . . . . . . . . . 755,700 7,193,641Ibiden Co. Ltd. . . . . . . . . . . . . . . . . . . . . . . . . . . . . . . . . . . . . . . . . . 143,500 8,872,958Idemitsu Kosan Co. Ltd. . . . . . . . . . . . . . . . . . . . . . . . . . . . . . . . . 346,300 8,908,107Inpex Corp. . . . . . . . . . . . . . . . . . . . . . . . . . . . . . . . . . . . . . . . . . . . . 1,311,300 10,729,833ITOCHU Corp. . . . . . . . . . . . . . . . . . . . . . . . . . . . . . . . . . . . . . . . . . 1,407,200 40,243,252Japan Post Holdings Co. Ltd. . . . . . . . . . . . . . . . . . . . . . . . . . . . 969,400 7,341,146JFE Holdings Inc. . . . . . . . . . . . . . . . . . . . . . . . . . . . . . . . . . . . . . . 601,600 6,856,919Kao Corp. . . . . . . . . . . . . . . . . . . . . . . . . . . . . . . . . . . . . . . . . . . . . . 254,800 12,997,758KDDI Corp. . . . . . . . . . . . . . . . . . . . . . . . . . . . . . . . . . . . . . . . . . . . . 1,256,300 36,451,740Keio Corp. . . . . . . . . . . . . . . . . . . . . . . . . . . . . . . . . . . . . . . . . . . . . . 156,400 7,032,288Keyence Corp.. . . . . . . . . . . . . . . . . . . . . . . . . . . . . . . . . . . . . . . . . 71,100 43,910,024Kikkoman Corp.. . . . . . . . . . . . . . . . . . . . . . . . . . . . . . . . . . . . . . . . 91,700 7,000,111Kirin Holdings Co. Ltd. . . . . . . . . . . . . . . . . . . . . . . . . . . . . . . . . . 727,400 11,589,431Komatsu Ltd. . . . . . . . . . . . . . . . . . . . . . . . . . . . . . . . . . . . . . . . . . . 717,900 16,241,092Kubota Corp. . . . . . . . . . . . . . . . . . . . . . . . . . . . . . . . . . . . . . . . . . . 525,700 10,938,759Kurita Water Industries Ltd.. . . . . . . . . . . . . . . . . . . . . . . . . . . . . 148,700 6,926,255Kyocera Corp. . . . . . . . . . . . . . . . . . . . . . . . . . . . . . . . . . . . . . . . . . 185,100 10,970,968
Schedule of Investments (unaudited) (continued)
November 30, 2021
iShares� ESG Aware MSCI EAFE ETF(Percentages shown are based on Net Assets)
33NM0122U-1995964-35/159

Security Shares
Value
Japan (continued)Kyowa Kirin Co. Ltd. . . . . . . . . . . . . . . . . . . . . . . . . . . . . . . . . . . . 249,000 $ 6,955,664Lawson Inc. . . . . . . . . . . . . . . . . . . . . . . . . . . . . . . . . . . . . . . . . . . . 149,000 7,305,418M3 Inc. . . . . . . . . . . . . . . . . . . . . . . . . . . . . . . . . . . . . . . . . . . . . . . . . 131,700 7,079,970Marubeni Corp. . . . . . . . . . . . . . . . . . . . . . . . . . . . . . . . . . . . . . . . . 828,300 7,406,965Mazda Motor Corp.(a) . . . . . . . . . . . . . . . . . . . . . . . . . . . . . . . . . . 938,000 7,567,354Mitsubishi Chemical Holdings Corp.. . . . . . . . . . . . . . . . . . . . . 899,800 7,034,008Mitsubishi Corp. . . . . . . . . . . . . . . . . . . . . . . . . . . . . . . . . . . . . . . . 285,000 8,474,319Mitsubishi UFJ Financial Group Inc.. . . . . . . . . . . . . . . . . . . . . 3,335,300 17,614,990Mitsui Fudosan Co. Ltd. . . . . . . . . . . . . . . . . . . . . . . . . . . . . . . . . 338,300 6,953,827Miura Co. Ltd. . . . . . . . . . . . . . . . . . . . . . . . . . . . . . . . . . . . . . . . . . 195,000 6,814,900Mizuho Financial Group Inc. . . . . . . . . . . . . . . . . . . . . . . . . . . . . 896,300 11,050,175MS&AD Insurance Group Holdings Inc. . . . . . . . . . . . . . . . . . 422,500 12,319,518Murata Manufacturing Co. Ltd.. . . . . . . . . . . . . . . . . . . . . . . . . . 223,200 16,374,840NEC Corp.. . . . . . . . . . . . . . . . . . . . . . . . . . . . . . . . . . . . . . . . . . . . . 156,100 7,042,808Nidec Corp.. . . . . . . . . . . . . . . . . . . . . . . . . . . . . . . . . . . . . . . . . . . . 137,700 15,767,687Nintendo Co. Ltd. . . . . . . . . . . . . . . . . . . . . . . . . . . . . . . . . . . . . . . 47,508 20,951,876Nippon Express Co. Ltd. . . . . . . . . . . . . . . . . . . . . . . . . . . . . . . . 126,900 7,224,423Nippon Paint Holdings Co. Ltd. . . . . . . . . . . . . . . . . . . . . . . . . . 656,700 6,890,827Nippon Steel Corp.. . . . . . . . . . . . . . . . . . . . . . . . . . . . . . . . . . . . . 548,900 8,092,806Nippon Telegraph & Telephone Corp. . . . . . . . . . . . . . . . . . . . 384,800 10,588,106Nippon Yusen KK . . . . . . . . . . . . . . . . . . . . . . . . . . . . . . . . . . . . . . 117,900 7,636,246Nitto Denko Corp.. . . . . . . . . . . . . . . . . . . . . . . . . . . . . . . . . . . . . . 98,700 6,842,771Nomura Holdings Inc. . . . . . . . . . . . . . . . . . . . . . . . . . . . . . . . . . . 2,836,500 11,885,401Nomura Research Institute Ltd. . . . . . . . . . . . . . . . . . . . . . . . . . 291,400 12,457,987NTT Data Corp.. . . . . . . . . . . . . . . . . . . . . . . . . . . . . . . . . . . . . . . . 340,600 7,187,954Obayashi Corp. . . . . . . . . . . . . . . . . . . . . . . . . . . . . . . . . . . . . . . . . 917,900 6,741,945Odakyu Electric Railway Co. Ltd. . . . . . . . . . . . . . . . . . . . . . . . 368,000 7,087,899Omron Corp. . . . . . . . . . . . . . . . . . . . . . . . . . . . . . . . . . . . . . . . . . . 261,700 25,144,293Ono Pharmaceutical Co. Ltd. . . . . . . . . . . . . . . . . . . . . . . . . . . . 345,100 7,611,787Oriental Land Co. Ltd.. . . . . . . . . . . . . . . . . . . . . . . . . . . . . . . . . . 83,300 13,089,332ORIX Corp. . . . . . . . . . . . . . . . . . . . . . . . . . . . . . . . . . . . . . . . . . . . . 673,300 13,266,304Panasonic Corp. . . . . . . . . . . . . . . . . . . . . . . . . . . . . . . . . . . . . . . . 1,434,700 15,641,859Recruit Holdings Co. Ltd. . . . . . . . . . . . . . . . . . . . . . . . . . . . . . . . 590,500 35,854,949Renesas Electronics Corp.(a) . . . . . . . . . . . . . . . . . . . . . . . . . . . 557,000 7,105,711Resona Holdings Inc. . . . . . . . . . . . . . . . . . . . . . . . . . . . . . . . . . . 3,104,500 11,337,874Secom Co. Ltd. . . . . . . . . . . . . . . . . . . . . . . . . . . . . . . . . . . . . . . . . 156,300 10,580,286Sekisui Chemical Co. Ltd. . . . . . . . . . . . . . . . . . . . . . . . . . . . . . . 534,800 8,687,552Sekisui House Ltd. . . . . . . . . . . . . . . . . . . . . . . . . . . . . . . . . . . . . . 649,000 12,613,187Seven & i Holdings Co. Ltd. . . . . . . . . . . . . . . . . . . . . . . . . . . . . 195,700 7,882,289SG Holdings Co. Ltd.. . . . . . . . . . . . . . . . . . . . . . . . . . . . . . . . . . . 323,600 7,142,388Shimadzu Corp. . . . . . . . . . . . . . . . . . . . . . . . . . . . . . . . . . . . . . . . 177,900 7,543,021Shin-Etsu Chemical Co. Ltd.. . . . . . . . . . . . . . . . . . . . . . . . . . . . 113,500 18,905,313Shionogi & Co. Ltd. . . . . . . . . . . . . . . . . . . . . . . . . . . . . . . . . . . . . 208,200 14,534,708Shiseido Co. Ltd. . . . . . . . . . . . . . . . . . . . . . . . . . . . . . . . . . . . . . . 128,300 7,354,127Softbank Corp.. . . . . . . . . . . . . . . . . . . . . . . . . . . . . . . . . . . . . . . . . 1,795,200 24,710,155SoftBank Group Corp.. . . . . . . . . . . . . . . . . . . . . . . . . . . . . . . . . . 486,000 25,540,289Sohgo Security Services Co. Ltd. . . . . . . . . . . . . . . . . . . . . . . . 169,100 7,208,158Sompo Holdings Inc. . . . . . . . . . . . . . . . . . . . . . . . . . . . . . . . . . . . 340,900 14,000,087Sony Group Corp. . . . . . . . . . . . . . . . . . . . . . . . . . . . . . . . . . . . . . 638,800 77,939,156Stanley Electric Co. Ltd. . . . . . . . . . . . . . . . . . . . . . . . . . . . . . . . . 280,300 7,282,561Sumitomo Chemical Co. Ltd. . . . . . . . . . . . . . . . . . . . . . . . . . . . 2,809,600 12,887,770Sumitomo Metal Mining Co. Ltd. . . . . . . . . . . . . . . . . . . . . . . . . 279,700 10,338,117Sumitomo Mitsui Financial Group Inc. . . . . . . . . . . . . . . . . . . . 321,700 10,466,478Sumitomo Mitsui Trust Holdings Inc. . . . . . . . . . . . . . . . . . . . . 452,100 14,121,555Sysmex Corp. . . . . . . . . . . . . . . . . . . . . . . . . . . . . . . . . . . . . . . . . . 138,200 17,189,698Takeda Pharmaceutical Co. Ltd. . . . . . . . . . . . . . . . . . . . . . . . . 779,394 20,851,088TDK Corp. . . . . . . . . . . . . . . . . . . . . . . . . . . . . . . . . . . . . . . . . . . . . . 211,900 8,382,644Terumo Corp. . . . . . . . . . . . . . . . . . . . . . . . . . . . . . . . . . . . . . . . . . . 299,100 12,180,605TIS Inc.. . . . . . . . . . . . . . . . . . . . . . . . . . . . . . . . . . . . . . . . . . . . . . . . 242,800 7,539,505Tokio Marine Holdings Inc. . . . . . . . . . . . . . . . . . . . . . . . . . . . . . 214,900 10,792,125
Security Shares
Value
Japan (continued)Tokyo Century Corp. . . . . . . . . . . . . . . . . . . . . . . . . . . . . . . . . . . . 143,400 $ 6,820,326Tokyo Electron Ltd. . . . . . . . . . . . . . . . . . . . . . . . . . . . . . . . . . . . . 78,100 41,039,182Tokyo Gas Co. Ltd. . . . . . . . . . . . . . . . . . . . . . . . . . . . . . . . . . . . . 437,500 7,484,636Tokyu Corp. . . . . . . . . . . . . . . . . . . . . . . . . . . . . . . . . . . . . . . . . . . . 573,900 7,932,362Toray Industries Inc.. . . . . . . . . . . . . . . . . . . . . . . . . . . . . . . . . . . . 2,187,900 12,650,422TOTO Ltd. . . . . . . . . . . . . . . . . . . . . . . . . . . . . . . . . . . . . . . . . . . . . . 152,200 6,732,856Toyota Motor Corp.. . . . . . . . . . . . . . . . . . . . . . . . . . . . . . . . . . . . . 4,562,500 80,935,326West Japan Railway Co. . . . . . . . . . . . . . . . . . . . . . . . . . . . . . . . 162,300 6,993,951Yamaha Corp. . . . . . . . . . . . . . . . . . . . . . . . . . . . . . . . . . . . . . . . . . 133,300 6,841,266Yamaha Motor Co. Ltd.. . . . . . . . . . . . . . . . . . . . . . . . . . . . . . . . . 430,300 10,821,411Yaskawa Electric Corp.. . . . . . . . . . . . . . . . . . . . . . . . . . . . . . . . . 171,000 7,632,427Yokogawa Electric Corp. . . . . . . . . . . . . . . . . . . . . . . . . . . . . . . . 379,300 7,110,355
1,612,308,008Netherlands — 5.6%Adyen NV(a)(c) . . . . . . . . . . . . . . . . . . . . . . . . . . . . . . . . . . . . . . . . . 7,906 21,898,316Akzo Nobel NV . . . . . . . . . . . . . . . . . . . . . . . . . . . . . . . . . . . . . . . . 156,378 16,455,086Argenx SE(a). . . . . . . . . . . . . . . . . . . . . . . . . . . . . . . . . . . . . . . . . . . 24,936 6,985,974ASM International NV . . . . . . . . . . . . . . . . . . . . . . . . . . . . . . . . . . 16,489 7,411,678ASML Holding NV. . . . . . . . . . . . . . . . . . . . . . . . . . . . . . . . . . . . . . 196,819 154,479,376CNH Industrial NV . . . . . . . . . . . . . . . . . . . . . . . . . . . . . . . . . . . . . 752,036 12,344,034Heineken NV . . . . . . . . . . . . . . . . . . . . . . . . . . . . . . . . . . . . . . . . . . 133,699 13,307,481ING Groep NV . . . . . . . . . . . . . . . . . . . . . . . . . . . . . . . . . . . . . . . . . 1,740,757 24,045,859Just Eat Takeaway.com NV(a)(c) . . . . . . . . . . . . . . . . . . . . . . . . . 108,690 6,806,208Koninklijke Ahold Delhaize NV . . . . . . . . . . . . . . . . . . . . . . . . . . 497,283 16,733,451Koninklijke DSM NV. . . . . . . . . . . . . . . . . . . . . . . . . . . . . . . . . . . . 119,409 25,701,172Koninklijke KPN NV . . . . . . . . . . . . . . . . . . . . . . . . . . . . . . . . . . . . 3,265,579 9,619,351Koninklijke Vopak NV . . . . . . . . . . . . . . . . . . . . . . . . . . . . . . . . . . 10,623 404,624NN Group NV. . . . . . . . . . . . . . . . . . . . . . . . . . . . . . . . . . . . . . . . . . 136,694 6,792,251Prosus NV. . . . . . . . . . . . . . . . . . . . . . . . . . . . . . . . . . . . . . . . . . . . . 404,964 32,544,062Randstad NV . . . . . . . . . . . . . . . . . . . . . . . . . . . . . . . . . . . . . . . . . . 103,650 6,540,408Stellantis NV. . . . . . . . . . . . . . . . . . . . . . . . . . . . . . . . . . . . . . . . . . . 467,400 7,975,592Wolters Kluwer NV . . . . . . . . . . . . . . . . . . . . . . . . . . . . . . . . . . . . . 207,280 23,310,883
393,355,806New Zealand — 0.3%Fisher & Paykel Healthcare Corp. Ltd. . . . . . . . . . . . . . . . . . . 369,100 8,351,092Ryman Healthcare Ltd. . . . . . . . . . . . . . . . . . . . . . . . . . . . . . . . . . 773,628 6,465,957Xero Ltd.(a) . . . . . . . . . . . . . . . . . . . . . . . . . . . . . . . . . . . . . . . . . . . . 81,670 8,295,013
23,112,062Norway — 0.9%Equinor ASA. . . . . . . . . . . . . . . . . . . . . . . . . . . . . . . . . . . . . . . . . . . 953,382 23,854,522Mowi ASA . . . . . . . . . . . . . . . . . . . . . . . . . . . . . . . . . . . . . . . . . . . . . 275,832 6,271,592Norsk Hydro ASA . . . . . . . . . . . . . . . . . . . . . . . . . . . . . . . . . . . . . . 1,259,970 8,159,674Orkla ASA . . . . . . . . . . . . . . . . . . . . . . . . . . . . . . . . . . . . . . . . . . . . . 1,129,201 10,321,788Telenor ASA . . . . . . . . . . . . . . . . . . . . . . . . . . . . . . . . . . . . . . . . . . . 1,219,909 18,025,682
66,633,258Portugal — 0.3%Galp Energia SGPS SA . . . . . . . . . . . . . . . . . . . . . . . . . . . . . . . . 1,337,737 12,553,915Jeronimo Martins SGPS SA . . . . . . . . . . . . . . . . . . . . . . . . . . . . 335,423 7,309,452
19,863,367Singapore — 1.2%Capitaland Investment Ltd/Singapore(a) . . . . . . . . . . . . . . . . . 3,348,600 8,245,426City Developments Ltd. . . . . . . . . . . . . . . . . . . . . . . . . . . . . . . . . 1,854,300 9,518,166DBS Group Holdings Ltd.. . . . . . . . . . . . . . . . . . . . . . . . . . . . . . . 872,100 18,996,612Keppel Corp. Ltd. . . . . . . . . . . . . . . . . . . . . . . . . . . . . . . . . . . . . . . 3,194,200 11,905,718Oversea-Chinese Banking Corp. Ltd. . . . . . . . . . . . . . . . . . . . 2,504,800 20,073,960United Overseas Bank Ltd. . . . . . . . . . . . . . . . . . . . . . . . . . . . . . 713,900 13,325,296
82,065,178
Schedule of Investments (unaudited) (continued)
November 30, 2021
iShares� ESG Aware MSCI EAFE ETF(Percentages shown are based on Net Assets)
34 NM0122U-1995964-36/159

Security Shares
Value
Spain — 2.3%Amadeus IT Group SA(a) . . . . . . . . . . . . . . . . . . . . . . . . . . . . . . . 192,413 $ 12,319,363Banco Bilbao Vizcaya Argentaria SA . . . . . . . . . . . . . . . . . . . . 4,142,292 21,960,862Banco Santander SA. . . . . . . . . . . . . . . . . . . . . . . . . . . . . . . . . . . 3,703,280 11,514,428CaixaBank SA . . . . . . . . . . . . . . . . . . . . . . . . . . . . . . . . . . . . . . . . . 2,647,294 6,834,965Cellnex Telecom SA(c). . . . . . . . . . . . . . . . . . . . . . . . . . . . . . . . . . 197,656 11,656,945Endesa SA . . . . . . . . . . . . . . . . . . . . . . . . . . . . . . . . . . . . . . . . . . . . 393,910 8,860,960Iberdrola SA . . . . . . . . . . . . . . . . . . . . . . . . . . . . . . . . . . . . . . . . . . . 3,322,699 37,320,995Industria de Diseno Textil SA . . . . . . . . . . . . . . . . . . . . . . . . . . . 677,322 21,410,624Naturgy Energy Group SA(b) . . . . . . . . . . . . . . . . . . . . . . . . . . . . 457,146 12,611,691Red Electrica Corp. SA. . . . . . . . . . . . . . . . . . . . . . . . . . . . . . . . . 174,858 3,716,774Repsol SA. . . . . . . . . . . . . . . . . . . . . . . . . . . . . . . . . . . . . . . . . . . . . 1,069,695 11,820,108
160,027,715Sweden — 3.9%Alfa Laval AB . . . . . . . . . . . . . . . . . . . . . . . . . . . . . . . . . . . . . . . . . . 169,527 6,541,274Assa Abloy AB, Class B . . . . . . . . . . . . . . . . . . . . . . . . . . . . . . . . 363,524 10,185,807Atlas Copco AB, Class A . . . . . . . . . . . . . . . . . . . . . . . . . . . . . . . 281,831 17,242,095Atlas Copco AB, Class B . . . . . . . . . . . . . . . . . . . . . . . . . . . . . . . 147,211 7,646,075Boliden AB . . . . . . . . . . . . . . . . . . . . . . . . . . . . . . . . . . . . . . . . . . . . 549,542 18,944,384Epiroc AB, Class A . . . . . . . . . . . . . . . . . . . . . . . . . . . . . . . . . . . . . 506,634 12,265,462EQT AB . . . . . . . . . . . . . . . . . . . . . . . . . . . . . . . . . . . . . . . . . . . . . . . 149,055 8,828,725Essity AB, Class B . . . . . . . . . . . . . . . . . . . . . . . . . . . . . . . . . . . . . 451,326 14,411,768Evolution AB(c) . . . . . . . . . . . . . . . . . . . . . . . . . . . . . . . . . . . . . . . . . 72,210 7,581,878H & M Hennes & Mauritz AB, Class B . . . . . . . . . . . . . . . . . . . 499,694 8,808,378Husqvarna AB, Class B . . . . . . . . . . . . . . . . . . . . . . . . . . . . . . . . 489,142 6,909,460ICA Gruppen AB . . . . . . . . . . . . . . . . . . . . . . . . . . . . . . . . . . . . . . . 180,823 10,710,386Industrivarden AB, Class A . . . . . . . . . . . . . . . . . . . . . . . . . . . . . 2,545 75,555Investor AB . . . . . . . . . . . . . . . . . . . . . . . . . . . . . . . . . . . . . . . . . . . . 295,081 7,128,683Investor AB, Class B . . . . . . . . . . . . . . . . . . . . . . . . . . . . . . . . . . . 335,514 7,796,182Kinnevik AB, Class B(a). . . . . . . . . . . . . . . . . . . . . . . . . . . . . . . . . 178,671 6,370,204Nibe Industrier AB, Class B. . . . . . . . . . . . . . . . . . . . . . . . . . . . . 708,735 10,101,986Sandvik AB . . . . . . . . . . . . . . . . . . . . . . . . . . . . . . . . . . . . . . . . . . . . 448,013 11,061,095Sinch AB(a)(c) . . . . . . . . . . . . . . . . . . . . . . . . . . . . . . . . . . . . . . . . . . 519,512 6,908,162Skandinaviska Enskilda Banken AB, Class A . . . . . . . . . . . . 488,458 7,103,120SKF AB, Class B. . . . . . . . . . . . . . . . . . . . . . . . . . . . . . . . . . . . . . . 302,665 6,908,824Svenska Cellulosa AB SCA, Class B . . . . . . . . . . . . . . . . . . . . 622,208 10,120,518Svenska Handelsbanken AB, Class A . . . . . . . . . . . . . . . . . . . 662,305 7,007,166Swedbank AB, Class A . . . . . . . . . . . . . . . . . . . . . . . . . . . . . . . . . 341,575 6,877,538Tele2 AB, Class B. . . . . . . . . . . . . . . . . . . . . . . . . . . . . . . . . . . . . . 959,642 13,694,703Telefonaktiebolaget LM Ericsson, Class B . . . . . . . . . . . . . . . 1,405,540 14,129,140Telia Co. AB . . . . . . . . . . . . . . . . . . . . . . . . . . . . . . . . . . . . . . . . . . . 3,926,981 15,177,684Volvo AB, Class A. . . . . . . . . . . . . . . . . . . . . . . . . . . . . . . . . . . . . . 353,110 7,714,415Volvo AB, Class B. . . . . . . . . . . . . . . . . . . . . . . . . . . . . . . . . . . . . . 305,037 6,567,319
274,817,986Switzerland — 10.7%ABB Ltd., Registered. . . . . . . . . . . . . . . . . . . . . . . . . . . . . . . . . . . 1,019,353 35,252,067Adecco Group AG, Registered. . . . . . . . . . . . . . . . . . . . . . . . . . 144,370 6,730,609Alcon Inc. . . . . . . . . . . . . . . . . . . . . . . . . . . . . . . . . . . . . . . . . . . . . . 191,587 15,133,210Barry Callebaut AG, Registered. . . . . . . . . . . . . . . . . . . . . . . . . 2,976 7,040,693Chocoladefabriken Lindt & Spruengli AG, Participation
Certificates, NVS. . . . . . . . . . . . . . . . . . . . . . . . . . . . . . . . . . . . 602 7,416,393Coca-Cola HBC AG, Class DI . . . . . . . . . . . . . . . . . . . . . . . . . . 298,104 9,180,223Credit Suisse Group AG, Registered . . . . . . . . . . . . . . . . . . . . 1,047,842 10,117,336Geberit AG, Registered . . . . . . . . . . . . . . . . . . . . . . . . . . . . . . . . 22,270 17,003,387Givaudan SA, Registered . . . . . . . . . . . . . . . . . . . . . . . . . . . . . . 6,848 33,478,149Kuehne + Nagel International AG, Registered . . . . . . . . . . . 56,369 16,114,141Logitech International SA, Registered . . . . . . . . . . . . . . . . . . . 103,055 8,219,026Lonza Group AG, Registered . . . . . . . . . . . . . . . . . . . . . . . . . . . 49,114 39,602,947Nestle SA, Registered. . . . . . . . . . . . . . . . . . . . . . . . . . . . . . . . . . 1,199,706 153,768,406Novartis AG, Registered. . . . . . . . . . . . . . . . . . . . . . . . . . . . . . . . 794,968 63,363,511
Security Shares
Value
Switzerland (continued)Partners Group Holding AG . . . . . . . . . . . . . . . . . . . . . . . . . . . . 6,712 $ 11,583,889Roche Holding AG, Bearer . . . . . . . . . . . . . . . . . . . . . . . . . . . . . 32,319 13,400,954Roche Holding AG, NVS . . . . . . . . . . . . . . . . . . . . . . . . . . . . . . . 291,292 113,723,354SGS SA, Registered . . . . . . . . . . . . . . . . . . . . . . . . . . . . . . . . . . . 6,726 20,290,801Sika AG, Registered . . . . . . . . . . . . . . . . . . . . . . . . . . . . . . . . . . . 40,817 15,939,076Sonova Holding AG, Registered . . . . . . . . . . . . . . . . . . . . . . . . 34,085 12,809,771STMicroelectronics NV . . . . . . . . . . . . . . . . . . . . . . . . . . . . . . . . . 351,694 17,128,128Straumann Holding AG, Registered . . . . . . . . . . . . . . . . . . . . . 4,917 10,453,283Swiss Life Holding AG, Registered . . . . . . . . . . . . . . . . . . . . . . 18,956 10,879,608Swiss Re AG . . . . . . . . . . . . . . . . . . . . . . . . . . . . . . . . . . . . . . . . . . 217,296 20,395,519Swisscom AG, Registered . . . . . . . . . . . . . . . . . . . . . . . . . . . . . . 20,698 11,497,960Temenos AG, Registered . . . . . . . . . . . . . . . . . . . . . . . . . . . . . . . 50,542 6,464,034UBS Group AG, Registered . . . . . . . . . . . . . . . . . . . . . . . . . . . . 1,437,137 24,850,218VAT Group AG(c) . . . . . . . . . . . . . . . . . . . . . . . . . . . . . . . . . . . . . . . 14,526 7,009,442Vifor Pharma AG. . . . . . . . . . . . . . . . . . . . . . . . . . . . . . . . . . . . . . . 75,941 8,513,704Zurich Insurance Group AG . . . . . . . . . . . . . . . . . . . . . . . . . . . . 69,163 28,433,566
755,793,405Taiwan — 0.2%Sea Ltd., ADR(a) . . . . . . . . . . . . . . . . . . . . . . . . . . . . . . . . . . . . . . . 40,061 11,540,372
United Kingdom — 13.3%3i Group PLC . . . . . . . . . . . . . . . . . . . . . . . . . . . . . . . . . . . . . . . . . . 498,650 9,149,199Antofagasta PLC. . . . . . . . . . . . . . . . . . . . . . . . . . . . . . . . . . . . . . . 533,314 9,750,471Ashtead Group PLC. . . . . . . . . . . . . . . . . . . . . . . . . . . . . . . . . . . . 226,278 18,203,632Associated British Foods PLC . . . . . . . . . . . . . . . . . . . . . . . . . . 283,219 7,229,292AstraZeneca PLC . . . . . . . . . . . . . . . . . . . . . . . . . . . . . . . . . . . . . . 693,440 76,025,124Aviva PLC . . . . . . . . . . . . . . . . . . . . . . . . . . . . . . . . . . . . . . . . . . . . . 1,384,556 7,066,303BAE Systems PLC . . . . . . . . . . . . . . . . . . . . . . . . . . . . . . . . . . . . . 2,033,121 14,806,907Barclays PLC . . . . . . . . . . . . . . . . . . . . . . . . . . . . . . . . . . . . . . . . . . 8,882,138 21,687,330Barratt Developments PLC . . . . . . . . . . . . . . . . . . . . . . . . . . . . . 1,183,000 10,955,587Berkeley Group Holdings PLC . . . . . . . . . . . . . . . . . . . . . . . . . . 165,556 9,424,375BP PLC . . . . . . . . . . . . . . . . . . . . . . . . . . . . . . . . . . . . . . . . . . . . . . . 12,200,778 52,935,836British Land Co. PLC (The) . . . . . . . . . . . . . . . . . . . . . . . . . . . . . 1,188,440 8,035,484BT Group PLC(a) . . . . . . . . . . . . . . . . . . . . . . . . . . . . . . . . . . . . . . . 4,702,598 9,899,411Burberry Group PLC . . . . . . . . . . . . . . . . . . . . . . . . . . . . . . . . . . . 372,881 8,757,803Coca-Cola Europacific Partners PLC. . . . . . . . . . . . . . . . . . . . 150,220 7,416,361Compass Group PLC(a) . . . . . . . . . . . . . . . . . . . . . . . . . . . . . . . . 518,232 10,109,596Croda International PLC. . . . . . . . . . . . . . . . . . . . . . . . . . . . . . . . 142,542 19,116,149DCC PLC. . . . . . . . . . . . . . . . . . . . . . . . . . . . . . . . . . . . . . . . . . . . . . 94,213 6,939,312Diageo PLC . . . . . . . . . . . . . . . . . . . . . . . . . . . . . . . . . . . . . . . . . . . 1,324,080 66,823,978Entain PLC(a) . . . . . . . . . . . . . . . . . . . . . . . . . . . . . . . . . . . . . . . . . . 296,098 6,581,412Experian PLC. . . . . . . . . . . . . . . . . . . . . . . . . . . . . . . . . . . . . . . . . . 161,976 7,272,050Ferguson PLC . . . . . . . . . . . . . . . . . . . . . . . . . . . . . . . . . . . . . . . . . 163,970 24,960,764GlaxoSmithKline PLC . . . . . . . . . . . . . . . . . . . . . . . . . . . . . . . . . . 2,183,118 44,324,048HSBC Holdings PLC . . . . . . . . . . . . . . . . . . . . . . . . . . . . . . . . . . . 9,152,163 50,578,497Informa PLC(a) . . . . . . . . . . . . . . . . . . . . . . . . . . . . . . . . . . . . . . . . . 1,077,239 6,671,010InterContinental Hotels Group PLC(a) . . . . . . . . . . . . . . . . . . . 109,136 6,484,680Intertek Group PLC . . . . . . . . . . . . . . . . . . . . . . . . . . . . . . . . . . . . 141,472 10,018,290J Sainsbury PLC . . . . . . . . . . . . . . . . . . . . . . . . . . . . . . . . . . . . . . . 2,771,736 10,182,945Johnson Matthey PLC. . . . . . . . . . . . . . . . . . . . . . . . . . . . . . . . . . 264,968 7,361,342Kingfisher PLC. . . . . . . . . . . . . . . . . . . . . . . . . . . . . . . . . . . . . . . . . 2,217,781 9,319,616Land Securities Group PLC . . . . . . . . . . . . . . . . . . . . . . . . . . . . 732,224 7,079,681Legal & General Group PLC. . . . . . . . . . . . . . . . . . . . . . . . . . . . 2,749,534 10,271,976Lloyds Banking Group PLC. . . . . . . . . . . . . . . . . . . . . . . . . . . . . 34,690,501 21,540,823London Stock Exchange Group PLC . . . . . . . . . . . . . . . . . . . . 122,164 10,583,156Melrose Industries PLC . . . . . . . . . . . . . . . . . . . . . . . . . . . . . . . . 3,273,938 6,313,552Mondi PLC . . . . . . . . . . . . . . . . . . . . . . . . . . . . . . . . . . . . . . . . . . . . 588,717 13,448,165National Grid PLC . . . . . . . . . . . . . . . . . . . . . . . . . . . . . . . . . . . . . 2,318,057 30,758,421Natwest Group PLC. . . . . . . . . . . . . . . . . . . . . . . . . . . . . . . . . . . . 3,262,589 9,193,040Next PLC. . . . . . . . . . . . . . . . . . . . . . . . . . . . . . . . . . . . . . . . . . . . . . 66,364 6,933,374
Schedule of Investments (unaudited) (continued)
November 30, 2021
iShares� ESG Aware MSCI EAFE ETF(Percentages shown are based on Net Assets)
35NM0122U-1995964-37/159

Security Shares
Value
United Kingdom (continued)Ocado Group PLC(a) . . . . . . . . . . . . . . . . . . . . . . . . . . . . . . . . . . . 309,303 $ 7,383,811Pearson PLC . . . . . . . . . . . . . . . . . . . . . . . . . . . . . . . . . . . . . . . . . . 871,697 6,892,843Prudential PLC . . . . . . . . . . . . . . . . . . . . . . . . . . . . . . . . . . . . . . . . 843,035 14,239,915Reckitt Benckiser Group PLC. . . . . . . . . . . . . . . . . . . . . . . . . . . 314,102 25,443,203RELX PLC. . . . . . . . . . . . . . . . . . . . . . . . . . . . . . . . . . . . . . . . . . . . . 1,172,258 36,364,185Rentokil Initial PLC. . . . . . . . . . . . . . . . . . . . . . . . . . . . . . . . . . . . . 895,701 7,294,272Rolls-Royce Holdings PLC(a) . . . . . . . . . . . . . . . . . . . . . . . . . . . 3,859,859 6,288,439Schroders PLC . . . . . . . . . . . . . . . . . . . . . . . . . . . . . . . . . . . . . . . . 231,692 10,566,049Segro PLC . . . . . . . . . . . . . . . . . . . . . . . . . . . . . . . . . . . . . . . . . . . . 1,322,270 24,712,124Smiths Group PLC . . . . . . . . . . . . . . . . . . . . . . . . . . . . . . . . . . . . . 377,250 7,205,177SSE PLC . . . . . . . . . . . . . . . . . . . . . . . . . . . . . . . . . . . . . . . . . . . . . . 729,955 15,007,056St. James's Place PLC . . . . . . . . . . . . . . . . . . . . . . . . . . . . . . . . . 350,363 7,214,129Standard Chartered PLC . . . . . . . . . . . . . . . . . . . . . . . . . . . . . . . 1,195,046 6,576,474Tesco PLC. . . . . . . . . . . . . . . . . . . . . . . . . . . . . . . . . . . . . . . . . . . . . 2,543,722 9,382,418Unilever PLC . . . . . . . . . . . . . . . . . . . . . . . . . . . . . . . . . . . . . . . . . . 1,045,029 53,372,745Vodafone Group PLC . . . . . . . . . . . . . . . . . . . . . . . . . . . . . . . . . . 11,530,187 16,716,661Whitbread PLC(a) . . . . . . . . . . . . . . . . . . . . . . . . . . . . . . . . . . . . . . 176,615 6,583,435WPP PLC . . . . . . . . . . . . . . . . . . . . . . . . . . . . . . . . . . . . . . . . . . . . . 606,411 8,417,052
943,868,980
Total Common Stocks — 99.4%(Cost: $6,237,780,860). . . . . . . . . . . . . . . . . . . . . . . . . . . . . . . . . . . . . . . . . . . 7,019,969,787
Preferred StocksGermany — 0.1%Sartorius AG, Preference Shares, NVS. . . . . . . . . . . . . . . . . . 11,672 8,029,530
Total Preferred Stocks — 0.1%(Cost: $2,955,840) . . . . . . . . . . . . . . . . . . . . . . . . . . . . . . . . . . . . . . . . . . . . . . . 8,029,530
RightsGermany — 0.0%Vonovia SE (Expires 12/07/21)(a) . . . . . . . . . . . . . . . . . . . . . . . 157,757 556,417
Total Rights — 0.0%(Cost: $0) . . . . . . . . . . . . . . . . . . . . . . . . . . . . . . . . . . . . . . . . . . . . . . . . . . . . . . . 556,417
Security Shares
Value
Short-Term InvestmentsMoney Market Funds — 0.4%BlackRock Cash Funds: Institutional, SL Agency Shares,
0.06%(d)(e)(f) . . . . . . . . . . . . . . . . . . . . . . . . . . . . . . . . . . . . . . . . . 25,358,951 $ 25,369,095BlackRock Cash Funds: Treasury, SL Agency Shares,
0.00%(d)(e) . . . . . . . . . . . . . . . . . . . . . . . . . . . . . . . . . . . . . . . . . . 1,810,000 1,810,000
27,179,095
Total Short-Term Investments — 0.4%(Cost: $27,180,379). . . . . . . . . . . . . . . . . . . . . . . . . . . . . . . . . . . . . . . . . . . . . . 27,179,095
Total Investments in Securities — 99.9%(Cost: $6,267,917,079). . . . . . . . . . . . . . . . . . . . . . . . . . . . . . . . . . . . . . . . . . . 7,055,734,829
Other Assets, Less Liabilities — 0.1% . . . . . . . . . . . . . . . . . . . . . . . . . . . . . 8,944,710
Net Assets — 100.0% . . . . . . . . . . . . . . . . . . . . . . . . . . . . . . . . . . . . . . . . . . . . . . $ 7,064,679,539 (a) Non-income producing security.(b) All or a portion of this security is on loan.(c) Security exempt from registration pursuant to Rule 144A under the Securities Act of
1933, as amended. These securities may be resold in transactions exempt fromregistration to qualified institutional investors.
(d) Affiliate of the Fund.(e) Annualized 7-day yield as of period end.(f) All or a portion of this security was purchased with the cash collateral from loaned
securities.
Affiliates
Investments in issuers considered to be affiliate(s) of the Fund during the period ended November 30, 2021 for purposes of Section 2(a)(3) of the Investment Company Actof 1940, as amended, were as follows:
Affiliated IssuerValue at
08/31/21Purchases
at CostProceeds
from SalesNet Realized
Gain (Loss)
Change inUnrealized
Appreciation(Depreciation)
Value at11/30/21
SharesHeld at
11/30/21 Income
CapitalGain
Distributionsfrom
UnderlyingFunds
BlackRock Cash Funds: Institutional, SL AgencyShares . . . . . . . . . . . . . . . . . . . . . . . . . . . . . . . . . . . . . $11,009,959 $14,360,833(a) $ — $ (413) $ (1,284) $25,369,095 25,358,951 $96,410(b) $ —
BlackRock Cash Funds: Treasury, SL AgencyShares . . . . . . . . . . . . . . . . . . . . . . . . . . . . . . . . . . . . . 1,190,000 620,000(a)
— — — 1,810,000 1,810,000 15 —
$ (413) $ (1,284) $27,179,095 $96,425 $ —
(a) Represents net amount purchased (sold).(b) All or a portion represents securities lending income earned from the reinvestment of cash collateral from loaned securities, net of fees and collateral investment expenses, and other
payments to and from borrowers of securities.
Schedule of Investments (unaudited) (continued)
November 30, 2021
iShares� ESG Aware MSCI EAFE ETF(Percentages shown are based on Net Assets)
36 NM0122U-1995964-38/159

Derivative Financial Instruments Outstanding as of Period End
Futures Contracts
DescriptionNumber ofContracts
ExpirationDate
NotionalAmount
(000)
Value/Unrealized
Appreciation(Depreciation)
Long ContractsTOPIX Index . . . . . . . . . . . . . . . . . . . . . . . . . . . . . . . . . . . . . . . . . . . . . . . . . . . . . . . . . . . . . . . . . . . . . . . . . . . . . . . . . . . . . . . . . . . . . . . . . . . . . . . . 58 12/09/21 $ 9,670 $ (707,829)SPI 200 Index . . . . . . . . . . . . . . . . . . . . . . . . . . . . . . . . . . . . . . . . . . . . . . . . . . . . . . . . . . . . . . . . . . . . . . . . . . . . . . . . . . . . . . . . . . . . . . . . . . . . . . . 32 12/16/21 4,094 (58,367)Euro STOXX 50 Index . . . . . . . . . . . . . . . . . . . . . . . . . . . . . . . . . . . . . . . . . . . . . . . . . . . . . . . . . . . . . . . . . . . . . . . . . . . . . . . . . . . . . . . . . . . . . . . 304 12/17/21 14,010 (159,413)FTSE 100 Index . . . . . . . . . . . . . . . . . . . . . . . . . . . . . . . . . . . . . . . . . . . . . . . . . . . . . . . . . . . . . . . . . . . . . . . . . . . . . . . . . . . . . . . . . . . . . . . . . . . . . 80 12/17/21 7,514 (73,652)
$ (999,261)
Fair Value Measurements
Various inputs are used in determining the fair value of financial instruments. These inputs to valuation techniques are categorized into a fair value hierarchy consisting ofthree broad levels for financial reporting purposes as follows:
• Level 1 – Unadjusted price quotations in active markets/exchanges for identical assets or liabilities that each Fund has the ability to access;• Level 2 – Other observable inputs (including, but not limited to, quoted prices for similar assets or liabilities in markets that are active, quoted prices for identical or
similar assets or liabilities in markets that are not active, inputs other than quoted prices that are observable for the assets or liabilities (such as interest rates, yieldcurves, volatilities, prepayment speeds, loss severities, credit risks and default rates) or other market-corroborated inputs); and
• Level 3 – Unobservable inputs based on the best information available in the circumstances, to the extent observable inputs are not available (including the BlackRockGlobal Valuation Methodologies Committee’s (the “Global Valuation Committee’s”) assumptions used in determining the fair value of financial instruments).
The hierarchy gives the highest priority to unadjusted quoted prices in active markets for identical assets or liabilities (Level 1 measurements) and the lowest priority tounobservable inputs (Level 3 measurements). Accordingly, the degree of judgment exercised in determining fair value is greatest for instruments categorized in Level 3. Theinputs used to measure fair value may fall into different levels of the fair value hierarchy. In such cases, for disclosure purposes, the fair value hierarchy classification isdetermined based on the lowest level input that is significant to the fair value measurement in its entirety. Investments classified within Level 3 have significant unobservableinputs used by the Global Valuation Committee in determining the price for Fair Valued Investments. Level 3 investments include equity or debt issued by privately heldcompanies or funds. There may not be a secondary market, and/or there are a limited number of investors. The categorization of a value determined for financial instrumentsis based on the pricing transparency of the financial instruments and is not necessarily an indication of the risks associated with investing in those securities. For informationabout the Fund’s policy regarding valuation of financial instruments, refer to its most recent financial statements.
The following table summarizes the Fund’s financial instruments categorized in the fair value hierarchy. The breakdown of the Fund’s financial instruments into majorcategories is disclosed in the Schedule of Investments above.
Level 1 Level 2 Level 3 Total
InvestmentsAssets
Common Stocks . . . . . . . . . . . . . . . . . . . . . . . . . . . . . . . . . . . . . . . . . . . . . . . . . . . . . . . . . . . . . . . . . . . . . . . . . . . . $ 134,707,440 $6,885,262,347 $ — $7,019,969,787Preferred Stocks . . . . . . . . . . . . . . . . . . . . . . . . . . . . . . . . . . . . . . . . . . . . . . . . . . . . . . . . . . . . . . . . . . . . . . . . . . . . — 8,029,530 — 8,029,530Rights . . . . . . . . . . . . . . . . . . . . . . . . . . . . . . . . . . . . . . . . . . . . . . . . . . . . . . . . . . . . . . . . . . . . . . . . . . . . . . . . . . . . . . 556,417 — — 556,417Money Market Funds . . . . . . . . . . . . . . . . . . . . . . . . . . . . . . . . . . . . . . . . . . . . . . . . . . . . . . . . . . . . . . . . . . . . . . . . 27,179,095 — — 27,179,095
$ 162,442,952 $6,893,291,877 $ — $7,055,734,829
Derivative financial instruments(a)
LiabilitiesFutures Contracts . . . . . . . . . . . . . . . . . . . . . . . . . . . . . . . . . . . . . . . . . . . . . . . . . . . . . . . . . . . . . . . . . . . . . . . . . . . $ — $ (999,261) $ — $ (999,261)
(a) Derivative financial instruments are futures contracts. Futures contracts are valued at the unrealized appreciation (depreciation) on the instrument.
Portfolio Abbreviations - Equity
ADR . . . . . . . . . . . . . American Depositary ReceiptNVS . . . . . . . . . . . . . Non-Voting Shares
Schedule of Investments (unaudited) (continued)
November 30, 2021
iShares� ESG Aware MSCI EAFE ETF
37NM0122U-1995964-39/159

Security Shares
Value
Common StocksAerospace & Defense — 1.1%HEICO Corp., Class A . . . . . . . . . . . . . . . . . . . . . . . . . . . . . . . . 181,962 $ 22,599,680Howmet Aerospace Inc. . . . . . . . . . . . . . . . . . . . . . . . . . . . . . . . 791,758 22,272,153Huntington Ingalls Industries Inc. . . . . . . . . . . . . . . . . . . . . . . 278,783 49,486,770L3Harris Technologies Inc. . . . . . . . . . . . . . . . . . . . . . . . . . . . . 319,063 66,709,692Raytheon Technologies Corp. . . . . . . . . . . . . . . . . . . . . . . . . . 1,223,707 99,022,371
260,090,666Air Freight & Logistics — 0.9%CH Robinson Worldwide Inc. . . . . . . . . . . . . . . . . . . . . . . . . . . 480,337 45,675,245Expeditors International of Washington Inc. . . . . . . . . . . . . 694,133 84,420,456FedEx Corp.. . . . . . . . . . . . . . . . . . . . . . . . . . . . . . . . . . . . . . . . . . 105,441 24,290,443United Parcel Service Inc., Class B . . . . . . . . . . . . . . . . . . . . 360,782 71,568,325
225,954,469Auto Components — 0.3%Aptiv PLC(a) . . . . . . . . . . . . . . . . . . . . . . . . . . . . . . . . . . . . . . . . . . 382,994 61,413,088BorgWarner Inc. . . . . . . . . . . . . . . . . . . . . . . . . . . . . . . . . . . . . . . 530,075 22,941,646
84,354,734Automobiles — 2.5%General Motors Co.(a) . . . . . . . . . . . . . . . . . . . . . . . . . . . . . . . . . 456,926 26,442,307Tesla Inc.(a). . . . . . . . . . . . . . . . . . . . . . . . . . . . . . . . . . . . . . . . . . . 495,855 567,634,970
594,077,277Banks — 3.9%Bank of America Corp. . . . . . . . . . . . . . . . . . . . . . . . . . . . . . . . . 4,431,966 197,089,528Citigroup Inc. . . . . . . . . . . . . . . . . . . . . . . . . . . . . . . . . . . . . . . . . . 1,843,581 117,436,110Huntington Bancshares Inc./OH . . . . . . . . . . . . . . . . . . . . . . . 3,869,402 57,421,926JPMorgan Chase & Co. . . . . . . . . . . . . . . . . . . . . . . . . . . . . . . . 2,032,165 322,768,767PNC Financial Services Group Inc. (The) . . . . . . . . . . . . . . 194,876 38,390,572Regions Financial Corp.. . . . . . . . . . . . . . . . . . . . . . . . . . . . . . . 2,876,660 65,444,015SVB Financial Group(a) . . . . . . . . . . . . . . . . . . . . . . . . . . . . . . . 48,446 33,540,619Truist Financial Corp. . . . . . . . . . . . . . . . . . . . . . . . . . . . . . . . . . 1,130,055 67,023,562U.S. Bancorp. . . . . . . . . . . . . . . . . . . . . . . . . . . . . . . . . . . . . . . . . 589,721 32,635,160
931,750,259Beverages — 1.9%Brown-Forman Corp., Class B, NVS . . . . . . . . . . . . . . . . . . . 341,167 24,004,510Coca-Cola Co. (The). . . . . . . . . . . . . . . . . . . . . . . . . . . . . . . . . . 3,350,543 175,735,981Keurig Dr Pepper Inc. . . . . . . . . . . . . . . . . . . . . . . . . . . . . . . . . . 887,214 30,156,404Molson Coors Beverage Co., Class B. . . . . . . . . . . . . . . . . . 682,980 30,351,631PepsiCo Inc. . . . . . . . . . . . . . . . . . . . . . . . . . . . . . . . . . . . . . . . . . 1,202,286 192,101,257
452,349,783Biotechnology — 2.0%AbbVie Inc. . . . . . . . . . . . . . . . . . . . . . . . . . . . . . . . . . . . . . . . . . . . 865,476 99,772,073Amgen Inc. . . . . . . . . . . . . . . . . . . . . . . . . . . . . . . . . . . . . . . . . . . . 450,342 89,564,017Biogen Inc.(a) . . . . . . . . . . . . . . . . . . . . . . . . . . . . . . . . . . . . . . . . . 145,332 34,260,566Exact Sciences Corp.(a) . . . . . . . . . . . . . . . . . . . . . . . . . . . . . . . 291,959 24,924,540Gilead Sciences Inc. . . . . . . . . . . . . . . . . . . . . . . . . . . . . . . . . . . 1,177,600 81,171,968Moderna Inc.(a) . . . . . . . . . . . . . . . . . . . . . . . . . . . . . . . . . . . . . . . 186,963 65,891,370Regeneron Pharmaceuticals Inc.(a) . . . . . . . . . . . . . . . . . . . . 57,123 36,360,503Vertex Pharmaceuticals Inc.(a) . . . . . . . . . . . . . . . . . . . . . . . . . 245,118 45,822,359
477,767,396Building Products — 1.3%Allegion PLC . . . . . . . . . . . . . . . . . . . . . . . . . . . . . . . . . . . . . . . . . 183,815 22,726,887Carrier Global Corp. . . . . . . . . . . . . . . . . . . . . . . . . . . . . . . . . . . 798,196 43,198,367Fortune Brands Home & Security Inc.. . . . . . . . . . . . . . . . . . 261,798 26,318,553Johnson Controls International PLC . . . . . . . . . . . . . . . . . . . 1,466,930 109,667,687Lennox International Inc. . . . . . . . . . . . . . . . . . . . . . . . . . . . . . . 77,593 23,977,789Owens Corning . . . . . . . . . . . . . . . . . . . . . . . . . . . . . . . . . . . . . . . 274,670 23,303,003
Security Shares
Value
Building Products (continued)Trane Technologies PLC . . . . . . . . . . . . . . . . . . . . . . . . . . . . . . 395,440 $ 73,808,876
323,001,162Capital Markets — 3.7%Ameriprise Financial Inc. . . . . . . . . . . . . . . . . . . . . . . . . . . . . . . 81,820 23,695,072Bank of New York Mellon Corp. (The) . . . . . . . . . . . . . . . . . . 1,006,914 55,168,818BlackRock Inc.(b) . . . . . . . . . . . . . . . . . . . . . . . . . . . . . . . . . . . . . 150,435 136,085,005Cboe Global Markets Inc. . . . . . . . . . . . . . . . . . . . . . . . . . . . . . 191,165 24,648,815Charles Schwab Corp. (The) . . . . . . . . . . . . . . . . . . . . . . . . . . 608,308 47,076,956CME Group Inc. . . . . . . . . . . . . . . . . . . . . . . . . . . . . . . . . . . . . . . 224,782 49,568,927FactSet Research Systems Inc. . . . . . . . . . . . . . . . . . . . . . . . 53,746 25,183,763Goldman Sachs Group Inc. (The). . . . . . . . . . . . . . . . . . . . . . 252,895 96,350,466Intercontinental Exchange Inc. . . . . . . . . . . . . . . . . . . . . . . . . 407,132 53,220,295Moody's Corp. . . . . . . . . . . . . . . . . . . . . . . . . . . . . . . . . . . . . . . . . 112,935 44,116,928Morgan Stanley. . . . . . . . . . . . . . . . . . . . . . . . . . . . . . . . . . . . . . . 1,322,507 125,400,114Northern Trust Corp. . . . . . . . . . . . . . . . . . . . . . . . . . . . . . . . . . . 420,457 48,646,875S&P Global Inc. . . . . . . . . . . . . . . . . . . . . . . . . . . . . . . . . . . . . . . 139,387 63,522,838State Street Corp. . . . . . . . . . . . . . . . . . . . . . . . . . . . . . . . . . . . . 487,512 43,373,943T Rowe Price Group Inc. . . . . . . . . . . . . . . . . . . . . . . . . . . . . . . 235,021 46,992,449
883,051,264Chemicals — 1.9%Air Products & Chemicals Inc. . . . . . . . . . . . . . . . . . . . . . . . . . 83,718 24,063,902Corteva Inc. . . . . . . . . . . . . . . . . . . . . . . . . . . . . . . . . . . . . . . . . . . 508,696 22,891,320Dow Inc. . . . . . . . . . . . . . . . . . . . . . . . . . . . . . . . . . . . . . . . . . . . . . 688,919 37,842,321DuPont de Nemours Inc. . . . . . . . . . . . . . . . . . . . . . . . . . . . . . . 434,194 32,112,988Ecolab Inc. . . . . . . . . . . . . . . . . . . . . . . . . . . . . . . . . . . . . . . . . . . . 435,053 96,351,188International Flavors & Fragrances Inc. . . . . . . . . . . . . . . . . 234,083 33,279,580Linde PLC. . . . . . . . . . . . . . . . . . . . . . . . . . . . . . . . . . . . . . . . . . . . 370,332 117,817,423Mosaic Co. (The) . . . . . . . . . . . . . . . . . . . . . . . . . . . . . . . . . . . . . 673,769 23,056,375PPG Industries Inc. . . . . . . . . . . . . . . . . . . . . . . . . . . . . . . . . . . . 253,340 39,057,428Sherwin-Williams Co. (The) . . . . . . . . . . . . . . . . . . . . . . . . . . . 80,481 26,658,526
453,131,051Commercial Services & Supplies — 0.1%Copart Inc.(a) . . . . . . . . . . . . . . . . . . . . . . . . . . . . . . . . . . . . . . . . . 159,235 23,114,553
Communications Equipment — 0.9%Cisco Systems Inc. . . . . . . . . . . . . . . . . . . . . . . . . . . . . . . . . . . . 3,506,242 192,282,311Motorola Solutions Inc.. . . . . . . . . . . . . . . . . . . . . . . . . . . . . . . . 143,077 36,224,235
228,506,546Consumer Finance — 0.8%Ally Financial Inc. . . . . . . . . . . . . . . . . . . . . . . . . . . . . . . . . . . . . . 511,387 23,436,866American Express Co. . . . . . . . . . . . . . . . . . . . . . . . . . . . . . . . . 582,642 88,736,377Discover Financial Services . . . . . . . . . . . . . . . . . . . . . . . . . . . 347,666 37,495,778Synchrony Financial . . . . . . . . . . . . . . . . . . . . . . . . . . . . . . . . . . 805,808 36,092,140
185,761,161Containers & Packaging — 0.4%Amcor PLC. . . . . . . . . . . . . . . . . . . . . . . . . . . . . . . . . . . . . . . . . . . 3,682,737 41,688,583Ball Corp. . . . . . . . . . . . . . . . . . . . . . . . . . . . . . . . . . . . . . . . . . . . . 515,772 48,198,893
89,887,476Distributors — 0.2%LKQ Corp.. . . . . . . . . . . . . . . . . . . . . . . . . . . . . . . . . . . . . . . . . . . . 538,420 30,097,678Pool Corp.. . . . . . . . . . . . . . . . . . . . . . . . . . . . . . . . . . . . . . . . . . . . 42,923 23,784,493
53,882,171Diversified Financial Services — 0.4%Berkshire Hathaway Inc., Class B(a) . . . . . . . . . . . . . . . . . . . 348,495 96,425,082
Diversified Telecommunication Services — 1.0%AT&T Inc. . . . . . . . . . . . . . . . . . . . . . . . . . . . . . . . . . . . . . . . . . . . . 2,748,765 62,754,305Lumen Technologies Inc. . . . . . . . . . . . . . . . . . . . . . . . . . . . . . . 1,824,008 22,508,259
Schedule of Investments (unaudited)
November 30, 2021
iShares� ESG Aware MSCI USA ETF(Percentages shown are based on Net Assets)
38 NM0122U-1995964-40/159

Security Shares
Value
Diversified Telecommunication Services (continued)Verizon Communications Inc.. . . . . . . . . . . . . . . . . . . . . . . . . . 3,200,628 $ 160,895,569
246,158,133Electric Utilities — 1.5%Entergy Corp. . . . . . . . . . . . . . . . . . . . . . . . . . . . . . . . . . . . . . . . . 300,938 30,196,119Eversource Energy . . . . . . . . . . . . . . . . . . . . . . . . . . . . . . . . . . . 918,129 75,534,473Exelon Corp. . . . . . . . . . . . . . . . . . . . . . . . . . . . . . . . . . . . . . . . . . 938,935 49,510,042NextEra Energy Inc. . . . . . . . . . . . . . . . . . . . . . . . . . . . . . . . . . . 2,324,809 201,746,925
356,987,559Electrical Equipment — 0.3%Generac Holdings Inc.(a) . . . . . . . . . . . . . . . . . . . . . . . . . . . . . . 58,764 24,753,747Plug Power Inc.(a). . . . . . . . . . . . . . . . . . . . . . . . . . . . . . . . . . . . . 612,520 24,408,922Rockwell Automation Inc. . . . . . . . . . . . . . . . . . . . . . . . . . . . . . 71,952 24,190,263
73,352,932Electronic Equipment, Instruments & Components — 0.7%Cognex Corp. . . . . . . . . . . . . . . . . . . . . . . . . . . . . . . . . . . . . . . . . 312,567 24,145,801Keysight Technologies Inc.(a) . . . . . . . . . . . . . . . . . . . . . . . . . . 180,612 35,125,422Teledyne Technologies Inc.(a). . . . . . . . . . . . . . . . . . . . . . . . . . 55,183 22,916,948Trimble Inc.(a). . . . . . . . . . . . . . . . . . . . . . . . . . . . . . . . . . . . . . . . . 528,205 45,356,963Zebra Technologies Corp., Class A(a) . . . . . . . . . . . . . . . . . . 52,353 30,824,399
158,369,533Energy Equipment & Services — 0.4%Baker Hughes Co. . . . . . . . . . . . . . . . . . . . . . . . . . . . . . . . . . . . . 1,036,685 24,196,228Halliburton Co. . . . . . . . . . . . . . . . . . . . . . . . . . . . . . . . . . . . . . . . 1,087,794 23,485,472Schlumberger NV. . . . . . . . . . . . . . . . . . . . . . . . . . . . . . . . . . . . . 1,389,522 39,851,491
87,533,191Entertainment — 1.6%AMC Entertainment Holdings Inc., Class A(a) . . . . . . . . . . . 612,671 20,794,054Electronic Arts Inc. . . . . . . . . . . . . . . . . . . . . . . . . . . . . . . . . . . . . 180,563 22,429,536Netflix Inc.(a). . . . . . . . . . . . . . . . . . . . . . . . . . . . . . . . . . . . . . . . . . 224,704 144,237,497Roku Inc.(a). . . . . . . . . . . . . . . . . . . . . . . . . . . . . . . . . . . . . . . . . . . 105,098 23,921,356Walt Disney Co. (The)(a) . . . . . . . . . . . . . . . . . . . . . . . . . . . . . . 1,278,605 185,269,864
396,652,307Equity Real Estate Investment Trusts (REITs) — 2.6%Alexandria Real Estate Equities Inc. . . . . . . . . . . . . . . . . . . . 119,955 23,999,397American Tower Corp. . . . . . . . . . . . . . . . . . . . . . . . . . . . . . . . . 395,059 103,695,086Boston Properties Inc. . . . . . . . . . . . . . . . . . . . . . . . . . . . . . . . . 338,254 36,477,311Crown Castle International Corp. . . . . . . . . . . . . . . . . . . . . . . 351,592 63,866,687Equinix Inc.. . . . . . . . . . . . . . . . . . . . . . . . . . . . . . . . . . . . . . . . . . . 82,723 67,187,621Healthpeak Properties Inc. . . . . . . . . . . . . . . . . . . . . . . . . . . . . 1,445,881 47,511,650Iron Mountain Inc. . . . . . . . . . . . . . . . . . . . . . . . . . . . . . . . . . . . . 522,217 23,729,540Prologis Inc. . . . . . . . . . . . . . . . . . . . . . . . . . . . . . . . . . . . . . . . . . . 614,158 92,584,318SBA Communications Corp. . . . . . . . . . . . . . . . . . . . . . . . . . . . 71,820 24,691,716Simon Property Group Inc. . . . . . . . . . . . . . . . . . . . . . . . . . . . . 169,308 25,877,035Ventas Inc. . . . . . . . . . . . . . . . . . . . . . . . . . . . . . . . . . . . . . . . . . . . 643,501 30,193,067Welltower Inc. . . . . . . . . . . . . . . . . . . . . . . . . . . . . . . . . . . . . . . . . 538,403 42,867,647Weyerhaeuser Co.. . . . . . . . . . . . . . . . . . . . . . . . . . . . . . . . . . . . 1,352,189 50,855,828
633,536,903Food & Staples Retailing — 0.7%Costco Wholesale Corp. . . . . . . . . . . . . . . . . . . . . . . . . . . . . . . 171,295 92,393,097Kroger Co. (The) . . . . . . . . . . . . . . . . . . . . . . . . . . . . . . . . . . . . . 733,717 30,471,267Sysco Corp. . . . . . . . . . . . . . . . . . . . . . . . . . . . . . . . . . . . . . . . . . . 331,005 23,183,590Walgreens Boots Alliance Inc. . . . . . . . . . . . . . . . . . . . . . . . . . 518,688 23,237,223
169,285,177Food Products — 1.2%Archer-Daniels-Midland Co. . . . . . . . . . . . . . . . . . . . . . . . . . . . 694,397 43,198,437Bunge Ltd. . . . . . . . . . . . . . . . . . . . . . . . . . . . . . . . . . . . . . . . . . . . 370,095 32,039,124General Mills Inc. . . . . . . . . . . . . . . . . . . . . . . . . . . . . . . . . . . . . . 531,316 32,819,389Hormel Foods Corp. . . . . . . . . . . . . . . . . . . . . . . . . . . . . . . . . . . 873,137 36,147,872
Security Shares
Value
Food Products (continued)Kellogg Co.. . . . . . . . . . . . . . . . . . . . . . . . . . . . . . . . . . . . . . . . . . . 1,242,438 $ 76,012,357McCormick & Co. Inc./MD, NVS . . . . . . . . . . . . . . . . . . . . . . . 695,357 59,675,538
279,892,717Gas Utilities — 0.1%UGI Corp. . . . . . . . . . . . . . . . . . . . . . . . . . . . . . . . . . . . . . . . . . . . . 562,200 23,190,750
Health Care Equipment & Supplies — 2.3%Abbott Laboratories . . . . . . . . . . . . . . . . . . . . . . . . . . . . . . . . . . . 588,772 74,049,854ABIOMED Inc.(a). . . . . . . . . . . . . . . . . . . . . . . . . . . . . . . . . . . . . . 72,778 22,909,059Align Technology Inc.(a) . . . . . . . . . . . . . . . . . . . . . . . . . . . . . . . 42,495 25,986,967Becton Dickinson and Co.. . . . . . . . . . . . . . . . . . . . . . . . . . . . . 99,474 23,589,264Dexcom Inc.(a)(c) . . . . . . . . . . . . . . . . . . . . . . . . . . . . . . . . . . . . . . 77,247 43,458,390Edwards Lifesciences Corp.(a) . . . . . . . . . . . . . . . . . . . . . . . . . 652,471 70,016,663Hologic Inc.(a) . . . . . . . . . . . . . . . . . . . . . . . . . . . . . . . . . . . . . . . . 458,327 34,250,777IDEXX Laboratories Inc.(a) . . . . . . . . . . . . . . . . . . . . . . . . . . . . 102,741 62,473,720Insulet Corp.(a) . . . . . . . . . . . . . . . . . . . . . . . . . . . . . . . . . . . . . . . 137,442 39,643,771Intuitive Surgical Inc.(a) . . . . . . . . . . . . . . . . . . . . . . . . . . . . . . . . 180,641 58,589,102ResMed Inc.. . . . . . . . . . . . . . . . . . . . . . . . . . . . . . . . . . . . . . . . . . 148,839 37,931,619STERIS PLC . . . . . . . . . . . . . . . . . . . . . . . . . . . . . . . . . . . . . . . . . 238,896 52,205,943
545,105,129Health Care Providers & Services — 2.3%Anthem Inc. . . . . . . . . . . . . . . . . . . . . . . . . . . . . . . . . . . . . . . . . . . 164,618 66,872,770Centene Corp.(a). . . . . . . . . . . . . . . . . . . . . . . . . . . . . . . . . . . . . . 329,121 23,502,531Cigna Corp. . . . . . . . . . . . . . . . . . . . . . . . . . . . . . . . . . . . . . . . . . . 279,236 53,585,388CVS Health Corp.. . . . . . . . . . . . . . . . . . . . . . . . . . . . . . . . . . . . . 768,505 68,443,055DaVita Inc.(a) . . . . . . . . . . . . . . . . . . . . . . . . . . . . . . . . . . . . . . . . . 243,847 23,043,542HCA Healthcare Inc. . . . . . . . . . . . . . . . . . . . . . . . . . . . . . . . . . . 174,227 39,303,869Humana Inc. . . . . . . . . . . . . . . . . . . . . . . . . . . . . . . . . . . . . . . . . . 67,093 28,159,603Laboratory Corp. of America Holdings(a) . . . . . . . . . . . . . . . 93,375 26,642,689McKesson Corp.. . . . . . . . . . . . . . . . . . . . . . . . . . . . . . . . . . . . . . 109,825 23,805,667Quest Diagnostics Inc. . . . . . . . . . . . . . . . . . . . . . . . . . . . . . . . . 211,584 31,458,309UnitedHealth Group Inc. . . . . . . . . . . . . . . . . . . . . . . . . . . . . . . 405,914 180,315,117
565,132,540Health Care Technology — 0.3%Cerner Corp. . . . . . . . . . . . . . . . . . . . . . . . . . . . . . . . . . . . . . . . . . 655,095 46,151,443Teladoc Health Inc.(a)(c) . . . . . . . . . . . . . . . . . . . . . . . . . . . . . . . 199,957 20,245,646
66,397,089Hotels, Restaurants & Leisure — 1.7%Airbnb Inc., Class A(a) . . . . . . . . . . . . . . . . . . . . . . . . . . . . . . . . . 121,166 20,905,982Booking Holdings Inc.(a) . . . . . . . . . . . . . . . . . . . . . . . . . . . . . . . 21,500 45,189,775Caesars Entertainment Inc.(a) . . . . . . . . . . . . . . . . . . . . . . . . . 258,148 23,251,390Chipotle Mexican Grill Inc.(a) . . . . . . . . . . . . . . . . . . . . . . . . . . 13,940 22,909,135Darden Restaurants Inc. . . . . . . . . . . . . . . . . . . . . . . . . . . . . . . 169,969 23,447,224Hilton Worldwide Holdings Inc.(a) . . . . . . . . . . . . . . . . . . . . . . 392,600 53,028,482Marriott International Inc./MD, Class A(a) . . . . . . . . . . . . . . . 159,290 23,504,832McDonald's Corp.. . . . . . . . . . . . . . . . . . . . . . . . . . . . . . . . . . . . . 344,071 84,159,767MGM Resorts International . . . . . . . . . . . . . . . . . . . . . . . . . . . . 674,431 26,693,979Starbucks Corp. . . . . . . . . . . . . . . . . . . . . . . . . . . . . . . . . . . . . . . 483,281 52,986,929Vail Resorts Inc. . . . . . . . . . . . . . . . . . . . . . . . . . . . . . . . . . . . . . . 91,413 30,322,606
406,400,101Household Products — 1.6%Church & Dwight Co. Inc. . . . . . . . . . . . . . . . . . . . . . . . . . . . . . 271,416 24,259,162Clorox Co. (The). . . . . . . . . . . . . . . . . . . . . . . . . . . . . . . . . . . . . . 167,159 27,221,843Colgate-Palmolive Co. . . . . . . . . . . . . . . . . . . . . . . . . . . . . . . . . 1,193,058 89,503,211Kimberly-Clark Corp.. . . . . . . . . . . . . . . . . . . . . . . . . . . . . . . . . . 548,384 71,459,919Procter & Gamble Co. (The). . . . . . . . . . . . . . . . . . . . . . . . . . . 1,211,812 175,203,779
387,647,914Industrial Conglomerates — 1.3%3M Co. . . . . . . . . . . . . . . . . . . . . . . . . . . . . . . . . . . . . . . . . . . . . . . . 686,493 116,731,270
Schedule of Investments (unaudited) (continued)
November 30, 2021
iShares� ESG Aware MSCI USA ETF(Percentages shown are based on Net Assets)
39NM0122U-1995964-41/159

Security Shares
Value
Industrial Conglomerates (continued)General Electric Co . . . . . . . . . . . . . . . . . . . . . . . . . . . . . . . . . . . 424,883 $ 40,359,636Honeywell International Inc. . . . . . . . . . . . . . . . . . . . . . . . . . . . 558,831 113,017,981Roper Technologies Inc. . . . . . . . . . . . . . . . . . . . . . . . . . . . . . . 85,847 39,845,885
309,954,772Insurance — 1.5%American International Group Inc. . . . . . . . . . . . . . . . . . . . . . 736,905 38,761,203Chubb Ltd. . . . . . . . . . . . . . . . . . . . . . . . . . . . . . . . . . . . . . . . . . . . 249,822 44,835,554Hartford Financial Services Group Inc. (The) . . . . . . . . . . . 351,790 23,253,319Marsh & McLennan Companies Inc. . . . . . . . . . . . . . . . . . . . 456,547 74,882,839MetLife Inc.. . . . . . . . . . . . . . . . . . . . . . . . . . . . . . . . . . . . . . . . . . . 1,188,225 69,701,278Progressive Corp. (The). . . . . . . . . . . . . . . . . . . . . . . . . . . . . . . 273,348 25,404,963Prudential Financial Inc.. . . . . . . . . . . . . . . . . . . . . . . . . . . . . . . 406,953 41,615,014Travelers Companies Inc. (The) . . . . . . . . . . . . . . . . . . . . . . . 297,524 43,721,152
362,175,322Interactive Media & Services — 5.9%Alphabet Inc., Class A(a) . . . . . . . . . . . . . . . . . . . . . . . . . . . . . . 166,776 473,301,949Alphabet Inc., Class C, NVS(a). . . . . . . . . . . . . . . . . . . . . . . . . 167,476 477,145,823Meta Platforms Inc, Class A(a) . . . . . . . . . . . . . . . . . . . . . . . . . 1,235,581 400,896,611Snap Inc., Class A, NVS(a) . . . . . . . . . . . . . . . . . . . . . . . . . . . . 627,595 29,879,798Twitter Inc.(a) . . . . . . . . . . . . . . . . . . . . . . . . . . . . . . . . . . . . . . . . . 510,075 22,412,696ZoomInfo Technologies Inc., Class A(a). . . . . . . . . . . . . . . . . 320,078 19,748,813
1,423,385,690Internet & Direct Marketing Retail — 4.2%Amazon.com Inc.(a) . . . . . . . . . . . . . . . . . . . . . . . . . . . . . . . . . . . 261,351 916,576,252DoorDash Inc., Class A(a) . . . . . . . . . . . . . . . . . . . . . . . . . . . . . 108,200 19,342,914eBay Inc. . . . . . . . . . . . . . . . . . . . . . . . . . . . . . . . . . . . . . . . . . . . . . 406,287 27,408,121Etsy Inc.(a) . . . . . . . . . . . . . . . . . . . . . . . . . . . . . . . . . . . . . . . . . . . 85,497 23,475,766MercadoLibre Inc.(a) . . . . . . . . . . . . . . . . . . . . . . . . . . . . . . . . . . 30,061 35,724,793
1,022,527,846IT Services — 4.8%Accenture PLC, Class A. . . . . . . . . . . . . . . . . . . . . . . . . . . . . . . 347,105 124,055,327Akamai Technologies Inc.(a)(c) . . . . . . . . . . . . . . . . . . . . . . . . . 224,323 25,281,202Automatic Data Processing Inc. . . . . . . . . . . . . . . . . . . . . . . . 498,354 115,064,955Cloudflare Inc., Class A(a) . . . . . . . . . . . . . . . . . . . . . . . . . . . . . 119,637 22,520,469Fidelity National Information Services Inc.. . . . . . . . . . . . . . 264,735 27,664,808Fiserv Inc.(a) . . . . . . . . . . . . . . . . . . . . . . . . . . . . . . . . . . . . . . . . . . 303,635 29,306,850International Business Machines Corp. . . . . . . . . . . . . . . . . 922,561 108,031,893Mastercard Inc., Class A . . . . . . . . . . . . . . . . . . . . . . . . . . . . . . 531,897 167,505,003MongoDB Inc.(a) . . . . . . . . . . . . . . . . . . . . . . . . . . . . . . . . . . . . . . 43,713 21,773,445Okta Inc.(a) . . . . . . . . . . . . . . . . . . . . . . . . . . . . . . . . . . . . . . . . . . . 149,200 32,112,316PayPal Holdings Inc.(a) . . . . . . . . . . . . . . . . . . . . . . . . . . . . . . . . 689,872 127,550,434Snowflake Inc., Class A(a) . . . . . . . . . . . . . . . . . . . . . . . . . . . . . 131,454 44,714,078Square Inc., Class A(a)(c) . . . . . . . . . . . . . . . . . . . . . . . . . . . . . . 251,652 52,426,661Twilio Inc., Class A(a). . . . . . . . . . . . . . . . . . . . . . . . . . . . . . . . . . 160,309 45,872,421VeriSign Inc.(a). . . . . . . . . . . . . . . . . . . . . . . . . . . . . . . . . . . . . . . . 102,912 24,689,618Visa Inc., Class A . . . . . . . . . . . . . . . . . . . . . . . . . . . . . . . . . . . . . 1,030,932 199,763,694
1,168,333,174Leisure Products — 0.1%Hasbro Inc.. . . . . . . . . . . . . . . . . . . . . . . . . . . . . . . . . . . . . . . . . . . 361,547 35,037,520
Life Sciences Tools & Services — 2.3%Agilent Technologies Inc. . . . . . . . . . . . . . . . . . . . . . . . . . . . . . . 475,424 71,741,482Danaher Corp.. . . . . . . . . . . . . . . . . . . . . . . . . . . . . . . . . . . . . . . . 298,981 96,164,249Illumina Inc.(a) . . . . . . . . . . . . . . . . . . . . . . . . . . . . . . . . . . . . . . . . 123,933 45,276,443IQVIA Holdings Inc.(a) . . . . . . . . . . . . . . . . . . . . . . . . . . . . . . . . . 92,866 24,064,367Mettler-Toledo International Inc.(a) . . . . . . . . . . . . . . . . . . . . . 30,981 46,909,261Thermo Fisher Scientific Inc. . . . . . . . . . . . . . . . . . . . . . . . . . . 198,357 125,526,260Waters Corp.(a) . . . . . . . . . . . . . . . . . . . . . . . . . . . . . . . . . . . . . . . 169,633 55,651,498
Security Shares
Value
Life Sciences Tools & Services (continued)West Pharmaceutical Services Inc. . . . . . . . . . . . . . . . . . . . . 203,099 $ 89,903,803
555,237,363Machinery — 1.5%Caterpillar Inc. . . . . . . . . . . . . . . . . . . . . . . . . . . . . . . . . . . . . . . . . 385,107 74,460,438Cummins Inc.. . . . . . . . . . . . . . . . . . . . . . . . . . . . . . . . . . . . . . . . . 172,823 36,249,624Deere & Co. . . . . . . . . . . . . . . . . . . . . . . . . . . . . . . . . . . . . . . . . . . 172,962 59,765,290Dover Corp. . . . . . . . . . . . . . . . . . . . . . . . . . . . . . . . . . . . . . . . . . . 140,206 22,972,753IDEX Corp. . . . . . . . . . . . . . . . . . . . . . . . . . . . . . . . . . . . . . . . . . . . 183,319 41,171,614Illinois Tool Works Inc. . . . . . . . . . . . . . . . . . . . . . . . . . . . . . . . . 200,464 46,537,718Pentair PLC . . . . . . . . . . . . . . . . . . . . . . . . . . . . . . . . . . . . . . . . . . 345,092 25,429,829Xylem Inc./NY . . . . . . . . . . . . . . . . . . . . . . . . . . . . . . . . . . . . . . . . 525,608 63,656,385
370,243,651Media — 0.8%Cable One Inc. . . . . . . . . . . . . . . . . . . . . . . . . . . . . . . . . . . . . . . . 14,370 25,464,502Comcast Corp., Class A. . . . . . . . . . . . . . . . . . . . . . . . . . . . . . . 2,081,027 104,009,729Discovery Inc., Class C, NVS(a). . . . . . . . . . . . . . . . . . . . . . . . 946,488 21,494,743Interpublic Group of Companies Inc. (The) . . . . . . . . . . . . . 858,339 28,488,271ViacomCBS Inc., Class B, NVS. . . . . . . . . . . . . . . . . . . . . . . . 724,303 22,417,178
201,874,423Metals & Mining — 0.2%Newmont Corp.. . . . . . . . . . . . . . . . . . . . . . . . . . . . . . . . . . . . . . . 511,953 28,116,459Nucor Corp. . . . . . . . . . . . . . . . . . . . . . . . . . . . . . . . . . . . . . . . . . . 221,994 23,589,082
51,705,541Multi-Utilities — 0.7%Consolidated Edison Inc.. . . . . . . . . . . . . . . . . . . . . . . . . . . . . . 640,129 49,699,615Public Service Enterprise Group Inc.. . . . . . . . . . . . . . . . . . . 1,059,269 66,193,720Sempra Energy. . . . . . . . . . . . . . . . . . . . . . . . . . . . . . . . . . . . . . . 365,340 43,793,306
159,686,641Multiline Retail — 0.4%Target Corp. . . . . . . . . . . . . . . . . . . . . . . . . . . . . . . . . . . . . . . . . . . 381,827 93,104,696
Oil, Gas & Consumable Fuels — 2.3%Cheniere Energy Inc. . . . . . . . . . . . . . . . . . . . . . . . . . . . . . . . . . 231,413 24,254,397Chevron Corp.. . . . . . . . . . . . . . . . . . . . . . . . . . . . . . . . . . . . . . . . 908,818 102,578,288ConocoPhillips . . . . . . . . . . . . . . . . . . . . . . . . . . . . . . . . . . . . . . . 1,013,176 71,054,033EOG Resources Inc. . . . . . . . . . . . . . . . . . . . . . . . . . . . . . . . . . . 276,261 24,034,707Exxon Mobil Corp. . . . . . . . . . . . . . . . . . . . . . . . . . . . . . . . . . . . . 2,068,709 123,791,547Hess Corp. . . . . . . . . . . . . . . . . . . . . . . . . . . . . . . . . . . . . . . . . . . . 774,571 57,721,031Kinder Morgan Inc. . . . . . . . . . . . . . . . . . . . . . . . . . . . . . . . . . . . 1,532,887 23,698,433Marathon Petroleum Corp. . . . . . . . . . . . . . . . . . . . . . . . . . . . . 476,590 29,000,501Occidental Petroleum Corp. . . . . . . . . . . . . . . . . . . . . . . . . . . . 809,856 24,012,230ONEOK Inc. . . . . . . . . . . . . . . . . . . . . . . . . . . . . . . . . . . . . . . . . . . 390,653 23,376,675Phillips 66 . . . . . . . . . . . . . . . . . . . . . . . . . . . . . . . . . . . . . . . . . . . . 336,509 23,276,328Valero Energy Corp. . . . . . . . . . . . . . . . . . . . . . . . . . . . . . . . . . . 403,910 27,037,735
553,835,905Pharmaceuticals — 3.1%Bristol-Myers Squibb Co.. . . . . . . . . . . . . . . . . . . . . . . . . . . . . . 1,482,103 79,485,184Catalent Inc.(a). . . . . . . . . . . . . . . . . . . . . . . . . . . . . . . . . . . . . . . . 193,717 24,923,629Eli Lilly & Co. . . . . . . . . . . . . . . . . . . . . . . . . . . . . . . . . . . . . . . . . . 475,251 117,881,258Johnson & Johnson. . . . . . . . . . . . . . . . . . . . . . . . . . . . . . . . . . . 1,215,025 189,458,848Merck & Co. Inc. . . . . . . . . . . . . . . . . . . . . . . . . . . . . . . . . . . . . . . 1,696,724 127,101,595Pfizer Inc. . . . . . . . . . . . . . . . . . . . . . . . . . . . . . . . . . . . . . . . . . . . . 1,710,533 91,906,938Zoetis Inc. . . . . . . . . . . . . . . . . . . . . . . . . . . . . . . . . . . . . . . . . . . . . 481,102 106,823,888
737,581,340Professional Services — 0.6%IHS Markit Ltd. . . . . . . . . . . . . . . . . . . . . . . . . . . . . . . . . . . . . . . . 405,636 51,848,394Jacobs Engineering Group Inc. . . . . . . . . . . . . . . . . . . . . . . . . 168,472 24,017,368Leidos Holdings Inc. . . . . . . . . . . . . . . . . . . . . . . . . . . . . . . . . . . 351,701 30,918,035
Schedule of Investments (unaudited) (continued)
November 30, 2021
iShares� ESG Aware MSCI USA ETF(Percentages shown are based on Net Assets)
40 NM0122U-1995964-42/159

Security Shares
Value
Professional Services (continued)Robert Half International Inc. . . . . . . . . . . . . . . . . . . . . . . . . . . 288,723 $ 32,097,336
138,881,133Real Estate Management & Development — 0.2%CBRE Group Inc., Class A(a) . . . . . . . . . . . . . . . . . . . . . . . . . . 537,156 51,335,999
Road & Rail — 0.9%CSX Corp. . . . . . . . . . . . . . . . . . . . . . . . . . . . . . . . . . . . . . . . . . . . 981,503 34,018,894Kansas City Southern. . . . . . . . . . . . . . . . . . . . . . . . . . . . . . . . . 127,826 37,178,192Norfolk Southern Corp.. . . . . . . . . . . . . . . . . . . . . . . . . . . . . . . . 181,914 48,256,327Old Dominion Freight Line Inc. . . . . . . . . . . . . . . . . . . . . . . . . 70,334 24,980,527Uber Technologies Inc.(a). . . . . . . . . . . . . . . . . . . . . . . . . . . . . . 551,204 20,945,752Union Pacific Corp. . . . . . . . . . . . . . . . . . . . . . . . . . . . . . . . . . . . 235,484 55,489,449
220,869,141Semiconductors & Semiconductor Equipment — 6.5%Advanced Micro Devices Inc.(a). . . . . . . . . . . . . . . . . . . . . . . . 718,939 113,858,369Analog Devices Inc.. . . . . . . . . . . . . . . . . . . . . . . . . . . . . . . . . . . 190,936 34,416,214Applied Materials Inc. . . . . . . . . . . . . . . . . . . . . . . . . . . . . . . . . . 803,647 118,288,802Broadcom Inc. . . . . . . . . . . . . . . . . . . . . . . . . . . . . . . . . . . . . . . . . 90,203 49,943,597Enphase Energy Inc.(a). . . . . . . . . . . . . . . . . . . . . . . . . . . . . . . . 97,289 24,322,250Intel Corp. . . . . . . . . . . . . . . . . . . . . . . . . . . . . . . . . . . . . . . . . . . . . 2,969,828 146,115,538Lam Research Corp.. . . . . . . . . . . . . . . . . . . . . . . . . . . . . . . . . . 134,256 91,273,942Marvell Technology Inc. . . . . . . . . . . . . . . . . . . . . . . . . . . . . . . . 485,214 34,532,680Micron Technology Inc.. . . . . . . . . . . . . . . . . . . . . . . . . . . . . . . . 633,351 53,201,484NVIDIA Corp. . . . . . . . . . . . . . . . . . . . . . . . . . . . . . . . . . . . . . . . . . 1,554,981 508,105,592NXP Semiconductors NV. . . . . . . . . . . . . . . . . . . . . . . . . . . . . . 310,433 69,338,315ON Semiconductor Corp.(a) . . . . . . . . . . . . . . . . . . . . . . . . . . . 455,563 27,985,235QUALCOMM Inc. . . . . . . . . . . . . . . . . . . . . . . . . . . . . . . . . . . . . . 403,219 72,805,223Skyworks Solutions Inc. . . . . . . . . . . . . . . . . . . . . . . . . . . . . . . . 152,015 23,054,595Texas Instruments Inc. . . . . . . . . . . . . . . . . . . . . . . . . . . . . . . . . 918,768 176,743,400Xilinx Inc.. . . . . . . . . . . . . . . . . . . . . . . . . . . . . . . . . . . . . . . . . . . . . 112,530 25,707,478
1,569,692,714Software — 11.1%Adobe Inc.(a) . . . . . . . . . . . . . . . . . . . . . . . . . . . . . . . . . . . . . . . . . 343,277 229,944,098ANSYS Inc.(a) . . . . . . . . . . . . . . . . . . . . . . . . . . . . . . . . . . . . . . . . 116,114 45,456,309Autodesk Inc.(a). . . . . . . . . . . . . . . . . . . . . . . . . . . . . . . . . . . . . . . 176,600 44,889,954Bill.com Holdings Inc.(a) . . . . . . . . . . . . . . . . . . . . . . . . . . . . . . . 78,847 22,144,180Black Knight Inc.(a). . . . . . . . . . . . . . . . . . . . . . . . . . . . . . . . . . . . 344,433 24,616,627Cadence Design Systems Inc.(a). . . . . . . . . . . . . . . . . . . . . . . 201,239 35,711,873Coupa Software Inc.(a) . . . . . . . . . . . . . . . . . . . . . . . . . . . . . . . . 112,813 22,185,805Crowdstrike Holdings Inc., Class A(a) . . . . . . . . . . . . . . . . . . 107,651 23,375,338Datadog Inc., Class A(a) . . . . . . . . . . . . . . . . . . . . . . . . . . . . . . . 129,895 23,158,980DocuSign Inc.(a) . . . . . . . . . . . . . . . . . . . . . . . . . . . . . . . . . . . . . . 111,068 27,362,712HubSpot Inc.(a) . . . . . . . . . . . . . . . . . . . . . . . . . . . . . . . . . . . . . . . 39,232 31,656,693Intuit Inc. . . . . . . . . . . . . . . . . . . . . . . . . . . . . . . . . . . . . . . . . . . . . . 206,207 134,508,826Microsoft Corp. . . . . . . . . . . . . . . . . . . . . . . . . . . . . . . . . . . . . . . . 4,311,100 1,425,206,549Nuance Communications Inc.(a) . . . . . . . . . . . . . . . . . . . . . . . 446,571 24,780,225Oracle Corp. . . . . . . . . . . . . . . . . . . . . . . . . . . . . . . . . . . . . . . . . . 755,600 68,563,144Paycom Software Inc.(a). . . . . . . . . . . . . . . . . . . . . . . . . . . . . . . 53,302 23,318,559PTC Inc.(a) . . . . . . . . . . . . . . . . . . . . . . . . . . . . . . . . . . . . . . . . . . . 211,123 23,134,858RingCentral Inc., Class A(a). . . . . . . . . . . . . . . . . . . . . . . . . . . . 101,726 21,970,781salesforce.com Inc.(a) . . . . . . . . . . . . . . . . . . . . . . . . . . . . . . . . . 639,265 182,164,954ServiceNow Inc.(a) . . . . . . . . . . . . . . . . . . . . . . . . . . . . . . . . . . . . 154,809 100,269,789Splunk Inc.(a) . . . . . . . . . . . . . . . . . . . . . . . . . . . . . . . . . . . . . . . . . 182,255 22,052,855Synopsys Inc.(a) . . . . . . . . . . . . . . . . . . . . . . . . . . . . . . . . . . . . . . 99,824 34,039,984VMware Inc., Class A . . . . . . . . . . . . . . . . . . . . . . . . . . . . . . . . . 244,436 28,535,459
Security Shares
Value
Software (continued)Workday Inc., Class A(a). . . . . . . . . . . . . . . . . . . . . . . . . . . . . . . 127,782 $ 35,041,658Zoom Video Communications Inc., Class A(a) . . . . . . . . . . 97,022 20,511,421
2,674,601,631Specialty Retail — 2.5%Best Buy Co. Inc. . . . . . . . . . . . . . . . . . . . . . . . . . . . . . . . . . . . . . 401,000 42,850,860CarMax Inc.(a) . . . . . . . . . . . . . . . . . . . . . . . . . . . . . . . . . . . . . . . . 169,534 23,946,677Home Depot Inc. (The). . . . . . . . . . . . . . . . . . . . . . . . . . . . . . . . 730,453 292,626,776Lowe's Companies Inc. . . . . . . . . . . . . . . . . . . . . . . . . . . . . . . . 537,079 131,364,153Ross Stores Inc. . . . . . . . . . . . . . . . . . . . . . . . . . . . . . . . . . . . . . . 207,470 22,632,902TJX Companies Inc. (The) . . . . . . . . . . . . . . . . . . . . . . . . . . . . 589,742 40,928,095Tractor Supply Co. . . . . . . . . . . . . . . . . . . . . . . . . . . . . . . . . . . . . 120,838 27,228,427Ulta Beauty Inc.(a) . . . . . . . . . . . . . . . . . . . . . . . . . . . . . . . . . . . . 61,143 23,475,855
605,053,745Technology Hardware, Storage & Peripherals — 6.8%Apple Inc. . . . . . . . . . . . . . . . . . . . . . . . . . . . . . . . . . . . . . . . . . . . . 9,378,207 1,550,217,617Hewlett Packard Enterprise Co. . . . . . . . . . . . . . . . . . . . . . . . 2,328,654 33,416,185HP Inc. . . . . . . . . . . . . . . . . . . . . . . . . . . . . . . . . . . . . . . . . . . . . . . . 1,101,498 38,860,850Seagate Technology Holdings PLC . . . . . . . . . . . . . . . . . . . . 244,527 25,105,587
1,647,600,239Textiles, Apparel & Luxury Goods — 0.8%Lululemon Athletica Inc.(a) . . . . . . . . . . . . . . . . . . . . . . . . . . . . . 67,909 30,858,529Nike Inc., Class B. . . . . . . . . . . . . . . . . . . . . . . . . . . . . . . . . . . . . 756,815 128,083,371VF Corp. . . . . . . . . . . . . . . . . . . . . . . . . . . . . . . . . . . . . . . . . . . . . . 523,877 37,577,697
196,519,597Trading Companies & Distributors — 0.4%Fastenal Co. . . . . . . . . . . . . . . . . . . . . . . . . . . . . . . . . . . . . . . . . . 492,601 29,147,201WW Grainger Inc.. . . . . . . . . . . . . . . . . . . . . . . . . . . . . . . . . . . . . 149,625 72,030,971
101,178,172
Total Common Stocks — 99.5%(Cost: $19,650,064,484) . . . . . . . . . . . . . . . . . . . . . . . . . . . . . . . . . . . . . . . . 24,009,163,280
Short-Term InvestmentsMoney Market Funds — 0.6%BlackRock Cash Funds: Institutional, SL Agency
Shares, 0.06%(b)(d)(e) . . . . . . . . . . . . . . . . . . . . . . . . . . . . . . . 56,826,847 56,849,578BlackRock Cash Funds: Treasury, SL Agency Shares,
0.00%(b)(d) . . . . . . . . . . . . . . . . . . . . . . . . . . . . . . . . . . . . . . . . . 74,698,000 74,698,000
131,547,578
Total Short-Term Investments — 0.6%(Cost: $131,546,631) . . . . . . . . . . . . . . . . . . . . . . . . . . . . . . . . . . . . . . . . . . . 131,547,578
Total Investments in Securities — 100.1%(Cost: $19,781,611,115) . . . . . . . . . . . . . . . . . . . . . . . . . . . . . . . . . . . . . . . . 24,140,710,858
Other Assets, Less Liabilities — (0.1)%. . . . . . . . . . . . . . . . . . . . . . . . . . . (17,614,251)
Net Assets — 100.0% . . . . . . . . . . . . . . . . . . . . . . . . . . . . . . . . . . . . . . . . . . . . . $ 24,123,096,607 (a) Non-income producing security.(b) Affiliate of the Fund.(c) All or a portion of this security is on loan.(d) Annualized 7-day yield as of period end.(e) All or a portion of this security was purchased with the cash collateral from loaned
securities.
Schedule of Investments (unaudited) (continued)
November 30, 2021
iShares� ESG Aware MSCI USA ETF(Percentages shown are based on Net Assets)
41NM0122U-1995964-43/159

Affiliates
Investments in issuers considered to be affiliate(s) of the Fund during the period ended November 30, 2021 for purposes of Section 2(a)(3) of the Investment Company Actof 1940, as amended, were as follows:
Affiliated IssuerValue at
08/31/21Purchases
at CostProceeds
from SalesNet Realized
Gain (Loss)
Change inUnrealized
Appreciation(Depreciation)
Value at11/30/21
SharesHeld at
11/30/21 Income
CapitalGain
Distributionsfrom
UnderlyingFunds
BlackRock Cash Funds: Institutional, SLAgency Shares. . . . . . . . . . . . . . . . . . . . . . . $ 47,556,080 $ 9,298,700(a) $ — $ (5,135) $ (67) $ 56,849,578 56,826,847 $ 69,443(b) $ —
BlackRock Cash Funds: Treasury, SLAgency Shares. . . . . . . . . . . . . . . . . . . . . . . 84,248,000 — (9,550,000)(a)
— — 74,698,000 74,698,000 812 —BlackRock Inc.. . . . . . . . . . . . . . . . . . . . . . . . . . 124,336,941 17,763,166 (872,882) 433,862 (5,576,082) 136,085,005 150,435 548,096 —
$ 428,727 $ (5,576,149) $267,632,583 $618,351 $ —
(a) Represents net amount purchased (sold).(b) All or a portion represents securities lending income earned from the reinvestment of cash collateral from loaned securities, net of fees and collateral investment expenses, and other
payments to and from borrowers of securities.
Derivative Financial Instruments Outstanding as of Period End
Futures Contracts
DescriptionNumber ofContracts
ExpirationDate
NotionalAmount
(000)
Value/Unrealized
Appreciation(Depreciation)
Long ContractsS&P 500 E-Mini Index . . . . . . . . . . . . . . . . . . . . . . . . . . . . . . . . . . . . . . . . . . . . . . . . . . . . . . . . . . . . . . . . . . . . . . . . . . . . . . . . . . . . . . . . . . . . . . 463 12/17/21 $105,709 $ 415,195
Fair Value Measurements
Various inputs are used in determining the fair value of financial instruments. These inputs to valuation techniques are categorized into a fair value hierarchy consisting ofthree broad levels for financial reporting purposes as follows:
• Level 1 – Unadjusted price quotations in active markets/exchanges for identical assets or liabilities that each Fund has the ability to access;• Level 2 – Other observable inputs (including, but not limited to, quoted prices for similar assets or liabilities in markets that are active, quoted prices for identical or
similar assets or liabilities in markets that are not active, inputs other than quoted prices that are observable for the assets or liabilities (such as interest rates, yieldcurves, volatilities, prepayment speeds, loss severities, credit risks and default rates) or other market-corroborated inputs); and
• Level 3 – Unobservable inputs based on the best information available in the circumstances, to the extent observable inputs are not available (including the BlackRockGlobal Valuation Methodologies Committee’s (the “Global Valuation Committee’s”) assumptions used in determining the fair value of financial instruments).
The hierarchy gives the highest priority to unadjusted quoted prices in active markets for identical assets or liabilities (Level 1 measurements) and the lowest priority tounobservable inputs (Level 3 measurements). Accordingly, the degree of judgment exercised in determining fair value is greatest for instruments categorized in Level 3. Theinputs used to measure fair value may fall into different levels of the fair value hierarchy. In such cases, for disclosure purposes, the fair value hierarchy classification isdetermined based on the lowest level input that is significant to the fair value measurement in its entirety. Investments classified within Level 3 have significant unobservableinputs used by the Global Valuation Committee in determining the price for Fair Valued Investments. Level 3 investments include equity or debt issued by privately heldcompanies or funds. There may not be a secondary market, and/or there are a limited number of investors. The categorization of a value determined for financial instrumentsis based on the pricing transparency of the financial instruments and is not necessarily an indication of the risks associated with investing in those securities. For informationabout the Fund’s policy regarding valuation of financial instruments, refer to its most recent financial statements.
Schedule of Investments (unaudited) (continued)
November 30, 2021
iShares� ESG Aware MSCI USA ETF
42 NM0122U-1995964-44/159

Fair Value Measurements (continued)
The following table summarizes the Fund’s financial instruments categorized in the fair value hierarchy. The breakdown of the Fund’s financial instruments into majorcategories is disclosed in the Schedule of Investments above.
Level 1 Level 2 Level 3 Total
InvestmentsAssets
Common Stocks. . . . . . . . . . . . . . . . . . . . . . . . . . . . . . . . . . . . . . . . . . . . . . . . . . . . . . . . . . . . . . . . . . . . . . . . $24,009,163,280 $ — $ — $24,009,163,280Money Market Funds . . . . . . . . . . . . . . . . . . . . . . . . . . . . . . . . . . . . . . . . . . . . . . . . . . . . . . . . . . . . . . . . . . . 131,547,578 — — 131,547,578
$24,140,710,858 $ — $ — $24,140,710,858
Derivative financial instruments(a)
AssetsFutures Contracts . . . . . . . . . . . . . . . . . . . . . . . . . . . . . . . . . . . . . . . . . . . . . . . . . . . . . . . . . . . . . . . . . . . . . . $ 415,195 $ — $ — $ 415,195
(a) Derivative financial instruments are futures contracts. Futures contracts are valued at the unrealized appreciation (depreciation) on the instrument.
Portfolio Abbreviations - Equity
NVS . . . . . . . . . . . . . Non-Voting Shares
Schedule of Investments (unaudited) (continued)
November 30, 2021
iShares� ESG Aware MSCI USA ETF
43NM0122U-1995964-45/159

Security Shares
Value
Common StocksAerospace & Defense — 1.6%AAR Corp.(a). . . . . . . . . . . . . . . . . . . . . . . . . . . . . . . . . . . . . . . . . . . 18,591 $ 607,182Aerovironment Inc.(a) . . . . . . . . . . . . . . . . . . . . . . . . . . . . . . . . . . . 7,512 606,669Axon Enterprise Inc.(a) . . . . . . . . . . . . . . . . . . . . . . . . . . . . . . . . . 19,443 3,281,784BWX Technologies Inc.. . . . . . . . . . . . . . . . . . . . . . . . . . . . . . . . . 52,741 2,515,746Curtiss-Wright Corp. . . . . . . . . . . . . . . . . . . . . . . . . . . . . . . . . . . . 16,247 2,044,197Ducommun Inc.(a) . . . . . . . . . . . . . . . . . . . . . . . . . . . . . . . . . . . . . . 14,325 608,956Hexcel Corp.(a) . . . . . . . . . . . . . . . . . . . . . . . . . . . . . . . . . . . . . . . . 27,635 1,419,886Kaman Corp. . . . . . . . . . . . . . . . . . . . . . . . . . . . . . . . . . . . . . . . . . . 22,005 814,185Kratos Defense & Security Solutions Inc.(a) . . . . . . . . . . . . . . 46,090 908,434Maxar Technologies Inc.. . . . . . . . . . . . . . . . . . . . . . . . . . . . . . . . 28,162 775,300Mercury Systems Inc.(a) . . . . . . . . . . . . . . . . . . . . . . . . . . . . . . . . 37,038 1,813,010Moog Inc., Class A . . . . . . . . . . . . . . . . . . . . . . . . . . . . . . . . . . . . . 15,695 1,085,623PAE Inc.(a) . . . . . . . . . . . . . . . . . . . . . . . . . . . . . . . . . . . . . . . . . . . . . 66,993 664,570Spirit AeroSystems Holdings Inc., Class A . . . . . . . . . . . . . . . 14,701 556,580Vectrus Inc.(a). . . . . . . . . . . . . . . . . . . . . . . . . . . . . . . . . . . . . . . . . . 18,252 763,664Virgin Galactic Holdings Inc.(a)(b) . . . . . . . . . . . . . . . . . . . . . . . . 55,669 890,704
19,356,490Air Freight & Logistics — 0.3%GXO Logistics Inc.(a) . . . . . . . . . . . . . . . . . . . . . . . . . . . . . . . . . . . 30,262 2,906,665Hub Group Inc., Class A(a). . . . . . . . . . . . . . . . . . . . . . . . . . . . . . 13,697 1,063,846
3,970,511Airlines — 0.2%Alaska Air Group Inc.(a). . . . . . . . . . . . . . . . . . . . . . . . . . . . . . . . . 35,899 1,743,614JetBlue Airways Corp.(a) . . . . . . . . . . . . . . . . . . . . . . . . . . . . . . . . 47,238 633,934
2,377,548Auto Components — 1.2%Adient PLC(a) . . . . . . . . . . . . . . . . . . . . . . . . . . . . . . . . . . . . . . . . . . 16,229 688,921American Axle & Manufacturing Holdings Inc.(a)(b) . . . . . . . 70,059 620,723Autoliv Inc. . . . . . . . . . . . . . . . . . . . . . . . . . . . . . . . . . . . . . . . . . . . . 15,196 1,464,742Dana Inc. . . . . . . . . . . . . . . . . . . . . . . . . . . . . . . . . . . . . . . . . . . . . . . 50,239 1,080,138Dorman Products Inc.(a) . . . . . . . . . . . . . . . . . . . . . . . . . . . . . . . . 7,284 808,378Fox Factory Holding Corp.(a). . . . . . . . . . . . . . . . . . . . . . . . . . . . 9,220 1,620,599Gentex Corp. . . . . . . . . . . . . . . . . . . . . . . . . . . . . . . . . . . . . . . . . . . 20,204 695,624Gentherm Inc.(a) . . . . . . . . . . . . . . . . . . . . . . . . . . . . . . . . . . . . . . . 23,028 1,944,715Goodyear Tire & Rubber Co. (The)(a). . . . . . . . . . . . . . . . . . . . 51,269 1,031,020LCI Industries. . . . . . . . . . . . . . . . . . . . . . . . . . . . . . . . . . . . . . . . . . 10,332 1,573,254Luminar Technologies Inc.(a) . . . . . . . . . . . . . . . . . . . . . . . . . . . . 42,072 685,774Modine Manufacturing Co.(a) . . . . . . . . . . . . . . . . . . . . . . . . . . . 56,634 586,728Veoneer Inc.(a) . . . . . . . . . . . . . . . . . . . . . . . . . . . . . . . . . . . . . . . . . 28,905 1,029,018Visteon Corp.(a) . . . . . . . . . . . . . . . . . . . . . . . . . . . . . . . . . . . . . . . . 6,827 723,116XPEL Inc.(a) . . . . . . . . . . . . . . . . . . . . . . . . . . . . . . . . . . . . . . . . . . . 8,837 635,292
15,188,042Automobiles — 0.5%Canoo Inc.(a)(b). . . . . . . . . . . . . . . . . . . . . . . . . . . . . . . . . . . . . . . . . 69,115 827,307Fisker Inc.(a) . . . . . . . . . . . . . . . . . . . . . . . . . . . . . . . . . . . . . . . . . . . 33,499 716,544Harley-Davidson Inc. . . . . . . . . . . . . . . . . . . . . . . . . . . . . . . . . . . . 49,626 1,817,800Thor Industries Inc. . . . . . . . . . . . . . . . . . . . . . . . . . . . . . . . . . . . . 16,821 1,778,148Winnebago Industries Inc. . . . . . . . . . . . . . . . . . . . . . . . . . . . . . . 9,160 661,535Workhorse Group Inc.(a)(b) . . . . . . . . . . . . . . . . . . . . . . . . . . . . . . 104,811 612,096
6,413,430Banks — 7.5%Amalgamated Financial Corp. . . . . . . . . . . . . . . . . . . . . . . . . . . 42,321 716,071Amerant Bancorp Inc.(a)(b) . . . . . . . . . . . . . . . . . . . . . . . . . . . . . . 22,451 631,996Ameris Bancorp. . . . . . . . . . . . . . . . . . . . . . . . . . . . . . . . . . . . . . . . 28,965 1,409,726Associated Banc-Corp. . . . . . . . . . . . . . . . . . . . . . . . . . . . . . . . . . 34,287 750,885Atlantic Union Bankshares Corp.. . . . . . . . . . . . . . . . . . . . . . . . 51,578 1,676,801Bancorp. Inc. (The)(a) . . . . . . . . . . . . . . . . . . . . . . . . . . . . . . . . . . 21,386 604,582
Security Shares
Value
Banks (continued)Bank of Hawaii Corp.. . . . . . . . . . . . . . . . . . . . . . . . . . . . . . . . . . . 21,342 $ 1,702,665Bank OZK . . . . . . . . . . . . . . . . . . . . . . . . . . . . . . . . . . . . . . . . . . . . . 60,942 2,724,717Banner Corp. . . . . . . . . . . . . . . . . . . . . . . . . . . . . . . . . . . . . . . . . . . 17,063 977,369Berkshire Hills Bancorp. Inc.. . . . . . . . . . . . . . . . . . . . . . . . . . . . 21,445 572,796BOK Financial Corp. . . . . . . . . . . . . . . . . . . . . . . . . . . . . . . . . . . . 14,031 1,448,139Cadence Bank. . . . . . . . . . . . . . . . . . . . . . . . . . . . . . . . . . . . . . . . . 56,003 1,636,408Camden National Corp. . . . . . . . . . . . . . . . . . . . . . . . . . . . . . . . . 23,644 1,083,368Cathay General Bancorp. . . . . . . . . . . . . . . . . . . . . . . . . . . . . . . 21,591 904,879CIT Group Inc. . . . . . . . . . . . . . . . . . . . . . . . . . . . . . . . . . . . . . . . . . 17,952 880,725Columbia Banking System Inc. . . . . . . . . . . . . . . . . . . . . . . . . . 16,689 548,400Comerica Inc.. . . . . . . . . . . . . . . . . . . . . . . . . . . . . . . . . . . . . . . . . . 61,192 5,050,176Commerce Bancshares Inc. . . . . . . . . . . . . . . . . . . . . . . . . . . . . 35,255 2,460,799Community Bank System Inc. . . . . . . . . . . . . . . . . . . . . . . . . . . 17,498 1,236,409Community Trust Bancorp. Inc. . . . . . . . . . . . . . . . . . . . . . . . . . 19,719 828,198Cullen/Frost Bankers Inc.. . . . . . . . . . . . . . . . . . . . . . . . . . . . . . . 13,815 1,739,170East West Bancorp. Inc.. . . . . . . . . . . . . . . . . . . . . . . . . . . . . . . . 34,225 2,635,325Eastern Bankshares Inc. . . . . . . . . . . . . . . . . . . . . . . . . . . . . . . . 66,983 1,348,368First Busey Corp. . . . . . . . . . . . . . . . . . . . . . . . . . . . . . . . . . . . . . . 32,976 847,483First Financial Bancorp. . . . . . . . . . . . . . . . . . . . . . . . . . . . . . . . . 32,888 756,424First Hawaiian Inc. . . . . . . . . . . . . . . . . . . . . . . . . . . . . . . . . . . . . . 58,439 1,534,024First Horizon Corp. . . . . . . . . . . . . . . . . . . . . . . . . . . . . . . . . . . . . . 149,167 2,406,064First Interstate BancSystem Inc., Class A . . . . . . . . . . . . . . . 28,571 1,165,697First of Long Island Corp. (The). . . . . . . . . . . . . . . . . . . . . . . . . 34,106 714,521FNB Corp. . . . . . . . . . . . . . . . . . . . . . . . . . . . . . . . . . . . . . . . . . . . . . 96,533 1,125,575Fulton Financial Corp.. . . . . . . . . . . . . . . . . . . . . . . . . . . . . . . . . . 89,714 1,416,584Glacier Bancorp. Inc.. . . . . . . . . . . . . . . . . . . . . . . . . . . . . . . . . . . 28,287 1,535,984Great Western Bancorp. Inc. . . . . . . . . . . . . . . . . . . . . . . . . . . . 16,876 566,190Hancock Whitney Corp. . . . . . . . . . . . . . . . . . . . . . . . . . . . . . . . . 36,292 1,734,032Heritage Financial Corp./WA . . . . . . . . . . . . . . . . . . . . . . . . . . . 26,325 616,795HomeStreet Inc. . . . . . . . . . . . . . . . . . . . . . . . . . . . . . . . . . . . . . . . 14,404 711,125Independent Bank Corp. . . . . . . . . . . . . . . . . . . . . . . . . . . . . . . . 11,994 948,246Independent Bank Corp./MI . . . . . . . . . . . . . . . . . . . . . . . . . . . . 33,154 747,623International Bancshares Corp. . . . . . . . . . . . . . . . . . . . . . . . . . 33,166 1,393,304Live Oak Bancshares Inc. . . . . . . . . . . . . . . . . . . . . . . . . . . . . . . 8,814 785,327National Bank Holdings Corp., Class A . . . . . . . . . . . . . . . . . . 15,973 680,769OceanFirst Financial Corp. . . . . . . . . . . . . . . . . . . . . . . . . . . . . . 34,958 720,484PacWest Bancorp. . . . . . . . . . . . . . . . . . . . . . . . . . . . . . . . . . . . . . 16,059 718,480Park National Corp. . . . . . . . . . . . . . . . . . . . . . . . . . . . . . . . . . . . . 6,222 809,420People's United Financial Inc. . . . . . . . . . . . . . . . . . . . . . . . . . . 156,813 2,672,093Pinnacle Financial Partners Inc. . . . . . . . . . . . . . . . . . . . . . . . . 26,139 2,493,922Popular Inc. . . . . . . . . . . . . . . . . . . . . . . . . . . . . . . . . . . . . . . . . . . . 18,245 1,419,826Prosperity Bancshares Inc. . . . . . . . . . . . . . . . . . . . . . . . . . . . . . 10,114 720,926QCR Holdings Inc. . . . . . . . . . . . . . . . . . . . . . . . . . . . . . . . . . . . . . 12,925 697,174Sandy Spring Bancorp. Inc. . . . . . . . . . . . . . . . . . . . . . . . . . . . . 27,859 1,307,423Seacoast Banking Corp. of Florida . . . . . . . . . . . . . . . . . . . . . . 21,625 730,276ServisFirst Bancshares Inc. . . . . . . . . . . . . . . . . . . . . . . . . . . . . 17,352 1,394,927Silvergate Capital Corp., Class A(a) . . . . . . . . . . . . . . . . . . . . . 6,610 1,351,613South State Corp.. . . . . . . . . . . . . . . . . . . . . . . . . . . . . . . . . . . . . . 17,269 1,349,400Southside Bancshares Inc. . . . . . . . . . . . . . . . . . . . . . . . . . . . . . 14,310 583,132Synovus Financial Corp. . . . . . . . . . . . . . . . . . . . . . . . . . . . . . . . 69,065 3,127,954Texas Capital Bancshares Inc.(a). . . . . . . . . . . . . . . . . . . . . . . . 12,081 680,402TriState Capital Holdings Inc.(a) . . . . . . . . . . . . . . . . . . . . . . . . . 22,815 682,397Triumph Bancorp. Inc.(a). . . . . . . . . . . . . . . . . . . . . . . . . . . . . . . . 5,905 752,002Trustmark Corp. . . . . . . . . . . . . . . . . . . . . . . . . . . . . . . . . . . . . . . . 23,223 710,856Umpqua Holdings Corp. . . . . . . . . . . . . . . . . . . . . . . . . . . . . . . . . 98,181 1,871,330United Community Banks Inc./GA. . . . . . . . . . . . . . . . . . . . . . . 20,241 693,659Valley National Bancorp. . . . . . . . . . . . . . . . . . . . . . . . . . . . . . . . 175,873 2,363,733Webster Financial Corp.. . . . . . . . . . . . . . . . . . . . . . . . . . . . . . . . 45,486 2,451,240Western Alliance Bancorp. . . . . . . . . . . . . . . . . . . . . . . . . . . . . . 30,982 3,401,204Wintrust Financial Corp. . . . . . . . . . . . . . . . . . . . . . . . . . . . . . . . . 22,458 1,965,749
Schedule of Investments (unaudited)
November 30, 2021
iShares� ESG Aware MSCI USA Small-Cap ETF(Percentages shown are based on Net Assets)
44 NM0122U-1995964-46/159

Security Shares
Value
Banks (continued)Zions Bancorp. NA. . . . . . . . . . . . . . . . . . . . . . . . . . . . . . . . . . . . . 77,566 $ 4,892,863
93,816,224Beverages — 0.1%Celsius Holdings Inc.(a)(b). . . . . . . . . . . . . . . . . . . . . . . . . . . . . . . 8,647 591,541MGP Ingredients Inc.. . . . . . . . . . . . . . . . . . . . . . . . . . . . . . . . . . . 8,970 699,481
1,291,022Biotechnology — 5.2%2seventy bio Inc.(a)(b). . . . . . . . . . . . . . . . . . . . . . . . . . . . . . . . . . . 1 26ACADIA Pharmaceuticals Inc.(a) . . . . . . . . . . . . . . . . . . . . . . . . 35,932 689,894Agios Pharmaceuticals Inc.(a) . . . . . . . . . . . . . . . . . . . . . . . . . . . 17,451 621,605Alder Biopharmaceuticals Inc.(b)(c) . . . . . . . . . . . . . . . . . . . . . . 3,497 3,077Alector Inc.(a) . . . . . . . . . . . . . . . . . . . . . . . . . . . . . . . . . . . . . . . . . . 30,251 624,683Alkermes PLC(a) . . . . . . . . . . . . . . . . . . . . . . . . . . . . . . . . . . . . . . . 28,430 623,186Allakos Inc.(a) . . . . . . . . . . . . . . . . . . . . . . . . . . . . . . . . . . . . . . . . . . 9,563 749,261Allogene Therapeutics Inc.(a) . . . . . . . . . . . . . . . . . . . . . . . . . . . 39,795 735,810Amicus Therapeutics Inc.(a). . . . . . . . . . . . . . . . . . . . . . . . . . . . . 58,397 625,432AnaptysBio Inc.(a) . . . . . . . . . . . . . . . . . . . . . . . . . . . . . . . . . . . . . . 21,252 687,502Anavex Life Sciences Corp.(a) . . . . . . . . . . . . . . . . . . . . . . . . . . 33,212 644,313Apellis Pharmaceuticals Inc.(a) . . . . . . . . . . . . . . . . . . . . . . . . . . 18,878 794,386Arcturus Therapeutics Holdings Inc.(a). . . . . . . . . . . . . . . . . . . 17,637 701,071Arcus Biosciences Inc.(a)(b) . . . . . . . . . . . . . . . . . . . . . . . . . . . . . 15,332 671,542Arena Pharmaceuticals Inc.(a) . . . . . . . . . . . . . . . . . . . . . . . . . . 23,900 1,302,311Arrowhead Pharmaceuticals Inc.(a). . . . . . . . . . . . . . . . . . . . . . 27,390 1,918,669Atara Biotherapeutics Inc.(a) . . . . . . . . . . . . . . . . . . . . . . . . . . . . 43,790 783,403Aurinia Pharmaceuticals Inc.(a) . . . . . . . . . . . . . . . . . . . . . . . . . 27,339 515,067Avid Bioservices Inc.(a) . . . . . . . . . . . . . . . . . . . . . . . . . . . . . . . . . 19,894 607,961Beam Therapeutics Inc.(a) . . . . . . . . . . . . . . . . . . . . . . . . . . . . . . 10,366 820,469BioAtla Inc.(a) . . . . . . . . . . . . . . . . . . . . . . . . . . . . . . . . . . . . . . . . . . 24,102 608,576BioCryst Pharmaceuticals Inc.(a) . . . . . . . . . . . . . . . . . . . . . . . . 56,806 685,080Biohaven Pharmaceutical Holding Co. Ltd.(a) . . . . . . . . . . . . 12,960 1,454,630Bluebird Bio Inc.(a)(b) . . . . . . . . . . . . . . . . . . . . . . . . . . . . . . . . . . . 61,180 618,530Blueprint Medicines Corp.(a) . . . . . . . . . . . . . . . . . . . . . . . . . . . . 8,255 794,131Bridgebio Pharma Inc.(a) . . . . . . . . . . . . . . . . . . . . . . . . . . . . . . . 24,174 979,047Cerevel Therapeutics Holdings Inc.(a) . . . . . . . . . . . . . . . . . . . 18,163 566,504ChemoCentryx Inc.(a) . . . . . . . . . . . . . . . . . . . . . . . . . . . . . . . . . . 17,126 621,331Chimerix Inc.(a) . . . . . . . . . . . . . . . . . . . . . . . . . . . . . . . . . . . . . . . . 104,840 659,444CRISPR Therapeutics AG(a)(b) . . . . . . . . . . . . . . . . . . . . . . . . . . 14,933 1,193,147Cytokinetics Inc.(a) . . . . . . . . . . . . . . . . . . . . . . . . . . . . . . . . . . . . . 16,340 642,816Denali Therapeutics Inc.(a). . . . . . . . . . . . . . . . . . . . . . . . . . . . . . 23,763 1,099,276Dicerna Pharmaceuticals Inc.(a). . . . . . . . . . . . . . . . . . . . . . . . . 22,932 871,645Dynavax Technologies Corp.(a)(b) . . . . . . . . . . . . . . . . . . . . . . . 39,843 643,464Editas Medicine Inc.(a). . . . . . . . . . . . . . . . . . . . . . . . . . . . . . . . . . 18,703 610,840Emergent BioSolutions Inc.(a) . . . . . . . . . . . . . . . . . . . . . . . . . . . 16,943 747,525Exelixis Inc.(a). . . . . . . . . . . . . . . . . . . . . . . . . . . . . . . . . . . . . . . . . . 45,082 756,927Fate Therapeutics Inc.(a) . . . . . . . . . . . . . . . . . . . . . . . . . . . . . . . 19,387 1,066,479FibroGen Inc.(a) . . . . . . . . . . . . . . . . . . . . . . . . . . . . . . . . . . . . . . . . 56,267 703,900Global Blood Therapeutics Inc.(a) . . . . . . . . . . . . . . . . . . . . . . . 20,677 584,332Halozyme Therapeutics Inc.(a) . . . . . . . . . . . . . . . . . . . . . . . . . . 29,753 978,279IGM Biosciences Inc.(a). . . . . . . . . . . . . . . . . . . . . . . . . . . . . . . . . 11,289 563,547Immunovant Inc.(a) . . . . . . . . . . . . . . . . . . . . . . . . . . . . . . . . . . . . . 84,408 649,942Inovio Pharmaceuticals Inc.(a)(b) . . . . . . . . . . . . . . . . . . . . . . . . 92,768 671,640Insmed Inc.(a)(b) . . . . . . . . . . . . . . . . . . . . . . . . . . . . . . . . . . . . . . . . 27,292 751,076Intellia Therapeutics Inc.(a) . . . . . . . . . . . . . . . . . . . . . . . . . . . . . 17,402 2,001,404Invitae Corp.(a) . . . . . . . . . . . . . . . . . . . . . . . . . . . . . . . . . . . . . . . . . 34,216 581,672Ionis Pharmaceuticals Inc.(a). . . . . . . . . . . . . . . . . . . . . . . . . . . . 28,915 766,248Iovance Biotherapeutics Inc.(a). . . . . . . . . . . . . . . . . . . . . . . . . . 34,989 654,994Karuna Therapeutics Inc.(a) . . . . . . . . . . . . . . . . . . . . . . . . . . . . . 5,145 658,046Kodiak Sciences Inc.(a)(b) . . . . . . . . . . . . . . . . . . . . . . . . . . . . . . . 6,566 603,021Krystal Biotech Inc.(a) . . . . . . . . . . . . . . . . . . . . . . . . . . . . . . . . . . 13,264 1,068,415
Security Shares
Value
Biotechnology (continued)Kura Oncology Inc.(a) . . . . . . . . . . . . . . . . . . . . . . . . . . . . . . . . . . 38,759 $ 541,076Kymera Therapeutics Inc.(a) . . . . . . . . . . . . . . . . . . . . . . . . . . . . 10,713 594,786Ligand Pharmaceuticals Inc.(a). . . . . . . . . . . . . . . . . . . . . . . . . . 4,691 759,567MacroGenics Inc.(a) . . . . . . . . . . . . . . . . . . . . . . . . . . . . . . . . . . . . 34,720 611,072Merus NV(a) . . . . . . . . . . . . . . . . . . . . . . . . . . . . . . . . . . . . . . . . . . . 23,531 612,041Mirati Therapeutics Inc.(a) . . . . . . . . . . . . . . . . . . . . . . . . . . . . . . 10,549 1,442,787Myriad Genetics Inc.(a) . . . . . . . . . . . . . . . . . . . . . . . . . . . . . . . . . 23,722 613,451Natera Inc.(a) . . . . . . . . . . . . . . . . . . . . . . . . . . . . . . . . . . . . . . . . . . 17,950 1,641,707Ocugen Inc.(a)(b) . . . . . . . . . . . . . . . . . . . . . . . . . . . . . . . . . . . . . . . 93,587 593,342OPKO Health Inc.(a) . . . . . . . . . . . . . . . . . . . . . . . . . . . . . . . . . . . . 157,592 619,337Passage Bio Inc.(a). . . . . . . . . . . . . . . . . . . . . . . . . . . . . . . . . . . . . 81,010 590,563Prothena Corp. PLC(a) . . . . . . . . . . . . . . . . . . . . . . . . . . . . . . . . . 12,242 613,936Rocket Pharmaceuticals Inc.(a) . . . . . . . . . . . . . . . . . . . . . . . . . 24,614 601,320Sage Therapeutics Inc.(a). . . . . . . . . . . . . . . . . . . . . . . . . . . . . . . 16,254 632,443Sarepta Therapeutics Inc.(a) . . . . . . . . . . . . . . . . . . . . . . . . . . . . 21,422 1,731,112SpringWorks Therapeutics Inc.(a) . . . . . . . . . . . . . . . . . . . . . . . 9,341 671,151Sutro Biopharma Inc.(a). . . . . . . . . . . . . . . . . . . . . . . . . . . . . . . . . 36,880 629,910Taysha Gene Therapies Inc.(a) . . . . . . . . . . . . . . . . . . . . . . . . . . 47,685 618,951TG Therapeutics Inc.(a) . . . . . . . . . . . . . . . . . . . . . . . . . . . . . . . . . 31,198 474,210Turning Point Therapeutics Inc.(a) . . . . . . . . . . . . . . . . . . . . . . . 15,990 608,579Twist Bioscience Corp.(a) . . . . . . . . . . . . . . . . . . . . . . . . . . . . . . . 8,991 858,640Ultragenyx Pharmaceutical Inc.(a)(b) . . . . . . . . . . . . . . . . . . . . . 21,679 1,630,911uniQure NV(a). . . . . . . . . . . . . . . . . . . . . . . . . . . . . . . . . . . . . . . . . . 22,774 634,256United Therapeutics Corp.(a). . . . . . . . . . . . . . . . . . . . . . . . . . . . 9,881 1,872,449Veracyte Inc.(a) . . . . . . . . . . . . . . . . . . . . . . . . . . . . . . . . . . . . . . . . 16,228 673,137Vericel Corp.(a). . . . . . . . . . . . . . . . . . . . . . . . . . . . . . . . . . . . . . . . . 15,610 580,848Vir Biotechnology Inc.(a) . . . . . . . . . . . . . . . . . . . . . . . . . . . . . . . . 22,515 1,067,661Xencor Inc.(a) . . . . . . . . . . . . . . . . . . . . . . . . . . . . . . . . . . . . . . . . . . 18,392 666,158Xenon Pharmaceuticals Inc.(a) . . . . . . . . . . . . . . . . . . . . . . . . . . 23,388 624,460Zentalis Pharmaceuticals Inc.(a). . . . . . . . . . . . . . . . . . . . . . . . . 8,420 690,861Zymeworks Inc.(a)(b) . . . . . . . . . . . . . . . . . . . . . . . . . . . . . . . . . . . . 34,477 693,332
65,169,630Building Products — 1.9%AAON Inc. . . . . . . . . . . . . . . . . . . . . . . . . . . . . . . . . . . . . . . . . . . . . . 19,690 1,535,820Advanced Drainage Systems Inc. . . . . . . . . . . . . . . . . . . . . . . . 19,341 2,392,675Armstrong World Industries Inc.. . . . . . . . . . . . . . . . . . . . . . . . . 16,199 1,716,608AZEK Co. Inc. (The)(a) . . . . . . . . . . . . . . . . . . . . . . . . . . . . . . . . . 26,906 1,055,254Builders FirstSource Inc.(a) . . . . . . . . . . . . . . . . . . . . . . . . . . . . . 54,869 3,810,104Carlisle Companies Inc. . . . . . . . . . . . . . . . . . . . . . . . . . . . . . . . . 14,368 3,235,674Cornerstone Building Brands Inc.(a) . . . . . . . . . . . . . . . . . . . . . 39,343 618,472Gibraltar Industries Inc.(a) . . . . . . . . . . . . . . . . . . . . . . . . . . . . . . 9,187 623,797JELD-WEN Holding Inc.(a) . . . . . . . . . . . . . . . . . . . . . . . . . . . . . . 25,884 627,169Masonite International Corp.(a). . . . . . . . . . . . . . . . . . . . . . . . . . 5,936 635,152Resideo Technologies Inc.(a). . . . . . . . . . . . . . . . . . . . . . . . . . . . 41,814 1,090,927Trex Co. Inc.(a). . . . . . . . . . . . . . . . . . . . . . . . . . . . . . . . . . . . . . . . . 32,438 4,306,793Zurn Water Solutions Corp.. . . . . . . . . . . . . . . . . . . . . . . . . . . . . 36,663 1,285,038
22,933,483Capital Markets — 2.2%Affiliated Managers Group Inc.. . . . . . . . . . . . . . . . . . . . . . . . . . 15,448 2,628,168Ares Management Corp., Class A. . . . . . . . . . . . . . . . . . . . . . . 25,618 2,079,157Artisan Partners Asset Management Inc., Class A . . . . . . . 22,162 991,306Cohen & Steers Inc.. . . . . . . . . . . . . . . . . . . . . . . . . . . . . . . . . . . . 8,989 806,943Cowen Inc., Class A. . . . . . . . . . . . . . . . . . . . . . . . . . . . . . . . . . . . 17,727 627,181Diamond Hill Investment Group Inc.. . . . . . . . . . . . . . . . . . . . . 3,235 621,411Donnelley Financial Solutions Inc.(a) . . . . . . . . . . . . . . . . . . . . 19,059 890,436Evercore Inc., Class A. . . . . . . . . . . . . . . . . . . . . . . . . . . . . . . . . . 6,295 873,116Focus Financial Partners Inc., Class A(a) . . . . . . . . . . . . . . . . 11,340 697,864Interactive Brokers Group Inc., Class A . . . . . . . . . . . . . . . . . 17,776 1,312,224Janus Henderson Group PLC . . . . . . . . . . . . . . . . . . . . . . . . . . 88,309 3,773,444
Schedule of Investments (unaudited) (continued)
November 30, 2021
iShares� ESG Aware MSCI USA Small-Cap ETF(Percentages shown are based on Net Assets)
45NM0122U-1995964-47/159

Security Shares
Value
Capital Markets (continued)Jefferies Financial Group Inc.. . . . . . . . . . . . . . . . . . . . . . . . . . . 37,808 $ 1,420,825LPL Financial Holdings Inc.. . . . . . . . . . . . . . . . . . . . . . . . . . . . . 26,851 4,231,986Morningstar Inc. . . . . . . . . . . . . . . . . . . . . . . . . . . . . . . . . . . . . . . . 7,517 2,332,751Open Lending Corp., Class A(a) . . . . . . . . . . . . . . . . . . . . . . . . . 31,928 742,007StoneX Group Inc.(a) . . . . . . . . . . . . . . . . . . . . . . . . . . . . . . . . . . . 10,333 580,456Victory Capital Holdings Inc., Class A . . . . . . . . . . . . . . . . . . . 22,470 787,798Virtu Financial Inc., Class A. . . . . . . . . . . . . . . . . . . . . . . . . . . . . 23,154 652,480Virtus Investment Partners Inc. . . . . . . . . . . . . . . . . . . . . . . . . . 2,292 681,595
26,731,148Chemicals — 1.9%AdvanSix Inc. . . . . . . . . . . . . . . . . . . . . . . . . . . . . . . . . . . . . . . . . . . 13,734 622,013Avient Corp. . . . . . . . . . . . . . . . . . . . . . . . . . . . . . . . . . . . . . . . . . . . 23,285 1,280,908Axalta Coating Systems Ltd.(a). . . . . . . . . . . . . . . . . . . . . . . . . . 110,803 3,359,547Balchem Corp.. . . . . . . . . . . . . . . . . . . . . . . . . . . . . . . . . . . . . . . . . 10,437 1,649,046Chemours Co. (The) . . . . . . . . . . . . . . . . . . . . . . . . . . . . . . . . . . . 43,720 1,298,484HB Fuller Co. . . . . . . . . . . . . . . . . . . . . . . . . . . . . . . . . . . . . . . . . . . 13,447 983,782Ingevity Corp.(a). . . . . . . . . . . . . . . . . . . . . . . . . . . . . . . . . . . . . . . . 9,102 654,525Innospec Inc. . . . . . . . . . . . . . . . . . . . . . . . . . . . . . . . . . . . . . . . . . . 18,195 1,477,434Koppers Holdings Inc.(a) . . . . . . . . . . . . . . . . . . . . . . . . . . . . . . . . 21,457 648,001Livent Corp.(a) . . . . . . . . . . . . . . . . . . . . . . . . . . . . . . . . . . . . . . . . . 42,631 1,291,293Minerals Technologies Inc. . . . . . . . . . . . . . . . . . . . . . . . . . . . . . 21,536 1,414,269Orion Engineered Carbons SA(a). . . . . . . . . . . . . . . . . . . . . . . . 63,288 1,110,704Quaker Chemical Corp. . . . . . . . . . . . . . . . . . . . . . . . . . . . . . . . . 2,694 613,828Scotts Miracle-Gro Co. (The) . . . . . . . . . . . . . . . . . . . . . . . . . . . 8,038 1,164,626Sensient Technologies Corp. . . . . . . . . . . . . . . . . . . . . . . . . . . . 10,579 1,029,231Stepan Co. . . . . . . . . . . . . . . . . . . . . . . . . . . . . . . . . . . . . . . . . . . . . 10,928 1,231,695Trinseo PLC . . . . . . . . . . . . . . . . . . . . . . . . . . . . . . . . . . . . . . . . . . . 22,468 1,061,164Tronox Holdings PLC, Class A . . . . . . . . . . . . . . . . . . . . . . . . . . 36,565 804,064Valvoline Inc. . . . . . . . . . . . . . . . . . . . . . . . . . . . . . . . . . . . . . . . . . . 57,883 1,972,074
23,666,688Commercial Services & Supplies — 1.4%ABM Industries Inc. . . . . . . . . . . . . . . . . . . . . . . . . . . . . . . . . . . . . 30,329 1,364,805ACCO Brands Corp. . . . . . . . . . . . . . . . . . . . . . . . . . . . . . . . . . . . 76,793 634,310ADT Inc.. . . . . . . . . . . . . . . . . . . . . . . . . . . . . . . . . . . . . . . . . . . . . . . 73,856 613,743Clean Harbors Inc.(a) . . . . . . . . . . . . . . . . . . . . . . . . . . . . . . . . . . . 8,092 820,852Deluxe Corp. . . . . . . . . . . . . . . . . . . . . . . . . . . . . . . . . . . . . . . . . . . 18,629 630,405Healthcare Services Group Inc. . . . . . . . . . . . . . . . . . . . . . . . . . 35,462 620,585Herman Miller Inc. . . . . . . . . . . . . . . . . . . . . . . . . . . . . . . . . . . . . . 35,219 1,336,209IAA Inc.(a). . . . . . . . . . . . . . . . . . . . . . . . . . . . . . . . . . . . . . . . . . . . . . 52,186 2,520,584KAR Auction Services Inc.(a) . . . . . . . . . . . . . . . . . . . . . . . . . . . . 62,435 935,901Matthews International Corp., Class A. . . . . . . . . . . . . . . . . . . 38,185 1,323,874Montrose Environmental Group Inc.(a). . . . . . . . . . . . . . . . . . . 10,936 800,843MSA Safety Inc.. . . . . . . . . . . . . . . . . . . . . . . . . . . . . . . . . . . . . . . . 12,068 1,729,586Pitney Bowes Inc. . . . . . . . . . . . . . . . . . . . . . . . . . . . . . . . . . . . . . . 26,949 184,062Steelcase Inc., Class A. . . . . . . . . . . . . . . . . . . . . . . . . . . . . . . . . 56,475 631,955Tetra Tech Inc. . . . . . . . . . . . . . . . . . . . . . . . . . . . . . . . . . . . . . . . . . 13,856 2,558,926Viad Corp.(a) . . . . . . . . . . . . . . . . . . . . . . . . . . . . . . . . . . . . . . . . . . . 14,954 632,704
17,339,344Communications Equipment — 0.8%ADTRAN Inc. . . . . . . . . . . . . . . . . . . . . . . . . . . . . . . . . . . . . . . . . . . 31,162 635,081Calix Inc.(a) . . . . . . . . . . . . . . . . . . . . . . . . . . . . . . . . . . . . . . . . . . . . 14,410 964,893Ciena Corp.(a)(b) . . . . . . . . . . . . . . . . . . . . . . . . . . . . . . . . . . . . . . . 39,387 2,372,279CommScope Holding Co. Inc.(a) . . . . . . . . . . . . . . . . . . . . . . . . 67,285 670,159Harmonic Inc.(a). . . . . . . . . . . . . . . . . . . . . . . . . . . . . . . . . . . . . . . . 66,689 716,907Infinera Corp.(a) . . . . . . . . . . . . . . . . . . . . . . . . . . . . . . . . . . . . . . . . 78,530 638,449Lumentum Holdings Inc.(a). . . . . . . . . . . . . . . . . . . . . . . . . . . . . . 19,193 1,665,377Plantronics Inc.(a) . . . . . . . . . . . . . . . . . . . . . . . . . . . . . . . . . . . . . . 22,111 564,273Ribbon Communications Inc.(a) . . . . . . . . . . . . . . . . . . . . . . . . . 113,544 618,815Viasat Inc.(a) . . . . . . . . . . . . . . . . . . . . . . . . . . . . . . . . . . . . . . . . . . . 12,981 574,928
Security Shares
Value
Communications Equipment (continued)Viavi Solutions Inc.(a). . . . . . . . . . . . . . . . . . . . . . . . . . . . . . . . . . . 43,179 $ 639,481
10,060,642Construction & Engineering — 2.1%AECOM(a) . . . . . . . . . . . . . . . . . . . . . . . . . . . . . . . . . . . . . . . . . . . . . 43,150 2,974,761API Group Corp.(a) . . . . . . . . . . . . . . . . . . . . . . . . . . . . . . . . . . . . . 39,696 925,314Arcosa Inc. . . . . . . . . . . . . . . . . . . . . . . . . . . . . . . . . . . . . . . . . . . . . 14,308 732,140Comfort Systems USA Inc. . . . . . . . . . . . . . . . . . . . . . . . . . . . . . 20,046 1,901,764Dycom Industries Inc.(a)(b) . . . . . . . . . . . . . . . . . . . . . . . . . . . . . . 7,897 738,212EMCOR Group Inc. . . . . . . . . . . . . . . . . . . . . . . . . . . . . . . . . . . . . 25,567 3,051,166Fluor Corp.(a) . . . . . . . . . . . . . . . . . . . . . . . . . . . . . . . . . . . . . . . . . . 29,854 660,072Granite Construction Inc. . . . . . . . . . . . . . . . . . . . . . . . . . . . . . . . 21,579 838,992Great Lakes Dredge & Dock Corp.(a) . . . . . . . . . . . . . . . . . . . . 52,468 775,477IES Holdings Inc.(a) . . . . . . . . . . . . . . . . . . . . . . . . . . . . . . . . . . . . 12,565 602,994MasTec Inc.(a) . . . . . . . . . . . . . . . . . . . . . . . . . . . . . . . . . . . . . . . . . 15,276 1,407,989MYR Group Inc.(a) . . . . . . . . . . . . . . . . . . . . . . . . . . . . . . . . . . . . . 8,295 918,339Primoris Services Corp. . . . . . . . . . . . . . . . . . . . . . . . . . . . . . . . . 28,814 646,010Quanta Services Inc. . . . . . . . . . . . . . . . . . . . . . . . . . . . . . . . . . . . 47,649 5,421,503Sterling Construction Co. Inc.(a). . . . . . . . . . . . . . . . . . . . . . . . . 23,346 601,626Valmont Industries Inc. . . . . . . . . . . . . . . . . . . . . . . . . . . . . . . . . . 6,093 1,456,410WillScot Mobile Mini Holdings Corp.(a) . . . . . . . . . . . . . . . . . . 55,775 2,124,470
25,777,239Construction Materials — 0.2%Summit Materials Inc., Class A(a)(b) . . . . . . . . . . . . . . . . . . . . . 48,699 1,816,473
Consumer Finance — 0.7%Credit Acceptance Corp.(a)(b) . . . . . . . . . . . . . . . . . . . . . . . . . . . 1,448 904,855Encore Capital Group Inc.(a) . . . . . . . . . . . . . . . . . . . . . . . . . . . . 11,893 693,838Green Dot Corp., Class A(a) . . . . . . . . . . . . . . . . . . . . . . . . . . . . 13,074 469,357LendingClub Corp.(a) . . . . . . . . . . . . . . . . . . . . . . . . . . . . . . . . . . . 23,375 764,830OneMain Holdings Inc. . . . . . . . . . . . . . . . . . . . . . . . . . . . . . . . . . 17,222 857,483PRA Group Inc.(a) . . . . . . . . . . . . . . . . . . . . . . . . . . . . . . . . . . . . . . 25,194 1,069,737PROG Holdings Inc. . . . . . . . . . . . . . . . . . . . . . . . . . . . . . . . . . . . 21,418 966,380SLM Corp.. . . . . . . . . . . . . . . . . . . . . . . . . . . . . . . . . . . . . . . . . . . . . 128,759 2,289,335
8,015,815Containers & Packaging — 0.9%AptarGroup Inc.. . . . . . . . . . . . . . . . . . . . . . . . . . . . . . . . . . . . . . . . 24,312 2,907,472Berry Global Group Inc.(a) . . . . . . . . . . . . . . . . . . . . . . . . . . . . . . 25,114 1,734,122Graphic Packaging Holding Co.. . . . . . . . . . . . . . . . . . . . . . . . . 53,347 1,053,070Greif Inc., Class A, NVS . . . . . . . . . . . . . . . . . . . . . . . . . . . . . . . . 12,317 747,395Myers Industries Inc. . . . . . . . . . . . . . . . . . . . . . . . . . . . . . . . . . . . 32,651 636,041Ranpak Holdings Corp.(a) . . . . . . . . . . . . . . . . . . . . . . . . . . . . . . 15,901 630,157Sonoco Products Co. . . . . . . . . . . . . . . . . . . . . . . . . . . . . . . . . . . 44,924 2,611,432TriMas Corp.. . . . . . . . . . . . . . . . . . . . . . . . . . . . . . . . . . . . . . . . . . . 19,364 641,336
10,961,025Diversified Consumer Services — 1.3%2U Inc.(a)(b) . . . . . . . . . . . . . . . . . . . . . . . . . . . . . . . . . . . . . . . . . . . . 34,368 817,615American Public Education Inc.(a) . . . . . . . . . . . . . . . . . . . . . . . 27,080 511,541Bright Horizons Family Solutions Inc.(a) . . . . . . . . . . . . . . . . . 22,278 2,739,080Carriage Services Inc.. . . . . . . . . . . . . . . . . . . . . . . . . . . . . . . . . . 13,076 676,552Chegg Inc.(a). . . . . . . . . . . . . . . . . . . . . . . . . . . . . . . . . . . . . . . . . . . 31,472 876,495frontdoor Inc.(a) . . . . . . . . . . . . . . . . . . . . . . . . . . . . . . . . . . . . . . . . 18,394 635,697Graham Holdings Co., Class B . . . . . . . . . . . . . . . . . . . . . . . . . 1,341 759,703Grand Canyon Education Inc.(a) . . . . . . . . . . . . . . . . . . . . . . . . 11,603 840,870H&R Block Inc. . . . . . . . . . . . . . . . . . . . . . . . . . . . . . . . . . . . . . . . . 53,576 1,268,680Houghton Mifflin Harcourt Co.(a) . . . . . . . . . . . . . . . . . . . . . . . . 41,368 643,686Service Corp. International . . . . . . . . . . . . . . . . . . . . . . . . . . . . . 42,956 2,841,969Terminix Global Holdings Inc.(a) . . . . . . . . . . . . . . . . . . . . . . . . . 60,876 2,271,892WW International Inc.(a)(b) . . . . . . . . . . . . . . . . . . . . . . . . . . . . . . 36,287 610,347
15,494,127
Schedule of Investments (unaudited) (continued)
November 30, 2021
iShares� ESG Aware MSCI USA Small-Cap ETF(Percentages shown are based on Net Assets)
46 NM0122U-1995964-48/159

Security Shares
Value
Diversified Financial Services — 0.2%Voya Financial Inc. . . . . . . . . . . . . . . . . . . . . . . . . . . . . . . . . . . . . . 41,940 $ 2,606,152
Diversified Telecommunication Services — 0.5%Bandwidth Inc., Class A(a) . . . . . . . . . . . . . . . . . . . . . . . . . . . . . . 12,290 880,701Cogent Communications Holdings Inc. . . . . . . . . . . . . . . . . . . 18,422 1,380,361Frontier Communications Parent Inc.(a). . . . . . . . . . . . . . . . . . 41,715 1,393,698Iridium Communications Inc.(a). . . . . . . . . . . . . . . . . . . . . . . . . . 39,950 1,536,078Liberty Latin America Ltd., Class C, NVS(a) . . . . . . . . . . . . . . 55,543 624,303Radius Global Infrastructure Inc., Class A(a) . . . . . . . . . . . . . 37,270 614,955
6,430,096Electric Utilities — 0.2%Hawaiian Electric Industries Inc. . . . . . . . . . . . . . . . . . . . . . . . . 48,789 1,853,494
Electrical Equipment — 1.2%Acuity Brands Inc. . . . . . . . . . . . . . . . . . . . . . . . . . . . . . . . . . . . . . 12,573 2,531,574Array Technologies Inc.(a) . . . . . . . . . . . . . . . . . . . . . . . . . . . . . . 27,237 490,675Atkore Inc.(a). . . . . . . . . . . . . . . . . . . . . . . . . . . . . . . . . . . . . . . . . . . 13,203 1,406,119Blink Charging Co.(a)(b) . . . . . . . . . . . . . . . . . . . . . . . . . . . . . . . . . 15,917 611,690Bloom Energy Corp., Class A(a)(b) . . . . . . . . . . . . . . . . . . . . . . . 38,407 1,055,424FuelCell Energy Inc.(a) . . . . . . . . . . . . . . . . . . . . . . . . . . . . . . . . . 87,973 763,606Hubbell Inc.. . . . . . . . . . . . . . . . . . . . . . . . . . . . . . . . . . . . . . . . . . . . 14,937 2,923,171Regal Rexnord Corp.. . . . . . . . . . . . . . . . . . . . . . . . . . . . . . . . . . . 19,184 3,032,990Shoals Technologies Group Inc., Class A(a). . . . . . . . . . . . . . 27,191 764,067Vertiv Holdings Co.. . . . . . . . . . . . . . . . . . . . . . . . . . . . . . . . . . . . . 64,758 1,660,395
15,239,711Electronic Equipment, Instruments & Components — 3.3%Advanced Energy Industries Inc.. . . . . . . . . . . . . . . . . . . . . . . . 7,488 656,623Avnet Inc. . . . . . . . . . . . . . . . . . . . . . . . . . . . . . . . . . . . . . . . . . . . . . 41,888 1,519,278Badger Meter Inc. . . . . . . . . . . . . . . . . . . . . . . . . . . . . . . . . . . . . . . 31,822 3,257,300Belden Inc. . . . . . . . . . . . . . . . . . . . . . . . . . . . . . . . . . . . . . . . . . . . . 9,909 611,088Benchmark Electronics Inc.. . . . . . . . . . . . . . . . . . . . . . . . . . . . . 27,311 643,993Coherent Inc.(a) . . . . . . . . . . . . . . . . . . . . . . . . . . . . . . . . . . . . . . . . 8,153 2,111,056CTS Corp. . . . . . . . . . . . . . . . . . . . . . . . . . . . . . . . . . . . . . . . . . . . . . 19,257 670,914ePlus Inc.(a) . . . . . . . . . . . . . . . . . . . . . . . . . . . . . . . . . . . . . . . . . . . 12,722 1,342,044Fabrinet(a) . . . . . . . . . . . . . . . . . . . . . . . . . . . . . . . . . . . . . . . . . . . . . 5,929 655,510FARO Technologies Inc.(a). . . . . . . . . . . . . . . . . . . . . . . . . . . . . . 11,588 804,903Flex Ltd.(a) . . . . . . . . . . . . . . . . . . . . . . . . . . . . . . . . . . . . . . . . . . . . . 171,047 2,924,904II-VI Inc.(a)(b) . . . . . . . . . . . . . . . . . . . . . . . . . . . . . . . . . . . . . . . . . . . 19,886 1,243,472Insight Enterprises Inc.(a) . . . . . . . . . . . . . . . . . . . . . . . . . . . . . . . 14,575 1,437,387Itron Inc.(a). . . . . . . . . . . . . . . . . . . . . . . . . . . . . . . . . . . . . . . . . . . . . 23,634 1,463,181Jabil Inc. . . . . . . . . . . . . . . . . . . . . . . . . . . . . . . . . . . . . . . . . . . . . . . 25,186 1,472,374Kimball Electronics Inc.(a) . . . . . . . . . . . . . . . . . . . . . . . . . . . . . . 29,165 618,881Knowles Corp.(a) . . . . . . . . . . . . . . . . . . . . . . . . . . . . . . . . . . . . . . . 37,787 820,734Littelfuse Inc. . . . . . . . . . . . . . . . . . . . . . . . . . . . . . . . . . . . . . . . . . . 5,438 1,623,134Methode Electronics Inc. . . . . . . . . . . . . . . . . . . . . . . . . . . . . . . . 36,448 1,620,843MicroVision Inc.(a) . . . . . . . . . . . . . . . . . . . . . . . . . . . . . . . . . . . . . . 82,743 585,820National Instruments Corp. . . . . . . . . . . . . . . . . . . . . . . . . . . . . . 66,816 2,774,200Novanta Inc.(a) . . . . . . . . . . . . . . . . . . . . . . . . . . . . . . . . . . . . . . . . . 13,389 2,161,654OSI Systems Inc.(a)(b) . . . . . . . . . . . . . . . . . . . . . . . . . . . . . . . . . . 25,224 2,293,618PAR Technology Corp.(a) . . . . . . . . . . . . . . . . . . . . . . . . . . . . . . . 12,328 645,617Plexus Corp.(a). . . . . . . . . . . . . . . . . . . . . . . . . . . . . . . . . . . . . . . . . 16,871 1,419,526Rogers Corp.(a) . . . . . . . . . . . . . . . . . . . . . . . . . . . . . . . . . . . . . . . . 6,618 1,804,199SYNNEX Corp. . . . . . . . . . . . . . . . . . . . . . . . . . . . . . . . . . . . . . . . . 9,415 974,076Vishay Precision Group Inc.(a) . . . . . . . . . . . . . . . . . . . . . . . . . . 18,601 638,572Vontier Corp. . . . . . . . . . . . . . . . . . . . . . . . . . . . . . . . . . . . . . . . . . . 49,495 1,559,587
40,354,488Energy Equipment & Services — 0.7%Archrock Inc. . . . . . . . . . . . . . . . . . . . . . . . . . . . . . . . . . . . . . . . . . . 86,773 641,252Cactus Inc., Class A. . . . . . . . . . . . . . . . . . . . . . . . . . . . . . . . . . . . 23,193 846,545ChampionX Corp.(a) . . . . . . . . . . . . . . . . . . . . . . . . . . . . . . . . . . . . 63,159 1,289,075
Security Shares
Value
Energy Equipment & Services (continued)Core Laboratories NV(b) . . . . . . . . . . . . . . . . . . . . . . . . . . . . . . . . 27,329 $ 625,561DMC Global Inc.(a) . . . . . . . . . . . . . . . . . . . . . . . . . . . . . . . . . . . . . 16,806 613,419Dril-Quip Inc.(a) . . . . . . . . . . . . . . . . . . . . . . . . . . . . . . . . . . . . . . . . 32,473 620,559NOV Inc.(a) . . . . . . . . . . . . . . . . . . . . . . . . . . . . . . . . . . . . . . . . . . . . 133,585 1,592,333Oceaneering International Inc.(a) . . . . . . . . . . . . . . . . . . . . . . . . 59,193 632,773TechnipFMC PLC(a)(b) . . . . . . . . . . . . . . . . . . . . . . . . . . . . . . . . . . 240,167 1,361,747Weatherford International PLC(a). . . . . . . . . . . . . . . . . . . . . . . . 20,806 598,173
8,821,437Entertainment — 0.3%Cinemark Holdings Inc.(a) . . . . . . . . . . . . . . . . . . . . . . . . . . . . . . 36,602 568,063IMAX Corp.(a) . . . . . . . . . . . . . . . . . . . . . . . . . . . . . . . . . . . . . . . . . . 40,672 670,681Lions Gate Entertainment Corp., Class A(a)(b) . . . . . . . . . . . . 53,537 784,317World Wrestling Entertainment Inc., Class A . . . . . . . . . . . . . 14,471 714,289Zynga Inc., Class A(a) . . . . . . . . . . . . . . . . . . . . . . . . . . . . . . . . . . 236,302 1,424,901
4,162,251Equity Real Estate Investment Trusts (REITs) — 7.6%Agree Realty Corp.. . . . . . . . . . . . . . . . . . . . . . . . . . . . . . . . . . . . . 9,350 631,686Alexander & Baldwin Inc. . . . . . . . . . . . . . . . . . . . . . . . . . . . . . . . 54,234 1,194,775American Assets Trust Inc. . . . . . . . . . . . . . . . . . . . . . . . . . . . . . 19,145 658,588American Campus Communities Inc.. . . . . . . . . . . . . . . . . . . . 57,341 2,966,823American Homes 4 Rent, Class A. . . . . . . . . . . . . . . . . . . . . . . 55,026 2,205,992Americold Realty Trust . . . . . . . . . . . . . . . . . . . . . . . . . . . . . . . . . 51,203 1,671,266Apartment Income REIT Corp. . . . . . . . . . . . . . . . . . . . . . . . . . . 34,948 1,773,961Brandywine Realty Trust . . . . . . . . . . . . . . . . . . . . . . . . . . . . . . . 89,649 1,151,990Brixmor Property Group Inc. . . . . . . . . . . . . . . . . . . . . . . . . . . . . 114,686 2,607,960Columbia Property Trust Inc. . . . . . . . . . . . . . . . . . . . . . . . . . . . 64,876 1,245,619CoreSite Realty Corp. . . . . . . . . . . . . . . . . . . . . . . . . . . . . . . . . . . 19,827 3,391,408Corporate Office Properties Trust . . . . . . . . . . . . . . . . . . . . . . . 92,210 2,366,109Cousins Properties Inc. . . . . . . . . . . . . . . . . . . . . . . . . . . . . . . . . 40,093 1,513,912CubeSmart . . . . . . . . . . . . . . . . . . . . . . . . . . . . . . . . . . . . . . . . . . . . 51,308 2,766,527CyrusOne Inc. . . . . . . . . . . . . . . . . . . . . . . . . . . . . . . . . . . . . . . . . . 40,344 3,591,423DiamondRock Hospitality Co.(a). . . . . . . . . . . . . . . . . . . . . . . . . 82,240 716,310DigitalBridge Group Inc.(a) . . . . . . . . . . . . . . . . . . . . . . . . . . . . . . 137,384 1,093,577Douglas Emmett Inc. . . . . . . . . . . . . . . . . . . . . . . . . . . . . . . . . . . . 84,416 2,766,312Easterly Government Properties Inc. . . . . . . . . . . . . . . . . . . . . 41,065 861,133Empire State Realty Trust Inc., Class A . . . . . . . . . . . . . . . . . 104,515 950,041EPR Properties . . . . . . . . . . . . . . . . . . . . . . . . . . . . . . . . . . . . . . . . 14,096 650,108Essential Properties Realty Trust Inc. . . . . . . . . . . . . . . . . . . . 33,749 912,235Federal Realty Investment Trust . . . . . . . . . . . . . . . . . . . . . . . . 24,417 2,995,233First Industrial Realty Trust Inc. . . . . . . . . . . . . . . . . . . . . . . . . . 13,759 831,181Four Corners Property Trust Inc. . . . . . . . . . . . . . . . . . . . . . . . . 25,008 675,716Gaming and Leisure Properties Inc.. . . . . . . . . . . . . . . . . . . . . 43,241 1,951,034Healthcare Realty Trust Inc. . . . . . . . . . . . . . . . . . . . . . . . . . . . . 27,263 853,877Healthcare Trust of America Inc., Class A . . . . . . . . . . . . . . . 33,823 1,148,629Highwoods Properties Inc.. . . . . . . . . . . . . . . . . . . . . . . . . . . . . . 20,226 873,763Hudson Pacific Properties Inc. . . . . . . . . . . . . . . . . . . . . . . . . . . 66,298 1,613,693Independence Realty Trust Inc. . . . . . . . . . . . . . . . . . . . . . . . . . 33,946 831,677Innovative Industrial Properties Inc. . . . . . . . . . . . . . . . . . . . . . 4,482 1,151,112iStar Inc. . . . . . . . . . . . . . . . . . . . . . . . . . . . . . . . . . . . . . . . . . . . . . . 43,532 1,059,569JBG SMITH Properties . . . . . . . . . . . . . . . . . . . . . . . . . . . . . . . . . 74,625 2,073,829Kilroy Realty Corp. . . . . . . . . . . . . . . . . . . . . . . . . . . . . . . . . . . . . . 45,217 2,917,853Kimco Realty Corp. . . . . . . . . . . . . . . . . . . . . . . . . . . . . . . . . . . . . 172,832 3,874,893Kite Realty Group Trust . . . . . . . . . . . . . . . . . . . . . . . . . . . . . . . . 55,419 1,115,030Lamar Advertising Co., Class A . . . . . . . . . . . . . . . . . . . . . . . . . 11,605 1,267,962Lexington Realty Trust . . . . . . . . . . . . . . . . . . . . . . . . . . . . . . . . . 56,433 849,317Life Storage Inc. . . . . . . . . . . . . . . . . . . . . . . . . . . . . . . . . . . . . . . . 21,472 2,837,310Macerich Co. (The) . . . . . . . . . . . . . . . . . . . . . . . . . . . . . . . . . . . . 64,884 1,223,712National Retail Properties Inc. . . . . . . . . . . . . . . . . . . . . . . . . . . 35,078 1,546,940National Storage Affiliates Trust. . . . . . . . . . . . . . . . . . . . . . . . . 11,424 701,205
Schedule of Investments (unaudited) (continued)
November 30, 2021
iShares� ESG Aware MSCI USA Small-Cap ETF(Percentages shown are based on Net Assets)
47NM0122U-1995964-49/159

Security Shares
Value
Equity Real Estate Investment Trusts (REITs) (continued)Omega Healthcare Investors Inc. . . . . . . . . . . . . . . . . . . . . . . . 27,059 $ 756,028Outfront Media Inc. . . . . . . . . . . . . . . . . . . . . . . . . . . . . . . . . . . . . 51,823 1,295,057Paramount Group Inc.. . . . . . . . . . . . . . . . . . . . . . . . . . . . . . . . . . 75,159 598,266Park Hotels & Resorts Inc.(a) . . . . . . . . . . . . . . . . . . . . . . . . . . . 66,700 1,109,888Pebblebrook Hotel Trust. . . . . . . . . . . . . . . . . . . . . . . . . . . . . . . . 30,111 630,825Physicians Realty Trust . . . . . . . . . . . . . . . . . . . . . . . . . . . . . . . . 102,588 1,829,144Piedmont Office Realty Trust Inc., Class A. . . . . . . . . . . . . . . 80,487 1,398,864PotlatchDeltic Corp. . . . . . . . . . . . . . . . . . . . . . . . . . . . . . . . . . . . . 25,114 1,359,672Rayonier Inc. . . . . . . . . . . . . . . . . . . . . . . . . . . . . . . . . . . . . . . . . . . 26,289 992,936Rexford Industrial Realty Inc. . . . . . . . . . . . . . . . . . . . . . . . . . . . 33,717 2,362,887Ryman Hospitality Properties Inc.(a) . . . . . . . . . . . . . . . . . . . . . 14,305 1,107,207Sabra Health Care REIT Inc. . . . . . . . . . . . . . . . . . . . . . . . . . . . 47,476 613,865SITE Centers Corp. . . . . . . . . . . . . . . . . . . . . . . . . . . . . . . . . . . . . 57,361 863,857SL Green Realty Corp. . . . . . . . . . . . . . . . . . . . . . . . . . . . . . . . . . 21,325 1,480,595Spirit Realty Capital Inc. . . . . . . . . . . . . . . . . . . . . . . . . . . . . . . . . 15,204 677,490STAG Industrial Inc.. . . . . . . . . . . . . . . . . . . . . . . . . . . . . . . . . . . . 21,360 930,869STORE Capital Corp. . . . . . . . . . . . . . . . . . . . . . . . . . . . . . . . . . . 63,529 2,092,645Sunstone Hotel Investors Inc.(a). . . . . . . . . . . . . . . . . . . . . . . . . 59,487 646,624Tanger Factory Outlet Centers Inc.. . . . . . . . . . . . . . . . . . . . . . 31,797 629,899Uniti Group Inc. . . . . . . . . . . . . . . . . . . . . . . . . . . . . . . . . . . . . . . . . 100,421 1,332,587Washington REIT . . . . . . . . . . . . . . . . . . . . . . . . . . . . . . . . . . . . . . 58,789 1,481,483Xenia Hotels & Resorts Inc.(a) . . . . . . . . . . . . . . . . . . . . . . . . . . 44,698 700,418
94,972,396Food & Staples Retailing — 0.9%Andersons Inc. (The). . . . . . . . . . . . . . . . . . . . . . . . . . . . . . . . . . . 17,991 611,334BJ's Wholesale Club Holdings Inc.(a) . . . . . . . . . . . . . . . . . . . . 35,762 2,365,656Casey's General Stores Inc. . . . . . . . . . . . . . . . . . . . . . . . . . . . . 9,291 1,805,148Chefs' Warehouse Inc. (The)(a) . . . . . . . . . . . . . . . . . . . . . . . . . 20,444 635,195Grocery Outlet Holding Corp.(a) . . . . . . . . . . . . . . . . . . . . . . . . . 24,357 705,379PriceSmart Inc. . . . . . . . . . . . . . . . . . . . . . . . . . . . . . . . . . . . . . . . . 15,079 1,081,466Sprouts Farmers Market Inc.(a) . . . . . . . . . . . . . . . . . . . . . . . . . 36,526 966,478U.S. Foods Holding Corp.(a) . . . . . . . . . . . . . . . . . . . . . . . . . . . . 58,710 1,844,668United Natural Foods Inc.(a) . . . . . . . . . . . . . . . . . . . . . . . . . . . . 20,494 1,018,962
11,034,286Food Products — 1.6%Beyond Meat Inc.(a)(b) . . . . . . . . . . . . . . . . . . . . . . . . . . . . . . . . . . 13,682 961,297Darling Ingredients Inc.(a). . . . . . . . . . . . . . . . . . . . . . . . . . . . . . . 47,498 3,207,065Flowers Foods Inc.. . . . . . . . . . . . . . . . . . . . . . . . . . . . . . . . . . . . . 61,480 1,587,414Fresh Del Monte Produce Inc. . . . . . . . . . . . . . . . . . . . . . . . . . . 24,562 608,155Freshpet Inc.(a) . . . . . . . . . . . . . . . . . . . . . . . . . . . . . . . . . . . . . . . . 17,821 1,925,024Hain Celestial Group Inc. (The)(a)(b) . . . . . . . . . . . . . . . . . . . . . 34,581 1,363,529Ingredion Inc. . . . . . . . . . . . . . . . . . . . . . . . . . . . . . . . . . . . . . . . . . . 45,142 4,204,075Lamb Weston Holdings Inc. . . . . . . . . . . . . . . . . . . . . . . . . . . . . 47,434 2,462,773Post Holdings Inc.(a) . . . . . . . . . . . . . . . . . . . . . . . . . . . . . . . . . . . 11,655 1,125,873Sanderson Farms Inc.. . . . . . . . . . . . . . . . . . . . . . . . . . . . . . . . . . 3,571 670,562Simply Good Foods Co. (The)(a) . . . . . . . . . . . . . . . . . . . . . . . . 24,199 894,637TreeHouse Foods Inc.(a). . . . . . . . . . . . . . . . . . . . . . . . . . . . . . . . 20,063 736,312Vital Farms Inc.(a) . . . . . . . . . . . . . . . . . . . . . . . . . . . . . . . . . . . . . . 35,834 605,953
20,352,669Gas Utilities — 0.9%Chesapeake Utilities Corp. . . . . . . . . . . . . . . . . . . . . . . . . . . . . . 5,003 637,182National Fuel Gas Co.. . . . . . . . . . . . . . . . . . . . . . . . . . . . . . . . . . 25,969 1,501,268New Jersey Resources Corp.. . . . . . . . . . . . . . . . . . . . . . . . . . . 53,425 1,964,971Northwest Natural Holding Co.. . . . . . . . . . . . . . . . . . . . . . . . . . 15,574 671,551ONE Gas Inc.. . . . . . . . . . . . . . . . . . . . . . . . . . . . . . . . . . . . . . . . . . 36,551 2,369,967South Jersey Industries Inc. . . . . . . . . . . . . . . . . . . . . . . . . . . . . 64,349 1,512,202Southwest Gas Holdings Inc. . . . . . . . . . . . . . . . . . . . . . . . . . . . 24,622 1,620,374Spire Inc. . . . . . . . . . . . . . . . . . . . . . . . . . . . . . . . . . . . . . . . . . . . . . . 21,257 1,272,231
11,549,746
Security Shares
Value
Health Care Equipment & Supplies — 3.1%Alphatec Holdings Inc.(a) . . . . . . . . . . . . . . . . . . . . . . . . . . . . . . . 58,762 $ 652,258AngioDynamics Inc.(a) . . . . . . . . . . . . . . . . . . . . . . . . . . . . . . . . . . 23,169 596,602AtriCure Inc.(a) . . . . . . . . . . . . . . . . . . . . . . . . . . . . . . . . . . . . . . . . . 16,042 1,017,063Cardiovascular Systems Inc.(a) . . . . . . . . . . . . . . . . . . . . . . . . . 32,821 656,420Cerus Corp.(a) . . . . . . . . . . . . . . . . . . . . . . . . . . . . . . . . . . . . . . . . . 93,015 640,873CONMED Corp. . . . . . . . . . . . . . . . . . . . . . . . . . . . . . . . . . . . . . . . 7,783 1,023,153CryoPort Inc.(a) . . . . . . . . . . . . . . . . . . . . . . . . . . . . . . . . . . . . . . . . 10,820 718,881Envista Holdings Corp.(a) . . . . . . . . . . . . . . . . . . . . . . . . . . . . . . . 36,323 1,409,332Establishment Labs Holdings Inc.(a) . . . . . . . . . . . . . . . . . . . . . 10,394 670,829Glaukos Corp.(a) . . . . . . . . . . . . . . . . . . . . . . . . . . . . . . . . . . . . . . . 14,231 612,360Globus Medical Inc., Class A(a) . . . . . . . . . . . . . . . . . . . . . . . . . 14,236 891,458Haemonetics Corp.(a) . . . . . . . . . . . . . . . . . . . . . . . . . . . . . . . . . . 17,689 906,561Heska Corp.(a) . . . . . . . . . . . . . . . . . . . . . . . . . . . . . . . . . . . . . . . . . 4,288 690,196Hill-Rom Holdings Inc. . . . . . . . . . . . . . . . . . . . . . . . . . . . . . . . . . 19,352 3,009,236ICU Medical Inc.(a) . . . . . . . . . . . . . . . . . . . . . . . . . . . . . . . . . . . . . 2,693 609,184Inari Medical Inc.(a). . . . . . . . . . . . . . . . . . . . . . . . . . . . . . . . . . . . . 8,985 741,622Inogen Inc.(a) . . . . . . . . . . . . . . . . . . . . . . . . . . . . . . . . . . . . . . . . . . 19,552 597,314Integer Holdings Corp.(a) . . . . . . . . . . . . . . . . . . . . . . . . . . . . . . . 7,570 603,632Integra LifeSciences Holdings Corp.(a) . . . . . . . . . . . . . . . . . . 10,306 659,069Intersect ENT Inc.(a). . . . . . . . . . . . . . . . . . . . . . . . . . . . . . . . . . . . 24,682 660,737iRhythm Technologies Inc.(a)(b). . . . . . . . . . . . . . . . . . . . . . . . . . 8,454 892,742LivaNova PLC(a) . . . . . . . . . . . . . . . . . . . . . . . . . . . . . . . . . . . . . . . 10,268 823,083Merit Medical Systems Inc.(a) . . . . . . . . . . . . . . . . . . . . . . . . . . . 19,571 1,230,233Natus Medical Inc.(a) . . . . . . . . . . . . . . . . . . . . . . . . . . . . . . . . . . . 32,756 740,286Nevro Corp.(a) . . . . . . . . . . . . . . . . . . . . . . . . . . . . . . . . . . . . . . . . . 7,574 659,544OraSure Technologies Inc.(a) . . . . . . . . . . . . . . . . . . . . . . . . . . . 68,421 638,368Orthofix Medical Inc.(a) . . . . . . . . . . . . . . . . . . . . . . . . . . . . . . . . . 38,764 1,186,566Outset Medical Inc.(a) . . . . . . . . . . . . . . . . . . . . . . . . . . . . . . . . . . 14,627 693,320Penumbra Inc.(a) . . . . . . . . . . . . . . . . . . . . . . . . . . . . . . . . . . . . . . . 9,108 2,237,380Pulmonx Corp.(a). . . . . . . . . . . . . . . . . . . . . . . . . . . . . . . . . . . . . . . 18,991 613,409Quidel Corp.(a) . . . . . . . . . . . . . . . . . . . . . . . . . . . . . . . . . . . . . . . . . 9,968 1,470,878Senseonics Holdings Inc.(a). . . . . . . . . . . . . . . . . . . . . . . . . . . . . 193,528 607,678Shockwave Medical Inc.(a). . . . . . . . . . . . . . . . . . . . . . . . . . . . . . 10,576 1,906,218SI-BONE Inc.(a) . . . . . . . . . . . . . . . . . . . . . . . . . . . . . . . . . . . . . . . . 31,155 599,734Silk Road Medical Inc.(a) . . . . . . . . . . . . . . . . . . . . . . . . . . . . . . . 14,677 595,593STAAR Surgical Co.(a) . . . . . . . . . . . . . . . . . . . . . . . . . . . . . . . . . 11,585 1,102,776Surmodics Inc.(a). . . . . . . . . . . . . . . . . . . . . . . . . . . . . . . . . . . . . . . 13,885 609,968Tactile Systems Technology Inc.(a)(b) . . . . . . . . . . . . . . . . . . . . 26,731 521,255Tandem Diabetes Care Inc.(a). . . . . . . . . . . . . . . . . . . . . . . . . . . 20,244 2,601,759Vapotherm Inc.(a) . . . . . . . . . . . . . . . . . . . . . . . . . . . . . . . . . . . . . . 33,760 742,720Varex Imaging Corp.(a)(b) . . . . . . . . . . . . . . . . . . . . . . . . . . . . . . . 26,508 756,803
38,597,093Health Care Providers & Services — 2.9%1Life Healthcare Inc.(a) . . . . . . . . . . . . . . . . . . . . . . . . . . . . . . . . . 33,765 537,876Acadia Healthcare Co. Inc.(a) . . . . . . . . . . . . . . . . . . . . . . . . . . . 16,707 938,432Accolade Inc.(a) . . . . . . . . . . . . . . . . . . . . . . . . . . . . . . . . . . . . . . . . 20,905 536,631AdaptHealth Corp.(a)(b) . . . . . . . . . . . . . . . . . . . . . . . . . . . . . . . . . 32,282 633,696Addus HomeCare Corp.(a) . . . . . . . . . . . . . . . . . . . . . . . . . . . . . . 10,727 935,609Amedisys Inc.(a) . . . . . . . . . . . . . . . . . . . . . . . . . . . . . . . . . . . . . . . 10,747 1,500,819AMN Healthcare Services Inc.(a) . . . . . . . . . . . . . . . . . . . . . . . . 16,038 1,828,492Apollo Medical Holdings Inc.(a). . . . . . . . . . . . . . . . . . . . . . . . . . 6,574 615,787Brookdale Senior Living Inc.(a) . . . . . . . . . . . . . . . . . . . . . . . . . . 101,046 592,130Chemed Corp. . . . . . . . . . . . . . . . . . . . . . . . . . . . . . . . . . . . . . . . . . 3,192 1,485,844Clover Health Investments Corp.(a). . . . . . . . . . . . . . . . . . . . . . 118,741 588,955CorVel Corp.(a). . . . . . . . . . . . . . . . . . . . . . . . . . . . . . . . . . . . . . . . . 6,557 1,232,716Covetrus Inc.(a) . . . . . . . . . . . . . . . . . . . . . . . . . . . . . . . . . . . . . . . . 36,104 649,150Encompass Health Corp. . . . . . . . . . . . . . . . . . . . . . . . . . . . . . . . 35,150 2,025,343Ensign Group Inc. (The) . . . . . . . . . . . . . . . . . . . . . . . . . . . . . . . . 14,133 1,078,772Fulgent Genetics Inc.(a)(b) . . . . . . . . . . . . . . . . . . . . . . . . . . . . . . 7,360 688,307Guardant Health Inc.(a) . . . . . . . . . . . . . . . . . . . . . . . . . . . . . . . . . 18,965 1,993,601
Schedule of Investments (unaudited) (continued)
November 30, 2021
iShares� ESG Aware MSCI USA Small-Cap ETF(Percentages shown are based on Net Assets)
48 NM0122U-1995964-50/159
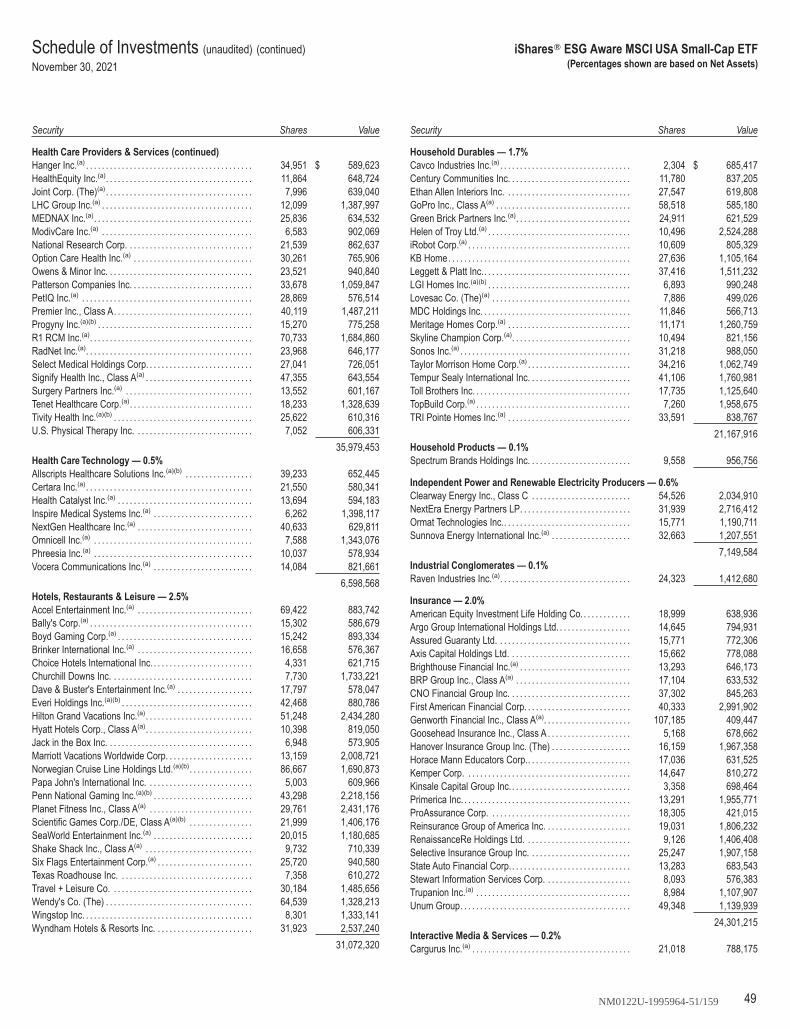
Security Shares
Value
Health Care Providers & Services (continued)Hanger Inc.(a) . . . . . . . . . . . . . . . . . . . . . . . . . . . . . . . . . . . . . . . . . . 34,951 $ 589,623HealthEquity Inc.(a). . . . . . . . . . . . . . . . . . . . . . . . . . . . . . . . . . . . . 11,864 648,724Joint Corp. (The)(a) . . . . . . . . . . . . . . . . . . . . . . . . . . . . . . . . . . . . . 7,996 639,040LHC Group Inc.(a) . . . . . . . . . . . . . . . . . . . . . . . . . . . . . . . . . . . . . . 12,099 1,387,997MEDNAX Inc.(a). . . . . . . . . . . . . . . . . . . . . . . . . . . . . . . . . . . . . . . . 25,836 634,532ModivCare Inc.(a) . . . . . . . . . . . . . . . . . . . . . . . . . . . . . . . . . . . . . . 6,583 902,069National Research Corp. . . . . . . . . . . . . . . . . . . . . . . . . . . . . . . . 21,539 862,637Option Care Health Inc.(a) . . . . . . . . . . . . . . . . . . . . . . . . . . . . . . 30,261 765,906Owens & Minor Inc. . . . . . . . . . . . . . . . . . . . . . . . . . . . . . . . . . . . . 23,521 940,840Patterson Companies Inc. . . . . . . . . . . . . . . . . . . . . . . . . . . . . . . 33,678 1,059,847PetIQ Inc.(a) . . . . . . . . . . . . . . . . . . . . . . . . . . . . . . . . . . . . . . . . . . . 28,869 576,514Premier Inc., Class A. . . . . . . . . . . . . . . . . . . . . . . . . . . . . . . . . . . 40,119 1,487,211Progyny Inc.(a)(b) . . . . . . . . . . . . . . . . . . . . . . . . . . . . . . . . . . . . . . . 15,270 775,258R1 RCM Inc.(a). . . . . . . . . . . . . . . . . . . . . . . . . . . . . . . . . . . . . . . . . 70,733 1,684,860RadNet Inc.(a). . . . . . . . . . . . . . . . . . . . . . . . . . . . . . . . . . . . . . . . . . 23,968 646,177Select Medical Holdings Corp. . . . . . . . . . . . . . . . . . . . . . . . . . . 27,041 726,051Signify Health Inc., Class A(a) . . . . . . . . . . . . . . . . . . . . . . . . . . . 47,355 643,554Surgery Partners Inc.(a) . . . . . . . . . . . . . . . . . . . . . . . . . . . . . . . . 13,552 601,167Tenet Healthcare Corp.(a). . . . . . . . . . . . . . . . . . . . . . . . . . . . . . . 18,233 1,328,639Tivity Health Inc.(a)(b) . . . . . . . . . . . . . . . . . . . . . . . . . . . . . . . . . . . 25,622 610,316U.S. Physical Therapy Inc. . . . . . . . . . . . . . . . . . . . . . . . . . . . . . 7,052 606,331
35,979,453Health Care Technology — 0.5%Allscripts Healthcare Solutions Inc.(a)(b) . . . . . . . . . . . . . . . . . 39,233 652,445Certara Inc.(a). . . . . . . . . . . . . . . . . . . . . . . . . . . . . . . . . . . . . . . . . . 21,550 580,341Health Catalyst Inc.(a) . . . . . . . . . . . . . . . . . . . . . . . . . . . . . . . . . . 13,694 594,183Inspire Medical Systems Inc.(a) . . . . . . . . . . . . . . . . . . . . . . . . . 6,262 1,398,117NextGen Healthcare Inc.(a) . . . . . . . . . . . . . . . . . . . . . . . . . . . . . 40,633 629,811Omnicell Inc.(a) . . . . . . . . . . . . . . . . . . . . . . . . . . . . . . . . . . . . . . . . 7,588 1,343,076Phreesia Inc.(a) . . . . . . . . . . . . . . . . . . . . . . . . . . . . . . . . . . . . . . . . 10,037 578,934Vocera Communications Inc.(a) . . . . . . . . . . . . . . . . . . . . . . . . . 14,084 821,661
6,598,568Hotels, Restaurants & Leisure — 2.5%Accel Entertainment Inc.(a) . . . . . . . . . . . . . . . . . . . . . . . . . . . . . 69,422 883,742Bally's Corp.(a) . . . . . . . . . . . . . . . . . . . . . . . . . . . . . . . . . . . . . . . . . 15,302 586,679Boyd Gaming Corp.(a) . . . . . . . . . . . . . . . . . . . . . . . . . . . . . . . . . . 15,242 893,334Brinker International Inc.(a) . . . . . . . . . . . . . . . . . . . . . . . . . . . . . 16,658 576,367Choice Hotels International Inc. . . . . . . . . . . . . . . . . . . . . . . . . . 4,331 621,715Churchill Downs Inc. . . . . . . . . . . . . . . . . . . . . . . . . . . . . . . . . . . . 7,730 1,733,221Dave & Buster's Entertainment Inc.(a) . . . . . . . . . . . . . . . . . . . 17,797 578,047Everi Holdings Inc.(a)(b) . . . . . . . . . . . . . . . . . . . . . . . . . . . . . . . . . 42,468 880,786Hilton Grand Vacations Inc.(a). . . . . . . . . . . . . . . . . . . . . . . . . . . 51,248 2,434,280Hyatt Hotels Corp., Class A(a). . . . . . . . . . . . . . . . . . . . . . . . . . . 10,398 819,050Jack in the Box Inc. . . . . . . . . . . . . . . . . . . . . . . . . . . . . . . . . . . . . 6,948 573,905Marriott Vacations Worldwide Corp. . . . . . . . . . . . . . . . . . . . . . 13,159 2,008,721Norwegian Cruise Line Holdings Ltd.(a)(b). . . . . . . . . . . . . . . . 86,667 1,690,873Papa John's International Inc. . . . . . . . . . . . . . . . . . . . . . . . . . . 5,003 609,966Penn National Gaming Inc.(a)(b) . . . . . . . . . . . . . . . . . . . . . . . . . 43,298 2,218,156Planet Fitness Inc., Class A(a) . . . . . . . . . . . . . . . . . . . . . . . . . . 29,761 2,431,176Scientific Games Corp./DE, Class A(a)(b) . . . . . . . . . . . . . . . . 21,999 1,406,176SeaWorld Entertainment Inc.(a) . . . . . . . . . . . . . . . . . . . . . . . . . 20,015 1,180,685Shake Shack Inc., Class A(a) . . . . . . . . . . . . . . . . . . . . . . . . . . . 9,732 710,339Six Flags Entertainment Corp.(a) . . . . . . . . . . . . . . . . . . . . . . . . 25,720 940,580Texas Roadhouse Inc. . . . . . . . . . . . . . . . . . . . . . . . . . . . . . . . . . 7,358 610,272Travel + Leisure Co. . . . . . . . . . . . . . . . . . . . . . . . . . . . . . . . . . . . 30,184 1,485,656Wendy's Co. (The) . . . . . . . . . . . . . . . . . . . . . . . . . . . . . . . . . . . . . 64,539 1,328,213Wingstop Inc. . . . . . . . . . . . . . . . . . . . . . . . . . . . . . . . . . . . . . . . . . . 8,301 1,333,141Wyndham Hotels & Resorts Inc. . . . . . . . . . . . . . . . . . . . . . . . . 31,923 2,537,240
31,072,320
Security Shares
Value
Household Durables — 1.7%Cavco Industries Inc.(a). . . . . . . . . . . . . . . . . . . . . . . . . . . . . . . . . 2,304 $ 685,417Century Communities Inc. . . . . . . . . . . . . . . . . . . . . . . . . . . . . . . 11,780 837,205Ethan Allen Interiors Inc. . . . . . . . . . . . . . . . . . . . . . . . . . . . . . . . 27,547 619,808GoPro Inc., Class A(a) . . . . . . . . . . . . . . . . . . . . . . . . . . . . . . . . . . 58,518 585,180Green Brick Partners Inc.(a). . . . . . . . . . . . . . . . . . . . . . . . . . . . . 24,911 621,529Helen of Troy Ltd.(a) . . . . . . . . . . . . . . . . . . . . . . . . . . . . . . . . . . . . 10,496 2,524,288iRobot Corp.(a) . . . . . . . . . . . . . . . . . . . . . . . . . . . . . . . . . . . . . . . . . 10,609 805,329KB Home. . . . . . . . . . . . . . . . . . . . . . . . . . . . . . . . . . . . . . . . . . . . . . 27,636 1,105,164Leggett & Platt Inc.. . . . . . . . . . . . . . . . . . . . . . . . . . . . . . . . . . . . . 37,416 1,511,232LGI Homes Inc.(a)(b) . . . . . . . . . . . . . . . . . . . . . . . . . . . . . . . . . . . . 6,893 990,248Lovesac Co. (The)(a) . . . . . . . . . . . . . . . . . . . . . . . . . . . . . . . . . . . 7,886 499,026MDC Holdings Inc. . . . . . . . . . . . . . . . . . . . . . . . . . . . . . . . . . . . . . 11,846 566,713Meritage Homes Corp.(a) . . . . . . . . . . . . . . . . . . . . . . . . . . . . . . . 11,171 1,260,759Skyline Champion Corp.(a). . . . . . . . . . . . . . . . . . . . . . . . . . . . . . 10,494 821,156Sonos Inc.(a) . . . . . . . . . . . . . . . . . . . . . . . . . . . . . . . . . . . . . . . . . . . 31,218 988,050Taylor Morrison Home Corp.(a) . . . . . . . . . . . . . . . . . . . . . . . . . . 34,216 1,062,749Tempur Sealy International Inc. . . . . . . . . . . . . . . . . . . . . . . . . . 41,106 1,760,981Toll Brothers Inc. . . . . . . . . . . . . . . . . . . . . . . . . . . . . . . . . . . . . . . . 17,735 1,125,640TopBuild Corp.(a) . . . . . . . . . . . . . . . . . . . . . . . . . . . . . . . . . . . . . . . 7,260 1,958,675TRI Pointe Homes Inc.(a) . . . . . . . . . . . . . . . . . . . . . . . . . . . . . . . 33,591 838,767
21,167,916Household Products — 0.1%Spectrum Brands Holdings Inc. . . . . . . . . . . . . . . . . . . . . . . . . . 9,558 956,756
Independent Power and Renewable Electricity Producers — 0.6%Clearway Energy Inc., Class C . . . . . . . . . . . . . . . . . . . . . . . . . 54,526 2,034,910NextEra Energy Partners LP. . . . . . . . . . . . . . . . . . . . . . . . . . . . 31,939 2,716,412Ormat Technologies Inc.. . . . . . . . . . . . . . . . . . . . . . . . . . . . . . . . 15,771 1,190,711Sunnova Energy International Inc.(a) . . . . . . . . . . . . . . . . . . . . 32,663 1,207,551
7,149,584Industrial Conglomerates — 0.1%Raven Industries Inc.(a). . . . . . . . . . . . . . . . . . . . . . . . . . . . . . . . . 24,323 1,412,680
Insurance — 2.0%American Equity Investment Life Holding Co.. . . . . . . . . . . . 18,999 638,936Argo Group International Holdings Ltd. . . . . . . . . . . . . . . . . . . 14,645 794,931Assured Guaranty Ltd. . . . . . . . . . . . . . . . . . . . . . . . . . . . . . . . . . 15,771 772,306Axis Capital Holdings Ltd. . . . . . . . . . . . . . . . . . . . . . . . . . . . . . . 15,662 778,088Brighthouse Financial Inc.(a) . . . . . . . . . . . . . . . . . . . . . . . . . . . . 13,293 646,173BRP Group Inc., Class A(a) . . . . . . . . . . . . . . . . . . . . . . . . . . . . . 17,104 633,532CNO Financial Group Inc. . . . . . . . . . . . . . . . . . . . . . . . . . . . . . . 37,302 845,263First American Financial Corp. . . . . . . . . . . . . . . . . . . . . . . . . . . 40,333 2,991,902Genworth Financial Inc., Class A(a). . . . . . . . . . . . . . . . . . . . . . 107,185 409,447Goosehead Insurance Inc., Class A . . . . . . . . . . . . . . . . . . . . . 5,168 678,662Hanover Insurance Group Inc. (The) . . . . . . . . . . . . . . . . . . . . 16,159 1,967,358Horace Mann Educators Corp.. . . . . . . . . . . . . . . . . . . . . . . . . . 17,036 631,525Kemper Corp. . . . . . . . . . . . . . . . . . . . . . . . . . . . . . . . . . . . . . . . . . 14,647 810,272Kinsale Capital Group Inc.. . . . . . . . . . . . . . . . . . . . . . . . . . . . . . 3,358 698,464Primerica Inc. . . . . . . . . . . . . . . . . . . . . . . . . . . . . . . . . . . . . . . . . . . 13,291 1,955,771ProAssurance Corp. . . . . . . . . . . . . . . . . . . . . . . . . . . . . . . . . . . . 18,305 421,015Reinsurance Group of America Inc. . . . . . . . . . . . . . . . . . . . . . 19,031 1,806,232RenaissanceRe Holdings Ltd. . . . . . . . . . . . . . . . . . . . . . . . . . . 9,126 1,406,408Selective Insurance Group Inc. . . . . . . . . . . . . . . . . . . . . . . . . . 25,247 1,907,158State Auto Financial Corp.. . . . . . . . . . . . . . . . . . . . . . . . . . . . . . 13,283 683,543Stewart Information Services Corp. . . . . . . . . . . . . . . . . . . . . . 8,093 576,383Trupanion Inc.(a) . . . . . . . . . . . . . . . . . . . . . . . . . . . . . . . . . . . . . . . 8,984 1,107,907Unum Group. . . . . . . . . . . . . . . . . . . . . . . . . . . . . . . . . . . . . . . . . . . 49,348 1,139,939
24,301,215Interactive Media & Services — 0.2%Cargurus Inc.(a) . . . . . . . . . . . . . . . . . . . . . . . . . . . . . . . . . . . . . . . . 21,018 788,175
Schedule of Investments (unaudited) (continued)
November 30, 2021
iShares� ESG Aware MSCI USA Small-Cap ETF(Percentages shown are based on Net Assets)
49NM0122U-1995964-51/159

Security Shares
Value
Interactive Media & Services (continued)TripAdvisor Inc.(a) . . . . . . . . . . . . . . . . . . . . . . . . . . . . . . . . . . . . . . 22,566 $ 583,557Vimeo Inc.(a) . . . . . . . . . . . . . . . . . . . . . . . . . . . . . . . . . . . . . . . . . . . 41,775 806,675Yelp Inc.(a) . . . . . . . . . . . . . . . . . . . . . . . . . . . . . . . . . . . . . . . . . . . . . 17,690 606,413
2,784,820Internet & Direct Marketing Retail — 0.3%1-800-Flowers.com Inc., Class A(a). . . . . . . . . . . . . . . . . . . . . . 19,928 593,456Overstock.com Inc.(a) . . . . . . . . . . . . . . . . . . . . . . . . . . . . . . . . . . 11,338 1,012,030Porch Group Inc.(a). . . . . . . . . . . . . . . . . . . . . . . . . . . . . . . . . . . . . 26,634 560,379RealReal Inc. (The)(a) . . . . . . . . . . . . . . . . . . . . . . . . . . . . . . . . . . 41,519 646,451Revolve Group Inc.(a) . . . . . . . . . . . . . . . . . . . . . . . . . . . . . . . . . . 10,893 829,720Stitch Fix Inc., Class A(a) . . . . . . . . . . . . . . . . . . . . . . . . . . . . . . . 22,052 549,094
4,191,130IT Services — 1.4%Alliance Data Systems Corp. . . . . . . . . . . . . . . . . . . . . . . . . . . . 9,337 636,410BigCommerce Holdings Inc., Series 1(a) . . . . . . . . . . . . . . . . . 13,057 591,090Brightcove Inc.(a). . . . . . . . . . . . . . . . . . . . . . . . . . . . . . . . . . . . . . . 65,942 635,022Concentrix Corp.. . . . . . . . . . . . . . . . . . . . . . . . . . . . . . . . . . . . . . . 12,609 2,093,094CSG Systems International Inc.. . . . . . . . . . . . . . . . . . . . . . . . . 17,154 904,187DXC Technology Co.(a) . . . . . . . . . . . . . . . . . . . . . . . . . . . . . . . . . 64,418 1,931,896Euronet Worldwide Inc.(a). . . . . . . . . . . . . . . . . . . . . . . . . . . . . . . 5,983 606,497EVERTEC Inc.. . . . . . . . . . . . . . . . . . . . . . . . . . . . . . . . . . . . . . . . . 15,469 649,543ExlService Holdings Inc.(a). . . . . . . . . . . . . . . . . . . . . . . . . . . . . . 9,928 1,289,349Fastly Inc., Class A(a)(b). . . . . . . . . . . . . . . . . . . . . . . . . . . . . . . . . 27,848 1,135,085LiveRamp Holdings Inc.(a) . . . . . . . . . . . . . . . . . . . . . . . . . . . . . . 12,504 586,813Maximus Inc. . . . . . . . . . . . . . . . . . . . . . . . . . . . . . . . . . . . . . . . . . . 8,118 612,503Perficient Inc.(a) . . . . . . . . . . . . . . . . . . . . . . . . . . . . . . . . . . . . . . . . 8,272 1,133,512Rackspace Technology Inc.(a)(b). . . . . . . . . . . . . . . . . . . . . . . . . 40,947 583,904Sabre Corp.(a) . . . . . . . . . . . . . . . . . . . . . . . . . . . . . . . . . . . . . . . . . 78,378 590,186TTEC Holdings Inc. . . . . . . . . . . . . . . . . . . . . . . . . . . . . . . . . . . . . 7,707 650,394Unisys Corp.(a). . . . . . . . . . . . . . . . . . . . . . . . . . . . . . . . . . . . . . . . . 33,784 613,517Verra Mobility Corp.(a) . . . . . . . . . . . . . . . . . . . . . . . . . . . . . . . . . . 43,803 630,325WEX Inc.(a) . . . . . . . . . . . . . . . . . . . . . . . . . . . . . . . . . . . . . . . . . . . . 16,264 2,056,095
17,929,422Leisure Products — 0.8%Brunswick Corp./DE. . . . . . . . . . . . . . . . . . . . . . . . . . . . . . . . . . . . 16,579 1,556,934Callaway Golf Co.(a). . . . . . . . . . . . . . . . . . . . . . . . . . . . . . . . . . . . 34,309 924,971Johnson Outdoors Inc., Class A . . . . . . . . . . . . . . . . . . . . . . . . 6,215 646,608Malibu Boats Inc., Class A(a). . . . . . . . . . . . . . . . . . . . . . . . . . . . 10,109 702,272Mattel Inc.(a) . . . . . . . . . . . . . . . . . . . . . . . . . . . . . . . . . . . . . . . . . . . 91,009 1,930,301Polaris Inc. . . . . . . . . . . . . . . . . . . . . . . . . . . . . . . . . . . . . . . . . . . . . 10,824 1,210,015YETI Holdings Inc.(a) . . . . . . . . . . . . . . . . . . . . . . . . . . . . . . . . . . . 26,238 2,418,094
9,389,195Life Sciences Tools & Services — 1.1%Adaptive Biotechnologies Corp.(a). . . . . . . . . . . . . . . . . . . . . . . 30,727 801,668BioNano Genomics Inc.(a) . . . . . . . . . . . . . . . . . . . . . . . . . . . . . . 150,619 588,920Bruker Corp.. . . . . . . . . . . . . . . . . . . . . . . . . . . . . . . . . . . . . . . . . . . 9,904 802,125Codexis Inc.(a) . . . . . . . . . . . . . . . . . . . . . . . . . . . . . . . . . . . . . . . . . 18,040 626,168Maravai LifeSciences Holdings Inc., Class A(a) . . . . . . . . . . 18,163 834,408Medpace Holdings Inc.(a) . . . . . . . . . . . . . . . . . . . . . . . . . . . . . . . 6,042 1,253,171NanoString Technologies Inc.(a) . . . . . . . . . . . . . . . . . . . . . . . . . 15,068 619,295NeoGenomics Inc.(a) . . . . . . . . . . . . . . . . . . . . . . . . . . . . . . . . . . . 41,930 1,436,522Pacific Biosciences of California Inc.(a) . . . . . . . . . . . . . . . . . . 40,705 944,763Repligen Corp.(a). . . . . . . . . . . . . . . . . . . . . . . . . . . . . . . . . . . . . . . 14,072 4,031,628Syneos Health Inc.(a) . . . . . . . . . . . . . . . . . . . . . . . . . . . . . . . . . . . 16,995 1,651,234
13,589,902Machinery — 4.2%AGCO Corp.. . . . . . . . . . . . . . . . . . . . . . . . . . . . . . . . . . . . . . . . . . . 12,146 1,338,611Alamo Group Inc. . . . . . . . . . . . . . . . . . . . . . . . . . . . . . . . . . . . . . . 4,537 645,252Allison Transmission Holdings Inc. . . . . . . . . . . . . . . . . . . . . . . 39,043 1,350,497
Security Shares
Value
Machinery (continued)Altra Industrial Motion Corp. . . . . . . . . . . . . . . . . . . . . . . . . . . . . 14,138 $ 745,214Astec Industries Inc. . . . . . . . . . . . . . . . . . . . . . . . . . . . . . . . . . . . 12,299 770,901Chart Industries Inc.(a). . . . . . . . . . . . . . . . . . . . . . . . . . . . . . . . . . 9,845 1,718,445Columbus McKinnon Corp./NY . . . . . . . . . . . . . . . . . . . . . . . . . 14,913 662,435Donaldson Co. Inc. . . . . . . . . . . . . . . . . . . . . . . . . . . . . . . . . . . . . 29,793 1,681,219Douglas Dynamics Inc. . . . . . . . . . . . . . . . . . . . . . . . . . . . . . . . . . 15,379 611,315Energy Recovery Inc.(a) . . . . . . . . . . . . . . . . . . . . . . . . . . . . . . . . 34,984 743,410Enerpac Tool Group Corp. . . . . . . . . . . . . . . . . . . . . . . . . . . . . . . 30,104 635,495EnPro Industries Inc. . . . . . . . . . . . . . . . . . . . . . . . . . . . . . . . . . . . 8,520 869,040ESCO Technologies Inc. . . . . . . . . . . . . . . . . . . . . . . . . . . . . . . . 7,653 625,556Evoqua Water Technologies Corp.(a) . . . . . . . . . . . . . . . . . . . . 38,281 1,721,879Federal Signal Corp. . . . . . . . . . . . . . . . . . . . . . . . . . . . . . . . . . . . 20,327 862,475Flowserve Corp. . . . . . . . . . . . . . . . . . . . . . . . . . . . . . . . . . . . . . . . 46,462 1,392,931Franklin Electric Co. Inc. . . . . . . . . . . . . . . . . . . . . . . . . . . . . . . . 13,317 1,172,562Graco Inc. . . . . . . . . . . . . . . . . . . . . . . . . . . . . . . . . . . . . . . . . . . . . . 35,105 2,558,803Hillenbrand Inc. . . . . . . . . . . . . . . . . . . . . . . . . . . . . . . . . . . . . . . . . 20,123 897,486Hyster-Yale Materials Handling Inc. . . . . . . . . . . . . . . . . . . . . . 16,088 631,615ITT Inc.. . . . . . . . . . . . . . . . . . . . . . . . . . . . . . . . . . . . . . . . . . . . . . . . 32,269 3,052,002John Bean Technologies Corp. . . . . . . . . . . . . . . . . . . . . . . . . . 8,404 1,325,899Lincoln Electric Holdings Inc. . . . . . . . . . . . . . . . . . . . . . . . . . . . 4,624 624,055Lindsay Corp.. . . . . . . . . . . . . . . . . . . . . . . . . . . . . . . . . . . . . . . . . . 4,736 689,183Luxfer Holdings PLC . . . . . . . . . . . . . . . . . . . . . . . . . . . . . . . . . . . 35,850 680,433Manitowoc Co. Inc. (The)(a). . . . . . . . . . . . . . . . . . . . . . . . . . . . . 32,418 617,887Meritor Inc.(a) . . . . . . . . . . . . . . . . . . . . . . . . . . . . . . . . . . . . . . . . . . 25,138 635,740Middleby Corp. (The)(a). . . . . . . . . . . . . . . . . . . . . . . . . . . . . . . . . 11,360 1,984,365Mueller Water Products Inc., Class A. . . . . . . . . . . . . . . . . . . . 106,946 1,458,743Nikola Corp.(a) . . . . . . . . . . . . . . . . . . . . . . . . . . . . . . . . . . . . . . . . . 53,887 550,725Oshkosh Corp.. . . . . . . . . . . . . . . . . . . . . . . . . . . . . . . . . . . . . . . . . 29,016 3,122,122Proto Labs Inc.(a) . . . . . . . . . . . . . . . . . . . . . . . . . . . . . . . . . . . . . . 12,299 616,426Shyft Group Inc. (The) . . . . . . . . . . . . . . . . . . . . . . . . . . . . . . . . . 13,069 635,284SPX Corp.(a) . . . . . . . . . . . . . . . . . . . . . . . . . . . . . . . . . . . . . . . . . . . 10,342 601,387SPX FLOW Inc.. . . . . . . . . . . . . . . . . . . . . . . . . . . . . . . . . . . . . . . . 11,327 945,918Tennant Co. . . . . . . . . . . . . . . . . . . . . . . . . . . . . . . . . . . . . . . . . . . . 15,900 1,250,694Terex Corp. . . . . . . . . . . . . . . . . . . . . . . . . . . . . . . . . . . . . . . . . . . . . 19,323 818,909Timken Co. (The) . . . . . . . . . . . . . . . . . . . . . . . . . . . . . . . . . . . . . . 17,312 1,139,649Toro Co. (The) . . . . . . . . . . . . . . . . . . . . . . . . . . . . . . . . . . . . . . . . . 36,791 3,699,703Trinity Industries Inc. . . . . . . . . . . . . . . . . . . . . . . . . . . . . . . . . . . . 24,109 638,889Wabash National Corp.. . . . . . . . . . . . . . . . . . . . . . . . . . . . . . . . . 38,000 634,600Watts Water Technologies Inc., Class A . . . . . . . . . . . . . . . . . 13,026 2,458,137Welbilt Inc.(a) . . . . . . . . . . . . . . . . . . . . . . . . . . . . . . . . . . . . . . . . . . 48,477 1,142,118Woodward Inc.. . . . . . . . . . . . . . . . . . . . . . . . . . . . . . . . . . . . . . . . . 13,567 1,435,389
52,393,398Media — 1.0%Altice USA Inc., Class A(a) . . . . . . . . . . . . . . . . . . . . . . . . . . . . . . 38,083 603,235Cardlytics Inc.(a) . . . . . . . . . . . . . . . . . . . . . . . . . . . . . . . . . . . . . . . 10,281 694,790Clear Channel Outdoor Holdings Inc.(a) . . . . . . . . . . . . . . . . . 203,870 625,881EW Scripps Co. (The), Class A . . . . . . . . . . . . . . . . . . . . . . . . . 42,429 786,209Gray Television Inc. . . . . . . . . . . . . . . . . . . . . . . . . . . . . . . . . . . . . 43,492 896,805Iheartmedia Inc., Class A(a) . . . . . . . . . . . . . . . . . . . . . . . . . . . . . 36,607 717,863John Wiley & Sons Inc., Class A . . . . . . . . . . . . . . . . . . . . . . . . 20,802 1,081,288Magnite Inc.(a) . . . . . . . . . . . . . . . . . . . . . . . . . . . . . . . . . . . . . . . . . 31,640 557,813New York Times Co. (The), Class A . . . . . . . . . . . . . . . . . . . . . 47,909 2,275,677Nexstar Media Group Inc., Class A. . . . . . . . . . . . . . . . . . . . . . 10,058 1,503,671Scholastic Corp. . . . . . . . . . . . . . . . . . . . . . . . . . . . . . . . . . . . . . . . 18,692 703,567TEGNA Inc.. . . . . . . . . . . . . . . . . . . . . . . . . . . . . . . . . . . . . . . . . . . . 73,764 1,456,839WideOpenWest Inc.(a). . . . . . . . . . . . . . . . . . . . . . . . . . . . . . . . . . 35,151 653,809
12,557,447Metals & Mining — 1.5%Alcoa Corp.. . . . . . . . . . . . . . . . . . . . . . . . . . . . . . . . . . . . . . . . . . . . 51,417 2,392,433
Schedule of Investments (unaudited) (continued)
November 30, 2021
iShares� ESG Aware MSCI USA Small-Cap ETF(Percentages shown are based on Net Assets)
50 NM0122U-1995964-52/159

Security Shares
Value
Metals & Mining (continued)Allegheny Technologies Inc.(a) . . . . . . . . . . . . . . . . . . . . . . . . . . 41,596 $ 592,327Arconic Corp.(a) . . . . . . . . . . . . . . . . . . . . . . . . . . . . . . . . . . . . . . . . 32,726 874,439Cleveland-Cliffs Inc.(a) . . . . . . . . . . . . . . . . . . . . . . . . . . . . . . . . . . 112,816 2,295,806Coeur Mining Inc.(a) . . . . . . . . . . . . . . . . . . . . . . . . . . . . . . . . . . . . 99,575 557,620Commercial Metals Co. . . . . . . . . . . . . . . . . . . . . . . . . . . . . . . . . 40,503 1,251,543Compass Minerals International Inc. . . . . . . . . . . . . . . . . . . . . 18,998 924,253Hecla Mining Co. . . . . . . . . . . . . . . . . . . . . . . . . . . . . . . . . . . . . . . 108,277 599,854Materion Corp.. . . . . . . . . . . . . . . . . . . . . . . . . . . . . . . . . . . . . . . . . 7,174 607,351MP Materials Corp.(a) . . . . . . . . . . . . . . . . . . . . . . . . . . . . . . . . . . 15,243 669,777Reliance Steel & Aluminum Co.. . . . . . . . . . . . . . . . . . . . . . . . . 21,299 3,165,670Royal Gold Inc. . . . . . . . . . . . . . . . . . . . . . . . . . . . . . . . . . . . . . . . . 23,564 2,357,107Schnitzer Steel Industries Inc., Class A. . . . . . . . . . . . . . . . . . 19,633 944,347United States Steel Corp. . . . . . . . . . . . . . . . . . . . . . . . . . . . . . . 48,498 1,096,540
18,329,067Mortgage Real Estate Investment — 0.6%Apollo Commercial Real Estate Finance Inc. . . . . . . . . . . . . 49,246 666,298Blackstone Mortgage Trust Inc., Class A . . . . . . . . . . . . . . . . 19,736 592,080Chimera Investment Corp.. . . . . . . . . . . . . . . . . . . . . . . . . . . . . . 40,254 640,038Hannon Armstrong Sustainable Infrastructure
Capital Inc. . . . . . . . . . . . . . . . . . . . . . . . . . . . . . . . . . . . . . . . . . 29,069 1,653,445KKR Real Estate Finance Trust Inc.. . . . . . . . . . . . . . . . . . . . . 31,563 651,145New Residential Investment Corp. . . . . . . . . . . . . . . . . . . . . . . 62,725 666,767Redwood Trust Inc. . . . . . . . . . . . . . . . . . . . . . . . . . . . . . . . . . . . . 52,662 675,127Starwood Property Trust Inc. . . . . . . . . . . . . . . . . . . . . . . . . . . . 85,253 2,127,915
7,672,815Multi-Utilities — 0.5%Avista Corp. . . . . . . . . . . . . . . . . . . . . . . . . . . . . . . . . . . . . . . . . . . . 59,299 2,283,604MDU Resources Group Inc. . . . . . . . . . . . . . . . . . . . . . . . . . . . . 134,398 3,659,658Unitil Corp. . . . . . . . . . . . . . . . . . . . . . . . . . . . . . . . . . . . . . . . . . . . . 16,326 676,549
6,619,811Multiline Retail — 0.6%Big Lots Inc. . . . . . . . . . . . . . . . . . . . . . . . . . . . . . . . . . . . . . . . . . . . 14,175 614,912Dillard's Inc., Class A. . . . . . . . . . . . . . . . . . . . . . . . . . . . . . . . . . . 1,817 497,676Franchise Group Inc.. . . . . . . . . . . . . . . . . . . . . . . . . . . . . . . . . . . 14,818 707,560Kohl's Corp. . . . . . . . . . . . . . . . . . . . . . . . . . . . . . . . . . . . . . . . . . . . 40,983 2,099,559Macy's Inc. . . . . . . . . . . . . . . . . . . . . . . . . . . . . . . . . . . . . . . . . . . . . 58,451 1,665,853Nordstrom Inc.(a) . . . . . . . . . . . . . . . . . . . . . . . . . . . . . . . . . . . . . . . 35,621 754,097Ollie's Bargain Outlet Holdings Inc.(a)(b) . . . . . . . . . . . . . . . . . 9,907 613,144
6,952,801Oil, Gas & Consumable Fuels — 3.1%Antero Midstream Corp. . . . . . . . . . . . . . . . . . . . . . . . . . . . . . . . . 100,481 975,671Antero Resources Corp.(a)(b). . . . . . . . . . . . . . . . . . . . . . . . . . . . 80,791 1,418,690APA Corp. . . . . . . . . . . . . . . . . . . . . . . . . . . . . . . . . . . . . . . . . . . . . . 106,075 2,733,553California Resources Corp. . . . . . . . . . . . . . . . . . . . . . . . . . . . . . 15,841 618,908Callon Petroleum Co.(a)(b) . . . . . . . . . . . . . . . . . . . . . . . . . . . . . . 12,434 632,145Centennial Resource Development Inc./DE, Class A(a) . . . 94,405 588,143Chesapeake Energy Corp. . . . . . . . . . . . . . . . . . . . . . . . . . . . . . 10,420 620,407Civitas Resources Inc. . . . . . . . . . . . . . . . . . . . . . . . . . . . . . . . . . 12,177 622,366Clean Energy Fuels Corp.(a) . . . . . . . . . . . . . . . . . . . . . . . . . . . . 85,732 614,698CNX Resources Corp.(a) . . . . . . . . . . . . . . . . . . . . . . . . . . . . . . . 68,342 932,185Delek U.S. Holdings Inc.(a) . . . . . . . . . . . . . . . . . . . . . . . . . . . . . 40,669 637,690Denbury Inc.(a) . . . . . . . . . . . . . . . . . . . . . . . . . . . . . . . . . . . . . . . . . 10,965 873,033DTE Midstream LLC(a) . . . . . . . . . . . . . . . . . . . . . . . . . . . . . . . . . 19,729 904,969EnLink Midstream LLC . . . . . . . . . . . . . . . . . . . . . . . . . . . . . . . . . 95,101 619,108EQT Corp.(a). . . . . . . . . . . . . . . . . . . . . . . . . . . . . . . . . . . . . . . . . . . 92,585 1,798,927Equitrans Midstream Corp. . . . . . . . . . . . . . . . . . . . . . . . . . . . . . 132,516 1,274,804Green Plains Inc.(a) . . . . . . . . . . . . . . . . . . . . . . . . . . . . . . . . . . . . 13,938 538,704HollyFrontier Corp. . . . . . . . . . . . . . . . . . . . . . . . . . . . . . . . . . . . . . 50,539 1,633,420Kosmos Energy Ltd.(a) . . . . . . . . . . . . . . . . . . . . . . . . . . . . . . . . . 198,394 726,122
Security Shares
Value
Oil, Gas & Consumable Fuels (continued)Marathon Oil Corp.. . . . . . . . . . . . . . . . . . . . . . . . . . . . . . . . . . . . . 224,435 $ 3,476,498Matador Resources Co. . . . . . . . . . . . . . . . . . . . . . . . . . . . . . . . . 25,989 1,020,588Murphy Oil Corp.. . . . . . . . . . . . . . . . . . . . . . . . . . . . . . . . . . . . . . . 40,366 1,072,928Oasis Petroleum Inc. . . . . . . . . . . . . . . . . . . . . . . . . . . . . . . . . . . . 6,446 772,875Ovintiv Inc. . . . . . . . . . . . . . . . . . . . . . . . . . . . . . . . . . . . . . . . . . . . . 87,625 3,045,845PDC Energy Inc. . . . . . . . . . . . . . . . . . . . . . . . . . . . . . . . . . . . . . . . 20,736 1,045,716Range Resources Corp.(a). . . . . . . . . . . . . . . . . . . . . . . . . . . . . . 71,705 1,402,550Renewable Energy Group Inc.(a)(b) . . . . . . . . . . . . . . . . . . . . . . 17,123 818,137SM Energy Co. . . . . . . . . . . . . . . . . . . . . . . . . . . . . . . . . . . . . . . . . 30,285 878,265Southwestern Energy Co.(a) . . . . . . . . . . . . . . . . . . . . . . . . . . . . 189,298 848,055Targa Resources Corp.. . . . . . . . . . . . . . . . . . . . . . . . . . . . . . . . . 52,966 2,734,635Texas Pacific Land Corp. . . . . . . . . . . . . . . . . . . . . . . . . . . . . . . . 1,343 1,623,378Whiting Petroleum Corp.(a) . . . . . . . . . . . . . . . . . . . . . . . . . . . . . 9,689 626,781World Fuel Services Corp.. . . . . . . . . . . . . . . . . . . . . . . . . . . . . . 31,711 792,458
38,922,252Paper & Forest Products — 0.2%Glatfelter Corp. . . . . . . . . . . . . . . . . . . . . . . . . . . . . . . . . . . . . . . . . 38,495 634,013Louisiana-Pacific Corp.. . . . . . . . . . . . . . . . . . . . . . . . . . . . . . . . . 26,097 1,705,439
2,339,452Personal Products — 0.3%Coty Inc., Class A(a) . . . . . . . . . . . . . . . . . . . . . . . . . . . . . . . . . . . . 62,017 603,425Edgewell Personal Care Co.. . . . . . . . . . . . . . . . . . . . . . . . . . . . 27,464 1,166,122Herbalife Nutrition Ltd.(a) . . . . . . . . . . . . . . . . . . . . . . . . . . . . . . . 27,708 1,035,171Medifast Inc.. . . . . . . . . . . . . . . . . . . . . . . . . . . . . . . . . . . . . . . . . . . 4,108 845,180Veru Inc.(a) . . . . . . . . . . . . . . . . . . . . . . . . . . . . . . . . . . . . . . . . . . . . 81,786 613,395
4,263,293Pharmaceuticals — 1.3%Aclaris Therapeutics Inc.(a) . . . . . . . . . . . . . . . . . . . . . . . . . . . . . 49,289 630,899Antares Pharma Inc.(a) . . . . . . . . . . . . . . . . . . . . . . . . . . . . . . . . . 193,767 625,867Arvinas Inc.(a). . . . . . . . . . . . . . . . . . . . . . . . . . . . . . . . . . . . . . . . . . 12,567 950,191Axsome Therapeutics Inc.(a) . . . . . . . . . . . . . . . . . . . . . . . . . . . . 18,719 646,554Cassava Sciences Inc.(a) . . . . . . . . . . . . . . . . . . . . . . . . . . . . . . . 13,744 735,167Corcept Therapeutics Inc.(a) . . . . . . . . . . . . . . . . . . . . . . . . . . . . 31,764 667,044Intra-Cellular Therapies Inc.(a) . . . . . . . . . . . . . . . . . . . . . . . . . . 23,863 965,974Nektar Therapeutics(a) . . . . . . . . . . . . . . . . . . . . . . . . . . . . . . . . . 56,908 640,784NGM Biopharmaceuticals Inc.(a) . . . . . . . . . . . . . . . . . . . . . . . . 33,241 599,003Nuvation Bio Inc.(a). . . . . . . . . . . . . . . . . . . . . . . . . . . . . . . . . . . . . 74,734 670,364Organon & Co.. . . . . . . . . . . . . . . . . . . . . . . . . . . . . . . . . . . . . . . . . 55,710 1,628,403Pacira BioSciences Inc.(a) . . . . . . . . . . . . . . . . . . . . . . . . . . . . . . 12,072 635,229Perrigo Co. PLC . . . . . . . . . . . . . . . . . . . . . . . . . . . . . . . . . . . . . . . 43,846 1,609,587Phathom Pharmaceuticals Inc.(a) . . . . . . . . . . . . . . . . . . . . . . . 31,780 570,133Provention Bio Inc.(a)(b) . . . . . . . . . . . . . . . . . . . . . . . . . . . . . . . . . 103,104 711,418Reata Pharmaceuticals Inc., Class A(a)(b) . . . . . . . . . . . . . . . . 7,577 648,591Relmada Therapeutics Inc.(a) . . . . . . . . . . . . . . . . . . . . . . . . . . . 31,582 564,055Revance Therapeutics Inc.(a) . . . . . . . . . . . . . . . . . . . . . . . . . . . 47,246 646,325Theravance Biopharma Inc.(a) . . . . . . . . . . . . . . . . . . . . . . . . . . 83,578 702,055Tilray Inc., Class 2 (a)(b). . . . . . . . . . . . . . . . . . . . . . . . . . . . . . . . . 115,797 1,171,866Zogenix Inc.(a) . . . . . . . . . . . . . . . . . . . . . . . . . . . . . . . . . . . . . . . . . 49,398 555,727
16,575,236Professional Services — 1.8%ASGN Inc.(a) . . . . . . . . . . . . . . . . . . . . . . . . . . . . . . . . . . . . . . . . . . . 18,586 2,261,545CACI International Inc., Class A(a) . . . . . . . . . . . . . . . . . . . . . . 4,595 1,192,081Exponent Inc. . . . . . . . . . . . . . . . . . . . . . . . . . . . . . . . . . . . . . . . . . . 9,168 1,068,072FTI Consulting Inc.(a) . . . . . . . . . . . . . . . . . . . . . . . . . . . . . . . . . . . 12,115 1,769,880Heidrick & Struggles International Inc.. . . . . . . . . . . . . . . . . . . 15,299 660,458ICF International Inc. . . . . . . . . . . . . . . . . . . . . . . . . . . . . . . . . . . . 11,231 1,086,487Insperity Inc.. . . . . . . . . . . . . . . . . . . . . . . . . . . . . . . . . . . . . . . . . . . 9,264 1,072,215KBR Inc. . . . . . . . . . . . . . . . . . . . . . . . . . . . . . . . . . . . . . . . . . . . . . . 21,272 935,968Kelly Services Inc., Class A, NVS . . . . . . . . . . . . . . . . . . . . . . . 64,723 1,091,230
Schedule of Investments (unaudited) (continued)
November 30, 2021
iShares� ESG Aware MSCI USA Small-Cap ETF(Percentages shown are based on Net Assets)
51NM0122U-1995964-53/159

Security Shares
Value
Professional Services (continued)Kforce Inc.. . . . . . . . . . . . . . . . . . . . . . . . . . . . . . . . . . . . . . . . . . . . . 8,984 $ 688,444Korn Ferry . . . . . . . . . . . . . . . . . . . . . . . . . . . . . . . . . . . . . . . . . . . . . 18,222 1,325,468ManpowerGroup Inc.. . . . . . . . . . . . . . . . . . . . . . . . . . . . . . . . . . . 23,032 2,064,358Nielsen Holdings PLC . . . . . . . . . . . . . . . . . . . . . . . . . . . . . . . . . . 107,037 2,050,829Science Applications International Corp. . . . . . . . . . . . . . . . . 8,845 742,007TriNet Group Inc.(a) . . . . . . . . . . . . . . . . . . . . . . . . . . . . . . . . . . . . 16,427 1,647,628TrueBlue Inc.(a) . . . . . . . . . . . . . . . . . . . . . . . . . . . . . . . . . . . . . . . . 34,494 897,534Upwork Inc.(a). . . . . . . . . . . . . . . . . . . . . . . . . . . . . . . . . . . . . . . . . . 34,589 1,288,786
21,842,990Real Estate Management & Development — 0.9%Cushman & Wakefield PLC(a). . . . . . . . . . . . . . . . . . . . . . . . . . . 74,925 1,324,674eXp World Holdings Inc.. . . . . . . . . . . . . . . . . . . . . . . . . . . . . . . . 16,081 590,334Howard Hughes Corp. (The)(a). . . . . . . . . . . . . . . . . . . . . . . . . . 15,401 1,262,728Jones Lang LaSalle Inc.(a)(b) . . . . . . . . . . . . . . . . . . . . . . . . . . . . 15,579 3,659,663Kennedy-Wilson Holdings Inc. . . . . . . . . . . . . . . . . . . . . . . . . . . 31,147 675,578Newmark Group Inc., Class A . . . . . . . . . . . . . . . . . . . . . . . . . . 39,721 637,919Opendoor Technologies Inc.(a) . . . . . . . . . . . . . . . . . . . . . . . . . . 32,116 508,718Realogy Holdings Corp.(a) . . . . . . . . . . . . . . . . . . . . . . . . . . . . . . 41,584 631,661Redfin Corp.(a) . . . . . . . . . . . . . . . . . . . . . . . . . . . . . . . . . . . . . . . . . 15,589 634,316St Joe Co. (The) . . . . . . . . . . . . . . . . . . . . . . . . . . . . . . . . . . . . . . . 13,599 652,888Tejon Ranch Co.(a) . . . . . . . . . . . . . . . . . . . . . . . . . . . . . . . . . . . . . 34,678 634,607
11,213,086Road & Rail — 1.3%ArcBest Corp. . . . . . . . . . . . . . . . . . . . . . . . . . . . . . . . . . . . . . . . . . 9,057 933,596Avis Budget Group Inc.(a). . . . . . . . . . . . . . . . . . . . . . . . . . . . . . . 13,708 3,764,080Landstar System Inc.. . . . . . . . . . . . . . . . . . . . . . . . . . . . . . . . . . . 16,046 2,704,553Ryder System Inc. . . . . . . . . . . . . . . . . . . . . . . . . . . . . . . . . . . . . . 24,276 2,016,850Saia Inc.(a). . . . . . . . . . . . . . . . . . . . . . . . . . . . . . . . . . . . . . . . . . . . . 7,303 2,418,607Schneider National Inc., Class B. . . . . . . . . . . . . . . . . . . . . . . . 28,276 695,590Werner Enterprises Inc. . . . . . . . . . . . . . . . . . . . . . . . . . . . . . . . . 36,611 1,651,522XPO Logistics Inc.(a) . . . . . . . . . . . . . . . . . . . . . . . . . . . . . . . . . . . 20,895 1,513,634
15,698,432Semiconductors & Semiconductor Equipment — 3.0%Ambarella Inc.(a) . . . . . . . . . . . . . . . . . . . . . . . . . . . . . . . . . . . . . . . 7,359 1,321,088Amkor Technology Inc. . . . . . . . . . . . . . . . . . . . . . . . . . . . . . . . . . 30,486 657,278Axcelis Technologies Inc.(a) . . . . . . . . . . . . . . . . . . . . . . . . . . . . . 10,670 659,619Brooks Automation Inc.. . . . . . . . . . . . . . . . . . . . . . . . . . . . . . . . . 16,618 1,879,496Cirrus Logic Inc.(a) . . . . . . . . . . . . . . . . . . . . . . . . . . . . . . . . . . . . . 21,316 1,709,117CMC Materials Inc.. . . . . . . . . . . . . . . . . . . . . . . . . . . . . . . . . . . . . 4,499 597,467First Solar Inc.(a) . . . . . . . . . . . . . . . . . . . . . . . . . . . . . . . . . . . . . . . 31,015 3,213,154Ichor Holdings Ltd.(a) . . . . . . . . . . . . . . . . . . . . . . . . . . . . . . . . . . . 17,271 827,108Kulicke & Soffa Industries Inc. . . . . . . . . . . . . . . . . . . . . . . . . . . 24,961 1,439,251Lattice Semiconductor Corp.(a). . . . . . . . . . . . . . . . . . . . . . . . . . 33,056 2,509,942MaxLinear Inc.(a) . . . . . . . . . . . . . . . . . . . . . . . . . . . . . . . . . . . . . . . 13,891 935,281MKS Instruments Inc. . . . . . . . . . . . . . . . . . . . . . . . . . . . . . . . . . . 5,912 899,570Onto Innovation Inc.(a). . . . . . . . . . . . . . . . . . . . . . . . . . . . . . . . . . 20,661 1,945,440Power Integrations Inc. . . . . . . . . . . . . . . . . . . . . . . . . . . . . . . . . . 15,610 1,561,468Rambus Inc.(a) . . . . . . . . . . . . . . . . . . . . . . . . . . . . . . . . . . . . . . . . . 42,774 1,150,621Semtech Corp.(a). . . . . . . . . . . . . . . . . . . . . . . . . . . . . . . . . . . . . . . 13,757 1,178,562Silicon Laboratories Inc.(a) . . . . . . . . . . . . . . . . . . . . . . . . . . . . . . 11,712 2,298,714SiTime Corp.(a) . . . . . . . . . . . . . . . . . . . . . . . . . . . . . . . . . . . . . . . . 2,346 700,234SunPower Corp.(a) . . . . . . . . . . . . . . . . . . . . . . . . . . . . . . . . . . . . . 22,598 647,433Synaptics Inc.(a) . . . . . . . . . . . . . . . . . . . . . . . . . . . . . . . . . . . . . . . 10,631 3,000,493Ultra Clean Holdings Inc.(a) . . . . . . . . . . . . . . . . . . . . . . . . . . . . . 13,876 760,544Universal Display Corp. . . . . . . . . . . . . . . . . . . . . . . . . . . . . . . . . 15,950 2,281,648Veeco Instruments Inc.(a) . . . . . . . . . . . . . . . . . . . . . . . . . . . . . . . 35,453 942,341Wolfspeed Inc.(a). . . . . . . . . . . . . . . . . . . . . . . . . . . . . . . . . . . . . . . 36,787 4,510,822
37,626,691
Security Shares
Value
Software — 6.0%8x8 Inc.(a) . . . . . . . . . . . . . . . . . . . . . . . . . . . . . . . . . . . . . . . . . . . . . 32,447 $ 699,233ACI Worldwide Inc.(a). . . . . . . . . . . . . . . . . . . . . . . . . . . . . . . . . . . 51,157 1,490,715Alarm.com Holdings Inc.(a) . . . . . . . . . . . . . . . . . . . . . . . . . . . . . 8,123 648,134Altair Engineering Inc., Class A(a)(b) . . . . . . . . . . . . . . . . . . . . . 16,240 1,209,068Alteryx Inc., Class A(a). . . . . . . . . . . . . . . . . . . . . . . . . . . . . . . . . . 11,419 759,021Anaplan Inc.(a)(b) . . . . . . . . . . . . . . . . . . . . . . . . . . . . . . . . . . . . . . . 31,438 1,345,861Appian Corp.(a)(b) . . . . . . . . . . . . . . . . . . . . . . . . . . . . . . . . . . . . . . 10,344 769,076Aspen Technology Inc.(a) . . . . . . . . . . . . . . . . . . . . . . . . . . . . . . . 19,488 2,826,345Avaya Holdings Corp.(a) . . . . . . . . . . . . . . . . . . . . . . . . . . . . . . . . 36,811 716,710Blackbaud Inc.(a) . . . . . . . . . . . . . . . . . . . . . . . . . . . . . . . . . . . . . . . 10,399 784,709Blackline Inc.(a) . . . . . . . . . . . . . . . . . . . . . . . . . . . . . . . . . . . . . . . . 20,095 2,211,455Bottomline Technologies DE Inc.(a). . . . . . . . . . . . . . . . . . . . . . 17,274 774,566Box Inc., Class A(a). . . . . . . . . . . . . . . . . . . . . . . . . . . . . . . . . . . . . 59,357 1,389,547BTRS Holdings Inc.(a) . . . . . . . . . . . . . . . . . . . . . . . . . . . . . . . . . . 76,184 568,333CDK Global Inc. . . . . . . . . . . . . . . . . . . . . . . . . . . . . . . . . . . . . . . . 29,464 1,138,489Cerence Inc.(a) . . . . . . . . . . . . . . . . . . . . . . . . . . . . . . . . . . . . . . . . . 10,748 808,035CommVault Systems Inc.(a) . . . . . . . . . . . . . . . . . . . . . . . . . . . . . 11,481 721,925Digital Turbine Inc.(a) . . . . . . . . . . . . . . . . . . . . . . . . . . . . . . . . . . . 18,243 967,974Dolby Laboratories Inc., Class A . . . . . . . . . . . . . . . . . . . . . . . . 18,885 1,575,198Domo Inc., Class B(a) . . . . . . . . . . . . . . . . . . . . . . . . . . . . . . . . . . 7,820 565,777Duck Creek Technologies Inc.(a) . . . . . . . . . . . . . . . . . . . . . . . . 23,564 673,695E2open Parent Holdings Inc.(a) . . . . . . . . . . . . . . . . . . . . . . . . . 51,813 631,082Elastic NV(a) . . . . . . . . . . . . . . . . . . . . . . . . . . . . . . . . . . . . . . . . . . . 18,210 2,830,927Envestnet Inc.(a) . . . . . . . . . . . . . . . . . . . . . . . . . . . . . . . . . . . . . . . 10,438 800,281Everbridge Inc.(a) . . . . . . . . . . . . . . . . . . . . . . . . . . . . . . . . . . . . . . 7,712 874,695Five9 Inc.(a). . . . . . . . . . . . . . . . . . . . . . . . . . . . . . . . . . . . . . . . . . . . 20,655 2,939,826InterDigital Inc.. . . . . . . . . . . . . . . . . . . . . . . . . . . . . . . . . . . . . . . . . 9,876 670,679Jamf Holding Corp.(a)(b) . . . . . . . . . . . . . . . . . . . . . . . . . . . . . . . . 33,510 1,080,027LivePerson Inc.(a)(b) . . . . . . . . . . . . . . . . . . . . . . . . . . . . . . . . . . . . 19,558 756,112MANDIANT Inc.(a). . . . . . . . . . . . . . . . . . . . . . . . . . . . . . . . . . . . . . 63,450 1,076,747Manhattan Associates Inc.(a). . . . . . . . . . . . . . . . . . . . . . . . . . . . 15,607 2,437,189Marathon Digital Holdings Inc.(a) . . . . . . . . . . . . . . . . . . . . . . . . 23,458 1,198,000MicroStrategy Inc., Class A(a)(b) . . . . . . . . . . . . . . . . . . . . . . . . . 1,835 1,323,824Mimecast Ltd.(a) . . . . . . . . . . . . . . . . . . . . . . . . . . . . . . . . . . . . . . . 17,215 1,394,415Model N Inc.(a) . . . . . . . . . . . . . . . . . . . . . . . . . . . . . . . . . . . . . . . . . 23,464 659,338Momentive Global Inc.(a) . . . . . . . . . . . . . . . . . . . . . . . . . . . . . . . 46,523 950,465N-Able Inc.(a) . . . . . . . . . . . . . . . . . . . . . . . . . . . . . . . . . . . . . . . . . . 54,832 647,018nCino Inc.(a)(b) . . . . . . . . . . . . . . . . . . . . . . . . . . . . . . . . . . . . . . . . . 12,469 774,574NCR Corp.(a) . . . . . . . . . . . . . . . . . . . . . . . . . . . . . . . . . . . . . . . . . . 31,146 1,211,579New Relic Inc.(a) . . . . . . . . . . . . . . . . . . . . . . . . . . . . . . . . . . . . . . . 18,193 2,016,330Nutanix Inc., Class A(a) . . . . . . . . . . . . . . . . . . . . . . . . . . . . . . . . . 59,520 1,977,254OneSpan Inc.(a) . . . . . . . . . . . . . . . . . . . . . . . . . . . . . . . . . . . . . . . . 36,656 626,451Pagerduty Inc.(a) . . . . . . . . . . . . . . . . . . . . . . . . . . . . . . . . . . . . . . . 26,597 942,864Paylocity Holding Corp.(a) . . . . . . . . . . . . . . . . . . . . . . . . . . . . . . 12,275 3,097,474Progress Software Corp. . . . . . . . . . . . . . . . . . . . . . . . . . . . . . . . 38,136 1,847,689PROS Holdings Inc.(a). . . . . . . . . . . . . . . . . . . . . . . . . . . . . . . . . . 17,423 632,803Q2 Holdings Inc.(a)(b) . . . . . . . . . . . . . . . . . . . . . . . . . . . . . . . . . . . 7,683 616,945Qualys Inc.(a) . . . . . . . . . . . . . . . . . . . . . . . . . . . . . . . . . . . . . . . . . . 6,666 868,513Rapid7 Inc.(a) . . . . . . . . . . . . . . . . . . . . . . . . . . . . . . . . . . . . . . . . . . 19,734 2,448,200Riot Blockchain Inc.(a)(b) . . . . . . . . . . . . . . . . . . . . . . . . . . . . . . . . 22,383 836,453SailPoint Technologies Holdings Inc.(a) . . . . . . . . . . . . . . . . . . 16,460 865,631Smartsheet Inc., Class A(a) . . . . . . . . . . . . . . . . . . . . . . . . . . . . . 37,353 2,390,592Sprout Social Inc., Class A(a)(b) . . . . . . . . . . . . . . . . . . . . . . . . . 12,279 1,371,319SPS Commerce Inc.(a) . . . . . . . . . . . . . . . . . . . . . . . . . . . . . . . . . 13,008 1,833,998Tenable Holdings Inc.(a) . . . . . . . . . . . . . . . . . . . . . . . . . . . . . . . . 15,783 779,680Teradata Corp.(a). . . . . . . . . . . . . . . . . . . . . . . . . . . . . . . . . . . . . . . 38,476 1,670,628Varonis Systems Inc.(a) . . . . . . . . . . . . . . . . . . . . . . . . . . . . . . . . . 27,406 1,419,905Workiva Inc.(a) . . . . . . . . . . . . . . . . . . . . . . . . . . . . . . . . . . . . . . . . . 19,837 2,766,666Xperi Holding Corp. . . . . . . . . . . . . . . . . . . . . . . . . . . . . . . . . . . . . 34,513 618,473
Schedule of Investments (unaudited) (continued)
November 30, 2021
iShares� ESG Aware MSCI USA Small-Cap ETF(Percentages shown are based on Net Assets)
52 NM0122U-1995964-54/159

Security Shares
Value
Software (continued)Zuora Inc., Class A(a). . . . . . . . . . . . . . . . . . . . . . . . . . . . . . . . . . . 30,333 $ 600,897
75,129,409Specialty Retail — 3.5%Aaron's Co. Inc. (The) . . . . . . . . . . . . . . . . . . . . . . . . . . . . . . . . . . 26,288 583,594Abercrombie & Fitch Co., Class A(a). . . . . . . . . . . . . . . . . . . . . 14,524 522,864American Eagle Outfitters Inc. . . . . . . . . . . . . . . . . . . . . . . . . . . 40,190 1,040,519Asbury Automotive Group Inc.(a) . . . . . . . . . . . . . . . . . . . . . . . . 4,901 802,000AutoNation Inc.(a)(b) . . . . . . . . . . . . . . . . . . . . . . . . . . . . . . . . . . . . 11,236 1,391,579Bed Bath & Beyond Inc.(a) . . . . . . . . . . . . . . . . . . . . . . . . . . . . . . 29,454 539,892Boot Barn Holdings Inc.(a) . . . . . . . . . . . . . . . . . . . . . . . . . . . . . . 8,502 1,040,135Buckle Inc. (The). . . . . . . . . . . . . . . . . . . . . . . . . . . . . . . . . . . . . . . 12,729 598,772Caleres Inc. . . . . . . . . . . . . . . . . . . . . . . . . . . . . . . . . . . . . . . . . . . . 23,599 557,172Children's Place Inc. (The)(a) . . . . . . . . . . . . . . . . . . . . . . . . . . . 6,044 522,987Five Below Inc.(a) . . . . . . . . . . . . . . . . . . . . . . . . . . . . . . . . . . . . . . 14,825 3,015,998Floor & Decor Holdings Inc., Class A(a) . . . . . . . . . . . . . . . . . . 24,592 3,170,155Foot Locker Inc. . . . . . . . . . . . . . . . . . . . . . . . . . . . . . . . . . . . . . . . 30,125 1,374,905GameStop Corp., Class A(a)(b) . . . . . . . . . . . . . . . . . . . . . . . . . . 16,526 3,242,566Gap Inc. (The) . . . . . . . . . . . . . . . . . . . . . . . . . . . . . . . . . . . . . . . . . 88,010 1,454,805Genesco Inc.(a) . . . . . . . . . . . . . . . . . . . . . . . . . . . . . . . . . . . . . . . . 9,335 589,972Group 1 Automotive Inc.. . . . . . . . . . . . . . . . . . . . . . . . . . . . . . . . 6,437 1,253,606Hibbett Inc. . . . . . . . . . . . . . . . . . . . . . . . . . . . . . . . . . . . . . . . . . . . . 8,768 683,466Leslie's Inc.(a) . . . . . . . . . . . . . . . . . . . . . . . . . . . . . . . . . . . . . . . . . . 41,176 863,049Lithia Motors Inc. . . . . . . . . . . . . . . . . . . . . . . . . . . . . . . . . . . . . . . 7,404 2,157,007MarineMax Inc.(a) . . . . . . . . . . . . . . . . . . . . . . . . . . . . . . . . . . . . . . 12,012 639,879Monro Inc. . . . . . . . . . . . . . . . . . . . . . . . . . . . . . . . . . . . . . . . . . . . . . 12,849 719,801Murphy USA Inc.. . . . . . . . . . . . . . . . . . . . . . . . . . . . . . . . . . . . . . . 10,476 1,815,805National Vision Holdings Inc.(a) . . . . . . . . . . . . . . . . . . . . . . . . . 23,450 1,126,538ODP Corp. (The)(a). . . . . . . . . . . . . . . . . . . . . . . . . . . . . . . . . . . . . 16,097 607,823Petco Health & Wellness Co. Inc.(a)(b) . . . . . . . . . . . . . . . . . . . 31,203 598,162Rent-A-Center Inc./TX . . . . . . . . . . . . . . . . . . . . . . . . . . . . . . . . . 23,784 1,050,539RH(a)(b) . . . . . . . . . . . . . . . . . . . . . . . . . . . . . . . . . . . . . . . . . . . . . . . . 3,602 2,100,614Sally Beauty Holdings Inc.(a) . . . . . . . . . . . . . . . . . . . . . . . . . . . . 32,098 628,800Signet Jewelers Ltd. . . . . . . . . . . . . . . . . . . . . . . . . . . . . . . . . . . . 14,578 1,416,107Sleep Number Corp.(a) . . . . . . . . . . . . . . . . . . . . . . . . . . . . . . . . . 8,580 684,512Urban Outfitters Inc.(a). . . . . . . . . . . . . . . . . . . . . . . . . . . . . . . . . . 18,355 581,303Victoria's Secret & Co.(a) . . . . . . . . . . . . . . . . . . . . . . . . . . . . . . . 25,045 1,359,443Williams-Sonoma Inc. . . . . . . . . . . . . . . . . . . . . . . . . . . . . . . . . . . 22,625 4,408,255Zumiez Inc.(a) . . . . . . . . . . . . . . . . . . . . . . . . . . . . . . . . . . . . . . . . . . 12,840 587,558
43,730,182Technology Hardware, Storage & Peripherals — 0.4%3D Systems Corp.(a) . . . . . . . . . . . . . . . . . . . . . . . . . . . . . . . . . . . 29,246 666,224Avid Technology Inc.(a) . . . . . . . . . . . . . . . . . . . . . . . . . . . . . . . . . 19,403 622,060Pure Storage Inc., Class A(a) . . . . . . . . . . . . . . . . . . . . . . . . . . . 61,099 1,892,236Xerox Holdings Corp. . . . . . . . . . . . . . . . . . . . . . . . . . . . . . . . . . . 97,086 1,788,324
4,968,844Textiles, Apparel & Luxury Goods — 2.1%Capri Holdings Ltd.(a). . . . . . . . . . . . . . . . . . . . . . . . . . . . . . . . . . . 32,771 1,940,699Carter's Inc. . . . . . . . . . . . . . . . . . . . . . . . . . . . . . . . . . . . . . . . . . . . 13,951 1,409,469Columbia Sportswear Co. . . . . . . . . . . . . . . . . . . . . . . . . . . . . . . 16,387 1,598,224Crocs Inc.(a) . . . . . . . . . . . . . . . . . . . . . . . . . . . . . . . . . . . . . . . . . . . 17,298 2,837,218Deckers Outdoor Corp.(a). . . . . . . . . . . . . . . . . . . . . . . . . . . . . . . 8,946 3,626,708Hanesbrands Inc. . . . . . . . . . . . . . . . . . . . . . . . . . . . . . . . . . . . . . . 131,689 2,126,777Kontoor Brands Inc. . . . . . . . . . . . . . . . . . . . . . . . . . . . . . . . . . . . . 15,545 838,186Levi Strauss & Co., Class A . . . . . . . . . . . . . . . . . . . . . . . . . . . . 23,398 598,287Movado Group Inc. . . . . . . . . . . . . . . . . . . . . . . . . . . . . . . . . . . . . 17,080 766,380PVH Corp.. . . . . . . . . . . . . . . . . . . . . . . . . . . . . . . . . . . . . . . . . . . . . 23,464 2,505,486Ralph Lauren Corp. . . . . . . . . . . . . . . . . . . . . . . . . . . . . . . . . . . . . 13,122 1,522,677Steven Madden Ltd.. . . . . . . . . . . . . . . . . . . . . . . . . . . . . . . . . . . . 23,259 1,103,640Tapestry Inc.. . . . . . . . . . . . . . . . . . . . . . . . . . . . . . . . . . . . . . . . . . . 71,277 2,859,633
Security Shares
Value
Textiles, Apparel & Luxury Goods (continued)Under Armour Inc., Class A(a) . . . . . . . . . . . . . . . . . . . . . . . . . . . 34,188 $ 806,495Under Armour Inc., Class C, NVS(a) . . . . . . . . . . . . . . . . . . . . . 38,659 775,886Wolverine World Wide Inc. . . . . . . . . . . . . . . . . . . . . . . . . . . . . . 29,758 926,367
26,242,132Thrifts & Mortgage Finance — 1.2%Capitol Federal Financial Inc. . . . . . . . . . . . . . . . . . . . . . . . . . . . 55,897 634,990Essent Group Ltd. . . . . . . . . . . . . . . . . . . . . . . . . . . . . . . . . . . . . . 20,984 872,515Federal Agricultural Mortgage Corp., Class C, NVS . . . . . . 10,786 1,312,872Flagstar Bancorp. Inc.. . . . . . . . . . . . . . . . . . . . . . . . . . . . . . . . . . 18,447 858,523MGIC Investment Corp. . . . . . . . . . . . . . . . . . . . . . . . . . . . . . . . . 143,671 2,025,761Mr Cooper Group Inc.(a) . . . . . . . . . . . . . . . . . . . . . . . . . . . . . . . . 24,809 974,249New York Community Bancorp. Inc.. . . . . . . . . . . . . . . . . . . . . 86,455 1,035,731PennyMac Financial Services Inc. . . . . . . . . . . . . . . . . . . . . . . 17,260 1,093,076Premier Financial Corp. . . . . . . . . . . . . . . . . . . . . . . . . . . . . . . . . 23,075 678,405Radian Group Inc. . . . . . . . . . . . . . . . . . . . . . . . . . . . . . . . . . . . . . 67,268 1,370,249Rocket Companies Inc., Class A . . . . . . . . . . . . . . . . . . . . . . . . 42,340 656,270TFS Financial Corp.. . . . . . . . . . . . . . . . . . . . . . . . . . . . . . . . . . . . 41,702 750,636Walker & Dunlop Inc.. . . . . . . . . . . . . . . . . . . . . . . . . . . . . . . . . . . 7,206 1,013,812Washington Federal Inc. . . . . . . . . . . . . . . . . . . . . . . . . . . . . . . . 22,695 737,361WSFS Financial Corp. . . . . . . . . . . . . . . . . . . . . . . . . . . . . . . . . . 9,569 475,771
14,490,221Trading Companies & Distributors — 1.5%Air Lease Corp. . . . . . . . . . . . . . . . . . . . . . . . . . . . . . . . . . . . . . . . . 22,366 907,836Beacon Roofing Supply Inc.(a) . . . . . . . . . . . . . . . . . . . . . . . . . . 14,846 740,964Boise Cascade Co. . . . . . . . . . . . . . . . . . . . . . . . . . . . . . . . . . . . . 33,086 2,144,965GATX Corp. . . . . . . . . . . . . . . . . . . . . . . . . . . . . . . . . . . . . . . . . . . . 14,260 1,404,610GMS Inc.(a) . . . . . . . . . . . . . . . . . . . . . . . . . . . . . . . . . . . . . . . . . . . . 16,545 924,369Herc Holdings Inc. . . . . . . . . . . . . . . . . . . . . . . . . . . . . . . . . . . . . . 6,061 1,033,098McGrath RentCorp. . . . . . . . . . . . . . . . . . . . . . . . . . . . . . . . . . . . . 14,938 1,154,707Rush Enterprises Inc., Class A. . . . . . . . . . . . . . . . . . . . . . . . . . 13,716 698,967SiteOne Landscape Supply Inc.(a) . . . . . . . . . . . . . . . . . . . . . . 16,326 3,924,117Triton International Ltd.. . . . . . . . . . . . . . . . . . . . . . . . . . . . . . . . . 26,536 1,485,220Univar Solutions Inc.(a) . . . . . . . . . . . . . . . . . . . . . . . . . . . . . . . . . 26,439 685,035Veritiv Corp.(a) . . . . . . . . . . . . . . . . . . . . . . . . . . . . . . . . . . . . . . . . . 5,685 716,537Watsco Inc. . . . . . . . . . . . . . . . . . . . . . . . . . . . . . . . . . . . . . . . . . . . . 3,995 1,169,377WESCO International Inc.(a) . . . . . . . . . . . . . . . . . . . . . . . . . . . . 15,750 1,955,048
18,944,850Water Utilities — 0.2%American States Water Co.. . . . . . . . . . . . . . . . . . . . . . . . . . . . . 19,405 1,827,563Middlesex Water Co. . . . . . . . . . . . . . . . . . . . . . . . . . . . . . . . . . . . 7,796 803,300
2,630,863Wireless Telecommunication Services — 0.1%Shenandoah Telecommunications Co. . . . . . . . . . . . . . . . . . . 24,682 626,676Telephone and Data Systems Inc. . . . . . . . . . . . . . . . . . . . . . . 35,941 635,437
1,262,113
Total Common Stocks — 100.0%(Cost: $1,108,720,267). . . . . . . . . . . . . . . . . . . . . . . . . . . . . . . . . . . . . . . . . . . 1,243,281,046
Short-Term InvestmentsMoney Market Funds — 2.9%BlackRock Cash Funds: Institutional, SL Agency Shares,
0.06%(d)(e)(f) . . . . . . . . . . . . . . . . . . . . . . . . . . . . . . . . . . . . . . . . . 34,017,528 34,031,135
Schedule of Investments (unaudited) (continued)
November 30, 2021
iShares� ESG Aware MSCI USA Small-Cap ETF(Percentages shown are based on Net Assets)
53NM0122U-1995964-55/159

Security Shares
Value
Money Market Funds (continued)BlackRock Cash Funds: Treasury, SL Agency Shares,
0.00%(d)(e) . . . . . . . . . . . . . . . . . . . . . . . . . . . . . . . . . . . . . . . . . . 2,550,000 $ 2,550,000
36,581,135
Total Short-Term Investments — 2.9%(Cost: $36,579,230). . . . . . . . . . . . . . . . . . . . . . . . . . . . . . . . . . . . . . . . . . . . . . 36,581,135
Total Investments in Securities — 102.9%(Cost: $1,145,299,497). . . . . . . . . . . . . . . . . . . . . . . . . . . . . . . . . . . . . . . . . . . 1,279,862,181
Other Assets, Less Liabilities — (2.9)% . . . . . . . . . . . . . . . . . . . . . . . . . . . . (36,265,720)
Net Assets — 100.0% . . . . . . . . . . . . . . . . . . . . . . . . . . . . . . . . . . . . . . . . . . . . . . $ 1,243,596,461
(a) Non-income producing security.(b) All or a portion of this security is on loan.(c) Security is valued using significant unobservable inputs and is classified as Level 3 in the
fair value hierarchy.(d) Affiliate of the Fund.(e) Annualized 7-day yield as of period end.(f) All or a portion of this security was purchased with the cash collateral from loaned
securities.
Affiliates
Investments in issuers considered to be affiliate(s) of the Fund during the period ended November 30, 2021 for purposes of Section 2(a)(3) of the Investment Company Actof 1940, as amended, were as follows:
Affiliated IssuerValue at
08/31/21Purchases
at CostProceeds
from SalesNet Realized
Gain (Loss)
Change inUnrealized
Appreciation(Depreciation)
Value at11/30/21
SharesHeld at
11/30/21 Income
CapitalGain
Distributionsfrom
UnderlyingFunds
BlackRock Cash Funds: Institutional, SLAgency Shares . . . . . . . . . . . . . . . . . . . . . . . . . . . $43,548,786 $ — $(9,513,730)(a) $ (1,497) $ (2,424) $34,031,135 34,017,528 $40,457(b) $ —
BlackRock Cash Funds: Treasury, SL AgencyShares . . . . . . . . . . . . . . . . . . . . . . . . . . . . . . . . . . . 1,390,000 1,160,000(a)
— — — 2,550,000 2,550,000 22 —
$ (1,497) $ (2,424) $36,581,135 $40,479 $ —
(a) Represents net amount purchased (sold).(b) All or a portion represents securities lending income earned from the reinvestment of cash collateral from loaned securities, net of fees and collateral investment expenses, and other
payments to and from borrowers of securities.
Derivative Financial Instruments Outstanding as of Period End
Futures Contracts
DescriptionNumber ofContracts
ExpirationDate
NotionalAmount
(000)
Value/Unrealized
Appreciation(Depreciation)
Long ContractsRussell 2000 E-Mini Index . . . . . . . . . . . . . . . . . . . . . . . . . . . . . . . . . . . . . . . . . . . . . . . . . . . . . . . . . . . . . . . . . . . . . . . . . . . . . . . . . . . . . . . . . . . 17 12/17/21 $ 1,868 $ (82,936)S&P Mid 400 E-Mini Index . . . . . . . . . . . . . . . . . . . . . . . . . . . . . . . . . . . . . . . . . . . . . . . . . . . . . . . . . . . . . . . . . . . . . . . . . . . . . . . . . . . . . . . . . . . 4 12/17/21 1,082 (46,064)
$ (129,000)
Fair Value Measurements
Various inputs are used in determining the fair value of financial instruments. These inputs to valuation techniques are categorized into a fair value hierarchy consisting ofthree broad levels for financial reporting purposes as follows:
• Level 1 – Unadjusted price quotations in active markets/exchanges for identical assets or liabilities that each Fund has the ability to access;• Level 2 – Other observable inputs (including, but not limited to, quoted prices for similar assets or liabilities in markets that are active, quoted prices for identical or
similar assets or liabilities in markets that are not active, inputs other than quoted prices that are observable for the assets or liabilities (such as interest rates, yieldcurves, volatilities, prepayment speeds, loss severities, credit risks and default rates) or other market-corroborated inputs); and
• Level 3 – Unobservable inputs based on the best information available in the circumstances, to the extent observable inputs are not available (including the BlackRockGlobal Valuation Methodologies Committee’s (the “Global Valuation Committee’s”) assumptions used in determining the fair value of financial instruments).
Schedule of Investments (unaudited) (continued)
November 30, 2021
iShares� ESG Aware MSCI USA Small-Cap ETF(Percentages shown are based on Net Assets)
54 NM0122U-1995964-56/159

Fair Value Measurements (continued)
The hierarchy gives the highest priority to unadjusted quoted prices in active markets for identical assets or liabilities (Level 1 measurements) and the lowest priority tounobservable inputs (Level 3 measurements). Accordingly, the degree of judgment exercised in determining fair value is greatest for instruments categorized in Level 3. Theinputs used to measure fair value may fall into different levels of the fair value hierarchy. In such cases, for disclosure purposes, the fair value hierarchy classification isdetermined based on the lowest level input that is significant to the fair value measurement in its entirety. Investments classified within Level 3 have significant unobservableinputs used by the Global Valuation Committee in determining the price for Fair Valued Investments. Level 3 investments include equity or debt issued by privately heldcompanies or funds. There may not be a secondary market, and/or there are a limited number of investors. The categorization of a value determined for financial instrumentsis based on the pricing transparency of the financial instruments and is not necessarily an indication of the risks associated with investing in those securities. For informationabout the Fund’s policy regarding valuation of financial instruments, refer to its most recent financial statements.
The following table summarizes the Fund’s financial instruments categorized in the fair value hierarchy. The breakdown of the Fund’s financial instruments into majorcategories is disclosed in the Schedule of Investments above.
Level 1 Level 2 Level 3 Total
InvestmentsAssets
Common Stocks . . . . . . . . . . . . . . . . . . . . . . . . . . . . . . . . . . . . . . . . . . . . . . . . . . . . . . . . . . . . . . . . . . . . . . . . . . . . $1,241,865,289 $ 1,412,680 $ 3,077 $1,243,281,046Money Market Funds. . . . . . . . . . . . . . . . . . . . . . . . . . . . . . . . . . . . . . . . . . . . . . . . . . . . . . . . . . . . . . . . . . . . . . . . 36,581,135 — — 36,581,135
$1,278,446,424 $ 1,412,680 $ 3,077 $1,279,862,181
Derivative financial instruments(a)
LiabilitiesFutures Contracts. . . . . . . . . . . . . . . . . . . . . . . . . . . . . . . . . . . . . . . . . . . . . . . . . . . . . . . . . . . . . . . . . . . . . . . . . . . $ (129,000) $ — $ — $ (129,000)
(a) Derivative financial instruments are futures contracts. Futures contracts are valued at the unrealized appreciation (depreciation) on the instrument.
Portfolio Abbreviations - Equity
NVS . . . . . . . . . . . . . Non-Voting SharesREIT . . . . . . . . . . . . . Real Estate Investment Trust
Schedule of Investments (unaudited) (continued)
November 30, 2021
iShares� ESG Aware MSCI USA Small-Cap ETF
55NM0122U-1995964-57/159
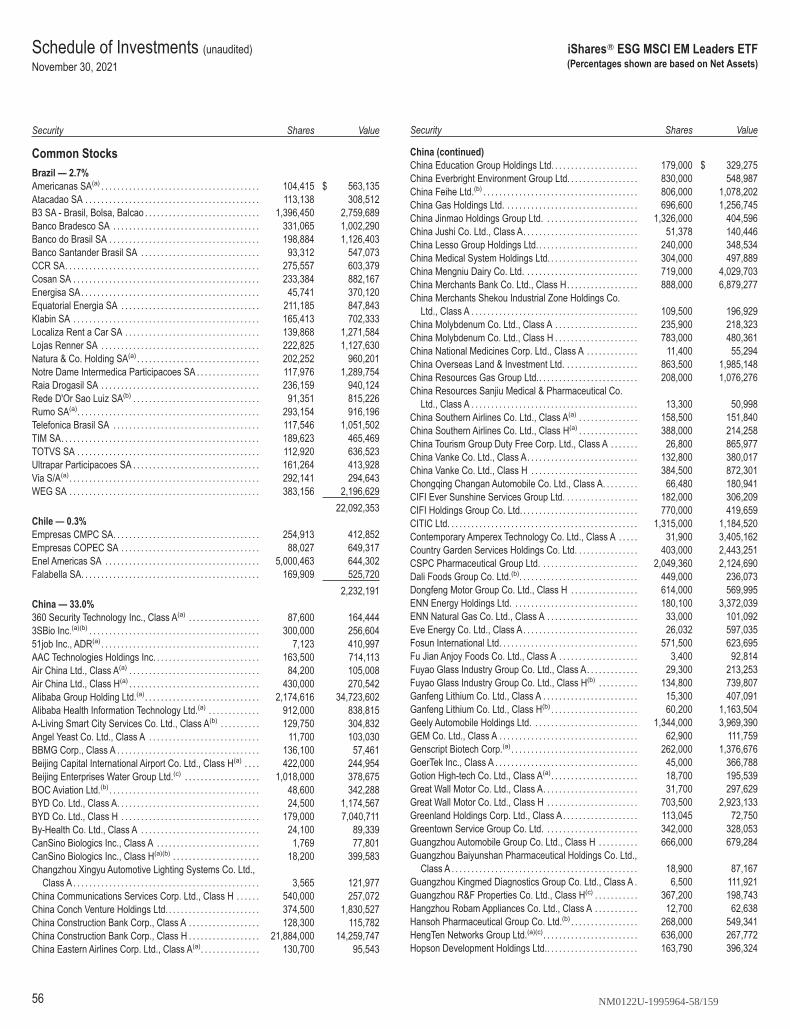
Security Shares
Value
Common StocksBrazil — 2.7%Americanas SA(a) . . . . . . . . . . . . . . . . . . . . . . . . . . . . . . . . . . . . . . . . 104,415 $ 563,135Atacadao SA . . . . . . . . . . . . . . . . . . . . . . . . . . . . . . . . . . . . . . . . . . . . 113,138 308,512B3 SA - Brasil, Bolsa, Balcao . . . . . . . . . . . . . . . . . . . . . . . . . . . . . 1,396,450 2,759,689Banco Bradesco SA . . . . . . . . . . . . . . . . . . . . . . . . . . . . . . . . . . . . . 331,065 1,002,290Banco do Brasil SA . . . . . . . . . . . . . . . . . . . . . . . . . . . . . . . . . . . . . . 198,884 1,126,403Banco Santander Brasil SA . . . . . . . . . . . . . . . . . . . . . . . . . . . . . . 93,312 547,073CCR SA. . . . . . . . . . . . . . . . . . . . . . . . . . . . . . . . . . . . . . . . . . . . . . . . . 275,557 603,379Cosan SA . . . . . . . . . . . . . . . . . . . . . . . . . . . . . . . . . . . . . . . . . . . . . . . 233,384 882,167Energisa SA. . . . . . . . . . . . . . . . . . . . . . . . . . . . . . . . . . . . . . . . . . . . . 45,741 370,120Equatorial Energia SA . . . . . . . . . . . . . . . . . . . . . . . . . . . . . . . . . . . 211,185 847,843Klabin SA . . . . . . . . . . . . . . . . . . . . . . . . . . . . . . . . . . . . . . . . . . . . . . . 165,413 702,333Localiza Rent a Car SA . . . . . . . . . . . . . . . . . . . . . . . . . . . . . . . . . . 139,868 1,271,584Lojas Renner SA . . . . . . . . . . . . . . . . . . . . . . . . . . . . . . . . . . . . . . . . 222,825 1,127,630Natura & Co. Holding SA(a) . . . . . . . . . . . . . . . . . . . . . . . . . . . . . . . 202,252 960,201Notre Dame Intermedica Participacoes SA . . . . . . . . . . . . . . . . 117,976 1,289,754Raia Drogasil SA . . . . . . . . . . . . . . . . . . . . . . . . . . . . . . . . . . . . . . . . 236,159 940,124Rede D'Or Sao Luiz SA(b) . . . . . . . . . . . . . . . . . . . . . . . . . . . . . . . . 91,351 815,226Rumo SA(a). . . . . . . . . . . . . . . . . . . . . . . . . . . . . . . . . . . . . . . . . . . . . . 293,154 916,196Telefonica Brasil SA . . . . . . . . . . . . . . . . . . . . . . . . . . . . . . . . . . . . . 117,546 1,051,502TIM SA. . . . . . . . . . . . . . . . . . . . . . . . . . . . . . . . . . . . . . . . . . . . . . . . . . 189,623 465,469TOTVS SA . . . . . . . . . . . . . . . . . . . . . . . . . . . . . . . . . . . . . . . . . . . . . . 112,920 636,523Ultrapar Participacoes SA . . . . . . . . . . . . . . . . . . . . . . . . . . . . . . . . 161,264 413,928Via S/A(a). . . . . . . . . . . . . . . . . . . . . . . . . . . . . . . . . . . . . . . . . . . . . . . . 292,141 294,643WEG SA . . . . . . . . . . . . . . . . . . . . . . . . . . . . . . . . . . . . . . . . . . . . . . . . 383,156 2,196,629
22,092,353Chile — 0.3%Empresas CMPC SA. . . . . . . . . . . . . . . . . . . . . . . . . . . . . . . . . . . . . 254,913 412,852Empresas COPEC SA . . . . . . . . . . . . . . . . . . . . . . . . . . . . . . . . . . . 88,027 649,317Enel Americas SA . . . . . . . . . . . . . . . . . . . . . . . . . . . . . . . . . . . . . . . 5,000,463 644,302Falabella SA. . . . . . . . . . . . . . . . . . . . . . . . . . . . . . . . . . . . . . . . . . . . . 169,909 525,720
2,232,191China — 33.0%360 Security Technology Inc., Class A(a) . . . . . . . . . . . . . . . . . . 87,600 164,4443SBio Inc.(a)(b) . . . . . . . . . . . . . . . . . . . . . . . . . . . . . . . . . . . . . . . . . . . 300,000 256,60451job Inc., ADR(a) . . . . . . . . . . . . . . . . . . . . . . . . . . . . . . . . . . . . . . . . 7,123 410,997AAC Technologies Holdings Inc. . . . . . . . . . . . . . . . . . . . . . . . . . . 163,500 714,113Air China Ltd., Class A(a) . . . . . . . . . . . . . . . . . . . . . . . . . . . . . . . . . 84,200 105,008Air China Ltd., Class H(a) . . . . . . . . . . . . . . . . . . . . . . . . . . . . . . . . . 430,000 270,542Alibaba Group Holding Ltd.(a). . . . . . . . . . . . . . . . . . . . . . . . . . . . . 2,174,616 34,723,602Alibaba Health Information Technology Ltd.(a) . . . . . . . . . . . . . 912,000 838,815A-Living Smart City Services Co. Ltd., Class A(b) . . . . . . . . . . 129,750 304,832Angel Yeast Co. Ltd., Class A . . . . . . . . . . . . . . . . . . . . . . . . . . . . 11,700 103,030BBMG Corp., Class A . . . . . . . . . . . . . . . . . . . . . . . . . . . . . . . . . . . . 136,100 57,461Beijing Capital International Airport Co. Ltd., Class H(a) . . . . 422,000 244,954Beijing Enterprises Water Group Ltd.(c) . . . . . . . . . . . . . . . . . . . 1,018,000 378,675BOC Aviation Ltd.(b) . . . . . . . . . . . . . . . . . . . . . . . . . . . . . . . . . . . . . . 48,600 342,288BYD Co. Ltd., Class A. . . . . . . . . . . . . . . . . . . . . . . . . . . . . . . . . . . . 24,500 1,174,567BYD Co. Ltd., Class H . . . . . . . . . . . . . . . . . . . . . . . . . . . . . . . . . . . 179,000 7,040,711By-Health Co. Ltd., Class A . . . . . . . . . . . . . . . . . . . . . . . . . . . . . . 24,100 89,339CanSino Biologics Inc., Class A . . . . . . . . . . . . . . . . . . . . . . . . . . 1,769 77,801CanSino Biologics Inc., Class H(a)(b) . . . . . . . . . . . . . . . . . . . . . . 18,200 399,583Changzhou Xingyu Automotive Lighting Systems Co. Ltd.,
Class A . . . . . . . . . . . . . . . . . . . . . . . . . . . . . . . . . . . . . . . . . . . . . . . 3,565 121,977China Communications Services Corp. Ltd., Class H . . . . . . 540,000 257,072China Conch Venture Holdings Ltd. . . . . . . . . . . . . . . . . . . . . . . . 374,500 1,830,527China Construction Bank Corp., Class A . . . . . . . . . . . . . . . . . . 128,300 115,782China Construction Bank Corp., Class H . . . . . . . . . . . . . . . . . . 21,884,000 14,259,747China Eastern Airlines Corp. Ltd., Class A(a). . . . . . . . . . . . . . . 130,700 95,543
Security Shares
Value
China (continued)China Education Group Holdings Ltd. . . . . . . . . . . . . . . . . . . . . . 179,000 $ 329,275China Everbright Environment Group Ltd. . . . . . . . . . . . . . . . . . 830,000 548,987China Feihe Ltd.(b) . . . . . . . . . . . . . . . . . . . . . . . . . . . . . . . . . . . . . . . 806,000 1,078,202China Gas Holdings Ltd. . . . . . . . . . . . . . . . . . . . . . . . . . . . . . . . . . 696,600 1,256,745China Jinmao Holdings Group Ltd. . . . . . . . . . . . . . . . . . . . . . . . 1,326,000 404,596China Jushi Co. Ltd., Class A. . . . . . . . . . . . . . . . . . . . . . . . . . . . . 51,378 140,446China Lesso Group Holdings Ltd.. . . . . . . . . . . . . . . . . . . . . . . . . 240,000 348,534China Medical System Holdings Ltd. . . . . . . . . . . . . . . . . . . . . . . 304,000 497,889China Mengniu Dairy Co. Ltd. . . . . . . . . . . . . . . . . . . . . . . . . . . . . 719,000 4,029,703China Merchants Bank Co. Ltd., Class H. . . . . . . . . . . . . . . . . . 888,000 6,879,277China Merchants Shekou Industrial Zone Holdings Co.
Ltd., Class A . . . . . . . . . . . . . . . . . . . . . . . . . . . . . . . . . . . . . . . . . . 109,500 196,929China Molybdenum Co. Ltd., Class A . . . . . . . . . . . . . . . . . . . . . 235,900 218,323China Molybdenum Co. Ltd., Class H . . . . . . . . . . . . . . . . . . . . . 783,000 480,361China National Medicines Corp. Ltd., Class A . . . . . . . . . . . . . 11,400 55,294China Overseas Land & Investment Ltd. . . . . . . . . . . . . . . . . . . 863,500 1,985,148China Resources Gas Group Ltd.. . . . . . . . . . . . . . . . . . . . . . . . . 208,000 1,076,276China Resources Sanjiu Medical & Pharmaceutical Co.
Ltd., Class A . . . . . . . . . . . . . . . . . . . . . . . . . . . . . . . . . . . . . . . . . . 13,300 50,998China Southern Airlines Co. Ltd., Class A(a) . . . . . . . . . . . . . . . 158,500 151,840China Southern Airlines Co. Ltd., Class H(a) . . . . . . . . . . . . . . . 388,000 214,258China Tourism Group Duty Free Corp. Ltd., Class A . . . . . . . 26,800 865,977China Vanke Co. Ltd., Class A. . . . . . . . . . . . . . . . . . . . . . . . . . . . 132,800 380,017China Vanke Co. Ltd., Class H . . . . . . . . . . . . . . . . . . . . . . . . . . . 384,500 872,301Chongqing Changan Automobile Co. Ltd., Class A. . . . . . . . . 66,480 180,941CIFI Ever Sunshine Services Group Ltd. . . . . . . . . . . . . . . . . . . 182,000 306,209CIFI Holdings Group Co. Ltd. . . . . . . . . . . . . . . . . . . . . . . . . . . . . . 770,000 419,659CITIC Ltd. . . . . . . . . . . . . . . . . . . . . . . . . . . . . . . . . . . . . . . . . . . . . . . . 1,315,000 1,184,520Contemporary Amperex Technology Co. Ltd., Class A . . . . . 31,900 3,405,162Country Garden Services Holdings Co. Ltd. . . . . . . . . . . . . . . . 403,000 2,443,251CSPC Pharmaceutical Group Ltd. . . . . . . . . . . . . . . . . . . . . . . . . 2,049,360 2,124,690Dali Foods Group Co. Ltd.(b). . . . . . . . . . . . . . . . . . . . . . . . . . . . . . 449,000 236,073Dongfeng Motor Group Co. Ltd., Class H . . . . . . . . . . . . . . . . . 614,000 569,995ENN Energy Holdings Ltd. . . . . . . . . . . . . . . . . . . . . . . . . . . . . . . . 180,100 3,372,039ENN Natural Gas Co. Ltd., Class A . . . . . . . . . . . . . . . . . . . . . . . 33,000 101,092Eve Energy Co. Ltd., Class A. . . . . . . . . . . . . . . . . . . . . . . . . . . . . 26,032 597,035Fosun International Ltd. . . . . . . . . . . . . . . . . . . . . . . . . . . . . . . . . . . 571,500 623,695Fu Jian Anjoy Foods Co. Ltd., Class A . . . . . . . . . . . . . . . . . . . . 3,400 92,814Fuyao Glass Industry Group Co. Ltd., Class A. . . . . . . . . . . . . 29,300 213,253Fuyao Glass Industry Group Co. Ltd., Class H(b) . . . . . . . . . . 134,800 739,807Ganfeng Lithium Co. Ltd., Class A . . . . . . . . . . . . . . . . . . . . . . . . 15,300 407,091Ganfeng Lithium Co. Ltd., Class H(b) . . . . . . . . . . . . . . . . . . . . . . 60,200 1,163,504Geely Automobile Holdings Ltd. . . . . . . . . . . . . . . . . . . . . . . . . . . 1,344,000 3,969,390GEM Co. Ltd., Class A . . . . . . . . . . . . . . . . . . . . . . . . . . . . . . . . . . . 62,900 111,759Genscript Biotech Corp.(a) . . . . . . . . . . . . . . . . . . . . . . . . . . . . . . . . 262,000 1,376,676GoerTek Inc., Class A . . . . . . . . . . . . . . . . . . . . . . . . . . . . . . . . . . . . 45,000 366,788Gotion High-tech Co. Ltd., Class A(a). . . . . . . . . . . . . . . . . . . . . . 18,700 195,539Great Wall Motor Co. Ltd., Class A. . . . . . . . . . . . . . . . . . . . . . . . 31,700 297,629Great Wall Motor Co. Ltd., Class H . . . . . . . . . . . . . . . . . . . . . . . 703,500 2,923,133Greenland Holdings Corp. Ltd., Class A. . . . . . . . . . . . . . . . . . . 113,045 72,750Greentown Service Group Co. Ltd. . . . . . . . . . . . . . . . . . . . . . . . 342,000 328,053Guangzhou Automobile Group Co. Ltd., Class H . . . . . . . . . . 666,000 679,284Guangzhou Baiyunshan Pharmaceutical Holdings Co. Ltd.,
Class A . . . . . . . . . . . . . . . . . . . . . . . . . . . . . . . . . . . . . . . . . . . . . . . 18,900 87,167Guangzhou Kingmed Diagnostics Group Co. Ltd., Class A . 6,500 111,921Guangzhou R&F Properties Co. Ltd., Class H(c) . . . . . . . . . . . 367,200 198,743Hangzhou Robam Appliances Co. Ltd., Class A . . . . . . . . . . . 12,700 62,638Hansoh Pharmaceutical Group Co. Ltd.(b) . . . . . . . . . . . . . . . . . 268,000 549,341HengTen Networks Group Ltd.(a)(c). . . . . . . . . . . . . . . . . . . . . . . . 636,000 267,772Hopson Development Holdings Ltd.. . . . . . . . . . . . . . . . . . . . . . . 163,790 396,324
Schedule of Investments (unaudited)
November 30, 2021
iShares� ESG MSCI EM Leaders ETF(Percentages shown are based on Net Assets)
56 NM0122U-1995964-58/159

Security Shares
Value
China (continued)Huaxia Bank Co. Ltd., Class A. . . . . . . . . . . . . . . . . . . . . . . . . . . . 171,100 $ 151,328Industrial Bank Co. Ltd., Class A. . . . . . . . . . . . . . . . . . . . . . . . . . 282,500 796,805Inner Mongolia Yili Industrial Group Co. Ltd., Class A . . . . . . 83,400 512,567Jafron Biomedical Co. Ltd., Class A. . . . . . . . . . . . . . . . . . . . . . . 11,800 95,090Jiangsu Zhongtian Technology Co. Ltd., Class A. . . . . . . . . . . 35,000 102,144Jinke Properties Group Co. Ltd., Class A. . . . . . . . . . . . . . . . . . 80,500 51,967Jinxin Fertility Group Ltd.(a)(b) . . . . . . . . . . . . . . . . . . . . . . . . . . . . . 292,000 405,760Kingdee International Software Group Co. Ltd.(a) . . . . . . . . . . 596,000 1,788,805Kuang-Chi Technologies Co. Ltd., Class A(a) . . . . . . . . . . . . . . 29,600 107,725Kunlun Energy Co. Ltd. . . . . . . . . . . . . . . . . . . . . . . . . . . . . . . . . . . 878,000 826,432KWG Group Holdings Ltd.. . . . . . . . . . . . . . . . . . . . . . . . . . . . . . . . 274,000 203,184Lee & Man Paper Manufacturing Ltd. . . . . . . . . . . . . . . . . . . . . . 311,000 213,454Lenovo Group Ltd. . . . . . . . . . . . . . . . . . . . . . . . . . . . . . . . . . . . . . . . 1,628,000 1,667,087Li Auto Inc., ADR(a) . . . . . . . . . . . . . . . . . . . . . . . . . . . . . . . . . . . . . . 125,480 4,447,011Li Ning Co. Ltd. . . . . . . . . . . . . . . . . . . . . . . . . . . . . . . . . . . . . . . . . . . 511,000 5,779,711Liaoning Cheng Da Co. Ltd., Class A . . . . . . . . . . . . . . . . . . . . . 18,900 54,805Logan Group Co. Ltd. . . . . . . . . . . . . . . . . . . . . . . . . . . . . . . . . . . . . 328,000 316,727Longfor Group Holdings Ltd.(b) . . . . . . . . . . . . . . . . . . . . . . . . . . . 415,000 1,969,908Meituan, Class B(a)(b) . . . . . . . . . . . . . . . . . . . . . . . . . . . . . . . . . . . . 930,200 28,272,769Microport Scientific Corp.. . . . . . . . . . . . . . . . . . . . . . . . . . . . . . . . . 142,400 591,838Ming Yang Smart Energy Group Ltd., Class A . . . . . . . . . . . . . 24,100 120,957Minth Group Ltd.. . . . . . . . . . . . . . . . . . . . . . . . . . . . . . . . . . . . . . . . . 172,000 798,826NARI Technology Co. Ltd., Class A . . . . . . . . . . . . . . . . . . . . . . . 60 390NIO Inc., ADR(a) . . . . . . . . . . . . . . . . . . . . . . . . . . . . . . . . . . . . . . . . . 309,896 12,126,230Offshore Oil Engineering Co. Ltd., Class A . . . . . . . . . . . . . . . . 80,500 54,255Ovctek China Inc., Class A . . . . . . . . . . . . . . . . . . . . . . . . . . . . . . . 11,960 107,884Pharmaron Beijing Co. Ltd., Class A . . . . . . . . . . . . . . . . . . . . . . 9,300 265,354Pharmaron Beijing Co. Ltd., Class H(b) . . . . . . . . . . . . . . . . . . . . 29,800 614,814Ping An Insurance Group Co. of China Ltd., Class A . . . . . . . 149,900 1,134,440Ping An Insurance Group Co. of China Ltd., Class H. . . . . . . 1,439,000 9,975,496Poly Developments and Holdings Group Co. Ltd., Class A . 164,100 356,863Shandong Weigao Group Medical Polymer Co. Ltd.,
Class H. . . . . . . . . . . . . . . . . . . . . . . . . . . . . . . . . . . . . . . . . . . . . . . 572,000 804,848Shanghai Electric Group Co. Ltd., Class A . . . . . . . . . . . . . . . . 156,700 118,881Shanghai Fosun Pharmaceutical Group Co. Ltd., Class A. . 28,000 245,757Shanghai Fosun Pharmaceutical Group Co. Ltd., Class H. . 110,500 570,955Shanghai M&G Stationery Inc., Class A . . . . . . . . . . . . . . . . . . . 12,700 111,783Shanghai Pharmaceuticals Holding Co. Ltd., Class A . . . . . . 26,100 75,468Shanghai Pharmaceuticals Holding Co. Ltd., Class H . . . . . . 172,200 313,976Shenzhen Inovance Technology Co. Ltd., Class A . . . . . . . . . 36,250 374,828Shenzhen International Holdings Ltd. . . . . . . . . . . . . . . . . . . . . . 281,000 306,488Shenzhen Overseas Chinese Town Co. Ltd., Class A . . . . . . 109,700 101,645Shenzhou International Group Holdings Ltd. . . . . . . . . . . . . . . 188,100 3,532,113Shimao Group Holdings Ltd. . . . . . . . . . . . . . . . . . . . . . . . . . . . . . 283,000 326,153Sinotrans Ltd., Class A . . . . . . . . . . . . . . . . . . . . . . . . . . . . . . . . . . . 52,800 36,480Sinotruk Hong Kong Ltd. . . . . . . . . . . . . . . . . . . . . . . . . . . . . . . . . . 159,000 235,295Skshu Paint Co. Ltd., Class A . . . . . . . . . . . . . . . . . . . . . . . . . . . . 4,900 91,551Sungrow Power Supply Co. Ltd., Class A . . . . . . . . . . . . . . . . . 19,700 499,522Suning.com Co. Ltd., Class A(a) . . . . . . . . . . . . . . . . . . . . . . . . . . 145,000 87,686TCL Technology Group Corp., Class A . . . . . . . . . . . . . . . . . . . . 188,400 181,455Tencent Holdings Ltd. . . . . . . . . . . . . . . . . . . . . . . . . . . . . . . . . . . . . 683,500 39,861,075Tongcheng-Elong Holdings Ltd.(a). . . . . . . . . . . . . . . . . . . . . . . . . 230,800 475,304Topchoice Medical Corp., Class A(a) . . . . . . . . . . . . . . . . . . . . . . 4,500 140,222Topsports International Holdings Ltd.(b) . . . . . . . . . . . . . . . . . . . 350,000 406,971Transfar Zhilian Co. Ltd., Class A . . . . . . . . . . . . . . . . . . . . . . . . . 42,800 61,178Uni-President China Holdings Ltd. . . . . . . . . . . . . . . . . . . . . . . . . 304,000 298,254Unisplendour Corp. Ltd., Class A . . . . . . . . . . . . . . . . . . . . . . . . . 40,800 165,422Vinda International Holdings Ltd.(c) . . . . . . . . . . . . . . . . . . . . . . . 79,000 213,760Vipshop Holdings Ltd., ADR(a) . . . . . . . . . . . . . . . . . . . . . . . . . . . . 103,173 1,008,000Want Want China Holdings Ltd.. . . . . . . . . . . . . . . . . . . . . . . . . . . 1,096,000 925,145
Security Shares
Value
China (continued)Wuchan Zhongda Group Co. Ltd., Class A . . . . . . . . . . . . . . . . 61,400 $ 58,444Wuhu Sanqi Interactive Entertainment Network
Technology Group Co. Ltd., Class A. . . . . . . . . . . . . . . . . . . . 30,300 111,990WuXi AppTec Co. Ltd., Class A . . . . . . . . . . . . . . . . . . . . . . . . . . . 34,592 782,883WuXi AppTec Co. Ltd., Class H(b) . . . . . . . . . . . . . . . . . . . . . . . . . 80,060 1,773,739Wuxi Biologics Cayman Inc., New(a)(b) . . . . . . . . . . . . . . . . . . . . 820,000 11,061,622Xiamen Intretech Inc., Class A. . . . . . . . . . . . . . . . . . . . . . . . . . . . 10,075 53,076Xinjiang Goldwind Science & Technology Co. Ltd.,
Class A . . . . . . . . . . . . . . . . . . . . . . . . . . . . . . . . . . . . . . . . . . . . . . . 47,800 137,593Xinjiang Goldwind Science & Technology Co. Ltd.,
Class H. . . . . . . . . . . . . . . . . . . . . . . . . . . . . . . . . . . . . . . . . . . . . . . 178,800 391,883Xinyi Solar Holdings Ltd. . . . . . . . . . . . . . . . . . . . . . . . . . . . . . . . . . 1,112,000 2,044,842XPeng Inc., ADR(a)(c). . . . . . . . . . . . . . . . . . . . . . . . . . . . . . . . . . . . . 88,370 4,860,350Yadea Group Holdings Ltd.(b) . . . . . . . . . . . . . . . . . . . . . . . . . . . . . 270,000 482,545Yantai Jereh Oilfield Services Group Co. Ltd., Class A . . . . . 12,800 78,181Yum China Holdings Inc. . . . . . . . . . . . . . . . . . . . . . . . . . . . . . . . . . 96,054 4,812,305Yunnan Baiyao Group Co. Ltd., Class A. . . . . . . . . . . . . . . . . . . 17,600 244,371Yutong Bus Co. Ltd., Class A . . . . . . . . . . . . . . . . . . . . . . . . . . . . . 26,300 45,606Zhejiang Chint Electrics Co. Ltd., Class A . . . . . . . . . . . . . . . . . 30,200 245,378Zhejiang Expressway Co. Ltd., Class H . . . . . . . . . . . . . . . . . . . 324,000 305,386Zhejiang Huayou Cobalt Co. Ltd., Class A. . . . . . . . . . . . . . . . . 15,700 320,793Zhejiang Jiuzhou Pharmaceutical Co. Ltd., Class A . . . . . . . . 13,400 126,160Zhejiang Weixing New Building Materials Co. Ltd.,
Class A . . . . . . . . . . . . . . . . . . . . . . . . . . . . . . . . . . . . . . . . . . . . . . . 20,900 60,823Zhongsheng Group Holdings Ltd.. . . . . . . . . . . . . . . . . . . . . . . . . 135,000 1,105,761Zoomlion Heavy Industry Science and Technology Co.
Ltd., Class A . . . . . . . . . . . . . . . . . . . . . . . . . . . . . . . . . . . . . . . . . . 107,600 118,438Zoomlion Heavy Industry Science and Technology Co.
Ltd., Class H. . . . . . . . . . . . . . . . . . . . . . . . . . . . . . . . . . . . . . . . . . 300,800 197,058
271,515,195Czech Republic — 0.1%Komercni Banka AS . . . . . . . . . . . . . . . . . . . . . . . . . . . . . . . . . . . . . 17,469 667,157Moneta Money Bank AS(a)(b) . . . . . . . . . . . . . . . . . . . . . . . . . . . . . 84,976 362,034
1,029,191Egypt — 0.2%Commercial International Bank Egypt SAE(a) . . . . . . . . . . . . . . 380,204 1,237,592
Greece — 0.2%Eurobank Ergasias Services and Holdings SA, Class A(a) . . 576,390 570,457Hellenic Telecommunications Organization SA . . . . . . . . . . . . 51,952 897,536
1,467,993Hong Kong — 0.3%Hutchmed China Ltd., ADR(a). . . . . . . . . . . . . . . . . . . . . . . . . . . . . 19,778 669,683Sino Biopharmaceutical Ltd.. . . . . . . . . . . . . . . . . . . . . . . . . . . . . . 2,343,500 1,713,200
2,382,883Hungary — 0.4%MOL Hungarian Oil & Gas PLC. . . . . . . . . . . . . . . . . . . . . . . . . . . 93,041 699,222OTP Bank Nyrt(a) . . . . . . . . . . . . . . . . . . . . . . . . . . . . . . . . . . . . . . . . 51,093 2,821,162
3,520,384India — 14.0%Adani Green Energy Ltd.(a) . . . . . . . . . . . . . . . . . . . . . . . . . . . . . . . 88,285 1,519,416Adani Total Gas Ltd. . . . . . . . . . . . . . . . . . . . . . . . . . . . . . . . . . . . . . 62,051 1,320,945Asian Paints Ltd.. . . . . . . . . . . . . . . . . . . . . . . . . . . . . . . . . . . . . . . . . 87,158 3,647,243Axis Bank Ltd.(a) . . . . . . . . . . . . . . . . . . . . . . . . . . . . . . . . . . . . . . . . . 515,976 4,493,460Bajaj Auto Ltd. . . . . . . . . . . . . . . . . . . . . . . . . . . . . . . . . . . . . . . . . . . . 15,640 675,145Bandhan Bank Ltd.(b) . . . . . . . . . . . . . . . . . . . . . . . . . . . . . . . . . . . . 144,086 521,268Berger Paints India Ltd. . . . . . . . . . . . . . . . . . . . . . . . . . . . . . . . . . . 54,952 549,646Bharat Petroleum Corp. Ltd.. . . . . . . . . . . . . . . . . . . . . . . . . . . . . . 197,905 973,478Biocon Ltd.(a) . . . . . . . . . . . . . . . . . . . . . . . . . . . . . . . . . . . . . . . . . . . . 97,443 467,669
Schedule of Investments (unaudited) (continued)
November 30, 2021
iShares� ESG MSCI EM Leaders ETF(Percentages shown are based on Net Assets)
57NM0122U-1995964-59/159

Security Shares
Value
India (continued)Britannia Industries Ltd. . . . . . . . . . . . . . . . . . . . . . . . . . . . . . . . . . . 24,998 $ 1,180,288Colgate-Palmolive India Ltd.. . . . . . . . . . . . . . . . . . . . . . . . . . . . . . 27,654 527,564Dabur India Ltd. . . . . . . . . . . . . . . . . . . . . . . . . . . . . . . . . . . . . . . . . . 139,954 1,107,916DLF Ltd.. . . . . . . . . . . . . . . . . . . . . . . . . . . . . . . . . . . . . . . . . . . . . . . . . 139,272 693,706Eicher Motors Ltd. . . . . . . . . . . . . . . . . . . . . . . . . . . . . . . . . . . . . . . . 31,510 991,956Grasim Industries Ltd.. . . . . . . . . . . . . . . . . . . . . . . . . . . . . . . . . . . . 60,400 1,337,537Havells India Ltd. . . . . . . . . . . . . . . . . . . . . . . . . . . . . . . . . . . . . . . . . 56,469 1,019,393HCL Technologies Ltd. . . . . . . . . . . . . . . . . . . . . . . . . . . . . . . . . . . . 246,963 3,740,590Hero MotoCorp Ltd. . . . . . . . . . . . . . . . . . . . . . . . . . . . . . . . . . . . . . . 26,967 879,707Hindalco Industries Ltd. . . . . . . . . . . . . . . . . . . . . . . . . . . . . . . . . . . 359,294 1,971,422Hindustan Unilever Ltd. . . . . . . . . . . . . . . . . . . . . . . . . . . . . . . . . . . 186,995 5,769,976Housing Development Finance Corp. Ltd. . . . . . . . . . . . . . . . . . 390,447 13,897,146Info Edge India Ltd. . . . . . . . . . . . . . . . . . . . . . . . . . . . . . . . . . . . . . . 17,431 1,346,680Infosys Ltd. . . . . . . . . . . . . . . . . . . . . . . . . . . . . . . . . . . . . . . . . . . . . . . 775,163 17,631,852Lupin Ltd. . . . . . . . . . . . . . . . . . . . . . . . . . . . . . . . . . . . . . . . . . . . . . . . 52,630 619,153Mahindra & Mahindra Ltd. . . . . . . . . . . . . . . . . . . . . . . . . . . . . . . . . 198,387 2,204,876Marico Ltd. . . . . . . . . . . . . . . . . . . . . . . . . . . . . . . . . . . . . . . . . . . . . . . 117,193 839,911Motherson Sumi Systems Ltd. . . . . . . . . . . . . . . . . . . . . . . . . . . . . 293,098 818,091Nestle India Ltd. . . . . . . . . . . . . . . . . . . . . . . . . . . . . . . . . . . . . . . . . . 7,733 1,969,729PI Industries Ltd.. . . . . . . . . . . . . . . . . . . . . . . . . . . . . . . . . . . . . . . . . 19,278 735,001Piramal Enterprises Ltd.. . . . . . . . . . . . . . . . . . . . . . . . . . . . . . . . . . 24,397 783,747Reliance Industries Ltd. . . . . . . . . . . . . . . . . . . . . . . . . . . . . . . . . . . 648,898 20,747,917Shree Cement Ltd.. . . . . . . . . . . . . . . . . . . . . . . . . . . . . . . . . . . . . . . 2,439 847,754Siemens Ltd. . . . . . . . . . . . . . . . . . . . . . . . . . . . . . . . . . . . . . . . . . . . . 16,821 481,341State Bank of India . . . . . . . . . . . . . . . . . . . . . . . . . . . . . . . . . . . . . . 406,085 2,484,242Tata Consultancy Services Ltd. . . . . . . . . . . . . . . . . . . . . . . . . . . . 210,385 9,887,512Titan Co. Ltd. . . . . . . . . . . . . . . . . . . . . . . . . . . . . . . . . . . . . . . . . . . . . 80,724 2,550,278Trent Ltd.. . . . . . . . . . . . . . . . . . . . . . . . . . . . . . . . . . . . . . . . . . . . . . . . 41,864 565,361UPL Ltd. . . . . . . . . . . . . . . . . . . . . . . . . . . . . . . . . . . . . . . . . . . . . . . . . 112,173 1,019,018Wipro Ltd. . . . . . . . . . . . . . . . . . . . . . . . . . . . . . . . . . . . . . . . . . . . . . . . 312,067 2,630,261
115,448,195Indonesia — 1.2%Aneka Tambang Tbk . . . . . . . . . . . . . . . . . . . . . . . . . . . . . . . . . . . . . 2,022,400 324,636Bank Central Asia Tbk PT . . . . . . . . . . . . . . . . . . . . . . . . . . . . . . . . 12,612,500 6,408,764Barito Pacific Tbk PT. . . . . . . . . . . . . . . . . . . . . . . . . . . . . . . . . . . . . 6,466,800 415,404Indah Kiat Pulp & Paper Tbk PT . . . . . . . . . . . . . . . . . . . . . . . . . . 621,900 327,147Kalbe Farma Tbk PT . . . . . . . . . . . . . . . . . . . . . . . . . . . . . . . . . . . . . 4,909,600 548,310Merdeka Copper Gold Tbk PT(a) . . . . . . . . . . . . . . . . . . . . . . . . . . 2,495,900 636,784Tower Bersama Infrastructure Tbk PT. . . . . . . . . . . . . . . . . . . . . 1,796,600 379,259Unilever Indonesia Tbk PT . . . . . . . . . . . . . . . . . . . . . . . . . . . . . . . 1,695,200 531,137
9,571,441Kuwait — 0.3%Kuwait Finance House KSCP . . . . . . . . . . . . . . . . . . . . . . . . . . . . 1,049,162 2,745,409
Malaysia — 2.2%AMMB Holdings Bhd(a) . . . . . . . . . . . . . . . . . . . . . . . . . . . . . . . . . . . 419,700 314,912Axiata Group Bhd. . . . . . . . . . . . . . . . . . . . . . . . . . . . . . . . . . . . . . . . 647,400 599,516CIMB Group Holdings Bhd . . . . . . . . . . . . . . . . . . . . . . . . . . . . . . . 1,464,300 1,799,185Dialog Group Bhd. . . . . . . . . . . . . . . . . . . . . . . . . . . . . . . . . . . . . . . . 907,000 550,614DiGi.Com Bhd . . . . . . . . . . . . . . . . . . . . . . . . . . . . . . . . . . . . . . . . . . . 704,400 697,459Fraser & Neave Holdings Bhd . . . . . . . . . . . . . . . . . . . . . . . . . . . . 31,000 189,279HAP Seng Consolidated Bhd . . . . . . . . . . . . . . . . . . . . . . . . . . . . . 143,900 259,680Hartalega Holdings Bhd . . . . . . . . . . . . . . . . . . . . . . . . . . . . . . . . . . 392,500 604,850IHH Healthcare Bhd . . . . . . . . . . . . . . . . . . . . . . . . . . . . . . . . . . . . . 399,600 624,331Kossan Rubber Industries Bhd . . . . . . . . . . . . . . . . . . . . . . . . . . . 9,700 4,952Kuala Lumpur Kepong Bhd. . . . . . . . . . . . . . . . . . . . . . . . . . . . . . . 98,900 494,089Malayan Banking Bhd. . . . . . . . . . . . . . . . . . . . . . . . . . . . . . . . . . . . 1,061,900 2,011,622Malaysia Airports Holdings Bhd(a). . . . . . . . . . . . . . . . . . . . . . . . . 254,563 346,348Maxis Bhd. . . . . . . . . . . . . . . . . . . . . . . . . . . . . . . . . . . . . . . . . . . . . . . 546,500 605,848MISC Bhd . . . . . . . . . . . . . . . . . . . . . . . . . . . . . . . . . . . . . . . . . . . . . . . 303,000 477,637
Security Shares
Value
Malaysia (continued)Nestle Malaysia Bhd . . . . . . . . . . . . . . . . . . . . . . . . . . . . . . . . . . . . . 15,500 $ 491,385Petronas Dagangan Bhd . . . . . . . . . . . . . . . . . . . . . . . . . . . . . . . . . 70,000 330,761Petronas Gas Bhd . . . . . . . . . . . . . . . . . . . . . . . . . . . . . . . . . . . . . . . 176,600 705,310PPB Group Bhd . . . . . . . . . . . . . . . . . . . . . . . . . . . . . . . . . . . . . . . . . 141,600 599,148Press Metal Aluminium Holdings Bhd . . . . . . . . . . . . . . . . . . . . . 728,300 925,182Public Bank Bhd . . . . . . . . . . . . . . . . . . . . . . . . . . . . . . . . . . . . . . . . . 3,315,000 3,101,294QL Resources Bhd. . . . . . . . . . . . . . . . . . . . . . . . . . . . . . . . . . . . . . . 249,000 269,013RHB Bank Bhd . . . . . . . . . . . . . . . . . . . . . . . . . . . . . . . . . . . . . . . . . . 404,700 507,118Sime Darby Bhd . . . . . . . . . . . . . . . . . . . . . . . . . . . . . . . . . . . . . . . . . 620,200 322,507Supermax Corp. Bhd. . . . . . . . . . . . . . . . . . . . . . . . . . . . . . . . . . . . . 14,500 6,473Telekom Malaysia Bhd . . . . . . . . . . . . . . . . . . . . . . . . . . . . . . . . . . . 261,200 344,980Top Glove Corp. Bhd. . . . . . . . . . . . . . . . . . . . . . . . . . . . . . . . . . . . . 1,202,700 836,735Westports Holdings Bhd. . . . . . . . . . . . . . . . . . . . . . . . . . . . . . . . . . 234,800 225,796
18,246,024Mexico — 1.5%Arca Continental SAB de CV . . . . . . . . . . . . . . . . . . . . . . . . . . . . . 105,500 643,406Cemex SAB de CV, NVS(a) . . . . . . . . . . . . . . . . . . . . . . . . . . . . . . . 3,412,176 2,116,448Coca-Cola Femsa SAB de CV. . . . . . . . . . . . . . . . . . . . . . . . . . . . 118,900 583,951Fomento Economico Mexicano SAB de CV . . . . . . . . . . . . . . . 443,100 3,150,314Gruma SAB de CV, Class B . . . . . . . . . . . . . . . . . . . . . . . . . . . . . . 50,170 608,123Grupo Bimbo SAB de CV, Series A . . . . . . . . . . . . . . . . . . . . . . . 355,800 932,871Grupo Financiero Banorte SAB de CV, Class O . . . . . . . . . . . 591,200 3,532,725Industrias Penoles SAB de CV . . . . . . . . . . . . . . . . . . . . . . . . . . . 32,590 399,561Kimberly-Clark de Mexico SAB de CV, Class A . . . . . . . . . . . . 358,400 562,776Telesites SAB de CV. . . . . . . . . . . . . . . . . . . . . . . . . . . . . . . . . . . . . 233,300 206,507
12,736,682Philippines — 0.8%Ayala Land Inc. . . . . . . . . . . . . . . . . . . . . . . . . . . . . . . . . . . . . . . . . . . 1,843,100 1,259,380Bank of the Philippine Islands . . . . . . . . . . . . . . . . . . . . . . . . . . . . 410,010 741,594Globe Telecom Inc. . . . . . . . . . . . . . . . . . . . . . . . . . . . . . . . . . . . . . . 6,240 406,464GT Capital Holdings Inc. . . . . . . . . . . . . . . . . . . . . . . . . . . . . . . . . . 21,060 237,608JG Summit Holdings Inc. . . . . . . . . . . . . . . . . . . . . . . . . . . . . . . . . . 693,188 778,005SM Investments Corp. . . . . . . . . . . . . . . . . . . . . . . . . . . . . . . . . . . . 55,520 1,079,877SM Prime Holdings Inc. . . . . . . . . . . . . . . . . . . . . . . . . . . . . . . . . . . 2,321,600 1,721,135Universal Robina Corp. . . . . . . . . . . . . . . . . . . . . . . . . . . . . . . . . . . 203,280 536,593
6,760,656Poland — 1.1%Bank Polska Kasa Opieki SA . . . . . . . . . . . . . . . . . . . . . . . . . . . . . 41,531 1,199,296CD Projekt SA . . . . . . . . . . . . . . . . . . . . . . . . . . . . . . . . . . . . . . . . . . . 15,717 699,367Cyfrowy Polsat SA . . . . . . . . . . . . . . . . . . . . . . . . . . . . . . . . . . . . . . . 66,296 566,241KGHM Polska Miedz SA . . . . . . . . . . . . . . . . . . . . . . . . . . . . . . . . . 31,617 1,085,428Orange Polska SA(a) . . . . . . . . . . . . . . . . . . . . . . . . . . . . . . . . . . . . . 148,378 308,338Polski Koncern Naftowy ORLEN SA . . . . . . . . . . . . . . . . . . . . . . 68,496 1,196,000Powszechna Kasa Oszczednosci Bank Polski SA(a) . . . . . . . 197,992 2,092,483Powszechny Zaklad Ubezpieczen SA. . . . . . . . . . . . . . . . . . . . . 138,962 1,211,780Santander Bank Polska SA. . . . . . . . . . . . . . . . . . . . . . . . . . . . . . . 8,311 738,136
9,097,069Qatar — 0.9%Commercial Bank PSQC (The) . . . . . . . . . . . . . . . . . . . . . . . . . . . 471,452 842,200Ooredoo QPSC. . . . . . . . . . . . . . . . . . . . . . . . . . . . . . . . . . . . . . . . . . 177,023 328,303Qatar Fuel QSC . . . . . . . . . . . . . . . . . . . . . . . . . . . . . . . . . . . . . . . . . 110,552 548,750Qatar National Bank QPSC . . . . . . . . . . . . . . . . . . . . . . . . . . . . . . 1,024,081 5,415,625
7,134,878Russia — 3.8%Gazprom PJSC. . . . . . . . . . . . . . . . . . . . . . . . . . . . . . . . . . . . . . . . . . 2,693,870 12,088,086LUKOIL PJSC . . . . . . . . . . . . . . . . . . . . . . . . . . . . . . . . . . . . . . . . . . . 94,644 8,338,596Mobile TeleSystems PJSC, ADR. . . . . . . . . . . . . . . . . . . . . . . . . . 102,359 819,896Moscow Exchange MICEX-RTS PJSC. . . . . . . . . . . . . . . . . . . . 330,470 675,525Novatek PJSC, GDR(d). . . . . . . . . . . . . . . . . . . . . . . . . . . . . . . . . . . 20,705 4,516,800
Schedule of Investments (unaudited) (continued)
November 30, 2021
iShares� ESG MSCI EM Leaders ETF(Percentages shown are based on Net Assets)
58 NM0122U-1995964-60/159

Security Shares
Value
Russia (continued)Novolipetsk Steel PJSC . . . . . . . . . . . . . . . . . . . . . . . . . . . . . . . . . . 345,386 $ 1,005,882PhosAgro PJSC, GDR(d) . . . . . . . . . . . . . . . . . . . . . . . . . . . . . . . . . 31,382 692,287Polymetal International PLC . . . . . . . . . . . . . . . . . . . . . . . . . . . . . . 79,515 1,488,108Polyus PJSC . . . . . . . . . . . . . . . . . . . . . . . . . . . . . . . . . . . . . . . . . . . . 7,746 1,509,890
31,135,070Saudi Arabia — 1.3%Almarai Co. JSC. . . . . . . . . . . . . . . . . . . . . . . . . . . . . . . . . . . . . . . . . 56,866 725,301Bank AlBilad(a). . . . . . . . . . . . . . . . . . . . . . . . . . . . . . . . . . . . . . . . . . . 83,187 948,315Dr Sulaiman Al Habib Medical Services Group Co. . . . . . . . . 12,136 530,617Saudi Arabian Mining Co.(a) . . . . . . . . . . . . . . . . . . . . . . . . . . . . . . 97,536 1,858,893Saudi Basic Industries Corp. . . . . . . . . . . . . . . . . . . . . . . . . . . . . . 204,453 5,875,813Savola Group (The). . . . . . . . . . . . . . . . . . . . . . . . . . . . . . . . . . . . . . 59,211 490,244
10,429,183South Africa — 5.4%Absa Group Ltd. . . . . . . . . . . . . . . . . . . . . . . . . . . . . . . . . . . . . . . . . . 162,626 1,365,476Anglo American Platinum Ltd. . . . . . . . . . . . . . . . . . . . . . . . . . . . . 12,214 1,295,572Aspen Pharmacare Holdings Ltd. . . . . . . . . . . . . . . . . . . . . . . . . . 89,393 1,337,156Bid Corp. Ltd.. . . . . . . . . . . . . . . . . . . . . . . . . . . . . . . . . . . . . . . . . . . . 75,789 1,453,262Bidvest Group Ltd. (The) . . . . . . . . . . . . . . . . . . . . . . . . . . . . . . . . . 67,004 761,668Capitec Bank Holdings Ltd.. . . . . . . . . . . . . . . . . . . . . . . . . . . . . . . 18,491 2,119,402Clicks Group Ltd. . . . . . . . . . . . . . . . . . . . . . . . . . . . . . . . . . . . . . . . . 56,849 1,013,310Discovery Ltd.(a) . . . . . . . . . . . . . . . . . . . . . . . . . . . . . . . . . . . . . . . . . 97,918 820,529FirstRand Ltd. . . . . . . . . . . . . . . . . . . . . . . . . . . . . . . . . . . . . . . . . . . . 1,149,476 4,019,840Gold Fields Ltd.. . . . . . . . . . . . . . . . . . . . . . . . . . . . . . . . . . . . . . . . . . 200,784 2,311,022Growthpoint Properties Ltd. . . . . . . . . . . . . . . . . . . . . . . . . . . . . . . 772,019 648,001Impala Platinum Holdings Ltd. . . . . . . . . . . . . . . . . . . . . . . . . . . . . 186,184 2,331,839Kumba Iron Ore Ltd. . . . . . . . . . . . . . . . . . . . . . . . . . . . . . . . . . . . . . 14,435 408,668MTN Group Ltd.(a) . . . . . . . . . . . . . . . . . . . . . . . . . . . . . . . . . . . . . . . 386,082 3,894,482MultiChoice Group . . . . . . . . . . . . . . . . . . . . . . . . . . . . . . . . . . . . . . . 84,785 655,731Naspers Ltd., Class N. . . . . . . . . . . . . . . . . . . . . . . . . . . . . . . . . . . . 49,553 7,658,797Nedbank Group Ltd. . . . . . . . . . . . . . . . . . . . . . . . . . . . . . . . . . . . . . 104,100 1,081,121NEPI Rockcastle PLC. . . . . . . . . . . . . . . . . . . . . . . . . . . . . . . . . . . . 96,579 599,027Northam Platinum Holdings Ltd.(a) . . . . . . . . . . . . . . . . . . . . . . . . 80,693 1,127,216Old Mutual Ltd. . . . . . . . . . . . . . . . . . . . . . . . . . . . . . . . . . . . . . . . . . . 1,062,079 811,333Remgro Ltd. . . . . . . . . . . . . . . . . . . . . . . . . . . . . . . . . . . . . . . . . . . . . . 119,046 939,494Sanlam Ltd. . . . . . . . . . . . . . . . . . . . . . . . . . . . . . . . . . . . . . . . . . . . . . 434,581 1,513,724Shoprite Holdings Ltd. . . . . . . . . . . . . . . . . . . . . . . . . . . . . . . . . . . . 113,438 1,406,189SPAR Group Ltd. (The) . . . . . . . . . . . . . . . . . . . . . . . . . . . . . . . . . . 43,493 444,638Standard Bank Group Ltd.. . . . . . . . . . . . . . . . . . . . . . . . . . . . . . . . 295,298 2,398,589Vodacom Group Ltd. . . . . . . . . . . . . . . . . . . . . . . . . . . . . . . . . . . . . . 145,322 1,219,864Woolworths Holdings Ltd. . . . . . . . . . . . . . . . . . . . . . . . . . . . . . . . . 224,977 727,166
44,363,116South Korea — 7.9%Amorepacific Corp. . . . . . . . . . . . . . . . . . . . . . . . . . . . . . . . . . . . . . . 7,259 959,029AMOREPACIFIC Group. . . . . . . . . . . . . . . . . . . . . . . . . . . . . . . . . . 6,690 232,223BGF retail Co. Ltd. . . . . . . . . . . . . . . . . . . . . . . . . . . . . . . . . . . . . . . . 1,869 228,342Celltrion Healthcare Co. Ltd.(a) . . . . . . . . . . . . . . . . . . . . . . . . . . . 19,227 1,308,868CJ CheilJedang Corp.. . . . . . . . . . . . . . . . . . . . . . . . . . . . . . . . . . . . 1,849 551,079CJ Corp. . . . . . . . . . . . . . . . . . . . . . . . . . . . . . . . . . . . . . . . . . . . . . . . . 3,407 229,334CJ Logistics Corp.(a) . . . . . . . . . . . . . . . . . . . . . . . . . . . . . . . . . . . . . 2,083 217,318Coway Co. Ltd. . . . . . . . . . . . . . . . . . . . . . . . . . . . . . . . . . . . . . . . . . . 12,462 711,033Doosan Bobcat Inc.(a) . . . . . . . . . . . . . . . . . . . . . . . . . . . . . . . . . . . . 11,050 336,379GS Engineering & Construction Corp.. . . . . . . . . . . . . . . . . . . . . 14,811 457,182GS Holdings Corp.. . . . . . . . . . . . . . . . . . . . . . . . . . . . . . . . . . . . . . . 10,344 325,826Hankook Tire & Technology Co. Ltd. . . . . . . . . . . . . . . . . . . . . . . 16,843 546,101Hanon Systems . . . . . . . . . . . . . . . . . . . . . . . . . . . . . . . . . . . . . . . . . 42,367 461,266Hanwha Solutions Corp.(a) . . . . . . . . . . . . . . . . . . . . . . . . . . . . . . . 27,832 775,632Hyundai Engineering & Construction Co. Ltd. . . . . . . . . . . . . . 18,187 675,707Hyundai Glovis Co. Ltd. . . . . . . . . . . . . . . . . . . . . . . . . . . . . . . . . . . 4,241 519,021
Security Shares
Value
South Korea (continued)Hyundai Heavy Industries Holdings Co. Ltd.. . . . . . . . . . . . . . . 10,711 $ 477,091Kakao Corp. . . . . . . . . . . . . . . . . . . . . . . . . . . . . . . . . . . . . . . . . . . . . . 70,832 7,246,817KB Financial Group Inc. . . . . . . . . . . . . . . . . . . . . . . . . . . . . . . . . . . 89,876 3,994,350Korean Air Lines Co. Ltd.(a). . . . . . . . . . . . . . . . . . . . . . . . . . . . . . . 39,748 883,356LG Chem Ltd. . . . . . . . . . . . . . . . . . . . . . . . . . . . . . . . . . . . . . . . . . . . 10,420 6,103,950LG Corp. . . . . . . . . . . . . . . . . . . . . . . . . . . . . . . . . . . . . . . . . . . . . . . . . 19,543 1,293,292LG Display Co. Ltd.(a) . . . . . . . . . . . . . . . . . . . . . . . . . . . . . . . . . . . . 52,392 876,274LG Electronics Inc.. . . . . . . . . . . . . . . . . . . . . . . . . . . . . . . . . . . . . . . 24,247 2,360,021LG Household & Health Care Ltd. . . . . . . . . . . . . . . . . . . . . . . . . 2,137 1,895,181Lotte Chemical Corp. . . . . . . . . . . . . . . . . . . . . . . . . . . . . . . . . . . . . 3,969 672,436NAVER Corp.. . . . . . . . . . . . . . . . . . . . . . . . . . . . . . . . . . . . . . . . . . . . 28,039 8,951,506POSCO Chemical Co. Ltd. . . . . . . . . . . . . . . . . . . . . . . . . . . . . . . . 6,997 928,871Samsung Electro-Mechanics Co. Ltd. . . . . . . . . . . . . . . . . . . . . . 12,805 1,793,167Samsung Engineering Co. Ltd.(a) . . . . . . . . . . . . . . . . . . . . . . . . . 35,786 624,861Samsung Fire & Marine Insurance Co. Ltd. . . . . . . . . . . . . . . . 6,943 1,181,268Samsung SDI Co. Ltd. . . . . . . . . . . . . . . . . . . . . . . . . . . . . . . . . . . . 12,514 7,230,612Samsung SDS Co. Ltd. . . . . . . . . . . . . . . . . . . . . . . . . . . . . . . . . . . 7,880 946,929Shinhan Financial Group Co. Ltd.. . . . . . . . . . . . . . . . . . . . . . . . . 99,900 2,905,224SK Biopharmaceuticals Co. Ltd.(a) . . . . . . . . . . . . . . . . . . . . . . . . 6,149 493,731SK Inc. . . . . . . . . . . . . . . . . . . . . . . . . . . . . . . . . . . . . . . . . . . . . . . . . . . 9,602 2,091,053SK Innovation Co. Ltd.(a) . . . . . . . . . . . . . . . . . . . . . . . . . . . . . . . . . 11,612 1,899,712SK Square Co. Ltd.(a) . . . . . . . . . . . . . . . . . . . . . . . . . . . . . . . . . . . . 4,014 229,777SK Telecom Co. Ltd. . . . . . . . . . . . . . . . . . . . . . . . . . . . . . . . . . . . . . 6,210 284,350SKC Co. Ltd. . . . . . . . . . . . . . . . . . . . . . . . . . . . . . . . . . . . . . . . . . . . . 4,816 797,616Yuhan Corp. . . . . . . . . . . . . . . . . . . . . . . . . . . . . . . . . . . . . . . . . . . . . . 11,374 553,741
65,249,526Taiwan — 16.4%Acer Inc. . . . . . . . . . . . . . . . . . . . . . . . . . . . . . . . . . . . . . . . . . . . . . . . . 651,000 647,019ASE Technology Holding Co. Ltd.. . . . . . . . . . . . . . . . . . . . . . . . . 748,000 2,726,647AU Optronics Corp. . . . . . . . . . . . . . . . . . . . . . . . . . . . . . . . . . . . . . . 1,876,000 1,351,434Cathay Financial Holding Co. Ltd. . . . . . . . . . . . . . . . . . . . . . . . . 1,783,000 3,830,568Chailease Holding Co. Ltd. . . . . . . . . . . . . . . . . . . . . . . . . . . . . . . . 297,502 2,632,002Cheng Shin Rubber Industry Co. Ltd. . . . . . . . . . . . . . . . . . . . . . 408,000 490,554China Steel Corp.. . . . . . . . . . . . . . . . . . . . . . . . . . . . . . . . . . . . . . . . 2,688,000 3,136,019Chunghwa Telecom Co. Ltd. . . . . . . . . . . . . . . . . . . . . . . . . . . . . . 864,000 3,475,922Compal Electronics Inc. . . . . . . . . . . . . . . . . . . . . . . . . . . . . . . . . . . 968,000 803,777CTBC Financial Holding Co. Ltd. . . . . . . . . . . . . . . . . . . . . . . . . . 4,211,000 3,686,408Delta Electronics Inc. . . . . . . . . . . . . . . . . . . . . . . . . . . . . . . . . . . . . 444,000 4,081,655E.Sun Financial Holding Co. Ltd. . . . . . . . . . . . . . . . . . . . . . . . . . 2,735,140 2,643,471Eclat Textile Co. Ltd. . . . . . . . . . . . . . . . . . . . . . . . . . . . . . . . . . . . . . 45,000 936,816Evergreen Marine Corp. Taiwan Ltd. . . . . . . . . . . . . . . . . . . . . . . 578,000 2,560,069Far Eastern New Century Corp. . . . . . . . . . . . . . . . . . . . . . . . . . . 661,000 661,037Far EasTone Telecommunications Co. Ltd. . . . . . . . . . . . . . . . . 368,000 813,786Feng TAY Enterprise Co. Ltd.. . . . . . . . . . . . . . . . . . . . . . . . . . . . . 101,000 736,731First Financial Holding Co. Ltd. . . . . . . . . . . . . . . . . . . . . . . . . . . . 2,361,324 1,961,127Fubon Financial Holding Co. Ltd. . . . . . . . . . . . . . . . . . . . . . . . . . 1,721,800 4,513,000Hiwin Technologies Corp. . . . . . . . . . . . . . . . . . . . . . . . . . . . . . . . . 61,449 628,540Hotai Motor Co. Ltd. . . . . . . . . . . . . . . . . . . . . . . . . . . . . . . . . . . . . . 69,000 1,502,454Hua Nan Financial Holdings Co. Ltd.. . . . . . . . . . . . . . . . . . . . . . 1,930,579 1,400,242Innolux Corp. . . . . . . . . . . . . . . . . . . . . . . . . . . . . . . . . . . . . . . . . . . . . 2,149,000 1,340,928Inventec Corp.. . . . . . . . . . . . . . . . . . . . . . . . . . . . . . . . . . . . . . . . . . . 621,000 573,526Lite-On Technology Corp. . . . . . . . . . . . . . . . . . . . . . . . . . . . . . . . . 475,000 1,026,963MediaTek Inc. . . . . . . . . . . . . . . . . . . . . . . . . . . . . . . . . . . . . . . . . . . . 344,000 12,470,215Mega Financial Holding Co. Ltd. . . . . . . . . . . . . . . . . . . . . . . . . . . 2,469,000 3,034,044Nan Ya Plastics Corp. . . . . . . . . . . . . . . . . . . . . . . . . . . . . . . . . . . . . 1,174,000 3,478,277Nien Made Enterprise Co. Ltd.. . . . . . . . . . . . . . . . . . . . . . . . . . . . 36,000 490,412Oneness Biotech Co. Ltd.(a) . . . . . . . . . . . . . . . . . . . . . . . . . . . . . . 51,000 545,685President Chain Store Corp.. . . . . . . . . . . . . . . . . . . . . . . . . . . . . . 131,000 1,267,657Ruentex Development Co. Ltd. . . . . . . . . . . . . . . . . . . . . . . . . . . . 264,600 608,537Shanghai Commercial & Savings Bank Ltd. (The) . . . . . . . . . 823,000 1,369,053
Schedule of Investments (unaudited) (continued)
November 30, 2021
iShares� ESG MSCI EM Leaders ETF(Percentages shown are based on Net Assets)
59NM0122U-1995964-61/159

Security Shares
Value
Taiwan (continued)SinoPac Financial Holdings Co. Ltd. . . . . . . . . . . . . . . . . . . . . . . 2,294,000 $ 1,258,656Taishin Financial Holding Co. Ltd. . . . . . . . . . . . . . . . . . . . . . . . . 2,355,151 1,572,637Taiwan Cement Corp. . . . . . . . . . . . . . . . . . . . . . . . . . . . . . . . . . . . . 1,184,000 1,954,532Taiwan High Speed Rail Corp. . . . . . . . . . . . . . . . . . . . . . . . . . . . . 427,000 455,017Taiwan Mobile Co. Ltd. . . . . . . . . . . . . . . . . . . . . . . . . . . . . . . . . . . . 371,000 1,293,563Taiwan Semiconductor Manufacturing Co. Ltd. . . . . . . . . . . . . 1,977,000 42,048,173Uni-President Enterprises Corp. . . . . . . . . . . . . . . . . . . . . . . . . . . 1,101,000 2,581,724United Microelectronics Corp. . . . . . . . . . . . . . . . . . . . . . . . . . . . . 2,687,000 6,151,308Wan Hai Lines Ltd.. . . . . . . . . . . . . . . . . . . . . . . . . . . . . . . . . . . . . . . 136,400 766,269Wistron Corp.. . . . . . . . . . . . . . . . . . . . . . . . . . . . . . . . . . . . . . . . . . . . 633,000 650,356Yageo Corp. . . . . . . . . . . . . . . . . . . . . . . . . . . . . . . . . . . . . . . . . . . . . . 84,000 1,372,126Yang Ming Marine Transport Corp.(a). . . . . . . . . . . . . . . . . . . . . . 397,000 1,630,225Yuanta Financial Holding Co. Ltd. . . . . . . . . . . . . . . . . . . . . . . . . 2,193,720 1,863,875
135,023,036Thailand — 2.4%Advanced Info Service PCL, NVDR. . . . . . . . . . . . . . . . . . . . . . . 275,800 1,683,460Airports of Thailand PCL, NVDR. . . . . . . . . . . . . . . . . . . . . . . . . . 967,200 1,712,967Asset World Corp. PCL, NVDR(a) . . . . . . . . . . . . . . . . . . . . . . . . . 1,834,800 232,070B Grimm Power PCL, NVDR . . . . . . . . . . . . . . . . . . . . . . . . . . . . . 179,600 210,153Bangkok Dusit Medical Services PCL, NVDR . . . . . . . . . . . . . 2,145,100 1,417,218Berli Jucker PCL, NVDR . . . . . . . . . . . . . . . . . . . . . . . . . . . . . . . . . 286,800 280,461BTS Group Holdings PCL, NVDR. . . . . . . . . . . . . . . . . . . . . . . . . 1,809,700 493,385Bumrungrad Hospital PCL, NVDR . . . . . . . . . . . . . . . . . . . . . . . . 110,400 470,142Central Pattana PCL, NVDR . . . . . . . . . . . . . . . . . . . . . . . . . . . . . 454,300 700,465Charoen Pokphand Foods PCL, NVDR . . . . . . . . . . . . . . . . . . . 865,400 610,043CP ALL PCL, NVDR . . . . . . . . . . . . . . . . . . . . . . . . . . . . . . . . . . . . . 1,315,500 2,278,890Energy Absolute PCL, NVDR. . . . . . . . . . . . . . . . . . . . . . . . . . . . . 343,700 834,855Home Product Center PCL, NVDR. . . . . . . . . . . . . . . . . . . . . . . . 1,344,300 542,153Indorama Ventures PCL, NVDR . . . . . . . . . . . . . . . . . . . . . . . . . . 379,300 440,394Intouch Holdings PCL, NVDR . . . . . . . . . . . . . . . . . . . . . . . . . . . . 258,900 558,607Land & Houses PCL, NVDR. . . . . . . . . . . . . . . . . . . . . . . . . . . . . . 1,794,700 443,642Minor International PCL, NVDR(a). . . . . . . . . . . . . . . . . . . . . . . . . 705,500 569,311Muangthai Capital PCL, NVDR . . . . . . . . . . . . . . . . . . . . . . . . . . . 172,800 286,518Osotspa PCL, NVDR. . . . . . . . . . . . . . . . . . . . . . . . . . . . . . . . . . . . . 279,500 264,829PTT Exploration & Production PCL, NVDR . . . . . . . . . . . . . . . . 309,600 1,036,703PTT Global Chemical PCL, NVDR . . . . . . . . . . . . . . . . . . . . . . . . 519,800 864,372Siam Cement PCL (The), NVDR. . . . . . . . . . . . . . . . . . . . . . . . . . 175,800 1,937,979Siam Commercial Bank PCL (The), NVDR . . . . . . . . . . . . . . . . 196,500 709,385Sri Trang Gloves Thailand PCL, NVDR . . . . . . . . . . . . . . . . . . . 226,100 201,291Thai Oil PCL, NVDR . . . . . . . . . . . . . . . . . . . . . . . . . . . . . . . . . . . . . 258,800 355,084Thai Union Group PCL, NVDR . . . . . . . . . . . . . . . . . . . . . . . . . . . 667,000 389,937True Corp. PCL, NVDR . . . . . . . . . . . . . . . . . . . . . . . . . . . . . . . . . . 2,705,100 361,865
19,886,179Turkey — 0.2%KOC Holding AS. . . . . . . . . . . . . . . . . . . . . . . . . . . . . . . . . . . . . . . . . 173,930 362,644Turkcell Iletisim Hizmetleri AS . . . . . . . . . . . . . . . . . . . . . . . . . . . . 270,256 378,053Turkiye Garanti Bankasi AS . . . . . . . . . . . . . . . . . . . . . . . . . . . . . . 536,255 447,394Turkiye Is Bankasi AS, Class C . . . . . . . . . . . . . . . . . . . . . . . . . . . 346,454 166,129Turkiye Sise ve Cam Fabrikalari AS. . . . . . . . . . . . . . . . . . . . . . . 299,848 274,914
1,629,134United Arab Emirates — 2.0%Abu Dhabi Commercial Bank PJSC. . . . . . . . . . . . . . . . . . . . . . . 628,602 1,452,839Abu Dhabi Islamic Bank PJSC. . . . . . . . . . . . . . . . . . . . . . . . . . . . 331,199 584,294Aldar Properties PJSC . . . . . . . . . . . . . . . . . . . . . . . . . . . . . . . . . . . 865,313 945,835Emirates NBD Bank PJSC . . . . . . . . . . . . . . . . . . . . . . . . . . . . . . . 573,917 2,063,270Emirates Telecommunications Group Co. PJSC . . . . . . . . . . . 688,799 5,990,005
Security Shares
Value
United Arab Emirates (continued)First Abu Dhabi Bank PJSC . . . . . . . . . . . . . . . . . . . . . . . . . . . . . . 994,922 $ 5,181,978
16,218,221
Total Common Stocks — 98.6%(Cost: $714,790,447) . . . . . . . . . . . . . . . . . . . . . . . . . . . . . . . . . . . . . . . . . . . . . . 811,151,601
Preferred StocksBrazil — 0.7%Banco Bradesco SA, Preference Shares, NVS . . . . . . . . . . . . 1,106,328 3,918,104Cia. Energetica de Minas Gerais, Preference
Shares, NVS. . . . . . . . . . . . . . . . . . . . . . . . . . . . . . . . . . . . . . . . . . 247,626 578,779Gerdau SA, Preference Shares, NVS . . . . . . . . . . . . . . . . . . . . . 257,635 1,182,348
5,679,231Chile — 0.2%Sociedad Quimica y Minera de Chile SA, Class B,
Preference Shares, NVS . . . . . . . . . . . . . . . . . . . . . . . . . . . . . . 30,851 1,942,374
Colombia — 0.1%Bancolombia SA, Preference Shares, NVS. . . . . . . . . . . . . . . . 103,405 838,629
South Korea — 0.1%LG Chem Ltd., Preference Shares, NVS . . . . . . . . . . . . . . . . . . 1,789 487,583LG Household & Health Care Ltd., Preference
Shares, NVS. . . . . . . . . . . . . . . . . . . . . . . . . . . . . . . . . . . . . . . . . . 475 237,904
725,487
Total Preferred Stocks — 1.1%(Cost: $10,759,132) . . . . . . . . . . . . . . . . . . . . . . . . . . . . . . . . . . . . . . . . . . . . . . . 9,185,721
RightsCayman Islands — 0.0%CIFI Holdings Group Co. Ltd. (Expires 12/20/21)(a) . . . . . . . . 38,500 1,234
Thailand — 0.0%Charoen Pokphand Foods PCL (Expires 12/31/21)(a) . . . . . . 12,362 —CP All PCL (Expires 12/31/21)(a) . . . . . . . . . . . . . . . . . . . . . . . . . . 87,700 —
—
Total Rights — 0.0%(Cost: $0) . . . . . . . . . . . . . . . . . . . . . . . . . . . . . . . . . . . . . . . . . . . . . . . . . . . . . . . . . 1,234
WarrantsThailand — 0.0%BTS Group Holdings PCL (Expires 11/20/26)(a) . . . . . . . . . . . . 359,380 —BTS Group Holdings PCL (Expires 11/07/24)(a) . . . . . . . . . . . . 179,690 2,720
2,720
Total Warrants — 0.0%(Cost: $0) . . . . . . . . . . . . . . . . . . . . . . . . . . . . . . . . . . . . . . . . . . . . . . . . . . . . . . . . . 2,720
Short-Term InvestmentsMoney Market Funds — 1.1%BlackRock Cash Funds: Institutional, SL Agency Shares,
0.06%(e)(f)(g). . . . . . . . . . . . . . . . . . . . . . . . . . . . . . . . . . . . . . . . . . . 4,962,927 4,964,912
Schedule of Investments (unaudited) (continued)
November 30, 2021
iShares� ESG MSCI EM Leaders ETF(Percentages shown are based on Net Assets)
60 NM0122U-1995964-62/159

Security Shares
Value
Money Market Funds (continued)BlackRock Cash Funds: Treasury, SL Agency Shares,
0.00%(e)(f). . . . . . . . . . . . . . . . . . . . . . . . . . . . . . . . . . . . . . . . . . . . . 3,550,000 $ 3,550,000
8,514,912
Total Short-Term Investments — 1.1%(Cost: $8,515,330). . . . . . . . . . . . . . . . . . . . . . . . . . . . . . . . . . . . . . . . . . . . . . . . . 8,514,912
Total Investments in Securities — 100.8%(Cost: $734,064,909) . . . . . . . . . . . . . . . . . . . . . . . . . . . . . . . . . . . . . . . . . . . . . . 828,856,188
Other Assets, Less Liabilities — (0.8)%. . . . . . . . . . . . . . . . . . . . . . . . . . . . . . (6,241,045)
Net Assets — 100.0% . . . . . . . . . . . . . . . . . . . . . . . . . . . . . . . . . . . . . . . . . . . . . . . . $ 822,615,143 (a) Non-income producing security.
(b) Security exempt from registration pursuant to Rule 144A under the Securities Act of1933, as amended. These securities may be resold in transactions exempt fromregistration to qualified institutional investors.
(c) All or a portion of this security is on loan.(d) This security may be resold to qualified foreign investors and foreign institutional buyers
under Regulation S of the Securities Act of 1933.(e) Affiliate of the Fund.(f) Annualized 7-day yield as of period end.(g) All or a portion of this security was purchased with the cash collateral from loaned
securities.
Affiliates
Investments in issuers considered to be affiliate(s) of the Fund during the period ended November 30, 2021 for purposes of Section 2(a)(3) of the Investment Company Actof 1940, as amended, were as follows:
Affiliated IssuerValue at
08/31/21Purchases
at CostProceeds
from SalesNet Realized
Gain (Loss)
Change inUnrealized
Appreciation(Depreciation)
Value at11/30/21
SharesHeld at
11/30/21 Income
CapitalGain
Distributionsfrom
UnderlyingFunds
BlackRock Cash Funds: Institutional, SL AgencyShares . . . . . . . . . . . . . . . . . . . . . . . . . . . . . . . . . . . . . . . . . . $1,399,372 $3,566,316(a) $ — $ (358) $ (418) $4,964,912 4,962,927 $10,143(b) $ —
BlackRock Cash Funds: Treasury, SL AgencyShares . . . . . . . . . . . . . . . . . . . . . . . . . . . . . . . . . . . . . . . . . . 2,330,000 1,220,000(a)
— — — 3,550,000 3,550,000 57 —
$ (358) $ (418) $8,514,912 $10,200 $ —
(a) Represents net amount purchased (sold).(b) All or a portion represents securities lending income earned from the reinvestment of cash collateral from loaned securities, net of fees and collateral investment expenses, and other
payments to and from borrowers of securities.
Derivative Financial Instruments Outstanding as of Period End
Futures Contracts
DescriptionNumber ofContracts
ExpirationDate
NotionalAmount
(000)
Value/Unrealized
Appreciation(Depreciation)
Long ContractsMSCI Emerging Markets Index . . . . . . . . . . . . . . . . . . . . . . . . . . . . . . . . . . . . . . . . . . . . . . . . . . . . . . . . . . . . . . . . . . . . . . . . . . . . . . . . . . . . . . . 22 12/17/21 $ 1,334 $ (66,769)
Fair Value Measurements
Various inputs are used in determining the fair value of financial instruments. These inputs to valuation techniques are categorized into a fair value hierarchy consisting ofthree broad levels for financial reporting purposes as follows:
• Level 1 – Unadjusted price quotations in active markets/exchanges for identical assets or liabilities that each Fund has the ability to access;• Level 2 – Other observable inputs (including, but not limited to, quoted prices for similar assets or liabilities in markets that are active, quoted prices for identical or
similar assets or liabilities in markets that are not active, inputs other than quoted prices that are observable for the assets or liabilities (such as interest rates, yieldcurves, volatilities, prepayment speeds, loss severities, credit risks and default rates) or other market-corroborated inputs); and
• Level 3 – Unobservable inputs based on the best information available in the circumstances, to the extent observable inputs are not available (including the BlackRockGlobal Valuation Methodologies Committee’s (the “Global Valuation Committee’s”) assumptions used in determining the fair value of financial instruments).
The hierarchy gives the highest priority to unadjusted quoted prices in active markets for identical assets or liabilities (Level 1 measurements) and the lowest priority tounobservable inputs (Level 3 measurements). Accordingly, the degree of judgment exercised in determining fair value is greatest for instruments categorized in Level 3. The
Schedule of Investments (unaudited) (continued)
November 30, 2021
iShares� ESG MSCI EM Leaders ETF(Percentages shown are based on Net Assets)
61NM0122U-1995964-63/159

Fair Value Measurements (continued)
inputs used to measure fair value may fall into different levels of the fair value hierarchy. In such cases, for disclosure purposes, the fair value hierarchy classification isdetermined based on the lowest level input that is significant to the fair value measurement in its entirety. Investments classified within Level 3 have significant unobservableinputs used by the Global Valuation Committee in determining the price for Fair Valued Investments. Level 3 investments include equity or debt issued by privately heldcompanies or funds. There may not be a secondary market, and/or there are a limited number of investors. The categorization of a value determined for financial instrumentsis based on the pricing transparency of the financial instruments and is not necessarily an indication of the risks associated with investing in those securities. For informationabout the Fund’s policy regarding valuation of financial instruments, refer to its most recent financial statements.
The following table summarizes the Fund’s financial instruments categorized in the fair value hierarchy. The breakdown of the Fund’s financial instruments into majorcategories is disclosed in the Schedule of Investments above.
Level 1 Level 2 Level 3 Total
InvestmentsAssets
Common Stocks. . . . . . . . . . . . . . . . . . . . . . . . . . . . . . . . . . . . . . . . . . . . . . . . . . . . . . . . . . . . . . . . . . . . . . . . . . . . . . . . . . . . $124,069,581 $687,082,020 $ — $811,151,601Preferred Stocks . . . . . . . . . . . . . . . . . . . . . . . . . . . . . . . . . . . . . . . . . . . . . . . . . . . . . . . . . . . . . . . . . . . . . . . . . . . . . . . . . . . 6,517,860 2,667,861 — 9,185,721Rights . . . . . . . . . . . . . . . . . . . . . . . . . . . . . . . . . . . . . . . . . . . . . . . . . . . . . . . . . . . . . . . . . . . . . . . . . . . . . . . . . . . . . . . . . . . . . — 1,234 — 1,234Warrants . . . . . . . . . . . . . . . . . . . . . . . . . . . . . . . . . . . . . . . . . . . . . . . . . . . . . . . . . . . . . . . . . . . . . . . . . . . . . . . . . . . . . . . . . . . 2,720 — — 2,720Money Market Funds . . . . . . . . . . . . . . . . . . . . . . . . . . . . . . . . . . . . . . . . . . . . . . . . . . . . . . . . . . . . . . . . . . . . . . . . . . . . . . . 8,514,912 — — 8,514,912
$139,105,073 $689,751,115 $ — $828,856,188
Derivative financial instruments(a)
LiabilitiesFutures Contracts . . . . . . . . . . . . . . . . . . . . . . . . . . . . . . . . . . . . . . . . . . . . . . . . . . . . . . . . . . . . . . . . . . . . . . . . . . . . . . . . . . $ (66,769) $ — $ — $ (66,769)
(a) Derivative financial instruments are futures contracts. Futures contracts are valued at the unrealized appreciation (depreciation) on the instrument.
Portfolio Abbreviations - Equity
ADR . . . . . . . . . . . . . American Depositary ReceiptGDR . . . . . . . . . . . . . Global Depositary ReceiptJSC. . . . . . . . . . . . . . Joint Stock CompanyNVDR. . . . . . . . . . . . Non-Voting Depositary ReceiptNVS . . . . . . . . . . . . . Non-Voting SharesPJSC . . . . . . . . . . . . Public Joint Stock Company
Schedule of Investments (unaudited) (continued)
November 30, 2021
iShares� ESG MSCI EM Leaders ETF
62 NM0122U-1995964-64/159

Security Shares
Value
Common StocksAerospace & Defense — 0.0%Howmet Aerospace Inc. . . . . . . . . . . . . . . . . . . . . . . . . . . . . . . . . . 78,892 $ 2,219,232
Air Freight & Logistics — 0.9%CH Robinson Worldwide Inc. . . . . . . . . . . . . . . . . . . . . . . . . . . . . 27,047 2,571,899Expeditors International of Washington Inc.. . . . . . . . . . . . . . . 34,192 4,158,431United Parcel Service Inc., Class B . . . . . . . . . . . . . . . . . . . . . . 147,535 29,266,518
35,996,848Airlines — 0.0%Delta Air Lines Inc.(a) . . . . . . . . . . . . . . . . . . . . . . . . . . . . . . . . . . . . 32,246 1,167,305
Auto Components — 0.3%Aptiv PLC(a). . . . . . . . . . . . . . . . . . . . . . . . . . . . . . . . . . . . . . . . . . . . . 54,545 8,746,291BorgWarner Inc. . . . . . . . . . . . . . . . . . . . . . . . . . . . . . . . . . . . . . . . . 48,353 2,092,718
10,839,009Automobiles — 4.6%Tesla Inc.(a) . . . . . . . . . . . . . . . . . . . . . . . . . . . . . . . . . . . . . . . . . . . . . 170,471 195,148,382
Banks — 2.0%Citizens Financial Group Inc. . . . . . . . . . . . . . . . . . . . . . . . . . . . . 85,840 4,057,657First Republic Bank/CA. . . . . . . . . . . . . . . . . . . . . . . . . . . . . . . . . . 35,512 7,445,446Huntington Bancshares Inc./OH. . . . . . . . . . . . . . . . . . . . . . . . . . 297,863 4,420,287KeyCorp . . . . . . . . . . . . . . . . . . . . . . . . . . . . . . . . . . . . . . . . . . . . . . . . 195,623 4,389,780M&T Bank Corp. . . . . . . . . . . . . . . . . . . . . . . . . . . . . . . . . . . . . . . . . 25,942 3,803,357PNC Financial Services Group Inc. (The). . . . . . . . . . . . . . . . . 85,732 16,889,204Regions Financial Corp. . . . . . . . . . . . . . . . . . . . . . . . . . . . . . . . . . 193,851 4,410,110SVB Financial Group(a) . . . . . . . . . . . . . . . . . . . . . . . . . . . . . . . . . . 11,884 8,227,650Truist Financial Corp.. . . . . . . . . . . . . . . . . . . . . . . . . . . . . . . . . . . . 271,052 16,076,094U.S. Bancorp.. . . . . . . . . . . . . . . . . . . . . . . . . . . . . . . . . . . . . . . . . . . 285,237 15,785,015
85,504,600Beverages — 2.2%Coca-Cola Co. (The) . . . . . . . . . . . . . . . . . . . . . . . . . . . . . . . . . . . . 831,375 43,605,619Keurig Dr Pepper Inc. . . . . . . . . . . . . . . . . . . . . . . . . . . . . . . . . . . . 142,055 4,828,449PepsiCo Inc. . . . . . . . . . . . . . . . . . . . . . . . . . . . . . . . . . . . . . . . . . . . . 279,984 44,735,844
93,169,912Biotechnology — 1.5%Amgen Inc. . . . . . . . . . . . . . . . . . . . . . . . . . . . . . . . . . . . . . . . . . . . . . 115,941 23,058,346Biogen Inc.(a) . . . . . . . . . . . . . . . . . . . . . . . . . . . . . . . . . . . . . . . . . . . 30,340 7,152,352BioMarin Pharmaceutical Inc.(a) . . . . . . . . . . . . . . . . . . . . . . . . . . 36,707 3,167,447Gilead Sciences Inc. . . . . . . . . . . . . . . . . . . . . . . . . . . . . . . . . . . . . 253,993 17,507,737Horizon Therapeutics PLC(a) . . . . . . . . . . . . . . . . . . . . . . . . . . . . . 42,938 4,455,247Vertex Pharmaceuticals Inc.(a) . . . . . . . . . . . . . . . . . . . . . . . . . . . 52,554 9,824,445
65,165,574Building Products — 0.8%Allegion PLC. . . . . . . . . . . . . . . . . . . . . . . . . . . . . . . . . . . . . . . . . . . . 18,365 2,270,648Fortune Brands Home & Security Inc. . . . . . . . . . . . . . . . . . . . . 27,964 2,811,221Johnson Controls International PLC . . . . . . . . . . . . . . . . . . . . . . 144,451 10,799,157Lennox International Inc. . . . . . . . . . . . . . . . . . . . . . . . . . . . . . . . . 6,893 2,130,075Masco Corp. . . . . . . . . . . . . . . . . . . . . . . . . . . . . . . . . . . . . . . . . . . . . 51,860 3,417,574Owens Corning . . . . . . . . . . . . . . . . . . . . . . . . . . . . . . . . . . . . . . . . . 21,175 1,796,487Trane Technologies PLC . . . . . . . . . . . . . . . . . . . . . . . . . . . . . . . . 48,105 8,978,798
32,203,960Capital Markets — 4.8%Ameriprise Financial Inc. . . . . . . . . . . . . . . . . . . . . . . . . . . . . . . . . 23,365 6,766,504Bank of New York Mellon Corp. (The) . . . . . . . . . . . . . . . . . . . . 168,573 9,236,115BlackRock Inc.(b) . . . . . . . . . . . . . . . . . . . . . . . . . . . . . . . . . . . . . . . . 30,777 27,841,182Carlyle Group Inc. (The) . . . . . . . . . . . . . . . . . . . . . . . . . . . . . . . . . 32,177 1,759,760Cboe Global Markets Inc.. . . . . . . . . . . . . . . . . . . . . . . . . . . . . . . . 21,679 2,795,290Charles Schwab Corp. (The). . . . . . . . . . . . . . . . . . . . . . . . . . . . . 291,725 22,576,598
Security Shares
Value
Capital Markets (continued)CME Group Inc.. . . . . . . . . . . . . . . . . . . . . . . . . . . . . . . . . . . . . . . . . 72,481 $ 15,983,510FactSet Research Systems Inc.. . . . . . . . . . . . . . . . . . . . . . . . . . 7,644 3,581,749Franklin Resources Inc. . . . . . . . . . . . . . . . . . . . . . . . . . . . . . . . . . 61,298 1,986,055Intercontinental Exchange Inc. . . . . . . . . . . . . . . . . . . . . . . . . . . . 113,563 14,844,955Invesco Ltd.. . . . . . . . . . . . . . . . . . . . . . . . . . . . . . . . . . . . . . . . . . . . . 69,913 1,561,157MarketAxess Holdings Inc. . . . . . . . . . . . . . . . . . . . . . . . . . . . . . . 7,647 2,697,021Moody's Corp. . . . . . . . . . . . . . . . . . . . . . . . . . . . . . . . . . . . . . . . . . . 34,009 13,285,276Morgan Stanley . . . . . . . . . . . . . . . . . . . . . . . . . . . . . . . . . . . . . . . . . 277,210 26,285,052Nasdaq Inc.. . . . . . . . . . . . . . . . . . . . . . . . . . . . . . . . . . . . . . . . . . . . . 23,254 4,725,910Northern Trust Corp. . . . . . . . . . . . . . . . . . . . . . . . . . . . . . . . . . . . . 39,986 4,626,380Raymond James Financial Inc. . . . . . . . . . . . . . . . . . . . . . . . . . . 37,482 3,684,106S&P Global Inc. . . . . . . . . . . . . . . . . . . . . . . . . . . . . . . . . . . . . . . . . . 48,602 22,149,390State Street Corp. . . . . . . . . . . . . . . . . . . . . . . . . . . . . . . . . . . . . . . . 73,854 6,570,790T Rowe Price Group Inc. . . . . . . . . . . . . . . . . . . . . . . . . . . . . . . . . 45,722 9,142,114
202,098,914Chemicals — 2.2%DuPont de Nemours Inc. . . . . . . . . . . . . . . . . . . . . . . . . . . . . . . . . 107,248 7,932,062Ecolab Inc. . . . . . . . . . . . . . . . . . . . . . . . . . . . . . . . . . . . . . . . . . . . . . 51,931 11,501,159International Flavors & Fragrances Inc.. . . . . . . . . . . . . . . . . . . 50,183 7,134,517Linde PLC . . . . . . . . . . . . . . . . . . . . . . . . . . . . . . . . . . . . . . . . . . . . . . 104,975 33,396,747LyondellBasell Industries NV, Class A . . . . . . . . . . . . . . . . . . . . 53,964 4,701,883Mosaic Co. (The). . . . . . . . . . . . . . . . . . . . . . . . . . . . . . . . . . . . . . . . 74,745 2,557,774PPG Industries Inc. . . . . . . . . . . . . . . . . . . . . . . . . . . . . . . . . . . . . . 47,798 7,369,018Sherwin-Williams Co. (The). . . . . . . . . . . . . . . . . . . . . . . . . . . . . . 51,302 16,993,274
91,586,434Commercial Services & Supplies — 0.5%Copart Inc.(a). . . . . . . . . . . . . . . . . . . . . . . . . . . . . . . . . . . . . . . . . . . . 42,908 6,228,526Waste Management Inc.. . . . . . . . . . . . . . . . . . . . . . . . . . . . . . . . . 85,081 13,669,964
19,898,490Communications Equipment — 1.3%Cisco Systems Inc. . . . . . . . . . . . . . . . . . . . . . . . . . . . . . . . . . . . . . . 853,700 46,816,908Motorola Solutions Inc. . . . . . . . . . . . . . . . . . . . . . . . . . . . . . . . . . . 34,238 8,668,377
55,485,285Consumer Finance — 0.7%Ally Financial Inc. . . . . . . . . . . . . . . . . . . . . . . . . . . . . . . . . . . . . . . . 75,446 3,457,690American Express Co.. . . . . . . . . . . . . . . . . . . . . . . . . . . . . . . . . . . 137,623 20,959,983Discover Financial Services . . . . . . . . . . . . . . . . . . . . . . . . . . . . . 61,447 6,627,059
31,044,732Containers & Packaging — 0.3%Amcor PLC . . . . . . . . . . . . . . . . . . . . . . . . . . . . . . . . . . . . . . . . . . . . . 310,755 3,517,746Ball Corp.. . . . . . . . . . . . . . . . . . . . . . . . . . . . . . . . . . . . . . . . . . . . . . . 66,235 6,189,661International Paper Co. . . . . . . . . . . . . . . . . . . . . . . . . . . . . . . . . . . 75,490 3,436,305
13,143,712Distributors — 0.3%Genuine Parts Co. . . . . . . . . . . . . . . . . . . . . . . . . . . . . . . . . . . . . . . 29,117 3,719,405LKQ Corp. . . . . . . . . . . . . . . . . . . . . . . . . . . . . . . . . . . . . . . . . . . . . . . 58,154 3,250,809Pool Corp. . . . . . . . . . . . . . . . . . . . . . . . . . . . . . . . . . . . . . . . . . . . . . . 8,122 4,500,563
11,470,777Diversified Financial Services — 0.1%Equitable Holdings Inc. . . . . . . . . . . . . . . . . . . . . . . . . . . . . . . . . . . 77,684 2,443,939
Diversified Telecommunication Services — 1.0%Verizon Communications Inc. . . . . . . . . . . . . . . . . . . . . . . . . . . . . 838,691 42,160,997
Electric Utilities — 0.2%Edison International . . . . . . . . . . . . . . . . . . . . . . . . . . . . . . . . . . . . . 76,582 4,999,273Eversource Energy. . . . . . . . . . . . . . . . . . . . . . . . . . . . . . . . . . . . . . 69,263 5,698,267
10,697,540
Schedule of Investments (unaudited)
November 30, 2021
iShares� ESG MSCI USA Leaders ETF(Percentages shown are based on Net Assets)
63NM0122U-1995964-65/159

Security Shares
Value
Electrical Equipment — 0.6%Eaton Corp. PLC. . . . . . . . . . . . . . . . . . . . . . . . . . . . . . . . . . . . . . . . 80,408 $ 13,030,920Generac Holdings Inc.(a). . . . . . . . . . . . . . . . . . . . . . . . . . . . . . . . . 12,673 5,338,375Rockwell Automation Inc. . . . . . . . . . . . . . . . . . . . . . . . . . . . . . . . . 23,476 7,892,631
26,261,926Electronic Equipment, Instruments & Components — 0.6%Cognex Corp. . . . . . . . . . . . . . . . . . . . . . . . . . . . . . . . . . . . . . . . . . . . 35,561 2,747,087Keysight Technologies Inc.(a) . . . . . . . . . . . . . . . . . . . . . . . . . . . . 37,184 7,231,544Teledyne Technologies Inc.(a) . . . . . . . . . . . . . . . . . . . . . . . . . . . . 9,352 3,883,792Trimble Inc.(a) . . . . . . . . . . . . . . . . . . . . . . . . . . . . . . . . . . . . . . . . . . . 50,527 4,338,754Zebra Technologies Corp., Class A(a). . . . . . . . . . . . . . . . . . . . . 10,763 6,337,039
24,538,216Energy Equipment & Services — 0.3%Baker Hughes Co. . . . . . . . . . . . . . . . . . . . . . . . . . . . . . . . . . . . . . . 167,832 3,917,199Schlumberger NV . . . . . . . . . . . . . . . . . . . . . . . . . . . . . . . . . . . . . . . 282,285 8,095,934
12,013,133Entertainment — 1.7%Activision Blizzard Inc.. . . . . . . . . . . . . . . . . . . . . . . . . . . . . . . . . . . 156,799 9,188,421Electronic Arts Inc. . . . . . . . . . . . . . . . . . . . . . . . . . . . . . . . . . . . . . . 58,065 7,212,834Take-Two Interactive Software Inc.(a) . . . . . . . . . . . . . . . . . . . . . 23,221 3,851,900Walt Disney Co. (The)(a) . . . . . . . . . . . . . . . . . . . . . . . . . . . . . . . . . 368,108 53,338,849
73,592,004Equity Real Estate Investment Trusts (REITs) — 2.5%American Tower Corp. . . . . . . . . . . . . . . . . . . . . . . . . . . . . . . . . . . . 92,201 24,200,919Boston Properties Inc. . . . . . . . . . . . . . . . . . . . . . . . . . . . . . . . . . . . 29,848 3,218,808Crown Castle International Corp.. . . . . . . . . . . . . . . . . . . . . . . . . 87,553 15,904,002Equinix Inc. . . . . . . . . . . . . . . . . . . . . . . . . . . . . . . . . . . . . . . . . . . . . . 18,181 14,766,608Equity Residential . . . . . . . . . . . . . . . . . . . . . . . . . . . . . . . . . . . . . . . 71,477 6,097,703Healthpeak Properties Inc.. . . . . . . . . . . . . . . . . . . . . . . . . . . . . . . 108,656 3,570,436Host Hotels & Resorts Inc.(a). . . . . . . . . . . . . . . . . . . . . . . . . . . . . 142,643 2,239,495Prologis Inc. . . . . . . . . . . . . . . . . . . . . . . . . . . . . . . . . . . . . . . . . . . . . 149,755 22,575,566Welltower Inc.. . . . . . . . . . . . . . . . . . . . . . . . . . . . . . . . . . . . . . . . . . . 85,601 6,815,552Weyerhaeuser Co. . . . . . . . . . . . . . . . . . . . . . . . . . . . . . . . . . . . . . . 150,998 5,679,035
105,068,124Food & Staples Retailing — 0.1%Kroger Co. (The) . . . . . . . . . . . . . . . . . . . . . . . . . . . . . . . . . . . . . . . . 144,965 6,020,396
Food Products — 0.6%Bunge Ltd. . . . . . . . . . . . . . . . . . . . . . . . . . . . . . . . . . . . . . . . . . . . . . . 28,310 2,450,797Campbell Soup Co. . . . . . . . . . . . . . . . . . . . . . . . . . . . . . . . . . . . . . 39,713 1,601,625Conagra Brands Inc. . . . . . . . . . . . . . . . . . . . . . . . . . . . . . . . . . . . . 96,730 2,955,102General Mills Inc. . . . . . . . . . . . . . . . . . . . . . . . . . . . . . . . . . . . . . . . 123,442 7,625,012Hormel Foods Corp.. . . . . . . . . . . . . . . . . . . . . . . . . . . . . . . . . . . . . 59,904 2,480,026JM Smucker Co. (The) . . . . . . . . . . . . . . . . . . . . . . . . . . . . . . . . . . 22,124 2,798,022Kellogg Co. . . . . . . . . . . . . . . . . . . . . . . . . . . . . . . . . . . . . . . . . . . . . . 52,013 3,182,155McCormick & Co. Inc./MD, NVS . . . . . . . . . . . . . . . . . . . . . . . . . 50,224 4,310,224
27,402,963Gas Utilities — 0.1%Atmos Energy Corp.. . . . . . . . . . . . . . . . . . . . . . . . . . . . . . . . . . . . . 26,366 2,381,377UGI Corp. . . . . . . . . . . . . . . . . . . . . . . . . . . . . . . . . . . . . . . . . . . . . . . 42,188 1,740,255
4,121,632Health Care Equipment & Supplies — 1.9%ABIOMED Inc.(a) . . . . . . . . . . . . . . . . . . . . . . . . . . . . . . . . . . . . . . . . 9,155 2,881,811Align Technology Inc.(a). . . . . . . . . . . . . . . . . . . . . . . . . . . . . . . . . . 15,151 9,265,291Baxter International Inc. . . . . . . . . . . . . . . . . . . . . . . . . . . . . . . . . . 101,351 7,557,744DENTSPLY SIRONA Inc. . . . . . . . . . . . . . . . . . . . . . . . . . . . . . . . . 44,112 2,150,019Dexcom Inc.(a) . . . . . . . . . . . . . . . . . . . . . . . . . . . . . . . . . . . . . . . . . . 19,512 10,977,256Edwards Lifesciences Corp.(a) . . . . . . . . . . . . . . . . . . . . . . . . . . . 126,272 13,550,248Hologic Inc.(a) . . . . . . . . . . . . . . . . . . . . . . . . . . . . . . . . . . . . . . . . . . . 51,957 3,882,747
Security Shares
Value
Health Care Equipment & Supplies (continued)IDEXX Laboratories Inc.(a) . . . . . . . . . . . . . . . . . . . . . . . . . . . . . . . 17,208 $ 10,463,669Insulet Corp.(a) . . . . . . . . . . . . . . . . . . . . . . . . . . . . . . . . . . . . . . . . . . 13,952 4,024,315Novocure Ltd.(a)(c) . . . . . . . . . . . . . . . . . . . . . . . . . . . . . . . . . . . . . . . 18,608 1,742,453ResMed Inc. . . . . . . . . . . . . . . . . . . . . . . . . . . . . . . . . . . . . . . . . . . . . 29,352 7,480,357STERIS PLC. . . . . . . . . . . . . . . . . . . . . . . . . . . . . . . . . . . . . . . . . . . . 20,084 4,388,956Teleflex Inc. . . . . . . . . . . . . . . . . . . . . . . . . . . . . . . . . . . . . . . . . . . . . . 9,410 2,798,722
81,163,588Health Care Providers & Services — 1.5%AmerisourceBergen Corp. . . . . . . . . . . . . . . . . . . . . . . . . . . . . . . . 30,970 3,584,777Cardinal Health Inc. . . . . . . . . . . . . . . . . . . . . . . . . . . . . . . . . . . . . . 59,219 2,737,694Centene Corp.(a) . . . . . . . . . . . . . . . . . . . . . . . . . . . . . . . . . . . . . . . . 117,402 8,383,677Cigna Corp.. . . . . . . . . . . . . . . . . . . . . . . . . . . . . . . . . . . . . . . . . . . . . 69,327 13,303,851DaVita Inc.(a). . . . . . . . . . . . . . . . . . . . . . . . . . . . . . . . . . . . . . . . . . . . 13,906 1,314,117HCA Healthcare Inc.. . . . . . . . . . . . . . . . . . . . . . . . . . . . . . . . . . . . . 51,883 11,704,286Humana Inc. . . . . . . . . . . . . . . . . . . . . . . . . . . . . . . . . . . . . . . . . . . . . 26,034 10,926,730Laboratory Corp. of America Holdings(a) . . . . . . . . . . . . . . . . . . 19,705 5,622,428Quest Diagnostics Inc. . . . . . . . . . . . . . . . . . . . . . . . . . . . . . . . . . . 24,751 3,679,979
61,257,539Health Care Technology — 0.2%Cerner Corp.. . . . . . . . . . . . . . . . . . . . . . . . . . . . . . . . . . . . . . . . . . . . 60,734 4,278,710Teladoc Health Inc.(a) . . . . . . . . . . . . . . . . . . . . . . . . . . . . . . . . . . . . 29,034 2,939,693
7,218,403Hotels, Restaurants & Leisure — 2.3%Booking Holdings Inc.(a) . . . . . . . . . . . . . . . . . . . . . . . . . . . . . . . . . 8,279 17,401,216Darden Restaurants Inc.. . . . . . . . . . . . . . . . . . . . . . . . . . . . . . . . . 26,258 3,622,291Domino's Pizza Inc. . . . . . . . . . . . . . . . . . . . . . . . . . . . . . . . . . . . . . 7,856 4,117,644Hilton Worldwide Holdings Inc.(a) . . . . . . . . . . . . . . . . . . . . . . . . . 56,044 7,569,863McDonald's Corp. . . . . . . . . . . . . . . . . . . . . . . . . . . . . . . . . . . . . . . . 151,284 37,004,066Starbucks Corp.. . . . . . . . . . . . . . . . . . . . . . . . . . . . . . . . . . . . . . . . . 238,858 26,188,391Vail Resorts Inc.. . . . . . . . . . . . . . . . . . . . . . . . . . . . . . . . . . . . . . . . . 8,126 2,695,476
98,598,947Household Durables — 0.3%Garmin Ltd. . . . . . . . . . . . . . . . . . . . . . . . . . . . . . . . . . . . . . . . . . . . . . 30,949 4,132,929Mohawk Industries Inc.(a) . . . . . . . . . . . . . . . . . . . . . . . . . . . . . . . . 12,094 2,030,220Newell Brands Inc. . . . . . . . . . . . . . . . . . . . . . . . . . . . . . . . . . . . . . . 77,297 1,659,567NVR Inc.(a). . . . . . . . . . . . . . . . . . . . . . . . . . . . . . . . . . . . . . . . . . . . . . 697 3,642,062
11,464,778Household Products — 2.3%Clorox Co. (The) . . . . . . . . . . . . . . . . . . . . . . . . . . . . . . . . . . . . . . . . 25,065 4,081,835Colgate-Palmolive Co.. . . . . . . . . . . . . . . . . . . . . . . . . . . . . . . . . . . 162,176 12,166,443Kimberly-Clark Corp. . . . . . . . . . . . . . . . . . . . . . . . . . . . . . . . . . . . . 68,013 8,862,774Procter & Gamble Co. (The) . . . . . . . . . . . . . . . . . . . . . . . . . . . . . 491,920 71,121,794
96,232,846Industrial Conglomerates — 0.7%3M Co. . . . . . . . . . . . . . . . . . . . . . . . . . . . . . . . . . . . . . . . . . . . . . . . . . 116,932 19,883,117Roper Technologies Inc. . . . . . . . . . . . . . . . . . . . . . . . . . . . . . . . . . 21,233 9,855,297
29,738,414Insurance — 3.0%Aflac Inc. . . . . . . . . . . . . . . . . . . . . . . . . . . . . . . . . . . . . . . . . . . . . . . . 130,131 7,045,292Allstate Corp. (The) . . . . . . . . . . . . . . . . . . . . . . . . . . . . . . . . . . . . . 60,330 6,559,078American International Group Inc.. . . . . . . . . . . . . . . . . . . . . . . . 172,961 9,097,748Aon PLC, Class A . . . . . . . . . . . . . . . . . . . . . . . . . . . . . . . . . . . . . . . 45,478 13,451,028Arch Capital Group Ltd.(a)(c). . . . . . . . . . . . . . . . . . . . . . . . . . . . . . 82,020 3,311,968Arthur J Gallagher & Co.. . . . . . . . . . . . . . . . . . . . . . . . . . . . . . . . . 41,663 6,786,903Assurant Inc.. . . . . . . . . . . . . . . . . . . . . . . . . . . . . . . . . . . . . . . . . . . . 12,217 1,858,206Chubb Ltd.. . . . . . . . . . . . . . . . . . . . . . . . . . . . . . . . . . . . . . . . . . . . . . 88,879 15,951,114Erie Indemnity Co., Class A, NVS . . . . . . . . . . . . . . . . . . . . . . . . 5,123 951,905Hartford Financial Services Group Inc. (The) . . . . . . . . . . . . . 72,206 4,772,817
Schedule of Investments (unaudited) (continued)
November 30, 2021
iShares� ESG MSCI USA Leaders ETF(Percentages shown are based on Net Assets)
64 NM0122U-1995964-66/159

Security Shares
Value
Insurance (continued)Lincoln National Corp. . . . . . . . . . . . . . . . . . . . . . . . . . . . . . . . . . . . 36,902 $ 2,447,710Loews Corp. . . . . . . . . . . . . . . . . . . . . . . . . . . . . . . . . . . . . . . . . . . . . 45,079 2,409,923Marsh & McLennan Companies Inc.. . . . . . . . . . . . . . . . . . . . . . 102,600 16,828,452Principal Financial Group Inc. . . . . . . . . . . . . . . . . . . . . . . . . . . . . 54,980 3,770,528Progressive Corp. (The) . . . . . . . . . . . . . . . . . . . . . . . . . . . . . . . . . 118,247 10,989,876Prudential Financial Inc. . . . . . . . . . . . . . . . . . . . . . . . . . . . . . . . . . 79,415 8,120,978Travelers Companies Inc. (The). . . . . . . . . . . . . . . . . . . . . . . . . . 50,913 7,481,665Willis Towers Watson PLC . . . . . . . . . . . . . . . . . . . . . . . . . . . . . . . 26,005 5,872,969
127,708,160Interactive Media & Services — 8.1%Alphabet Inc., Class A(a) . . . . . . . . . . . . . . . . . . . . . . . . . . . . . . . . . 60,993 173,095,084Alphabet Inc., Class C, NVS(a) . . . . . . . . . . . . . . . . . . . . . . . . . . . 58,373 166,307,012
339,402,096Internet & Direct Marketing Retail — 0.5%eBay Inc. . . . . . . . . . . . . . . . . . . . . . . . . . . . . . . . . . . . . . . . . . . . . . . . 131,686 8,883,538MercadoLibre Inc.(a) . . . . . . . . . . . . . . . . . . . . . . . . . . . . . . . . . . . . . 9,052 10,757,487
19,641,025IT Services — 5.1%Accenture PLC, Class A . . . . . . . . . . . . . . . . . . . . . . . . . . . . . . . . . 128,461 45,911,961Automatic Data Processing Inc. . . . . . . . . . . . . . . . . . . . . . . . . . . 85,866 19,825,601International Business Machines Corp. . . . . . . . . . . . . . . . . . . . 181,574 21,262,315Mastercard Inc., Class A. . . . . . . . . . . . . . . . . . . . . . . . . . . . . . . . . 178,512 56,216,999Okta Inc.(a). . . . . . . . . . . . . . . . . . . . . . . . . . . . . . . . . . . . . . . . . . . . . . 25,233 5,430,899Visa Inc., Class A . . . . . . . . . . . . . . . . . . . . . . . . . . . . . . . . . . . . . . . 341,877 66,245,506Western Union Co. (The) . . . . . . . . . . . . . . . . . . . . . . . . . . . . . . . . 83,068 1,314,136
216,207,417Leisure Products — 0.1%Hasbro Inc. . . . . . . . . . . . . . . . . . . . . . . . . . . . . . . . . . . . . . . . . . . . . . 26,343 2,552,900
Life Sciences Tools & Services — 2.2%Agilent Technologies Inc. . . . . . . . . . . . . . . . . . . . . . . . . . . . . . . . . 61,548 9,287,593Bio-Techne Corp. . . . . . . . . . . . . . . . . . . . . . . . . . . . . . . . . . . . . . . . 7,855 3,707,796Illumina Inc.(a). . . . . . . . . . . . . . . . . . . . . . . . . . . . . . . . . . . . . . . . . . . 29,718 10,856,877Mettler-Toledo International Inc.(a). . . . . . . . . . . . . . . . . . . . . . . . 4,694 7,107,326Thermo Fisher Scientific Inc.. . . . . . . . . . . . . . . . . . . . . . . . . . . . . 79,698 50,435,285Waters Corp.(a). . . . . . . . . . . . . . . . . . . . . . . . . . . . . . . . . . . . . . . . . . 12,547 4,116,294West Pharmaceutical Services Inc.. . . . . . . . . . . . . . . . . . . . . . . 14,928 6,608,029
92,119,200Machinery — 2.3%Caterpillar Inc. . . . . . . . . . . . . . . . . . . . . . . . . . . . . . . . . . . . . . . . . . . 110,539 21,372,716Cummins Inc. . . . . . . . . . . . . . . . . . . . . . . . . . . . . . . . . . . . . . . . . . . . 29,460 6,179,235Deere & Co. . . . . . . . . . . . . . . . . . . . . . . . . . . . . . . . . . . . . . . . . . . . . 60,115 20,772,137Dover Corp.. . . . . . . . . . . . . . . . . . . . . . . . . . . . . . . . . . . . . . . . . . . . . 29,000 4,751,650Fortive Corp.. . . . . . . . . . . . . . . . . . . . . . . . . . . . . . . . . . . . . . . . . . . . 68,972 5,094,962IDEX Corp. . . . . . . . . . . . . . . . . . . . . . . . . . . . . . . . . . . . . . . . . . . . . . 15,319 3,440,494Illinois Tool Works Inc. . . . . . . . . . . . . . . . . . . . . . . . . . . . . . . . . . . . 63,660 14,778,669PACCAR Inc. . . . . . . . . . . . . . . . . . . . . . . . . . . . . . . . . . . . . . . . . . . . 70,075 5,845,657Pentair PLC. . . . . . . . . . . . . . . . . . . . . . . . . . . . . . . . . . . . . . . . . . . . . 33,542 2,471,710Snap-on Inc. . . . . . . . . . . . . . . . . . . . . . . . . . . . . . . . . . . . . . . . . . . . . 10,962 2,257,185Stanley Black & Decker Inc. . . . . . . . . . . . . . . . . . . . . . . . . . . . . . 32,458 5,672,360Xylem Inc./NY . . . . . . . . . . . . . . . . . . . . . . . . . . . . . . . . . . . . . . . . . . 36,412 4,409,857
97,046,632Media — 0.3%Cable One Inc. . . . . . . . . . . . . . . . . . . . . . . . . . . . . . . . . . . . . . . . . . . 1,092 1,935,090Discovery Inc., Class A(a)(c) . . . . . . . . . . . . . . . . . . . . . . . . . . . . . . 34,048 792,297Discovery Inc., Class C, NVS(a) . . . . . . . . . . . . . . . . . . . . . . . . . . 63,288 1,437,270Interpublic Group of Companies Inc. (The) . . . . . . . . . . . . . . . 78,971 2,621,048Omnicom Group Inc. . . . . . . . . . . . . . . . . . . . . . . . . . . . . . . . . . . . . 43,374 2,919,504
Security Shares
Value
Media (continued)Sirius XM Holdings Inc.(c) . . . . . . . . . . . . . . . . . . . . . . . . . . . . . . . . 209,264 $ 1,276,510
10,981,719Metals & Mining — 0.3%Newmont Corp. . . . . . . . . . . . . . . . . . . . . . . . . . . . . . . . . . . . . . . . . . 161,588 8,874,413Steel Dynamics Inc. . . . . . . . . . . . . . . . . . . . . . . . . . . . . . . . . . . . . . 42,439 2,537,852
11,412,265Mortgage Real Estate Investment — 0.1%Annaly Capital Management Inc.. . . . . . . . . . . . . . . . . . . . . . . . . 282,767 2,290,413
Multi-Utilities — 0.3%Consolidated Edison Inc. . . . . . . . . . . . . . . . . . . . . . . . . . . . . . . . . 71,587 5,558,015Sempra Energy . . . . . . . . . . . . . . . . . . . . . . . . . . . . . . . . . . . . . . . . . 63,972 7,668,323
13,226,338Multiline Retail — 0.6%Target Corp. . . . . . . . . . . . . . . . . . . . . . . . . . . . . . . . . . . . . . . . . . . . . 98,865 24,107,242
Oil, Gas & Consumable Fuels — 0.9%Cheniere Energy Inc. . . . . . . . . . . . . . . . . . . . . . . . . . . . . . . . . . . . . 48,630 5,096,910Marathon Petroleum Corp.. . . . . . . . . . . . . . . . . . . . . . . . . . . . . . . 131,448 7,998,611ONEOK Inc. . . . . . . . . . . . . . . . . . . . . . . . . . . . . . . . . . . . . . . . . . . . . 89,863 5,377,402Phillips 66 . . . . . . . . . . . . . . . . . . . . . . . . . . . . . . . . . . . . . . . . . . . . . . 88,208 6,101,347Valero Energy Corp.. . . . . . . . . . . . . . . . . . . . . . . . . . . . . . . . . . . . . 82,517 5,523,688Williams Companies Inc. (The). . . . . . . . . . . . . . . . . . . . . . . . . . . 245,033 6,564,434
36,662,392Personal Products — 0.4%Estee Lauder Companies Inc. (The), Class A . . . . . . . . . . . . . 47,210 15,677,025
Pharmaceuticals — 5.1%Bristol-Myers Squibb Co. . . . . . . . . . . . . . . . . . . . . . . . . . . . . . . . . 450,798 24,176,297Catalent Inc.(a) . . . . . . . . . . . . . . . . . . . . . . . . . . . . . . . . . . . . . . . . . . 34,323 4,415,997Eli Lilly & Co. . . . . . . . . . . . . . . . . . . . . . . . . . . . . . . . . . . . . . . . . . . . 164,497 40,801,836Jazz Pharmaceuticals PLC(a) . . . . . . . . . . . . . . . . . . . . . . . . . . . . 12,252 1,468,647Johnson & Johnson . . . . . . . . . . . . . . . . . . . . . . . . . . . . . . . . . . . . . 533,280 83,154,351Merck & Co. Inc. . . . . . . . . . . . . . . . . . . . . . . . . . . . . . . . . . . . . . . . . 512,798 38,413,698Zoetis Inc. . . . . . . . . . . . . . . . . . . . . . . . . . . . . . . . . . . . . . . . . . . . . . . 95,804 21,272,320
213,703,146Professional Services — 0.3%IHS Markit Ltd. . . . . . . . . . . . . . . . . . . . . . . . . . . . . . . . . . . . . . . . . . . 76,396 9,764,937Robert Half International Inc. . . . . . . . . . . . . . . . . . . . . . . . . . . . . 22,866 2,542,013
12,306,950Real Estate Management & Development — 0.1%CBRE Group Inc., Class A(a) . . . . . . . . . . . . . . . . . . . . . . . . . . . . . 67,729 6,472,861
Road & Rail — 1.6%AMERCO. . . . . . . . . . . . . . . . . . . . . . . . . . . . . . . . . . . . . . . . . . . . . . . 1,985 1,398,552CSX Corp. . . . . . . . . . . . . . . . . . . . . . . . . . . . . . . . . . . . . . . . . . . . . . . 458,525 15,892,476Kansas City Southern . . . . . . . . . . . . . . . . . . . . . . . . . . . . . . . . . . . 18,361 5,340,297Norfolk Southern Corp. . . . . . . . . . . . . . . . . . . . . . . . . . . . . . . . . . . 50,439 13,379,954Union Pacific Corp.. . . . . . . . . . . . . . . . . . . . . . . . . . . . . . . . . . . . . . 132,105 31,129,222
67,140,501Semiconductors & Semiconductor Equipment — 6.8%Applied Materials Inc. . . . . . . . . . . . . . . . . . . . . . . . . . . . . . . . . . . . 182,912 26,922,817Intel Corp. . . . . . . . . . . . . . . . . . . . . . . . . . . . . . . . . . . . . . . . . . . . . . . 821,854 40,435,217Lam Research Corp. . . . . . . . . . . . . . . . . . . . . . . . . . . . . . . . . . . . . 28,778 19,564,723NVIDIA Corp. . . . . . . . . . . . . . . . . . . . . . . . . . . . . . . . . . . . . . . . . . . . 506,442 165,484,988Texas Instruments Inc. . . . . . . . . . . . . . . . . . . . . . . . . . . . . . . . . . . 187,021 35,977,230
288,384,975Software — 16.2%Adobe Inc.(a) . . . . . . . . . . . . . . . . . . . . . . . . . . . . . . . . . . . . . . . . . . . . 96,459 64,613,061
Schedule of Investments (unaudited) (continued)
November 30, 2021
iShares� ESG MSCI USA Leaders ETF(Percentages shown are based on Net Assets)
65NM0122U-1995964-67/159

Security Shares
Value
Software (continued)ANSYS Inc.(a) . . . . . . . . . . . . . . . . . . . . . . . . . . . . . . . . . . . . . . . . . . . 17,548 $ 6,869,691Autodesk Inc.(a) . . . . . . . . . . . . . . . . . . . . . . . . . . . . . . . . . . . . . . . . . 44,404 11,287,053Cadence Design Systems Inc.(a) . . . . . . . . . . . . . . . . . . . . . . . . . 56,299 9,990,821Citrix Systems Inc. . . . . . . . . . . . . . . . . . . . . . . . . . . . . . . . . . . . . . . 24,801 1,994,744Intuit Inc. . . . . . . . . . . . . . . . . . . . . . . . . . . . . . . . . . . . . . . . . . . . . . . . 55,356 36,108,719Microsoft Corp. . . . . . . . . . . . . . . . . . . . . . . . . . . . . . . . . . . . . . . . . . 1,446,225 478,107,523salesforce.com Inc.(a) . . . . . . . . . . . . . . . . . . . . . . . . . . . . . . . . . . . 198,323 56,514,122VMware Inc., Class A. . . . . . . . . . . . . . . . . . . . . . . . . . . . . . . . . . . . 42,185 4,924,677Workday Inc., Class A(a) . . . . . . . . . . . . . . . . . . . . . . . . . . . . . . . . . 38,692 10,610,507
681,020,918Specialty Retail — 3.8%Advance Auto Parts Inc. . . . . . . . . . . . . . . . . . . . . . . . . . . . . . . . . . 13,262 2,927,189Best Buy Co. Inc. . . . . . . . . . . . . . . . . . . . . . . . . . . . . . . . . . . . . . . . 45,420 4,853,581Burlington Stores Inc.(a)(c). . . . . . . . . . . . . . . . . . . . . . . . . . . . . . . . 13,377 3,921,200CarMax Inc.(a). . . . . . . . . . . . . . . . . . . . . . . . . . . . . . . . . . . . . . . . . . . 32,839 4,638,509Home Depot Inc. (The) . . . . . . . . . . . . . . . . . . . . . . . . . . . . . . . . . . 213,791 85,646,812Lowe's Companies Inc. . . . . . . . . . . . . . . . . . . . . . . . . . . . . . . . . . . 140,271 34,308,884TJX Companies Inc. (The) . . . . . . . . . . . . . . . . . . . . . . . . . . . . . . . 243,364 16,889,462Tractor Supply Co. . . . . . . . . . . . . . . . . . . . . . . . . . . . . . . . . . . . . . . 23,223 5,232,838
158,418,475Technology Hardware, Storage & Peripherals — 0.3%Hewlett Packard Enterprise Co. . . . . . . . . . . . . . . . . . . . . . . . . . . 262,367 3,764,966HP Inc. . . . . . . . . . . . . . . . . . . . . . . . . . . . . . . . . . . . . . . . . . . . . . . . . . 243,346 8,585,247
12,350,213Textiles, Apparel & Luxury Goods — 1.4%Lululemon Athletica Inc.(a) . . . . . . . . . . . . . . . . . . . . . . . . . . . . . . . 23,981 10,897,206Nike Inc., Class B . . . . . . . . . . . . . . . . . . . . . . . . . . . . . . . . . . . . . . . 258,911 43,818,098VF Corp.. . . . . . . . . . . . . . . . . . . . . . . . . . . . . . . . . . . . . . . . . . . . . . . . 67,231 4,822,480
59,537,784Trading Companies & Distributors — 0.4%Fastenal Co. . . . . . . . . . . . . . . . . . . . . . . . . . . . . . . . . . . . . . . . . . . . . 115,961 6,861,412United Rentals Inc.(a) . . . . . . . . . . . . . . . . . . . . . . . . . . . . . . . . . . . . 14,572 4,936,119
Security Shares
Value
Trading Companies & Distributors (continued)WW Grainger Inc. . . . . . . . . . . . . . . . . . . . . . . . . . . . . . . . . . . . . . . . 9,009 $ 4,337,023
16,134,554Water Utilities — 0.2%American Water Works Co. Inc. . . . . . . . . . . . . . . . . . . . . . . . . . . 36,606 6,170,673Essential Utilities Inc.. . . . . . . . . . . . . . . . . . . . . . . . . . . . . . . . . . . . 47,072 2,225,094
8,395,767
Total Common Stocks — 99.8%(Cost: $2,943,876,816). . . . . . . . . . . . . . . . . . . . . . . . . . . . . . . . . . . . . . . . . . . 4,199,039,519
Short-Term InvestmentsMoney Market Funds — 0.3%BlackRock Cash Funds: Institutional, SL Agency Shares,
0.06%(b)(d)(e) . . . . . . . . . . . . . . . . . . . . . . . . . . . . . . . . . . . . . . . . . 6,654,122 6,656,784BlackRock Cash Funds: Treasury, SL Agency Shares,
0.00%(b)(d) . . . . . . . . . . . . . . . . . . . . . . . . . . . . . . . . . . . . . . . . . . . 4,916,000 4,916,000
11,572,784
Total Short-Term Investments — 0.3%(Cost: $11,572,126). . . . . . . . . . . . . . . . . . . . . . . . . . . . . . . . . . . . . . . . . . . . . . 11,572,784
Total Investments in Securities — 100.1%(Cost: $2,955,448,942). . . . . . . . . . . . . . . . . . . . . . . . . . . . . . . . . . . . . . . . . . . 4,210,612,303
Other Assets, Less Liabilities — (0.1)% . . . . . . . . . . . . . . . . . . . . . . . . . . . . (2,662,567)
Net Assets — 100.0% . . . . . . . . . . . . . . . . . . . . . . . . . . . . . . . . . . . . . . . . . . . . . . $ 4,207,949,736 (a) Non-income producing security.(b) Affiliate of the Fund.(c) All or a portion of this security is on loan.(d) Annualized 7-day yield as of period end.(e) All or a portion of this security was purchased with the cash collateral from loaned
securities.
Affiliates
Investments in issuers considered to be affiliate(s) of the Fund during the period ended November 30, 2021 for purposes of Section 2(a)(3) of the Investment Company Actof 1940, as amended, were as follows:
Affiliated IssuerValue at
08/31/21Purchases
at CostProceeds
from SalesNet Realized
Gain (Loss)
Change inUnrealized
Appreciation(Depreciation)
Value at11/30/21
SharesHeld at
11/30/21 Income
CapitalGain
Distributionsfrom
UnderlyingFunds
BlackRock Cash Funds: Institutional, SL AgencyShares . . . . . . . . . . . . . . . . . . . . . . . . . . . . . . . . . . . . . $10,691,739 $ — $(4,034,553)(a) $ (351) $ (51) $ 6,656,784 6,654,122 $ 4,513(b) $ —
BlackRock Cash Funds: Treasury, SL AgencyShares . . . . . . . . . . . . . . . . . . . . . . . . . . . . . . . . . . . . . 6,176,000 — (1,260,000)(a)
— — 4,916,000 4,916,000 79 —BlackRock Inc. . . . . . . . . . . . . . . . . . . . . . . . . . . . . . . . . 28,721,294 1,155,777 (905,446) 418,793 (1,549,236) 27,841,182 30,777 125,998 —
$ 418,442 $ (1,549,287) $39,413,966 $130,590 $ —
(a) Represents net amount purchased (sold).(b) All or a portion represents securities lending income earned from the reinvestment of cash collateral from loaned securities, net of fees and collateral investment expenses, and other
payments to and from borrowers of securities.
Schedule of Investments (unaudited) (continued)
November 30, 2021
iShares� ESG MSCI USA Leaders ETF(Percentages shown are based on Net Assets)
66 NM0122U-1995964-68/159

Derivative Financial Instruments Outstanding as of Period End
Futures Contracts
DescriptionNumber ofContracts
ExpirationDate
NotionalAmount
(000)
Value/Unrealized
Appreciation(Depreciation)
Long ContractsS&P 500 E-Mini Index . . . . . . . . . . . . . . . . . . . . . . . . . . . . . . . . . . . . . . . . . . . . . . . . . . . . . . . . . . . . . . . . . . . . . . . . . . . . . . . . . . . . . . . . . . . . . . . 37 12/17/21 $ 8,448 $ (44,983)
Fair Value Measurements
Various inputs are used in determining the fair value of financial instruments. These inputs to valuation techniques are categorized into a fair value hierarchy consisting ofthree broad levels for financial reporting purposes as follows:
• Level 1 – Unadjusted price quotations in active markets/exchanges for identical assets or liabilities that each Fund has the ability to access;• Level 2 – Other observable inputs (including, but not limited to, quoted prices for similar assets or liabilities in markets that are active, quoted prices for identical or
similar assets or liabilities in markets that are not active, inputs other than quoted prices that are observable for the assets or liabilities (such as interest rates, yieldcurves, volatilities, prepayment speeds, loss severities, credit risks and default rates) or other market-corroborated inputs); and
• Level 3 – Unobservable inputs based on the best information available in the circumstances, to the extent observable inputs are not available (including the BlackRockGlobal Valuation Methodologies Committee’s (the “Global Valuation Committee’s”) assumptions used in determining the fair value of financial instruments).
The hierarchy gives the highest priority to unadjusted quoted prices in active markets for identical assets or liabilities (Level 1 measurements) and the lowest priority tounobservable inputs (Level 3 measurements). Accordingly, the degree of judgment exercised in determining fair value is greatest for instruments categorized in Level 3. Theinputs used to measure fair value may fall into different levels of the fair value hierarchy. In such cases, for disclosure purposes, the fair value hierarchy classification isdetermined based on the lowest level input that is significant to the fair value measurement in its entirety. Investments classified within Level 3 have significant unobservableinputs used by the Global Valuation Committee in determining the price for Fair Valued Investments. Level 3 investments include equity or debt issued by privately heldcompanies or funds. There may not be a secondary market, and/or there are a limited number of investors. The categorization of a value determined for financial instrumentsis based on the pricing transparency of the financial instruments and is not necessarily an indication of the risks associated with investing in those securities. For informationabout the Fund’s policy regarding valuation of financial instruments, refer to its most recent financial statements.
The following table summarizes the Fund’s financial instruments categorized in the fair value hierarchy. The breakdown of the Fund’s financial instruments into majorcategories is disclosed in the Schedule of Investments above.
Level 1 Level 2 Level 3 Total
InvestmentsAssets
Common Stocks. . . . . . . . . . . . . . . . . . . . . . . . . . . . . . . . . . . . . . . . . . . . . . . . . . . . . . . . . . . . . . . . . . . . . . . . . . . . . $4,199,039,519 $ — $ — $4,199,039,519Money Market Funds . . . . . . . . . . . . . . . . . . . . . . . . . . . . . . . . . . . . . . . . . . . . . . . . . . . . . . . . . . . . . . . . . . . . . . . . 11,572,784 — — 11,572,784
$4,210,612,303 $ — $ — $4,210,612,303
Derivative financial instruments(a)
LiabilitiesFutures Contracts . . . . . . . . . . . . . . . . . . . . . . . . . . . . . . . . . . . . . . . . . . . . . . . . . . . . . . . . . . . . . . . . . . . . . . . . . . . $ (44,983) $ — $ — $ (44,983)
(a) Derivative financial instruments are futures contracts. Futures contracts are valued at the unrealized appreciation (depreciation) on the instrument.
Portfolio Abbreviations - Equity
NVS . . . . . . . . . . . . . Non-Voting Shares
Schedule of Investments (unaudited) (continued)
November 30, 2021
iShares� ESG MSCI USA Leaders ETF
67NM0122U-1995964-69/159

Security Shares
Value
Common StocksArgentina — 47.2%Arcos Dorados Holdings Inc., Class A(a) . . . . . . . . . . . . . . . . . . . . . . . . 59,917 $ 294,792Banco BBVA Argentina SA, ADR(a) . . . . . . . . . . . . . . . . . . . . . . . . . . . . . 39,294 116,703Banco Macro SA, ADR(a) . . . . . . . . . . . . . . . . . . . . . . . . . . . . . . . . . . . . . . 20,180 267,789Central Puerto SA, ADR(a) . . . . . . . . . . . . . . . . . . . . . . . . . . . . . . . . . . . . . 54,096 169,320Corp. America Airports SA(a)(b) . . . . . . . . . . . . . . . . . . . . . . . . . . . . . . . . . 17,657 101,704Cresud SACIF y A, ADR(a) . . . . . . . . . . . . . . . . . . . . . . . . . . . . . . . . . . . . . 19,513 86,638Despegar.com Corp.(a)(b) . . . . . . . . . . . . . . . . . . . . . . . . . . . . . . . . . . . . . . 24,913 215,497Empresa Distribuidora y Comercializadora Norte, ADR(a)(b) . . . . . . 10,727 63,504Grupo Financiero Galicia SA, ADR . . . . . . . . . . . . . . . . . . . . . . . . . . . . . 37,198 322,879Grupo Supervielle SA, ADR(b). . . . . . . . . . . . . . . . . . . . . . . . . . . . . . . . . . 34,739 67,394IRSA Inversiones y Representaciones SA, ADR(a) . . . . . . . . . . . . . . 14,483 61,553IRSA Propiedades Comerciales SA, ADR. . . . . . . . . . . . . . . . . . . . . . . 14,862 32,696Loma Negra Cia Industrial Argentina SA, ADR . . . . . . . . . . . . . . . . . . 32,486 197,515Pampa Energia SA, ADR(a)(b) . . . . . . . . . . . . . . . . . . . . . . . . . . . . . . . . . . 17,194 284,045Telecom Argentina SA, ADR(b) . . . . . . . . . . . . . . . . . . . . . . . . . . . . . . . . . 48,333 234,415Transportadora de Gas del Sur SA, Class B, ADR(a)(b) . . . . . . . . . . 38,211 154,754YPF SA, ADR(a)(b) . . . . . . . . . . . . . . . . . . . . . . . . . . . . . . . . . . . . . . . . . . . . . 77,242 276,526
2,947,724Brazil — 4.6%Adecoagro SA(a) . . . . . . . . . . . . . . . . . . . . . . . . . . . . . . . . . . . . . . . . . . . . . . 36,489 284,979
Canada — 10.2%SSR Mining Inc.. . . . . . . . . . . . . . . . . . . . . . . . . . . . . . . . . . . . . . . . . . . . . . . 18,539 336,545Yamana Gold Inc. . . . . . . . . . . . . . . . . . . . . . . . . . . . . . . . . . . . . . . . . . . . . . 75,374 300,918
637,463Cayman Islands — 1.3%Bioceres Crop. Solutions Corp.(a) . . . . . . . . . . . . . . . . . . . . . . . . . . . . . . 5,649 84,848
Chile — 10.1%Cencosud SA . . . . . . . . . . . . . . . . . . . . . . . . . . . . . . . . . . . . . . . . . . . . . . . . . 222,113 354,361Cia. Cervecerias Unidas SA . . . . . . . . . . . . . . . . . . . . . . . . . . . . . . . . . . . 34,904 276,635
630,996United States — 20.8%MercadoLibre Inc.(a) . . . . . . . . . . . . . . . . . . . . . . . . . . . . . . . . . . . . . . . . . . . 1,095 1,301,309
Total Common Stocks — 94.2%(Cost: $9,729,719) . . . . . . . . . . . . . . . . . . . . . . . . . . . . . . . . . . . . . . . . . . . . . . . . . . . 5,887,319
Security Shares
Value
Preferred StocksChile — 5.0%Embotelladora Andina SA, Class B, Preference Shares, NVS. . . . 151,131 $ 310,527
Total Preferred Stocks — 5.0%(Cost: $350,600) . . . . . . . . . . . . . . . . . . . . . . . . . . . . . . . . . . . . . . . . . . . . . . . . . . . . . 310,527
Short-Term InvestmentsMoney Market Funds — 8.5%BlackRock Cash Funds: Institutional, SL Agency Shares,
0.06%(c)(d)(e). . . . . . . . . . . . . . . . . . . . . . . . . . . . . . . . . . . . . . . . . . . . . . . . 521,325 521,534BlackRock Cash Funds: Treasury, SL Agency Shares,
0.00%(c)(d). . . . . . . . . . . . . . . . . . . . . . . . . . . . . . . . . . . . . . . . . . . . . . . . . . 10,000 10,000
531,534
Total Short-Term Investments — 8.5%(Cost: $531,532) . . . . . . . . . . . . . . . . . . . . . . . . . . . . . . . . . . . . . . . . . . . . . . . . . . . . . 531,534
Total Investments in Securities — 107.7%(Cost: $10,611,851) . . . . . . . . . . . . . . . . . . . . . . . . . . . . . . . . . . . . . . . . . . . . . . . . . . 6,729,380
Other Assets, Less Liabilities — (7.7)% . . . . . . . . . . . . . . . . . . . . . . . . . . . . . . . . (481,895)
Net Assets — 100.0% . . . . . . . . . . . . . . . . . . . . . . . . . . . . . . . . . . . . . . . . . . . . . . . . . . $ 6,247,485 (a) Non-income producing security.(b) All or a portion of this security is on loan.(c) Affiliate of the Fund.(d) Annualized 7-day yield as of period end.(e) All or a portion of this security was purchased with the cash collateral from loaned
securities.
Affiliates
Investments in issuers considered to be affiliate(s) of the Fund during the period ended November 30, 2021 for purposes of Section 2(a)(3) of the Investment Company Actof 1940, as amended, were as follows:
Affiliated IssuerValue at
08/31/21Purchases
at CostProceeds
from SalesNet Realized
Gain (Loss)
Change inUnrealized
Appreciation(Depreciation)
Value at11/30/21
SharesHeld at
11/30/21 Income
CapitalGain
Distributionsfrom
UnderlyingFunds
BlackRock Cash Funds: Institutional, SL Agency Shares . . . . $114,864 $406,713(a) $ — $ (25) $ (18) $521,534 521,325 $ 768(b) $ —BlackRock Cash Funds: Treasury, SL Agency Shares. . . . . . . — 10,000(a)
— — — 10,000 10,000 — —
$ (25) $ (18) $531,534 $ 768 $ —
(a) Represents net amount purchased (sold).(b) All or a portion represents securities lending income earned from the reinvestment of cash collateral from loaned securities, net of fees and collateral investment expenses, and other
payments to and from borrowers of securities.
Schedule of Investments (unaudited)
November 30, 2021
iShares� MSCI Argentina and Global Exposure ETF(Percentages shown are based on Net Assets)
68 NM0122U-1995964-70/159

Fair Value Measurements
Various inputs are used in determining the fair value of financial instruments. These inputs to valuation techniques are categorized into a fair value hierarchy consisting ofthree broad levels for financial reporting purposes as follows:
• Level 1 – Unadjusted price quotations in active markets/exchanges for identical assets or liabilities that each Fund has the ability to access;• Level 2 – Other observable inputs (including, but not limited to, quoted prices for similar assets or liabilities in markets that are active, quoted prices for identical or
similar assets or liabilities in markets that are not active, inputs other than quoted prices that are observable for the assets or liabilities (such as interest rates, yieldcurves, volatilities, prepayment speeds, loss severities, credit risks and default rates) or other market-corroborated inputs); and
• Level 3 – Unobservable inputs based on the best information available in the circumstances, to the extent observable inputs are not available (including the BlackRockGlobal Valuation Methodologies Committee’s (the “Global Valuation Committee’s”) assumptions used in determining the fair value of financial instruments).
The hierarchy gives the highest priority to unadjusted quoted prices in active markets for identical assets or liabilities (Level 1 measurements) and the lowest priority tounobservable inputs (Level 3 measurements). Accordingly, the degree of judgment exercised in determining fair value is greatest for instruments categorized in Level 3. Theinputs used to measure fair value may fall into different levels of the fair value hierarchy. In such cases, for disclosure purposes, the fair value hierarchy classification isdetermined based on the lowest level input that is significant to the fair value measurement in its entirety. Investments classified within Level 3 have significant unobservableinputs used by the Global Valuation Committee in determining the price for Fair Valued Investments. Level 3 investments include equity or debt issued by privately heldcompanies or funds. There may not be a secondary market, and/or there are a limited number of investors. The categorization of a value determined for financial instrumentsis based on the pricing transparency of the financial instruments and is not necessarily an indication of the risks associated with investing in those securities. For informationabout the Fund’s policy regarding valuation of financial instruments, refer to its most recent financial statements.
The following table summarizes the Fund’s financial instruments categorized in the fair value hierarchy. The breakdown of the Fund’s financial instruments into majorcategories is disclosed in the Schedule of Investments above.
Level 1 Level 2 Level 3 Total
InvestmentsAssets
Common Stocks . . . . . . . . . . . . . . . . . . . . . . . . . . . . . . . . . . . . . . . . . . . . . . . . . . . . . . . . . . . . . . . . . . . . . . . . . . . . . . . . . . . . . . . . . . . . . $5,610,684 $ 276,635 $ — $5,887,319Preferred Stocks . . . . . . . . . . . . . . . . . . . . . . . . . . . . . . . . . . . . . . . . . . . . . . . . . . . . . . . . . . . . . . . . . . . . . . . . . . . . . . . . . . . . . . . . . . . . . 310,527 — — 310,527Money Market Funds . . . . . . . . . . . . . . . . . . . . . . . . . . . . . . . . . . . . . . . . . . . . . . . . . . . . . . . . . . . . . . . . . . . . . . . . . . . . . . . . . . . . . . . . . 531,534 — — 531,534
$6,452,745 $ 276,635 $ — $6,729,380
Portfolio Abbreviations - Equity
ADR . . . . . . . . . . . . . American Depositary ReceiptNVS . . . . . . . . . . . . . Non-Voting Shares
Schedule of Investments (unaudited) (continued)
November 30, 2021
iShares� MSCI Argentina and Global Exposure ETF
69NM0122U-1995964-71/159

Security Shares
Value
Common StocksAerospace & Defense — 3.9%Embraer SA(a) . . . . . . . . . . . . . . . . . . . . . . . . . . . . . . . . . . . . . . . . . . . . . 970,318 $ 3,303,519
Air Freight & Logistics — 0.2%Sequoia Logistica e Transportes SA(a). . . . . . . . . . . . . . . . . . . . . . . 86,411 150,632
Auto Components — 0.7%Mahle-Metal Leve SA . . . . . . . . . . . . . . . . . . . . . . . . . . . . . . . . . . . . . . 53,093 276,616Tupy SA . . . . . . . . . . . . . . . . . . . . . . . . . . . . . . . . . . . . . . . . . . . . . . . . . . . 99,435 341,541
618,157Biotechnology — 0.3%Blau Farmaceutica SA(a). . . . . . . . . . . . . . . . . . . . . . . . . . . . . . . . . . . . 47,944 287,399
Commercial Services & Supplies — 1.5%Ambipar Participacoes e Empreendimentos S/A . . . . . . . . . . . . . 62,310 437,135GPS Participacoes e Empreendimentos SA(b) . . . . . . . . . . . . . . . 312,185 805,750
1,242,885Communications Equipment — 0.6%Intelbras SA Industria de Telecomunicacao
Eletronica Brasileira . . . . . . . . . . . . . . . . . . . . . . . . . . . . . . . . . . . . . 112,973 533,330
Diversified Consumer Services — 4.7%Anima Holding SA(a). . . . . . . . . . . . . . . . . . . . . . . . . . . . . . . . . . . . . . . . 417,819 636,184Cogna Educacao(a). . . . . . . . . . . . . . . . . . . . . . . . . . . . . . . . . . . . . . . . . 2,588,571 1,141,911Cruzeiro do Sul Educacional SA . . . . . . . . . . . . . . . . . . . . . . . . . . . . 237,004 274,025MPM Corporeos SA . . . . . . . . . . . . . . . . . . . . . . . . . . . . . . . . . . . . . . . . 185,290 268,615YDUQS Participacoes SA . . . . . . . . . . . . . . . . . . . . . . . . . . . . . . . . . . 426,351 1,655,548
3,976,283Electric Utilities — 7.6%AES Brasil Energia SA . . . . . . . . . . . . . . . . . . . . . . . . . . . . . . . . . . . . . 339,401 682,201Alupar Investimento SA. . . . . . . . . . . . . . . . . . . . . . . . . . . . . . . . . . . . . 201,302 865,099Cia Paranaense de Energia . . . . . . . . . . . . . . . . . . . . . . . . . . . . . . . . 86,492 451,703EDP - Energias do Brasil SA. . . . . . . . . . . . . . . . . . . . . . . . . . . . . . . . 418,538 1,593,197Light SA . . . . . . . . . . . . . . . . . . . . . . . . . . . . . . . . . . . . . . . . . . . . . . . . . . . 462,508 990,527Transmissora Alianca de Energia Eletrica SA . . . . . . . . . . . . . . . . 286,495 1,836,124
6,418,851Electrical Equipment — 0.5%Aeris Industria E Comercio De Equipamentos Para Geracao
De Energia SA(a) . . . . . . . . . . . . . . . . . . . . . . . . . . . . . . . . . . . . . . . . 317,072 442,740
Food & Staples Retailing — 5.0%Cia Brasileira de Distribuicao . . . . . . . . . . . . . . . . . . . . . . . . . . . . . . . 221,638 883,106Grupo Mateus SA(a) . . . . . . . . . . . . . . . . . . . . . . . . . . . . . . . . . . . . . . . . 761,887 794,162Sendas Distribuidora SA. . . . . . . . . . . . . . . . . . . . . . . . . . . . . . . . . . . . 1,114,407 2,527,405
4,204,673Food Products — 7.5%Camil Alimentos SA . . . . . . . . . . . . . . . . . . . . . . . . . . . . . . . . . . . . . . . . 178,629 304,078M. Dias Branco SA . . . . . . . . . . . . . . . . . . . . . . . . . . . . . . . . . . . . . . . . . 116,902 577,663Marfrig Global Foods SA . . . . . . . . . . . . . . . . . . . . . . . . . . . . . . . . . . . 524,515 2,199,066Minerva SA . . . . . . . . . . . . . . . . . . . . . . . . . . . . . . . . . . . . . . . . . . . . . . . . 379,083 578,552Sao Martinho SA . . . . . . . . . . . . . . . . . . . . . . . . . . . . . . . . . . . . . . . . . . . 244,158 1,524,834SLC Agricola SA . . . . . . . . . . . . . . . . . . . . . . . . . . . . . . . . . . . . . . . . . . . 133,186 909,252Tres Tentos Agroindustrial SA(a). . . . . . . . . . . . . . . . . . . . . . . . . . . . . 165,070 217,280
6,310,725Health Care Providers & Services — 4.4%CM Hospitalar SA . . . . . . . . . . . . . . . . . . . . . . . . . . . . . . . . . . . . . . . . . . 133,820 405,137Fleury SA. . . . . . . . . . . . . . . . . . . . . . . . . . . . . . . . . . . . . . . . . . . . . . . . . . 262,072 814,393Hospital Mater Dei SA(a) . . . . . . . . . . . . . . . . . . . . . . . . . . . . . . . . . . . . 118,614 304,666Instituto Hermes Pardini SA. . . . . . . . . . . . . . . . . . . . . . . . . . . . . . . . . 72,266 248,477Odontoprev SA . . . . . . . . . . . . . . . . . . . . . . . . . . . . . . . . . . . . . . . . . . . . 364,930 817,252
Security Shares
Value
Health Care Providers & Services (continued)Oncoclinicas do Brasil Servicos Medicos SA(a). . . . . . . . . . . . . . . 198,582 $ 274,108Qualicorp Consultoria e Corretora de Seguros SA . . . . . . . . . . . 313,411 876,928
3,740,961Hotels, Restaurants & Leisure — 1.6%CVC Brasil Operadora e Agencia de Viagens SA(a) . . . . . . . . . . 308,340 747,012Smartfit . . . . . . . . . . . . . . . . . . . . . . . . . . . . . . . . . . . . . . . . . . . . . . . . . . . . 195,847 630,197
1,377,209Household Durables — 2.8%Cyrela Brazil Realty SA Empreendimentos e Participacoes . . . 413,548 1,000,427Ez Tec Empreendimentos e Participacoes SA . . . . . . . . . . . . . . . 156,560 505,172MRV Engenharia e Participacoes SA. . . . . . . . . . . . . . . . . . . . . . . . 430,409 849,051
2,354,650Independent Power and Renewable Electricity Producers — 3.8%Eneva SA(a). . . . . . . . . . . . . . . . . . . . . . . . . . . . . . . . . . . . . . . . . . . . . . . . 960,495 2,383,362Omega Geracao SA(a). . . . . . . . . . . . . . . . . . . . . . . . . . . . . . . . . . . . . . 174,962 844,645
3,228,007Insurance — 3.4%IRB Brasil Resseguros S/A(a) . . . . . . . . . . . . . . . . . . . . . . . . . . . . . . . 1,311,684 1,005,604Sul America SA . . . . . . . . . . . . . . . . . . . . . . . . . . . . . . . . . . . . . . . . . . . . 411,382 1,826,462
2,832,066Interactive Media & Services — 0.9%Infracommerce CXAAS SA(a) . . . . . . . . . . . . . . . . . . . . . . . . . . . . . . . 130,399 334,704Meliuz SA(b). . . . . . . . . . . . . . . . . . . . . . . . . . . . . . . . . . . . . . . . . . . . . . . . 720,505 383,203
717,907Internet & Direct Marketing Retail — 0.4%Lojas Americanas SA. . . . . . . . . . . . . . . . . . . . . . . . . . . . . . . . . . . . . . . 352,411 341,012
IT Services — 2.4%Cielo SA . . . . . . . . . . . . . . . . . . . . . . . . . . . . . . . . . . . . . . . . . . . . . . . . . . . 1,686,393 620,940Locaweb Servicos de Internet SA(b) . . . . . . . . . . . . . . . . . . . . . . . . . 609,946 1,431,057
2,051,997Machinery — 0.6%Iochpe Maxion SA(a). . . . . . . . . . . . . . . . . . . . . . . . . . . . . . . . . . . . . . . . 180,233 462,937
Marine — 0.3%Hidrovias do Brasil SA(a). . . . . . . . . . . . . . . . . . . . . . . . . . . . . . . . . . . . 576,872 278,080
Metals & Mining — 0.5%Companhia Brasileira de Aluminio(a). . . . . . . . . . . . . . . . . . . . . . . . . 199,051 423,818
Oil, Gas & Consumable Fuels — 5.3%3R Petroleum Oleo E Gas SA(a). . . . . . . . . . . . . . . . . . . . . . . . . . . . . 223,562 1,098,354Enauta Participacoes SA . . . . . . . . . . . . . . . . . . . . . . . . . . . . . . . . . . . 146,657 347,479Petro Rio SA(a) . . . . . . . . . . . . . . . . . . . . . . . . . . . . . . . . . . . . . . . . . . . . . 848,090 3,060,869
4,506,702Paper & Forest Products — 1.6%Dexco SA. . . . . . . . . . . . . . . . . . . . . . . . . . . . . . . . . . . . . . . . . . . . . . . . . . 429,405 1,377,157
Professional Services — 0.5%Boa Vista Servicos SA. . . . . . . . . . . . . . . . . . . . . . . . . . . . . . . . . . . . . . 291,632 389,061
Real Estate Management & Development — 6.4%Aliansce Sonae Shopping Centers SA. . . . . . . . . . . . . . . . . . . . . . . 196,474 718,537BR Malls Participacoes SA(a) . . . . . . . . . . . . . . . . . . . . . . . . . . . . . . . 1,194,845 1,679,034BR Properties SA . . . . . . . . . . . . . . . . . . . . . . . . . . . . . . . . . . . . . . . . . . 289,177 370,354Iguatemi SA(a) . . . . . . . . . . . . . . . . . . . . . . . . . . . . . . . . . . . . . . . . . . . . . 18,604 628,735Iguatemi SA . . . . . . . . . . . . . . . . . . . . . . . . . . . . . . . . . . . . . . . . . . . . . . . 5,408 26,790JHSF Participacoes SA. . . . . . . . . . . . . . . . . . . . . . . . . . . . . . . . . . . . . 418,142 349,577LOG Commercial Properties e Participacoes SA . . . . . . . . . . . . . 61,783 241,885
Schedule of Investments (unaudited)
November 30, 2021
iShares� MSCI Brazil Small-Cap ETF(Percentages shown are based on Net Assets)
70 NM0122U-1995964-72/159

Security Shares
Value
Real Estate Management & Development (continued)Multiplan Empreendimentos Imobiliarios SA . . . . . . . . . . . . . . . . . 385,888 $ 1,345,359
5,360,271Road & Rail — 4.6%Cia. de Locacao das Americas . . . . . . . . . . . . . . . . . . . . . . . . . . . . . . 456,127 1,879,891Movida Participacoes SA . . . . . . . . . . . . . . . . . . . . . . . . . . . . . . . . . . . 198,500 592,479SIMPAR SA. . . . . . . . . . . . . . . . . . . . . . . . . . . . . . . . . . . . . . . . . . . . . . . . 392,865 735,855Vamos Locacao de Caminhoes Maquinas e
Equipamentos SA(a) . . . . . . . . . . . . . . . . . . . . . . . . . . . . . . . . . . . . . 314,294 625,027
3,833,252Software — 0.2%Clear Sale SA(a). . . . . . . . . . . . . . . . . . . . . . . . . . . . . . . . . . . . . . . . . . . . 75,337 129,317
Specialty Retail — 3.0%C&A Modas Ltda(a) . . . . . . . . . . . . . . . . . . . . . . . . . . . . . . . . . . . . . . . . . 148,814 171,000Grupo SBF SA(a) . . . . . . . . . . . . . . . . . . . . . . . . . . . . . . . . . . . . . . . . . . . 134,053 580,387Lojas Quero Quero S/A. . . . . . . . . . . . . . . . . . . . . . . . . . . . . . . . . . . . . 245,427 442,235Pet Center Comercio e Participacoes SA . . . . . . . . . . . . . . . . . . . . 420,014 1,360,487
2,554,109Technology Hardware, Storage & Peripherals — 0.4%Multilaser Industrial SA(a) . . . . . . . . . . . . . . . . . . . . . . . . . . . . . . . . . . . 274,118 324,738
Textiles, Apparel & Luxury Goods — 4.4%Arezzo Industria e Comercio SA . . . . . . . . . . . . . . . . . . . . . . . . . . . . 75,585 902,957Grendene SA . . . . . . . . . . . . . . . . . . . . . . . . . . . . . . . . . . . . . . . . . . . . . . 435,548 649,233GRUPO DE MODA SOMA SA(a) . . . . . . . . . . . . . . . . . . . . . . . . . . . . 581,902 1,347,665Guararapes Confeccoes SA . . . . . . . . . . . . . . . . . . . . . . . . . . . . . . . . 137,715 249,863Vivara Participacoes SA . . . . . . . . . . . . . . . . . . . . . . . . . . . . . . . . . . . . 130,323 568,179
3,717,897Trading Companies & Distributors — 0.6%Armac Locacao Logistica E Servicos SA . . . . . . . . . . . . . . . . . . . . 138,610 533,793
Transportation Infrastructure — 1.7%EcoRodovias Infraestrutura e Logistica SA(a) . . . . . . . . . . . . . . . . 480,258 709,044Santos Brasil Participacoes SA(a) . . . . . . . . . . . . . . . . . . . . . . . . . . . 654,328 697,177
1,406,221Water Utilities — 1.5%Cia. de Saneamento de Minas Gerais-COPASA . . . . . . . . . . . . . 262,255 598,043Cia. de Saneamento do Parana. . . . . . . . . . . . . . . . . . . . . . . . . . . . . 209,170 697,624
1,295,667
Total Common Stocks — 83.8%(Cost: $72,171,218). . . . . . . . . . . . . . . . . . . . . . . . . . . . . . . . . . . . . . . . . . . . . . . . . 70,726,023
Preferred StocksAirlines — 2.9%Azul SA, Preference Shares, NVS(a) . . . . . . . . . . . . . . . . . . . . . . . . 391,143 1,626,675Gol Linhas Aereas Inteligentes SA, Preference
Shares, NVS(a) . . . . . . . . . . . . . . . . . . . . . . . . . . . . . . . . . . . . . . . . . . 281,857 802,176
2,428,851Banks — 2.0%Banco ABC Brasil SA, Preference Shares, NVS . . . . . . . . . . . . . 116,534 350,938
Security Shares
Value
Banks (continued)Banco do Estado do Rio Grande do Sul SA, Class B,
Preference Shares, NVS. . . . . . . . . . . . . . . . . . . . . . . . . . . . . . . . . 279,374 $ 501,913Banco Pan SA, Preference Shares, NVS . . . . . . . . . . . . . . . . . . . . 413,685 828,569
1,681,420Chemicals — 1.2%Unipar Carbocloro SA, Class B, Preference Shares, NVS . . . . 61,405 973,091
Electric Utilities — 1.6%Cia. Energetica do Ceara, Class A, Preference Shares, NVS . 19,485 190,627Cia. Paranaense de Energia, Preference Shares, NVS. . . . . . . 1,090,842 1,191,382
1,382,009Independent Power and Renewable Electricity Producers — 1.3%Cia. Energetica de Sao Paulo, Class B, Preference
Shares, NVS . . . . . . . . . . . . . . . . . . . . . . . . . . . . . . . . . . . . . . . . . . . . 261,878 1,107,258
Internet & Direct Marketing Retail — 1.4%Lojas Americanas SA, Preference Shares, NVS . . . . . . . . . . . . . 1,256,487 1,222,548
Machinery — 1.0%Marcopolo SA, Preference Shares, NVS . . . . . . . . . . . . . . . . . . . . 667,919 305,336Randon SA Implementos e Participacoes, Preference
Shares, NVS . . . . . . . . . . . . . . . . . . . . . . . . . . . . . . . . . . . . . . . . . . . . 252,990 498,163
803,499Metals & Mining — 2.7%Cia. Ferro Ligas da Bahia-Ferbasa, Preference Shares, NVS. 52,790 408,096Metalurgica Gerdau SA, Preference Shares, NVS . . . . . . . . . . . 996,102 1,887,010
2,295,106Water Utilities — 0.4%Cia. de Saneamento do Parana, Preference Shares, NVS. . . . 553,013 373,800
Total Preferred Stocks — 14.5%(Cost: $12,031,270). . . . . . . . . . . . . . . . . . . . . . . . . . . . . . . . . . . . . . . . . . . . . . . . . 12,267,582
Short-Term InvestmentsMoney Market Funds — 0.1%BlackRock Cash Funds: Treasury, SL Agency Shares,
0.00%(c)(d). . . . . . . . . . . . . . . . . . . . . . . . . . . . . . . . . . . . . . . . . . . . . . . 40,000 40,000
Total Short-Term Investments — 0.1%(Cost: $40,000) . . . . . . . . . . . . . . . . . . . . . . . . . . . . . . . . . . . . . . . . . . . . . . . . . . . . . 40,000
Total Investments in Securities — 98.4%(Cost: $84,242,488). . . . . . . . . . . . . . . . . . . . . . . . . . . . . . . . . . . . . . . . . . . . . . . . . 83,033,605
Other Assets, Less Liabilities — 1.6% . . . . . . . . . . . . . . . . . . . . . . . . . . . . . . . . 1,372,788
Net Assets — 100.0% . . . . . . . . . . . . . . . . . . . . . . . . . . . . . . . . . . . . . . . . . . . . . . . . . $ 84,406,393 (a) Non-income producing security.(b) Security exempt from registration pursuant to Rule 144A under the Securities Act of
1933, as amended. These securities may be resold in transactions exempt fromregistration to qualified institutional investors.
(c) Affiliate of the Fund.(d) Annualized 7-day yield as of period end.
Schedule of Investments (unaudited) (continued)
November 30, 2021
iShares� MSCI Brazil Small-Cap ETF(Percentages shown are based on Net Assets)
71NM0122U-1995964-73/159
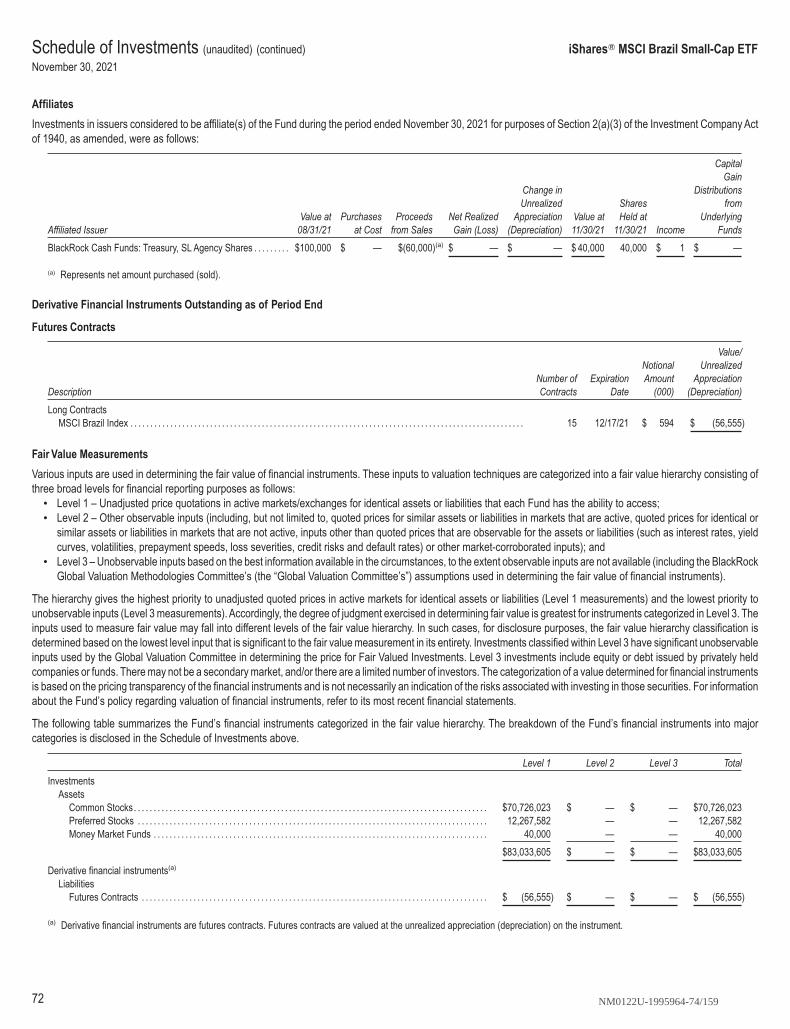
Affiliates
Investments in issuers considered to be affiliate(s) of the Fund during the period ended November 30, 2021 for purposes of Section 2(a)(3) of the Investment Company Actof 1940, as amended, were as follows:
Affiliated IssuerValue at
08/31/21Purchases
at CostProceeds
from SalesNet Realized
Gain (Loss)
Change inUnrealized
Appreciation(Depreciation)
Value at11/30/21
SharesHeld at
11/30/21 Income
CapitalGain
Distributionsfrom
UnderlyingFunds
BlackRock Cash Funds: Treasury, SL Agency Shares . . . . . . . . . $100,000 $ — $(60,000)(a) $ — $ — $ 40,000 40,000 $ 1 $ —
(a) Represents net amount purchased (sold).
Derivative Financial Instruments Outstanding as of Period End
Futures Contracts
DescriptionNumber ofContracts
ExpirationDate
NotionalAmount
(000)
Value/Unrealized
Appreciation(Depreciation)
Long ContractsMSCI Brazil Index . . . . . . . . . . . . . . . . . . . . . . . . . . . . . . . . . . . . . . . . . . . . . . . . . . . . . . . . . . . . . . . . . . . . . . . . . . . . . . . . . . . . . . . . . . . . . . . . . . . 15 12/17/21 $ 594 $ (56,555)
Fair Value Measurements
Various inputs are used in determining the fair value of financial instruments. These inputs to valuation techniques are categorized into a fair value hierarchy consisting ofthree broad levels for financial reporting purposes as follows:
• Level 1 – Unadjusted price quotations in active markets/exchanges for identical assets or liabilities that each Fund has the ability to access;• Level 2 – Other observable inputs (including, but not limited to, quoted prices for similar assets or liabilities in markets that are active, quoted prices for identical or
similar assets or liabilities in markets that are not active, inputs other than quoted prices that are observable for the assets or liabilities (such as interest rates, yieldcurves, volatilities, prepayment speeds, loss severities, credit risks and default rates) or other market-corroborated inputs); and
• Level 3 – Unobservable inputs based on the best information available in the circumstances, to the extent observable inputs are not available (including the BlackRockGlobal Valuation Methodologies Committee’s (the “Global Valuation Committee’s”) assumptions used in determining the fair value of financial instruments).
The hierarchy gives the highest priority to unadjusted quoted prices in active markets for identical assets or liabilities (Level 1 measurements) and the lowest priority tounobservable inputs (Level 3 measurements). Accordingly, the degree of judgment exercised in determining fair value is greatest for instruments categorized in Level 3. Theinputs used to measure fair value may fall into different levels of the fair value hierarchy. In such cases, for disclosure purposes, the fair value hierarchy classification isdetermined based on the lowest level input that is significant to the fair value measurement in its entirety. Investments classified within Level 3 have significant unobservableinputs used by the Global Valuation Committee in determining the price for Fair Valued Investments. Level 3 investments include equity or debt issued by privately heldcompanies or funds. There may not be a secondary market, and/or there are a limited number of investors. The categorization of a value determined for financial instrumentsis based on the pricing transparency of the financial instruments and is not necessarily an indication of the risks associated with investing in those securities. For informationabout the Fund’s policy regarding valuation of financial instruments, refer to its most recent financial statements.
The following table summarizes the Fund’s financial instruments categorized in the fair value hierarchy. The breakdown of the Fund’s financial instruments into majorcategories is disclosed in the Schedule of Investments above.
Level 1 Level 2 Level 3 Total
InvestmentsAssets
Common Stocks. . . . . . . . . . . . . . . . . . . . . . . . . . . . . . . . . . . . . . . . . . . . . . . . . . . . . . . . . . . . . . . . . . . . . . . . . . . . . . . . . . . . . . . . . $70,726,023 $ — $ — $70,726,023Preferred Stocks . . . . . . . . . . . . . . . . . . . . . . . . . . . . . . . . . . . . . . . . . . . . . . . . . . . . . . . . . . . . . . . . . . . . . . . . . . . . . . . . . . . . . . . . 12,267,582 — — 12,267,582Money Market Funds . . . . . . . . . . . . . . . . . . . . . . . . . . . . . . . . . . . . . . . . . . . . . . . . . . . . . . . . . . . . . . . . . . . . . . . . . . . . . . . . . . . . 40,000 — — 40,000
$83,033,605 $ — $ — $83,033,605
Derivative financial instruments(a)
LiabilitiesFutures Contracts . . . . . . . . . . . . . . . . . . . . . . . . . . . . . . . . . . . . . . . . . . . . . . . . . . . . . . . . . . . . . . . . . . . . . . . . . . . . . . . . . . . . . . . $ (56,555) $ — $ — $ (56,555)
(a) Derivative financial instruments are futures contracts. Futures contracts are valued at the unrealized appreciation (depreciation) on the instrument.
Schedule of Investments (unaudited) (continued)
November 30, 2021
iShares� MSCI Brazil Small-Cap ETF
72 NM0122U-1995964-74/159

Portfolio Abbreviations - Equity
NVS . . . . . . . . . . . . . Non-Voting Shares
Schedule of Investments (unaudited) (continued)
November 30, 2021
iShares� MSCI Brazil Small-Cap ETF
73NM0122U-1995964-75/159

Security Shares
Value
Common StocksAerospace & Defense — 0.2%AECC Aviation Power Co. Ltd., Class A . . . . . . . . . . . . . . . . 374,476 $ 3,800,033AVIC Electromechanical Systems Co. Ltd., Class A. . . . . 655,200 1,753,864AviChina Industry & Technology Co. Ltd., Class H . . . . . . 5,616,000 3,693,757Kuang-Chi Technologies Co. Ltd., Class A(a) . . . . . . . . . . . 327,600 1,192,255
10,439,909Air Freight & Logistics — 0.7%SF Holding Co. Ltd., Class A . . . . . . . . . . . . . . . . . . . . . . . . . . 655,283 6,301,214Yunda Holding Co. Ltd., Class A. . . . . . . . . . . . . . . . . . . . . . . 468,557 1,459,203ZTO Express Cayman Inc., ADR . . . . . . . . . . . . . . . . . . . . . . 1,006,668 31,820,775
39,581,192Airlines — 0.2%Air China Ltd., Class A(a) . . . . . . . . . . . . . . . . . . . . . . . . . . . . . . 936,089 1,167,416Air China Ltd., Class H(a)(b) . . . . . . . . . . . . . . . . . . . . . . . . . . . . 3,744,000 2,355,603China Eastern Airlines Corp. Ltd., Class A(a). . . . . . . . . . . . 1,872,096 1,368,525China Southern Airlines Co. Ltd., Class A(a) . . . . . . . . . . . . 1,872,088 1,793,430China Southern Airlines Co. Ltd., Class H(a) . . . . . . . . . . . . 3,744,000 2,067,480Spring Airlines Co. Ltd., Class A(a) . . . . . . . . . . . . . . . . . . . . . 140,485 1,215,097
9,967,551Auto Components — 0.5%Changzhou Xingyu Automotive Lighting Systems Co.
Ltd., Class A . . . . . . . . . . . . . . . . . . . . . . . . . . . . . . . . . . . . . . . 46,895 1,604,514Fuyao Glass Industry Group Co. Ltd., Class A. . . . . . . . . . 234,098 1,703,823Fuyao Glass Industry Group Co. Ltd., Class H(c). . . . . . . . 1,497,600 8,219,101Huayu Automotive Systems Co. Ltd., Class A . . . . . . . . . . 514,872 2,084,281Huizhou Desay Sv Automotive Co. Ltd., Class A. . . . . . . . 94,100 2,057,792Mianyang Fulin Precision Machining Co. Ltd.,
Class A, NVS(a) . . . . . . . . . . . . . . . . . . . . . . . . . . . . . . . . . . . . 93,600 548,236Minth Group Ltd.. . . . . . . . . . . . . . . . . . . . . . . . . . . . . . . . . . . . . . 1,872,000 8,694,196Ningbo Tuopu Group Co. Ltd., Class A. . . . . . . . . . . . . . . . . 140,400 1,478,649Sailun Group Co. Ltd., Class A . . . . . . . . . . . . . . . . . . . . . . . . 374,400 818,017Shandong Linglong Tyre Co. Ltd., Class A . . . . . . . . . . . . . 234,028 1,417,135Shenzhen Kedali Industry Co., Class A, NVS. . . . . . . . . . . 46,800 1,295,683
29,921,427Automobiles — 6.5%BYD Co. Ltd., Class A . . . . . . . . . . . . . . . . . . . . . . . . . . . . . . . . 234,059 11,221,138BYD Co. Ltd., Class H . . . . . . . . . . . . . . . . . . . . . . . . . . . . . . . . 1,826,500 71,842,783Chongqing Changan Automobile Co. Ltd., Class A. . . . . . 915,893 2,492,823Dongfeng Motor Group Co. Ltd., Class H . . . . . . . . . . . . . . 6,274,000 5,824,341Geely Automobile Holdings Ltd. . . . . . . . . . . . . . . . . . . . . . . . 13,572,000 40,083,750Great Wall Motor Co. Ltd., Class A. . . . . . . . . . . . . . . . . . . . . 327,800 3,077,689Great Wall Motor Co. Ltd., Class H . . . . . . . . . . . . . . . . . . . . 7,254,000 30,141,304Guangzhou Automobile Group Co. Ltd., Class H . . . . . . . 6,552,400 6,683,093Li Auto Inc., ADR(a)(b) . . . . . . . . . . . . . . . . . . . . . . . . . . . . . . . . . 1,275,768 45,213,218NIO Inc., ADR(a)(b) . . . . . . . . . . . . . . . . . . . . . . . . . . . . . . . . . . . . 3,162,744 123,758,173SAIC Motor Corp. Ltd., Class A. . . . . . . . . . . . . . . . . . . . . . . . 1,216,876 3,813,827XPeng Inc., ADR(a)(b) . . . . . . . . . . . . . . . . . . . . . . . . . . . . . . . . . 905,112 49,781,160Yadea Group Holdings Ltd.(c) . . . . . . . . . . . . . . . . . . . . . . . . . . 2,470,000 4,414,395
398,347,694Banks — 8.3%Agricultural Bank of China Ltd., Class A. . . . . . . . . . . . . . . . 11,091,600 5,065,433Agricultural Bank of China Ltd., Class H . . . . . . . . . . . . . . . 59,904,000 19,784,652Bank of Beijing Co. Ltd., Class A . . . . . . . . . . . . . . . . . . . . . . 3,744,099 2,573,143Bank of Chengdu Co. Ltd., Class A . . . . . . . . . . . . . . . . . . . . 655,293 1,149,324Bank of China Ltd., Class A . . . . . . . . . . . . . . . . . . . . . . . . . . . 4,773,600 2,286,427Bank of China Ltd., Class H . . . . . . . . . . . . . . . . . . . . . . . . . . . 183,456,000 63,702,543Bank of Communications Co. Ltd., Class A. . . . . . . . . . . . . 5,709,622 4,095,197Bank of Communications Co. Ltd., Class H . . . . . . . . . . . . 19,656,200 11,444,650
Security Shares
Value
Banks (continued)Bank of Hangzhou Co. Ltd., Class A . . . . . . . . . . . . . . . . . . . 982,860 $ 2,112,929Bank of Jiangsu Co. Ltd., Class A . . . . . . . . . . . . . . . . . . . . . 2,527,255 2,331,175Bank of Nanjing Co. Ltd., Class A. . . . . . . . . . . . . . . . . . . . . . 1,684,800 2,393,242Bank of Ningbo Co. Ltd., Class A . . . . . . . . . . . . . . . . . . . . . . 889,284 5,345,009Bank of Shanghai Co. Ltd., Class A. . . . . . . . . . . . . . . . . . . . 2,340,097 2,624,967China Bohai Bank Co. Ltd., Class H(c) . . . . . . . . . . . . . . . . . 7,488,000 2,227,771China CITIC Bank Corp. Ltd., Class H . . . . . . . . . . . . . . . . . 19,656,800 8,436,773China Construction Bank Corp., Class A . . . . . . . . . . . . . . . 1,169,514 1,055,409China Construction Bank Corp., Class H . . . . . . . . . . . . . . . 222,300,000 144,852,025China Everbright Bank Co. Ltd., Class A . . . . . . . . . . . . . . . 6,271,200 3,294,864China Everbright Bank Co. Ltd., Class H . . . . . . . . . . . . . . . 6,084,000 2,085,928China Merchants Bank Co. Ltd., Class A . . . . . . . . . . . . . . . 2,854,868 22,166,889China Merchants Bank Co. Ltd., Class H. . . . . . . . . . . . . . . 9,126,150 70,699,680China Minsheng Banking Corp. Ltd., Class A. . . . . . . . . . . 5,054,470 3,086,189China Minsheng Banking Corp. Ltd., Class H. . . . . . . . . . . 12,870,160 4,948,420China Zheshang Bank Co. Ltd., Class A . . . . . . . . . . . . . . . 2,705,900 1,456,440Huaxia Bank Co. Ltd., Class A. . . . . . . . . . . . . . . . . . . . . . . . . 2,340,061 2,069,642Industrial & Commercial Bank of China Ltd., Class A . . . 8,938,800 6,418,759Industrial & Commercial Bank of China Ltd., Class H . . . 130,104,000 68,751,255Industrial Bank Co. Ltd., Class A. . . . . . . . . . . . . . . . . . . . . . . 2,901,600 8,184,108Ping An Bank Co. Ltd., Class A . . . . . . . . . . . . . . . . . . . . . . . . 2,761,255 7,557,424Postal Savings Bank of China Co. Ltd., Class A . . . . . . . . 3,790,800 3,015,775Postal Savings Bank of China Co. Ltd., Class H(c) . . . . . . 18,720,000 12,681,655Shanghai Pudong Development Bank Co. Ltd., Class A. 4,165,298 5,561,296
503,458,993Beverages — 2.8%Anhui Gujing Distillery Co. Ltd., Class A. . . . . . . . . . . . . . . . 57,596 2,293,677Anhui Gujing Distillery Co. Ltd., Class B . . . . . . . . . . . . . . . 281,230 3,881,122China Resources Beer Holdings Co. Ltd.. . . . . . . . . . . . . . . 3,444,000 28,249,963Chongqing Brewery Co. Ltd., Class A(a) . . . . . . . . . . . . . . . . 93,600 2,120,046Jiangsu King's Luck Brewery JSC Ltd., Class A . . . . . . . . 187,203 1,656,493Jiangsu Yanghe Brewery Joint-Stock Co. Ltd., Class A . 187,276 5,108,535JiuGui Liquor Co. Ltd., Class A . . . . . . . . . . . . . . . . . . . . . . . . 47,400 1,669,436Kweichow Moutai Co. Ltd., Class A . . . . . . . . . . . . . . . . . . . . 177,704 53,896,054Luzhou Laojiao Co. Ltd., Class A . . . . . . . . . . . . . . . . . . . . . . 207,700 7,531,559Nongfu Spring Co. Ltd., Class H(c) . . . . . . . . . . . . . . . . . . . . . 4,024,800 23,097,301Shanghai Bairun Investment Holding Group Co. Ltd.,
Class A . . . . . . . . . . . . . . . . . . . . . . . . . . . . . . . . . . . . . . . . . . . . 128,540 1,181,854Shanxi Xinghuacun Fen Wine Factory Co. Ltd.,
Class A . . . . . . . . . . . . . . . . . . . . . . . . . . . . . . . . . . . . . . . . . . . . 187,286 9,185,679Sichuan Swellfun Co. Ltd., Class A . . . . . . . . . . . . . . . . . . . . 68,752 1,396,781Tsingtao Brewery Co. Ltd., Class A . . . . . . . . . . . . . . . . . . . . 93,663 1,448,990Tsingtao Brewery Co. Ltd., Class H . . . . . . . . . . . . . . . . . . . . 1,268,000 10,249,759Wuliangye Yibin Co. Ltd., Class A . . . . . . . . . . . . . . . . . . . . . 514,877 17,643,451
170,610,700Biotechnology — 1.8%3SBio Inc.(a)(c) . . . . . . . . . . . . . . . . . . . . . . . . . . . . . . . . . . . . . . . . 3,042,000 2,601,967Akeso Inc.(a)(c) . . . . . . . . . . . . . . . . . . . . . . . . . . . . . . . . . . . . . . . . 668,000 4,213,644BeiGene Ltd., ADR(a)(b) . . . . . . . . . . . . . . . . . . . . . . . . . . . . . . . 108,108 37,570,773Beijing Tiantan Biological Products Corp. Ltd., Class A . 187,272 882,751Beijing Wantai Biological Pharmacy Enterprise Co. Ltd.,
Class A . . . . . . . . . . . . . . . . . . . . . . . . . . . . . . . . . . . . . . . . . . . . 46,800 1,842,284BGI Genomics Co. Ltd., Class A . . . . . . . . . . . . . . . . . . . . . . . 93,699 1,402,885Chongqing Zhifei Biological Products Co. Ltd., Class A . 234,040 4,729,744Hualan Biological Engineering Inc., Class A . . . . . . . . . . . . 275,872 1,251,046I-Mab, ADR(a)(b). . . . . . . . . . . . . . . . . . . . . . . . . . . . . . . . . . . . . . . 82,836 5,008,265Imeik Technology Development Co. Ltd., Class A. . . . . . . 25,300 2,244,473Innovent Biologics Inc.(a)(c) . . . . . . . . . . . . . . . . . . . . . . . . . . . . 2,808,000 24,806,961Legend Biotech Corp., ADR(a) . . . . . . . . . . . . . . . . . . . . . . . . . 80,496 4,146,349
Schedule of Investments (unaudited)
November 30, 2021
iShares� MSCI China ETF(Percentages shown are based on Net Assets)
74 NM0122U-1995964-76/159

Security Shares
Value
Biotechnology (continued)Shanghai RAAS Blood Products Co. Ltd., Class A . . . . . . 1,263,600 $ 1,301,350Shenzhen Kangtai Biological Products Co. Ltd.,
Class A . . . . . . . . . . . . . . . . . . . . . . . . . . . . . . . . . . . . . . . . . . . . 93,655 1,694,176Walvax Biotechnology Co. Ltd., Class A. . . . . . . . . . . . . . . . 234,097 2,523,063Zai Lab Ltd., ADR(a). . . . . . . . . . . . . . . . . . . . . . . . . . . . . . . . . . . 176,904 12,250,602
108,470,333Building Products — 0.1%Beijing New Building Materials PLC, Class A . . . . . . . . . . . 280,870 1,174,696China Lesso Group Holdings Ltd.. . . . . . . . . . . . . . . . . . . . . . 2,808,000 4,077,849Guangdong Kinlong Hardware Products Co. Ltd.,
Class A . . . . . . . . . . . . . . . . . . . . . . . . . . . . . . . . . . . . . . . . . . . . 47,400 1,141,551Zhuzhou Kibing Group Co. Ltd., Class A . . . . . . . . . . . . . . . 374,400 937,165
7,331,261Capital Markets — 1.8%Changjiang Securities Co. Ltd., Class A. . . . . . . . . . . . . . . . 1,357,236 1,530,218China Cinda Asset Management Co. Ltd., Class H . . . . . 21,996,000 3,514,621China Galaxy Securities Co. Ltd., Class A. . . . . . . . . . . . . . 675,800 1,102,739China Galaxy Securities Co. Ltd., Class H . . . . . . . . . . . . . 7,956,000 4,385,080China Huarong Asset Management Co. Ltd.,
Class H(a)(c)(d). . . . . . . . . . . . . . . . . . . . . . . . . . . . . . . . . . . . . . 20,400,000 2,001,282China International Capital Corp. Ltd., Class A . . . . . . . . . 93,600 699,813China International Capital Corp. Ltd., Class H(c) . . . . . . . 3,316,400 8,022,850China Merchants Securities Co. Ltd., Class A . . . . . . . . . . 1,076,468 2,870,774CITIC Securities Co. Ltd., Class A . . . . . . . . . . . . . . . . . . . . . 1,591,275 5,932,792CITIC Securities Co. Ltd., Class H . . . . . . . . . . . . . . . . . . . . . 5,148,000 12,239,045CSC Financial Co. Ltd., Class A . . . . . . . . . . . . . . . . . . . . . . . 655,299 2,878,704Dongxing Securities Co. Ltd., Class A. . . . . . . . . . . . . . . . . . 655,294 1,230,334East Money Information Co. Ltd., Class A . . . . . . . . . . . . . . 1,497,681 8,139,881Everbright Securities Co. Ltd., Class A . . . . . . . . . . . . . . . . . 561,699 1,272,843First Capital Securities Co. Ltd., Class A . . . . . . . . . . . . . . . 748,889 817,206Founder Securities Co. Ltd., Class A. . . . . . . . . . . . . . . . . . . 1,544,499 1,875,698GF Securities Co. Ltd., Class A. . . . . . . . . . . . . . . . . . . . . . . . 920,999 3,368,659GF Securities Co. Ltd., Class H. . . . . . . . . . . . . . . . . . . . . . . . 2,433,600 4,239,899Guosen Securities Co. Ltd., Class A . . . . . . . . . . . . . . . . . . . 1,123,233 1,945,103Guotai Junan Securities Co. Ltd., Class A . . . . . . . . . . . . . . 1,263,643 3,316,964Guoyuan Securities Co. Ltd., Class A . . . . . . . . . . . . . . . . . . 842,420 984,053Haitong Securities Co. Ltd., Class A . . . . . . . . . . . . . . . . . . . 1,450,859 2,694,265Haitong Securities Co. Ltd., Class H . . . . . . . . . . . . . . . . . . . 5,990,400 5,029,621Hithink RoyalFlush Information Network Co. Ltd.,
Class A . . . . . . . . . . . . . . . . . . . . . . . . . . . . . . . . . . . . . . . . . . . . 78,587 1,444,905Huatai Securities Co. Ltd., Class A . . . . . . . . . . . . . . . . . . . . 1,310,493 3,255,866Huatai Securities Co. Ltd., Class H(c) . . . . . . . . . . . . . . . . . . 3,182,400 4,559,726Huaxi Securities Co. Ltd., Class A . . . . . . . . . . . . . . . . . . . . . 702,073 1,022,799Industrial Securities Co. Ltd., Class A . . . . . . . . . . . . . . . . . . 1,123,240 1,508,308Noah Holdings Ltd., ADR(a)(b). . . . . . . . . . . . . . . . . . . . . . . . . . 80,028 2,915,420Orient Securities Co. Ltd., Class A . . . . . . . . . . . . . . . . . . . . . 982,864 2,168,746Pacific Securities Co. Ltd. (The), Class A(a). . . . . . . . . . . . . 1,204,193 600,217SDIC Capital Co. Ltd., Class A . . . . . . . . . . . . . . . . . . . . . . . . 1,207,414 1,515,706Sealand Securities Co. Ltd., Class A . . . . . . . . . . . . . . . . . . . 1,450,860 887,363Shanxi Securities Co. Ltd., Class A . . . . . . . . . . . . . . . . . . . . 795,621 789,270Shenwan Hongyuan Group Co. Ltd., Class A. . . . . . . . . . . 4,022,579 3,188,107Sinolink Securities Co. Ltd., Class A . . . . . . . . . . . . . . . . . . . 514,826 857,332SooChow Securities Co. Ltd., Class A . . . . . . . . . . . . . . . . . 748,850 1,026,605Western Securities Co. Ltd., Class A. . . . . . . . . . . . . . . . . . . 1,076,430 1,320,533Zheshang Securities Co. Ltd., Class A . . . . . . . . . . . . . . . . . 608,400 1,187,514
108,340,861Chemicals — 1.0%Beijing Easpring Material, Class A, NVS . . . . . . . . . . . . . . . 46,800 770,383DO Fluoride New Materials, Class A, NVS . . . . . . . . . . . . . 93,600 715,985
Security Shares
Value
Chemicals (continued)Dongyue Group Ltd. . . . . . . . . . . . . . . . . . . . . . . . . . . . . . . . . . . 3,276,000 $ 6,225,996Guangzhou Tinci Materials Technology Co. Ltd.,
Class A . . . . . . . . . . . . . . . . . . . . . . . . . . . . . . . . . . . . . . . . . . . . 140,800 2,984,908Hengli Petrochemical Co. Ltd., Class A . . . . . . . . . . . . . . . . 889,210 2,955,731Hengyi Petrochemical Co. Ltd., Class A. . . . . . . . . . . . . . . . 842,476 1,387,532Hoshine Silicon Industry Co. Ltd., Class A. . . . . . . . . . . . . . 46,800 1,134,476Huabao International Holdings Ltd. . . . . . . . . . . . . . . . . . . . . 2,177,000 6,246,062Huafon Chemical Co. Ltd., Class A . . . . . . . . . . . . . . . . . . . . 791,200 1,328,735Hubei Xingfa Chemicals Group Co. Ltd., Class A, NVS . 187,200 1,174,686Inner Mongolia Junzheng Energy & Chemical Industry
Group Co. Ltd., Class A . . . . . . . . . . . . . . . . . . . . . . . . . . . . 1,497,600 1,244,962Inner Mongolia Yuan Xing Energy Co. Ltd.,
Class A, NVS(a) . . . . . . . . . . . . . . . . . . . . . . . . . . . . . . . . . . . . 561,600 637,771Jiangsu Eastern Shenghong Co. Ltd., Class A. . . . . . . . . . 468,000 1,737,170Kingfa Sci & Tech Co. Ltd., Class A . . . . . . . . . . . . . . . . . . . . 514,800 1,099,615LB Group Co. Ltd., Class A. . . . . . . . . . . . . . . . . . . . . . . . . . . . 374,400 1,642,057Ningxia Baofeng Energy Group Co. Ltd., Class A. . . . . . . 1,024,700 2,609,783Rongsheng Petrochemical Co. Ltd., Class A . . . . . . . . . . . 1,544,442 3,934,667Satellite Chemical Co. Ltd., Class A . . . . . . . . . . . . . . . . . . . 277,764 1,720,136Shandong Hualu Hengsheng Chemical Co. Ltd.,
Class A . . . . . . . . . . . . . . . . . . . . . . . . . . . . . . . . . . . . . . . . . . . . 374,470 1,736,268Shanghai Putailai New Energy Technology Co. Ltd.,
Class A . . . . . . . . . . . . . . . . . . . . . . . . . . . . . . . . . . . . . . . . . . . . 93,600 2,692,461Shenzhen Capchem Technology Co. Ltd., Class A. . . . . . 46,800 890,939Shenzhen Senior Technology Co. Ltd., Class A, NVS . . . 93,600 674,820Sinoma Science & Technology Co. Ltd., Class A . . . . . . . 234,000 1,341,553Skshu Paint Co. Ltd., Class A . . . . . . . . . . . . . . . . . . . . . . . . . 64,200 1,199,501Tongkun Group Co. Ltd., Class A . . . . . . . . . . . . . . . . . . . . . . 421,276 1,306,536Transfar Zhilian Co. Ltd., Class A . . . . . . . . . . . . . . . . . . . . . . 748,893 1,070,458Wanhua Chemical Group Co. Ltd., Class A. . . . . . . . . . . . . 468,073 7,012,866Weihai Guangwei Composites Co. Ltd., Class A. . . . . . . . 93,600 1,239,375Zhejiang Longsheng Group Co. Ltd., Class A . . . . . . . . . . 889,271 1,747,365Zhejiang Yongtai Technology Co. Ltd., Class A, NVS(a) . 137,700 1,357,210
61,820,007Commercial Services & Supplies — 0.1%Beijing Originwater Technology Co. Ltd., Class A . . . . . . . 936,097 1,034,841China Everbright Environment Group Ltd. . . . . . . . . . . . . . . 8,892,148 5,881,531Shanghai M&G Stationery Inc., Class A . . . . . . . . . . . . . . . . 140,400 1,235,775
8,152,147Communications Equipment — 0.3%BYD Electronic International Co. Ltd.(b) . . . . . . . . . . . . . . . . 1,639,000 6,063,542China Zhenhua Group Science & Technology Co. Ltd.,
Class A . . . . . . . . . . . . . . . . . . . . . . . . . . . . . . . . . . . . . . . . . . . . 46,800 889,689Fiberhome Telecommunication Technologies Co. Ltd.,
Class A . . . . . . . . . . . . . . . . . . . . . . . . . . . . . . . . . . . . . . . . . . . . 221,277 616,791Guangzhou Haige Communications Group Inc. Co.,
Class A . . . . . . . . . . . . . . . . . . . . . . . . . . . . . . . . . . . . . . . . . . . . 748,884 1,228,135Yealink Network Technology Corp. Ltd., Class A . . . . . . . . 123,094 1,499,942Zhongji Innolight Co. Ltd., Class A . . . . . . . . . . . . . . . . . . . . . 140,477 838,064ZTE Corp., Class A . . . . . . . . . . . . . . . . . . . . . . . . . . . . . . . . . . . 544,156 2,626,005ZTE Corp., Class H . . . . . . . . . . . . . . . . . . . . . . . . . . . . . . . . . . . 1,778,440 4,824,877
18,587,045Construction & Engineering — 0.8%China Communications Services Corp. Ltd., Class H . . . 6,552,800 3,119,519China Conch Venture Holdings Ltd. . . . . . . . . . . . . . . . . . . . . 3,978,000 19,444,154China National Chemical Engineering Co. Ltd., Class A. 936,095 1,636,516China Railway Group Ltd., Class A . . . . . . . . . . . . . . . . . . . . 3,369,698 2,800,664China Railway Group Ltd., Class H . . . . . . . . . . . . . . . . . . . . 8,892,000 4,227,388
Schedule of Investments (unaudited) (continued)
November 30, 2021
iShares� MSCI China ETF(Percentages shown are based on Net Assets)
75NM0122U-1995964-77/159

Security Shares
Value
Construction & Engineering (continued)China State Construction Engineering Corp. Ltd.,
Class A . . . . . . . . . . . . . . . . . . . . . . . . . . . . . . . . . . . . . . . . . . . . 5,990,498 $ 4,357,323China State Construction International Holdings Ltd.. . . . 4,680,000 4,731,894Metallurgical Corp. of China Ltd., Class A . . . . . . . . . . . . . . 3,697,200 2,201,922Power Construction Corp. of China Ltd., Class A . . . . . . . 2,433,697 2,511,488Sichuan Road & Bridge Co. Ltd., Class A . . . . . . . . . . . . . . 608,400 1,146,753
46,177,621Construction Materials — 0.5%Anhui Conch Cement Co. Ltd., Class A . . . . . . . . . . . . . . . . 640,191 3,655,093Anhui Conch Cement Co. Ltd., Class H . . . . . . . . . . . . . . . . 2,808,000 12,784,344China Jushi Co. Ltd., Class A. . . . . . . . . . . . . . . . . . . . . . . . . . 702,005 1,918,988China National Building Material Co. Ltd., Class H. . . . . . 9,360,000 10,055,623China Resources Cement Holdings Ltd. . . . . . . . . . . . . . . . 5,616,000 4,087,853Tangshan Jidong Cement Co. Ltd., Class A . . . . . . . . . . . . 468,068 865,470
33,367,371Consumer Finance — 0.1%360 DigiTech Inc., ADR(a) . . . . . . . . . . . . . . . . . . . . . . . . . . . . . 200,772 4,673,972
Containers & Packaging — 0.1%Yunnan Energy New Material Co. Ltd., Class A. . . . . . . . . 140,400 5,627,545
Distributors — 0.0%Wuchan Zhongda Group Co. Ltd., Class A . . . . . . . . . . . . . 889,203 846,394
Diversified Consumer Services — 0.3%China Education Group Holdings Ltd.(b) . . . . . . . . . . . . . . . . 1,872,000 3,443,594China Yuhua Education Corp. Ltd.(c) . . . . . . . . . . . . . . . . . . . 3,744,000 1,790,859New Oriental Education & Technology
Group Inc., ADR(a) . . . . . . . . . . . . . . . . . . . . . . . . . . . . . . . . . 3,611,088 7,980,504Offcn Education Technology Co. Ltd., Class A(a) . . . . . . . . 5 8TAL Education Group, ADR(a)(b) . . . . . . . . . . . . . . . . . . . . . . . 978,120 5,066,662
18,281,627Diversified Financial Services — 0.1%AVIC Industry-Finance Holdings Co. Ltd., Class A . . . . . . 1,825,282 1,099,231Far East Horizon Ltd. . . . . . . . . . . . . . . . . . . . . . . . . . . . . . . . . . 4,176,000 3,625,483
4,724,714Diversified Telecommunication Services — 0.2%China Tower Corp. Ltd., Class H(c) . . . . . . . . . . . . . . . . . . . . . 97,344,000 12,321,119
Electrical Equipment — 1.4%Contemporary Amperex Technology Co. Ltd., Class A . . 332,571 35,500,254Dongfang Electric Corp. Ltd., Class A . . . . . . . . . . . . . . . . . . 374,400 1,199,680Eve Energy Co. Ltd., Class A. . . . . . . . . . . . . . . . . . . . . . . . . . 289,236 6,633,528Fangda Carbon New Material Co. Ltd., Class A . . . . . . . . 748,847 1,418,937Ginlong Technologies Co. Ltd., Class A . . . . . . . . . . . . . . . . 46,800 1,874,352Gotion High-tech Co. Ltd., Class A(a). . . . . . . . . . . . . . . . . . . 208,300 2,178,112Hongfa Technology Co. Ltd., Class A . . . . . . . . . . . . . . . . . . 140,400 1,600,820Jiangsu Zhongtian Technology Co. Ltd., Class A . . . . . . . 374,400 1,092,649Ming Yang Smart Energy Group Ltd., Class A . . . . . . . . . . 280,800 1,405,654NARI Technology Co. Ltd., Class A . . . . . . . . . . . . . . . . . . . . 842,477 5,473,959Shanghai Electric Group Co. Ltd., Class A . . . . . . . . . . . . . 982,800 747,153Sungrow Power Supply Co. Ltd., Class A . . . . . . . . . . . . . . 210,600 5,340,064Sunwoda Electronic Co. Ltd., Class A. . . . . . . . . . . . . . . . . . 280,898 2,325,455Suzhou Maxwell Technologies Co. Ltd., Class A. . . . . . . . 16,620 1,833,345TBEA Co. Ltd., Class A . . . . . . . . . . . . . . . . . . . . . . . . . . . . . . . 608,457 2,187,513Titan Wind Energy Suzhou Co. Ltd., Class A, NVS . . . . . 234,000 764,134Xinjiang Goldwind Science & Technology Co. Ltd.,
Class A . . . . . . . . . . . . . . . . . . . . . . . . . . . . . . . . . . . . . . . . . . . . 556,420 1,601,658Xinjiang Goldwind Science & Technology Co. Ltd.,
Class H. . . . . . . . . . . . . . . . . . . . . . . . . . . . . . . . . . . . . . . . . . . . 1,744,120 3,822,655
Security Shares
Value
Electrical Equipment (continued)Zhejiang Chint Electrics Co. Ltd., Class A . . . . . . . . . . . . . . 327,668 $ 2,662,333Zhuzhou CRRC Times Electric Co. Ltd. . . . . . . . . . . . . . . . . 1,263,600 8,294,229
87,956,484Electronic Equipment, Instruments & Components — 1.9%AAC Technologies Holdings Inc. . . . . . . . . . . . . . . . . . . . . . . . 1,638,000 7,154,229Avary Holding Shenzhen Co. Ltd., Class A . . . . . . . . . . . . . 229,800 1,457,133BOE Technology Group Co. Ltd., Class A . . . . . . . . . . . . . . 5,288,400 3,996,764Chaozhou Three-Circle Group Co. Ltd., Class A. . . . . . . . 327,600 2,147,130Foxconn Industrial Internet Co. Ltd., Class A . . . . . . . . . . . 1,263,696 2,216,054GoerTek Inc., Class A . . . . . . . . . . . . . . . . . . . . . . . . . . . . . . . . . 514,800 4,196,051Guangzhou Shiyuan Electronic Technology Co. Ltd.,
Class A . . . . . . . . . . . . . . . . . . . . . . . . . . . . . . . . . . . . . . . . . . . . 93,619 1,019,646Kingboard Holdings Ltd.. . . . . . . . . . . . . . . . . . . . . . . . . . . . . . . 1,638,000 8,222,576Kingboard Laminates Holdings Ltd. . . . . . . . . . . . . . . . . . . . . 2,340,000 4,102,943Lens Technology Co. Ltd., Class A. . . . . . . . . . . . . . . . . . . . . 748,888 2,461,959Lingyi iTech Guangdong Co., Class A(a) . . . . . . . . . . . . . . . . 1,263,600 1,343,229Luxshare Precision Industry Co. Ltd., Class A . . . . . . . . . . 982,824 6,109,580Maxscend Microelectronics Co. Ltd., Class A. . . . . . . . . . . 47,520 2,782,169Raytron Technology Co. Ltd., Class A. . . . . . . . . . . . . . . . . . 70,314 958,652Shengyi Technology Co. Ltd., Class A . . . . . . . . . . . . . . . . . 421,200 1,558,776Shennan Circuits Co. Ltd., Class A . . . . . . . . . . . . . . . . . . . . 64,424 1,063,739Shenzhen Kaifa Technology Co. Ltd., Class A . . . . . . . . . . 273,104 663,325Sunny Optical Technology Group Co. Ltd.. . . . . . . . . . . . . . 1,638,000 49,337,877Suzhou Dongshan Precision Manufacturing Co. Ltd.,
Class A . . . . . . . . . . . . . . . . . . . . . . . . . . . . . . . . . . . . . . . . . . . . 187,200 705,988Tianma Microelectronics Co. Ltd., Class A . . . . . . . . . . . . . 561,699 1,103,535Unisplendour Corp. Ltd., Class A . . . . . . . . . . . . . . . . . . . . . . 421,127 1,707,440Universal Scientific Industrial Shanghai Co. Ltd.,
Class A . . . . . . . . . . . . . . . . . . . . . . . . . . . . . . . . . . . . . . . . . . . . 266,200 644,280Westone Information Industry Inc., Class A. . . . . . . . . . . . . 93,600 836,394Wingtech Technology Co. Ltd., Class A . . . . . . . . . . . . . . . . 187,200 3,599,984Wuhan Guide Infrared Co. Ltd., Class A. . . . . . . . . . . . . . . . 385,264 1,469,416Wuhu Token Science Co. Ltd., Class A. . . . . . . . . . . . . . . . . 327,600 588,666WUS Printed Circuit Kunshan Co. Ltd., Class A . . . . . . . . 514,908 1,229,599Wuxi Lead Intelligent Equipment Co. Ltd., Class A. . . . . . 149,396 1,859,051Zhejiang Dahua Technology Co. Ltd., Class A . . . . . . . . . . 561,600 2,161,241
116,697,426Energy Equipment & Services — 0.1%China Oilfield Services Ltd., Class H. . . . . . . . . . . . . . . . . . . 4,680,000 3,685,180Offshore Oil Engineering Co. Ltd., Class A . . . . . . . . . . . . . 736,198 496,175Yantai Jereh Oilfield Services Group Co. Ltd., Class A . . 140,492 858,108
5,039,463Entertainment — 2.7%Alibaba Pictures Group Ltd.(a) . . . . . . . . . . . . . . . . . . . . . . . . . 32,760,000 3,362,429Beijing Enlight Media Co. Ltd., Class A. . . . . . . . . . . . . . . . . 502,198 801,747Bilibili Inc., ADR(a)(b) . . . . . . . . . . . . . . . . . . . . . . . . . . . . . . . . . . 383,760 25,331,998Giant Network Group Co. Ltd., Class A . . . . . . . . . . . . . . . . 655,271 1,041,009iQIYI Inc., ADR(a)(b) . . . . . . . . . . . . . . . . . . . . . . . . . . . . . . . . . . . 658,008 4,105,970Kingsoft Corp. Ltd. . . . . . . . . . . . . . . . . . . . . . . . . . . . . . . . . . . . . 2,246,400 9,720,694Kunlun Tech Co. Ltd., Class A . . . . . . . . . . . . . . . . . . . . . . . . . 234,061 777,608Mango Excellent Media Co. Ltd., Class A . . . . . . . . . . . . . . 280,880 1,922,941NetEase Inc., ADR. . . . . . . . . . . . . . . . . . . . . . . . . . . . . . . . . . . . 935,532 100,784,862Perfect World Co. Ltd., Class A . . . . . . . . . . . . . . . . . . . . . . . . 348,000 1,029,857Tencent Music Entertainment Group, ADR(a)(b) . . . . . . . . . 1,547,208 11,124,425Wuhu Sanqi Interactive Entertainment Network
Technology Group Co. Ltd., Class A. . . . . . . . . . . . . . . . . 374,400 1,383,798Zhejiang Century Huatong Group Co. Ltd., Class A(a) . . . 1,310,498 1,513,446
162,900,784
Schedule of Investments (unaudited) (continued)
November 30, 2021
iShares� MSCI China ETF(Percentages shown are based on Net Assets)
76 NM0122U-1995964-78/159

Security Shares
Value
Food & Staples Retailing — 0.1%DaShenLin Pharmaceutical Group Co. Ltd., Class A . . . . 140,436 $ 777,786Shanghai Bailian Group Co. Ltd., Class A . . . . . . . . . . . . . . 280,900 584,319Sun Art Retail Group Ltd.. . . . . . . . . . . . . . . . . . . . . . . . . . . . . . 4,680,000 1,892,601Yifeng Pharmacy Chain Co. Ltd., Class A . . . . . . . . . . . . . . 150,398 1,066,327Yonghui Superstores Co. Ltd., Class A . . . . . . . . . . . . . . . . . 2,059,234 1,254,427
5,575,460Food Products — 2.1%Angel Yeast Co. Ltd., Class A . . . . . . . . . . . . . . . . . . . . . . . . . 140,424 1,236,569Beijing Dabeinong Technology Group Co. Ltd., Class A . 748,800 1,066,903China Feihe Ltd.(c) . . . . . . . . . . . . . . . . . . . . . . . . . . . . . . . . . . . . 8,424,000 11,268,948China Huishan Dairy Holdings Co. Ltd.(d) . . . . . . . . . . . . . . 1,366,667 2China Mengniu Dairy Co. Ltd. . . . . . . . . . . . . . . . . . . . . . . . . . 7,488,000 41,967,200Chongqing Fuling Zhacai Group Co. Ltd., Class A . . . . . . 140,423 714,319Dali Foods Group Co. Ltd.(c). . . . . . . . . . . . . . . . . . . . . . . . . . . 5,382,000 2,829,725Foshan Haitian Flavouring & Food Co. Ltd., Class A . . . . 468,014 8,265,557Fu Jian Anjoy Foods Co. Ltd., Class A . . . . . . . . . . . . . . . . . 47,400 1,293,940Guangdong Haid Group Co. Ltd., Class A . . . . . . . . . . . . . . 268,097 2,703,571Henan Shuanghui Investment & Development Co. Ltd.,
Class A . . . . . . . . . . . . . . . . . . . . . . . . . . . . . . . . . . . . . . . . . . . . 475,708 2,128,440Inner Mongolia Yili Industrial Group Co. Ltd., Class A . . . 889,223 5,465,062Jiangxi Zhengbang Technology Co. Ltd., Class A . . . . . . . 608,400 921,085Juewei Food Co. Ltd., Class A. . . . . . . . . . . . . . . . . . . . . . . . . 93,600 953,866Muyuan Foods Co. Ltd., Class A. . . . . . . . . . . . . . . . . . . . . . . 748,816 6,133,041New Hope Liuhe Co. Ltd., Class A(a) . . . . . . . . . . . . . . . . . . . 702,099 1,582,651Tingyi Cayman Islands Holding Corp. . . . . . . . . . . . . . . . . . . 4,680,000 9,041,353Tongwei Co. Ltd., Class A . . . . . . . . . . . . . . . . . . . . . . . . . . . . . 655,299 4,617,113Uni-President China Holdings Ltd. . . . . . . . . . . . . . . . . . . . . . 3,744,000 3,673,236Want Want China Holdings Ltd.. . . . . . . . . . . . . . . . . . . . . . . . 11,232,000 9,481,051Wens Foodstuffs Group Co. Ltd., Class A(a) . . . . . . . . . . . . 1,216,816 3,045,613Yihai International Holding Ltd.(b) . . . . . . . . . . . . . . . . . . . . . . 1,133,000 6,078,832Yihai Kerry Arawana Holdings Co. Ltd., Class A . . . . . . . . 187,200 1,808,912
126,276,989Gas Utilities — 1.2%Beijing Enterprises Holdings Ltd. . . . . . . . . . . . . . . . . . . . . . . 1,170,000 3,947,536China Gas Holdings Ltd. . . . . . . . . . . . . . . . . . . . . . . . . . . . . . . 7,113,600 12,833,733China Resources Gas Group Ltd.. . . . . . . . . . . . . . . . . . . . . . 2,284,000 11,818,338ENN Energy Holdings Ltd. . . . . . . . . . . . . . . . . . . . . . . . . . . . . 1,825,200 34,173,490Kunlun Energy Co. Ltd. . . . . . . . . . . . . . . . . . . . . . . . . . . . . . . . 9,360,000 8,802,955
71,576,052Health Care Equipment & Supplies — 0.5%Autobio Diagnostics Co. Ltd., Class A. . . . . . . . . . . . . . . . . . 93,656 823,508Intco Medical Technology Co. Ltd., Class A . . . . . . . . . . . . 70,200 719,918Jafron Biomedical Co. Ltd., Class A. . . . . . . . . . . . . . . . . . . . 140,420 1,131,566Jiangsu Yuyue Medical Equipment & Supply Co. Ltd.,
Class A . . . . . . . . . . . . . . . . . . . . . . . . . . . . . . . . . . . . . . . . . . . . 206,300 1,169,083Lepu Medical Technology Beijing Co. Ltd., Class A . . . . . 280,800 979,349Microport Scientific Corp. . . . . . . . . . . . . . . . . . . . . . . . . . . . . . 1,497,600 6,224,274Ovctek China Inc., Class A . . . . . . . . . . . . . . . . . . . . . . . . . . . . 128,640 1,160,386Shandong Weigao Group Medical Polymer Co. Ltd.,
Class H. . . . . . . . . . . . . . . . . . . . . . . . . . . . . . . . . . . . . . . . . . . . 5,798,400 8,158,792Shenzhen Mindray Bio-Medical Electronics Co. Ltd.,
Class A . . . . . . . . . . . . . . . . . . . . . . . . . . . . . . . . . . . . . . . . . . . . 187,295 10,591,748Venus MedTech Hangzhou Inc., Class H(a)(c) . . . . . . . . . . . 468,000 2,337,093
33,295,717Health Care Providers & Services — 0.6%Aier Eye Hospital Group Co. Ltd., Class A. . . . . . . . . . . . . . 748,874 5,037,321Guangzhou Kingmed Diagnostics Group Co. Ltd.,
Class A . . . . . . . . . . . . . . . . . . . . . . . . . . . . . . . . . . . . . . . . . . . . 80,994 1,394,607Huadong Medicine Co. Ltd., Class A. . . . . . . . . . . . . . . . . . . 280,880 1,497,707
Security Shares
Value
Health Care Providers & Services (continued)Hygeia Healthcare Holdings Co. Ltd.(c). . . . . . . . . . . . . . . . . 748,800 $ 5,823,893Jinxin Fertility Group Ltd.(a)(b)(c) . . . . . . . . . . . . . . . . . . . . . . . . 3,135,000 4,356,358Meinian Onehealth Healthcare Holdings Co. Ltd.,
Class A(a) . . . . . . . . . . . . . . . . . . . . . . . . . . . . . . . . . . . . . . . . . . 655,281 767,828Ping An Healthcare and Technology Co. Ltd.(a)(b)(c) . . . . . 1,076,400 4,052,709Shanghai Pharmaceuticals Holding Co. Ltd., Class A . . . 369,464 1,068,301Shanghai Pharmaceuticals Holding Co. Ltd., Class H. . . 1,872,000 3,413,255Sinopharm Group Co. Ltd., Class H . . . . . . . . . . . . . . . . . . . 3,182,400 6,916,099Topchoice Medical Corp., Class A(a) . . . . . . . . . . . . . . . . . . . 46,800 1,458,306
35,786,384Health Care Technology — 0.2%Alibaba Health Information Technology Ltd.(a)(b) . . . . . . . . 9,360,000 8,608,887Winning Health Technology Group Co. Ltd., Class A . . . . 416,156 1,028,431
9,637,318Hotels, Restaurants & Leisure — 1.9%Haidilao International Holding Ltd.(b)(c) . . . . . . . . . . . . . . . . . 2,340,000 5,156,448Huazhu Group Ltd., ADR(a). . . . . . . . . . . . . . . . . . . . . . . . . . . . 416,520 16,460,870Jiumaojiu International Holdings Ltd.(c) . . . . . . . . . . . . . . . . . 1,872,000 3,866,600Shanghai Jinjiang International Hotels Co. Ltd.,
Class A . . . . . . . . . . . . . . . . . . . . . . . . . . . . . . . . . . . . . . . . . . . . 46,800 383,574Shenzhen Overseas Chinese Town Co. Ltd., Class A . . . 1,357,238 1,257,578Songcheng Performance Development Co. Ltd.,
Class A . . . . . . . . . . . . . . . . . . . . . . . . . . . . . . . . . . . . . . . . . . . . 468,077 968,498Tongcheng-Elong Holdings Ltd.(a) . . . . . . . . . . . . . . . . . . . . . 2,433,600 5,011,693Trip.com Group Ltd., ADR(a)(b) . . . . . . . . . . . . . . . . . . . . . . . . . 1,184,976 32,586,840Yum China Holdings Inc. . . . . . . . . . . . . . . . . . . . . . . . . . . . . . . 982,332 49,214,833
114,906,934Household Durables — 0.6%Beijing Roborock Technology Co. Ltd., Class A . . . . . . . . . 8,720 1,112,048Ecovacs Robotics Co. Ltd., Class A. . . . . . . . . . . . . . . . . . . . 94,000 2,437,080Haier Smart Home Co. Ltd., Class A . . . . . . . . . . . . . . . . . . . 1,029,646 4,388,191Haier Smart Home Co. Ltd., Class H. . . . . . . . . . . . . . . . . . . 5,054,400 18,860,929Hang Zhou Great Star Industrial Co. Ltd., Class A(a) . . . . 140,400 706,355Jason Furniture Hangzhou Co. Ltd., Class A . . . . . . . . . . . 140,400 1,472,418NavInfo Co. Ltd., Class A(a) . . . . . . . . . . . . . . . . . . . . . . . . . . . 561,618 1,376,820Oppein Home Group Inc., Class A . . . . . . . . . . . . . . . . . . . . . 93,620 1,777,599Suofeiya Home Collection Co. Ltd., Class A . . . . . . . . . . . . 14 37TCL Technology Group Corp., Class A . . . . . . . . . . . . . . . . . 2,199,600 2,118,521Zhejiang Supor Co. Ltd., Class A . . . . . . . . . . . . . . . . . . . . . . 140,496 1,361,170
35,611,168Household Products — 0.0%Vinda International Holdings Ltd.(b) . . . . . . . . . . . . . . . . . . . . 936,000 2,532,649
Independent Power and Renewable Electricity Producers — 1.0%CECEP Solar Energy Co. Ltd., Class A, NVS. . . . . . . . . . . 421,200 661,588CECEP Wind Power Corp., Class A, NVS. . . . . . . . . . . . . . 702,000 705,694CGN Power Co. Ltd., Class H(c) . . . . . . . . . . . . . . . . . . . . . . . 22,932,000 6,270,929China Longyuan Power Group Corp. Ltd., Class H . . . . . 7,736,000 15,812,900China National Nuclear Power Co. Ltd., Class A. . . . . . . . 2,620,876 2,805,317China Power International Development Ltd. . . . . . . . . . . . 9,360,000 4,762,730China Resources Power Holdings Co. Ltd. . . . . . . . . . . . . . 4,680,000 12,117,227China Yangtze Power Co. Ltd., Class A . . . . . . . . . . . . . . . . 3,276,041 10,049,647Huaneng Power International Inc., Class A . . . . . . . . . . . . . 1,047,400 1,021,653Huaneng Power International Inc., Class H(b). . . . . . . . . . . 8,424,000 3,760,613SDIC Power Holdings Co. Ltd., Class A . . . . . . . . . . . . . . . . 1,076,496 1,679,134Shenergy Co. Ltd., Class A. . . . . . . . . . . . . . . . . . . . . . . . . . . . 1,076,455 1,042,519Shenzhen Energy Group Co. Ltd., Class A . . . . . . . . . . . . . 608,480 762,564Sichuan Chuantou Energy Co. Ltd., Class A . . . . . . . . . . . 738,562 1,324,806
62,777,321
Schedule of Investments (unaudited) (continued)
November 30, 2021
iShares� MSCI China ETF(Percentages shown are based on Net Assets)
77NM0122U-1995964-79/159

Security Shares
Value
Industrial Conglomerates — 0.3%China Baoan Group Co. Ltd., Class A. . . . . . . . . . . . . . . . . . 374,400 $ 1,034,951CITIC Ltd. . . . . . . . . . . . . . . . . . . . . . . . . . . . . . . . . . . . . . . . . . . . . 13,572,000 12,225,331Fosun International Ltd. . . . . . . . . . . . . . . . . . . . . . . . . . . . . . . . 5,850,000 6,384,282
19,644,564Insurance — 3.3%China Life Insurance Co. Ltd., Class A . . . . . . . . . . . . . . . . . 468,080 2,168,644China Life Insurance Co. Ltd., Class H. . . . . . . . . . . . . . . . . 16,848,000 27,709,250China Pacific Insurance Group Co. Ltd., Class A . . . . . . . 982,847 4,177,008China Pacific Insurance Group Co. Ltd., Class H . . . . . . . 6,084,000 17,647,314China Taiping Insurance Holdings Co. Ltd. . . . . . . . . . . . . . 3,744,124 5,208,496New China Life Insurance Co. Ltd., Class A . . . . . . . . . . . . 364,324 2,162,798New China Life Insurance Co. Ltd., Class H. . . . . . . . . . . . 1,825,200 4,875,676People's Insurance Co. Group of China Ltd. (The),
Class H. . . . . . . . . . . . . . . . . . . . . . . . . . . . . . . . . . . . . . . . . . . . 19,656,000 5,743,227PICC Property & Casualty Co. Ltd., Class H . . . . . . . . . . . 15,912,462 13,604,233Ping An Insurance Group Co. of China Ltd., Class A . . . . 1,497,643 11,334,126Ping An Insurance Group Co. of China Ltd., Class H. . . . 14,742,000 102,195,108ZhongAn Online P&C Insurance Co. Ltd.,
Class H(a)(b)(c). . . . . . . . . . . . . . . . . . . . . . . . . . . . . . . . . . . . . . 1,170,000 3,987,479
200,813,359Interactive Media & Services — 15.0%Autohome Inc., ADR . . . . . . . . . . . . . . . . . . . . . . . . . . . . . . . . . . 176,904 6,044,810Baidu Inc., ADR(a)(b) . . . . . . . . . . . . . . . . . . . . . . . . . . . . . . . . . . 645,372 96,702,541Hello Group Inc., ADR . . . . . . . . . . . . . . . . . . . . . . . . . . . . . . . . 364,572 4,218,098JOYY Inc., ADR . . . . . . . . . . . . . . . . . . . . . . . . . . . . . . . . . . . . . . 130,572 6,685,286Kanzhun Ltd., ADR(a) . . . . . . . . . . . . . . . . . . . . . . . . . . . . . . . . . 131,976 4,220,592Kuaishou Technology(a)(c) . . . . . . . . . . . . . . . . . . . . . . . . . . . . . 1,076,400 11,685,476Tencent Holdings Ltd. . . . . . . . . . . . . . . . . . . . . . . . . . . . . . . . . . 13,384,800 780,588,910Weibo Corp., ADR(a)(b) . . . . . . . . . . . . . . . . . . . . . . . . . . . . . . . . 148,824 5,924,683
916,070,396Internet & Direct Marketing Retail — 18.3%Alibaba Group Holding Ltd.(a). . . . . . . . . . . . . . . . . . . . . . . . . . 35,240,468 562,709,001Dada Nexus Ltd., ADR(a)(b) . . . . . . . . . . . . . . . . . . . . . . . . . . . . 139,932 2,528,571HengTen Networks Group Ltd.(a)(b) . . . . . . . . . . . . . . . . . . . . 7,488,000 3,152,635JD Health International Inc.(a)(c). . . . . . . . . . . . . . . . . . . . . . . . 819,000 7,077,933JD.com Inc., ADR(a). . . . . . . . . . . . . . . . . . . . . . . . . . . . . . . . . . . 2,017,548 169,695,963Meituan, Class B(a)(c) . . . . . . . . . . . . . . . . . . . . . . . . . . . . . . . . . 9,500,400 288,757,921Pinduoduo Inc., ADR(a)(b). . . . . . . . . . . . . . . . . . . . . . . . . . . . . . 1,018,368 67,721,472Vipshop Holdings Ltd., ADR(a) . . . . . . . . . . . . . . . . . . . . . . . . . 1,038,960 10,150,639
1,111,794,135IT Services — 0.6%Beijing Sinnet Technology Co. Ltd., Class A . . . . . . . . . . . . 468,096 1,085,734China TransInfo Technology Co. Ltd., Class A . . . . . . . . . . 468,047 1,083,563Chinasoft International Ltd. . . . . . . . . . . . . . . . . . . . . . . . . . . . . 5,616,000 9,337,580Chindata Group Holdings Ltd., ADR(a) . . . . . . . . . . . . . . . . . 212,472 2,009,985DHC Software Co. Ltd., Class A . . . . . . . . . . . . . . . . . . . . . . . 842,428 958,768GDS Holdings Ltd., ADR(a)(b) . . . . . . . . . . . . . . . . . . . . . . . . . . 206,856 11,592,210Kingsoft Cloud Holdings Ltd., ADR(a)(b). . . . . . . . . . . . . . . . . 131,040 2,264,371TravelSky Technology Ltd., Class H . . . . . . . . . . . . . . . . . . . 2,411,000 3,982,300Vnet Group Inc., ADR(a)(b) . . . . . . . . . . . . . . . . . . . . . . . . . . . . . 226,980 2,206,246
34,520,757Life Sciences Tools & Services — 2.8%Genscript Biotech Corp.(a). . . . . . . . . . . . . . . . . . . . . . . . . . . . . 2,858,000 15,017,327Hangzhou Tigermed Consulting Co. Ltd., Class A . . . . . . 46,837 1,014,378Hangzhou Tigermed Consulting Co. Ltd., Class H(c) . . . . 300,700 4,763,177Pharmaron Beijing Co. Ltd., Class A . . . . . . . . . . . . . . . . . . . 94,100 2,684,927Pharmaron Beijing Co. Ltd., Class H(c) . . . . . . . . . . . . . . . . . 327,600 6,758,827WuXi AppTec Co. Ltd., Class A . . . . . . . . . . . . . . . . . . . . . . . . 392,164 8,875,424WuXi AppTec Co. Ltd., Class H(c) . . . . . . . . . . . . . . . . . . . . . . 748,881 16,591,552
Security Shares
Value
Life Sciences Tools & Services (continued)Wuxi Biologics Cayman Inc., New(a)(c) . . . . . . . . . . . . . . . . . 8,424,000 $ 113,637,934
169,343,546Machinery — 0.9%China CSSC Holdings Ltd., Class A . . . . . . . . . . . . . . . . . . . 748,800 2,817,197CRRC Corp. Ltd., Class A. . . . . . . . . . . . . . . . . . . . . . . . . . . . . 3,480,000 3,333,036CRRC Corp. Ltd., Class H . . . . . . . . . . . . . . . . . . . . . . . . . . . . 7,488,000 3,322,452Haitian International Holdings Ltd. . . . . . . . . . . . . . . . . . . . . . 1,404,000 3,878,206Hefei Meiya Optoelectronic Technology Inc., Class A . . . 135,423 828,337Jiangsu Hengli Hydraulic Co. Ltd., Class A . . . . . . . . . . . . . 205,004 2,539,784North Industries Group Red Arrow Co. Ltd.,
Class A, NVS(a) . . . . . . . . . . . . . . . . . . . . . . . . . . . . . . . . . . . . 187,200 889,174Sany Heavy Equipment International Holdings Co. Ltd. . 2,808,000 2,915,209Sany Heavy Industry Co. Ltd., Class A . . . . . . . . . . . . . . . . . 1,215,593 4,189,348Shenzhen Inovance Technology Co. Ltd., Class A . . . . . . 374,430 3,871,636Sinotruk Hong Kong Ltd. . . . . . . . . . . . . . . . . . . . . . . . . . . . . . . 1,638,000 2,423,983Weichai Power Co. Ltd., Class A . . . . . . . . . . . . . . . . . . . . . . 936,068 2,273,380Weichai Power Co. Ltd., Class H . . . . . . . . . . . . . . . . . . . . . . 4,680,000 8,300,215Wuxi Shangji Automation Co. Ltd., Class A. . . . . . . . . . . . . 47,400 1,657,581XCMG Construction Machinery Co. Ltd., Class A . . . . . . . 1,459,599 1,358,493Yutong Bus Co. Ltd., Class A . . . . . . . . . . . . . . . . . . . . . . . . . . 514,899 892,874Zhejiang Dingli Machinery Co. Ltd., Class A . . . . . . . . . . . . 111,005 1,440,467Zhejiang Sanhua Intelligent Controls Co. Ltd., Class A. . 608,487 2,228,308Zoomlion Heavy Industry Science and Technology Co.
Ltd., Class A . . . . . . . . . . . . . . . . . . . . . . . . . . . . . . . . . . . . . . . 1,123,216 1,236,354Zoomlion Heavy Industry Science and Technology Co.
Ltd., Class H. . . . . . . . . . . . . . . . . . . . . . . . . . . . . . . . . . . . . . . 3,088,800 2,023,517
52,419,551Marine — 0.3%COSCO SHIPPING Holdings Co. Ltd., Class A(a) . . . . . . . 1,825,200 4,961,537COSCO SHIPPING Holdings Co. Ltd., Class H(a)(b). . . . . 7,722,100 13,160,977
18,122,514Media — 0.1%China Literature Ltd.(a)(c) . . . . . . . . . . . . . . . . . . . . . . . . . . . . . . 936,000 6,534,057Focus Media Information Technology Co. Ltd., Class A . 2,199,638 2,451,939
8,985,996Metals & Mining — 1.6%Aluminum Corp. of China Ltd., Class A(a). . . . . . . . . . . . . . . 2,199,600 1,800,781Aluminum Corp. of China Ltd., Class H(a) . . . . . . . . . . . . . . 9,360,000 4,569,476Baoshan Iron & Steel Co. Ltd., Class A . . . . . . . . . . . . . . . . 3,369,677 3,425,205Chengtun Mining Group Co. Ltd., Class A . . . . . . . . . . . . . . 421,200 767,442China Hongqiao Group Ltd. . . . . . . . . . . . . . . . . . . . . . . . . . . . 5,382,000 5,209,880China Minmetals Rare Earth Co. Ltd., Class A. . . . . . . . . . 140,400 982,238China Molybdenum Co. Ltd., Class A . . . . . . . . . . . . . . . . . . 2,948,400 2,728,712China Molybdenum Co. Ltd., Class H . . . . . . . . . . . . . . . . . . 7,020,000 4,306,684China Northern Rare Earth Group High-Tech Co. Ltd.,
Class A . . . . . . . . . . . . . . . . . . . . . . . . . . . . . . . . . . . . . . . . . . . . 514,800 4,333,974Ganfeng Lithium Co. Ltd., Class A . . . . . . . . . . . . . . . . . . . . . 162,195 4,315,565Ganfeng Lithium Co. Ltd., Class H(c) . . . . . . . . . . . . . . . . . . . 602,600 11,646,637GEM Co. Ltd., Class A . . . . . . . . . . . . . . . . . . . . . . . . . . . . . . . . 842,400 1,496,757Hunan Valin Steel Co. Ltd., Class A. . . . . . . . . . . . . . . . . . . . 1,024,700 803,421Inner Mongolia BaoTou Steel Union Co. Ltd., Class A(a). 6,879,692 3,109,344Jiangxi Copper Co. Ltd., Class A . . . . . . . . . . . . . . . . . . . . . . 93,600 335,058Jiangxi Copper Co. Ltd., Class H . . . . . . . . . . . . . . . . . . . . . . 2,808,000 4,512,429MMG Ltd.(a) . . . . . . . . . . . . . . . . . . . . . . . . . . . . . . . . . . . . . . . . . . 7,488,000 2,711,974Shandong Gold Mining Co. Ltd., Class A. . . . . . . . . . . . . . . 421,291 1,268,216Shandong Gold Mining Co. Ltd., Class H(b)(c). . . . . . . . . . . 1,989,000 3,583,674Shandong Nanshan Aluminum Co. Ltd., Class A . . . . . . . 2,052,100 1,416,223Shanxi Meijin Energy Co. Ltd., Class A(a) . . . . . . . . . . . . . . 702,000 1,488,805Shanxi Taigang Stainless Steel Co. Ltd., Class A . . . . . . . 1,076,400 1,201,872
Schedule of Investments (unaudited) (continued)
November 30, 2021
iShares� MSCI China ETF(Percentages shown are based on Net Assets)
78 NM0122U-1995964-80/159

Security Shares
Value
Metals & Mining (continued)Shenghe Resources Holding Co. Ltd., Class A . . . . . . . . . 234,000 $ 820,737Tianshan Aluminum Group Co. Ltd., Class A . . . . . . . . . . . 655,200 841,834Tongling Nonferrous Metals Group Co. Ltd., Class A. . . . 2,714,400 1,463,377Western Superconducting Technologies Co. Ltd.,
Class A . . . . . . . . . . . . . . . . . . . . . . . . . . . . . . . . . . . . . . . . . . . . 66,456 1,013,568YongXing Special Materials Technology Co. Ltd.,
Class A . . . . . . . . . . . . . . . . . . . . . . . . . . . . . . . . . . . . . . . . . . . . 46,800 1,064,054Yunnan Aluminium Co. Ltd., Class A(a) . . . . . . . . . . . . . . . . . 511,000 858,724Yunnan Tin Co. Ltd., Class A(a) . . . . . . . . . . . . . . . . . . . . . . . . 280,800 817,282Zhejiang Huayou Cobalt Co. Ltd., Class A. . . . . . . . . . . . . . 174,598 3,567,501Zijin Mining Group Co. Ltd., Class A . . . . . . . . . . . . . . . . . . . 3,182,400 5,110,185Zijin Mining Group Co. Ltd., Class H . . . . . . . . . . . . . . . . . . . 13,104,000 17,388,354
98,959,983Oil, Gas & Consumable Fuels — 1.4%China Coal Energy Co. Ltd., Class H . . . . . . . . . . . . . . . . . . 4,680,000 2,352,603China Merchants Energy Shipping Co. Ltd., Class A . . . . 1,404,115 963,832China Petroleum & Chemical Corp., Class A . . . . . . . . . . . 4,539,888 2,869,801China Petroleum & Chemical Corp., Class H . . . . . . . . . . . 56,161,000 24,481,097China Shenhua Energy Co. Ltd., Class A . . . . . . . . . . . . . . 842,405 2,588,568China Shenhua Energy Co. Ltd., Class H . . . . . . . . . . . . . . 7,956,000 16,483,486China Suntien Green Energy Corp. Ltd., Class H . . . . . . . 3,744,000 2,626,273PetroChina Co. Ltd., Class A . . . . . . . . . . . . . . . . . . . . . . . . . . 2,993,991 2,208,718PetroChina Co. Ltd., Class H . . . . . . . . . . . . . . . . . . . . . . . . . . 49,608,000 21,480,678Shaanxi Coal Industry Co. Ltd., Class A. . . . . . . . . . . . . . . . 1,638,088 3,064,636Shanxi Lu'an Environmental Energy Development Co.
Ltd., Class A . . . . . . . . . . . . . . . . . . . . . . . . . . . . . . . . . . . . . . . 514,800 872,760Yanzhou Coal Mining Co. Ltd., Class A . . . . . . . . . . . . . . . . 374,403 1,344,595Yanzhou Coal Mining Co. Ltd., Class H(b) . . . . . . . . . . . . . . 3,744,000 5,861,985
87,199,032Paper & Forest Products — 0.1%Chengxin Lithium Group Co Ltd., Class A, NVS(a) . . . . . . 46,800 440,985Lee & Man Paper Manufacturing Ltd. . . . . . . . . . . . . . . . . . . 3,276,000 2,248,478Nine Dragons Paper Holdings Ltd.. . . . . . . . . . . . . . . . . . . . . 3,744,000 4,176,210
6,865,673Personal Products — 0.1%By-Health Co. Ltd., Class A . . . . . . . . . . . . . . . . . . . . . . . . . . . 280,800 1,040,928Hengan International Group Co. Ltd.. . . . . . . . . . . . . . . . . . . 1,404,000 6,780,338Shanghai Jahwa United Co. Ltd., Class A . . . . . . . . . . . . . . 93,581 615,970
8,437,236Pharmaceuticals — 1.8%Apeloa Pharmaceutical Co. Ltd., Class A. . . . . . . . . . . . . . . 93,600 607,485Asymchem Laboratories Tianjin Co. Ltd., Class A . . . . . . 37,300 3,017,803Betta Pharmaceuticals Co. Ltd., Class A . . . . . . . . . . . . . . . 80,998 1,059,682CanSino Biologics Inc., Class H(a)(b)(c) . . . . . . . . . . . . . . . . . 187,200 4,109,997Changchun High & New Technology Industry
Group Inc., Class A . . . . . . . . . . . . . . . . . . . . . . . . . . . . . . . . 56,696 2,521,591China Medical System Holdings Ltd. . . . . . . . . . . . . . . . . . . . 3,276,000 5,365,410China Resources Sanjiu Medical & Pharmaceutical Co.
Ltd., Class A . . . . . . . . . . . . . . . . . . . . . . . . . . . . . . . . . . . . . . . 280,894 1,077,075China Traditional Chinese Medicine Holdings Co. Ltd. . . 6,552,000 3,159,210CSPC Pharmaceutical Group Ltd. . . . . . . . . . . . . . . . . . . . . . 20,592,400 21,349,330Dong-E-E-Jiao Co. Ltd., Class A. . . . . . . . . . . . . . . . . . . . . . . 140,788 908,336Guangzhou Baiyunshan Pharmaceutical Holdings Co.
Ltd., Class A . . . . . . . . . . . . . . . . . . . . . . . . . . . . . . . . . . . . . . . 374,495 1,727,167Hansoh Pharmaceutical Group Co. Ltd.(c) . . . . . . . . . . . . . . 2,808,000 5,755,784Humanwell Healthcare Group Co. Ltd., Class A . . . . . . . . 187,500 628,029Hutchmed China Ltd., ADR(a)(b). . . . . . . . . . . . . . . . . . . . . . . . 200,772 6,798,140Jiangsu Hengrui Medicine Co. Ltd., Class A . . . . . . . . . . . . 889,290 7,024,406
Security Shares
Value
Pharmaceuticals (continued)Joincare Pharmaceutical Group Industry Co. Ltd.,
Class A . . . . . . . . . . . . . . . . . . . . . . . . . . . . . . . . . . . . . . . . . . . . 410,962 $ 772,158Nanjing King-Friend Biochemical Pharmaceutical Co.
Ltd., Class A . . . . . . . . . . . . . . . . . . . . . . . . . . . . . . . . . . . . . . . 180,174 1,177,784Shanghai Fosun Pharmaceutical Group Co. Ltd.,
Class A . . . . . . . . . . . . . . . . . . . . . . . . . . . . . . . . . . . . . . . . . . . . 280,884 2,465,326Shanghai Fosun Pharmaceutical Group Co. Ltd.,
Class H. . . . . . . . . . . . . . . . . . . . . . . . . . . . . . . . . . . . . . . . . . . . 1,170,000 6,045,407Shenzhen Salubris Pharmaceuticals Co. Ltd.,
Class A(a) . . . . . . . . . . . . . . . . . . . . . . . . . . . . . . . . . . . . . . . . . . 187,200 831,191Shijiazhuang Yiling Pharmaceutical Co. Ltd., Class A . . . 260,640 702,109Sichuan Kelun Pharmaceutical Co. Ltd., Class A . . . . . . . 280,865 836,761Sino Biopharmaceutical Ltd.. . . . . . . . . . . . . . . . . . . . . . . . . . . 24,336,000 17,790,665Yunnan Baiyao Group Co. Ltd., Class A. . . . . . . . . . . . . . . . 187,232 2,599,666Zhangzhou Pientzehuang Pharmaceutical Co. Ltd.,
Class A . . . . . . . . . . . . . . . . . . . . . . . . . . . . . . . . . . . . . . . . . . . . 93,709 6,591,467Zhejiang Huahai Pharmaceutical Co. Ltd., Class A . . . . . 234,046 792,883Zhejiang NHU Co. Ltd., Class A . . . . . . . . . . . . . . . . . . . . . . . 468,095 2,130,300Zhejiang Wolwo Bio-Pharmaceutical Co. Ltd., Class A . . 84,706 745,891
108,591,053Professional Services — 0.1%51job Inc., ADR(a). . . . . . . . . . . . . . . . . . . . . . . . . . . . . . . . . . . . . 70,668 4,077,544
Real Estate Management & Development — 4.0%Agile Group Holdings Ltd. . . . . . . . . . . . . . . . . . . . . . . . . . . . . . 2,808,000 1,846,888A-Living Smart City Services Co. Ltd., Class A(c) . . . . . . . 1,287,000 3,023,652China Evergrande Group(b). . . . . . . . . . . . . . . . . . . . . . . . . . . . 4,500,000 1,321,493China Jinmao Holdings Group Ltd. . . . . . . . . . . . . . . . . . . . . 13,104,000 3,998,357China Merchants Shekou Industrial Zone Holdings Co.
Ltd., Class A . . . . . . . . . . . . . . . . . . . . . . . . . . . . . . . . . . . . . . . 1,450,833 2,609,239China Overseas Land & Investment Ltd. . . . . . . . . . . . . . . . 8,892,000 20,442,316China Overseas Property Holdings Ltd. . . . . . . . . . . . . . . . . 2,340,000 2,187,623China Resources Land Ltd. . . . . . . . . . . . . . . . . . . . . . . . . . . . 7,648,665 31,953,941China Resources Mixc Lifestyle Services Ltd.(c) . . . . . . . . 1,310,400 6,465,518China Vanke Co. Ltd., Class A. . . . . . . . . . . . . . . . . . . . . . . . . 1,404,009 4,017,678China Vanke Co. Ltd., Class H . . . . . . . . . . . . . . . . . . . . . . . . 3,837,631 8,706,297CIFI Ever Sunshine Services Group Ltd. . . . . . . . . . . . . . . . 1,506,000 2,533,795CIFI Holdings Group Co. Ltd.. . . . . . . . . . . . . . . . . . . . . . . . . . 7,488,000 4,081,046Country Garden Holdings Co. Ltd.(b) . . . . . . . . . . . . . . . . . . . 17,784,727 15,673,991Country Garden Services Holdings Co. Ltd. . . . . . . . . . . . . 4,055,000 24,584,073Gemdale Corp., Class A . . . . . . . . . . . . . . . . . . . . . . . . . . . . . . 796,697 1,251,389Greenland Holdings Corp. Ltd., Class A. . . . . . . . . . . . . . . . 1,521,925 979,436Greentown China Holdings Ltd.(b) . . . . . . . . . . . . . . . . . . . . . 2,106,000 3,116,687Greentown Service Group Co. Ltd. . . . . . . . . . . . . . . . . . . . . 3,744,000 3,591,321Guangzhou R&F Properties Co. Ltd., Class H(b) . . . . . . . . 4,118,400 2,229,034Hopson Development Holdings Ltd. . . . . . . . . . . . . . . . . . . . 1,684,800 4,076,728Jinke Properties Group Co. Ltd., Class A. . . . . . . . . . . . . . . 984,081 635,280KE Holdings Inc., ADR(a)(b) . . . . . . . . . . . . . . . . . . . . . . . . . . . . 839,592 16,800,236KWG Group Holdings Ltd.. . . . . . . . . . . . . . . . . . . . . . . . . . . . . 3,042,000 2,255,793Logan Group Co. Ltd. . . . . . . . . . . . . . . . . . . . . . . . . . . . . . . . . . 3,276,000 3,163,411Longfor Group Holdings Ltd.(c). . . . . . . . . . . . . . . . . . . . . . . . . 4,212,000 19,993,378Poly Developments and Holdings Group Co. Ltd.,
Class A . . . . . . . . . . . . . . . . . . . . . . . . . . . . . . . . . . . . . . . . . . . . 1,825,275 3,969,372Powerlong Real Estate Holdings Ltd. . . . . . . . . . . . . . . . . . . 3,276,000 1,973,373RiseSun Real Estate Development Co. Ltd., Class A . . . 1,450,830 942,848Seazen Group Ltd.(b). . . . . . . . . . . . . . . . . . . . . . . . . . . . . . . . . . 4,680,000 3,356,268Seazen Holdings Co. Ltd., Class A . . . . . . . . . . . . . . . . . . . . 327,664 1,603,517Shanghai Lujiazui Finance & Trade Zone Development
Co. Ltd., Class B . . . . . . . . . . . . . . . . . . . . . . . . . . . . . . . . . . . 3,135,694 2,840,939
Schedule of Investments (unaudited) (continued)
November 30, 2021
iShares� MSCI China ETF(Percentages shown are based on Net Assets)
79NM0122U-1995964-81/159

Security Shares
Value
Real Estate Management & Development (continued)Shanghai Zhangjiang High-Tech Park Development Co.
Ltd., Class A . . . . . . . . . . . . . . . . . . . . . . . . . . . . . . . . . . . . . . . 468,009 $ 1,091,666Shimao Group Holdings Ltd. . . . . . . . . . . . . . . . . . . . . . . . . . . 2,574,000 2,966,490Shimao Services Holdings Ltd.(c) . . . . . . . . . . . . . . . . . . . . . . 1,404,000 1,734,835Sunac China Holdings Ltd. . . . . . . . . . . . . . . . . . . . . . . . . . . . . 6,084,000 10,910,652Sunac Services Holdings Ltd.(a)(c) . . . . . . . . . . . . . . . . . . . . . 1,872,000 2,959,504Wharf Holdings Ltd. (The) . . . . . . . . . . . . . . . . . . . . . . . . . . . . . 3,276,000 11,447,935Yuexiu Property Co. Ltd. . . . . . . . . . . . . . . . . . . . . . . . . . . . . . . 3,744,600 3,495,360
240,831,359Road & Rail — 0.2%Beijing-Shanghai High Speed Railway Co. Ltd.,
Class A . . . . . . . . . . . . . . . . . . . . . . . . . . . . . . . . . . . . . . . . . . . . 5,756,400 4,086,964DiDi Global Inc., ADR(a)(b) . . . . . . . . . . . . . . . . . . . . . . . . . . . . . 704,808 5,377,685
9,464,649Semiconductors & Semiconductor Equipment — 1.6%Advanced Micro-Fabrication Equipment Inc., Class A(a) . 93,788 2,349,964Daqo New Energy Corp., ADR(a) . . . . . . . . . . . . . . . . . . . . . . 136,188 7,809,020Flat Glass Group Co. Ltd., Class A . . . . . . . . . . . . . . . . . . . . 187,200 1,347,901Flat Glass Group Co. Ltd., Class H(b) . . . . . . . . . . . . . . . . . . 936,000 4,081,970GCL System Integration Technology Co. Ltd.,
Class A(a) . . . . . . . . . . . . . . . . . . . . . . . . . . . . . . . . . . . . . . . . . . 1,029,645 697,591Gigadevice Semiconductor Beijing Inc., Class A . . . . . . . . 103,687 2,453,373Hangzhou First Applied Material Co. Ltd., Class A . . . . . . 140,800 2,688,309Hangzhou Silan Microelectronics Co. Ltd., Class A . . . . . 187,200 1,823,929Hua Hong Semiconductor Ltd.(a)(c). . . . . . . . . . . . . . . . . . . . . 1,217,000 8,108,297Ingenic Semiconductor Co. Ltd., Class A. . . . . . . . . . . . . . . 94,000 1,997,854JA Solar Technology Co. Ltd., Class A . . . . . . . . . . . . . . . . . 234,050 3,200,184JCET Group Co. Ltd., Class A . . . . . . . . . . . . . . . . . . . . . . . . . 280,900 1,460,953LONGi Green Energy Technology Co. Ltd., Class A . . . . 748,825 10,371,080Montage Technology Co. Ltd., Class A . . . . . . . . . . . . . . . . . 93,600 1,210,118National Silicon Industry Group Co. Ltd., Class A(a) . . . . . 269,168 1,250,501NAURA Technology Group Co. Ltd., Class A . . . . . . . . . . . 69,200 4,203,285Sanan Optoelectronics Co. Ltd., Class A . . . . . . . . . . . . . . . 655,260 3,616,097SG Micro Corp., Class A . . . . . . . . . . . . . . . . . . . . . . . . . . . . . . 43,400 2,333,443Shenzhen SC New Energy Technology Corp., Class A. . 46,800 897,034StarPower Semiconductor Ltd., Class A. . . . . . . . . . . . . . . . 22,000 1,643,860Tianjin Zhonghuan Semiconductor Co. Ltd., Class A. . . . 421,298 2,986,177Tianshui Huatian Technology Co. Ltd., Class A . . . . . . . . . 514,829 1,115,261TongFu Microelectronics Co. Ltd., Class A . . . . . . . . . . . . . 273,296 935,073Unigroup Guoxin Microelectronics Co. Ltd., Class A . . . . 83,200 3,009,277Will Semiconductor Co. Ltd. Shanghai, Class A . . . . . . . . 140,400 6,028,553Xinyi Solar Holdings Ltd. . . . . . . . . . . . . . . . . . . . . . . . . . . . . . . 11,232,000 20,654,376Zhejiang Jingsheng Mechanical & Electrical Co. Ltd.,
Class A . . . . . . . . . . . . . . . . . . . . . . . . . . . . . . . . . . . . . . . . . . . . 187,228 2,115,475
100,388,955Software — 0.9%360 Security Technology Inc., Class A(a) . . . . . . . . . . . . . . . 1,123,200 2,108,491Agora Inc., ADR(a)(b) . . . . . . . . . . . . . . . . . . . . . . . . . . . . . . . . . . 117,000 2,445,300Beijing E-Hualu Information Technology Co. Ltd.,
Class A(a) . . . . . . . . . . . . . . . . . . . . . . . . . . . . . . . . . . . . . . . . . . 156,520 815,611Beijing Kingsoft Office Software Inc., Class A. . . . . . . . . . . 51,052 2,151,269Beijing Shiji Information Technology Co. Ltd., Class A. . . 196,204 874,520China National Software & Service Co. Ltd., Class A . . . 93,600 759,047China Youzan Ltd.(a) . . . . . . . . . . . . . . . . . . . . . . . . . . . . . . . . . . 33,696,000 3,002,427Hundsun Technologies Inc., Class A . . . . . . . . . . . . . . . . . . . 229,474 2,112,746Iflytek Co. Ltd., Class A . . . . . . . . . . . . . . . . . . . . . . . . . . . . . . . 318,559 2,697,772Kingdee International Software Group Co. Ltd.(a) . . . . . . . 6,084,000 18,260,220Ming Yuan Cloud Group Holdings Ltd. . . . . . . . . . . . . . . . . . 1,404,000 4,002,061Sangfor Technologies Inc., Class A . . . . . . . . . . . . . . . . . . . . 58,200 1,807,107
Security Shares
Value
Software (continued)Shanghai Baosight Software Co. Ltd., Class A . . . . . . . . . 180,180 $ 1,876,121Shanghai Baosight Software Co. Ltd., Class B . . . . . . . . . 608,350 2,963,273Thunder Software Technology Co. Ltd., Class A . . . . . . . . 93,600 2,301,211Weimob Inc.(a)(b)(c) . . . . . . . . . . . . . . . . . . . . . . . . . . . . . . . . . . . . 4,212,000 5,059,997Yonyou Network Technology Co. Ltd., Class A. . . . . . . . . . 514,812 2,631,389
55,868,562Specialty Retail — 0.6%China Meidong Auto Holdings Ltd. . . . . . . . . . . . . . . . . . . . . . 1,310,000 6,333,605China Tourism Group Duty Free Corp. Ltd., Class A . . . . 280,889 9,076,242GOME Retail Holdings Ltd.(a)(b). . . . . . . . . . . . . . . . . . . . . . . . 29,016,000 2,523,655Suning.com Co. Ltd., Class A(a) . . . . . . . . . . . . . . . . . . . . . . . 2,012,471 1,216,997Topsports International Holdings Ltd.(c) . . . . . . . . . . . . . . . . 3,744,000 4,353,426Zhongsheng Group Holdings Ltd.. . . . . . . . . . . . . . . . . . . . . . 1,404,000 11,499,916
35,003,841Technology Hardware, Storage & Peripherals — 1.7%China Greatwall Technology Group Co. Ltd., Class A . . . 468,000 1,033,869Inspur Electronic Information Industry Co. Ltd., Class A . 248,280 1,267,538Lenovo Group Ltd. . . . . . . . . . . . . . . . . . . . . . . . . . . . . . . . . . . . . 16,848,000 17,252,503Ninestar Corp., Class A . . . . . . . . . . . . . . . . . . . . . . . . . . . . . . . 280,826 1,938,903Shenzhen Transsion Holding Co. Ltd., Class A . . . . . . . . . 76,949 2,021,837Xiaomi Corp., Class B(a)(c). . . . . . . . . . . . . . . . . . . . . . . . . . . . . 33,228,000 82,653,031
106,167,681Textiles, Apparel & Luxury Goods — 2.3%ANTA Sports Products Ltd. . . . . . . . . . . . . . . . . . . . . . . . . . . . . 2,566,200 40,978,957Bosideng International Holdings Ltd.(b) . . . . . . . . . . . . . . . . . 7,488,000 5,269,479Li Ning Co. Ltd. . . . . . . . . . . . . . . . . . . . . . . . . . . . . . . . . . . . . . . . 5,148,000 58,226,911Shenzhou International Group Holdings Ltd. . . . . . . . . . . . 1,918,800 36,030,930SuZhou TA&A Ultra Clean Technology Co. Ltd.,
Class A . . . . . . . . . . . . . . . . . . . . . . . . . . . . . . . . . . . . . . . . . . . . 93,600 1,646,619
142,152,896Tobacco — 0.5%RLX Technology Inc., ADR(a) . . . . . . . . . . . . . . . . . . . . . . . . . . 1,436,292 5,903,160Smoore International Holdings Ltd.(c) . . . . . . . . . . . . . . . . . . 4,212,000 25,109,038
31,012,198Trading Companies & Distributors — 0.1%Beijing United Information Technology Co. Ltd.,
Class A . . . . . . . . . . . . . . . . . . . . . . . . . . . . . . . . . . . . . . . . . . . . 93,600 1,752,594BOC Aviation Ltd.(c) . . . . . . . . . . . . . . . . . . . . . . . . . . . . . . . . . . . 514,800 3,625,720COSCO SHIPPING Development Co. Ltd., Class A . . . . 889,200 451,130
5,829,444Transportation Infrastructure — 0.4%Beijing Capital International Airport Co. Ltd., Class H(a) . 4,680,000 2,716,548China Merchants Port Holdings Co. Ltd. . . . . . . . . . . . . . . . 3,744,000 5,761,257COSCO SHIPPING Ports Ltd. . . . . . . . . . . . . . . . . . . . . . . . . . 4,680,000 3,677,832Jiangsu Expressway Co. Ltd., Class H . . . . . . . . . . . . . . . . . 2,808,000 2,730,649Shanghai International Airport Co. Ltd., Class A(a) . . . . . . 187,499 1,270,165Shanghai International Port Group Co. Ltd., Class A . . . . 2,246,477 1,690,808Shenzhen International Holdings Ltd. . . . . . . . . . . . . . . . . . . 2,808,000 3,062,695Zhejiang Expressway Co. Ltd., Class H . . . . . . . . . . . . . . . . 2,808,000 2,646,679
23,556,633Water Utilities — 0.2%Beijing Enterprises Water Group Ltd.(b) . . . . . . . . . . . . . . . . 11,232,000 4,178,074Guangdong Investment Ltd. . . . . . . . . . . . . . . . . . . . . . . . . . . . 6,552,000 8,721,436
12,899,510
Schedule of Investments (unaudited) (continued)
November 30, 2021
iShares� MSCI China ETF(Percentages shown are based on Net Assets)
80 NM0122U-1995964-82/159

Security Shares
Value
Wireless Telecommunication Services — 0.0%China United Network Communications Ltd., Class A . . . 4,454,400 $ 2,722,366
Total Common Stocks — 99.9%(Cost: $5,519,304,281). . . . . . . . . . . . . . . . . . . . . . . . . . . . . . . . . . . . . . . . . . . 6,083,363,065
RightsReal Estate Management & Development — 0.0%CIFI Holdings Group Co. Ltd., (Expires 12/20/21)(a). . . . . 374,400 12,003
Total Rights — 0.0%(Cost: $0) . . . . . . . . . . . . . . . . . . . . . . . . . . . . . . . . . . . . . . . . . . . . . . . . . . . . . . . 12,003
Short-Term InvestmentsMoney Market Funds — 2.6%BlackRock Cash Funds: Institutional, SL Agency
Shares, 0.06%(e)(f)(g) . . . . . . . . . . . . . . . . . . . . . . . . . . . . . . . 156,937,177 156,999,952BlackRock Cash Funds: Treasury, SL Agency Shares,
0.00%(e)(f) . . . . . . . . . . . . . . . . . . . . . . . . . . . . . . . . . . . . . . . . . 4,980,000 4,980,000
161,979,952
Total Short-Term Investments — 2.6%(Cost: $161,885,525) . . . . . . . . . . . . . . . . . . . . . . . . . . . . . . . . . . . . . . . . . . . . 161,979,952
Total Investments in Securities — 102.5%(Cost: $5,681,189,806). . . . . . . . . . . . . . . . . . . . . . . . . . . . . . . . . . . . . . . . . . . 6,245,355,020
Other Assets, Less Liabilities — (2.5)% . . . . . . . . . . . . . . . . . . . . . . . . . . . . (153,983,554)
Net Assets — 100.0% . . . . . . . . . . . . . . . . . . . . . . . . . . . . . . . . . . . . . . . . . . . . . . $ 6,091,371,466
(a) Non-income producing security.(b) All or a portion of this security is on loan.(c) Security exempt from registration pursuant to Rule 144A under the Securities Act of
1933, as amended. These securities may be resold in transactions exempt fromregistration to qualified institutional investors.
(d) Security is valued using significant unobservable inputs and is classified as Level 3 in thefair value hierarchy.
(e) Affiliate of the Fund.(f) Annualized 7-day yield as of period end.(g) All or a portion of this security was purchased with the cash collateral from loaned
securities.
Affiliates
Investments in issuers considered to be affiliate(s) of the Fund during the period ended November 30, 2021 for purposes of Section 2(a)(3) of the Investment Company Actof 1940, as amended, were as follows:
Affiliated IssuerValue at
08/31/21Purchases
at CostProceeds
from SalesNet Realized
Gain (Loss)
Change inUnrealized
Appreciation(Depreciation)
Value at11/30/21
SharesHeld at
11/30/21 Income
CapitalGain
Distributionsfrom
UnderlyingFunds
BlackRock Cash Funds: Institutional, SLAgency Shares. . . . . . . . . . . . . . . . . . . . . . . $148,079,490 $8,941,675(a) $ — $ (8,713) $ (12,500) $156,999,952 156,937,177 $447,318(b) $ —
BlackRock Cash Funds: Treasury, SLAgency Shares. . . . . . . . . . . . . . . . . . . . . . . 6,820,000 — (1,840,000)(a)
— — 4,980,000 4,980,000 133 —
$ (8,713) $ (12,500) $161,979,952 $447,451 $ —
(a) Represents net amount purchased (sold).(b) All or a portion represents securities lending income earned from the reinvestment of cash collateral from loaned securities, net of fees and collateral investment expenses, and other
payments to and from borrowers of securities.
Schedule of Investments (unaudited) (continued)
November 30, 2021
iShares� MSCI China ETF(Percentages shown are based on Net Assets)
81NM0122U-1995964-83/159

Derivative Financial Instruments Outstanding as of Period End
Futures Contracts
DescriptionNumber ofContracts
ExpirationDate
NotionalAmount
(000)
Value/Unrealized
Appreciation(Depreciation)
Long ContractsMSCI China Free Index. . . . . . . . . . . . . . . . . . . . . . . . . . . . . . . . . . . . . . . . . . . . . . . . . . . . . . . . . . . . . . . . . . . . . . . . . . . . . . . . . . . . . . . . . . . . . . 124 12/17/21 $ 5,874 $ (698,343)
Fair Value Measurements
Various inputs are used in determining the fair value of financial instruments. These inputs to valuation techniques are categorized into a fair value hierarchy consisting ofthree broad levels for financial reporting purposes as follows:
• Level 1 – Unadjusted price quotations in active markets/exchanges for identical assets or liabilities that each Fund has the ability to access;• Level 2 – Other observable inputs (including, but not limited to, quoted prices for similar assets or liabilities in markets that are active, quoted prices for identical or
similar assets or liabilities in markets that are not active, inputs other than quoted prices that are observable for the assets or liabilities (such as interest rates, yieldcurves, volatilities, prepayment speeds, loss severities, credit risks and default rates) or other market-corroborated inputs); and
• Level 3 – Unobservable inputs based on the best information available in the circumstances, to the extent observable inputs are not available (including the BlackRockGlobal Valuation Methodologies Committee’s (the “Global Valuation Committee’s”) assumptions used in determining the fair value of financial instruments).
The hierarchy gives the highest priority to unadjusted quoted prices in active markets for identical assets or liabilities (Level 1 measurements) and the lowest priority tounobservable inputs (Level 3 measurements). Accordingly, the degree of judgment exercised in determining fair value is greatest for instruments categorized in Level 3. Theinputs used to measure fair value may fall into different levels of the fair value hierarchy. In such cases, for disclosure purposes, the fair value hierarchy classification isdetermined based on the lowest level input that is significant to the fair value measurement in its entirety. Investments classified within Level 3 have significant unobservableinputs used by the Global Valuation Committee in determining the price for Fair Valued Investments. Level 3 investments include equity or debt issued by privately heldcompanies or funds. There may not be a secondary market, and/or there are a limited number of investors. The categorization of a value determined for financial instrumentsis based on the pricing transparency of the financial instruments and is not necessarily an indication of the risks associated with investing in those securities. For informationabout the Fund’s policy regarding valuation of financial instruments, refer to its most recent financial statements.
The following table summarizes the Fund’s financial instruments categorized in the fair value hierarchy. The breakdown of the Fund’s financial instruments into majorcategories is disclosed in the Schedule of Investments above.
Level 1 Level 2 Level 3 Total
InvestmentsAssets
Common Stocks . . . . . . . . . . . . . . . . . . . . . . . . . . . . . . . . . . . . . . . . . . . . . . . . . . . . . . . . . . . . . . . . . . . . . . . . . . . . $1,148,433,367 $4,932,928,414 $ 2,001,284 $6,083,363,065Rights . . . . . . . . . . . . . . . . . . . . . . . . . . . . . . . . . . . . . . . . . . . . . . . . . . . . . . . . . . . . . . . . . . . . . . . . . . . . . . . . . . . . . . — 12,003 — 12,003Money Market Funds. . . . . . . . . . . . . . . . . . . . . . . . . . . . . . . . . . . . . . . . . . . . . . . . . . . . . . . . . . . . . . . . . . . . . . . . 161,979,952 — — 161,979,952
$1,310,413,319 $4,932,940,417 $ 2,001,284 $6,245,355,020
Derivative financial instruments(a)
LiabilitiesFutures Contracts. . . . . . . . . . . . . . . . . . . . . . . . . . . . . . . . . . . . . . . . . . . . . . . . . . . . . . . . . . . . . . . . . . . . . . . . . . . $ — $ (698,343) $ — $ (698,343)
(a) Derivative financial instruments are futures contracts. Futures contracts are valued at the unrealized appreciation (depreciation) on the instrument.
Portfolio Abbreviations - Equity
ADR . . . . . . . . . . . . . American Depositary ReceiptJSC. . . . . . . . . . . . . . Joint Stock CompanyNVS . . . . . . . . . . . . . Non-Voting Shares
Schedule of Investments (unaudited) (continued)
November 30, 2021
iShares� MSCI China ETF
82 NM0122U-1995964-84/159

Security Shares
Value
Common StocksAerospace & Defense — 0.5%EHang Holdings Ltd., ADR(a)(b) . . . . . . . . . . . . . . . . . . . . . . . . . . . 17,888 $ 378,331
Air Freight & Logistics — 0.2%BEST Inc., ADR(a)(b) . . . . . . . . . . . . . . . . . . . . . . . . . . . . . . . . . . . . . 154,816 161,009
Auto Components — 2.4%Huazhong In-Vehicle Holdings Co. Ltd. . . . . . . . . . . . . . . . . . . . 364,000 204,919Nexteer Automotive Group Ltd. . . . . . . . . . . . . . . . . . . . . . . . . . . . 704,000 910,157Prinx Chengshan Holdings Ltd.(b) . . . . . . . . . . . . . . . . . . . . . . . . . 112,000 89,192Tianneng Power International Ltd.(b) . . . . . . . . . . . . . . . . . . . . . . 534,000 588,879Wuling Motors Holdings Ltd.(b). . . . . . . . . . . . . . . . . . . . . . . . . . . . 960,000 222,884
2,016,031Automobiles — 0.7%Niu Technologies, ADR(a)(b). . . . . . . . . . . . . . . . . . . . . . . . . . . . . . . 23,936 486,858Qingling Motors Co. Ltd., Class H . . . . . . . . . . . . . . . . . . . . . . . . 576,000 115,783
602,641Beverages — 0.3%China Foods Ltd. . . . . . . . . . . . . . . . . . . . . . . . . . . . . . . . . . . . . . . . . 704,000 261,942China Huiyuan Juice Group Ltd.(c) . . . . . . . . . . . . . . . . . . . . . . . . 81,000 —
261,942Biotechnology — 4.9%Alphamab Oncology(a)(d) . . . . . . . . . . . . . . . . . . . . . . . . . . . . . . . . . 296,000 718,018Ascentage Pharma Group International(a)(b)(d) . . . . . . . . . . . . . 115,200 478,963Beyondspring Inc.(a)(b) . . . . . . . . . . . . . . . . . . . . . . . . . . . . . . . . . . . 17,088 218,214Burning Rock Biotech Ltd., ADR(a) . . . . . . . . . . . . . . . . . . . . . . . . 34,304 530,340CStone Pharmaceuticals(a)(d) . . . . . . . . . . . . . . . . . . . . . . . . . . . . . 368,000 490,035Essex Bio-Technology Ltd. . . . . . . . . . . . . . . . . . . . . . . . . . . . . . . . 224,000 158,276Everest Medicines Ltd.(a)(d) . . . . . . . . . . . . . . . . . . . . . . . . . . . . . . . 118,000 535,676Genetron Holdings Ltd., ADR(a)(b) . . . . . . . . . . . . . . . . . . . . . . . . . 14,208 128,440Genor Biopharma Holdings Ltd.(a)(b)(d) . . . . . . . . . . . . . . . . . . . . 128,000 139,793Immunotech Biopharm Ltd.(a)(b). . . . . . . . . . . . . . . . . . . . . . . . . . . 96,000 185,943JW Cayman Therapeutics Co. Ltd.(a)(b)(d). . . . . . . . . . . . . . . . . . 128,000 206,978Shanghai Henlius Biotech Inc.(a)(d) . . . . . . . . . . . . . . . . . . . . . . . . 64,000 248,269Untrade Cteg(c) . . . . . . . . . . . . . . . . . . . . . . . . . . . . . . . . . . . . . . . . . . 600,000 11,615
4,050,560Building Products — 0.5%China Fangda Group Co. Ltd., Class B(a) . . . . . . . . . . . . . . . . . 39,890 12,893Luoyang Glass Co. Ltd., Class H(a) . . . . . . . . . . . . . . . . . . . . . . . 192,000 394,085
406,978Capital Markets — 2.1%China Everbright Ltd. . . . . . . . . . . . . . . . . . . . . . . . . . . . . . . . . . . . . 734,000 790,664China Renaissance Holdings Ltd.(d). . . . . . . . . . . . . . . . . . . . . . . 131,200 272,736Glory Sun Financial Group Ltd.(a) . . . . . . . . . . . . . . . . . . . . . . . . . 8,704,000 255,959Up Fintech Holding Ltd., ADR(a) . . . . . . . . . . . . . . . . . . . . . . . . . . 72,480 437,779
1,757,138Chemicals — 1.9%China BlueChemical Ltd., Class H . . . . . . . . . . . . . . . . . . . . . . . . 1,408,000 427,388China Longevity Group Co. Ltd.(a)(c) . . . . . . . . . . . . . . . . . . . . . . 96,000 —China Lumena New Materials Corp.(a)(b)(c) . . . . . . . . . . . . . . . . 21,700 —China XLX Fertiliser Ltd. . . . . . . . . . . . . . . . . . . . . . . . . . . . . . . . . . 320,000 194,088Fufeng Group Ltd. . . . . . . . . . . . . . . . . . . . . . . . . . . . . . . . . . . . . . . . 1,184,600 473,413Shanghai Chlor-Alkali Chemical Co. Ltd., Class B . . . . . . . . . 326,493 211,150Sinofert Holdings Ltd.(b) . . . . . . . . . . . . . . . . . . . . . . . . . . . . . . . . . . 1,664,000 245,007
1,551,046Commercial Services & Supplies — 0.4%Binjiang Service Group Co. Ltd. . . . . . . . . . . . . . . . . . . . . . . . . . . 64,000 176,005
Security Shares
Value
Commercial Services & Supplies (continued)Dynagreen Environmental Protection Group Co. Ltd.,
Class H. . . . . . . . . . . . . . . . . . . . . . . . . . . . . . . . . . . . . . . . . . . . . . . 320,000 $ 165,223
341,228Communications Equipment — 0.1%Eastern Communications Co. Ltd., Class B . . . . . . . . . . . . . . . 262,400 121,229
Construction & Engineering — 1.3%Changsha Broad Homes Industrial Group Co Ltd.,
Class H(a)(b)(d). . . . . . . . . . . . . . . . . . . . . . . . . . . . . . . . . . . . . . . . . 76,800 96,046Greentown Management Holdings Co. Ltd.(d) . . . . . . . . . . . . . 384,000 222,035ReneSola Ltd., ADR(a)(b) . . . . . . . . . . . . . . . . . . . . . . . . . . . . . . . . . 30,336 209,318Sinopec Engineering Group Co. Ltd., Class H . . . . . . . . . . . . . 1,152,000 560,802
1,088,201Construction Materials — 0.7%Asia Cement China Holdings Corp. . . . . . . . . . . . . . . . . . . . . . . . 368,000 234,070Untrade MH Development NPV(c). . . . . . . . . . . . . . . . . . . . . . . . . 112,000 8,330West China Cement Ltd. . . . . . . . . . . . . . . . . . . . . . . . . . . . . . . . . . 1,728,000 293,962
536,362Consumer Finance — 2.1%Differ Group Holding Co. Ltd.(b) . . . . . . . . . . . . . . . . . . . . . . . . . . . 2,304,000 469,782FinVolution Group, ADR. . . . . . . . . . . . . . . . . . . . . . . . . . . . . . . . . . 86,016 504,914LexinFintech Holdings Ltd., ADR(a) . . . . . . . . . . . . . . . . . . . . . . . 79,648 334,522Qudian Inc., ADR(a) . . . . . . . . . . . . . . . . . . . . . . . . . . . . . . . . . . . . . . 142,336 199,270Yixin Group Ltd.(a)(d) . . . . . . . . . . . . . . . . . . . . . . . . . . . . . . . . . . . . . 1,024,000 181,607
1,690,095Containers & Packaging — 0.5%CPMC Holdings Ltd. . . . . . . . . . . . . . . . . . . . . . . . . . . . . . . . . . . . . . 320,000 164,300Greatview Aseptic Packaging Co. Ltd. . . . . . . . . . . . . . . . . . . . . 640,000 215,029
379,329Distributors — 0.7%China Tobacco International HK Co. Ltd.(b) . . . . . . . . . . . . . . . . 160,000 363,966Xinhua Winshare Publishing and Media Co. Ltd., Class H. . 320,000 241,652
605,618Diversified Consumer Services — 5.0%China East Education Holdings Ltd.(d). . . . . . . . . . . . . . . . . . . . . 432,000 450,946China Kepei Education Group Ltd. . . . . . . . . . . . . . . . . . . . . . . . . 320,000 173,793China Maple Leaf Educational Systems Ltd.(a). . . . . . . . . . . . . 1,152,000 128,492China New Higher Education Group Ltd.(d) . . . . . . . . . . . . . . . . 672,000 337,388China Online Education Group, ADR(a)(b). . . . . . . . . . . . . . . . . . 1,315 2,183Edvantage Group Holdings Ltd. . . . . . . . . . . . . . . . . . . . . . . . . . . 256,000 165,779Fu Shou Yuan International Group Ltd.. . . . . . . . . . . . . . . . . . . . 928,000 745,845Gaotu Techedu Inc., ADR(a) . . . . . . . . . . . . . . . . . . . . . . . . . . . . . . 103,008 275,031Hope Education Group Co. Ltd.(d) . . . . . . . . . . . . . . . . . . . . . . . . 2,176,000 474,575JH Educational Technology Inc. . . . . . . . . . . . . . . . . . . . . . . . . . . 384,000 122,616Koolearn Technology Holding Ltd.(a)(b)(d) . . . . . . . . . . . . . . . . . . 272,000 284,170Minsheng Education Group Co. Ltd.(d) . . . . . . . . . . . . . . . . . . . . 832,000 113,096OneSmart International Education Group Ltd., ADR(a)(b)(c) . 52,440 20,987Tianli Education International Holdings Ltd. . . . . . . . . . . . . . . . 1,056,000 251,709Wisdom Education International Holdings Co. Ltd.. . . . . . . . . 704,000 129,647Youdao Inc., ADR(a) . . . . . . . . . . . . . . . . . . . . . . . . . . . . . . . . . . . . . . 28,992 459,813
4,136,070Diversified Financial Services — 0.7%CSSC Hong Kong Shipping Co. Ltd. . . . . . . . . . . . . . . . . . . . . . . 960,000 131,573Haitong UniTrust International Leasing Co. Ltd., Class H(d). 1,152,000 162,503National Agricultural Holdings Ltd.(b)(c) . . . . . . . . . . . . . . . . . . . . 108,900 140Sheng Ye Capital Ltd. . . . . . . . . . . . . . . . . . . . . . . . . . . . . . . . . . . . . 336,000 305,494
599,710
Schedule of Investments (unaudited)
November 30, 2021
iShares� MSCI China Small-Cap ETF(Percentages shown are based on Net Assets)
83NM0122U-1995964-85/159

Security Shares
Value
Electrical Equipment — 1.9%China Fiber Optic Network System Group Ltd.(c). . . . . . . . . . . 181,600 $ —China High Speed Transmission Equipment Group
Co. Ltd.(a). . . . . . . . . . . . . . . . . . . . . . . . . . . . . . . . . . . . . . . . . . . . . 320,000 264,936Hangzhou Steam Turbine Co. Ltd., Class B . . . . . . . . . . . . . . . 217,623 484,196Harbin Electric Co. Ltd., Class H. . . . . . . . . . . . . . . . . . . . . . . . . . 576,000 271,935Sun King Technology Group Ltd. . . . . . . . . . . . . . . . . . . . . . . . . . 832,000 554,809Trony Solar Holdings Co. Ltd.(c) . . . . . . . . . . . . . . . . . . . . . . . . . . 216,000 —
1,575,876Electronic Equipment, Instruments & Components — 1.2%Anxin-China Holdings Ltd.(c) . . . . . . . . . . . . . . . . . . . . . . . . . . . . . . 672,000 1FIH Mobile Ltd.(a)(b) . . . . . . . . . . . . . . . . . . . . . . . . . . . . . . . . . . . . . . 2,528,000 368,514PAX Global Technology Ltd. . . . . . . . . . . . . . . . . . . . . . . . . . . . . . . 6,000 4,642Truly International Holdings Ltd. . . . . . . . . . . . . . . . . . . . . . . . . . . 1,408,000 473,065Zepp Health Corp., ADR(a) . . . . . . . . . . . . . . . . . . . . . . . . . . . . . . . 24,032 163,177
1,009,399Entertainment — 5.0%Archosaur Games Inc.(d) . . . . . . . . . . . . . . . . . . . . . . . . . . . . . . . . . 128,000 173,337Cathay Media And Education Group Inc.(d) . . . . . . . . . . . . . . . . 352,000 142,953CMGE Technology Group Ltd.(b) . . . . . . . . . . . . . . . . . . . . . . . . . . 768,000 328,176DouYu International Holdings Ltd., ADR(a)(b). . . . . . . . . . . . . . . 115,648 321,502Fire Rock Holdings Ltd. . . . . . . . . . . . . . . . . . . . . . . . . . . . . . . . . . . 1,680,000 467,505Huanxi Media Group Ltd.(a). . . . . . . . . . . . . . . . . . . . . . . . . . . . . . . 1,280,000 251,141HUYA Inc., ADR(a) . . . . . . . . . . . . . . . . . . . . . . . . . . . . . . . . . . . . . . . 63,520 546,907iDreamSky Technology Holdings Ltd.(a)(d) . . . . . . . . . . . . . . . . . 409,600 341,829IMAX China Holding Inc.(d) . . . . . . . . . . . . . . . . . . . . . . . . . . . . . . . 96,000 158,810NetDragon Websoft Holdings Ltd. . . . . . . . . . . . . . . . . . . . . . . . . 192,000 437,358Untrade SMI Holdings(c). . . . . . . . . . . . . . . . . . . . . . . . . . . . . . . . . . 267,200 —XD Inc.(a)(b) . . . . . . . . . . . . . . . . . . . . . . . . . . . . . . . . . . . . . . . . . . . . . . 153,600 912,679
4,082,197Equity Real Estate Investment Trusts (REITs) — 0.7%Yuexiu REIT. . . . . . . . . . . . . . . . . . . . . . . . . . . . . . . . . . . . . . . . . . . . . 1,312,000 563,632
Food & Staples Retailing — 0.1%111 Inc.(a)(b) . . . . . . . . . . . . . . . . . . . . . . . . . . . . . . . . . . . . . . . . . . . . . 20,544 79,094
Food Products — 2.3%China Modern Dairy Holdings Ltd.(b) . . . . . . . . . . . . . . . . . . . . . . 2,240,000 374,568China Youran Dairy Group Ltd.(a)(d) . . . . . . . . . . . . . . . . . . . . . . . 608,000 321,231COFCO Joycome Foods Ltd.(b) . . . . . . . . . . . . . . . . . . . . . . . . . . . 1,856,000 623,463Zhou Hei Ya International Holdings Co. Ltd.(d) . . . . . . . . . . . . . 656,000 602,611
1,921,873Gas Utilities — 1.0%Beijing Gas Blue Sky Holdings Ltd.(a)(c) . . . . . . . . . . . . . . . . . . . 3,264,000 29,287Tian Lun Gas Holdings Ltd. . . . . . . . . . . . . . . . . . . . . . . . . . . . . . . 240,000 228,837Towngas China Co. Ltd.. . . . . . . . . . . . . . . . . . . . . . . . . . . . . . . . . . 832,000 564,119
822,243Health Care Equipment & Supplies — 3.4%AK Medical Holdings Ltd.(d) . . . . . . . . . . . . . . . . . . . . . . . . . . . . . . 384,000 328,165Beijing Chunlizhengda Medical Instruments Co. Ltd.,
Class H(a). . . . . . . . . . . . . . . . . . . . . . . . . . . . . . . . . . . . . . . . . . . . . 64,100 151,097China Isotope & Radiation Corp.(b). . . . . . . . . . . . . . . . . . . . . . . . 47,200 134,373Kangji Medical Holdings Ltd. . . . . . . . . . . . . . . . . . . . . . . . . . . . . . 256,000 287,095Lifetech Scientific Corp.(a) . . . . . . . . . . . . . . . . . . . . . . . . . . . . . . . . 2,944,000 1,591,480Peijia Medical Ltd.(a)(d) . . . . . . . . . . . . . . . . . . . . . . . . . . . . . . . . . . . 128,000 275,435Untrade Hosa International Ltd.(c). . . . . . . . . . . . . . . . . . . . . . . . . 220,000 —
2,767,645Health Care Providers & Services — 1.8%China Resources Medical Holdings Co. Ltd.. . . . . . . . . . . . . . . 672,000 421,007Genertec Universal Medical Group Co. Ltd.(d) . . . . . . . . . . . . . 736,000 508,161
Security Shares
Value
Health Care Providers & Services (continued)IVD Medical Holding Ltd. . . . . . . . . . . . . . . . . . . . . . . . . . . . . . . . . . 640,000 $ 282,208New Horizon Health Ltd.(a)(d) . . . . . . . . . . . . . . . . . . . . . . . . . . . . . 64,000 242,113
1,453,489Hotels, Restaurants & Leisure — 1.7%CA Cultural Technology Group Ltd.(a)(c) . . . . . . . . . . . . . . . . . . . 482,000 37,705China Travel International Investment Hong Kong Ltd.(a) . . . 1,664,000 279,429Haichang Ocean Park Holdings Ltd.(a)(d) . . . . . . . . . . . . . . . . . . 928,000 326,073Huangshan Tourism Development Co. Ltd., Class B(a) . . . . . 163,200 113,098Shanghai Jin Jiang Capital Co. Ltd., Class H . . . . . . . . . . . . . . 1,088,000 401,826Xiabuxiabu Catering Management China Holdings
Co. Ltd.(d). . . . . . . . . . . . . . . . . . . . . . . . . . . . . . . . . . . . . . . . . . . . . 336,000 232,040
1,390,171Household Durables — 2.0%Konka Group Co. Ltd., Class B . . . . . . . . . . . . . . . . . . . . . . . . . . . 419,200 127,803Q Technology Group Co. Ltd.. . . . . . . . . . . . . . . . . . . . . . . . . . . . . 320,000 450,259Skyworth Group Ltd.(a) . . . . . . . . . . . . . . . . . . . . . . . . . . . . . . . . . . . 1,152,000 700,241TCL Electronics Holdings Ltd. . . . . . . . . . . . . . . . . . . . . . . . . . . . . 672,000 353,358
1,631,661Independent Power and Renewable Electricity Producers — 3.9%Beijing Energy International Holding Co. Ltd.(a) . . . . . . . . . . . . 5,312,000 181,117Beijing Jingneng Clean Energy Co. Ltd., Class H . . . . . . . . . . 1,088,000 309,831Canvest Environmental Protection Group Co. Ltd. . . . . . . . . . 384,000 203,375CGN New Energy Holdings Co. Ltd.(b) . . . . . . . . . . . . . . . . . . . . 1,024,000 901,321China Datang Corp. Renewable Power Co. Ltd., Class H . . 1,792,000 688,887China Everbright Greentech Ltd.(d). . . . . . . . . . . . . . . . . . . . . . . . 480,000 163,925Concord New Energy Group Ltd. . . . . . . . . . . . . . . . . . . . . . . . . . 4,480,000 459,014GCL New Energy Holdings Ltd.(a). . . . . . . . . . . . . . . . . . . . . . . . . 6,656,000 263,335
3,170,805Industrial Conglomerates — 0.6%Shanghai Industrial Holdings Ltd. . . . . . . . . . . . . . . . . . . . . . . . . . 352,000 505,896
Insurance — 0.5%Fanhua Inc., ADR. . . . . . . . . . . . . . . . . . . . . . . . . . . . . . . . . . . . . . . . 31,872 407,962
Interactive Media & Services — 1.3%Meitu Inc.(a)(d) . . . . . . . . . . . . . . . . . . . . . . . . . . . . . . . . . . . . . . . . . . . 1,728,000 357,190Sohu.com Ltd., ADR(a)(b) . . . . . . . . . . . . . . . . . . . . . . . . . . . . . . . . . 23,360 394,083Tongdao Liepin Group(a) . . . . . . . . . . . . . . . . . . . . . . . . . . . . . . . . . 147,200 288,435
1,039,708Internet & Direct Marketing Retail — 1.8%Baozun Inc., ADR(a). . . . . . . . . . . . . . . . . . . . . . . . . . . . . . . . . . . . . . 46,432 640,297Cango Inc./KY, ADR(b) . . . . . . . . . . . . . . . . . . . . . . . . . . . . . . . . . . . 29,568 93,139Maoyan Entertainment(a)(b)(d) . . . . . . . . . . . . . . . . . . . . . . . . . . . . . 313,600 352,589Uxin Ltd., ADR(a). . . . . . . . . . . . . . . . . . . . . . . . . . . . . . . . . . . . . . . . . 194,592 430,048
1,516,073IT Services — 1.4%Digital China Holdings Ltd. . . . . . . . . . . . . . . . . . . . . . . . . . . . . . . . 608,000 330,343Hi Sun Technology China Ltd.(a) . . . . . . . . . . . . . . . . . . . . . . . . . . 1,440,000 185,147INESA Intelligent Tech Inc., Class B . . . . . . . . . . . . . . . . . . . . . . 148,800 62,157Yeahka Ltd.(a) . . . . . . . . . . . . . . . . . . . . . . . . . . . . . . . . . . . . . . . . . . . 166,400 600,687
1,178,334Life Sciences Tools & Services — 0.4%Viva Biotech Holdings(d). . . . . . . . . . . . . . . . . . . . . . . . . . . . . . . . . . 528,000 315,358
Machinery — 2.6%China Yuchai International Ltd. . . . . . . . . . . . . . . . . . . . . . . . . . . . 11,392 134,995CIMC Enric Holdings Ltd. . . . . . . . . . . . . . . . . . . . . . . . . . . . . . . . . 576,000 784,313First Tractor Co. Ltd., Class H(b) . . . . . . . . . . . . . . . . . . . . . . . . . . 320,000 147,039Lonking Holdings Ltd. . . . . . . . . . . . . . . . . . . . . . . . . . . . . . . . . . . . . 1,536,000 396,286
Schedule of Investments (unaudited) (continued)
November 30, 2021
iShares� MSCI China Small-Cap ETF(Percentages shown are based on Net Assets)
84 NM0122U-1995964-86/159

Security Shares
Value
Machinery (continued)Shanghai Diesel Engine Co. Ltd., Class B. . . . . . . . . . . . . . . . . 278,465 $ 168,193Shanghai Highly Group Co. Ltd., Class B . . . . . . . . . . . . . . . . . 217,684 108,900Shanghai Mechanical and Electrical Industry Co. Ltd.,
Class B. . . . . . . . . . . . . . . . . . . . . . . . . . . . . . . . . . . . . . . . . . . . . . . 163,200 220,320Zhengzhou Coal Mining Machinery Group Co. Ltd.,
Class H(b). . . . . . . . . . . . . . . . . . . . . . . . . . . . . . . . . . . . . . . . . . . . . 185,600 203,732
2,163,778Media — 1.0%iClick Interactive Asia Group Ltd., ADR(a)(b). . . . . . . . . . . . . . . . 50,080 332,030Joy Spreader Group Inc.(a)(b) . . . . . . . . . . . . . . . . . . . . . . . . . . . . . 512,000 143,560Mobvista Inc.(a)(b)(d) . . . . . . . . . . . . . . . . . . . . . . . . . . . . . . . . . . . . . . 384,000 335,364
810,954Metals & Mining — 3.3%China Metal Recycling Holdings Ltd.(c) . . . . . . . . . . . . . . . . . . . . 184,800 —China Oriental Group Co. Ltd. . . . . . . . . . . . . . . . . . . . . . . . . . . . . 896,000 236,818China Zhongwang Holdings Ltd.(a)(b)(c) . . . . . . . . . . . . . . . . . . . . 1,271,200 230,707Jinchuan Group International Resources Co. Ltd.(b). . . . . . . . 2,496,000 375,791Shougang Fushan Resources Group Ltd. . . . . . . . . . . . . . . . . . 1,600,000 415,130Tiangong International Co. Ltd. . . . . . . . . . . . . . . . . . . . . . . . . . . . 896,000 524,765Untrade Real Gold Mining(c) . . . . . . . . . . . . . . . . . . . . . . . . . . . . . . 126,000 —Youyuan International Holdings Ltd.(b)(c). . . . . . . . . . . . . . . . . . . 120,000 2,000Zhaojin Mining Industry Co. Ltd., Class H . . . . . . . . . . . . . . . . . 928,000 968,700
2,753,911Oil, Gas & Consumable Fuels — 1.4%CGN Mining Co. Ltd. . . . . . . . . . . . . . . . . . . . . . . . . . . . . . . . . . . . . . 1,760,000 200,872Inner Mongolia Yitai Coal Co. Ltd., Class B. . . . . . . . . . . . . . . . 841,687 669,276Sinopec Kantons Holdings Ltd. . . . . . . . . . . . . . . . . . . . . . . . . . . . 768,000 279,794
1,149,942Paper & Forest Products — 0.0%China Forestry Holdings Co. Ltd.(c) . . . . . . . . . . . . . . . . . . . . . . . 306,000 1Qunxing Paper Holdings Co. Ltd.(c) . . . . . . . . . . . . . . . . . . . . . . . 148,000 —Superb Summit International Group Ltd.(c) . . . . . . . . . . . . . . . . 2,975 1
2Personal Products — 0.2%Yatsen Holding Ltd., ADR(a) . . . . . . . . . . . . . . . . . . . . . . . . . . . . . . 67,968 177,396
Pharmaceuticals — 5.5%Antengene Corp. Ltd.(a)(d) . . . . . . . . . . . . . . . . . . . . . . . . . . . . . . . . 160,000 241,293Beijing Tong Ren Tang Chinese Medicine Co. Ltd. . . . . . . . . . 206,000 276,109China Animal Healthcare Ltd.(c) . . . . . . . . . . . . . . . . . . . . . . . . . . . 140,000 —China Shineway Pharmaceutical Group Ltd.. . . . . . . . . . . . . . . 224,000 206,642Grand Pharmaceutical Group Ltd., Class A(b). . . . . . . . . . . . . . 848,000 694,886Hua Han Health Industry Holdings Ltd.(b)(c) . . . . . . . . . . . . . . . . 651,960 1Hua Medicine(a)(d). . . . . . . . . . . . . . . . . . . . . . . . . . . . . . . . . . . . . . . . 544,000 286,001Luye Pharma Group Ltd.(a)(d) . . . . . . . . . . . . . . . . . . . . . . . . . . . . . 1,392,000 638,163Ocumension Therapeutics(a)(b)(d) . . . . . . . . . . . . . . . . . . . . . . . . . 128,000 272,588Shanghai Fudan-Zhangjiang Bio-Pharmaceutical Co. Ltd.,
Class H. . . . . . . . . . . . . . . . . . . . . . . . . . . . . . . . . . . . . . . . . . . . . . . 192,000 100,201Shanghai Haixin Group Co., Class B. . . . . . . . . . . . . . . . . . . . . . 361,663 121,519Sihuan Pharmaceutical Holdings Group Ltd. . . . . . . . . . . . . . . 2,976,000 580,247SSY Group Ltd.. . . . . . . . . . . . . . . . . . . . . . . . . . . . . . . . . . . . . . . . . . 1,088,000 544,139Tianjin ZhongXin Pharmaceutical Group Corp. Ltd.,
Class S(b) . . . . . . . . . . . . . . . . . . . . . . . . . . . . . . . . . . . . . . . . . . . . . 160,000 174,400Tong Ren Tang Technologies Co. Ltd., Class H . . . . . . . . . . . . 480,000 361,628YiChang HEC ChangJiang Pharmaceutical Co. Ltd.,
Class H(a)(d). . . . . . . . . . . . . . . . . . . . . . . . . . . . . . . . . . . . . . . . . . . 22,400 16,289
4,514,106Professional Services — 0.2%SOS Ltd., ADR(a)(b) . . . . . . . . . . . . . . . . . . . . . . . . . . . . . . . . . . . . . . 144,096 184,443
Security Shares
Value
Real Estate Management & Development — 17.3%Aoyuan Healthy Life Group Co. Ltd. . . . . . . . . . . . . . . . . . . . . . . 44,000 $ 16,492Beijing North Star Co. Ltd., Class H. . . . . . . . . . . . . . . . . . . . . . . 130,000 18,775C&D International Investment Group Ltd. . . . . . . . . . . . . . . . . . 302,000 575,679C&D Property Management Group Co. Ltd.(a) . . . . . . . . . . . . . 320,000 172,330Central China Management Co. Ltd. . . . . . . . . . . . . . . . . . . . . . . 769,038 147,987Central China New Life Ltd. . . . . . . . . . . . . . . . . . . . . . . . . . . . . . . 251,000 160,224Central China Real Estate Ltd. . . . . . . . . . . . . . . . . . . . . . . . . . . . 704,038 99,313China Aoyuan Group Ltd. . . . . . . . . . . . . . . . . . . . . . . . . . . . . . . . . 992,000 277,322China Logistics Property Holdings Co. Ltd.(a)(b)(d) . . . . . . . . . . 544,000 292,998China Merchants Land Ltd.. . . . . . . . . . . . . . . . . . . . . . . . . . . . . . . 960,000 104,768China Overseas Grand Oceans Group Ltd. . . . . . . . . . . . . . . . 1,344,000 606,183China SCE Group Holdings Ltd. . . . . . . . . . . . . . . . . . . . . . . . . . . 1,344,800 355,087China South City Holdings Ltd.(b) . . . . . . . . . . . . . . . . . . . . . . . . . 3,520,000 234,044China Vast Industrial Urban Development Co. Ltd.(d). . . . . . . 242,000 52,136Colour Life Services Group Co. Ltd.(b) . . . . . . . . . . . . . . . . . . . . 380,000 55,152Cosmopolitan International Holdings Ltd.(a). . . . . . . . . . . . . . . . 1,536,000 238,338DaFa Properties Group Ltd.(b) . . . . . . . . . . . . . . . . . . . . . . . . . . . . 192,000 107,104Datang Group Holdings Ltd.(b) . . . . . . . . . . . . . . . . . . . . . . . . . . . . 256,000 136,779Dexin China Holdings Co. Ltd.(b). . . . . . . . . . . . . . . . . . . . . . . . . . 640,000 208,464Excellence Commercial Property & Facilities Management
Group Ltd.(b) . . . . . . . . . . . . . . . . . . . . . . . . . . . . . . . . . . . . . . . . . . 256,000 152,943Fantasia Holdings Group Co. Ltd. . . . . . . . . . . . . . . . . . . . . . . . . 1,435,500 57,987Ganglong China Property Group Ltd.(b) . . . . . . . . . . . . . . . . . . . 384,000 220,872Gemdale Properties & Investment Corp. Ltd. . . . . . . . . . . . . . . 5,248,000 503,527Greenland Hong Kong Holdings Ltd. . . . . . . . . . . . . . . . . . . . . . . 672,000 135,822Huijing Holdings Co. Ltd.(b) . . . . . . . . . . . . . . . . . . . . . . . . . . . . . . . 640,000 158,400Jiayuan International Group Ltd. . . . . . . . . . . . . . . . . . . . . . . . . . . 1,152,000 443,191Jingrui Holdings Ltd. . . . . . . . . . . . . . . . . . . . . . . . . . . . . . . . . . . . . . 416,000 107,228JY Grandmark Holdings Ltd. . . . . . . . . . . . . . . . . . . . . . . . . . . . . . 416,000 144,037Kaisa Group Holdings Ltd. . . . . . . . . . . . . . . . . . . . . . . . . . . . . . . . 2,208,000 300,139KWG Living Group Holdings Ltd. . . . . . . . . . . . . . . . . . . . . . . . . . 736,000 444,919Leading Holdings Group Ltd.(a)(b) . . . . . . . . . . . . . . . . . . . . . . . . . 256,000 111,618LVGEM China Real Estate Investment Co. Ltd.(a). . . . . . . . . . 832,000 150,439Midea Real Estate Holding Ltd.(d) . . . . . . . . . . . . . . . . . . . . . . . . . 236,800 409,951Nam Tai Property Inc.(a) . . . . . . . . . . . . . . . . . . . . . . . . . . . . . . . . . . 13,824 247,588Poly Property Group Co. Ltd. . . . . . . . . . . . . . . . . . . . . . . . . . . . . . 1,632,000 410,198Powerlong Commercial Management Holdings Ltd.. . . . . . . . 128,000 257,934Radiance Holdings Group Co. Ltd.(b). . . . . . . . . . . . . . . . . . . . . . 640,000 317,248Redco Properties Group Ltd.(d) . . . . . . . . . . . . . . . . . . . . . . . . . . . 832,000 241,129Redsun Properties Group Ltd.(b) . . . . . . . . . . . . . . . . . . . . . . . . . . 800,000 226,725Road King Infrastructure Ltd. . . . . . . . . . . . . . . . . . . . . . . . . . . . . . 187,000 174,479Ronshine China Holdings Ltd.(b) . . . . . . . . . . . . . . . . . . . . . . . . . . 464,000 176,472SCE Intelligent Commercial Management Holdings Ltd. . . . 416,000 187,782Shanghai Industrial Urban Development Group Ltd. . . . . . . . 1,536,000 133,020Shanghai Jinqiao Export Processing Zone Development
Co. Ltd., Class B . . . . . . . . . . . . . . . . . . . . . . . . . . . . . . . . . . . . . . 217,600 189,312Shenzhen Investment Ltd.. . . . . . . . . . . . . . . . . . . . . . . . . . . . . . . . 2,112,000 479,384Shinsun Holdings Group Co. Ltd. . . . . . . . . . . . . . . . . . . . . . . . . . 608,000 105,258Shoucheng Holdings Ltd. . . . . . . . . . . . . . . . . . . . . . . . . . . . . . . . . 1,729,600 419,707Shui On Land Ltd. . . . . . . . . . . . . . . . . . . . . . . . . . . . . . . . . . . . . . . . 2,848,000 378,526Sino-Ocean Group Holding Ltd. . . . . . . . . . . . . . . . . . . . . . . . . . . 2,416,000 564,991Skyfame Realty Holdings Ltd. . . . . . . . . . . . . . . . . . . . . . . . . . . . . 1,984,000 223,893SOHO China Ltd.(a) . . . . . . . . . . . . . . . . . . . . . . . . . . . . . . . . . . . . . . 1,632,000 364,155Sunkwan Properties Group Ltd.(b) . . . . . . . . . . . . . . . . . . . . . . . . 512,000 147,074Times Neighborhood Holdings Ltd.(b) . . . . . . . . . . . . . . . . . . . . . 416,000 183,378Yincheng International Holding Co. Ltd.(b) . . . . . . . . . . . . . . . . . 320,000 123,109Yuzhou Group Holdings Co. Ltd.. . . . . . . . . . . . . . . . . . . . . . . . . . 1,728,907 170,718Zhenro Properties Group Ltd. . . . . . . . . . . . . . . . . . . . . . . . . . . . . 1,376,000 776,404Zhongliang Holdings Group Co. Ltd. . . . . . . . . . . . . . . . . . . . . . . 544,000 235,096
Schedule of Investments (unaudited) (continued)
November 30, 2021
iShares� MSCI China Small-Cap ETF(Percentages shown are based on Net Assets)
85NM0122U-1995964-87/159

Security Shares
Value
Real Estate Management & Development (continued)Zhuguang Holdings Group Co. Ltd. . . . . . . . . . . . . . . . . . . . . . . . 1,408,000 $ 287,089
14,220,917Semiconductors & Semiconductor Equipment — 2.3%BOE Varitronix Ltd. . . . . . . . . . . . . . . . . . . . . . . . . . . . . . . . . . . . . . . 224,000 280,359JinkoSolar Holding Co. Ltd., ADR(a) . . . . . . . . . . . . . . . . . . . . . . . 30,176 1,577,601
1,857,960Software — 2.0%AsiaInfo Technologies Ltd.(d) . . . . . . . . . . . . . . . . . . . . . . . . . . . . . 140,800 234,048Bit Digital Inc.(a)(b). . . . . . . . . . . . . . . . . . . . . . . . . . . . . . . . . . . . . . . . 48,736 479,562BIT Mining Ltd., SP ADR(a)(b) . . . . . . . . . . . . . . . . . . . . . . . . . . . . . 28,736 212,072Cloopen Group Holding Ltd., ADR(a) . . . . . . . . . . . . . . . . . . . . . . 41,344 156,694Inspur International Ltd.(a) . . . . . . . . . . . . . . . . . . . . . . . . . . . . . . . . 384,000 196,460Newborn Town Inc.(a) . . . . . . . . . . . . . . . . . . . . . . . . . . . . . . . . . . . . 320,000 158,199OneConnect Financial Technology Co. Ltd., ADR(a). . . . . . . . 91,552 234,373
1,671,408Specialty Retail — 0.9%Boshiwa International Holding Ltd.(c) . . . . . . . . . . . . . . . . . . . . . . 67,000 —China Harmony Auto Holding Ltd. . . . . . . . . . . . . . . . . . . . . . . . . 624,000 344,088Mulsanne Group Holding Ltd.(a)(b)(d) . . . . . . . . . . . . . . . . . . . . . . 192,000 153,158Pou Sheng International Holdings Ltd.(a) . . . . . . . . . . . . . . . . . . 1,664,000 234,727
731,973Technology Hardware, Storage & Peripherals — 1.0%Canaan Inc., ADR(a)(b) . . . . . . . . . . . . . . . . . . . . . . . . . . . . . . . . . . . 70,624 620,785Coolpad Group Ltd.(a) . . . . . . . . . . . . . . . . . . . . . . . . . . . . . . . . . . . . 3,328,000 160,041
780,826Textiles, Apparel & Luxury Goods — 2.8%361 Degrees International Ltd.(a). . . . . . . . . . . . . . . . . . . . . . . . . . 640,000 320,173China Dongxiang Group Co. Ltd. . . . . . . . . . . . . . . . . . . . . . . . . . 2,304,000 209,777China Lilang Ltd.. . . . . . . . . . . . . . . . . . . . . . . . . . . . . . . . . . . . . . . . . 320,000 171,366Fuguiniao Co. Ltd.(c) . . . . . . . . . . . . . . . . . . . . . . . . . . . . . . . . . . . . . 43,200 —JNBY Design Ltd.. . . . . . . . . . . . . . . . . . . . . . . . . . . . . . . . . . . . . . . . 128,000 215,686Xtep International Holdings Ltd.(b) . . . . . . . . . . . . . . . . . . . . . . . . 1,040,000 1,404,843
2,321,845Trading Companies & Distributors — 0.3%China Aircraft Leasing Group Holdings Ltd. . . . . . . . . . . . . . . . 192,000 123,409CITIC Resources Holdings Ltd.(a) . . . . . . . . . . . . . . . . . . . . . . . . . 2,176,000 128,361
251,770Transportation Infrastructure — 2.0%Anhui Expressway Co. Ltd., Class H . . . . . . . . . . . . . . . . . . . . . . 340,000 257,527
Security Shares
Value
Transportation Infrastructure (continued)COSCO SHIPPING International Hong Kong Co. Ltd. . . . . . 448,000 $ 138,629Hainan Meilan International Airport Co. Ltd., Class H(a) . . . . 160,000 522,185Sichuan Expressway Co. Ltd., Class H. . . . . . . . . . . . . . . . . . . . 576,000 127,482Tianjin Port Development Holdings Ltd. . . . . . . . . . . . . . . . . . . . 1,472,000 115,830Yuexiu Transport Infrastructure Ltd. . . . . . . . . . . . . . . . . . . . . . . . 794,000 492,814
1,654,467Water Utilities — 1.1%China Everbright Water Ltd. . . . . . . . . . . . . . . . . . . . . . . . . . . . . . . 688,000 146,217China Water Affairs Group Ltd. . . . . . . . . . . . . . . . . . . . . . . . . . . . 640,000 734,343
880,560
Total Common Stocks — 99.9%(Cost: $93,201,976) . . . . . . . . . . . . . . . . . . . . . . . . . . . . . . . . . . . . . . . . . . . . . . . 82,241,192
Short-Term InvestmentsMoney Market Funds — 15.5%BlackRock Cash Funds: Institutional, SL Agency Shares,
0.06%(e)(f)(g). . . . . . . . . . . . . . . . . . . . . . . . . . . . . . . . . . . . . . . . . . . 12,464,528 12,469,513BlackRock Cash Funds: Treasury, SL Agency Shares,
0.00%(e)(f). . . . . . . . . . . . . . . . . . . . . . . . . . . . . . . . . . . . . . . . . . . . . 310,000 310,000
12,779,513
Total Short-Term Investments — 15.5%(Cost: $12,776,982) . . . . . . . . . . . . . . . . . . . . . . . . . . . . . . . . . . . . . . . . . . . . . . . 12,779,513
Total Investments in Securities — 115.4%(Cost: $105,978,958) . . . . . . . . . . . . . . . . . . . . . . . . . . . . . . . . . . . . . . . . . . . . . . 95,020,705
Other Assets, Less Liabilities — (15.4)% . . . . . . . . . . . . . . . . . . . . . . . . . . . . (12,667,186)
Net Assets — 100.0% . . . . . . . . . . . . . . . . . . . . . . . . . . . . . . . . . . . . . . . . . . . . . . . . $ 82,353,519 (a) Non-income producing security.(b) All or a portion of this security is on loan.(c) Security is valued using significant unobservable inputs and is classified as Level 3 in the
fair value hierarchy.(d) Security exempt from registration pursuant to Rule 144A under the Securities Act of
1933, as amended. These securities may be resold in transactions exempt fromregistration to qualified institutional investors.
(e) Affiliate of the Fund.(f) Annualized 7-day yield as of period end.(g) All or a portion of this security was purchased with the cash collateral from loaned
securities.
Schedule of Investments (unaudited) (continued)
November 30, 2021
iShares� MSCI China Small-Cap ETF(Percentages shown are based on Net Assets)
86 NM0122U-1995964-88/159

Affiliates
Investments in issuers considered to be affiliate(s) of the Fund during the period ended November 30, 2021 for purposes of Section 2(a)(3) of the Investment Company Actof 1940, as amended, were as follows:
Affiliated IssuerValue at
08/31/21Purchases
at CostProceeds
from SalesNet Realized
Gain (Loss)
Change inUnrealized
Appreciation(Depreciation)
Value at11/30/21
SharesHeld at
11/30/21 Income
CapitalGain
Distributionsfrom
UnderlyingFunds
BlackRock Cash Funds: Institutional, SLAgency Shares . . . . . . . . . . . . . . . . . . . . . . . . . . . $22,118,371 $ — $(9,647,115)(a) $ (602) $ (1,141) $12,469,513 12,464,528 $251,080(b) $ —
BlackRock Cash Funds: Treasury, SL AgencyShares . . . . . . . . . . . . . . . . . . . . . . . . . . . . . . . . . . . 50,000 260,000(a)
— — — 310,000 310,000 2 —
$ (602) $ (1,141) $12,779,513 $251,082 $ —
(a) Represents net amount purchased (sold).(b) All or a portion represents securities lending income earned from the reinvestment of cash collateral from loaned securities, net of fees and collateral investment expenses, and other
payments to and from borrowers of securities.
Derivative Financial Instruments Outstanding as of Period End
Futures Contracts
DescriptionNumber ofContracts
ExpirationDate
NotionalAmount
(000)
Value/Unrealized
Appreciation(Depreciation)
Long ContractsMSCI China Free Index. . . . . . . . . . . . . . . . . . . . . . . . . . . . . . . . . . . . . . . . . . . . . . . . . . . . . . . . . . . . . . . . . . . . . . . . . . . . . . . . . . . . . . . . . . . . . . 8 12/17/21 $ 379 $ (19,145)
Fair Value Measurements
Various inputs are used in determining the fair value of financial instruments. These inputs to valuation techniques are categorized into a fair value hierarchy consisting ofthree broad levels for financial reporting purposes as follows:
• Level 1 – Unadjusted price quotations in active markets/exchanges for identical assets or liabilities that each Fund has the ability to access;• Level 2 – Other observable inputs (including, but not limited to, quoted prices for similar assets or liabilities in markets that are active, quoted prices for identical or
similar assets or liabilities in markets that are not active, inputs other than quoted prices that are observable for the assets or liabilities (such as interest rates, yieldcurves, volatilities, prepayment speeds, loss severities, credit risks and default rates) or other market-corroborated inputs); and
• Level 3 – Unobservable inputs based on the best information available in the circumstances, to the extent observable inputs are not available (including the BlackRockGlobal Valuation Methodologies Committee’s (the “Global Valuation Committee’s”) assumptions used in determining the fair value of financial instruments).
The hierarchy gives the highest priority to unadjusted quoted prices in active markets for identical assets or liabilities (Level 1 measurements) and the lowest priority tounobservable inputs (Level 3 measurements). Accordingly, the degree of judgment exercised in determining fair value is greatest for instruments categorized in Level 3. Theinputs used to measure fair value may fall into different levels of the fair value hierarchy. In such cases, for disclosure purposes, the fair value hierarchy classification isdetermined based on the lowest level input that is significant to the fair value measurement in its entirety. Investments classified within Level 3 have significant unobservableinputs used by the Global Valuation Committee in determining the price for Fair Valued Investments. Level 3 investments include equity or debt issued by privately heldcompanies or funds. There may not be a secondary market, and/or there are a limited number of investors. The categorization of a value determined for financial instrumentsis based on the pricing transparency of the financial instruments and is not necessarily an indication of the risks associated with investing in those securities. For informationabout the Fund’s policy regarding valuation of financial instruments, refer to its most recent financial statements.
Schedule of Investments (unaudited) (continued)
November 30, 2021
iShares� MSCI China Small-Cap ETF
87NM0122U-1995964-89/159

Fair Value Measurements (continued)
The following table summarizes the Fund’s financial instruments categorized in the fair value hierarchy. The breakdown of the Fund’s financial instruments into majorcategories is disclosed in the Schedule of Investments above.
Level 1 Level 2 Level 3 Total
InvestmentsAssets
Common Stocks . . . . . . . . . . . . . . . . . . . . . . . . . . . . . . . . . . . . . . . . . . . . . . . . . . . . . . . . . . . . . . . . . . . . . . . . . . . . . . . . . . . . . . . . $32,575,509 $49,324,908 $ 340,775 $82,241,192Money Market Funds. . . . . . . . . . . . . . . . . . . . . . . . . . . . . . . . . . . . . . . . . . . . . . . . . . . . . . . . . . . . . . . . . . . . . . . . . . . . . . . . . . . . 12,779,513 — — 12,779,513
$45,355,022 $49,324,908 $ 340,775 $95,020,705
Derivative financial instruments(a)
LiabilitiesFutures Contracts . . . . . . . . . . . . . . . . . . . . . . . . . . . . . . . . . . . . . . . . . . . . . . . . . . . . . . . . . . . . . . . . . . . . . . . . . . . . . . . . . . . . . . . $ — $ (19,145) $ — $ (19,145)
(a) Derivative financial instruments are futures contracts. Futures contracts are valued at the unrealized appreciation (depreciation) on the instrument.
Portfolio Abbreviations - Equity
ADR . . . . . . . . . . . . . American Depositary Receipt
Schedule of Investments (unaudited) (continued)
November 30, 2021
iShares� MSCI China Small-Cap ETF
88 NM0122U-1995964-90/159

Security Shares
Value
Common StocksAir Freight & Logistics — 9.1%DSV A/S. . . . . . . . . . . . . . . . . . . . . . . . . . . . . . . . . . . . . . . . . . . . . . . . . . 71,197 $ 15,501,416
Banks — 6.0%Danske Bank A/S . . . . . . . . . . . . . . . . . . . . . . . . . . . . . . . . . . . . . . . . . 268,890 4,445,678Jyske Bank A/S, Registered(a) . . . . . . . . . . . . . . . . . . . . . . . . . . . . . 31,942 1,597,395Ringkjoebing Landbobank A/S . . . . . . . . . . . . . . . . . . . . . . . . . . . . . 14,364 1,899,049Spar Nord Bank A/S. . . . . . . . . . . . . . . . . . . . . . . . . . . . . . . . . . . . . . . 77,899 996,634Sydbank A/S. . . . . . . . . . . . . . . . . . . . . . . . . . . . . . . . . . . . . . . . . . . . . . 38,824 1,262,853
10,201,609Beverages — 4.7%Carlsberg A/S, Class B . . . . . . . . . . . . . . . . . . . . . . . . . . . . . . . . . . . . 37,475 5,819,820Royal Unibrew A/S . . . . . . . . . . . . . . . . . . . . . . . . . . . . . . . . . . . . . . . . 21,290 2,269,116
8,088,936Biotechnology — 6.8%Bavarian Nordic A/S(a)(b). . . . . . . . . . . . . . . . . . . . . . . . . . . . . . . . . . . 35,748 1,775,462Genmab A/S(a) . . . . . . . . . . . . . . . . . . . . . . . . . . . . . . . . . . . . . . . . . . . . 23,442 9,084,753Zealand Pharma A/S(a) . . . . . . . . . . . . . . . . . . . . . . . . . . . . . . . . . . . . 34,953 725,679
11,585,894Building Products — 1.0%Rockwool International A/S, Class B . . . . . . . . . . . . . . . . . . . . . . . 3,974 1,651,680
Chemicals — 5.3%Chr Hansen Holding A/S . . . . . . . . . . . . . . . . . . . . . . . . . . . . . . . . . . 42,385 3,153,442Novozymes A/S, Class B . . . . . . . . . . . . . . . . . . . . . . . . . . . . . . . . . . 77,409 5,878,779
9,032,221Commercial Services & Supplies — 0.8%ISS A/S(a). . . . . . . . . . . . . . . . . . . . . . . . . . . . . . . . . . . . . . . . . . . . . . . . . 81,130 1,458,205
Construction & Engineering — 0.5%Per Aarsleff Holding A/S . . . . . . . . . . . . . . . . . . . . . . . . . . . . . . . . . . . 19,383 817,125
Electric Utilities — 4.6%Orsted A/S(c). . . . . . . . . . . . . . . . . . . . . . . . . . . . . . . . . . . . . . . . . . . . . . 61,610 7,921,692
Electrical Equipment — 7.7%NKT A/S(a) . . . . . . . . . . . . . . . . . . . . . . . . . . . . . . . . . . . . . . . . . . . . . . . . 26,071 1,217,697Vestas Wind Systems A/S . . . . . . . . . . . . . . . . . . . . . . . . . . . . . . . . . 356,741 11,978,205
13,195,902Energy Equipment & Services — 0.5%Drilling Co. of 1972 A/S (The)(a)(b) . . . . . . . . . . . . . . . . . . . . . . . . . . 23,334 841,764
Food Products — 0.5%Schouw & Co. A/S . . . . . . . . . . . . . . . . . . . . . . . . . . . . . . . . . . . . . . . . 10,265 829,615
Health Care Equipment & Supplies — 8.5%Ambu A/S, Class B(b). . . . . . . . . . . . . . . . . . . . . . . . . . . . . . . . . . . . . . 76,186 2,160,848Coloplast A/S, Class B . . . . . . . . . . . . . . . . . . . . . . . . . . . . . . . . . . . . 43,710 7,139,821Demant A/S(a) . . . . . . . . . . . . . . . . . . . . . . . . . . . . . . . . . . . . . . . . . . . . 47,145 2,261,005GN Store Nord A/S. . . . . . . . . . . . . . . . . . . . . . . . . . . . . . . . . . . . . . . . 50,798 2,925,461
14,487,135Health Care Technology — 0.1%NNIT A/S(b)(c) . . . . . . . . . . . . . . . . . . . . . . . . . . . . . . . . . . . . . . . . . . . . . 16,051 269,238
Insurance — 4.0%ALM Brand . . . . . . . . . . . . . . . . . . . . . . . . . . . . . . . . . . . . . . . . . . . . . . . 1,048,365 1,819,268Topdanmark A/S . . . . . . . . . . . . . . . . . . . . . . . . . . . . . . . . . . . . . . . . . . 26,439 1,427,775Tryg A/S . . . . . . . . . . . . . . . . . . . . . . . . . . . . . . . . . . . . . . . . . . . . . . . . . . 145,928 3,539,241
6,786,284
Security Shares
Value
IT Services — 0.3%Trifork Holding AG, NVS. . . . . . . . . . . . . . . . . . . . . . . . . . . . . . . . . . . 11,378 $ 494,485
Life Sciences Tools & Services — 0.8%Chemometec A/S . . . . . . . . . . . . . . . . . . . . . . . . . . . . . . . . . . . . . . . . . 9,266 1,333,631
Machinery — 1.2%FLSmidth & Co. A/S. . . . . . . . . . . . . . . . . . . . . . . . . . . . . . . . . . . . . . . 38,017 1,281,021Nilfisk Holding A/S(a) . . . . . . . . . . . . . . . . . . . . . . . . . . . . . . . . . . . . . . 25,008 842,778
2,123,799Marine — 5.9%AP Moller - Maersk A/S, Class A . . . . . . . . . . . . . . . . . . . . . . . . . . . 942 2,695,953AP Moller - Maersk A/S, Class B, NVS . . . . . . . . . . . . . . . . . . . . . 1,847 5,560,894D/S Norden A/S. . . . . . . . . . . . . . . . . . . . . . . . . . . . . . . . . . . . . . . . . . . 31,971 740,552Dfds A/S(a). . . . . . . . . . . . . . . . . . . . . . . . . . . . . . . . . . . . . . . . . . . . . . . . 22,486 1,027,756
10,025,155Oil, Gas & Consumable Fuels — 0.1%TORM PLC, Class A(a)(b) . . . . . . . . . . . . . . . . . . . . . . . . . . . . . . . . . . 31,502 234,831
Pharmaceuticals — 23.7%ALK-Abello A/S(a) . . . . . . . . . . . . . . . . . . . . . . . . . . . . . . . . . . . . . . . . . 3,479 1,748,572H Lundbeck A/S . . . . . . . . . . . . . . . . . . . . . . . . . . . . . . . . . . . . . . . . . . 44,029 1,107,146Novo Nordisk A/S, Class B . . . . . . . . . . . . . . . . . . . . . . . . . . . . . . . . 352,764 37,763,375
40,619,093Road & Rail — 0.4%NTG Nordic Transport Group AS, Class A(a) . . . . . . . . . . . . . . . . 9,086 710,261
Software — 2.6%cBrain AS(b). . . . . . . . . . . . . . . . . . . . . . . . . . . . . . . . . . . . . . . . . . . . . . . 12,029 634,669Netcompany Group A/S(c) . . . . . . . . . . . . . . . . . . . . . . . . . . . . . . . . . 18,137 1,928,453SimCorp A/S. . . . . . . . . . . . . . . . . . . . . . . . . . . . . . . . . . . . . . . . . . . . . . 18,006 1,825,184
4,388,306Specialty Retail — 0.5%Matas A/S . . . . . . . . . . . . . . . . . . . . . . . . . . . . . . . . . . . . . . . . . . . . . . . . 43,313 797,200
Textiles, Apparel & Luxury Goods — 2.8%Pandora A/S . . . . . . . . . . . . . . . . . . . . . . . . . . . . . . . . . . . . . . . . . . . . . . 38,734 4,819,378
Tobacco — 0.5%Scandinavian Tobacco Group A/S, Class A(c) . . . . . . . . . . . . . . . 50,449 927,004
Trading Companies & Distributors — 0.4%Solar A/S, Class B . . . . . . . . . . . . . . . . . . . . . . . . . . . . . . . . . . . . . . . . 6,303 686,258
Total Common Stocks — 99.3%(Cost: $149,818,591) . . . . . . . . . . . . . . . . . . . . . . . . . . . . . . . . . . . . . . . . . . . . . . 169,828,117
Short-Term InvestmentsMoney Market Funds — 3.2%BlackRock Cash Funds: Institutional, SL Agency Shares,
0.06%(d)(e)(f) . . . . . . . . . . . . . . . . . . . . . . . . . . . . . . . . . . . . . . . . . . . . 5,381,458 5,383,610
Schedule of Investments (unaudited)
November 30, 2021
iShares� MSCI Denmark ETF(Percentages shown are based on Net Assets)
89NM0122U-1995964-91/159
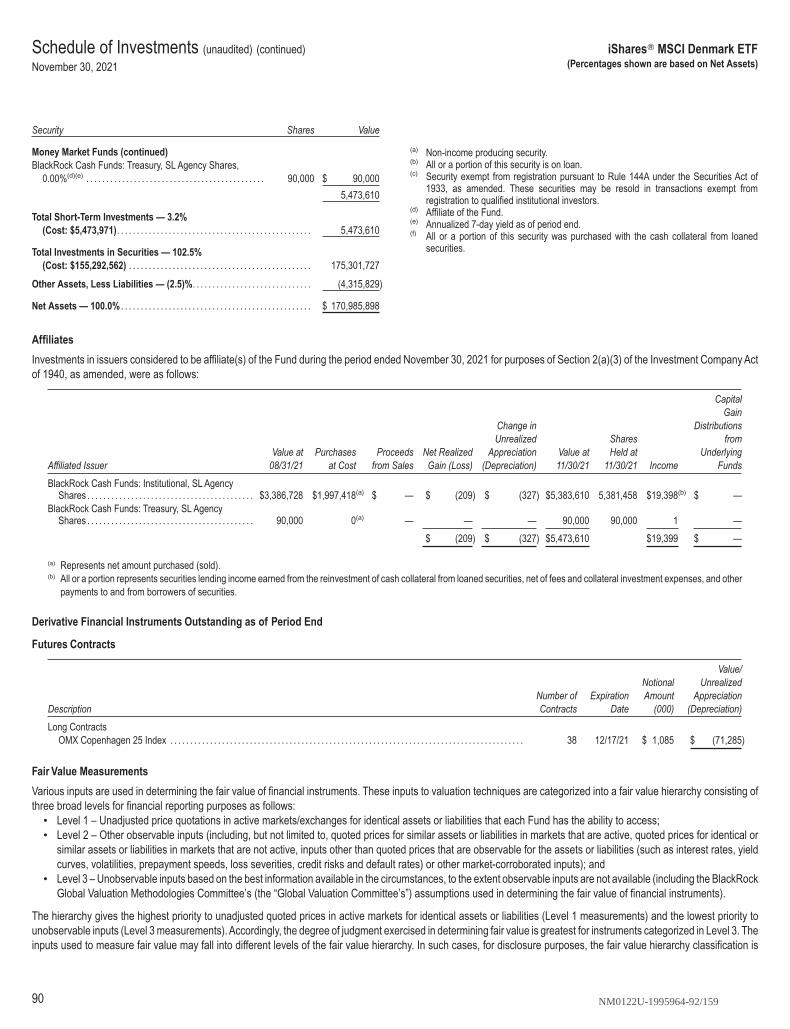
Security Shares
Value
Money Market Funds (continued)BlackRock Cash Funds: Treasury, SL Agency Shares,
0.00%(d)(e) . . . . . . . . . . . . . . . . . . . . . . . . . . . . . . . . . . . . . . . . . . . . . 90,000 $ 90,000
5,473,610
Total Short-Term Investments — 3.2%(Cost: $5,473,971). . . . . . . . . . . . . . . . . . . . . . . . . . . . . . . . . . . . . . . . . . . . . . . . . 5,473,610
Total Investments in Securities — 102.5%(Cost: $155,292,562) . . . . . . . . . . . . . . . . . . . . . . . . . . . . . . . . . . . . . . . . . . . . . . 175,301,727
Other Assets, Less Liabilities — (2.5)%. . . . . . . . . . . . . . . . . . . . . . . . . . . . . . (4,315,829)
Net Assets — 100.0% . . . . . . . . . . . . . . . . . . . . . . . . . . . . . . . . . . . . . . . . . . . . . . . . $ 170,985,898
(a) Non-income producing security.(b) All or a portion of this security is on loan.(c) Security exempt from registration pursuant to Rule 144A under the Securities Act of
1933, as amended. These securities may be resold in transactions exempt fromregistration to qualified institutional investors.
(d) Affiliate of the Fund.(e) Annualized 7-day yield as of period end.(f) All or a portion of this security was purchased with the cash collateral from loaned
securities.
Affiliates
Investments in issuers considered to be affiliate(s) of the Fund during the period ended November 30, 2021 for purposes of Section 2(a)(3) of the Investment Company Actof 1940, as amended, were as follows:
Affiliated IssuerValue at
08/31/21Purchases
at CostProceeds
from SalesNet Realized
Gain (Loss)
Change inUnrealized
Appreciation(Depreciation)
Value at11/30/21
SharesHeld at
11/30/21 Income
CapitalGain
Distributionsfrom
UnderlyingFunds
BlackRock Cash Funds: Institutional, SL AgencyShares . . . . . . . . . . . . . . . . . . . . . . . . . . . . . . . . . . . . . . . . . . $3,386,728 $1,997,418(a) $ — $ (209) $ (327) $5,383,610 5,381,458 $19,398(b) $ —
BlackRock Cash Funds: Treasury, SL AgencyShares . . . . . . . . . . . . . . . . . . . . . . . . . . . . . . . . . . . . . . . . . . 90,000 0(a)
— — — 90,000 90,000 1 —
$ (209) $ (327) $5,473,610 $19,399 $ —
(a) Represents net amount purchased (sold).(b) All or a portion represents securities lending income earned from the reinvestment of cash collateral from loaned securities, net of fees and collateral investment expenses, and other
payments to and from borrowers of securities.
Derivative Financial Instruments Outstanding as of Period End
Futures Contracts
DescriptionNumber ofContracts
ExpirationDate
NotionalAmount
(000)
Value/Unrealized
Appreciation(Depreciation)
Long ContractsOMX Copenhagen 25 Index . . . . . . . . . . . . . . . . . . . . . . . . . . . . . . . . . . . . . . . . . . . . . . . . . . . . . . . . . . . . . . . . . . . . . . . . . . . . . . . . . . . . . . . . . 38 12/17/21 $ 1,085 $ (71,285)
Fair Value Measurements
Various inputs are used in determining the fair value of financial instruments. These inputs to valuation techniques are categorized into a fair value hierarchy consisting ofthree broad levels for financial reporting purposes as follows:
• Level 1 – Unadjusted price quotations in active markets/exchanges for identical assets or liabilities that each Fund has the ability to access;• Level 2 – Other observable inputs (including, but not limited to, quoted prices for similar assets or liabilities in markets that are active, quoted prices for identical or
similar assets or liabilities in markets that are not active, inputs other than quoted prices that are observable for the assets or liabilities (such as interest rates, yieldcurves, volatilities, prepayment speeds, loss severities, credit risks and default rates) or other market-corroborated inputs); and
• Level 3 – Unobservable inputs based on the best information available in the circumstances, to the extent observable inputs are not available (including the BlackRockGlobal Valuation Methodologies Committee’s (the “Global Valuation Committee’s”) assumptions used in determining the fair value of financial instruments).
The hierarchy gives the highest priority to unadjusted quoted prices in active markets for identical assets or liabilities (Level 1 measurements) and the lowest priority tounobservable inputs (Level 3 measurements). Accordingly, the degree of judgment exercised in determining fair value is greatest for instruments categorized in Level 3. Theinputs used to measure fair value may fall into different levels of the fair value hierarchy. In such cases, for disclosure purposes, the fair value hierarchy classification is
Schedule of Investments (unaudited) (continued)
November 30, 2021
iShares� MSCI Denmark ETF(Percentages shown are based on Net Assets)
90 NM0122U-1995964-92/159

Fair Value Measurements (continued)
determined based on the lowest level input that is significant to the fair value measurement in its entirety. Investments classified within Level 3 have significant unobservableinputs used by the Global Valuation Committee in determining the price for Fair Valued Investments. Level 3 investments include equity or debt issued by privately heldcompanies or funds. There may not be a secondary market, and/or there are a limited number of investors. The categorization of a value determined for financial instrumentsis based on the pricing transparency of the financial instruments and is not necessarily an indication of the risks associated with investing in those securities. For informationabout the Fund’s policy regarding valuation of financial instruments, refer to its most recent financial statements.
The following table summarizes the Fund’s financial instruments categorized in the fair value hierarchy. The breakdown of the Fund’s financial instruments into majorcategories is disclosed in the Schedule of Investments above.
Level 1 Level 2 Level 3 Total
InvestmentsAssets
Common Stocks. . . . . . . . . . . . . . . . . . . . . . . . . . . . . . . . . . . . . . . . . . . . . . . . . . . . . . . . . . . . . . . . . . . . . . . . . . . . . . . . . . . . $ 15,794,958 $154,033,159 $ — $169,828,117Money Market Funds . . . . . . . . . . . . . . . . . . . . . . . . . . . . . . . . . . . . . . . . . . . . . . . . . . . . . . . . . . . . . . . . . . . . . . . . . . . . . . . 5,473,610 — — 5,473,610
$ 21,268,568 $154,033,159 $ — $175,301,727
Derivative financial instruments(a)
LiabilitiesFutures Contracts . . . . . . . . . . . . . . . . . . . . . . . . . . . . . . . . . . . . . . . . . . . . . . . . . . . . . . . . . . . . . . . . . . . . . . . . . . . . . . . . . . $ — $ (71,285) $ — $ (71,285)
(a) Derivative financial instruments are futures contracts. Futures contracts are valued at the unrealized appreciation (depreciation) on the instrument.
Portfolio Abbreviations - Equity
NVS . . . . . . . . . . . . . Non-Voting Shares
Schedule of Investments (unaudited) (continued)
November 30, 2021
iShares� MSCI Denmark ETF
91NM0122U-1995964-93/159

Security Shares
Value
Common StocksAirlines — 0.4%Finnair OYJ(a)(b). . . . . . . . . . . . . . . . . . . . . . . . . . . . . . . . . . . . . . . . . . . . . . 159,753 $ 102,475
Auto Components — 2.5%Nokian Renkaat OYJ. . . . . . . . . . . . . . . . . . . . . . . . . . . . . . . . . . . . . . . . . 17,019 632,492
Banks — 0.7%Aktia Bank OYJ . . . . . . . . . . . . . . . . . . . . . . . . . . . . . . . . . . . . . . . . . . . . . . 12,090 167,278
Beverages — 0.1%Anora Group OYJ . . . . . . . . . . . . . . . . . . . . . . . . . . . . . . . . . . . . . . . . . . . . 2,142 25,896
Building Products — 0.8%Uponor OYJ . . . . . . . . . . . . . . . . . . . . . . . . . . . . . . . . . . . . . . . . . . . . . . . . . 8,993 206,992
Chemicals — 1.0%Kemira OYJ . . . . . . . . . . . . . . . . . . . . . . . . . . . . . . . . . . . . . . . . . . . . . . . . . 16,929 251,162
Commercial Services & Supplies — 0.6%Caverion OYJ. . . . . . . . . . . . . . . . . . . . . . . . . . . . . . . . . . . . . . . . . . . . . . . . 21,314 147,934
Communications Equipment — 13.9%Nokia OYJ(a) . . . . . . . . . . . . . . . . . . . . . . . . . . . . . . . . . . . . . . . . . . . . . . . . . 626,702 3,512,448
Construction & Engineering — 0.5%YIT OYJ . . . . . . . . . . . . . . . . . . . . . . . . . . . . . . . . . . . . . . . . . . . . . . . . . . . . . 27,704 138,244
Containers & Packaging — 2.2%Huhtamaki OYJ . . . . . . . . . . . . . . . . . . . . . . . . . . . . . . . . . . . . . . . . . . . . . . 12,738 546,572
Diversified Telecommunication Services — 3.9%Elisa OYJ. . . . . . . . . . . . . . . . . . . . . . . . . . . . . . . . . . . . . . . . . . . . . . . . . . . . 16,187 971,981
Electric Utilities — 4.6%Fortum OYJ . . . . . . . . . . . . . . . . . . . . . . . . . . . . . . . . . . . . . . . . . . . . . . . . . 40,752 1,171,706
Entertainment — 0.5%Remedy Entertainment OYJ . . . . . . . . . . . . . . . . . . . . . . . . . . . . . . . . . . 571 25,547Rovio Entertainment OYJ(c). . . . . . . . . . . . . . . . . . . . . . . . . . . . . . . . . . . 13,372 102,892
128,439Food & Staples Retailing — 3.6%Kesko OYJ, Class B . . . . . . . . . . . . . . . . . . . . . . . . . . . . . . . . . . . . . . . . . 29,130 914,601
Health Care Equipment & Supplies — 0.5%Revenio Group OYJ. . . . . . . . . . . . . . . . . . . . . . . . . . . . . . . . . . . . . . . . . . 1,796 114,402
Health Care Providers & Services — 0.4%Oriola OYJ, Class B. . . . . . . . . . . . . . . . . . . . . . . . . . . . . . . . . . . . . . . . . . 45,897 101,874
Insurance — 10.8%Sampo OYJ, Class A. . . . . . . . . . . . . . . . . . . . . . . . . . . . . . . . . . . . . . . . . 55,565 2,726,427
IT Services — 1.5%TietoEVRY OYJ. . . . . . . . . . . . . . . . . . . . . . . . . . . . . . . . . . . . . . . . . . . . . . 12,580 367,186
Leisure Products — 0.1%Harvia OYJ . . . . . . . . . . . . . . . . . . . . . . . . . . . . . . . . . . . . . . . . . . . . . . . . . . 569 35,587
Machinery — 22.4%Cargotec OYJ, Class B. . . . . . . . . . . . . . . . . . . . . . . . . . . . . . . . . . . . . . . 5,782 270,167Kone OYJ, Class B . . . . . . . . . . . . . . . . . . . . . . . . . . . . . . . . . . . . . . . . . . 38,407 2,523,135Konecranes OYJ. . . . . . . . . . . . . . . . . . . . . . . . . . . . . . . . . . . . . . . . . . . . . 8,475 329,184Metso Outotec OYJ . . . . . . . . . . . . . . . . . . . . . . . . . . . . . . . . . . . . . . . . . . 77,918 785,250Neles OYJ. . . . . . . . . . . . . . . . . . . . . . . . . . . . . . . . . . . . . . . . . . . . . . . . . . . 14,742 219,955Valmet OYJ. . . . . . . . . . . . . . . . . . . . . . . . . . . . . . . . . . . . . . . . . . . . . . . . . . 17,202 703,910
Security Shares
Value
Machinery (continued)Wartsila OYJ Abp . . . . . . . . . . . . . . . . . . . . . . . . . . . . . . . . . . . . . . . . . . . . 59,059 $ 818,156
5,649,757Media — 0.8%Sanoma OYJ . . . . . . . . . . . . . . . . . . . . . . . . . . . . . . . . . . . . . . . . . . . . . . . . 13,110 198,223
Metals & Mining — 1.2%Outokumpu OYJ(a) . . . . . . . . . . . . . . . . . . . . . . . . . . . . . . . . . . . . . . . . . . . 51,771 301,849
Multiline Retail — 0.8%Puuilo OYJ(a) . . . . . . . . . . . . . . . . . . . . . . . . . . . . . . . . . . . . . . . . . . . . . . . . 2,898 24,189Tokmanni Group Corp. . . . . . . . . . . . . . . . . . . . . . . . . . . . . . . . . . . . . . . . 8,225 172,941
197,130Oil, Gas & Consumable Fuels — 9.0%Neste OYJ. . . . . . . . . . . . . . . . . . . . . . . . . . . . . . . . . . . . . . . . . . . . . . . . . . . 47,878 2,264,482
Paper & Forest Products — 9.8%Metsa Board OYJ, Class B . . . . . . . . . . . . . . . . . . . . . . . . . . . . . . . . . . . 26,546 256,028Stora Enso OYJ, Class R. . . . . . . . . . . . . . . . . . . . . . . . . . . . . . . . . . . . . 62,819 1,063,478UPM-Kymmene OYJ . . . . . . . . . . . . . . . . . . . . . . . . . . . . . . . . . . . . . . . . . 32,021 1,161,110
2,480,616Pharmaceuticals — 2.3%Orion OYJ, Class B . . . . . . . . . . . . . . . . . . . . . . . . . . . . . . . . . . . . . . . . . . 13,869 570,905
Professional Services — 0.1%Talenom OYJ . . . . . . . . . . . . . . . . . . . . . . . . . . . . . . . . . . . . . . . . . . . . . . . . 1,768 25,304
Real Estate Management & Development — 1.5%Citycon OYJ . . . . . . . . . . . . . . . . . . . . . . . . . . . . . . . . . . . . . . . . . . . . . . . . . 15,625 121,478Kojamo OYJ . . . . . . . . . . . . . . . . . . . . . . . . . . . . . . . . . . . . . . . . . . . . . . . . . 11,272 259,251
380,729Software — 2.0%Admicom OYJ . . . . . . . . . . . . . . . . . . . . . . . . . . . . . . . . . . . . . . . . . . . . . . . 282 25,106BasWare OYJ(a) . . . . . . . . . . . . . . . . . . . . . . . . . . . . . . . . . . . . . . . . . . . . . 2,793 99,935F-Secure OYJ . . . . . . . . . . . . . . . . . . . . . . . . . . . . . . . . . . . . . . . . . . . . . . . 23,740 137,579QT Group OYJ(a). . . . . . . . . . . . . . . . . . . . . . . . . . . . . . . . . . . . . . . . . . . . . 1,592 241,276
503,896Specialty Retail — 0.9%Kamux Corp.(b) . . . . . . . . . . . . . . . . . . . . . . . . . . . . . . . . . . . . . . . . . . . . . . 2,047 26,140Musti Group OYJ . . . . . . . . . . . . . . . . . . . . . . . . . . . . . . . . . . . . . . . . . . . . 5,739 194,546
220,686Textiles, Apparel & Luxury Goods — 0.2%Marimekko OYJ. . . . . . . . . . . . . . . . . . . . . . . . . . . . . . . . . . . . . . . . . . . . . . 270 26,640Spinnova OYJ . . . . . . . . . . . . . . . . . . . . . . . . . . . . . . . . . . . . . . . . . . . . . . . 1,549 25,455
52,095
Total Common Stocks — 99.6%(Cost: $27,717,201). . . . . . . . . . . . . . . . . . . . . . . . . . . . . . . . . . . . . . . . . . . . . . . . . 25,109,368
Short-Term InvestmentsMoney Market Funds — 0.2%BlackRock Cash Funds: Institutional, SL Agency Shares,
0.06%(d)(e)(f) . . . . . . . . . . . . . . . . . . . . . . . . . . . . . . . . . . . . . . . . . . . . . . . 33,794 33,808
Schedule of Investments (unaudited)
November 30, 2021
iShares� MSCI Finland ETF(Percentages shown are based on Net Assets)
92 NM0122U-1995964-94/159

Security Shares
Value
Money Market Funds (continued)BlackRock Cash Funds: Treasury, SL Agency Shares,
0.00%(d)(e) . . . . . . . . . . . . . . . . . . . . . . . . . . . . . . . . . . . . . . . . . . . . . . . . 25,000 $ 25,000
58,808
Total Short-Term Investments — 0.2%(Cost: $58,808) . . . . . . . . . . . . . . . . . . . . . . . . . . . . . . . . . . . . . . . . . . . . . . . . . . . . . 58,808
Total Investments in Securities — 99.8%(Cost: $27,776,009). . . . . . . . . . . . . . . . . . . . . . . . . . . . . . . . . . . . . . . . . . . . . . . . . 25,168,176
Other Assets, Less Liabilities — 0.2% . . . . . . . . . . . . . . . . . . . . . . . . . . . . . . . . 45,898
Net Assets — 100.0% . . . . . . . . . . . . . . . . . . . . . . . . . . . . . . . . . . . . . . . . . . . . . . . . . $ 25,214,074
(a) Non-income producing security.(b) All or a portion of this security is on loan.(c) Security exempt from registration pursuant to Rule 144A under the Securities Act of
1933, as amended. These securities may be resold in transactions exempt fromregistration to qualified institutional investors.
(d) Affiliate of the Fund.(e) Annualized 7-day yield as of period end.(f) All or a portion of this security was purchased with the cash collateral from loaned
securities.
Affiliates
Investments in issuers considered to be affiliate(s) of the Fund during the period ended November 30, 2021 for purposes of Section 2(a)(3) of the Investment Company Actof 1940, as amended, were as follows:
Affiliated IssuerValue at
08/31/21Purchases
at CostProceeds
from SalesNet Realized
Gain (Loss)
Change inUnrealized
Appreciation(Depreciation)
Value at11/30/21
SharesHeld at
11/30/21 Income
CapitalGain
Distributionsfrom
UnderlyingFunds
BlackRock Cash Funds: Institutional, SL Agency Shares. . . . . $143,228 $ — $(109,407)(a) $ (13) $ — $ 33,808 33,794 $ 564(b) $ —BlackRock Cash Funds: Treasury, SL Agency Shares . . . . . . . 165,000 — (140,000)(a)
— — 25,000 25,000 1 —
$ (13) $ — $ 58,808 $ 565 $ —
(a) Represents net amount purchased (sold).(b) All or a portion represents securities lending income earned from the reinvestment of cash collateral from loaned securities, net of fees and collateral investment expenses, and other
payments to and from borrowers of securities.
Derivative Financial Instruments Outstanding as of Period End
Futures Contracts
DescriptionNumber ofContracts
ExpirationDate
NotionalAmount
(000)
Value/Unrealized
Appreciation(Depreciation)
Long ContractsEuro STOXX 50 Index . . . . . . . . . . . . . . . . . . . . . . . . . . . . . . . . . . . . . . . . . . . . . . . . . . . . . . . . . . . . . . . . . . . . . . . . . . . . . . . . . . . . . . . . . . . . . . . 2 12/17/21 $ 92 $ 656
Fair Value Measurements
Various inputs are used in determining the fair value of financial instruments. These inputs to valuation techniques are categorized into a fair value hierarchy consisting ofthree broad levels for financial reporting purposes as follows:
• Level 1 – Unadjusted price quotations in active markets/exchanges for identical assets or liabilities that each Fund has the ability to access;• Level 2 – Other observable inputs (including, but not limited to, quoted prices for similar assets or liabilities in markets that are active, quoted prices for identical or
similar assets or liabilities in markets that are not active, inputs other than quoted prices that are observable for the assets or liabilities (such as interest rates, yieldcurves, volatilities, prepayment speeds, loss severities, credit risks and default rates) or other market-corroborated inputs); and
• Level 3 – Unobservable inputs based on the best information available in the circumstances, to the extent observable inputs are not available (including the BlackRockGlobal Valuation Methodologies Committee’s (the “Global Valuation Committee’s”) assumptions used in determining the fair value of financial instruments).
The hierarchy gives the highest priority to unadjusted quoted prices in active markets for identical assets or liabilities (Level 1 measurements) and the lowest priority tounobservable inputs (Level 3 measurements). Accordingly, the degree of judgment exercised in determining fair value is greatest for instruments categorized in Level 3. Theinputs used to measure fair value may fall into different levels of the fair value hierarchy. In such cases, for disclosure purposes, the fair value hierarchy classification isdetermined based on the lowest level input that is significant to the fair value measurement in its entirety. Investments classified within Level 3 have significant unobservableinputs used by the Global Valuation Committee in determining the price for Fair Valued Investments. Level 3 investments include equity or debt issued by privately held
Schedule of Investments (unaudited) (continued)
November 30, 2021
iShares� MSCI Finland ETF(Percentages shown are based on Net Assets)
93NM0122U-1995964-95/159

Fair Value Measurements (continued)
companies or funds. There may not be a secondary market, and/or there are a limited number of investors. The categorization of a value determined for financial instrumentsis based on the pricing transparency of the financial instruments and is not necessarily an indication of the risks associated with investing in those securities. For informationabout the Fund’s policy regarding valuation of financial instruments, refer to its most recent financial statements.
The following table summarizes the Fund’s financial instruments categorized in the fair value hierarchy. The breakdown of the Fund’s financial instruments into majorcategories is disclosed in the Schedule of Investments above.
Level 1 Level 2 Level 3 Total
InvestmentsAssets
Common Stocks . . . . . . . . . . . . . . . . . . . . . . . . . . . . . . . . . . . . . . . . . . . . . . . . . . . . . . . . . . . . . . . . . . . . . . . . . . . . . . . . . . . . . . . . $ 1,227,504 $23,881,864 $ — $25,109,368Money Market Funds . . . . . . . . . . . . . . . . . . . . . . . . . . . . . . . . . . . . . . . . . . . . . . . . . . . . . . . . . . . . . . . . . . . . . . . . . . . . . . . . . . . . 58,808 — — 58,808
$ 1,286,312 $23,881,864 $ — $25,168,176
Derivative financial instruments(a)
AssetsFutures Contracts . . . . . . . . . . . . . . . . . . . . . . . . . . . . . . . . . . . . . . . . . . . . . . . . . . . . . . . . . . . . . . . . . . . . . . . . . . . . . . . . . . . . . . . $ — $ 656 $ — $ 656
(a) Derivative financial instruments are futures contracts. Futures contracts are valued at the unrealized appreciation (depreciation) on the instrument.
Schedule of Investments (unaudited) (continued)
November 30, 2021
iShares� MSCI Finland ETF
94 NM0122U-1995964-96/159

Security Shares
Value
Common StocksAerospace & Defense — 0.5%Hensoldt AG . . . . . . . . . . . . . . . . . . . . . . . . . . . . . . . . . . . . . . . . . . . . . . . 9,965 $ 142,281OHB SE . . . . . . . . . . . . . . . . . . . . . . . . . . . . . . . . . . . . . . . . . . . . . . . . . . . 1,243 47,506
189,787Auto Components — 1.2%ElringKlinger AG(a)(b) . . . . . . . . . . . . . . . . . . . . . . . . . . . . . . . . . . . . . . . 6,765 82,224SAF-Holland SE(a) . . . . . . . . . . . . . . . . . . . . . . . . . . . . . . . . . . . . . . . . . 10,770 136,678Vitesco Technologies Group AG(a). . . . . . . . . . . . . . . . . . . . . . . . . . . 5,222 232,153
451,055Biotechnology — 0.8%MorphoSys AG(a). . . . . . . . . . . . . . . . . . . . . . . . . . . . . . . . . . . . . . . . . . . 8,122 327,704
Building Products — 0.4%Steico SE. . . . . . . . . . . . . . . . . . . . . . . . . . . . . . . . . . . . . . . . . . . . . . . . . . 1,337 155,473
Capital Markets — 1.7%AURELIUS Equity Opportunities SE & Co. KGaA . . . . . . . . . . . . 7,063 209,780Deutsche Beteiligungs AG . . . . . . . . . . . . . . . . . . . . . . . . . . . . . . . . . . 3,123 137,087flatexDEGIRO AG(a) . . . . . . . . . . . . . . . . . . . . . . . . . . . . . . . . . . . . . . . . 7,809 187,445MLP SE . . . . . . . . . . . . . . . . . . . . . . . . . . . . . . . . . . . . . . . . . . . . . . . . . . . 15,564 140,680
674,992Chemicals — 3.6%K+S AG, Registered(a) . . . . . . . . . . . . . . . . . . . . . . . . . . . . . . . . . . . . . . 45,412 771,359Wacker Chemie AG . . . . . . . . . . . . . . . . . . . . . . . . . . . . . . . . . . . . . . . . 3,712 638,460
1,409,819Commercial Services & Supplies — 2.7%Befesa SA . . . . . . . . . . . . . . . . . . . . . . . . . . . . . . . . . . . . . . . . . . . . . . . . . 9,490 627,980Bilfinger SE . . . . . . . . . . . . . . . . . . . . . . . . . . . . . . . . . . . . . . . . . . . . . . . . 6,818 218,561Cewe Stiftung & Co. KGaA . . . . . . . . . . . . . . . . . . . . . . . . . . . . . . . . . 1,321 190,264
1,036,805Communications Equipment — 0.4%ADVA Optical Networking SE(a) . . . . . . . . . . . . . . . . . . . . . . . . . . . . . 10,245 147,453
Construction & Engineering — 1.0%HOCHTIEF AG. . . . . . . . . . . . . . . . . . . . . . . . . . . . . . . . . . . . . . . . . . . . . 5,028 377,483
Diversified Financial Services — 1.8%GRENKE AG(b) . . . . . . . . . . . . . . . . . . . . . . . . . . . . . . . . . . . . . . . . . . . . 6,619 226,969Hypoport SE(a) . . . . . . . . . . . . . . . . . . . . . . . . . . . . . . . . . . . . . . . . . . . . . 847 462,312
689,281Electrical Equipment — 3.4%Energiekontor AG, NVS . . . . . . . . . . . . . . . . . . . . . . . . . . . . . . . . . . . . 1,508 127,412Nordex SE(a)(b) . . . . . . . . . . . . . . . . . . . . . . . . . . . . . . . . . . . . . . . . . . . . . 24,678 439,056PNE AG . . . . . . . . . . . . . . . . . . . . . . . . . . . . . . . . . . . . . . . . . . . . . . . . . . . 8,174 71,966SGL Carbon SE(a)(b) . . . . . . . . . . . . . . . . . . . . . . . . . . . . . . . . . . . . . . . . 14,513 126,719Varta AG(b). . . . . . . . . . . . . . . . . . . . . . . . . . . . . . . . . . . . . . . . . . . . . . . . . 4,316 551,789
1,316,942Electronic Equipment, Instruments & Components — 1.9%Basler AG. . . . . . . . . . . . . . . . . . . . . . . . . . . . . . . . . . . . . . . . . . . . . . . . . . 872 145,176Jenoptik AG. . . . . . . . . . . . . . . . . . . . . . . . . . . . . . . . . . . . . . . . . . . . . . . . 12,222 494,614LPKF Laser & Electronics AG(b) . . . . . . . . . . . . . . . . . . . . . . . . . . . . . 5,812 115,079
754,869Entertainment — 2.8%Borussia Dortmund GmbH & Co. KGaA(a) . . . . . . . . . . . . . . . . . . . 18,335 85,628CTS Eventim AG & Co. KGaA(a) . . . . . . . . . . . . . . . . . . . . . . . . . . . . 13,666 888,106Media and Games Invest SE(a)(b). . . . . . . . . . . . . . . . . . . . . . . . . . . . 21,308 123,901
1,097,635
Security Shares
Value
Equity Real Estate Investment Trusts (REITs) — 2.6%alstria office REIT-AG(b) . . . . . . . . . . . . . . . . . . . . . . . . . . . . . . . . . . . . 38,016 $ 839,925Hamborner REIT AG . . . . . . . . . . . . . . . . . . . . . . . . . . . . . . . . . . . . . . . 16,405 175,103
1,015,028Food & Staples Retailing — 2.4%METRO AG . . . . . . . . . . . . . . . . . . . . . . . . . . . . . . . . . . . . . . . . . . . . . . . . 29,905 338,511Shop Apotheke Europe NV(a)(b) . . . . . . . . . . . . . . . . . . . . . . . . . . . . . 3,220 583,503
922,014Food Products — 1.2%KWS Saat SE & Co. KGaA . . . . . . . . . . . . . . . . . . . . . . . . . . . . . . . . . 2,740 227,464Suedzucker AG . . . . . . . . . . . . . . . . . . . . . . . . . . . . . . . . . . . . . . . . . . . . 16,956 245,561
473,025Health Care Equipment & Supplies — 1.8%Draegerwerk AG & Co. KGaA. . . . . . . . . . . . . . . . . . . . . . . . . . . . . . . 723 42,399Eckert & Ziegler Strahlen- und Medizintechnik AG . . . . . . . . . . . 3,516 387,195Stratec SE . . . . . . . . . . . . . . . . . . . . . . . . . . . . . . . . . . . . . . . . . . . . . . . . . 1,868 283,364
712,958Health Care Providers & Services — 1.0%Medios AG(a). . . . . . . . . . . . . . . . . . . . . . . . . . . . . . . . . . . . . . . . . . . . . . . 2,404 107,419Synlab AG, NVS(a) . . . . . . . . . . . . . . . . . . . . . . . . . . . . . . . . . . . . . . . . . 10,545 270,276
377,695Health Care Technology — 1.3%CompuGroup Medical SE & Co. KgaA. . . . . . . . . . . . . . . . . . . . . . . 6,375 487,851
Hotels, Restaurants & Leisure — 0.4%Zeal Network SE(b) . . . . . . . . . . . . . . . . . . . . . . . . . . . . . . . . . . . . . . . . . 3,454 150,069
Independent Power and Renewable Electricity Producers — 1.1%Encavis AG(b) . . . . . . . . . . . . . . . . . . . . . . . . . . . . . . . . . . . . . . . . . . . . . . 23,146 427,959
Industrial Conglomerates — 2.9%Indus Holding AG . . . . . . . . . . . . . . . . . . . . . . . . . . . . . . . . . . . . . . . . . . 4,467 149,955MBB SE . . . . . . . . . . . . . . . . . . . . . . . . . . . . . . . . . . . . . . . . . . . . . . . . . . . 493 66,878Rheinmetall AG . . . . . . . . . . . . . . . . . . . . . . . . . . . . . . . . . . . . . . . . . . . . 10,335 916,418
1,133,251Insurance — 0.3%Wuestenrot & Wuerttembergische AG . . . . . . . . . . . . . . . . . . . . . . . 5,561 107,971
Interactive Media & Services — 0.4%New Work SE . . . . . . . . . . . . . . . . . . . . . . . . . . . . . . . . . . . . . . . . . . . . . . 667 150,230
Internet & Direct Marketing Retail — 2.0%ABOUT YOU Holding SE, NVS(a) . . . . . . . . . . . . . . . . . . . . . . . . . . . 8,833 234,410Bike24 Holding AG, NVS(a) . . . . . . . . . . . . . . . . . . . . . . . . . . . . . . . . . 4,716 99,320Global Fashion Group SA(a)(b) . . . . . . . . . . . . . . . . . . . . . . . . . . . . . . 18,040 138,918Home24 SE(a)(b). . . . . . . . . . . . . . . . . . . . . . . . . . . . . . . . . . . . . . . . . . . . 6,250 87,255Takkt AG. . . . . . . . . . . . . . . . . . . . . . . . . . . . . . . . . . . . . . . . . . . . . . . . . . . 7,783 126,695Westwing Group AG(a)(b). . . . . . . . . . . . . . . . . . . . . . . . . . . . . . . . . . . . 2,728 77,399
763,997IT Services — 4.9%Adesso SE. . . . . . . . . . . . . . . . . . . . . . . . . . . . . . . . . . . . . . . . . . . . . . . . . 661 140,333CANCOM SE . . . . . . . . . . . . . . . . . . . . . . . . . . . . . . . . . . . . . . . . . . . . . . 9,146 659,206Datagroup SE(a). . . . . . . . . . . . . . . . . . . . . . . . . . . . . . . . . . . . . . . . . . . . 990 93,301GFT Technologies SE . . . . . . . . . . . . . . . . . . . . . . . . . . . . . . . . . . . . . . 4,060 175,890Nagarro SE(a) . . . . . . . . . . . . . . . . . . . . . . . . . . . . . . . . . . . . . . . . . . . . . . 2,060 425,197S&T AG(b) . . . . . . . . . . . . . . . . . . . . . . . . . . . . . . . . . . . . . . . . . . . . . . . . . 11,761 253,459Secunet Security Networks AG . . . . . . . . . . . . . . . . . . . . . . . . . . . . . 308 144,902
1,892,288Life Sciences Tools & Services — 5.6%Evotec SE(a) . . . . . . . . . . . . . . . . . . . . . . . . . . . . . . . . . . . . . . . . . . . . . . . 31,245 1,479,193
Schedule of Investments (unaudited)
November 30, 2021
iShares� MSCI Germany Small-Cap ETF(Percentages shown are based on Net Assets)
95NM0122U-1995964-97/159

Security Shares
Value
Life Sciences Tools & Services (continued)Gerresheimer AG . . . . . . . . . . . . . . . . . . . . . . . . . . . . . . . . . . . . . . . . . . 7,450 $ 683,407
2,162,600Machinery — 6.9%Deutz AG(a) . . . . . . . . . . . . . . . . . . . . . . . . . . . . . . . . . . . . . . . . . . . . . . . . 28,676 193,296Duerr AG . . . . . . . . . . . . . . . . . . . . . . . . . . . . . . . . . . . . . . . . . . . . . . . . . . 12,314 490,316Heidelberger Druckmaschinen AG(a) . . . . . . . . . . . . . . . . . . . . . . . . 61,405 168,179JOST Werke AG . . . . . . . . . . . . . . . . . . . . . . . . . . . . . . . . . . . . . . . . . . . 3,358 172,136Koenig & Bauer AG(a) . . . . . . . . . . . . . . . . . . . . . . . . . . . . . . . . . . . . . . 3,333 107,162Krones AG. . . . . . . . . . . . . . . . . . . . . . . . . . . . . . . . . . . . . . . . . . . . . . . . . 3,373 341,607Norma Group SE. . . . . . . . . . . . . . . . . . . . . . . . . . . . . . . . . . . . . . . . . . . 7,560 276,962Pfeiffer Vacuum Technology AG. . . . . . . . . . . . . . . . . . . . . . . . . . . . . 936 223,980Stabilus SA . . . . . . . . . . . . . . . . . . . . . . . . . . . . . . . . . . . . . . . . . . . . . . . . 5,860 389,778Vossloh AG . . . . . . . . . . . . . . . . . . . . . . . . . . . . . . . . . . . . . . . . . . . . . . . . 2,084 106,499Wacker Neuson SE . . . . . . . . . . . . . . . . . . . . . . . . . . . . . . . . . . . . . . . . 7,489 219,328
2,689,243Media — 2.8%ProSiebenSat.1 Media SE . . . . . . . . . . . . . . . . . . . . . . . . . . . . . . . . . . 38,697 568,504Stroeer SE & Co. KGaA . . . . . . . . . . . . . . . . . . . . . . . . . . . . . . . . . . . . 6,723 518,851
1,087,355Metals & Mining — 5.0%Aurubis AG . . . . . . . . . . . . . . . . . . . . . . . . . . . . . . . . . . . . . . . . . . . . . . . . 7,466 639,700Salzgitter AG(a). . . . . . . . . . . . . . . . . . . . . . . . . . . . . . . . . . . . . . . . . . . . . 8,555 253,021thyssenkrupp AG(a). . . . . . . . . . . . . . . . . . . . . . . . . . . . . . . . . . . . . . . . . 96,006 1,052,684
1,945,405Oil, Gas & Consumable Fuels — 1.3%CropEnergies AG . . . . . . . . . . . . . . . . . . . . . . . . . . . . . . . . . . . . . . . . . . 6,210 82,943VERBIO Vereinigte BioEnergie AG . . . . . . . . . . . . . . . . . . . . . . . . . . 5,247 405,807
488,750Pharmaceuticals — 1.1%Dermapharm Holding SE . . . . . . . . . . . . . . . . . . . . . . . . . . . . . . . . . . . 4,471 410,828
Professional Services — 0.9%Amadeus Fire AG . . . . . . . . . . . . . . . . . . . . . . . . . . . . . . . . . . . . . . . . . . 1,357 278,859Bertrandt AG. . . . . . . . . . . . . . . . . . . . . . . . . . . . . . . . . . . . . . . . . . . . . . . 1,324 87,833
366,692Real Estate Management & Development — 6.7%ADLER Group SA . . . . . . . . . . . . . . . . . . . . . . . . . . . . . . . . . . . . . . . . . . 18,122 177,468Corestate Capital Holding SA(a)(b) . . . . . . . . . . . . . . . . . . . . . . . . . . . 4,864 42,236Deutsche EuroShop AG . . . . . . . . . . . . . . . . . . . . . . . . . . . . . . . . . . . . 11,727 186,600DIC Asset AG . . . . . . . . . . . . . . . . . . . . . . . . . . . . . . . . . . . . . . . . . . . . . . 10,682 174,565Grand City Properties SA . . . . . . . . . . . . . . . . . . . . . . . . . . . . . . . . . . . 25,081 594,486Instone Real Estate Group AG . . . . . . . . . . . . . . . . . . . . . . . . . . . . . . 11,148 233,895PATRIZIA AG . . . . . . . . . . . . . . . . . . . . . . . . . . . . . . . . . . . . . . . . . . . . . . 10,956 248,256TAG Immobilien AG . . . . . . . . . . . . . . . . . . . . . . . . . . . . . . . . . . . . . . . . 34,758 963,344
2,620,850Road & Rail — 1.3%Sixt SE(a) . . . . . . . . . . . . . . . . . . . . . . . . . . . . . . . . . . . . . . . . . . . . . . . . . . 3,242 526,123
Semiconductors & Semiconductor Equipment — 4.1%AIXTRON SE . . . . . . . . . . . . . . . . . . . . . . . . . . . . . . . . . . . . . . . . . . . . . . 26,858 539,783Elmos Semiconductor SE. . . . . . . . . . . . . . . . . . . . . . . . . . . . . . . . . . . 2,146 106,843PVA TePla AG, NVS(a) . . . . . . . . . . . . . . . . . . . . . . . . . . . . . . . . . . . . . . 4,644 226,997Siltronic AG . . . . . . . . . . . . . . . . . . . . . . . . . . . . . . . . . . . . . . . . . . . . . . . . 3,915 598,346SMA Solar Technology AG. . . . . . . . . . . . . . . . . . . . . . . . . . . . . . . . . . 2,470 119,771
1,591,740Software — 3.6%Atoss Software AG . . . . . . . . . . . . . . . . . . . . . . . . . . . . . . . . . . . . . . . . . 943 222,447Northern Data AG(a)(b) . . . . . . . . . . . . . . . . . . . . . . . . . . . . . . . . . . . . . . 1,170 145,428Software AG . . . . . . . . . . . . . . . . . . . . . . . . . . . . . . . . . . . . . . . . . . . . . . . 12,290 521,820
Security Shares
Value
Software (continued)TeamViewer AG(a) . . . . . . . . . . . . . . . . . . . . . . . . . . . . . . . . . . . . . . . . . . 38,165 $ 518,962
1,408,657Specialty Retail — 2.5%Ceconomy AG(a) . . . . . . . . . . . . . . . . . . . . . . . . . . . . . . . . . . . . . . . . . . . 38,088 151,143Fielmann AG. . . . . . . . . . . . . . . . . . . . . . . . . . . . . . . . . . . . . . . . . . . . . . . 5,979 391,929Hornbach Baumarkt AG . . . . . . . . . . . . . . . . . . . . . . . . . . . . . . . . . . . . 1,887 77,042Hornbach Holding AG & Co. KGaA. . . . . . . . . . . . . . . . . . . . . . . . . . 2,278 285,756Mister Spex SE, NVS(a). . . . . . . . . . . . . . . . . . . . . . . . . . . . . . . . . . . . . 3,710 52,173
958,043Textiles, Apparel & Luxury Goods — 2.1%Hugo Boss AG . . . . . . . . . . . . . . . . . . . . . . . . . . . . . . . . . . . . . . . . . . . . . 14,198 827,365
Thrifts & Mortgage Finance — 2.2%Aareal Bank AG(b) . . . . . . . . . . . . . . . . . . . . . . . . . . . . . . . . . . . . . . . . . . 14,202 466,379Deutsche Pfandbriefbank AG . . . . . . . . . . . . . . . . . . . . . . . . . . . . . . . 31,906 372,167
838,546Trading Companies & Distributors — 0.8%BayWa AG. . . . . . . . . . . . . . . . . . . . . . . . . . . . . . . . . . . . . . . . . . . . . . . . . 3,243 135,346Kloeckner & Co. SE(a) . . . . . . . . . . . . . . . . . . . . . . . . . . . . . . . . . . . . . . 17,750 190,861
326,207Transportation Infrastructure — 1.8%Fraport AG Frankfurt Airport Services Worldwide(a)(b). . . . . . . . . 8,776 545,999Hamburger Hafen und Logistik AG . . . . . . . . . . . . . . . . . . . . . . . . . . 7,139 157,636
703,635Wireless Telecommunication Services — 2.7%1&1 AG. . . . . . . . . . . . . . . . . . . . . . . . . . . . . . . . . . . . . . . . . . . . . . . . . . . . 10,485 298,226Freenet AG . . . . . . . . . . . . . . . . . . . . . . . . . . . . . . . . . . . . . . . . . . . . . . . . 30,384 770,486
1,068,712
Total Common Stocks — 95.9%(Cost: $35,563,125). . . . . . . . . . . . . . . . . . . . . . . . . . . . . . . . . . . . . . . . . . . . . . . . . 37,264,385
Preferred StocksAuto Components — 0.6%Schaeffler AG, Preference Shares, NVS. . . . . . . . . . . . . . . . . . . . . 29,539 229,476
Construction Materials — 0.4%STO SE & Co. KGaA, Preference Shares, NVS. . . . . . . . . . . . . . 602 140,984
Health Care Equipment & Supplies — 0.3%Draegerwerk AG & Co. KGaA, Preference Shares, NVS. . . . . . 2,040 131,941
Household Durables — 0.2%Einhell Germany AG Vorzug, Preference Shares, NVS . . . . . . . 399 94,121
Machinery — 1.4%Jungheinrich AG, Preference Shares, NVS . . . . . . . . . . . . . . . . . . 11,388 533,654
Road & Rail — 0.9%Sixt SE, Preference Shares, NVS . . . . . . . . . . . . . . . . . . . . . . . . . . . 3,933 357,721
Total Preferred Stocks — 3.8%(Cost: $1,364,073) . . . . . . . . . . . . . . . . . . . . . . . . . . . . . . . . . . . . . . . . . . . . . . . . . . 1,487,897
Short-Term InvestmentsMoney Market Funds — 8.6%BlackRock Cash Funds: Institutional, SL Agency Shares,
0.06%(c)(d)(e). . . . . . . . . . . . . . . . . . . . . . . . . . . . . . . . . . . . . . . . . . . . . 3,318,819 3,320,146
Schedule of Investments (unaudited) (continued)
November 30, 2021
iShares� MSCI Germany Small-Cap ETF(Percentages shown are based on Net Assets)
96 NM0122U-1995964-98/159

Security Shares
Value
Money Market Funds (continued)BlackRock Cash Funds: Treasury, SL Agency Shares,
0.00%(c)(d). . . . . . . . . . . . . . . . . . . . . . . . . . . . . . . . . . . . . . . . . . . . . . . 20,000 $ 20,000
3,340,146
Total Short-Term Investments — 8.6%(Cost: $3,339,484) . . . . . . . . . . . . . . . . . . . . . . . . . . . . . . . . . . . . . . . . . . . . . . . . . . 3,340,146
Total Investments in Securities — 108.3%(Cost: $40,266,682). . . . . . . . . . . . . . . . . . . . . . . . . . . . . . . . . . . . . . . . . . . . . . . . . 42,092,428
Other Assets, Less Liabilities — (8.3)% . . . . . . . . . . . . . . . . . . . . . . . . . . . . . . . (3,208,792)
Net Assets — 100.0% . . . . . . . . . . . . . . . . . . . . . . . . . . . . . . . . . . . . . . . . . . . . . . . . . $ 38,883,636
(a) Non-income producing security.(b) All or a portion of this security is on loan.(c) Affiliate of the Fund.(d) Annualized 7-day yield as of period end.(e) All or a portion of this security was purchased with the cash collateral from loaned
securities.
Affiliates
Investments in issuers considered to be affiliate(s) of the Fund during the period ended November 30, 2021 for purposes of Section 2(a)(3) of the Investment Company Actof 1940, as amended, were as follows:
Affiliated IssuerValue at
08/31/21Purchases
at CostProceeds
from SalesNet Realized
Gain (Loss)
Change inUnrealized
Appreciation(Depreciation)
Value at11/30/21
SharesHeld at
11/30/21 Income
CapitalGain
Distributionsfrom
UnderlyingFunds
BlackRock Cash Funds: Institutional, SL AgencyShares . . . . . . . . . . . . . . . . . . . . . . . . . . . . . . . . . . . . . . . . . $3,634,912 $ — $(314,462)(a) $ (156) $ (148) $3,320,146 3,318,819 $16,637(b) $ —
BlackRock Cash Funds: Treasury, SL AgencyShares . . . . . . . . . . . . . . . . . . . . . . . . . . . . . . . . . . . . . . . . . 10,000 10,000(a)
— — — 20,000 20,000 — —
$ (156) $ (148) $3,340,146 $16,637 $ —
(a) Represents net amount purchased (sold).(b) All or a portion represents securities lending income earned from the reinvestment of cash collateral from loaned securities, net of fees and collateral investment expenses, and other
payments to and from borrowers of securities.
Derivative Financial Instruments Outstanding as of Period End
Futures Contracts
DescriptionNumber ofContracts
ExpirationDate
NotionalAmount
(000)
Value/Unrealized
Appreciation(Depreciation)
Long ContractsEuro STOXX 50 Index . . . . . . . . . . . . . . . . . . . . . . . . . . . . . . . . . . . . . . . . . . . . . . . . . . . . . . . . . . . . . . . . . . . . . . . . . . . . . . . . . . . . . . . . . . . . . . . 2 12/17/21 $ 92 $ (1,214)
Fair Value Measurements
Various inputs are used in determining the fair value of financial instruments. These inputs to valuation techniques are categorized into a fair value hierarchy consisting ofthree broad levels for financial reporting purposes as follows:
• Level 1 – Unadjusted price quotations in active markets/exchanges for identical assets or liabilities that each Fund has the ability to access;• Level 2 – Other observable inputs (including, but not limited to, quoted prices for similar assets or liabilities in markets that are active, quoted prices for identical or
similar assets or liabilities in markets that are not active, inputs other than quoted prices that are observable for the assets or liabilities (such as interest rates, yieldcurves, volatilities, prepayment speeds, loss severities, credit risks and default rates) or other market-corroborated inputs); and
• Level 3 – Unobservable inputs based on the best information available in the circumstances, to the extent observable inputs are not available (including the BlackRockGlobal Valuation Methodologies Committee’s (the “Global Valuation Committee’s”) assumptions used in determining the fair value of financial instruments).
The hierarchy gives the highest priority to unadjusted quoted prices in active markets for identical assets or liabilities (Level 1 measurements) and the lowest priority tounobservable inputs (Level 3 measurements). Accordingly, the degree of judgment exercised in determining fair value is greatest for instruments categorized in Level 3. Theinputs used to measure fair value may fall into different levels of the fair value hierarchy. In such cases, for disclosure purposes, the fair value hierarchy classification is
Schedule of Investments (unaudited) (continued)
November 30, 2021
iShares� MSCI Germany Small-Cap ETF(Percentages shown are based on Net Assets)
97NM0122U-1995964-99/159

Fair Value Measurements (continued)
determined based on the lowest level input that is significant to the fair value measurement in its entirety. Investments classified within Level 3 have significant unobservableinputs used by the Global Valuation Committee in determining the price for Fair Valued Investments. Level 3 investments include equity or debt issued by privately heldcompanies or funds. There may not be a secondary market, and/or there are a limited number of investors. The categorization of a value determined for financial instrumentsis based on the pricing transparency of the financial instruments and is not necessarily an indication of the risks associated with investing in those securities. For informationabout the Fund’s policy regarding valuation of financial instruments, refer to its most recent financial statements.
The following table summarizes the Fund’s financial instruments categorized in the fair value hierarchy. The breakdown of the Fund’s financial instruments into majorcategories is disclosed in the Schedule of Investments above.
Level 1 Level 2 Level 3 Total
InvestmentsAssets
Common Stocks . . . . . . . . . . . . . . . . . . . . . . . . . . . . . . . . . . . . . . . . . . . . . . . . . . . . . . . . . . . . . . . . . . . . . . . . . . . . . . . . . . . . . . . . $ 7,183,354 $30,081,031 $ — $37,264,385Preferred Stocks . . . . . . . . . . . . . . . . . . . . . . . . . . . . . . . . . . . . . . . . . . . . . . . . . . . . . . . . . . . . . . . . . . . . . . . . . . . . . . . . . . . . . . . . 235,105 1,252,792 — 1,487,897Money Market Funds . . . . . . . . . . . . . . . . . . . . . . . . . . . . . . . . . . . . . . . . . . . . . . . . . . . . . . . . . . . . . . . . . . . . . . . . . . . . . . . . . . . . 3,340,146 — — 3,340,146
$10,758,605 $31,333,823 $ — $42,092,428
Derivative financial instruments(a)
LiabilitiesFutures Contracts . . . . . . . . . . . . . . . . . . . . . . . . . . . . . . . . . . . . . . . . . . . . . . . . . . . . . . . . . . . . . . . . . . . . . . . . . . . . . . . . . . . . . . . $ — $ (1,214) $ — $ (1,214)
(a) Derivative financial instruments are futures contracts. Futures contracts are valued at the unrealized appreciation (depreciation) on the instrument.
Portfolio Abbreviations - Equity
NVS . . . . . . . . . . . . . Non-Voting SharesREIT . . . . . . . . . . . . . Real Estate Investment Trust
Schedule of Investments (unaudited) (continued)
November 30, 2021
iShares� MSCI Germany Small-Cap ETF
98 NM0122U-1995964-100/159

Security Shares
Value
Common StocksAustralia — 1.3%CSL Ltd. . . . . . . . . . . . . . . . . . . . . . . . . . . . . . . . . . . . . . . . . . . . . . . . . 26,556 $ 5,774,270IDP Education Ltd. . . . . . . . . . . . . . . . . . . . . . . . . . . . . . . . . . . . . . . . 10,882 271,348Vicinity Centres . . . . . . . . . . . . . . . . . . . . . . . . . . . . . . . . . . . . . . . . . . 731,313 876,430
6,922,048Austria — 0.1%Verbund AG . . . . . . . . . . . . . . . . . . . . . . . . . . . . . . . . . . . . . . . . . . . . . 5,797 606,218
Belgium — 4.7%Elia Group SA/NV . . . . . . . . . . . . . . . . . . . . . . . . . . . . . . . . . . . . . . . 11,397 1,419,852Etablissements Franz Colruyt NV. . . . . . . . . . . . . . . . . . . . . . . . . 61,201 2,873,092Umicore SA . . . . . . . . . . . . . . . . . . . . . . . . . . . . . . . . . . . . . . . . . . . . . 428,528 20,954,559
25,247,503Canada — 4.6%Ballard Power Systems Inc.(a) . . . . . . . . . . . . . . . . . . . . . . . . . . . . 10,144 154,449Northland Power Inc.. . . . . . . . . . . . . . . . . . . . . . . . . . . . . . . . . . . . . 70,140 2,099,615West Fraser Timber Co. Ltd. . . . . . . . . . . . . . . . . . . . . . . . . . . . . . 269,457 22,156,455
24,410,519Chile — 1.1%Empresas CMPC SA. . . . . . . . . . . . . . . . . . . . . . . . . . . . . . . . . . . . . 3,674,950 5,951,875
China — 13.6%3SBio Inc.(a)(b) . . . . . . . . . . . . . . . . . . . . . . . . . . . . . . . . . . . . . . . . . . . 437,500 374,215Beijing Enterprises Water Group Ltd. . . . . . . . . . . . . . . . . . . . . . 6,384,000 2,374,717BYD Co. Ltd., Class A. . . . . . . . . . . . . . . . . . . . . . . . . . . . . . . . . . . . 35,189 1,687,013BYD Co. Ltd., Class H . . . . . . . . . . . . . . . . . . . . . . . . . . . . . . . . . . . 87,000 3,422,021China Conch Venture Holdings Ltd. . . . . . . . . . . . . . . . . . . . . . . . 410,000 2,004,048China Education Group Holdings Ltd. . . . . . . . . . . . . . . . . . . . . . 130,000 239,139China Everbright Environment Group Ltd. . . . . . . . . . . . . . . . . . 11,191,000 7,402,060China Longyuan Power Group Corp. Ltd., Class H . . . . . . . . 1,382,000 2,824,900China Medical System Holdings Ltd. . . . . . . . . . . . . . . . . . . . . . . 229,000 375,055China Mengniu Dairy Co. Ltd. . . . . . . . . . . . . . . . . . . . . . . . . . . . . 1,102,000 6,176,263China Railway Signal & Communication Corp. Ltd.,
Class A . . . . . . . . . . . . . . . . . . . . . . . . . . . . . . . . . . . . . . . . . . . . . . . 231,936 176,965Chindata Group Holdings Ltd., ADR(a) . . . . . . . . . . . . . . . . . . . . 16,954 160,385Contemporary Amperex Technology Co. Ltd., Class A . . . . . 17,400 1,857,361CSPC Pharmaceutical Group Ltd. . . . . . . . . . . . . . . . . . . . . . . . . 1,123,520 1,164,818Fu Jian Anjoy Foods Co. Ltd., Class A . . . . . . . . . . . . . . . . . . . . 400 10,919Gotion High-tech Co. Ltd., Class A(a). . . . . . . . . . . . . . . . . . . . . . 18,700 195,539Guangzhou R&F Properties Co. Ltd., Class H . . . . . . . . . . . . . 18,178,000 9,837,286Hansoh Pharmaceutical Group Co. Ltd.(b) . . . . . . . . . . . . . . . . . 86,000 175,573Henan Shuanghui Investment & Development Co. Ltd.,
Class A . . . . . . . . . . . . . . . . . . . . . . . . . . . . . . . . . . . . . . . . . . . . . . . 127,400 570,020Kingsoft Cloud Holdings Ltd., ADR(a)(c) . . . . . . . . . . . . . . . . . . . . 25,798 445,789Li Auto Inc., ADR(a) . . . . . . . . . . . . . . . . . . . . . . . . . . . . . . . . . . . . . . 83,339 2,953,534LONGi Green Energy Technology Co. Ltd., Class A. . . . . . . . 79,100 1,095,520Ming Yang Smart Energy Group Ltd., Class A . . . . . . . . . . . . . 78,700 394,993NIO Inc., ADR(a) . . . . . . . . . . . . . . . . . . . . . . . . . . . . . . . . . . . . . . . . . 213,313 8,346,938Riyue Heavy Industry Co. Ltd., Class A . . . . . . . . . . . . . . . . . . . 5,500 31,539Shimao Group Holdings Ltd. . . . . . . . . . . . . . . . . . . . . . . . . . . . . . 8,296,500 9,561,571Sungrow Power Supply Co. Ltd., Class A . . . . . . . . . . . . . . . . . 14,200 360,061Venus MedTech Hangzhou Inc., Class H(a)(b) . . . . . . . . . . . . . . 5,500 27,295Vinda International Holdings Ltd. . . . . . . . . . . . . . . . . . . . . . . . . . 291,000 787,394Wuxi Lead Intelligent Equipment Co. Ltd., Class A. . . . . . . . . 100 1,244Xinjiang Goldwind Science & Technology Co. Ltd.,
Class A . . . . . . . . . . . . . . . . . . . . . . . . . . . . . . . . . . . . . . . . . . . . . . . 264,300 760,789Xinjiang Goldwind Science & Technology Co. Ltd.,
Class H. . . . . . . . . . . . . . . . . . . . . . . . . . . . . . . . . . . . . . . . . . . . . . . 297,104 651,174Xinyi Solar Holdings Ltd. . . . . . . . . . . . . . . . . . . . . . . . . . . . . . . . . . 1,124,000 2,066,909
Security Shares
Value
China (continued)XPeng Inc., ADR(a). . . . . . . . . . . . . . . . . . . . . . . . . . . . . . . . . . . . . . . 32,810 $ 1,804,550Yadea Group Holdings Ltd.(b) . . . . . . . . . . . . . . . . . . . . . . . . . . . . . 976,000 1,744,312
72,061,909Denmark — 7.3%Genmab A/S(a). . . . . . . . . . . . . . . . . . . . . . . . . . . . . . . . . . . . . . . . . . . 1,464 567,361Novo Nordisk A/S, Class B . . . . . . . . . . . . . . . . . . . . . . . . . . . . . . . 126,688 13,561,946Orsted A/S(b) . . . . . . . . . . . . . . . . . . . . . . . . . . . . . . . . . . . . . . . . . . . . 27,897 3,586,941Rockwool International A/S, Class B . . . . . . . . . . . . . . . . . . . . . . 5,894 2,449,674Vestas Wind Systems A/S. . . . . . . . . . . . . . . . . . . . . . . . . . . . . . . . 558,793 18,762,456
38,928,378France — 3.2%Covivio . . . . . . . . . . . . . . . . . . . . . . . . . . . . . . . . . . . . . . . . . . . . . . . . . . 15,173 1,257,291Gecina SA . . . . . . . . . . . . . . . . . . . . . . . . . . . . . . . . . . . . . . . . . . . . . . 5,499 740,938Ipsen SA . . . . . . . . . . . . . . . . . . . . . . . . . . . . . . . . . . . . . . . . . . . . . . . . 8,136 794,028Klepierre SA. . . . . . . . . . . . . . . . . . . . . . . . . . . . . . . . . . . . . . . . . . . . . 90,743 1,909,481Suez SA . . . . . . . . . . . . . . . . . . . . . . . . . . . . . . . . . . . . . . . . . . . . . . . . 399,716 8,946,234Unibail-Rodamco-Westfield(a) . . . . . . . . . . . . . . . . . . . . . . . . . . . . 48,307 3,179,594
16,827,566Germany — 1.1%LEG Immobilien SE . . . . . . . . . . . . . . . . . . . . . . . . . . . . . . . . . . . . . . 14,574 2,041,255Vonovia SE. . . . . . . . . . . . . . . . . . . . . . . . . . . . . . . . . . . . . . . . . . . . . . 66,706 3,701,918
5,743,173Hong Kong — 5.0%Henderson Land Development Co. Ltd. . . . . . . . . . . . . . . . . . . . 258,000 1,054,991Link REIT . . . . . . . . . . . . . . . . . . . . . . . . . . . . . . . . . . . . . . . . . . . . . . . 148,100 1,283,862MTR Corp. Ltd. . . . . . . . . . . . . . . . . . . . . . . . . . . . . . . . . . . . . . . . . . . 472,500 2,516,598Sun Hung Kai Properties Ltd.. . . . . . . . . . . . . . . . . . . . . . . . . . . . . 514,500 6,264,903Swire Properties Ltd.. . . . . . . . . . . . . . . . . . . . . . . . . . . . . . . . . . . . . 305,600 725,345WH Group Ltd.(b) . . . . . . . . . . . . . . . . . . . . . . . . . . . . . . . . . . . . . . . . 23,452,000 14,755,930
26,601,629India — 0.5%Adani Green Energy Ltd.(a) . . . . . . . . . . . . . . . . . . . . . . . . . . . . . . . 5,662 97,445Colgate-Palmolive India Ltd.. . . . . . . . . . . . . . . . . . . . . . . . . . . . . . 18,267 348,485Godrej Consumer Products Ltd.(a) . . . . . . . . . . . . . . . . . . . . . . . . 18,811 230,670Hindustan Unilever Ltd. . . . . . . . . . . . . . . . . . . . . . . . . . . . . . . . . . . 48,157 1,485,947Marico Ltd. . . . . . . . . . . . . . . . . . . . . . . . . . . . . . . . . . . . . . . . . . . . . . . 11,030 79,051Nestle India Ltd. . . . . . . . . . . . . . . . . . . . . . . . . . . . . . . . . . . . . . . . . . 1,437 366,029
2,607,627Indonesia — 0.1%Unilever Indonesia Tbk PT . . . . . . . . . . . . . . . . . . . . . . . . . . . . . . . 1,289,000 403,192
Ireland — 0.3%Horizon Therapeutics PLC(a) . . . . . . . . . . . . . . . . . . . . . . . . . . . . . 16,978 1,761,637
Japan — 15.9%Asahi Intecc Co. Ltd. . . . . . . . . . . . . . . . . . . . . . . . . . . . . . . . . . . . . . 20,100 440,573Central Japan Railway Co. . . . . . . . . . . . . . . . . . . . . . . . . . . . . . . . 50,600 6,956,263Chugai Pharmaceutical Co. Ltd. . . . . . . . . . . . . . . . . . . . . . . . . . . 48,700 1,577,576Daiichi Sankyo Co. Ltd. . . . . . . . . . . . . . . . . . . . . . . . . . . . . . . . . . . 168,400 4,185,767Daiwa House Industry Co. Ltd. . . . . . . . . . . . . . . . . . . . . . . . . . . . 743,000 21,796,682East Japan Railway Co.. . . . . . . . . . . . . . . . . . . . . . . . . . . . . . . . . . 280,800 17,215,707Eisai Co. Ltd. . . . . . . . . . . . . . . . . . . . . . . . . . . . . . . . . . . . . . . . . . . . . 41,500 2,508,066Japan Metropolitan Fund Invest . . . . . . . . . . . . . . . . . . . . . . . . . . 1,126 971,525Japan Real Estate Investment Corp. . . . . . . . . . . . . . . . . . . . . . . 131 758,139Kyowa Kirin Co. Ltd. . . . . . . . . . . . . . . . . . . . . . . . . . . . . . . . . . . . . . 25,000 698,360Nippon Building Fund Inc. . . . . . . . . . . . . . . . . . . . . . . . . . . . . . . . . 133 821,930Nippon Prologis REIT Inc. . . . . . . . . . . . . . . . . . . . . . . . . . . . . . . . . 216 705,469Nisshin Seifun Group Inc. . . . . . . . . . . . . . . . . . . . . . . . . . . . . . . . . 218,600 3,143,834Nissin Foods Holdings Co. Ltd. . . . . . . . . . . . . . . . . . . . . . . . . . . . 36,000 2,646,128
Schedule of Investments (unaudited)
November 30, 2021
iShares� MSCI Global Impact ETF(Percentages shown are based on Net Assets)
99NM0122U-1995964-101/159

Security Shares
Value
Japan (continued)Nomura Real Estate Master Fund Inc. . . . . . . . . . . . . . . . . . . . . 663 $ 945,233Ono Pharmaceutical Co. Ltd. . . . . . . . . . . . . . . . . . . . . . . . . . . . . . 87,000 1,918,938Orix JREIT Inc. . . . . . . . . . . . . . . . . . . . . . . . . . . . . . . . . . . . . . . . . . . 361 575,660Shionogi & Co. Ltd. . . . . . . . . . . . . . . . . . . . . . . . . . . . . . . . . . . . . . . 23,900 1,668,490Sysmex Corp. . . . . . . . . . . . . . . . . . . . . . . . . . . . . . . . . . . . . . . . . . . . 9,700 1,206,513Terumo Corp.. . . . . . . . . . . . . . . . . . . . . . . . . . . . . . . . . . . . . . . . . . . . 53,400 2,174,672TOTO Ltd.. . . . . . . . . . . . . . . . . . . . . . . . . . . . . . . . . . . . . . . . . . . . . . . 85,500 3,782,255Toyo Suisan Kaisha Ltd. . . . . . . . . . . . . . . . . . . . . . . . . . . . . . . . . . 82,900 3,354,510Unicharm Corp.. . . . . . . . . . . . . . . . . . . . . . . . . . . . . . . . . . . . . . . . . . 98,100 4,249,319
84,301,609Malaysia — 0.1%PPB Group Bhd . . . . . . . . . . . . . . . . . . . . . . . . . . . . . . . . . . . . . . . . . 59,900 253,453QL Resources Bhd. . . . . . . . . . . . . . . . . . . . . . . . . . . . . . . . . . . . . . . 469,200 506,912
760,365Mexico — 0.5%Gruma SAB de CV, Class B . . . . . . . . . . . . . . . . . . . . . . . . . . . . . . 122,985 1,490,733Kimberly-Clark de Mexico SAB de CV, Class A . . . . . . . . . . . . 920,600 1,445,568
2,936,301Netherlands — 0.3%JDE Peet's NV. . . . . . . . . . . . . . . . . . . . . . . . . . . . . . . . . . . . . . . . . . . 66,533 1,813,329
Norway — 0.5%Mowi ASA . . . . . . . . . . . . . . . . . . . . . . . . . . . . . . . . . . . . . . . . . . . . . . . 116,862 2,657,091
Portugal — 0.2%EDP Renovaveis SA . . . . . . . . . . . . . . . . . . . . . . . . . . . . . . . . . . . . . 39,824 1,024,276
Saudi Arabia — 0.1%Almarai Co. JSC. . . . . . . . . . . . . . . . . . . . . . . . . . . . . . . . . . . . . . . . . 52,897 674,678
Singapore — 0.4%CapitaLand Integrated Commercial Trust. . . . . . . . . . . . . . . . . . 659,440 1,016,496City Developments Ltd. . . . . . . . . . . . . . . . . . . . . . . . . . . . . . . . . . . 194,700 999,400Mapletree Commercial Trust . . . . . . . . . . . . . . . . . . . . . . . . . . . . . 248,400 370,341
2,386,237Sweden — 2.7%Essity AB, Class B . . . . . . . . . . . . . . . . . . . . . . . . . . . . . . . . . . . . . . . 330,542 10,554,887Svenska Cellulosa AB SCA, Class B. . . . . . . . . . . . . . . . . . . . . . 239,632 3,897,732
14,452,619Switzerland — 0.7%Geberit AG, Registered . . . . . . . . . . . . . . . . . . . . . . . . . . . . . . . . . . 4,697 3,586,211
Taiwan — 2.0%Taiwan High Speed Rail Corp. . . . . . . . . . . . . . . . . . . . . . . . . . . . . 1,281,000 1,365,051Uni-President Enterprises Corp. . . . . . . . . . . . . . . . . . . . . . . . . . . 3,906,000 9,159,142
10,524,193Thailand — 0.3%BTS Group Holdings PCL, NVDR. . . . . . . . . . . . . . . . . . . . . . . . . 5,019,400 1,368,458
United Kingdom — 6.8%Berkeley Group Holdings PLC. . . . . . . . . . . . . . . . . . . . . . . . . . . . 48,263 2,747,400Johnson Matthey PLC . . . . . . . . . . . . . . . . . . . . . . . . . . . . . . . . . . . 776,386 21,569,559Land Securities Group PLC . . . . . . . . . . . . . . . . . . . . . . . . . . . . . . 80,391 774,921Pearson PLC . . . . . . . . . . . . . . . . . . . . . . . . . . . . . . . . . . . . . . . . . . . . 1,083,007 8,563,752United Utilities Group PLC . . . . . . . . . . . . . . . . . . . . . . . . . . . . . . . 156,562 2,248,680
35,904,312United States — 25.6%ABIOMED Inc.(a) . . . . . . . . . . . . . . . . . . . . . . . . . . . . . . . . . . . . . . . . . 2,207 694,720Alexandria Real Estate Equities Inc. . . . . . . . . . . . . . . . . . . . . . . 11,017 2,204,171Alnylam Pharmaceuticals Inc.(a) . . . . . . . . . . . . . . . . . . . . . . . . . . 2,832 520,522
Security Shares
Value
United States (continued)Amgen Inc. . . . . . . . . . . . . . . . . . . . . . . . . . . . . . . . . . . . . . . . . . . . . . . 73,758 $ 14,668,991Baxter International Inc. . . . . . . . . . . . . . . . . . . . . . . . . . . . . . . . . . . 80,276 5,986,181BioMarin Pharmaceutical Inc.(a) . . . . . . . . . . . . . . . . . . . . . . . . . . 22,159 1,912,100Boston Properties Inc. . . . . . . . . . . . . . . . . . . . . . . . . . . . . . . . . . . . 22,455 2,421,547Citrix Systems Inc. . . . . . . . . . . . . . . . . . . . . . . . . . . . . . . . . . . . . . . . 52,463 4,219,599Colgate-Palmolive Co. . . . . . . . . . . . . . . . . . . . . . . . . . . . . . . . . . . . 124,815 9,363,621Dexcom Inc.(a) . . . . . . . . . . . . . . . . . . . . . . . . . . . . . . . . . . . . . . . . . . . 3,070 1,727,151Digital Realty Trust Inc. . . . . . . . . . . . . . . . . . . . . . . . . . . . . . . . . . . 55,780 9,356,537Eli Lilly & Co. . . . . . . . . . . . . . . . . . . . . . . . . . . . . . . . . . . . . . . . . . . . . 60,733 15,064,213Enphase Energy Inc.(a). . . . . . . . . . . . . . . . . . . . . . . . . . . . . . . . . . . 7,542 1,885,500Healthpeak Properties Inc. . . . . . . . . . . . . . . . . . . . . . . . . . . . . . . . 41,845 1,375,027Hormel Foods Corp. . . . . . . . . . . . . . . . . . . . . . . . . . . . . . . . . . . . . . 134,522 5,569,211Incyte Corp.(a) . . . . . . . . . . . . . . . . . . . . . . . . . . . . . . . . . . . . . . . . . . . 38,747 2,623,947Insulet Corp.(a). . . . . . . . . . . . . . . . . . . . . . . . . . . . . . . . . . . . . . . . . . . 3,007 867,339Jazz Pharmaceuticals PLC(a)(c) . . . . . . . . . . . . . . . . . . . . . . . . . . . 20,136 2,413,702Kimberly-Clark Corp.. . . . . . . . . . . . . . . . . . . . . . . . . . . . . . . . . . . . . 163,158 21,261,119Regeneron Pharmaceuticals Inc.(a) . . . . . . . . . . . . . . . . . . . . . . . 17,983 11,446,719Seagen Inc.(a) . . . . . . . . . . . . . . . . . . . . . . . . . . . . . . . . . . . . . . . . . . . 8,494 1,359,040SolarEdge Technologies Inc.(a) . . . . . . . . . . . . . . . . . . . . . . . . . . . 6,648 2,178,949Sun Communities Inc.. . . . . . . . . . . . . . . . . . . . . . . . . . . . . . . . . . . . 10,367 1,955,009Sunrun Inc.(a) . . . . . . . . . . . . . . . . . . . . . . . . . . . . . . . . . . . . . . . . . . . . 42,723 1,966,967Vertex Pharmaceuticals Inc.(a) . . . . . . . . . . . . . . . . . . . . . . . . . . . . 36,029 6,735,261VMware Inc., Class A . . . . . . . . . . . . . . . . . . . . . . . . . . . . . . . . . . . . 11,494 1,341,810Xylem Inc./NY . . . . . . . . . . . . . . . . . . . . . . . . . . . . . . . . . . . . . . . . . . . 41,248 4,995,545
136,114,498
Total Common Stocks — 99.0%(Cost: $520,128,520) . . . . . . . . . . . . . . . . . . . . . . . . . . . . . . . . . . . . . . . . . . . . . . 526,577,451
RightsGermany — 0.1%Vonovia SE (Expires 12/07/21)(a) . . . . . . . . . . . . . . . . . . . . . . . . . 99,192 349,855
Total Rights — 0.1%(Cost: $0) . . . . . . . . . . . . . . . . . . . . . . . . . . . . . . . . . . . . . . . . . . . . . . . . . . . . . . . . . 349,855
WarrantsThailand — 0.0%BTS Group Holdings PCL (Expires 11/20/26)(a) . . . . . . . . . . . . 702,000 —BTS Group Holdings PCL (Expires 11/07/24)(a) . . . . . . . . . . . . 351,000 5,313
5,313
Total Warrants — 0.0%(Cost: $0) . . . . . . . . . . . . . . . . . . . . . . . . . . . . . . . . . . . . . . . . . . . . . . . . . . . . . . . . . 5,313
Short-Term InvestmentsMoney Market Funds — 0.5%BlackRock Cash Funds: Institutional, SL Agency Shares,
0.06%(d)(e)(f). . . . . . . . . . . . . . . . . . . . . . . . . . . . . . . . . . . . . . . . . . . 865,173 865,519
Schedule of Investments (unaudited) (continued)
November 30, 2021
iShares� MSCI Global Impact ETF(Percentages shown are based on Net Assets)
100 NM0122U-1995964-102/159

Security Shares
Value
Money Market Funds (continued)BlackRock Cash Funds: Treasury, SL Agency Shares,
0.00%(d)(e) . . . . . . . . . . . . . . . . . . . . . . . . . . . . . . . . . . . . . . . . . . . . 1,850,000 $ 1,850,000
2,715,519
Total Short-Term Investments — 0.5%(Cost: $2,715,519). . . . . . . . . . . . . . . . . . . . . . . . . . . . . . . . . . . . . . . . . . . . . . . . . 2,715,519
Total Investments in Securities — 99.6%(Cost: $522,844,039) . . . . . . . . . . . . . . . . . . . . . . . . . . . . . . . . . . . . . . . . . . . . . . 529,648,138
Other Assets, Less Liabilities — 0.4% . . . . . . . . . . . . . . . . . . . . . . . . . . . . . . . 1,991,909
Net Assets — 100.0% . . . . . . . . . . . . . . . . . . . . . . . . . . . . . . . . . . . . . . . . . . . . . . . . $ 531,640,047
(a) Non-income producing security.(b) Security exempt from registration pursuant to Rule 144A under the Securities Act of
1933, as amended. These securities may be resold in transactions exempt fromregistration to qualified institutional investors.
(c) All or a portion of this security is on loan.(d) Affiliate of the Fund.(e) Annualized 7-day yield as of period end.(f) All or a portion of this security was purchased with the cash collateral from loaned
securities.
Affiliates
Investments in issuers considered to be affiliate(s) of the Fund during the period ended November 30, 2021 for purposes of Section 2(a)(3) of the Investment Company Actof 1940, as amended, were as follows:
Affiliated IssuerValue at
08/31/21Purchases
at CostProceeds
from SalesNet Realized
Gain (Loss)
Change inUnrealized
Appreciation(Depreciation)
Value at11/30/21
SharesHeld at
11/30/21 Income
CapitalGain
Distributionsfrom
UnderlyingFunds
BlackRock Cash Funds: Institutional, SLAgency Shares . . . . . . . . . . . . . . . . . . . . . . . . . . . . $22,422,442 $ — $(21,556,907)(a) $ (16) $ — $ 865,519 865,173 $633,755(b) $ —
BlackRock Cash Funds: Treasury, SL AgencyShares . . . . . . . . . . . . . . . . . . . . . . . . . . . . . . . . . . . . 1,070,000 780,000(a)
— — — 1,850,000 1,850,000 11 —
$ (16) $ — $2,715,519 $633,766 $ —
(a) Represents net amount purchased (sold).(b) All or a portion represents securities lending income earned from the reinvestment of cash collateral from loaned securities, net of fees and collateral investment expenses, and other
payments to and from borrowers of securities.
Derivative Financial Instruments Outstanding as of Period End
Futures Contracts
DescriptionNumber ofContracts
ExpirationDate
NotionalAmount
(000)
Value/Unrealized
Appreciation(Depreciation)
Long ContractsMSCI EAFE Index . . . . . . . . . . . . . . . . . . . . . . . . . . . . . . . . . . . . . . . . . . . . . . . . . . . . . . . . . . . . . . . . . . . . . . . . . . . . . . . . . . . . . . . . . . . . . . . . . . . 15 12/17/21 $ 1,677 $ (33,791)MSCI Emerging Markets Index . . . . . . . . . . . . . . . . . . . . . . . . . . . . . . . . . . . . . . . . . . . . . . . . . . . . . . . . . . . . . . . . . . . . . . . . . . . . . . . . . . . . . . . 13 12/17/21 788 (11,949)S&P 500 E-Mini Index . . . . . . . . . . . . . . . . . . . . . . . . . . . . . . . . . . . . . . . . . . . . . . . . . . . . . . . . . . . . . . . . . . . . . . . . . . . . . . . . . . . . . . . . . . . . . . . 3 12/17/21 685 (4,461)
$ (50,201)
Fair Value Measurements
Various inputs are used in determining the fair value of financial instruments. These inputs to valuation techniques are categorized into a fair value hierarchy consisting ofthree broad levels for financial reporting purposes as follows:
• Level 1 – Unadjusted price quotations in active markets/exchanges for identical assets or liabilities that each Fund has the ability to access;• Level 2 – Other observable inputs (including, but not limited to, quoted prices for similar assets or liabilities in markets that are active, quoted prices for identical or
similar assets or liabilities in markets that are not active, inputs other than quoted prices that are observable for the assets or liabilities (such as interest rates, yieldcurves, volatilities, prepayment speeds, loss severities, credit risks and default rates) or other market-corroborated inputs); and
• Level 3 – Unobservable inputs based on the best information available in the circumstances, to the extent observable inputs are not available (including the BlackRockGlobal Valuation Methodologies Committee’s (the “Global Valuation Committee’s”) assumptions used in determining the fair value of financial instruments).
Schedule of Investments (unaudited) (continued)
November 30, 2021
iShares� MSCI Global Impact ETF(Percentages shown are based on Net Assets)
101NM0122U-1995964-103/159

Fair Value Measurements (continued)
The hierarchy gives the highest priority to unadjusted quoted prices in active markets for identical assets or liabilities (Level 1 measurements) and the lowest priority tounobservable inputs (Level 3 measurements). Accordingly, the degree of judgment exercised in determining fair value is greatest for instruments categorized in Level 3. Theinputs used to measure fair value may fall into different levels of the fair value hierarchy. In such cases, for disclosure purposes, the fair value hierarchy classification isdetermined based on the lowest level input that is significant to the fair value measurement in its entirety. Investments classified within Level 3 have significant unobservableinputs used by the Global Valuation Committee in determining the price for Fair Valued Investments. Level 3 investments include equity or debt issued by privately heldcompanies or funds. There may not be a secondary market, and/or there are a limited number of investors. The categorization of a value determined for financial instrumentsis based on the pricing transparency of the financial instruments and is not necessarily an indication of the risks associated with investing in those securities. For informationabout the Fund’s policy regarding valuation of financial instruments, refer to its most recent financial statements.
The following table summarizes the Fund’s financial instruments categorized in the fair value hierarchy. The breakdown of the Fund’s financial instruments into majorcategories is disclosed in the Schedule of Investments above.
Level 1 Level 2 Level 3 Total
InvestmentsAssets
Common Stocks. . . . . . . . . . . . . . . . . . . . . . . . . . . . . . . . . . . . . . . . . . . . . . . . . . . . . . . . . . . . . . . . . . . . . . . . . . . . . . . . . . . . $196,428,912 $330,148,539 $ — $526,577,451Rights . . . . . . . . . . . . . . . . . . . . . . . . . . . . . . . . . . . . . . . . . . . . . . . . . . . . . . . . . . . . . . . . . . . . . . . . . . . . . . . . . . . . . . . . . . . . . 349,855 — — 349,855Warrants . . . . . . . . . . . . . . . . . . . . . . . . . . . . . . . . . . . . . . . . . . . . . . . . . . . . . . . . . . . . . . . . . . . . . . . . . . . . . . . . . . . . . . . . . . . 5,313 — — 5,313Money Market Funds . . . . . . . . . . . . . . . . . . . . . . . . . . . . . . . . . . . . . . . . . . . . . . . . . . . . . . . . . . . . . . . . . . . . . . . . . . . . . . . 2,715,519 — — 2,715,519
$199,499,599 $330,148,539 $ — $529,648,138
Derivative financial instruments(a)
LiabilitiesFutures Contracts . . . . . . . . . . . . . . . . . . . . . . . . . . . . . . . . . . . . . . . . . . . . . . . . . . . . . . . . . . . . . . . . . . . . . . . . . . . . . . . . . . $ (50,201) $ — $ — $ (50,201)
(a) Derivative financial instruments are futures contracts. Futures contracts are valued at the unrealized appreciation (depreciation) on the instrument.
Portfolio Abbreviations - Equity
ADR . . . . . . . . . . . . . American Depositary ReceiptJSC. . . . . . . . . . . . . . Joint Stock CompanyNVDR. . . . . . . . . . . . Non-Voting Depositary ReceiptREIT . . . . . . . . . . . . . Real Estate Investment Trust
Schedule of Investments (unaudited) (continued)
November 30, 2021
iShares� MSCI Global Impact ETF
102 NM0122U-1995964-104/159

Security Shares
Value
Common StocksAerospace & Defense — 0.3%Bharat Electronics Ltd. . . . . . . . . . . . . . . . . . . . . . . . . . . . . . . . . . 7,815,939 $ 21,194,791
Airlines — 0.2%InterGlobe Aviation Ltd.(a)(b) . . . . . . . . . . . . . . . . . . . . . . . . . . . . 617,583 15,651,618
Auto Components — 1.1%Balkrishna Industries Ltd.. . . . . . . . . . . . . . . . . . . . . . . . . . . . . . . 558,099 16,145,343Bharat Forge Ltd. . . . . . . . . . . . . . . . . . . . . . . . . . . . . . . . . . . . . . . 1,493,484 13,788,498Motherson Sumi Systems Ltd. . . . . . . . . . . . . . . . . . . . . . . . . . . 8,103,847 22,619,343MRF Ltd. . . . . . . . . . . . . . . . . . . . . . . . . . . . . . . . . . . . . . . . . . . . . . . 12,243 12,147,299
64,700,483Automobiles — 4.6%Bajaj Auto Ltd. . . . . . . . . . . . . . . . . . . . . . . . . . . . . . . . . . . . . . . . . . 445,542 19,233,092Eicher Motors Ltd. . . . . . . . . . . . . . . . . . . . . . . . . . . . . . . . . . . . . . 876,992 27,608,299Hero MotoCorp Ltd. . . . . . . . . . . . . . . . . . . . . . . . . . . . . . . . . . . . . 769,064 25,088,100Mahindra & Mahindra Ltd. . . . . . . . . . . . . . . . . . . . . . . . . . . . . . . 5,582,961 62,049,112Maruti Suzuki India Ltd. . . . . . . . . . . . . . . . . . . . . . . . . . . . . . . . . 872,093 82,096,179Tata Motors Ltd.(b) . . . . . . . . . . . . . . . . . . . . . . . . . . . . . . . . . . . . . 10,650,658 65,041,556
281,116,338Banks — 10.3%Axis Bank Ltd.(b) . . . . . . . . . . . . . . . . . . . . . . . . . . . . . . . . . . . . . . . 14,555,395 126,758,010Bandhan Bank Ltd.(a) . . . . . . . . . . . . . . . . . . . . . . . . . . . . . . . . . . 4,136,882 14,966,224ICICI Bank Ltd. . . . . . . . . . . . . . . . . . . . . . . . . . . . . . . . . . . . . . . . . 32,902,122 311,006,023Kotak Mahindra Bank Ltd. . . . . . . . . . . . . . . . . . . . . . . . . . . . . . . 3,561,974 93,031,306State Bank of India. . . . . . . . . . . . . . . . . . . . . . . . . . . . . . . . . . . . . 11,450,472 70,048,754Yes Bank Ltd.(b). . . . . . . . . . . . . . . . . . . . . . . . . . . . . . . . . . . . . . . . 72,332,497 11,889,723
627,700,040Beverages — 0.4%United Spirits Ltd.(b) . . . . . . . . . . . . . . . . . . . . . . . . . . . . . . . . . . . . 1,864,690 21,909,909
Biotechnology — 0.2%Biocon Ltd.(b) . . . . . . . . . . . . . . . . . . . . . . . . . . . . . . . . . . . . . . . . . . 2,695,764 12,938,087
Capital Markets — 0.2%HDFC Asset Management Co. Ltd.(a) . . . . . . . . . . . . . . . . . . . 341,810 11,420,011
Chemicals — 3.6%Asian Paints Ltd.. . . . . . . . . . . . . . . . . . . . . . . . . . . . . . . . . . . . . . . 2,461,480 103,003,932Berger Paints India Ltd. . . . . . . . . . . . . . . . . . . . . . . . . . . . . . . . . 1,557,827 15,581,843PI Industries Ltd.. . . . . . . . . . . . . . . . . . . . . . . . . . . . . . . . . . . . . . . 535,033 20,398,896Pidilite Industries Ltd. . . . . . . . . . . . . . . . . . . . . . . . . . . . . . . . . . . 978,013 28,712,842SRF Ltd. . . . . . . . . . . . . . . . . . . . . . . . . . . . . . . . . . . . . . . . . . . . . . . 947,674 25,293,794UPL Ltd.. . . . . . . . . . . . . . . . . . . . . . . . . . . . . . . . . . . . . . . . . . . . . . . 3,186,110 28,943,711
221,935,018Commercial Services & Supplies — 0.3%Indian Railway Catering & Tourism Corp. . . . . . . . . . . . . . . . . 1,535,596 16,247,352
Construction & Engineering — 1.7%Larsen & Toubro Ltd. . . . . . . . . . . . . . . . . . . . . . . . . . . . . . . . . . . . 4,415,646 103,808,973
Construction Materials — 2.7%ACC Ltd. . . . . . . . . . . . . . . . . . . . . . . . . . . . . . . . . . . . . . . . . . . . . . . 481,897 14,632,376Ambuja Cements Ltd. . . . . . . . . . . . . . . . . . . . . . . . . . . . . . . . . . . 4,458,594 22,213,935Grasim Industries Ltd.. . . . . . . . . . . . . . . . . . . . . . . . . . . . . . . . . . 1,688,818 37,398,276Shree Cement Ltd. . . . . . . . . . . . . . . . . . . . . . . . . . . . . . . . . . . . . . 69,443 24,137,174UltraTech Cement Ltd. . . . . . . . . . . . . . . . . . . . . . . . . . . . . . . . . . 648,156 64,008,773
162,390,534Consumer Finance — 3.9%Bajaj Finance Ltd.. . . . . . . . . . . . . . . . . . . . . . . . . . . . . . . . . . . . . . 1,742,552 162,314,810
Security Shares
Value
Consumer Finance (continued)Cholamandalam Investment and Finance Co. Ltd. . . . . . . . 2,631,907 $ 19,261,704Muthoot Finance Ltd.. . . . . . . . . . . . . . . . . . . . . . . . . . . . . . . . . . . 772,164 14,648,150SBI Cards & Payment Services Ltd.(b). . . . . . . . . . . . . . . . . . . 1,509,519 19,040,766Shriram Transport Finance Co. Ltd. . . . . . . . . . . . . . . . . . . . . . 1,293,257 24,230,854
239,496,284Diversified Financial Services — 1.3%Bajaj Finserv Ltd. . . . . . . . . . . . . . . . . . . . . . . . . . . . . . . . . . . . . . . 244,264 56,047,340Piramal Enterprises Ltd. . . . . . . . . . . . . . . . . . . . . . . . . . . . . . . . . 689,149 22,138,721
78,186,061Diversified Telecommunication Services — 0.3%Indus Towers Ltd. . . . . . . . . . . . . . . . . . . . . . . . . . . . . . . . . . . . . . . 4,321,543 16,352,611
Electric Utilities — 2.0%Adani Transmission Ltd.(b) . . . . . . . . . . . . . . . . . . . . . . . . . . . . . . 1,783,439 42,492,005Power Grid Corp. of India Ltd. . . . . . . . . . . . . . . . . . . . . . . . . . . 20,137,850 55,362,631Tata Power Co. Ltd. (The) . . . . . . . . . . . . . . . . . . . . . . . . . . . . . . 9,200,156 26,540,618
124,395,254Electrical Equipment — 0.5%Havells India Ltd. . . . . . . . . . . . . . . . . . . . . . . . . . . . . . . . . . . . . . . 1,607,210 29,013,784
Food & Staples Retailing — 1.1%Avenue Supermarts Ltd.(a)(b). . . . . . . . . . . . . . . . . . . . . . . . . . . . 1,038,944 65,061,710
Food Products — 2.1%Britannia Industries Ltd. . . . . . . . . . . . . . . . . . . . . . . . . . . . . . . . . 695,377 32,832,426Nestle India Ltd. . . . . . . . . . . . . . . . . . . . . . . . . . . . . . . . . . . . . . . . 216,493 55,144,531Tata Consumer Products Ltd. . . . . . . . . . . . . . . . . . . . . . . . . . . . 3,838,815 39,809,251
127,786,208Gas Utilities — 1.1%Adani Total Gas Ltd. . . . . . . . . . . . . . . . . . . . . . . . . . . . . . . . . . . . 1,763,949 37,551,030GAIL India Ltd.. . . . . . . . . . . . . . . . . . . . . . . . . . . . . . . . . . . . . . . . . 9,970,499 17,218,133Indraprastha Gas Ltd. . . . . . . . . . . . . . . . . . . . . . . . . . . . . . . . . . . 1,796,330 11,584,792
66,353,955Health Care Providers & Services — 0.8%Apollo Hospitals Enterprise Ltd.. . . . . . . . . . . . . . . . . . . . . . . . . 645,712 48,814,251
Hotels, Restaurants & Leisure — 0.4%Jubilant Foodworks Ltd. . . . . . . . . . . . . . . . . . . . . . . . . . . . . . . . . 506,927 24,681,976
Household Products — 2.7%Hindustan Unilever Ltd. . . . . . . . . . . . . . . . . . . . . . . . . . . . . . . . . 5,275,802 162,791,789
Independent Power and Renewable Electricity Producers — 1.6%Adani Green Energy Ltd.(b) . . . . . . . . . . . . . . . . . . . . . . . . . . . . . 2,554,749 43,968,137NTPC Ltd. . . . . . . . . . . . . . . . . . . . . . . . . . . . . . . . . . . . . . . . . . . . . . 31,104,313 52,564,442
96,532,579Industrial Conglomerates — 0.2%Siemens Ltd. . . . . . . . . . . . . . . . . . . . . . . . . . . . . . . . . . . . . . . . . . . 456,624 13,066,515
Insurance — 2.3%HDFC Life Insurance Co. Ltd.(a) . . . . . . . . . . . . . . . . . . . . . . . . 5,838,956 52,909,990ICICI Lombard General Insurance Co. Ltd.(a) . . . . . . . . . . . . 1,429,462 27,317,373ICICI Prudential Life Insurance Co. Ltd.(a) . . . . . . . . . . . . . . . 2,304,342 18,173,770SBI Life Insurance Co. Ltd.(a) . . . . . . . . . . . . . . . . . . . . . . . . . . . 2,887,541 44,623,558
143,024,691Interactive Media & Services — 0.6%Info Edge India Ltd. . . . . . . . . . . . . . . . . . . . . . . . . . . . . . . . . . . . . 494,869 38,232,461
Internet & Direct Marketing Retail — 0.3%Zomato Ltd.(b) . . . . . . . . . . . . . . . . . . . . . . . . . . . . . . . . . . . . . . . . . 10,039,188 20,378,273
Consolidated Schedule of Investments (unaudited)
November 30, 2021
iShares� MSCI India ETF(Percentages shown are based on Net Assets)
103NM0122U-1995964-105/159

Security Shares
Value
IT Services — 18.3%HCL Technologies Ltd. . . . . . . . . . . . . . . . . . . . . . . . . . . . . . . . . . 6,963,770 $ 105,475,763Infosys Ltd. . . . . . . . . . . . . . . . . . . . . . . . . . . . . . . . . . . . . . . . . . . . . 21,859,242 497,210,163Larsen & Toubro Infotech Ltd.(a) . . . . . . . . . . . . . . . . . . . . . . . . 337,144 30,493,641Mindtree Ltd. . . . . . . . . . . . . . . . . . . . . . . . . . . . . . . . . . . . . . . . . . . 421,778 24,293,100Mphasis Ltd.. . . . . . . . . . . . . . . . . . . . . . . . . . . . . . . . . . . . . . . . . . . 539,340 20,777,355Tata Consultancy Services Ltd. . . . . . . . . . . . . . . . . . . . . . . . . . 5,932,784 278,824,404Tech Mahindra Ltd. . . . . . . . . . . . . . . . . . . . . . . . . . . . . . . . . . . . . 4,041,575 82,777,299Wipro Ltd. . . . . . . . . . . . . . . . . . . . . . . . . . . . . . . . . . . . . . . . . . . . . . 8,788,005 74,069,829
1,113,921,554Life Sciences Tools & Services — 0.9%Divi's Laboratories Ltd. . . . . . . . . . . . . . . . . . . . . . . . . . . . . . . . . . 851,552 55,326,010
Metals & Mining — 3.2%Hindalco Industries Ltd. . . . . . . . . . . . . . . . . . . . . . . . . . . . . . . . . 10,090,449 55,365,606JSW Steel Ltd.. . . . . . . . . . . . . . . . . . . . . . . . . . . . . . . . . . . . . . . . . 5,405,580 43,595,011Tata Steel Ltd. . . . . . . . . . . . . . . . . . . . . . . . . . . . . . . . . . . . . . . . . . 4,632,094 65,725,843Vedanta Ltd. . . . . . . . . . . . . . . . . . . . . . . . . . . . . . . . . . . . . . . . . . . . 7,154,263 32,040,762
196,727,222Multiline Retail — 0.3%Trent Ltd. . . . . . . . . . . . . . . . . . . . . . . . . . . . . . . . . . . . . . . . . . . . . . . 1,163,115 15,707,524
Oil, Gas & Consumable Fuels — 11.7%Bharat Petroleum Corp. Ltd. . . . . . . . . . . . . . . . . . . . . . . . . . . . . 5,566,706 27,382,160Coal India Ltd. . . . . . . . . . . . . . . . . . . . . . . . . . . . . . . . . . . . . . . . . . 9,884,193 19,974,683Hindustan Petroleum Corp. Ltd. . . . . . . . . . . . . . . . . . . . . . . . . 4,095,291 16,091,102Indian Oil Corp. Ltd.. . . . . . . . . . . . . . . . . . . . . . . . . . . . . . . . . . . . 12,079,243 19,057,796Oil & Natural Gas Corp. Ltd. . . . . . . . . . . . . . . . . . . . . . . . . . . . . 16,141,669 30,281,738Petronet LNG Ltd. . . . . . . . . . . . . . . . . . . . . . . . . . . . . . . . . . . . . . 4,816,537 14,089,253Reliance Industries Ltd. . . . . . . . . . . . . . . . . . . . . . . . . . . . . . . . . 18,301,715 585,180,503
712,057,235Personal Products — 1.6%Colgate-Palmolive India Ltd. . . . . . . . . . . . . . . . . . . . . . . . . . . . . 785,212 14,979,732Dabur India Ltd.. . . . . . . . . . . . . . . . . . . . . . . . . . . . . . . . . . . . . . . . 3,969,555 31,424,127Godrej Consumer Products Ltd.(b) . . . . . . . . . . . . . . . . . . . . . . 2,296,031 28,155,079Marico Ltd. . . . . . . . . . . . . . . . . . . . . . . . . . . . . . . . . . . . . . . . . . . . . 3,311,961 23,736,498
98,295,436Pharmaceuticals — 3.1%Aurobindo Pharma Ltd.. . . . . . . . . . . . . . . . . . . . . . . . . . . . . . . . . 1,880,523 16,510,192Cipla Ltd. . . . . . . . . . . . . . . . . . . . . . . . . . . . . . . . . . . . . . . . . . . . . . . 3,105,023 40,112,821Dr. Reddy's Laboratories Ltd. . . . . . . . . . . . . . . . . . . . . . . . . . . . 747,143 46,573,486Lupin Ltd. . . . . . . . . . . . . . . . . . . . . . . . . . . . . . . . . . . . . . . . . . . . . . 1,457,078 17,141,443Sun Pharmaceutical Industries Ltd. . . . . . . . . . . . . . . . . . . . . . 5,387,645 54,014,455Torrent Pharmaceuticals Ltd. . . . . . . . . . . . . . . . . . . . . . . . . . . . 325,849 13,175,601
187,527,998Real Estate Management & Development — 0.7%DLF Ltd.. . . . . . . . . . . . . . . . . . . . . . . . . . . . . . . . . . . . . . . . . . . . . . . 3,970,070 19,774,695
Security Shares
Value
Real Estate Management & Development (continued)Godrej Properties Ltd.(b) . . . . . . . . . . . . . . . . . . . . . . . . . . . . . . . . 800,393 $ 21,265,357
41,040,052Road & Rail — 0.2%Container Corp. of India Ltd.. . . . . . . . . . . . . . . . . . . . . . . . . . . . 1,563,563 12,893,292
Textiles, Apparel & Luxury Goods — 1.5%Page Industries Ltd.. . . . . . . . . . . . . . . . . . . . . . . . . . . . . . . . . . . . 35,779 18,285,513Titan Co. Ltd. . . . . . . . . . . . . . . . . . . . . . . . . . . . . . . . . . . . . . . . . . . 2,278,225 71,974,964
90,260,477Thrifts & Mortgage Finance — 6.4%Housing Development Finance Corp. Ltd. . . . . . . . . . . . . . . . 11,011,110 391,917,470
Tobacco — 0.9%ITC Ltd. . . . . . . . . . . . . . . . . . . . . . . . . . . . . . . . . . . . . . . . . . . . . . . . 18,962,418 55,717,191
Trading Companies & Distributors — 0.6%Adani Enterprises Ltd.. . . . . . . . . . . . . . . . . . . . . . . . . . . . . . . . . . 1,764,341 38,977,085
Transportation Infrastructure — 0.5%Adani Ports & Special Economic Zone Ltd. . . . . . . . . . . . . . . 3,274,698 29,803,173
Wireless Telecommunication Services — 2.5%Bharti Airtel Ltd.(b). . . . . . . . . . . . . . . . . . . . . . . . . . . . . . . . . . . . . . 15,845,933 153,563,150
Total Common Stocks — 99.2%(Cost: $3,437,463,056). . . . . . . . . . . . . . . . . . . . . . . . . . . . . . . . . . . . . . . . . . . 6,048,916,425
Short-Term InvestmentsMoney Market Funds — 0.7%BlackRock Cash Funds: Treasury, SL Agency Shares,
0.00%(c)(d) . . . . . . . . . . . . . . . . . . . . . . . . . . . . . . . . . . . . . . . . . . 42,300,000 42,300,000
Total Short-Term Investments — 0.7%(Cost: $42,300,000). . . . . . . . . . . . . . . . . . . . . . . . . . . . . . . . . . . . . . . . . . . . . . 42,300,000
Total Investments in Securities — 99.9%(Cost: $3,479,763,056). . . . . . . . . . . . . . . . . . . . . . . . . . . . . . . . . . . . . . . . . . . 6,091,216,425
Other Assets, Less Liabilities — 0.1% . . . . . . . . . . . . . . . . . . . . . . . . . . . . . 4,046,299
Net Assets — 100.0% . . . . . . . . . . . . . . . . . . . . . . . . . . . . . . . . . . . . . . . . . . . . . . $ 6,095,262,724 (a) Security exempt from registration pursuant to Rule 144A under the Securities Act of
1933, as amended. These securities may be resold in transactions exempt fromregistration to qualified institutional investors.
(b) Non-income producing security.(c) Affiliate of the Fund.(d) Annualized 7-day yield as of period end.
Consolidated Schedule of Investments (unaudited) (continued)
November 30, 2021
iShares� MSCI India ETF(Percentages shown are based on Net Assets)
104 NM0122U-1995964-106/159

Affiliates
Investments in issuers considered to be affiliate(s) of the Fund during the period ended November 30, 2021 for purposes of Section 2(a)(3) of the Investment Company Actof 1940, as amended, were as follows:
Affiliated IssuerValue at
08/31/21Purchases
at CostProceeds
from SalesNet Realized
Gain (Loss)
Change inUnrealized
Appreciation(Depreciation)
Value at11/30/21
SharesHeld at
11/30/21 Income
CapitalGain
Distributionsfrom
UnderlyingFunds
BlackRock Cash Funds: Treasury, SL AgencyShares. . . . . . . . . . . . . . . . . . . . . . . . . . . . . . . . . . . . . . $138,250,000 $ — $(95,950,000)(a) $ — $ — $42,300,000 42,300,000 $ 2,666 $ —
(a) Represents net amount purchased (sold).
Derivative Financial Instruments Outstanding as of Period End
Futures Contracts
DescriptionNumber ofContracts
ExpirationDate
NotionalAmount
(000)
Value/Unrealized
Appreciation(Depreciation)
Long ContractsSGX CNX Nifty Index . . . . . . . . . . . . . . . . . . . . . . . . . . . . . . . . . . . . . . . . . . . . . . . . . . . . . . . . . . . . . . . . . . . . . . . . . . . . . . . . . . . . . . . . . . . . . . . . 545 12/30/21 $18,572 $ (795,928)
Fair Value Measurements
Various inputs are used in determining the fair value of financial instruments. These inputs to valuation techniques are categorized into a fair value hierarchy consisting ofthree broad levels for financial reporting purposes as follows:
• Level 1 – Unadjusted price quotations in active markets/exchanges for identical assets or liabilities that each Fund has the ability to access;• Level 2 – Other observable inputs (including, but not limited to, quoted prices for similar assets or liabilities in markets that are active, quoted prices for identical or
similar assets or liabilities in markets that are not active, inputs other than quoted prices that are observable for the assets or liabilities (such as interest rates, yieldcurves, volatilities, prepayment speeds, loss severities, credit risks and default rates) or other market-corroborated inputs); and
• Level 3 – Unobservable inputs based on the best information available in the circumstances, to the extent observable inputs are not available (including the BlackRockGlobal Valuation Methodologies Committee’s (the “Global Valuation Committee’s”) assumptions used in determining the fair value of financial instruments).
The hierarchy gives the highest priority to unadjusted quoted prices in active markets for identical assets or liabilities (Level 1 measurements) and the lowest priority tounobservable inputs (Level 3 measurements). Accordingly, the degree of judgment exercised in determining fair value is greatest for instruments categorized in Level 3. Theinputs used to measure fair value may fall into different levels of the fair value hierarchy. In such cases, for disclosure purposes, the fair value hierarchy classification isdetermined based on the lowest level input that is significant to the fair value measurement in its entirety. Investments classified within Level 3 have significant unobservableinputs used by the Global Valuation Committee in determining the price for Fair Valued Investments. Level 3 investments include equity or debt issued by privately heldcompanies or funds. There may not be a secondary market, and/or there are a limited number of investors. The categorization of a value determined for financial instrumentsis based on the pricing transparency of the financial instruments and is not necessarily an indication of the risks associated with investing in those securities. For informationabout the Fund’s policy regarding valuation of financial instruments, refer to its most recent financial statements.
The following table summarizes the Fund’s financial instruments categorized in the fair value hierarchy. The breakdown of the Fund’s financial instruments into majorcategories is disclosed in the Schedule of Investments above.
Level 1 Level 2 Level 3 Total
InvestmentsAssets
Common Stocks . . . . . . . . . . . . . . . . . . . . . . . . . . . . . . . . . . . . . . . . . . . . . . . . . . . . . . . . . . . . . . . . . . . . . . . . . . . . $ 57,929,303 $5,990,987,122 $ — $6,048,916,425Money Market Funds . . . . . . . . . . . . . . . . . . . . . . . . . . . . . . . . . . . . . . . . . . . . . . . . . . . . . . . . . . . . . . . . . . . . . . . . 42,300,000 — — 42,300,000
$ 100,229,303 $5,990,987,122 $ — $6,091,216,425
Derivative financial instruments(a)
LiabilitiesFutures Contracts . . . . . . . . . . . . . . . . . . . . . . . . . . . . . . . . . . . . . . . . . . . . . . . . . . . . . . . . . . . . . . . . . . . . . . . . . . . $ — $ (795,928) $ — $ (795,928)
(a) Derivative financial instruments are futures contracts. Futures contracts are valued at the unrealized appreciation (depreciation) on the instrument.
Consolidated Schedule of Investments (unaudited) (continued)
November 30, 2021
iShares� MSCI India ETF
105NM0122U-1995964-107/159

Security Shares
Value
Common StocksAir Freight & Logistics — 0.6%Allcargo Logistics Ltd.. . . . . . . . . . . . . . . . . . . . . . . . . . . . . . . . . . . . 125,072 $ 555,774Blue Dart Express Ltd. . . . . . . . . . . . . . . . . . . . . . . . . . . . . . . . . . . . 8,053 702,306Mahindra Logistics Ltd.(a) . . . . . . . . . . . . . . . . . . . . . . . . . . . . . . . . 48,718 425,612TCI Express Ltd.. . . . . . . . . . . . . . . . . . . . . . . . . . . . . . . . . . . . . . . . . 22,726 647,632
2,331,324Airlines — 0.1%SpiceJet Ltd.(b) . . . . . . . . . . . . . . . . . . . . . . . . . . . . . . . . . . . . . . . . . . 408,186 381,191
Auto Components — 3.5%Apollo Tyres Ltd.. . . . . . . . . . . . . . . . . . . . . . . . . . . . . . . . . . . . . . . . . 538,835 1,465,117Asahi India Glass Ltd.. . . . . . . . . . . . . . . . . . . . . . . . . . . . . . . . . . . . 103,122 661,043Ceat Ltd. . . . . . . . . . . . . . . . . . . . . . . . . . . . . . . . . . . . . . . . . . . . . . . . . 37,751 590,172Endurance Technologies Ltd.(a) . . . . . . . . . . . . . . . . . . . . . . . . . . . 59,671 1,324,916Exide Industries Ltd. . . . . . . . . . . . . . . . . . . . . . . . . . . . . . . . . . . . . . 649,045 1,403,724Mahindra CIE Automotive Ltd.(b) . . . . . . . . . . . . . . . . . . . . . . . . . . 192,958 612,636Minda Industries Ltd.. . . . . . . . . . . . . . . . . . . . . . . . . . . . . . . . . . . . . 120,840 1,454,736Sundaram Clayton Ltd.. . . . . . . . . . . . . . . . . . . . . . . . . . . . . . . . . . . 8,583 510,794Sundram Fasteners Ltd. . . . . . . . . . . . . . . . . . . . . . . . . . . . . . . . . . 160,450 1,870,089Suprajit Engineering Ltd. . . . . . . . . . . . . . . . . . . . . . . . . . . . . . . . . . 117,409 649,673Tube Investments of India Ltd.. . . . . . . . . . . . . . . . . . . . . . . . . . . . 163,604 3,542,449
14,085,349Automobiles — 0.7%TVS Motor Co. Ltd. . . . . . . . . . . . . . . . . . . . . . . . . . . . . . . . . . . . . . . 322,461 2,945,604
Banks — 3.4%AU Small Finance Bank Ltd.(a)(b). . . . . . . . . . . . . . . . . . . . . . . . . . 132,774 1,937,316Canara Bank(b) . . . . . . . . . . . . . . . . . . . . . . . . . . . . . . . . . . . . . . . . . . 615,661 1,630,474City Union Bank Ltd. . . . . . . . . . . . . . . . . . . . . . . . . . . . . . . . . . . . . . 614,298 1,180,840DCB Bank Ltd.(b) . . . . . . . . . . . . . . . . . . . . . . . . . . . . . . . . . . . . . . . . 18,775 20,478Equitas Small Finance Bank Ltd.(a)(b) . . . . . . . . . . . . . . . . . . . . . 388,643 311,835Federal Bank Ltd.. . . . . . . . . . . . . . . . . . . . . . . . . . . . . . . . . . . . . . . . 2,618,077 3,018,922IDFC First Bank Ltd.(b) . . . . . . . . . . . . . . . . . . . . . . . . . . . . . . . . . . . 5,165,097 3,057,293Karur Vysya Bank Ltd. (The) . . . . . . . . . . . . . . . . . . . . . . . . . . . . . 664,600 423,230RBL Bank Ltd.(a)(b) . . . . . . . . . . . . . . . . . . . . . . . . . . . . . . . . . . . . . . . 610,188 1,480,205Yes Bank Ltd., (Acquired 03/16/20, Cost: $3,554,476)(c) . . . 4,044,378 579,636
13,640,229Beverages — 1.2%Radico Khaitan Ltd. . . . . . . . . . . . . . . . . . . . . . . . . . . . . . . . . . . . . . . 124,753 1,870,233Varun Beverages Ltd. . . . . . . . . . . . . . . . . . . . . . . . . . . . . . . . . . . . . 257,177 3,048,672
4,918,905Building Products — 2.2%Astral Ltd. . . . . . . . . . . . . . . . . . . . . . . . . . . . . . . . . . . . . . . . . . . . . . . . 153,419 4,496,531Blue Star Ltd.. . . . . . . . . . . . . . . . . . . . . . . . . . . . . . . . . . . . . . . . . . . . 98,058 1,239,979Cera Sanitaryware Ltd.. . . . . . . . . . . . . . . . . . . . . . . . . . . . . . . . . . . 8,828 587,523Kajaria Ceramics Ltd. . . . . . . . . . . . . . . . . . . . . . . . . . . . . . . . . . . . . 134,968 2,048,012Prince Pipes and Fittings Ltd. . . . . . . . . . . . . . . . . . . . . . . . . . . . . 46,674 452,440
8,824,485Capital Markets — 4.2%Angel One Ltd. . . . . . . . . . . . . . . . . . . . . . . . . . . . . . . . . . . . . . . . . . . 35,044 472,950BSE Ltd. . . . . . . . . . . . . . . . . . . . . . . . . . . . . . . . . . . . . . . . . . . . . . . . . 37,436 777,014Central Depository Services India Ltd. . . . . . . . . . . . . . . . . . . . . 86,887 1,678,424CRISIL Ltd.. . . . . . . . . . . . . . . . . . . . . . . . . . . . . . . . . . . . . . . . . . . . . . 24,703 1,021,944Dhani Services Ltd.(b) . . . . . . . . . . . . . . . . . . . . . . . . . . . . . . . . . . . . 357,774 785,876Edelweiss Financial Services Ltd. . . . . . . . . . . . . . . . . . . . . . . . . 874,327 777,786ICICI Securities Ltd.(a) . . . . . . . . . . . . . . . . . . . . . . . . . . . . . . . . . . . 136,848 1,332,537IDFC Ltd.(b). . . . . . . . . . . . . . . . . . . . . . . . . . . . . . . . . . . . . . . . . . . . . . 1,896,238 1,260,646IIFL Wealth Management Ltd. . . . . . . . . . . . . . . . . . . . . . . . . . . . . 59,993 1,192,232Indian Energy Exchange Ltd.(a) . . . . . . . . . . . . . . . . . . . . . . . . . . . 248,235 2,458,386
Security Shares
Value
Capital Markets (continued)JM Financial Ltd. . . . . . . . . . . . . . . . . . . . . . . . . . . . . . . . . . . . . . . . . 728,128 $ 688,915Motilal Oswal Financial Services Ltd. . . . . . . . . . . . . . . . . . . . . . 62,342 784,106Multi Commodity Exchange of India Ltd. . . . . . . . . . . . . . . . . . . 42,324 901,546Nippon Life India Asset Management Ltd.(a) . . . . . . . . . . . . . . . 210,106 1,022,980Tata Investment Corp. Ltd. . . . . . . . . . . . . . . . . . . . . . . . . . . . . . . . 21,463 400,324UTI Asset Management Co. Ltd. . . . . . . . . . . . . . . . . . . . . . . . . . . 75,327 1,098,899
16,654,565Chemicals — 12.2%Aarti Industries Ltd. . . . . . . . . . . . . . . . . . . . . . . . . . . . . . . . . . . . . . . 338,313 4,224,279Advanced Enzyme Technologies Ltd. . . . . . . . . . . . . . . . . . . . . . 75,868 331,111Akzo Nobel India Ltd. . . . . . . . . . . . . . . . . . . . . . . . . . . . . . . . . . . . . 15,455 423,369Alkyl Amines Chemicals. . . . . . . . . . . . . . . . . . . . . . . . . . . . . . . . . . 21,661 918,363Atul Ltd. . . . . . . . . . . . . . . . . . . . . . . . . . . . . . . . . . . . . . . . . . . . . . . . . . 25,102 2,902,626Balaji Amines Ltd.. . . . . . . . . . . . . . . . . . . . . . . . . . . . . . . . . . . . . . . . 16,498 657,631BASF India Ltd.. . . . . . . . . . . . . . . . . . . . . . . . . . . . . . . . . . . . . . . . . . 18,362 662,788Bayer CropScience Ltd./India . . . . . . . . . . . . . . . . . . . . . . . . . . . . 22,878 1,400,673Carborundum Universal Ltd.. . . . . . . . . . . . . . . . . . . . . . . . . . . . . . 177,100 2,161,113Castrol India Ltd. . . . . . . . . . . . . . . . . . . . . . . . . . . . . . . . . . . . . . . . . 671,357 1,156,323Chambal Fertilizers and Chemicals Ltd. . . . . . . . . . . . . . . . . . . . 282,205 1,363,920Chemplast Sanmar Ltd.(b) . . . . . . . . . . . . . . . . . . . . . . . . . . . . . . . . 67,072 511,033Clean Science and Technology(b) . . . . . . . . . . . . . . . . . . . . . . . . . 36,048 1,026,171Coromandel International Ltd. . . . . . . . . . . . . . . . . . . . . . . . . . . . . 199,165 1,959,577Deepak Fertilisers & Petrochemicals Corp. Ltd. . . . . . . . . . . . 92,083 456,417Deepak Nitrite Ltd. . . . . . . . . . . . . . . . . . . . . . . . . . . . . . . . . . . . . . . . 115,719 3,261,474EID Parry India Ltd. . . . . . . . . . . . . . . . . . . . . . . . . . . . . . . . . . . . . . . 120,206 743,800Fine Organic Industries Ltd. . . . . . . . . . . . . . . . . . . . . . . . . . . . . . . 13,006 620,902Finolex Industries Ltd.. . . . . . . . . . . . . . . . . . . . . . . . . . . . . . . . . . . . 419,693 1,181,508Galaxy Surfactants Ltd. . . . . . . . . . . . . . . . . . . . . . . . . . . . . . . . . . . 18,048 664,473Gujarat Fluorochemicals Ltd.(b) . . . . . . . . . . . . . . . . . . . . . . . . . . . 37,280 975,672Gujarat Narmada Valley Fertilizers & Chemicals Ltd.. . . . . . . 131,861 744,196Gujarat State Fertilizers & Chemicals Ltd. . . . . . . . . . . . . . . . . . 304,270 451,633Indigo Paints Ltd.(b) . . . . . . . . . . . . . . . . . . . . . . . . . . . . . . . . . . . . . . 16,143 476,706Jubilant Ingrevia Ltd. . . . . . . . . . . . . . . . . . . . . . . . . . . . . . . . . . . . . . 108,110 793,931Kansai Nerolac Paints Ltd. . . . . . . . . . . . . . . . . . . . . . . . . . . . . . . . 158,169 1,254,892Laxmi Organic Industries Ltd. . . . . . . . . . . . . . . . . . . . . . . . . . . . . 79,665 437,109Linde India Ltd. . . . . . . . . . . . . . . . . . . . . . . . . . . . . . . . . . . . . . . . . . . 36,179 1,204,709Navin Fluorine International Ltd. . . . . . . . . . . . . . . . . . . . . . . . . . . 54,614 2,718,825NOCIL Ltd. . . . . . . . . . . . . . . . . . . . . . . . . . . . . . . . . . . . . . . . . . . . . . . 169,450 508,220Polyplex Corporation Ltd. . . . . . . . . . . . . . . . . . . . . . . . . . . . . . . . . 21,307 523,273Rain Industries Ltd. . . . . . . . . . . . . . . . . . . . . . . . . . . . . . . . . . . . . . . 285,364 752,489Rallis India Ltd. . . . . . . . . . . . . . . . . . . . . . . . . . . . . . . . . . . . . . . . . . . 131,994 436,481Rossari Biotech Ltd. . . . . . . . . . . . . . . . . . . . . . . . . . . . . . . . . . . . . . 23,355 402,149Solar Industries India Ltd. . . . . . . . . . . . . . . . . . . . . . . . . . . . . . . . . 46,064 1,696,282Sumitomo Chemical India Ltd. . . . . . . . . . . . . . . . . . . . . . . . . . . . . 169,395 839,072Supreme Industries Ltd.. . . . . . . . . . . . . . . . . . . . . . . . . . . . . . . . . . 107,773 3,113,385Supreme Petrochem Ltd.. . . . . . . . . . . . . . . . . . . . . . . . . . . . . . . . . 55,839 488,799Tata Chemicals Ltd.. . . . . . . . . . . . . . . . . . . . . . . . . . . . . . . . . . . . . . 280,984 3,260,420Vinati Organics Ltd. . . . . . . . . . . . . . . . . . . . . . . . . . . . . . . . . . . . . . . 43,601 1,093,953
48,799,747Commercial Services & Supplies — 0.1%SIS Ltd.(b) . . . . . . . . . . . . . . . . . . . . . . . . . . . . . . . . . . . . . . . . . . . . . . . 62,298 398,644
Communications Equipment — 0.4%Sterlite Technologies Ltd.. . . . . . . . . . . . . . . . . . . . . . . . . . . . . . . . . 269,333 989,015Tejas Networks Ltd.(a)(b) . . . . . . . . . . . . . . . . . . . . . . . . . . . . . . . . . . 96,653 587,808
1,576,823Construction & Engineering — 3.1%Dilip Buildcon Ltd.(a) . . . . . . . . . . . . . . . . . . . . . . . . . . . . . . . . . . . . . 62,026 435,866Engineers India Ltd. . . . . . . . . . . . . . . . . . . . . . . . . . . . . . . . . . . . . . 429,166 409,211
Consolidated Schedule of Investments (unaudited)
November 30, 2021
iShares� MSCI India Small-Cap ETF(Percentages shown are based on Net Assets)
106 NM0122U-1995964-108/159

Security Shares
Value
Construction & Engineering (continued)IRB Infrastructure Developers Ltd.(b) . . . . . . . . . . . . . . . . . . . . . . 208,725 $ 570,135Kalpataru Power Transmission Ltd. . . . . . . . . . . . . . . . . . . . . . . . 113,704 588,564KEC International Ltd.. . . . . . . . . . . . . . . . . . . . . . . . . . . . . . . . . . . . 196,308 1,110,490KNR Constructions Ltd. . . . . . . . . . . . . . . . . . . . . . . . . . . . . . . . . . . 214,746 805,682NBCC India Ltd. . . . . . . . . . . . . . . . . . . . . . . . . . . . . . . . . . . . . . . . . . 1,221,731 654,927NCC Ltd./India. . . . . . . . . . . . . . . . . . . . . . . . . . . . . . . . . . . . . . . . . . . 672,632 634,349PNC Infratech Ltd. . . . . . . . . . . . . . . . . . . . . . . . . . . . . . . . . . . . . . . . 152,358 622,593Praj Industries Ltd.. . . . . . . . . . . . . . . . . . . . . . . . . . . . . . . . . . . . . . . 118,895 512,584Sterling & Wilson Solar Ltd.(b) . . . . . . . . . . . . . . . . . . . . . . . . . . . . 68,027 361,803Voltas Ltd.. . . . . . . . . . . . . . . . . . . . . . . . . . . . . . . . . . . . . . . . . . . . . . . 364,815 5,825,456
12,531,660Construction Materials — 3.1%Birla Corp. Ltd. . . . . . . . . . . . . . . . . . . . . . . . . . . . . . . . . . . . . . . . . . . 45,733 821,065Dalmia Bharat Ltd. . . . . . . . . . . . . . . . . . . . . . . . . . . . . . . . . . . . . . . . 127,004 3,163,208HeidelbergCement India Ltd. . . . . . . . . . . . . . . . . . . . . . . . . . . . . . 115,358 338,043India Cements Ltd. (The) . . . . . . . . . . . . . . . . . . . . . . . . . . . . . . . . . 236,631 578,474JK Cement Ltd. . . . . . . . . . . . . . . . . . . . . . . . . . . . . . . . . . . . . . . . . . . 59,001 2,546,434JK Lakshmi Cement Ltd. . . . . . . . . . . . . . . . . . . . . . . . . . . . . . . . . . 99,834 843,720Nuvoco Vistas Corp. Ltd.(b) . . . . . . . . . . . . . . . . . . . . . . . . . . . . . . . 138,416 978,641Prism Johnson Ltd.(b) . . . . . . . . . . . . . . . . . . . . . . . . . . . . . . . . . . . . 213,530 348,991Ramco Cements Ltd. (The). . . . . . . . . . . . . . . . . . . . . . . . . . . . . . . 220,206 2,760,733
12,379,309Consumer Finance — 3.0%Cholamandalam Financial Holdings Ltd. . . . . . . . . . . . . . . . . . . 159,275 1,480,689CreditAccess Grameen Ltd.(b) . . . . . . . . . . . . . . . . . . . . . . . . . . . . 79,293 531,708Mahindra & Mahindra Financial Services Ltd. . . . . . . . . . . . . . 1,048,254 2,161,181Manappuram Finance Ltd. . . . . . . . . . . . . . . . . . . . . . . . . . . . . . . . 861,723 1,872,863MAS Financial Services Ltd.(a). . . . . . . . . . . . . . . . . . . . . . . . . . . . 28,666 261,788Paisalo Digital Ltd. . . . . . . . . . . . . . . . . . . . . . . . . . . . . . . . . . . . . . . . 43,058 551,743Poonawalla Fincorp Ltd.(b) . . . . . . . . . . . . . . . . . . . . . . . . . . . . . . . 259,458 625,924Shriram City Union Finance Ltd. . . . . . . . . . . . . . . . . . . . . . . . . . . 39,200 1,161,069Spandana Sphoorty Financial Ltd.(b) . . . . . . . . . . . . . . . . . . . . . . 33,686 178,477Sundaram Finance Ltd. . . . . . . . . . . . . . . . . . . . . . . . . . . . . . . . . . . 102,828 3,096,311
11,921,753Containers & Packaging — 0.1%EPL Ltd.. . . . . . . . . . . . . . . . . . . . . . . . . . . . . . . . . . . . . . . . . . . . . . . . . 214,187 563,892
Diversified Financial Services — 1.4%Aditya Birla Capital Ltd.(b) . . . . . . . . . . . . . . . . . . . . . . . . . . . . . . . . 778,957 1,130,890L&T Finance Holdings Ltd.(b) . . . . . . . . . . . . . . . . . . . . . . . . . . . . . 1,255,025 1,254,825REC Ltd. . . . . . . . . . . . . . . . . . . . . . . . . . . . . . . . . . . . . . . . . . . . . . . . . 1,675,569 2,999,871
5,385,586Diversified Telecommunication Services — 1.1%HFCL Ltd. . . . . . . . . . . . . . . . . . . . . . . . . . . . . . . . . . . . . . . . . . . . . . . . 984,495 940,578Tata Communications Ltd.. . . . . . . . . . . . . . . . . . . . . . . . . . . . . . . . 193,441 3,340,581Tata Teleservices Maharastra Ltd.(b) . . . . . . . . . . . . . . . . . . . . . . 27,437 41,090
4,322,249Electric Utilities — 0.8%CESC Ltd.. . . . . . . . . . . . . . . . . . . . . . . . . . . . . . . . . . . . . . . . . . . . . . . 1,012,182 1,177,337Torrent Power Ltd. . . . . . . . . . . . . . . . . . . . . . . . . . . . . . . . . . . . . . . . 285,437 2,094,463
3,271,800Electrical Equipment — 3.1%ABB Power Products & Systems India Ltd. . . . . . . . . . . . . . . . . 14,383 506,450Amara Raja Batteries Ltd. . . . . . . . . . . . . . . . . . . . . . . . . . . . . . . . . 159,414 1,310,308Bharat Heavy Electricals Ltd.(b) . . . . . . . . . . . . . . . . . . . . . . . . . . . 1,477,134 1,156,438CG Power and Industrial Solutions Ltd.(b) . . . . . . . . . . . . . . . . . 917,550 1,829,541Finolex Cables Ltd. . . . . . . . . . . . . . . . . . . . . . . . . . . . . . . . . . . . . . . 117,416 885,592Graphite India Ltd. . . . . . . . . . . . . . . . . . . . . . . . . . . . . . . . . . . . . . . . 99,457 539,716HEG Ltd. . . . . . . . . . . . . . . . . . . . . . . . . . . . . . . . . . . . . . . . . . . . . . . . . 19,647 471,699
Security Shares
Value
Electrical Equipment (continued)KEI Industries Ltd. . . . . . . . . . . . . . . . . . . . . . . . . . . . . . . . . . . . . . . . 91,733 $ 1,348,846Olectra Greentech Ltd.(b) . . . . . . . . . . . . . . . . . . . . . . . . . . . . . . . . . 55,711 610,873Polycab India Ltd.. . . . . . . . . . . . . . . . . . . . . . . . . . . . . . . . . . . . . . . . 63,316 1,941,779Suzlon Energy Ltd.(b) . . . . . . . . . . . . . . . . . . . . . . . . . . . . . . . . . . . . 8,271,562 753,936V-Guard Industries Ltd. . . . . . . . . . . . . . . . . . . . . . . . . . . . . . . . . . . 291,986 951,409
12,306,587Electronic Equipment, Instruments & Components — 0.4%Redington India Ltd. . . . . . . . . . . . . . . . . . . . . . . . . . . . . . . . . . . . . . 862,391 1,687,067
Entertainment — 0.8%Chennai Super Kings Cricket Ltd.(d). . . . . . . . . . . . . . . . . . . . . . . 206,787 28Inox Leisure Ltd.(b) . . . . . . . . . . . . . . . . . . . . . . . . . . . . . . . . . . . . . . . 103,795 552,795Nazara Technologies Ltd.(b) . . . . . . . . . . . . . . . . . . . . . . . . . . . . . . 12,918 385,293PVR Ltd.(b) . . . . . . . . . . . . . . . . . . . . . . . . . . . . . . . . . . . . . . . . . . . . . . 77,337 1,409,555Saregama India Ltd. . . . . . . . . . . . . . . . . . . . . . . . . . . . . . . . . . . . . . 11,451 650,232
2,997,903Equity Real Estate Investment Trusts (REITs) — 1.3%Brookfield India Real Estate Trust(a) . . . . . . . . . . . . . . . . . . . . . . 179,833 678,461Embassy Office Parks REIT . . . . . . . . . . . . . . . . . . . . . . . . . . . . . . 723,795 3,469,092Mindspace Business Parks REIT(a) . . . . . . . . . . . . . . . . . . . . . . . 251,566 1,060,477
5,208,030Food Products — 1.0%Avanti Feeds Ltd. . . . . . . . . . . . . . . . . . . . . . . . . . . . . . . . . . . . . . . . . 92,475 646,803Balrampur Chini Mills Ltd. . . . . . . . . . . . . . . . . . . . . . . . . . . . . . . . . 213,803 887,137Bombay Burmah Trading Co.. . . . . . . . . . . . . . . . . . . . . . . . . . . . . 29,598 391,650CCL Products India Ltd. . . . . . . . . . . . . . . . . . . . . . . . . . . . . . . . . . . 124,151 665,326Kaveri Seed Co. Ltd. . . . . . . . . . . . . . . . . . . . . . . . . . . . . . . . . . . . . . 41,826 278,243Shree Renuka Sugars Ltd.(b) . . . . . . . . . . . . . . . . . . . . . . . . . . . . . 902,932 297,964Triveni Engineering & Industries Ltd. . . . . . . . . . . . . . . . . . . . . . . 123,067 338,157Zydus Wellness Ltd. . . . . . . . . . . . . . . . . . . . . . . . . . . . . . . . . . . . . . 21,595 563,489
4,068,769Gas Utilities — 1.4%Gujarat Gas Ltd. . . . . . . . . . . . . . . . . . . . . . . . . . . . . . . . . . . . . . . . . . 292,024 2,600,477Gujarat State Petronet Ltd. . . . . . . . . . . . . . . . . . . . . . . . . . . . . . . . 478,691 1,997,935Mahanagar Gas Ltd. . . . . . . . . . . . . . . . . . . . . . . . . . . . . . . . . . . . . . 92,186 1,121,578
5,719,990Health Care Equipment & Supplies — 0.1%Poly Medicure Ltd. . . . . . . . . . . . . . . . . . . . . . . . . . . . . . . . . . . . . . . . 40,674 559,883
Health Care Providers & Services — 3.1%Aster DM Healthcare Ltd.(a)(b) . . . . . . . . . . . . . . . . . . . . . . . . . . . . 211,900 541,612Dr Lal PathLabs Ltd.(a) . . . . . . . . . . . . . . . . . . . . . . . . . . . . . . . . . . . 56,089 2,829,766Fortis Healthcare Ltd.(b) . . . . . . . . . . . . . . . . . . . . . . . . . . . . . . . . . . 768,630 2,874,031Krishna Institute Of Medical Sciences Ltd.(a) . . . . . . . . . . . . . . 27,159 448,425Max Healthcare Institute Ltd.(b) . . . . . . . . . . . . . . . . . . . . . . . . . . . 491,719 2,489,701Metropolis Healthcare Ltd.(a) . . . . . . . . . . . . . . . . . . . . . . . . . . . . . 43,414 1,899,109Narayana Hrudayalaya Ltd.(b) . . . . . . . . . . . . . . . . . . . . . . . . . . . . 121,369 964,065Thyrocare Technologies Ltd.(a) . . . . . . . . . . . . . . . . . . . . . . . . . . . 31,402 461,376
12,508,085Hotels, Restaurants & Leisure — 1.4%Burger King India Ltd.(b) . . . . . . . . . . . . . . . . . . . . . . . . . . . . . . . . . . 260,604 515,049Chalet Hotel Ltd.(b). . . . . . . . . . . . . . . . . . . . . . . . . . . . . . . . . . . . . . . 104,368 330,314Delta Corp. Ltd.. . . . . . . . . . . . . . . . . . . . . . . . . . . . . . . . . . . . . . . . . . 108,661 356,624Devyani International Ltd.(b) . . . . . . . . . . . . . . . . . . . . . . . . . . . . . . 408,100 804,498EIH Ltd.(b) . . . . . . . . . . . . . . . . . . . . . . . . . . . . . . . . . . . . . . . . . . . . . . . 265,287 424,538Indian Hotels Co. Ltd. (The) . . . . . . . . . . . . . . . . . . . . . . . . . . . . . . 1,104,740 2,649,637Westlife Development Ltd.(b) . . . . . . . . . . . . . . . . . . . . . . . . . . . . . 92,555 676,560
5,757,220
Consolidated Schedule of Investments (unaudited) (continued)
November 30, 2021
iShares� MSCI India Small-Cap ETF(Percentages shown are based on Net Assets)
107NM0122U-1995964-109/159

Security Shares
Value
Household Durables — 4.2%Amber Enterprises India Ltd.(b) . . . . . . . . . . . . . . . . . . . . . . . . . . . 28,587 $ 1,146,730Bajaj Electricals Ltd.(b) . . . . . . . . . . . . . . . . . . . . . . . . . . . . . . . . . . . 77,810 1,112,453Crompton Greaves Consumer Electricals Ltd. . . . . . . . . . . . . . 905,602 5,406,846Dixon Technologies India Ltd. . . . . . . . . . . . . . . . . . . . . . . . . . . . . 54,738 3,692,872Johnson Controls-Hitachi Air Conditioning India Ltd.(b) . . . . . 11,979 302,024Orient Electric Ltd. . . . . . . . . . . . . . . . . . . . . . . . . . . . . . . . . . . . . . . . 216,028 1,120,691Sheela Foam Ltd.(b). . . . . . . . . . . . . . . . . . . . . . . . . . . . . . . . . . . . . . 24,833 1,077,449Symphony Ltd. . . . . . . . . . . . . . . . . . . . . . . . . . . . . . . . . . . . . . . . . . . 29,677 369,811TTK Prestige Ltd. . . . . . . . . . . . . . . . . . . . . . . . . . . . . . . . . . . . . . . . . 7,056 936,618Whirlpool of India Ltd. . . . . . . . . . . . . . . . . . . . . . . . . . . . . . . . . . . . . 53,833 1,462,576
16,628,070Household Products — 0.1%Jyothy Labs Ltd. . . . . . . . . . . . . . . . . . . . . . . . . . . . . . . . . . . . . . . . . . 249,239 512,851
Independent Power and Renewable Electricity Producers — 0.7%Adani Power Ltd.(b) . . . . . . . . . . . . . . . . . . . . . . . . . . . . . . . . . . . . . . 1,308,929 1,713,209NLC India Ltd. . . . . . . . . . . . . . . . . . . . . . . . . . . . . . . . . . . . . . . . . . . . 470,583 358,483Reliance Power Ltd.(b) . . . . . . . . . . . . . . . . . . . . . . . . . . . . . . . . . . . 4,038,651 693,238
2,764,930Industrial Conglomerates — 0.6%3M India Ltd.(b) . . . . . . . . . . . . . . . . . . . . . . . . . . . . . . . . . . . . . . . . . . 4,779 1,589,777Godrej Industries Ltd.(b) . . . . . . . . . . . . . . . . . . . . . . . . . . . . . . . . . . 85,670 649,804
2,239,581Insurance — 1.1%Max Financial Services Ltd.(b) . . . . . . . . . . . . . . . . . . . . . . . . . . . . 351,365 4,398,843
Interactive Media & Services — 0.3%Brightcom Group Ltd. . . . . . . . . . . . . . . . . . . . . . . . . . . . . . . . . . . . . 458,639 838,827Just Dial Ltd.(b) . . . . . . . . . . . . . . . . . . . . . . . . . . . . . . . . . . . . . . . . . . 49,618 432,007
1,270,834Internet & Direct Marketing Retail — 0.1%CarTrade Tech Ltd.(b) . . . . . . . . . . . . . . . . . . . . . . . . . . . . . . . . . . . . 31,109 380,457
IT Services — 4.0%Coforge Ltd. . . . . . . . . . . . . . . . . . . . . . . . . . . . . . . . . . . . . . . . . . . . . . 35,990 2,592,969Computer Age Management Services Ltd. . . . . . . . . . . . . . . . . 45,567 1,861,723eClerx Services Ltd. . . . . . . . . . . . . . . . . . . . . . . . . . . . . . . . . . . . . . 26,641 775,736Firstsource Solutions Ltd. . . . . . . . . . . . . . . . . . . . . . . . . . . . . . . . . 472,976 1,066,375Happiest Minds Technologies Ltd. . . . . . . . . . . . . . . . . . . . . . . . . 99,682 1,598,159Infibeam Avenues Ltd. . . . . . . . . . . . . . . . . . . . . . . . . . . . . . . . . . . . 565,070 296,867Mastek Ltd.. . . . . . . . . . . . . . . . . . . . . . . . . . . . . . . . . . . . . . . . . . . . . . 21,559 773,258NIIT Ltd.. . . . . . . . . . . . . . . . . . . . . . . . . . . . . . . . . . . . . . . . . . . . . . . . . 124,682 667,520Persistent Systems Ltd. . . . . . . . . . . . . . . . . . . . . . . . . . . . . . . . . . . 82,274 4,529,686Sonata Software Ltd. . . . . . . . . . . . . . . . . . . . . . . . . . . . . . . . . . . . . 105,790 1,286,625Vakrangee Ltd. . . . . . . . . . . . . . . . . . . . . . . . . . . . . . . . . . . . . . . . . . . 719,061 327,227
15,776,145Life Sciences Tools & Services — 0.4%Syngene International Ltd.(a)(b) . . . . . . . . . . . . . . . . . . . . . . . . . . . 204,027 1,621,541
Machinery — 5.3%AIA Engineering Ltd. . . . . . . . . . . . . . . . . . . . . . . . . . . . . . . . . . . . . . 72,021 1,818,441Ashok Leyland Ltd. . . . . . . . . . . . . . . . . . . . . . . . . . . . . . . . . . . . . . . 2,490,574 3,967,370BEML Ltd. . . . . . . . . . . . . . . . . . . . . . . . . . . . . . . . . . . . . . . . . . . . . . . . 31,799 782,188Cochin Shipyard Ltd.(a). . . . . . . . . . . . . . . . . . . . . . . . . . . . . . . . . . . 57,596 260,388Cummins India Ltd. . . . . . . . . . . . . . . . . . . . . . . . . . . . . . . . . . . . . . . 211,665 2,477,478Escorts Ltd. . . . . . . . . . . . . . . . . . . . . . . . . . . . . . . . . . . . . . . . . . . . . . 114,397 2,813,180GMM Pfaudler Ltd.. . . . . . . . . . . . . . . . . . . . . . . . . . . . . . . . . . . . . . . 11,162 664,049Grindwell Norton Ltd. . . . . . . . . . . . . . . . . . . . . . . . . . . . . . . . . . . . . 46,574 999,774ISGEC Heavy Engineering Ltd. . . . . . . . . . . . . . . . . . . . . . . . . . . . 43,669 320,113Lakshmi Machine Works Ltd. . . . . . . . . . . . . . . . . . . . . . . . . . . . . . 5,438 615,315
Security Shares
Value
Machinery (continued)MTAR Technologies Ltd. . . . . . . . . . . . . . . . . . . . . . . . . . . . . . . . . . 18,268 $ 513,152Schaeffler India Ltd.. . . . . . . . . . . . . . . . . . . . . . . . . . . . . . . . . . . . . . 13,261 1,370,882SKF India Ltd. . . . . . . . . . . . . . . . . . . . . . . . . . . . . . . . . . . . . . . . . . . . 37,750 1,946,017Thermax Ltd. . . . . . . . . . . . . . . . . . . . . . . . . . . . . . . . . . . . . . . . . . . . . 70,767 1,648,898Timken India Ltd. . . . . . . . . . . . . . . . . . . . . . . . . . . . . . . . . . . . . . . . . 31,909 858,054
21,055,299Marine — 0.1%Shipping Corp. of India Ltd. . . . . . . . . . . . . . . . . . . . . . . . . . . . . . . 197,598 390,713
Media — 2.3%Affle India Ltd.(b) . . . . . . . . . . . . . . . . . . . . . . . . . . . . . . . . . . . . . . . . . 90,443 1,386,362Sun TV Network Ltd. . . . . . . . . . . . . . . . . . . . . . . . . . . . . . . . . . . . . . 133,740 927,934TV18 Broadcast Ltd.(b) . . . . . . . . . . . . . . . . . . . . . . . . . . . . . . . . . . . 756,343 414,763Zee Entertainment Enterprises Ltd. . . . . . . . . . . . . . . . . . . . . . . . 1,466,865 6,327,182
9,056,241Metals & Mining — 2.3%APL Apollo Tubes Ltd.(b) . . . . . . . . . . . . . . . . . . . . . . . . . . . . . . . . . 190,737 2,355,447Jindal Stainless Hisar Ltd.(b) . . . . . . . . . . . . . . . . . . . . . . . . . . . . . . 160,138 644,579Jindal Stainless Ltd.(b) . . . . . . . . . . . . . . . . . . . . . . . . . . . . . . . . . . . 299,486 658,130Jindal Steel & Power Ltd.(b) . . . . . . . . . . . . . . . . . . . . . . . . . . . . . . 692,325 3,151,272National Aluminium Co. Ltd. . . . . . . . . . . . . . . . . . . . . . . . . . . . . . . 1,402,419 1,644,691Ratnamani Metals & Tubes Ltd. . . . . . . . . . . . . . . . . . . . . . . . . . . 27,752 813,336
9,267,455Multiline Retail — 0.3%Future Retail Ltd.(b) . . . . . . . . . . . . . . . . . . . . . . . . . . . . . . . . . . . . . . 368,070 242,923V-Mart Retail Ltd.(b) . . . . . . . . . . . . . . . . . . . . . . . . . . . . . . . . . . . . . . 16,407 860,415
1,103,338Oil, Gas & Consumable Fuels — 0.7%Aegis Logistics Ltd. . . . . . . . . . . . . . . . . . . . . . . . . . . . . . . . . . . . . . . 238,238 726,127Great Eastern Shipping Co. Ltd. (The) . . . . . . . . . . . . . . . . . . . . 174,566 681,956Oil India Ltd.. . . . . . . . . . . . . . . . . . . . . . . . . . . . . . . . . . . . . . . . . . . . . 460,018 1,292,318
2,700,401Paper & Forest Products — 0.4%Century Plyboards India Ltd. . . . . . . . . . . . . . . . . . . . . . . . . . . . . . 94,249 755,327Century Textiles & Industries Ltd. . . . . . . . . . . . . . . . . . . . . . . . . . 75,812 771,589
1,526,916Personal Products — 0.9%Bajaj Consumer Care Ltd. . . . . . . . . . . . . . . . . . . . . . . . . . . . . . . . . 162,730 396,065Emami Ltd. . . . . . . . . . . . . . . . . . . . . . . . . . . . . . . . . . . . . . . . . . . . . . . 339,423 2,384,833Gillette India Ltd.. . . . . . . . . . . . . . . . . . . . . . . . . . . . . . . . . . . . . . . . . 11,058 798,850
3,579,748Pharmaceuticals — 6.3%Aarti Drugs Ltd. . . . . . . . . . . . . . . . . . . . . . . . . . . . . . . . . . . . . . . . . . . 56,865 383,731Ajanta Pharma Ltd. . . . . . . . . . . . . . . . . . . . . . . . . . . . . . . . . . . . . . . 44,051 1,219,336Alembic Pharmaceuticals Ltd. . . . . . . . . . . . . . . . . . . . . . . . . . . . . 100,061 1,073,158AstraZeneca Pharma India Ltd.. . . . . . . . . . . . . . . . . . . . . . . . . . . 8,484 354,154Caplin Point Laboratories Ltd. . . . . . . . . . . . . . . . . . . . . . . . . . . . . 32,089 319,620Eris Lifesciences Ltd.(a) . . . . . . . . . . . . . . . . . . . . . . . . . . . . . . . . . . 57,635 551,416FDC Ltd./India(b) . . . . . . . . . . . . . . . . . . . . . . . . . . . . . . . . . . . . . . . . . 85,934 325,932GlaxoSmithKline Pharmaceuticals Ltd. . . . . . . . . . . . . . . . . . . . . 55,400 1,237,668Glenmark Pharmaceuticals Ltd. . . . . . . . . . . . . . . . . . . . . . . . . . . 239,398 1,668,791Granules India Ltd. . . . . . . . . . . . . . . . . . . . . . . . . . . . . . . . . . . . . . . 231,147 923,598Hikal Ltd. . . . . . . . . . . . . . . . . . . . . . . . . . . . . . . . . . . . . . . . . . . . . . . . . 62,767 421,774IOL Chemicals and Pharmaceuticals Ltd. . . . . . . . . . . . . . . . . . 41,090 242,927Ipca Laboratories Ltd. . . . . . . . . . . . . . . . . . . . . . . . . . . . . . . . . . . . . 118,387 3,308,425JB Chemicals & Pharmaceuticals Ltd. . . . . . . . . . . . . . . . . . . . . 59,011 1,287,817Jubilant Pharmova Ltd.. . . . . . . . . . . . . . . . . . . . . . . . . . . . . . . . . . . 108,038 837,235Laurus Labs Ltd.(a). . . . . . . . . . . . . . . . . . . . . . . . . . . . . . . . . . . . . . . 546,320 3,691,323
Consolidated Schedule of Investments (unaudited) (continued)
November 30, 2021
iShares� MSCI India Small-Cap ETF(Percentages shown are based on Net Assets)
108 NM0122U-1995964-110/159

Security Shares
Value
Pharmaceuticals (continued)Natco Pharma Ltd.. . . . . . . . . . . . . . . . . . . . . . . . . . . . . . . . . . . . . . . 154,700 $ 1,725,210Procter & Gamble Health Ltd. . . . . . . . . . . . . . . . . . . . . . . . . . . . . 12,675 898,048Sanofi India Ltd. . . . . . . . . . . . . . . . . . . . . . . . . . . . . . . . . . . . . . . . . . 13,678 1,445,787Shilpa Medicare Ltd. . . . . . . . . . . . . . . . . . . . . . . . . . . . . . . . . . . . . . 55,336 400,480Solara Active Pharma Sciences Ltd. . . . . . . . . . . . . . . . . . . . . . . 22,082 374,398Strides Pharma Science Ltd. . . . . . . . . . . . . . . . . . . . . . . . . . . . . . 98,960 642,662Sun Pharma Advanced Research Co. Ltd.(b) . . . . . . . . . . . . . . 111,760 366,907Suven Pharmaceuticals Ltd.. . . . . . . . . . . . . . . . . . . . . . . . . . . . . . 151,185 980,577Wockhardt Ltd.(b) . . . . . . . . . . . . . . . . . . . . . . . . . . . . . . . . . . . . . . . . 56,406 326,756
25,007,730Professional Services — 1.4%L&T Technology Services Ltd.(a) . . . . . . . . . . . . . . . . . . . . . . . . . . 44,618 3,128,553Quess Corp. Ltd.(a) . . . . . . . . . . . . . . . . . . . . . . . . . . . . . . . . . . . . . . 112,823 1,340,316TeamLease Services Ltd.(b) . . . . . . . . . . . . . . . . . . . . . . . . . . . . . . 18,837 1,071,424
5,540,293Real Estate Management & Development — 2.3%Brigade Enterprises Ltd. . . . . . . . . . . . . . . . . . . . . . . . . . . . . . . . . . 174,099 1,166,738Indiabulls Real Estate Ltd.(b). . . . . . . . . . . . . . . . . . . . . . . . . . . . . . 306,477 681,775NESCO Ltd. . . . . . . . . . . . . . . . . . . . . . . . . . . . . . . . . . . . . . . . . . . . . . 35,868 281,145Oberoi Realty Ltd.(b) . . . . . . . . . . . . . . . . . . . . . . . . . . . . . . . . . . . . . 215,942 2,388,291Phoenix Mills Ltd. (The) . . . . . . . . . . . . . . . . . . . . . . . . . . . . . . . . . . 160,489 2,030,180Prestige Estates Projects Ltd. . . . . . . . . . . . . . . . . . . . . . . . . . . . . 238,071 1,335,185Sobha Ltd. . . . . . . . . . . . . . . . . . . . . . . . . . . . . . . . . . . . . . . . . . . . . . . 64,376 732,637Sunteck Realty Ltd. . . . . . . . . . . . . . . . . . . . . . . . . . . . . . . . . . . . . . . 86,943 501,282
9,117,233Semiconductors & Semiconductor Equipment — 0.1%Borosil Renewables Ltd.(b) . . . . . . . . . . . . . . . . . . . . . . . . . . . . . . . 59,979 469,401
Software — 4.2%Birlasoft Ltd. . . . . . . . . . . . . . . . . . . . . . . . . . . . . . . . . . . . . . . . . . . . . . 235,565 1,484,438Cyient Ltd. . . . . . . . . . . . . . . . . . . . . . . . . . . . . . . . . . . . . . . . . . . . . . . 140,247 1,887,481Intellect Design Arena Ltd.(b) . . . . . . . . . . . . . . . . . . . . . . . . . . . . . 136,554 1,126,055KPIT Technologies Ltd.. . . . . . . . . . . . . . . . . . . . . . . . . . . . . . . . . . . 279,108 1,835,706Oracle Financial Services Software Ltd.. . . . . . . . . . . . . . . . . . . 36,553 2,057,653Route Mobile Ltd. . . . . . . . . . . . . . . . . . . . . . . . . . . . . . . . . . . . . . . . . 34,394 829,014Tanla Platforms Ltd.. . . . . . . . . . . . . . . . . . . . . . . . . . . . . . . . . . . . . . 113,108 2,251,353Tata Elxsi Ltd. . . . . . . . . . . . . . . . . . . . . . . . . . . . . . . . . . . . . . . . . . . . 58,175 4,467,723Zensar Technologies Ltd.. . . . . . . . . . . . . . . . . . . . . . . . . . . . . . . . . 153,249 908,936
16,848,359Textiles, Apparel & Luxury Goods — 3.5%Aditya Birla Fashion and Retail Ltd.(b) . . . . . . . . . . . . . . . . . . . . . 500,624 1,698,664Alok Industries Ltd.(b) . . . . . . . . . . . . . . . . . . . . . . . . . . . . . . . . . . . . 2,106,316 598,759Bata India Ltd. . . . . . . . . . . . . . . . . . . . . . . . . . . . . . . . . . . . . . . . . . . . 87,237 2,181,775Garware Technical Fibres Ltd. . . . . . . . . . . . . . . . . . . . . . . . . . . . . 15,744 671,360Indo Count Industries Ltd. . . . . . . . . . . . . . . . . . . . . . . . . . . . . . . . . 133,983 415,574KPR Mill Ltd. . . . . . . . . . . . . . . . . . . . . . . . . . . . . . . . . . . . . . . . . . . . . 145,950 1,024,851Lux Industries Ltd. . . . . . . . . . . . . . . . . . . . . . . . . . . . . . . . . . . . . . . . 12,757 646,741Rajesh Exports Ltd. . . . . . . . . . . . . . . . . . . . . . . . . . . . . . . . . . . . . . . 100,202 1,020,565Relaxo Footwears Ltd. . . . . . . . . . . . . . . . . . . . . . . . . . . . . . . . . . . . 84,314 1,450,054Trident Ltd. . . . . . . . . . . . . . . . . . . . . . . . . . . . . . . . . . . . . . . . . . . . . . . 1,729,414 1,196,627
Security Shares
Value
Textiles, Apparel & Luxury Goods (continued)Vaibhav Global Ltd. . . . . . . . . . . . . . . . . . . . . . . . . . . . . . . . . . . . . . . 83,154 $ 544,368Vardhman Textiles Ltd. . . . . . . . . . . . . . . . . . . . . . . . . . . . . . . . . . . . 39,137 1,055,378VIP Industries Ltd.(b) . . . . . . . . . . . . . . . . . . . . . . . . . . . . . . . . . . . . . 95,965 714,915Welspun India Ltd. . . . . . . . . . . . . . . . . . . . . . . . . . . . . . . . . . . . . . . . 419,147 770,970
13,990,601Thrifts & Mortgage Finance — 2.2%Aavas Financiers Ltd.(b) . . . . . . . . . . . . . . . . . . . . . . . . . . . . . . . . . . 59,951 2,242,378Can Fin Homes Ltd. . . . . . . . . . . . . . . . . . . . . . . . . . . . . . . . . . . . . . 101,674 798,895Home First Finance Company India Ltd.(a)(b) . . . . . . . . . . . . . . 44,554 479,851IIFL Finance Ltd.. . . . . . . . . . . . . . . . . . . . . . . . . . . . . . . . . . . . . . . . . 192,971 793,411Indiabulls Housing Finance Ltd. . . . . . . . . . . . . . . . . . . . . . . . . . . 431,569 1,311,115LIC Housing Finance Ltd. . . . . . . . . . . . . . . . . . . . . . . . . . . . . . . . . 513,802 2,543,919PNB Housing Finance Ltd.(a)(b) . . . . . . . . . . . . . . . . . . . . . . . . . . . 100,077 733,408
8,902,977Tobacco — 0.1%Godfrey Phillips India Ltd. . . . . . . . . . . . . . . . . . . . . . . . . . . . . . . . . 21,174 340,994
Trading Companies & Distributors — 0.5%IndiaMART Intermesh Ltd.(a) . . . . . . . . . . . . . . . . . . . . . . . . . . . . . 20,745 2,060,790
Transportation Infrastructure — 0.5%GMR Infrastructure Ltd.(b) . . . . . . . . . . . . . . . . . . . . . . . . . . . . . . . . 3,072,627 1,538,314Gujarat Pipavav Port Ltd. . . . . . . . . . . . . . . . . . . . . . . . . . . . . . . . . 451,179 591,156
2,129,470Wireless Telecommunication Services — 0.5%Vodafone Idea Ltd.(b). . . . . . . . . . . . . . . . . . . . . . . . . . . . . . . . . . . . . 14,627,887 2,154,101
Total Common Stocks — 99.2%(Cost: $269,904,657) . . . . . . . . . . . . . . . . . . . . . . . . . . . . . . . . . . . . . . . . . . . . . . 396,581,961
RightsHotels, Restaurants & Leisure — 0.0%Indian Hotels Co. Ltd. (The), (Expires 12/08/21)(b) . . . . . . . . . 128,478 53,339
Total Rights — 0.0%(Cost: $0) . . . . . . . . . . . . . . . . . . . . . . . . . . . . . . . . . . . . . . . . . . . . . . . . . . . . . . . . . 53,339
Total Investments in Securities — 99.2%(Cost: $269,904,657) . . . . . . . . . . . . . . . . . . . . . . . . . . . . . . . . . . . . . . . . . . . . . . 396,635,300
Other Assets, Less Liabilities — 0.8% . . . . . . . . . . . . . . . . . . . . . . . . . . . . . . . 3,065,380
Net Assets — 100.0% . . . . . . . . . . . . . . . . . . . . . . . . . . . . . . . . . . . . . . . . . . . . . . . . $ 399,700,680 (a) Security exempt from registration pursuant to Rule 144A under the Securities Act of
1933, as amended. These securities may be resold in transactions exempt fromregistration to qualified institutional investors.
(b) Non-income producing security.(c) Restricted security as to resale, excluding 144A securities. The Fund held restricted
securities with a current value of $579,636, representing 0.2% of its net assets as ofperiod end, and an original cost of $3,554,476.
(d) Security is valued using significant unobservable inputs and is classified as Level 3 in thefair value hierarchy.
Consolidated Schedule of Investments (unaudited) (continued)
November 30, 2021
iShares� MSCI India Small-Cap ETF(Percentages shown are based on Net Assets)
109NM0122U-1995964-111/159

Affiliates
Investments in issuers considered to be affiliate(s) of the Fund during the period ended November 30, 2021 for purposes of Section 2(a)(3) of the Investment Company Actof 1940, as amended, were as follows:
Affiliated IssuerValue at
08/31/21Purchases
at CostProceeds
from SalesNet Realized
Gain (Loss)
Change inUnrealized
Appreciation(Depreciation)
Value at11/30/21
SharesHeld at
11/30/21 Income
CapitalGain
Distributionsfrom
UnderlyingFunds
BlackRock Cash Funds: Treasury, SL Agency Shares(a) . . . . $7,290,000 $ — $(7,290,000)(b) $ — $ — $ — — $ 148 $ —
(a) As of period end, the entity is no longer held.(b) Represents net amount purchased (sold).
Derivative Financial Instruments Outstanding as of Period End
Futures Contracts
DescriptionNumber ofContracts
ExpirationDate
NotionalAmount
(000)
Value/Unrealized
Appreciation(Depreciation)
Long ContractsSGX CNX Nifty Index . . . . . . . . . . . . . . . . . . . . . . . . . . . . . . . . . . . . . . . . . . . . . . . . . . . . . . . . . . . . . . . . . . . . . . . . . . . . . . . . . . . . . . . . . . . . . . . . 23 12/30/21 $ 784 $ (31,642)
Fair Value Measurements
Various inputs are used in determining the fair value of financial instruments. These inputs to valuation techniques are categorized into a fair value hierarchy consisting ofthree broad levels for financial reporting purposes as follows:
• Level 1 – Unadjusted price quotations in active markets/exchanges for identical assets or liabilities that each Fund has the ability to access;• Level 2 – Other observable inputs (including, but not limited to, quoted prices for similar assets or liabilities in markets that are active, quoted prices for identical or
similar assets or liabilities in markets that are not active, inputs other than quoted prices that are observable for the assets or liabilities (such as interest rates, yieldcurves, volatilities, prepayment speeds, loss severities, credit risks and default rates) or other market-corroborated inputs); and
• Level 3 – Unobservable inputs based on the best information available in the circumstances, to the extent observable inputs are not available (including the BlackRockGlobal Valuation Methodologies Committee’s (the “Global Valuation Committee’s”) assumptions used in determining the fair value of financial instruments).
The hierarchy gives the highest priority to unadjusted quoted prices in active markets for identical assets or liabilities (Level 1 measurements) and the lowest priority tounobservable inputs (Level 3 measurements). Accordingly, the degree of judgment exercised in determining fair value is greatest for instruments categorized in Level 3. Theinputs used to measure fair value may fall into different levels of the fair value hierarchy. In such cases, for disclosure purposes, the fair value hierarchy classification isdetermined based on the lowest level input that is significant to the fair value measurement in its entirety. Investments classified within Level 3 have significant unobservableinputs used by the Global Valuation Committee in determining the price for Fair Valued Investments. Level 3 investments include equity or debt issued by privately heldcompanies or funds. There may not be a secondary market, and/or there are a limited number of investors. The categorization of a value determined for financial instrumentsis based on the pricing transparency of the financial instruments and is not necessarily an indication of the risks associated with investing in those securities. For informationabout the Fund’s policy regarding valuation of financial instruments, refer to its most recent financial statements.
The following table summarizes the Fund’s financial instruments categorized in the fair value hierarchy. The breakdown of the Fund’s financial instruments into majorcategories is disclosed in the Schedule of Investments above.
Level 1 Level 2 Level 3 Total
InvestmentsAssets
Common Stocks . . . . . . . . . . . . . . . . . . . . . . . . . . . . . . . . . . . . . . . . . . . . . . . . . . . . . . . . . . . . . . . . . . . . . . . . . . . . . . . . . . . $ 54,854,203 $341,727,730 $ 28 $396,581,961Rights . . . . . . . . . . . . . . . . . . . . . . . . . . . . . . . . . . . . . . . . . . . . . . . . . . . . . . . . . . . . . . . . . . . . . . . . . . . . . . . . . . . . . . . . . . . . . 53,339 — — 53,339
$ 54,907,542 $341,727,730 $ 28 $396,635,300
Derivative financial instruments(a)
LiabilitiesFutures Contracts . . . . . . . . . . . . . . . . . . . . . . . . . . . . . . . . . . . . . . . . . . . . . . . . . . . . . . . . . . . . . . . . . . . . . . . . . . . . . . . . . . $ — $ (31,642) $ — $ (31,642)
(a) Derivative financial instruments are futures contracts. Futures contracts are valued at the unrealized appreciation (depreciation) on the instrument.
Consolidated Schedule of Investments (unaudited) (continued)
November 30, 2021
iShares� MSCI India Small-Cap ETF
110 NM0122U-1995964-112/159

Portfolio Abbreviations - Equity
REIT . . . . . . . . . . . . . Real Estate Investment Trust
Consolidated Schedule of Investments (unaudited) (continued)
November 30, 2021
iShares� MSCI India Small-Cap ETF
111NM0122U-1995964-113/159

Security Shares
Value
Common StocksAutomobiles — 4.0%Astra International Tbk PT . . . . . . . . . . . . . . . . . . . . . . . . . . . . . . 39,556,230 $ 15,950,110
Banks — 45.1%Bank Aladin Syariah Tbk PT(a). . . . . . . . . . . . . . . . . . . . . . . . . . . 9,165,200 1,791,766Bank BTPN Syariah Tbk PT. . . . . . . . . . . . . . . . . . . . . . . . . . . . . 8,469,300 2,109,125Bank Central Asia Tbk PT. . . . . . . . . . . . . . . . . . . . . . . . . . . . . . . 164,447,290 83,560,265Bank Mandiri Persero Tbk PT . . . . . . . . . . . . . . . . . . . . . . . . . . . 35,855,460 17,503,898Bank Negara Indonesia Persero Tbk PT . . . . . . . . . . . . . . . . . 24,740,858 11,710,575Bank Pembangunan Daerah Jawa Barat Dan Banten
Tbk PT . . . . . . . . . . . . . . . . . . . . . . . . . . . . . . . . . . . . . . . . . . . . . . 15,382,336 1,460,637Bank Pembangunan Daerah Jawa Timur Tbk PT. . . . . . . . . 23,705,900 1,233,112Bank Rakyat Indonesia Persero Tbk PT . . . . . . . . . . . . . . . . . 201,041,654 57,284,206Bank Tabungan Negara Persero Tbk PT(a) . . . . . . . . . . . . . . . 19,590,026 2,333,814
178,987,398Capital Markets — 0.5%Pacific Strategic Financial Tbk PT(a) . . . . . . . . . . . . . . . . . . . . . 27,058,500 2,059,261Pool Advista Indonesia Tbk PT(a)(b) . . . . . . . . . . . . . . . . . . . . . . 7,126,300 —
2,059,261Chemicals — 1.5%Barito Pacific Tbk PT . . . . . . . . . . . . . . . . . . . . . . . . . . . . . . . . . . . 94,089,900 6,044,002
Construction & Engineering — 1.0%Agung Semesta Sejahtera Tbk PT(a). . . . . . . . . . . . . . . . . . . . . 29,855,608 104,226PP Persero Tbk PT(a) . . . . . . . . . . . . . . . . . . . . . . . . . . . . . . . . . . . 16,490,322 1,298,254Waskita Karya Persero Tbk PT(a) . . . . . . . . . . . . . . . . . . . . . . . . 22,619,800 1,247,684Wijaya Karya Persero Tbk PT(a) . . . . . . . . . . . . . . . . . . . . . . . . . 16,039,870 1,295,134
3,945,298Construction Materials — 2.6%Berkah Beton Sadaya Tbk(a) . . . . . . . . . . . . . . . . . . . . . . . . . . . . 1,634,000 452,922Indocement Tunggal Prakarsa Tbk PT . . . . . . . . . . . . . . . . . . . 5,371,844 3,960,202Semen Indonesia Persero Tbk PT . . . . . . . . . . . . . . . . . . . . . . . 10,188,555 5,676,835Waskita Beton Precast Tbk PT(a) . . . . . . . . . . . . . . . . . . . . . . . . 7,250,000 64,179
10,154,138Consumer Finance — 0.1%BFI Finance Indonesia Tbk PT . . . . . . . . . . . . . . . . . . . . . . . . . . 7,163,600 487,660
Diversified Telecommunication Services — 13.2%Inovisi Infracom Tbk PT(b) . . . . . . . . . . . . . . . . . . . . . . . . . . . . . . . 9,476,400 —Link Net Tbk PT . . . . . . . . . . . . . . . . . . . . . . . . . . . . . . . . . . . . . . . . 5,867,000 1,799,320Sarana Menara Nusantara Tbk PT . . . . . . . . . . . . . . . . . . . . . . 58,173,200 4,705,901Telkom Indonesia Persero Tbk PT . . . . . . . . . . . . . . . . . . . . . . . 144,061,890 40,110,508Tower Bersama Infrastructure Tbk PT . . . . . . . . . . . . . . . . . . . 28,337,400 5,981,964
52,597,693Electronic Equipment, Instruments & Components — 0.5%Erajaya Swasembada Tbk PT . . . . . . . . . . . . . . . . . . . . . . . . . . . 43,430,400 1,878,000
Energy Equipment & Services — 0.1%Pelayaran Tamarin Samudra Tbk PT(a) . . . . . . . . . . . . . . . . . . 87,360,300 304,976
Food Products — 6.6%Astra Agro Lestari Tbk PT. . . . . . . . . . . . . . . . . . . . . . . . . . . . . . . 588,200 409,388Charoen Pokphand Indonesia Tbk PT . . . . . . . . . . . . . . . . . . . 24,216,125 10,244,362Indofood CBP Sukses Makmur Tbk PT . . . . . . . . . . . . . . . . . . 8,172,254 4,814,868Indofood Sukses Makmur Tbk PT . . . . . . . . . . . . . . . . . . . . . . . 14,940,130 6,562,659Inti Agri Resources Tbk PT(a)(b) . . . . . . . . . . . . . . . . . . . . . . . . . . 190,840,700 —Japfa Comfeed Indonesia Tbk PT . . . . . . . . . . . . . . . . . . . . . . . 18,220,700 2,036,234Perusahaan Perkebunan London Sumatra Indonesia
Tbk PT . . . . . . . . . . . . . . . . . . . . . . . . . . . . . . . . . . . . . . . . . . . . . . 17,448,800 1,506,548
Security Shares
Value
Food Products (continued)Sawit Sumbermas Sarana Tbk PT. . . . . . . . . . . . . . . . . . . . . . . 5,378,900 $ 441,278
26,015,337Gas Utilities — 1.1%Perusahaan Gas Negara Tbk PT(a) . . . . . . . . . . . . . . . . . . . . . . 40,863,207 4,277,477
Health Care Providers & Services — 0.3%Metro Healthcare Indonesia TBK PT(a). . . . . . . . . . . . . . . . . . . 16,340,800 545,466Siloam International Hospitals Tbk PT . . . . . . . . . . . . . . . . . . . 695,600 471,100
1,016,566Household Products — 2.0%Unilever Indonesia Tbk PT . . . . . . . . . . . . . . . . . . . . . . . . . . . . . . 24,923,420 7,808,960
Insurance — 0.3%Panin Financial Tbk PT(a) . . . . . . . . . . . . . . . . . . . . . . . . . . . . . . . 84,144,378 1,045,746
IT Services — 0.1%M Cash Integrasi PT(a) . . . . . . . . . . . . . . . . . . . . . . . . . . . . . . . . . . 493,000 453,501
Marine — 0.1%Berlian Laju Tanker Tbk PT(a) . . . . . . . . . . . . . . . . . . . . . . . . . . . 20,933,614 73,080Trada Alam Minera Tbk PT(a)(b) . . . . . . . . . . . . . . . . . . . . . . . . . . 163,879,000 —Transcoal Pacific Tbk PT(a). . . . . . . . . . . . . . . . . . . . . . . . . . . . . . 725,200 432,917
505,997Media — 1.1%Media Nusantara Citra Tbk PT . . . . . . . . . . . . . . . . . . . . . . . . . . 24,826,600 1,660,197MNC Vision Networks Tbk PT(a) . . . . . . . . . . . . . . . . . . . . . . . . . 24,667,300 396,124Surya Citra Media Tbk PT(a). . . . . . . . . . . . . . . . . . . . . . . . . . . . . 92,090,400 2,200,967
4,257,288Metals & Mining — 3.2%Aneka Tambang Tbk. . . . . . . . . . . . . . . . . . . . . . . . . . . . . . . . . . . . 30,056,754 4,824,720Merdeka Copper Gold Tbk PT(a). . . . . . . . . . . . . . . . . . . . . . . . . 28,650,900 7,309,764Timah Tbk PT(a) . . . . . . . . . . . . . . . . . . . . . . . . . . . . . . . . . . . . . . . . 3,978,800 438,106
12,572,590Multiline Retail — 0.5%Mitra Adiperkasa Tbk PT(a) . . . . . . . . . . . . . . . . . . . . . . . . . . . . . . 38,911,000 2,010,413
Oil, Gas & Consumable Fuels — 4.2%Adaro Energy Tbk PT. . . . . . . . . . . . . . . . . . . . . . . . . . . . . . . . . . . 52,907,939 6,304,008AKR Corporindo Tbk PT . . . . . . . . . . . . . . . . . . . . . . . . . . . . . . . . 8,387,300 2,322,203Bukit Asam Tbk PT . . . . . . . . . . . . . . . . . . . . . . . . . . . . . . . . . . . . . 14,969,300 2,721,187Indika Energy Tbk PT(a) . . . . . . . . . . . . . . . . . . . . . . . . . . . . . . . . . 3,893,900 444,512Indo Tambangraya Megah Tbk PT. . . . . . . . . . . . . . . . . . . . . . . 2,010,200 3,024,598Medco Energi Internasional Tbk PT(a) . . . . . . . . . . . . . . . . . . . 38,729,886 1,285,298Sekawan Intipratama Tbk PT(b). . . . . . . . . . . . . . . . . . . . . . . . . . 30,572,100 —Sugih Energy Tbk PT(a)(b) . . . . . . . . . . . . . . . . . . . . . . . . . . . . . . . 39,886,700 28United Tractors Tbk PT . . . . . . . . . . . . . . . . . . . . . . . . . . . . . . . . . 269,096 400,280
16,502,114Paper & Forest Products — 1.8%Indah Kiat Pulp & Paper Tbk PT. . . . . . . . . . . . . . . . . . . . . . . . . 9,394,100 4,941,715Pabrik Kertas Tjiwi Kimia Tbk PT . . . . . . . . . . . . . . . . . . . . . . . . 4,171,600 2,231,218
7,172,933Personal Products — 0.5%Industri Jamu Dan Farmasi Sido Muncul Tbk PT . . . . . . . . . 31,992,737 2,043,872
Pharmaceuticals — 2.0%Kalbe Farma Tbk PT. . . . . . . . . . . . . . . . . . . . . . . . . . . . . . . . . . . . 71,840,185 8,023,196
Real Estate Management & Development — 3.2%Bumi Serpong Damai Tbk PT(a) . . . . . . . . . . . . . . . . . . . . . . . . . 32,233,422 2,439,047Ciputra Development Tbk PT. . . . . . . . . . . . . . . . . . . . . . . . . . . . 38,208,913 2,798,559Hanson International Tbk PT(a)(b) . . . . . . . . . . . . . . . . . . . . . . . . 372,896,535 —
Schedule of Investments (unaudited)
November 30, 2021
iShares� MSCI Indonesia ETF(Percentages shown are based on Net Assets)
112 NM0122U-1995964-114/159

Security Shares
Value
Real Estate Management & Development (continued)Lippo Karawaci Tbk PT(a) . . . . . . . . . . . . . . . . . . . . . . . . . . . . . . . 124,409,842 $ 1,285,576Pakuwon Jati Tbk PT(a) . . . . . . . . . . . . . . . . . . . . . . . . . . . . . . . . . 73,265,977 2,512,939Puradelta Lestari Tbk PT. . . . . . . . . . . . . . . . . . . . . . . . . . . . . . . . 67,918,800 1,033,779Rimo International Lestari Tbk PT(a)(b) . . . . . . . . . . . . . . . . . . . 54,096,000 —Summarecon Agung Tbk PT(a) . . . . . . . . . . . . . . . . . . . . . . . . . . 43,861,186 2,659,237
12,729,137Road & Rail — 0.1%Adi Sarana Armada Tbk PT(a) . . . . . . . . . . . . . . . . . . . . . . . . . . . 1,748,500 451,698
Software — 0.1%Digital Mediatama Maxima Tbk(a) . . . . . . . . . . . . . . . . . . . . . . . . 2,291,400 443,161
Specialty Retail — 0.9%Ace Hardware Indonesia Tbk PT . . . . . . . . . . . . . . . . . . . . . . . . 28,454,679 2,590,307Bintang Oto Global Tbk PT(a). . . . . . . . . . . . . . . . . . . . . . . . . . . . 10,501,000 1,019,354
3,609,661Tobacco — 0.9%Gudang Garam Tbk PT . . . . . . . . . . . . . . . . . . . . . . . . . . . . . . . . . 1,665,442 3,652,609
Transportation Infrastructure — 0.6%Jasa Marga Persero Tbk PT(a) . . . . . . . . . . . . . . . . . . . . . . . . . . 9,062,808 2,569,715
Wireless Telecommunication Services — 1.8%Indosat Tbk PT(a) . . . . . . . . . . . . . . . . . . . . . . . . . . . . . . . . . . . . . . . 5,973,300 3,410,198Smartfren Telecom Tbk PT(a) . . . . . . . . . . . . . . . . . . . . . . . . . . . . 115,962,000 710,964
Security Shares
Value
Wireless Telecommunication Services (continued)XL Axiata Tbk PT . . . . . . . . . . . . . . . . . . . . . . . . . . . . . . . . . . . . . . . 14,688,000 $ 3,147,286
7,268,448
Total Common Stocks — 100.0%(Cost: $482,466,393) . . . . . . . . . . . . . . . . . . . . . . . . . . . . . . . . . . . . . . . . . . . . . . 396,838,955
Short-Term InvestmentsMoney Market Funds — 0.1%BlackRock Cash Funds: Treasury, SL Agency Shares,
0.00%(c)(d) . . . . . . . . . . . . . . . . . . . . . . . . . . . . . . . . . . . . . . . . . . . 660,000 660,000
Total Short-Term Investments — 0.1%(Cost: $660,000) . . . . . . . . . . . . . . . . . . . . . . . . . . . . . . . . . . . . . . . . . . . . . . . . . . 660,000
Total Investments in Securities — 100.1%(Cost: $483,126,393) . . . . . . . . . . . . . . . . . . . . . . . . . . . . . . . . . . . . . . . . . . . . . . 397,498,955
Other Assets, Less Liabilities — (0.1)%. . . . . . . . . . . . . . . . . . . . . . . . . . . . . . (537,590)
Net Assets — 100.0% . . . . . . . . . . . . . . . . . . . . . . . . . . . . . . . . . . . . . . . . . . . . . . . . $ 396,961,365 (a) Non-income producing security.(b) Security is valued using significant unobservable inputs and is classified as Level 3 in the
fair value hierarchy.(c) Affiliate of the Fund.(d) Annualized 7-day yield as of period end.
Affiliates
Investments in issuers considered to be affiliate(s) of the Fund during the period ended November 30, 2021 for purposes of Section 2(a)(3) of the Investment Company Actof 1940, as amended, were as follows:
Affiliated IssuerValue at
08/31/21Purchases
at CostProceeds
from SalesNet Realized
Gain (Loss)
Change inUnrealized
Appreciation(Depreciation)
Value at11/30/21
SharesHeld at
11/30/21 Income
CapitalGain
Distributionsfrom
UnderlyingFunds
BlackRock Cash Funds: Treasury, SL Agency Shares. . . . . . . . . $ 20,000 $640,000(a) $ — $ — $ — $660,000 660,000 $ 6 $ —
(a) Represents net amount purchased (sold).
Derivative Financial Instruments Outstanding as of Period End
Futures Contracts
DescriptionNumber ofContracts
ExpirationDate
NotionalAmount
(000)
Value/Unrealized
Appreciation(Depreciation)
Long ContractsMSCI Emerging Markets Index . . . . . . . . . . . . . . . . . . . . . . . . . . . . . . . . . . . . . . . . . . . . . . . . . . . . . . . . . . . . . . . . . . . . . . . . . . . . . . . . . . . . . . . 14 12/17/21 $ 849 $ (34,552)
Fair Value Measurements
Various inputs are used in determining the fair value of financial instruments. These inputs to valuation techniques are categorized into a fair value hierarchy consisting ofthree broad levels for financial reporting purposes as follows:
• Level 1 – Unadjusted price quotations in active markets/exchanges for identical assets or liabilities that each Fund has the ability to access;• Level 2 – Other observable inputs (including, but not limited to, quoted prices for similar assets or liabilities in markets that are active, quoted prices for identical or
similar assets or liabilities in markets that are not active, inputs other than quoted prices that are observable for the assets or liabilities (such as interest rates, yieldcurves, volatilities, prepayment speeds, loss severities, credit risks and default rates) or other market-corroborated inputs); and
Schedule of Investments (unaudited) (continued)
November 30, 2021
iShares� MSCI Indonesia ETF(Percentages shown are based on Net Assets)
113NM0122U-1995964-115/159

Fair Value Measurements (continued)
• Level 3 – Unobservable inputs based on the best information available in the circumstances, to the extent observable inputs are not available (including the BlackRockGlobal Valuation Methodologies Committee’s (the “Global Valuation Committee’s”) assumptions used in determining the fair value of financial instruments).
The hierarchy gives the highest priority to unadjusted quoted prices in active markets for identical assets or liabilities (Level 1 measurements) and the lowest priority tounobservable inputs (Level 3 measurements). Accordingly, the degree of judgment exercised in determining fair value is greatest for instruments categorized in Level 3. Theinputs used to measure fair value may fall into different levels of the fair value hierarchy. In such cases, for disclosure purposes, the fair value hierarchy classification isdetermined based on the lowest level input that is significant to the fair value measurement in its entirety. Investments classified within Level 3 have significant unobservableinputs used by the Global Valuation Committee in determining the price for Fair Valued Investments. Level 3 investments include equity or debt issued by privately heldcompanies or funds. There may not be a secondary market, and/or there are a limited number of investors. The categorization of a value determined for financial instrumentsis based on the pricing transparency of the financial instruments and is not necessarily an indication of the risks associated with investing in those securities. For informationabout the Fund’s policy regarding valuation of financial instruments, refer to its most recent financial statements.
The following table summarizes the Fund’s financial instruments categorized in the fair value hierarchy. The breakdown of the Fund’s financial instruments into majorcategories is disclosed in the Schedule of Investments above.
Level 1 Level 2 Level 3 Total
InvestmentsAssets
Common Stocks . . . . . . . . . . . . . . . . . . . . . . . . . . . . . . . . . . . . . . . . . . . . . . . . . . . . . . . . . . . . . . . . . . . . . . . . . . . . . . . . . . . $ 20,712,803 $376,126,124 $ 28 $396,838,955Money Market Funds . . . . . . . . . . . . . . . . . . . . . . . . . . . . . . . . . . . . . . . . . . . . . . . . . . . . . . . . . . . . . . . . . . . . . . . . . . . . . . . 660,000 — — 660,000
$ 21,372,803 $376,126,124 $ 28 $397,498,955
Derivative financial instruments(a)
LiabilitiesFutures Contracts . . . . . . . . . . . . . . . . . . . . . . . . . . . . . . . . . . . . . . . . . . . . . . . . . . . . . . . . . . . . . . . . . . . . . . . . . . . . . . . . . . $ (34,552) $ — $ — $ (34,552)
(a) Derivative financial instruments are futures contracts. Futures contracts are valued at the unrealized appreciation (depreciation) on the instrument.
Schedule of Investments (unaudited) (continued)
November 30, 2021
iShares� MSCI Indonesia ETF
114 NM0122U-1995964-116/159

Security Shares
Value
Common StocksAirlines — 4.1%Ryanair Holdings PLC, ADR(a) . . . . . . . . . . . . . . . . . . . . . . . . . . . . . . 33,980 $ 3,246,789
Banks — 8.6%AIB Group PLC(a) . . . . . . . . . . . . . . . . . . . . . . . . . . . . . . . . . . . . . . . . . . 1,434,728 3,143,625Bank of Ireland Group PLC(a) . . . . . . . . . . . . . . . . . . . . . . . . . . . . . . . 641,068 3,505,017Permanent TSB Group Holdings PLC(a) . . . . . . . . . . . . . . . . . . . . . 64,542 113,231
6,761,873Beverages — 2.9%C&C Group PLC(a) . . . . . . . . . . . . . . . . . . . . . . . . . . . . . . . . . . . . . . . . . 752,062 2,270,465
Building Products — 4.8%Kingspan Group PLC. . . . . . . . . . . . . . . . . . . . . . . . . . . . . . . . . . . . . . . 32,931 3,818,324
Construction Materials — 23.3%CRH PLC. . . . . . . . . . . . . . . . . . . . . . . . . . . . . . . . . . . . . . . . . . . . . . . . . . 378,846 18,417,468
Containers & Packaging — 4.7%Smurfit Kappa Group PLC . . . . . . . . . . . . . . . . . . . . . . . . . . . . . . . . . . 72,131 3,697,082
Equity Real Estate Investment Trusts (REITs) — 4.2%Hibernia REIT PLC . . . . . . . . . . . . . . . . . . . . . . . . . . . . . . . . . . . . . . . . . 1,266,830 1,872,387Irish Residential Properties REIT PLC . . . . . . . . . . . . . . . . . . . . . . . 859,175 1,476,187
3,348,574Food Products — 11.0%Dole PLC(a) . . . . . . . . . . . . . . . . . . . . . . . . . . . . . . . . . . . . . . . . . . . . . . . . 53,462 691,264Glanbia PLC . . . . . . . . . . . . . . . . . . . . . . . . . . . . . . . . . . . . . . . . . . . . . . . 264,497 3,419,127Kerry Group PLC, Class A . . . . . . . . . . . . . . . . . . . . . . . . . . . . . . . . . . 29,246 3,602,034Origin Enterprises PLC . . . . . . . . . . . . . . . . . . . . . . . . . . . . . . . . . . . . . 240,414 947,471
8,659,896Health Care Providers & Services — 2.9%Uniphar PLC(a) . . . . . . . . . . . . . . . . . . . . . . . . . . . . . . . . . . . . . . . . . . . . . 444,212 2,251,902
Hotels, Restaurants & Leisure — 19.0%Dalata Hotel Group PLC(a) . . . . . . . . . . . . . . . . . . . . . . . . . . . . . . . . . . 383,945 1,480,470Flutter Entertainment PLC, Class DI(a). . . . . . . . . . . . . . . . . . . . . . . 99,084 13,569,528
15,049,998Household Durables — 4.3%Cairn Homes PLC(a) . . . . . . . . . . . . . . . . . . . . . . . . . . . . . . . . . . . . . . . . 1,363,734 1,704,366Glenveagh Properties PLC(a)(b) . . . . . . . . . . . . . . . . . . . . . . . . . . . . . 1,336,993 1,725,532
3,429,898
Security Shares
Value
Insurance — 0.1%FBD Holdings PLC(a) . . . . . . . . . . . . . . . . . . . . . . . . . . . . . . . . . . . . . . . 12,024 $ 111,819
Life Sciences Tools & Services — 4.5%ICON PLC(a) . . . . . . . . . . . . . . . . . . . . . . . . . . . . . . . . . . . . . . . . . . . . . . . 13,269 3,588,866
Marine — 0.5%Irish Continental Group PLC(a) . . . . . . . . . . . . . . . . . . . . . . . . . . . . . . 76,088 366,739
Metals & Mining — 0.3%Kenmare Resources PLC. . . . . . . . . . . . . . . . . . . . . . . . . . . . . . . . . . . 39,385 219,996
Pharmaceuticals — 0.2%GH Research PLC(a) . . . . . . . . . . . . . . . . . . . . . . . . . . . . . . . . . . . . . . . 4,835 127,982
Trading Companies & Distributors — 4.3%Grafton Group PLC. . . . . . . . . . . . . . . . . . . . . . . . . . . . . . . . . . . . . . . . . 220,607 3,429,806
Total Common Stocks — 99.7%(Cost: $69,531,415). . . . . . . . . . . . . . . . . . . . . . . . . . . . . . . . . . . . . . . . . . . . . . . . . 78,797,477
Short-Term InvestmentsMoney Market Funds — 0.1%BlackRock Cash Funds: Treasury, SL Agency Shares,
0.00%(c)(d). . . . . . . . . . . . . . . . . . . . . . . . . . . . . . . . . . . . . . . . . . . . . . . 40,000 40,000
Total Short-Term Investments — 0.1%(Cost: $40,000) . . . . . . . . . . . . . . . . . . . . . . . . . . . . . . . . . . . . . . . . . . . . . . . . . . . . . 40,000
Total Investments in Securities — 99.8%(Cost: $69,571,415). . . . . . . . . . . . . . . . . . . . . . . . . . . . . . . . . . . . . . . . . . . . . . . . . 78,837,477
Other Assets, Less Liabilities — 0.2% . . . . . . . . . . . . . . . . . . . . . . . . . . . . . . . . 184,343
Net Assets — 100.0% . . . . . . . . . . . . . . . . . . . . . . . . . . . . . . . . . . . . . . . . . . . . . . . . . $ 79,021,820 (a) Non-income producing security.(b) Security exempt from registration pursuant to Rule 144A under the Securities Act of
1933, as amended. These securities may be resold in transactions exempt fromregistration to qualified institutional investors.
(c) Affiliate of the Fund.(d) Annualized 7-day yield as of period end.
Affiliates
Investments in issuers considered to be affiliate(s) of the Fund during the period ended November 30, 2021 for purposes of Section 2(a)(3) of the Investment Company Actof 1940, as amended, were as follows:
Affiliated IssuerValue at
08/31/21Purchases
at CostProceeds
from SalesNet Realized
Gain (Loss)
Change inUnrealized
Appreciation(Depreciation)
Value at11/30/21
SharesHeld at
11/30/21 Income
CapitalGain
Distributionsfrom
UnderlyingFunds
BlackRock Cash Funds: Treasury, SL Agency Shares. . . . . . . . . . $ 30,000 $ 10,000(a) $ — $ — $ — $ 40,000 40,000 $ — $ —
(a) Represents net amount purchased (sold).
Schedule of Investments (unaudited)
November 30, 2021
iShares� MSCI Ireland ETF(Percentages shown are based on Net Assets)
115NM0122U-1995964-117/159

Derivative Financial Instruments Outstanding as of Period End
Futures Contracts
DescriptionNumber ofContracts
ExpirationDate
NotionalAmount
(000)
Value/Unrealized
Appreciation(Depreciation)
Long ContractsEuro STOXX 50 Index . . . . . . . . . . . . . . . . . . . . . . . . . . . . . . . . . . . . . . . . . . . . . . . . . . . . . . . . . . . . . . . . . . . . . . . . . . . . . . . . . . . . . . . . . . . . . . . 5 12/17/21 $ 230 $ (936)
Fair Value Measurements
Various inputs are used in determining the fair value of financial instruments. These inputs to valuation techniques are categorized into a fair value hierarchy consisting ofthree broad levels for financial reporting purposes as follows:
• Level 1 – Unadjusted price quotations in active markets/exchanges for identical assets or liabilities that each Fund has the ability to access;• Level 2 – Other observable inputs (including, but not limited to, quoted prices for similar assets or liabilities in markets that are active, quoted prices for identical or
similar assets or liabilities in markets that are not active, inputs other than quoted prices that are observable for the assets or liabilities (such as interest rates, yieldcurves, volatilities, prepayment speeds, loss severities, credit risks and default rates) or other market-corroborated inputs); and
• Level 3 – Unobservable inputs based on the best information available in the circumstances, to the extent observable inputs are not available (including the BlackRockGlobal Valuation Methodologies Committee’s (the “Global Valuation Committee’s”) assumptions used in determining the fair value of financial instruments).
The hierarchy gives the highest priority to unadjusted quoted prices in active markets for identical assets or liabilities (Level 1 measurements) and the lowest priority tounobservable inputs (Level 3 measurements). Accordingly, the degree of judgment exercised in determining fair value is greatest for instruments categorized in Level 3. Theinputs used to measure fair value may fall into different levels of the fair value hierarchy. In such cases, for disclosure purposes, the fair value hierarchy classification isdetermined based on the lowest level input that is significant to the fair value measurement in its entirety. Investments classified within Level 3 have significant unobservableinputs used by the Global Valuation Committee in determining the price for Fair Valued Investments. Level 3 investments include equity or debt issued by privately heldcompanies or funds. There may not be a secondary market, and/or there are a limited number of investors. The categorization of a value determined for financial instrumentsis based on the pricing transparency of the financial instruments and is not necessarily an indication of the risks associated with investing in those securities. For informationabout the Fund’s policy regarding valuation of financial instruments, refer to its most recent financial statements.
The following table summarizes the Fund’s financial instruments categorized in the fair value hierarchy. The breakdown of the Fund’s financial instruments into majorcategories is disclosed in the Schedule of Investments above.
Level 1 Level 2 Level 3 Total
InvestmentsAssets
Common Stocks . . . . . . . . . . . . . . . . . . . . . . . . . . . . . . . . . . . . . . . . . . . . . . . . . . . . . . . . . . . . . . . . . . . . . . . . . . . . . . . . . . . . . . . . $22,335,695 $56,461,782 $ — $78,797,477Money Market Funds . . . . . . . . . . . . . . . . . . . . . . . . . . . . . . . . . . . . . . . . . . . . . . . . . . . . . . . . . . . . . . . . . . . . . . . . . . . . . . . . . . . . 40,000 — — 40,000
$22,375,695 $56,461,782 $ — $78,837,477
Derivative financial instruments(a)
LiabilitiesFutures Contracts . . . . . . . . . . . . . . . . . . . . . . . . . . . . . . . . . . . . . . . . . . . . . . . . . . . . . . . . . . . . . . . . . . . . . . . . . . . . . . . . . . . . . . . $ — $ (936) $ — $ (936)
(a) Derivative financial instruments are futures contracts. Futures contracts are valued at the unrealized appreciation (depreciation) on the instrument.
Portfolio Abbreviations - Equity
ADR . . . . . . . . . . . . . American Depositary ReceiptREIT . . . . . . . . . . . . . Real Estate Investment Trust
Schedule of Investments (unaudited) (continued)
November 30, 2021
iShares� MSCI Ireland ETF
116 NM0122U-1995964-118/159

Security Shares
Value
Common StocksAir Freight & Logistics — 0.8%SG Holdings Co. Ltd. . . . . . . . . . . . . . . . . . . . . . . . . . . . . . . . . . . . . . . . . . . . 1,400 $ 30,900Yamato Holdings Co. Ltd. . . . . . . . . . . . . . . . . . . . . . . . . . . . . . . . . . . . . . . . 1,400 30,904
61,804Airlines — 0.7%ANA Holdings Inc.(a) . . . . . . . . . . . . . . . . . . . . . . . . . . . . . . . . . . . . . . . . . . . . 1,200 23,614Japan Airlines Co. Ltd.(a) . . . . . . . . . . . . . . . . . . . . . . . . . . . . . . . . . . . . . . . . 1,400 25,236
48,850Auto Components — 2.2%Aisin Corp. . . . . . . . . . . . . . . . . . . . . . . . . . . . . . . . . . . . . . . . . . . . . . . . . . . . . . 800 29,357Bridgestone Corp. . . . . . . . . . . . . . . . . . . . . . . . . . . . . . . . . . . . . . . . . . . . . . . 600 24,059Denso Corp. . . . . . . . . . . . . . . . . . . . . . . . . . . . . . . . . . . . . . . . . . . . . . . . . . . . 400 29,262Koito Manufacturing Co. Ltd. . . . . . . . . . . . . . . . . . . . . . . . . . . . . . . . . . . . . 400 22,938Stanley Electric Co. Ltd. . . . . . . . . . . . . . . . . . . . . . . . . . . . . . . . . . . . . . . . . 1,000 25,982Sumitomo Electric Industries Ltd.. . . . . . . . . . . . . . . . . . . . . . . . . . . . . . . . 2,200 28,796
160,394Automobiles — 2.9%Honda Motor Co. Ltd.. . . . . . . . . . . . . . . . . . . . . . . . . . . . . . . . . . . . . . . . . . . 1,000 27,385Isuzu Motors Ltd. . . . . . . . . . . . . . . . . . . . . . . . . . . . . . . . . . . . . . . . . . . . . . . . 2,000 26,805Mazda Motor Corp.(a) . . . . . . . . . . . . . . . . . . . . . . . . . . . . . . . . . . . . . . . . . . . 3,200 25,816Nissan Motor Co. Ltd.(a) . . . . . . . . . . . . . . . . . . . . . . . . . . . . . . . . . . . . . . . . 5,400 26,701Subaru Corp.. . . . . . . . . . . . . . . . . . . . . . . . . . . . . . . . . . . . . . . . . . . . . . . . . . . 1,400 26,368Suzuki Motor Corp. . . . . . . . . . . . . . . . . . . . . . . . . . . . . . . . . . . . . . . . . . . . . . 600 24,221Toyota Motor Corp. . . . . . . . . . . . . . . . . . . . . . . . . . . . . . . . . . . . . . . . . . . . . . 1,600 28,383Yamaha Motor Co. Ltd. . . . . . . . . . . . . . . . . . . . . . . . . . . . . . . . . . . . . . . . . . 1,200 30,178
215,857Banks — 3.5%Chiba Bank Ltd. (The) . . . . . . . . . . . . . . . . . . . . . . . . . . . . . . . . . . . . . . . . . . 5,000 29,011Concordia Financial Group Ltd. . . . . . . . . . . . . . . . . . . . . . . . . . . . . . . . . . 7,800 28,292Japan Post Bank Co. Ltd. . . . . . . . . . . . . . . . . . . . . . . . . . . . . . . . . . . . . . . . 3,600 29,414Mitsubishi UFJ Financial Group Inc. . . . . . . . . . . . . . . . . . . . . . . . . . . . . . 5,400 28,520Mizuho Financial Group Inc. . . . . . . . . . . . . . . . . . . . . . . . . . . . . . . . . . . . . 2,280 28,109Resona Holdings Inc. . . . . . . . . . . . . . . . . . . . . . . . . . . . . . . . . . . . . . . . . . . . 7,800 28,486Shizuoka Bank Ltd. (The) . . . . . . . . . . . . . . . . . . . . . . . . . . . . . . . . . . . . . . . 4,000 28,120Sumitomo Mitsui Financial Group Inc. . . . . . . . . . . . . . . . . . . . . . . . . . . . 800 26,028Sumitomo Mitsui Trust Holdings Inc. . . . . . . . . . . . . . . . . . . . . . . . . . . . . . 1,000 31,236
257,216Beverages — 1.5%Asahi Group Holdings Ltd. . . . . . . . . . . . . . . . . . . . . . . . . . . . . . . . . . . . . . . 800 29,504Ito En Ltd.. . . . . . . . . . . . . . . . . . . . . . . . . . . . . . . . . . . . . . . . . . . . . . . . . . . . . . 400 23,537Kirin Holdings Co. Ltd. . . . . . . . . . . . . . . . . . . . . . . . . . . . . . . . . . . . . . . . . . . 1,800 28,679Suntory Beverage & Food Ltd. . . . . . . . . . . . . . . . . . . . . . . . . . . . . . . . . . . 800 28,221
109,941Building Products — 1.4%AGC Inc. . . . . . . . . . . . . . . . . . . . . . . . . . . . . . . . . . . . . . . . . . . . . . . . . . . . . . . . 600 29,218Daikin Industries Ltd. . . . . . . . . . . . . . . . . . . . . . . . . . . . . . . . . . . . . . . . . . . . 100 20,363Lixil Corp. . . . . . . . . . . . . . . . . . . . . . . . . . . . . . . . . . . . . . . . . . . . . . . . . . . . . . . 1,200 29,357TOTO Ltd. . . . . . . . . . . . . . . . . . . . . . . . . . . . . . . . . . . . . . . . . . . . . . . . . . . . . . 600 26,542
105,480Capital Markets — 1.6%Daiwa Securities Group Inc.. . . . . . . . . . . . . . . . . . . . . . . . . . . . . . . . . . . . . 5,400 29,946Japan Exchange Group Inc. . . . . . . . . . . . . . . . . . . . . . . . . . . . . . . . . . . . . 1,400 30,312Nomura Holdings Inc.. . . . . . . . . . . . . . . . . . . . . . . . . . . . . . . . . . . . . . . . . . . 7,000 29,331SBI Holdings Inc. . . . . . . . . . . . . . . . . . . . . . . . . . . . . . . . . . . . . . . . . . . . . . . . 1,200 30,787
120,376Chemicals — 5.2%Asahi Kasei Corp. . . . . . . . . . . . . . . . . . . . . . . . . . . . . . . . . . . . . . . . . . . . . . . 3,000 28,050
Security Shares
Value
Chemicals (continued)JSR Corp.. . . . . . . . . . . . . . . . . . . . . . . . . . . . . . . . . . . . . . . . . . . . . . . . . . . . . . 800 $ 29,762Kansai Paint Co. Ltd. . . . . . . . . . . . . . . . . . . . . . . . . . . . . . . . . . . . . . . . . . . . 1,200 26,939Mitsubishi Chemical Holdings Corp. . . . . . . . . . . . . . . . . . . . . . . . . . . . . . 3,600 28,142Mitsubishi Gas Chemical Co. Inc. . . . . . . . . . . . . . . . . . . . . . . . . . . . . . . . 1,800 29,769Mitsui Chemicals Inc. . . . . . . . . . . . . . . . . . . . . . . . . . . . . . . . . . . . . . . . . . . . 1,000 26,637Nippon Paint Holdings Co. Ltd.. . . . . . . . . . . . . . . . . . . . . . . . . . . . . . . . . . 2,600 27,282Nippon Sanso Holdings Corp. . . . . . . . . . . . . . . . . . . . . . . . . . . . . . . . . . . . 1,200 25,308Nissan Chemical Corp. . . . . . . . . . . . . . . . . . . . . . . . . . . . . . . . . . . . . . . . . . 400 23,006Nitto Denko Corp. . . . . . . . . . . . . . . . . . . . . . . . . . . . . . . . . . . . . . . . . . . . . . . 400 27,732Shin-Etsu Chemical Co. Ltd. . . . . . . . . . . . . . . . . . . . . . . . . . . . . . . . . . . . . 200 33,313Sumitomo Chemical Co. Ltd. . . . . . . . . . . . . . . . . . . . . . . . . . . . . . . . . . . . . 6,000 27,522Toray Industries Inc. . . . . . . . . . . . . . . . . . . . . . . . . . . . . . . . . . . . . . . . . . . . . 4,800 27,754Tosoh Corp. . . . . . . . . . . . . . . . . . . . . . . . . . . . . . . . . . . . . . . . . . . . . . . . . . . . . 2,000 28,592
389,808Commercial Services & Supplies — 1.5%Dai Nippon Printing Co. Ltd.. . . . . . . . . . . . . . . . . . . . . . . . . . . . . . . . . . . . . 1,200 28,164Secom Co. Ltd.. . . . . . . . . . . . . . . . . . . . . . . . . . . . . . . . . . . . . . . . . . . . . . . . . 400 27,077Sohgo Security Services Co. Ltd.. . . . . . . . . . . . . . . . . . . . . . . . . . . . . . . . 600 25,576Toppan Inc. . . . . . . . . . . . . . . . . . . . . . . . . . . . . . . . . . . . . . . . . . . . . . . . . . . . . 1,800 27,284
108,101Construction & Engineering — 1.5%Kajima Corp. . . . . . . . . . . . . . . . . . . . . . . . . . . . . . . . . . . . . . . . . . . . . . . . . . . . 2,400 26,395Obayashi Corp. . . . . . . . . . . . . . . . . . . . . . . . . . . . . . . . . . . . . . . . . . . . . . . . . 3,800 27,911Shimizu Corp. . . . . . . . . . . . . . . . . . . . . . . . . . . . . . . . . . . . . . . . . . . . . . . . . . . 4,600 28,980Taisei Corp. . . . . . . . . . . . . . . . . . . . . . . . . . . . . . . . . . . . . . . . . . . . . . . . . . . . . 1,000 29,111
112,397Diversified Financial Services — 1.1%Mitsubishi HC Capital Inc.. . . . . . . . . . . . . . . . . . . . . . . . . . . . . . . . . . . . . . . 6,200 29,102ORIX Corp. . . . . . . . . . . . . . . . . . . . . . . . . . . . . . . . . . . . . . . . . . . . . . . . . . . . . 1,400 27,585Tokyo Century Corp.. . . . . . . . . . . . . . . . . . . . . . . . . . . . . . . . . . . . . . . . . . . . 600 28,537
85,224Diversified Telecommunication Services — 0.4%Nippon Telegraph & Telephone Corp. . . . . . . . . . . . . . . . . . . . . . . . . . . . . 1,000 27,516
Electric Utilities — 1.2%Chubu Electric Power Co. Inc. . . . . . . . . . . . . . . . . . . . . . . . . . . . . . . . . . . 3,000 30,264Kansai Electric Power Co. Inc. (The) . . . . . . . . . . . . . . . . . . . . . . . . . . . . 3,400 30,717Tokyo Electric Power Co. Holdings Inc.(a) . . . . . . . . . . . . . . . . . . . . . . . . 11,200 29,884
90,865Electrical Equipment — 1.1%Fuji Electric Co. Ltd. . . . . . . . . . . . . . . . . . . . . . . . . . . . . . . . . . . . . . . . . . . . . 600 31,236Mitsubishi Electric Corp. . . . . . . . . . . . . . . . . . . . . . . . . . . . . . . . . . . . . . . . . 2,200 27,488Nidec Corp. . . . . . . . . . . . . . . . . . . . . . . . . . . . . . . . . . . . . . . . . . . . . . . . . . . . . 200 22,902
81,626Electronic Equipment, Instruments & Components — 4.1%Azbil Corp. . . . . . . . . . . . . . . . . . . . . . . . . . . . . . . . . . . . . . . . . . . . . . . . . . . . . . 600 26,448Hamamatsu Photonics KK . . . . . . . . . . . . . . . . . . . . . . . . . . . . . . . . . . . . . . 400 24,558Hirose Electric Co. Ltd. . . . . . . . . . . . . . . . . . . . . . . . . . . . . . . . . . . . . . . . . . 200 33,541Ibiden Co. Ltd. . . . . . . . . . . . . . . . . . . . . . . . . . . . . . . . . . . . . . . . . . . . . . . . . . 600 37,100Kyocera Corp.. . . . . . . . . . . . . . . . . . . . . . . . . . . . . . . . . . . . . . . . . . . . . . . . . . 400 23,708Murata Manufacturing Co. Ltd. . . . . . . . . . . . . . . . . . . . . . . . . . . . . . . . . . . 400 29,346Omron Corp. . . . . . . . . . . . . . . . . . . . . . . . . . . . . . . . . . . . . . . . . . . . . . . . . . . . 400 38,432Shimadzu Corp. . . . . . . . . . . . . . . . . . . . . . . . . . . . . . . . . . . . . . . . . . . . . . . . . 800 33,920TDK Corp. . . . . . . . . . . . . . . . . . . . . . . . . . . . . . . . . . . . . . . . . . . . . . . . . . . . . . 800 31,648Yokogawa Electric Corp. . . . . . . . . . . . . . . . . . . . . . . . . . . . . . . . . . . . . . . . . 1,600 29,994
308,695Entertainment — 2.9%Capcom Co. Ltd. . . . . . . . . . . . . . . . . . . . . . . . . . . . . . . . . . . . . . . . . . . . . . . . 1,000 24,890
Schedule of Investments (unaudited)
November 30, 2021
iShares� MSCI Japan Equal Weighted ETF(Percentages shown are based on Net Assets)
117NM0122U-1995964-119/159

Security Shares
Value
Entertainment (continued)Koei Tecmo Holdings Co. Ltd. . . . . . . . . . . . . . . . . . . . . . . . . . . . . . . . . . . . 720 $ 30,000Konami Holdings Corp. . . . . . . . . . . . . . . . . . . . . . . . . . . . . . . . . . . . . . . . . . 600 30,673Nexon Co. Ltd. . . . . . . . . . . . . . . . . . . . . . . . . . . . . . . . . . . . . . . . . . . . . . . . . . 1,400 27,794Nintendo Co. Ltd.. . . . . . . . . . . . . . . . . . . . . . . . . . . . . . . . . . . . . . . . . . . . . . . 100 44,102Square Enix Holdings Co. Ltd. . . . . . . . . . . . . . . . . . . . . . . . . . . . . . . . . . . 600 31,392Toho Co. Ltd.. . . . . . . . . . . . . . . . . . . . . . . . . . . . . . . . . . . . . . . . . . . . . . . . . . . 600 26,629
215,480Equity Real Estate Investment Trusts (REITs) — 3.4%Daiwa House REIT Investment Corp. . . . . . . . . . . . . . . . . . . . . . . . . . . . . 12 34,352GLP J-REIT . . . . . . . . . . . . . . . . . . . . . . . . . . . . . . . . . . . . . . . . . . . . . . . . . . . . 18 28,711Japan Metropolitan Fund Invest . . . . . . . . . . . . . . . . . . . . . . . . . . . . . . . . . 34 29,336Japan Real Estate Investment Corp. . . . . . . . . . . . . . . . . . . . . . . . . . . . . 6 34,724Nippon Building Fund Inc.. . . . . . . . . . . . . . . . . . . . . . . . . . . . . . . . . . . . . . . 6 37,079Nippon Prologis REIT Inc. . . . . . . . . . . . . . . . . . . . . . . . . . . . . . . . . . . . . . . 10 32,661Nomura Real Estate Master Fund Inc. . . . . . . . . . . . . . . . . . . . . . . . . . . . 20 28,514Orix JREIT Inc. . . . . . . . . . . . . . . . . . . . . . . . . . . . . . . . . . . . . . . . . . . . . . . . . . 18 28,703
254,080Food & Staples Retailing — 2.7%Aeon Co. Ltd. . . . . . . . . . . . . . . . . . . . . . . . . . . . . . . . . . . . . . . . . . . . . . . . . . . 1,200 27,988Cosmos Pharmaceutical Corp. . . . . . . . . . . . . . . . . . . . . . . . . . . . . . . . . . . 200 31,033Kobe Bussan Co. Ltd. . . . . . . . . . . . . . . . . . . . . . . . . . . . . . . . . . . . . . . . . . . 800 30,157Lawson Inc. . . . . . . . . . . . . . . . . . . . . . . . . . . . . . . . . . . . . . . . . . . . . . . . . . . . . 600 29,418Seven & i Holdings Co. Ltd. . . . . . . . . . . . . . . . . . . . . . . . . . . . . . . . . . . . . . 800 32,222Tsuruha Holdings Inc.. . . . . . . . . . . . . . . . . . . . . . . . . . . . . . . . . . . . . . . . . . . 200 22,626Welcia Holdings Co. Ltd.. . . . . . . . . . . . . . . . . . . . . . . . . . . . . . . . . . . . . . . . 800 28,446
201,890Food Products — 2.8%Ajinomoto Co. Inc. . . . . . . . . . . . . . . . . . . . . . . . . . . . . . . . . . . . . . . . . . . . . . . 1,000 29,984Kikkoman Corp. . . . . . . . . . . . . . . . . . . . . . . . . . . . . . . . . . . . . . . . . . . . . . . . . 400 30,535MEIJI Holdings Co. Ltd.. . . . . . . . . . . . . . . . . . . . . . . . . . . . . . . . . . . . . . . . . 400 23,542Nisshin Seifun Group Inc. . . . . . . . . . . . . . . . . . . . . . . . . . . . . . . . . . . . . . . . 2,000 28,763Nissin Foods Holdings Co. Ltd.. . . . . . . . . . . . . . . . . . . . . . . . . . . . . . . . . . 400 29,401Toyo Suisan Kaisha Ltd. . . . . . . . . . . . . . . . . . . . . . . . . . . . . . . . . . . . . . . . . 800 32,372Yakult Honsha Co. Ltd. . . . . . . . . . . . . . . . . . . . . . . . . . . . . . . . . . . . . . . . . . 600 30,109
204,706Gas Utilities — 0.8%Osaka Gas Co. Ltd. . . . . . . . . . . . . . . . . . . . . . . . . . . . . . . . . . . . . . . . . . . . . 2,000 32,128Tokyo Gas Co. Ltd. . . . . . . . . . . . . . . . . . . . . . . . . . . . . . . . . . . . . . . . . . . . . . 1,800 30,794
62,922Health Care Equipment & Supplies — 1.9%Asahi Intecc Co. Ltd. . . . . . . . . . . . . . . . . . . . . . . . . . . . . . . . . . . . . . . . . . . . 1,200 26,303Hoya Corp.. . . . . . . . . . . . . . . . . . . . . . . . . . . . . . . . . . . . . . . . . . . . . . . . . . . . . 200 31,657Olympus Corp. . . . . . . . . . . . . . . . . . . . . . . . . . . . . . . . . . . . . . . . . . . . . . . . . . 1,400 31,281Sysmex Corp. . . . . . . . . . . . . . . . . . . . . . . . . . . . . . . . . . . . . . . . . . . . . . . . . . . 200 24,877Terumo Corp. . . . . . . . . . . . . . . . . . . . . . . . . . . . . . . . . . . . . . . . . . . . . . . . . . . 600 24,434
138,552Health Care Providers & Services — 0.4%Medipal Holdings Corp. . . . . . . . . . . . . . . . . . . . . . . . . . . . . . . . . . . . . . . . . . 1,600 28,756
Health Care Technology — 0.4%M3 Inc. . . . . . . . . . . . . . . . . . . . . . . . . . . . . . . . . . . . . . . . . . . . . . . . . . . . . . . . . 600 32,255
Hotels, Restaurants & Leisure — 0.8%McDonald's Holdings Co. Japan Ltd. . . . . . . . . . . . . . . . . . . . . . . . . . . . . 600 26,778Oriental Land Co. Ltd. . . . . . . . . . . . . . . . . . . . . . . . . . . . . . . . . . . . . . . . . . . 200 31,427
58,205Household Durables — 2.8%Iida Group Holdings Co. Ltd. . . . . . . . . . . . . . . . . . . . . . . . . . . . . . . . . . . . . 1,400 28,910Open House Co. Ltd. . . . . . . . . . . . . . . . . . . . . . . . . . . . . . . . . . . . . . . . . . . . 400 22,789
Security Shares
Value
Household Durables (continued)Panasonic Corp. . . . . . . . . . . . . . . . . . . . . . . . . . . . . . . . . . . . . . . . . . . . . . . . 2,800 $ 30,527Rinnai Corp. . . . . . . . . . . . . . . . . . . . . . . . . . . . . . . . . . . . . . . . . . . . . . . . . . . . 200 18,922Sekisui Chemical Co. Ltd.. . . . . . . . . . . . . . . . . . . . . . . . . . . . . . . . . . . . . . . 1,800 29,240Sekisui House Ltd. . . . . . . . . . . . . . . . . . . . . . . . . . . . . . . . . . . . . . . . . . . . . . 1,400 27,209Sharp Corp. . . . . . . . . . . . . . . . . . . . . . . . . . . . . . . . . . . . . . . . . . . . . . . . . . . . . 2,600 29,005Sony Group Corp. . . . . . . . . . . . . . . . . . . . . . . . . . . . . . . . . . . . . . . . . . . . . . . 200 24,402
211,004Household Products — 0.8%Lion Corp.. . . . . . . . . . . . . . . . . . . . . . . . . . . . . . . . . . . . . . . . . . . . . . . . . . . . . . 2,000 28,407Unicharm Corp. . . . . . . . . . . . . . . . . . . . . . . . . . . . . . . . . . . . . . . . . . . . . . . . . 800 34,653
63,060Industrial Conglomerates — 0.7%Hitachi Ltd.. . . . . . . . . . . . . . . . . . . . . . . . . . . . . . . . . . . . . . . . . . . . . . . . . . . . . 400 23,432Toshiba Corp. . . . . . . . . . . . . . . . . . . . . . . . . . . . . . . . . . . . . . . . . . . . . . . . . . . 800 31,931
55,363Insurance — 2.8%Dai-ichi Life Holdings Inc. . . . . . . . . . . . . . . . . . . . . . . . . . . . . . . . . . . . . . . . 1,400 28,048Japan Post Holdings Co. Ltd. . . . . . . . . . . . . . . . . . . . . . . . . . . . . . . . . . . . 4,000 30,145Japan Post Insurance Co. Ltd. . . . . . . . . . . . . . . . . . . . . . . . . . . . . . . . . . . 2,000 30,895MS&AD Insurance Group Holdings Inc.. . . . . . . . . . . . . . . . . . . . . . . . . . 1,000 29,159Sompo Holdings Inc. . . . . . . . . . . . . . . . . . . . . . . . . . . . . . . . . . . . . . . . . . . . 800 32,854T&D Holdings Inc. . . . . . . . . . . . . . . . . . . . . . . . . . . . . . . . . . . . . . . . . . . . . . . 2,400 28,208Tokio Marine Holdings Inc. . . . . . . . . . . . . . . . . . . . . . . . . . . . . . . . . . . . . . . 600 30,132
209,441Interactive Media & Services — 0.8%Kakaku.com Inc. . . . . . . . . . . . . . . . . . . . . . . . . . . . . . . . . . . . . . . . . . . . . . . . 1,000 27,941Z Holdings Corp. . . . . . . . . . . . . . . . . . . . . . . . . . . . . . . . . . . . . . . . . . . . . . . . 4,200 27,798
55,739Internet & Direct Marketing Retail — 1.1%Mercari Inc.(a) . . . . . . . . . . . . . . . . . . . . . . . . . . . . . . . . . . . . . . . . . . . . . . . . . . 400 24,128Rakuten Group Inc.. . . . . . . . . . . . . . . . . . . . . . . . . . . . . . . . . . . . . . . . . . . . . 2,800 28,577ZOZO Inc. . . . . . . . . . . . . . . . . . . . . . . . . . . . . . . . . . . . . . . . . . . . . . . . . . . . . . 800 25,357
78,062IT Services — 4.0%Fujitsu Ltd. . . . . . . . . . . . . . . . . . . . . . . . . . . . . . . . . . . . . . . . . . . . . . . . . . . . . . 200 33,057GMO Payment Gateway Inc. . . . . . . . . . . . . . . . . . . . . . . . . . . . . . . . . . . . . 200 26,650Itochu Techno-Solutions Corp. . . . . . . . . . . . . . . . . . . . . . . . . . . . . . . . . . . 1,000 32,532NEC Corp. . . . . . . . . . . . . . . . . . . . . . . . . . . . . . . . . . . . . . . . . . . . . . . . . . . . . . 600 27,070Nomura Research Institute Ltd. . . . . . . . . . . . . . . . . . . . . . . . . . . . . . . . . . 600 25,651NTT Data Corp. . . . . . . . . . . . . . . . . . . . . . . . . . . . . . . . . . . . . . . . . . . . . . . . . 1,400 29,545Obic Co. Ltd. . . . . . . . . . . . . . . . . . . . . . . . . . . . . . . . . . . . . . . . . . . . . . . . . . . . 200 36,783Otsuka Corp. . . . . . . . . . . . . . . . . . . . . . . . . . . . . . . . . . . . . . . . . . . . . . . . . . . . 600 27,420SCSK Corp.. . . . . . . . . . . . . . . . . . . . . . . . . . . . . . . . . . . . . . . . . . . . . . . . . . . . 1,600 30,303TIS Inc. . . . . . . . . . . . . . . . . . . . . . . . . . . . . . . . . . . . . . . . . . . . . . . . . . . . . . . . . 1,000 30,825
299,836Leisure Products — 1.2%Bandai Namco Holdings Inc. . . . . . . . . . . . . . . . . . . . . . . . . . . . . . . . . . . . . 400 31,133Shimano Inc. . . . . . . . . . . . . . . . . . . . . . . . . . . . . . . . . . . . . . . . . . . . . . . . . . . . 100 27,659Yamaha Corp.. . . . . . . . . . . . . . . . . . . . . . . . . . . . . . . . . . . . . . . . . . . . . . . . . . 600 30,793
89,585Machinery — 6.4%Daifuku Co. Ltd. . . . . . . . . . . . . . . . . . . . . . . . . . . . . . . . . . . . . . . . . . . . . . . . . 400 31,960FANUC Corp. . . . . . . . . . . . . . . . . . . . . . . . . . . . . . . . . . . . . . . . . . . . . . . . . . . 100 19,604Hino Motors Ltd.. . . . . . . . . . . . . . . . . . . . . . . . . . . . . . . . . . . . . . . . . . . . . . . . 3,400 28,059Hitachi Construction Machinery Co. Ltd. . . . . . . . . . . . . . . . . . . . . . . . . . 1,000 28,891Hoshizaki Corp. . . . . . . . . . . . . . . . . . . . . . . . . . . . . . . . . . . . . . . . . . . . . . . . . 400 30,391Komatsu Ltd. . . . . . . . . . . . . . . . . . . . . . . . . . . . . . . . . . . . . . . . . . . . . . . . . . . . 1,200 27,148Kubota Corp. . . . . . . . . . . . . . . . . . . . . . . . . . . . . . . . . . . . . . . . . . . . . . . . . . . . 1,600 33,293
Schedule of Investments (unaudited) (continued)
November 30, 2021
iShares� MSCI Japan Equal Weighted ETF(Percentages shown are based on Net Assets)
118 NM0122U-1995964-120/159

Security Shares
Value
Machinery (continued)Kurita Water Industries Ltd. . . . . . . . . . . . . . . . . . . . . . . . . . . . . . . . . . . . . . 600 $ 27,947Makita Corp. . . . . . . . . . . . . . . . . . . . . . . . . . . . . . . . . . . . . . . . . . . . . . . . . . . . 800 35,126Minebea Mitsumi Inc. . . . . . . . . . . . . . . . . . . . . . . . . . . . . . . . . . . . . . . . . . . . 1,200 31,579Misumi Group Inc. . . . . . . . . . . . . . . . . . . . . . . . . . . . . . . . . . . . . . . . . . . . . . . 800 33,730Mitsubishi Heavy Industries Ltd. . . . . . . . . . . . . . . . . . . . . . . . . . . . . . . . . . 1,200 26,917Miura Co. Ltd. . . . . . . . . . . . . . . . . . . . . . . . . . . . . . . . . . . . . . . . . . . . . . . . . . . 800 27,959NGK Insulators Ltd.. . . . . . . . . . . . . . . . . . . . . . . . . . . . . . . . . . . . . . . . . . . . . 1,800 28,427Toyota Industries Corp. . . . . . . . . . . . . . . . . . . . . . . . . . . . . . . . . . . . . . . . . . 400 32,809Yaskawa Electric Corp. . . . . . . . . . . . . . . . . . . . . . . . . . . . . . . . . . . . . . . . . . 800 35,707
479,547Marine — 0.4%Nippon Yusen KK. . . . . . . . . . . . . . . . . . . . . . . . . . . . . . . . . . . . . . . . . . . . . . . 400 25,908
Media — 1.1%CyberAgent Inc. . . . . . . . . . . . . . . . . . . . . . . . . . . . . . . . . . . . . . . . . . . . . . . . . 1,600 29,448Dentsu Group Inc. . . . . . . . . . . . . . . . . . . . . . . . . . . . . . . . . . . . . . . . . . . . . . . 800 25,335Hakuhodo DY Holdings Inc. . . . . . . . . . . . . . . . . . . . . . . . . . . . . . . . . . . . . . 2,000 29,589
84,372Metals & Mining — 1.5%Hitachi Metals Ltd.(a). . . . . . . . . . . . . . . . . . . . . . . . . . . . . . . . . . . . . . . . . . . . 1,600 29,706JFE Holdings Inc. . . . . . . . . . . . . . . . . . . . . . . . . . . . . . . . . . . . . . . . . . . . . . . 2,400 27,355Nippon Steel Corp. . . . . . . . . . . . . . . . . . . . . . . . . . . . . . . . . . . . . . . . . . . . . . 1,800 26,538Sumitomo Metal Mining Co. Ltd. . . . . . . . . . . . . . . . . . . . . . . . . . . . . . . . . 800 29,569
113,168Multiline Retail — 0.7%Pan Pacific International Holdings Corp. . . . . . . . . . . . . . . . . . . . . . . . . . 1,600 27,312Ryohin Keikaku Co. Ltd. . . . . . . . . . . . . . . . . . . . . . . . . . . . . . . . . . . . . . . . . 1,600 25,820
53,132Oil, Gas & Consumable Fuels — 1.2%ENEOS Holdings Inc.. . . . . . . . . . . . . . . . . . . . . . . . . . . . . . . . . . . . . . . . . . . 7,800 28,956Idemitsu Kosan Co. Ltd. . . . . . . . . . . . . . . . . . . . . . . . . . . . . . . . . . . . . . . . . 1,200 30,869Inpex Corp. . . . . . . . . . . . . . . . . . . . . . . . . . . . . . . . . . . . . . . . . . . . . . . . . . . . . 3,600 29,457
89,282Paper & Forest Products — 0.4%Oji Holdings Corp. . . . . . . . . . . . . . . . . . . . . . . . . . . . . . . . . . . . . . . . . . . . . . . 6,000 27,609
Personal Products — 1.8%Kao Corp. . . . . . . . . . . . . . . . . . . . . . . . . . . . . . . . . . . . . . . . . . . . . . . . . . . . . . . 600 30,607Kobayashi Pharmaceutical Co. Ltd. . . . . . . . . . . . . . . . . . . . . . . . . . . . . . 400 31,493Kose Corp.. . . . . . . . . . . . . . . . . . . . . . . . . . . . . . . . . . . . . . . . . . . . . . . . . . . . . 200 24,067Pola Orbis Holdings Inc. . . . . . . . . . . . . . . . . . . . . . . . . . . . . . . . . . . . . . . . . 1,600 28,510Shiseido Co. Ltd. . . . . . . . . . . . . . . . . . . . . . . . . . . . . . . . . . . . . . . . . . . . . . . . 400 22,928
137,605Pharmaceuticals — 5.0%Astellas Pharma Inc.. . . . . . . . . . . . . . . . . . . . . . . . . . . . . . . . . . . . . . . . . . . . 1,800 28,225Chugai Pharmaceutical Co. Ltd. . . . . . . . . . . . . . . . . . . . . . . . . . . . . . . . . . 900 29,154Daiichi Sankyo Co. Ltd. . . . . . . . . . . . . . . . . . . . . . . . . . . . . . . . . . . . . . . . . . 1,200 29,827Eisai Co. Ltd.. . . . . . . . . . . . . . . . . . . . . . . . . . . . . . . . . . . . . . . . . . . . . . . . . . . 400 24,174Kyowa Kirin Co. Ltd. . . . . . . . . . . . . . . . . . . . . . . . . . . . . . . . . . . . . . . . . . . . . 1,000 27,934Nippon Shinyaku Co. Ltd. . . . . . . . . . . . . . . . . . . . . . . . . . . . . . . . . . . . . . . . 400 29,616Ono Pharmaceutical Co. Ltd.. . . . . . . . . . . . . . . . . . . . . . . . . . . . . . . . . . . . 1,400 30,879Otsuka Holdings Co. Ltd. . . . . . . . . . . . . . . . . . . . . . . . . . . . . . . . . . . . . . . . 800 28,976Santen Pharmaceutical Co. Ltd. . . . . . . . . . . . . . . . . . . . . . . . . . . . . . . . . . 2,200 29,123Shionogi & Co. Ltd. . . . . . . . . . . . . . . . . . . . . . . . . . . . . . . . . . . . . . . . . . . . . . 400 27,925Sumitomo Dainippon Pharma Co. Ltd. . . . . . . . . . . . . . . . . . . . . . . . . . . . 2,400 29,250Taisho Pharmaceutical Holdings Co. Ltd. . . . . . . . . . . . . . . . . . . . . . . . . 600 29,498Takeda Pharmaceutical Co. Ltd.. . . . . . . . . . . . . . . . . . . . . . . . . . . . . . . . . 1,000 26,753
371,334
Security Shares
Value
Professional Services — 1.5%Benefit One Inc. . . . . . . . . . . . . . . . . . . . . . . . . . . . . . . . . . . . . . . . . . . . . . . . . 600 $ 28,239Nihon M&A Center Holdings Inc. . . . . . . . . . . . . . . . . . . . . . . . . . . . . . . . . 1,000 29,339Persol Holdings Co. Ltd. . . . . . . . . . . . . . . . . . . . . . . . . . . . . . . . . . . . . . . . . 1,000 28,793Recruit Holdings Co. Ltd. . . . . . . . . . . . . . . . . . . . . . . . . . . . . . . . . . . . . . . . 400 24,288
110,659Real Estate Management & Development — 2.5%Daito Trust Construction Co. Ltd. . . . . . . . . . . . . . . . . . . . . . . . . . . . . . . . . 200 21,662Daiwa House Industry Co. Ltd. . . . . . . . . . . . . . . . . . . . . . . . . . . . . . . . . . . 1,000 29,040Hulic Co. Ltd. . . . . . . . . . . . . . . . . . . . . . . . . . . . . . . . . . . . . . . . . . . . . . . . . . . 3,000 28,381Mitsubishi Estate Co. Ltd. . . . . . . . . . . . . . . . . . . . . . . . . . . . . . . . . . . . . . . . 2,000 27,488Mitsui Fudosan Co. Ltd.. . . . . . . . . . . . . . . . . . . . . . . . . . . . . . . . . . . . . . . . . 1,400 28,777Nomura Real Estate Holdings Inc.. . . . . . . . . . . . . . . . . . . . . . . . . . . . . . . 1,200 26,019Sumitomo Realty & Development Co. Ltd. . . . . . . . . . . . . . . . . . . . . . . . 800 24,954
186,321Road & Rail — 4.1%Central Japan Railway Co. . . . . . . . . . . . . . . . . . . . . . . . . . . . . . . . . . . . . . . 200 27,495East Japan Railway Co. . . . . . . . . . . . . . . . . . . . . . . . . . . . . . . . . . . . . . . . . 400 24,524Hankyu Hanshin Holdings Inc. . . . . . . . . . . . . . . . . . . . . . . . . . . . . . . . . . . 1,000 29,629Keio Corp. . . . . . . . . . . . . . . . . . . . . . . . . . . . . . . . . . . . . . . . . . . . . . . . . . . . . . 600 26,978Keisei Electric Railway Co. Ltd. . . . . . . . . . . . . . . . . . . . . . . . . . . . . . . . . . 1,000 27,358Kintetsu Group Holdings Co. Ltd.(a). . . . . . . . . . . . . . . . . . . . . . . . . . . . . . 1,000 28,722Nippon Express Co. Ltd. . . . . . . . . . . . . . . . . . . . . . . . . . . . . . . . . . . . . . . . . 600 34,158Odakyu Electric Railway Co. Ltd. . . . . . . . . . . . . . . . . . . . . . . . . . . . . . . . . 1,400 26,965Tobu Railway Co. Ltd. . . . . . . . . . . . . . . . . . . . . . . . . . . . . . . . . . . . . . . . . . . 1,200 27,120Tokyu Corp. . . . . . . . . . . . . . . . . . . . . . . . . . . . . . . . . . . . . . . . . . . . . . . . . . . . . 2,000 27,644West Japan Railway Co. . . . . . . . . . . . . . . . . . . . . . . . . . . . . . . . . . . . . . . . . 600 25,855
306,448Semiconductors & Semiconductor Equipment — 2.9%Advantest Corp. . . . . . . . . . . . . . . . . . . . . . . . . . . . . . . . . . . . . . . . . . . . . . . . . 400 34,920Lasertec Corp. . . . . . . . . . . . . . . . . . . . . . . . . . . . . . . . . . . . . . . . . . . . . . . . . . 200 51,937Renesas Electronics Corp.(a) . . . . . . . . . . . . . . . . . . . . . . . . . . . . . . . . . . . . 2,200 27,644Rohm Co. Ltd.. . . . . . . . . . . . . . . . . . . . . . . . . . . . . . . . . . . . . . . . . . . . . . . . . . 200 18,573SUMCO Corp.. . . . . . . . . . . . . . . . . . . . . . . . . . . . . . . . . . . . . . . . . . . . . . . . . . 1,400 30,347Tokyo Electron Ltd. . . . . . . . . . . . . . . . . . . . . . . . . . . . . . . . . . . . . . . . . . . . . . 100 52,547
215,968Software — 1.0%Oracle Corp. Japan. . . . . . . . . . . . . . . . . . . . . . . . . . . . . . . . . . . . . . . . . . . . . 400 39,238Trend Micro Inc. . . . . . . . . . . . . . . . . . . . . . . . . . . . . . . . . . . . . . . . . . . . . . . . . 600 34,598
73,836Specialty Retail — 1.3%Hikari Tsushin Inc. . . . . . . . . . . . . . . . . . . . . . . . . . . . . . . . . . . . . . . . . . . . . . . 200 28,961Nitori Holdings Co. Ltd. . . . . . . . . . . . . . . . . . . . . . . . . . . . . . . . . . . . . . . . . . 200 31,697USS Co. Ltd. . . . . . . . . . . . . . . . . . . . . . . . . . . . . . . . . . . . . . . . . . . . . . . . . . . . 2,400 35,209
95,867Technology Hardware, Storage & Peripherals — 2.0%Brother Industries Ltd. . . . . . . . . . . . . . . . . . . . . . . . . . . . . . . . . . . . . . . . . . . 1,600 27,460Canon Inc. . . . . . . . . . . . . . . . . . . . . . . . . . . . . . . . . . . . . . . . . . . . . . . . . . . . . . 1,400 30,790FUJIFILM Holdings Corp. . . . . . . . . . . . . . . . . . . . . . . . . . . . . . . . . . . . . . . . 400 31,464Ricoh Co. Ltd. . . . . . . . . . . . . . . . . . . . . . . . . . . . . . . . . . . . . . . . . . . . . . . . . . . 3,200 28,232Seiko Epson Corp. . . . . . . . . . . . . . . . . . . . . . . . . . . . . . . . . . . . . . . . . . . . . . 1,800 29,022
146,968Tobacco — 0.4%Japan Tobacco Inc. . . . . . . . . . . . . . . . . . . . . . . . . . . . . . . . . . . . . . . . . . . . . . 1,400 27,884
Trading Companies & Distributors — 2.7%ITOCHU Corp. . . . . . . . . . . . . . . . . . . . . . . . . . . . . . . . . . . . . . . . . . . . . . . . . . 1,000 28,598Marubeni Corp.. . . . . . . . . . . . . . . . . . . . . . . . . . . . . . . . . . . . . . . . . . . . . . . . . 3,400 30,404Mitsubishi Corp. . . . . . . . . . . . . . . . . . . . . . . . . . . . . . . . . . . . . . . . . . . . . . . . . 1,000 29,734
Schedule of Investments (unaudited) (continued)
November 30, 2021
iShares� MSCI Japan Equal Weighted ETF(Percentages shown are based on Net Assets)
119NM0122U-1995964-121/159

Security Shares
Value
Trading Companies & Distributors (continued)Mitsui & Co. Ltd.. . . . . . . . . . . . . . . . . . . . . . . . . . . . . . . . . . . . . . . . . . . . . . . . 1,400 $ 31,477MonotaRO Co. Ltd. . . . . . . . . . . . . . . . . . . . . . . . . . . . . . . . . . . . . . . . . . . . . . 1,400 27,562Sumitomo Corp. . . . . . . . . . . . . . . . . . . . . . . . . . . . . . . . . . . . . . . . . . . . . . . . . 2,000 27,231Toyota Tsusho Corp.. . . . . . . . . . . . . . . . . . . . . . . . . . . . . . . . . . . . . . . . . . . . 600 25,982
200,988Wireless Telecommunication Services — 1.1%KDDI Corp. . . . . . . . . . . . . . . . . . . . . . . . . . . . . . . . . . . . . . . . . . . . . . . . . . . . . 1,000 29,015Softbank Corp. . . . . . . . . . . . . . . . . . . . . . . . . . . . . . . . . . . . . . . . . . . . . . . . . . 2,200 30,282SoftBank Group Corp. . . . . . . . . . . . . . . . . . . . . . . . . . . . . . . . . . . . . . . . . . . 400 21,021
80,318
Total Common Stocks — 99.0%(Cost: $6,948,477) . . . . . . . . . . . . . . . . . . . . . . . . . . . . . . . . . . . . . . . . . . . . . . . . . . . 7,370,300
Total Investments in Securities — 99.0%(Cost: $6,948,477) . . . . . . . . . . . . . . . . . . . . . . . . . . . . . . . . . . . . . . . . . . . . . . . . . . . 7,370,300
Other Assets, Less Liabilities — 1.0% . . . . . . . . . . . . . . . . . . . . . . . . . . . . . . . . . 76,796
Net Assets — 100.0% . . . . . . . . . . . . . . . . . . . . . . . . . . . . . . . . . . . . . . . . . . . . . . . . . . $ 7,447,096
(a) Non-income producing security.
Derivative Financial Instruments Outstanding as of Period End
Futures Contracts
DescriptionNumber ofContracts
ExpirationDate
NotionalAmount
(000)
Value/Unrealized
Appreciation(Depreciation)
Long ContractsMini TOPIX Index. . . . . . . . . . . . . . . . . . . . . . . . . . . . . . . . . . . . . . . . . . . . . . . . . . . . . . . . . . . . . . . . . . . . . . . . . . . . . . . . . . . . . . . . . . . . . . . . . . . . 3 12/09/21 $ 50 $ (4,066)
Fair Value Measurements
Various inputs are used in determining the fair value of financial instruments. These inputs to valuation techniques are categorized into a fair value hierarchy consisting ofthree broad levels for financial reporting purposes as follows:
• Level 1 – Unadjusted price quotations in active markets/exchanges for identical assets or liabilities that each Fund has the ability to access;• Level 2 – Other observable inputs (including, but not limited to, quoted prices for similar assets or liabilities in markets that are active, quoted prices for identical or
similar assets or liabilities in markets that are not active, inputs other than quoted prices that are observable for the assets or liabilities (such as interest rates, yieldcurves, volatilities, prepayment speeds, loss severities, credit risks and default rates) or other market-corroborated inputs); and
• Level 3 – Unobservable inputs based on the best information available in the circumstances, to the extent observable inputs are not available (including the BlackRockGlobal Valuation Methodologies Committee’s (the “Global Valuation Committee’s”) assumptions used in determining the fair value of financial instruments).
The hierarchy gives the highest priority to unadjusted quoted prices in active markets for identical assets or liabilities (Level 1 measurements) and the lowest priority tounobservable inputs (Level 3 measurements). Accordingly, the degree of judgment exercised in determining fair value is greatest for instruments categorized in Level 3. Theinputs used to measure fair value may fall into different levels of the fair value hierarchy. In such cases, for disclosure purposes, the fair value hierarchy classification isdetermined based on the lowest level input that is significant to the fair value measurement in its entirety. Investments classified within Level 3 have significant unobservableinputs used by the Global Valuation Committee in determining the price for Fair Valued Investments. Level 3 investments include equity or debt issued by privately heldcompanies or funds. There may not be a secondary market, and/or there are a limited number of investors. The categorization of a value determined for financial instrumentsis based on the pricing transparency of the financial instruments and is not necessarily an indication of the risks associated with investing in those securities. For informationabout the Fund’s policy regarding valuation of financial instruments, refer to its most recent financial statements.
Schedule of Investments (unaudited) (continued)
November 30, 2021
iShares� MSCI Japan Equal Weighted ETF(Percentages shown are based on Net Assets)
120 NM0122U-1995964-122/159

Fair Value Measurements (continued)
The following table summarizes the Fund’s financial instruments categorized in the fair value hierarchy. The breakdown of the Fund’s financial instruments into majorcategories is disclosed in the Schedule of Investments above.
Level 1 Level 2 Level 3 Total
InvestmentsAssets
Common Stocks . . . . . . . . . . . . . . . . . . . . . . . . . . . . . . . . . . . . . . . . . . . . . . . . . . . . . . . . . . . . . . . . . . . . . . . . . . . . . . . . . . . . . . . . . . . . . $ 28,711 $7,341,589 $ — $7,370,300
Derivative financial instruments(a)
LiabilitiesFutures Contracts . . . . . . . . . . . . . . . . . . . . . . . . . . . . . . . . . . . . . . . . . . . . . . . . . . . . . . . . . . . . . . . . . . . . . . . . . . . . . . . . . . . . . . . . . . . . $ — $ (4,066) $ — $ (4,066)
(a) Derivative financial instruments are futures contracts. Futures contracts are valued at the unrealized appreciation (depreciation) on the instrument.
Schedule of Investments (unaudited) (continued)
November 30, 2021
iShares� MSCI Japan Equal Weighted ETF
121NM0122U-1995964-123/159

Security Shares
Value
Common StocksAirlines — 0.1%ANA Holdings Inc.(a). . . . . . . . . . . . . . . . . . . . . . . . . . . . . . . . . . . . . . . . . . 2,800 $ 55,475Japan Airlines Co. Ltd.(a) . . . . . . . . . . . . . . . . . . . . . . . . . . . . . . . . . . . . . 2,800 50,473
105,948Auto Components — 2.2%Aisin Corp. . . . . . . . . . . . . . . . . . . . . . . . . . . . . . . . . . . . . . . . . . . . . . . . . . . 5,800 212,837Bridgestone Corp.. . . . . . . . . . . . . . . . . . . . . . . . . . . . . . . . . . . . . . . . . . . . 22,400 898,208Stanley Electric Co. Ltd. . . . . . . . . . . . . . . . . . . . . . . . . . . . . . . . . . . . . . . 5,600 145,495Sumitomo Electric Industries Ltd. . . . . . . . . . . . . . . . . . . . . . . . . . . . . . 30,800 403,148
1,659,688Automobiles — 14.7%Honda Motor Co. Ltd. . . . . . . . . . . . . . . . . . . . . . . . . . . . . . . . . . . . . . . . . 64,400 1,763,579Isuzu Motors Ltd. . . . . . . . . . . . . . . . . . . . . . . . . . . . . . . . . . . . . . . . . . . . . 11,200 150,109Mazda Motor Corp.(a) . . . . . . . . . . . . . . . . . . . . . . . . . . . . . . . . . . . . . . . . 22,400 180,713Nissan Motor Co. Ltd.(a) . . . . . . . . . . . . . . . . . . . . . . . . . . . . . . . . . . . . . . 92,400 456,885Subaru Corp. . . . . . . . . . . . . . . . . . . . . . . . . . . . . . . . . . . . . . . . . . . . . . . . . 25,200 474,620Suzuki Motor Corp. . . . . . . . . . . . . . . . . . . . . . . . . . . . . . . . . . . . . . . . . . . 7,300 294,684Toyota Motor Corp.. . . . . . . . . . . . . . . . . . . . . . . . . . . . . . . . . . . . . . . . . . . 420,000 7,450,485Yamaha Motor Co. Ltd. . . . . . . . . . . . . . . . . . . . . . . . . . . . . . . . . . . . . . . . 5,900 148,376
10,919,451Banks — 9.0%Chiba Bank Ltd. (The) . . . . . . . . . . . . . . . . . . . . . . . . . . . . . . . . . . . . . . . . 22,400 129,971Concordia Financial Group Ltd. . . . . . . . . . . . . . . . . . . . . . . . . . . . . . . . 42,000 152,342Japan Post Bank Co. Ltd. . . . . . . . . . . . . . . . . . . . . . . . . . . . . . . . . . . . . 16,800 137,265Mitsubishi UFJ Financial Group Inc.. . . . . . . . . . . . . . . . . . . . . . . . . . . 484,400 2,558,301Mizuho Financial Group Inc. . . . . . . . . . . . . . . . . . . . . . . . . . . . . . . . . . . 95,250 1,174,305Resona Holdings Inc. . . . . . . . . . . . . . . . . . . . . . . . . . . . . . . . . . . . . . . . . 81,200 296,549Shizuoka Bank Ltd. (The). . . . . . . . . . . . . . . . . . . . . . . . . . . . . . . . . . . . . 16,800 118,105Sumitomo Mitsui Financial Group Inc. . . . . . . . . . . . . . . . . . . . . . . . . . 50,400 1,639,759Sumitomo Mitsui Trust Holdings Inc. . . . . . . . . . . . . . . . . . . . . . . . . . . 14,000 437,296
6,643,893Beverages — 1.9%Asahi Group Holdings Ltd.. . . . . . . . . . . . . . . . . . . . . . . . . . . . . . . . . . . . 17,700 652,783Kirin Holdings Co. Ltd. . . . . . . . . . . . . . . . . . . . . . . . . . . . . . . . . . . . . . . . 33,600 535,338Suntory Beverage & Food Ltd. . . . . . . . . . . . . . . . . . . . . . . . . . . . . . . . . 5,600 197,550
1,385,671Building Products — 1.0%AGC Inc. . . . . . . . . . . . . . . . . . . . . . . . . . . . . . . . . . . . . . . . . . . . . . . . . . . . . 8,400 409,055Lixil Corp. . . . . . . . . . . . . . . . . . . . . . . . . . . . . . . . . . . . . . . . . . . . . . . . . . . . 8,400 207,260TOTO Ltd. . . . . . . . . . . . . . . . . . . . . . . . . . . . . . . . . . . . . . . . . . . . . . . . . . . . 2,800 123,863
740,178Capital Markets — 1.4%Daiwa Securities Group Inc. . . . . . . . . . . . . . . . . . . . . . . . . . . . . . . . . . . 56,000 310,550Nomura Holdings Inc. . . . . . . . . . . . . . . . . . . . . . . . . . . . . . . . . . . . . . . . . 120,400 504,496SBI Holdings Inc. . . . . . . . . . . . . . . . . . . . . . . . . . . . . . . . . . . . . . . . . . . . . 8,400 215,512
1,030,558Chemicals — 3.0%Asahi Kasei Corp.. . . . . . . . . . . . . . . . . . . . . . . . . . . . . . . . . . . . . . . . . . . . 50,400 471,237Mitsubishi Chemical Holdings Corp.. . . . . . . . . . . . . . . . . . . . . . . . . . . 33,600 262,661Mitsubishi Gas Chemical Co. Inc. . . . . . . . . . . . . . . . . . . . . . . . . . . . . . 5,600 92,616Mitsui Chemicals Inc.. . . . . . . . . . . . . . . . . . . . . . . . . . . . . . . . . . . . . . . . . 8,400 223,750Nitto Denko Corp. . . . . . . . . . . . . . . . . . . . . . . . . . . . . . . . . . . . . . . . . . . . . 5,600 388,243Sumitomo Chemical Co. Ltd. . . . . . . . . . . . . . . . . . . . . . . . . . . . . . . . . . 58,800 269,719Toray Industries Inc.. . . . . . . . . . . . . . . . . . . . . . . . . . . . . . . . . . . . . . . . . . 56,000 323,792Tosoh Corp. . . . . . . . . . . . . . . . . . . . . . . . . . . . . . . . . . . . . . . . . . . . . . . . . . 11,200 160,118
2,192,136
Security Shares
Value
Commercial Services & Supplies — 0.8%Dai Nippon Printing Co. Ltd. . . . . . . . . . . . . . . . . . . . . . . . . . . . . . . . . . . 8,400 $ 197,149Secom Co. Ltd. . . . . . . . . . . . . . . . . . . . . . . . . . . . . . . . . . . . . . . . . . . . . . . 2,800 189,538Toppan Inc. . . . . . . . . . . . . . . . . . . . . . . . . . . . . . . . . . . . . . . . . . . . . . . . . . . 11,200 169,770
556,457Construction & Engineering — 1.0%Kajima Corp.. . . . . . . . . . . . . . . . . . . . . . . . . . . . . . . . . . . . . . . . . . . . . . . . . 16,800 184,764Obayashi Corp. . . . . . . . . . . . . . . . . . . . . . . . . . . . . . . . . . . . . . . . . . . . . . . 25,200 185,093Shimizu Corp. . . . . . . . . . . . . . . . . . . . . . . . . . . . . . . . . . . . . . . . . . . . . . . . 22,400 141,121Taisei Corp.. . . . . . . . . . . . . . . . . . . . . . . . . . . . . . . . . . . . . . . . . . . . . . . . . . 8,400 244,533
755,511Diversified Financial Services — 1.5%Mitsubishi HC Capital Inc. . . . . . . . . . . . . . . . . . . . . . . . . . . . . . . . . . . . . 25,200 118,288ORIX Corp. . . . . . . . . . . . . . . . . . . . . . . . . . . . . . . . . . . . . . . . . . . . . . . . . . . 47,600 937,882Tokyo Century Corp. . . . . . . . . . . . . . . . . . . . . . . . . . . . . . . . . . . . . . . . . . 600 28,537
1,084,707Diversified Telecommunication Services — 1.9%Nippon Telegraph & Telephone Corp. . . . . . . . . . . . . . . . . . . . . . . . . . 50,400 1,386,800
Electric Utilities — 0.9%Chubu Electric Power Co. Inc. . . . . . . . . . . . . . . . . . . . . . . . . . . . . . . . . 25,200 254,221Kansai Electric Power Co. Inc. (The) . . . . . . . . . . . . . . . . . . . . . . . . . . 28,000 252,960Tokyo Electric Power Co. Holdings Inc.(a). . . . . . . . . . . . . . . . . . . . . . 61,600 164,364
671,545Electrical Equipment — 1.6%Fuji Electric Co. Ltd.. . . . . . . . . . . . . . . . . . . . . . . . . . . . . . . . . . . . . . . . . . 5,600 291,534Mitsubishi Electric Corp. . . . . . . . . . . . . . . . . . . . . . . . . . . . . . . . . . . . . . . 72,800 909,617
1,201,151Electronic Equipment, Instruments & Components — 1.2%Hirose Electric Co. Ltd. . . . . . . . . . . . . . . . . . . . . . . . . . . . . . . . . . . . . . . . 400 67,083Kyocera Corp. . . . . . . . . . . . . . . . . . . . . . . . . . . . . . . . . . . . . . . . . . . . . . . . 11,800 699,392Yokogawa Electric Corp. . . . . . . . . . . . . . . . . . . . . . . . . . . . . . . . . . . . . . 5,600 104,977
871,452Entertainment — 0.1%Toho Co. Ltd. . . . . . . . . . . . . . . . . . . . . . . . . . . . . . . . . . . . . . . . . . . . . . . . . 1,600 71,482
Equity Real Estate Investment Trusts (REITs) — 2.8%Daiwa House REIT Investment Corp. . . . . . . . . . . . . . . . . . . . . . . . . . 87 249,051GLP J-REIT . . . . . . . . . . . . . . . . . . . . . . . . . . . . . . . . . . . . . . . . . . . . . . . . . 168 267,974Japan Metropolitan Fund Invest. . . . . . . . . . . . . . . . . . . . . . . . . . . . . . . 280 241,587Japan Real Estate Investment Corp. . . . . . . . . . . . . . . . . . . . . . . . . . . 56 324,090Nippon Building Fund Inc. . . . . . . . . . . . . . . . . . . . . . . . . . . . . . . . . . . . . 59 364,616Nippon Prologis REIT Inc. . . . . . . . . . . . . . . . . . . . . . . . . . . . . . . . . . . . . 58 189,431Nomura Real Estate Master Fund Inc. . . . . . . . . . . . . . . . . . . . . . . . . 168 239,516Orix JREIT Inc. . . . . . . . . . . . . . . . . . . . . . . . . . . . . . . . . . . . . . . . . . . . . . . 112 178,598
2,054,863Food & Staples Retailing — 1.7%Seven & i Holdings Co. Ltd. . . . . . . . . . . . . . . . . . . . . . . . . . . . . . . . . . . 30,800 1,240,544
Food Products — 1.2%Ajinomoto Co. Inc. . . . . . . . . . . . . . . . . . . . . . . . . . . . . . . . . . . . . . . . . . . . 8,400 251,867MEIJI Holdings Co. Ltd. . . . . . . . . . . . . . . . . . . . . . . . . . . . . . . . . . . . . . . 5,600 329,588Nisshin Seifun Group Inc. . . . . . . . . . . . . . . . . . . . . . . . . . . . . . . . . . . . . 8,400 120,806Nissin Foods Holdings Co. Ltd. . . . . . . . . . . . . . . . . . . . . . . . . . . . . . . . 500 36,752Toyo Suisan Kaisha Ltd. . . . . . . . . . . . . . . . . . . . . . . . . . . . . . . . . . . . . . . 2,800 113,301
852,314Gas Utilities — 0.6%Osaka Gas Co. Ltd. . . . . . . . . . . . . . . . . . . . . . . . . . . . . . . . . . . . . . . . . . . 14,000 224,897Tokyo Gas Co. Ltd.. . . . . . . . . . . . . . . . . . . . . . . . . . . . . . . . . . . . . . . . . . . 14,000 239,509
464,406
Schedule of Investments (unaudited)
November 30, 2021
iShares� MSCI Japan Value ETF(Percentages shown are based on Net Assets)
122 NM0122U-1995964-124/159

Security Shares
Value
Health Care Providers & Services — 0.2%Medipal Holdings Corp. . . . . . . . . . . . . . . . . . . . . . . . . . . . . . . . . . . . . . . 8,400 $ 150,971
Household Durables — 2.4%Iida Group Holdings Co. Ltd.. . . . . . . . . . . . . . . . . . . . . . . . . . . . . . . . . . 5,600 115,642Panasonic Corp. . . . . . . . . . . . . . . . . . . . . . . . . . . . . . . . . . . . . . . . . . . . . . 86,800 946,339Sekisui Chemical Co. Ltd. . . . . . . . . . . . . . . . . . . . . . . . . . . . . . . . . . . . . 14,000 227,423Sekisui House Ltd. . . . . . . . . . . . . . . . . . . . . . . . . . . . . . . . . . . . . . . . . . . . 25,200 489,757
1,779,161Household Products — 0.1%Lion Corp. . . . . . . . . . . . . . . . . . . . . . . . . . . . . . . . . . . . . . . . . . . . . . . . . . . . 5,600 79,812
Industrial Conglomerates — 2.9%Hitachi Ltd. . . . . . . . . . . . . . . . . . . . . . . . . . . . . . . . . . . . . . . . . . . . . . . . . . . 25,200 1,476,169Toshiba Corp.. . . . . . . . . . . . . . . . . . . . . . . . . . . . . . . . . . . . . . . . . . . . . . . . 16,800 672,833
2,149,002Insurance — 4.7%Dai-ichi Life Holdings Inc.. . . . . . . . . . . . . . . . . . . . . . . . . . . . . . . . . . . . . 39,200 785,355Japan Post Holdings Co. Ltd. . . . . . . . . . . . . . . . . . . . . . . . . . . . . . . . . . 98,000 738,563Japan Post Insurance Co. Ltd. . . . . . . . . . . . . . . . . . . . . . . . . . . . . . . . . 8,400 129,759MS&AD Insurance Group Holdings Inc. . . . . . . . . . . . . . . . . . . . . . . . 16,800 489,865Sompo Holdings Inc. . . . . . . . . . . . . . . . . . . . . . . . . . . . . . . . . . . . . . . . . . 11,500 472,282T&D Holdings Inc.. . . . . . . . . . . . . . . . . . . . . . . . . . . . . . . . . . . . . . . . . . . . 22,400 263,271Tokio Marine Holdings Inc.. . . . . . . . . . . . . . . . . . . . . . . . . . . . . . . . . . . . 12,400 622,719
3,501,814Interactive Media & Services — 0.5%Z Holdings Corp. . . . . . . . . . . . . . . . . . . . . . . . . . . . . . . . . . . . . . . . . . . . . . 53,200 352,099
Internet & Direct Marketing Retail — 0.2%Rakuten Group Inc. . . . . . . . . . . . . . . . . . . . . . . . . . . . . . . . . . . . . . . . . . . 11,200 114,309
Machinery — 2.4%Hino Motors Ltd. . . . . . . . . . . . . . . . . . . . . . . . . . . . . . . . . . . . . . . . . . . . . . 11,200 92,429Hitachi Construction Machinery Co. Ltd.. . . . . . . . . . . . . . . . . . . . . . . 5,600 161,791Hoshizaki Corp. . . . . . . . . . . . . . . . . . . . . . . . . . . . . . . . . . . . . . . . . . . . . . . 1,000 75,977Kubota Corp. . . . . . . . . . . . . . . . . . . . . . . . . . . . . . . . . . . . . . . . . . . . . . . . . 25,200 524,361Mitsubishi Heavy Industries Ltd. . . . . . . . . . . . . . . . . . . . . . . . . . . . . . . 14,000 314,028NGK Insulators Ltd. . . . . . . . . . . . . . . . . . . . . . . . . . . . . . . . . . . . . . . . . . . 11,200 176,880Toyota Industries Corp.. . . . . . . . . . . . . . . . . . . . . . . . . . . . . . . . . . . . . . . 5,600 459,323
1,804,789Marine — 0.5%Nippon Yusen KK . . . . . . . . . . . . . . . . . . . . . . . . . . . . . . . . . . . . . . . . . . . . 5,600 362,706
Media — 0.5%Dentsu Group Inc. . . . . . . . . . . . . . . . . . . . . . . . . . . . . . . . . . . . . . . . . . . . 8,400 266,024Hakuhodo DY Holdings Inc. . . . . . . . . . . . . . . . . . . . . . . . . . . . . . . . . . . 5,600 82,848
348,872Metals & Mining — 1.5%Hitachi Metals Ltd.(a) . . . . . . . . . . . . . . . . . . . . . . . . . . . . . . . . . . . . . . . . . 3,000 55,698JFE Holdings Inc. . . . . . . . . . . . . . . . . . . . . . . . . . . . . . . . . . . . . . . . . . . . . 19,600 223,397Nippon Steel Corp.. . . . . . . . . . . . . . . . . . . . . . . . . . . . . . . . . . . . . . . . . . . 33,600 495,388Sumitomo Metal Mining Co. Ltd. . . . . . . . . . . . . . . . . . . . . . . . . . . . . . . 9,800 362,222
1,136,705Multiline Retail — 0.2%Ryohin Keikaku Co. Ltd. . . . . . . . . . . . . . . . . . . . . . . . . . . . . . . . . . . . . . . 11,200 180,742
Oil, Gas & Consumable Fuels — 1.3%ENEOS Holdings Inc. . . . . . . . . . . . . . . . . . . . . . . . . . . . . . . . . . . . . . . . . 120,400 446,957Idemitsu Kosan Co. Ltd. . . . . . . . . . . . . . . . . . . . . . . . . . . . . . . . . . . . . . . 8,492 218,445Inpex Corp. . . . . . . . . . . . . . . . . . . . . . . . . . . . . . . . . . . . . . . . . . . . . . . . . . . 39,200 320,758
986,160
Security Shares
Value
Paper & Forest Products — 0.2%Oji Holdings Corp. . . . . . . . . . . . . . . . . . . . . . . . . . . . . . . . . . . . . . . . . . . . 30,800 $ 141,724
Personal Products — 0.5%Kao Corp. . . . . . . . . . . . . . . . . . . . . . . . . . . . . . . . . . . . . . . . . . . . . . . . . . . . 6,600 336,676Pola Orbis Holdings Inc. . . . . . . . . . . . . . . . . . . . . . . . . . . . . . . . . . . . . . . 2,800 49,892
386,568Pharmaceuticals — 5.6%Astellas Pharma Inc. . . . . . . . . . . . . . . . . . . . . . . . . . . . . . . . . . . . . . . . . . 72,800 1,141,529Otsuka Holdings Co. Ltd. . . . . . . . . . . . . . . . . . . . . . . . . . . . . . . . . . . . . . 15,100 546,916Santen Pharmaceutical Co. Ltd. . . . . . . . . . . . . . . . . . . . . . . . . . . . . . . 14,000 185,325Shionogi & Co. Ltd. . . . . . . . . . . . . . . . . . . . . . . . . . . . . . . . . . . . . . . . . . . 6,800 474,717Sumitomo Dainippon Pharma Co. Ltd. . . . . . . . . . . . . . . . . . . . . . . . . 8,400 102,375Taisho Pharmaceutical Holdings Co. Ltd. . . . . . . . . . . . . . . . . . . . . . . 1,400 68,828Takeda Pharmaceutical Co. Ltd. . . . . . . . . . . . . . . . . . . . . . . . . . . . . . . 61,600 1,647,982
4,167,672Real Estate Management & Development — 3.9%Daito Trust Construction Co. Ltd. . . . . . . . . . . . . . . . . . . . . . . . . . . . . . 2,800 303,267Daiwa House Industry Co. Ltd.. . . . . . . . . . . . . . . . . . . . . . . . . . . . . . . . 22,400 650,498Hulic Co. Ltd. . . . . . . . . . . . . . . . . . . . . . . . . . . . . . . . . . . . . . . . . . . . . . . . . 8,400 79,468Mitsubishi Estate Co. Ltd. . . . . . . . . . . . . . . . . . . . . . . . . . . . . . . . . . . . . 47,600 654,209Mitsui Fudosan Co. Ltd. . . . . . . . . . . . . . . . . . . . . . . . . . . . . . . . . . . . . . . 36,400 748,210Nomura Real Estate Holdings Inc. . . . . . . . . . . . . . . . . . . . . . . . . . . . . 5,600 121,422Sumitomo Realty & Development Co. Ltd.. . . . . . . . . . . . . . . . . . . . . 11,200 349,350
2,906,424Road & Rail — 3.8%Central Japan Railway Co. . . . . . . . . . . . . . . . . . . . . . . . . . . . . . . . . . . . 5,600 769,863East Japan Railway Co. . . . . . . . . . . . . . . . . . . . . . . . . . . . . . . . . . . . . . . 12,000 735,714Hankyu Hanshin Holdings Inc. . . . . . . . . . . . . . . . . . . . . . . . . . . . . . . . . 8,400 248,882Keio Corp. . . . . . . . . . . . . . . . . . . . . . . . . . . . . . . . . . . . . . . . . . . . . . . . . . . . 2,800 126,580Keisei Electric Railway Co. Ltd. . . . . . . . . . . . . . . . . . . . . . . . . . . . . . . . 2,800 76,602Kintetsu Group Holdings Co. Ltd.(a) . . . . . . . . . . . . . . . . . . . . . . . . . . . 2,800 80,422Nippon Express Co. Ltd. . . . . . . . . . . . . . . . . . . . . . . . . . . . . . . . . . . . . . 2,800 159,404Odakyu Electric Railway Co. Ltd. . . . . . . . . . . . . . . . . . . . . . . . . . . . . . 5,800 111,711Tokyu Corp.. . . . . . . . . . . . . . . . . . . . . . . . . . . . . . . . . . . . . . . . . . . . . . . . . . 11,200 154,805West Japan Railway Co. . . . . . . . . . . . . . . . . . . . . . . . . . . . . . . . . . . . . . 8,600 370,598
2,834,581Semiconductors & Semiconductor Equipment — 0.1%Rohm Co. Ltd. . . . . . . . . . . . . . . . . . . . . . . . . . . . . . . . . . . . . . . . . . . . . . . . 1,100 102,151
Software — 0.2%Trend Micro Inc. . . . . . . . . . . . . . . . . . . . . . . . . . . . . . . . . . . . . . . . . . . . . . 2,800 161,457
Specialty Retail — 0.2%USS Co. Ltd. . . . . . . . . . . . . . . . . . . . . . . . . . . . . . . . . . . . . . . . . . . . . . . . . 8,400 123,232
Technology Hardware, Storage & Peripherals — 2.7%Brother Industries Ltd.. . . . . . . . . . . . . . . . . . . . . . . . . . . . . . . . . . . . . . . . 8,400 144,164Canon Inc.. . . . . . . . . . . . . . . . . . . . . . . . . . . . . . . . . . . . . . . . . . . . . . . . . . . 39,200 862,115FUJIFILM Holdings Corp.. . . . . . . . . . . . . . . . . . . . . . . . . . . . . . . . . . . . . 9,300 731,548Ricoh Co. Ltd. . . . . . . . . . . . . . . . . . . . . . . . . . . . . . . . . . . . . . . . . . . . . . . . 8,400 74,536Seiko Epson Corp. . . . . . . . . . . . . . . . . . . . . . . . . . . . . . . . . . . . . . . . . . . . 11,200 180,583
1,992,946Tobacco — 1.3%Japan Tobacco Inc. . . . . . . . . . . . . . . . . . . . . . . . . . . . . . . . . . . . . . . . . . . 47,600 948,042
Trading Companies & Distributors — 6.1%ITOCHU Corp. . . . . . . . . . . . . . . . . . . . . . . . . . . . . . . . . . . . . . . . . . . . . . . . 22,400 640,598Marubeni Corp. . . . . . . . . . . . . . . . . . . . . . . . . . . . . . . . . . . . . . . . . . . . . . . 61,600 550,850Mitsubishi Corp. . . . . . . . . . . . . . . . . . . . . . . . . . . . . . . . . . . . . . . . . . . . . . 50,400 1,498,616Mitsui & Co. Ltd. . . . . . . . . . . . . . . . . . . . . . . . . . . . . . . . . . . . . . . . . . . . . . 39,200 881,350
Schedule of Investments (unaudited) (continued)
November 30, 2021
iShares� MSCI Japan Value ETF(Percentages shown are based on Net Assets)
123NM0122U-1995964-125/159

Security Shares
Value
Trading Companies & Distributors (continued)Sumitomo Corp. . . . . . . . . . . . . . . . . . . . . . . . . . . . . . . . . . . . . . . . . . . . . . 44,800 $ 609,964Toyota Tsusho Corp. . . . . . . . . . . . . . . . . . . . . . . . . . . . . . . . . . . . . . . . . . 8,400 363,755
4,545,133Wireless Telecommunication Services — 8.1%KDDI Corp. . . . . . . . . . . . . . . . . . . . . . . . . . . . . . . . . . . . . . . . . . . . . . . . . . . 64,400 1,868,576Softbank Corp.. . . . . . . . . . . . . . . . . . . . . . . . . . . . . . . . . . . . . . . . . . . . . . . 114,800 1,580,173SoftBank Group Corp.. . . . . . . . . . . . . . . . . . . . . . . . . . . . . . . . . . . . . . . . 47,800 2,511,987
5,960,736
Total Common Stocks — 98.7%(Cost: $75,665,824). . . . . . . . . . . . . . . . . . . . . . . . . . . . . . . . . . . . . . . . . . . . . . . . . 73,106,563
Short-Term InvestmentsMoney Market Funds — 0.0%BlackRock Cash Funds: Treasury, SL Agency Shares,
0.00%(b)(c) . . . . . . . . . . . . . . . . . . . . . . . . . . . . . . . . . . . . . . . . . . . . . . . . 20,000 20,000
Total Short-Term Investments — 0.0%(Cost: $20,000) . . . . . . . . . . . . . . . . . . . . . . . . . . . . . . . . . . . . . . . . . . . . . . . . . . . . . 20,000
Total Investments in Securities — 98.7%(Cost: $75,685,824). . . . . . . . . . . . . . . . . . . . . . . . . . . . . . . . . . . . . . . . . . . . . . . . . 73,126,563
Other Assets, Less Liabilities — 1.3% . . . . . . . . . . . . . . . . . . . . . . . . . . . . . . . . 955,683
Net Assets — 100.0% . . . . . . . . . . . . . . . . . . . . . . . . . . . . . . . . . . . . . . . . . . . . . . . . . $ 74,082,246
(a) Non-income producing security.(b) Affiliate of the Fund.(c) Annualized 7-day yield as of period end.
Affiliates
Investments in issuers considered to be affiliate(s) of the Fund during the period ended November 30, 2021 for purposes of Section 2(a)(3) of the Investment Company Actof 1940, as amended, were as follows:
Affiliated IssuerValue at
08/31/21Purchases
at CostProceeds
from SalesNet Realized
Gain (Loss)
Change inUnrealized
Appreciation(Depreciation)
Value at11/30/21
SharesHeld at
11/30/21 Income
CapitalGain
Distributionsfrom
UnderlyingFunds
BlackRock Cash Funds: Treasury, SL Agency Shares. . . . . . . . . . $ — $ 20,000(a) $ — $ — $ — $ 20,000 20,000 $ — $ —
(a) Represents net amount purchased (sold).
Derivative Financial Instruments Outstanding as of Period End
Futures Contracts
DescriptionNumber ofContracts
ExpirationDate
NotionalAmount
(000)
Value/Unrealized
Appreciation(Depreciation)
Long ContractsMini TOPIX Index. . . . . . . . . . . . . . . . . . . . . . . . . . . . . . . . . . . . . . . . . . . . . . . . . . . . . . . . . . . . . . . . . . . . . . . . . . . . . . . . . . . . . . . . . . . . . . . . . . . . 56 12/09/21 $ 934 $ (51,748)
Fair Value Measurements
Various inputs are used in determining the fair value of financial instruments. These inputs to valuation techniques are categorized into a fair value hierarchy consisting ofthree broad levels for financial reporting purposes as follows:
• Level 1 – Unadjusted price quotations in active markets/exchanges for identical assets or liabilities that each Fund has the ability to access;
Schedule of Investments (unaudited) (continued)
November 30, 2021
iShares� MSCI Japan Value ETF(Percentages shown are based on Net Assets)
124 NM0122U-1995964-126/159

Fair Value Measurements (continued)
• Level 2 – Other observable inputs (including, but not limited to, quoted prices for similar assets or liabilities in markets that are active, quoted prices for identical orsimilar assets or liabilities in markets that are not active, inputs other than quoted prices that are observable for the assets or liabilities (such as interest rates, yieldcurves, volatilities, prepayment speeds, loss severities, credit risks and default rates) or other market-corroborated inputs); and
• Level 3 – Unobservable inputs based on the best information available in the circumstances, to the extent observable inputs are not available (including the BlackRockGlobal Valuation Methodologies Committee’s (the “Global Valuation Committee’s”) assumptions used in determining the fair value of financial instruments).
The hierarchy gives the highest priority to unadjusted quoted prices in active markets for identical assets or liabilities (Level 1 measurements) and the lowest priority tounobservable inputs (Level 3 measurements). Accordingly, the degree of judgment exercised in determining fair value is greatest for instruments categorized in Level 3. Theinputs used to measure fair value may fall into different levels of the fair value hierarchy. In such cases, for disclosure purposes, the fair value hierarchy classification isdetermined based on the lowest level input that is significant to the fair value measurement in its entirety. Investments classified within Level 3 have significant unobservableinputs used by the Global Valuation Committee in determining the price for Fair Valued Investments. Level 3 investments include equity or debt issued by privately heldcompanies or funds. There may not be a secondary market, and/or there are a limited number of investors. The categorization of a value determined for financial instrumentsis based on the pricing transparency of the financial instruments and is not necessarily an indication of the risks associated with investing in those securities. For informationabout the Fund’s policy regarding valuation of financial instruments, refer to its most recent financial statements.
The following table summarizes the Fund’s financial instruments categorized in the fair value hierarchy. The breakdown of the Fund’s financial instruments into majorcategories is disclosed in the Schedule of Investments above.
Level 1 Level 2 Level 3 Total
InvestmentsAssets
Common Stocks . . . . . . . . . . . . . . . . . . . . . . . . . . . . . . . . . . . . . . . . . . . . . . . . . . . . . . . . . . . . . . . . . . . . . . . . . . . . . . . . . . . . . . . . $ 267,974 $72,838,589 $ — $73,106,563Money Market Funds . . . . . . . . . . . . . . . . . . . . . . . . . . . . . . . . . . . . . . . . . . . . . . . . . . . . . . . . . . . . . . . . . . . . . . . . . . . . . . . . . . . . 20,000 — — 20,000
$ 287,974 $72,838,589 $ — $73,126,563
Derivative financial instruments(a)
LiabilitiesFutures Contracts . . . . . . . . . . . . . . . . . . . . . . . . . . . . . . . . . . . . . . . . . . . . . . . . . . . . . . . . . . . . . . . . . . . . . . . . . . . . . . . . . . . . . . . $ — $ (51,748) $ — $ (51,748)
(a) Derivative financial instruments are futures contracts. Futures contracts are valued at the unrealized appreciation (depreciation) on the instrument.
Schedule of Investments (unaudited) (continued)
November 30, 2021
iShares� MSCI Japan Value ETF
125NM0122U-1995964-127/159

Security Shares
Value
Common StocksAir Freight & Logistics — 4.0%Agility Public Warehousing Co. KSC . . . . . . . . . . . . . . . . . . . . . . . . 246,045 $ 752,919
Airlines — 1.3%Jazeera Airways Co. KSCP(a) . . . . . . . . . . . . . . . . . . . . . . . . . . . . . . . 73,315 247,211
Banks — 58.2%Ahli United Bank BSC . . . . . . . . . . . . . . . . . . . . . . . . . . . . . . . . . . . . . . 1,170,843 1,023,831Ahli United Bank KSCP(a). . . . . . . . . . . . . . . . . . . . . . . . . . . . . . . . . . . 17,009 17,104Al Ahli Bank of Kuwait KSCP(a). . . . . . . . . . . . . . . . . . . . . . . . . . . . . . 396,807 313,510Boubyan Bank KSCP(a). . . . . . . . . . . . . . . . . . . . . . . . . . . . . . . . . . . . . 8,912 22,359Burgan Bank SAK. . . . . . . . . . . . . . . . . . . . . . . . . . . . . . . . . . . . . . . . . . 567,489 405,110Gulf Bank KSCP . . . . . . . . . . . . . . . . . . . . . . . . . . . . . . . . . . . . . . . . . . . 726,705 586,169Kuwait Finance House KSCP . . . . . . . . . . . . . . . . . . . . . . . . . . . . . . . 1,199,215 3,138,062Kuwait International Bank KSCP(a) . . . . . . . . . . . . . . . . . . . . . . . . . . 434,964 294,769Kuwait Projects Holding KSCP. . . . . . . . . . . . . . . . . . . . . . . . . . . . . . 689,148 320,289National Bank of Kuwait SAKP. . . . . . . . . . . . . . . . . . . . . . . . . . . . . . 1,314,101 4,285,251Warba Bank KSCP(a) . . . . . . . . . . . . . . . . . . . . . . . . . . . . . . . . . . . . . . . 487,848 426,352
10,832,806Capital Markets — 3.2%Boursa Kuwait Securities Co. KPSC . . . . . . . . . . . . . . . . . . . . . . . . 55,808 356,433Noor Financial Investment Co. KSC . . . . . . . . . . . . . . . . . . . . . . . . . 236,041 242,983
599,416Chemicals — 2.7%Boubyan Petrochemicals Co. KSCP. . . . . . . . . . . . . . . . . . . . . . . . . 114,642 314,587Qurain Petrochemical Industries Co. . . . . . . . . . . . . . . . . . . . . . . . . 171,857 189,510
504,097Construction & Engineering — 0.5%Combined Group Contracting Co. SAK . . . . . . . . . . . . . . . . . . . . . . 91,335 99,305
Diversified Consumer Services — 2.3%Humansoft Holding Co. KSC. . . . . . . . . . . . . . . . . . . . . . . . . . . . . . . . 40,751 431,085
Diversified Financial Services — 4.2%A'ayan Leasing & Investment Co. KSCP(a). . . . . . . . . . . . . . . . . . . 556,926 271,620Alimtiaz Investment Group KSC(a). . . . . . . . . . . . . . . . . . . . . . . . . . . 763,112 283,724National Investments Co. KSCP . . . . . . . . . . . . . . . . . . . . . . . . . . . . 319,049 231,969
787,313Electrical Equipment — 1.7%Gulf Cable & Electrical Industries Co. KSCP . . . . . . . . . . . . . . . . . 106,229 317,809
Energy Equipment & Services — 1.0%Heavy Engineering & Ship Building Co. KSCP . . . . . . . . . . . . . . . 123,566 187,313
Food Products — 1.2%Mezzan Holding Co. KSCC . . . . . . . . . . . . . . . . . . . . . . . . . . . . . . . . . 109,919 214,387
Security Shares
Value
Independent Power and Renewable Electricity Producers — 1.4%Shamal Az-Zour Al-Oula for the First Phase of Az-Zour Power
Plant KSC. . . . . . . . . . . . . . . . . . . . . . . . . . . . . . . . . . . . . . . . . . . . . . . 340,621 $ 261,516
Industrial Conglomerates — 2.9%National Industries Group Holding SAK(a). . . . . . . . . . . . . . . . . . . . 634,307 534,665
Real Estate Management & Development — 7.8%Kuwait Real Estate Co. KSC(a) . . . . . . . . . . . . . . . . . . . . . . . . . . . . . . 627,151 353,355Mabanee Co. KPSC. . . . . . . . . . . . . . . . . . . . . . . . . . . . . . . . . . . . . . . . 265,371 684,262National Real Estate Co. KPSC(a) . . . . . . . . . . . . . . . . . . . . . . . . . . . 572,664 406,432
1,444,049Trading Companies & Distributors — 2.2%ALAFCO Aviation Lease & Finance Co. KSCP(a) . . . . . . . . . . . . . 273,450 196,015Integrated Holding Co. KCSC(a) . . . . . . . . . . . . . . . . . . . . . . . . . . . . . 166,943 207,145
403,160Wireless Telecommunication Services — 4.0%Mobile Telecommunications Co. KSCP . . . . . . . . . . . . . . . . . . . . . . 398,332 749,711
Total Common Stocks — 98.6%(Cost: $14,575,895). . . . . . . . . . . . . . . . . . . . . . . . . . . . . . . . . . . . . . . . . . . . . . . . . 18,366,762
RightsBanks — 0.2%Warba Bank KSCP, (Expires 12/12/21)(a) . . . . . . . . . . . . . . . . . . . . 131,641 33,509
Total Rights — 0.2%(Cost: $0) . . . . . . . . . . . . . . . . . . . . . . . . . . . . . . . . . . . . . . . . . . . . . . . . . . . . . . . . . . 33,509
Short-Term InvestmentsMoney Market Funds — 0.4%BlackRock Cash Funds: Treasury, SL Agency Shares,
0.00%(b)(c). . . . . . . . . . . . . . . . . . . . . . . . . . . . . . . . . . . . . . . . . . . . . . . 70,000 70,000
Total Short-Term Investments — 0.4%(Cost: $70,000) . . . . . . . . . . . . . . . . . . . . . . . . . . . . . . . . . . . . . . . . . . . . . . . . . . . . . 70,000
Total Investments in Securities — 99.2%(Cost: $14,645,895). . . . . . . . . . . . . . . . . . . . . . . . . . . . . . . . . . . . . . . . . . . . . . . . . 18,470,271
Other Assets, Less Liabilities — 0.8% . . . . . . . . . . . . . . . . . . . . . . . . . . . . . . . . 147,574
Net Assets — 100.0% . . . . . . . . . . . . . . . . . . . . . . . . . . . . . . . . . . . . . . . . . . . . . . . . . $ 18,617,845 (a) Non-income producing security.(b) Affiliate of the Fund.(c) Annualized 7-day yield as of period end.
Schedule of Investments (unaudited)
November 30, 2021
iShares� MSCI Kuwait ETF(Percentages shown are based on Net Assets)
126 NM0122U-1995964-128/159

Affiliates
Investments in issuers considered to be affiliate(s) of the Fund during the period ended November 30, 2021 for purposes of Section 2(a)(3) of the Investment Company Actof 1940, as amended, were as follows:
Affiliated IssuerValue at
08/31/21Purchases
at CostProceeds
from SalesNet Realized
Gain (Loss)
Change inUnrealized
Appreciation(Depreciation)
Value at11/30/21
SharesHeld at
11/30/21 Income
CapitalGain
Distributionsfrom
UnderlyingFunds
BlackRock Cash Funds: Treasury, SL Agency Shares. . . . . . . . . . $ 10,000 $ 60,000(a) $ — $ — $ — $ 70,000 70,000 $ — $ —
(a) Represents net amount purchased (sold).
Fair Value Measurements
Various inputs are used in determining the fair value of financial instruments. These inputs to valuation techniques are categorized into a fair value hierarchy consisting ofthree broad levels for financial reporting purposes as follows:
• Level 1 – Unadjusted price quotations in active markets/exchanges for identical assets or liabilities that each Fund has the ability to access;• Level 2 – Other observable inputs (including, but not limited to, quoted prices for similar assets or liabilities in markets that are active, quoted prices for identical or
similar assets or liabilities in markets that are not active, inputs other than quoted prices that are observable for the assets or liabilities (such as interest rates, yieldcurves, volatilities, prepayment speeds, loss severities, credit risks and default rates) or other market-corroborated inputs); and
• Level 3 – Unobservable inputs based on the best information available in the circumstances, to the extent observable inputs are not available (including the BlackRockGlobal Valuation Methodologies Committee’s (the “Global Valuation Committee’s”) assumptions used in determining the fair value of financial instruments).
The hierarchy gives the highest priority to unadjusted quoted prices in active markets for identical assets or liabilities (Level 1 measurements) and the lowest priority tounobservable inputs (Level 3 measurements). Accordingly, the degree of judgment exercised in determining fair value is greatest for instruments categorized in Level 3. Theinputs used to measure fair value may fall into different levels of the fair value hierarchy. In such cases, for disclosure purposes, the fair value hierarchy classification isdetermined based on the lowest level input that is significant to the fair value measurement in its entirety. Investments classified within Level 3 have significant unobservableinputs used by the Global Valuation Committee in determining the price for Fair Valued Investments. Level 3 investments include equity or debt issued by privately heldcompanies or funds. There may not be a secondary market, and/or there are a limited number of investors. The categorization of a value determined for financial instrumentsis based on the pricing transparency of the financial instruments and is not necessarily an indication of the risks associated with investing in those securities. For informationabout the Fund’s policy regarding valuation of financial instruments, refer to its most recent financial statements.
The following table summarizes the Fund’s financial instruments categorized in the fair value hierarchy. The breakdown of the Fund’s financial instruments into majorcategories is disclosed in the Schedule of Investments above.
Level 1 Level 2 Level 3 Total
InvestmentsAssets
Common Stocks . . . . . . . . . . . . . . . . . . . . . . . . . . . . . . . . . . . . . . . . . . . . . . . . . . . . . . . . . . . . . . . . . . . . . . . . . . . . . . . . . . . . . . . . $ 3,445,635 $14,921,127 $ — $18,366,762Rights . . . . . . . . . . . . . . . . . . . . . . . . . . . . . . . . . . . . . . . . . . . . . . . . . . . . . . . . . . . . . . . . . . . . . . . . . . . . . . . . . . . . . . . . . . . . . . . . . . 33,509 — — 33,509Money Market Funds . . . . . . . . . . . . . . . . . . . . . . . . . . . . . . . . . . . . . . . . . . . . . . . . . . . . . . . . . . . . . . . . . . . . . . . . . . . . . . . . . . . . 70,000 — — 70,000
$ 3,549,144 $14,921,127 $ — $18,470,271
Schedule of Investments (unaudited) (continued)
November 30, 2021
iShares� MSCI Kuwait ETF
127NM0122U-1995964-129/159

Security Shares
Value
Common StocksAirlines — 1.2%Air New Zealand Ltd.(a)(b) . . . . . . . . . . . . . . . . . . . . . . . . . . . . . . . . . . 1,603,959 $ 1,653,065
Building Products — 4.4%Fletcher Building Ltd.. . . . . . . . . . . . . . . . . . . . . . . . . . . . . . . . . . . . . . 1,292,715 5,950,363
Diversified Telecommunication Services — 12.6%Chorus Ltd. . . . . . . . . . . . . . . . . . . . . . . . . . . . . . . . . . . . . . . . . . . . . . . . 1,020,720 4,660,532Spark New Zealand Ltd.. . . . . . . . . . . . . . . . . . . . . . . . . . . . . . . . . . . 3,955,987 12,372,641
17,033,173Electric Utilities — 15.2%Contact Energy Ltd. . . . . . . . . . . . . . . . . . . . . . . . . . . . . . . . . . . . . . . . 1,112,859 5,926,187Genesis Energy Ltd. . . . . . . . . . . . . . . . . . . . . . . . . . . . . . . . . . . . . . . 1,285,728 2,562,328Infratil Ltd. . . . . . . . . . . . . . . . . . . . . . . . . . . . . . . . . . . . . . . . . . . . . . . . . 1,121,751 6,015,576Mercury NZ Ltd. . . . . . . . . . . . . . . . . . . . . . . . . . . . . . . . . . . . . . . . . . . 1,500,106 6,130,117
20,634,208Equity Real Estate Investment Trusts (REITs) — 9.4%Argosy Property Ltd. . . . . . . . . . . . . . . . . . . . . . . . . . . . . . . . . . . . . . . 2,208,088 2,219,653Goodman Property Trust . . . . . . . . . . . . . . . . . . . . . . . . . . . . . . . . . . 2,574,619 4,315,316Kiwi Property Group Ltd. . . . . . . . . . . . . . . . . . . . . . . . . . . . . . . . . . . 3,790,320 2,982,583Precinct Properties New Zealand Ltd. . . . . . . . . . . . . . . . . . . . . . . 2,996,663 3,174,295
12,691,847Food Products — 5.0%a2 Milk Co. Ltd. (The)(a)(b) . . . . . . . . . . . . . . . . . . . . . . . . . . . . . . . . . 1,413,015 5,890,854Synlait Milk Ltd.(a) . . . . . . . . . . . . . . . . . . . . . . . . . . . . . . . . . . . . . . . . . 407,405 889,773
6,780,627Health Care Equipment & Supplies — 20.0%Fisher & Paykel Healthcare Corp. Ltd. . . . . . . . . . . . . . . . . . . . . . 1,197,170 27,086,634
Health Care Providers & Services — 8.6%Oceania Healthcare Ltd.. . . . . . . . . . . . . . . . . . . . . . . . . . . . . . . . . . . 1,948,518 1,738,872Ryman Healthcare Ltd. . . . . . . . . . . . . . . . . . . . . . . . . . . . . . . . . . . . . 656,302 5,485,350Summerset Group Holdings Ltd. . . . . . . . . . . . . . . . . . . . . . . . . . . . 503,739 4,354,168
11,578,390Hotels, Restaurants & Leisure — 2.7%SKYCITY Entertainment Group Ltd.. . . . . . . . . . . . . . . . . . . . . . . . 1,768,791 3,616,226
Security Shares
Value
Independent Power and Renewable Electricity Producers — 6.5%Meridian Energy Ltd. . . . . . . . . . . . . . . . . . . . . . . . . . . . . . . . . . . . . . . 2,753,288 $ 8,854,277
IT Services — 1.7%Pushpay Holdings Ltd.(a) . . . . . . . . . . . . . . . . . . . . . . . . . . . . . . . . . . 2,419,583 2,227,072
Oil, Gas & Consumable Fuels — 2.3%Z Energy Ltd. . . . . . . . . . . . . . . . . . . . . . . . . . . . . . . . . . . . . . . . . . . . . . 1,289,541 3,071,591
Transportation Infrastructure — 10.4%Auckland International Airport Ltd.(a) . . . . . . . . . . . . . . . . . . . . . . . 2,636,080 14,139,109
Total Common Stocks — 100.0%(Cost: $145,363,554) . . . . . . . . . . . . . . . . . . . . . . . . . . . . . . . . . . . . . . . . . . . . . . 135,316,582
Short-Term InvestmentsMoney Market Funds — 4.0%BlackRock Cash Funds: Institutional, SL Agency Shares,
0.06%(c)(d)(e) . . . . . . . . . . . . . . . . . . . . . . . . . . . . . . . . . . . . . . . . . . . 5,405,764 5,407,927BlackRock Cash Funds: Treasury, SL Agency Shares,
0.00%(c)(d) . . . . . . . . . . . . . . . . . . . . . . . . . . . . . . . . . . . . . . . . . . . . . 60,000 60,000
5,467,927
Total Short-Term Investments — 4.0%(Cost: $5,468,161). . . . . . . . . . . . . . . . . . . . . . . . . . . . . . . . . . . . . . . . . . . . . . . . . 5,467,927
Total Investments in Securities — 104.0%(Cost: $150,831,715) . . . . . . . . . . . . . . . . . . . . . . . . . . . . . . . . . . . . . . . . . . . . . . 140,784,509
Other Assets, Less Liabilities — (4.0)%. . . . . . . . . . . . . . . . . . . . . . . . . . . . . . (5,395,122)
Net Assets — 100.0% . . . . . . . . . . . . . . . . . . . . . . . . . . . . . . . . . . . . . . . . . . . . . . . . $ 135,389,387 (a) Non-income producing security.(b) All or a portion of this security is on loan.(c) Affiliate of the Fund.(d) Annualized 7-day yield as of period end.(e) All or a portion of this security was purchased with the cash collateral from loaned
securities.
Affiliates
Investments in issuers considered to be affiliate(s) of the Fund during the period ended November 30, 2021 for purposes of Section 2(a)(3) of the Investment Company Actof 1940, as amended, were as follows:
Affiliated IssuerValue at
08/31/21Purchases
at CostProceeds
from SalesNet Realized
Gain (Loss)
Change inUnrealized
Appreciation(Depreciation)
Value at11/30/21
SharesHeld at
11/30/21 Income
CapitalGain
Distributionsfrom
UnderlyingFunds
BlackRock Cash Funds: Institutional, SL AgencyShares. . . . . . . . . . . . . . . . . . . . . . . . . . . . . . . . . . . . . . . . $6,794,552 $ — $(1,386,084)(a) $ (307) $ (234) $5,407,927 5,405,764 $17,353(b) $ —
BlackRock Cash Funds: Treasury, SL AgencyShares. . . . . . . . . . . . . . . . . . . . . . . . . . . . . . . . . . . . . . . . 50,000 10,000(a)
— — — 60,000 60,000 1 —
$ (307) $ (234) $5,467,927 $17,354 $ —
(a) Represents net amount purchased (sold).(b) All or a portion represents securities lending income earned from the reinvestment of cash collateral from loaned securities, net of fees and collateral investment expenses, and other
payments to and from borrowers of securities.
Schedule of Investments (unaudited)
November 30, 2021
iShares� MSCI New Zealand ETF(Percentages shown are based on Net Assets)
128 NM0122U-1995964-130/159

Derivative Financial Instruments Outstanding as of Period End
Futures Contracts
DescriptionNumber ofContracts
ExpirationDate
NotionalAmount
(000)
Value/Unrealized
Appreciation(Depreciation)
Long ContractsSPI 200 Index . . . . . . . . . . . . . . . . . . . . . . . . . . . . . . . . . . . . . . . . . . . . . . . . . . . . . . . . . . . . . . . . . . . . . . . . . . . . . . . . . . . . . . . . . . . . . . . . . . . . . . . 1 12/16/21 $ 128 $ (3,819)
Fair Value Measurements
Various inputs are used in determining the fair value of financial instruments. These inputs to valuation techniques are categorized into a fair value hierarchy consisting ofthree broad levels for financial reporting purposes as follows:
• Level 1 – Unadjusted price quotations in active markets/exchanges for identical assets or liabilities that each Fund has the ability to access;• Level 2 – Other observable inputs (including, but not limited to, quoted prices for similar assets or liabilities in markets that are active, quoted prices for identical or
similar assets or liabilities in markets that are not active, inputs other than quoted prices that are observable for the assets or liabilities (such as interest rates, yieldcurves, volatilities, prepayment speeds, loss severities, credit risks and default rates) or other market-corroborated inputs); and
• Level 3 – Unobservable inputs based on the best information available in the circumstances, to the extent observable inputs are not available (including the BlackRockGlobal Valuation Methodologies Committee’s (the “Global Valuation Committee’s”) assumptions used in determining the fair value of financial instruments).
The hierarchy gives the highest priority to unadjusted quoted prices in active markets for identical assets or liabilities (Level 1 measurements) and the lowest priority tounobservable inputs (Level 3 measurements). Accordingly, the degree of judgment exercised in determining fair value is greatest for instruments categorized in Level 3. Theinputs used to measure fair value may fall into different levels of the fair value hierarchy. In such cases, for disclosure purposes, the fair value hierarchy classification isdetermined based on the lowest level input that is significant to the fair value measurement in its entirety. Investments classified within Level 3 have significant unobservableinputs used by the Global Valuation Committee in determining the price for Fair Valued Investments. Level 3 investments include equity or debt issued by privately heldcompanies or funds. There may not be a secondary market, and/or there are a limited number of investors. The categorization of a value determined for financial instrumentsis based on the pricing transparency of the financial instruments and is not necessarily an indication of the risks associated with investing in those securities. For informationabout the Fund’s policy regarding valuation of financial instruments, refer to its most recent financial statements.
The following table summarizes the Fund’s financial instruments categorized in the fair value hierarchy. The breakdown of the Fund’s financial instruments into majorcategories is disclosed in the Schedule of Investments above.
Level 1 Level 2 Level 3 Total
InvestmentsAssets
Common Stocks. . . . . . . . . . . . . . . . . . . . . . . . . . . . . . . . . . . . . . . . . . . . . . . . . . . . . . . . . . . . . . . . . . . . . . . . . . . . . . . . . . . . $ 11,184,224 $124,132,358 $ — $135,316,582Money Market Funds . . . . . . . . . . . . . . . . . . . . . . . . . . . . . . . . . . . . . . . . . . . . . . . . . . . . . . . . . . . . . . . . . . . . . . . . . . . . . . . 5,467,927 — — 5,467,927
$ 16,652,151 $124,132,358 $ — $140,784,509
Derivative financial instruments(a)
LiabilitiesFutures Contracts . . . . . . . . . . . . . . . . . . . . . . . . . . . . . . . . . . . . . . . . . . . . . . . . . . . . . . . . . . . . . . . . . . . . . . . . . . . . . . . . . . $ — $ (3,819) $ — $ (3,819)
(a) Derivative financial instruments are futures contracts. Futures contracts are valued at the unrealized appreciation (depreciation) on the instrument.
Schedule of Investments (unaudited) (continued)
November 30, 2021
iShares� MSCI New Zealand ETF
129NM0122U-1995964-131/159

Security Shares
Value
Common StocksAerospace & Defense — 1.4%Kongsberg Gruppen ASA. . . . . . . . . . . . . . . . . . . . . . . . . . . . . . . . . . . . . 27,923 $ 819,773
Airlines — 0.3%Norwegian Air Shuttle ASA . . . . . . . . . . . . . . . . . . . . . . . . . . . . . . . . . . . 188,233 188,555
Banks — 14.3%DNB Bank ASA . . . . . . . . . . . . . . . . . . . . . . . . . . . . . . . . . . . . . . . . . . . . . . 290,490 6,339,925Sbanken ASA(a). . . . . . . . . . . . . . . . . . . . . . . . . . . . . . . . . . . . . . . . . . . . . . 1,558 16,278SpareBank 1 Nord Norge. . . . . . . . . . . . . . . . . . . . . . . . . . . . . . . . . . . . . 29,786 338,546Sparebank 1 Oestlandet. . . . . . . . . . . . . . . . . . . . . . . . . . . . . . . . . . . . . . 12,662 204,114SpareBank 1 SMN . . . . . . . . . . . . . . . . . . . . . . . . . . . . . . . . . . . . . . . . . . . 40,547 617,711SpareBank 1 SR-Bank ASA . . . . . . . . . . . . . . . . . . . . . . . . . . . . . . . . . . 55,908 772,562
8,289,136Biotechnology — 0.6%Vaccibody AS . . . . . . . . . . . . . . . . . . . . . . . . . . . . . . . . . . . . . . . . . . . . . . . . 40,267 356,166
Chemicals — 6.1%Borregaard ASA . . . . . . . . . . . . . . . . . . . . . . . . . . . . . . . . . . . . . . . . . . . . . 29,668 704,944Elkem ASA(a) . . . . . . . . . . . . . . . . . . . . . . . . . . . . . . . . . . . . . . . . . . . . . . . . 89,860 288,732Yara International ASA . . . . . . . . . . . . . . . . . . . . . . . . . . . . . . . . . . . . . . . 51,705 2,538,212
3,531,888Commercial Services & Supplies — 5.1%Aker Carbon Capture ASA. . . . . . . . . . . . . . . . . . . . . . . . . . . . . . . . . . . . 84,912 284,229Quantafuel ASA(b). . . . . . . . . . . . . . . . . . . . . . . . . . . . . . . . . . . . . . . . . . . . 34,024 111,356Tomra Systems ASA . . . . . . . . . . . . . . . . . . . . . . . . . . . . . . . . . . . . . . . . . 36,981 2,535,428
2,931,013Construction & Engineering — 0.8%Veidekke ASA . . . . . . . . . . . . . . . . . . . . . . . . . . . . . . . . . . . . . . . . . . . . . . . 33,716 483,939
Containers & Packaging — 0.2%Elopak ASA, NVS . . . . . . . . . . . . . . . . . . . . . . . . . . . . . . . . . . . . . . . . . . . . 37,834 109,408
Diversified Financial Services — 1.3%Aker ASA, Class A . . . . . . . . . . . . . . . . . . . . . . . . . . . . . . . . . . . . . . . . . . . 8,124 735,955
Diversified Telecommunication Services — 5.6%Telenor ASA . . . . . . . . . . . . . . . . . . . . . . . . . . . . . . . . . . . . . . . . . . . . . . . . . 218,514 3,228,818
Electric Utilities — 0.3%Fjordkraft Holding ASA(a) . . . . . . . . . . . . . . . . . . . . . . . . . . . . . . . . . . . . . 30,341 144,466
Electrical Equipment — 1.6%NEL ASA(b) . . . . . . . . . . . . . . . . . . . . . . . . . . . . . . . . . . . . . . . . . . . . . . . . . . 456,120 941,315
Energy Equipment & Services — 2.0%Aker Solutions ASA . . . . . . . . . . . . . . . . . . . . . . . . . . . . . . . . . . . . . . . . . . 76,848 202,525BW Offshore Ltd. . . . . . . . . . . . . . . . . . . . . . . . . . . . . . . . . . . . . . . . . . . . . 23,792 67,212Ocean Yield ASA. . . . . . . . . . . . . . . . . . . . . . . . . . . . . . . . . . . . . . . . . . . . . 15,325 69,605Subsea 7 SA . . . . . . . . . . . . . . . . . . . . . . . . . . . . . . . . . . . . . . . . . . . . . . . . 70,265 489,850TGS ASA . . . . . . . . . . . . . . . . . . . . . . . . . . . . . . . . . . . . . . . . . . . . . . . . . . . . 37,201 343,460
1,172,652Entertainment — 0.8%Kahoot! ASA. . . . . . . . . . . . . . . . . . . . . . . . . . . . . . . . . . . . . . . . . . . . . . . . . 81,187 454,335
Food Products — 15.4%Atlantic Sapphire ASA(b)(c) . . . . . . . . . . . . . . . . . . . . . . . . . . . . . . . . . . . . 22,739 108,638Austevoll Seafood ASA. . . . . . . . . . . . . . . . . . . . . . . . . . . . . . . . . . . . . . . 28,489 310,353Bakkafrost P/F . . . . . . . . . . . . . . . . . . . . . . . . . . . . . . . . . . . . . . . . . . . . . . . 15,701 1,031,171Grieg Seafood ASA(c) . . . . . . . . . . . . . . . . . . . . . . . . . . . . . . . . . . . . . . . . 15,944 141,026Leroy Seafood Group ASA . . . . . . . . . . . . . . . . . . . . . . . . . . . . . . . . . . . 93,026 655,270Mowi ASA . . . . . . . . . . . . . . . . . . . . . . . . . . . . . . . . . . . . . . . . . . . . . . . . . . . 143,958 3,273,173
Security Shares
Value
Food Products (continued)Norway Royal Salmon ASA. . . . . . . . . . . . . . . . . . . . . . . . . . . . . . . . . . . 3,744 $ 67,431Orkla ASA . . . . . . . . . . . . . . . . . . . . . . . . . . . . . . . . . . . . . . . . . . . . . . . . . . . 234,548 2,143,954Salmar ASA . . . . . . . . . . . . . . . . . . . . . . . . . . . . . . . . . . . . . . . . . . . . . . . . . 18,395 1,162,336
8,893,352Independent Power and Renewable Electricity Producers — 1.4%Aker Horizons Holding ASA(b). . . . . . . . . . . . . . . . . . . . . . . . . . . . . . . . . 36,273 134,726Scatec ASA(a). . . . . . . . . . . . . . . . . . . . . . . . . . . . . . . . . . . . . . . . . . . . . . . . 37,209 653,984
788,710Industrial Conglomerates — 0.3%Bonheur ASA . . . . . . . . . . . . . . . . . . . . . . . . . . . . . . . . . . . . . . . . . . . . . . . . 5,978 190,354
Insurance — 5.1%Gjensidige Forsikring ASA. . . . . . . . . . . . . . . . . . . . . . . . . . . . . . . . . . . . 62,457 1,414,805Protector Forsikring ASA . . . . . . . . . . . . . . . . . . . . . . . . . . . . . . . . . . . . . 18,036 203,784Storebrand ASA . . . . . . . . . . . . . . . . . . . . . . . . . . . . . . . . . . . . . . . . . . . . . 146,090 1,342,230
2,960,819Interactive Media & Services — 2.0%Adevinta ASA(c) . . . . . . . . . . . . . . . . . . . . . . . . . . . . . . . . . . . . . . . . . . . . . . 80,212 1,143,124
IT Services — 0.8%Atea ASA . . . . . . . . . . . . . . . . . . . . . . . . . . . . . . . . . . . . . . . . . . . . . . . . . . . . 26,263 474,808
Machinery — 0.3%Hexagon Composites ASA . . . . . . . . . . . . . . . . . . . . . . . . . . . . . . . . . . . 34,947 140,665Hexagon Purus ASA(b) . . . . . . . . . . . . . . . . . . . . . . . . . . . . . . . . . . . . . . . 17,556 55,196
195,861Marine — 1.5%Golden Ocean Group Ltd. . . . . . . . . . . . . . . . . . . . . . . . . . . . . . . . . . . . . 40,681 378,024MPC Container Ships AS, NVS . . . . . . . . . . . . . . . . . . . . . . . . . . . . . . . 83,202 197,781Stolt-Nielsen Ltd.. . . . . . . . . . . . . . . . . . . . . . . . . . . . . . . . . . . . . . . . . . . . . 8,012 112,954Wallenius Wilhelmsen ASA . . . . . . . . . . . . . . . . . . . . . . . . . . . . . . . . . . . 33,033 152,518
841,277Media — 3.8%Schibsted ASA, Class A . . . . . . . . . . . . . . . . . . . . . . . . . . . . . . . . . . . . . . 22,837 1,017,555Schibsted ASA, Class B . . . . . . . . . . . . . . . . . . . . . . . . . . . . . . . . . . . . . . 30,402 1,174,459
2,192,014Metals & Mining — 4.9%Norsk Hydro ASA . . . . . . . . . . . . . . . . . . . . . . . . . . . . . . . . . . . . . . . . . . . . 440,457 2,852,437
Multiline Retail — 0.6%Europris ASA(a) . . . . . . . . . . . . . . . . . . . . . . . . . . . . . . . . . . . . . . . . . . . . . . 49,535 342,022
Oil, Gas & Consumable Fuels — 16.8%Aker BP ASA . . . . . . . . . . . . . . . . . . . . . . . . . . . . . . . . . . . . . . . . . . . . . . . . 39,360 1,246,353BW Energy Ltd.(c) . . . . . . . . . . . . . . . . . . . . . . . . . . . . . . . . . . . . . . . . . . . . 24,171 55,770BW LPG Ltd.(a) . . . . . . . . . . . . . . . . . . . . . . . . . . . . . . . . . . . . . . . . . . . . . . 24,380 122,982DNO ASA(c). . . . . . . . . . . . . . . . . . . . . . . . . . . . . . . . . . . . . . . . . . . . . . . . . . 137,075 158,694Equinor ASA. . . . . . . . . . . . . . . . . . . . . . . . . . . . . . . . . . . . . . . . . . . . . . . . . 305,196 7,636,294Flex LNG Ltd.. . . . . . . . . . . . . . . . . . . . . . . . . . . . . . . . . . . . . . . . . . . . . . . . 9,295 219,926Frontline Ltd./Bermuda . . . . . . . . . . . . . . . . . . . . . . . . . . . . . . . . . . . . . . . 32,374 217,529Hafnia Ltd.. . . . . . . . . . . . . . . . . . . . . . . . . . . . . . . . . . . . . . . . . . . . . . . . . . . 28,905 50,047
9,707,595Professional Services — 0.2%Meltwater Holding BV . . . . . . . . . . . . . . . . . . . . . . . . . . . . . . . . . . . . . . . . 41,554 118,153
Real Estate Management & Development — 1.6%Entra ASA(a) . . . . . . . . . . . . . . . . . . . . . . . . . . . . . . . . . . . . . . . . . . . . . . . . . 36,971 830,611Selvaag Bolig ASA . . . . . . . . . . . . . . . . . . . . . . . . . . . . . . . . . . . . . . . . . . . 13,177 67,819
898,430
Schedule of Investments (unaudited)
November 30, 2021
iShares� MSCI Norway ETF(Percentages shown are based on Net Assets)
130 NM0122U-1995964-132/159

Security Shares
Value
Semiconductors & Semiconductor Equipment — 3.5%Nordic Semiconductor ASA . . . . . . . . . . . . . . . . . . . . . . . . . . . . . . . . . . . 54,183 $ 1,802,714REC Silicon ASA. . . . . . . . . . . . . . . . . . . . . . . . . . . . . . . . . . . . . . . . . . . . . 93,039 222,053
2,024,767Software — 1.2%Crayon Group Holding ASA(a). . . . . . . . . . . . . . . . . . . . . . . . . . . . . . . . . 17,048 352,475LINK Mobility Group Holding ASA. . . . . . . . . . . . . . . . . . . . . . . . . . . . . 54,770 124,052Pexip Holding ASA . . . . . . . . . . . . . . . . . . . . . . . . . . . . . . . . . . . . . . . . . . . 22,830 98,392Volue ASA . . . . . . . . . . . . . . . . . . . . . . . . . . . . . . . . . . . . . . . . . . . . . . . . . . . 15,694 105,152
680,071Specialty Retail — 0.1%XXL ASA . . . . . . . . . . . . . . . . . . . . . . . . . . . . . . . . . . . . . . . . . . . . . . . . . . . . 43,358 69,319
Total Common Stocks — 99.9%(Cost: $57,359,929). . . . . . . . . . . . . . . . . . . . . . . . . . . . . . . . . . . . . . . . . . . . . . . . . 57,760,532
Short-Term InvestmentsMoney Market Funds — 1.6%BlackRock Cash Funds: Institutional, SL Agency Shares,
0.06%(d)(e)(f) . . . . . . . . . . . . . . . . . . . . . . . . . . . . . . . . . . . . . . . . . . . . . . . 925,959 926,329BlackRock Cash Funds: Treasury, SL Agency Shares,
0.00%(d)(e) . . . . . . . . . . . . . . . . . . . . . . . . . . . . . . . . . . . . . . . . . . . . . . . . 20,000 20,000
946,329
Total Short-Term Investments — 1.6%(Cost: $946,398). . . . . . . . . . . . . . . . . . . . . . . . . . . . . . . . . . . . . . . . . . . . . . . . . . . . 946,329
Total Investments in Securities — 101.5%(Cost: $58,306,327). . . . . . . . . . . . . . . . . . . . . . . . . . . . . . . . . . . . . . . . . . . . . . . . . 58,706,861
Other Assets, Less Liabilities — (1.5)% . . . . . . . . . . . . . . . . . . . . . . . . . . . . . . . (880,138)
Net Assets — 100.0% . . . . . . . . . . . . . . . . . . . . . . . . . . . . . . . . . . . . . . . . . . . . . . . . . $ 57,826,723
(a) Security exempt from registration pursuant to Rule 144A under the Securities Act of1933, as amended. These securities may be resold in transactions exempt fromregistration to qualified institutional investors.
(b) All or a portion of this security is on loan.(c) Non-income producing security.(d) Affiliate of the Fund.(e) Annualized 7-day yield as of period end.(f) All or a portion of this security was purchased with the cash collateral from loaned
securities.
Affiliates
Investments in issuers considered to be affiliate(s) of the Fund during the period ended November 30, 2021 for purposes of Section 2(a)(3) of the Investment Company Actof 1940, as amended, were as follows:
Affiliated IssuerValue at
08/31/21Purchases
at CostProceeds
from SalesNet Realized
Gain (Loss)
Change inUnrealized
Appreciation(Depreciation)
Value at11/30/21
SharesHeld at
11/30/21 Income
CapitalGain
Distributionsfrom
UnderlyingFunds
BlackRock Cash Funds: Institutional, SL Agency Shares. . . . $775,553 $150,880(a) $ — $ (35) $ (69) $926,329 925,959 $ 3,763(b) $ —BlackRock Cash Funds: Treasury, SL Agency Shares . . . . . . 20,000 0(a)
— — — 20,000 20,000 1 —
$ (35) $ (69) $946,329 $ 3,764 $ —
(a) Represents net amount purchased (sold).(b) All or a portion represents securities lending income earned from the reinvestment of cash collateral from loaned securities, net of fees and collateral investment expenses, and other
payments to and from borrowers of securities.
Fair Value Measurements
Various inputs are used in determining the fair value of financial instruments. These inputs to valuation techniques are categorized into a fair value hierarchy consisting ofthree broad levels for financial reporting purposes as follows:
• Level 1 – Unadjusted price quotations in active markets/exchanges for identical assets or liabilities that each Fund has the ability to access;• Level 2 – Other observable inputs (including, but not limited to, quoted prices for similar assets or liabilities in markets that are active, quoted prices for identical or
similar assets or liabilities in markets that are not active, inputs other than quoted prices that are observable for the assets or liabilities (such as interest rates, yieldcurves, volatilities, prepayment speeds, loss severities, credit risks and default rates) or other market-corroborated inputs); and
Schedule of Investments (unaudited) (continued)
November 30, 2021
iShares� MSCI Norway ETF(Percentages shown are based on Net Assets)
131NM0122U-1995964-133/159

Fair Value Measurements (continued)
• Level 3 – Unobservable inputs based on the best information available in the circumstances, to the extent observable inputs are not available (including the BlackRockGlobal Valuation Methodologies Committee’s (the “Global Valuation Committee’s”) assumptions used in determining the fair value of financial instruments).
The hierarchy gives the highest priority to unadjusted quoted prices in active markets for identical assets or liabilities (Level 1 measurements) and the lowest priority tounobservable inputs (Level 3 measurements). Accordingly, the degree of judgment exercised in determining fair value is greatest for instruments categorized in Level 3. Theinputs used to measure fair value may fall into different levels of the fair value hierarchy. In such cases, for disclosure purposes, the fair value hierarchy classification isdetermined based on the lowest level input that is significant to the fair value measurement in its entirety. Investments classified within Level 3 have significant unobservableinputs used by the Global Valuation Committee in determining the price for Fair Valued Investments. Level 3 investments include equity or debt issued by privately heldcompanies or funds. There may not be a secondary market, and/or there are a limited number of investors. The categorization of a value determined for financial instrumentsis based on the pricing transparency of the financial instruments and is not necessarily an indication of the risks associated with investing in those securities. For informationabout the Fund’s policy regarding valuation of financial instruments, refer to its most recent financial statements.
The following table summarizes the Fund’s financial instruments categorized in the fair value hierarchy. The breakdown of the Fund’s financial instruments into majorcategories is disclosed in the Schedule of Investments above.
Level 1 Level 2 Level 3 Total
InvestmentsAssets
Common Stocks . . . . . . . . . . . . . . . . . . . . . . . . . . . . . . . . . . . . . . . . . . . . . . . . . . . . . . . . . . . . . . . . . . . . . . . . . . . . . . . . . . . . . . . . $ 6,080,512 $51,680,020 $ — $57,760,532Money Market Funds . . . . . . . . . . . . . . . . . . . . . . . . . . . . . . . . . . . . . . . . . . . . . . . . . . . . . . . . . . . . . . . . . . . . . . . . . . . . . . . . . . . . 946,329 — — 946,329
$ 7,026,841 $51,680,020 $ — $58,706,861
Portfolio Abbreviations - Equity
NVS . . . . . . . . . . . . . Non-Voting Shares
Schedule of Investments (unaudited) (continued)
November 30, 2021
iShares� MSCI Norway ETF
132 NM0122U-1995964-134/159

Security Shares
Value
Common StocksBanks — 27.2%Banco BBVA Peru SA . . . . . . . . . . . . . . . . . . . . . . . . . . . . . . . . . . . . 6,423,921 $ 3,095,485Banco de Credito del Peru, Class C . . . . . . . . . . . . . . . . . . . . . . 45,000 30,977Credicorp Ltd. . . . . . . . . . . . . . . . . . . . . . . . . . . . . . . . . . . . . . . . . . . . 266,258 31,418,444Intercorp Financial Services Inc. . . . . . . . . . . . . . . . . . . . . . . . . . . 103,504 3,001,616
37,546,522Construction & Engineering — 1.8%Aenza SAA(a) . . . . . . . . . . . . . . . . . . . . . . . . . . . . . . . . . . . . . . . . . . . . 7,992,840 2,554,565
Construction Materials — 5.5%Cementos Pacasmayo SAA . . . . . . . . . . . . . . . . . . . . . . . . . . . . . . 2,380,420 3,019,783Union Andina de Cementos SAA . . . . . . . . . . . . . . . . . . . . . . . . . 9,826,283 4,590,028
7,609,811Food & Staples Retailing — 3.0%InRetail Peru Corp.(b) . . . . . . . . . . . . . . . . . . . . . . . . . . . . . . . . . . . . 117,679 4,150,538
Food Products — 5.2%Alicorp SAA . . . . . . . . . . . . . . . . . . . . . . . . . . . . . . . . . . . . . . . . . . . . . 4,036,529 5,974,162Casa Grande SAA . . . . . . . . . . . . . . . . . . . . . . . . . . . . . . . . . . . . . . . 653,034 1,221,780
7,195,942Metals & Mining — 47.6%Cia. de Minas Buenaventura SAA, ADR(a). . . . . . . . . . . . . . . . . 885,300 6,471,543Corp. Aceros Arequipa SA, NVS . . . . . . . . . . . . . . . . . . . . . . . . . . 3,577,890 1,592,128Fortuna Silver Mines Inc.(a) . . . . . . . . . . . . . . . . . . . . . . . . . . . . . . . 614,319 2,139,982Hochschild Mining PLC . . . . . . . . . . . . . . . . . . . . . . . . . . . . . . . . . . 2,570,149 4,505,147MMG Ltd.(a) . . . . . . . . . . . . . . . . . . . . . . . . . . . . . . . . . . . . . . . . . . . . . 7,772,000 2,814,832Pan American Silver Corp. . . . . . . . . . . . . . . . . . . . . . . . . . . . . . . . 125,491 3,205,426Sociedad Minera Cerro Verde SAA . . . . . . . . . . . . . . . . . . . . . . . 193,770 6,202,578Southern Copper Corp. . . . . . . . . . . . . . . . . . . . . . . . . . . . . . . . . . . 539,828 31,579,938Volcan Cia. Minera SAA, Class B, NVS(a) . . . . . . . . . . . . . . . . . 27,318,393 3,895,432Wheaton Precious Metals Corp. . . . . . . . . . . . . . . . . . . . . . . . . . . 81,197 3,395,470
65,802,476
Security Shares
Value
Multiline Retail — 2.0%Falabella SA. . . . . . . . . . . . . . . . . . . . . . . . . . . . . . . . . . . . . . . . . . . . . 908,461 $ 2,810,890
Oil, Gas & Consumable Fuels — 1.7%PetroTal Corp.(a) . . . . . . . . . . . . . . . . . . . . . . . . . . . . . . . . . . . . . . . . . 10,268,579 2,375,883
Real Estate Management & Development — 2.0%Parque Arauco SA(a) . . . . . . . . . . . . . . . . . . . . . . . . . . . . . . . . . . . . . 2,807,664 2,710,620
Trading Companies & Distributors — 3.4%Ferreycorp SAA . . . . . . . . . . . . . . . . . . . . . . . . . . . . . . . . . . . . . . . . . 10,070,143 4,679,181
Total Common Stocks — 99.4%(Cost: $178,422,873) . . . . . . . . . . . . . . . . . . . . . . . . . . . . . . . . . . . . . . . . . . . . . . 137,436,428
Short-Term InvestmentsMoney Market Funds — 0.4%BlackRock Cash Funds: Treasury, SL Agency Shares,
0.00%(c)(d) . . . . . . . . . . . . . . . . . . . . . . . . . . . . . . . . . . . . . . . . . . . . 620,000 620,000
Total Short-Term Investments — 0.4%(Cost: $620,000) . . . . . . . . . . . . . . . . . . . . . . . . . . . . . . . . . . . . . . . . . . . . . . . . . . 620,000
Total Investments in Securities — 99.8%(Cost: $179,042,873) . . . . . . . . . . . . . . . . . . . . . . . . . . . . . . . . . . . . . . . . . . . . . . 138,056,428
Other Assets, Less Liabilities — 0.2% . . . . . . . . . . . . . . . . . . . . . . . . . . . . . . . 248,563
Net Assets — 100.0% . . . . . . . . . . . . . . . . . . . . . . . . . . . . . . . . . . . . . . . . . . . . . . . . $ 138,304,991 (a) Non-income producing security.(b) Security exempt from registration pursuant to Rule 144A under the Securities Act of
1933, as amended. These securities may be resold in transactions exempt fromregistration to qualified institutional investors.
(c) Affiliate of the Fund.(d) Annualized 7-day yield as of period end.
Affiliates
Investments in issuers considered to be affiliate(s) of the Fund during the period ended November 30, 2021 for purposes of Section 2(a)(3) of the Investment Company Actof 1940, as amended, were as follows:
Affiliated IssuerValue at
08/31/21Purchases
at CostProceeds
from SalesNet Realized
Gain (Loss)
Change inUnrealized
Appreciation(Depreciation)
Value at11/30/21
SharesHeld at
11/30/21 Income
CapitalGain
Distributionsfrom
UnderlyingFunds
BlackRock Cash Funds: Treasury, SL Agency Shares . . . . . . . . $540,000 $ 80,000(a) $ — $ — $ — $620,000 620,000 $ 3 $ —
(a) Represents net amount purchased (sold).
Derivative Financial Instruments Outstanding as of Period End
Futures Contracts
DescriptionNumber ofContracts
ExpirationDate
NotionalAmount
(000)
Value/Unrealized
Appreciation(Depreciation)
Long ContractsMSCI Emerging Markets Index . . . . . . . . . . . . . . . . . . . . . . . . . . . . . . . . . . . . . . . . . . . . . . . . . . . . . . . . . . . . . . . . . . . . . . . . . . . . . . . . . . . . . . . 12 12/17/21 $ 727 $ (35,276)
Schedule of Investments (unaudited)
November 30, 2021
iShares� MSCI Peru ETF(Percentages shown are based on Net Assets)
133NM0122U-1995964-135/159

Fair Value Measurements
Various inputs are used in determining the fair value of financial instruments. These inputs to valuation techniques are categorized into a fair value hierarchy consisting ofthree broad levels for financial reporting purposes as follows:
• Level 1 – Unadjusted price quotations in active markets/exchanges for identical assets or liabilities that each Fund has the ability to access;• Level 2 – Other observable inputs (including, but not limited to, quoted prices for similar assets or liabilities in markets that are active, quoted prices for identical or
similar assets or liabilities in markets that are not active, inputs other than quoted prices that are observable for the assets or liabilities (such as interest rates, yieldcurves, volatilities, prepayment speeds, loss severities, credit risks and default rates) or other market-corroborated inputs); and
• Level 3 – Unobservable inputs based on the best information available in the circumstances, to the extent observable inputs are not available (including the BlackRockGlobal Valuation Methodologies Committee’s (the “Global Valuation Committee’s”) assumptions used in determining the fair value of financial instruments).
The hierarchy gives the highest priority to unadjusted quoted prices in active markets for identical assets or liabilities (Level 1 measurements) and the lowest priority tounobservable inputs (Level 3 measurements). Accordingly, the degree of judgment exercised in determining fair value is greatest for instruments categorized in Level 3. Theinputs used to measure fair value may fall into different levels of the fair value hierarchy. In such cases, for disclosure purposes, the fair value hierarchy classification isdetermined based on the lowest level input that is significant to the fair value measurement in its entirety. Investments classified within Level 3 have significant unobservableinputs used by the Global Valuation Committee in determining the price for Fair Valued Investments. Level 3 investments include equity or debt issued by privately heldcompanies or funds. There may not be a secondary market, and/or there are a limited number of investors. The categorization of a value determined for financial instrumentsis based on the pricing transparency of the financial instruments and is not necessarily an indication of the risks associated with investing in those securities. For informationabout the Fund’s policy regarding valuation of financial instruments, refer to its most recent financial statements.
The following table summarizes the Fund’s financial instruments categorized in the fair value hierarchy. The breakdown of the Fund’s financial instruments into majorcategories is disclosed in the Schedule of Investments above.
Level 1 Level 2 Level 3 Total
InvestmentsAssets
Common Stocks. . . . . . . . . . . . . . . . . . . . . . . . . . . . . . . . . . . . . . . . . . . . . . . . . . . . . . . . . . . . . . . . . . . . . . . . . . . . . . . . . . . . $129,535,093 $ 7,901,335 $ — $137,436,428Money Market Funds . . . . . . . . . . . . . . . . . . . . . . . . . . . . . . . . . . . . . . . . . . . . . . . . . . . . . . . . . . . . . . . . . . . . . . . . . . . . . . . 620,000 — — 620,000
$130,155,093 $ 7,901,335 $ — $138,056,428
Derivative financial instruments(a)
LiabilitiesFutures Contracts . . . . . . . . . . . . . . . . . . . . . . . . . . . . . . . . . . . . . . . . . . . . . . . . . . . . . . . . . . . . . . . . . . . . . . . . . . . . . . . . . . $ (35,276) $ — $ — $ (35,276)
(a) Derivative financial instruments are futures contracts. Futures contracts are valued at the unrealized appreciation (depreciation) on the instrument.
Portfolio Abbreviations - Equity
ADR . . . . . . . . . . . . . American Depositary ReceiptNVS . . . . . . . . . . . . . Non-Voting Shares
Schedule of Investments (unaudited) (continued)
November 30, 2021
iShares� MSCI Peru ETF
134 NM0122U-1995964-136/159

Security Shares
Value
Common StocksAirlines — 0.3%Cebu Air Inc.(a) . . . . . . . . . . . . . . . . . . . . . . . . . . . . . . . . . . . . . . . . . . 344,440 $ 315,817
Banks — 15.0%Bank of the Philippine Islands . . . . . . . . . . . . . . . . . . . . . . . . . . . . 3,104,695 5,615,527BDO Unibank Inc. . . . . . . . . . . . . . . . . . . . . . . . . . . . . . . . . . . . . . . . 2,921,164 7,178,037Metropolitan Bank & Trust Co. . . . . . . . . . . . . . . . . . . . . . . . . . . . . 3,807,774 3,767,512Security Bank Corp. . . . . . . . . . . . . . . . . . . . . . . . . . . . . . . . . . . . . . 787,580 1,792,804
18,353,880Chemicals — 1.0%D&L Industries Inc.. . . . . . . . . . . . . . . . . . . . . . . . . . . . . . . . . . . . . . . 7,232,400 1,249,083
Diversified Financial Services — 1.9%Metro Pacific Investments Corp. . . . . . . . . . . . . . . . . . . . . . . . . . . 29,075,050 2,335,204
Electric Utilities — 2.3%Manila Electric Co.. . . . . . . . . . . . . . . . . . . . . . . . . . . . . . . . . . . . . . . 501,140 2,860,049
Equity Real Estate Investment Trusts (REITs) — 0.5%AREIT Inc., NVS. . . . . . . . . . . . . . . . . . . . . . . . . . . . . . . . . . . . . . . . . 350,000 322,318Filinvest REIT Corp., NVS. . . . . . . . . . . . . . . . . . . . . . . . . . . . . . . . 2,092,400 317,055
639,373Food & Staples Retailing — 2.9%Cosco Capital Inc. . . . . . . . . . . . . . . . . . . . . . . . . . . . . . . . . . . . . . . . 7,982,900 804,865Puregold Price Club Inc. . . . . . . . . . . . . . . . . . . . . . . . . . . . . . . . . . 2,114,260 1,722,544Robinsons Retail Holdings Inc. . . . . . . . . . . . . . . . . . . . . . . . . . . . 741,110 978,145
3,505,554Food Products — 5.8%Century Pacific Food Inc. . . . . . . . . . . . . . . . . . . . . . . . . . . . . . . . . 2,057,800 1,102,477Monde Nissin Corp.(a)(b) . . . . . . . . . . . . . . . . . . . . . . . . . . . . . . . . . . 7,358,700 2,454,016Universal Robina Corp. . . . . . . . . . . . . . . . . . . . . . . . . . . . . . . . . . . 1,366,658 3,607,532
7,164,025Hotels, Restaurants & Leisure — 4.8%Bloomberry Resorts Corp.(a). . . . . . . . . . . . . . . . . . . . . . . . . . . . . . 10,196,065 1,576,409Jollibee Foods Corp. . . . . . . . . . . . . . . . . . . . . . . . . . . . . . . . . . . . . . 917,551 4,279,537
5,855,946Independent Power and Renewable Electricity Producers — 3.2%AC Energy Corp. . . . . . . . . . . . . . . . . . . . . . . . . . . . . . . . . . . . . . . . . 12,673,454 2,837,284First Gen Corp. . . . . . . . . . . . . . . . . . . . . . . . . . . . . . . . . . . . . . . . . . . 1,896,247 1,110,237
3,947,521Industrial Conglomerates — 25.0%Aboitiz Equity Ventures Inc. . . . . . . . . . . . . . . . . . . . . . . . . . . . . . . 3,531,667 3,441,597Alliance Global Group Inc.. . . . . . . . . . . . . . . . . . . . . . . . . . . . . . . . 7,790,439 1,751,024Ayala Corp.. . . . . . . . . . . . . . . . . . . . . . . . . . . . . . . . . . . . . . . . . . . . . . 461,838 7,642,160DMCI Holdings Inc. . . . . . . . . . . . . . . . . . . . . . . . . . . . . . . . . . . . . . . 10,398,700 1,679,973GT Capital Holdings Inc. . . . . . . . . . . . . . . . . . . . . . . . . . . . . . . . . . 222,276 2,507,815JG Summit Holdings Inc. . . . . . . . . . . . . . . . . . . . . . . . . . . . . . . . . . 4,766,841 5,350,101LT Group Inc. . . . . . . . . . . . . . . . . . . . . . . . . . . . . . . . . . . . . . . . . . . . . 2,676,100 562,998SM Investments Corp. . . . . . . . . . . . . . . . . . . . . . . . . . . . . . . . . . . . 393,536 7,654,367
30,590,035
Security Shares
Value
Oil, Gas & Consumable Fuels — 1.0%Semirara Mining & Power Corp. . . . . . . . . . . . . . . . . . . . . . . . . . . 2,778,700 $ 1,260,163
Real Estate Management & Development — 21.1%Ayala Land Inc. . . . . . . . . . . . . . . . . . . . . . . . . . . . . . . . . . . . . . . . . . . 13,541,550 9,252,866DoubleDragon Corp. . . . . . . . . . . . . . . . . . . . . . . . . . . . . . . . . . . . . . 46,500 7,051Filinvest Land Inc. . . . . . . . . . . . . . . . . . . . . . . . . . . . . . . . . . . . . . . . 36,419,590 809,565Megaworld Corp. . . . . . . . . . . . . . . . . . . . . . . . . . . . . . . . . . . . . . . . . 26,972,960 1,678,909Robinsons Land Corp. . . . . . . . . . . . . . . . . . . . . . . . . . . . . . . . . . . . 1,733,206 624,856SM Prime Holdings Inc. . . . . . . . . . . . . . . . . . . . . . . . . . . . . . . . . . . 17,098,835 12,676,346Vista Land & Lifescapes Inc. . . . . . . . . . . . . . . . . . . . . . . . . . . . . . 11,304,900 858,050
25,907,643Specialty Retail — 2.5%AllHome Corp.. . . . . . . . . . . . . . . . . . . . . . . . . . . . . . . . . . . . . . . . . . . 4,291,100 809,079Wilcon Depot Inc. . . . . . . . . . . . . . . . . . . . . . . . . . . . . . . . . . . . . . . . . 3,553,500 2,249,809
3,058,888Transportation Infrastructure — 4.7%International Container Terminal Services Inc. . . . . . . . . . . . . . 1,453,763 5,710,027
Water Utilities — 0.3%Manila Water Co. Inc. . . . . . . . . . . . . . . . . . . . . . . . . . . . . . . . . . . . . 702,329 334,542
Wireless Telecommunication Services — 7.2%Globe Telecom Inc. . . . . . . . . . . . . . . . . . . . . . . . . . . . . . . . . . . . . . . 56,490 3,679,670PLDT Inc. . . . . . . . . . . . . . . . . . . . . . . . . . . . . . . . . . . . . . . . . . . . . . . . 153,199 5,108,154
8,787,824
Total Common Stocks — 99.5%(Cost: $141,322,393) . . . . . . . . . . . . . . . . . . . . . . . . . . . . . . . . . . . . . . . . . . . . . . 121,875,574
Short-Term InvestmentsMoney Market Funds — 0.0%BlackRock Cash Funds: Treasury, SL Agency Shares,
0.00%(c)(d) . . . . . . . . . . . . . . . . . . . . . . . . . . . . . . . . . . . . . . . . . . . . 40,000 40,000
Total Short-Term Investments — 0.0%(Cost: $40,000). . . . . . . . . . . . . . . . . . . . . . . . . . . . . . . . . . . . . . . . . . . . . . . . . . . . 40,000
Total Investments in Securities — 99.5%(Cost: $141,362,393) . . . . . . . . . . . . . . . . . . . . . . . . . . . . . . . . . . . . . . . . . . . . . . 121,915,574
Other Assets, Less Liabilities — 0.5% . . . . . . . . . . . . . . . . . . . . . . . . . . . . . . . 580,904
Net Assets — 100.0% . . . . . . . . . . . . . . . . . . . . . . . . . . . . . . . . . . . . . . . . . . . . . . . . $ 122,496,478 (a) Non-income producing security.(b) Security exempt from registration pursuant to Rule 144A under the Securities Act of
1933, as amended. These securities may be resold in transactions exempt fromregistration to qualified institutional investors.
(c) Affiliate of the Fund.(d) Annualized 7-day yield as of period end.
Schedule of Investments (unaudited)
November 30, 2021
iShares� MSCI Philippines ETF(Percentages shown are based on Net Assets)
135NM0122U-1995964-137/159

Affiliates
Investments in issuers considered to be affiliate(s) of the Fund during the period ended November 30, 2021 for purposes of Section 2(a)(3) of the Investment Company Actof 1940, as amended, were as follows:
Affiliated IssuerValue at
08/31/21Purchases
at CostProceeds
from SalesNet Realized
Gain (Loss)
Change inUnrealized
Appreciation(Depreciation)
Value at11/30/21
SharesHeld at
11/30/21 Income
CapitalGain
Distributionsfrom
UnderlyingFunds
BlackRock Cash Funds: Treasury, SL Agency Shares . . . . . . . . . $140,000 $ — $(100,000)(a) $ — $ — $ 40,000 40,000 $ 1 $ —
(a) Represents net amount purchased (sold).
Derivative Financial Instruments Outstanding as of Period End
Futures Contracts
DescriptionNumber ofContracts
ExpirationDate
NotionalAmount
(000)
Value/Unrealized
Appreciation(Depreciation)
Long ContractsMSCI Emerging Markets Index . . . . . . . . . . . . . . . . . . . . . . . . . . . . . . . . . . . . . . . . . . . . . . . . . . . . . . . . . . . . . . . . . . . . . . . . . . . . . . . . . . . . . . . 4 12/17/21 $ 242 $ (14,709)
Fair Value Measurements
Various inputs are used in determining the fair value of financial instruments. These inputs to valuation techniques are categorized into a fair value hierarchy consisting ofthree broad levels for financial reporting purposes as follows:
• Level 1 – Unadjusted price quotations in active markets/exchanges for identical assets or liabilities that each Fund has the ability to access;• Level 2 – Other observable inputs (including, but not limited to, quoted prices for similar assets or liabilities in markets that are active, quoted prices for identical or
similar assets or liabilities in markets that are not active, inputs other than quoted prices that are observable for the assets or liabilities (such as interest rates, yieldcurves, volatilities, prepayment speeds, loss severities, credit risks and default rates) or other market-corroborated inputs); and
• Level 3 – Unobservable inputs based on the best information available in the circumstances, to the extent observable inputs are not available (including the BlackRockGlobal Valuation Methodologies Committee’s (the “Global Valuation Committee’s”) assumptions used in determining the fair value of financial instruments).
The hierarchy gives the highest priority to unadjusted quoted prices in active markets for identical assets or liabilities (Level 1 measurements) and the lowest priority tounobservable inputs (Level 3 measurements). Accordingly, the degree of judgment exercised in determining fair value is greatest for instruments categorized in Level 3. Theinputs used to measure fair value may fall into different levels of the fair value hierarchy. In such cases, for disclosure purposes, the fair value hierarchy classification isdetermined based on the lowest level input that is significant to the fair value measurement in its entirety. Investments classified within Level 3 have significant unobservableinputs used by the Global Valuation Committee in determining the price for Fair Valued Investments. Level 3 investments include equity or debt issued by privately heldcompanies or funds. There may not be a secondary market, and/or there are a limited number of investors. The categorization of a value determined for financial instrumentsis based on the pricing transparency of the financial instruments and is not necessarily an indication of the risks associated with investing in those securities. For informationabout the Fund’s policy regarding valuation of financial instruments, refer to its most recent financial statements.
The following table summarizes the Fund’s financial instruments categorized in the fair value hierarchy. The breakdown of the Fund’s financial instruments into majorcategories is disclosed in the Schedule of Investments above.
Level 1 Level 2 Level 3 Total
InvestmentsAssets
Common Stocks. . . . . . . . . . . . . . . . . . . . . . . . . . . . . . . . . . . . . . . . . . . . . . . . . . . . . . . . . . . . . . . . . . . . . . . . . . . . . . . . . . . . $ 55,895,967 $ 65,979,607 $ — $121,875,574Money Market Funds . . . . . . . . . . . . . . . . . . . . . . . . . . . . . . . . . . . . . . . . . . . . . . . . . . . . . . . . . . . . . . . . . . . . . . . . . . . . . . . 40,000 — — 40,000
$ 55,935,967 $ 65,979,607 $ — $121,915,574
Derivative financial instruments(a)
LiabilitiesFutures Contracts . . . . . . . . . . . . . . . . . . . . . . . . . . . . . . . . . . . . . . . . . . . . . . . . . . . . . . . . . . . . . . . . . . . . . . . . . . . . . . . . . . $ (14,709) $ — $ — $ (14,709)
(a) Derivative financial instruments are futures contracts. Futures contracts are valued at the unrealized appreciation (depreciation) on the instrument.
Schedule of Investments (unaudited) (continued)
November 30, 2021
iShares� MSCI Philippines ETF
136 NM0122U-1995964-138/159

Portfolio Abbreviations - Equity
NVS . . . . . . . . . . . . . Non-Voting SharesREIT . . . . . . . . . . . . . Real Estate Investment Trust
Schedule of Investments (unaudited) (continued)
November 30, 2021
iShares� MSCI Philippines ETF
137NM0122U-1995964-139/159

Security Shares
Value
Common StocksBanks — 31.0%Alior Bank SA(a) . . . . . . . . . . . . . . . . . . . . . . . . . . . . . . . . . . . . . . . . . 227,700 $ 3,190,722Bank Handlowy w Warszawie SA(b) . . . . . . . . . . . . . . . . . . . . . . . 198,584 2,796,349Bank Millennium SA(a)(b) . . . . . . . . . . . . . . . . . . . . . . . . . . . . . . . . . 2,945,787 5,937,032Bank Polska Kasa Opieki SA . . . . . . . . . . . . . . . . . . . . . . . . . . . . . 675,256 19,499,460mBank SA(a)(b). . . . . . . . . . . . . . . . . . . . . . . . . . . . . . . . . . . . . . . . . . . 67,785 8,015,331Powszechna Kasa Oszczednosci Bank Polski SA(a) . . . . . . . 3,354,143 35,448,330Santander Bank Polska SA. . . . . . . . . . . . . . . . . . . . . . . . . . . . . . . 155,820 13,839,056
88,726,280Capital Markets — 0.8%Warsaw Stock Exchange. . . . . . . . . . . . . . . . . . . . . . . . . . . . . . . . . 167,984 1,742,335X-Trade Brokers Dom Maklerski SA(b)(c) . . . . . . . . . . . . . . . . . . 164,330 630,473
2,372,808Chemicals — 1.5%Ciech SA . . . . . . . . . . . . . . . . . . . . . . . . . . . . . . . . . . . . . . . . . . . . . . . . 186,127 1,903,325Grupa Azoty SA(a)(b) . . . . . . . . . . . . . . . . . . . . . . . . . . . . . . . . . . . . . 275,425 2,368,526
4,271,851Construction & Engineering — 1.1%Budimex SA . . . . . . . . . . . . . . . . . . . . . . . . . . . . . . . . . . . . . . . . . . . . . 60,695 3,214,151
Consumer Finance — 2.3%KRUK SA . . . . . . . . . . . . . . . . . . . . . . . . . . . . . . . . . . . . . . . . . . . . . . . 80,891 6,637,190
Diversified Telecommunication Services — 2.3%Orange Polska SA(a) . . . . . . . . . . . . . . . . . . . . . . . . . . . . . . . . . . . . . 3,126,728 6,497,522
Electric Utilities — 5.0%Enea SA(a) . . . . . . . . . . . . . . . . . . . . . . . . . . . . . . . . . . . . . . . . . . . . . . 1,299,328 2,788,278PGE Polska Grupa Energetyczna SA(a) . . . . . . . . . . . . . . . . . . . 3,820,052 7,705,813Tauron Polska Energia SA(a)(b) . . . . . . . . . . . . . . . . . . . . . . . . . . . 5,525,431 3,861,884
14,355,975Entertainment — 5.3%CD Projekt SA(b) . . . . . . . . . . . . . . . . . . . . . . . . . . . . . . . . . . . . . . . . . 272,093 12,107,450HUUUGE Inc.(a)(b)(c) . . . . . . . . . . . . . . . . . . . . . . . . . . . . . . . . . . . . . 99,267 725,071PlayWay SA(b) . . . . . . . . . . . . . . . . . . . . . . . . . . . . . . . . . . . . . . . . . . . 6,116 617,973TEN Square Games SA(b) . . . . . . . . . . . . . . . . . . . . . . . . . . . . . . . . 19,960 1,702,837
15,153,331Food & Staples Retailing — 5.2%Dino Polska SA(a)(c) . . . . . . . . . . . . . . . . . . . . . . . . . . . . . . . . . . . . . . 162,721 13,478,205Eurocash SA(b) . . . . . . . . . . . . . . . . . . . . . . . . . . . . . . . . . . . . . . . . . . 496,509 1,318,882
14,797,087Health Care Equipment & Supplies — 0.0%Mercator Medical SA(a)(b). . . . . . . . . . . . . . . . . . . . . . . . . . . . . . . . . 3,241 106,608
Health Care Providers & Services — 0.9%Neuca SA(b) . . . . . . . . . . . . . . . . . . . . . . . . . . . . . . . . . . . . . . . . . . . . . 13,656 2,636,640
Hotels, Restaurants & Leisure — 1.0%AmRest Holdings SE(a)(b). . . . . . . . . . . . . . . . . . . . . . . . . . . . . . . . . 436,038 3,008,084
Insurance — 6.8%Powszechny Zaklad Ubezpieczen SA. . . . . . . . . . . . . . . . . . . . . 2,224,216 19,395,670
Internet & Direct Marketing Retail — 4.3%Allegro.eu SA(a)(c). . . . . . . . . . . . . . . . . . . . . . . . . . . . . . . . . . . . . . . . 1,282,509 12,292,064
Security Shares
Value
Media — 3.4%Cyfrowy Polsat SA . . . . . . . . . . . . . . . . . . . . . . . . . . . . . . . . . . . . . . . 1,132,180 $ 9,670,061
Metals & Mining — 7.2%Jastrzebska Spolka Weglowa SA(a)(b) . . . . . . . . . . . . . . . . . . . . . 310,754 3,106,235KGHM Polska Miedz SA . . . . . . . . . . . . . . . . . . . . . . . . . . . . . . . . . 510,681 17,531,946
20,638,181Oil, Gas & Consumable Fuels — 12.4%Grupa Lotos SA(a) . . . . . . . . . . . . . . . . . . . . . . . . . . . . . . . . . . . . . . . 441,915 5,792,210Polski Koncern Naftowy ORLEN SA . . . . . . . . . . . . . . . . . . . . . . 1,105,683 19,306,197Polskie Gornictwo Naftowe i Gazownictwo SA. . . . . . . . . . . . . 7,617,449 10,272,486
35,370,893Pharmaceuticals — 0.2%Celon Pharma SA(b) . . . . . . . . . . . . . . . . . . . . . . . . . . . . . . . . . . . . . 67,560 494,297
Software — 2.7%Asseco Poland SA . . . . . . . . . . . . . . . . . . . . . . . . . . . . . . . . . . . . . . . 276,923 5,927,113LiveChat Software SA(b). . . . . . . . . . . . . . . . . . . . . . . . . . . . . . . . . . 57,093 1,715,348
7,642,461Textiles, Apparel & Luxury Goods — 6.2%CCC SA(a)(b). . . . . . . . . . . . . . . . . . . . . . . . . . . . . . . . . . . . . . . . . . . . . 179,533 4,472,035LPP SA . . . . . . . . . . . . . . . . . . . . . . . . . . . . . . . . . . . . . . . . . . . . . . . . . 4,079 13,288,133
17,760,168
Total Common Stocks — 99.6%(Cost: $350,741,586) . . . . . . . . . . . . . . . . . . . . . . . . . . . . . . . . . . . . . . . . . . . . . . 285,041,322
Short-Term InvestmentsMoney Market Funds — 8.2%BlackRock Cash Funds: Institutional, SL Agency Shares,
0.06%(d)(e)(f). . . . . . . . . . . . . . . . . . . . . . . . . . . . . . . . . . . . . . . . . . . 20,435,204 20,443,378BlackRock Cash Funds: Treasury, SL Agency Shares,
0.00%(d)(e) . . . . . . . . . . . . . . . . . . . . . . . . . . . . . . . . . . . . . . . . . . . . 2,980,000 2,980,000
23,423,378
Total Short-Term Investments — 8.2%(Cost: $23,423,787) . . . . . . . . . . . . . . . . . . . . . . . . . . . . . . . . . . . . . . . . . . . . . . . 23,423,378
Total Investments in Securities — 107.8%(Cost: $374,165,373) . . . . . . . . . . . . . . . . . . . . . . . . . . . . . . . . . . . . . . . . . . . . . . 308,464,700
Other Assets, Less Liabilities — (7.8)%. . . . . . . . . . . . . . . . . . . . . . . . . . . . . . (22,344,848)
Net Assets — 100.0% . . . . . . . . . . . . . . . . . . . . . . . . . . . . . . . . . . . . . . . . . . . . . . . . $ 286,119,852 (a) Non-income producing security.(b) All or a portion of this security is on loan.(c) Security exempt from registration pursuant to Rule 144A under the Securities Act of
1933, as amended. These securities may be resold in transactions exempt fromregistration to qualified institutional investors.
(d) Affiliate of the Fund.(e) Annualized 7-day yield as of period end.(f) All or a portion of this security was purchased with the cash collateral from loaned
securities.
Schedule of Investments (unaudited)
November 30, 2021
iShares� MSCI Poland ETF(Percentages shown are based on Net Assets)
138 NM0122U-1995964-140/159

Affiliates
Investments in issuers considered to be affiliate(s) of the Fund during the period ended November 30, 2021 for purposes of Section 2(a)(3) of the Investment Company Actof 1940, as amended, were as follows:
Affiliated IssuerValue at
08/31/21Purchases
at CostProceeds
from SalesNet Realized
Gain (Loss)
Change inUnrealized
Appreciation(Depreciation)
Value at11/30/21
SharesHeld at
11/30/21 Income
CapitalGain
Distributionsfrom
UnderlyingFunds
BlackRock Cash Funds: Institutional, SL AgencyShares . . . . . . . . . . . . . . . . . . . . . . . . . . . . . . . . . . . . . . $13,507,125 $6,938,774(a) $ — $ (763) $ (1,758) $20,443,378 20,435,204 $76,215(b) $ —
BlackRock Cash Funds: Treasury, SL AgencyShares . . . . . . . . . . . . . . . . . . . . . . . . . . . . . . . . . . . . . . 2,310,000 670,000(a)
— — — 2,980,000 2,980,000 36 —
$ (763) $ (1,758) $23,423,378 $76,251 $ —
(a) Represents net amount purchased (sold).(b) All or a portion represents securities lending income earned from the reinvestment of cash collateral from loaned securities, net of fees and collateral investment expenses, and other
payments to and from borrowers of securities.
Derivative Financial Instruments Outstanding as of Period End
Futures Contracts
DescriptionNumber ofContracts
ExpirationDate
NotionalAmount
(000)
Value/Unrealized
Appreciation(Depreciation)
Long ContractsMSCI Emerging Markets Index . . . . . . . . . . . . . . . . . . . . . . . . . . . . . . . . . . . . . . . . . . . . . . . . . . . . . . . . . . . . . . . . . . . . . . . . . . . . . . . . . . . . . . . 21 12/17/21 $ 1,273 $ (72,077)
Fair Value Measurements
Various inputs are used in determining the fair value of financial instruments. These inputs to valuation techniques are categorized into a fair value hierarchy consisting ofthree broad levels for financial reporting purposes as follows:
• Level 1 – Unadjusted price quotations in active markets/exchanges for identical assets or liabilities that each Fund has the ability to access;• Level 2 – Other observable inputs (including, but not limited to, quoted prices for similar assets or liabilities in markets that are active, quoted prices for identical or
similar assets or liabilities in markets that are not active, inputs other than quoted prices that are observable for the assets or liabilities (such as interest rates, yieldcurves, volatilities, prepayment speeds, loss severities, credit risks and default rates) or other market-corroborated inputs); and
• Level 3 – Unobservable inputs based on the best information available in the circumstances, to the extent observable inputs are not available (including the BlackRockGlobal Valuation Methodologies Committee’s (the “Global Valuation Committee’s”) assumptions used in determining the fair value of financial instruments).
The hierarchy gives the highest priority to unadjusted quoted prices in active markets for identical assets or liabilities (Level 1 measurements) and the lowest priority tounobservable inputs (Level 3 measurements). Accordingly, the degree of judgment exercised in determining fair value is greatest for instruments categorized in Level 3. Theinputs used to measure fair value may fall into different levels of the fair value hierarchy. In such cases, for disclosure purposes, the fair value hierarchy classification isdetermined based on the lowest level input that is significant to the fair value measurement in its entirety. Investments classified within Level 3 have significant unobservableinputs used by the Global Valuation Committee in determining the price for Fair Valued Investments. Level 3 investments include equity or debt issued by privately heldcompanies or funds. There may not be a secondary market, and/or there are a limited number of investors. The categorization of a value determined for financial instrumentsis based on the pricing transparency of the financial instruments and is not necessarily an indication of the risks associated with investing in those securities. For informationabout the Fund’s policy regarding valuation of financial instruments, refer to its most recent financial statements.
Schedule of Investments (unaudited) (continued)
November 30, 2021
iShares� MSCI Poland ETF
139NM0122U-1995964-141/159

Fair Value Measurements (continued)
The following table summarizes the Fund’s financial instruments categorized in the fair value hierarchy. The breakdown of the Fund’s financial instruments into majorcategories is disclosed in the Schedule of Investments above.
Level 1 Level 2 Level 3 Total
InvestmentsAssets
Common Stocks. . . . . . . . . . . . . . . . . . . . . . . . . . . . . . . . . . . . . . . . . . . . . . . . . . . . . . . . . . . . . . . . . . . . . . . . . . . . . . . . . . . . $ 90,813,781 $194,227,541 $ — $285,041,322Money Market Funds . . . . . . . . . . . . . . . . . . . . . . . . . . . . . . . . . . . . . . . . . . . . . . . . . . . . . . . . . . . . . . . . . . . . . . . . . . . . . . . 23,423,378 — — 23,423,378
$114,237,159 $194,227,541 $ — $308,464,700
Derivative financial instruments(a)
LiabilitiesFutures Contracts . . . . . . . . . . . . . . . . . . . . . . . . . . . . . . . . . . . . . . . . . . . . . . . . . . . . . . . . . . . . . . . . . . . . . . . . . . . . . . . . . . $ (72,077) $ — $ — $ (72,077)
(a) Derivative financial instruments are futures contracts. Futures contracts are valued at the unrealized appreciation (depreciation) on the instrument.
Schedule of Investments (unaudited) (continued)
November 30, 2021
iShares� MSCI Poland ETF
140 NM0122U-1995964-142/159

Security Shares
Value
Common StocksAir Freight & Logistics — 1.1%Gulf Warehousing Co. . . . . . . . . . . . . . . . . . . . . . . . . . . . . . . . . . . . . . . 695,400 $ 904,669
Banks — 47.2%Commercial Bank PSQC (The) . . . . . . . . . . . . . . . . . . . . . . . . . . . . . 2,245,541 4,011,426Doha Bank QPSC. . . . . . . . . . . . . . . . . . . . . . . . . . . . . . . . . . . . . . . . . . 2,600,759 2,163,398Masraf Al Rayan QSC . . . . . . . . . . . . . . . . . . . . . . . . . . . . . . . . . . . . . . 4,261,264 5,636,593Qatar First Bank . . . . . . . . . . . . . . . . . . . . . . . . . . . . . . . . . . . . . . . . . . . 1,656,541 806,449Qatar International Islamic Bank QSC . . . . . . . . . . . . . . . . . . . . . . . 1,081,618 2,746,376Qatar Islamic Bank SAQ. . . . . . . . . . . . . . . . . . . . . . . . . . . . . . . . . . . . 1,361,489 6,386,737Qatar National Bank QPSC . . . . . . . . . . . . . . . . . . . . . . . . . . . . . . . . . 3,528,707 18,660,783
40,411,762Chemicals — 4.0%Mesaieed Petrochemical Holding Co. . . . . . . . . . . . . . . . . . . . . . . . 6,126,613 3,461,297
Construction Materials — 2.0%Qatar National Cement Co. QSC. . . . . . . . . . . . . . . . . . . . . . . . . . . . 706,013 984,328Qatari Investors Group QSC . . . . . . . . . . . . . . . . . . . . . . . . . . . . . . . . 1,110,335 708,609
1,692,937Diversified Financial Services — 0.9%Salam International Investment Ltd. QSC. . . . . . . . . . . . . . . . . . . . 3,216,451 769,920
Diversified Telecommunication Services — 2.6%Ooredoo QPSC . . . . . . . . . . . . . . . . . . . . . . . . . . . . . . . . . . . . . . . . . . . . 1,217,333 2,257,641
Energy Equipment & Services — 1.3%Gulf International Services QSC(a) . . . . . . . . . . . . . . . . . . . . . . . . . . 2,191,651 1,089,192
Food & Staples Retailing — 1.3%Al Meera Consumer Goods Co. QSC. . . . . . . . . . . . . . . . . . . . . . . . 209,559 1,103,062
Food Products — 1.0%Baladna . . . . . . . . . . . . . . . . . . . . . . . . . . . . . . . . . . . . . . . . . . . . . . . . . . . 2,194,375 893,526
Health Care Providers & Services — 1.0%Medicare Group. . . . . . . . . . . . . . . . . . . . . . . . . . . . . . . . . . . . . . . . . . . . 380,041 870,655
Industrial Conglomerates — 11.1%Aamal Co. . . . . . . . . . . . . . . . . . . . . . . . . . . . . . . . . . . . . . . . . . . . . . . . . . 3,774,467 1,066,478Industries Qatar QSC . . . . . . . . . . . . . . . . . . . . . . . . . . . . . . . . . . . . . . 1,811,817 7,174,926Mannai Corp. QSC . . . . . . . . . . . . . . . . . . . . . . . . . . . . . . . . . . . . . . . . . 448,294 568,284Qatar Industrial Manufacturing Co. QSC. . . . . . . . . . . . . . . . . . . . . 793,191 668,456
9,478,144Insurance — 2.1%Qatar Insurance Co. SAQ(a) . . . . . . . . . . . . . . . . . . . . . . . . . . . . . . . . 2,630,437 1,793,512
Security Shares
Value
Marine — 2.2%Qatar Navigation QSC. . . . . . . . . . . . . . . . . . . . . . . . . . . . . . . . . . . . . . 924,432 $ 1,885,876
Metals & Mining — 2.7%Qatar Aluminum Manufacturing Co. . . . . . . . . . . . . . . . . . . . . . . . . . 4,711,051 2,325,588
Multi-Utilities — 3.6%Qatar Electricity & Water Co. QSC . . . . . . . . . . . . . . . . . . . . . . . . . . 681,597 3,067,242
Oil, Gas & Consumable Fuels — 7.7%Qatar Fuel QSC. . . . . . . . . . . . . . . . . . . . . . . . . . . . . . . . . . . . . . . . . . . . 688,462 3,417,337Qatar Gas Transport Co. Ltd. . . . . . . . . . . . . . . . . . . . . . . . . . . . . . . . 3,565,455 3,205,140
6,622,477Real Estate Management & Development — 6.4%Barwa Real Estate Co. . . . . . . . . . . . . . . . . . . . . . . . . . . . . . . . . . . . . . 2,856,741 2,408,277Ezdan Holding Group QSC . . . . . . . . . . . . . . . . . . . . . . . . . . . . . . . . . 2,858,415 1,145,985Mazaya Real Estate Development QPSC . . . . . . . . . . . . . . . . . . . 2,238,162 615,302United Development Co. QSC . . . . . . . . . . . . . . . . . . . . . . . . . . . . . . 3,247,665 1,349,408
5,518,972Wireless Telecommunication Services — 1.7%Vodafone Qatar QSC. . . . . . . . . . . . . . . . . . . . . . . . . . . . . . . . . . . . . . . 3,251,537 1,422,426
Total Common Stocks — 99.9%(Cost: $63,555,294). . . . . . . . . . . . . . . . . . . . . . . . . . . . . . . . . . . . . . . . . . . . . . . . . 85,568,898
Short-Term InvestmentsMoney Market Funds — 0.1%BlackRock Cash Funds: Treasury, SL Agency Shares,
0.00%(b)(c). . . . . . . . . . . . . . . . . . . . . . . . . . . . . . . . . . . . . . . . . . . . . . . 70,000 70,000
Total Short-Term Investments — 0.1%(Cost: $70,000) . . . . . . . . . . . . . . . . . . . . . . . . . . . . . . . . . . . . . . . . . . . . . . . . . . . . . 70,000
Total Investments in Securities — 100.0%(Cost: $63,625,294). . . . . . . . . . . . . . . . . . . . . . . . . . . . . . . . . . . . . . . . . . . . . . . . . 85,638,898
Other Assets, Less Liabilities — 0.0% . . . . . . . . . . . . . . . . . . . . . . . . . . . . . . . . 23,874
Net Assets — 100.0% . . . . . . . . . . . . . . . . . . . . . . . . . . . . . . . . . . . . . . . . . . . . . . . . . $ 85,662,772 (a) Non-income producing security.(b) Affiliate of the Fund.(c) Annualized 7-day yield as of period end.
Affiliates
Investments in issuers considered to be affiliate(s) of the Fund during the period ended November 30, 2021 for purposes of Section 2(a)(3) of the Investment Company Actof 1940, as amended, were as follows:
Affiliated IssuerValue at
08/31/21Purchases
at CostProceeds
from SalesNet Realized
Gain (Loss)
Change inUnrealized
Appreciation(Depreciation)
Value at11/30/21
SharesHeld at
11/30/21 Income
CapitalGain
Distributionsfrom
UnderlyingFunds
BlackRock Cash Funds: Treasury, SL Agency Shares. . . . . . . . . . $ 20,000 $ 50,000(a) $ — $ — $ — $ 70,000 70,000 $ 1 $ —
(a) Represents net amount purchased (sold).
Schedule of Investments (unaudited)
November 30, 2021
iShares� MSCI Qatar ETF(Percentages shown are based on Net Assets)
141NM0122U-1995964-143/159

Derivative Financial Instruments Outstanding as of Period End
Futures Contracts
DescriptionNumber ofContracts
ExpirationDate
NotionalAmount
(000)
Value/Unrealized
Appreciation(Depreciation)
Long ContractsMSCI Emerging Markets Index . . . . . . . . . . . . . . . . . . . . . . . . . . . . . . . . . . . . . . . . . . . . . . . . . . . . . . . . . . . . . . . . . . . . . . . . . . . . . . . . . . . . . . . 1 12/17/21 $ 61 $ (71)
Fair Value Measurements
Various inputs are used in determining the fair value of financial instruments. These inputs to valuation techniques are categorized into a fair value hierarchy consisting ofthree broad levels for financial reporting purposes as follows:
• Level 1 – Unadjusted price quotations in active markets/exchanges for identical assets or liabilities that each Fund has the ability to access;• Level 2 – Other observable inputs (including, but not limited to, quoted prices for similar assets or liabilities in markets that are active, quoted prices for identical or
similar assets or liabilities in markets that are not active, inputs other than quoted prices that are observable for the assets or liabilities (such as interest rates, yieldcurves, volatilities, prepayment speeds, loss severities, credit risks and default rates) or other market-corroborated inputs); and
• Level 3 – Unobservable inputs based on the best information available in the circumstances, to the extent observable inputs are not available (including the BlackRockGlobal Valuation Methodologies Committee’s (the “Global Valuation Committee’s”) assumptions used in determining the fair value of financial instruments).
The hierarchy gives the highest priority to unadjusted quoted prices in active markets for identical assets or liabilities (Level 1 measurements) and the lowest priority tounobservable inputs (Level 3 measurements). Accordingly, the degree of judgment exercised in determining fair value is greatest for instruments categorized in Level 3. Theinputs used to measure fair value may fall into different levels of the fair value hierarchy. In such cases, for disclosure purposes, the fair value hierarchy classification isdetermined based on the lowest level input that is significant to the fair value measurement in its entirety. Investments classified within Level 3 have significant unobservableinputs used by the Global Valuation Committee in determining the price for Fair Valued Investments. Level 3 investments include equity or debt issued by privately heldcompanies or funds. There may not be a secondary market, and/or there are a limited number of investors. The categorization of a value determined for financial instrumentsis based on the pricing transparency of the financial instruments and is not necessarily an indication of the risks associated with investing in those securities. For informationabout the Fund’s policy regarding valuation of financial instruments, refer to its most recent financial statements.
The following table summarizes the Fund’s financial instruments categorized in the fair value hierarchy. The breakdown of the Fund’s financial instruments into majorcategories is disclosed in the Schedule of Investments above.
Level 1 Level 2 Level 3 Total
InvestmentsAssets
Common Stocks . . . . . . . . . . . . . . . . . . . . . . . . . . . . . . . . . . . . . . . . . . . . . . . . . . . . . . . . . . . . . . . . . . . . . . . . . . . . . . . . . . . . . . . . $75,693,941 $ 9,874,957 $ — $85,568,898Money Market Funds . . . . . . . . . . . . . . . . . . . . . . . . . . . . . . . . . . . . . . . . . . . . . . . . . . . . . . . . . . . . . . . . . . . . . . . . . . . . . . . . . . . . 70,000 — — 70,000
$75,763,941 $ 9,874,957 $ — $85,638,898
Derivative financial instruments(a)
LiabilitiesFutures Contracts . . . . . . . . . . . . . . . . . . . . . . . . . . . . . . . . . . . . . . . . . . . . . . . . . . . . . . . . . . . . . . . . . . . . . . . . . . . . . . . . . . . . . . . $ (71) $ — $ — $ (71)
(a) Derivative financial instruments are futures contracts. Futures contracts are valued at the unrealized appreciation (depreciation) on the instrument.
Schedule of Investments (unaudited) (continued)
November 30, 2021
iShares� MSCI Qatar ETF
142 NM0122U-1995964-144/159

Security Shares
Value
Common StocksBanks — 42.8%Al Rajhi Bank . . . . . . . . . . . . . . . . . . . . . . . . . . . . . . . . . . . . . . . . . . . . . 4,035,649 $ 141,796,711Alinma Bank . . . . . . . . . . . . . . . . . . . . . . . . . . . . . . . . . . . . . . . . . . . . . . 3,607,453 21,904,728Arab National Bank . . . . . . . . . . . . . . . . . . . . . . . . . . . . . . . . . . . . . . . 2,227,060 12,988,611Bank AlBilad(a) . . . . . . . . . . . . . . . . . . . . . . . . . . . . . . . . . . . . . . . . . . . . 1,391,563 15,863,537Bank Al-Jazira . . . . . . . . . . . . . . . . . . . . . . . . . . . . . . . . . . . . . . . . . . . . 1,644,258 7,943,860Banque Saudi Fransi . . . . . . . . . . . . . . . . . . . . . . . . . . . . . . . . . . . . . . 2,157,525 23,118,804Riyad Bank . . . . . . . . . . . . . . . . . . . . . . . . . . . . . . . . . . . . . . . . . . . . . . . 4,821,122 35,982,358Saudi British Bank (The) . . . . . . . . . . . . . . . . . . . . . . . . . . . . . . . . . . 2,977,262 23,717,873Saudi National Bank (The). . . . . . . . . . . . . . . . . . . . . . . . . . . . . . . . . 7,191,666 115,784,366
399,100,848Building Products — 0.3%Saudi Ceramic Co. . . . . . . . . . . . . . . . . . . . . . . . . . . . . . . . . . . . . . . . . 225,333 3,119,872
Chemicals — 18.2%Advanced Petrochemical Co. . . . . . . . . . . . . . . . . . . . . . . . . . . . . . . 427,840 7,797,730Alujain Holding. . . . . . . . . . . . . . . . . . . . . . . . . . . . . . . . . . . . . . . . . . . . 103,986 1,593,622National Industrialization Co.(a) . . . . . . . . . . . . . . . . . . . . . . . . . . . . 1,391,912 7,409,537National Petrochemical Co.. . . . . . . . . . . . . . . . . . . . . . . . . . . . . . . . 136,900 1,459,644SABIC Agri-Nutrients Co.. . . . . . . . . . . . . . . . . . . . . . . . . . . . . . . . . . 629,068 28,921,151Sahara International Petrochemical Co. . . . . . . . . . . . . . . . . . . . . 1,406,208 14,412,170Saudi Basic Industries Corp.. . . . . . . . . . . . . . . . . . . . . . . . . . . . . . . 2,914,697 83,766,031Saudi Industrial Investment Group . . . . . . . . . . . . . . . . . . . . . . . . . 887,271 7,154,267Saudi Kayan Petrochemical Co.(a) . . . . . . . . . . . . . . . . . . . . . . . . . 1,546,909 6,841,258Yanbu National Petrochemical Co. . . . . . . . . . . . . . . . . . . . . . . . . . 605,518 10,281,346
169,636,756Commercial Services & Supplies — 0.4%Saudi Airlines Catering Co.(a) . . . . . . . . . . . . . . . . . . . . . . . . . . . . . . 178,983 3,845,884
Construction Materials — 3.5%Arabian Cement Co./Saudi Arabia . . . . . . . . . . . . . . . . . . . . . . . . . 258,804 2,552,444City Cement Co. . . . . . . . . . . . . . . . . . . . . . . . . . . . . . . . . . . . . . . . . . . 349,350 2,106,381Eastern Province Cement Co. . . . . . . . . . . . . . . . . . . . . . . . . . . . . . 222,015 2,559,481Najran Cement Co. . . . . . . . . . . . . . . . . . . . . . . . . . . . . . . . . . . . . . . . 505,476 2,410,374Northern Region Cement Co. . . . . . . . . . . . . . . . . . . . . . . . . . . . . . . 562,068 1,962,001Qassim Cement Co. (The). . . . . . . . . . . . . . . . . . . . . . . . . . . . . . . . . 199,568 3,888,586Riyadh Cement Co. . . . . . . . . . . . . . . . . . . . . . . . . . . . . . . . . . . . . . . . 79,655 660,160Saudi Cement Co. . . . . . . . . . . . . . . . . . . . . . . . . . . . . . . . . . . . . . . . . 324,837 4,807,856Southern Province Cement Co. . . . . . . . . . . . . . . . . . . . . . . . . . . . . 282,067 4,962,262Yamama Cement Co.(a) . . . . . . . . . . . . . . . . . . . . . . . . . . . . . . . . . . . 459,575 3,105,402Yanbu Cement Co.. . . . . . . . . . . . . . . . . . . . . . . . . . . . . . . . . . . . . . . . 351,667 3,243,330
32,258,277Diversified Consumer Services — 0.1%Ataa Educational Co., NVS . . . . . . . . . . . . . . . . . . . . . . . . . . . . . . . . 39,970 647,770National Co. for Learning & Education Ltd., NVS . . . . . . . . . . . 39,408 614,503
1,262,273Diversified Telecommunication Services — 4.7%Saudi Telecom Co. . . . . . . . . . . . . . . . . . . . . . . . . . . . . . . . . . . . . . . . . 1,491,456 44,128,269
Electric Utilities — 2.1%Saudi Electricity Co.. . . . . . . . . . . . . . . . . . . . . . . . . . . . . . . . . . . . . . . 3,053,310 19,172,825
Equity Real Estate Investment Trusts (REITs) — 0.2%Jadwa REIT Saudi Fund . . . . . . . . . . . . . . . . . . . . . . . . . . . . . . . . . . 480,692 1,932,198
Food & Staples Retailing — 0.6%Abdullah Al Othaim Markets Co. . . . . . . . . . . . . . . . . . . . . . . . . . . . 189,259 5,387,534
Food Products — 3.2%Al Jouf Agricultural Development Co.. . . . . . . . . . . . . . . . . . . . . . . 42,514 639,138
Security Shares
Value
Food Products (continued)Almarai Co. JSC . . . . . . . . . . . . . . . . . . . . . . . . . . . . . . . . . . . . . . . . . . 947,881 $ 12,089,803Aseer Trading Tourism & Manufacturing Co.(a) . . . . . . . . . . . . . . 426,409 2,023,158Halwani Brothers Co. . . . . . . . . . . . . . . . . . . . . . . . . . . . . . . . . . . . . . 42,575 868,160National Agriculture Development Co. (The)(a) . . . . . . . . . . . . . . 265,977 2,137,543Saudi Fisheries Co.(a) . . . . . . . . . . . . . . . . . . . . . . . . . . . . . . . . . . . . . 55,637 715,886Saudia Dairy & Foodstuff Co. . . . . . . . . . . . . . . . . . . . . . . . . . . . . . . 75,019 3,253,886Savola Group (The) . . . . . . . . . . . . . . . . . . . . . . . . . . . . . . . . . . . . . . . 1,021,185 8,455,013
30,182,587Gas Utilities — 0.3%National Gas & Industrialization Co.. . . . . . . . . . . . . . . . . . . . . . . . 217,593 3,239,986
Health Care Providers & Services — 3.1%Al Hammadi Co. for Development and Investment . . . . . . . . . . 309,596 3,218,425Dallah Healthcare Co. . . . . . . . . . . . . . . . . . . . . . . . . . . . . . . . . . . . . . 183,666 3,651,516Dr Sulaiman Al Habib Medical Services Group Co.. . . . . . . . . . 175,487 7,672,741Middle East Healthcare Co.. . . . . . . . . . . . . . . . . . . . . . . . . . . . . . . . 202,064 1,714,540Mouwasat Medical Services Co. . . . . . . . . . . . . . . . . . . . . . . . . . . . 193,891 8,793,734National Medical Care Co.. . . . . . . . . . . . . . . . . . . . . . . . . . . . . . . . . 129,917 2,139,938Saudi Chemical Co. Holding . . . . . . . . . . . . . . . . . . . . . . . . . . . . . . . 244,211 2,067,374
29,258,268Hotels, Restaurants & Leisure — 1.2%Dur Hospitality Co.(a) . . . . . . . . . . . . . . . . . . . . . . . . . . . . . . . . . . . . . . 254,617 2,103,936Herfy Food Services Co. . . . . . . . . . . . . . . . . . . . . . . . . . . . . . . . . . . 131,499 2,277,143Leejam Sports Co. JSC . . . . . . . . . . . . . . . . . . . . . . . . . . . . . . . . . . . 113,096 3,150,794Seera Group Holding(a). . . . . . . . . . . . . . . . . . . . . . . . . . . . . . . . . . . . 668,062 3,244,687
10,776,560Industrial Conglomerates — 0.1%Astra Industrial Group, NVS . . . . . . . . . . . . . . . . . . . . . . . . . . . . . . . 63,211 603,197
Insurance — 1.7%Al Rajhi Co. for Co-operative Insurance(a) . . . . . . . . . . . . . . . . . . 96,543 2,141,054Bupa Arabia for Cooperative Insurance Co. . . . . . . . . . . . . . . . . 231,267 8,322,061Co for Cooperative Insurance (The) . . . . . . . . . . . . . . . . . . . . . . . . 269,244 5,545,667
16,008,782IT Services — 0.1%Al Moammar Information Systems Co. . . . . . . . . . . . . . . . . . . . . . 22,808 899,772
Media — 0.8%Saudi Research & Media Group(a) . . . . . . . . . . . . . . . . . . . . . . . . . 168,583 7,146,724
Metals & Mining — 3.2%Saudi Arabian Mining Co.(a) . . . . . . . . . . . . . . . . . . . . . . . . . . . . . . . 1,562,139 29,772,081
Oil, Gas & Consumable Fuels — 5.6%Aldrees Petroleum and Transport Services Co. . . . . . . . . . . . . . 180,194 3,146,046Rabigh Refining & Petrochemical Co.(a) . . . . . . . . . . . . . . . . . . . . 964,285 5,630,586Saudi Arabia Refineries Co. . . . . . . . . . . . . . . . . . . . . . . . . . . . . . . . 20,335 695,169Saudi Arabian Oil Co.(b) . . . . . . . . . . . . . . . . . . . . . . . . . . . . . . . . . . . 4,668,911 43,088,875
52,560,676Pharmaceuticals — 0.3%Saudi Pharmaceutical Industries & Medical
Appliances Corp. . . . . . . . . . . . . . . . . . . . . . . . . . . . . . . . . . . . . . . . 291,902 2,903,360
Professional Services — 0.2%Maharah Human Resources Co. . . . . . . . . . . . . . . . . . . . . . . . . . . . 98,738 1,985,525
Real Estate Management & Development — 1.8%Arriyadh Development Co.. . . . . . . . . . . . . . . . . . . . . . . . . . . . . . . . . 464,940 3,234,602Dar Al Arkan Real Estate Development Co.(a). . . . . . . . . . . . . . . 2,296,164 5,591,346Emaar Economic City(a) . . . . . . . . . . . . . . . . . . . . . . . . . . . . . . . . . . . 1,772,578 5,235,144
Schedule of Investments (unaudited)
November 30, 2021
iShares� MSCI Saudi Arabia ETF(Percentages shown are based on Net Assets)
143NM0122U-1995964-145/159

Security Shares
Value
Real Estate Management & Development (continued)Saudi Real Estate Co.(a). . . . . . . . . . . . . . . . . . . . . . . . . . . . . . . . . . . 530,481 $ 2,943,974
17,005,066Road & Rail — 0.5%Saudi Public Transport Co.(a) . . . . . . . . . . . . . . . . . . . . . . . . . . . . . . 376,769 1,986,483United International Transportation Co.. . . . . . . . . . . . . . . . . . . . . 199,168 2,409,394
4,395,877Specialty Retail — 2.1%Fawaz Abdulaziz Al Hokair & Co.(a) . . . . . . . . . . . . . . . . . . . . . . . . 386,533 1,712,383Jarir Marketing Co.. . . . . . . . . . . . . . . . . . . . . . . . . . . . . . . . . . . . . . . . 225,477 11,116,275Saudi Co. For Hardware CJSC . . . . . . . . . . . . . . . . . . . . . . . . . . . . 111,248 1,420,402United Electronics Co.. . . . . . . . . . . . . . . . . . . . . . . . . . . . . . . . . . . . . 144,224 4,843,860
19,092,920Thrifts & Mortgage Finance — 0.1%Amlak International for Real Estate Finance Co. . . . . . . . . . . . . 108,315 610,925
Transportation Infrastructure — 0.5%Saudi Ground Services Co.(a). . . . . . . . . . . . . . . . . . . . . . . . . . . . . . 408,823 3,367,265Saudi Industrial Services Co. . . . . . . . . . . . . . . . . . . . . . . . . . . . . . . 122,430 954,547
4,321,812Water Utilities — 0.1%AlKhorayef Water & Power Technologies Co., NVS . . . . . . . . . 25,528 601,523
Wireless Telecommunication Services — 1.9%Etihad Etisalat Co. . . . . . . . . . . . . . . . . . . . . . . . . . . . . . . . . . . . . . . . . 1,443,751 12,083,853Mobile Telecommunications Co.(a) . . . . . . . . . . . . . . . . . . . . . . . . . 1,853,595 6,057,435
18,141,288
Total Common Stocks — 99.7%(Cost: $699,871,276) . . . . . . . . . . . . . . . . . . . . . . . . . . . . . . . . . . . . . . . . . . . . . . 929,351,665
Security Shares
Value
Short-Term InvestmentsMoney Market Funds — 0.3%BlackRock Cash Funds: Treasury, SL Agency Shares,
0.00%(c)(d) . . . . . . . . . . . . . . . . . . . . . . . . . . . . . . . . . . . . . . . . . . . . . 2,320,000 $ 2,320,000
Total Short-Term Investments — 0.3%(Cost: $2,320,000). . . . . . . . . . . . . . . . . . . . . . . . . . . . . . . . . . . . . . . . . . . . . . . . . 2,320,000
Total Investments in Securities — 100.0%(Cost: $702,191,276) . . . . . . . . . . . . . . . . . . . . . . . . . . . . . . . . . . . . . . . . . . . . . . 931,671,665
Other Assets, Less Liabilities — 0.0% . . . . . . . . . . . . . . . . . . . . . . . . . . . . . . . 73,275
Net Assets — 100.0% . . . . . . . . . . . . . . . . . . . . . . . . . . . . . . . . . . . . . . . . . . . . . . . . $ 931,744,940 (a) Non-income producing security.(b) Security exempt from registration pursuant to Rule 144A under the Securities Act of
1933, as amended. These securities may be resold in transactions exempt fromregistration to qualified institutional investors.
(c) Affiliate of the Fund.(d) Annualized 7-day yield as of period end.
Affiliates
Investments in issuers considered to be affiliate(s) of the Fund during the period ended November 30, 2021 for purposes of Section 2(a)(3) of the Investment Company Actof 1940, as amended, were as follows:
Affiliated IssuerValue at
08/31/21Purchases
at CostProceeds
from SalesNet Realized
Gain (Loss)
Change inUnrealized
Appreciation(Depreciation)
Value at11/30/21
SharesHeld at
11/30/21 Income
CapitalGain
Distributionsfrom
UnderlyingFunds
BlackRock Cash Funds: Treasury, SL Agency Shares . . . $3,190,000 $ — $(870,000)(a) $ — $ — $2,320,000 2,320,000 $ 18 $ —
(a) Represents net amount purchased (sold).
Derivative Financial Instruments Outstanding as of Period End
Futures Contracts
DescriptionNumber ofContracts
ExpirationDate
NotionalAmount
(000)
Value/Unrealized
Appreciation(Depreciation)
Long ContractsMSCI Emerging Markets Index . . . . . . . . . . . . . . . . . . . . . . . . . . . . . . . . . . . . . . . . . . . . . . . . . . . . . . . . . . . . . . . . . . . . . . . . . . . . . . . . . . . . . . . 38 12/17/21 $ 2,303 $ (102,690)
Schedule of Investments (unaudited) (continued)
November 30, 2021
iShares� MSCI Saudi Arabia ETF(Percentages shown are based on Net Assets)
144 NM0122U-1995964-146/159

Fair Value Measurements
Various inputs are used in determining the fair value of financial instruments. These inputs to valuation techniques are categorized into a fair value hierarchy consisting ofthree broad levels for financial reporting purposes as follows:
• Level 1 – Unadjusted price quotations in active markets/exchanges for identical assets or liabilities that each Fund has the ability to access;• Level 2 – Other observable inputs (including, but not limited to, quoted prices for similar assets or liabilities in markets that are active, quoted prices for identical or
similar assets or liabilities in markets that are not active, inputs other than quoted prices that are observable for the assets or liabilities (such as interest rates, yieldcurves, volatilities, prepayment speeds, loss severities, credit risks and default rates) or other market-corroborated inputs); and
• Level 3 – Unobservable inputs based on the best information available in the circumstances, to the extent observable inputs are not available (including the BlackRockGlobal Valuation Methodologies Committee’s (the “Global Valuation Committee’s”) assumptions used in determining the fair value of financial instruments).
The hierarchy gives the highest priority to unadjusted quoted prices in active markets for identical assets or liabilities (Level 1 measurements) and the lowest priority tounobservable inputs (Level 3 measurements). Accordingly, the degree of judgment exercised in determining fair value is greatest for instruments categorized in Level 3. Theinputs used to measure fair value may fall into different levels of the fair value hierarchy. In such cases, for disclosure purposes, the fair value hierarchy classification isdetermined based on the lowest level input that is significant to the fair value measurement in its entirety. Investments classified within Level 3 have significant unobservableinputs used by the Global Valuation Committee in determining the price for Fair Valued Investments. Level 3 investments include equity or debt issued by privately heldcompanies or funds. There may not be a secondary market, and/or there are a limited number of investors. The categorization of a value determined for financial instrumentsis based on the pricing transparency of the financial instruments and is not necessarily an indication of the risks associated with investing in those securities. For informationabout the Fund’s policy regarding valuation of financial instruments, refer to its most recent financial statements.
The following table summarizes the Fund’s financial instruments categorized in the fair value hierarchy. The breakdown of the Fund’s financial instruments into majorcategories is disclosed in the Schedule of Investments above.
Level 1 Level 2 Level 3 Total
InvestmentsAssets
Common Stocks. . . . . . . . . . . . . . . . . . . . . . . . . . . . . . . . . . . . . . . . . . . . . . . . . . . . . . . . . . . . . . . . . . . . . . . . . . . . . . . . . . . . $425,843,690 $503,507,975 $ — $929,351,665Money Market Funds . . . . . . . . . . . . . . . . . . . . . . . . . . . . . . . . . . . . . . . . . . . . . . . . . . . . . . . . . . . . . . . . . . . . . . . . . . . . . . . 2,320,000 — — 2,320,000
$428,163,690 $503,507,975 $ — $931,671,665
Derivative financial instruments(a)
LiabilitiesFutures Contracts . . . . . . . . . . . . . . . . . . . . . . . . . . . . . . . . . . . . . . . . . . . . . . . . . . . . . . . . . . . . . . . . . . . . . . . . . . . . . . . . . . $ (102,690) $ — $ — $ (102,690)
(a) Derivative financial instruments are futures contracts. Futures contracts are valued at the unrealized appreciation (depreciation) on the instrument.
Portfolio Abbreviations - Equity
JSC. . . . . . . . . . . . . . Joint Stock CompanyNVS . . . . . . . . . . . . . Non-Voting SharesREIT . . . . . . . . . . . . . Real Estate Investment Trust
Schedule of Investments (unaudited) (continued)
November 30, 2021
iShares� MSCI Saudi Arabia ETF
145NM0122U-1995964-147/159

Security Shares
Value
Common StocksAir Freight & Logistics — 2.3%Aramex PJSC. . . . . . . . . . . . . . . . . . . . . . . . . . . . . . . . . . . . . . . . . . . . . . 560,505 $ 592,486
Airlines — 2.3%Air Arabia PJSC(a). . . . . . . . . . . . . . . . . . . . . . . . . . . . . . . . . . . . . . . . . . 1,491,581 588,819
Banks — 38.2%Abu Dhabi Commercial Bank PJSC . . . . . . . . . . . . . . . . . . . . . . . . . 522,296 1,207,142Abu Dhabi Islamic Bank PJSC . . . . . . . . . . . . . . . . . . . . . . . . . . . . . . 602,709 1,063,285Dubai Islamic Bank PJSC . . . . . . . . . . . . . . . . . . . . . . . . . . . . . . . . . . 701,325 983,298Emirates NBD Bank PJSC. . . . . . . . . . . . . . . . . . . . . . . . . . . . . . . . . . 300,872 1,081,655First Abu Dhabi Bank PJSC. . . . . . . . . . . . . . . . . . . . . . . . . . . . . . . . . 1,084,362 5,647,820
9,983,200Building Products — 1.7%National Central Cooling Co. PJSC . . . . . . . . . . . . . . . . . . . . . . . . . 220,015 149,747Ras Al Khaimah Ceramics . . . . . . . . . . . . . . . . . . . . . . . . . . . . . . . . . . 380,782 287,160
436,907Capital Markets — 3.1%Dubai Financial Market PJSC(a) . . . . . . . . . . . . . . . . . . . . . . . . . . . . . 919,802 601,199SHUAA Capital PSC . . . . . . . . . . . . . . . . . . . . . . . . . . . . . . . . . . . . . . . 1,095,899 213,344
814,543Construction & Engineering — 0.4%Arabtec Holding PJSC(b). . . . . . . . . . . . . . . . . . . . . . . . . . . . . . . . . . . . 2,433,366 7Drake & Scull International PJSC(a)(b) . . . . . . . . . . . . . . . . . . . . . . . 2,972,998 104,817
104,824Diversified Financial Services — 3.4%Al Waha Capital PJSC. . . . . . . . . . . . . . . . . . . . . . . . . . . . . . . . . . . . . . 1,022,046 460,220Amanat Holdings PJSC(a). . . . . . . . . . . . . . . . . . . . . . . . . . . . . . . . . . . 1,080,462 336,497Gulf General Investment Co.(b). . . . . . . . . . . . . . . . . . . . . . . . . . . . . . 7,295,803 94,547
891,264Diversified Telecommunication Services — 26.1%Al Yah Satellite Communications Co.(a) . . . . . . . . . . . . . . . . . . . . . . 514,621 388,092Emirates Telecommunications Group Co. PJSC . . . . . . . . . . . . . 739,143 6,427,812
6,815,904Energy Equipment & Services — 0.4%Lamprell PLC . . . . . . . . . . . . . . . . . . . . . . . . . . . . . . . . . . . . . . . . . . . . . . 258,456 109,995
Food Products — 1.8%Agthia Group PJSC . . . . . . . . . . . . . . . . . . . . . . . . . . . . . . . . . . . . . . . . 311,764 477,069
Health Care Providers & Services — 0.0%NMC Health PLC(b). . . . . . . . . . . . . . . . . . . . . . . . . . . . . . . . . . . . . . . . . 112,588 2
Security Shares
Value
Industrial Conglomerates — 2.4%Dubai Investments PJSC . . . . . . . . . . . . . . . . . . . . . . . . . . . . . . . . . . . 1,242,492 $ 639,756
Oil, Gas & Consumable Fuels — 2.4%Dana Gas PJSC . . . . . . . . . . . . . . . . . . . . . . . . . . . . . . . . . . . . . . . . . . . 2,149,361 617,059
Real Estate Management & Development — 10.7%Aldar Properties PJSC . . . . . . . . . . . . . . . . . . . . . . . . . . . . . . . . . . . . . 1,017,234 1,111,893Deyaar Development PJSC. . . . . . . . . . . . . . . . . . . . . . . . . . . . . . . . . 744,318 85,311Emaar Development PJSC(a) . . . . . . . . . . . . . . . . . . . . . . . . . . . . . . . 21,106 26,280Emaar Properties PJSC . . . . . . . . . . . . . . . . . . . . . . . . . . . . . . . . . . . . 816,249 1,041,872Eshraq Investments PJSC . . . . . . . . . . . . . . . . . . . . . . . . . . . . . . . . . . 1,230,916 128,014RAK Properties PJSC . . . . . . . . . . . . . . . . . . . . . . . . . . . . . . . . . . . . . . 1,058,853 212,808Union Properties PJSC . . . . . . . . . . . . . . . . . . . . . . . . . . . . . . . . . . . . . 2,270,995 196,291
2,802,469Specialty Retail — 3.7%Abu Dhabi National Oil Co. for Distribution PJSC . . . . . . . . . . . . 855,500 964,246
Thrifts & Mortgage Finance — 0.5%Amlak Finance PJSC. . . . . . . . . . . . . . . . . . . . . . . . . . . . . . . . . . . . . . . 648,277 120,015
Total Common Stocks — 99.4%(Cost: $22,143,828). . . . . . . . . . . . . . . . . . . . . . . . . . . . . . . . . . . . . . . . . . . . . . . . . 25,958,558
Short-Term InvestmentsMoney Market Funds — 0.1%BlackRock Cash Funds: Treasury, SL Agency Shares,
0.00%(c)(d). . . . . . . . . . . . . . . . . . . . . . . . . . . . . . . . . . . . . . . . . . . . . . . 30,000 30,000
Total Short-Term Investments — 0.1%(Cost: $30,000) . . . . . . . . . . . . . . . . . . . . . . . . . . . . . . . . . . . . . . . . . . . . . . . . . . . . . 30,000
Total Investments in Securities — 99.5%(Cost: $22,173,828). . . . . . . . . . . . . . . . . . . . . . . . . . . . . . . . . . . . . . . . . . . . . . . . . 25,988,558
Other Assets, Less Liabilities — 0.5% . . . . . . . . . . . . . . . . . . . . . . . . . . . . . . . . 128,625
Net Assets — 100.0% . . . . . . . . . . . . . . . . . . . . . . . . . . . . . . . . . . . . . . . . . . . . . . . . . $ 26,117,183 (a) Non-income producing security.(b) Security is valued using significant unobservable inputs and is classified as Level 3 in the
fair value hierarchy.(c) Affiliate of the Fund.(d) Annualized 7-day yield as of period end.
Affiliates
Investments in issuers considered to be affiliate(s) of the Fund during the period ended November 30, 2021 for purposes of Section 2(a)(3) of the Investment Company Actof 1940, as amended, were as follows:
Affiliated IssuerValue at
08/31/21Purchases
at CostProceeds
from SalesNet Realized
Gain (Loss)
Change inUnrealized
Appreciation(Depreciation)
Value at11/30/21
SharesHeld at
11/30/21 Income
CapitalGain
Distributionsfrom
UnderlyingFunds
BlackRock Cash Funds: Treasury, SL Agency Shares. . . . . . . . . . $ 70,000 $ — $(40,000)(a) $ — $ — $ 30,000 30,000 $ 1 $ —
(a) Represents net amount purchased (sold).
Schedule of Investments (unaudited)
November 30, 2021
iShares� MSCI UAE ETF(Percentages shown are based on Net Assets)
146 NM0122U-1995964-148/159

Derivative Financial Instruments Outstanding as of Period End
Futures Contracts
DescriptionNumber ofContracts
ExpirationDate
NotionalAmount
(000)
Value/Unrealized
Appreciation(Depreciation)
Long ContractsMSCI Emerging Markets Index . . . . . . . . . . . . . . . . . . . . . . . . . . . . . . . . . . . . . . . . . . . . . . . . . . . . . . . . . . . . . . . . . . . . . . . . . . . . . . . . . . . . . . . 2 12/17/21 $ 121 $ (25)
Fair Value Measurements
Various inputs are used in determining the fair value of financial instruments. These inputs to valuation techniques are categorized into a fair value hierarchy consisting ofthree broad levels for financial reporting purposes as follows:
• Level 1 – Unadjusted price quotations in active markets/exchanges for identical assets or liabilities that each Fund has the ability to access;• Level 2 – Other observable inputs (including, but not limited to, quoted prices for similar assets or liabilities in markets that are active, quoted prices for identical or
similar assets or liabilities in markets that are not active, inputs other than quoted prices that are observable for the assets or liabilities (such as interest rates, yieldcurves, volatilities, prepayment speeds, loss severities, credit risks and default rates) or other market-corroborated inputs); and
• Level 3 – Unobservable inputs based on the best information available in the circumstances, to the extent observable inputs are not available (including the BlackRockGlobal Valuation Methodologies Committee’s (the “Global Valuation Committee’s”) assumptions used in determining the fair value of financial instruments).
The hierarchy gives the highest priority to unadjusted quoted prices in active markets for identical assets or liabilities (Level 1 measurements) and the lowest priority tounobservable inputs (Level 3 measurements). Accordingly, the degree of judgment exercised in determining fair value is greatest for instruments categorized in Level 3. Theinputs used to measure fair value may fall into different levels of the fair value hierarchy. In such cases, for disclosure purposes, the fair value hierarchy classification isdetermined based on the lowest level input that is significant to the fair value measurement in its entirety. Investments classified within Level 3 have significant unobservableinputs used by the Global Valuation Committee in determining the price for Fair Valued Investments. Level 3 investments include equity or debt issued by privately heldcompanies or funds. There may not be a secondary market, and/or there are a limited number of investors. The categorization of a value determined for financial instrumentsis based on the pricing transparency of the financial instruments and is not necessarily an indication of the risks associated with investing in those securities. For informationabout the Fund’s policy regarding valuation of financial instruments, refer to its most recent financial statements.
The following table summarizes the Fund’s financial instruments categorized in the fair value hierarchy. The breakdown of the Fund’s financial instruments into majorcategories is disclosed in the Schedule of Investments above.
Level 1 Level 2 Level 3 Total
InvestmentsAssets
Common Stocks . . . . . . . . . . . . . . . . . . . . . . . . . . . . . . . . . . . . . . . . . . . . . . . . . . . . . . . . . . . . . . . . . . . . . . . . . . . . . . . . . . . . . . . . $ 3,884,684 $21,874,501 $ 199,373 $25,958,558Money Market Funds. . . . . . . . . . . . . . . . . . . . . . . . . . . . . . . . . . . . . . . . . . . . . . . . . . . . . . . . . . . . . . . . . . . . . . . . . . . . . . . . . . . . 30,000 — — 30,000
$ 3,914,684 $21,874,501 $ 199,373 $25,988,558
Derivative financial instruments(a)
LiabilitiesFutures Contracts . . . . . . . . . . . . . . . . . . . . . . . . . . . . . . . . . . . . . . . . . . . . . . . . . . . . . . . . . . . . . . . . . . . . . . . . . . . . . . . . . . . . . . . $ (25) $ — $ — $ (25)
(a) Derivative financial instruments are futures contracts. Futures contracts are valued at the unrealized appreciation (depreciation) on the instrument.
Schedule of Investments (unaudited) (continued)
November 30, 2021
iShares� MSCI UAE ETF
147NM0122U-1995964-149/159

A reconciliation of Level 3 financial instruments is presented when the Fund had a significant amount of Level 3 investments and derivative financial instruments at thebeginning and/or end of the period in relation to net assets. The following table is a reconciliation of Level 3 investments for which significant unobservable inputs were usedin determining fair value:
Common Stocks
Opening balance, as of August 31, 2021 . . . . . . . . . . . . . . . . . . . . . . . . . . . . . . . . . . . . . . . . . . . . . . . . . . . . . . . . . . . . . . . . . . . . . . . . . . . . . . . . . . . . . . . . . . . . . . . . . . . . . . . . . . . . . . . . . . . $226,161Transfers into Level 3. . . . . . . . . . . . . . . . . . . . . . . . . . . . . . . . . . . . . . . . . . . . . . . . . . . . . . . . . . . . . . . . . . . . . . . . . . . . . . . . . . . . . . . . . . . . . . . . . . . . . . . . . . . . . . . . . . . . . . . . . . . . . . . . . . . —Transfers out of Level 3. . . . . . . . . . . . . . . . . . . . . . . . . . . . . . . . . . . . . . . . . . . . . . . . . . . . . . . . . . . . . . . . . . . . . . . . . . . . . . . . . . . . . . . . . . . . . . . . . . . . . . . . . . . . . . . . . . . . . . . . . . . . . . . . . —Accrued discounts/premiums . . . . . . . . . . . . . . . . . . . . . . . . . . . . . . . . . . . . . . . . . . . . . . . . . . . . . . . . . . . . . . . . . . . . . . . . . . . . . . . . . . . . . . . . . . . . . . . . . . . . . . . . . . . . . . . . . . . . . . . . . . . —Net realized gain (loss) . . . . . . . . . . . . . . . . . . . . . . . . . . . . . . . . . . . . . . . . . . . . . . . . . . . . . . . . . . . . . . . . . . . . . . . . . . . . . . . . . . . . . . . . . . . . . . . . . . . . . . . . . . . . . . . . . . . . . . . . . . . . . . . . . —Net change in unrealized appreciation (depreciation)(a) . . . . . . . . . . . . . . . . . . . . . . . . . . . . . . . . . . . . . . . . . . . . . . . . . . . . . . . . . . . . . . . . . . . . . . . . . . . . . . . . . . . . . . . . . . . . . . . . . . . (26,788)Purchases . . . . . . . . . . . . . . . . . . . . . . . . . . . . . . . . . . . . . . . . . . . . . . . . . . . . . . . . . . . . . . . . . . . . . . . . . . . . . . . . . . . . . . . . . . . . . . . . . . . . . . . . . . . . . . . . . . . . . . . . . . . . . . . . . . . . . . . . . . . . . —Sales . . . . . . . . . . . . . . . . . . . . . . . . . . . . . . . . . . . . . . . . . . . . . . . . . . . . . . . . . . . . . . . . . . . . . . . . . . . . . . . . . . . . . . . . . . . . . . . . . . . . . . . . . . . . . . . . . . . . . . . . . . . . . . . . . . . . . . . . . . . . . . . . . . —
Closing balance, as of November 30, 2021 . . . . . . . . . . . . . . . . . . . . . . . . . . . . . . . . . . . . . . . . . . . . . . . . . . . . . . . . . . . . . . . . . . . . . . . . . . . . . . . . . . . . . . . . . . . . . . . . . . . . . . . . . . . . . . . . . $199,373
Net change in unrealized appreciation (depreciation) on investments still held at November 30, 2021(a) . . . . . . . . . . . . . . . . . . . . . . . . . . . . . . . . . . . . . . . . . . . . . . . . . . . . . . . $ (26,788)(a) Any difference between net change in unrealized appreciation (depreciation) and net change in unrealized appreciation (depreciation) on investments stillheld at November 30, 2021 is generally due to investments no longer held or categorized as Level 3 at period end.
Portfolio Abbreviations - Equity
PJSC . . . . . . . . . . . . Public Joint Stock Company
Schedule of Investments (unaudited) (continued)
November 30, 2021
iShares� MSCI UAE ETF
148 NM0122U-1995964-150/159

Security Shares
Value
Common StocksAerospace & Defense — 1.6%BAE Systems PLC . . . . . . . . . . . . . . . . . . . . . . . . . . . . . . . . . . . . . 3,734,375 $ 27,196,877Rolls-Royce Holdings PLC(a) . . . . . . . . . . . . . . . . . . . . . . . . . . . 9,701,303 15,826,168
43,023,045Banks — 9.6%Barclays PLC . . . . . . . . . . . . . . . . . . . . . . . . . . . . . . . . . . . . . . . . . . 19,698,112 48,096,467HSBC Holdings PLC . . . . . . . . . . . . . . . . . . . . . . . . . . . . . . . . . . . 23,744,396 131,220,987Lloyds Banking Group PLC. . . . . . . . . . . . . . . . . . . . . . . . . . . . . 82,508,821 51,233,274Natwest Group PLC. . . . . . . . . . . . . . . . . . . . . . . . . . . . . . . . . . . . 6,695,349 18,865,572Standard Chartered PLC . . . . . . . . . . . . . . . . . . . . . . . . . . . . . . . 3,063,357 16,858,001
266,274,301Beverages — 5.2%Coca-Cola HBC AG, Class DI . . . . . . . . . . . . . . . . . . . . . . . . . . 232,737 7,167,222Diageo PLC . . . . . . . . . . . . . . . . . . . . . . . . . . . . . . . . . . . . . . . . . . . 2,713,072 136,923,949
144,091,171Capital Markets — 3.2%3i Group PLC . . . . . . . . . . . . . . . . . . . . . . . . . . . . . . . . . . . . . . . . . . 1,129,584 20,725,537Abrdn PLC . . . . . . . . . . . . . . . . . . . . . . . . . . . . . . . . . . . . . . . . . . . . 2,536,051 7,841,502Hargreaves Lansdown PLC . . . . . . . . . . . . . . . . . . . . . . . . . . . . 413,995 7,348,084London Stock Exchange Group PLC . . . . . . . . . . . . . . . . . . . . 382,393 33,126,983Schroders PLC . . . . . . . . . . . . . . . . . . . . . . . . . . . . . . . . . . . . . . . . 144,682 6,598,057St. James's Place PLC . . . . . . . . . . . . . . . . . . . . . . . . . . . . . . . . . 627,474 12,919,968
88,560,131Chemicals — 1.0%Croda International PLC. . . . . . . . . . . . . . . . . . . . . . . . . . . . . . . . 162,188 21,750,853Johnson Matthey PLC. . . . . . . . . . . . . . . . . . . . . . . . . . . . . . . . . . 225,894 6,275,788
28,026,641Commercial Services & Supplies — 0.6%Rentokil Initial PLC. . . . . . . . . . . . . . . . . . . . . . . . . . . . . . . . . . . . . 2,157,443 17,569,453
Diversified Financial Services — 0.3%M&G PLC . . . . . . . . . . . . . . . . . . . . . . . . . . . . . . . . . . . . . . . . . . . . . 2,994,754 7,432,814
Diversified Telecommunication Services — 0.8%BT Group PLC(a) . . . . . . . . . . . . . . . . . . . . . . . . . . . . . . . . . . . . . . . 10,376,545 21,843,602
Electric Utilities — 0.9%SSE PLC . . . . . . . . . . . . . . . . . . . . . . . . . . . . . . . . . . . . . . . . . . . . . . 1,212,738 24,932,533
Electronic Equipment, Instruments & Components — 0.6%Halma PLC . . . . . . . . . . . . . . . . . . . . . . . . . . . . . . . . . . . . . . . . . . . . 439,252 17,508,879
Equity Real Estate Investment Trusts (REITs) — 1.5%British Land Co. PLC (The) . . . . . . . . . . . . . . . . . . . . . . . . . . . . . 1,023,735 6,921,852Land Securities Group PLC . . . . . . . . . . . . . . . . . . . . . . . . . . . . 818,864 7,893,358Segro PLC . . . . . . . . . . . . . . . . . . . . . . . . . . . . . . . . . . . . . . . . . . . . 1,395,229 26,075,667
40,890,877Food & Staples Retailing — 2.0%J Sainsbury PLC . . . . . . . . . . . . . . . . . . . . . . . . . . . . . . . . . . . . . . . 2,033,332 7,470,159Ocado Group PLC(a) . . . . . . . . . . . . . . . . . . . . . . . . . . . . . . . . . . . 567,298 13,542,777Tesco PLC. . . . . . . . . . . . . . . . . . . . . . . . . . . . . . . . . . . . . . . . . . . . . 8,970,918 33,088,877
54,101,813Food Products — 0.4%Associated British Foods PLC . . . . . . . . . . . . . . . . . . . . . . . . . . 412,644 10,532,923
Health Care Equipment & Supplies — 0.6%Smith & Nephew PLC . . . . . . . . . . . . . . . . . . . . . . . . . . . . . . . . . . 1,019,840 16,390,218
Health Care Providers & Services — 0.0%NMC Health PLC(b) . . . . . . . . . . . . . . . . . . . . . . . . . . . . . . . . . . . . 122,262 2
Security Shares
Value
Hotels, Restaurants & Leisure — 2.8%Compass Group PLC(a) . . . . . . . . . . . . . . . . . . . . . . . . . . . . . . . . 2,073,863 $ 40,456,624Entain PLC(a) . . . . . . . . . . . . . . . . . . . . . . . . . . . . . . . . . . . . . . . . . . 680,727 15,130,615InterContinental Hotels Group PLC(a) . . . . . . . . . . . . . . . . . . . 212,249 12,611,483Whitbread PLC(a) . . . . . . . . . . . . . . . . . . . . . . . . . . . . . . . . . . . . . . 233,829 8,716,122
76,914,844Household Durables — 1.5%Barratt Developments PLC . . . . . . . . . . . . . . . . . . . . . . . . . . . . . 1,180,218 10,929,823Berkeley Group Holdings PLC . . . . . . . . . . . . . . . . . . . . . . . . . . 130,651 7,437,386Persimmon PLC . . . . . . . . . . . . . . . . . . . . . . . . . . . . . . . . . . . . . . . 370,944 13,480,366Taylor Wimpey PLC . . . . . . . . . . . . . . . . . . . . . . . . . . . . . . . . . . . . 4,238,985 8,902,896
40,750,471Household Products — 2.4%Reckitt Benckiser Group PLC. . . . . . . . . . . . . . . . . . . . . . . . . . . 830,248 67,252,576
Industrial Conglomerates — 1.0%DCC PLC. . . . . . . . . . . . . . . . . . . . . . . . . . . . . . . . . . . . . . . . . . . . . . 114,332 8,421,189Melrose Industries PLC . . . . . . . . . . . . . . . . . . . . . . . . . . . . . . . . 5,078,183 9,756,282Smiths Group PLC . . . . . . . . . . . . . . . . . . . . . . . . . . . . . . . . . . . . . 460,926 8,803,323
26,980,794Insurance — 4.2%Admiral Group PLC . . . . . . . . . . . . . . . . . . . . . . . . . . . . . . . . . . . . 223,171 8,773,779Aviva PLC . . . . . . . . . . . . . . . . . . . . . . . . . . . . . . . . . . . . . . . . . . . . . 4,546,065 23,201,571Legal & General Group PLC. . . . . . . . . . . . . . . . . . . . . . . . . . . . 6,939,800 25,926,380Phoenix Group Holdings PLC. . . . . . . . . . . . . . . . . . . . . . . . . . . 758,295 6,439,064Prudential PLC . . . . . . . . . . . . . . . . . . . . . . . . . . . . . . . . . . . . . . . . 3,040,513 51,358,065
115,698,859Interactive Media & Services — 0.4%Auto Trader Group PLC(c) . . . . . . . . . . . . . . . . . . . . . . . . . . . . . . 1,121,527 10,894,101
Machinery — 0.6%Spirax-Sarco Engineering PLC . . . . . . . . . . . . . . . . . . . . . . . . . 85,638 17,768,917
Media — 1.3%Informa PLC(a) . . . . . . . . . . . . . . . . . . . . . . . . . . . . . . . . . . . . . . . . . 1,736,985 10,756,614Pearson PLC . . . . . . . . . . . . . . . . . . . . . . . . . . . . . . . . . . . . . . . . . . 879,512 6,954,639WPP PLC . . . . . . . . . . . . . . . . . . . . . . . . . . . . . . . . . . . . . . . . . . . . . 1,386,198 19,240,583
36,951,836Metals & Mining — 9.8%Anglo American PLC . . . . . . . . . . . . . . . . . . . . . . . . . . . . . . . . . . . 1,502,154 55,294,054Antofagasta PLC. . . . . . . . . . . . . . . . . . . . . . . . . . . . . . . . . . . . . . . 457,922 8,372,094BHP Group PLC . . . . . . . . . . . . . . . . . . . . . . . . . . . . . . . . . . . . . . . 2,455,174 67,090,196Evraz PLC. . . . . . . . . . . . . . . . . . . . . . . . . . . . . . . . . . . . . . . . . . . . . 596,574 4,547,874Glencore PLC . . . . . . . . . . . . . . . . . . . . . . . . . . . . . . . . . . . . . . . . . 11,607,893 55,111,865Rio Tinto PLC. . . . . . . . . . . . . . . . . . . . . . . . . . . . . . . . . . . . . . . . . . 1,305,535 80,034,658
270,450,741Multi-Utilities — 2.0%National Grid PLC . . . . . . . . . . . . . . . . . . . . . . . . . . . . . . . . . . . . . 4,204,855 55,794,443
Multiline Retail — 0.6%Next PLC. . . . . . . . . . . . . . . . . . . . . . . . . . . . . . . . . . . . . . . . . . . . . . 153,984 16,087,467
Oil, Gas & Consumable Fuels — 10.5%BP PLC . . . . . . . . . . . . . . . . . . . . . . . . . . . . . . . . . . . . . . . . . . . . . . . 23,388,592 101,476,699Royal Dutch Shell PLC, Class A . . . . . . . . . . . . . . . . . . . . . . . . 4,767,481 99,732,682Royal Dutch Shell PLC, Class B . . . . . . . . . . . . . . . . . . . . . . . . 4,279,992 89,691,216
290,900,597Paper & Forest Products — 0.5%Mondi PLC . . . . . . . . . . . . . . . . . . . . . . . . . . . . . . . . . . . . . . . . . . . . 561,108 12,817,487
Schedule of Investments (unaudited)
November 30, 2021
iShares� MSCI United Kingdom ETF(Percentages shown are based on Net Assets)
149NM0122U-1995964-151/159

Security Shares
Value
Personal Products — 5.6%Unilever PLC . . . . . . . . . . . . . . . . . . . . . . . . . . . . . . . . . . . . . . . . . . 3,016,540 $ 154,063,686
Pharmaceuticals — 11.6%AstraZeneca PLC . . . . . . . . . . . . . . . . . . . . . . . . . . . . . . . . . . . . . . 1,800,772 197,427,196GlaxoSmithKline PLC . . . . . . . . . . . . . . . . . . . . . . . . . . . . . . . . . . 5,849,112 118,755,064Hikma Pharmaceuticals PLC . . . . . . . . . . . . . . . . . . . . . . . . . . . 201,822 5,932,272
322,114,532Professional Services — 4.7%Experian PLC. . . . . . . . . . . . . . . . . . . . . . . . . . . . . . . . . . . . . . . . . . 1,071,715 48,115,553Intertek Group PLC . . . . . . . . . . . . . . . . . . . . . . . . . . . . . . . . . . . . 186,746 13,224,353RELX PLC. . . . . . . . . . . . . . . . . . . . . . . . . . . . . . . . . . . . . . . . . . . . . 2,247,937 69,732,428
131,072,334Software — 0.7%AVEVA Group PLC. . . . . . . . . . . . . . . . . . . . . . . . . . . . . . . . . . . . . 140,055 5,977,976Sage Group PLC (The). . . . . . . . . . . . . . . . . . . . . . . . . . . . . . . . . 1,224,752 12,568,866
18,546,842Specialty Retail — 0.7%JD Sports Fashion PLC . . . . . . . . . . . . . . . . . . . . . . . . . . . . . . . . 2,998,745 8,868,254Kingfisher PLC. . . . . . . . . . . . . . . . . . . . . . . . . . . . . . . . . . . . . . . . . 2,454,532 10,314,497
19,182,751Textiles, Apparel & Luxury Goods — 0.4%Burberry Group PLC . . . . . . . . . . . . . . . . . . . . . . . . . . . . . . . . . . . 470,651 11,054,114
Tobacco — 3.9%British American Tobacco PLC. . . . . . . . . . . . . . . . . . . . . . . . . . 2,534,025 84,806,754Imperial Brands PLC . . . . . . . . . . . . . . . . . . . . . . . . . . . . . . . . . . . 1,097,486 22,428,999
107,235,753Trading Companies & Distributors — 3.5%Ashtead Group PLC. . . . . . . . . . . . . . . . . . . . . . . . . . . . . . . . . . . . 520,409 41,865,908Bunzl PLC. . . . . . . . . . . . . . . . . . . . . . . . . . . . . . . . . . . . . . . . . . . . . 392,100 14,918,975Ferguson PLC . . . . . . . . . . . . . . . . . . . . . . . . . . . . . . . . . . . . . . . . . 258,434 39,340,795
96,125,678
Security Shares
Value
Water Utilities — 0.8%Severn Trent PLC. . . . . . . . . . . . . . . . . . . . . . . . . . . . . . . . . . . . . . 290,866 $ 11,144,562United Utilities Group PLC. . . . . . . . . . . . . . . . . . . . . . . . . . . . . . 789,516 11,339,718
22,484,280Wireless Telecommunication Services — 1.7%Vodafone Group PLC . . . . . . . . . . . . . . . . . . . . . . . . . . . . . . . . . . 32,145,357 46,604,885
Total Common Stocks — 99.5%(Cost: $3,207,013,248). . . . . . . . . . . . . . . . . . . . . . . . . . . . . . . . . . . . . . . . . . . 2,748,926,391
Short-Term InvestmentsMoney Market Funds — 0.0%BlackRock Cash Funds: Treasury, SL Agency Shares,
0.00%(d)(e) . . . . . . . . . . . . . . . . . . . . . . . . . . . . . . . . . . . . . . . . . . 1,430,000 1,430,000
Total Short-Term Investments — 0.0%(Cost: $1,430,000) . . . . . . . . . . . . . . . . . . . . . . . . . . . . . . . . . . . . . . . . . . . . . . . 1,430,000
Total Investments in Securities — 99.5%(Cost: $3,208,443,248). . . . . . . . . . . . . . . . . . . . . . . . . . . . . . . . . . . . . . . . . . . 2,750,356,391
Other Assets, Less Liabilities — 0.5% . . . . . . . . . . . . . . . . . . . . . . . . . . . . . 13,007,043
Net Assets — 100.0% . . . . . . . . . . . . . . . . . . . . . . . . . . . . . . . . . . . . . . . . . . . . . . $ 2,763,363,434 (a) Non-income producing security.(b) Security is valued using significant unobservable inputs and is classified as Level 3 in the
fair value hierarchy.(c) Security exempt from registration pursuant to Rule 144A under the Securities Act of
1933, as amended. These securities may be resold in transactions exempt fromregistration to qualified institutional investors.
(d) Affiliate of the Fund.(e) Annualized 7-day yield as of period end.
Affiliates
Investments in issuers considered to be affiliate(s) of the Fund during the period ended November 30, 2021 for purposes of Section 2(a)(3) of the Investment Company Actof 1940, as amended, were as follows:
Affiliated IssuerValue at
08/31/21Purchases
at CostProceeds
from SalesNet Realized
Gain (Loss)
Change inUnrealized
Appreciation(Depreciation)
Value at11/30/21
SharesHeld at
11/30/21 Income
CapitalGain
Distributionsfrom
UnderlyingFunds
BlackRock Cash Funds: Treasury, SL Agency Shares . . . $1,420,000 $ 10,000(a) $ — $ — $ — $1,430,000 1,430,000 $ 16 $ —
(a) Represents net amount purchased (sold).
Derivative Financial Instruments Outstanding as of Period End
Futures Contracts
DescriptionNumber ofContracts
ExpirationDate
NotionalAmount
(000)
Value/Unrealized
Appreciation(Depreciation)
Long ContractsFTSE 100 Index . . . . . . . . . . . . . . . . . . . . . . . . . . . . . . . . . . . . . . . . . . . . . . . . . . . . . . . . . . . . . . . . . . . . . . . . . . . . . . . . . . . . . . . . . . . . . . . . . . . . . 142 12/17/21 $13,337 $ (147,580)
Schedule of Investments (unaudited) (continued)
November 30, 2021
iShares� MSCI United Kingdom ETF(Percentages shown are based on Net Assets)
150 NM0122U-1995964-152/159
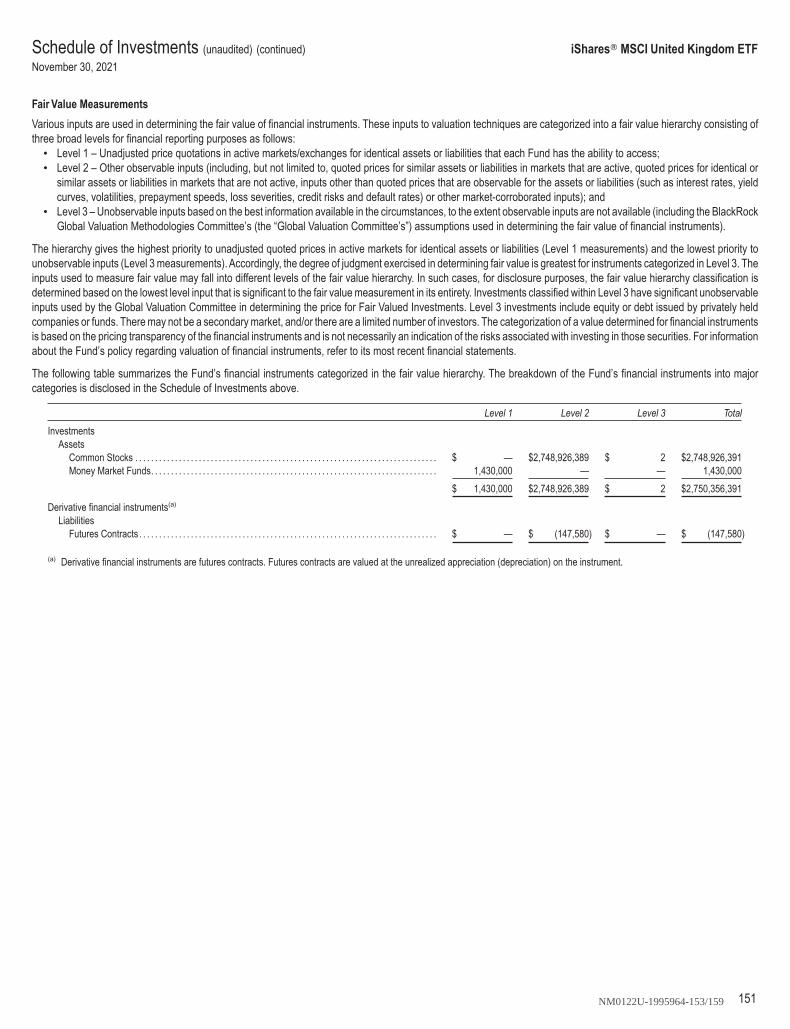
Fair Value Measurements
Various inputs are used in determining the fair value of financial instruments. These inputs to valuation techniques are categorized into a fair value hierarchy consisting ofthree broad levels for financial reporting purposes as follows:
• Level 1 – Unadjusted price quotations in active markets/exchanges for identical assets or liabilities that each Fund has the ability to access;• Level 2 – Other observable inputs (including, but not limited to, quoted prices for similar assets or liabilities in markets that are active, quoted prices for identical or
similar assets or liabilities in markets that are not active, inputs other than quoted prices that are observable for the assets or liabilities (such as interest rates, yieldcurves, volatilities, prepayment speeds, loss severities, credit risks and default rates) or other market-corroborated inputs); and
• Level 3 – Unobservable inputs based on the best information available in the circumstances, to the extent observable inputs are not available (including the BlackRockGlobal Valuation Methodologies Committee’s (the “Global Valuation Committee’s”) assumptions used in determining the fair value of financial instruments).
The hierarchy gives the highest priority to unadjusted quoted prices in active markets for identical assets or liabilities (Level 1 measurements) and the lowest priority tounobservable inputs (Level 3 measurements). Accordingly, the degree of judgment exercised in determining fair value is greatest for instruments categorized in Level 3. Theinputs used to measure fair value may fall into different levels of the fair value hierarchy. In such cases, for disclosure purposes, the fair value hierarchy classification isdetermined based on the lowest level input that is significant to the fair value measurement in its entirety. Investments classified within Level 3 have significant unobservableinputs used by the Global Valuation Committee in determining the price for Fair Valued Investments. Level 3 investments include equity or debt issued by privately heldcompanies or funds. There may not be a secondary market, and/or there are a limited number of investors. The categorization of a value determined for financial instrumentsis based on the pricing transparency of the financial instruments and is not necessarily an indication of the risks associated with investing in those securities. For informationabout the Fund’s policy regarding valuation of financial instruments, refer to its most recent financial statements.
The following table summarizes the Fund’s financial instruments categorized in the fair value hierarchy. The breakdown of the Fund’s financial instruments into majorcategories is disclosed in the Schedule of Investments above.
Level 1 Level 2 Level 3 Total
InvestmentsAssets
Common Stocks . . . . . . . . . . . . . . . . . . . . . . . . . . . . . . . . . . . . . . . . . . . . . . . . . . . . . . . . . . . . . . . . . . . . . . . . . . . . $ — $2,748,926,389 $ 2 $2,748,926,391Money Market Funds. . . . . . . . . . . . . . . . . . . . . . . . . . . . . . . . . . . . . . . . . . . . . . . . . . . . . . . . . . . . . . . . . . . . . . . . 1,430,000 — — 1,430,000
$ 1,430,000 $2,748,926,389 $ 2 $2,750,356,391
Derivative financial instruments(a)
LiabilitiesFutures Contracts. . . . . . . . . . . . . . . . . . . . . . . . . . . . . . . . . . . . . . . . . . . . . . . . . . . . . . . . . . . . . . . . . . . . . . . . . . . $ — $ (147,580) $ — $ (147,580)
(a) Derivative financial instruments are futures contracts. Futures contracts are valued at the unrealized appreciation (depreciation) on the instrument.
Schedule of Investments (unaudited) (continued)
November 30, 2021
iShares� MSCI United Kingdom ETF
151NM0122U-1995964-153/159

Security Shares
Value
Common StocksAerospace & Defense — 2.9%Avon Protection PLC . . . . . . . . . . . . . . . . . . . . . . . . . . . . . . . . . . . . . . 5,981 $ 85,271Babcock International Group PLC. . . . . . . . . . . . . . . . . . . . . . . . . . 48,873 192,138Chemring Group PLC . . . . . . . . . . . . . . . . . . . . . . . . . . . . . . . . . . . . . 54,695 200,522Meggitt PLC . . . . . . . . . . . . . . . . . . . . . . . . . . . . . . . . . . . . . . . . . . . . . . 151,062 1,477,218QinetiQ Group PLC . . . . . . . . . . . . . . . . . . . . . . . . . . . . . . . . . . . . . . . 111,889 385,836Senior PLC . . . . . . . . . . . . . . . . . . . . . . . . . . . . . . . . . . . . . . . . . . . . . . . 81,085 141,916Ultra Electronics Holdings PLC . . . . . . . . . . . . . . . . . . . . . . . . . . . . 13,793 566,403
3,049,304Air Freight & Logistics — 1.0%Royal Mail PLC . . . . . . . . . . . . . . . . . . . . . . . . . . . . . . . . . . . . . . . . . . . 154,661 1,030,042
Airlines — 0.8%easyJet PLC. . . . . . . . . . . . . . . . . . . . . . . . . . . . . . . . . . . . . . . . . . . . . . 58,617 387,659JET2 PLC . . . . . . . . . . . . . . . . . . . . . . . . . . . . . . . . . . . . . . . . . . . . . . . . 31,119 404,479
792,138Auto Components — 0.2%AB Dynamics PLC . . . . . . . . . . . . . . . . . . . . . . . . . . . . . . . . . . . . . . . . 3,034 64,965TI Fluid Systems PLC(a) . . . . . . . . . . . . . . . . . . . . . . . . . . . . . . . . . . . 45,262 131,965
196,930Automobiles — 0.3%Aston Martin Lagonda Global Holdings PLC(a) . . . . . . . . . . . . . . 13,480 266,226
Banks — 1.3%Bank of Georgia Group PLC. . . . . . . . . . . . . . . . . . . . . . . . . . . . . . . 7,605 155,962Close Brothers Group PLC . . . . . . . . . . . . . . . . . . . . . . . . . . . . . . . . 29,154 499,743TBC Bank Group PLC. . . . . . . . . . . . . . . . . . . . . . . . . . . . . . . . . . . . . 7,997 165,490Virgin Money UK PLC . . . . . . . . . . . . . . . . . . . . . . . . . . . . . . . . . . . . . 250,550 562,470
1,383,665Beverages — 1.6%AG Barr PLC . . . . . . . . . . . . . . . . . . . . . . . . . . . . . . . . . . . . . . . . . . . . . 17,327 121,673Britvic PLC . . . . . . . . . . . . . . . . . . . . . . . . . . . . . . . . . . . . . . . . . . . . . . . 51,663 611,512C&C Group PLC(b) . . . . . . . . . . . . . . . . . . . . . . . . . . . . . . . . . . . . . . . . 75,956 229,310Fevertree Drinks PLC . . . . . . . . . . . . . . . . . . . . . . . . . . . . . . . . . . . . . 20,278 698,490
1,660,985Biotechnology — 1.9%Abcam PLC . . . . . . . . . . . . . . . . . . . . . . . . . . . . . . . . . . . . . . . . . . . . . . 41,648 944,395Avacta Group PLC . . . . . . . . . . . . . . . . . . . . . . . . . . . . . . . . . . . . . . . . 49,799 76,695Genus PLC . . . . . . . . . . . . . . . . . . . . . . . . . . . . . . . . . . . . . . . . . . . . . . . 12,713 815,446Oxford Biomedica PLC . . . . . . . . . . . . . . . . . . . . . . . . . . . . . . . . . . . . 11,178 195,936
2,032,472Building Products — 0.8%Genuit Group PLC . . . . . . . . . . . . . . . . . . . . . . . . . . . . . . . . . . . . . . . . 47,881 369,438Tyman PLC. . . . . . . . . . . . . . . . . . . . . . . . . . . . . . . . . . . . . . . . . . . . . . . 37,939 194,007Volution Group PLC . . . . . . . . . . . . . . . . . . . . . . . . . . . . . . . . . . . . . . . 38,264 253,937
817,382Capital Markets — 8.6%AJ Bell PLC . . . . . . . . . . . . . . . . . . . . . . . . . . . . . . . . . . . . . . . . . . . . . . 59,519 307,130Alpha FX Group PLC. . . . . . . . . . . . . . . . . . . . . . . . . . . . . . . . . . . . . . 5,542 142,252Ashmore Group PLC . . . . . . . . . . . . . . . . . . . . . . . . . . . . . . . . . . . . . . 89,565 355,760Brewin Dolphin Holdings PLC . . . . . . . . . . . . . . . . . . . . . . . . . . . . . 58,675 266,879Bridgepoint Group PLC(a). . . . . . . . . . . . . . . . . . . . . . . . . . . . . . . . . . 39,790 258,243CMC Markets PLC(a) . . . . . . . . . . . . . . . . . . . . . . . . . . . . . . . . . . . . . . 25,150 77,934IG Group Holdings PLC . . . . . . . . . . . . . . . . . . . . . . . . . . . . . . . . . . . 75,091 772,811Impax Asset Management Group PLC . . . . . . . . . . . . . . . . . . . . . 16,662 293,837IntegraFin Holdings PLC . . . . . . . . . . . . . . . . . . . . . . . . . . . . . . . . . . 54,446 417,681Intermediate Capital Group PLC . . . . . . . . . . . . . . . . . . . . . . . . . . . 56,171 1,560,407Investec PLC . . . . . . . . . . . . . . . . . . . . . . . . . . . . . . . . . . . . . . . . . . . . . 134,571 672,937
Security Shares
Value
Capital Markets (continued)IP Group PLC. . . . . . . . . . . . . . . . . . . . . . . . . . . . . . . . . . . . . . . . . . . . . 195,192 $ 299,573JTC PLC(a) . . . . . . . . . . . . . . . . . . . . . . . . . . . . . . . . . . . . . . . . . . . . . . . 25,361 288,045Jupiter Fund Management PLC. . . . . . . . . . . . . . . . . . . . . . . . . . . . 85,537 267,014Liontrust Asset Management PLC. . . . . . . . . . . . . . . . . . . . . . . . . . 11,842 322,073Man Group PLC . . . . . . . . . . . . . . . . . . . . . . . . . . . . . . . . . . . . . . . . . . 275,806 786,437Ninety One PLC . . . . . . . . . . . . . . . . . . . . . . . . . . . . . . . . . . . . . . . . . . 66,204 221,353Numis Corp. PLC . . . . . . . . . . . . . . . . . . . . . . . . . . . . . . . . . . . . . . . . . 13,893 60,420Polar Capital Holdings PLC(c) . . . . . . . . . . . . . . . . . . . . . . . . . . . . . . 14,516 154,251Quilter PLC(a) . . . . . . . . . . . . . . . . . . . . . . . . . . . . . . . . . . . . . . . . . . . . . 329,846 616,769Rathbone Brothers PLC . . . . . . . . . . . . . . . . . . . . . . . . . . . . . . . . . . . 11,778 289,787Sanne Group PLC . . . . . . . . . . . . . . . . . . . . . . . . . . . . . . . . . . . . . . . . 31,354 378,629TP ICAP Group PLC . . . . . . . . . . . . . . . . . . . . . . . . . . . . . . . . . . . . . . 152,471 257,205
9,067,427Chemicals — 1.3%Elementis PLC. . . . . . . . . . . . . . . . . . . . . . . . . . . . . . . . . . . . . . . . . . . . 112,463 201,920Essentra PLC. . . . . . . . . . . . . . . . . . . . . . . . . . . . . . . . . . . . . . . . . . . . . 58,324 236,086Synthomer PLC. . . . . . . . . . . . . . . . . . . . . . . . . . . . . . . . . . . . . . . . . . . 65,708 411,075Victrex PLC. . . . . . . . . . . . . . . . . . . . . . . . . . . . . . . . . . . . . . . . . . . . . . . 16,810 513,305
1,362,386Commercial Services & Supplies — 2.4%Biffa PLC(a) . . . . . . . . . . . . . . . . . . . . . . . . . . . . . . . . . . . . . . . . . . . . . . . 59,082 274,118Clipper Logistics PLC . . . . . . . . . . . . . . . . . . . . . . . . . . . . . . . . . . . . . 14,765 130,781HomeServe PLC. . . . . . . . . . . . . . . . . . . . . . . . . . . . . . . . . . . . . . . . . . 58,527 699,763Johnson Service Group PLC . . . . . . . . . . . . . . . . . . . . . . . . . . . . . . 86,062 147,651Mitie Group PLC . . . . . . . . . . . . . . . . . . . . . . . . . . . . . . . . . . . . . . . . . . 275,600 235,315Renewi PLC . . . . . . . . . . . . . . . . . . . . . . . . . . . . . . . . . . . . . . . . . . . . . . 15,471 157,198Restore PLC. . . . . . . . . . . . . . . . . . . . . . . . . . . . . . . . . . . . . . . . . . . . . . 23,780 154,652Serco Group PLC . . . . . . . . . . . . . . . . . . . . . . . . . . . . . . . . . . . . . . . . . 235,474 409,630Smart Metering Systems PLC . . . . . . . . . . . . . . . . . . . . . . . . . . . . . 24,397 259,250
2,468,358Communications Equipment — 0.4%Spirent Communications PLC . . . . . . . . . . . . . . . . . . . . . . . . . . . . . 118,266 421,217
Construction & Engineering — 0.9%Balfour Beatty PLC. . . . . . . . . . . . . . . . . . . . . . . . . . . . . . . . . . . . . . . . 125,008 388,426Keller Group PLC . . . . . . . . . . . . . . . . . . . . . . . . . . . . . . . . . . . . . . . . . 13,981 166,974Kier Group PLC. . . . . . . . . . . . . . . . . . . . . . . . . . . . . . . . . . . . . . . . . . . 86,258 123,667Morgan Sindall Group PLC . . . . . . . . . . . . . . . . . . . . . . . . . . . . . . . . 7,619 240,543
919,610Construction Materials — 1.2%Breedon Group PLC . . . . . . . . . . . . . . . . . . . . . . . . . . . . . . . . . . . . . . 293,937 379,976Forterra PLC(a). . . . . . . . . . . . . . . . . . . . . . . . . . . . . . . . . . . . . . . . . . . . 44,204 143,445Ibstock PLC(a) . . . . . . . . . . . . . . . . . . . . . . . . . . . . . . . . . . . . . . . . . . . . 79,183 203,062Marshalls PLC . . . . . . . . . . . . . . . . . . . . . . . . . . . . . . . . . . . . . . . . . . . . 38,675 355,950Rhi Magnesita NV. . . . . . . . . . . . . . . . . . . . . . . . . . . . . . . . . . . . . . . . . 5,452 218,687
1,301,120Consumer Finance — 0.3%Funding Circle Holdings PLC(a) . . . . . . . . . . . . . . . . . . . . . . . . . . . . 35,514 65,180Provident Financial PLC. . . . . . . . . . . . . . . . . . . . . . . . . . . . . . . . . . . 49,031 231,491
296,671Containers & Packaging — 1.2%DS Smith PLC . . . . . . . . . . . . . . . . . . . . . . . . . . . . . . . . . . . . . . . . . . . . 265,533 1,266,244
Distributors — 0.8%Inchcape PLC . . . . . . . . . . . . . . . . . . . . . . . . . . . . . . . . . . . . . . . . . . . . 75,713 834,757
Diversified Financial Services — 0.6%Burford Capital Ltd. . . . . . . . . . . . . . . . . . . . . . . . . . . . . . . . . . . . . . . . 35,996 365,270
Schedule of Investments (unaudited)
November 30, 2021
iShares� MSCI United Kingdom Small-Cap ETF(Percentages shown are based on Net Assets)
152 NM0122U-1995964-154/159

Security Shares
Value
Diversified Financial Services (continued)Plus500 Ltd. . . . . . . . . . . . . . . . . . . . . . . . . . . . . . . . . . . . . . . . . . . . . . . 17,619 $ 297,568
662,838Diversified Telecommunication Services — 0.6%Gamma Communications PLC. . . . . . . . . . . . . . . . . . . . . . . . . . . . . 15,813 357,519Helios Towers PLC. . . . . . . . . . . . . . . . . . . . . . . . . . . . . . . . . . . . . . . . 141,825 309,714
667,233Electrical Equipment — 0.9%Ceres Power Holdings PLC. . . . . . . . . . . . . . . . . . . . . . . . . . . . . . . . 18,406 269,943ITM Power PLC(c) . . . . . . . . . . . . . . . . . . . . . . . . . . . . . . . . . . . . . . . . . 82,978 504,989Luceco PLC(a) . . . . . . . . . . . . . . . . . . . . . . . . . . . . . . . . . . . . . . . . . . . . 15,543 72,867Volex PLC . . . . . . . . . . . . . . . . . . . . . . . . . . . . . . . . . . . . . . . . . . . . . . . . 23,013 112,239
960,038Electronic Equipment, Instruments & Components — 1.5%Renishaw PLC. . . . . . . . . . . . . . . . . . . . . . . . . . . . . . . . . . . . . . . . . . . . 7,036 422,388Spectris PLC . . . . . . . . . . . . . . . . . . . . . . . . . . . . . . . . . . . . . . . . . . . . . 21,761 1,019,477Strix Group PLC . . . . . . . . . . . . . . . . . . . . . . . . . . . . . . . . . . . . . . . . . . 39,921 163,526
1,605,391Energy Equipment & Services — 0.5%Hunting PLC. . . . . . . . . . . . . . . . . . . . . . . . . . . . . . . . . . . . . . . . . . . . . . 28,327 55,531John Wood Group PLC. . . . . . . . . . . . . . . . . . . . . . . . . . . . . . . . . . . . 133,074 355,991Petrofac Ltd. . . . . . . . . . . . . . . . . . . . . . . . . . . . . . . . . . . . . . . . . . . . . . . 85,421 123,489
535,011Entertainment — 0.5%Cineworld Group PLC(c) . . . . . . . . . . . . . . . . . . . . . . . . . . . . . . . . . . . 185,806 116,241Frontier Developments PLC . . . . . . . . . . . . . . . . . . . . . . . . . . . . . . . 4,184 98,715Sumo Group PLC . . . . . . . . . . . . . . . . . . . . . . . . . . . . . . . . . . . . . . . . . 21,546 138,834Team17 Group PLC . . . . . . . . . . . . . . . . . . . . . . . . . . . . . . . . . . . . . . . 20,334 178,485
532,275Equity Real Estate Investment Trusts (REITs) — 9.4%Assura PLC . . . . . . . . . . . . . . . . . . . . . . . . . . . . . . . . . . . . . . . . . . . . . . 517,520 465,619Big Yellow Group PLC. . . . . . . . . . . . . . . . . . . . . . . . . . . . . . . . . . . . . 33,761 732,775BMO Commercial Property Trust Ltd. . . . . . . . . . . . . . . . . . . . . . . 151,879 204,265Capital & Counties Properties PLC. . . . . . . . . . . . . . . . . . . . . . . . . 139,863 299,791Civitas Social Housing PLC. . . . . . . . . . . . . . . . . . . . . . . . . . . . . . . . 120,338 147,560Custodian REIT PLC . . . . . . . . . . . . . . . . . . . . . . . . . . . . . . . . . . . . . . 77,248 98,729Derwent London PLC . . . . . . . . . . . . . . . . . . . . . . . . . . . . . . . . . . . . . 19,518 884,682Empiric Student Property PLC . . . . . . . . . . . . . . . . . . . . . . . . . . . . . 116,615 126,555GCP Student Living PLC . . . . . . . . . . . . . . . . . . . . . . . . . . . . . . . . . . 87,967 246,826Great Portland Estates PLC . . . . . . . . . . . . . . . . . . . . . . . . . . . . . . . 44,172 421,848Hammerson PLC(c) . . . . . . . . . . . . . . . . . . . . . . . . . . . . . . . . . . . . . . . 609,522 244,858Home Reit PLC . . . . . . . . . . . . . . . . . . . . . . . . . . . . . . . . . . . . . . . . . . . 108,586 163,188LondonMetric Property PLC . . . . . . . . . . . . . . . . . . . . . . . . . . . . . . . 167,187 603,094LXI REIT PLC . . . . . . . . . . . . . . . . . . . . . . . . . . . . . . . . . . . . . . . . . . . . 135,290 265,935Picton Property Income Ltd. (The) . . . . . . . . . . . . . . . . . . . . . . . . . 105,867 140,375Primary Health Properties PLC . . . . . . . . . . . . . . . . . . . . . . . . . . . . 257,453 513,960Regional REIT Ltd.(a) . . . . . . . . . . . . . . . . . . . . . . . . . . . . . . . . . . . . . . 79,251 93,217Safestore Holdings PLC . . . . . . . . . . . . . . . . . . . . . . . . . . . . . . . . . . . 40,758 721,483Secure Income REIT PLC . . . . . . . . . . . . . . . . . . . . . . . . . . . . . . . . . 53,248 280,436Shaftesbury PLC. . . . . . . . . . . . . . . . . . . . . . . . . . . . . . . . . . . . . . . . . . 37,140 303,775Target Healthcare REIT PLC . . . . . . . . . . . . . . . . . . . . . . . . . . . . . . 119,909 181,161Tritax Big Box REIT PLC . . . . . . . . . . . . . . . . . . . . . . . . . . . . . . . . . . 332,662 1,051,403UK Commercial Property REIT Ltd. . . . . . . . . . . . . . . . . . . . . . . . . 150,727 152,409UNITE Group PLC (The) . . . . . . . . . . . . . . . . . . . . . . . . . . . . . . . . . . 65,565 925,186Urban Logistics REIT PLC. . . . . . . . . . . . . . . . . . . . . . . . . . . . . . . . . 62,404 139,430Warehouse REIT PLC. . . . . . . . . . . . . . . . . . . . . . . . . . . . . . . . . . . . . 78,030 167,494Workspace Group PLC. . . . . . . . . . . . . . . . . . . . . . . . . . . . . . . . . . . . 26,261 277,835
9,853,889
Security Shares
Value
Food & Staples Retailing — 0.1%Naked Wines PLC . . . . . . . . . . . . . . . . . . . . . . . . . . . . . . . . . . . . . . . . 11,358 $ 96,525
Food Products — 1.6%Bakkavor Group PLC(a) . . . . . . . . . . . . . . . . . . . . . . . . . . . . . . . . . . . 29,394 47,302Cranswick PLC . . . . . . . . . . . . . . . . . . . . . . . . . . . . . . . . . . . . . . . . . . . 10,197 482,518Greencore Group PLC . . . . . . . . . . . . . . . . . . . . . . . . . . . . . . . . . . . . 103,084 171,371Hotel Chocolat Group PLC . . . . . . . . . . . . . . . . . . . . . . . . . . . . . . . . 10,042 67,311Premier Foods PLC . . . . . . . . . . . . . . . . . . . . . . . . . . . . . . . . . . . . . . . 115,827 158,665Tate & Lyle PLC. . . . . . . . . . . . . . . . . . . . . . . . . . . . . . . . . . . . . . . . . . . 90,572 758,152
1,685,319Health Care Equipment & Supplies — 0.9%Advanced Medical Solutions Group PLC . . . . . . . . . . . . . . . . . . . 37,541 160,268ConvaTec Group PLC(a) . . . . . . . . . . . . . . . . . . . . . . . . . . . . . . . . . . . 311,461 799,459
959,727Health Care Providers & Services — 0.8%CVS Group PLC . . . . . . . . . . . . . . . . . . . . . . . . . . . . . . . . . . . . . . . . . . 12,997 380,638Mediclinic International PLC . . . . . . . . . . . . . . . . . . . . . . . . . . . . . . . 78,391 299,957Spire Healthcare Group PLC(a) . . . . . . . . . . . . . . . . . . . . . . . . . . . . 54,278 166,415
847,010Health Care Technology — 0.4%Craneware PLC. . . . . . . . . . . . . . . . . . . . . . . . . . . . . . . . . . . . . . . . . . . 5,524 187,340EMIS Group PLC . . . . . . . . . . . . . . . . . . . . . . . . . . . . . . . . . . . . . . . . . 11,016 190,883Renalytix PLC . . . . . . . . . . . . . . . . . . . . . . . . . . . . . . . . . . . . . . . . . . . . 9,238 86,797
465,020Hotels, Restaurants & Leisure — 4.6%888 Holdings PLC. . . . . . . . . . . . . . . . . . . . . . . . . . . . . . . . . . . . . . . . . 71,959 296,867Carnival PLC . . . . . . . . . . . . . . . . . . . . . . . . . . . . . . . . . . . . . . . . . . . . . 29,877 478,015Domino's Pizza Group PLC. . . . . . . . . . . . . . . . . . . . . . . . . . . . . . . . 79,693 380,496Greggs PLC . . . . . . . . . . . . . . . . . . . . . . . . . . . . . . . . . . . . . . . . . . . . . . 19,687 783,588Gym Group PLC (The)(a) . . . . . . . . . . . . . . . . . . . . . . . . . . . . . . . . . . 30,912 97,229J D Wetherspoon PLC . . . . . . . . . . . . . . . . . . . . . . . . . . . . . . . . . . . . 18,668 211,836Marston's PLC . . . . . . . . . . . . . . . . . . . . . . . . . . . . . . . . . . . . . . . . . . . . 129,192 111,682Mitchells & Butlers PLC . . . . . . . . . . . . . . . . . . . . . . . . . . . . . . . . . . . 51,904 161,392On the Beach Group PLC(a) . . . . . . . . . . . . . . . . . . . . . . . . . . . . . . . 32,537 88,533Patisserie Holdings PLC(d). . . . . . . . . . . . . . . . . . . . . . . . . . . . . . . . . 6,053 —Playtech PLC . . . . . . . . . . . . . . . . . . . . . . . . . . . . . . . . . . . . . . . . . . . . . 59,227 587,616Rank Group PLC . . . . . . . . . . . . . . . . . . . . . . . . . . . . . . . . . . . . . . . . . 49,808 90,752Restaurant Group PLC (The) . . . . . . . . . . . . . . . . . . . . . . . . . . . . . . 147,856 156,723SSP Group PLC . . . . . . . . . . . . . . . . . . . . . . . . . . . . . . . . . . . . . . . . . . 146,145 418,328Trainline PLC(a) . . . . . . . . . . . . . . . . . . . . . . . . . . . . . . . . . . . . . . . . . . . 92,928 336,905TUI AG(c) . . . . . . . . . . . . . . . . . . . . . . . . . . . . . . . . . . . . . . . . . . . . . . . . . 219,627 578,538Young & Co's Brewery PLC, Series A . . . . . . . . . . . . . . . . . . . . . . 4,323 86,816
4,865,316Household Durables — 2.9%Bellway PLC. . . . . . . . . . . . . . . . . . . . . . . . . . . . . . . . . . . . . . . . . . . . . . 23,856 995,764Countryside Properties PLC(a) . . . . . . . . . . . . . . . . . . . . . . . . . . . . . 95,798 526,486Crest Nicholson Holdings PLC. . . . . . . . . . . . . . . . . . . . . . . . . . . . . 49,670 211,520IG Design Group PLC . . . . . . . . . . . . . . . . . . . . . . . . . . . . . . . . . . . . . 15,476 50,221Redrow PLC. . . . . . . . . . . . . . . . . . . . . . . . . . . . . . . . . . . . . . . . . . . . . . 54,470 467,809Victoria PLC . . . . . . . . . . . . . . . . . . . . . . . . . . . . . . . . . . . . . . . . . . . . . . 12,425 196,105Vistry Group PLC . . . . . . . . . . . . . . . . . . . . . . . . . . . . . . . . . . . . . . . . . 42,975 611,801
3,059,706Independent Power and Renewable Electricity Producers — 0.6%ContourGlobal PLC(a) . . . . . . . . . . . . . . . . . . . . . . . . . . . . . . . . . . . . . 38,055 92,315Drax Group PLC . . . . . . . . . . . . . . . . . . . . . . . . . . . . . . . . . . . . . . . . . . 77,118 563,051
655,366Insurance — 2.9%Beazley PLC . . . . . . . . . . . . . . . . . . . . . . . . . . . . . . . . . . . . . . . . . . . . . 117,781 627,229
Schedule of Investments (unaudited) (continued)
November 30, 2021
iShares� MSCI United Kingdom Small-Cap ETF(Percentages shown are based on Net Assets)
153NM0122U-1995964-155/159

Security Shares
Value
Insurance (continued)Direct Line Insurance Group PLC . . . . . . . . . . . . . . . . . . . . . . . . . . 258,787 $ 931,334Hiscox Ltd. . . . . . . . . . . . . . . . . . . . . . . . . . . . . . . . . . . . . . . . . . . . . . . . 66,976 743,880Just Group PLC. . . . . . . . . . . . . . . . . . . . . . . . . . . . . . . . . . . . . . . . . . . 200,729 207,868Lancashire Holdings Ltd. . . . . . . . . . . . . . . . . . . . . . . . . . . . . . . . . . . 46,931 316,761Sabre Insurance Group PLC(a). . . . . . . . . . . . . . . . . . . . . . . . . . . . . 48,332 121,230Saga PLC . . . . . . . . . . . . . . . . . . . . . . . . . . . . . . . . . . . . . . . . . . . . . . . . 20,314 69,378
3,017,680Interactive Media & Services — 1.7%Rightmove PLC . . . . . . . . . . . . . . . . . . . . . . . . . . . . . . . . . . . . . . . . . . . 165,743 1,646,047Trustpilot Group PLC(a). . . . . . . . . . . . . . . . . . . . . . . . . . . . . . . . . . . . 35,783 136,201
1,782,248Internet & Direct Marketing Retail — 2.1%AO World PLC . . . . . . . . . . . . . . . . . . . . . . . . . . . . . . . . . . . . . . . . . . . . 59,612 75,079ASOS PLC . . . . . . . . . . . . . . . . . . . . . . . . . . . . . . . . . . . . . . . . . . . . . . . 13,511 422,919Auction Technology Group PLC. . . . . . . . . . . . . . . . . . . . . . . . . . . . 16,239 271,691boohoo Group PLC(c) . . . . . . . . . . . . . . . . . . . . . . . . . . . . . . . . . . . . . 195,578 431,142Deliveroo PLC(a) . . . . . . . . . . . . . . . . . . . . . . . . . . . . . . . . . . . . . . . . . . 134,369 534,504Moneysupermarket.com Group PLC . . . . . . . . . . . . . . . . . . . . . . . 103,790 277,727Moonpig Group PLC . . . . . . . . . . . . . . . . . . . . . . . . . . . . . . . . . . . . . . 29,763 129,754Victorian Plumbing Group PLC . . . . . . . . . . . . . . . . . . . . . . . . . . . . 21,995 45,868
2,188,684IT Services — 2.8%Capita PLC . . . . . . . . . . . . . . . . . . . . . . . . . . . . . . . . . . . . . . . . . . . . . . . 325,615 190,219Computacenter PLC . . . . . . . . . . . . . . . . . . . . . . . . . . . . . . . . . . . . . . 15,431 579,194Equiniti Group PLC(a) . . . . . . . . . . . . . . . . . . . . . . . . . . . . . . . . . . . . . 71,097 170,010Finablr PLC(a)(d). . . . . . . . . . . . . . . . . . . . . . . . . . . . . . . . . . . . . . . . . . . 61,710 1Kainos Group PLC . . . . . . . . . . . . . . . . . . . . . . . . . . . . . . . . . . . . . . . . 15,457 381,950Keywords Studios PLC. . . . . . . . . . . . . . . . . . . . . . . . . . . . . . . . . . . . 13,879 498,007NCC Group PLC . . . . . . . . . . . . . . . . . . . . . . . . . . . . . . . . . . . . . . . . . . 59,733 181,922Network International Holdings PLC(a). . . . . . . . . . . . . . . . . . . . . . 90,380 321,778Softcat PLC . . . . . . . . . . . . . . . . . . . . . . . . . . . . . . . . . . . . . . . . . . . . . . 23,088 567,445
2,890,526Leisure Products — 0.8%Games Workshop Group PLC . . . . . . . . . . . . . . . . . . . . . . . . . . . . . 6,336 788,726
Life Sciences Tools & Services — 0.3%Clinigen Group PLC. . . . . . . . . . . . . . . . . . . . . . . . . . . . . . . . . . . . . . . 24,432 194,310Ergomed PLC . . . . . . . . . . . . . . . . . . . . . . . . . . . . . . . . . . . . . . . . . . . . 7,081 120,543
314,853Machinery — 3.9%Bodycote PLC . . . . . . . . . . . . . . . . . . . . . . . . . . . . . . . . . . . . . . . . . . . . 37,014 402,481IMI PLC . . . . . . . . . . . . . . . . . . . . . . . . . . . . . . . . . . . . . . . . . . . . . . . . . . 52,483 1,187,294Judges Scientific PLC . . . . . . . . . . . . . . . . . . . . . . . . . . . . . . . . . . . . . 976 101,357Morgan Advanced Materials PLC . . . . . . . . . . . . . . . . . . . . . . . . . . 55,170 263,777Rotork PLC . . . . . . . . . . . . . . . . . . . . . . . . . . . . . . . . . . . . . . . . . . . . . . . 168,551 762,607Vesuvius PLC. . . . . . . . . . . . . . . . . . . . . . . . . . . . . . . . . . . . . . . . . . . . . 41,946 230,089Weir Group PLC (The) . . . . . . . . . . . . . . . . . . . . . . . . . . . . . . . . . . . . 50,190 1,106,034
4,053,639Marine — 0.3%Clarkson PLC. . . . . . . . . . . . . . . . . . . . . . . . . . . . . . . . . . . . . . . . . . . . . 5,590 268,754
Media — 3.8%Ascential PLC . . . . . . . . . . . . . . . . . . . . . . . . . . . . . . . . . . . . . . . . . . . . 84,841 490,641Euromoney Institutional Investor PLC . . . . . . . . . . . . . . . . . . . . . . 21,129 267,963Future PLC . . . . . . . . . . . . . . . . . . . . . . . . . . . . . . . . . . . . . . . . . . . . . . . 22,223 1,060,728ITV PLC . . . . . . . . . . . . . . . . . . . . . . . . . . . . . . . . . . . . . . . . . . . . . . . . . . 700,398 1,029,102Reach PLC . . . . . . . . . . . . . . . . . . . . . . . . . . . . . . . . . . . . . . . . . . . . . . . 57,439 197,089S4 Capital PLC . . . . . . . . . . . . . . . . . . . . . . . . . . . . . . . . . . . . . . . . . . . 53,459 412,903Tremor International Ltd.(c) . . . . . . . . . . . . . . . . . . . . . . . . . . . . . . . . 20,549 154,683
Security Shares
Value
Media (continued)Yougov PLC . . . . . . . . . . . . . . . . . . . . . . . . . . . . . . . . . . . . . . . . . . . . . . 20,444 $ 409,202
4,022,311Metals & Mining — 1.5%Atalaya Mining PLC . . . . . . . . . . . . . . . . . . . . . . . . . . . . . . . . . . . . . . . 14,696 79,939Centamin PLC . . . . . . . . . . . . . . . . . . . . . . . . . . . . . . . . . . . . . . . . . . . . 223,573 289,080Central Asia Metals PLC . . . . . . . . . . . . . . . . . . . . . . . . . . . . . . . . . . 34,031 109,981Eurasia Mining PLC(b) . . . . . . . . . . . . . . . . . . . . . . . . . . . . . . . . . . . . . 353,364 106,210Ferrexpo PLC. . . . . . . . . . . . . . . . . . . . . . . . . . . . . . . . . . . . . . . . . . . . . 56,898 218,698Greatland Gold PLC . . . . . . . . . . . . . . . . . . . . . . . . . . . . . . . . . . . . . . 764,363 148,637Hill & Smith Holdings PLC . . . . . . . . . . . . . . . . . . . . . . . . . . . . . . . . . 15,400 345,723Hochschild Mining PLC. . . . . . . . . . . . . . . . . . . . . . . . . . . . . . . . . . . . 64,575 113,192Petropavlovsk PLC. . . . . . . . . . . . . . . . . . . . . . . . . . . . . . . . . . . . . . . . 459,028 128,324SolGold PLC(b)(c). . . . . . . . . . . . . . . . . . . . . . . . . . . . . . . . . . . . . . . . . . 185,106 56,252
1,596,036Multi-Utilities — 1.2%Centrica PLC . . . . . . . . . . . . . . . . . . . . . . . . . . . . . . . . . . . . . . . . . . . . . 1,136,855 977,406Telecom Plus PLC . . . . . . . . . . . . . . . . . . . . . . . . . . . . . . . . . . . . . . . . 12,184 232,043
1,209,449Multiline Retail — 2.5%B&M European Value Retail SA. . . . . . . . . . . . . . . . . . . . . . . . . . . . 174,140 1,437,295Marks & Spencer Group PLC . . . . . . . . . . . . . . . . . . . . . . . . . . . . . . 378,554 1,187,713
2,625,008Oil, Gas & Consumable Fuels — 1.4%Cairn Energy PLC. . . . . . . . . . . . . . . . . . . . . . . . . . . . . . . . . . . . . . . . . 96,522 235,442Diversified Energy Co. PLC. . . . . . . . . . . . . . . . . . . . . . . . . . . . . . . . 156,038 205,986Energean PLC(b) . . . . . . . . . . . . . . . . . . . . . . . . . . . . . . . . . . . . . . . . . . 22,260 260,965Harbour Energy PLC(b) . . . . . . . . . . . . . . . . . . . . . . . . . . . . . . . . . . . . 80,519 420,985Pantheon Resources PLC(b) . . . . . . . . . . . . . . . . . . . . . . . . . . . . . . . 100,802 93,307Serica Energy PLC. . . . . . . . . . . . . . . . . . . . . . . . . . . . . . . . . . . . . . . . 31,109 87,505Tullow Oil PLC(b) . . . . . . . . . . . . . . . . . . . . . . . . . . . . . . . . . . . . . . . . . . 234,958 129,547
1,433,737Personal Products — 0.1%PZ Cussons PLC . . . . . . . . . . . . . . . . . . . . . . . . . . . . . . . . . . . . . . . . . 41,442 106,560
Pharmaceuticals — 1.9%Alliance Pharma PLC . . . . . . . . . . . . . . . . . . . . . . . . . . . . . . . . . . . . . 87,919 119,194Dechra Pharmaceuticals PLC . . . . . . . . . . . . . . . . . . . . . . . . . . . . . 20,921 1,403,715Indivior PLC . . . . . . . . . . . . . . . . . . . . . . . . . . . . . . . . . . . . . . . . . . . . . . 141,101 431,236
1,954,145Professional Services — 1.7%Hays PLC . . . . . . . . . . . . . . . . . . . . . . . . . . . . . . . . . . . . . . . . . . . . . . . . 324,100 631,038Pagegroup PLC. . . . . . . . . . . . . . . . . . . . . . . . . . . . . . . . . . . . . . . . . . . 63,531 532,729RWS Holdings PLC . . . . . . . . . . . . . . . . . . . . . . . . . . . . . . . . . . . . . . . 56,457 470,032SThree PLC . . . . . . . . . . . . . . . . . . . . . . . . . . . . . . . . . . . . . . . . . . . . . . 24,516 169,546
1,803,345Real Estate Management & Development — 2.1%CLS Holdings PLC . . . . . . . . . . . . . . . . . . . . . . . . . . . . . . . . . . . . . . . . 35,442 95,703Grainger PLC. . . . . . . . . . . . . . . . . . . . . . . . . . . . . . . . . . . . . . . . . . . . . 130,267 517,603Helical PLC. . . . . . . . . . . . . . . . . . . . . . . . . . . . . . . . . . . . . . . . . . . . . . . 21,264 125,433IWG PLC . . . . . . . . . . . . . . . . . . . . . . . . . . . . . . . . . . . . . . . . . . . . . . . . . 146,063 540,856Savills PLC . . . . . . . . . . . . . . . . . . . . . . . . . . . . . . . . . . . . . . . . . . . . . . . 27,660 491,467Sirius Real Estate Ltd.. . . . . . . . . . . . . . . . . . . . . . . . . . . . . . . . . . . . . 195,449 354,115Watkin Jones PLC . . . . . . . . . . . . . . . . . . . . . . . . . . . . . . . . . . . . . . . . 39,619 128,567
2,253,744Road & Rail — 0.9%Firstgroup PLC . . . . . . . . . . . . . . . . . . . . . . . . . . . . . . . . . . . . . . . . . . . 236,345 292,324Go-Ahead Group PLC (The) . . . . . . . . . . . . . . . . . . . . . . . . . . . . . . . 8,347 73,711National Express Group PLC . . . . . . . . . . . . . . . . . . . . . . . . . . . . . . 106,847 302,379
Schedule of Investments (unaudited) (continued)
November 30, 2021
iShares� MSCI United Kingdom Small-Cap ETF(Percentages shown are based on Net Assets)
154 NM0122U-1995964-156/159

Security Shares
Value
Road & Rail (continued)Redde Northgate PLC. . . . . . . . . . . . . . . . . . . . . . . . . . . . . . . . . . . . . 45,197 $ 237,434Stagecoach Group PLC . . . . . . . . . . . . . . . . . . . . . . . . . . . . . . . . . . . 79,875 72,714
978,562Semiconductors & Semiconductor Equipment — 0.2%Alphawave IP Group PLC . . . . . . . . . . . . . . . . . . . . . . . . . . . . . . . . . 51,422 135,546IQE PLC. . . . . . . . . . . . . . . . . . . . . . . . . . . . . . . . . . . . . . . . . . . . . . . . . . 147,304 67,686
203,232Software — 3.2%Argo Blockchain PLC . . . . . . . . . . . . . . . . . . . . . . . . . . . . . . . . . . . . . 91,146 170,841Avast PLC(a) . . . . . . . . . . . . . . . . . . . . . . . . . . . . . . . . . . . . . . . . . . . . . . 129,917 1,046,720Blue Prism Group PLC . . . . . . . . . . . . . . . . . . . . . . . . . . . . . . . . . . . . 15,905 274,776Bytes Technology Group PLC . . . . . . . . . . . . . . . . . . . . . . . . . . . . . 41,669 307,291dotdigital group PLC . . . . . . . . . . . . . . . . . . . . . . . . . . . . . . . . . . . . . . 51,871 133,832FD Technologies PLC . . . . . . . . . . . . . . . . . . . . . . . . . . . . . . . . . . . . . 4,299 120,352GB Group PLC . . . . . . . . . . . . . . . . . . . . . . . . . . . . . . . . . . . . . . . . . . . 43,690 444,082Ideagen PLC . . . . . . . . . . . . . . . . . . . . . . . . . . . . . . . . . . . . . . . . . . . . . 41,820 147,389Kape Technologies PLC . . . . . . . . . . . . . . . . . . . . . . . . . . . . . . . . . . . 20,203 107,476Learning Technologies Group PLC. . . . . . . . . . . . . . . . . . . . . . . . . 113,526 253,200Micro Focus International PLC. . . . . . . . . . . . . . . . . . . . . . . . . . . . . 64,876 300,531
3,306,490Specialty Retail — 2.5%Currys PLC. . . . . . . . . . . . . . . . . . . . . . . . . . . . . . . . . . . . . . . . . . . . . . . 214,232 371,705Dunelm Group PLC . . . . . . . . . . . . . . . . . . . . . . . . . . . . . . . . . . . . . . . 23,512 420,266Frasers Group PLC . . . . . . . . . . . . . . . . . . . . . . . . . . . . . . . . . . . . . . . 39,572 358,951Halfords Group PLC . . . . . . . . . . . . . . . . . . . . . . . . . . . . . . . . . . . . . . 38,495 156,866Pets at Home Group PLC . . . . . . . . . . . . . . . . . . . . . . . . . . . . . . . . . 96,663 600,361Vivo Energy PLC(a). . . . . . . . . . . . . . . . . . . . . . . . . . . . . . . . . . . . . . . . 85,727 150,497WH Smith PLC . . . . . . . . . . . . . . . . . . . . . . . . . . . . . . . . . . . . . . . . . . . 25,308 444,910Wickes Group PLC. . . . . . . . . . . . . . . . . . . . . . . . . . . . . . . . . . . . . . . . 49,631 140,990
2,644,546Textiles, Apparel & Luxury Goods — 0.7%Coats Group PLC . . . . . . . . . . . . . . . . . . . . . . . . . . . . . . . . . . . . . . . . . 280,821 229,316Dr. Martens PLC . . . . . . . . . . . . . . . . . . . . . . . . . . . . . . . . . . . . . . . . . . 86,997 462,575
691,891Thrifts & Mortgage Finance — 0.9%OSB Group PLC . . . . . . . . . . . . . . . . . . . . . . . . . . . . . . . . . . . . . . . . . . 86,695 578,806Paragon Banking Group PLC . . . . . . . . . . . . . . . . . . . . . . . . . . . . . . 48,728 335,370
914,176Trading Companies & Distributors — 5.3%Diploma PLC . . . . . . . . . . . . . . . . . . . . . . . . . . . . . . . . . . . . . . . . . . . . . 24,081 1,025,113Electrocomponents PLC. . . . . . . . . . . . . . . . . . . . . . . . . . . . . . . . . . . 90,950 1,465,071
Security Shares
Value
Trading Companies & Distributors (continued)Grafton Group PLC . . . . . . . . . . . . . . . . . . . . . . . . . . . . . . . . . . . . . . . 43,957 $ 683,405Howden Joinery Group PLC . . . . . . . . . . . . . . . . . . . . . . . . . . . . . . . 115,009 1,325,014SIG PLC. . . . . . . . . . . . . . . . . . . . . . . . . . . . . . . . . . . . . . . . . . . . . . . . . . 136,813 90,249Travis Perkins PLC. . . . . . . . . . . . . . . . . . . . . . . . . . . . . . . . . . . . . . . . 43,504 836,331Yellow Cake PLC(a) . . . . . . . . . . . . . . . . . . . . . . . . . . . . . . . . . . . . . . . 28,223 125,180
5,550,363Water Utilities — 0.8%Penno Group PLC . . . . . . . . . . . . . . . . . . . . . . . . . . . . . . . . . . . . . . . . 53,927 874,758
Wireless Telecommunication Services — 0.3%Airtel Africa PLC(a) . . . . . . . . . . . . . . . . . . . . . . . . . . . . . . . . . . . . . . . . 181,638 301,479
Total Common Stocks — 99.6%(Cost: $106,869,788) . . . . . . . . . . . . . . . . . . . . . . . . . . . . . . . . . . . . . . . . . . . . . . 104,392,540
Short-Term InvestmentsMoney Market Funds — 1.9%BlackRock Cash Funds: Institutional, SL Agency Shares,
0.06%(e)(f)(g) . . . . . . . . . . . . . . . . . . . . . . . . . . . . . . . . . . . . . . . . . . . . 1,940,796 1,941,572BlackRock Cash Funds: Treasury, SL Agency Shares,
0.00%(e)(f) . . . . . . . . . . . . . . . . . . . . . . . . . . . . . . . . . . . . . . . . . . . . . . 60,000 60,000
2,001,572
Total Short-Term Investments — 1.9%(Cost: $2,001,062). . . . . . . . . . . . . . . . . . . . . . . . . . . . . . . . . . . . . . . . . . . . . . . . . 2,001,572
Total Investments in Securities — 101.5%(Cost: $108,870,850) . . . . . . . . . . . . . . . . . . . . . . . . . . . . . . . . . . . . . . . . . . . . . . 106,394,112
Other Assets, Less Liabilities — (1.5)%. . . . . . . . . . . . . . . . . . . . . . . . . . . . . . (1,583,891)
Net Assets — 100.0% . . . . . . . . . . . . . . . . . . . . . . . . . . . . . . . . . . . . . . . . . . . . . . . . $ 104,810,221 (a) Security exempt from registration pursuant to Rule 144A under the Securities Act of
1933, as amended. These securities may be resold in transactions exempt fromregistration to qualified institutional investors.
(b) Non-income producing security.(c) All or a portion of this security is on loan.(d) Security is valued using significant unobservable inputs and is classified as Level 3 in the
fair value hierarchy.(e) Affiliate of the Fund.(f) Annualized 7-day yield as of period end.(g) All or a portion of this security was purchased with the cash collateral from loaned
securities.
Schedule of Investments (unaudited) (continued)
November 30, 2021
iShares� MSCI United Kingdom Small-Cap ETF(Percentages shown are based on Net Assets)
155NM0122U-1995964-157/159

Affiliates
Investments in issuers considered to be affiliate(s) of the Fund during the period ended November 30, 2021 for purposes of Section 2(a)(3) of the Investment Company Actof 1940, as amended, were as follows:
Affiliated IssuerValue at
08/31/21Purchases
at CostProceeds
from SalesNet Realized
Gain (Loss)
Change inUnrealized
Appreciation(Depreciation)
Value at11/30/21
SharesHeld at
11/30/21 Income
CapitalGain
Distributionsfrom
UnderlyingFunds
BlackRock Cash Funds: Institutional, SL AgencyShares . . . . . . . . . . . . . . . . . . . . . . . . . . . . . . . . . . . . . . . . . $2,279,475 $ — $(337,764)(a) $ (98) $ (41) $1,941,572 1,940,796 $35,435(b) $ —
BlackRock Cash Funds: Treasury, SL AgencyShares . . . . . . . . . . . . . . . . . . . . . . . . . . . . . . . . . . . . . . . . . 50,000 10,000(a)
— — — 60,000 60,000 — —
$ (98) $ (41) $2,001,572 $35,435 $ —
(a) Represents net amount purchased (sold).(b) All or a portion represents securities lending income earned from the reinvestment of cash collateral from loaned securities, net of fees and collateral investment expenses, and other
payments to and from borrowers of securities.
Derivative Financial Instruments Outstanding as of Period End
Futures Contracts
DescriptionNumber ofContracts
ExpirationDate
NotionalAmount
(000)
Value/Unrealized
Appreciation(Depreciation)
Long ContractsFTSE 250 Index . . . . . . . . . . . . . . . . . . . . . . . . . . . . . . . . . . . . . . . . . . . . . . . . . . . . . . . . . . . . . . . . . . . . . . . . . . . . . . . . . . . . . . . . . . . . . . . . . . . . . 6 12/17/21 $ 358 $ (6,412)
Fair Value Measurements
Various inputs are used in determining the fair value of financial instruments. These inputs to valuation techniques are categorized into a fair value hierarchy consisting ofthree broad levels for financial reporting purposes as follows:
• Level 1 – Unadjusted price quotations in active markets/exchanges for identical assets or liabilities that each Fund has the ability to access;• Level 2 – Other observable inputs (including, but not limited to, quoted prices for similar assets or liabilities in markets that are active, quoted prices for identical or
similar assets or liabilities in markets that are not active, inputs other than quoted prices that are observable for the assets or liabilities (such as interest rates, yieldcurves, volatilities, prepayment speeds, loss severities, credit risks and default rates) or other market-corroborated inputs); and
• Level 3 – Unobservable inputs based on the best information available in the circumstances, to the extent observable inputs are not available (including the BlackRockGlobal Valuation Methodologies Committee’s (the “Global Valuation Committee’s”) assumptions used in determining the fair value of financial instruments).
The hierarchy gives the highest priority to unadjusted quoted prices in active markets for identical assets or liabilities (Level 1 measurements) and the lowest priority tounobservable inputs (Level 3 measurements). Accordingly, the degree of judgment exercised in determining fair value is greatest for instruments categorized in Level 3. Theinputs used to measure fair value may fall into different levels of the fair value hierarchy. In such cases, for disclosure purposes, the fair value hierarchy classification isdetermined based on the lowest level input that is significant to the fair value measurement in its entirety. Investments classified within Level 3 have significant unobservableinputs used by the Global Valuation Committee in determining the price for Fair Valued Investments. Level 3 investments include equity or debt issued by privately heldcompanies or funds. There may not be a secondary market, and/or there are a limited number of investors. The categorization of a value determined for financial instrumentsis based on the pricing transparency of the financial instruments and is not necessarily an indication of the risks associated with investing in those securities. For informationabout the Fund’s policy regarding valuation of financial instruments, refer to its most recent financial statements.
Schedule of Investments (unaudited) (continued)
November 30, 2021
iShares� MSCI United Kingdom Small-Cap ETF
156 NM0122U-1995964-158/159

Fair Value Measurements (continued)
The following table summarizes the Fund’s financial instruments categorized in the fair value hierarchy. The breakdown of the Fund’s financial instruments into majorcategories is disclosed in the Schedule of Investments above.
Level 1 Level 2 Level 3 Total
InvestmentsAssets
Common Stocks . . . . . . . . . . . . . . . . . . . . . . . . . . . . . . . . . . . . . . . . . . . . . . . . . . . . . . . . . . . . . . . . . . . . . . . . . . . . . . . . . . . $ 46,776,377 $ 57,616,162 $ 1 $104,392,540Money Market Funds . . . . . . . . . . . . . . . . . . . . . . . . . . . . . . . . . . . . . . . . . . . . . . . . . . . . . . . . . . . . . . . . . . . . . . . . . . . . . . . 2,001,572 — — 2,001,572
$ 48,777,949 $ 57,616,162 $ 1 $106,394,112
Derivative financial instruments(a)
LiabilitiesFutures Contracts . . . . . . . . . . . . . . . . . . . . . . . . . . . . . . . . . . . . . . . . . . . . . . . . . . . . . . . . . . . . . . . . . . . . . . . . . . . . . . . . . . $ — $ (6,412) $ — $ (6,412)
(a) Derivative financial instruments are futures contracts. Futures contracts are valued at the unrealized appreciation (depreciation) on the instrument.
Portfolio Abbreviations - Equity
REIT . . . . . . . . . . . . . Real Estate Investment Trust
Schedule of Investments (unaudited) (continued)
November 30, 2021
iShares� MSCI United Kingdom Small-Cap ETF
157NM0122U-1995964-159/159