Notes to Unaudited Consolidated Financial Statements
143
UNITED STATES SECURITIES AND EXCHANGE COMMISSION Washington, D.C. 20549 FORM 10-Q QUARTERLY REPORT PURSUANT TO SECTION 13 OR 15(d) OF THE SECURITIES EXCHANGE ACT OF 1934 QUARTERLY PERIOD ENDED June 30, 2009 Commission File Number 1-34073 Huntington Bancshares Incorporated Maryland 31-0724920 (State or other jurisdiction of incorporation or organization) (I.R.S. Employer Identification No.) 41 South High Street, Columbus, Ohio 43287 Registrant's telephone number (614) 480-8300 Indicate by check mark whether the Registrant (1) has filed all reports required to be filed by Section 13 or 15(d) of the Securities Exchange Act of 1934 during the preceding 12 months and (2) has been subject to such filing requirements for the past 90 days. [X] Yes [ ] No Indicate by check mark whether the registrant has submitted electronically and posted on its corporate Web site, if any, every Interactive Data File required to be submitted and posted pursuant to Rule 405 of Regulation S-T (§232.405 of this chapter) during the preceding 12 months (or for such shorter period that the registrant was required to submit and post such files). [ ] Yes [ ] No Indicate by check mark whether the registrant is a large accelerated filer, an accelerated filer, a non-accelerated filer, or a smaller reporting company.. See the definitions of “large accelerated filer,” “ accelerated filer” and “smaller reporting company” in Rule 12b-2 of the Exchange Act. (Check one): Large accelerated filer [X] Accelerated filer [ ] Non-accelerated filer [ ] (Do not check if a smaller reporting company) Smaller reporting company [ ] Indicate by check mark whether the registrant is a shell company (as defined in Rule 12b-2 of the Exchange Act). [ ]Yes [X]No There were 569,017,481 shares of Registrant's common stock ($0.01 par value) outstanding on July 31, 2009.
-
Upload
khangminh22 -
Category
Documents
-
view
0 -
download
0
Transcript of Notes to Unaudited Consolidated Financial Statements

UNITED STATES SECURITIES AND EXCHANGE COMMISSION
Washington, D.C. 20549
FORM 10-Q
QUARTERLY REPORT PURSUANT TO SECTION 13 OR 15(d) OF THE SECURITIES EXCHANGE ACT OF 1934
QUARTERLY PERIOD ENDED June 30, 2009
Commission File Number 1-34073
Huntington Bancshares Incorporated
Maryland 31-0724920 (State or other jurisdiction of incorporation or organization)
(I.R.S. Employer Identification No.)
41 South High Street, Columbus, Ohio 43287
Registrant's telephone number (614) 480-8300
Indicate by check mark whether the Registrant (1) has filed all reports required to be filed by Section 13 or 15(d) of the Securities Exchange Act of 1934 during the preceding 12 months and (2) has been subject to such filing requirements for the past 90 days. [X] Yes [ ] No Indicate by check mark whether the registrant has submitted electronically and posted on its corporate Web site, if any, every Interactive Data File required to be submitted and posted pursuant to Rule 405 of Regulation S-T (§232.405 of this chapter) during the preceding 12 months (or for such shorter period that the registrant was required to submit and post such files). [ ] Yes [ ] No Indicate by check mark whether the registrant is a large accelerated filer, an accelerated filer, a non-accelerated filer, or a smaller reporting company.. See the definitions of “large accelerated filer,” “ accelerated filer” and “smaller reporting company” in Rule 12b-2 of the Exchange Act. (Check one): Large accelerated filer [X] Accelerated filer [ ] Non-accelerated filer [ ] (Do not check if a smaller reporting company) Smaller reporting company [ ] Indicate by check mark whether the registrant is a shell company (as defined in Rule 12b-2 of the Exchange Act). [ ]Yes [X]No There were 569,017,481 shares of Registrant's common stock ($0.01 par value) outstanding on July 31, 2009.

Huntington Bancshares Incorporated INDEX Part 1. FINANCIAL INFORMATION Item 1. Financial Statements (Unaudited)
Condensed Consolidated Balance Sheets at June 30, 2009, December 31, 2008, and June 30, 2008 92
Condensed Consolidated Statements of Income for the three months and six months ended June 30, 2009 and 2008 93
Condensed Consolidated Statements of Changes in Shareholders’ Equity for the six months ended June 30, 2009 and 2008 94
Condensed Consolidated Statements of Cash Flows for the six months ended June 30, 2009 and 2008 95
Notes to Unaudited Condensed Consolidated Financial Statements 96
Item 2. Management’s Discussion and Analysis of Financial Condition and Results of Operations 3 Item 3. Quantitative and Qualitative Disclosures about Market Risk 136 Item 4. Controls and Procedures 136 Item 4T. Controls and Procedures 136 PART II. OTHER INFORMATION Item 1. Legal Proceedings 136 Item 1A. Risk Factors 136 Item 4. Submission of Matters to a Vote of Security Holders 136 Item 6. Exhibits 137 Signatures 139
2

PART 1. FINANCIAL INFORMATION Item 2. Management’s Discussion and Analysis of Financial Condition and Results of Operations. INTRODUCTION
Huntington Bancshares Incorporated (we or our) is a multi-state diversified financial holding company organized under Maryland law in 1966 and headquartered in Columbus, Ohio. Through our subsidiaries, including our bank subsidiary, The Huntington National Bank (the Bank), organized in 1866, we provide full-service commercial and consumer banking services, mortgage banking services, automobile financing, equipment leasing, investment management, trust services, brokerage services, customized insurance service programs, and other financial products and services. Our banking offices are located in Ohio, Michigan, Pennsylvania, Indiana, West Virginia, and Kentucky. Selected financial service activities are also conducted in other states including Private Financial Group (PFG) offices in Florida, and Mortgage Banking offices in Maryland and New Jersey. International banking services are available through the headquarters office in Columbus and a limited purpose office located in both the Cayman Islands and Hong Kong.
The following Management’s Discussion and Analysis of Financial Condition and Results of Operations (MD&A) provides information we believe necessary for understanding our financial condition, changes in financial condition, results of operations, and cash flows. This MD&A provides updates to the discussion and analysis included in our Annual Report on Form 10-K for the year ended December 31, 2008 (2008 Form 10-K). This MD&A should be read in conjunction with our 2008 Form 10-K as well as the financial statements, notes, and other information contained in this report.
Our discussion is divided into key segments:
• Introduction - Provides overview comments on important matters including risk factors, acquisitions, and other
items. These are essential for understanding our performance and prospects.
• Discussion of Results of Operations - Reviews financial performance from a consolidated company perspective. It also includes a “Significant Items” section that summarizes key issues helpful for understanding performance trends. Key consolidated average balance sheet and income statement trends are also discussed in this section.
• Risk Management and Capital - Discusses credit, market, liquidity, and operational risks, including how these are managed, as well as performance trends. It also includes a discussion of liquidity policies, how we obtain funding, and related performance. In addition, there is a discussion of guarantees and/or commitments made for items such as standby letters of credit and commitments to sell loans, and a discussion that reviews the adequacy of capital, including regulatory capital requirements.
• Business Segment Discussion - Provides an overview of financial performance for each of our major business segments and provides additional discussion of trends underlying consolidated financial performance.
A reading of each section is important to understand fully the nature of our financial performance and prospects.
Forward-Looking Statements
This report, including this MD&A, contains certain forward-looking statements, including certain plans, expectations,
goals, projections, and statements, which are subject to numerous assumptions, risks, and uncertainties. Statements that do not describe historical or current facts, including statements about beliefs and expectations, are forward-looking statements. The forward-looking statements are intended to be subject to the safe harbor provided by Section 27A of the Securities Exchange Act of 1933 and Section 21E of the Securities Exchange Act.
Actual results could differ materially from those contained or implied by such statements for a variety of factors
including: (1) deterioration in the loan portfolio could be worse than expected due to a number of factors such as the underlying value of the collateral could prove less valuable than otherwise assumed and assumed cash flows may be worse than expected; (2) changes in economic conditions; (3) movements in interest rates; (4) competitive pressures on product pricing and services; (5) success and timing of other business strategies; (6) the nature, extent, and timing of governmental actions and reforms, including existing and potential future restrictions and limitations imposed in connection with the Troubled Asset Relief Program (TARP) voluntary Capital Purchase Plan (CPP) or otherwise under the Emergency Economic Stabilization Act of 2008; and (7) extended disruption of vital infrastructure.
3

Additional factors that could cause results to differ materially from those described above can be found in our 2008 Form 10-K, and documents subsequently filed by us with the Securities and Exchange Commission (SEC). All forward-looking statements included in this filing are based on information available at the time of the filing. We assume no obligation to update any forward-looking statement. Risk Factors
We, like other financial companies, are subject to a number of risks that may adversely affect our financial condition
or results of operation, many of which are outside of our direct control, though efforts are made to manage those risks while optimizing returns. Among the risks assumed are: (1) credit risk, which is the risk of loss due to loan and lease customers or other counterparties not being able to meet their financial obligations under agreed upon terms, (2) market risk, which is the risk of loss due to changes in the market value of assets and liabilities due to changes in market interest rates, foreign exchange rates, equity prices, and credit spreads, (3) liquidity risk, which is the risk of loss due to the possibility that funds may not be available to satisfy current or future obligations resulting from external macro market issues, investor and customer perception of financial strength, and events unrelated to the company such as war, terrorism, or financial institution market specific issues, and (4) operational risk, which is the risk of loss due to human error, inadequate or failed internal systems and controls, violations of, or noncompliance with, laws, rules, regulations, prescribed practices, or ethical standards, and external influences such as market conditions, fraudulent activities, disasters, and security risks.
More information on risk is set forth under the heading “Risk Factors” included in Item 1A of our 2008 Form 10-K.
Additional information regarding risk factors can also be found in the “Risk Management and Capital” discussion. Update to Risk Factors All of our loan portfolios, particularly our construction and commercial real estate (CRE) loans, may continue to be affected by the sustained economic weakness of our Midwest markets and the impact of higher unemployment rates. This may significantly adversely affect our business, financial condition, liquidity, capital, and results of operation.
As described in the “Credit Risk” discussion, credit quality performance continued to be under pressure during the first six-month period of 2009, with nonaccrual loans and leases (NALs) and nonperforming assets (NPAs) both increasing at June 30, 2009, compared with December 31, 2008, and June 30, 2008. The allowance for credit losses (ACL) of $964.8 million at June 30, 2009, was 2.51% of period-end loans and leases and 53% of period-end NALs.
The majority of our credit risk is associated with lending activities, as the acceptance and management of credit risk is central to profitable lending. Credit risk is mitigated through a combination of credit policies and processes, market risk management activities, and portfolio diversification. However, adverse changes in our borrowers ability to meet their financial obligations under agreed upon terms and, in some cases, to the value of the assets securing our loans to them may increase our credit risk. Our commercial portfolio, as well as our real estate-related portfolios, have continued to be negatively affected by the ongoing reduction in real estate values and reduced levels of sales and leasing activities. We periodically review the ACL for adequacy considering economic conditions and trends, collateral values, and credit quality indicators, including past charge-off experience and levels of past due loans and NPAs. There is no certainty that the ACL will be adequate over time to cover credit losses in the portfolio because of continued adverse changes in the economy, market conditions, or events adversely affecting specific customers, industries or markets. If the credit quality of the customer base materially decreases, if the risk profile of a market, industry, or group of customers changes materially, or if the ACL is not adequate, our business, financial condition, liquidity, capital, and results of operations could be materially adversely affected.
Bank regulators periodically review our ACL and may require us to increase our provision for loan and lease losses or loan charge-offs. Any increase in our ACL or loan charge-offs as required by these regulatory authorities could have a material adverse effect on our results of operations and our financial condition.
In particular, an increase in our ACL could result in a reduction in the amount of our tangible common equity (TCE) and/or our Tier 1 common equity. Given the focus on these measurements, we may be required to raise additional capital through the issuance of common stock as a result of an increase in our ACL. The issuance of additional common stock or other actions could have a dilutive effect on the existing holders of our common stock, and adversely affect the market price of our common stock.
4

Legislative and regulatory actions taken now or in the future to address the current liquidity and credit crisis in the financial industry may significantly affect our financial condition, results of operation, liquidity, or stock price.
Current economic conditions, particularly in the financial markets, have resulted in government regulatory agencies and political bodies placing increased focus on and scrutiny of the financial services industry. The U.S. Government has intervened on an unprecedented scale, responding to what has been commonly referred to as the financial crisis. In addition to the U.S. Treasury Department’s CPP under the TARP announced in the fall of 2008 and the new Capital Assistance Program (CAP) announced in spring of 2009, the U.S. Government has taken steps that include enhancing the liquidity support available to financial institutions, establishing a commercial paper funding facility, temporarily guaranteeing money market funds and certain types of debt issuances, and increasing insurance on bank deposits. The U.S. Congress, through the Emergency Economic Stabilization Act of 2008 and the American Recovery and Reinvestment Act of 2009, has imposed a number of restrictions and limitations on the operations of financial services firms participating in the federal programs.
These programs subject us and other financial institutions that participate in them to additional restrictions, oversight, and costs that may have an adverse impact on our business, financial condition, results of operations, or the price of our common stock. In addition, new proposals for legislation continue to be introduced in the U.S. Congress that could further increase regulation of the financial services industry and impose restrictions on the operations and general ability of firms within the industry to conduct business consistent with historical practices, including as related to compensation, interest rates, the impact of bankruptcy proceedings on consumer real property mortgages, and otherwise. Federal and state regulatory agencies also frequently adopt changes to their regulations and/or change the manner in which existing regulations are applied. We cannot predict the substance or impact of pending or future legislation, regulation, or its application. Compliance with such current and potential regulation and scrutiny may significantly increase our costs, impede the efficiency of our internal business processes, negatively impact the recoverability of certain of our recorded assets, require us to increase our regulatory capital, and limit our ability to pursue business opportunities in an efficient manner. We may raise additional capital, which could have a dilutive effect on the existing holders of our common stock and adversely affect the market price of our common stock.
We are not restricted from issuing additional authorized shares of common stock or securities that are convertible into or exchangeable for, or that represent the right to receive, common stock. We continually evaluate opportunities to access capital markets taking into account our regulatory capital ratios, financial condition, and other relevant considerations, and anticipate that, subject to market conditions, we are likely to take further capital actions. Such actions, with regulatory approval when required, may include opportunistically retiring our outstanding securities, including our subordinated debt, trust-preferred securities, and preferred shares, in open market transactions, privately negotiated transactions, or public offers for cash or common shares, as well as issuing additional shares of common stock in public or private transactions in order to increase our capital levels above our already “well-capitalized” levels, as defined by the federal bank regulatory agencies, and other regulatory capital targets.
During the 2009 second quarter, the Federal Reserve conducted a Supervisory Capital Assessment Program (SCAP) on the country’s 19 largest bank holding companies to determine the amount of capital required to absorb losses that could arise under “baseline” and “more adverse” economic scenarios. While we were not one of these 19 institutions required to conduct a forward-looking capital assessment, or “stress test”, we voluntarily conducted our own analysis and recognized a need to raise additional capital to improve certain capital ratios, including our Tier 1 common equity risk based ratio. During the first six-month period of 2009, we issued an additional 201.6 million shares of common stock. The issuance of these additional shares of common stock was dilutive to existing common shareholders. (See the “Capital” section located within the “Risk Management and Capital” section for additional information).
Both Huntington and the Bank are highly regulated, and we, as well as our regulators, continue to regularly perform a
variety of capital analyses, including the preparation of stress case scenarios. As a result of those assessments, we could determine, or our regulators could require us, to raise additional capital in the future. Any such capital raise could include, among other things, the potential issuance of additional common equity to the public, the potential issuance of common equity to the government under the CAP, or the additional conversions of our existing Series B Preferred Stock to common equity. There could also be market perceptions that we need to raise additional capital, and regardless of the outcome of
5
any stress test or other stress case analysis, such perceptions could have an adverse effect on the price of our common stock.
Furthermore, in order to improve our capital ratios above our already adequately capitalized levels, we can decrease the amount of our risk-weighted assets, increase capital, or a combination of both. If it is determined that additional capital is required in order to improve or maintain our capital ratios, we may accomplish this through the issuance of additional common stock.
The issuance of any additional shares of common stock or securities convertible into or exchangeable for common
stock or that represent the right to receive common stock, or the exercise of such securities, could be substantially dilutive to existing common shareholders. Shareholders of our common stock have no preemptive rights that entitle holders to purchase their pro rata share of any offering of shares of any class or series and, therefore, such sales or offerings could result in increased dilution to existing shareholders. The market price of our common stock could decline as a result of sales of shares of our common stock or securities convertible into or exchangeable for common stock in anticipation of such sales. We are subject to ongoing tax examinations in various jurisdictions. The Internal Revenue Service and other taxing jurisdictions may propose various adjustments to our previously filed tax returns. It is possible that the ultimate resolution of such proposed adjustments, if unfavorable, may be material to the results of operations in the period it occurs.
The calculation of our provision for federal and state and local income taxes is complex and requires the use of
estimates and judgments. We have two accruals for income taxes: our federal income tax receivable represents the estimated amount currently due from the federal government, net of any reserve for potential audit issues, and is reported as a component of “accrued income and other assets” and state and local tax reserves for potential audit issues are reported as a component of “other liabilities” in our consolidated balance sheet; our deferred federal and state and local income tax asset or liability represents the estimated impact of temporary differences between how we recognize our assets and liabilities under GAAP, and how such assets and liabilities are recognized under federal and state and local tax law.
In the ordinary course of business, we operate in various taxing jurisdictions and are subject to income and nonincome taxes. The effective tax rate is based in part on our interpretation of the relevant current tax laws. We believe the aggregate liabilities related to taxes are appropriately reflected in the consolidated financial statements. We review the appropriate tax treatment of all transactions taking into consideration statutory, judicial, and regulatory guidance in the context of our tax positions. In addition, we rely on various tax opinions, recent tax audits, and historical experience.
From time to time, we engage in business transactions that may have an effect on our tax liabilities. Where appropriate, we have obtained opinions of outside experts and have assessed the relative merits and risks of the appropriate tax treatment of business transactions taking into account statutory, judicial, and regulatory guidance in the context of the tax position. However, changes to our estimates of accrued taxes can occur due to changes in tax rates, implementation of new business strategies, resolution of issues with taxing authorities regarding previously taken tax positions and newly enacted statutory, judicial, and regulatory guidance. Such changes could affect the amount of our accrued taxes and could be material to our financial position and/or results of operations.
During the 2009 second quarter, the State of Ohio completed the audit of our 2001, 2002, and 2003 corporate franchise tax returns. During 2008, the Internal Revenue Service (IRS) completed the audit of our consolidated federal income tax returns for tax years 2004 and 2005. In addition, we are subject to ongoing tax examinations in various other state and local jurisdictions. Both the IRS and various state tax officials have proposed adjustments to our previously filed tax returns. We believe that the tax positions taken by us related to such proposed adjustments were correct and supported by applicable statutes, regulations, and judicial authority, and intend to vigorously defend them. It is possible that the ultimate resolution of the proposed adjustments, if unfavorable, may be material to the results of operations in the period it occurs. However, although no assurances can be given, we believe that the resolution of these examinations will not, individually or in the aggregate, have a material adverse impact on our consolidated financial position.
Furthermore, we still face risk relating to the Franklin relationship not withstanding the restructuring announced on
March 31, 2009. The Franklin restructuring resulted in a $159.9 million net deferred tax asset equal to the amount of income and equity that was included in our operating results for the 2009 first quarter. While we believe that our position regarding the deferred tax asset and related income recognition is correct, that position could be subject to challenge.
6

Recent Accounting Pronouncements and Developments
Note 2 to the Unaudited Condensed Consolidated Financial Statements discusses new accounting pronouncements adopted during 2009 and the expected impact of accounting pronouncements recently issued but not yet required to be adopted. To the extent that we believe the adoption of new accounting standards will materially affect our financial condition, results of operations, or liquidity, the impacts or potential impacts are discussed in the applicable section of this MD&A and the Notes to the Unaudited Condensed Consolidated Financial Statements. Critical Accounting Policies and Use of Significant Estimates
Our financial statements are prepared in accordance with generally accepted accounting principles in the United States (GAAP). The preparation of financial statements in conformity with GAAP requires us to establish critical accounting policies and make accounting estimates, assumptions, and judgments that affect amounts recorded and reported in our financial statements. Note 1 of the Notes to Consolidated Financial Statements included in our 2008 Form 10-K as supplemented by this report lists significant accounting policies we use in the development and presentation of our financial statements. This MD&A, the significant accounting policies, and other financial statement disclosures identify and address key variables and other qualitative and quantitative factors necessary to understand and evaluate our company, financial position, results of operations, and cash flows.
An accounting estimate requires assumptions about uncertain matters that could have a material effect on the financial statements if a different amount within a range of estimates were used or if estimates changed from period to period. Estimates are made under facts and circumstances at a point in time, and changes in those facts and circumstances could produce results that differ from when those estimates were made. The most significant accounting estimates and their related application are discussed in our 2008 Form 10-K.
The following discussion provides updates of our accounting estimates related to the fair value measurements of
certain portfolios within our investment securities portfolio, goodwill, and Franklin loans. Securities and Other-Than-Temporary Impairment (OTTI) (This section should be read in conjunction with the “Investment Securities Portfolio” discussion.)
Effective with the 2009 second quarter, we adopted two FASB Staff Positions (FSPs) that impact estimates and assumptions utilized by us in determining the fair values of securities. The first, FSP Financial Accounting Standard (FAS) 157-4, “Determining Fair Value When the Volume and Level of Activity for the Asset or Liability Have Significantly Decreased and Identifying Transactions That Are Not Orderly,” reaffirms the exit price fair value measurement guidance in Statement No. 157, “Fair Value Measurements,” and also provides additional guidance for estimating fair value in accordance with Statement No. 157 when the volume and level of activity for the asset or liability have significantly decreased. The second, FSP FAS 115-2 and FAS 124-2, “Recognition and Presentation of Other-Than-Temporary Impairments,” amended the other-than-temporary impairment (OTTI) guidance in GAAP for debt securities.
We recognize OTTI through earnings on those debt securities that: (a) have a fair value less than its book value, and (b) we intend to sell (or we cannot assert that it is more likely than not that we will not have to sell before recovery). The amount of OTTI recognized is the difference between the fair value and book value of the securities.
If we do not intend to sell a debt security, but it is probable that we will not collect all amounts due according to the debt’s contractual terms, we separate the impairment into credit and noncredit components. The credit component of the impairment, measured as the difference between amortized cost and the present value of expected cash flows discounted at the security’s effective interest rate, is recognized in earnings. The noncredit component is recognized in other comprehensive income (OCI), separately from other unrealized gains and losses on available-for-sale securities.
The adoption of FSP FAS 115-2 and FAS 124-2 required an after-tax adjustment of $3.5 million to increase retained
earnings, with an equal and offsetting adjustment to OCI, that was recorded at the beginning of the 2009 second quarter to reclassify noncredit related impairment to OCI for previously impaired securities. The adjustment was applicable only to noncredit OTTI relating to the debt securities that we do not have the intent to sell. Noncredit OTTI losses related to debt securities that we intend to sell (or for which we cannot assert that it is more likely than not that we will not have to sell the
7

securities before recovery) were not reclassified. OTTI ANALYSIS ON CERTAIN SECURITIES PORTFOLIOS
Our three highest risk segments of our investment portfolio are the Alt-A mortgage backed, pooled-trust-preferred, and private-label collateralized mortgage obligation (CMO) portfolios. The Alt-A mortgage backed securities and pooled-trust-preferred securities are located within the asset-backed securities portfolio. The performance of the underlying securities in each of these segments continued to reflect the economic environment. Each of these securities in these three segments is subjected to a monthly review of the projected cash flows, supporting our impairment analysis. These reviews are supported with analysis from independent third parties. (See the “Securities and Other-Than-Temporary Impairment” section located within the “Critical Accounting Policies and Use of Significant Estimates” section for additional information.) These three segments, and the results of our impairment analysis for each segment, are discussed in further detail below:
Alt-A mortgage-backed and private-label collateralized mortgage obligation (CMO) securities represent securities collateralized by first-lien residential mortgage loans. As the lowest level input that is significant to the fair value measurement of these securities in its entirety was a Level 3 input, we classified all securities within these portfolios as Level 3 in the fair value hierarchy. The securities were priced with the assistance of an outside third-party consultant using a discounted cash flow approach and the independent third-party’s proprietary pricing model. The model used inputs such as estimated prepayment speeds, losses, recoveries, default rates that were implied by the underlying performance of collateral in the structure or similar structures, discount rates that were implied by market prices for similar securities, collateral structure types, and house price depreciation/appreciation rates that were based upon macroeconomic forecasts.
We analyzed both our Alt-A mortgage-backed and private-label CMO securities portfolios to determine if the
securities in these portfolios were other-than-temporarily-impaired. We used the analysis to determine whether we believed it probable that all contractual cash flows would not be collected. All securities in these portfolios remained current with respect to interest and principal at June 30, 2009.
Our analysis indicated, as of June 30, 2009, a total of 14 Alt-A mortgage-backed securities and 4 private-label CMO securities could experience loss of principal in the future. The future expected losses of principal on these other-than-temporarily impaired securities ranged from 0.1% to 89.1% of their par value. The average amount of future principal loss was 3.9% of their par value. These losses were projected to occur beginning anywhere from 6 months to as many as 18 years in the future. We measured the amount of credit impairment on these securities using the cash flows discounted at each securities effective rate. As a result, in the 2009 second quarter, we recorded $5.9 million of credit OTTI in our Alt-A mortgage-backed securities portfolio representing additional impairment on four previously impaired securities and one security that was previously not impaired. Credit OTTI of $1.3 million was recorded for three newly impaired and one previously impaired private-label CMO securities in the 2009 second quarter.
Pooled-trust-preferred securities represent collateralized debt obligations (CDOs) backed by a pool of debt securities issued by financial institutions. As the lowest level input that is significant to the fair value measurement of these securities in its entirety was a Level 3 input, we classified all securities within this portfolio as Level 3 in the fair value hierarchy. The collateral generally consisted of trust-preferred securities and subordinated debt securities issued by banks, bank holding companies, and insurance companies. A full cash flow analysis was used to estimate fair values and assess impairment for each security within this portfolio. Impairment was calculated as the difference between the carrying amount and the amount of cash flows discounted at each securities effective rate. We engaged a third party specialist with direct industry experience in pooled trust preferred securities valuations to provide assistance in estimating the fair value and expected cash flows for each security in this portfolio. Relying on cash flows was necessary because there was a lack of observable transactions in the market and many of the original sponsors or dealers for these securities were no longer able to provide a fair value that was compliant with FASB Statement No. 157, Fair Value Measurements.
The analysis was completed by evaluating the relevant credit and structural aspects of each pooled trust preferred
security in the portfolio, including collateral performance projections for each piece of collateral in each security and terms of each security’s structure. The credit review included analysis of profitability, credit quality, operating efficiency, leverage, and liquidity using the most recently available financial and regulatory information for each underlying collateral issuer. We also reviewed historical industry default data and current/near term operating conditions. Using the results of our analysis, we estimated appropriate default and recovery probabilities for each piece of collateral and then estimated the expected cash flows for each security. All deferrals were considered to be defaults and a recovery assumption of 10% on
8

bank issuers and 15% on insurance issuers one year after the actual or projected default occurs was used. As a result of this testing, we believe we will experience a loss of principal on seven securities; and as such, recorded credit OTTI of $12.5 million for five newly impaired and two previously impaired pooled-trust-preferred securities in the 2009 second quarter.
Please refer to the “Investment Securities Portfolio” discussion for additional information regarding OTTI. Goodwill
Goodwill is tested for impairment annually, as of October 1, using a two-step process that begins with an estimation of the fair value of a reporting unit. Goodwill impairment exists when a reporting unit’s carrying value of goodwill exceeds its implied fair value. Goodwill is also tested for impairment on an interim basis, using the same two-step process as the annual testing, if an event occurs or circumstances change between annual tests that would more likely than not reduce the fair value of the reporting unit below its carrying amount. We had previously performed goodwill impairment tests at June 30, October 1, and December 31, 2008, and concluded no impairment existed at those dates. During the 2009 first quarter, our stock price declined 78%, from $7.66 per common share at December 31, 2008, to $1.66 per common share at March 31, 2009. Peer banks also experienced declines in market capitalization. This decline primarily reflected the continuing economic slowdown and increased market concern surrounding financial institutions’ credit risks and capital positions, as well as uncertainty related to increased regulatory supervision and intervention. We determined that these changes would more-likely-than-not reduce the fair value of certain reporting units below their carrying amounts. Therefore, we performed an interim goodwill impairment test during the 2009 first quarter. An independent third party was engaged to assist with the impairment assessment.
Significant judgment is applied when goodwill is assessed for impairment. This judgment includes developing cash
flow projections, selecting appropriate discount rates, identifying relevant market comparables, incorporating general economic and market conditions, and selecting an appropriate control premium. The selection and weighting of the various fair value techniques may result in a higher or lower fair value. Judgment is applied in determining the weightings that are most representative of fair value. The assumptions used in the goodwill impairment assessment and the application of these estimates and assumptions are discussed below.
2009 FIRST QUARTER IMPAIRMENT TESTING
The first step (Step 1) of impairment testing requires a comparison of each reporting unit’s fair value to carrying value to identify potential impairment. For our impairment testing conducted during the 2009 first quarter, we identified four reporting units: Regional Banking, PFG, Insurance, and Auto Finance and Dealer Services (AFDS). Although Insurance is included within PFG for business segment reporting, it was evaluated as a separate
reporting unit for goodwill impairment testing because it has its own separately allocated goodwill resulting from prior acquisitions. The fair value of PFG (determined using the market approach as described below), excluding Insurance, exceeded its carrying value, and goodwill was determined to not be impaired for this reporting unit.
There was no goodwill associated with AFDS and, therefore, it was not subject to impairment testing.
For Regional Banking, we utilized both the income and market approaches to determine fair value. The income
approach was based on discounted cash flows derived from assumptions of balance sheet and income statement activity. An internal forecast was developed by considering several long-term key business drivers such as anticipated loan and deposit growth. The long-term growth rate used in determining the terminal value was estimated at 2.5%. The discount rate of 14% was estimated based on the Capital Asset Pricing Model, which considered the risk-free interest rate (20-year Treasury Bonds), market risk premium, equity risk premium, and a company-specific risk factor. The company-specific risk factor was used to address the uncertainty of growth estimates and earnings projections of management. For the market approach, revenue, earnings and market capitalization multiples of comparable public companies were selected and applied to the Regional Banking unit’s applicable metrics such as book and tangible book values. A 20% control premium was used in the market approach. The results of the income and market approaches were weighted 75% and 25%, respectively, to arrive at the final calculation of fair value. As market capitalization declined across the banking industry, we believed that a heavier weighting on the income approach is more representative of a market participant’s view. For the
9

Insurance reporting unit, management utilized a market approach to determine fair value. The aggregate fair market values were compared with market capitalization as an assessment of the appropriateness of the fair value measurements. As our stock price fluctuated greatly, we used our average stock price for the 30 days preceding the valuation date to determine market capitalization. The aggregate fair market values of the reporting units compared with market capitalization indicated an implied premium of 27%. A control premium analysis indicated that the implied premium was within range of overall premiums observed in the market place. Neither the Regional Banking nor Insurance reporting units passed Step 1.
The second step (Step 2) of impairment testing is necessary only if the reporting unit does not pass Step 1. Step 2 compares the implied fair value of the reporting unit goodwill with the carrying amount of the goodwill for the reporting unit. The implied fair value of goodwill is determined in the same manner as goodwill that is recognized in a business combination. Significant judgment and estimates are involved in estimating the fair value of the assets and liabilities of the reporting unit.
To determine the implied fair value of goodwill, the fair value of Regional Banking and Insurance (as determined in Step 1) was allocated to all assets and liabilities of the reporting units including any recognized or unrecognized intangible assets. The allocation was done as if the reporting unit was acquired in a business combination, and the fair value of the reporting unit was the price paid to acquire the reporting unit. This allocation process is only performed for purposes of testing goodwill for impairment. The carrying values of recognized assets or liabilities (other than goodwill, as appropriate) were not adjusted nor were any new intangible assets recorded. Key valuations were the assessment of core deposit intangibles, the mark-to-fair-value of outstanding debt and deposits, and mark-to-fair-value on the loan portfolio. Core deposits were valued using a 15% discount rate. The marks on our outstanding debt and deposits were based upon observable trades or modeled prices using current yield curves and market spreads. The valuation of the loan portfolio indicated discounts in the ranges of 9%-24%, depending upon the loan type. For every 100 basis point change in the valuation of our overall loan portfolio, implied goodwill would be impacted by approximately $325 million. The estimated fair value of these loan portfolios was based on an exit price, and the assumptions used were intended to approximate those that a market participant would have used in valuing the loans in an orderly transaction, including a market liquidity discount. The significant market risk premium that is a consequence of the current distressed market conditions was a significant contributor to the valuation discounts associated with these loans. We believed these discounts were consistent with transactions currently occurring in the marketplace.
Upon completion of Step 2, we determined that the Regional Banking and Insurance reporting units’ goodwill
carrying values exceeded their implied fair values of goodwill by $2,573.8 million and $28.9 million, respectively. As a result, we recorded a noncash pretax impairment charge of $2,602.7 million, or $7.09 per common share, in the 2009 first quarter. The impairment charge was included in noninterest expense and did not affect our regulatory and tangible capital ratios. 2009 SECOND QUARTER IMPAIRMENT TESTING
While we recorded an impairment charge of $4.2 million related to the sale of a small payments-related business
completed in July 2009, we concluded that no other goodwill impairment was required during the 2009 second quarter.
Subsequent to the 2009 first quarter impairment testing, we reorganized our Regional Banking segment to reflect how our assets and operations are now managed. The Regional Banking business segment, which through March 31, 2009, had been managed geographically, is now managed by a product segment approach. Essentially, Regional Banking has been divided into the new segments of Retail and Business Banking, Commercial Banking, and Commercial Real Estate.
Primarily as a result of the 2009 first and second quarter impairment charges, our goodwill totaled $0.4 billion at June
30, 2009. Of this amount, $0.3 billion was allocated to the Retail and Business Banking segment.
Due to the current economic environment and other uncertainties, it is possible that our estimates and assumptions may adversely change in the future. If our market capitalization decreases or the liquidity discount on our loan portfolio improves significantly without a concurrent increase in market capitalization, we may be required to record additional goodwill impairment losses in future periods, whether in connection with our next annual impairment testing in the 2009 third quarter or prior to that, if any changes constitute a triggering event. It is not possible at this time to determine if any such future impairment loss would result or, if it does, whether such charge would be material. However, any such future impairment loss would be limited to the remaining goodwill balance of $0.4 billion at June 30, 2009.
10

11
Franklin Loans Restructuring Transaction (This section should be read in conjunction with Note 3 of the Notes to the Unaudited Condensed Consolidated Financial Statements).
Franklin is a specialty consumer finance company primarily engaged in servicing residential mortgage loans. Prior to March 31, 2009, Franklin owned a portfolio of loans secured by first- and second- liens on 1-4 family residential properties. At December 31, 2008, our total loans outstanding to Franklin were $650.2 million, all of which were placed on nonaccrual status. Additionally, the specific allowance for loan and lease losses for the Franklin portfolio was $130.0 million, resulting in our net exposure to Franklin at December 31, 2008, of $520.2 million.
On March 31, 2009, we entered into a transaction with Franklin whereby a Huntington wholly-owned REIT subsidiary
(REIT) indirectly acquired an 84% ownership right in a trust which holds all the underlying consumer loans and other real estate owned (OREO) properties that were formerly collateral for the Franklin commercial loans. The equity interests provided to Franklin by the REIT were pledged by Franklin as collateral for the Franklin commercial loans.
As a result of the restructuring, on a consolidated basis, the $650.2 million nonaccrual commercial loan to Franklin at
December 31, 2008, is no longer reported. Instead, we now report the loans secured by first- and second- mortgages on residential properties and OREO properties both of which had previously been assets of Franklin or its subsidiaries and were pledged to secure our loan to Franklin. At the time of the restructuring, the loans had a fair value of $493.6 million and the OREO properties had a fair value of $79.6 million. As a result, NALs declined by a net amount of $284.1 million as there were $650.2 million commercial NALs outstanding related to Franklin, and $366.1 million mortgage-related NALs outstanding, representing first- and second- lien mortgages that were nonaccruing at March 31, 2009. Also, our specific allowance for loan and lease losses for the Franklin portfolio of $130.0 million was eliminated; however, no initial increase to the allowance for loan and lease losses (ALLL) relating to the acquired mortgages was recorded as these assets were recorded at fair value.
In accordance with Statement No. 141R, we recorded a net deferred tax asset of $159.9 million related to the
difference between the tax basis and the book basis in the acquired assets. Because the acquisition price, represented by the equity interests in our wholly-owned subsidiary, was equal to the fair value of the acquired 84% ownership right, no goodwill was created from the transaction. The recording of the net deferred tax asset was a bargain purchase under Statement No. 141R, and was recorded as a tax benefit in the 2009 first quarter.

DISCUSSION OF RESULTS OF OPERATIONS
This section provides a review of financial performance from a consolidated perspective. It also includes a “Significant Items” section that summarizes key issues important for a complete understanding of performance trends. Key consolidated balance sheet and income statement trends are discussed. All earnings per share data are reported on a diluted basis. For additional insight on financial performance, please read this section in conjunction with the “Business Segment” discussion.
The below summary provides an update of key events and trends during the current quarter. Comparisons are made with the prior quarter, as we believe this comparison provides the most meaningful measurement relative to analyzing trends. Summary
We reported a net loss of $125.1 million in the 2009 second quarter, representing a loss per common share of $0.40. This compared favorably with the prior quarter’s net loss of $2,433.2 million, or $6.79 per common share, as the prior quarter was significantly impacted by a $2,602.7 million ($7.09 per common share) goodwill impairment charge, partially offset by a $159.9 million ($0.44 per common share) nonrecurring tax benefit associated with the prior quarter’s Franklin restructuring. In addition to these items, comparisons with the prior quarter were significantly impacted by other factors that are discussed later in the “Significant Items” section (see “Significant Items” discussion).
The largest contributor to our 2009 second quarter net loss was a $121.9 million, or 42%, increase in our provision for credit losses to $413.7 million. This increase resulted from our decision to continue to build reserves based primarily from our review of every “noncriticized” commercial relationship with an aggregate exposure of over $500,000. The review encompassed $13 billion of outstanding balances consisting of commercial and industrial (C&I), CRE, and business banking loans. (See “Commercial Loan Portfolio Review And Actions” section located within the “Commercial Credit” section for additional information.) While we continue to believe our commercial portfolio will remain under pressure, we believe that the risks in our portfolio are manageable.
Credit quality performance in the 2009 second quarter continued to be negatively impacted by the sustained economic
weaknesses in our Midwest markets. The continued trend of higher unemployment rates and declining home values in our markets negatively impacted consumer loan credit quality. Non-Franklin net charge-offs (NCOs) totaled $344.5 million, compared with $213.2 million in the prior quarter. The increase was largely within the commercial loan portfolio, as the single family home builder and retail project segments continued to be stressed. NPAs also increased, primarily within the commercial loan portfolio, reflecting the continued decline in the housing markets, and stress on retail sales. Our outlook is that the economy will remain under stress, and that no improvement will be seen through the end of 2009. As a result, we expect that the overall level of NPAs and NCOs will remain elevated, especially as related to continued softness in our C&I and CRE portfolios.
During the current quarter, we took proactive steps to increase our capital position as we executed total additions of
$704.9 million to Tier 1 common equity. This capital raising was accomplished through several actions including discretionary equity issuances, a common stock offering, conversion of preferred stock, and a gain on the redemption of a portion of our junior subordinated debt. These actions strengthened all of our period-end capital ratios. Our TCE ratio increased to 5.68% from 4.65%, and our Tier 1 common equity ratio increased to 6.80% from 5.64%.
Our period-end liquidity position remained strong as average core deposits grew at a 17% annualized rate, thus
reducing our reliance on noncore funding. As of June 30, 2009, we had $8.0 billion of unused Federal Home Loan Bank (FHLB) and Federal Reserve borrowing capacity, $3.2 billion in unpledged investment securities, and our available cash totaled $2.1 billion.
Fully-taxable equivalent net interest income in the 2009 second quarter increased $10.0 million, or 3%, compared with the prior quarter. The increase reflected a 13 basis point improvement in our net interest margin, partially offset by a 5% decline in average total loans and leases. The margin improvement reflected the impact of strong core deposit growth, the benefits of a more disciplined focus on deposit and loan pricing, and the benefits of our Franklin restructuring during the 2009 first quarter; partially offset by the negative impact of maintaining a higher liquidity position and the higher levels of NPAs. We expect that the net interest margin will be flat or improve slightly from the 2009 second quarter level. We expect that average total loans will decline modestly, reflecting the impacts of our efforts to reduce our CRE exposure and
12

the weak economy, as well as charge-offs. As previously mentioned, average core deposits grew at an annualized 17% rate, despite the competitive market. Deposit growth is a strategic priority for us through the end of 2009.
Noninterest income in the 2009 second quarter increased $26.8 million compared with the 2009 first quarter. The following table reflects the impacts of “Significant Items” to noninterest income (see “Significant Items”).
Table 1 - Noninterest Income - Significant Items Impact - 2009 Second Quarter vs. 2009 First Quarter
Second FirstQuarter Quarter
(in thousands) 2009 2009Total noninterest income, excluding
Significant Items 234,583$ 239,102$ (4,519)$
Significant Items:Gain related to Visa® stock 31,362 --- 31,362
Total noninterest income 265,945$ 239,102$ 26,843$
Change
As shown in the table above, after adjusting for “Significant Items”, noninterest income decreased $4.5 million. This
decrease reflected a decline in brokerage and insurance income as a result of lower annuity sales and stronger seasonal insurance income in the prior quarter. The prior quarter also represented a record level of investment sales. This decrease was partially offset by stronger growth in service charges on deposits and electronic banking income as a result of normal season increases.
The following table reflects the impacts of “Significant Items” to noninterest expense (see “Significant Items”). Table 2 - Noninterest Expense - Significant Items Impact - 2009 Second Quarter vs. 2009 First Quarter
S econd FirstQuarter Quarter
(in thousands) 2009 2009 ChangeTotal noninterest expense, excluding
S ignificant Items 379,605$ 367,056$ 12,549$
Significant Items:Goodwill impairment 4,231 2,602,713 (2,598,482) FDIC special assessment 23,555 --- 23,555 Gain on redemption of junior subordinated debt (67,409) --- (67,409)
Total noninterest expense 339,982$ 2,969,769$ (2,629,787)$
As shown in the table above, after adjusting for “Significant Items” (see “Significant Items”), noninterest expense
increased $12.5 million. This increase primarily reflected a $16.6 million increase in OREO expenses, partially offset by a $4.2 million decline in personnel expenses. The decrease in personnel expenses reflected the implementation of our $100 million expense reduction initiatives. We expect to exceed the targeted $100 million of expense savings during 2010.
13
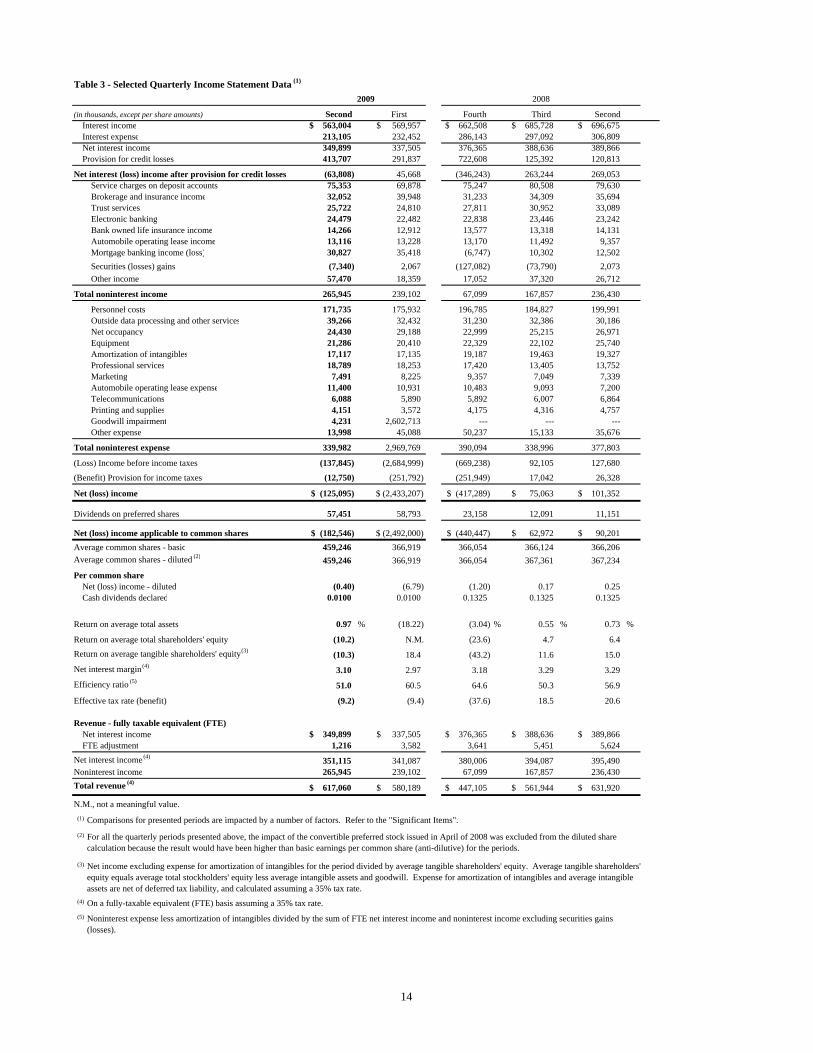
Table 3 - Selected Quarterly Income Statement Data (1)
(in thousands, except per share amounts) FirstInterest income 563,004$ 569,957$ 662,508$ 685,728$ 696,675$ Interest expense 213,105 232,452 286,143 297,092 306,809 Net interest income 349,899 337,505 376,365 388,636 389,866 Provision for credit losses 413,707 291,837 722,608 125,392 120,813
Net interest (loss) income after provision for credit losses (63,808) 45,668 (346,243) 263,244 269,053 Service charges on deposit accounts 75,353 69,878 75,247 80,508 79,630 Brokerage and insurance income 32,052 39,948 31,233 34,309 35,694 Trust services 25,722 24,810 27,811 30,952 33,089 Electronic banking 24,479 22,482 22,838 23,446 23,242 Bank owned life insurance income 14,266 12,912 13,577 13,318 14,131 Automobile operating lease income 13,116 13,228 13,170 11,492 9,357 Mortgage banking income (loss) 30,827 35,418 (6,747) 10,302 12,502 Securities (losses) gains (7,340) 2,067 (127,082) (73,790) 2,073 Other income 57,470 18,359 17,052 37,320 26,712
Total noninterest income 265,945 239,102 67,099 167,857 236,430
Personnel costs 171,735 175,932 196,785 184,827 199,991 Outside data processing and other services 39,266 32,432 31,230 32,386 30,186 Net occupancy 24,430 29,188 22,999 25,215 26,971 Equipment 21,286 20,410 22,329 22,102 25,740 Amortization of intangibles 17,117 17,135 19,187 19,463 19,327 Professional services 18,789 18,253 17,420 13,405 13,752 Marketing 7,491 8,225 9,357 7,049 7,339 Automobile operating lease expense 11,400 10,931 10,483 9,093 7,200 Telecommunications 6,088 5,890 5,892 6,007 6,864 Printing and supplies 4,151 3,572 4,175 4,316 4,757 Goodwill impairment 4,231 2,602,713 --- --- --- Other expense 13,998 45,088 50,237 15,133 35,676
Total noninterest expense 339,982 2,969,769 390,094 338,996 377,803
(Loss) Income before income taxes (137,845) (2,684,999) (669,238) 92,105 127,680
(Benefit) Provision for income taxes (12,750) (251,792) (251,949) 17,042 26,328
Net (loss) income (125,095)$ (2,433,207)$ (417,289)$ 75,063$ 101,352$
Dividends on preferred shares 57,451 58,793 23,158 12,091 11,151
Net (loss) income applicable to common shares (182,546)$ (2,492,000)$ (440,447)$ 62,972$ 90,201$ Average common shares - basic 459,246 366,919 366,054 366,124 366,206 Average common shares - diluted (2) 459,246 366,919 366,054 367,361 367,234
Per common shareNet (loss) income - diluted (0.40) (6.79) (1.20) 0.17 0.25 Cash dividends declared 0.0100 0.0100 0.1325 0.1325 0.1325
Return on average total assets 0.97 % (18.22) (3.04) % 0.55 % 0.73 %
Return on average total shareholders' equity (10.2) N.M. (23.6) 4.7 6.4 Return on average tangible shareholders' equity (3) (10.3) 18.4 (43.2) 11.6 15.0 Net interest margin (4) 3.10 2.97 3.18 3.29 3.29 Efficiency ratio (5) 51.0 60.5 64.6 50.3 56.9
Effective tax rate (benefit) (9.2) (9.4) (37.6) 18.5 20.6
Revenue - fully taxable equivalent (FTE)Net interest income 349,899$ 337,505$ 376,365$ 388,636$ 389,866$ FTE adjustment 1,216 3,582 3,641 5,451 5,624
Net interest income (4) 351,115 341,087 380,006 394,087 395,490 Noninterest income 265,945 239,102 67,099 167,857 236,430 Total revenue (4)
617,060$ 580,189$ 447,105$ 561,944$ 631,920$
N.M., not a meaningful value.(1)
(2)
(3)
(4) On a fully-taxable equivalent (FTE) basis assuming a 35% tax rate.(5)
Comparisons for presented periods are impacted by a number of factors. Refer to the "Significant Items".
Net income excluding expense for amortization of intangibles for the period divided by average tangible shareholders' equity. Average tangible shareholders' equity equals average total stockholders' equity less average intangible assets and goodwill. Expense for amortization of intangibles and average intangible assets are net of deferred tax liability, and calculated assuming a 35% tax rate.
For all the quarterly periods presented above, the impact of the convertible preferred stock issued in April of 2008 was excluded from the diluted share calculation because the result would have been higher than basic earnings per common share (anti-dilutive) for the periods.
Noninterest expense less amortization of intangibles divided by the sum of FTE net interest income and noninterest income excluding securities gains (losses).
2009 2008
Second Fourth Third Second
14

Table 4 - Selected Year to Date Income Statement Data (1)
(in thousands, except per share amounts) AmountInterest income 1,132,961$ 1,450,086$ (317,125)$ (21.9) %Interest expense 445,557 683,396 (237,839) (34.8) Net interest income 687,404 766,690 (79,286) (10.3) Provision for credit losses 705,544 209,463 496,081 N.M.
Net interest (loss) income after provision for credit losses (18,140) 557,227 (575,367) N.M.Service charges on deposit accounts 145,231 152,298 (7,067) (4.6) Brokerage and insurance income 72,000 72,254 (254) (0.4) Trust services 50,532 67,217 (16,685) (24.8) Electronic Banking 46,961 43,983 2,978 6.8 Bank owned life insurance income 27,178 27,881 (703) (2.5) Automobile operating lease income 26,344 15,189 11,155 73.4 Mortgage banking income 66,245 5,439 60,806 N.M.Securities (losses) gains (5,273) 3,502 (8,775) N.M.Other income 75,829 84,419 (8,590) (10.2)
Total noninterest income 505,047 472,182 32,865 7.0 Personnel costs 347,667 401,934 (54,267) (13.5) Outside data processing and other services 71,698 64,547 7,151 11.1 Net occupancy 53,618 60,214 (6,596) (11.0) Equipment 41,696 49,534 (7,838) (15.8) Amortization of intangibles 34,252 38,244 (3,992) (10.4) Professional services 37,042 22,842 14,200 62.2 Marketing 15,716 16,258 (542) (3.3) Automobile operating lease expense 22,331 11,706 10,625 90.8 Telecommunications 11,978 13,109 (1,131) (8.6) Printing and supplies 7,723 10,379 (2,656) (25.6) Goodwill impairment 2,606,944 --- 2,606,944 --- Other expense 59,086 59,517 (431) (0.7)
Total noninterest expense 3,309,751 748,284 2,561,467 N.M.(Loss) Income before income taxes (2,822,844) 281,125 (3,103,969) N.M.(Benefit) Provision for income taxes (264,542) 52,705 (317,247) N.M.Net (loss) income (2,558,302)$ 228,420$ (2,786,722)$ N.M. %
Dividends declared on preferred shares 116,244 11,151 105,093 N.M.Net (loss) income applicable to common shares (2,674,546)$ 217,269$ (2,891,815)$ N.M. %
Average common shares - basic 413,083 366,221 46,862 12.8 %Average common shares - diluted (2) 413,083 387,322 25,761 6.7
Per common shareNet (loss) income per common share - diluted (6.47)$ 0.59$ (7.06)$ N.M.Cash dividends declared 0.0200 0.3975 (0.3775) (95.0)
Return on average total assets (9.77) % 0.83 % (10.60) % N.M. %Return on average total shareholders' equity (85.0) 7.6 (92.6) N.M.Return on average tangible shareholders' equity (3) (124.2) 18.2 (142.4) N.M.Net interest margin (4) 3.03 3.26 (0.23) (7.1) Efficiency ratio (5) 55.6 57.0 (1.4) (2.5) Effective tax rate (benefit) (9.4) 18.7 (28.1) N.M
Revenue - fully taxable equivalent (FTE)Net interest income 687,404$ 766,690$ (79,286)$ (10.3) %FTE adjustment 4,798 11,126 (6,328) (56.9) Net interest income 692,202 777,816 (85,614) (11.0) Non-interest income 505,047 472,182 32,865 7.0 Total revenue 1,197,249$ 1,249,998$ (52,749)$ (4.2) %N.M., not a meaningful value.
(1)
(2)
(3)
(4)
(5)
On a fully taxable equivalent (FTE) basis assuming a 35% tax rate.
Comparisons for presented periods are impacted by a number of factors. Refer to the 'Significant Items" discussion.For the six months ended June 30, 2009, the impact of the convertible preferred stock issued in April of 2008 was excluded from the diluted share calculation because the result was more than basic earnings per common share (anti-dilutive) for the period. For the six months ended June 30, 2008, the impact of the convertible preferred stock issued in April of 2008 was included from the diluted share calculation because the result was less than basic earnings per common share (dilutive) for the period.
Noninterest expense less amortization of intangibles divided by the sum of FTE net interest income and noninterest income excluding securities (losses) gains.
Net income excluding expense for amortization of intangibles for the period divided by average tangible shareholders' equity. Average tangible shareholders' equity equals average total shareholders' equity less average intangible assets and goodwill. Expense for amortization of intangibles and average intangible assets are net of deferred tax liability, and calculated assuming a 35% tax rate.
Percent
Change
2009
Six Months Ended June 30,
2008
15

Significant Items Definition of Significant Items
From time to time, revenue, expenses, or taxes, are impacted by items we believe to be outside of ordinary banking activities and/or by items that, while they may be associated with ordinary banking activities, are so unusually large that we believe the outsized impact at that time to be one-time or short-term in nature. We refer to such items as "Significant Items". Most often, these significant items result from factors originating outside the company: regulatory actions/assessments, windfall gains, changes in accounting principles, one-time tax assessments/refunds, and other similar items. In other cases they may result from our decisions associated with significant corporation actions out of the ordinary course of business: merger/restructuring charges, recapitalization actions, goodwill impairment, and other similar items.
Even though certain revenue and expense items are naturally subject to more volatility than others due to changes in
market and economic environment conditions, as a general rule, volatility alone does not define a significant item. For example, changes in the provision for credit losses, gains/losses from investment activities, and asset valuation writedowns reflect ordinary banking activities and are, therefore, typically excluded from consideration as a significant item.
We believe the disclosure of “Significant Items” in current and prior period results aids in better understanding our
performance and trends so readers can ascertain which of such items, if any, they may wish to include or exclude from an analysis of our performance within the context of determining how that performance differed from expectations, as well as how, if at all, to adjust estimates of future performance accordingly.
"Significant Items" for any particular period are not intended to be a complete list of items that may materially impact
current or future period performance. A number of items could materially impact these periods, including those described in our 2008 Annual Report on Form 10-K and other factors described from time to time in our other filings with the SEC.
The above description of “Significant Items” represents a change in definition from that provided in our 2008 Annual
Report. Certain components listed within the “Timing Differences” section found within the “Significant Items” section on our 2008 Annual Report are no longer considered within the scope of our definition of “Significant Items”. Although these items are subject to more volatility than other items due to changes in market and economic environment conditions, they reflect ordinary banking activities.
16

Table 5 - Significant Items Influencing Earnings Performance Comparison
(in millions)Net income - reported earnings (125.1)$ (2,433.2)$ 101.4$ Earnings per share, after tax (0.40)$ (6.79)$ 0.25$
Change from prior quarter - $ 6.39 (5.59) (0.10) Change from prior quarter - % (94.1) % N.M. % 28.6 %
Change from a year-ago - $ (0.65)$ (7.14)$ (0.09)$ Change from a year-ago - % N.M. % N.M. % (26.5) %
Significant items - favorable (unfavorable) impact: EPS EPS EPS
Gain on redemption of junior subordinated debt 67.4$ 0.10$ -$ -$ -$ -$ Gain related to Visa® stock 31.4 0.04 --- --- --- --- FDIC special assessment (23.6) (0.03) --- --- --- --- Goodwill impairment (4.2) (0.01) (2,602.7) (7.09) --- --- Preferred stock conversion deemed dividend --- (0.06) --- (0.08) --- --- Franklin relationship restructuring (2) --- --- 159.9 0.44 --- --- Deferred tax valuation allowance benefit (2) --- --- --- --- 3.4 0.01 Merger and restructuring costs --- --- --- --- (14.6) (0.03)
(in millions)
Net income - reported earnings (2,558.3)$ 228.4$ Earnings per share, after tax (6.47)$ (3) 0.59$
Change from a year-ago - $ (7.06) (0.15) Change from a year-ago - % N.M. % (20.3) %
Significant items - favorable (unfavorable) impact: EPS EPS
Franklin relationship restructuring (2) 159.9$ 0.39$ -$ -$ Gain on redemption of junior subordinated debt 67.4 0.11 --- --- Gain related to Visa® stock 31.4 0.05 25.1 0.04 Goodwill impairment (2,606.9) (6.31) --- --- FDIC special assessment (23.6) (0.04) --- --- Preferred stock conversion deemed dividend --- (0.14) --- --- Deferred tax valuation allowance benefit (2) --- --- 14.5 0.04 Visa® indemnification liability --- --- 12.4 0.02 Merger and restructuring costs --- --- (21.9) (0.04) Asset impairment --- --- (12.4) (0.02)
N.M., not a meaningful value.(1) Pretax unless otherwise noted.(2) After-tax.(3)
June 30, 2009 March 31, 2009 June 30, 2008Three Months Ended
After-tax EPS
Earnings (1) Earnings (1) Earnings (1)
After-tax EPS After-tax EPS
Reflects the impact of the 201.6 million additional shares of common stock issued during the period. Of these shares, 24.6 million were issued late in the 2009 first quarter and the remaining 177.0 million shares were issued during the 2009 second quarter.
Earnings (1) Earnings (1)
Six Months EndedJune 30, 2009 June 30, 2008
After-tax EPS After-tax EPS
17

Significant Items Influencing Financial Performance Comparisons
Earnings comparisons were impacted by a number of significant items summarized below.
1. Goodwill Impairment. The impacts of goodwill impairment on our reported results were as follows:
• During the 2009 first quarter, bank stock prices continued to decline significantly. Our stock price declined 78% from $7.66 per share at December 31, 2008 to $1.66 per share at March 31, 2009. Given this significant decline, we conducted an interim test for goodwill impairment. As a result, we recorded a noncash $2,602.7 million pretax ($7.09 per common share) charge. (See “Goodwill” discussion located within the “Critical Accounting Policies and Use of Significant Estimates” section for additional information).
• During the 2009 second quarter, a pretax goodwill impairment of $4.2 million ($0.01 per common share) was recorded relating to the sale of a small payments-related business in July 2009.
2. Franklin Relationship Restructuring. The impacts of the Franklin relationship on our reported results were as follows (see “Franklin Relationship” discussion located within the “Risk Management and Capital” section and the “Franklin Loans” discussion located within the “Critical Accounting Policies and Use of Significant Estimates” discussion for additional information.):
• Performance for the 2009 first quarter included a nonrecurring net tax benefit of $159.9 million ($0.44 per common share) related to the restructuring with Franklin. Also as a result of the restructuring, although earnings were not significantly impacted, commercial NCOs increased $128.3 million as the previously established $130.0 million Franklin-specific ALLL was utilized to write-down the acquired mortgages and OREO collateral to fair value.
• The restructuring affects the comparability of our 2009 second quarter income statement with prior periods. In the 2009 second quarter, we recorded interest income from the loans that we now own as a result of the restructuring. Interest income was earned through interest payments on accruing loans, from the payoff of loans that were recorded at a discount, and through the accretion of the accretable discount recorded at the time the loans were acquired. Noninterest expense was also impacted as, effective with the 2009 second quarter, we pay Franklin to service the loans, and record the expense of holding foreclosed homes, including any declines in the fair value of these homes below their carrying value.
3. Preferred Stock Conversion. During the 2009 first and second quarters, we converted 114,109 and 92,384
shares, respectively, of Series A 8.50% Non-cumulative Perpetual Preferred (Series A Preferred Stock) stock into common stock. As part of these transactions, there was a deemed dividend that did not impact net income, but resulted in negative impacts of $0.08 per common share for the 2009 first quarter and $0.06 per common share for the 2009 second quarter. (See “Capital” discussion located within the “Risk Management and Capital” section for additional information.)
4. Visa®. Prior to the Visa® initial public offering (IPO) occurring in March 2008, Visa® was owned by its member
banks, which included the Bank. The impacts related to the Visa® IPO for the first six-month periods of 2009 and 2008 are presented in the following table:
18

Table 6 - Visa® impacts - First Six Months of 2009 and 2008
(in millions)Gain related to Visa® stock (1) 31.4$ -$ -$ 25.1$ Visa® indemnification liability (2) - - - 12.4 Deferred tax valuation allowance benefit (3) - - 11.1 3.4
(1)
(2)
(3)
Pretax. Recorded to noninterest expense, and represents a reversal of our pro-rata portion of an indemnification charge provided to Visa® by its member banks for various litigation filed against Visa®, as an escrow account was established by Visa® using a portion of the proceeds received from the IPO.
After-tax. Recorded to provision for income taxes, and represents a reduction to the previously established capital loss carry-forward valuation allowance related to the value of Visa® shares held.
Second Quarter First Quarter
Pretax. Recorded to noninterest income, and represents a gain on the sale of ownership interest in Visa®. As part of the 2009 second quarter sale, we released $7.1 million, as of June 30, 2009, of the remaining indemnification liability. Concurrently, we established a $7.1 million swap liability associated with the conversion protection provided to the purchasers of the Visa® shares.
2009Second Quarter First Quarter
2008
5. Other Significant Items Influencing Earnings Performance Comparisons. In addition to the items discussed
separately in this section, a number of other items impacted financial results. These included:
2009 – Second Quarter
• $67.4 million pretax gain ($0.10 per common share) related to the redemption of a portion of our junior subordinated debt.
• $23.6 million ($0.03 per common share) negative impact due to a special Federal Deposit Insurance Corporation (FDIC) insurance premium assessment.
2008 – Second Quarter
• $14.6 million ($0.03 per common share) of merger and restructuring costs related to the Sky Financial Group, Inc. acquisition in 2007.
• $1.4 million of asset impairment, included in other noninterest expense, relating to the charge-off of a receivable.
2008 – First Quarter
• $11.0 million ($0.02 per common share) of asset impairment, including (a) $5.9 million venture capital loss included in other noninterest income, (b) $2.6 million charge-off of a receivable included in other noninterest expense, and (c) $2.5 million write-down of leasehold improvements in our Cleveland main office included net occupancy expense.
• $7.3 million ($0.01 per common share) of merger and restructuring costs related to the Sky Financial Group, Inc. acquisition in 2007.
19

Net Interest Income / Average Balance Sheet 2009 Second Quarter versus 2008 Second Quarter
Fully-taxable equivalent net interest income decreased $44.4 million, or 11%, from the year-ago quarter primarily
reflecting a 19 basis point decline in the net interest margin to 3.10% from 3.29%. This decline primarily reflected the unfavorable impact of maintaining a higher liquidity position partially offset by managed reductions of our balance sheet and other capital management initiatives. Declining market interest rates as well as the impact of increased NALs also contributed to the decline in net interest margin. Average earning assets also decreased $2.8 billion, or 6%, primarily reflecting a $2.0 billion, or 5%, decline in average total loans and leases.
The following table details the changes in our average loans and leases and average deposits:
Table 7 - Average Loans/Leases and Deposits - 2009 Second Quarter vs. 2008 Second Quarter
(in thousands) 2009 2008 AmountNet interest income - FTE 351,115$ 395,490$ (44,375)$ (11.2) %
(in millions)Average Loans/Leases
Commercial and industrial 13,523$ 13,631$ (108)$ (0.8) %Commercial real estate 9,199 9,601 (402) (4.2)
Total commercial 22,722 23,232 (510) (2.2)
Automobile loans and leases 3,290 4,551 (1,261) (27.7) Home equity 7,640 7,365 275 3.7 Residential mortgage 4,657 5,178 (521) (10.1) Other consumer 698 699 (1) (0.1)
Total consumer 16,285 17,793 (1,508) (8.5) Total loans 39,007$ 41,025$ (2,018)$ (4.9) %
Average DepositsDemand deposits - noninterest bearing 6,021$ 5,061$ 960$ 19.0 %Demand deposits - interest bearing 4,547 4,086 461 11.3 Money market deposits 6,355 6,267 88 1.4 Savings and other domestic time deposits 5,031 5,242 (211) (4.0) Core certificates of deposit 12,501 11,058 1,443 13.0
Total core deposits 34,455 31,714 2,741 8.6 Other deposits 5,079 6,313 (1,234) (19.5)
Total deposits 39,534$ 38,027$ 1,507$ 4.0 %
PercentSecond Quarter Change
The $2.0 billion, or 5%, decrease in average total loans and leases reflected:
• $1.5 billion, or 8%, decrease in average total consumer loans. This primarily reflected a $1.3 billion, or 28%, decline in average automobile loans and leases due to the 2009 first quarter securitization of $1.0 billion of automobile loans and continued runoff of the automobile lease portfolio. The $0.5 billion, or 10%, decline in average residential mortgages reflected the impact of loan sales, as well as the continued refinance of portfolio loans. The majority of this refinance activity was fixed-rate loans, which we typically sell to the secondary market. Average home equity loans increased 4%, due primarily to higher utilization of existing lines and slower runoff experience. The increased line usage was a result of higher quality borrowers taking advantage of the low interest rate environment.
• $0.5 billion, or 2%, decrease in average total commercial loans, with most of the decline reflected in CRE loans. The decline in CRE loans primarily reflected the reclassification process of CRE loans to C&I loans completed late in the 2009 first quarter. The reclassification was primarily associated with loans to
20
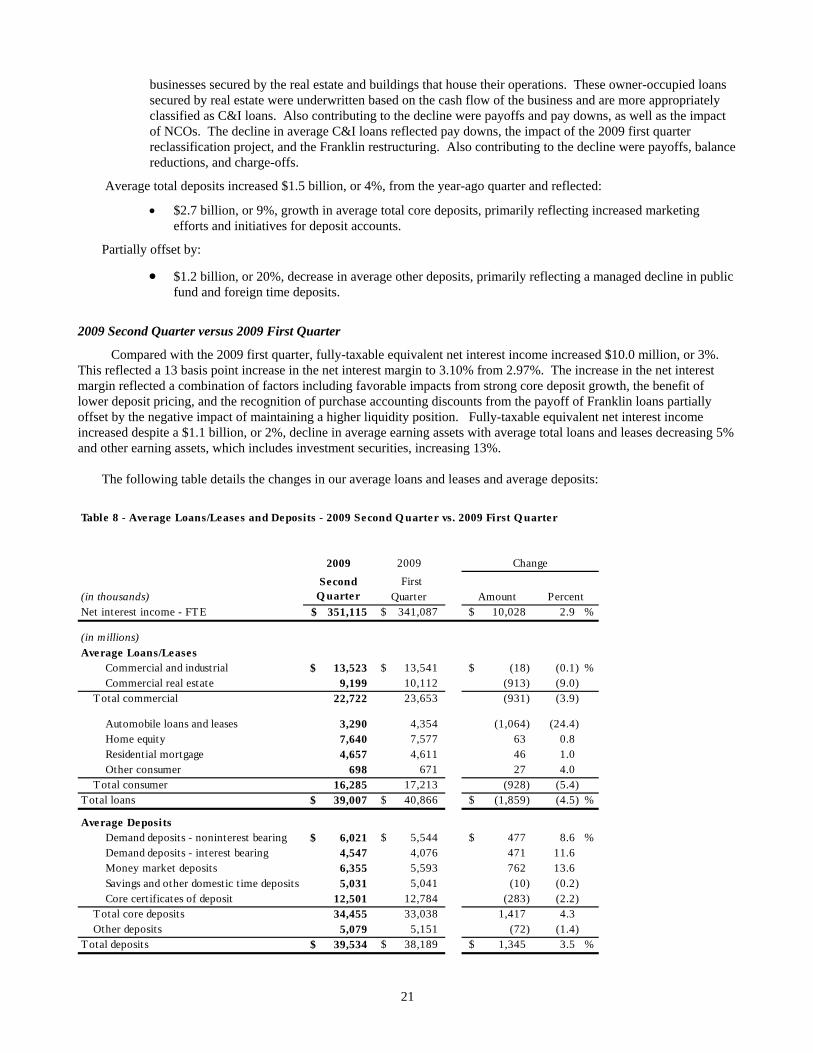
businesses secured by the real estate and buildings that house their operations. These owner-occupied loans secured by real estate were underwritten based on the cash flow of the business and are more appropriately classified as C&I loans. Also contributing to the decline were payoffs and pay downs, as well as the impact of NCOs. The decline in average C&I loans reflected pay downs, the impact of the 2009 first quarter reclassification project, and the Franklin restructuring. Also contributing to the decline were payoffs, balance reductions, and charge-offs.
Average total deposits increased $1.5 billion, or 4%, from the year-ago quarter and reflected:
• $2.7 billion, or 9%, growth in average total core deposits, primarily reflecting increased marketing efforts and initiatives for deposit accounts.
Partially offset by:
• $1.2 billion, or 20%, decrease in average other deposits, primarily reflecting a managed decline in public fund and foreign time deposits.
2009 Second Quarter versus 2009 First Quarter
Compared with the 2009 first quarter, fully-taxable equivalent net interest income increased $10.0 million, or 3%. This reflected a 13 basis point increase in the net interest margin to 3.10% from 2.97%. The increase in the net interest margin reflected a combination of factors including favorable impacts from strong core deposit growth, the benefit of lower deposit pricing, and the recognition of purchase accounting discounts from the payoff of Franklin loans partially offset by the negative impact of maintaining a higher liquidity position. Fully-taxable equivalent net interest income increased despite a $1.1 billion, or 2%, decline in average earning assets with average total loans and leases decreasing 5% and other earning assets, which includes investment securities, increasing 13%.
The following table details the changes in our average loans and leases and average deposits:
Table 8 - Average Loans/Leases and Deposits - 2009 Second Q uarter vs. 2009 First Q uarter
2009 2009
(in thousands)Second
Q uarter First
Quarter AmountNet interest income - FTE 351,115$ 341,087$ 10,028$ 2.9 %
(in millions)Average Loans/Leases
Commercial and industrial 13,523$ 13,541$ (18)$ (0.1) %Commercial real estate 9,199 10,112 (913) (9.0)
Total commercial 22,722 23,653 (931) (3.9)
Automobile loans and leases 3,290 4,354 (1,064) (24.4) Home equity 7,640 7,577 63 0.8 Residential mortgage 4,657 4,611 46 1.0 Other consumer 698 671 27 4.0
Total consumer 16,285 17,213 (928) (5.4) Total loans 39,007$ 40,866$ (1,859)$ (4.5) %
Average DepositsDemand deposits - noninterest bearing 6,021$ 5,544$ 477$ 8.6 %Demand deposits - interest bearing 4,547 4,076 471 11.6 Money market deposits 6,355 5,593 762 13.6 Savings and other domestic t ime deposits 5,031 5,041 (10) (0.2) Core cert ificates of deposit 12,501 12,784 (283) (2.2)
Total core deposits 34,455 33,038 1,417 4.3 Other deposits 5,079 5,151 (72) (1.4)
Total deposits 39,534$ 38,189$ 1,345$ 3.5 %
Percent
Change
21
Average total loans and leases declined $1.9 billion, or 5%, primarily reflecting declines in total CRE and automobile loans and leases.
Average total commercial loans decreased $0.9 billion, or 4%. The decline in average CRE loans primarily reflected the reclassification process of CRE loans to C&I loans noted earlier. Also contributing to the decline were payoffs, balance reductions, and charge-offs. Average C&I loans were essentially unchanged, reflecting the benefit of the first quarter’s CRE reclassification and new loan originations, offset almost entirely by payoffs and line reductions as well as the first quarter restructuring of the Franklin relationship which had the effect of reducing C&I loans and increasing residential mortgages and home equity loans.
Average total consumer loans declined $0.9 billion, or 5%. This decline was entirely attributable to the $1.1 billion, or 24%, decrease in average total automobile loans and leases. Average automobile loans declined $1.0 billion, reflecting the impact of a $1.0 billion automobile loan securitization at the end of the 2009 first quarter. Average automobile leases declined $0.1 billion, reflecting the continued runoff of the lease portfolio.
Average residential mortgages and home equity loans were essentially unchanged. The increase due to the 2009 first quarter reclassification of Franklin loans to these categories from C&I loans offset the negative impact of the sale of mortgage loans at the end of the 2009 first quarter. Though mortgage loan originations remained strong, as is our practice, we sold virtually all of our fixed-rate production in the secondary market. Demand for home equity loans remained weak, reflecting the impact of the economic environment and home values.
The 13% increase in average other earning assets reflected redeployment of the cash proceeds from the 2009 first quarter automobile loan securitization into investment securities, as well as the retention of a portion of the resulting securities. Average investment securities increased $0.9 billion, or 20%, from the prior quarter.
Average total deposits increased $1.3 billion, or 4% (14% annualized), from the prior quarter and reflected:
• $1.4 billion, or 4%, growth in average total core deposits, primarily reflecting increased marketing efforts and initiatives for deposit accounts.
Tables 9 and 10 reflect quarterly average balance sheets and rates earned and paid on interest-earning assets and
interest-bearing liabilities.
22

Table 9 - Consolidated Quarterly Average Balance Sheets
Fully-taxable equivalent basis
(in millions) First Second Amount
AssetsInterest bearing deposits in banks 369$ 355$ 343$ 321$ 256$ 113$ 44.1 %Trading account securities 88 278 940 992 1,243 (1,155) (92.9) Federal funds sold and securities purchased
under resale agreements --- 19 48 363 566 (566) (100.0) Loans held for sale 709 627 329 274 501 208 41.5 Investment securities:
Taxable 5,181 3,961 3,789 3,975 3,971 1,210 30.5 Tax-exempt 126 465 689 712 717 (591) (82.4)
Total investment securities 5,307 4,426 4,478 4,687 4,688 619 13.2 Loans and leases: (1)
Commercial: Commercial and industrial 13,523 13,541 13,746 13,629 13,631 (108) (0.8) Commercial real estate:
Construction 1,946 2,033 2,103 2,090 2,038 (92) (4.5) Commercial 7,253 8,079 8,115 7,726 7,563 (310) (4.1)
Commercial real estate 9,199 10,112 10,218 9,816 9,601 (402) (4.2)
Total commercial 22,722 23,653 23,964 23,445 23,232 (510) (2.2)
Consumer:Automobile loans 2,867 3,837 3,899 3,856 3,636 (769) (21.1) Automobile leases 423 517 636 768 915 (492) (53.8)
Automobile loans and leases 3,290 4,354 4,535 4,624 4,551 (1,261) (27.7) Home equity 7,640 7,577 7,523 7,453 7,365 275 3.7 Residential mortgage 4,657 4,611 4,737 4,812 5,178 (521) (10.1) Other loans 698 671 678 670 699 (1) (0.1)
Total consumer 16,285 17,213 17,473 17,559 17,793 (1,508) (8.5)
Total loans and leases 39,007 40,866 41,437 41,004 41,025 (2,018) (4.9) Allowance for loan and lease losses (930) (913) (764) (731) (654) (276) 42.2
Net loans and leases 38,077 39,953 40,673 40,273 40,371 (2,294) (5.7)
Total earning assets 45,480 46,571 47,575 47,641 48,279 (2,799) (5.8) Cash and due from banks 2,466 1,553 928 925 943 1,523 N.M.Intangible assets 780 3,371 3,421 3,441 3,449 (2,669) (77.4) All other assets 3,701 3,571 3,447 3,384 3,522 179 5.1
Total Assets 51,497$ 54,153$ 54,607$ 54,660$ 55,539$ (4,042)$ (7.3) %
Liabilities and Shareholders' EquityDeposits:
Demand deposits - noninterest bearing 6,021$ 5,544$ 5,205$ 5,080$ 5,061$ 960$ 19.0 %Demand deposits - interest bearing 4,547 4,076 3,988 4,005 4,086 461 11.3 Money market deposits 6,355 5,593 5,500 5,860 6,267 88 1.4 Savings and other domestic deposits 5,031 5,041 5,034 5,100 5,242 (211) (4.0) Core certificates of deposit 12,501 12,784 12,588 11,993 11,058 1,443 13.0
Total core deposits 34,455 33,038 32,315 32,038 31,714 2,741 8.6 Other domestic deposits of $250,000 or more 886 1,069 1,365 1,692 1,842 (956) (51.9) Brokered deposits and negotiable CDs 3,740 3,449 3,049 3,025 3,361 379 11.3 Deposits in foreign offices 453 633 854 1,048 1,110 (657) (59.2)
Total deposits 39,534 38,189 37,583 37,803 38,027 1,507 4.0 Short-term borrowings 879 1,099 1,748 2,131 2,854 (1,975) (69.2) Federal Home Loan Bank advances 947 2,414 3,188 3,139 3,412 (2,465) (72.2) Subordinated notes and other long-term debt 4,640 4,612 4,252 4,382 3,928 712 18.1
Total interest bearing liabilities 39,979 40,770 41,566 42,375 43,160 (3,181) (7.4)
All other liabilities 569 614 817 882 961 (392) (40.8) Shareholders' equity 4,928 7,225 7,019 6,323 6,357 (1,429) (22.5)
Total Liabilities and Shareholders' Equity 51,497$ 54,153$ 54,607$ 54,660$ 55,539$ (4,042)$ (7.3) %
N.M., not a meaningful value.(1) For purposes of this analysis, non-accrual loans are reflected in the average balances of loans.
Change
2Q09 vs 2Q082009 2008
Fourth PercentThirdSecond
23

Table 10 - Consolidated Quarterly Net Interest Margin Analysis
Fully-taxable equivalent basis (1)
Assets Interest bearing deposits in banks 0.37 % 0.45 % 1.44 % 2.17 % 2.77 %Trading account securities 2.22 4.04 5.32 5.45 5.13 Federal funds sold and securities purchased
under resale agreements 0.82 0.20 0.24 2.02 2.08 Loans held for sale 5.19 5.04 6.58 6.54 5.98 Investment securities:
Taxable 4.63 5.60 5.74 5.54 5.50 Tax-exempt 6.83 6.61 7.02 6.80 6.77
Total investment securities 4.69 5.71 5.94 5.73 5.69 Loans and leases: (3)
Commercial:Commercial and industrial 5.00 4.60 5.01 5.46 5.53 Commercial real estate:
Construction 2.78 2.76 4.55 4.69 4.81 Commercial 3.56 3.76 5.07 5.33 5.47
Commercial real estate 3.39 3.55 4.96 5.19 5.32
Total commercial 4.35 4.15 4.99 5.35 5.45
Consumer:Automobile loans 7.28 7.20 7.17 7.13 7.12 Automobile leases 6.12 6.03 5.82 5.70 5.59
Automobile loans and leases 7.13 7.06 6.98 6.89 6.81 Home equity 5.75 5.13 5.87 6.19 6.43 Residential mortgage 5.12 5.71 5.84 5.83 5.78 Other loans 8.22 8.97 9.25 9.71 9.98
Total consumer 5.95 5.92 6.28 6.41 6.48
Total loans and leases 5.02 4.90 5.53 5.80 5.89
Total earning assets 4.99 % 4.99 % 5.57 % 5.77 % 5.85 %
Liabilities and Shareholders' EquityDeposits:
Demand deposits - noninterest bearing --- % --- % --- % --- % --- %Demand deposits - interest bearing 0.18 0.14 0.34 0.51 0.55 Money market deposits 1.14 1.02 1.31 1.66 1.76 Savings and other domestic deposits 1.37 1.50 1.72 1.79 1.91 Core certificates of deposit 3.50 3.81 4.02 4.05 4.36
Total core deposits 2.06 2.28 2.50 2.58 2.68 Other domestic deposits of $250,000 or more 2.61 2.92 3.39 3.50 3.76 Brokered deposits and negotiable CDs 2.54 2.97 3.39 3.37 3.38 Deposits in foreign offices 0.20 0.17 0.90 1.49 1.66
Total deposits 2.11 2.33 2.58 2.66 2.78 Short-term borrowings 0.26 0.25 0.85 1.42 1.66 Federal Home Loan Bank advances 1.13 1.03 3.04 2.92 3.01 Subordinated notes and other long-term debt 2.91 3.29 4.49 4.29 4.21
Total interest bearing liabilities 2.14 % 2.31 % 2.74 % 2.79 % 2.85 % Net interest rate spread 2.85 % 2.68 % 2.83 % 2.98 % 3.00 %Impact of noninterest bearing funds on margin 0.25 0.29 0.35 0.31 0.29 Net interest margin 3.10 % 2.97 % 3.18 % 3.29 % 3.29 %
(1) Fully taxable equivalent (FTE) yields are calculated assuming a 35% tax rate. See Table 3 for the FTE adjustment.(2) Loan, lease, and deposit average rates include impact of applicable derivatives and non-deferrable fees.(3) For purposes of this analysis, nonaccrual loans are reflected in the average balances of loans.
Fourth
Average Rates (2)
Third SecondSecond First
2009 2008
24

2009 First Six Months versus 2008 First Six Months
Fully-taxable equivalent net interest income for the first six-month period of 2009 declined $85.6 million, or 11%, from the comparable year-ago period primarily reflecting a 23 basis point decline in the net interest margin. This decline primarily reflected the unfavorable impact of maintaining a higher liquidity position partially offset by managed reductions of our balance sheet and other capital management initiatives. Declining market interest rates as well as the impact of increased NALs also contributed to the decline in net interest margin. Average earning assets also declined $1.9 billion, or 4%, primarily reflecting a $1.0 billion decline in trading account securities, as well as a $0.8 billion, or 2%, decline in average total loans and leases.
The following table details the changes in our average loans and leases and average deposits:
Table 11 - Average Loans/Leases and Deposits - 2009 First Six Months vs. 2008 First Six Months
(in thousands) 2009 2008 AmountNet interest income - FTE 692,202$ 777,816$ (85,614)$ (11.0) %
(in millions)Average Loans/Leases
Commercial and industrial 13,532$ 13,487$ 45$ 0.3 %Commercial real estate 9,653 9,444 209 2.2
Total commercial 23,185 22,931 254 1.1
Automobile loans and leases 3,820 4,475 (655) (14.6) Home equity 7,609 7,320 289 3.9 Residential mortgage 4,634 5,264 (630) (12.0) Other consumer 683 706 (23) (3.3)
Total consumer 16,746 17,765 (1,019) (5.7) Total loans 39,931$ 40,696$ (765)$ (1.9) %
Average DepositsDemand deposits - noninterest bearing 5,784$ 5,047$ 737$ 14.6 %Demand deposits - interest bearing 4,312 4,010 302 7.5 Money market deposits 5,975 6,510 (535) (8.2) Savings and other domestic time deposits 5,036 5,228 (192) (3.7) Core certificates of deposit 12,643 10,975 1,668 15.2
Total core deposits 33,750 31,770 1,980 6.2 Other deposits 5,115 6,209 (1,094) (17.6)
Total deposits 38,865$ 37,979$ 886$ 2.3 %
ChangePercent
Six Months Ended June 30,
The $0.8 billion, or 2%, decrease in average total loans and leases primarily reflected:
• $0.7 billion, or 15%, decline in average automobile loans and leases, primarily reflecting the 2009 securitization of $1.0 billion of automobile loans, and the continued runoff of the automobile lease portfolio.
• $0.6 billion, or 12%, decline in residential mortgages, reflecting the impact of loan sales, as well as the continued refinance of portfolio loans. The majority of this refinance activity was fixed-rate loans, which we typically sell to the secondary market.
Partially offset by: • $0.3 billion, or 4%, increase in average home equity loans, reflecting higher utilization of existing lines
resulting from higher quality borrowers taking advantage of the current relatively lower interest rate environment, as well as a slowdown in runoff.
25

• $0.2 billion, or 2%, increase in average CRE loans, reflecting draws on existing performing projects and new originations to existing CRE borrowers. These increases were partially offset by our 2009 second quarter efforts to shrink this portfolio through payoffs and pay downs, as well as the impact of NCOs and the impact of the 2009 first quarter reclassification for CRE loans into C&I loans noted earlier.
The $0.9 billion, or 2%, increase/decrease in average total deposits reflected:
• $2.0 billion, or 6%, growth in total core deposits, primarily reflecting increased marketing efforts and initiatives for deposit accounts.
Partially offset by: • $1.1 billion, or 18%, decline in average other deposits, primarily reflecting a managed decline in public fund
and foreign time deposits.
26

Table 12 - Consolidated YTD Average Balance Sheets and Net Interest Margin Analysis
Fully taxable equivalent basis
(in millions of dollars) 2009 2008 AmountAssets
Interest bearing deposits in banks 362$ 274$ 88$ 32.1 % 0.41 % 3.43 %Trading account securities 182 1,214 (1,032) (85.0) 3.61 5.18 Federal funds sold and securities purchased
under resale agreements 9 668 (659) (98.7) 0.21 2.65 Loans held for sale 668 533 135 25.3 5.12 5.68 Investment securities:
Taxable 4,575 3,873 702 18.1 5.05 5.60 Tax-exempt 295 710 (415) (58.5) 6.68 6.76
Total investment securities 4,870 4,583 287 6.3 5.15 5.78 Loans and leases: (2)
Commercial:Commercial and industrial 13,532 13,487 45 0.3 4.80 5.92 Commercial real estate:
Construction 1,989 2,026 (37) (1.8) 2.77 5.34 Commercial 7,664 7,418 246 3.3 3.66 5.86
Commercial real estate 9,653 9,444 209 2.2 3.48 5.75 Total commercial 23,185 22,931 254 1.1 4.25 5.85 Consumer:
Automobile loans 3,350 3,472 (122) (3.5) 7.23 7.18 Automobile leases 470 1,003 (533) (53.1) 6.07 5.56
Automobile loans and leases 3,820 4,475 (655) (14.6) 7.09 6.82 Home equity 7,609 7,320 289 3.9 5.44 6.82 Residential mortgage 4,634 5,264 (630) (12.0) 5.41 5.82 Other loans 683 706 (23) (3.3) 8.58 10.21
Total consumer 16,746 17,765 (1,019) (5.7) 5.94 6.66 Total loans and leases 39,931 40,696 (765) (1.9) 4.96 6.20 Allowance for loan and lease losses (922) (642) (280) (43.6) Net loans and leases 39,009 40,054 (1,045) (2.6) Total earning assets 46,022 47,968 (1,946) (4.1) 5.00 % 6.13 %Cash and due from banks 2,012 990 1,022 N.M.Intangible assets 2,069 3,460 (1,391) (40.2) All other assets 3,637 3,436 201 5.8
Total Assets 52,818$ 55,212$ (2,394)$ (4.3) %
Liabilities and Shareholders' EquityDeposits:
Demand deposits - non-interest bearing 5,784$ 5,047$ 737$ 14.6 % --- % --- %Demand deposits - interest bearing 4,312 4,010 302 7.5 0.16 0.68 Money market deposits 5,975 6,510 (535) (8.2) 1.09 2.31 Savings and other domestic time deposits 5,036 5,228 (192) (3.7) 1.43 2.13 Core certificates of deposit 12,643 10,975 1,668 15.2 3.66 4.52
Total core deposits 33,750 31,770 1,980 6.2 2.17 2.94
Other domestic time deposits of $250,000 or more 977 1,760 (783) (44.5) 2.78 4.05 Brokered deposits and negotiable CDs 3,596 3,451 145 4.2 2.74 3.92 Deposits in foreign offices 542 998 (456) (45.7) 0.18 1.88
Total deposits 38,865 37,979 886 2.3 2.22 3.07 Short-term borrowings 988 2,813 (1,825) (64.9) 0.26 2.21 Federal Home Loan Bank advances 1,677 3,399 (1,722) (50.7) 1.06 3.47 Subordinated notes and other long-term debt 4,627 3,872 755 19.5 3.10 4.66 Total interest bearing liabilities 40,373 43,016 (2,643) (6.1) 2.22 3.19 All other liabilities 591 1,032 (441) (42.7) Shareholders' equity 6,070 6,117 (47) (0.8)
Total Liabilities and Shareholders' Equity 52,818$ 55,212$ (2,394)$ (4.3) %
Net interest rate spread 2.78 2.94 Impact of non-interest bearing funds on margin 0.25 0.32
Net interest margin 3.03 % 3.26 %
N.M., not a meaningful value.
(1)
(2)
Loan and lease and deposit average rates include impact of applicable derivatives and non-deferrable fees.For purposes of this analysis, non-accrual loans are reflected in the average balances of loans.
YTD Average BalancesSix Months Ending June 30, Change
Percent
YTD Average Rates (1)
Six Months Ending June 30,2009 2008
27
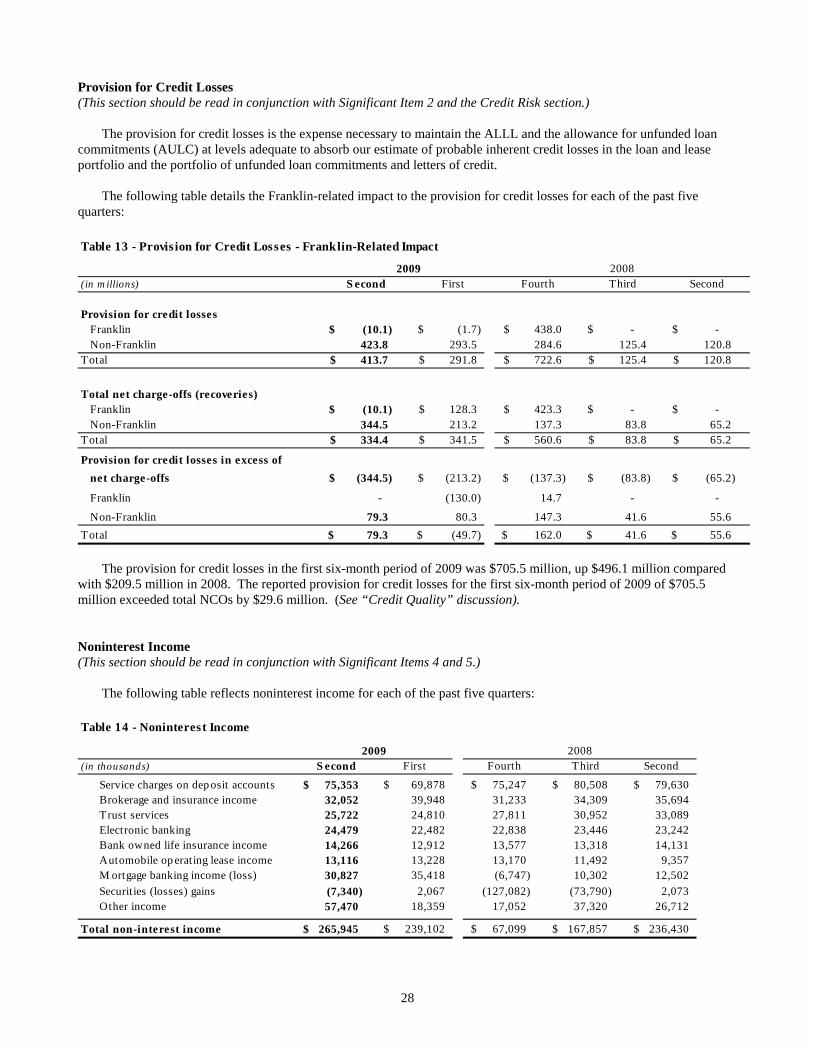
Provision for Credit Losses (This section should be read in conjunction with Significant Item 2 and the Credit Risk section.)
The provision for credit losses is the expense necessary to maintain the ALLL and the allowance for unfunded loan commitments (AULC) at levels adequate to absorb our estimate of probable inherent credit losses in the loan and lease portfolio and the portfolio of unfunded loan commitments and letters of credit.
The following table details the Franklin-related impact to the provision for credit losses for each of the past five
quarters: Table 13 - Provis ion for Credit Losses - Franklin-Related Impact
(in m illions)
Provision for credit lossesFranklin (10.1)$ (1.7)$ 438.0$ -$ -$ Non-Franklin 423.8 293.5 284.6 125.4 120.8
Total 413.7$ 291.8$ 722.6$ 125.4$ 120.8$
Total net charge-offs (recoveries)Franklin (10.1)$ 128.3$ 423.3$ -$ -$ Non-Franklin 344.5 213.2 137.3 83.8 65.2
Total 334.4$ 341.5$ 560.6$ 83.8$ 65.2$
Provision for credit losses in excess of net charge-offs (344.5)$ (213.2)$ (137.3)$ (83.8)$ (65.2)$
Franklin - (130.0) 14.7 - -
Non-Franklin 79.3 80.3 147.3 41.6 55.6 Total 79.3$ (49.7)$ 162.0$ 41.6$ 55.6$
S econd2009
First2008
Fourth Third Second
The provision for credit losses in the first six-month period of 2009 was $705.5 million, up $496.1 million compared
with $209.5 million in 2008. The reported provision for credit losses for the first six-month period of 2009 of $705.5 million exceeded total NCOs by $29.6 million. (See “Credit Quality” discussion). Noninterest Income (This section should be read in conjunction with Significant Items 4 and 5.)
The following table reflects noninterest income for each of the past five quarters: Table 14 - Noninteres t Income
(in thousands) First
Service charges on dep osit accounts 75,353$ 69,878$ 75,247$ 80,508$ 79,630$ Brokerage and insurance income 32,052 39,948 31,233 34,309 35,694 T rust services 25,722 24,810 27,811 30,952 33,089 Electronic banking 24,479 22,482 22,838 23,446 23,242 Bank owned life insurance income 14,266 12,912 13,577 13,318 14,131 Automobile op erating lease income 13,116 13,228 13,170 11,492 9,357 M ortgage banking income (loss) 30,827 35,418 (6,747) 10,302 12,502 Securit ies (losses) gains (7,340) 2,067 (127,082) (73,790) 2,073 Other income 57,470 18,359 17,052 37,320 26,712
Total non-interest income 265,945$ 239,102$ 67,099$ 167,857$ 236,430$
2009S econd Third Second
2008Fourth
28

The following table details mortgage banking income and the net impact of mortgage servicing rights (MSR) hedging activity for each of the past five quarters:
Table 15 - Mortgage Banking Income and Net Impact of MSR Hedging
(in thousands, except as noted) First
Mortgage Banking Income
Origination and secondary marketing 31,782$ 29,965$ 7,180$ 7,647$ 13,098$ Servicing fees 12,045 11,840 11,660 11,838 11,166 Amortization of capitalized servicing (1) (14,445) (12,285) (6,462) (6,234) (7,024) Other mortgage banking income 5,381 9,404 2,959 3,519 5,959
Sub-total 34,763 38,924 15,337 16,770 23,199
M SR valuation adjustment (1) 46,551 (10,389) (63,355) (10,251) 39,031 Net trading (losses) gains related to M SR hedging (50,487) 6,883 41,271 3,783 (49,728)
Total mortgage banking income (loss) 30,827$ 35,418$ (6,747)$ 10,302$ 12,502$
M ortgage originations (in millions) 1,587$ 1,546$ 724$ 680$ 1,127$ Average trading account securites used to hedge
M SRs (in millions) 20 223 857 941 1,190
Capitalized mortgage servicing rights (2) 219,282 167,838 167,438 230,398 240,024
Total mortgages serviced for others (in millions) (2) 16,246 16,315 15,754 15,741 15,770
M SR % of investor servicing portfolio 1.35% 1.03% 1.06% 1.46% 1.52%
Net Impact of MS R Hedging
M SR valuation adjustment (1) 46,551$ (10,389)$ (63,355)$ (10,251)$ 39,031$
Net trading (losses) gains related to M SR hedging (50,487) 6,883 41,271 3,783 (49,728)
Net interest income related to M SR hedging 199 2,441 9,473 8,368 9,364
Net impact of M SR hedging (3,737)$ (1,065)$ (12,611)$ 1,900$ (1,333)$
(1) The change in fair value for the period represents the M SR valuation adjustment, excluding amortization of cap italized servicing.(2) At period end.
2009 2008
Third SecondS econd Fourth
29

2009 Second Quarter versus 2008 Second Quarter
Noninterest income increased $29.5 million, or 12%, from the year-ago quarter.
Table 16 - Noninterest Income - 2009 Second Quarter vs. 2008 Second Quarter
(in thousands) 2009 2008 Amount Percent
Service charges on deposit accounts 75,353$ 79,630$ (4,277)$ (5.4) %Brokerage and insurance income 32,052 35,694 (3,642) (10.2)Trust services 25,722 33,089 (7,367) (22.3)Electronic banking 24,479 23,242 1,237 5.3Bank owned life insurance income 14,266 14,131 135 1.0Automobile operating lease income 13,116 9,357 3,759 40.2M ortgage banking income 30,827 12,502 18,325 N.M .Securities (losses) gains (7,340) 2,073 (9,413) N.M .Other income 57,470 26,712 30,758 N.M .
Total noninterest income 265,945$ 236,430$ 29,515$ 12.5 %
N.M ., not a meaningful value.
ChangeS econd Quarter
The $29.5 million increase in total noninterest income reflected:
• $30.8 million increase in other income, primarily reflecting a $31.4 million gain on the sale of Visa ® stock.
• $18.3 million increase in mortgage banking income, primarily reflecting an $18.7 million increase in origination and secondary marketing income as current quarter loan sales increased 59% from the year-ago quarter and loan originations that were 41% higher than in the year-ago quarter (see Table 15).
• $3.8 million, or 40%, increase in automobile operating lease income, reflecting a 34% increase in average operating lease balances, as lease originations since the 2007 fourth quarter were recorded as operating leases. Separately, all automobile lease origination activities were discontinued in the 2008 fourth quarter.
Partially offset by:
• $9.4 million decline in securities gains (losses) as the current quarter reflected a $7.3 million loss compared with a $2.1 million gain in the year-ago quarter.
• $7.4 million, or 22%, decline in trust services income, reflecting the impact of reduced market values on asset management revenues and lower yields on proprietary money market funds.
• $4.3 million, or 5%, decline in service charges on deposit accounts primarily reflecting lower consumer NSF and overdraft fees, partially offset by higher commercial service charges.
• $3.6 million, or 10%, decrease in brokerage and insurance income reflecting lower mutual fund and annuity sales, as well as reduced commercial property and casualty agency commissions.
2009 Second Quarter versus 2009 First Quarter
Noninterest income increased $26.8 million, or 11%, from the 2009 first quarter.
30

Table 17 - Noninterest Income - 2009 Second Quarter vs. 2009 First Quarter
Second FirstQuarter Quarter
(in thousands) 2009 2009 Amount Percent
Service charges on deposit accounts 75,353$ 69,878$ 5,475$ 7.8 %Brokerage and insurance income 32,052 39,948 (7,896) (19.8)Trust services 25,722 24,810 912 3.7Electronic banking 24,479 22,482 1,997 8.9Bank owned life insurance income 14,266 12,912 1,354 10.5Automobile operating lease income 13,116 13,228 (112) (0.8)Mortgage banking income 30,827 35,418 (4,591) (13.0)Securities (losses) gains (7,340) 2,067 (9,407) N.M.Other income 57,470 18,359 39,111 N.M.
Total noninterest income 265,945$ 239,102$ 26,843$ 11.2 %
N.M., not a meaningful value.
Change
The $26.8 million increase in total noninterest income reflected:
• $39.1 million increase in other income, primarily reflecting a $31.4 million gain on the sale of our Visa ® stock and, to a lesser degree, a $6.2 million improvement in loan sale gains as the prior quarter included a $5.9 million loss associated with the automobile loan securitization at the end of the 2009 first quarter. Also contributing to the increase in other income from the prior quarter were higher equity investment gains and derivatives revenue.
• $5.5 million, or 8%, increase in service charges on deposit accounts, reflecting seasonally higher personal service charges, primarily NSF charges.
• $2.0 million, or 9%, seasonal increase in electronic banking income.
Partially offset by:
• $9.4 million decline in securities gains (losses) as the current quarter reflected a $7.3 million loss compared with a $2.1 million gain in the prior quarter.
• $7.9 million, or 20%, decline in brokerage and insurance income, reflecting lower annuity sales and first quarter seasonal insurance income. The 2009 first quarter also represented a record level of investment sales.
• $4.6 million, or 13%, decline in mortgage banking income as 2009 first quarter results included a $4.3 million portfolio loan sale gain.
2009 First Six Months versus 2008 First Six Months
The following table reflects noninterest income for the first six-month periods of 2009 and 2008:
31

Table 18 - Noninterest Income - 2009 First Six Months vs . 2008 First Six Months
(in thousands) 2009 2008 Amount Percent
Service charges on deposit accounts 145,231$ 152,298$ (7,067)$ (4.6) %Brokerage and insurance income 72,000 72,254 (254) (0.4)Trust services 50,532 67,217 (16,685) (24.8)Electronic banking 46,961 43,983 2,978 6.8Bank owned life insurance income 27,178 27,881 (703) (2.5)Automobile operating lease income 26,344 15,189 11,155 73.4M ortgage banking income 66,245 5,439 60,806 N.M .Securities (losses) gains (5,273) 3,502 (8,775) N.M .Other income 75,829 84,419 (8,590) (10.2)
Total noninterest income 505,047$ 472,182$ 32,865$ 7.0 %
N.M ., not a meaningful value.
ChangeS ix Months Ended June 30,
The following table details mortgage banking income and the net impact of MSR hedging activity for the first six-month periods of 2009 and 2008:
Table 19 - Mortgage Banking Income and Net Impact of MSR Hedging
(in thousands, except as noted) 2009 2008 Amount Percent
Mortgage Banking Income
Origination and secondary marketing 61,747$ 22,430$ 39,317$ N.M . %Servicing fees 23,885 22,060 1,825 8.3 Amortization of capitalized servicing (1) (26,730) (13,938) (12,792) (91.8) Other mortgage banking income 14,785 10,290 4,495 43.7
Sub-total 73,687 40,842 32,845 80.4
M SR valuation adjustment (1) 36,162 20,938 15,224 72.7 Net trading losses related to M SR hedging (43,604) (56,341) 12,737 22.6
Total mortgage banking income 66,245$ 5,439$ 60,806$ N.M . %
M ortgage originations (in millions) 3,133$ 2,369$ 764$ 32.2 %Average trading account securites used to hedge
M SRs (in millions) 121 1,164 (1,043) (89.6)
Capitalized mortgage servicing rights (2) 219,282 240,024 (20,742) (8.6)
Total mortgages serviced for others (2) (in millions) 16,246 15,770 476 3.0
M SR % of investor servicing portfolio 1.35% 1.52% (0.17) % (11.2) %
Net Impact of MS R Hedging
M SR valuation adjustment (1) 36,162$ 20,938$ 15,224$ 72.7 %
Net trading losses related to M SR hedging (43,604) (56,341) 12,737 (22.6)
Net interest income related to M SR hedging 2,640 15,298 (12,658) (82.7)
Net impact of M SR hedging (4,802)$ (20,105)$ 15,303$ (76.1) %
N.M ., not a meaningful value.(1) The change in fair value for the period represents the M SR valuation adjustment, excluding amortization of capitalized servicing.(2) At period end.
S ix Months Ended June 30, YTD 2009 vs 2008
32

The $32.9 million, or 7%, increase in total noninterest income reflected:
• $60.8 million increase in mortgage banking income reflecting: (a) $39.3 million increase in origination and secondary marketing income as loan sales and loan originations increased substantially in the first six-month period of 2009 compared with the first six-month period of 2008, and (b) $28.0 million improvement in MSR hedging (see Table 19).
• $11.2 million, or 73%, increase in automobile operating lease income, reflecting a 73% increase in average operating lease balances, as lease originations since the 2007 fourth quarter were recorded as operating leases. Separately, all automobile lease origination activities were discontinued in the 2008 fourth quarter.
Partially offset by:
• $16.7 million, or 25%, decrease in trust services income, reflecting the impact of reduced market values on asset management revenues, as well as lower yields on proprietary money market funds.
• $8.8 million decline in securities gains (losses).
• $8.6 million decline in other income, primarily reflecting a $25.1 million gain in the first six-month period of 2008 reflecting the sale of a portion of our Visa® stock, and a $14.0 million decline in customer derivatives income from the comparable year-ago period, partially offset by a $31.4 million gain in the first six-month period of 2009 reflecting the sale of our remaining Visa® stock (see “Significant Items” discussion).
• $7.1 million, or 5%, decline in service charges on deposit accounts, primarily reflecting lower consumer NSF and overdraft fees, partially offset by higher commercial service charges.
Noninterest Expense (This section should be read in conjunction with Significant Items 1, 4, and 5.)
The following table reflects noninterest expense for each of the past five quarters: Table 2 0 - N oninte r e s t Expe ns e
( in th o u sa n d s) F irs tP ers onnel cos t s 171 ,735$ 175 ,932$ 196 ,785$ 184 ,827$ 199 ,991$ O u t s ide dat a p ro ces s in g and o t h er s erv ices 39 ,266 32 ,432 31 ,230 32 ,386 30 ,186 N et occup ancy 24 ,430 29 ,188 22 ,999 25 ,215 26 ,971 Equ ip m en t 21 ,286 20 ,410 22 ,329 22 ,102 25 ,740 A m ort iz at ion o f in t angib les 17 ,117 17 ,135 19 ,187 19 ,463 19 ,327 P ro fes s io n al s erv ices 18 ,789 18 ,253 17 ,420 13 ,405 13 ,752 M arket ing 7 ,491 8 ,225 9 ,357 7 ,049 7 ,339 A u t om ob ile op erat ing leas e exp ens e 11 ,400 10 ,931 10 ,483 9 ,093 7 ,200 T elecom m unicat ions 6 ,088 5 ,890 5 ,892 6 ,007 6 ,864 P rin t ing and s up p lies 4 ,151 3 ,572 4 ,175 4 ,316 4 ,757 G oodw ill im p airm en t 4 ,231 2 ,602 ,713 --- --- --- O t h er exp en s e 13 ,998 45 ,088 50 ,237 15 ,133 35 ,676
T ota l n on i n te re s t e xpe n s e 339 ,982$ 2 ,969 ,769$ 390 ,094$ 338 ,996$ 377 ,803$
F u ll-t im e equ ivalen t em p loy ees , at p eriod end 10 ,252 10 ,540 10 ,951 10 ,901 11 ,251
S e con d F ourt h2009 2008
T h ird Second
33

2009 Second Quarter versus 2008 Second Quarter
Noninterest expense decreased $37.8 million, or 10%, from the year-ago quarter.
Table 21 - Noninterest Expense - 2009 Second Quarter vs. 2008 Second Quarter
Second SecondQuarter Quarter
(in thousands) 2009 2008 Amount PercentPersonnel costs 171,735$ 199,991$ (28,256)$ (14.1) %Outside data processing and other services 39,266 30,186 9,080 30.1Net occupancy 24,430 26,971 (2,541) (9.4)Equipment 21,286 25,740 (4,454) (17.3)Amortization of intangibles 17,117 19,327 (2,210) (11.4)Professional services 18,789 13,752 5,037 36.6Marketing 7,491 7,339 152 2.1Automobile operating lease expense 11,400 7,200 4,200 58.3Telecommunications 6,088 6,864 (776) (11.3)Printing and supplies 4,151 4,757 (606) (12.7)Goodwill impairment 4,231 --- 4,231 --- Other expense 13,998 35,676 (21,678) (60.8)
Total noninterest expense 339,982$ 377,803$ (37,821)$ (10.0) %
Full-time equivalent employees, at period-end 10,252 11,251 (999) (8.9) %
Change
The $37.8 million decline reflected:
• $28.3 million, or 14%, decline in personnel costs, primarily reflecting a $16.4 million decline in salaries, an $8.0 million decline in severance costs, and lower benefits expenses. Full-time equivalent staff declined 9% from the year-ago period.
• $21.7 million, or 61%, decrease in other expense reflecting the benefit in the 2009 second quarter of a $67.4 million gain on the redemption of a portion of our junior subordinated debt, a $3.5 million net comparative benefit related to gains resulting from debt extinguishment, and a $6.8 million decline in franchise tax-related expense. Partially offsetting these favorable items was a $43.5 million increase in deposit insurance. This increase was comprised of two components: (a) $23.6 million FDIC special assessment during the current quarter, and (b) $19.9 million increase primarily related to our 2008 FDIC assessments being reduced by a nonrecurring deposit insurance assessment credit provided by the FDIC that was depleted during the 2008 fourth quarter. This deposit insurance credit offset substantially all of our assessment in the 2008 second quarter. Also contributing to the increase in other expense was a $14.6 million increase in OREO expense.
• $4.5 million, or 17%, decline in equipment costs, reflecting lower depreciation costs from the year-ago period.
• $2.5 million, or 9%, decline in net occupancy expenses, reflecting lower rental costs.
• $2.2 million, or 11%, decline in amortization of intangibles expense.
Partially offset by:
• $9.1 million, or 30%, increase in outside data processing and other services, primarily reflecting portfolio servicing fees now paid to Franklin as a result of the 2009 first quarter restructuring of this relationship, as well as higher outside appraisal costs.
• $5.0 million, or 37%, increase in professional services, reflecting higher legal and collection-related expenses.
• $4.2 million goodwill impairment charge related to the sale of a small payments-related business completed in July 2009.
• $4.2 million, or 58%, increase in automobile operating lease expense, primarily reflecting the 34% increase in average operating leases discussed above.
34

2009 Second Quarter versus 2009 First Quarter
Noninterest expense decreased $2,629.8 million, or 89%, from the 2009 first quarter.
Table 22 - Noninterest Expense - 2009 Second Quarter vs. 2009 First Quarter
Second FirstQuarter Quarter
(in thousands) 2009 2009 Amount PercentPersonnel costs 171,735$ 175,932$ (4,197)$ (2.4) %Outside data processing and other services 39,266 32,432 6,834 21.1Net occupancy 24,430 29,188 (4,758) (16.3)Equipment 21,286 20,410 876 4.3Amortization of intangibles 17,117 17,135 (18) (0.1)Professional services 18,789 18,253 536 2.9Marketing 7,491 8,225 (734) (8.9)Automobile operating lease expense 11,400 10,931 469 4.3Telecommunications 6,088 5,890 198 3.4Printing and supplies 4,151 3,572 579 16.2Goodwill impairment 4,231 2,602,713 (2,598,482) (99.8)Other expense 13,998 45,088 (31,090) (69.0)
Total noninterest expense 339,982$ 2,969,769$ (2,629,787)$ (88.6) %
Full-time equivalent employees, at period-end 10,252 10,540 (288) (2.7) %
Change
The $2,629.8 million decrease in noninterest expense reflected:
• $2,598.5 million decline in goodwill impairment. The prior quarter included a goodwill noncash impairment charge of $2,602.7 million. The current quarter’s goodwill noncash impairment charge of $4.2 million was related to the sale of a small payments-related business completed in July 2009. (See “Goodwill” discussion located within the Critical Account Policies and Use of Significant Estimates” for additional information).
• $31.1 million, or 69%, decline in other expense, reflecting the benefit of a $67.4 million gain on the redemption of a portion of our junior subordinated debt, a $5.6 million gain resulting from other debt extinguishment, and a $6.9 million decline in franchise tax-related expense. Partially offsetting these favorable items were this quarter’s $23.6 million FDIC special assessment and a $16.6 million increase in OREO expense.
• $4.8 million, or 16%, decrease in net occupancy expense, reflecting lower seasonal expenses, as well as lower rental costs.
• $4.2 million, or 2%, decline in personnel costs, reflecting a decline in severance and other benefits and incentive-based expense, partially offset by higher commissions. Full-time equivalent staff declined 3% from the prior period.
Partially offset by:
• $6.8 million, or 21%, increase in outside data processing and other services, primarily reflecting portfolio servicing fees paid to Franklin for servicing the related residential mortgage and home equity portfolios and outside appraisal costs, partially offset by lower software maintenance expense.
2009 First Six Months versus 2008 First Six Months
Noninterest expense for the first six-month period of 2009 increased $2,561.5 million from the comparable year-ago
period.
35

Table 23 - Noninterest Expense - 2009 First Six Months vs. 2008 First Six Months
(in thousands) 2009 2008 Amount PercentPersonnel costs 347,667$ 401,934$ (54,267)$ (13.5) %Outside data processing and other services 71,698 64,547 7,151 11.1Net occupancy 53,618 60,214 (6,596) (11.0)Equipment 41,696 49,534 (7,838) (15.8)Amortization of intangibles 34,252 38,244 (3,992) (10.4)Professional services 37,042 22,842 14,200 62.2Marketing 15,716 16,258 (542) (3.3)Automobile operating lease expense 22,331 11,706 10,625 90.8Telecommunications 11,978 13,109 (1,131) (8.6)Printing and supplies 7,723 10,379 (2,656) (25.6)Goodwill impairment 2,606,944 --- 2,606,944 --- Other expense 59,086 59,517 (431) (0.7)
Total noninterest expense 3,309,751$ 748,284$ 2,561,467$ N.M. %
Full-time equivalent employees, at period-end 10,252 11,251 (999) (8.9)
N.M., not a meaningful value
Six Months Ended June 30, Change
The $2,561.5 million increase in total noninterest expense reflected:
• $2,606.9 million of goodwill impairment recorded in 2009. The majority of the goodwill impairment, $2,602.7 million, was recorded during the 2009 first quarter. The remaining $4.2 million of goodwill impairment was recorded in the 2009 second quarter, and was related to the sale of a small payments-related business in July 2009. (See “Goodwill” discussion located within the Critical Account Policies and Use of Significant Estimates” for additional information).
• $14.2 million, or 62%, increase in professional services, reflecting higher legal and collection-related expenses.
• $10.6 million, or 91%, increase in automobile operating lease expense, primarily reflecting the 73% increase in average operating lease assets discussed above.
• $7.2 million, or 11%, increase in outside data processing and other services, primarily reflecting portfolio servicing fees now paid to Franklin resulting from the restructuring of the relationship at the end of the 2009 first quarter, as well as higher outside appraisal costs.
Partially offset by:
• $54.3 million, or 14%, decline in personnel costs reflecting a 9% reduction in full-time equivalent staff from the comparable year-ago period.
• $7.8 million, or 16%, decline in equipment costs, reflecting lower depreciation costs, as well as lower repair and maintenance costs.
• $6.6 million, or 11%, decline in net occupancy, reflecting lower rental costs and lower seasonal expenses.
• $0.4 million, or 1%, decrease in other expense, reflecting the benefit in the 2009 second quarter of a $67.4 million gain on the redemption of a portion of our junior subordinated debt, and a $5.3 million decline in franchise tax-related expense. Partially offsetting these favorable items was a $56.4 million increase in deposit insurance. This increase was comprised of two components: (a) $23.6 million FDIC special assessment during the current quarter, and (b) $32.8 million increase primarily related to our 2008 FDIC assessments being significantly reduced by a nonrecurring deposit insurance assessment credit provided by the FDIC that was depleted during the 2008 fourth quarter. This deposit insurance credit offset substantially all of our assessment in the first six-month period of 2008. Also contributing to the increase in other expense was a $15.2 million increase in OREO expense.
36

Provision for Income Taxes (This section should be read in conjunction with Significant Items 2 and 4.)
The provision for income taxes in the 2009 second quarter was a benefit of $12.7 million, resulting in an effective tax rate benefit of 9.2%. This compared with a tax benefit of $251.8 million in the 2009 first quarter and a tax expense of $26.3 million in the 2008 second quarter. The effective tax rates in the prior quarter and the year-ago quarter were a benefit of 9.4% and an expense of 20.6%, respectively. During the 2009 first quarter, the effective tax rate included a $159.9 million nonrecurring tax benefit from the Franklin restructuring and the nondeductibility of $2,595.0 million of the total $2,602.7 million of goodwill impairment. The effective tax rate for the first six-month period of 2009 was a benefit of 9.4% compared with an expense of 18.7% for the first six-month period of 2008. The effective tax rate for the 2009 second quarter and for the first six-month period of 2009 were both impacted by the goodwill impairment and the Franklin restructuring benefit.
In the ordinary course of business, we operate in various taxing jurisdictions and are subject to income and nonincome taxes. Also, we are subject to ongoing tax examinations in various jurisdictions. During the 2009 second quarter, the State of Ohio completed the audit of our 2001, 2002, and 2003 corporate franchise tax returns. During 2008, the IRS completed the audit of our consolidated federal income tax returns for tax years 2004 and 2005. In addition, we are subject to ongoing tax examinations in various other state and local jurisdictions. Both the IRS and various state tax officials have proposed adjustments to our previously filed tax returns. We believe that the tax positions taken by us related to such proposed adjustments were correct and supported by applicable statutes, regulations, and judicial authority, and intend to vigorously defend them. It is possible that the ultimate resolution of the proposed adjustments, if unfavorable, may be material to the results of operations in the period it occurs. However, although no assurances can be given, we believe that the resolution of these examinations will not, individually or in the aggregate, have a material adverse impact on our consolidated financial position.
We account for uncertainties in income taxes in accordance with FASB Interpretation No. 48, Accounting for Uncertainty in Income Taxes (FIN 48). At June 30, 2009 we had a gross unrecognized tax benefit of $10.4 million in income tax liability related to tax positions taken in prior periods. This balance includes $6.8 million of unrecognized tax benefits that would impact the effective tax rate, if recognized. Prior to June 30, 2009, we had recorded no significant unrecognized tax benefits. Due to the complexity of some of these uncertainties, the ultimate resolution may result in a payment that is materially different from our current estimate of the tax liabilities. However, any ultimate settlement is not expected to be material to the financial statements as a whole. Our policy is to recognize interest and penalties, if any, related to unrecognized tax benefits in the provision for income taxes. Accrued interest and penalties are included within the related tax liability line in the consolidated balance sheet. It is possible that the amount of the liability for unrecognized tax benefits under examination could change during the next 12 months. An estimate of the range of the possible change cannot be made at this time.
37

RISK MANAGEMENT AND CAPITAL
Risk identification and monitoring are key elements in overall risk management. We believe our primary risk exposures are credit, market, liquidity, and operational risk. More information on risk can be found under the heading “Risk Factors” included in Item 1A of our 2008 Form 10-K, and subsequent filings with the SEC. Additionally, the MD&A, included as an exhibit to our 2008 Form 10-K, should be read in conjunction with this MD&A as this report provides only material updates to the 2008 Form 10-K. Our definition, philosophy, and approach to risk management are unchanged from the discussion presented in the 2008 Form 10-K.
Credit Risk
Credit risk is the risk of loss due to our counterparties not being able to meet their financial obligations under agreed upon terms. The majority of our credit risk is associated with lending activities, as the acceptance and management of credit risk is central to profitable lending. We also have credit risk associated with our investment and derivatives activities. Credit risk is incidental to trading activities and represents a significant risk that is associated with our investment securities portfolio (see “Investment Securities Portfolio” discussion). Credit risk is mitigated through a combination of credit policies and processes, market risk management activities, and portfolio diversification. Credit Exposure Mix
As shown in Table 24, at June 30, 2009, commercial loans totaled $22.3 billion, and represented 58% of our total credit exposure. This portfolio was diversified between C&I and CRE loans (see “Commercial Credit” discussion).
Total consumer loans were $16.2 billion at June 30, 2009, and represented 42% of our total credit exposure. The consumer portfolio included home equity loans and lines of credit, residential mortgages, and automobile loans and leases (see “Consumer Credit” discussion).
38

Table 24 - Loans and Leases Composition
(in millions)
By TypeCommercial: (1)
Commercial and industrial (2) 13,320$ 34.6 % 13,768$ 34.8 % 13,541$ 33.0 % 13,638$ 33.1 % 13,746$ 33.5 %Commercial real estate:
Construction 1,857 4.8 2,074 5.2 2,080 5.1 2,111 5.1 2,136 5.2 Commercial (2) 7,089 18.4 7,187 18.2 8,018 19.5 7,796 18.9 7,565 18.4
Commercial real estate 8,946 23.2 9,261 23.4 10,098 24.6 9,907 24.0 9,701 23.6
Total commercial 22,266 57.8 23,029 58.2 23,639 57.6 23,545 57.1 23,447 57.1 Consumer:
Automobile loans (3) 2,855 7.4 2,894 7.3 3,901 9.5 3,918 9.5 3,759 9.2 Automobile leases 383 1.0 468 1.2 563 1.4 698 1.7 835 2.0 Home equity 7,631 19.8 7,663 19.4 7,556 18.4 7,497 18.2 7,410 18.1 Residential mortgage 4,646 12.1 4,837 12.2 4,761 11.6 4,854 11.8 4,901 11.9 Other loans 714 1.9 657 1.7 672 1.5 680 1.7 695 1.7
Total consumer 16,229 42.2 16,519 41.8 17,453 42.4 17,647 42.9 17,600 42.9
Total loans and leases 38,495$ 100.0 % 39,548$ 100.0 % 41,092$ 100.0 41,192$ 100.0 % 41,047$ 100.0 %(1) There were no commercial loans outstanding that would be considered a concentration of lending to a particular group of industries.(2) The 2009 first quarter reflected a net reclassification of $782.2 million from commercial real estate to commercial and industrial.(3) The decrease from December 31, 2008, to March 31, 2009, reflected a $1.0 billion automobile loan sale during the 2009 first quarter.
2008 2008
June 30, March 31, June 30,December 31, September 30,
39

Franklin relationship (This section should be read in conjunction with Significant Item 2 and the “Franklin Loans Restructuring Transaction” discussion located within the “Critical Accounting Policies and Use of Significant Estimates” section.)
As a result of the restructuring, on a consolidated basis, the $650.2 million nonaccrual commercial loan to Franklin at
December 31, 2008, is no longer reported. Instead, we now report the loans secured by first- and second- mortgages on residential properties and OREO properties both of which had previously been assets of Franklin or its subsidiaries and were pledged to secure our loan to Franklin. At the time of the restructuring, the loans had a fair value of $493.6 million and the OREO properties had a fair value of $79.6 million. As a result, NALs declined by a net amount of $284.1 million as there were $650.2 million commercial NALs outstanding related to Franklin, and $366.1 million mortgage-related NALs outstanding, representing first- and second- lien mortgages that were nonaccruing at March 31, 2009. Also, our specific allowance for loan and lease losses for the Franklin portfolio of $130.0 million was eliminated; however, no initial increase to the ALLL relating to the acquired mortgages was recorded as these assets were recorded at fair value.
The following table summarizes the Franklin-related balances for accruing loans, nonaccruing loans, and OREO:
Table 25 - Franklin-related loan and OREO balances(in millions)
June 30, March 31,Accruing loans 127.4$ 127.4$ Nonaccruing loans 344.6 366.1 Total loans 472.0 493.5 OREO 43.6 79.6 Total Franklin loans and OREO 515.6$ 573.1$
2009
An objective of the Franklin restructuring was to improve ultimate collections and recoveries. As shown in the above table, Franklin-related loans declined 4%, reflecting a 13% increase in cash collections in the 2009 second quarter compared with the 2009 first quarter. Also, Franklin-related OREO properties declined 45% reflecting accelerated sales of Franklin-related OREO properties during the 2009 second quarter. This action is consistent with our assessment of the value of the properties, as well as the current and anticipated future market conditions. Commercial Credit
The primary factors considered in commercial credit approvals are the financial strength of the borrower, assessment of the borrower’s management capabilities, industry sector trends, type of exposure, transaction structure, and the general economic outlook.
In commercial lending, ongoing credit management is dependent upon the type and nature of the loan. We monitor all significant exposures on a periodic basis. Internal risk ratings are assigned at the time of each loan approval, and are assessed and updated with each periodic monitoring event. The frequency of the monitoring event is dependent upon the size and complexity of the individual credit, but in no case less frequently than every 12 months. There is also extensive macro portfolio management analysis conducted to identify performance trends or specific portions of the overall portfolio that may need additional monitoring activity. The single family home builder portfolio and retail projects are examples of segments of the portfolio that have received more frequent evaluation at the loan level as a result of the economic environment and performance trends (see “Single Family Home Builder” discussion). We continually review and adjust our risk rating criteria and rating determination process based on actual experience. This continuous review and analysis process results in a determination of an appropriate ALLL amount for our commercial loan portfolio.
Our commercial loan portfolio is primarily comprised of the following: Commercial and Industrial (C&I) loans – C&I loans represent loans to commercial customers for use in normal
business operations to finance working capital needs, equipment purchases, or other projects. The vast majority of these loans are to commercial customers doing business within our geographic regions. C&I loans are generally underwritten
40

individually and usually secured with the assets of the company and/or the personal guarantee of the business owners. The financing of owner-occupied facilities is considered a C&I loan even though there is improved real estate as collateral. This treatment is a function of the underwriting process, which focuses on cash flow from operations to repay the debt. The operation or sale of the real estate is not considered a repayment source for the loan.
Commercial real estate (CRE) loans – CRE loans consist of loans for income producing real estate properties. We mitigate our risk on these loans by requiring collateral values that exceed the loan amount and underwriting the loan with cash flow substantially in excess of the debt service requirement. These loans are made to finance properties such as apartment buildings, office and industrial buildings, and retail shopping centers; and are repaid through cash flows related to the operation, sale, or refinance of the property.
Construction CRE loans – Construction CRE loans are loans to individuals, companies, or developers used for the construction of a commercial property for which repayment will be generated by the sale or permanent financing of the property. A significant portion of our construction CRE portfolio consists of residential product types (land, single family, and condominium loans) within our regions, and to a lesser degree, retail and multi-family projects. Generally, these loans are for construction projects that have been presold, preleased, or otherwise have secured permanent financing, as well as loans to real estate companies that have significant equity invested in each project. These loans are generally underwritten and managed by a specialized real estate group that actively monitors the construction phase and manages the loan disbursements according to the predetermined construction schedule.
COMMERCIAL LOAN PORTFOLIO REVIEWS AND ACTIONS
In the 2009 first quarter, we restructured our commercial loan relationship with Franklin by taking control of the underlying mortgage loan collateral, and transferring the exposure to the consumer loan portfolio as first- and second- lien loans to individuals secured by residential real estate properties. (See “Franklin Loans Restructuring Transaction” located within the “Critical Accounting Policies and Use of Significant Estimates” section). We also proactively completed a concentrated review of our single family home builder and retail CRE loan portfolios, our CRE portfolio’s two highest risk segments. We now review the “criticized” portion of these portfolios on a monthly basis. The increased review activity resulted in more pro-active decisions on nonaccrual status, reserve levels, and charge-offs. This heightened level of portfolio monitoring is ongoing.
During the 2009 second quarter, we updated our evaluation of every “noncriticized” commercial relationship with an aggregate exposure of over $500,000. This review included C&I, CRE, and business banking loans and encompassed 5,460 loans representing $13.2 billion, or about 59%, of total commercial loans, and $17.1 billion in related commitments.
This was a detailed, labor-intensive process designed to enhance our understanding of each borrower’s financial position, and to ensure that this understanding was accurately reflected in our internal risk rating system. Our objective was to identify current and potential credit risks across the portfolio consistent with our expectation that the economy in our markets will not improve before the end of this year.
Our business segment teams conducted the reviews within their respective portfolios. Each team had a hierarchy of assessment and oversight review activity defined for each borrowing relationship. In many cases, we directly contacted the borrower and obtained the most recent financial information available, including interim financial results. In addition, we discussed the impact of the economic environment on the future direction of their company, industry prospects, collateral values, and other borrower-specific information. We then made an appropriate assessment of the current risk for each borrower.
The work of each business segment team was under the direction and oversight of a central credit review committee, which also assessed the overall results. This level of review is an ongoing activity with each team accountable for identifying specific follow up portfolio management actions. We further enhanced system capabilities to provide better credit related management information that will facilitate our ongoing portfolio management actions. Taken together, these actions will ensure that our view of the portfolio remains current.
In addition, with respect to our commercial loan exposure to automobile dealers, we have had an ongoing review process in place for some time now. Our automobile dealer commercial loan portfolio is predominantly comprised of larger, “well-capitalized”, multi-franchised dealer groups underwritten to conservative credit standards. These dealer groups have largely remained profitable on a consolidated basis due to franchise diversity and a shift of sales emphasis to higher-margin, used vehicles, as well as a focus on the service department. Additionally, our portfolio is closely monitored through receipt and review of monthly dealer financial statements and ongoing floor plan inventory audits, which allow for rapid response to weakening trends. As a result, we have not experienced any significant deterioration in the credit quality
41

of our automobile dealer commercial loan portfolio and remain comfortable with our expectation of no material losses, even given the substantial stress associated with our dealership closings announced by Chrysler and GM. (See “Automobile Industry” section located within the “Commercial and Industrial Portfolio” section for additional information.)
In summary, we have established an ongoing portfolio management process involving each business segment, providing an improved view of emerging risk issues at a borrower level, enhanced ongoing monitoring capabilities, and strengthened actions and timeliness to mitigate emerging loan risks. Given our stated view of continued economic weakness through 2009, we anticipate some level of additional negative credit migration in the second half of this year. While we can give no assurances given market uncertainties, we believe that as a result of our increased portfolio management actions, a portfolio management process involving each business segment, an improved view of emerging risk issues at the borrower level, enhanced ongoing monitoring capabilities, and strengthened borrower-level loan structures, any future migration will be manageable.
Our commercial loan portfolio, including CRE loans, is diversified by customer size, as well as throughout our
geographic footprint. However, the following segments are noteworthy: COMMERCIAL AND INDUSTRIAL (C&I) PORTFOLIO
The C&I portfolio is comprised of loans to businesses where the source of repayment is associated with the ongoing operations of the business. Generally, the loans are secured with the financing of the borrower’s assets, such as equipment, accounts receivable, or inventory. In many cases, the loans are secured by real estate, although the sale of the real estate is not a primary source of repayment for the loan. There were no outstanding commercial loans that would be considered a concentration of lending to a particular industry or within a geographic standpoint. Currently, higher-risk segments of the C&I portfolio include loans to borrowers supporting the home building industry, contractors, and automotive suppliers. However, the combined total of these segments represent less than 10% of the total C&I portfolio. We manage the risks inherent in this portfolio through origination policies, concentration limits, ongoing loan level reviews, recourse requirements, and continuous portfolio risk management activities. Our origination policies for this portfolio include loan product-type specific policies such as loan-to-value (LTV), and debt service coverage ratios, as applicable.
As shown in the following table, C&I loans totaled $13.3 billion at June 30, 2009.
Table 26 - Commercial and Industrial Loans and Leases by Industry Classification
(in millions of dollars) Amount Amount
Industry Classification:Services 5,207$ 26.6 % 3,928$ 29.5 %Manufacturing 3,789 19.4 2,355 17.7 Finance, insurance, and real estate 2,770 14.2 2,189 16.4 Retail trade - Auto Dealers 1,373 7.0 893 6.7 Retail trade - Other than Auto Dealers 1,752 9.0 1,145 8.6 Contractors and construction 1,467 7.5 835 6.3 Transportation, communications, and utilities 1,172 6.0 716 5.4 Wholesale trade 990 5.1 500 3.8 Agriculture and forestry 592 3.0 412 3.1 Energy 277 1.4 199 1.5 Public administration 131 0.7 121 0.9 Other 32 0.1 27 0.1
Total 19,552$ 100.0 % 13,320$ 100.0 %
At June 30, 2009
Percent
Commitments
Percent
Loans Outstanding
42

Credit quality information regarding NCOs and NALs for our C&I loan portfolio is presented in the following table. Table 27 - Comme rcial and Indus trial Cre dit Quality Data by Indus try Clas s ification
(in m illions) Amount Percent Amount
Industry Classification:Services 19.8$ 1.99 % 20.1 % 113.5$ 2.8 %Finance, insurance, and real estate 15.1 2.71 15.4 74.8 3.4 M anufacturing 39.6 6.67 40.3 109.6 4.6 Retail trade - Auto Dealers 0.2 0.08 0.2 3.1 0.3 Retail trade - Other than Auto Dealers 12.4 5.45 12.6 68.8 7.6 Contractors and construction 2.6 2.04 2.6 26.2 5.1 T ransp ortation, communications, and utilit ies 2.0 1.09 2.0 11.9 1.6 Wholesale trade 6.3 3.00 6.4 30.9 3.7 Agriculture and forestry --- --- --- 3.9 1.9 Energy --- --- --- 12.7 3.0 Public administration 0.3 0.80 0.3 1.6 1.0
Total 98.3$ 2.91 % 100.00 % 456.7$ 3.4 %
At June 30, 2009Quarter Ended June 30, 2009
Annualized %
Net Charge-offs Nonaccrual Loans% of Total
Loans
Within the C&I portfolio, the automotive industry segment continued to be stressed and is discussed below. Automotive Industry
The following table provides a summary of loans and total exposure including both loans and unused commitments and standby letters of credit to companies related to the automotive industry. Table 28 - Automotive Industry Exposure (1)
(in millions)Loans
Outstanding Total ExposureLoans
Outstanding Total ExposureSuppliers:
Domestic 196$ 327$ 182$ 331$ Foreign 33 46 33 46
Total Suppliers 228 0.59 % 373 215 0.52 % 377
Dealer:Floorplan - domestic 444 787 553 747 Floorplan - foreign 339 561 408 544 Other 354 426 346 464
Total Dealer 1,138 2.96 1,773 1,306 3.18 1,755
Total Automotive 1,366$ 3.55 2,146$ 1,521$ 3.70 2,131$
(1) Companies with > 25% of revenue derived from the automotive industry.
June 30, 2009 December 31, 2008% of Total
Loans% of Total
Loans
Although we do not have direct exposure to the automobile manufacturing companies, we do have limited exposure to
automobile industry suppliers, and automobile dealer-related exposures. The automobile industry supplier exposure is embedded primarily in our C&I portfolio within the Commercial Banking segment, while the dealer exposure is originated and managed within the AFDS business segment. As a result of our geographic locations and the above referenced exposure, we have closely monitored the entire automobile industry; particularly the recent events associated with General Motors and Chrysler, including bankruptcy filings, plant closings, production suspension, and model eliminations. We
43

have anticipated the significant reductions in production across the industry that will result in additional economic distress in some of our markets. Our eastern Michigan and northern Ohio markets are particularly exposed to these reductions, but all our markets are affected. We anticipate the impact will result in additional stress throughout our commercial and consumer loan portfolios, as secondary and tertiary businesses are affected by the actions of the manufacturers. However, as these actions were anticipated, many of the potential impacts have been mitigated through changes in underwriting criteria and regionally focused policies and procedures. Within the AFDS portfolio, our dealer selection criteria and focus is on multiple brand dealership groups, as we have immaterial exposure to single-brand dealerships.
As shown in Table 28, our total direct exposure to the automotive supplier segment is $373 million, of which $228 million represented loans outstanding. We included companies that derive more than 25% of their revenues from contracts with automobile manufacturing companies. This low level of exposure is reflective of our industry-level risk-limits approach.
While the entire automotive industry is under significant pressure as evidenced by a significant reduction in new car
sales and the resulting production declines, we believe that our floorplan exposure of $1.3 billion will not be materially affected. Our floorplan exposure is centered in large, multi-dealership entities, and we have focused on client selection, and conservative underwriting standards. We anticipate that the economic environment will affect our dealerships in the near-term, but we believe the majority of our portfolio will perform favorably relative to the industry in the increasingly stressed environment. The decline in floorplan loans outstanding at June 30, 2009, compared with December 31, 2008, reflected reduced dealership inventory as the market continued to contract.
While the specific impacts associated with the ongoing changes in the industry are unknown, we believe that we have taken appropriate steps to limit our exposure. When we have chosen to extend credit, our client selection process has focused us on the most diversified and strongest dealership groups. COMMERCIAL REAL ESTATE (CRE) PORTFOLIO
As shown in the following table, CRE loans totaled $8.9 billion and represented 23% of total loans and leases at June
30, 2009.
44

Table 29 - Commercial Real Estate Loans by Property Type and Property Location
(in millions) Pennsylvania Florida Kentucky OtherTotal
Amount
Retail properties 921$ 265$ 161$ 217$ 48$ 86$ 11$ 592$ 2,301$ 25.7 %Multi family 836 142 103 76 79 7 40 130 1,413 15.8 Single family home builders 684 122 63 37 20 135 26 75 1,162 13.0 Office 588 204 114 55 62 21 28 68 1,140 12.7 Industrial and warehouse 516 235 30 82 20 41 14 125 1,063 11.9 Lines to real estate companies 703 118 58 43 53 1 2 14 992 11.1 Hotel 143 86 24 21 10 --- --- 67 351 3.9 Health care 174 67 19 --- 4 --- --- 32 296 3.3 Raw land and other land uses 79 30 11 13 6 7 9 20 175 2.0 Other 31 8 7 2 --- --- 4 1 53 0.6
Total 4,675$ 1,277$ 590$ 546$ 302$ 298$ 134$ 1,124$ 8,946$ 100.0 %
% of total portfolio 52.3% 14.3% 6.6% 6.1% 3.4% 3.3% 1.5% 12.6% 100.0%
Net charge-offs 82.7$ 31.1$ -$ 2.8$ 1.2$ 29.9$ 2.9$ 22.0$ 172.6$ Net charge-offs - annualized percentage 6.86% 9.46% 0.13% 1.97% 1.56% 39.22% 8.63% 7.63% 7.51%
Nonaccrual loans 432.8$ 143.8$ 10.7$ 31.4$ 1.4$ 105.4$ 9.3$ 116.0$ 850.8$ % of portfolio 9.26% 11.26% 1.81% 5.75% 0.46% 35.37% 6.94% 10.32% 9.51%
At June 30, 2009
Ohio Michigan Indiana PercentWest Virginia
Credit quality data regarding NCOs and NALs for our CRE portfolio is presented in the following table.
(in thousands) Amount Percent Amount% of Total
Loans
Retail properties 53,792$ 9.35 % 31.2 % 263,934$ 11.5 %Single family home builders 52,208 17.98 30.2 289,991 25.0Lines to real estate companies 24,132 9.28 14.0 29,898 3.0Multi family 17,440 4.72 10.1 104,493 7.4Industrial and warehouse 14,020 5.04 8.1 75,988 7.1Office 6,528 2.19 3.8 53,300 4.7Raw land and other land uses 4,454 9.82 2.6 20,206 11.7Hotel 48 0.00 0.0 6,292 1.8Health care --- --- --- 716 0.2Other --- --- --- 6,027 11.4
Total 172,621$ 7.51 % 100.0 % 850,846$ 9.5 %
Table 30 - Commercial Real Estate Loans Credit Quality Data by Property Type
At June 30, 2009
Annualized %
Quarter Ended June 30,2009
Net charge-offs Nonaccrual Loans
We manage the risks inherent in this portfolio through origination policies, concentration limits, ongoing loan level reviews, recourse requirements, and continuous portfolio risk management activities. Our origination policies for this portfolio include loan product-type specific policies such as LTV, debt service coverage ratios, and pre-leasing requirements, as applicable. Generally, we: (a) limit our loans to 80% of the appraised value of the commercial real estate,
45

(b) require net operating cash flows to be 125% of required interest and principal payments, and (c) if the commercial real estate is non-owner occupied, require that at least 50% of the space of the project be pre-leased. We may require more conservative loan terms, depending on the project.
Dedicated real estate professionals within our Commercial Real Estate segment team originated the majority of the portfolio, with the remainder obtained from prior acquisitions. Appraisals from approved vendors are reviewed by an internal appraisal review group to ensure the quality of the valuation used in the underwriting process. The portfolio is diversified by project type and loan size, and represents a significant piece of the credit risk management strategies employed for this portfolio. Our loan review staff provides an assessment of the quality of the underwriting and structure and validates the risk rating assigned to the loan.
Appraisal values are updated as needed, in compliance with regulatory requirements. Given the stressed environment for some loan types, we have initiated ongoing portfolio level reviews of segments such as single family home builders and retail properties (see “Single Family Home Builders” and “Retail Properties” discussions). These reviews generate action plans based on occupancy levels or sales volume associated with the projects being reviewed. The results of the 2009 first six-month period reviews of these two portfolio segments indicated that additional stress was likely due to the current economic conditions. Appraisals are updated on a regular basis to ensure that appropriate decisions regarding the ongoing management of the portfolio reflect the changing market conditions. This highly individualized process requires working closely with all of our borrowers as well as an in-depth knowledge of CRE project lending and the market environment.
At the portfolio level, we actively monitor the concentrations and performance metrics of all loan types, with a focus on higher risk segments. Macro-level stress-test scenarios based on home-price depreciation trends for the segments are embedded in our performance expectations, and lease-up and absorption is assessed. We anticipate the current stress within this portfolio will continue throughout the remainder of 2009, resulting in elevated charge-offs, NALs, and ALLL levels.
During the 2009 first quarter, a portfolio review resulted in a reclassification of certain CRE loans to C&I loans at the
end of the period. This net reclassification of $782 million was primarily associated with loans to businesses secured by the real estate and buildings that house their operations. These owner-occupied loans secured by real estate were underwritten based on the cash flow of the business and are more appropriately classified as C&I loans.
Within the CRE portfolio, the single family home builder and retail properties segments continued to be stressed as a
result of the continued decline in the housing markets and general economic conditions. As previously mentioned above, these segments continue to be the highest risk segments within our CRE portfolio, and are discussed further below. Single Family Home Builders
At June 30, 2009, we had $1,162 million of CRE loans to single family home builders. Such loans represented 3% of total loans and leases. Of this portfolio segment, 69% were to finance projects currently under construction, 16% to finance land under development, and 15% to finance land held for development. The $1,162 million represented a $427 million, or 27%, decrease compared with $1,589 million at December 31, 2008. The decrease primarily reflected the reclassification of loans secured by 1-4 family residential real estate rental properties to C&I loans, consistent with industry practices in the definition of this segment. Other factors contributing to the decrease in exposure include essentially no new originations in 2009 and substantial charge-offs.
The housing market across our geographic footprint remained stressed, reflecting relatively lower sales activity, declining prices, and excess inventories of houses to be sold, particularly impacting borrowers in our eastern Michigan and northern Ohio markets. Further, a portion of the loans extended to borrowers located within our geographic regions was to finance projects outside of our geographic regions. We anticipate the residential developer market will continue to be depressed, and anticipate continued pressure on the single family home builder segment throughout 2009. As previously mentioned, all significant exposures are monitored on a periodic basis. For this portfolio segment, the periodic monitoring has included: (a) all loans greater than $50 thousand have been reviewed continuously over the past 18 months and continue to be monitored, (b) credit valuation adjustments have been made when appropriate based on the current condition of each relationship, and (c) reserves have been increased based on proactive risk identification and thorough borrower analysis.
46

Retail properties
Our portfolio of CRE loans secured by retail properties totaled $2.3 billion, or approximately 6% of total loans and leases, at June 30, 2009. Loans within this portfolio segment increased 2% from December 31, 2008, primarily reflecting construction draws. Credit approval in this portfolio segment is generally dependant on pre-leasing requirements, and net operating income from the project must cover debt service by specified percentages when the loan is fully funded.
The weakness of the economic environment in our geographic regions significantly impacted the projects that secure the loans in this portfolio segment. Increased unemployment levels compared with recent years, and the expectation that these levels will continue to increase for the foreseeable future, are expected to adversely affect our borrowers’ ability to repay these loans. We have increased the level of credit risk management activity to this portfolio segment, and we analyze our retail property loans in detail by combining property type, geographic location, tenants, and other data, to assess and manage our credit concentration risks. Consumer Credit
Consumer credit approvals are based on, among other factors, the financial strength and payment history of the borrower, type of exposure, and the transaction structure. We make extensive use of portfolio assessment models to continuously monitor the quality of the portfolio, which may result in changes to future origination strategies. The continuous analysis and review process results in a determination of an appropriate ALLL amount for our consumer loan portfolio.
Our consumer loan portfolio is primarily comprised of home equity loans, traditional residential mortgages, and
automobile loans and leases. Home equity – Home equity lending includes both home equity loans and lines of credit. This type of lending, which
is secured by a first- or second- mortgage on the borrower’s residence, allows customers to borrow against the equity in their home. Real estate market values as of the time the loan or line is granted directly affect the amount of credit extended and, in addition, changes in these values impact the severity of losses.
Residential mortgages – Residential mortgage loans represent loans to consumers for the purchase or refinance of a
residence. These loans are generally financed over a 15- to 30- year term, and in most cases, are extended to borrowers to finance their primary residence. In some cases, government agencies or private mortgage insurers guarantee the loan. Generally speaking, our practice is to sell a significant majority of our fixed-rate originations in the secondary market.
Automobile loans/leases – Automobile loans/leases is primarily comprised of loans made through automotive dealerships, and includes exposure in several out-of-market states. However, no out-of-market state represented more than 10% of our total automobile loan portfolio, and we expect to see relatively rapid reductions in these exposures as we ceased automobile loan originations in out-of-market states during the 2009 first quarter. Our automobile lease portfolio will continue to decline as we ceased new originations of all automobile leases during the 2008 fourth quarter.
The residential mortgage and home equity portfolios are primarily located throughout our geographic footprint. The general slowdown in the housing market has impacted the performance of our residential mortgage and home equity portfolios over the past year. While the degree of price depreciation varies across our markets, all regions throughout our footprint have been affected. Given the conditions in our markets as described above in the single family home builder section, the home equity and residential mortgage portfolios are particularly noteworthy, and are discussed in greater detail below:
47

Table 31 - Selected Home Equity and Residential Mortgage Portfolio Data (1)
(dollar amounts in millions)6/30/09 12/31/08 6/30/09 12/31/08 6/30/09 12/31/08
Ending Balance $2,830 $3,116 $4,802 $4,440 $4,646 $4,761Portfolio Weighted Average LTV ratio (2) 71% 70% 78% 78% 77% 76%Portfolio Weighted Average FICO (3) 720 725 723 720 700 707
OriginationsOrigination Weighted Average LTV ratio (2)
Origination Weighted Average FICO (3)
(4) Represents only owned-portfolio originations.
(3) Portfolio Weighted Average FICO reflects currently updated customer credit scores whereas Origination Weighted Average FICO reflects the customer credit scores at the time of loan origination.
(2) The loan-to-value (LTV) ratios for home equity loans and home equity lines of credit are cumulative LTVs reflecting the balance of any senior loans.
Residential Mortgages
Home Equity Loans Home Equity Lines of Credit Residential Mortgages (4)
Home Equity Loans Home Equity Lines of Credit
$94
(1) Excludes Franklin loans.
Three-Month Period Ended June 30, 2009
92%$2861%
717749
$357
76674%
HOME EQUITY PORTFOLIO
Our home equity portfolio (loans and lines of credit) consists of both first and second mortgage loans with underwriting criteria based on minimum credit scores, debt-to-income ratios, and LTV ratios. Included in our home equity loan portfolio are $1.4 billion of loans where the loan is secured by a first-mortgage lien on the property. We offer closed-end home equity loans with a fixed interest rate and level monthly payments and a variable-rate, interest-only home equity line of credit.
We believe we have granted credit conservatively within this portfolio. We have not originated home equity loans or
lines of credit that allow negative amortization. Also, we have not originated home equity loans or lines of credit with an LTV ratio at origination greater than 100%, except for infrequent situations with high quality borrowers. Home equity loans are generally fixed-rate with periodic principal and interest payments. Home equity lines of credit are generally variable-rate and do not require payment of principal during the 10-year revolving period of the line.
We continue to make appropriate origination policy adjustments based on our assessment of an appropriate risk profile as well as industry actions. As an example, the significant changes made in 2008 by the Federal National Mortgage Association (Fannie Mae) and the Federal Home Loan Mortgage Corporation (Freddie Mac) resulted in the reduction of our maximum LTV ratio on second-mortgage loans, even for customers with high credit scores. In addition to origination policy adjustments, we take appropriate actions, as necessary, to mitigate the risk profile of this portfolio. We focus production primarily within our banking footprint or to existing customers. RESIDENTIAL MORTGAGES
We focus on higher quality borrowers, and underwrite all applications centrally, often through the use of an automated underwriting system. We do not originate residential mortgage loans that allow negative amortization or are “payment option adjustable-rate mortgages.”
A majority of the loans in our loan portfolio have adjustable rates. Our adjustable-rate mortgages (ARMs) are
primarily residential mortgages that have a fixed rate for the first 3 to 5 years and then adjust annually. These loans comprised approximately 58% of our total residential mortgage loan portfolio at June 30, 2009. At June 30, 2009, ARM
48

loans that were expected to have rates reset totaled $391.2 million for the remainder of 2009, and $753.0 million for 2010. Given the quality of our borrowers and the relatively low current interest rates, we believe that we have a relatively limited exposure to ARM reset risk. Nonetheless, we have taken actions to mitigate our risk exposure. We initiate borrower contact at least six months prior to the interest rate resetting, and have been successful in converting many ARMs to fixed-rate loans through this process. Additionally, where borrowers are experiencing payment difficulties, loans may be re-underwritten based on the borrower’s ability to repay the loan.
We had $410.4 million of Alt-A mortgage loans in the residential mortgage loan portfolio at June 30, 2009, representing an 8% decline, compared with $445.4 million at December 31, 2008. These loans have a higher risk profile than the rest of the portfolio as a result of origination policies for this limited segment including reliance on stated income, stated assets, or higher acceptable LTV ratios. At June 30, 2009, borrowers for Alt-A mortgages had an average current FICO score of 665 and the loans had an average LTV ratio of 88%, compared with 671 and 88%, respectively, at December 31, 2008. Total Alt-A NCOs were an annualized 3.27% for the 2009 second quarter, compared with an annualized 2.03% for the 2008 fourth quarter. Our exposure related to this product will continue to decline in the future as we stopped originating these loans in 2007.
Interest-only loans comprised $624.6 million, or 13%, of residential real estate loans at June 30, 2009, representing a
10% decline, compared with $691.9 million, or 15%, at December 31, 2008. Interest-only loans are underwritten to specific standards including minimum credit scores, stressed debt-to-income ratios, and extensive collateral evaluation. At June 30, 2009, borrowers for interest-only loans had an average current FICO score of 720 and the loans had an average LTV ratio of 78%, compared with 724 and 78%, respectively, at December 31, 2008. Total interest-only NCOs were an annualized 2.74% for the 2009 second quarter, compared with an annualized 0.20% for the 2008 fourth quarter.
Several recent government actions have been enacted that have affected the residential mortgage portfolio and MSRs
in particular. Various refinance programs positively affected the availability of credit for the industry. We are utilizing these programs to enhance our existing strategies of working closely with our customers. AUTOMOTIVE INDUSTRY IMPACTS ON CONSUMER LOAN PORTFOLIO
The issues affecting the automotive industry (see “Automotive Industry” discussion located within the “Commercial Credit” section) also have an impact on the performance of the consumer loan portfolio. While there is a direct correlation between the industry situation and our exposure to the automotive suppliers and automobile dealers in our commercial portfolio, the loss of jobs and reduction in wages may have a negative impact on our consumer portfolio. In 2008, we initiated a project to assess the impact on our geographic regions in the event of significant production changes or plant closings in our markets. This project included assessing the downstream impact on automotive suppliers, related small businesses, and consumers. As a result of this project, we believe that we have made a number of positive decisions regarding the quality of our consumer portfolio given the current environment. In the indirect automobile portfolio, we have focused on borrowers with high credit scores for many years, as reflected by the performance of the portfolio given the economic conditions. In the residential and home equity loan portfolios, we have been operating in a relatively high unemployment situation for an extended period of time, yet have been able to maintain our performance metrics reflecting our focus on strong underwriting. In summary, while we anticipate our performance results may be negatively impacted, we believe the impact will be manageable. Counterparty Risk
In the normal course of business, we engage with other financial counterparties for a variety of purposes including
investing, asset and liability management, mortgage banking, and for trading activities. As a result, we are exposed to credit risk, or the risk of loss if the counterparty fails to perform according to the terms of our contract or agreement.
We minimize counterparty risk through credit approvals, actively setting adjusting exposure limits, implementing monitoring procedures similar to those used for our commercial portfolio (see “Commercial Credit” discussion), generally entering into transactions only with counterparties that carry high quality ratings, and requiring collateral when appropriate.
49

The majority of the financial institutions with whom we are exposed to counterparty risk are large commercial banks. The potential amount of loss, which would have been recognized at June 30, 2009, if a counterparty defaulted, did not exceed $14 million for any individual counterparty. Credit Quality
We believe the most meaningful way to assess overall credit quality performance is through an analysis of credit quality performance ratios. This approach forms the basis of most of the discussion in the three sections immediately following: NALs and NPAs, ACL, and NCOs.
Credit quality performance in the 2009 second quarter continued to be negatively impacted by the sustained
economic weakness in our Midwest markets. In addition, the negative trends in credit quality metrics for commercial loans were also influenced by the results of the in-depth review of our commercial loan portfolio, which resulted in higher provision for credit losses. The continued trend of higher unemployment rates and declining home values in our markets negatively impacted consumer loan credit quality. NONACCRUING LOANS (NAL/NALs) AND NONPERFORMING ASSETS (NPA/NPAs) (This section should be read in conjunction with the “Franklin Relationship” discussion.)
NPAs consist of (a) NALs, which represent loans and leases that are no longer accruing interest, (b) impaired held-for-sale loans, (c) OREO, and (d) other NPAs. A C&I or CRE loan is generally placed on nonaccrual status when collection of principal or interest is in doubt or when the loan is 90-days past due. Home equity and residential mortgage loans are placed on nonaccrual status at 120 days and 180 days, respectively. When interest accruals are suspended, accrued interest income is reversed with current year accruals charged to earnings and prior-year amounts generally charged-off as a credit loss.
Table 32 reflects period-end NALs, NPAs, accruing restructured loans (ARLs), and past due loans and leases detail for each of the last five quarters. Due to the impact of the NALs and NPAs related to Franklin, we believe it is helpful to analyze trends in our portfolio with those Franklin-related NALs and NPAs removed. Table 33 details the Franklin-related impacts to NALs and NPAs for each of the last five quarters.
50

Table 32 - Nonaccruing Loans (NALs), Nonperforming Assets (NPAs), and Past Due Loans and Leases
(in thousands)
Nonaccrual loans and leases (NALs):Commercial and industrial (1) 456,734$ 398,286$ 932,648$ 174,207$ 161,345$ Commercial real estate 850,846 629,886 445,717 298,844 261,739 Residential mortgage (1) 475,488 486,955 98,951 85,163 82,882 Home equity (1) 35,299 37,967 24,831 27,727 29,076
Total NALs 1,818,367 1,553,094 1,502,147 585,941 535,042
Other real estate:Residential (1) 107,954 143,856 63,058 59,302 59,119 Commercial 64,976 66,906 59,440 14,176 13,259
Total other real estate 172,930 210,762 122,498 73,478 72,378 Impaired loans held for sale (2) 11,287 11,887 12,001 13,503 14,759 Other NPAs (3) --- --- --- 2,397 2,557 Total NPAs 2,002,584$ 1,775,743$ 1,636,646$ 675,319$ 624,736$
Nonperforming Franklin loans (1)
Commercial ---$ ---$ 650,225$ ---$ ---$ Residential mortgage 342,207 360,106 --- --- --- OREO 43,623 79,596 --- --- --- Home Equity 2,437 6,000 --- --- ---
Total nonperforming Franklin loans 388,267$ 445,702$ 650,225$ ---$ ---$
NALs as a % of total loans and leases 4.72 % 3.93 % 3.66 % 1.42 % 1.30 %
NPA ratio (4) 5.18 4.46 3.97 1.64 1.52
Accruing loans and leases past due 90 days or more:
Commercial and industrial ---$ ---$ 10,889$ 24,407$ 9,805$ Commercial real estate --- --- 59,425 58,867 24,052 Residential mortgage (excluding loans guaranteed by
the U.S. government) 97,937 88,381 71,553 58,280 52,006 Home equity 35,328 35,717 29,039 23,224 26,464 Other loans and leases 13,474 15,611 18,039 14,580 13,575 Total, excl. loans guaranteed by the U.S. government 146,739$ 139,709$ 188,945$ 179,358$ 125,902$ Add: loans guaranteed by U.S. government 99,379 88,551 82,576 68,729 65,021
Total accruing loans and leases past due 90 daysor more, including loans guaranteed by the U.S.government 246,118$ 228,260$ 271,521$ 248,087$ 190,923$
Excluding loans guaranteed by the U.S. government,as a percent of total loans and leases 0.38 % 0.35 % 0.46 % 0.44 % 0.31 %
Guaranteed by U.S. government, as a percent oftotal loans and leases 0.26 % 0.22 % 0.20 % 0.17 % 0.16 %
Including loans guaranteed by the U.S. government,as a percent of total loans and leases 0.64 % 0.58 % 0.66 % 0.60 % 0.47 %
Accruing restructured loans:Commercial (1) 267,975$ 201,508$ 185,333$ 364,939$ 368,379$ Residential mortgage 158,568 108,011 82,857 71,512 57,802 Other 35,720 27,014 41,094 40,414 34,094
Total accruing restructured loans 462,263$ 336,533$ 309,284$ 476,865$ 460,275$
(1)
(2)
(3)
(4)
Franklin loans were reported as accruing restructured commercial loans for the three-month periods ended June 30, 2008, and September 30, 2008. For the three-month period ended December 31, 2008, Franklin loans were reported as nonaccruing commercial and industrial loans. For the three-month periods ended March 31, 2009, and June 30, 2009, nonaccruing Franklin loans were reported as residential mortgage loans, home equity loans, and OREO; reflecting the 2009 first quarter restructuring.
Represent impaired loans obtained from the Sky Financial acquisition. Held for sale loans are carried at the lower of cost or fair value less costs to sell.
Other NPAs represent certain investment securities backed by mortgage loans to borrowers with lower FICO scores.
Nonperforming assets divided by the sum of loans and leases, impaired loans held for sale, net other real estate, and other NPAs.
2009 2008June 30, March 31, December 31, June 30,September 30,
51

Table 33 - N ALs/N PAs - Franklin-Re lated Impact
(in m illions) T hird SecondN onaccrual loans
Franklin 344.6$ 366.1$ 650.2$ -$ -$ N on-Franklin 1,473.8 1,187.0 851.9 585.9 535.0
T otal 1,818.4$ 1,553.1$ 1,502.1$ 585.9$ 535.0$
Total loans and lease sFranklin 472.0$ 494.0$ 650.2$ 1,095.0$ 1,130.0$ N on-Franklin 38,023.0 39,054.0 40,441.8 40,097.0 39,917.0
T otal 38,495.0$ 39,548.0$ 41,092.0$ 41,192.0$ 41,047.0$
N AL ratioT otal 4.72 % 3.93 % 3.66 % 1.42 % 1.30 %N on-Franklin 3.88 3.04 2.11 1.46 1.34
2009(in m illions) T hird Second
N onperforming asse ts
Franklin 388.3$ 445.7$ 650.2$ -$ -$ N on-Franklin 1,614.3 1,330.0 986.4 675.3 624.7
T otal 2,002.6$ 1,775.7$ 1,636.6$ 675.3$ 624.7$
T otal loans and leases 38,495.0$ 39,548.0$ 41,092.0$ 41,192.0$ 41,047.0$
T otal other real estate, net 172.9 210.8 122.5 73.5 72.4
Imp aired loans held for sale 11.3 11.9 12.0 13.5 14.8
O ther N PA s - - - 2.4 2.6
T otal 38,679.2 39,770.7 41,226.5 41,281.4 41,136.8
F ranklin 388.3 445.7 650.2 - - N on-Franklin 39,067.5$ 40,216.4$ 41,876.7$ 41,281.4$ 41,136.8$
N PA ratioT otal 5.18 % 4.46 % 3.97 % 1.64 % 1.52 %N on-Franklin 4.15 3.32 2.36 1.68 1.56
S econd2008
First Fourth
First Fourth20082009
S econd
NPAs, which include NALs (discussed below), were $2,002.6 million at June 30, 2009, and represented 5.18% of related assets. This compared with $1,775.7 million, or 4.46%, at March 31, 2009. The $226.9 million, or 13%, increase reflected:
• $265.3 million increase in NALs (discussed below)
Partially offset by:
• $37.8 million, or 18%, decline in OREO assets, reflecting a $36.0 million, or 45%, decline in Franklin-related OREO assets. We implemented a strategy whereby Franklin accelerated the sale of OREO properties over the past three months. This action is consistent with our assessment of the value of the properties and the current and future market conditions. We also made a significant advancement in the sales of existing OREO properties as a result of our increased focus on vendor performance.
NALs were $1,818.4 million at June 30, 2009, compared with $1,553.1 million at March 31, 2009. The increase of
$265.3 million, or 17%, primarily reflected:
• $221.0 million, or 35% increase in CRE NALs was primarily associated with retail projects, which accounted for over 70% of the increase. The stress of lower retail sales and downward pressure on rents given the economic conditions, continued to adversely affect retail projects. Multi-family projects accounted for most of the remaining increase, principally reflected in one relationship. Of note, single family home builder portfolio NALs were essentially unchanged.
52

• $58.4 million, or 15%, increase in C&I NALs reflected continued stress in the higher risk segments of the portfolio, including loans to borrowers supporting the home building industry, contractors, and automotive suppliers. While these higher risk segments account for less than 10% of the total C&I portfolio, they accounted for approximately 50% of the NAL increase. Those areas with a heavier manufacturing concentration, such as northern Ohio, were responsible for a higher percentage of the increase.
Residential mortgage and home equity NALs declined, reflecting a concentrated effort to minimize the inflow of new NALs and address existing issues through loss mitigation and loan modification transactions.
Compared with December 31, 2008, NPAs, which include NALs, increased $365.9 million, or 22%, reflecting:
• $405.1 million increase in CRE NALs, reflecting the continued decline in the housing market and stress on retail sales, as the majority of the increase was associated with the retail and the single family home builder segments. The stress of lower retail sales and downward pressure on rents given the economic conditions, continued to adversely affect retail projects.
• $376.5 million increase in residential mortgage NALs. This reflected an increase of $342.2 million related to the Franklin restructuring.
• $50.4 million increase in OREO. This reflected an increase of $79.6 million in OREO assets recorded as part of the Franklin restructuring. Subsequently, Franklin-related OREO assets declined $36.0 million, reflecting the accelerated sale of Franklin-related OREO properties over the past six months. The non-Franklin-related decline reflects significant advancement in the sales of existing OREO properties as a result of our increased focus on vendor performance.
Partially offset by:
• $475.9 million decrease in C&I NALs. This reflected a reduction of $650.2 million related to the 2009 first quarter Franklin relationship, partially offset by an increase on $174.3 million in non-Franklin related NALs reflecting the economic conditions in our markets. In general, the C&I loans experiencing the most stress are those supporting the housing and construction segments, and to a lesser degree, the automobile suppliers and restaurant segments.
The over 90-day delinquent, but still accruing, ratio excluding loans guaranteed by the U.S. Government, was 0.38%
at June 30, 2009. The guaranteed loans represent loans currently in Government National Mortgage Association (GNMA) pools that have met the eligibility requirements for voluntary repurchase. Because there is insignificant loss potential in these loans, as they remain supported by a guarantee from the Federal Housing Administration (FHA) or the Department of Veteran Affairs (VA), we believe the ratio excluding loans guaranteed by the U.S. Government represents a better leading indicator of loss potential and also aligns better with our regulatory reporting.
As part of our loss mitigation process, we may re-underwrite, modify, or restructure loans when borrowers are experiencing payment difficulties, and these loan restructurings are based on the borrower’s ability to repay the loan.
NPA activity for each of the past five quarters was as follows:
53
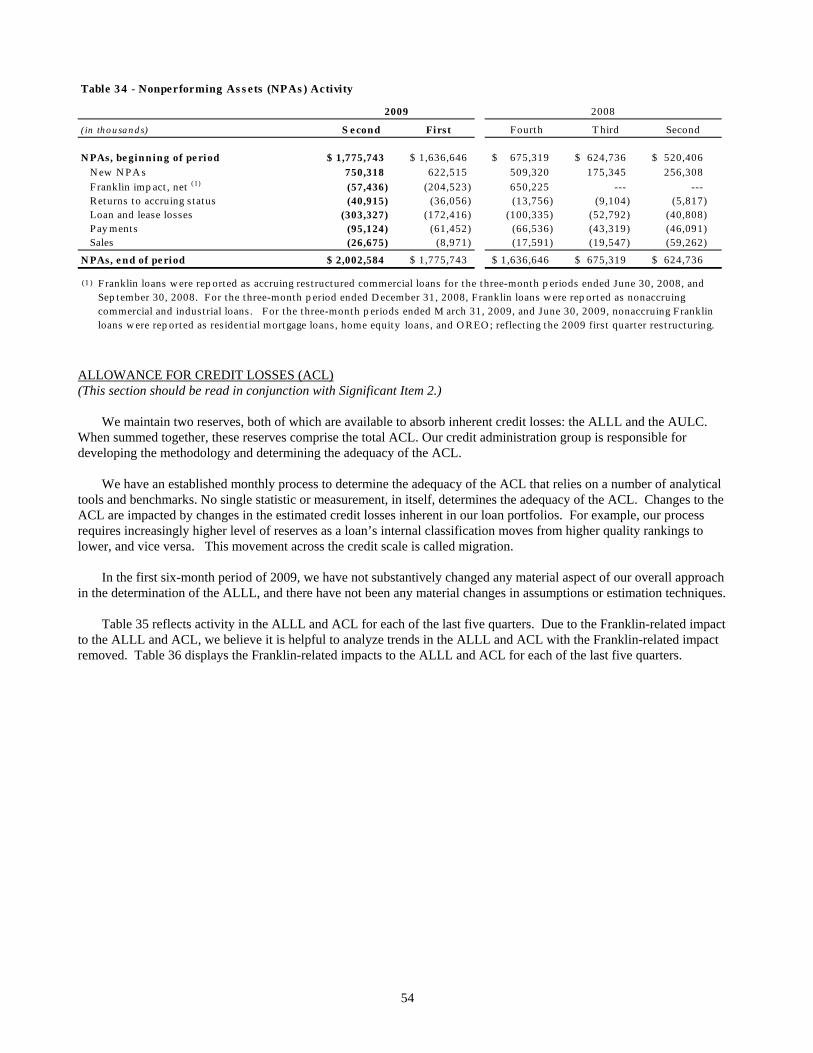
Table 3 4 - Nonperforming As s ets (NPAs ) Activity
( in th o u sa n d s) First
N PAs, be gin n ing of pe riod 1,775,743$ 1,636,646$ 675,319$ 624,736$ 520,406$ N ew N P A s 750,318 622,515 509,320 175,345 256,308 F ranklin imp act , net (1) (57,436) (204,523) 650,225 --- --- Returns to accruing s tatus (40,915) (36,056) (13,756) (9,104) (5,817) Loan and lease losses (303,327) (172,416) (100,335) (52,792) (40,808) P ay ments (95,124) (61,452) (66,536) (43,319) (46,091) Sales (26,675) (8,971) (17,591) (19,547) (59,262)
N PAs, e n d of pe riod 2,002,584$ 1,775,743$ 1,636,646$ 675,319$ 624,736$
(1 )
F ourth
F ranklin loans w ere rep orted as accruing rest ructured commercial loans for the three-month p eriods ended June 30, 2008, and Sep tember 30, 2008. F or the three-month p eriod ended D ecember 31, 2008, F ranklin loans w ere rep orted as nonaccruing commercial and indust rial loans . F or the three-month p eriods ended M arch 31, 2009, and June 30, 2009, nonaccruing F ranklin loans w ere rep orted as res ident ial mortgage loans, home equity loans, and O REO ; reflect ing the 2009 first quarter res t ructuring.
2009 2008
SecondT hirdS e cond
ALLOWANCE FOR CREDIT LOSSES (ACL) (This section should be read in conjunction with Significant Item 2.)
We maintain two reserves, both of which are available to absorb inherent credit losses: the ALLL and the AULC. When summed together, these reserves comprise the total ACL. Our credit administration group is responsible for developing the methodology and determining the adequacy of the ACL.
We have an established monthly process to determine the adequacy of the ACL that relies on a number of analytical
tools and benchmarks. No single statistic or measurement, in itself, determines the adequacy of the ACL. Changes to the ACL are impacted by changes in the estimated credit losses inherent in our loan portfolios. For example, our process requires increasingly higher level of reserves as a loan’s internal classification moves from higher quality rankings to lower, and vice versa. This movement across the credit scale is called migration.
In the first six-month period of 2009, we have not substantively changed any material aspect of our overall approach
in the determination of the ALLL, and there have not been any material changes in assumptions or estimation techniques. Table 35 reflects activity in the ALLL and ACL for each of the last five quarters. Due to the Franklin-related impact
to the ALLL and ACL, we believe it is helpful to analyze trends in the ALLL and ACL with the Franklin-related impact removed. Table 36 displays the Franklin-related impacts to the ALLL and ACL for each of the last five quarters.
54

Table 35 - Quarterly Credit Reserves Analysis
(in thousands)
Allowance for loan and lease losses, beginning of period 838,549$ 900,227$ 720,738$ 679,403$ 627,615$
Loan and lease losses (359,444) (353,005) (571,053) (96,388) (78,084) Recoveries of loans previously charged off 25,037 11,514 10,433 12,637 12,837
Net loan and lease losses (334,407) (341,491) (560,620) (83,751) (65,247) Provision for loan and lease losses 413,538 289,001 728,046 125,086 117,035 Economic reserve transfer --- --- 12,063 --- --- Allowance of assets sold --- (9,188) --- --- ---
Allowance for loan and lease losses, end of period 917,680$ 838,549$ 900,227$ 720,738$ 679,403$
Allowance for unfunded loan commitmentsand letters of credit, beginning of period 46,975$ 44,139$ 61,640$ 61,334$ 57,556$
Provision for (reduction in) unfunded loancommitments and letters of credit losses 169 2,836 (5,438) 306 3,778
Economic reserve transfer --- --- (12,063) --- ---
Allowance for unfunded loan commitmentsand letters of credit, end of period 47,144$ 46,975$ 44,139$ 61,640$ 61,334$
Total allowances for credit losses 964,824$ 885,524$ 944,366$ 782,378$ 740,737$
Allowance for loan and lease losses (ALLL) as % of:
Total loans and leases 2.38 % 2.12 % 2.19 % 1.75 % 1.66 %Nonaccrual loans and leases (NALs) 50 54 60 123 127 Nonperforming assets (NPAs) 46 47 55 107 109
Total allowances for credit losses (ACL) as % of:Total loans and leases 2.51 % 2.24 % 2.30 % 1.90 % 1.80 %NALs 53 57 63 134 138 NPAs 48 50 58 116 119
20082009
Second First Fourth Third Second
55

Table 36 - ALLL/ACL - Franklin-Related Impact
(in millions)Allowance for loan and lease losses
Franklin -$ -$ 130.0$ 115.3$ 115.3$ Non-Franklin 917.7 838.5 770.2 605.4 564.1
Total 917.7$ 838.5$ 900.2$ 720.7$ 679.4$
Allowance for credit lossesFranklin -$ -$ 130.0$ 115.3$ 115.3$ Non-Franklin 964.8 885.5 814.4 667.1 625.4
Total 964.8$ 885.5$ 944.4$ 782.4$ 740.7$
Total loans and leasesFranklin 472.0$ 494.0$ 650.2$ 1,095.0$ 1,130.0$ Non-Franklin 38,023.0 39,054.0 40,441.8 40,097.0 39,917.0
Total 38,495.0$ 39,548.0$ 41,092.0$ 41,192.0$ 41,047.0$
ALLL as % of total loans and leases
Total 2.38 % 2.12 % 2.19 % 1.75 % 1.66 %
Non-Franklin 2.41 2.15 1.90 1.51 1.41
ACL as % of total loans and leases
Total 2.51 2.24 2.30 1.90 1.80
Non-Franklin 2.54 2.27 2.01 1.66 1.57
Nonaccrual loansFranklin 344.6$ 366.1$ 650.2$ -$ -$ Non-Franklin 1,473.8 1,187.0 851.9 586.0 535.0
Total 1,818.4$ 1,553.1$ 1,502.1$ 586.0$ 535.0$
ALLL as % of NALs
Total 50 % 54 % 60 % 123 % 127 %
Non-Franklin 62 71 90 103 105
ACL as % of NALsTotal 53 57 63 134 138 Non-Franklin 65 75 96 114 117
First Fourth2008Third Second
2009Second
56

The table below reflects activity in the ALLL and AULC for the first six-month periods of 2009 and 2008.
Table 37 - Year to Date Credit Reserves Analysis
(in thousands)
Allowance for loan and lease losses, beginning of period 900,227$ 578,442$
Loan and lease losses (712,449) (138,888) Recoveries of loans p reviously charged off 36,551 25,192
Net loan and lease losses (675,898) (113,696) Provision for loan and lease losses 702,539 214,657 Allowance of assets sold and securitized (9,188) ---
Allowance for loan and lease losses, end of period 917,680$ 679,403$
Allowance for unfunded loan commitmentsand letters of credit, beginning of period 44,139$ 66,528$
Provision for (reduction in) unfunded loan commitments and letters of credit losses 3,005 (5,194)
Allowance for unfunded loan commitmentsand letters of credit, end of period 47,144$ 61,334$
Total allowances for credit losses 964,824$ 740,737$
Allowance for loan and lease losses (ALLL) as % of:
Total loans and leases 2.38 % 1.66 %Nonaccrual loans and leases (NALs) 50 127 Non-p erforming assets (NPAs) 46 109
Total allowances for credit losses (ACL) as % of:Total loans and leases 2.51 % 1.80 %NALs 53 138 NPAs 48 119
2008
Six M onths Ended June 30,
2009
As shown in the above table, the ALLL increased to $917.7 million at June 30, 2009, compared with $838.5 million
at March 31, 2009, and $900.2 million at December 31, 2008. Expressed as a percent of period-end loans and leases, the ALLL ratio increased to 2.38% at June 30, 2009, compared with 2.12% at March 31, 2009, and 2.19% at December 31, 2008. The increases of $79.1 million and $17.5 million compared with March 31, 2009 and December 31, 2008, respectively, primarily reflected the building of reserves associated with our portfolio review process discussed previously. (See “Commercial Loan Portfolio Review and Actions” section located within the “Commercial Credit” section for additional information) As loans were assigned to higher risk ratings, our calculated reserve increased accordingly, consistent with our reserving methodology. The increase of $17.5 million compared with December 31, 2008, also reflected the increase of reserves resulting from the portfolio review process just noted, partially offset by the impact of using the previously established $130.0 million Franklin specific reserve to absorb related NCOs due to the 2009 first quarter Franklin restructuring (see “Franklin Loan” discussion located within the “Critical Accounting Policies and Use of Significant Estimates” section).
57

On a combined basis, the ACL as a percent of total loans and leases at June 30, 2009, was 2.51% compared with 2.24% at March 31, 2009, and 2.30% at December 31, 2008. Like the ALLL, the Franklin restructuring impacted the change in the ACL from December 31, 2008.
The following table provides additional detail regarding the ACL coverage ratios for NALs.
Table 38 - ACL/NAL Coverage Ratios AnalysisAt June 30, 2009(in thousands) Commercial
Impaired Franklin Other TotalNonaccrual loans (NALs) 410,162$ 344,644$ 1,063,561$ 1,818,367$
Allowance for Credit Losses NA (1) NA (2) 964,824 964,824
ACL as a % of NALs (coverage ratio) 91% 53%
(1)
(2)
Not applicable. These assets are considered impaired, and therefore valuations are subject to continous impairment analysis. Amounts shown are written down to assessed values as of June 30, 2009.Not applicable. Franklin loans were acquired at fair value on March 31, 2009. Under AICPA Statement of Position 03-3, Accounting for Certain Loans or Debt Securities Acquired in a Transfer (SOP 03-3) , a nonaccretable discount was recorded to reduce the carrying value of the loans to the amount of future cash flows we expect to receive.
Although the ACL/NAL coverage ratio has declined compared with prior quarters (see Table 37), we believe it represents an appropriate level of reserves for the remaining risk in the portfolio. A total of $754.8 million of the $1,818.4 million of NALs do not have reserves assigned as those loans have already been written down to recoverable value.
As shown in the table above, the two components of the NAL balance that do not have reserves assigned are the commercial impaired segment and the Franklin segment. The commercial impaired segment is subject to quarterly impairment testing. The $410.2 million balance represents the net recoverable balance based on our most recent test date of June 30, 2009. Based on the impairment designation and valuation, no reserves are assigned. The Franklin NAL balance was written down to fair value as a part of the restructuring agreement on March 31, 2009, and we do not expect any additional charge-offs. (See “Franklin Loan Restructuring Transaction” discussion located within the “Critical Accounting Policies and Use of Significant Estimates” section.)
As we believe that the coverage ratios are used to gauge coverage of potential future losses, not including these balances provides a more accurate measure of our ACL level relative to NALs. After adjusting for such loans, our June 30, 2009, ACL/NAL ratio was 91%.
NET CHARGE-OFFS (NCOs) (This section should be read in conjunction with Significant Item 2.)
Table 39 reflects NCO detail for each of the last five quarters. Due to the size of the NCOs related to our loans to Franklin, we believe it is helpful to analyze trends in our portfolio with those Franklin-related NCOs, and the related loans, removed. Table 40 displays the Franklin-related impacts for each of the last five quarters.
58

Table 39 - Quarterly Net Charge-Off Analysis
(in thousands)
Net charge-offs by loan and lease type:Commercial:
Commercial and industrial 98,300$ (1) 210,648$ (2) 473,426$ (3) 29,646$ 12,361$ Commercial real estate:
Construction 31,360 25,642 2,390 3,539 575 Commercial 141,261 57,139 35,991 7,446 14,524
Commercial real estate 172,621 82,781 38,381 10,985 15,099
Total commercial 270,921 293,429 511,807 40,631 27,460 Consumer:
Automobile loans 12,379 14,971 14,885 9,813 8,522 Automobile leases 2,227 3,086 3,666 3,532 2,928
Automobile loans and leases 14,606 18,057 18,551 13,345 11,450 Home equity 24,687 17,680 19,168 15,828 17,345 Residential mortgage 17,160 6,298 7,328 6,706 4,286 Other loans 7,033 6,027 3,766 7,241 4,706
Total consumer 63,486 48,062 48,813 43,120 37,787
Total net charge-offs 334,407$ 341,491$ 560,620$ 83,751$ 65,247$
Net charge-offs - annualized percentages:Commercial:
Commercial and industrial (1), (2), (3) 2.91 % 6.22 % 13.78 % 0.87 % 0.36 %Commercial real estate:
Construction 6.45 5.05 0.45 0.68 0.11 Commercial 7.79 2.83 1.77 0.39 0.77
Commercial real estate 7.51 3.27 1.50 0.45 0.63
Total commercial 4.77 4.96 8.54 0.69 0.47 Consumer:
Automobile loans 1.73 1.56 1.53 1.02 0.94 Automobile leases 2.11 2.39 2.31 1.84 1.28
Automobile loans and leases 1.78 1.66 1.64 1.15 1.01 Home equity 1.29 0.93 1.02 0.85 0.94 Residential mortgage 1.47 0.55 0.62 0.56 0.33 Other loans 4.03 3.59 2.22 4.32 2.69
Total consumer 1.56 1.12 1.12 0.98 0.85
Net charge-offs as a % of average loans 3.43 % 3.34 % 5.41 % 0.82 % 0.64 %
(1)
(2)
(3) The 2008 fourth quarter included net charge-offs totaling $423,269 thousand associated with the Franklin relationship.
The 2009 first quarter included net charge-offs totaling $128,338 thousand associated with the Franklin restructuring.
20082009
Second First Fourth Third Second
The 2009 second quarter included net recoveries totaling $9,884 thousand associated with the Franklin relationship.
59

Table 40 - NCOs - Franklin-Related Impact
(in millions)Commercial and industrial net charge-offs (recoveries)
Franklin (9.9)$ 128.3$ 423.3$ -$ -$ Non-Franklin 108.2 82.3 50.1 29.6 12.4
Total 98.3$ 210.6$ 473.4$ 29.6$ 12.4$
Commercial and industrial average loan balancesFranklin -$ 628.0$ 1,085.0$ 1,114.0$ 1,143.0$ Non-Franklin 13,523.0 12,913.0 12,661.0 12,515.0 12,488.0
Total 13,523.0$ 13,541.0$ 13,746.0$ 13,629.0$ 13,631.0$
Commercial and industrial net charge-offs - annualized percentagesTotal 2.91 % 6.22 % 13.78 % 0.87 % 0.36 %Non-Franklin 3.20 2.55 1.58 0.95 0.40
(in millions)
Total net charge-offs (recoveries)Franklin (10.1)$ 128.3$ 423.3$ -$ -$ Non-Franklin 344.5 213.2 137.3 83.8 65.2
Total 334.4$ 341.5$ 560.6$ 83.8$ 65.2$
Total average loan balancesFranklin 489.0$ 630.0$ 1,085.0$ 1,114.0$ 1,143.0$ Non-Franklin 38,518.0 40,236.0 40,352.0 39,890.0 39,882.0
Total 39,007.0$ 40,866.0$ 41,437.0$ 41,004.0$ 41,025.0$
Total net charge-offs - annualized percentagesTotal 3.43 % 3.34 % 5.41 % 0.82 % 0.64 %Non-Franklin 3.58 2.12 1.36 0.84 0.65
2008First Fourth Third Second
2009Second
First2008
Fourth Third Second2009
Second
C&I NCOs for the 2009 second quarter were $98.3 million. We recorded $9.9 million of net C&I loan loss recoveries during the 2009 second quarter related to a Franklin-related litigation recovery that was received. Excluding this $9.9 million, second quarter non-Franklin related C&I NCOs were $108.2 million, or an annualized 3.20%. This was up from $82.3 million, or an annualized 2.55%, of related average non-Franklin C&I loans in the 2009 first quarter. C&I NCOs in the second quarter were impacted by four relationships, each with a charge-off greater than $5 million. The remaining charge-offs were concentrated in smaller loans, distributed across our geographic markets. From an industry perspective, manufacturing represented the most significant level of losses, including three of the four relationships just noted.
CRE NCOs for the 2009 second quarter were $172.6 million. The single family home builder and retail projects continued to represent a significant portion of the losses, consistent with our views of the higher risk nature of these project types and developers. There were five charge-offs in excess of $5 million, with the remaining losses spread across multiple borrowers and throughout our footprint.
The larger losses mentioned above were previously identified problem credits with appropriate reserves previously established via our FAS 114 process. As a result, there was a net decrease in our specific reserves associated with impaired loans. This is a positive change in that impaired loans with previously established reserves typically represent the majority of future losses.
60

In assessing commercial NCOs trends, it is helpful to understand the process of how these loans are treated as they deteriorate over time. Reserves for loans are established at origination consistent with the level of risk associated with the transaction. If the quality of a commercial loan deteriorates, it migrates to a lower quality risk rating as a result of our normal portfolio management process, and a higher reserve amount is assigned. As a part of our normal portfolio management process, the loan is reviewed and reserves are increased as warranted. Charge-offs, if necessary, are generally recognized in a period after the reserves were established. If the previously established reserves exceed that needed to satisfactorily resolve the problem credit, a reduction in the overall level of the reserve could be recognized. In summary, if loan quality deteriorates, the typical credit sequence for commercial loans are periods of reserve building, followed by periods of higher NCOs. Additionally, it is helpful to understand that increases in reserves either precede or are in conjunction with increases in NALs. When a credit is classified as NAL, it is evaluated for specific reserves or charge-off. As a result, an increase in NALs does not necessarily result in an increase in reserves or an expectation of higher future NCOs.
Automobile loans and leases NCOs for the 2009 second quarter were $14.6 million. The increase in the NCO ratio from the prior quarter reflected a reduction in 2009 second quarter average balances due to the impact of the 2009 first quarter’s automobile loan securitization. Performance of this portfolio on both an absolute and relative basis continued to be consistent with our views regarding the underlying quality of the portfolio. The level of delinquencies dropped for the second quarter in a row, further substantiating our longer-term view of flat to improved performance of this portfolio through 2009.
Home equity NCOs in the 2009 second quarter were $24.7 million. While NCOs were higher than in prior quarters, there was a significant decline in the early-stage delinquency level in the home equity line of credit portfolio, supporting our positive longer-term view regarding the performance of this portfolio. The higher losses resulted from a combination of a small number of larger dollar losses, and our continued commitment to the loss mitigation and short sale process. We continue to believe that our more proactive loss mitigation strategies are in the best interest of both our customers and us. Given the current market conditions, we remain comfortable with the performance of this portfolio.
Residential mortgage NCOs in the 2009 second quarter were $17.2 million. The higher loss levels compared with prior quarters were a direct result of our continued emphasis on loss mitigation strategies, as well as an increased number of short sales. While the delinquency rates continued to increase, indicating the economic stress on our borrowers, our losses have remained manageable.
61

Table 41 - Year To Date Net Charge-Off Analysis
(in thousands)
Net charge-offs by loan and lease type:Commercial:
Commercial and industrial 308,948$ (1) 23,093$ Commercial real estate:
Construction 57,002 697 Commercial 198,400 18,677
Commercial real estate 255,402 19,374
Total commercial 564,350 42,467 Consumer:
Automobile loans 27,350 16,530 Automobile leases 5,313 6,139
Automobile loans and leases 32,663 22,669 Home equity 42,367 28,499 Residential mortgage 23,458 7,213 Other loans 13,060 12,848
Total consumer 111,548 71,229
Total net charge-offs 675,898$ 113,696$
Net charge-offs - annualized percentages:Commercial:
Commercial and industrial (1) 4.57 % 0.34 %Commercial real estate:
Construction 5.73 0.07 Commercial 5.18 0.50
Commercial real estate 5.29 0.41
Total commercial 4.87 0.37 Consumer:
Automobile loans 1.63 0.95 Automobile leases 2.26 1.22
Automobile loans and leases 1.71 1.01 Home equity 1.11 0.89 Residential mortgage 1.01 0.27 Other loans 3.82 2.49
Total consumer 1.33 0.80
Net charge-offs as a % of average loans 3.39 % 0.56 %(1)
2008Six M onths Ended June 30,
2009
The 2009 first six-month period included net charge-offs totaling $118,454 thousand associated with the Franklin restructuring.
62

INVESTMENT SECURITIES PORTFOLIO (This section should be read in conjunction with the “Securities and Other-Than-Temporary Impairment” discussion located within the “Critical Accounting Policies and Use of Significant Estimates” section.)
We routinely review our available for sale investment securities portfolio, and recognize impairment based on fair value, issuer-specific factors and results, and our intent to hold such investments. Our available for sale investment securities portfolio is evaluated taking into consideration established asset/liability management objectives, and changing market conditions that could affect the profitability of the portfolio, as well as the level of interest rate risk to which we are exposed.
Our available for sale investment securities portfolio is comprised of various financial instruments. At June 30, 2009, our available for sale investment securities portfolio totaled $5.9 billion.
Declines in the fair value of available for sale investment securities are recorded as temporary impairment, noncredit OTTI, or credit OTTI adjustments.
Temporary impairment adjustments are recorded when the fair value of a security fluctuates from its historical cost.
Temporary impairment adjustments are recorded in accumulated OCI, and therefore, reduces equity. Temporary impairment adjustments do not impact net income or risk-based capital. A recovery of available for sale security prices also is recorded as an adjustment to OCI for securities that are temporarily impaired, and results in an increase to equity.
OTTI is recorded when the fair value of an available for sale security is less than historical cost, and it is probable that
all contractual cash flows will not be collected. If we do not intend to sell a debt security, but it is probable that we will not collect all amounts due according to the debt’s contractual terms, the OTTI is separated into noncredit and credit components. The noncredit component is recognized in OCI, separately from any temporary impairment. As with temporary impairment, noncredit OTTI does not impact net income or risk-based capital. Any recovery of noncredit OTTI is also recorded to OCI, and results in an increase to equity.
The credit component of OTTI, measured as the difference between amortized cost and the present value of expected
cash flows discounted at the security’s effective interest rate, is recognized in noninterest income and, therefore, reduces net income, as well as our regulatory capital ratios.
Because the available for sale securities portfolio is recorded at fair value, the conclusion as to whether an investment
decline is other-than-temporarily impaired, does not significantly impact our equity position as the amount of temporary adjustment has already been reflected in accumulated other comprehensive income/loss. A recovery in the value of an other-than-temporarily impaired security is recorded as additional interest income over the remaining life of the security.
Given the continued disruption in the financial markets, we may be required to recognize additional credit OTTI losses in future periods with respect to our available for sale investment securities portfolio. The amount and timing of any additional credit OTTI will depend on the decline in the underlying cash flows of the securities.
63
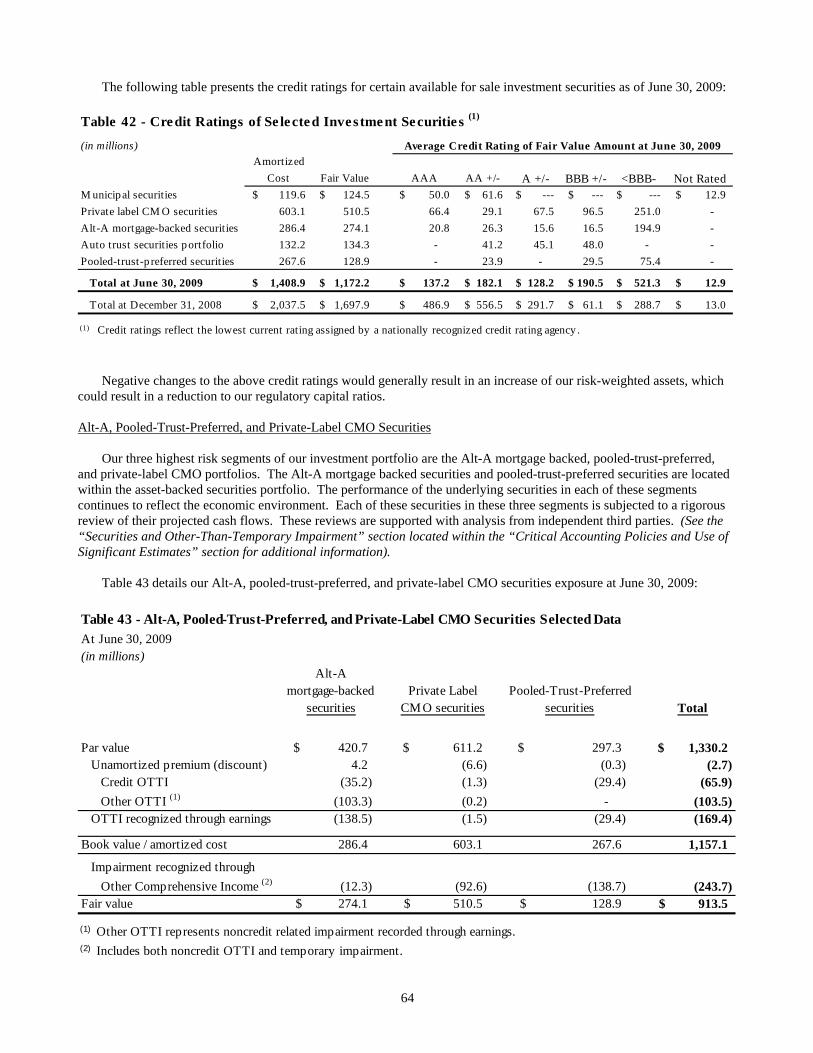
The following table presents the credit ratings for certain available for sale investment securities as of June 30, 2009:
Table 42 - Cre dit Ratings of Se le cte d Investme nt Se curitie s (1)
(in millions)Amortized
Cost Fair Value AAA AA +/- A +/- BBB +/- <BBB- Not RatedM unicipal securities 119.6$ 124.5$ 50.0$ 61.6$ ---$ ---$ ---$ 12.9$ Private label CM O securities 603.1 510.5 66.4 29.1 67.5 96.5 251.0 - Alt-A mortgage-backed securities 286.4 274.1 20.8 26.3 15.6 16.5 194.9 - Auto trust securities p ortfolio 132.2 134.3 - 41.2 45.1 48.0 - - Pooled-trust-p referred securities 267.6 128.9 - 23.9 - 29.5 75.4 -
Total at June 30, 2009 1,408.9$ 1,172.2$ 137.2$ 182.1$ 128.2$ 190.5$ 521.3$ 12.9$
Total at December 31, 2008 2,037.5$ 1,697.9$ 486.9$ 556.5$ 291.7$ 61.1$ 288.7$ 13.0$
(1) Credit ratings reflect the lowest current rating assigned by a nationally recognized credit rating agency .
Average Credit Rating of Fair Value Amount at June 30, 2009
Negative changes to the above credit ratings would generally result in an increase of our risk-weighted assets, which could result in a reduction to our regulatory capital ratios.
Alt-A, Pooled-Trust-Preferred, and Private-Label CMO Securities
Our three highest risk segments of our investment portfolio are the Alt-A mortgage backed, pooled-trust-preferred,
and private-label CMO portfolios. The Alt-A mortgage backed securities and pooled-trust-preferred securities are located within the asset-backed securities portfolio. The performance of the underlying securities in each of these segments continues to reflect the economic environment. Each of these securities in these three segments is subjected to a rigorous review of their projected cash flows. These reviews are supported with analysis from independent third parties. (See the “Securities and Other-Than-Temporary Impairment” section located within the “Critical Accounting Policies and Use of Significant Estimates” section for additional information).
Table 43 details our Alt-A, pooled-trust-preferred, and private-label CMO securities exposure at June 30, 2009:
Table 43 - Alt-A, Pooled-Trust-Preferred, and Private-Label CMO Securities Selected DataAt June 30, 2009(in millions)
Alt-Amortgage-backed Private Label Pooled-Trust-Preferred
securities CM O securities securities Total
Par value 420.7$ 611.2$ 297.3$ 1,330.2$ Unamortized premium (discount) 4.2 (6.6) (0.3) (2.7)
Credit OTTI (35.2) (1.3) (29.4) (65.9) Other OTTI (1) (103.3) (0.2) - (103.5)
OTTI recognized through earnings (138.5) (1.5) (29.4) (169.4)
Book value / amortized cost 286.4 603.1 267.6 1,157.1
Impairment recognized throughOther Comprehensive Income (2) (12.3) (92.6) (138.7) (243.7)
Fair value 274.1$ 510.5$ 128.9$ 913.5$
(1)
(2) Includes both noncredit OTTI and temporary impairment.Other OTTI represents noncredit related impairment recorded through earnings.
64

As shown in the above table, the securities in the Alt-A, pooled-trust-preferred, and private-label CMO securities portfolios had a fair value that was $243.7 million less than their book value (net of impairment) at June 30, 2009, resulting from increased liquidity spreads and extended duration. We consider the $243.7 million of impairment to be temporary, as we believe that it is probable that all contractual cash flows will be collected on the related securities and we intend to hold these securities until recovery. The subsequent recovery on this temporary impairment will be recorded in OCI. In addition, we recorded $103.5 million of noncredit related impairment on securities through earnings. These are securities for which we don't have the intent to hold until recovery. The subsequent recovery of this OTTI will be recorded to interest income over the remaining life of the securities. During the first six-month period of 2009, we recognized OTTI of $7.4 million within the Alt-A securities portfolio, $14.9 million within the pooled-trust-preferred securities portfolio, and $1.3 million within the private-label CMO securities. (See “Critical Accounting Policies and Use of Significant Estimates” for additional information).
The following table summarizes the relevant characteristics of our pooled-trust-preferred securities portfolio. Each of
the securities is part of a pool of issuers and each support a more senior tranche of securities except for the I-Pre TSL II security that is the most senior class. (See “Critical Accounting Policies and Use of Significant Estimates” for additional information regarding our pooled-trust-preferred securities portfolio).
Table 44 - Trust Preferred Securities Data(in thousands, as of June 30, 2009) Actual
Deferrals Expectedand Defaults
# of Defaults as a % ofLowest Issuers Currently as a % of Remaining
Book Fair Unrealized Credit Performing/ Original Performing ExcessDeal Name Value Value Gain/(Loss) Rating(2) Remaining(3) Collateral Collateral Subordination(4)
Alesco II(1) 37,320$ 12,236$ (25,084)$ CC 36/44 18.8 % 19.4 % - %Alesco IV(1) 14,696 4,000 (10,696) CC 44/54 23.6 25.6 - ICONS 20,000 11,444 (8,556) BBB 29/30 3.0 14.1 54.9 I-Pre TSL II 36,863 23,917 (12,946) AA 29/29 - 13.8 73.2 MM Comm II 24,773 18,084 (6,689) BBB 6/8 3.9 10.9 8.8 MM Comm III 12,045 6,116 (5,928) B 12/12 1.9 36.3 1.3 Pre TSL IX(1) 4,533 1,635 (2,898) CC 41/49 17.1 20.9 - Pre TSL X(1) 14,919 5,381 (9,539) CC 44/58 23.0 15.2 - Pre TSL XI 25,000 10,170 (14,830) CC 57/65 13.6 18.0 6.8 Pre TSL XIII 27,530 11,100 (16,430) CC 57/65 14.8 18.5 0.3 Reg Diversified(1) 7,487 7,487 - CC 34/45 24.3 24.1 - Soloso(1) 11,436 3,452 (7,984) CC 61/71 11.2 24.0 - Tropic III 31,000 13,842 (17,159) B 38/46 17.5 20.0 27.1 Total 267,602$ 128,864$ (138,738)$
(1) Security was determined to have other-than-temporary impairment. The book value is net of recorded credit impairment.
(3) Includes both banks and/or insurance companies.
(2) For purposes of comparability, the lowest credit rating expressed is equivalent to Fitch ratings even where lowest rating is based on another nationally recognized credit rating agency.
(4) Excess subordination percentage represents the additional defaults in excess of both current and projected defaults that the CDO can absorb before the bond experiences credit impairment. Excess subordinated percentage is calculated by (a) determining what percentage of defaults a deal can experience before the bond has credit impairment, and (b) subtracting from this default breakage percentage both total current and expected future default percentages.
65

Market Risk
Market risk represents the risk of loss due to changes in market values of assets and liabilities. We incur market risk in the normal course of business through exposures to market interest rates, foreign exchange rates, equity prices, credit spreads, and expected lease residual values. We have identified two primary sources of market risk: interest rate risk and price risk. Interest rate risk is our primary market risk.
Interest Rate Risk
Interest rate risk is the risk to earnings and value arising from changes in market interest rates. Interest rate risk arises from timing differences in the repricings and maturities of interest bearing assets and liabilities (reprice risk), changes in the expected maturities of assets and liabilities arising from embedded options, such as borrowers’ ability to prepay residential mortgage loans at any time and depositors’ ability to terminate certificates of deposit before maturity (option risk), changes in the shape of the yield curve whereby interest rates increase or decrease in a non-parallel fashion (yield curve risk), and changes in spread relationships between different yield curves, such as U.S. Treasuries and London Interbank Offered Rate (LIBOR) (basis risk).
“Asset sensitive position” refers to an increase in short-term interest rates that is expected to generate higher net interest income, as rates earned on our interest-earning assets would reprice upward more quickly than rates paid on our interest-bearing liabilities. Conversely, “liability sensitive position” refers to an increase in short-term interest rates that is expected to generate lower net interest income, as rates paid on our interest-bearing liabilities would reprice upward more quickly than rates earned on our interest-earning assets. INCOME SIMULATION AND ECONOMIC VALUE OF EQUITY ANALYSIS
Interest rate risk measurement is performed monthly. Two broad approaches to modeling interest rate risk are used:
income simulation and economic value analysis. An income simulation analysis is used to measure the sensitivity of forecasted net interest income to changes in market rates over a one-year time period. Although bank owned life insurance and automobile operating lease assets are classified as noninterest earning assets, and the income from these assets is in noninterest income, these portfolios are included in the interest sensitivity analysis because both have attributes similar to fixed-rate interest earning assets. Economic value of equity (EVE) analysis is used to measure the sensitivity of the values of period-end assets and liabilities to changes in market interest rates. EVE serves as a complement to income simulation modeling as it provides risk exposure estimates for time periods beyond the one-year time period simulation.
The simulations for evaluating short-term interest rate risk exposure are scenarios that model gradual “+/-100” and “+/-200” basis point parallel shifts in market interest rates over the next 12-month period beyond the interest rate change implied by the current yield curve. We assumed that market interest rates would not fall below 0% over the next 12-month period for the scenarios that used the “-100” and “-200” basis point parallel shift in market interest rates. The following table shows the results of the scenarios as of June 30, 2009, and December 31, 2008. All of the positions were within the board of directors’ policy limits.
Table 45 - Net Interest Income at Risk
Basis point change scenario -200 -100 +100 +200
Board policy limits -4.0% -2.0% -2.0% -4.0%
June 30, 2009 -1.5% -1.2% +0.8% +1.8%
December 31, 2008 -0.3% -0.9% +0.6% +1.1%
Net Interest Income at Risk (%)
The net interest income at risk reported as of June 30, 2009, for the “+200” basis points scenario shows a change to a higher near-term asset sensitive position compared with December 31, 2008, reflecting actions taken by us to improve our liquidity position. The primary factors contributing to the change include:
• 2.9% incremental liability sensitivity reflecting the execution of $4.3 billion receive fixed interest rates swaps
66

during the first six-month period of 2009 primarily to offset the impact of actual and anticipated reductions in fixed rate assets.
• 1.7% incremental asset sensitivity reflecting the decrease in floating rate debt and an increase in net free funds.
• 1.3% incremental asset sensitivity reflecting the sale of municipal securities, the securitization and sale of automobile loans, and the sale of residential mortgage loans, slightly offset by an increase in other securities.
• 1.1% incremental asset sensitivity reflecting the anticipated slow down in fixed-rate loan originations due to customer preferences for variable-rate loans.
• 0.6% incremental liability sensitivity reflecting the purchase of securities to maintain a higher liquidity position.
The primary simulations for EVE at risk assume immediate “+/-100” and “+/-200” basis point parallel shifts in market
interest rates beyond the interest rate change implied by the current yield curve. The following table outlines the June 30, 2009, results compared with December 31, 2008. All of the positions were within the board of directors’ policy limits. Table 46 - Economic Value of Equity at Risk
Basis point change scenario -200 -100 +100 +200
Board policy limits -12.0% -5.0% -5.0% -12.0%
June 30, 2009 +0.6% +0.6% -1.8% -4.5%
December 31, 2008 -3.4% -1.0% -2.6% -7.2%
Economic Value of Equity at Risk (%)
The EVE at risk reported as of June 30, 2009, for the “+200” basis points scenario shows a change to a lower long-term liability sensitive position compared with December 31, 2008, reflecting actions taken by us to improve our liquidity position and improvements made in modeling assumptions around deposit pricing and mortgage asset prepayments. The primary factors contributing to the change include:
• 3.3% incremental asset sensitivity reflecting the improvements made in modeling assumptions regarding deposit pricing and mortgage asset prepayments.
• 2.2% incremental asset sensitivity reflecting the sale of municipal securities, the securitization of indirect auto loans, and the sale of residential mortgage loans, slightly offset by an increase in other securities.
• 2.0% incremental liability sensitivity reflecting the execution of $4.3 billion receive fixed interest rates swaps during the first six-month period of 2009 primarily to offset the impact of actual and anticipated reductions in fixed rate assets.
• 0.8% incremental liability sensitivity reflecting the purchase of securities to maintain a higher liquidity position.
MORTGAGE SERVICING RIGHTS (MSRs)
At June 30, 2009, we had a total of $219.3 million of capitalized MSRs representing the right to service $16.2 billion in mortgage loans. Of this $219.3 million, $196.9 million was recorded using the fair value method, and $22.4 million was recorded using the amortization method. If we actively engage in hedging, the MSR asset is adjusted using the fair value method. If we do not actively engage in hedging, the MSR asset is adjusted using the amortization method.
MSR fair values are very sensitive to movements in interest rates as expected future net servicing income depends on
the projected outstanding principal balances of the underlying loans, which can be greatly reduced by prepayments. Prepayments usually increase when mortgage interest rates decline and decrease when mortgage interest rates rise. We have employed strategies to reduce the risk of MSR fair value changes or impairment. In addition, we engage a third party to provide improved valuation tools and assistance with our strategies with the objective to decrease the volatility from MSR fair value changes. However, volatile changes in interest rates can diminish the effectiveness of these hedges. We typically report MSR fair value adjustments net of hedge-related trading activity in the mortgage banking income category
67

of noninterest income. Changes in fair value between reporting dates are recorded as an increase or decrease in mortgage banking income.
MSRs recorded using the amortization method generally relate to loans originated with historically low interest rates,
resulting in a lower probability of prepayments and, ultimately, impairment. MSR assets are included in other assets, and are presented in Table 15 and Table 19. (See Note 5 of the Notes to the Unaudited Condensed Consolidated Financial Statements). Price Risk
Price risk represents the risk of loss arising from adverse movements in the prices of financial instruments that are carried at fair value and are subject to fair value accounting. We have price risk from trading securities, securities owned by our broker-dealer subsidiaries, foreign exchange positions, equity investments, investments in securities backed by mortgage loans, and marketable equity securities held by our insurance subsidiaries. We have established loss limits on the trading portfolio, on the amount of foreign exchange exposure that can be maintained, and on the amount of marketable equity securities that can be held by the insurance subsidiaries. EQUITY INVESTMENT PORTFOLIOS
In reviewing our equity investment portfolio, we consider general economic and market conditions, including industries in which private equity merchant banking and community development investments are made, and adverse changes affecting the availability of capital. We determine any impairment based on all of the information available at the time of the assessment. New information or economic developments in the future could result in the recognition of additional impairment.
From time to time, we invest in various investments with equity risk. Such investments include investment funds that
buy and sell publicly traded securities, investment funds that hold securities of private companies, direct equity or venture capital investments in companies (public and private), and direct equity or venture capital interests in private companies in connection with our mezzanine lending activities. These investments are included in “accrued income and other assets” on our consolidated balance sheet. At June 30, 2009, we had a total of $36.4 million of such investments, down from $44.7 million at December 31, 2008. The following table details the components of this change during 2009:
Table 47 - Equity Investment Activity(in thousands)
Balance at New Returns of Balance atDecember 31, 2008 Investments Capital Gain / (Loss) June 30, 2009
Type:Public equity 12,129$ -$ (8,507)$ 2,038$ 5,660$ Private equity 25,951 2,146 (2,198) (1,386) 24,513 Direct investment 6,576 - - (319) 6,257 Total 44,656$ 2,146$ (10,705)$ 333$ 36,430$
Investment decisions that incorporate credit risk require the approval of the independent credit administration function. The degree of initial due diligence and subsequent review is a function of the type, size, and collateral of the investment. Performance is monitored on a regular basis, and reported to the Market Risk Committee. Liquidity Risk
Liquidity risk is the risk of loss due to the possibility that funds may not be available to satisfy current or future commitments resulting from external macro market issues, investor and customer perception of financial strength, and events unrelated to the company such as war, terrorism, or financial institution market specific issues. We manage liquidity risk at both the Bank and at the parent company, Huntington Bancshares Incorporated (HBI).
The overall objective of liquidity risk management is to ensure that we can obtain cost-effective funding to meet current and future obligations under both normal “business as usual” and unanticipated, stressed circumstances. The Risk Management Committee was appointed by the HBI Board Risk Committee to oversee liquidity risk management and
68

establish policies and limits, based upon analyses of the ratio of loans to deposits, the percentage of assets funded with noncore or wholesale funding, net cash capital, liquid assets, and contingency borrowing capacity. In addition, operating guidelines are established to ensure diversification of noncore funding by type, source, and maturity and provide sufficient liquidity to cover 100% of wholesale funds maturing within a six-month period. A contingency funding plan is in place, which includes forecasted sources and uses of funds under various scenarios in order to prepare for unexpected liquidity shortages, including the implications of any credit rating changes and/or other trigger events related to financial ratios, deposit fluctuations, debt issuance capacity, stock performance, or negative news related to us or the banking industry. Liquidity risk is reviewed monthly for the Bank and the parent company, as well as its subsidiaries. In addition, two liquidity subcommittees meet regularly to identify and monitor liquidity positions, provide policy guidance, review funding strategies, and oversee adherence to, and the maintenance of, the contingency funding plan(s). A Contingency Funding Working Group monitors daily cash flow trends, branch activity, unfunded commitments, significant transactions, and parent company subsidiary sources and uses of funds in order to identify areas of concern, and establish specific funding strategies. This group works closely with the Risk Management Committee and the HBI Communication Team in order to identify issues that may require a more proactive communication plan to shareholders, associates, and customers regarding specific events or issues that could have an impact on our liquidity position.
In the normal course of business, in order to better manage liquidity risk, we perform stress tests to determine the effect that a potential downgrade in our credit ratings or other market disruptions could have on liquidity over various time periods. These credit ratings, which are presented in Table 49, have a direct impact on our cost of funds and ability to raise funds under normal, as well as adverse, circumstances. The results of these stress tests indicate that sufficient sources of funds are available to meet our financial obligations and fund our operations for a 12-month period. The stress test scenarios include testing to determine the impact of an interruption to our access to the national markets for funding, significant run-off in core deposits and liquidity triggers inherent in other financial agreements. To compensate for the effect of these assumed liquidity pressures, we consider alternative sources of liquidity over different time periods to project how funding needs would be managed. The specific alternatives for enhancing liquidity include generating client deposits, securitizing or selling loans, selling or maturing of securities, and extending the level or maturity of wholesale borrowings.
Most credit markets in which we participate and rely upon as sources of funding have been significantly disrupted and
highly volatile since mid-2007. Reflecting concern about the stability of the financial markets generally, many lenders reduced, and in some cases, ceased unsecured funding to borrowers, including other financial institutions. Since that time, as a means of maintaining adequate liquidity, we, like many other financial institutions, have relied more heavily on the liquidity and stability present in the secured credit markets since access to unsecured term debt has been restricted. Throughout this period, we continued to extend maturities ensuring that we maintained adequate liquidity in the event the crisis became prolonged. In addition to managing our maturities, we strengthened our overall liquidity position by significantly reducing our noncore funds and wholesale borrowings, and increasing our overall level of liquid assets. Shifting from the net purchasing of overnight federal funds to an excess reserve position at the end of the 2009 first quarter, as well as increasing our level of free securities, has significantly improved our on-hand liquidity. However, we are part of a financial system, and a systemic lack of available credit, a lack of confidence in the financial sector, and increased volatility in the financial markets could materially and adversely affect our liquidity position. Bank Liquidity and Sources of Liquidity
Our primary sources of funding for the Bank are retail and commercial core deposits. Core deposits are comprised of interest bearing and noninterest bearing demand deposits, money market deposits, savings and other domestic time deposits, consumer certificates of deposit both over and under $250,000, and nonconsumer certificates of deposit less than $250,000. Noncore deposits consist of brokered money market deposits and certificates of deposit, foreign time deposits, and other domestic time deposits of $250,000 or more comprised primarily of public fund certificates of deposit more than $250,000.
Core deposits may increase our need for liquidity as certificates of deposit mature or are withdrawn before maturity
and as nonmaturity deposits, such as checking and savings account balances, are withdrawn. Additionally, we are exposed to the risk that customers with large deposit balances will withdraw all or a portion of such deposits as the FDIC establishes certain limits on the amount of insurance coverage provided to depositors (see “Risk Factors” included in Item 1A of our 2008 Form 10-K). To mitigate our uninsured deposit risk, we have joined the Certificate of Deposit Account Registry Service (CDARS), a program that allows customers to invest up to $50 million in certificates of deposit through one participating financial institution, with the entire amount being covered by FDIC insurance.
69

Table 48 - Deposit Composition
(in millions)
By TypeDemand deposits - noninterest bearing 6,169$ 15.8 % 5,887$ 15.1 % 5,477$ 14.4 % 5,135$ 13.7 % 5,253$ 13.8 %Demand deposits - interest bearing 4,842 12.4 4,306 11.0 4,083 10.8 4,052 10.8 4,074 10.7 Money market deposits 6,622 16.9 5,857 15.0 5,182 13.7 5,565 14.8 6,171 16.2 Savings and other domestic deposits 4,859 12.4 5,007 12.8 4,930 13.0 4,903 13.1 5,090 13.4 Core certificates of deposit 12,197 31.1 12,616 32.3 12,856 33.9 12,270 32.7 11,389 29.9
Total core deposits 34,689 88.6 33,673 86.2 32,528 85.8 31,925 85.1 31,977 84.0 Other domestic deposits of $250,000 or more 846 2.2 1,041 2.7 1,328 3.5 1,749 4.7 1,943 5.1 Brokered deposits and negotiable CDs 3,229 8.2 3,848 9.8 3,355 8.8 2,925 7.8 3,101 8.1 Deposits in foreign offices 401 1.0 508 1.3 732 1.9 970 2.4 1,103 2.8
Total deposits 39,165$ 100.0 % 39,070$ 100.0 % 37,943$ 100.0 % 37,569$ 100.0 % 38,124$ 100.0 %
Total core deposits:Commercial 9,738$ 28.1 % 8,934$ 26.5 % 7,971$ 24.5 % 8,208$ 25.7 % 8,668$ 27.1 %Personal 24,951 71.9 24,739 73.5 24,557 75.5 23,717 74.3 23,309 72.9
Total core deposits 34,689$ 100.0 % 33,673$ 100.0 % 32,528$ 100.0 % 31,925$ 100.0 % 31,977$ 100.0 %
2008
March 31, December 31, September 30, June 30,
2009
June 30,
70

During the first six-month period of 2009, we strengthened our liquidity position as our available cash increased $1.3 billion, and our unpledged investment securities increased $1.8 billion. Further, as shown in the table on the previous page, core deposits have increased $2.2 billion from December 31, 2008, resulting in reduced reliance upon our funding lines. In addition, our loan-to-deposit ratio improved to 98% at June 30, 2009, compared with 108% at December 31, 2008.
The Bank has access to the Federal Reserve's discount window and Term Auction Facility (TAF). These borrowings are secured by commercial loans and home equity lines of credit. The Bank is also a member of the Federal Home Loan Bank (FHLB)-Cincinnati, and as such, has access to advances from this facility. These advances are generally secured by residential mortgages, other mortgage-related loans, and available-for-sale securities. Information regarding amounts pledged, for the ability to borrow if necessary, and unused borrowing capacity at both the Federal Reserve and the FHLB-Cincinnati, are outlined in the following table:
June 30, December 31,
(in billions) 2009 2008
Loans and Securities PledgedFederal Reserve Bank 8.3$ 8.4$ FHLB-Cincinnati 9.3 9.2 Total loans and securities pledged 17.6$ 17.6$
8.0$ 9.3$ Total unused borrowing capacity at Federal Reserve Bank and FHLB-Cincinnati
As part of a periodic review conducted by the Federal Reserve, our discount window and TAF borrowing capacity was reduced. The reduction was based on the lowering of the specific percentages of pledged amounts available for borrowing.
We can also obtain funding through other methods including: (a) purchasing federal funds, (b) selling securities under repurchase agreements, (c) the sale or maturity of investment securities, (d) the sale or securitization of loans, (e) the sale of national market certificates of deposit, (f) the relatively shorter-term structure of our commercial loans and automobile loans, and (g) the issuance of common and preferred stock.
During the first six-month period of 2009, we initiated various strategies with the intent of further strengthening our
liquidity position, as well as reducing the size of our balance sheet to, among other objectives, provide additional support to our TCE ratio (see “Capital” discussion). Our actions taken during the first six-month period of 2009 included: (a) $2.2 billion core deposit growth, (b) $1.0 billion automobile loan securitization, (c) $0.6 billion sale of municipal securities, (d) $0.6 billion debt issuance as part of the TLGP, and (e) $0.2 billion mortgage loan sale. The proceeds from these actions were used primarily to pay down wholesale borrowings.
At June 30, 2009, we believe that the Bank had sufficient liquidity to meet its cash flow obligations for the foreseeable
future. Parent Company Liquidity
The parent company’s funding requirements consist primarily of dividends to shareholders, debt service, income taxes, operating expenses, funding of non-bank subsidiaries, repurchases of our stock, and acquisitions. The parent company obtains funding to meet obligations from dividends received from direct subsidiaries, net taxes collected from subsidiaries included in the federal consolidated tax return, fees for services provided to subsidiaries, and the issuance of debt securities.
At June 30, 2009, the parent company had $1.5 billion in cash or cash equivalents, compared with $1.1 billion at
December 31, 2008. During the first six-month period of 2009, the following actions taken during the first six-month period of 2009 affected the parent company’s liquidity position: (a) the issuance of 103.5 million shares of new common stock resulting in aggregate gross proceeds of $372.6 million; (b) the completion of two separate “discretionary equity
71

issuance” programs, which allowed us to take advantage of market opportunities to issue an additional 56.9 million shares of common stock worth $195.9 million; (c) a contribution of $250 million of additional capital made by the parent company to the Bank, which increased the Bank’s regulatory capital levels above its already “well-capitalized” levels; and (d) the redemption of a portion of our junior subordinated debt at a total cost of $92.3 million.
Based on the current dividend of $0.01 per common share, cash demands required for common stock dividends are
estimated to be approximately $6 million per quarter. We recognize the importance of the dividend to our shareholders. While our overall capital and liquidity positions are strong, extreme and economic market deterioration and the changing regulatory environment drove the difficult but prudent decision to reduce the dividend during the 2009 first quarter to $0.01 per common share. This proactive measure will enable us to build capital and strengthen our balance sheet. Table 54 provides additional detail regarding quarterly dividends declared per common share.
During 2008, we issued an aggregate $569 million of Series A Non-cumulative Perpetual Convertible Preferred Stock.
The Series A Preferred Stock will pay, as declared by our board of directors, dividends in cash at a rate of 8.50% per annum, payable quarterly (see Note 8 of the Notes to Unaudited Condensed Consolidated Financial Statements). During the first six-month period of 2009, we entered into agreements with various institutional investors exchanging shares of our common stock for shares of the Series A Preferred Stock held by them (see “Capital” discussion). In the aggregate, these exchanges are anticipated to reduce our total dividend cash requirements (common, Series A Preferred Stock, and Series B Preferred Stock) by an estimated $4.0 million per quarter. Considering these exchanges and the current dividend, cash demands required for Series A Preferred Stock are estimated to be approximately $7.7 million per quarter.
Also during 2008, we received $1.4 billion of equity capital by issuing 1.4 million shares of Series B Preferred Stock
to the U.S. Department of Treasury as a result of our participation in the TARP voluntary CPP. The Series B Preferred Stock will pay cumulative dividends at a rate of 5% per year for the first five years and 9% per year thereafter, resulting in quarterly cash demands of approximately $18 million through 2012, and $32 million thereafter (see Note 8 of the Notes to the Unaudited Condensed Consolidated Financial Statements for additional information regarding the Series B Preferred Stock issuance).
Based on a regulatory dividend limitation, the Bank could not have declared and paid a dividend to the parent
company at June 30, 2009, without regulatory approval. We do not anticipate that the Bank will request regulatory approval to pay dividends in the near future as we continue to build Bank regulatory capital above our already “well-capitalized” level. To help meet any additional liquidity needs, we have an open-ended, automatic shelf registration statement filed and effective with the SEC, which permits us to issue an unspecified amount of debt or equity securities.
With the exception of the common and preferred dividends previously discussed, the parent company does not have any significant cash demands. There are no maturities of parent company obligations until 2013, when a debt maturity of $50 million is payable.
Considering the factors discussed above, and other analyses that we have performed, we believe the parent company has sufficient liquidity to meet its cash flow obligations for the foreseeable future. Credit Ratings
Credit ratings provided by the three major credit rating agencies are an important component of our liquidity profile. Among other factors, the credit ratings are based on financial strength, credit quality and concentrations in the loan portfolio, the level and volatility of earnings, capital adequacy, the quality of management, the liquidity of the balance sheet, the availability of a significant base of core deposits, and our ability to access a broad array of wholesale funding sources. Adverse changes in these factors could result in a negative change in credit ratings and impact our ability to raise funds at a reasonable cost in the capital markets. In addition, certain financial on- and off-balance sheet arrangements contain credit rating triggers that could increase funding needs if a negative rating change occurs. Other arrangements that could be impacted by credit rating changes include, but are not limited to, letter of credit commitments for marketable securities, interest rate swap collateral agreements, and certain asset securitization transactions contain credit rating provisions or could otherwise be impacted by credit rating changes.
72
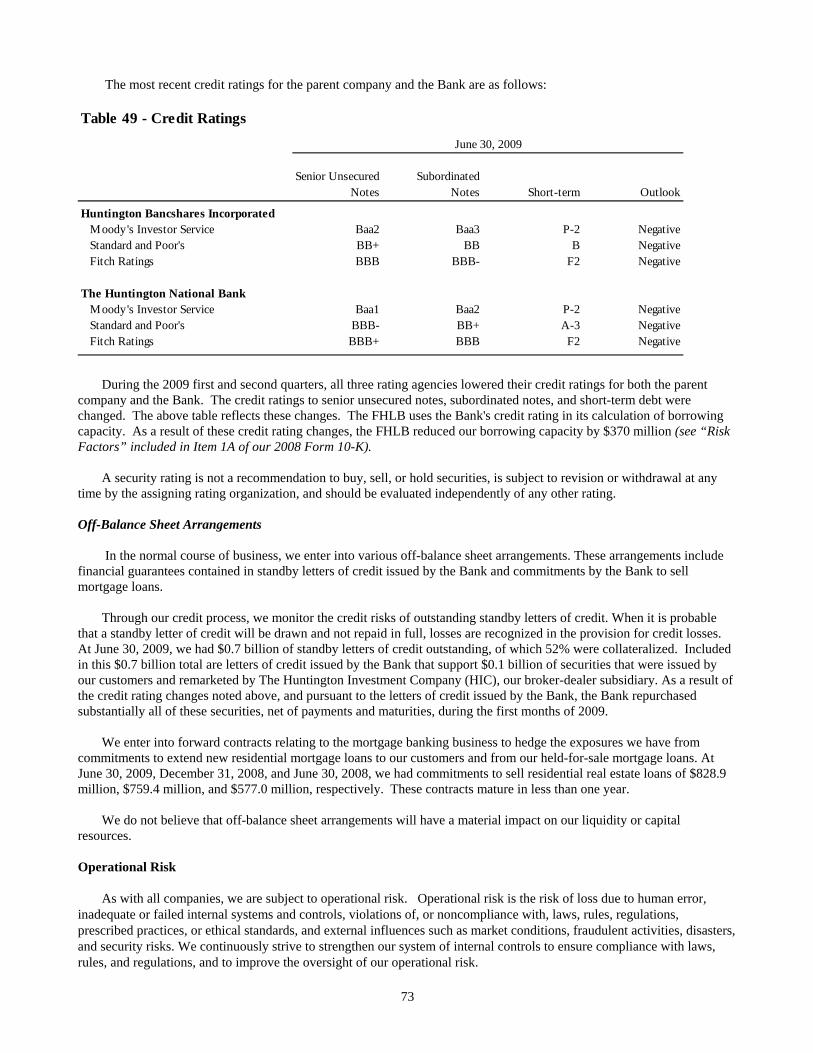
73
The most recent credit ratings for the parent company and the Bank are as follows: Table 49 - Credit Ratings
Huntington Bancshares IncorporatedMoody's Investor Service Baa2 Baa3 P-2 NegativeStandard and Poor's BB+ BB B NegativeFitch Ratings BBB BBB- F2 Negative
The Huntington National BankMoody's Investor Service Baa1 Baa2 P-2 NegativeStandard and Poor's BBB- BB+ A-3 NegativeFitch Ratings BBB+ BBB F2 Negative
June 30, 2009
Senior Unsecured Notes
Subordinated Notes Short-term Outlook
During the 2009 first and second quarters, all three rating agencies lowered their credit ratings for both the parent company and the Bank. The credit ratings to senior unsecured notes, subordinated notes, and short-term debt were changed. The above table reflects these changes. The FHLB uses the Bank's credit rating in its calculation of borrowing capacity. As a result of these credit rating changes, the FHLB reduced our borrowing capacity by $370 million (see “Risk Factors” included in Item 1A of our 2008 Form 10-K).
A security rating is not a recommendation to buy, sell, or hold securities, is subject to revision or withdrawal at any time by the assigning rating organization, and should be evaluated independently of any other rating. Off-Balance Sheet Arrangements
In the normal course of business, we enter into various off-balance sheet arrangements. These arrangements include financial guarantees contained in standby letters of credit issued by the Bank and commitments by the Bank to sell mortgage loans.
Through our credit process, we monitor the credit risks of outstanding standby letters of credit. When it is probable that a standby letter of credit will be drawn and not repaid in full, losses are recognized in the provision for credit losses. At June 30, 2009, we had $0.7 billion of standby letters of credit outstanding, of which 52% were collateralized. Included in this $0.7 billion total are letters of credit issued by the Bank that support $0.1 billion of securities that were issued by our customers and remarketed by The Huntington Investment Company (HIC), our broker-dealer subsidiary. As a result of the credit rating changes noted above, and pursuant to the letters of credit issued by the Bank, the Bank repurchased substantially all of these securities, net of payments and maturities, during the first months of 2009.
We enter into forward contracts relating to the mortgage banking business to hedge the exposures we have from commitments to extend new residential mortgage loans to our customers and from our held-for-sale mortgage loans. At June 30, 2009, December 31, 2008, and June 30, 2008, we had commitments to sell residential real estate loans of $828.9 million, $759.4 million, and $577.0 million, respectively. These contracts mature in less than one year.
We do not believe that off-balance sheet arrangements will have a material impact on our liquidity or capital
resources. Operational Risk
As with all companies, we are subject to operational risk. Operational risk is the risk of loss due to human error, inadequate or failed internal systems and controls, violations of, or noncompliance with, laws, rules, regulations, prescribed practices, or ethical standards, and external influences such as market conditions, fraudulent activities, disasters, and security risks. We continuously strive to strengthen our system of internal controls to ensure compliance with laws, rules, and regulations, and to improve the oversight of our operational risk.

74
The goal of this framework is to implement effective operational risk techniques and strategies, minimize operational
losses, and strengthen our overall performance. Capital / Capital Adequacy (This section should be read in conjunction with Significant Item 3.)
Capital is managed both at the Bank and on a consolidated basis. Capital levels are maintained based on regulatory capital requirements and the economic capital required to support credit, market, liquidity, and operational risks inherent in our business, and to provide the flexibility needed for future growth and new business opportunities. Shareholders’ equity totaled $5.2 billion at June 30, 2009. This represented a decrease compared with $7.2 billion at December 31, 2008, primarily reflecting the negative impact of the $2.6 billion goodwill impairment charge, partially offset by the issuance of 160.5 million new shares of common stock worth $0.5 billion and the exchange of a portion of our Series A Preferred Stock for 41.1 million shares of our common stock worth $0.2 billion (see ”Tier 1 Common Equity” section below). Tier 1 Common Equity
During the first six-month period of 2009, a key priority was to strengthen our capital position in order to withstand
potential future credit losses should the economic environment continue to deteriorate. During the 2009 second quarter, the Federal Reserve conducted a Supervisory Capital Assessment Program (SCAP) on the country’s 19 largest bank holding companies to determine the amount of capital required to absorb losses that could arise under “baseline” and “more adverse” economic scenarios. The SCAP results determined that a Tier 1 common capital risk based ratio of at least 4.0% would be needed. A total of 10 of the 19 bank holding companies were directed to increase their capital levels to meet this 4.0% threshold.
While we were not one of these 19 institutions required to conduct a forward-looking capital assessment, or “stress test”, we believed it important that we have an equivalent relative amount of capital to meet a 4% Tier 1 common capital risk based ratio. We conducted an internal analysis designed to emulate the SCAP “more adverse” economic scenario modeled by the Federal Reserve, and based on that analysis, estimated that additional Tier 1 common equity was needed.
The following table summarizes the primary activity during the first six-month period of 2009 to increase Tier 1 common equity:
Table 50 - Tier 1 Common Equity Activity
OtherRetained
(all figures in millions) Shares Amount Earnings Total
First Quarter - 2009Franklin restructuring - -$ 159.9$ 159.9$ Conversion of preferred stock 24.6 114.1 - 114.1 Other (1) - - 47.1 47.1
Total 2009 First Quarter 24.6 114.1 207.0 321.1
Discretionary equity issuance #1 38.5 117.6 - 117.6 Discretionary equity issuance #2 18.5 74.4 - 74.4 Conversion of preferred stock 16.5 92.3 - 92.3 Common stock offering 103.5 356.4 356.4 Gain on cash tender offer of certain trust
preferred securities - - 43.8 43.8 Gain related to Visa stock - - 20.4 20.4
Total 2009 Second Quarter 177.0 640.7 64.2 704.9
Total 2009 year-to-date 201.6 754.8$ 271.2$ 1,026.0$ (1) Primarily represents improvement in other comprehensive income.
Common Stock
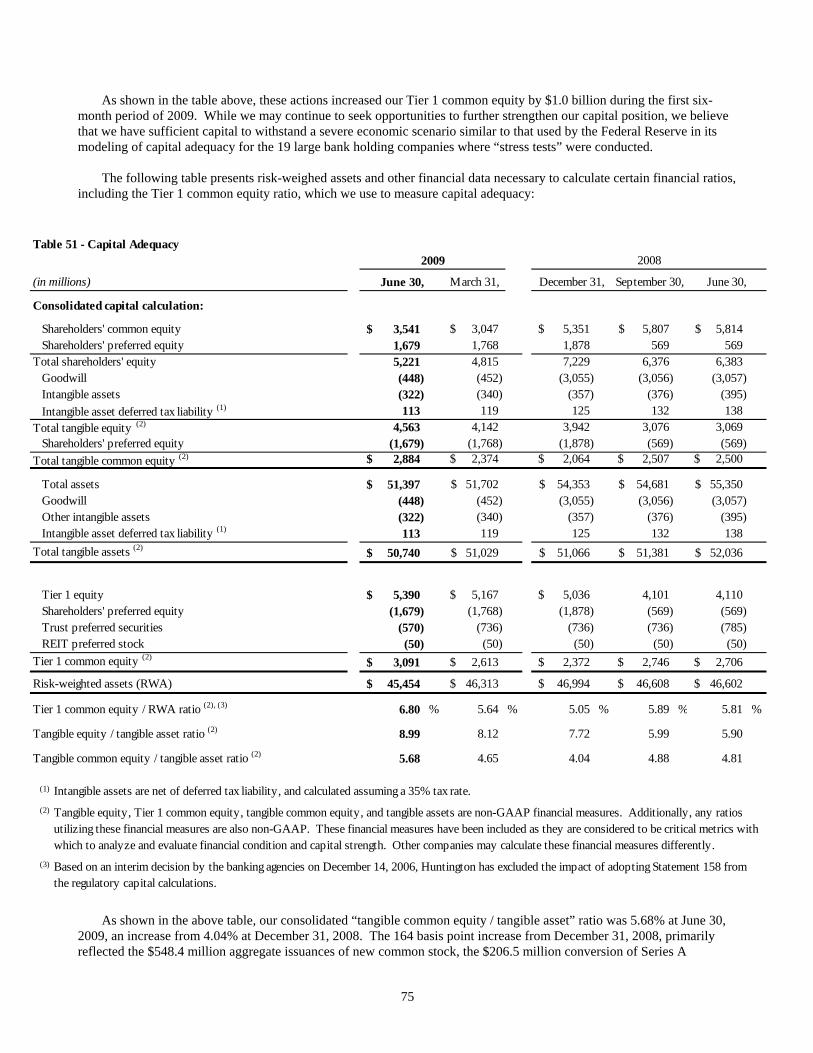
75
As shown in the table above, these actions increased our Tier 1 common equity by $1.0 billion during the first six-
month period of 2009. While we may continue to seek opportunities to further strengthen our capital position, we believe that we have sufficient capital to withstand a severe economic scenario similar to that used by the Federal Reserve in its modeling of capital adequacy for the 19 large bank holding companies where “stress tests” were conducted.
The following table presents risk-weighed assets and other financial data necessary to calculate certain financial ratios,
including the Tier 1 common equity ratio, which we use to measure capital adequacy:
Table 51 - Capital Adequacy
(in millions) March 31, Consolidated capital calculation:
Shareholders' common equity 3,541$ 3,047$ 5,351$ 5,807$ 5,814$ Shareholders' preferred equity 1,679 1,768 1,878 569 569
Total shareholders' equity 5,221 4,815 7,229 6,376 6,383 Goodwill (448) (452) (3,055) (3,056) (3,057) Intangible assets (322) (340) (357) (376) (395) Intangible asset deferred tax liability (1) 113 119 125 132 138
Total tangible equity (2) 4,563 4,142 3,942 3,076 3,069 Shareholders' preferred equity (1,679) (1,768) (1,878) (569) (569)
Total tangible common equity (2) 2,884$ 2,374$ 2,064$ 2,507$ 2,500$
Total assets 51,397$ 51,702$ 54,353$ 54,681$ 55,350$ Goodwill (448) (452) (3,055) (3,056) (3,057) Other intangible assets (322) (340) (357) (376) (395) Intangible asset deferred tax liability (1) 113 119 125 132 138
Total tangible assets (2) 50,740$ 51,029$ 51,066$ 51,381$ 52,036$
Tier 1 equity 5,390$ 5,167$ 5,036$ 4,101 4,110 Shareholders' preferred equity (1,679) (1,768) (1,878) (569) (569) Trust preferred securities (570) (736) (736) (736) (785) REIT preferred stock (50) (50) (50) (50) (50)
Tier 1 common equity (2) 3,091$ 2,613$ 2,372$ 2,746$ 2,706$
45,454$ 46,313$ 46,994$ 46,608$ 46,602$
Tier 1 common equity / RWA ratio (2), (3) 6.80 % 5.64 % 5.05 % 5.89 % 5.81 %
Tangible equity / tangible asset ratio (2) 8.99 8.12 7.72 5.99 5.90
Tangible common equity / tangible asset ratio (2) 5.68 4.65 4.04 4.88 4.81
(1) Intangible assets are net of deferred tax liability, and calculated assuming a 35% tax rate.(2)
(3)
2009 2008
June 30, December 31, September 30, June 30,
Risk-weighted assets (RWA)
Tangible equity, Tier 1 common equity, tangible common equity, and tangible assets are non-GAAP financial measures. Additionally, any ratios utilizing these financial measures are also non-GAAP. These financial measures have been included as they are considered to be critical metrics with which to analyze and evaluate financial condition and capital strength. Other companies may calculate these financial measures differently.
Based on an interim decision by the banking agencies on December 14, 2006, Huntington has excluded the impact of adopting Statement 158 from the regulatory capital calculations.
As shown in the above table, our consolidated “tangible common equity / tangible asset” ratio was 5.68% at June 30,
2009, an increase from 4.04% at December 31, 2008. The 164 basis point increase from December 31, 2008, primarily reflected the $548.4 million aggregate issuances of new common stock, the $206.5 million conversion of Series A

76
Preferred Stock to common stock, as well as the reducing of our balance sheet through the securitizing of automobile loans, and the selling of a portion of our municipal securities portfolio, as well as mortgage loans. Regulatory Capital
Regulatory capital ratios are the primary metrics used by regulators in assessing the “safety and soundness” of banks.
We intend to maintain both the parent company’s and the Bank’s risk-based capital ratios at levels at which each would be considered “well-capitalized” by regulators. The Bank is primarily supervised and regulated by the Office of the Comptroller of the Currency (OCC), which establishes regulatory capital guidelines for banks similar to those established for bank holding companies by the Federal Reserve Board.
Regulatory capital primarily consists of Tier 1 capital and Tier 2 capital. The sum of Tier 1 capital and Tier 2 capital
equals total risk-based capital. The following table reflects changes and activity to the various components utilized in the calculation our consolidated Tier 1, Tier 2, and total risk-based capital amounts during 2009.
Table 52 - Regulatory Capital Activity(in millions)
Shareholder Disallowed DisallowedCommon Preferred Qualifying Goodwill & Other Tier 1
Equity (1) Equity Core Capital (2) Intangible assets Adjustments (net) Capital
Balance at 12/31/08 5,676.1$ 1,877.7$ 788.0$ (3,286.8)$ (19.4)$ 5,035.6$
Cumulative effect accounting changes 3.5 --- --- --- --- 3.5 Earnings (2,558.3) --- --- 2,558.3 --- --- Changes to disallowed adjustments --- --- --- 71.1 (4.9) 66.2 Dividends (61.5) --- --- --- --- (61.5) Issuance of common stock 552.5 --- --- --- --- 552.5 Conversion of preferred stock 206.5 (206.5) --- --- --- --- Amortization of preferred discount (7.9) 7.9 --- --- --- --- Redemption of junior subordinated debt --- --- (166.3) --- --- (166.3) Disallowance of deferred tax assets --- --- --- --- (42.5) (42.5) Change in minority interest --- --- (0.5) --- --- (0.5) Other 2.4 0.3 --- --- --- 2.7
Balance at 06/30/09 3,813.3$ 1,679.4$ 621.2$ (657.4)$ (66.8)$ 5,389.7$
QualifyingSubordinated Tier 1 Capital Total risk-based
Qualifying ACL Debt Tier 2 Capital (from above) capital
Balance at 12/31/08 591.8$ 907.2$ 1,499.0$ 5,035.6$ 6,534.6$
Change in qualifying subordinated debt --- (78.2) (78.2) --- (78.2) Change in qualifying ACL (14.6) --- (14.6) --- (14.6) Changes to Tier 1 Capital (see above) --- --- --- 354.1 354.1
Balance at 06/30/09 577.2$ 829.0$ 1,406.2$ 5,389.7$ 6,795.9$
(1) Excludes Other Comprehensive Income (OCI) and M inority Interest.(2) Includes M inority Interest

77
The following table presents our regulatory capital ratios at both the consolidated and Bank levels for the past five
quarters:
Table 53 - Regulatory Capital Ratios
March 31,
45,454$ 46,313$ 46,994$ 46,608$ 46,602$ 45,137 45,951 46,477 45,883 46,346
10.62 % 9.67 % 9.82 % 7.99 % 7.88 %6.46 5.95 5.99 6.36 6.37
11.86 11.16 10.72 8.80 8.827.14 6.79 6.44 7.01 7.10
14.95 14.28 13.91 12.03 12.0511.35 11.00 10.71 10.25 10.32
(1)
Tier 1 leverage ratio (1) Consolidated Bank
Based on an interim decision by the banking agencies on December 14, 2006, Huntington has excluded the impact of adopting Statement 158 from the regulatory capital calculations.
Tier 1 risk-based capital / RWA ratio (1) Consolidated Bank
Total risk-based capital / RWA ratio (1) Consolidated Bank
Risk-weighted assets (RWA) (in millions) Consolidated Bank
2009 2008
June 30, December 31, September 30, June 30,
Both consolidated and bank risk-weighted assets declined compared with March 31, 2009, primarily reflecting a
decline in period-ending total loan balances. At June 30, 2009, the parent company had Tier 1 and Total risk-based capital in excess of the minimum level
required to be considered “well-capitalized” of $2.7 billion and $2.3 billion, respectively. During the 2009 second quarter, the parent company contributed $250 million of additional capital to the Bank. The contribution increased the Bank’s regulatory capital levels above its already “well-capitalized” levels.
At June 30, 2009, the Bank had Tier 1 and Total risk-based capital in excess of the minimum level required to be
considered “well-capitalized” of $0.5 billion and $0.6 billion, respectively. Preferred Stock / TARP
In 2008, we issued an aggregate $569 million of Series A Preferred Stock. The Series A Preferred Stock is nonvoting
and may be convertible at any time, at the option of the holder, into 83.668 shares of our common stock. Shares of Series A Preferred Stock held by investors is not a component of Tier 1 common equity. As previously mentioned (see “Tier 1 Common Equity” section), we entered into agreements with various institutional investors exchanging 41.1 million shares of our common stock for 0.2 million shares of the Series A Preferred Stock held by them during the first six-month period of 2009. These transactions increased common equity by $206.5 million, while preferred equity decreased by the same amount.
During 2008, we received $1.4 billion of equity capital by issuing 1.4 million shares of Series B Preferred Stock to
the U.S. Department of Treasury, and a ten-year warrant to purchase up to 23.6 million shares of our common stock, par value $0.01 per share, at an exercise price of $8.90 per share. The proceeds received were allocated to the preferred stock and additional paid-in-capital. The resulting discount on the preferred stock will be amortized, resulting in additional dilution to our earnings per share. The Series B Preferred Stock is not a component of Tier 1 common equity. (See Note 8 of the Notes to the Unaudited Condensed Consolidated Financial Statements for additional information regarding the Series B Preferred Stock issuance).

78
Other Capital Matters To accelerate the building of capital, we reduced our quarterly common stock dividend to $0.01 per common share,
effective with the dividend paid April 1, 2009.
On February 18, 2009, our 2006 Repurchase Program was terminated. Additionally, as a condition to participate in the TARP, we may not repurchase any shares without prior approval from the Department of Treasury. No shares were repurchased during the first six months of 2009.
Table 54 - Quarterly Common Stock Summary
(in thousands, except per share amounts)
Common stock price, per shareHigh (1) 6.180$ 8.000$ 11.650$ 13.500$ 11.750$ Low (1) 1.550 1.000 5.260 4.370 4.940 Close 4.180 1.660 7.660 7.990 5.770 Average closing price 3.727 2.733 8.276 7.510 8.783
Dividends, per shareCash dividends declared per common share 0.0100$ 0.0100$ 0.1325$ 0.1325$ 0.1325$
Common shares outstandingAverage - basic 459,246 366,919 366,054 366,124 366,206 Average - diluted (2) 459,246 366,919 366,054 367,361 367,234 Ending 568,741 390,682 366,057 366,069 366,197
Book value per share 6.23$ 7.80$ 14.62$ 15.86$ 15.88$ Tangible book value per share 5.07 6.08 5.64 6.85 6.83
(1) High and low stock prices are intra-day quotes obtained from NASDAQ.(2)
Third
For all periods presented, the impact of the convertible preferred stock issued in April of 2008 was excluded from the diluted share calculations. They were excluded because the results would have been higher than basic earnings per common share (anti-dilutive) for the periods.
2008
Second
2009
FirstSecond Fourth

79
BUSINESS SEGMENT DISCUSSION This section reviews financial performance from a business segment perspective and should be read in conjunction
with the Discussion of Results of Operations, Note 17 of the Notes to Consolidated Financial Statements, and other sections for a full understanding of our consolidated financial performance. We have five major business segments: Retail and Business Banking, Commercial Banking, Commercial Real Estate, Auto Finance and Dealer Services (AFDS), and the Private Financial Group (PFG). A Treasury/Other function includes other unallocated assets, liabilities, revenue, and expense. For each of our business segments, we expect the combination of our business model and exceptional service to provide a competitive advantage that supports revenue and earnings growth. Our business model emphasizes the delivery of a complete set of banking products and services offered by larger banks, but distinguished by local decision-making regarding the pricing and offering of these products.
Periodically, organizational changes result in the transfer of specific components from one business segment to
another business segment. During the first six-month period of 2009, the Mezzanine Lending component was transferred to the Commercial Real Estate business segment from the PFG business segment.
Funds Transfer Pricing We use a centralized funds transfer pricing (FTP) methodology to attribute appropriate net interest income to the
business segments. The Treasury/Other business segment charges (credits) an internal cost of funds for assets held in (or pays for funding provided by) each business segment. The FTP rate is based on prevailing market interest rates for comparable duration assets (or liabilities). Deposits of an indeterminate maturity receive an FTP credit based on vintage-based pool rates. Other assets, liabilities, and capital are charged (credited) with a four-year moving average FTP rate. The intent of the FTP methodology is to eliminate all interest rate risk from the business segments by providing matched duration funding of assets and liabilities. The result is to centralize the financial impact, management, and reporting of interest rate and liquidity risk in the Treasury/Other function where it can be monitored and managed. The denominator in net interest margin calculation has been modified to add the amount of net funds provided by each business segment for all periods presented. Fee Sharing
Our business segments operate in cooperation to provide products and services to our customers. Revenue is recorded in the business segment responsible for the related product or service. Fee sharing is recorded to allocate portions of such revenue to other business segments involved in selling to or providing service to customers. The most significant revenues for which fee sharing is recorded relate to customer derivatives and brokerage services, which are recorded by PFG and shared primarily with Retail and Business Banking and Commercial Banking. Results of operations for the business segments reflect these fee sharing allocations. Expense Allocation
Business segment results are determined based upon our management reporting system, which assigns balance sheet and income statement items to each of the business segments. The process is designed around our organizational and management structure and, accordingly, the results derived are not necessarily comparable with similar information published by other financial institutions. For comparability purposes, the amounts in all periods were based on business segments and methodologies in effect at June 30, 2009.
The management accounting process used to develop the business segment reporting utilized various estimates and allocation methodologies to measure the performance of the business segments. To determine the financial performance for each business segment, we allocated a portion of the provision for credit losses and certain noninterest expenses related to shared services and corporate overhead. The provision for credit losses was allocated based on the level of each business segment’s respective ACL. Noninterest expenses were allocated based on various methodologies, including volume of activity and the number of full-time equivalent employees.

80
Treasury/Other The Treasury / Other function includes revenue and expense related to assets, liabilities, and equity not directly
assigned or allocated to one of the five business segments. Assets include investment securities, bank owned life insurance, and the loans and OREO properties acquired through the 2009 first quarter Franklin restructuring. The financial impact associated with our FTP methodology, as described above, is also included.
Net interest income includes the impact of administering our investment securities portfolios and the net impact of derivatives used to hedge interest rate sensitivity. Noninterest income includes miscellaneous fee income not allocated to other business segments such as bank owned life insurance income, and any investment securities and trading assets gains or losses. Noninterest expense includes certain corporate administrative, merger, and other miscellaneous expenses not allocated to other business segments. The provision for income taxes for the business segments is calculated at a statutory 35% tax rate, though our overall effective tax rate is lower. As a result, Treasury/Other reflects a credit for income taxes representing the difference between the lower actual effective tax rate and the statutory tax rate used to allocate income taxes to the business segments.
Net Income by Business Segment
The company reported net loss of $2,558.3 million in the first six-month period of 2009. This compared with net income of $228.4 million in the first six-month period of 2008. The breakdown of net income by business segment for the first six-month periods of 2009 and 2008 is presented in the following table:
Table 55 - Net Income (Loss) by Business Segment - 2009 First Six Months vs . 2008 First Six Months
(in thousands) 2009 2008 Amount
Retail and Business Banking 90,046$ 122,288$ (32,242)$ Commercial Banking (19,723) 67,362 (87,085) Commercial Real Estate (119,856) 12,704 (132,559) AFDS (9,510) 14,350 (23,860) PFG 4,059 25,666 (21,607) Treasury /Other 70,500 (13,950) 84,450 Unallocated goodwill impairment (1) (2,573,818) --- (2,573,818)
Total net (loss) income (2,558,302)$ 228,420$ (2,786,722)$ (1) Represents the 2009 first quarter impairment charge, net of tax, associated with the former Regional Banking
business segment. The allocation of this charge to the newly created business segments is not p ractical. See the "Goodwill" section located within the "Critical Accounting Polices and Use of Significant Estimates" section for additional information.
ChangeS ix Months Ended June 30,

81
Average Loans/Leases and Deposits by Business Segment The breakdown of total average loans and leases and total average deposits by business segment for the first six-month
period of 2009 is presented in the following table:
Table 56 - Average Loans/Leases and Deposits by Business Segment - 2009 First Six Months
Regional and Commercial Commercial Treasury /Business Banking Banking Real Estate AFDS PFG Other TOTAL
(in millions)Average Loans/Leases
Commercial and industrial 3,368$ 7,230$ 524$ 1,195$ 903$ 312$ 13,532$ Commercial real estate 1,677 1,059 6,663 63 191 - 9,653
Total commercial 5,045 8,289 7,187 1,258 1,094 312 23,185
Automobile loans and leases - - - 3,820 - - 3,820 Home equity 6,874 43 - - 660 32 7,609 Residential mortgage 3,758 1 1 2 658 214 4,634 Other consumer 458 7 - 184 34 - 683
Total consumer 11,090 51 1 4,006 1,352 246 16,746 Total loans 16,135$ 8,340$ 7,188$ 5,264$ 2,446$ 558$ 39,931$
Average DepositsDemand deposits - noninterest bearing 3,298$ 1,840$ 178$ 60$ 333$ 75$ 5,784$ Demand deposits - interest bearing 3,371 658 28 - 252 3 4,312 M oney market deposits 3,549 1,185 154 3 1,085 (1) 5,975 Savings and other domestic time depos 4,656 319 (2) - 63 - 5,036 Core certificates of deposit 12,188 67 9 - 379 - 12,643
Total core deposits 27,062 4,069 367 63 2,112 77 33,750 Other deposits 447 1,415 41 5 133 3,074 5,115
Total deposits 27,509$ 5,484$ 408$ 68$ 2,245$ 3,151$ 38,865$

82
Retail and Business Banking (This section should be read in conjunction with Significant Items 1, 4, 5 and the “Goodwill” discussion located within the “Critical Accounting Policies and Use of Significant Estimates” section.) Objectives, Strategies, and Priorities
Our Retail and Business Banking segment provides traditional banking products and services to consumer and small business customers located in our 11 operating regions within the six states of Ohio, Michigan, Pennsylvania, Indiana, West Virginia, and Kentucky. It provides these services through a banking network of over 600 branches, and almost 1,400 ATMs, along with internet and telephone banking channels. It also provides certain services on a limited basis outside of these six states, including mortgage banking and small business administration (SBA) lending. Retail products and services include home equity loans and lines of credit, first mortgage loans, direct installment loans, small business loans, personal and business deposit products, as well as sales of investment and insurance services. At June 30, 2009, Retail and Business Banking accounted for 41% and 73% of consolidated loans and leases and deposits, respectively.
The Retail and Business Banking strategy is to focus on building a deeper relationship with our customers by providing an exceptional service experience. This focus on service involves continued investments in state-of-the-art platform technology in our branches, award-winning retail and business websites for our customers, extensive development of associates, and internal processes that empower our local bankers to serve our customers better.
2009 First Six Months versus 2008 First Six Months
Table 5 7 - Key Performance Indicators for Retail and B us ines s B ank ing
(in th o u s a n d s u n le s s o th e rw is e n o te d )
N et in t erest in co m e 5 1 0 ,6 8 2$ 4 7 7 ,7 0 9$ 3 2 ,9 7 3$ 6 .9 %P ro v isio n fo r credit lo sses 2 1 9 ,0 7 6 9 3 ,6 9 1 1 2 5 ,3 8 5 N .M .N o n in t erest in co m e 2 5 3 ,9 9 8 2 0 4 ,0 6 2 4 9 ,9 3 6 2 4 .5
N o n in t erest ex p en se 4 0 7 ,0 7 2 3 9 9 ,9 4 5 7 ,1 2 7 1 .8 (Ben efit ) P ro v isio n fo r in co m e t ax es 4 8 ,4 8 6 6 5 ,8 4 7 (1 7 ,3 6 1 ) (2 6 .4 )
N et ( lo ss) in co m e 9 0 ,0 4 6$ 1 2 2 ,2 8 8$ (3 2 ,2 4 2 )$ (2 6 .4 ) %
T o t al av erage asset s ( in m illio n s) 1 8 ,1 8 5$ 1 9 ,0 5 2$ (8 6 7 )$ (4 .6 ) %
T o t al av erage lo an s/leases ( in m illio n s) 1 6 ,1 3 5 1 6 ,9 9 9 (8 6 4 ) (5 .1 )
T o t al av erage dep o sit s ( in m illio n s) 2 7 ,5 0 9 2 5 ,8 1 0 1 ,6 9 9 6 .6
N et in t erest m argin 3 .7 1 % 3 .7 2 % (0 .0 1 ) % (0 .3 )
N et ch arge-o ffs (N CO s) 1 6 5 ,0 9 5$ 5 9 ,1 7 2$ 1 0 5 ,9 2 3$ N .M .
N CO s as a % o f av erage lo an s an d leases 2 .0 5 % 0 .7 0 % 1 .4 % N .M .
Ret urn o n av erage equit y 1 4 .0 2 5 .4 (1 1 .4 ) (4 4 .9 )
Ret ail ban k in g # D D A h o useh o lds (eo p ) 9 0 5 ,3 1 4 8 9 7 ,0 2 3 8 ,2 9 1 0 .9
Ret ail ban k in g # n ew relat io n sh ip s 9 0 -day cro ss-sell (a vera g e) 2 .5 1 2 .4 6 0 .0 5 2 .0
Busin ess ban k in g # busin ess D D A relat io n sh ip s (eo p ) 1 0 9 ,5 9 8 1 0 5 ,3 3 7 4 ,2 6 1 4 .0
Busin ess ban k in g # n ew relat io n sh ip s 9 0 -day cro ss-sell (a vera g e) 2 .1 6 2 .0 8 0 .0 8 3 .8
M o rt gage ban k in g clo sed lo an v o lum e ( in m illio n s) 3 ,1 3 3$ 2 ,3 6 9$ 7 6 4$ 3 2 .2 %
eo p - E n d o f P er io d.
N .M ., n o t a m ean in gful v alue.
Ch an ge - Y T D 2 0 0 9 v s 2 0 0 82 0 0 8
Jun e 3 0 ,Six M o n t h s E n ded
2 0 0 9 A m o un t P ercen t

83
Retail and Business Banking reported a net income of $90.0 million in the first six-month period of 2009, compared with net income of $122.3 million in the first six-month period of 2008.
The most notable factors contributing to this $32.2 million decrease was a $125.4 million increase to the provision
for credit losses reflecting a $105.9 million increase in NCOs, as well as reserve building necessary due to the continued economic weaknesses in our markets. The overall economic slowdown impacted our commercial loan portfolio as reflected in the increases in commercial NCOs and NALs. Of the increase in NCOs, 76% was within our commercial loan portfolio, and the majority of these NCOs were associated with smaller projects. NALs increased $228 million, and as with NCOs, were largely driven by commercial NALs. Our consumer loan portfolio NCOs and NALs increased $25 million and $48 million, respectively. This increase was driven primarily by the higher unemployment rate, particularly in our Michigan and northern Ohio markets.
Net interest income increased $33.0 million, or 7%, reflecting (a) the reduction in market interest rates over the last 12 months, as well as a $1.9 billion increase in average consumer deposit balances, (b) decreases in our funding costs for nonearning assets, and (c) an increase in allocated equity, resulting in a higher funding credit. Partially offsetting these increases were (a) a $19.4 million reduction in loan net interest income reflecting significant declines in both the LIBOR and prime interest rates, (b) a 134 basis point decline in the commercial deposit net interest margin, a result of the significant decline in the 30 day LIBOR rate, and (c) a $12.7 million reduction related to MSR hedging.
The $864 million decline in total average loans and leases primarily reflected a $791 million decrease in average
residential mortgages, resulting from the impact of loan sales. During the first six-month period of 2009, mortgage originations increased 24%, compared with the first six-month period of 2008. We expect production levels for the remainder of the year to stabilize or be slightly lower than the first six-month period of 2009. However, as is our practice, the expectation is that the majority of our fixed-rate originations will be sold in the secondary market.
Average total deposits increased $1.7 billion, or 7%, compared with the first six-month period of 2008. Consumer
deposits increased $1.9 million, or 9%, primarily reflecting increased marketing efforts for consumer time deposit accounts in the 2008 fourth quarter. Additionally, the number of DDA households increased 1% from the first six-month period of 2008, primarily reflecting new sales and marketing initiatives for DDA deposit accounts. We anticipate continued consumer deposit growth for the remainder of 2009, specifically in our consumer DDA and non-maturity deposits.
Noninterest income increased $49.9 million, or 25%, primarily reflecting a $60.4 million increase in mortgage
banking income. The increase to mortgage banking income primarily reflected a $39.3 million increase in origination and secondary marketing fees, as well as a $28.0 million improvement in the net hedging impact of MSRs. This increase was partially offset by an $11.0 million decline in service charges on deposit accounts compared with the first six-month period of 2008, primarily reflecting lower consumer nonsufficient funds and overdraft fees, partially offset by higher commercial service charges. During the current economic environment, customers have improved the management of their deposit balances, thus resulting in fewer overdraft instances.
Noninterest expense increased $7.1 million. This increase reflected a $21.2 million increase in FDIC insurance
expense, and a $6.6 million increase in credit quality related expenses, such as legal and collection costs. We expect that collection costs will remain at higher levels throughout 2009 due to the current economic weaknesses. The increase was partially offset by a $16.7 million decrease in personnel expense resulting from a 5% reduction in full-time equivalent employees; as well as a reduction in, or elimination of, incentive plan payouts. Also, several other expense categories, such as travel expense and marketing expense, declined as a result of several expense reduction initiatives implemented since the 2008 first quarter.

84
Commercial Banking Objectives, Strategies, and Priorities
The Commercial Banking segment provides a variety of banking products and services to customers within our primary banking markets who generally have larger credit exposures and sales revenues compared with our Retail and Business Banking customers. Commercial Banking products include commercial loans, international trade, cash management, leasing, interest rate protection products, capital market alternatives, 401(k) plans, and mezzanine investment capabilities. Our Commercial Banking team also serves customers that specialize in equipment leasing, as well as serving the commercial banking needs of government entities, not-for-profit organizations, and large corporations. Commercial bankers personally deliver these products and services by developing leads through community involvement, referrals from other professionals, and targeted prospect calling.
The Commercial Banking strategy is to focus on building a deeper relationship with our customers by providing an exceptional service experience. This focus on service requires continued investments in technology for our product offerings, websites for our customers, extensive development of associates, and internal processes that empower our local bankers to serve our customers better.
2009 First Six Months versus 2008 First Six Months
Table 58 - Key Performance Indicators for Commercial Banking
(in tho us ands unle s s o the rwis e no te d)
Net interest income 153,725$ 159,716$ (5,991)$ (3.8) %Provision for credit losses 158,781 25,401 133,380 N.M.Noninterest income 44,849 48,936 (4,087) (8.4) Noninterest expense 70,136 79,617 (9,481) (11.9) (Benefit ) Provision for income taxes (10,620) 36,272 (46,892) N.M.
Net (loss) income (19,723)$ 67,362$ (87,085)$ N.M. %
T otal average assets (in m illions) 8,664$ 8,682$ (18)$ (0.2) %
T otal average loans/leases (in m illions) 8,340 8,143 197 2.4
T otal average deposit s (in m illions) 5,484 6,412 (928) (14.5)
Net interest margin 3.74 % 3.90 % (0.16) % (4.1)
Net charge-offs (NCOs) 131,914$ 15,556$ 116,358$ N.M.
NCOs as a % of average loans and leases 3.16 % 0.38 % 2.8 % N.M.
Return on average equity (4.9) 17.4 (22.3) N.M.
N.M., not a meaningful value.
Six Months EndedJune 30, Change - YT D 2009 vs 2008
2009 2008 Amount Percent
Commercial Banking reported a net loss of $19.7 million in the first six-month period of 2009, compared with net
income of $67.4 million in the first six-month period of 2008. The decline was primarily due to a $133.4 million increase to the provision for credit losses, reflecting a $116.4 million increase in NCOs as well as reserve building necessary due to the continued economic weaknesses in our markets. This increase was partially offset by a $46.9 million reduction in provision for income taxes expense, reflecting the net loss during the first six-month period of 2009. As NALs continued to grow, we continued to build our loan loss reserves. Additionally, during the 2009 second quarter, we reviewed every “noncriticized” commercial relationship with an aggregate exposure of over $500,000. (See “Commercial Loan Portfolio Reviews and Actions” section located within the “Commercial Credit” section for additional information). This loan level review will allow us to proactively mitigate risk going forward. Although we expect our commercial portfolio will remain under pressure, we believe that the risks in our loan portfolios are manageable.

85
Net interest income decreased $6.0 million, or 4%, reflecting a 16 basis point decline in net interest margin, and a $1.6
billion decline in average interest bearing liabilities. The net interest margin decline primarily reflected a 23 basis point reduction in loan net interest margin, resulting from a significant decline in the LIBOR rate, as well as a $108 million, or 80%, increase in nonaccrual loans. The decline in average interest bearing liabilities primarily reflected lower money-market account and automated funds investment balances. Partially offsetting these declines was a $141 million increase in average earning assets, and a $454 million increase in demand deposit average balances.
The $179 million increase in total average commercial loans and leases primarily reflected higher utilization of existing lines and lower payoffs in our existing portfolio.
Average total deposits declined $928 million, or 15%, compared with the first six-month period of 2008. The decline was driven by balance decreases on deposit products that had customer rates directly linked to overall market interest rates that decreased quickly and significantly in the 2008 fourth quarter. Also, customers withdrew balances due to concern over FDIC insurance coverage.
Noninterest income decreased $4.1 million, or 8%, primarily reflecting (a) a $4.5 million decrease in derivative income due to a decline in demand for interest rate swap products, (b) a $0.6 million decrease in mezzanine income, and (c) a $1.3 million decline in operating lease income, as effective with the 2009 second quarter, lease originations were recorded as direct finance leases rather than operating leases. These decreases were partially offset by a $2.4 million increase in service charges on deposit accounts, reflecting pricing initiatives implemented during the 2009 first six-month period.
Noninterest expense declined $9.5 million, reflecting a decrease in personnel expense resulting from a 21% reduction
in full-time equivalent employees; as well as a decrease in various other expense categories as a result of several expense reduction initiatives implemented since the 2008 first quarter. These decreases were partially offset by a $3.5 million increase in FDIC insurance expense, and a $2.9 million increase in credit quality related expenses, such as legal and collection costs. We expect that collection costs will remain at higher levels throughout 2009 due to the current economic weaknesses.

86
Commercial Real Estate Objectives, Strategies, and Priorities
Our Commercial Real Estate segment serves professional real estate developers or other customers with real estate project financing needs within our primary banking markets. Commercial Real Estate products and services include CRE loans, cash management, interest rate protection products, and capital market alternatives. Commercial real estate bankers personally deliver these products and services by: (a) relationships with developers in our footprint who are recognized as the most experienced, well-managed and well-capitalized, and are capable of operating in all phases of the real estate cycle (“top-tier developers”), (b) leads through community involvement, and (c) referrals from other professionals.
The Commercial Real Estate strategy is to focus on building a deeper relationship with top-tier developers within our geographic footprint. Our local expertise of the customers, market, and products, gives us a competitive advantage and supports revenue growth in our footprint. Our strategy is to continue to expand the relationships of our current customer base and to attract new, profitable business with top-tier developers in our footprint.
2009 First Six Months versus 2008 First Six Months
Table 59 - Key Performance Indicators for Commercial Real Estate
(in tho us ands unles s o therwis e no ted)
Net interest income 90,126$ 86,368$ 3,758$ 4.4 %Provision for credit losses 262,932 60,911 202,021 N.M.Noninterest income 1,105 8,265 (7,160) (86.6)
Noninterest expense 12,693 14,178 (1,485) (10.5) (Benefit) Provision for income taxes (64,538) 6,840 (71,378) N.M.
Net (loss) income (119,856)$ 12,704$ (132,560)$ N.M. %
Total average assets (in millions) 7,114$ 6,349$ 765$ 12.0 %
Total average loans/leases (in millions) 7,188 6,322 866 13.7
Total average deposits (in millions) 408 553 (145) (26.2)
Net interest margin 2.54 % 2.75 % (0.21) % (7.6)
Net charge-offs (NCOs) 212,978$ 11,064$ 201,914$ N.M.
NCOs as a % of average loans and leases 5.93 % 0.35 % 5.6 % N.M.
Return on average equity (47.5) 6.0 (53.5) N.M.
N.M., not a meaningful value.
Six Months EndedJune 30, Change - YTD 2009 vs 2008
2009 2008 Amount Percent
Commercial Real Estate reported a net loss of $119.9 million in the first six-month period of 2009, compared with net income of $12.7 million in the first six-month period of 2008. The decline primarily reflected a $202.0 million increase to the provision for credit losses reflecting a $201.9 million increase in NCOs, as well as continued reserve building necessary due to the continued economic weaknesses in our markets. Commercial NCOs for first six-month period of 2009 included a $15 million loss associated with a CRE retail project located in our Cleveland market. The impact to net income resulting from the increase in the provision for credit losses was partially offset by a $71.4 million reduction in provision for income taxes expense reflecting the net loss during the first six-month period of 2009. Additionally, during the second quarter, we reviewed every “noncriticized” commercial relationship with an aggregate exposure of over $500,000. (See “Commercial Loan Portfolio Reviews and Actions” section located within the “Commercial Credit” section for additional information). This loan level review allows us to proactively mitigate risk going forward. Although we expect our CRE portfolio will remain under pressure, we believe that the risks in our loan portfolios are manageable.

87
Net interest income increased $3.8 million, or 4%, reflecting a $0.9 billion, or 14%, increase in average earning assets,
partially offset by a 21 basis point decrease in net interest margin. The decrease in net interest margin was driven primarily by a 24 basis point reduction in loan net interest income, reflecting a significant decline in the LIBOR rate, as well as a significant increase in NALs, which increased to $747 million at June 30, 2009. Also contributing to the decrease, deposit net interest income declined $1.2 million primarily reflecting the significant decline in the 30 day LIBOR rate. Partially offsetting the decline in the net interest margin on CRE loans was an increase in ALLL and allocated equity, resulting in an increase in our funding credit on these noninterest bearing items.
The $865 million increase in total average commercial loans and leases reflected higher utilization of existing lines
and lower payoffs due to the lack of permanent financing in the secondary market. Noninterest income decreased $7.2 million, or 87%, primarily reflecting (a) $3.9 million of interest rate swap losses
associated with our Cleveland region due to a deterioration in the underlying credit, and (b) a $3.7 million decrease in derivative income due to a decline in demand for interest rate swap products.
Noninterest expense decreased $1.5 million, or 10%, primarily reflecting a decrease in personnel expense resulting
from a 16% reduction in full-time equivalent employees. Also, various other expense categories declined as a result of several expense reduction initiatives implemented since the 2008 first quarter, specifically travel and business development expenses.

88
Auto Finance and Dealer Services (AFDS) (This section should be read in conjunction with the “Automotive Industry” discussion located within the “Commercial Credit” section.) Objectives, Strategies, and Priorities
Our AFDS business segment provides a variety of banking products and services to more than 2,000 automotive dealerships within our primary banking markets. During the first quarter of 2009, AFDS discontinued lending activities in Arizona, Florida, Tennessee, Texas, and Virginia. Also, all lease origination activities were discontinued during the 2008 fourth quarter. AFDS finances the purchase of automobiles by customers at the automotive dealerships; finances dealerships’ new and used vehicle inventories, land, buildings, and other real estate owned by the dealership; finances dealership working capital needs; and provides other banking services to the automotive dealerships and their owners. Competition from the financing divisions of automobile manufacturers and from other financial institutions is intense. AFDS’ production opportunities are directly impacted by the general automotive sales business, including programs initiated by manufacturers to enhance and increase sales directly. We have been in this line of business for over 50 years.
The AFDS strategy focuses on developing relationships with the dealership through its finance department, general manager, and owner. An underwriter who understands each local region makes loan decisions, though we prioritize maintaining pricing discipline over market share.
2009 First Six Months versus 2008 First Six Months
Table 60 - Key Performance Indicators for Auto Finance and Dealer Services (AFDS)
(in tho us ands un le s s o the rwis e no te d)
Net in t erest incom e 71,153$ 74,888$ (3 ,735)$ (5.0) %P rovision for credit losses 57,105 24,417 32,688 N.M.Nonint erest incom e 27,065 27,476 (411) (1.5) Nonint erest expense 55,744 55,870 (126) (0.2) (Benefit ) P rovision for income t axes (5 ,121) 7,727 (12,848) N.M.
Net (loss) income (9 ,510)$ 14,350$ (23,860)$ N.M. %
T otal average asset s (in m illions) 5,406$ 5,668$ (262)$ (4.6) %
T otal average loans/leases (in m illions) 5,264 5,801 (537) (9.3)
Net in t erest margin 2.58 % 2.55 % 0.03 % 1.2
Net charge-offs (NCOs) 34,236$ 24,083$ 10,153$ 42.2
NCOs as a % of average loans and leases 1.30 % 0.83 % 0.47 % 56.6
Return on average equity (7.6) 14.9 (22.5) N.M.
Autom obile loans product ion (in m illions) 679$ 1,352$ (672)$ (49.7)
N.M., not a meaningful value.
Change - YT D 2009 vs 2008
2009 Amount P ercent2008
Six Months EndedJune 30,
AFDS reported a net loss of $9.5 million in the first six-month period of 2009, compared with net income of $14.4
million in the first six-month period of 2008. This $23.9 million decline primarily resulted from a $32.7 million increase to the provision for credit losses reflecting elevated NCOs during the 2009 period, as well as reserve building necessary due to continued economic and automobile industry related weaknesses. At June 30, 2009, the ALLL as a percentage of total loans and leases increased to 1.36% compared with 0.61% at June 30, 2008. Total NCOs as a percentage of loans increased to 1.30% for the first six-month period of 2009 compared with 0.83% for the first six-month period of 2008 and, on an absolute basis, automobile loan and lease charge-offs were $32.6 million compared with $22.7 million in the comparable

89
year-ago period. Although total NCOs increased from the comparable year-ago period, automobile loan and lease NCOs in the 2009 second quarter declined $3.5 million, or 19%, compared with the 2009 first quarter. Also, delinquency levels declined for the second quarter in a row. Performance of this portfolio on both an absolute and relative basis continues to be consistent with our views regarding the underlying quality of the portfolio and we continue to expect flat to improved performance through the rest of 2009.
Net interest income decreased $3.7 million, or 5%, to $71.2 million reflecting a $0.5 billion decrease in average loans
and leases. The decline in average loans and leases was primarily due to the run-off in the automobile lease portfolio. Average commercial loans increased $0.1 billion, or 14%, while average automobile loans decreased $0.1 billion. We remain committed to providing commercial lending to our retail dealer customers, as well as pursuing new business development opportunities that have resulted from the tightened credit markets. The decline in average automobile loan balances reflected lower originations, primarily due to the significant decline in industry-wide new and used vehicle sales, and the sale of $1.0 billion of loans at the end of March 2009. Originations totaled $679 million for the first six-month period of 2009 ($551 million from our primary banking markets) compared with $1,352 million for the first six-month period of 2008 ($892 million from our primary banking markets).
Noninterest income (excluding operating lease income of $26.3 million in the first six-month period of 2009, and $15.2 million in the first six-month period of 2008) declined $11.6 million, and included a $5.9 million nonrecurring loss from the previously mentioned $1.0 billion sale of loans in the first six-month period of 2009. In addition, fee income from the sale of Huntington Plus loans declined as this program was discontinued in the 2008 fourth quarter while fees associated with customers exercising their purchase option on leased vehicles and servicing income were also down due to declines in the underlying lease and loan portfolios.
Noninterest expense (excluding operating lease expense of $22.3 million in the first six-month period of 2009, and
$11.7 million in the first six-month period of 2008) decreased $10.8 million. This decline reflected: (a) $5.4 million in losses from sales of vehicles returned at the end of their lease terms due to an improvement in used vehicle values along with a decline in the number of vehicles being returned, (b) $1.3 million decline in residual value insurance costs as all residual value insurance policies were terminated in the 2008 fourth quarter, (c) $1.5 million decline in personnel costs. The declines in personnel costs, as well as other expense categories, reflected various expense reduction initiatives that began in the second half of 2008 and continued into 2009. A majority of these reduction initiatives involved discontinuing lending activities outside of our primary banking markets.
Net automobile operating lease income increased $0.5 million and consisted of an $11.2 million increase in noninterest income, offset by a $10.6 million increase in noninterest expense. These increases primarily reflected the increase in average operating lease balances from $133 million for the first six-month period of 2008 to $231 million for the first six-month period of 2009, which resulted from all automobile lease originations since the 2007 fourth quarter being recorded as operating leases. However, the automobile operating lease portfolio and related income will decline in the future as all lease origination activities were discontinued during the 2008 fourth quarter.

90
Private Financial Group (PFG) (This section should be read in conjunction with Significant Items 1, 5, and the “Goodwill” discussion located within the “Critical Accounting Policies and Use of Significant Estimates” section.) Objectives, Strategies, and Priorities
PFG provides products and services designed to meet the needs of higher net worth customers. Revenue results from the sale of trust, asset management, investment advisory, brokerage, insurance, and private banking products and services including credit and lending activities. PFG also focuses on financial solutions for corporate and institutional customers that include investment banking, sales and trading of securities, and interest rate risk management products. To serve high net worth customers, we use a unique distribution model that employs a single, unified sales force to deliver products and services mainly through Retail and Business Banking distribution channels. PFG provides investment management and custodial services to the Huntington Funds, which consists of 32 proprietary mutual funds, including 12 variable annuity funds. Huntington Funds assets represented 25% of the approximately $12.3 billion total assets under management at June 30, 2009. The Huntington Investment Company (HIC) offers brokerage and investment advisory services to both Regional Banking and PFG customers through a combination of licensed investment sales representatives and licensed personal bankers. PFG’s Insurance group provides a complete array of insurance products including individual life insurance products ranging from basic term-life insurance to estate planning, group life and health insurance, property and casualty insurance, mortgage title insurance, and reinsurance for payment protection products.
PFG’s primary goals are to consistently increase assets under management by offering innovative products and services that are responsive to our clients’ changing financial needs, and to grow deposits through increased focus and improved cross-selling efforts. To grow managed assets, the HIC sales team has been utilized as the primary distribution source for trust and investment management. 2009 First Six Months versus 2008 First Six Months
Table 6 1 - Key Performance Indicators for Private Financial Group (PFG)
(in t h o u s a n d s u n le s s o th e rw is e n o te d )
N et in t erest in co m e 4 8 ,3 7 3$ 3 9 ,4 0 5$ 8 ,9 6 8$ 2 2 .8 %P ro v isio n fo r credit lo sses 1 9 ,3 9 6 5 ,0 4 3 1 4 ,3 5 3 N .M .N o n in t erest in co m e 1 2 5 ,4 9 8 1 3 1 ,7 4 8 (6 ,2 5 0 ) (4 .7 ) N o n in t erest ex p en se ex cludin g go o dwill im p airm en t 1 1 9 ,3 3 6 1 2 6 ,6 2 4 (7 ,2 8 8 ) (5 .8 ) Go o dwill im p airm en t 2 8 ,8 9 5 - 2 8 ,8 9 5 - - -
P ro v isio n fo r in co m e t ax es 2 ,1 8 5 1 3 ,8 2 0 (1 1 ,6 3 5 ) (8 4 .2 )
N et in co m e 4 ,0 5 9$ 2 5 ,6 6 6$ (2 1 ,6 0 7 )$ (8 4 .2 ) %
T o t al av erage asset s ( in m illio n s) 3 ,3 5 1$ 2 ,9 7 6$ 3 7 5$ 1 2 .6 %
T o t al av erage lo an s/leases ( in m illio n s) 2 ,4 4 6 2 ,2 7 7 1 6 9 7 .4
N et in t erest m argin 3 .7 9 % 3 .3 7 % 0 .4 2 % 1 2 .5
N et ch arge-o ffs (N CO s) 1 3 ,4 2 0$ 3 ,8 2 1$ 9 ,5 9 9$ N .M .
N CO s as a % o f av erage lo an s an d leases 1 .1 0 % 0 .3 4 % 0 .7 6 % N .M .
Ret urn o n av erage equit y 3 .3 2 4 .5 (2 1 .2 ) (8 6 .5 )
N o n in t erest in co m e sh ared wit h o t h er
busin ess segm en t s (1 ) 1 9 .6$ 2 8 .8$ (9 .2 )$ (3 1 .9 )
T o t al asset s un der m an agem en t ( in b illio n s)- eo p 1 2 .3 1 4 .6 (2 .3 ) (1 5 .8 ) T o t al t rust asset s ( in b illio n s)- eo p 4 4 .9 5 2 .7 (7 .8 ) (1 4 .8 ) %
eo p - E n d o f P erio d.
N .M ., n o t a m ean in gful v alue.
(1 ) A m o un t is n o t in cluded in n o n in t erest in co m e rep o rt ed abo v e.
2 0 0 8
Six M o n t h s E n dedJun e 3 0 ,
2 0 0 9 A m o un t P ercen tCh an ge - Y T D 2 0 0 9 v s 2 0 0 8

91
PFG reported net income of $4.1 million in the first six-month period of 2009, compared with net income of $25.7
million in the first six-month period of 2008. The decline reflected the $28.9 million goodwill impairment charge recorded during the first six-month period of 2009 (see “Goodwill” discussion located within the “Critical Accounting Policies and Use of Significant Estimates” for additional information). After adjusting for the goodwill impairment charge, and the related tax impact, PFG’s net income decreased $2.9 million.
Net interest income increased $9.0 million, or 23%, primarily as a result of a 42 basis point improvement in the net interest margin. The improvement in the net interest margin primarily reflected a 42% increase in average deposits relative to the much smaller loan growth of 7%. A substantial portion of the deposit growth resulted from the introduction of three deposit products during the first six-month period of 2009 that were designed as alternative options for lower yielding money market mutual funds. The new deposit products are: (a) the Huntington Conservative Deposit Account (HCDA), (b) the Huntington Protected Deposit Account (HPDA), and (c) the Bank Deposit Sweep Product (BDSP). These three accounts had balances in excess of $950 million at June 30, 2009.
Provision for credit losses increased $14.4 million reflecting a 76 basis point increase in total NCOs, as well as reserve
building resulting from our decision to continue to build reserves as a result of the review of every “noncriticized” commercial relationship with an aggregate exposure of over $500,000. (See “Commercial Loan Portfolio Review and Actions” section located within the “Commercial Credit” section for additional information.)
Noninterest income decreased $6.3 million, or 5%, primarily reflecting a $16.3 million decline in trust services revenue. The trust revenue decline resulted from a market-driven $2.3 billion decline in total assets under management as well as reduced proprietary mutual fund fees due to the migration of proprietary money-market mutual fund balances to the HCDA, HPDA, and other deposit products. Another factor contributing to the trust revenue decline was the impact of reduced money market yields. Also contributing to the reduction in noninterest income was a $4.6 million decline in derivatives income primarily as a result of less demand for CRE loan hedging transactions. These decreases were partially offset by a $13.9 million improvement in equity investment portfolio valuation adjustments from a loss of $12.9 million in the first six-month period of 2008 to a $1.0 million gain in the first six-month period of 2009.
Noninterest expense increased $21.6 million, or 17%, primarily reflecting the goodwill impairment charge of $28.9 million recorded during the first six-month period of 2009, partially offset by $10.6 million of reduced personnel expense as a result of several expense reduction initiatives implemented since the 2008 first quarter.

Item 1. Financial StatementsHuntington Bancshares IncorporatedCondensed Consolidated Balance Sheets
(in thousands, except number of shares)
AssetsCash and due from banks 2,092,604$ 806,693$ 1,159,819$ Federal funds sold and securities
purchased under resale agreements --- 37,975 198,333 Interest bearing deposits in banks 383,082 292,561 313,855 Trading account securities 95,920 88,677 1,096,239 Loans held for sale 559,017 390,438 365,063 Investment securities 5,934,704 4,384,457 4,788,275
Loans and leases 38,494,889 41,092,165 41,047,140 Allowance for loan and lease losses (917,680) (900,227) (679,403)
Net loans and leases 37,577,209 40,191,938 40,367,737 Bank owned life insurance 1,391,045 1,364,466 1,341,162 Premises and equipment 503,877 519,500 533,789 Goodwill 447,879 3,054,985 3,056,691 Other intangible assets 322,467 356,703 395,250 Accrued income and other assets 2,089,448 2,864,466 1,717,628
Total Assets 51,397,252$ 54,352,859$ 55,333,841$
Liabilities and Shareholders' EquityLiabilities
Deposits 39,165,132$ 37,943,286$ 38,124,426$ Short-term borrowings 862,056 1,309,157 2,313,190 Federal Home Loan Bank advances 926,937 2,588,976 3,058,163 Other long-term debt 2,508,144 2,331,632 2,608,092 Subordinated notes 1,672,887 1,950,097 1,879,900 Accrued expenses and other liabilities 1,041,574 1,000,805 966,857
Total Liabilities 46,176,730 47,123,953 48,950,628
Shareholders' equityPreferred stock - authorized 6,617,808 shares -
5.00% Series B Non-voting, Cumulative Preferred Stock, par valueof $0.01 and liquidation value per share of $1,000 1,316,854 1,308,667 ---
8.50% Series A Non-cumulative Perpetual Convertible PreferredStock, par value and liquidiation value per share of $1,000 362,507 569,000 569,000
Common stock - Par value of $0.01 and authorized 1,000,000,000 shares 5,696 3,670 3,670
Capital surplus 6,134,590 5,322,428 5,226,326 Less treasury shares at cost (12,223) (15,530) (15,224) Accumulated other comprehensive income (loss):
Unrealized losses on investment securities (127,124) (207,756) (146,307) Unrealized gains on cash flow hedging derivatives 14,220 44,638 (50,544) Pension and other postretirement benefit adjustments (160,621) (163,575) (46,271)
Retained (deficit) earnings (2,313,377) 367,364 842,563
Total Shareholders' Equity 5,220,522 7,228,906 6,383,213
Total Liabilities and Shareholders' Equity 51,397,252$ 54,352,859$ 55,333,841$
Common shares issued 569,646,682 366,972,250 367,019,713 Common shares outstanding 568,741,245 366,057,669 366,196,767 Preferred shares issued 1,967,071 1,967,071 569,000 Preferred shares outstanding 1,760,578 1,967,071 569,000
See notes to unaudited condensed consolidated financial statements
June 30,
(Unaudited)
December 31, June 30,2009 2008
92

Huntington Bancshares IncorporatedCondensed Consolidated Statements of Income(Unaudited)
(in thousands, except per share amounts)
Interest and fee incomeLoans and leases
Taxable 491,082$ 604,746$ 988,670$ 1,263,216$ Tax-exempt 604 1,775 1,702 3,511
Investment securitiesTaxable 60,029 54,563 115,490 108,458 Tax-exempt 1,343 7,524 6,098 14,878
Other 9,946 28,067 21,001 60,023 Total interest income 563,004 696,675 1,132,961 1,450,086
Interest expensesDeposits 176,081 227,765 363,650 502,648 Short-term borrowings 580 11,785 1,261 30,941 Federal Home Loan Bank advances 2,714 25,925 8,948 59,645 Subordinated notes and other long-term debt 33,730 41,334 71,698 90,162
Total interest expense 213,105 306,809 445,557 683,396 Net interest income 349,899 389,866 687,404 766,690 Provision for credit losses 413,707 120,813 705,544 209,463
Net interest (loss) income after provision for credit losses (63,808) 269,053 (18,140) 557,227 Service charges on deposit accounts 75,353 79,630 145,231 152,298 Brokerage and insurance income 32,052 35,694 72,000 72,254 Trust services 25,722 33,089 50,532 67,217 Electronic banking 24,479 23,242 46,961 43,983 Bank owned life insurance income 14,266 14,131 27,178 27,881 Automobile operating lease income 13,116 9,357 26,344 15,189 Mortgage banking income (loss) 30,827 12,502 66,245 5,439 Net (losses) gains on sales of investment securities 12,246 2,073 18,235 6,606 Impairment losses on investment securities:
Impairment losses on investment securities (88,114) --- (92,036) (3,104) Noncredit-related losses on securities not expectedto be sold (recognized in other comprehensive income) 68,528 --- 68,528 ---
Net impairment losses on investment securities (19,586) --- (23,508) (3,104) Other income 57,470 26,712 75,829 84,419
Total non-interest income 265,945 236,430 505,047 472,182 Personnel costs 171,735 199,991 347,667 401,934 Outside data processing and other services 39,266 30,186 71,698 64,547 Net occupancy 24,430 26,971 53,618 60,214 Equipment 21,286 25,740 41,696 49,534 Amortization of intangibles 17,117 19,327 34,252 38,244 Professional services 18,789 13,752 37,042 22,842 Marketing 7,491 7,339 15,716 16,258 Automobile operating lease expense 11,400 7,200 22,331 11,706 Telecommunications 6,088 6,864 11,978 13,109 Printing and supplies 4,151 4,757 7,723 10,379 Goodwill impairment 4,231 --- 2,606,944 --- Other expense 13,998 35,676 59,086 59,517
Total non-interest expense 339,982 377,803 3,309,751 748,284 (Loss) income before income taxes (137,845) 127,680 (2,822,844) 281,125 (Benefit) provision for income taxes (12,750) 26,328 (264,542) 52,705 Net (loss) income (125,095)$ 101,352$ (2,558,302)$ 228,420$
Dividends declared on preferred shares 57,451 11,151 116,244 11,151
Net (loss) income applicable to common shares (182,546)$ 90,201$ (2,674,546)$ 217,269$
Average common shares - basic 459,246 366,206 413,083 366,221 Average common shares - diluted 459,246 367,234 413,083 387,322
Per common shareNet (loss) income - basic (0.40)$ 0.25$ (6.47)$ 0.59$ Net (loss) income - diluted (0.40) 0.25 (6.47) 0.59 Cash dividends declared 0.0100 0.1325 0.0200 0.3975
See notes to unaudited condensed consolidated financial statements
Six Months EndedJune 30,
2009 20082009 2008
Three Months EndedJune 30,
93

Huntington Bancshares IncorporatedCondensed Consolidated Statements of Changes in Shareholders' Equity(Unaudited)
Capital Retained(in thousands) Shares Amount Shares Amount Shares Amount Surplus Shares Amount Loss Earnings Total
Six Months Ended June 30, 2008: Balance, beginning of period - -$ - -$ 367,001 3,670$ 5,237,783$ (739) (14,391)$ (49,611)$ 771,689$ 5,949,140$ Cumulative effect of change in accounting principle for fair value of assets and libilities, net of tax of ($803) 1,491 1,491 Cumulative effect of changing measurement date provisions for pension and post-retirement assets and obligations, net of tax of $4,324 (3,834) (4,195) (8,029) Cumulative effect of change in accounting principle for noncontrolling interests 1,950 1,950 Balance, beginning of period - as adjusted --- --- --- --- 367,001 3,670 5,237,783 (739) (14,391) (53,445) 770,935 5,944,552
Comprehensive Income:Net income 228,420 228,420
Unrealized net losses on investment securities arising during the period, net of reclassification for net realized gains, net of tax of $74,479 (136,296) (136,296) Unrealized losses on cash flow hedging derivatives, net of tax of $29,668 (55,097) (55,097) Amortization included in net periodic benefit costs: Net actuarial loss, net of tax of ($562) 1,043 1,043 Prior service costs, net of tax of ($169) 313 313 Transition obligation, net of tax of ($194) 360 360 Total comprehensive income 38,743 Issuance of preferred stock 569 569,000 (18,151) 550,849 Cash dividends declared:
Common ($0.3975 per share) (145,485) (145,485) Preferred Series A ($19.597 per share) (11,151) (11,151)
Recognition of the fair value of share-based compensation 7,194 7,194 Other share-based compensation activity 19 --- (279) (154) (433) Other (221) (84) (833) (2) (1,056)
Balance, end of period --- $ --- 569 569,000$ 367,020 3,670$ 5,226,326$ (823) (15,224)$ (243,122)$ 842,563$ 6,383,213$
Six Months Ended June 30, 2009: Balance, beginning of period 1,398 1,308,667$ 569 569,000$ 366,972 3,670$ 5,322,428$ (915) (15,530)$ (326,693)$ 365,599$ 7,227,141$ Cumulative effect of change in accounting principle for noncontrolling interests 1,765 1,765 Balance, beginning of period - as adjusted 1,398 1,308,667 569 569,000 366,972 3,670 5,322,428 (915) (15,530) (326,693) 367,364 7,228,906
Comprehensive Income: Net loss (2,558,302) (2,558,302) Cumulative effect of change in accounting principle for other-than-temporarily impaired debt securities, net of tax of $1,907 (3,541) 3,541 - Non-credit-related impairment losses on debt securities not expected to be sold, net of tax of $23,985 (44,543) (44,543) Unrealized net gains on investment securities arising during the period, net of reclassification for net realized gains, net of tax of ($69,827) 128,716 128,716 Unrealized losses on cash flow hedging derivatives, net of tax of $16,380 (30,419) (30,419) Amortization included in net periodic benefit costs: Net actuarial loss, net of tax of ($1,221) 2,267 2,267 Prior service costs, net of tax of ($177) 328 328 Transition obligation, net of tax of ($194) 360 360 Total comprehensive loss (2,501,593) Issuance of common stock 161,549 1,614 550,850 552,464 Conversion of Preferred Series A stock (206) (206,493) 41,072 411 262,117 (56,035) -
Amortization of discount 7,887 (7,887) - Cash dividends declared: -
Common ($0.02 per share) (9,167) (9,167) Preferred Series B ($25.00 per share) (34,952) (34,952) Preferred Series A ($42.50 per share) (17,370) (17,370)
Recognition of the fair value of share-based compensation 2,640 2,640
Other share-based compensation activity 54 1 35 (108) (72) Other 300 (3,480) 10 3,307 (461) (334)
Balance, end of period 1,398 1,316,854$ 363 362,507 569,647 5,696$ 6,134,590$ (905) (12,223)$ (273,525)$ (2,313,377)$ 5,220,522$
See notes to unaudited condensed consolidated financial statements.
Series B
Accumulated
Treasury StockCommon Stock ComprehensiveOtherPreferred Stock
Series A
94
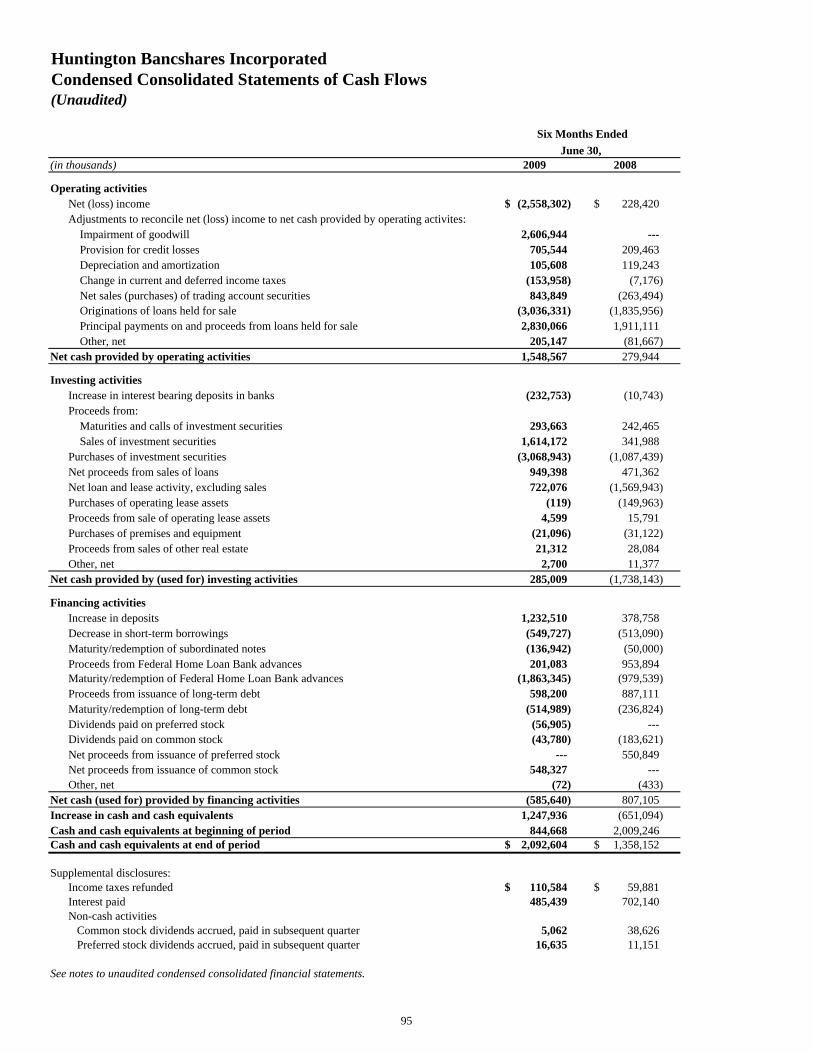
Huntington Bancshares IncorporatedCondensed Consolidated Statements of Cash Flows(Unaudited)
(in thousands) 2009 2008
Operating activitiesNet (loss) income (2,558,302)$ 228,420$ Adjustments to reconcile net (loss) income to net cash provided by operating activites: Impairment of goodwill 2,606,944 --- Provision for credit losses 705,544 209,463 Depreciation and amortization 105,608 119,243 Change in current and deferred income taxes (153,958) (7,176) Net sales (purchases) of trading account securities 843,849 (263,494) Originations of loans held for sale (3,036,331) (1,835,956) Principal payments on and proceeds from loans held for sale 2,830,066 1,911,111 Other, net 205,147 (81,667)
Net cash provided by operating activities 1,548,567 279,944
Investing activities Increase in interest bearing deposits in banks (232,753) (10,743)Proceeds from: Maturities and calls of investment securities 293,663 242,465 Sales of investment securities 1,614,172 341,988Purchases of investment securities (3,068,943) (1,087,439) Net proceeds from sales of loans 949,398 471,362 Net loan and lease activity, excluding sales 722,076 (1,569,943)Purchases of operating lease assets (119) (149,963) Proceeds from sale of operating lease assets 4,599 15,791 Purchases of premises and equipment (21,096) (31,122)Proceeds from sales of other real estate 21,312 28,084Other, net 2,700 11,377
Net cash provided by (used for) investing activities 285,009 (1,738,143)
Financing activities Increase in deposits 1,232,510 378,758Decrease in short-term borrowings (549,727) (513,090)Maturity/redemption of subordinated notes (136,942) (50,000) Proceeds from Federal Home Loan Bank advances 201,083 953,894 Maturity/redemption of Federal Home Loan Bank advances (1,863,345) (979,539) Proceeds from issuance of long-term debt 598,200 887,111 Maturity/redemption of long-term debt (514,989) (236,824) Dividends paid on preferred stock (56,905) --- Dividends paid on common stock (43,780) (183,621) Net proceeds from issuance of preferred stock --- 550,849 Net proceeds from issuance of common stock 548,327 --- Other, net (72) (433)
Net cash (used for) provided by financing activities (585,640) 807,105Increase in cash and cash equivalents 1,247,936 (651,094)Cash and cash equivalents at beginning of period 844,668 2,009,246Cash and cash equivalents at end of period 2,092,604$ 1,358,152$
Supplemental disclosures:Income taxes refunded 110,584$ 59,881$ Interest paid 485,439 702,140Non-cash activities Common stock dividends accrued, paid in subsequent quarter 5,062 38,626 Preferred stock dividends accrued, paid in subsequent quarter 16,635 11,151
See notes to unaudited condensed consolidated financial statements.
Six Months EndedJune 30,
95

Notes to Unaudited Condensed Consolidated Financial Statements Note 1 – Basis of Presentation
The accompanying unaudited condensed consolidated financial statements of Huntington Bancshares Incorporated (Huntington or the Company) reflect all adjustments consisting of normal recurring accruals, which are, in the opinion of Management, necessary for a fair presentation of the consolidated financial position, the results of operations, and cash flows for the periods presented. These unaudited condensed consolidated financial statements have been prepared according to the rules and regulations of the Securities and Exchange Commission (SEC) and, therefore, certain information and footnote disclosures normally included in financial statements prepared in accordance with accounting principles generally accepted in the United States (GAAP) have been omitted. The Notes to Consolidated Financial Statements appearing in Huntington’s 2008 Annual Report on Form 10-K (2008 Form 10-K), which include descriptions of significant accounting policies, as updated by the information contained in this report, should be read in conjunction with these interim financial statements.
Certain amounts in the prior-period financial statements have been reclassified to conform to the current period presentation.
For statement of cash flows purposes, cash and cash equivalents are defined as the sum of “Cash and due from banks” and “Federal funds sold and securities purchased under resale agreements.” Note 2 – New Accounting Pronouncements FASB Statement No. 141 (Revised 2008), Business Combinations (Statement No. 141R) – Statement No. 141R was issued in December 2007. The revised statement requires an acquirer to recognize the assets acquired, the liabilities assumed, and any noncontrolling interest in the acquiree at the acquisition date, measured at their fair values as of that date, with limited exceptions specified in the Statement. Statement No. 141R required prospective application for business combinations consummated in fiscal years beginning on or after December 15, 2008. The Franklin restructuring transaction described in Note 3 was accounted for under this standard. FASB Statement No. 160, Noncontrolling Interests in Consolidated Financial Statements – an amendment of ARB No. 51 (Statement No. 160) – Statement No. 160 was issued in December 2007. The Statement requires that noncontrolling interests in subsidiaries be initially measured at fair value and classified as a separate component of equity. The Statement is effective for fiscal years beginning on or after December 15, 2008. The adoption of this new Statement did not have a material impact on Huntington’s condensed consolidated financial statements. FASB Statement No. 163, Accounting for Financial Guarantee Insurance Contracts – an interpretation of FASB Statement No. 60 (Statement No. 163) – Statement No. 163 requires that an insurance enterprise recognize a claim liability prior to an event of default (insured event) when there is evidence that credit deterioration has occurred in an insured financial obligation. This Statement also clarifies how Statement No. 60 applies to financial guarantee insurance contracts, including the recognition and measurement to be used to account for premium revenue and claim liabilities. This Statement requires expanded disclosures about financial guarantee insurance contracts. This Statement is effective for financial statements issued for fiscal years and interim periods beginning after December 15, 2008. The adoption of this Statement did not have a material impact on the Huntington’s condensed consolidated financial statements. FASB Staff Position (FSP) FAS 157-4, Determining Fair Value When the Volume and Level of Activity for the Asset or Liability Have Significantly Decreased and Identifying Transactions That Are Not Orderly (FSP FAS 157-4). FSP FAS 157-4 was issued in April 2009. The FSP reaffirms the exit price fair value measurement guidance in Statement No. 157 and also provides additional guidance for estimating fair value in accordance with Statement No. 157 when the volume and level of activity for the asset or liability have significantly decreased. This FSP is effective for interim reporting periods ending after June 15, 2009. The adoption of this Statement did not have a material impact on the Huntington’s condensed consolidated financial statements.
96
FSP FAS 115-2 and FAS 124-2, Recognition and Presentation of Other-Than-Temporary Impairments (FSP FAS 115-2 and FAS 124-2). FSP FAS 115-2 and FAS 124-2 was issued in April 2009. This FSP amends the other-than-temporary impairment (OTTI) guidance in GAAP for debt securities and includes additional presentation and disclosure requirements for both debt and equity securities. This FSP is effective for interim reporting periods ending after June 15, 2009. The adoption of FSP FAS 115-2 and FAS 124-2 requires an adjustment to retained earnings and other comprehensive income (OCI) in the period of adoption to reclassify non-credit related impairment to OCI for securities that the Company does not intend to sell (and will not more likely than not be required to sell). The adoption of this Statement resulted in the reclassification of $3.5 million (net of tax) from retained earnings to OCI. (See Condensed Consolidated Statements of Shareholders’ Equity and Note 7). FSP FAS 107-1 and APB 28-1, Interim Disclosures about Fair Value of Financial Instruments (FSP FAS 107-1 and APB 28-1). FSP FAS 107-1 and APB 28-1 was issued in April 2009. The FSP requires disclosures about fair value of financial instruments for interim reporting periods of publicly traded companies as well as in annual financial statements. This FSP was effective for interim reporting periods ending after June 15, 2009 (See Note 11). FSP FAS 132R-1, Employers’ Disclosures about Postretirement Benefit Plan Assets (FSP FAS 132R-1.) FSP FAS 132R-1 was issued in December 2008. This FSP requires additional disclosures about plan assets in an employer’s defined benefit pension and other postretirement plans. This FSP is effective for fiscal years ending after December 15, 2009. FASB Statement No. 165, Subsequent Events (Statement No. 165) – Statement No. 165 establishes general standards of accounting for and disclosure of subsequent events. Subsequent events are events that occur after the balance sheet date but before financial statements are issued or are available to be issued. The Statement is effective for interim or annual periods ending after June 15, 2009. The impact of this new Statement was not material to Huntington’s consolidated financial statements. Huntington has evaluated its subsequent events through August 10, 2009. FASB Statement No. 166, Accounting for Transfers of Financial Assets – an amendment of FASB Statement No. 140 (Statement No. 166) – Statement 140 is the primary source of accounting guidance for transfers of financial assets and securitization transactions. Statement No. 166 removes the concept of a qualifying special purpose entity from Statement 140 and removes the exception from applying FASB Interpretation No. 46 (revised December 2003), Consolidation of Variable Interest Entities, to qualifying special-purpose entities. Many types of transferred financial assets that would have been derecognized previously are no longer eligible for derecognition. This Statement is effective for financial statements issued for fiscal years and interim periods beginning after November 15, 2009, and early adoption is prohibited. The amendments apply prospectively to transfers of financial assets occurring on or after the effective date. Management is currently evaluating the impact that the Statement could have on the Company’s consolidated financial statements. FASB Statement No. 167, Amendments to FASB Interpretation No. 46R (Statement No. 167) – Statement No. 167 amends the consolidation guidance applicable for variable interest entities (VIE). Huntington will need to reconsider its previous Interpretation 46R conclusions including whether an entity is a VIE, and whether Huntington is the VIE’s primary beneficiary. It is possible that application of this revised guidance will change Huntington’s assessment of which entities with which it is involved are VIEs and consolidation will be required. This Statement is effective for financial statements issued for fiscal years and interim periods beginning after November 15, 2009, and early adoption is prohibited. Management is currently evaluating the impact that the Statement could have on the Company’s consolidated financial statements. However, based upon the current regulatory requirements, Huntington anticipates the impact of adopting will decrease risk weighted capital ratios between five and ten basis points. FASB Statement No. 168, The FASB Accounting Standards Codification and the Hierarchy of Generally Accepted Accounting Principles – a replacement of FASB Statement No. 162 – Statement No. 168 replaces the guidance in FASB Statement No. 162, The Hierarchy of Generally Accepted Accounting Principles (Statement No. 162), and identifies the FASB Accounting Standards Codification (Codification) as the single source of authoritative U.S. Generally Accepted Accounting Principles (GAAP) recognized by the FASB to be applied by nongovernmental entities. The Codification reorganizes all previous GAAP pronouncements into roughly 90 accounting topics and displays all topics using a consistent structure. All existing standards that were used to create the Codification will be superseded, replacing the previous references to specific Statements of Financial Accounting Standards (SFAS) with numbers used in the Codification’s structural organization. Statement No. 168 is effective for interim and annual periods ending after September 15, 2009. After September 15, only one level of authoritative GAAP will exist, other than guidance issued by the Securities and Exchange Commission (SEC). All other accounting literature excluded from the Codification will be considered non-authoritative. The adoption of the Codification does not have a material impact on the Company’s condensed consolidated financial statements.
97

Note 3 – Loans and Leases Franklin Credit Management relationship
Franklin Credit Management Corporation (Franklin) is a specialty consumer finance company primarily engaged
in servicing residential mortgage loans. Prior to March 31, 2009, Franklin owned a portfolio of loans secured by first and second liens on 1-4 family residential properties. At December 31, 2008, Huntington’s total loans outstanding to Franklin were $650.2 million, all of which were on nonaccrual status. Additionally, the specific ALLL for the Franklin portfolio was $130.0 million, resulting in a net exposure to Franklin at December 31, 2008 of $520.2 million.
On March 31, 2009, Huntington entered into a transaction with Franklin whereby a Huntington wholly-owned
REIT subsidiary (REIT) exchanged a non controlling amount of certain equity interests for a 100% interest in Franklin Asset Merger Sub, LLC (Merger Sub), a wholly owned subsidiary of Franklin. This was accomplished by merging Merger Sub into a wholly-owned subsidiary of REIT. Merger Sub’s sole assets were two trust participation certificates evidencing 84% ownership rights in a trust (New Trust) which holds all the underlying consumer loans and OREO that were formerly collateral for the Franklin commercial loans. The equity interests provided to Franklin by REIT were pledged by Franklin as collateral for the Franklin commercial loans.
New Trust is a variable interest entity under FASB Interpretation No 46R, Consolidation of Variable Interest
Entities (revised December 2003) - an interpretation of ARB No. 51 (FIN 46R), and, as a result of Huntington’s 84% participation certificates, New Trust was consolidated into Huntington’s financial results. As required by FIN 46R, the consolidation is treated as a business combination under Statement No. 141R with the fair value of the equity interests issued to Franklin representing the acquisition price. AICPA Statement of Position 03-3, Accounting for Certain Loans or Debt Securities Acquired in a Transfer (SOP 03-3), provides guidance for accounting for acquired loans, such as these, that have experienced a deterioration of credit quality at the time of acquisition for which it is probable that the investor will be unable to collect all contractually required payments.
Under SOP 03-3, the excess of cash flows expected at acquisition over the estimated fair value is referred to as the
accretable discount and is recognized in interest income over the remaining life of the loan, or pool of loans, in situations where there is a reasonable expectation about the timing and amount of cash flows expected to be collected. The difference between the contractually required payments at acquisition and the cash flows expected to be collected at acquisition, considering the impact of prepayments, is referred to as the nonaccretable discount. Subsequent decreases to the expected cash flows will generally result in a charge to the provision for credit losses and an increase to the allowance for loan and lease losses. Subsequent increases in cash flows result in reversal of any nonaccretable discount (or allowance for loan and lease losses to the extent any has been recorded) with a positive impact on interest income. The measurement of undiscounted cash flows involves assumptions and judgments for credit risk, interest rate risk, prepayment risk, default rates, loss severity, payment speeds, and collateral values. All of these factors are inherently subjective and significant changes in the cash flow estimates over the life of the loan can result.
At June 30, 2009, there were no additional credit losses recorded on the portfolio and no adjustment to the
accretable yield or nonaccretable yield was required. The following table reflects the contractually required payments receivable, cash flows expected to be collected,
and fair value of the loans at the acquisition date:
(in thousands) Loans OREO TotalContractually required payments including interest 1,612,695$ 113,732$ 1,726,427$ Less: nonaccretable difference (1,079,362) (34,136) (1,113,498) Cash flows expected to be collected 533,333 79,596 612,929 Less: accretable yield (39,781) - (39,781) Fair value of loans acquired 493,552$ 79,596$ 573,148$
98

The fair values of the acquired mortgage loans and OREO assets were based upon a market participant model and calculated in accordance with FASB Statement No. 157, Fair Value Measurements (Statement No. 157). Under this market participant model, expected cash flows for first-lien mortgages were calculated based upon the net expected foreclosure proceeds of the collateral underlying each mortgage loan. Updated appraisals or other indicators of value provided the basis for estimating cash flows. Sales proceeds from the underlying collateral were estimated to be received over a one to three year period, depending on the delinquency status of the loan. Expected proceeds were reduced assuming housing price depreciation of 18%, 12%, and 0% over each year of the next three years of expected collections, respectively. Interest cash flows were estimated to be received for a limited time on each portfolio. The resulting cash flows were discounted at an 18% rate of return. Limited value was assigned to all second-lien mortgages because, after considering the house price depreciation rates above, little if any proceeds would be realized.
The following table presents a rollforward of the accretable yield from the beginning of the period to the end of
the period:
(in thousands) Accretable YieldBalance at December 31, 2008 ---$
Impact of Franklin transaction on March 31, 2009 39,781 Additions --- Accretion (750) Reclassification from (to) nonaccretable difference ---
Balance at June 30, 2009 39,031$ The following table reflects the outstanding balance of all contractually required payments and carrying amounts
of the acquired loans accounted for under SOP 03-3 at June 30, 2009:
(in thousands) Carrying Value Outstanding BalanceResidential mortgage 415,029$ 740,850$ Home equity 56,944 829,994
Total 471,973$ 1,570,844$
June 30, 2009
At June 30, 2009, $127.4 million of the acquired current mortgage loans accrue interest while $344.6 million were on nonaccrual. Management has concluded that it cannot reliably estimate the timing of collection of cash flows for delinquent first and second lien mortgages, because the majority of the expected cash flows for the delinquent portfolio will result from the foreclosure and subsequent disposition of the underlying collateral supporting the loans.
The consolidation of New Trust at March 31, 2009 resulted in the recording of a $95.8 million liability,
representing the 16% of New Trust certificates not acquired by Huntington. These certificates were retained by Franklin. In accordance with Statement No. 141R, at March 31, 2009 Huntington has recorded a net deferred tax asset of
$159.9 million related to the difference between the tax basis and the book basis in the acquired assets. Because the acquisition price, represented by the equity interests in the Huntington wholly-owned subsidiary, was equal to the fair value of the 84% interest in the New Trust participant certificate, no goodwill was created from the transaction. The recording of the net deferred tax asset was a bargain purchase under Statement No. 141R, and was recorded as tax benefit in the current period.
99
Single Family Home Builders
At June 30, 2009, December 31, 2008, and June 30, 2008, Huntington had $1.2 billion, $1.6 billion and $1.6 billion of commercial real estate loans to single family homebuilders, including loans made to both middle market and small business homebuilders. The decline from December 31, 2008 was primarily the result of a reclassification of loans from commercial real estate to commercial and industrial. Such loans represented 3%, 4%, and 4% of total loans and leases at June 30, 2009, December 31, 2008, and June 30, 2008 respectively. Of this portfolio at June 30, 2009, 69% were to finance projects currently under construction, 16% to finance land under development, and 15% to finance land held for development.
The housing market across Huntington’s geographic footprint remained stressed, reflecting relatively lower sales
activity, declining prices, and excess inventories of houses to be sold, particularly impacting borrowers in our eastern Michigan and northern Ohio regions. Further, a portion of the loans extended to borrowers located within Huntington’s geographic regions was to finance projects outside of our geographic regions.
Retail properties
Huntington’s portfolio of commercial real estate loans secured by retail properties totaled $2.3 billion, $2.3 billion and $2.1 billion at June 30, 2009, December 31, 2008 and June 30, 2008 or approximately 6%, 6% and 5%of total loans and leases, at each respective date. Credit approval in this loan segment is generally dependant on pre-leasing requirements, and net operating income from the project must cover interest expense when the loan is fully funded.
The weakness of the economic environment in the Company’s geographic regions significantly impacted the projects that secure the loans in this portfolio segment. Increased unemployment levels compared with recent years, and the expectation that these levels will continue to increase for the foreseeable future, are expected to adversely affect our borrowers’ ability to repay these loans.
Home Equity and Residential Mortgage Loans (excluding loans in New Trust)
There is a potential for loan products to contain contractual terms that give rise to a concentration of credit risk
that may increase a lending institution’s exposure to risk of nonpayment or realization. Examples of these contractual terms include loans that permit negative amortization, a loan-to-value of greater than 100%, and option adjustable-rate mortgages.
Huntington does not offer mortgage loan products that contain these terms. Recent declines in housing prices have
likely eliminated a portion of the collateral for the home equity portfolio, such that some loans originally underwritten at a LTV of less than 100% are currently at higher than 100%. Home equity loans totaled $7.6 billion at June 30, 2009, $7.6 billion at December 31, 2008, and $7.4 billion at June 30, 2008, or 20%, 18%, and 18% of total loans at the end of each respective period.
As part of the Company’s loss mitigation process, Huntington increased its efforts in 2008 and 2009 to re-underwrite, modify, or restructure loans when borrowers are experiencing payment difficulties, and these loan restructurings are based on the borrower’s ability to repay the loan.
100

Note 4 - Investment Securities
Listed below are the contractual maturities (under 1 year, 1-5 years, 6-10 years, and over 10 years) of investmentsecurities at June 30, 2009, December 31, 2008, and June 30, 2008:
Amortized Amortized Amortized(in thousands of dollars) Cost Fair Value Cost Fair Value Cost Fair Value
U.S. TreasuryUnder 1 year 50,480$ 50,497$ 11,141$ 11,157$ 349$ 355$ 1-5 years --- --- --- --- --- --- 6-10 years --- --- --- --- --- --- Over 10 years --- --- --- --- --- ---
Total U.S. Treasury 50,480 50,497 11,141 11,157 349 355 Federal agencies
Mortgage backed securitiesUnder 1 year --- --- --- --- 600 604 1-5 years --- --- --- --- 13,948 14,096 6-10 years 1 1 1 1 9,812 9,784 Over 10 years 1,845,469 1,870,855 1,625,655 1,627,580 1,907,774 1,906,654
Total mortgage-backed Federal agencies 1,845,470 1,870,856 1,625,656 1,627,581 1,932,134 1,931,138 Temporary Liquidity Guarantee Program (TLGP) securities
Under 1 year --- --- --- --- --- --- 1-5 years 319,737 320,021 --- --- --- --- 6-10 years --- --- --- --- --- --- Over 10 years --- --- --- --- --- ---
Total TLGP securities 319,737 320,021 --- --- --- --- Other agencies
Under 1 year 2,206 2,271 --- --- --- --- 1-5 years 1,965,647 1,979,813 579,546 595,912 352,425 348,964 6-10 years 7,018 7,189 7,954 8,328 --- --- Over 10 years --- --- --- --- --- ---
Total other Federal agencies 1,974,871 1,989,273 587,500 604,240 352,425 348,964
4,190,558 4,230,647 2,224,297 2,242,978 2,284,908 2,280,457
Municipal securitiesUnder 1 year --- --- --- --- 16 16 1-5 years 1,165 1,191 51,890 54,184 18,903 19,187 6-10 years 53,148 56,223 216,433 222,086 219,369 218,709 Over 10 years 65,254 67,106 441,825 434,076 475,112 470,457
Total municipal securities 119,567 124,520 710,148 710,346 713,400 708,369 Private label CMO
Under 1 year --- --- --- --- --- --- 1-5 years --- --- --- --- --- --- 6-10 years --- --- --- --- --- --- Over 10 years 603,099 510,503 674,506 523,515 725,896 686,122
Total private label CMO 603,099 510,503 674,506 523,515 725,896 686,122 Asset backed securities
Under 1 year --- --- --- --- --- --- 1-5 years --- --- --- --- --- --- 6-10 years 132,205 134,270 --- --- --- --- Over 10 years 554,032 402,928 652,881 464,027 847,443 673,739
Total asset backed securities 686,237 537,198 652,881 464,027 847,443 673,739 Other
Under 1 year 2,350 2,350 549 552 1,700 1,703 1-5 years 4,451 4,513 6,546 6,563 6,200 6,145 6-10 years 50,038 50,336 798 811 698 686 Over 10 years 63 137 64 136 164 214 Non-marketable equity securities 427,772 427,772 427,973 427,973 424,271 424,271 Marketable equity securities 47,369 46,728 8,061 7,556 9,860 6,569
Total other 532,043 531,836 443,991 443,591 442,893 439,588 Total investment securities 6,131,504$ 5,934,704$ 4,705,823$ 4,384,457$ 5,014,540$ 4,788,275$
December 31, 2008June 30, 2009 June 30, 2008
Total U.S. government backed securities
101

Other securities include $240.6 million of stock issued by the Federal Home Loan Bank of Cincinnati, $45.7 million of stock issued by the Federal Home Loan Bank of Indianapolis, and $141.5 million of Federal Reserve Bank stock. Other securities also include corporate debt and marketable equity securities. Huntington does not have any material equity positions in Federal National Mortgage Association (FNMA or Fannie Mae) and the Federal Home Loan Mortgage Corporation (FHLMC or Freddie Mac).
The following table provides gross unrealized gains and losses recognized in accumulated other comprehensive
income by investment category at June 30, 2009 and December 31, 2008.
UnrealizedAmortized Gross Gross Fair
(in thousands) Cost Gains Losses ValueJune 30, 2009 U.S. Treasury 50,480$ 17$ ---$ 50,497$ Federal Agencies Mortgage-backed securities 1,845,470 34,269 (8,883) 1,870,856 TLGP securities 319,737 1,084 (800) 320,021 Other agencies 1,974,871 15,666 (1,264) 1,989,273 Total Federal agencies and U.S. Government backed securities 4,190,558 51,036 (10,947) 4,230,647 Municipal securities 119,567 5,442 (489) 124,520 Private label CMO 603,099 --- (92,596) 510,503 Asset backed securities 686,237 16,195 (165,234) 537,198 Other securities 532,043 442 (649) 531,836 Total investment securities 6,131,504$ 73,115$ (269,915)$ 5,934,704$
UnrealizedAmortized Gross Gross Fair
(in thousands) Cost Gains Losses ValueDecember 31, 2008 U.S. Treasury 11,141$ 16$ ---$ 11,157$ Federal Agencies Mortgage-backed securities 1,625,656 18,822 (16,897) 1,627,581 TLGP securities --- --- --- --- Other agencies 587,500 16,748 (8) 604,240 Total Federal agencies and U.S. Government backed securities 2,224,297 35,586 (16,905) 2,242,978 Municipal securities 710,148 13,897 (13,699) 710,346 Private label CMO 674,506 --- (150,991) 523,515 Asset backed securities 652,881 --- (188,854) 464,027 Other securities 443,991 114 (514) 443,591 Total investment securities 4,705,823$ 49,597$ (370,963)$ 4,384,457$
102

The following table provides detail on investment securities with unrealized losses aggregated by investment category and length of time the individual securities have been in a continuous loss position, at June 30, 2009 and December 31, 2008.
Fair Unrealized Fair Unrealized Fair Unrealized(in thousands ) Value Losses Value Losses Value LossesJune 30, 2009 U.S. Treasury ---$ ---$ ---$ ---$ ---$ ---$ Federal agencies Mortgage-backed securities 518,356 (8,883) --- --- 518,356 (8,883) TLGP securities 132,758 (800) --- --- 132,758 (800) Other agencies 551,296 (1,218) 6,830 (46) 558,126 (1,264) Total Federal agencies and US Government backed securities 1,202,410 (10,901) 6,830 (46) 1,209,240 (10,947) Municipal securities 8,893 (103) 10,949 (386) 19,842 (489) Private label CMO 17,889 (2,536) 492,599 (90,060) 510,488 (92,596) Asset backed securities 17,561 (99) 217,425 (165,135) 234,986 (165,234) Other securities 38,913 (240) 2,541 (409) 41,454 (649) Total temporarily impaired securities 1,285,666$ (13,879)$ 730,344$ (256,036)$ 2,016,010$ (269,915)$
Fair Unrealized Fair Unrealized Fair Unrealized(in thousands ) Value Losses Value Losses Value LossesDecember 31, 2008 U.S. Treasury ---$ ---$ ---$ ---$ ---$ ---$ Federal agencies Mortgage-backed securities 417,988 (16,897) --- --- 417,988 (16,897) TLGP securities --- --- --- --- --- --- Other agencies --- --- 2,028 (8) 2,028 (8) Total Federal agencies and US Government backed securities 417,988 (16,897) 2,028 (8) 420,016 (16,905) Municipal securities 276,990 (6,951) 40,913 (6,748) 317,903 (13,699) Private label CMO 449,494 (130,914) 57,024 (20,077) 506,518 (150,991) Asset backed securities 61,304 (24,220) 164,074 (164,634) 225,378 (188,854) Other securities 1,132 (323) 1,149 (191) 2,281 (514) Total temporarily impaired securities 1,206,908$ (179,305)$ 265,188$ (191,658)$ 1,472,096$ (370,963)$
Total
Less than 12 Months Over 12 Months Total
Less than 12 Months Over 12 Months
Securities transactions are recognized on the trade date (the date the order to buy or sell is executed). The
amortized cost of sold securities is used to compute realized gains and losses. Interest and dividends on securities, including amortization of premiums and accretion of discounts using the effective interest method over the period to maturity, are included in interest income.
103
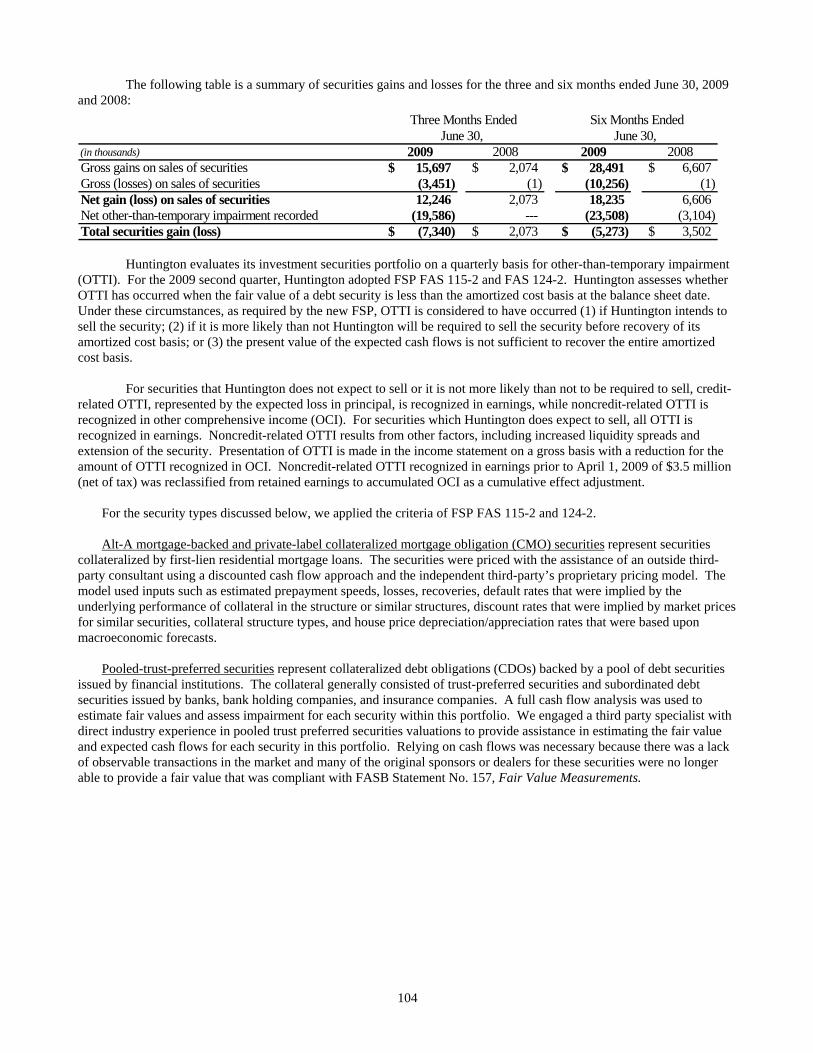
The following table is a summary of securities gains and losses for the three and six months ended June 30, 2009 and 2008:
(in thousands) 2009 2008 2009 2008Gross gains on sales of securities 15,697$ 2,074$ 28,491$ 6,607$ Gross (losses) on sales of securities (3,451) (1) (10,256) (1) Net gain (loss) on sales of securities 12,246 2,073 18,235 6,606 Net other-than-temporary impairment recorded (19,586) --- (23,508) (3,104) Total securities gain (loss) (7,340)$ 2,073$ (5,273)$ 3,502$
Six Months EndedJune 30,
Three Months EndedJune 30,
Huntington evaluates its investment securities portfolio on a quarterly basis for other-than-temporary impairment
(OTTI). For the 2009 second quarter, Huntington adopted FSP FAS 115-2 and FAS 124-2. Huntington assesses whether OTTI has occurred when the fair value of a debt security is less than the amortized cost basis at the balance sheet date. Under these circumstances, as required by the new FSP, OTTI is considered to have occurred (1) if Huntington intends to sell the security; (2) if it is more likely than not Huntington will be required to sell the security before recovery of its amortized cost basis; or (3) the present value of the expected cash flows is not sufficient to recover the entire amortized cost basis.
For securities that Huntington does not expect to sell or it is not more likely than not to be required to sell, credit-
related OTTI, represented by the expected loss in principal, is recognized in earnings, while noncredit-related OTTI is recognized in other comprehensive income (OCI). For securities which Huntington does expect to sell, all OTTI is recognized in earnings. Noncredit-related OTTI results from other factors, including increased liquidity spreads and extension of the security. Presentation of OTTI is made in the income statement on a gross basis with a reduction for the amount of OTTI recognized in OCI. Noncredit-related OTTI recognized in earnings prior to April 1, 2009 of $3.5 million (net of tax) was reclassified from retained earnings to accumulated OCI as a cumulative effect adjustment.
For the security types discussed below, we applied the criteria of FSP FAS 115-2 and 124-2.
Alt-A mortgage-backed and private-label collateralized mortgage obligation (CMO) securities represent securities
collateralized by first-lien residential mortgage loans. The securities were priced with the assistance of an outside third-party consultant using a discounted cash flow approach and the independent third-party’s proprietary pricing model. The model used inputs such as estimated prepayment speeds, losses, recoveries, default rates that were implied by the underlying performance of collateral in the structure or similar structures, discount rates that were implied by market prices for similar securities, collateral structure types, and house price depreciation/appreciation rates that were based upon macroeconomic forecasts.
Pooled-trust-preferred securities represent collateralized debt obligations (CDOs) backed by a pool of debt securities issued by financial institutions. The collateral generally consisted of trust-preferred securities and subordinated debt securities issued by banks, bank holding companies, and insurance companies. A full cash flow analysis was used to estimate fair values and assess impairment for each security within this portfolio. We engaged a third party specialist with direct industry experience in pooled trust preferred securities valuations to provide assistance in estimating the fair value and expected cash flows for each security in this portfolio. Relying on cash flows was necessary because there was a lack of observable transactions in the market and many of the original sponsors or dealers for these securities were no longer able to provide a fair value that was compliant with FASB Statement No. 157, Fair Value Measurements.
104

For the three months ended June 30, 2009, the following table summarizes by debt security type, total OTTI losses, OTTI losses included in OCI, and OTTI recognized in the income statement.
Alt-A Pooled Private(in thousands) Mortgage-backed Trust-Preferred Label CMO TotalTotal OTTI losses (unrealized and realized) (5,980)$ (13,479)$ (68,655)$ (88,114)$ Unrealized OTTI recognized in OCI 99 12,228 56,201 68,528 Net impairment losses recognized in earnings (5,881)$ (1,251)$ (12,454)$ (19,586)$
The following table displays the cumulative credit component of OTTI recognized in earnings on debt securities
held by Huntington for the three months ended June 30, 2009 is as follows:
(in thousands) TotalBalance, March 31, 2009 --- $
Credit component of other-than-temporary impairment not reclassified to other comprehensive income in conjunction with the cumulative effect transition adjustment 25 Additions for the credit component on debt securities in which other-than-temporary impairment was not previously recognized 19,586
Balance, June 30, 2009 19,611$
As of June 30, 2009, management has evaluated all other investment securities with unrealized losses and all non-marketable securities for impairment. The unrealized losses were primarily the result of wider liquidity spreads on asset-backed securities and, additionally, increased market volatility on non-agency mortgage and asset-backed securities that are backed by certain mortgage loans. The fair values of these assets have been impacted by various market conditions. In addition, the expected average lives of the asset-backed securities backed by trust preferred securities have been extended, due to changes in the expectations of when the underlying securities would be repaid. The contractual terms and/or cash flows of the investments do not permit the issuer to settle the securities at a price less than the amortized cost. Huntington has reviewed its asset-backed portfolio with independent third parties and does not believe there is additional OTTI from these securities other than what has already been recorded. Huntington does not intend to sell, nor does it believe it will be required to sell these securities until the fair value is recovered, which may be maturity and, therefore, does not consider them to be other-than-temporarily impaired at June 30, 2009. Note 5 – Loan Sales and Securitizations Residential Mortgage Loans
For each of the three months ended June 30, 2009 and 2008, Huntington sold $1.2 billion of residential mortgage loans with servicing retained, resulting in net pre-tax gains of $27.1 million and $12.3 million, respectively, recorded in mortgage banking income. During the first six months of 2009 and 2008, sales of residential mortgage loans with servicing retained totaled $2.7 billion and $1.9 billion, respectively, resulting in net pre-tax gains of $55.5 million and $16.0 million, respectively.
A mortgage servicing right (MSR) is established only when the servicing is contractually separated from the
underlying mortgage loans by sale or securitization of the loans with servicing rights retained. At initial recognition, the MSR asset is established at its fair value using assumptions that are consistent with
assumptions used to estimate the fair value of the total MSR portfolio. Subsequent to initial capitalization, MSR assets are adjusted using the fair value method if the Company will engage in actively hedging the asset or adjusted using the amortization method if no active hedging will be performed. MSRs are included in accrued income and other assets in the Company’s condensed consolidated balance sheet. Any increase or decrease in the fair value or amortized cost of MSRs carried under the fair value method during the period is recorded as an increase or decrease in mortgage banking income, which is reflected in non-interest income in the consolidated statements of income.
105
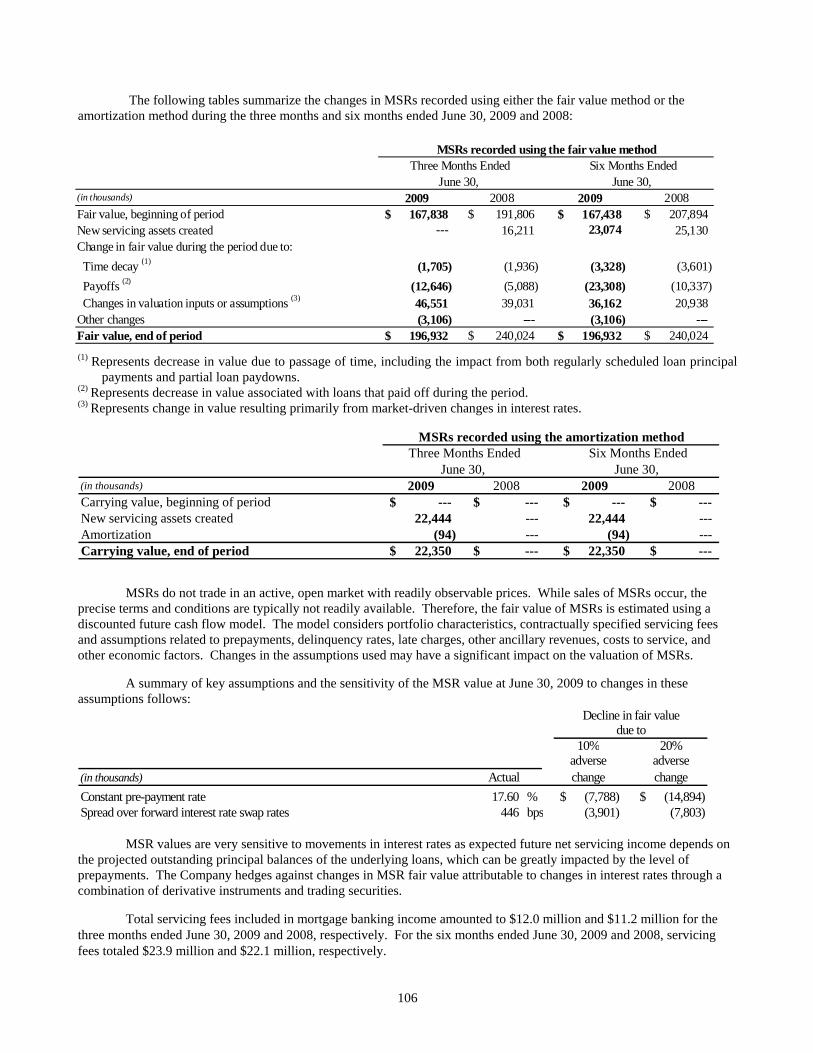
The following tables summarize the changes in MSRs recorded using either the fair value method or the
amortization method during the three months and six months ended June 30, 2009 and 2008:
(in thousands) 2009 2008 2009 2008Fair value, beginning of period 167,838$ 191,806$ 167,438$ 207,894$ New servicing assets created --- 16,211 23,074 25,130 Change in fair value during the period due to: Time decay (1) (1,705) (1,936) (3,328) (3,601) Payoffs (2) (12,646) (5,088) (23,308) (10,337) Changes in valuation inputs or assumptions (3) 46,551 39,031 36,162 20,938 Other changes (3,106) --- (3,106) --- Fair value, end of period 196,932$ 240,024$ 196,932$ 240,024$
MSRs recorded using the fair value methodSix Months Ended
June 30, Three Months Ended
June 30,
(1) Represents decrease in value due to passage of time, including the impact from both regularly scheduled loan principal
payments and partial loan paydowns. (2) Represents decrease in value associated with loans that paid off during the period. (3) Represents change in value resulting primarily from market-driven changes in interest rates.
(in thousands) 2009 2008 2009 2008Carrying value, beginning of period ---$ ---$ ---$ ---$ New servicing assets created 22,444 --- 22,444 --- Amortization (94) --- (94) --- Carrying value, end of period 22,350$ ---$ 22,350$ ---$
MSRs recorded using the amortization methodSix Months Ended
June 30, Three Months Ended
June 30,
MSRs do not trade in an active, open market with readily observable prices. While sales of MSRs occur, the
precise terms and conditions are typically not readily available. Therefore, the fair value of MSRs is estimated using a discounted future cash flow model. The model considers portfolio characteristics, contractually specified servicing fees and assumptions related to prepayments, delinquency rates, late charges, other ancillary revenues, costs to service, and other economic factors. Changes in the assumptions used may have a significant impact on the valuation of MSRs.
A summary of key assumptions and the sensitivity of the MSR value at June 30, 2009 to changes in these assumptions follows:
10% 20%adverse adverse
(in thousands) change changeConstant pre-payment rate 17.60 % (7,788)$ (14,894)$ Spread over forward interest rate swap rates 446 bps (3,901) (7,803)
Decline in fair valuedue to
Actual
MSR values are very sensitive to movements in interest rates as expected future net servicing income depends on
the projected outstanding principal balances of the underlying loans, which can be greatly impacted by the level of prepayments. The Company hedges against changes in MSR fair value attributable to changes in interest rates through a combination of derivative instruments and trading securities.
Total servicing fees included in mortgage banking income amounted to $12.0 million and $11.2 million for the three months ended June 30, 2009 and 2008, respectively. For the six months ended June 30, 2009 and 2008, servicing fees totaled $23.9 million and $22.1 million, respectively.
106

Automobile Loans and Leases
During the first quarter of 2009, Huntington transferred $1.0 billion automobile loans and leases to a trust in a securitization transaction. The securitization qualified for sale accounting under Statement No. 140. Huntington retained $210.9 million of the related securities and recorded a $47.1 million retained residual interest as a result of the transaction. Subsequent to the transaction, Huntington sold $78.4 million of these securities in the second quarter of 2009. These amounts were recorded as investment securities on Huntington’s condensed consolidated balance sheet. Huntington also recorded a $5.9 million loss in other noninterest income on the condensed consolidated statement of income and recorded a $19.5 million servicing asset in accrued income and other assets associated with this transaction.
Automobile loan servicing rights are accounted for under the amortization method. A servicing asset is established at fair value at the time of the sale. The servicing asset is then amortized against servicing income. Impairment, if any, is recognized when carrying value exceeds the fair value as determined by calculating the present value of expected net future cash flows. The primary risk characteristic for measuring servicing assets is payoff rates of the underlying loan pools. Valuation calculations rely on the predicted payoff assumption and, if actual payoff is quicker than expected, then future value would be impaired.
Changes in the carrying value of automobile loan servicing rights for the three months and six months ended June 30, 2009 and 2008, and the fair value at the end of each period were as follows:
(in thousands) 2009 2008 2009 2008Carrying value, beginning of period 20,051$ 3,248$ 1,656$ 4,099$ New servicing assets --- --- 19,538 - Amortization (2,628) (604) (3,771) (1,455) Carrying value, end of period 17,423$ 2,644$ 17,423$ 2,644$ Fair value, end of period 18,401$ 3,626$ 18,401$ 3,626$
Six Months EndedJune 30,
Three Months EndedJune 30,
Huntington has retained servicing responsibilities on sold automobile loans and receives annual servicing fees
from 0.55% to 1.00% and other ancillary fees of approximately 0.40% to 0.50% of the outstanding loan balances. Servicing income, net of amortization of capitalized servicing assets, amounted to $1.6 million and $1.9 million for the three months ended June 30, 2009 and 2008, respectively. For the six months ended June 30, 2009 and 2008, servicing income, net of amortization of capitalized servicing assets, was $2.8 million and $4.0 million, respectively. Note 6 – Goodwill and Other Intangible Assets
During the second quarter of 2009, Huntington reorganized its internal reporting structure. The Regional Banking reporting unit, which through March 31, 2009 had been managed geographically, is now managed on a product segment approach. Regional Banking was divided into Commercial Banking, Retail and Business Banking, and Commercial Real Estate segments. Regional Banking goodwill was assigned to the new reporting units affected using a relative fair value allocation. Auto Finance and Dealer Services (AFDS), Private Financial Group (PFG), and Treasury / Other remained essentially unchanged. A rollforward of goodwill including the reallocation noted above, was as follows:
Retail &
Regional Business Commercial Commercial Treasury/ Huntington(in thousands) Banking Banking Banking Real Estate PFG Other ConsolidatedBalance, January 1, 2009 2,888,344$ ---$ ---$ ---$ 153,178$ 13,463$ 3,054,985$
Impairment, March 31, 2009 (2,573,818) --- --- --- (28,895) --- (2,602,713) Reallocation of goodwill (314,526) 309,518 5,008 --- --- --- ---
Balance, April 1, 2009 --- 309,518 5,008 --- 124,283 13,463 452,272 Impairment --- --- --- --- --- (4,231) (4,231) Other adjustments --- --- --- --- --- (162) (162)
Balance, June 30, 2009 ---$ 309,518$ 5,008$ ---$ 124,283$ 9,070$ 447,879$
In accordance with FASB Statement No. 142, Goodwill and Other Intangible Assets (Statement No. 142),
goodwill is not amortized but is evaluated for impairment on an annual basis at October 1st of each year or whenever
107

events or changes in circumstances indicate that the carrying value may not be recoverable. During the first quarter of 2009, Huntington experienced a sustained decline in its stock price, which was primarily attributable to the continuing economic slowdown and increased market concern surrounding financial institutions’ credit risks and capital positions as well as uncertainty related to increased regulatory supervision and intervention. Huntington determined that these changes would more likely than not reduce the fair value of certain reporting units below their carrying amounts. Therefore, Huntington performed a goodwill impairment test, which resulted in a goodwill impairment charge of $2,603 million in the first quarter of 2009.
An impairment charge of $4.3 million was recorded related to the sale of a small payments-related business
completed in July 2009. Huntington concluded that no other goodwill impairment was required during the 2009 second quarter.
At June 30, 2009, December 31, 2008, and June 30, 2008, Huntington’s other intangible assets consisted of the
following:
Gross Accumulated Net(in thousands) Carrying Amount Amortization Carrying ValueJune 30, 2009
Core deposit intangible 373,300$ (139,826)$ 233,474$ Customer relationship 104,574 (21,399) 83,175 Other 29,327 (23,509) 5,818
Total other intangible assets 507,201$ (184,734)$ 322,467$ December 31, 2008
Core deposit intangible 373,300$ (111,163)$ 262,137$ Customer relationship 104,574 (16,776) 87,798 Other 29,327 (22,559) 6,768
Total other intangible assets 507,201$ (150,498)$ 356,703$ June 30, 2008
Core deposit intangible 373,300$ (78,610)$ 294,690$ Customer relationship 104,574 (11,926) 92,648 Other 29,177 (21,265) 7,912
Total other intangible assets 507,051$ (111,801)$ 395,250$
The estimated amortization expense of other intangible assets for the remainder of 2009 and the next five years are as follows:
Amortization(in thousands) Expense
2009 34,157$ 2010 60,455 2011 53,310 2012 46,066 2013 40,429 2014 35,744
108

Note 7 – Other Comprehensive Income
The components of Huntington’s other comprehensive income in the three and six months ended June 30, 2009 and 2008, were as follows:
(in thousands) 2009 2008 2009 2008
(5,448)$ -$ (5,448)$ -$ Related tax benefit 1,907 - 1,907 -
Net (3,541) - (3,541) - Non-credit-related impairment losses on debt securities not expected to be sold (68,528) - (68,528) -
Related tax benefit (expense) 23,985 - 23,985 - Net (44,543) - (44,543) -
Unrealized net (losses) gains 118,702 (97,886) 193,405 (203,997) Related tax benefit (expense) (41,642) 34,597 (68,029) 72,106
Net 77,060 (63,289) 125,376 (131,891)
Realized net gains (losses) 7,340 (2,073) 5,273 (3,502) Related tax (expense) benefit (2,569) 726 (1,846) 1,226
Net 4,771 (1,347) 3,427 (2,276)
Net 37,288 (64,636) 84,260 (134,167)
Unrealized net (losses) gains 309 (3,502) (135) (3,276) Related tax benefit (expense) (108) 1,226 48 1,147
Net 201 (2,276) (87) (2,129)
Realized net gains (losses) - - - - Related tax (expense) benefit - - - -
Net - - - -
Net 201 (2,276) (87) (2,129)
Unrealized net losses (45,173) (84,386) (46,799) (84,765) Related tax benefit 15,811 29,535 16,380 29,668
Net (29,362) (54,851) (30,419) (55,097)
- - - (5,898) Related tax benefit - - - 2,064
Net - - - (3,834) Amortization included in net periodic benefit costs:
Net actuarial loss 1,744 802 3,488 1,605 Prior service cost 252 241 505 482 Transition obligation 277 277 554 554 Related tax benefit (expense) (795) (462) (1,592) (925)
Net 1,478 858 2,955 1,716 Total other comprehensive income (loss) 6,064$ (120,905)$ 53,168$ (193,511)$
Cumulative effect of change in accounting principle for other-than-temporarily impaired debt securities
Total unrealized holding (losses) gains on debt securities available for sale arising during the period, net of reclassification adjustment for net (losses) gains included in net income
Cumulative effect of changing measurement date provisions for pension and post-retirement assets and obligations
Unrealized holding (losses) gains on debt securities available for sale arising during the period:
Unrealized holding (losses) gains on equity securities available for sale arising during the period:
Reclassification adjustment for net losses (gains) losses included in net
Reclassification adjustment for net losses (gains) losses included in net
Total unrealized holding (losses) gains on equity securities available for sale arising during the period, net of reclassification adjustment for net gains included in net income
Unrealized gains and losses on derivatives used in cash flow hedging relationships arising during the period:
Six Months EndedJune 30,
Three Months EndedJune 30,
109

Activity in accumulated other comprehensive income for each of the six month periods ended June 30, 2009 and
2008, was as follows:
Amortizationincluded
in net periodic(in thousands) benefit costs TotalBalance, December 31, 2007 (10,001)$ (10)$ 4,553$ (44,153)$ (49,611)$ Cumulative effect of change in measurement date provisions for pension and post-retirement assets and obligations - - - (3,834) (3,834) Period change (134,167) (2,129) (55,097) 1,716 (189,677) Balance, June 30, 2008 (144,168)$ (2,139)$ (50,544)$ (46,271)$ (243,122)$
Balance, December 31, 2008 (207,427)$ (329)$ 44,638$ (163,575)$ (326,693)$ Cumulative effect of change in accounting principle for other-than-temporarily impaired debt securities (3,541) - - - (3,541) Period change 84,260 (1) (87) (30,419) 2,955 56,709 Balance, June 30, 2009 (126,708)$ (416)$ 14,219$ (160,620)$ (273,525)$ (1) includes $68.5 million of unrealized losses in which other-than temporary impairment has been recognized.
Unrealized gains and losses on
equity securities
Unrealized gains and losses on debt
securities
Unrealized gains and losses on cash
flow hedging derivatives
Note 8 – Shareholders’ Equity Issuance of Common Stock
During the 2009 second quarter, Huntington completed an offering of 103.5 million shares of its common stock at a price to the public of $3.60 per share, or $372.6 million in aggregate gross proceeds.
Also, during the 2009 second quarter, Huntington completed two separate “discretionary equity issuance”
programs. These programs allowed the Company to take advantage of market opportunities to issue a total of 56.9 million new shares of common stock worth a total of $195.9 million. Sales of the common shares were made through ordinary brokers’ transactions on the NASDAQ Global Select Market or otherwise at the prevailing market prices. Conversion of Convertible Preferred Stock
In 2008, Huntington completed the public offering of 569,000 shares of 8.50% Series A Non-Cumulative Perpetual Convertible Preferred Stock (Series A Preferred Stock) with a liquidation preference of $1,000 per share, resulting in an aggregate liquidation preference of $569 million.
During the 2009 first and second quarters, Huntington entered into agreements with various institutional investors
exchanging shares of common stock for shares of the Series A Preferred Stock held by the institutional investors. The table below provides details of the aggregate activities:
First Second
(in thousands) Quarter 2009 Quarter 2009 TotalPreferred shares exchanged 114 92 206 Common shares issued:
At stated convertible option 9,547 7,730 17,277 As deemed dividend 15,044 8,751 23,795
Total common shares issued: 24,591 16,481 41,072
Deemed dividend $27,742 $28,293 $56,035
110

Each share of the Series A Preferred Stock is non-voting and may be converted at any time, at the option of the holder, into 83.668 shares of common stock of Huntington, which represents an approximate initial conversion price of $11.95 per share of common stock (for a total of approximately 30.3 million shares at June 30, 2009). The conversion rate and conversion price will be subject to adjustments in certain circumstances. On or after April 15, 2013, at the option of Huntington, the Series A Preferred Stock will be subject to mandatory conversion into Huntington's common stock at the prevailing conversion rate, if the closing price of Huntington's common stock exceeds 130% of the conversion price for 20 trading days during any 30 consecutive trading day period.
Troubled Asset Relief Program (TARP)
In 2008, Huntington received $1.4 billion of equity capital by issuing to the U.S. Department of Treasury 1.4
million shares of Huntington’s 5.00% Series B Non-voting Cumulative Preferred Stock, par value $0.01 per share with a liquidation preference of $1,000 per share, and a ten-year warrant to purchase up to 23.6 million shares of Huntington’s common stock, par value $0.01 per share, at an exercise price of $8.90 per share. The proceeds received were allocated to the preferred stock and additional paid-in-capital based on their relative fair values. The resulting discount on the preferred stock is amortized against retained earnings and is reflected in Huntington’s consolidated statement of income as “Dividends on preferred shares”, resulting in additional dilution to Huntington’s earnings per share. The warrants are immediately exercisable, in whole or in part, over a term of 10 years. The warrants are included in Huntington’s diluted average common shares outstanding using the treasury stock method. Both the preferred securities and warrants were accounted for as additions to Huntington’s regulatory Tier 1 and Total capital.
The Series B Preferred Stock is not mandatorily redeemable and will pay cumulative dividends at a rate of 5% per year for the first five years and 9% per year thereafter. Huntington cannot redeem the preferred securities during the first three years after issuance except with the proceeds from a “qualified equity offering.” Any redemption requires Federal Reserve approval. The Series B Preferred Stock rank on equal priority with Huntington’s existing 8.50% Series A Non-Cumulative Perpetual Convertible Preferred Stock.
A company that participates in the TARP must adopt certain standards for executive compensation, including (a) prohibiting “golden parachute” payments as defined in the Emergency Economic Stabilization Act of 2008 (EESA) to senior executive officers; (b) requiring recovery of any compensation paid to senior executive officers based on criteria that is later proven to be materially inaccurate; (c) prohibiting incentive compensation that encourages unnecessary and excessive risks that threaten the value of the financial institution, and (d) accepting restrictions on the payment of dividends and the repurchase of common stock. As of June 30, 2009, Huntington is in compliance with all TARP standards and restrictions.
111

Note 9 – (Loss) Earnings per Share
Basic loss or earnings per share is the amount of (loss) earnings (adjusted for dividends declared on preferred stock) available to each share of common stock outstanding during the reporting period. Diluted (loss) earnings per share is the amount of loss or earnings available to each share of common stock outstanding during the reporting period adjusted to include the effect of potentially dilutive common shares. Potentially dilutive common shares include incremental shares issued for stock options, restricted stock units, distributions from deferred compensation plans, and the conversion of the Company’s convertible preferred stock and warrants (See Note 8). Potentially dilutive common shares are excluded from the computation of diluted earnings per share in periods in which the effect would be antidilutive. For diluted (loss) earnings per share, net (loss) income available to common shares can be affected by the conversion of the Company’s convertible preferred stock. Where the effect of this conversion would be dilutive, net (loss) income available to common shareholders is adjusted by the associated preferred dividends. The calculation of basic and diluted (loss) earnings per share for the three months and six months ended June 30, 2009 and 2008, was as follows:
(in thousands, exc ept per share amounts) 2009 2008 2009 2008Basic (loss) earnings per common shareNet (loss) income (125,095)$ 101,352$ (2,558,302)$ 228,420$
Preferred Class B and Class A stock dividends (25,179) (11,151) (52,322) (11,151)$ Amortization of discount on issuance of Preferred Class B stoc (3,979) --- (7,887) Deemed dividend on conversion of Preferred Class A stock (28,293) --- (56,035)
Net (loss) income available to common shareholders (182,546)$ 90,201$ (2,674,546)$ 217,269$Average common shares issued and outstanding 459,246 366,206 413,083 366,221 Basic (loss) earnings per common share (0.40)$ 0.25$ (6.47)$ 0.59$
Diluted (loss) earnings per common shareNet (loss) income available to common shareholders (182,546)$ 90,201$ (2,674,546)$ 217,280$
Effect of assumed preferred stock conversion --- --- --- 11,151$ Net (loss) income applicable to diluted earnings per share (182,546)$ 90,201$ (2,674,546)$ 228,431$Average common shares issued and outstanding 459,246 366,206 413,083 366,221 Dilutive potential common shares: Stock options and restricted stock units --- 221 --- 212 Shares held in deferred compensation plans --- 807 --- 788 Conversion of preferred stock --- --- --- 20,101 Dilutive potential common shares: --- 1,028 --- 21,101 Total diluted average common shares issued and outstanding 459,246 367,234 413,083 387,322 Diluted (loss) earnings per common share (0.40)$ 0.25$ (6.47)$ 0.59$
Three Months Ended Six Months EndedJune 30, June 30,
Options to purchase 23.3 million and 26.4 million shares during the three months and six months ended June 30, 2008, respectively, were outstanding but were not included in the computation of diluted earnings per share because the effect would have been antidilutive. The weighted average exercise price for these options was $18.62 per share for the three months and six months ended June 30, 2009, and $20.35 per share for the three months and six months ended June 30, 2008. Due to the loss attributable to common shareholders for the three months and six months ended June 30, 2009, no additional potentially dilutive shares were included in loss per share calculation as including such shares in the calculation would have reduced the reported loss per share.
112

Note 10 – Share-based Compensation
Huntington sponsors nonqualified and incentive share-based compensation plans. These plans provide for the granting of stock options and other awards to officers, directors, and other employees. Compensation costs are included in personnel costs on the condensed consolidated statements of income. Stock options are granted at the closing market price on the date of the grant. Options granted typically vest ratably over three years or when other conditions are met. Options granted prior to May 2004 have a term of ten years. All options granted after May 2004 have a term of seven years.
Huntington uses the Black-Scholes option-pricing model to value share-based compensation expense. This model assumes that the estimated fair value of options is amortized over the options’ vesting periods. Forfeitures are estimated at the date of grant based on historical rates and reduce the compensation expense recognized. The risk-free interest rate is based on the U.S. Treasury yield curve in effect at the date of grant. Expected volatility is based on the estimated volatility of Huntington’s stock over the expected term of the option. The expected dividend yield is based on the dividend rate and stock price at the date of the grant. The following table illustrates the weighted-average assumptions used in the option-pricing model for options granted in each of the periods presented.
2009 2008 2009 2008Assumptions
Risk-free interest rate 2.63 % 2.98 % 2.03 % 3.12 %Expected dividend yield 1.20 5.11 0.84 6.82Expected volatility of Huntington's common stock 35.0 27.5 35.0 23.7Expected option term (years) 6.0 6.0 6.0 6.0
Weighted-average grant date fair value per share 1.18$ 1.71$ 1.66$ 1.21$
Three Months EndedJune 30,
Six Months EndedJune 30,
As a result of increased employee turnover, during the 2009 second quarter Huntington updated its forfeiture rate
assumption and adjusted share-based compensation expense to account for the higher forfeiture rate. This resulted in a reduction to share-based compensation expense of $2.8 million. The following table illustrates total share-based compensation expense for the three months ended June 30, 2009 and 2008:
(in thousands) 2009 2008 2009 2008Share-based compensation expense (183)$ 3,540$ 2,640$ 7,194$ Tax (expense) benefit (64) 1,239 924 2,518
Six Months EndedJune 30,
Three Months EndedJune 30,
Upon adoption of Financial Accounting Standards Board Statement No. 123 (revised 2004), Share-Based
Payment on January 1, 2006, Huntington established an additional paid-in capital pool (APIC Pool). With the continued decline in Huntington’s stock price, the tax deductions have been less than the compensation expense recorded for book purposes, causing the related APIC Pool to be reduced to zero. As a result, Huntington will be required to take a tax expense equal to any short fall in future periods.
113

Huntington’s stock option activity and related information for the six months ended June 30, 2009, was as
follows:
Weighted-Weighted- Average
Average Remaining AggregateExercise Contractual Intrinsic
(in thousands, except per share amounts) Options Price Life (Years) ValueOutstanding at January 1, 2009 26,289 19.45$ Granted 1,025 4.89 Exercised - - Forfeited/expired (4,024) 20.50 Outstanding at June 30, 2009 23,290 18.62$ 3.5 45$ Exercisable at June 30, 2009 19,433 20.10$ 3.1 -$
The aggregate intrinsic value represents the amount by which the fair value of underlying stock exceeds the “in-
the-money” option exercise price. There were no exercises of stock options in the first six months of 2009 or 2008. Huntington also grants restricted stock units and awards. Restricted stock units and awards are issued at no cost to
the recipient, and can be settled only in shares at the end of the vesting period. Restricted stock awards provide the holder with full voting rights and cash dividends during the vesting period. Restricted stock units do not provide the holder with voting rights or cash dividends during the vesting period and are subject to certain service restrictions. The fair value of the restricted stock units and awards is the closing market price of the Company’s common stock on the date of award.
The following table summarizes the status of Huntington's restricted stock units and restricted stock awards as of
June 30, 2009, and activity for the six months ended June 30, 2009: Weighted- Weighted-
Average AverageRestricted Grant Date Restricted Grant Date
Stock Fair Value Stock Fair Value(in thousands, except per share amounts) Units Per Share Awards Per ShareNonvested at January 1, 2009 1,823 14.64$ - -$ Granted 114 3.07 74 1.66 Vested (68) 16.08 - - Forfeited (186) 15.18 - - Nonvested at June 30, 2009 1,683 13.73$ 74 1.66$
The weighted-average grant date fair value of nonvested shares granted for the six months ended June 30, 2009 and 2008, were $2.52 and $11.99, respectively. The total fair value of awards vested during the six months ended June 30, 2009 and 2008, was $0.2 million and $0.1 million, respectively. As of June 30, 2009, the total unrecognized compensation cost related to nonvested awards was $7.2 million with a weighted-average remaining expense recognition period of 1.6 years.
Of the 32.4 million shares of common stock authorized for issuance under the plans at June 30, 2009, 23.9 million were outstanding and 8.5 million were available for future grants. Huntington issues shares to fulfill stock option exercises and restricted stock units from available authorized shares. At June 30, 2009, the Company believes there are adequate authorized shares to satisfy anticipated stock option exercises in 2009.
114

Note 11 – Fair Values of Assets and Liabilities
Huntington adopted FASB Statement No. 157, Fair Value Measurements (Statement No. 157) and FASB Statement No. 159, The Fair Value Option for Financial Assets and Financial Liabilities (Statement No. 159) effective January 1, 2008. Huntington elected to apply the provisions of Statement No. 159, the fair value option, for mortgage loans originated with the intent to sell which are included in loans held for sale.
At June 30, 2009, mortgage loans held for sale had an aggregate fair value of $545.1 million and an aggregate outstanding principal balance of $540.9 million. Interest income on these loans is recorded in interest and fees on loans and leases. Included in mortgage banking income were net gains resulting from changes in fair value of these loans, including net realized gains of $55.4 million and $17.8 million for the six months ended June 30, 2009 and 2008, respectively.
Statement No. 157 defines fair value as the exchange price that would be received for an asset or paid to transfer a liability (an exit price) in the principal or most advantageous market for the asset or liability in an orderly transaction between market participants on the measurement date. Statement No. 157 also establishes a three-level valuation hierarchy for disclosure of fair value measurements. The valuation hierarchy is based upon the transparency of inputs to the valuation of an asset or liability as of the measurement date. The three levels are defined as follows:
Level 1 – inputs to the valuation methodology are quoted prices (unadjusted) for identical assets or liabilities in active markets. Level 2 – inputs to the valuation methodology include quoted prices for similar assets and liabilities in active markets, and inputs that are observable for the asset or liability, either directly or indirectly, for substantially the full term of the financial instrument. Level 3 – inputs to the valuation methodology are unobservable and significant to the fair value measurement.
A financial instrument’s categorization within the valuation hierarchy is based upon the lowest level of input that is significant to the fair value measurement.
Following is a description of the valuation methodologies used for instruments measured at fair value, as well as the general classification of such instruments pursuant to the valuation hierarchy.
Securities Where quoted prices are available in an active market, securities are classified within Level 1 of the valuation hierarchy. Level 1 securities include US Treasury and other federal agency securities, and money market mutual funds. If quoted market prices are not available, then fair values are estimated by using pricing models, quoted prices of securities with similar characteristics, or discounted cash flows. Level 2 securities include US Government and agency mortgage-backed securities and municipal securities. In certain cases where there is limited activity or less transparency around inputs to the valuation, securities are classified within Level 3 of the valuation hierarchy. Securities classified within Level 3 include asset backed securities and private label CMOs, for which Huntington obtains third party pricing. With the current market conditions, the assumptions used to determine the fair value of many Level 3 securities have greater subjectivity due to the lack of observable market transactions. Mortgage loans held for sale Mortgage loans held for sale are estimated using security prices for similar product types and, therefore, are classified in Level 2. Mortgage servicing rights MSRs do not trade in an active, open market with readily observable prices. For example, sales of MSRs do occur, but the precise terms and conditions typically are not readily available. Accordingly, MSRs are classified in Level 3. Equity Investments Equity investments are valued initially based upon transaction price. The carrying values are then adjusted from the transaction price to reflect expected exit values as evidenced by financing and sale transactions with third parties, or when determination of a valuation adjustment is considered necessary based upon a variety of factors including, but not limited to, current operating performance and future expectations of the particular investment, industry valuations of comparable public companies, and changes in market outlook. Due to the absence of quoted market prices and inherent lack of
115

liquidity and the long-term nature of such assets, these equity investments are included in Level 3. Certain equity investments are accounted for under the equity method and, therefore, are not subject to the fair value disclosure requirements. Derivatives Huntington uses derivatives for a variety of purposes including asset and liability management, mortgage banking, and for trading activities. Level 1 derivatives consist of exchange traded options and forward commitments to deliver mortgage backed securities which have quoted prices. Level 2 derivatives include basic asset and liability conversion swaps and options, and interest rate caps. Derivative instruments offered to customers are adjusted for credit considerations related to the customer based upon individual credit considerations. These derivative positions are valued using internally developed models that use readily observable market parameters. Derivatives in Level 3 consist primarily of interest rate lock agreements related to mortgage loan commitments. The valuation includes assumptions related to the likelihood that a commitment will ultimately result in a closed loan, which is a significant unobservable assumption. Assets and Liabilities measured at fair value on a recurring basis
Assets and liabilities measured at fair value on a recurring basis at June 30, 2009 and 2008 are summarized below:
Netting Balance at(in thousands) Level 1 Level 2 Level 3 Adjustments (1) June 30, 2009AssetsTrading account securities 58,763$ 37,157$ 95,920$ Investment securities 2,377,767 2,032,372 1,096,793$ 5,506,932 Mortgage loans held for sale 545,119 545,119 Mortgage servicing rights 196,932 196,932 Derivative assets 7,920 337,491 3,180 (115,701)$ 232,890 Equity investments 28,462 28,462 LiabilitiesDerivative liabilities 1,744 236,069 7,717 (87,887) 157,643
Netting Balance at(in thousands) Level 1 Level 2 Level 3 Adjustments (1) June 30, 2008AssetsTrading account securities 43,200$ 1,053,039$ 1,096,239$ Investment securities 358,681 3,331,584 673,739$ 4,364,004 Mortgage loans held for sale 350,304 350,304 Mortgage servicing rights 240,024 240,024 Derivative assets 3,473 140,126 2,708 (17,358)$ 128,949 Equity investments 32,200 32,200 LiabilitiesDerivative liabilities 1,626 153,662 703 (50,978) 105,013
positive and negative positions and cash collateral held or placed with the same counterparties.
Fair Value Measurements at Reporting Date Using
(1) Amounts represent the impact of legally enforceable master netting agreements that allow the Company to settle
Fair Value Measurements at Reporting Date Using
116

The tables below present a rollforward of the balance sheet amounts for the three months and six months ended June 30, 2009 and 2008, for financial instruments measured on a recurring basis and classified as Level 3. The classification of an item as Level 3 is based on the significance of the unobservable inputs to the overall fair value measurement. However, Level 3 measurements may also include observable components of value that can be validated externally. Accordingly, the gains and losses in the table below included changes in fair value due in part to observable factors that are part of the valuation methodology. Transfers in and out of Level 3 are presented in the tables below at fair value at the beginning of the reporting period.
Mortgage NetServicing Interest Alt-A Pooled Private Equity
(in thousands) Rights Rate Locks Mortgage-backed Trust-Preferred Label CMO Other investmentsBalance, March 31, 2009 167,838$ 9,515$ 355,729$ 130,497$ 511,949$ 257,586$ 32,480$ Total gains/losses: Included in earnings 32,200 (5,843) (974) (12,422) (622) 1,298 1,389 Included in OCI (2,727) 12,296 45,077 3,152 Purchases, sales, repayments, issuances, and settlements (3,106) (1,109) (77,963) (1,507) (45,901) (78,675) (5,407) Balance, June 30, 2009 196,932$ 2,563$ 274,065$ 128,864$ 510,503$ 183,361$ 28,462$ The amount of total gains or losses for the period included in earnings (or OCI) attributable to the change in unrealized gains or losses relating to assets still held at reporting date 32,200$ (6,952)$ (3,701)$ 126$ 44,455$ 4,450$ 1,389$
Mortgage NetServicing Interest Alt-A Pooled Private Equity
(in thousands) Rights Rate Locks Mortgage-backed Trust-Preferred Label CMO Other investmentsBalance, March 31, 2008 191,806$ 2,948$ 502,072$ 245,787$ ---$ 2,836$ 35,345$ Total gains/losses: Included in earnings 48,674 (736) 206 (6) --- (236) (4,512) Included in OCI (36,139) (31,383) --- Purchases, sales, repayments, issuances, and settlements (456) (207) (7,702) (1,653) --- (43) 1,367 Balance, June 30, 2008 240,024$ 2,005$ 458,437$ 212,745$ ---$ 2,557$ 32,200$
The amount of total gains or losses for the period included in earnings (or OCI) attributable to the change in unrealized gains or losses relating to assets still held at reporting date (48,674)$ (943)$ (35,933)$ (31,389)$ ---$ (236)$ (4,639)$
Level 3 Fair Value Measurements Three months ended June 30, 2009
Investment Securities
Level 3 Fair Value Measurements Three months ended June 30, 2008
Investment Securities
117

Mortgage NetServicing Interest Alt-A Pooled Private Equity
(in thousands) Rights Rate Locks Mortgage-backed Trust-Preferred Label CMO Other investmentsBalance, December 31, 2008 167,438$ 8,132$ 322,421$ 141,606$ 523,515$ -$ 36,893$ Total gains/losses: Included in earnings 30,212 (3,875) 1,992 (14,816) 103 1,298 69 Included in OCI 34,141 3,610 58,396 2,323 Purchases, sales, repayments, issuances, and settlements (718) (1,694) (84,489) (1,536) (71,511) 179,740 (8,500) Balance, June 30, 2009 196,932$ 2,563$ 274,065$ 128,864$ 510,503$ 183,361$ 28,462$
The amount of total gains or losses for the period included in earnings (or OCI) attributable to the change in unrealized gains or losses relating to assets still held at reporting date 30,212$ (5,843)$ 36,133$ (11,206)$ 58,499$ 3,621$ 1,389$
Mortgage NetServicing Interest Alt-A Pooled Private Equity
(in thousands) Rights Rate Locks Mortgage-backed Trust-Preferred Label CMO Other investmentsBalance, January 1, 2008 207,894$ (46)$ 547,358$ 279,175$ ---$ 7,956$ 41,516$ Total gains/losses: Included in earnings 31,937 2,253 412 (12) --- (3,753) (13,289) Included in OCI (73,588) (64,764) --- (187) Purchases, sales, repayments, issuances, and settlements 193 (202) (15,745) (1,654) --- (1,459) 3,973 Balance, June 30, 2008 240,024$ 2,005$ 458,437$ 212,745$ ---$ 2,557$ 32,200$
The amount of total gains or losses for the period included in earnings (or OCI) attributable to the change in unrealized gains or losses relating to assets still held at reporting date 31,937$ 2,051$ (73,176)$ (64,776)$ ---$ (3,940)$ (7,516)$
Six months ended June 30, 2008Investment Securities
Level 3 Fair Value Measurements Six months ended June 30, 2009
Investment Securities
Level 3 Fair Value Measurements
118

The table below summarizes the classification of gains and losses due to changes in fair value, recorded in earnings for Level 3 assets and liabilities for the three months and six months ended June 30, 2009 and 2008.
Mortgage NetServicing Interest Alt-A Pooled Private Equity
(in thousands) Rights Rate Locks Mortgage-backed Trust-Preferred Label CMO Other investmentsClassification of gains and losses in earnings: Mortgage banking income (loss) 32,200$ (5,843)$ Securities gains (losses) (5,881)$ (12,455)$ (1,251)$ Interest and fee income 4,907 33 629 1,298$ Noninterest income 1,389$ Total 32,200$ (5,843)$ (974)$ (12,422)$ (622)$ 1,298$ 1,389$
Mortgage NetServicing Interest Alt-A Pooled Private Equity
(in thousands) Rights Rate Locks Mortgage-backed Trust-Preferred Label CMO Other investmentsClassification of gains and losses in earnings: Mortgage banking income (loss) (48,674)$ (736)$ Interest and fee income 206$ (6)$ (36)$ Noninterest income (4,512)$ Total (48,674)$ (736)$ 206$ (6)$ ---$ (36)$ (4,512)$
Mortgage NetServicing Interest Alt-A Pooled Private Equity
(in thousands) Rights Rate Locks Mortgage-backed Trust-Preferred Label CMO Other investmentsClassification of gains and losses in earnings: Mortgage banking income (loss) 30,212$ (3,875)$ Securities gains (losses) (7,386)$ (14,887)$ (1,251)$ Interest and fee income 9,378 71 1,354 1,298$ Noninterest income 69$ Total 30,212$ (3,875)$ 1,992$ (14,816)$ 103$ 1,298$ 69$
Mortgage NetServicing Interest Alt-A Pooled Private Equity
(in thousands) Rights Rate Locks Mortgage-backed Trust-Preferred Label CMO Other investmentsClassification of gains and losses in earnings: Mortgage banking income (loss) 31,937$ 2,253$ Securities gains (losses) (3,143)$ Interest and fee income 412$ (12)$ (610) Noninterest income (13,289)$ Total 31,937$ 2,253$ 412$ (12)$ ---$ (3,753)$ (13,289)$
Investment Securities
Level 3 Fair Value Measurements
Investment Securities
Level 3 Fair Value Measurements Three months ended June 30, 2009
Investment Securities
Six months ended June 30, 2009Investment Securities
Level 3 Fair Value Measurements Six months ended June 30, 2008
Level 3 Fair Value Measurements Three months ended June 30, 2008
119

Assets and Liabilities measured at fair value on a nonrecurring basis
Certain assets and liabilities may be required to be measured at fair value on a nonrecurring basis in periods subsequent to their initial recognition. These assets and liabilities are not measured at fair value on an ongoing basis; however, they are subject to fair value adjustments in certain circumstances, such as when there is evidence of impairment.
Periodically, Huntington records nonrecurring adjustments of collateral-dependent loans measured for impairment
in accordance with FASB Statement No. 114, “Accounting by Creditors for Impairment of a Loan,” when establishing the allowance for credit losses. Such amounts are generally based on the fair value of the underlying collateral supporting the loan. In cases where the carrying value exceeds the fair value of the collateral, an impairment charge is recognized. During the six months of 2009 and 2008, Huntington identified $198.1 million, and $97.5 million, respectively, of impaired loans for which the fair value is recorded based upon collateral value, a Level 3 input in the valuation hierarchy. For the six months ended June 30, 2009 and 2008, nonrecurring fair value losses of $93.7 million and $51.5 million, respectively, were recorded within the provision for credit losses.
Other real estate owned properties are valued based on appraisals and third party price opinions, less estimated
selling costs. During the second quarter, Huntington recorded $172.9 million of OREO assets at fair value. Losses of $28.2 were recorded within noninterest expense.
During the 2009 second quarter, new mortgage servicing assets were created and recorded at fair value of $22.4
million (See Note 5).
Also during the 2009 second quarter, goodwill related to the sale of a small payments-related business completed in July 2009,with a carrying amount of $8.4 million was written down to its implied fair value of $4.2 million. Fair values of financial instruments
The carrying amounts and estimated fair values of Huntington’s financial instruments at June 30, 2009 and December 31, 2008 are presented in the following table:
Carrying Fair Carrying Fair(in thousands) Amount Value Amount Value
Financial Assets:Cash and short-term assets 2,475,686$ 2,475,686$ 1,137,229$ 1,137,229$ Trading account securities 95,920 95,920 88,677 88,677 Loans held for sale 559,017 559,017 390,438 390,438 Investment securities 5,934,704 5,934,704 4,384,457 4,384,457 Net loans and direct financing leases 37,577,209 32,524,867 40,191,938 33,856,153 Derivatives 232,764 232,764 458,995 458,995
Financial Liabilities:Deposits (39,165,132) (39,513,808) (37,943,286) (38,363,248) Short-term borrowings (862,056) (838,324) (1,309,157) (1,252,861) Federal Home Loan Bank advances (926,937) (926,937) (2,588,976) (2,588,445) Other long term debt (2,508,144) (2,380,252) (2,331,632) (1,979,441) Subordinated notes (1,672,887) (1,222,059) (1,950,097) (1,287,150) Derivatives (160,202) (160,202) (83,367) (83,367)
December 31, 2008June 30, 2009
The short-term nature of certain assets and liabilities result in their carrying value approximating fair value. These
include trading account securities, customers’ acceptance liabilities, short-term borrowings, bank acceptances outstanding, Federal Home Loan Bank Advances and cash and short-term assets, which include cash and due from banks, interest-bearing deposits in banks, and federal funds sold and securities purchased under resale agreements. Loan commitments and
120

letters of credit generally have short-term, variable-rate features and contain clauses that limit Huntington’s exposure to changes in customer credit quality. Accordingly, their carrying values, which are immaterial at the respective balance sheet dates, are reasonable estimates of fair value. Not all the financial instruments listed in the table above are subject to the disclosure provisions of Statement No. 157.
Certain assets, the most significant being operating lease assets, bank owned life insurance, and premises and equipment, do not meet the definition of a financial instrument and are excluded from this disclosure. Similarly, mortgage and non-mortgage servicing rights, deposit base, and other customer relationship intangibles are not considered financial instruments and are not discussed below. Accordingly, this fair value information is not intended to, and does not, represent Huntington’s underlying value. Many of the assets and liabilities subject to the disclosure requirements are not actively traded, requiring fair values to be estimated by management. These estimations necessarily involve the use of judgment about a wide variety of factors, including but not limited to, relevancy of market prices of comparable instruments, expected future cash flows, and appropriate discount rates.
The following methods and assumptions were used by Huntington to estimate the fair value of the remaining
classes of financial instruments: Loans and Direct Financing Leases Variable-rate loans that reprice frequently are based on carrying amounts, as adjusted for estimated credit losses. The fair values for other loans and leases are estimated using discounted cash flow analyses and employ interest rates currently being offered for loans and leases with similar terms. The rates take into account the position of the yield curve, as well as an adjustment for prepayment risk, operating costs, and profit. This value is also reduced by an estimate of probable losses and the credit risk associated in the loan and lease portfolio. The valuation of the loan portfolio reflected discounts that Huntington believed are consistent with transactions occurring in the market place. Deposits Demand deposits, savings accounts, and money market deposits are, by definition, equal to the amount payable on demand. The fair values of fixed-rate time deposits are estimated by discounting cash flows using interest rates currently being offered on certificates with similar maturities. Debt Fixed-rate, long-term debt is based upon quoted market prices, which are inclusive of Huntington’s credit risk. In the absence of quoted market prices, discounted cash flows using market rates for similar debt with the same maturities are used in the determination of fair value. Note 12 – Benefit Plans
Huntington sponsors the Huntington Bancshares Retirement Plan (the Plan), a non-contributory defined benefit pension plan covering substantially all employees. The Plan provides benefits based upon length of service and compensation levels. The funding policy of Huntington is to contribute an annual amount that is at least equal to the minimum funding requirements but not more than that deductible under the Internal Revenue Code.
In addition, Huntington has an unfunded, defined benefit post-retirement plan (Post-Retirement Benefit Plan) that
provides certain healthcare and life insurance benefits to retired employees who have attained the age of 55 and have at least 10 years of vesting service under this plan. For any employee retiring on or after January 1, 1993, post-retirement healthcare benefits are based upon the employee’s number of months of service and are limited to the actual cost of coverage. Life insurance benefits are a percentage of the employee’s base salary at the time of retirement, with a maximum of $50,000 of coverage.
On January 1, 2008, Huntington transitioned to fiscal year-end measurement date of plan assets and benefit obligations as required by FASB Statement No. 158, Employer's Accounting for Defined Benefit Pension and Other Postretirement Plans - An amendment of FASB Statements No. 87, 88, 106, and 132R (Statement No. 158). As a result, Huntington recognized a charge to beginning retained earnings of $4.2 million, representing the net periodic benefit costs for the last three months of 2008, and a charge to the opening balance of accumulated other comprehensive loss of $3.8 million, representing the change in fair value of plan assets and benefit obligations for the last three months of 2008 (net of amortization included in net periodic benefit cost).
121

The following table shows the components of net periodic benefit expense of the Plan and the Post-Retirement Benefit Plan:
(in thousands) 2009 2008 2009 2008Service cost 6,154$ 5,954$ 465$ 420$ Interest cost 7,056 6,761 896 903 Expected return on plan assets (10,551) (9,786) --- --- Amortization of transition asset 1 1 276 276 Amortization of prior service cost 120 79 94 95 Settlements 1,725 450 --- --- Recognized net actuarial loss (gain) 1,874 1,038 (231) (274) Benefit expense 6,379$ 4,497$ 1,500$ 1,420$
(in thousands) 2009 2008 2009 2008Service cost 12,309$ 11,908$ 930$ 840$ Interest cost 14,111 13,522 1,791 1,806 Expected return on plan assets (21,102) (19,572) --- --- Amortization of transition asset 2 2 552 552 Amortization of prior service cost 241 158 189 190 Settlements 3,450 900 --- --- Recognized net actuarial loss (gain) 3,748 2,076 (462) (548) Benefit expense 12,759$ 8,994$ 3,000$ 2,840$
Three Months EndedPension Benefits Post Retirement Benefits
Three Months EndedJune 30, June 30,
June 30, June 30,Six Months Ended Six Months EndedPension Benefits Post Retirement Benefits
There is no required minimum contribution for 2009 to the Plan. Huntington also sponsors other retirement plans, the most significant being the Supplemental Executive
Retirement Plan and the Supplemental Retirement Income Plan. These plans are nonqualified plans that provide certain former officers and directors of Huntington and its subsidiaries with defined pension benefits in excess of limits imposed by federal tax law. The cost of providing these plans was $1.0 million and $0.8 million for the three-month periods ended June 30, 2009 and 2008, respectively. For the respective six-month periods, the cost was $1.8 million and $1.7 million.
Huntington has a defined contribution plan that is available to eligible employees. Huntington matches participant
contributions, up to the first 3% of base pay contributed to the plan. Half of the employee contribution is matched on the 4th and 5th percent of base pay contributed to the plan. In the first quarter of 2009, the Plan was amended to eliminate employer matching contributions effective on or after March 15, 2009. For the six months ended June 30, 2009 and 2008, the cost of providing the plan was $3.1 million and $7.7 million.
122

Note 13 – Derivative Financial Instruments
A variety of derivative financial instruments, principally interest rate swaps, are used in asset and liability management activities to protect against the risk of adverse price or interest rate movements. These instruments provide flexibility in adjusting Huntington’s sensitivity to changes in interest rates without exposure to loss of principal and higher funding requirements. Huntington records derivatives at fair value, as further described in Note 11. Collateral agreements are regularly entered into as part of the underlying derivative agreements with Huntington’s counterparties to mitigate counter party credit risk. At June 30, 2009, December 31, 2008, and June 30, 2008, aggregate credit risk associated with these derivatives, net of collateral that has been pledged by the counterparty, was $42.4 million, $40.7 million, and $33.3 million, respectively. The credit risk associated with interest rate swaps is calculated after considering master netting agreements.
At June 30, 2009, Huntington pledged $220.4 million cash collateral to various counterparties, while various other
counterparties pledged $127.8 million to Huntington to satisfy collateral netting agreements. In the event of credit downgrades, Huntington could be required to provide an additional $1.0 million in collateral. Derivatives used in Asset and Liability Management Activities
The following table presents the gross notional values of derivatives used in Huntington’s Asset and Liability Management activities at June 30, 2009, identified by the underlying interest rate-sensitive instruments:
Fair Value Cash Flow(in thousands ) Hedges Hedges TotalInstruments associated with: Loans ---$ 8,805,000$ 8,805,000$ Deposits 801,525 --- 801,525 Subordinated notes 675,000 --- 675,000 Other long-term debt 35,000 --- 35,000 Total notional value at June 30, 2009 1,511,525$ 8,805,000$ 10,316,525$
The following table presents additional information about the interest rate swaps and caps used in Huntington’s
Asset and Liability Management activities at June 30, 2009: Average
Notional Maturity Fair(in thousands ) Value (years) ValueAsset conversion swaps Receive fixed - generic 8,805,000$ 1.6 22,314$ 2.28 % 0.57 %Total asset conversion swaps 8,805,000 1.6 22,314 2.28 0.57 Liability conversion swaps Receive fixed - generic 1,511,525 4.5 56,044 3.12 0.68 Total liability conversion swaps 1,511,525 4.5 56,044 3.12 0.68 Total swap portfolio 10,316,525 2.1 78,358 2.40 % 0.58 %
Purchased caps Interest rate caps 200,000 0.1 - Total purchased caps 200,000$ 0.1 -$
Weighted-AverageRate
Weighted-AverageStrike Rate
Receive Pay
5.50 %5.50 %
These derivative financial instruments were entered into for the purpose of managing the interest rate risk of assets and liabilities. Consequently, net amounts receivable or payable on contracts hedging either interest earning assets or interest bearing liabilities were accrued as an adjustment to either interest income or interest expense. The net amounts resulted in an increase to net interest income of $42.2 million and $3.0 million for the three months ended June 30, 2009 and 2008, respectively. For the six months ended June 30, 2009 and 2008, the net amounts resulted in an increase to net interest income of $73.4 million and $2.1 million, respectively.
123

The following table presents the fair values at June 30, 2009, December 31, 2008, and June 30, 2008 of Huntington’s derivatives that are designated and not designated as hedging instruments under Statement No. 133. Amounts in the table below are presented without the impact of any net collateral arrangements.
June 30, December 31, June 30,(in thousands) 2009 2008 2008Interest rate contracts designated as hedging instruments 87,069$ 230,601$ 14,282$ Interest rate contracts not designated as hedging instruments 284,902 436,131 124,490 Total contracts 371,971$ 666,732$ 138,772$
June 30, December 31, June 30,(in thousands) 2009 2008 2008Interest rate contracts designated as hedging instruments 8,711$ -$ 82,736$ Interest rate contracts not designated as hedging instruments 268,939 377,249 69,642 Total contracts 277,650$ 377,249$ 152,378$
Asset derivatives included in accrued income and other assets
Liability derivatives included in accrued expenses and other liabilities
Fair value hedges effectively convert deposits and subordinated and other long term debt from fixed rate obligations to floating rate. The changes in fair value of the derivative are, to the extent that the hedging relationship is effective, recorded through earnings and offset against changes in the fair value of the hedged item.
The following table presents the increase or (decrease) to interest expense for the three months and six months ending June 30, 2009 and 2008, for derivatives designated as fair value hedges under Statement No 133:
Derivatives in fair value hedging relationships
Location of change in fair value recognized in earnings on derivative
(in thousands) 2009 2008 2009 2008Interest Rate Contracts Deposits Interest expense - deposits (757)$ (1,112)$ (1,103)$ (1,539)$ Subordinated notes Interest expense - subordinated notes and other long term debt (7,305) (4,729) (13,651) (6,742) Other long term debt Interest expense - subordinated notes and other long term debt 350 1,092 836 2,666 Total (7,712)$ (4,749)$ (13,918)$ (5,615)$
Three months ended June 30,
Six months ended June 30,
Increase (decrease) to interest expense
For cash flow hedges, interest rate swap contracts were entered into that pay fixed-rate interest in exchange for the
receipt of variable-rate interest without the exchange of the contract’s underlying notional amount, which effectively converts a portion of its floating-rate debt to fixed-rate. This reduces the potentially adverse impact of increases in interest rates on future interest expense. In like fashion, certain LIBOR-based commercial and industrial loans were effectively converted to fixed-rate by entering into contracts that swap certain variable-rate interest payments for fixed-rate interest payments at designated times.
To the extent these derivatives are effective in offsetting the variability of the hedged cash flows, changes in the derivatives’ fair value will not be included in current earnings but are reported as a component of accumulated other comprehensive income in shareholders’ equity. These changes in fair value will be included in earnings of future periods when earnings are also affected by the changes in the hedged cash flows. To the extent these derivatives are not effective, changes in their fair values are immediately included in earnings.
124

The following table presents the gains and losses recognized in other comprehensive loss (OCL) and the location in the consolidated statements of income of gains and losses reclassified from OCL into earnings for the six months ending June 30, 2009 and 2008 for derivatives designated as effective cash flow hedges under Statement No 133:
Derivatives in cash flow hedging relationships
Location of gain or (loss) reclassified from accumulated OCL into earnings (effective portion)
(in thousands) 2009 2008 2009 2008Interest rate contracts Loans (41,450)$ (47,913)$ Interest and fee income - loans and leases 9,512$ (641)$ FHLB Advances 1,338 (232) Interest expense - FHLB Advances 3,744 (3,020) Deposits 253 1,699 Interest expense - deposits 3,139 (7,481) Subordinated notes 92 - Interest expense - subordinated notes and other long term (1,550) (1,792) Other long term debt --- 68 Interest expense - subordinated notes and other long term (247) (479) Total (39,767)$ (46,378)$ 14,598$ (13,413)$
Amount of gain or (loss) recognized in OCL on derivatives (effective portion)
Amount of gain or (loss) reclassified from accumulated OCL into earnings (effective portion)
The following table details the gains recognized in noninterest income on the ineffective portion on interest rate
contracts for derivatives designated as cash flow hedges for the three months and six months ending June 30, 2009 and 2008.
Derivatives in cash flow hedging relationships(in thousands) 2009 2008 2009 2008Interest rate contracts Loans (2,670)$ (443)$ 1,642$ 153$
June 30,June 30,Three months ended Six months ended
Derivatives Used in Trading Activities
Various derivative financial instruments are offered to enable customers to meet their financing and investing objectives and for their risk management purposes. Derivative financial instruments used in trading activities consisted predominantly of interest rate swaps, but also included interest rate caps, floors, and futures, as well as foreign exchange options. Interest rate options grant the option holder the right to buy or sell an underlying financial instrument for a predetermined price before the contract expires. Interest rate futures are commitments to either purchase or sell a financial instrument at a future date for a specified price or yield and may be settled in cash or through delivery of the underlying financial instrument. Interest rate caps and floors are option-based contracts that entitle the buyer to receive cash payments based on the difference between a designated reference rate and a strike price, applied to a notional amount. Written options, primarily caps, expose Huntington to market risk but not credit risk. Purchased options contain both credit and market risk. The interest rate risk of these customer derivatives is mitigated by entering into similar derivatives having offsetting terms with other counterparties. The credit risk to these customers is evaluated and included in the calculation of fair value.
The net fair values of these derivative financial instruments, for which the gross amounts are included in other assets or other liabilities, were $50.4 million, $41.9 million, and $47.3 million at June 30, 2009, December 31, 2008, and June 30, 2008. Changes in fair value of $2.6 million and $8.3 million for the three months ended June 30, 2009 and 2008 and $6.4 million and $20.0 million for the six months ended June 30, 2009 and 2008, respectively, were reflected in other noninterest income. The total notional values of derivative financial instruments used by Huntington on behalf of customers, including offsetting derivatives, were $9.8 billion, $10.9 billion, and $10.3 billion at June 30, 2009, December 31, 2008, and June 30, 2008, respectively. Huntington’s credit risks from interest rate swaps used for trading purposes were $284.9 million, $429.9 million, and $145.4 million at the same dates, respectively.
Huntington also uses certain derivative financial instruments to offset changes in value of its residential mortgage
servicing assets. These derivatives consist primarily of forward interest rate agreements and forward mortgage securities. The derivative instruments used are not designated as hedges under Statement No. 133. Accordingly, such derivatives are recorded at fair value with changes in fair value reflected in mortgage banking income. The total notional value of these derivative financial instruments at June 30, 2009, December 31, 2008, and June 30, 2008, was $4.8 billion, $2.2 billion,
125

and $1.6 billion, respectively. The total notional amount at June 30, 2009 corresponds to trading assets with a fair value of $8.1 million and trading liabilities with a fair value of $26.5 million. The losses related to derivative instruments included in mortgage banking income for the three months ended June 30, 2009 and 2008 were $50.4 million and $21.0 million, respectively and for the six months ended June 30, 2009 and 2008 were $43.7 million and $36.9 million, respectively. Total MSR hedging losses for the three months ended June 30, 2009 and 2008, were $50.2 million and $40.3 million, respectively, and for the six months ended June 30, 2009 and 2008 were $40.9 million and $40.6 million and were also included in mortgage banking income.
In connection with securitization activities, Huntington purchased interest rate caps with a notional value totaling
$1.2 billion. These purchased caps were assigned to the securitization trust for the benefit of the security holders. Interest rate caps were also sold totaling $1.2 billion outside the securitization structure. Both the purchased and sold caps are marked to market through income.
In connection with the sale of Huntington's remaining class B Visa shares, Huntington entered into a swap agreement with the purchaser of the shares. The swap agreement adjusts for dilution in the conversion ratio of class B shares resulting from the Visa litigation. At June 30, the fair value of the swap liability of $7.1 million is an estimate of the exposure liability based upon probability-weighted potential Visa litigation losses. Note 14 –Variable Interest Entities Consolidated Variable Interest Entities
Consolidated variable interest entities at June 30, 2009 consist of New Trust (See Note 4) and loan securitizations. Loan securitizations include auto loan and lease securitization trusts formed in 2008, 2006, and 2000. Huntington has determined that the trusts are not qualified special purpose entities and, therefore, are variable interest entities (VIEs) based upon equity guidelines established in FIN 46R. Huntington owns 100% of the trusts and is the primary beneficiary of the VIEs, therefore, the trusts are consolidated. The carrying amount and classification of the trusts’ assets and liabilities included in the consolidated balance sheet are as follows:
(in thousands) New Trust 2008 Trust 2006 Trust 2000 Trust TotalAssetsCash -$ 30,420$ 290,033$ 22,447$ 342,900$ Loans and leases 471,973 671,624 1,159,685 58,442 2,361,724 Allowance for loan and lease losses - (12,383) (21,537) (1,078) (34,998) Net loans and leases 471,973 659,241 1,138,148 57,364 2,326,726 Accrued income and other assets 51,655 4,267 6,196 226 62,344 Total assets 523,628$ 693,928$ 1,434,377$ 80,037$ 2,389,070$
LiabilitiesOther long-term debt 87,024$ 528,418$ 1,055,443$ -$ 1,670,885$ Accrued interest and other liabilities 10,008 789 11,761 - 22,558 Total liabilities 97,032$ 529,207$ 1,067,204$ -$ 1,693,443$
June 30, 2009
The auto loans and leases were designated to repay the securitized notes. Huntington services the loans and leases and uses the proceeds from principal and interest payments to pay the securitized notes during the amortization period. Huntington has not provided financial or other support that was not previously contractually required.
126

Trust Preferred Securities
Under FIN 46R, certain wholly-owned trusts are not consolidated. The trusts have been formed for the sole purpose of issuing trust preferred securities, from which the proceeds are then invested in Huntington junior subordinated debentures, which are reflected in Huntington’s condensed consolidated balance sheet as subordinated notes. The trust securities are the obligations of the trusts and are not consolidated within Huntington’s balance sheet. A list of trust preferred securities outstanding at June 30, 2009 follows:
Principal amount of Investment insubordinated note/ unconsolidated
(in thousands) debenture issued to trust (1) subsidiaryHuntington Capital I 138,816$ 6,186$ Huntington Capital II 60,093 3,093 Huntington Capital III 114,032 10 BankFirst Ohio Trust Preferred 23,323 619 Sky Financial Capital Trust I 65,440 1,856 Sky Financial Capital Trust II 30,929 929 Sky Financial Capital Trust III 77,974 2,320 Sky Financial Capital Trust IV 77,975 2,320 Prospect Trust I 6,186 186 Total 594,768$ 17,519$ (1) Represents the principal amount of debentures issued to each trust, including unamortized original issue discount.
Huntington’s investment in the unconsolidated trusts represents the only risk of loss. During the second quarter of 2009, Huntington redeemed a portion of the junior subordinated debt associated with
the outstanding trust preferred securities of Huntington Capital I, Huntington Capital II, and Huntington Capital III, for an aggregate of $96.2 million, resulting in a net pre tax gain of $67.4 million. This was reflected as a debt extinguishment in the condensed consolidated financial statements.
Each issue of the junior subordinated debentures has an interest rate equal to the corresponding trust securities
distribution rate. Huntington has the right to defer payment of interest on the debentures at any time, or from time to time for a period not exceeding five years, provided that no extension period may extend beyond the stated maturity of the related debentures. During any such extension period, distributions to the trust securities will also be deferred and Huntington’s ability to pay dividends on its common stock will be restricted. Periodic cash payments and payments upon liquidation or redemption with respect to trust securities are guaranteed by Huntington to the extent of funds held by the trusts. The guarantee ranks subordinate and junior in right of payment to all indebtedness of the company to the same extent as the junior subordinated debt. The guarantee does not place a limitation on the amount of additional indebtedness that may be incurred by Huntington. Low Income Housing Tax Credit Partnerships
Huntington makes certain equity investments in various limited partnerships that sponsor affordable housing
projects utilizing the Low Income Housing Tax Credit (LIHTC) pursuant to Section 42 of the Internal Revenue Code. The purpose of these investments is to achieve a satisfactory return on capital, to facilitate the sale of additional affordable housing product offerings and to assist us in achieving goals associated with the Community Reinvestment Act. The primary activities of the limited partnerships include the identification, development, and operation of multi-family housing that is leased to qualifying residential tenants. Generally, these types of investments are funded through a combination of debt and equity.
Huntington does not own a majority of the limited partnership interests in these entities and is not the primary
beneficiary. Huntington uses the equity method to account for the majority of its investments in these entities. These investments are included in accrued income and other assets. At June 30, 2009, we have commitments of $231.5 million of which $169.8 million are funded. The unfunded portion is included in accrued expenses and other liabilities.
127

Note 15 – Commitments and Contingent Liabilities Commitments to extend credit
In the ordinary course of business, Huntington makes various commitments to extend credit that are not reflected in the financial statements. The contract amounts of these financial agreements at June 30, 2009, December 31, 2008, and June 30, 2008, were as follows:
June 30, December 31, (in millions) 2009 2008 2008Contract amount represents credit risk
Commitments to extend creditCommercial 6,232$ 6,494$ 6,233$ Consumer 4,952 4,964 4,896 Commercial real estate 1,395 1,951 2,566
Standby letters of credit 703 1,272 1,644
June 30,
Commitments to extend credit generally have fixed expiration dates, are variable-rate, and contain clauses that permit Huntington to terminate or otherwise renegotiate the contracts in the event of a significant deterioration in the customer’s credit quality. These arrangements normally require the payment of a fee by the customer, the pricing of which is based on prevailing market conditions, credit quality, probability of funding, and other relevant factors. Since many of these commitments are expected to expire without being drawn upon, the contract amounts are not necessarily indicative of future cash requirements. The interest rate risk arising from these financial instruments is insignificant as a result of their predominantly short-term, variable-rate nature.
Standby letters of credit are conditional commitments issued to guarantee the performance of a customer to a third party. These guarantees are primarily issued to support public and private borrowing arrangements, including commercial paper, bond financing, and similar transactions. Most of these arrangements mature within two years. The carrying amount of deferred revenue associated with these guarantees was $2.8 million, $4.5 million, and $4.3 million at June 30, 2009, December 31, 2008, and June 30, 2008, respectively.
Through the Company’s credit process, Huntington monitors the credit risks of outstanding standby letters of credit. When it is probable that a standby letter of credit will be drawn and not repaid in full, losses are recognized in the provision for credit losses. At June 30, 2009, Huntington had $0.7 billion of standby letters of credit outstanding, of which 52% were collateralized. Included in this $0.7 billion total are letters of credit issued by the Bank that support $0.1 billion of securities that were issued by customers and remarketed by The Huntington Investment Company (HIC), the Company’s broker-dealer subsidiary. As a result of a change in credit ratings and pursuant to the letters of credit issued by the Bank, the Bank repurchased substantially all of these securities, net of payments and maturities, during the first six months of 2009.
Huntington uses an internal loan grading system to assess an estimate of loss on its loan and lease portfolio. The
same loan grading system is used to help monitor credit risk associated with standby letters of credit. Under this risk rating system as of June 30, 2009, approximately $98.5 million of the standby letters of credit were rated strong with sufficient asset quality, liquidity, and good debt capacity and coverage.; approximately $560.7 million were rated average with acceptable asset quality, liquidity, and modest debt capacity; and approximately $43.7 million were rated substandard with negative financial trends, structural weaknesses, operating difficulties, and higher leverage.
Commercial letters of credit represent short-term, self-liquidating instruments that facilitate customer trade
transactions and generally have maturities of no longer than 90 days. The goods or cargo being traded normally secures these instruments. Commitments to sell loans
Huntington enters into forward contracts relating to its mortgage banking business to hedge the exposures from commitments to make new residential mortgage loans with existing customers and from mortgage loans classified as held for sale. At June 30, 2009, December 31, 2008, and June 30, 2008, Huntington had commitments to sell residential real estate loans of $828.9 million, $759.4 million, and $577.0 million, respectively. These contracts mature in less than one year.
Income Taxes
128

The Company and its subsidiaries file income tax returns in the U.S. federal jurisdiction and various state, city and
foreign jurisdictions. Federal income tax audits have been completed through 2005. Various state and other jurisdictions remain open to examination for tax years 2000 and forward.
The Internal Revenue Service, State of Ohio and state tax officials have proposed adjustments to the Company’s
previously filed tax returns. Management believes that the tax positions taken by the Company related to such proposed adjustments were correct and supported by applicable statutes, regulations, and judicial authority, and intends to vigorously defend them. It is possible that the ultimate resolution of the proposed adjustments, if unfavorable, may be material to the results of operations in the period it occurs. However, although no assurance can be given, we believe that the resolution of these examinations will not, individually or in the aggregate, have a material adverse impact on our consolidated financial position. Litigation
Between December 19, 2007 and February 1, 2008, two putative class actions were filed in the United States District Court for the Southern District of Ohio, Eastern Division, against Huntington and certain of its current or former officers and directors purportedly on behalf of purchasers of Huntington securities during the periods July 20, 2007 to November 16, 2007, or July 20, 2007 to January 10, 2008. These complaints seek to allege that the defendants violated Section 10(b) of the Securities Exchange Act of 1934, as amended (the Exchange Act), and Rule 10b-5 promulgated thereunder, and Section 20(a) of the Exchange Act by issuing a series of allegedly false and/or misleading statements concerning Huntington’s financial results, prospects, and condition, relating, in particular, to its transactions with Franklin.. On June 5, 2008, the two cases were consolidated into a single action. On August 22, 2008, a consolidated complaint was filed asserting a class period of July 19, 2007 through November 16, 2007. At this stage, it is not possible for management to assess the probability of an adverse outcome, or reasonably estimate the amount of any potential loss.
Three putative derivative class action lawsuits were filed in the Court of Common Pleas of Delaware County, Ohio, the United States District Court for the Southern District of Ohio, Eastern Division, and the Court of Common Pleas of Franklin County, Ohio, between January 16, 2008, and April 17, 2008, against certain of Huntington’s current or former officers and directors variously seeking to allege breaches of fiduciary duty, waste of corporate assets, abuse of control, gross mismanagement, and unjust enrichment, all in connection with Huntington’s acquisition of Sky Financial, certain transactions between Huntington and Franklin, and the financial disclosures relating to such transactions. Huntington is named as a nominal defendant in each of these actions. At this stage of the lawsuits, it is not possible for management to assess the probability of an adverse outcome, or reasonably estimate the amount of any potential loss.
Between February 20, 2008 and February 29, 2008, three putative class action lawsuits were filed in the United States District Court for the Southern District of Ohio, Eastern Division, against Huntington, the Huntington Bancshares Incorporated Pension Review Committee, the Huntington Investment and Tax Savings Plan (the Plan) Administrative Committee, and certain of the Company’s officers and directors purportedly on behalf of participants in or beneficiaries of the Plan between either July 1, 2007 or July 20, 2007 and the present. The complaints seek to allege breaches of fiduciary duties in violation of the Employee Retirement Income Security Act (ERISA) relating to Huntington stock being offered as an investment alternative for participants in the Plan. The complaints sought money damages and equitable relief. On May 13, 2008, the three cases were consolidated into a single action. On August 4, 2008, a consolidated complaint was filed asserting a class period of July 1, 2007 through the present. On February 9, 2009, the court entered an order dismissing with prejudice the consolidated lawsuit in its entirety. Because the case is currently being appealed, it is not possible for management to assess the probability of an eventual material adverse outcome, or reasonably estimate the amount of any potential loss at this time.
On May 7, 2008, a putative class action lawsuit was filed in the United States District Court for the Southern District of Ohio, Eastern Division, against Huntington (as successor in interest to Sky Financial), and certain of Sky Financial’s former officers on behalf of all persons who purchased or acquired Sky Financial common stock in connection with and as a result of Sky Financial’s October 2006 acquisition of Waterfield Mortgage Company. The complaint seeks to allege that the defendants violated Sections 11, 12, and 15 of the Securities Act of 1933 in connection with the issuance of allegedly false and misleading registration and proxy statements leading up to the Waterfield acquisition and their disclosures about the nature and extent of Sky Financial’s lending relationship with Franklin. On May 1, 2009, Plaintiff filed a stipulation dismissing the lawsuit with prejudice. The dismissal entry was approved by the Court on May 5, 2009, and the case is now terminated.
129

Note 16 – Parent Company Financial Statements The parent company condensed financial statements, which include transactions with subsidiaries, are as follows.
Balance Sheets June 30, December 31, June 30,(in thousands) 2009 2008 2008ASSETSCash and cash equivalents (1) 1,463,068$ 1,122,056$ 665,135$ Due from The Huntington National Bank 552,481 532,746 31,481 Due from non-bank subsidiaries 289,443 338,675 331,627 Investment in The Huntington National Bank 3,012,016 5,274,261 5,664,014 Investment in non-bank subsidiaries 865,154 854,575 900,910 Accrued interest receivable and other assets 138,980 146,167 192,797 Total assets 6,321,142$ 8,268,480$ 7,785,964$
LIABILITIES AND SHAREHOLDERS' EQUITYShort-term borrowings 1,388$ 1,852$ 1,951$ Long-term borrowings 637,434 803,699 852,169 Dividends payable, accrued expenses, and other liabilities 461,798 234,023 548,631 Total liabilities 1,100,620 1,039,574 1,402,751 Shareholders' equity (2) 5,220,522 7,228,906 6,383,213 Total liabilities and shareholders' equity 6,321,142$ 8,268,480$ 7,785,964$ (1) Includes restricted cash of $125,000 at June 30, 2009 and December 31, 2008.(2) See page 94 for Huntington’s Condensed Consolidated Statements of Changes in Shareholders’ Equity.
Statements of Income(in thousands) 2009 2008 2009 2008Income Dividends from Non-bank subsidiaries ---$ 3,000$ 9,250 16,845 Interest from The Huntington National Bank 11,636 7,387 22,987 10,431 Non-bank subsidiaries 3,860 3,282 8,291 6,932 Other 67,749 65 67,569 598 Total income 83,245 13,734 108,097 34,806 Expense Personnel costs 628 5,363 2,715 10,989 Interest on borrowings 8,527 10,686 17,917 23,241 Other 6,053 4,676 12,527 8,047 Total expense 15,208 20,725 33,159 42,277 Income (loss) before income taxes and equity in undistributed net income of subsidiaries 68,037 (6,991) 74,938 (7,471) Income taxes 70,829 (3,698) 19,202 (13,190) Income before equity in undistributed net income (2,792) (3,293) 55,736 5,719 of subsidiariesIncrease (decrease) in undistributed net income of: The Huntington National Bank (133,061) 101,961 (2,593,366) 232,920 Non-bank subsidiaries 10,758 2,684 (20,672) (10,219) Net income (125,095)$ 101,352$ (2,558,302)$ 228,420$
Six months endedJune 30,
Three months endedJune 30,
130

Statements of Cash Flows(in thousands) 2009 2008Operating activities Net (loss) income (2,558,302)$ 228,420$ Adjustments to reconcile net income to net cash provided by operating activities: Equity in undistributed net income of subsidiaries 2,614,038 (222,701) Depreciation and amortization 2,950 680 Change in other, net 188,997 138 Net cash provided by operating activities 247,683 6,537 Investing activities Repayments from subsidiaries 78,527 349,898 Advances to subsidiaries (333,448) (161,584) Net cash provided by (used in) investing activities (254,921) 188,314 Financing activities Payment of borrowings (99,320) (50,000) Dividends paid on preferred stock (56,905) --- Dividends paid on common stock (43,780) (183,621) Proceeds from issuance of preferred stock --- 550,849 Proceeds from issuance of common stock 548,255 (433) Net cash used for financing activities 348,250 316,795 Change in cash and cash equivalents 341,012 511,646 Cash and cash equivalents at beginning of year 1,122,056 153,489 Cash and cash equivalents at end of year 1,463,068$ 665,135$ Supplemental disclosure: Interest paid 17,917$ 23,241$
Six months endedJune 30,
131

Note 17 – Segment Reporting
In the second quarter of 2009, Huntington reorganized its Regional Banking segment to reflect how its assets and operations are now managed. The Regional Banking line of business, which through March 31, 2009, had been managed geographically, is now managed on a product segment approach. The five distinct segments are: Retail and Business Banking, Commercial Banking, Commercial Real Estate, Auto Finance and Dealer Services (AFDS), and the Private Financial Group (PFG). A sixth group includes the Treasury function and other unallocated assets, liabilities, revenue, and expense. All periods have been reclassified to conform to the current period presentation.
Segment results are determined based upon the Company’s management reporting system, which assigns balance
sheet and income statement items to each of the business segments. The process is designed around the Company’s organizational and management structure and, accordingly, the results derived are not necessarily comparable with similar information published by other financial institutions. An overview of this system is provided below, along with a description of each segment and discussion of financial results.
Retail and Business Banking: This segment provides traditional banking products and services to consumer and small business customers located in its 11 operating regions within the six states of Ohio, Michigan, Pennsylvania, Indiana, West Virginia, and Kentucky. It provides these services through a banking network of over 600 branches, and almost 1,400 ATMs, along with internet and telephone banking channels. It also provides certain services on a limited basis outside of these six states, including mortgage banking and small business administration (SBA) lending. Retail products and services include home equity loans and lines of credit, first mortgage loans, direct installment loans, small business loans, personal and business deposit products, as well as sales of investment and insurance services. At June 30, 2009, Retail and Business Banking accounted for 41% and 73% of consolidated loans and leases and deposits, respectively. Commercial Banking: This segment provides a variety of banking products and services to customers within the Company’s primary banking markets who generally have larger credit exposures and sales revenues compared with its Retail and Business Banking customers. Commercial Banking products include commercial loans, international trade, cash management, leasing, interest rate protection products, capital market alternatives, 401(k) plans, and mezzanine investment capabilities. The Commercial Banking team also serves customers that specialize in equipment leasing, as well as serves the commercial banking needs of government entities, not-for-profit organizations, and large corporations. Commercial bankers personally deliver these products and services by developing leads through community involvement, referrals from other professionals, and targeted prospect calling. Commercial Real Estate: This segment serves professional real estate developers or other customers with real estate project financing needs within the Company’s primary banking markets. Commercial Real Estate products and services include CRE loans, cash management, interest rate protection products, and capital market alternatives. Commercial real estate bankers personally deliver these products and services by: (a) relationships with developers in the Company’s footprint who are recognized as the most experienced, well-managed, and well-capitalized, and are capable of operating in all phases of the real estate cycle (“top-tier developers”), (b) leads through community involvement, and (c) referrals from other professionals. Auto Finance and Dealer Services (AFDS): This segment provides a variety of banking products and services to more than 2,000 automotive dealerships within the Company’s primary banking markets. During the first quarter of 2009, AFDS discontinued lending activities in Arizona, Florida, Tennessee, Texas, and Virginia. Also, all lease origination activities were discontinued during the 2008 fourth quarter. AFDS finances the purchase of automobiles by customers at the automotive dealerships; finances dealerships’ new and used vehicle inventories, land, buildings, and other real estate owned by the dealership; finances dealership working capital needs; and provides other banking services to the automotive dealerships and their owners. Competition from the financing divisions of automobile manufacturers and from other financial institutions is intense. AFDS’ production opportunities are directly impacted by the general automotive sales business, including programs initiated by manufacturers to enhance and increase sales directly. Huntington has been in this line of business for over 50 years. Private Financial Group (PFG): This segment provides products and services designed to meet the needs of higher net worth customers. Revenue results from the sale of trust, asset management, investment advisory, brokerage, insurance, and private banking products and services including credit and lending activities. PFG also focuses on financial solutions for corporate and institutional customers that include investment banking, sales and trading of securities, and interest rate
132

risk management products. To serve high net worth customers, we use a unique distribution model that employs a single, unified sales force to deliver products and services mainly through Retail and Business Banking distribution channels. In addition to the Company’s five business segments, the Treasury / Other group includes revenue and expense related to assets, liabilities, and equity that are not directly assigned or allocated to one of the five business segments. Assets in this group include investment securities and bank owned life insurance. Net interest income/(expense) includes the net impact of administering the Company’s investment securities portfolios as part of overall liquidity management. A match-funded transfer pricing system is used to attribute appropriate funding interest income and interest expense to other business segments. As such, net interest income includes the net impact of any over or under allocations arising from centralized management of interest rate risk. Furthermore, net interest income includes the net impact of derivatives used to hedge interest rate sensitivity. Non-interest income includes miscellaneous fee income not allocated to other business segments, including bank owned life insurance income. Fee income also includes asset revaluations not allocated to business segments, as well as any investment securities and trading assets gains or losses. The non-interest expense includes certain corporate administrative, merger costs, and other miscellaneous expenses not allocated to business segments. This group also includes any difference between the actual effective tax rate of Huntington and the statutory tax rate used to allocate income taxes to the other segments. Listed below are certain financial results by line of business. For the three months and six months ended June 30, 2009 and 2008, operating earnings were the same as reported earnings.
133

Retail & FormerIncome Statements Business Commercial Regional Treasury/ Huntington(in thousands ) Banking Commercial Real Estate Banking AFDS PFG Other Consolidated2009Net interest income 258,833$ 77,630$ 45,856$ 382,319$ 32,063$ 26,199$ (90,682)$ 349,899$ Provision for credit losses (127,983) (107,378) (165,525) (400,886) (13,097) (9,807) 10,083 (413,707) Non interest income 128,465 20,546 166 149,177 17,151 61,597 38,020 265,945 Non interest expense (206,993) (37,552) (6,128) (250,673) (26,150) (58,612) (4,547) (339,982) Income taxes (18,313) 16,364 43,971 42,022 (3,488) (6,782) (19,002) 12,750 Operating / reported net income 34,009$ (30,390)$ (81,660)$ (78,041)$ 6,479$ 12,595$ (66,128)$ (125,095)$
2008Net interest income 243,711$ 79,125$ 42,736$ 365,572$ 36,976$ 19,717$ (32,399)$ 389,866$ Provision for credit losses (53,038) (26,953) (30,522) (110,513) (7,152) (3,148) --- (120,813) Non interest income 118,070 23,669 4,367 146,106 14,795 64,309 11,220 236,430 Non interest expense (196,345) (40,110) (6,986) (243,441) (30,318) (61,461) (42,583) (377,803) Income taxes (39,339) (12,506) (3,358) (55,203) (5,005) (6,796) 40,676 (26,328) Operating / reported net income 73,059$ 23,225$ 6,237$ 102,521$ 9,296$ 12,621$ (23,086)$ 101,352$
Retail & FormerIncome Statements Business Commercial Regional Treasury/ Huntington(in thousands of dollars) Banking Commercial Real Estate Banking AFDS PFG Other Consolidated
2009Net interest income 510,682$ 153,725$ 90,126$ 754,533$ 71,153$ 48,373$ (186,655)$ 687,404$ Provision for credit losses (219,076) (158,781) (262,932) (640,789) (57,105) (19,396) 11,746 (705,544) Non-Interest income 253,998 44,849 1,105 299,952 27,065 125,498 52,532 505,047 Non-Interest expense, excluding goodwill impairment (407,072) (70,136) (12,693) (489,901) (55,744) (119,336) (37,826) (702,807) Goodwill impairment --- --- --- (2,573,818) (1) --- (28,895) (4,231) (2,606,944) Income taxes (48,486) 10,620 64,538 26,672 5,121 (2,185) 234,934 264,542 Operating / reported net income 90,046$ (19,723)$ (119,856)$ (2,623,351)$ (9,510)$ 4,059$ 70,500$ (2,558,302)$
2008Net interest income 477,709$ 159,716$ 86,368$ 723,793$ 74,888$ 39,405$ (71,396)$ 766,690$ Provision for credit losses (93,691) (25,401) (60,911) (180,003) (24,417) (5,043) --- (209,463) Non-Interest income 204,062 48,936 8,265 261,263 27,476 131,748 51,695 472,182 Non-Interest expense (399,945) (79,617) (14,178) (493,740) (55,870) (126,624) (72,050) (748,284) Income taxes (65,847) (36,272) (6,840) (108,959) (7,727) (13,820) 77,801 (52,705) Operating / reported net income 122,288$ 67,362$ 12,704$ 202,354$ 14,350$ 25,666$ (13,950)$ 228,420$
(1) Represents the 2009 first quarter goodwill impairment charge associated with the former Regional Banking segment.The allocation of this amount to the new business segments was not practical.
Three Months Ended June 30,
Six Months Ended June 30,
134

June 30, December 31, June 30, June 30, December 31, June 30,(in millions) 2009 2008 2008 2009 2008 2008
Retail & Business Banking 18,318$ 18,230$ 18,573$ 27,852$ 27,314$ 26,238$ Commercial Banking 8,448 8,883 8,741 5,614 5,180 6,495 Commercial Real Estate 6,906 7,116 6,693 404 433 495 AFDS 5,182 6,376 6,413 84 68 59 PFG 3,389 3,242 2,963 2,728 1,777 1,695 Treasury / Other 9,154 7,618 9,061 2,483 3,171 3,142 Unallocated goodwill (1) --- 2,888 2,890 --- --- --- Total 51,397$ 54,353$ 55,334$ 39,165$ 37,943$ 38,124$
(1) Represents the balance of goodwill associated with the former Regional Banking business segment.The allocation of these amounts to the new business segments is not practical.
Assets at Deposits at
135

Item 3. Quantitative and Qualitative Disclosures about Market Risk
Quantitative and qualitative disclosures for the current period can be found in the Market Risk section of this report, which includes changes in market risk exposures from disclosures presented in Huntington’s 2008 Form 10-K. Item 4. Controls and Procedures
Huntington maintains disclosure controls and procedures designed to ensure that the information required to be disclosed in the reports that it files or submits under the Securities Exchange Act of 1934, as amended, are recorded, processed, summarized, and reported within the time periods specified in the Commission's rules and forms. Disclosure controls and procedures include, without limitation, controls and procedures designed to ensure that information required to be disclosed by an issuer in the reports that it files or submits under the Act is accumulated and communicated to the issuer's management, including its principal executive and principal financial officers, or persons performing similar functions, as appropriate to allow timely decisions regarding required disclosure. Huntington’s Management, with the participation of its Chief Executive Officer and the Chief Financial Officer, evaluated the effectiveness of Huntington’s disclosure controls and procedures (as such term is defined in Rules 13a-15(e) and 15d-15(e) under the Exchange Act) as of the end of the period covered by this report. Based upon such evaluation, Huntington’s Chief Executive Officer and Chief Financial Officer have concluded that, as of the end of such period, Huntington’s disclosure controls and procedures were effective.
There have not been any changes in Huntington's internal control over financial reporting (as such term is defined in Rules 13a-15(f) and 15d-15(f) under the Exchange Act) during the fiscal quarter to which this report relates that have materially affected, or are reasonably likely to materially affect, Huntington’s internal control over financial reporting. Item 4T. Controls and Procedures
Not applicable
PART II. OTHER INFORMATION
In accordance with the instructions to Part II, the other specified items in this part have been omitted because they are not applicable or the information has been previously reported.
Item 1. Legal Proceedings
Information required by this item is set forth in Note 15 of Notes to Unaudited Condensed Consolidated Financial Statements included in Item 1 of this report and incorporated herein by reference.
Item 1A. Risk Factors
Information required by this item is set forth in Part 1 Item 2.- Management’s Discussion and Analysis of Financial Condition and Results of Operations of this report and incorporated herein by reference.
Item 4. Submission of Matters to a Vote of Security Holders
Huntington held its annual meeting of shareholders on April 22, 2009. At this meeting, the shareholders approved the following management proposals:
Abstain/ For Against Withheld Non-Votes
1. Election of four directors to serve as Class I Directors until the 2011 Annual Meeting of Shareholders and until their successors are elected and qualified as follows:
John B. Gerlach, Jr. 221,616,912 60,977,345 D. James Hilliker 222,321,562 60,272,695 Jonathan A. Levy 255,344,947 27,249,310 Gene E. Little 254,915,637 27,678,619 2. Approve the Amended and Restated 2007 Stock and Long-
Term Incentive Plan
166,384,643 26,918,007 2,812,205 86,479,401 3. Ratification of Deloitte & Touche LLP as independent
auditors for Huntington for the year 2009.
275,427,560 6,000,177 1,166,519 4. Non-binding advisory vote on the compensation of
136

executives as disclosed in the 2009 annual proxy statement. 211,722,744 65,985,162 4,886,351
Item 6. Exhibits This report incorporates by reference the documents listed below that we have previously filed with the SEC. The SEC allows us to incorporate by reference information in this document. The information incorporated by reference is considered to be a part of this document, except for any information that is superseded by information that is included directly in this document. This information may be read and copied at the Public Reference Room of the SEC at 100 F Street, N.E., Washington, D.C. 20549. The SEC also maintains an Internet web site that contains reports, proxy statements, and other information about issuers, like us, who file electronically with the SEC. The address of the site is http://www.sec.gov. The reports and other information filed by us with the SEC are also available at our Internet web site. The address of the site is http://www.huntington.com. Except as specifically incorporated by reference into this Quarterly Report on Form 10-Q, information on those web sites is not part of this report. You also should be able to inspect reports, proxy statements, and other information about us at the offices of the NASDAQ National Market at 33 Whitehall Street, New York, New York. (a) Exhibits Incorporated from SEC File or
Registration Number
Exhibit Number
Report or Registration Statement
Exhibit Reference Document Description
3.1 Articles of Restatement of Charter Annual Report on Form 10-K for the year ended December 31, 1993.
000-02525 3(i)
3.2 Articles of Amendment to Articles of Restatement of Charter.
Current Report on Form 8-K dated May 31, 2007
000-02525 3.1
3.3 Articles of Amendment to Articles of Restatement of Charter
Current Report on Form 8-K dated May 7, 2008
000-02525 3.1
Current Report on Form 8-K dated April 22, 2008
000-02525 3.1 3.4 Articles Supplementary of Huntington Bancshares Incorporated, as of April 22, 2008.
000-02525 3.2 3.5 Articles Supplementary of Huntington Bancshares Incorporated, as of April 22. 2008.
Current Report on Form 8-K dated April 22, 2008 Current Report on Form 8-K dated November 12, 2008
001-34073 3.1 3.6 Articles Supplementary of Huntington Bancshares Incorporated, as of November 12, 2008.
Articles Supplementary of Huntington Bancshares Incorporated, as of December 31, 2006.
Annual Report on Form 10-K for the year ended December 31, 2006
000-02525 3.4 3.7
Bylaws of Huntington Bancshares Incorporated, as amended and restated, as of January 21, 2009.
Current Report on Form 8-K dated January 23, 2009.
001-34073 3.1 3.8
Instruments defining the Rights of Security Holders -- reference is made to Articles Fifth, Eighth, and Tenth of Articles of Restatement of Charter, as amended and supplemented. Instruments defining the rights of holders of long-term debt will be furnished to the Securities and Exchange Commission upon request.
4.1
10.1* 2009 Stock Option Grant Notice to Stephen D. Steinour.
Quarterly Report on Form 10-Q for the quarter ended March 31, 2009.
001-34073 10.1
10.2 Schedule identifying material details of Executive Agreements.
10.3* Relocation assistance and reimbursement agreement with Mark E. Thompson dated May 7, 2009.
12.1 Ratio of Earnings to Fixed Charges. 12.2 Ratio of Earnings to Fixed Charges and Preferred
Dividends.
31.1 Rule 13a-14(a) Certification – Chief Executive Officer.
137

31.2 Rule 13a-14(a) Certification – Chief Financial Officer. 32.1 Section 1350 Certification – Chief Executive Officer. 32.2 Section 1350 Certification – Chief Financial Officer.
* Denotes management contract or compensatory plan or arrangement.
138

SIGNATURES
Pursuant to the requirements of the Securities Exchange Act of 1934, the Registrant has duly caused this report to be signed on its behalf by the undersigned thereunto duly authorized.
Huntington Bancshares Incorporated (Registrant)
Date: August 10, 2009 /s/ Stephen D. Steinour Stephen D. Steinour Chairman, Chief Executive Officer and President Date: August 10, 2009 /s/ Donald R. Kimble Donald R. Kimble
Sr. Executive Vice President and Chief Financial Officer
139

Exhibit 31.1
CERTIFICATION
I, Stephen D. Steinour, certify that:
1. I have reviewed this Quarterly Report on Form 10-Q of Huntington Bancshares Incorporated; 2. Based on my knowledge, this report does not contain any untrue statement of a material fact or omit to
state a material fact necessary to make the statements made, in light of the circumstances under which such statements were made, not misleading with respect to the period covered by this report;
3. Based on my knowledge, the financial statements, and other financial information included in this report,
fairly present in all material respects the financial condition, results of operations, and cash flows of the registrant as of, and for, the periods presented in this report;
4. The registrant’s other certifying officers and I are responsible for establishing and maintaining disclosure
controls and procedures (as defined in Exchange Act Rules 13a-15(e) and 15d-15(e)) and internal control over financial reporting (as defined in Exchange Act Rules 13a-15(f) and 15d-15(f)), for the registrant and have:
a) designed such disclosure controls and procedures, or caused such disclosure controls and
procedures to be designed under our supervision, to ensure that material information relating to the registrant, including its consolidated subsidiaries, is made known to us by others within those entities, particularly during the period in which this report is being prepared; and
b) designed such internal control over financial reporting, or caused such internal control over
financial reporting to be designed under our supervision, to provide reasonable assurance regarding the reliability of financial reporting and the preparation of financial statements for external purposes in accordance with generally accepted accounting principles; and
c) evaluated the effectiveness of the registrant’s disclosure controls and procedures and presented
in this report our conclusions about the effectiveness of the disclosure controls and procedures, as of the end of the period covered by this report based on such evaluation; and
d) disclosed in this report any change in the registrant’s internal control over financial reporting
that occurred during the registrant’s most recent fiscal quarter that has materially affected or is reasonably likely to materially affect, the registrant’s internal control over financial reporting; and
5. The registrant’s other certifying officers and I have disclosed, based on our most recent evaluation of
internal control over financial reporting, to the registrant’s auditors and the audit committee of the registrant’s board of directors (or persons performing the equivalent functions):
a) all significant deficiencies and material weaknesses in the design or operation of internal control
over financial reporting which are reasonably likely to adversely affect the registrant’s ability to record, process, summarize, and report financial information; and
b) any fraud, whether or not material, that involves Management or other employees who have a
significant role in the registrant’s internal control over financial reporting.
Date: August 10, 2009
/s/ Stephen D. Steinour Stephen D. Steinour Chairman, Chief Executive Officer
144

Exhibit 31.2
CERTIFICATION
I, Donald R. Kimble, certify that:
1. I have reviewed this Quarterly Report on Form 10-Q of Huntington Bancshares Incorporated; 2. Based on my knowledge, this report does not contain any untrue statement of a material fact or omit to
state a material fact necessary to make the statements made, in light of the circumstances under which such statements were made, not misleading with respect to the period covered by this report;
3. Based on my knowledge, the financial statements, and other financial information included in this report,
fairly present in all material respects the financial condition, results of operations, and cash flows of the registrant as of, and for, the periods presented in this report;
4. The registrant’s other certifying officers and I are responsible for establishing and maintaining disclosure
controls and procedures (as defined in Exchange Act Rules 13a-15(e) and 15d-15(e)) and internal control over financial reporting (as defined in Exchange Act Rules 13a-15(f) and 15d-15(f)), for the registrant and have:
a) designed such disclosure controls and procedures, or caused such disclosure controls and
procedures to be designed under our supervision, to ensure that material information relating to the registrant, including its consolidated subsidiaries, is made known to us by others within those entities, particularly during the period in which this report is being prepared; and
b) designed such internal control over financial reporting, or caused such internal control over
financial reporting to be designed under our supervision, to provide reasonable assurance regarding the reliability of financial reporting and the preparation of financial statements for external purposes in accordance with generally accepted accounting principles; and
c) evaluated the effectiveness of the registrant’s disclosure controls and procedures and presented
in this report our conclusions about the effectiveness of the disclosure controls and procedures, as of the end of the period covered by this report based on such evaluation; and
d) disclosed in this report any change in the registrant’s internal control over financial reporting
that occurred during the registrant’s most recent fiscal quarter that has materially affected or is reasonably likely to materially affect, the registrant’s internal control over financial reporting; and
5. The registrant’s other certifying officers and I have disclosed, based on our most recent evaluation of
internal control over financial reporting, to the registrant’s auditors and the audit committee of the registrant’s board of directors (or persons performing the equivalent functions):
a) all significant deficiencies and material weaknesses in the design or operation of internal control
over financial reporting which are reasonably likely to adversely affect the registrant’s ability to record, process, summarize, and report financial information; and
b) any fraud, whether or not material, that involves Management or other employees who have a
significant role in the registrant’s internal control over financial reporting.
Date: August 10, 2009
/s/ Donald R. Kimble Donald R. Kimble Sr. Executive Vice President and Chief Financial Officer
145

Exhibit 32.1
SECTION 1350 CERTIFICATION
In connection with the Quarterly Report of Huntington Bancshares Incorporated (the “Company”) on Form 10-Q for the three month period ended June 30, 2009, as filed with the Securities and Exchange Commission on the date hereof (the “Report”), I, Stephen D. Steinour, Chief Executive Officer of the Company, certify, pursuant to 18 U.S.C. § 1350, as adopted pursuant to § 906 of the Sarbanes-Oxley Act of 2002, that: (1) The Report fully complies with the requirements of Section 13(a) or 15(d) of the Securities Exchange Act of 1934; and (2) The information contained in the Report fairly presents, in all material respects, the financial condition and results of operations of the Company.
/s/ Stephen D. Steinour Stephen D. Steinour Chairman, Chief Executive Officer August 10, 2009
146

Exhibit 32.2
SECTION 1350 CERTIFICATION
In connection with the Quarterly Report of Huntington Bancshares Incorporated (the “Company”) on Form 10-Q for the three month period ended June 30, 2009, as filed with the Securities and Exchange Commission on the date hereof (the “Report”), I, Donald R. Kimble, Chief Financial Officer of the Company, certify, pursuant to 18 U.S.C. § 1350, as adopted pursuant to § 906 of the Sarbanes-Oxley Act of 2002, that: (1) The Report fully complies with the requirements of Section 13(a) or 15(d) of the Securities Exchange Act of 1934; and (2) The information contained in the Report fairly presents, in all material respects, the financial condition and results of operations of the Company.
/s/ Donald R. Kimble
Donald R. Kimble Sr. Executive Vice President and Chief Financial Officer August 10, 2009
147