Unaudited Financial Statements as of December 31 2019.pdf
53
-
Upload
khangminh22 -
Category
Documents
-
view
5 -
download
0
Transcript of Unaudited Financial Statements as of December 31 2019.pdf

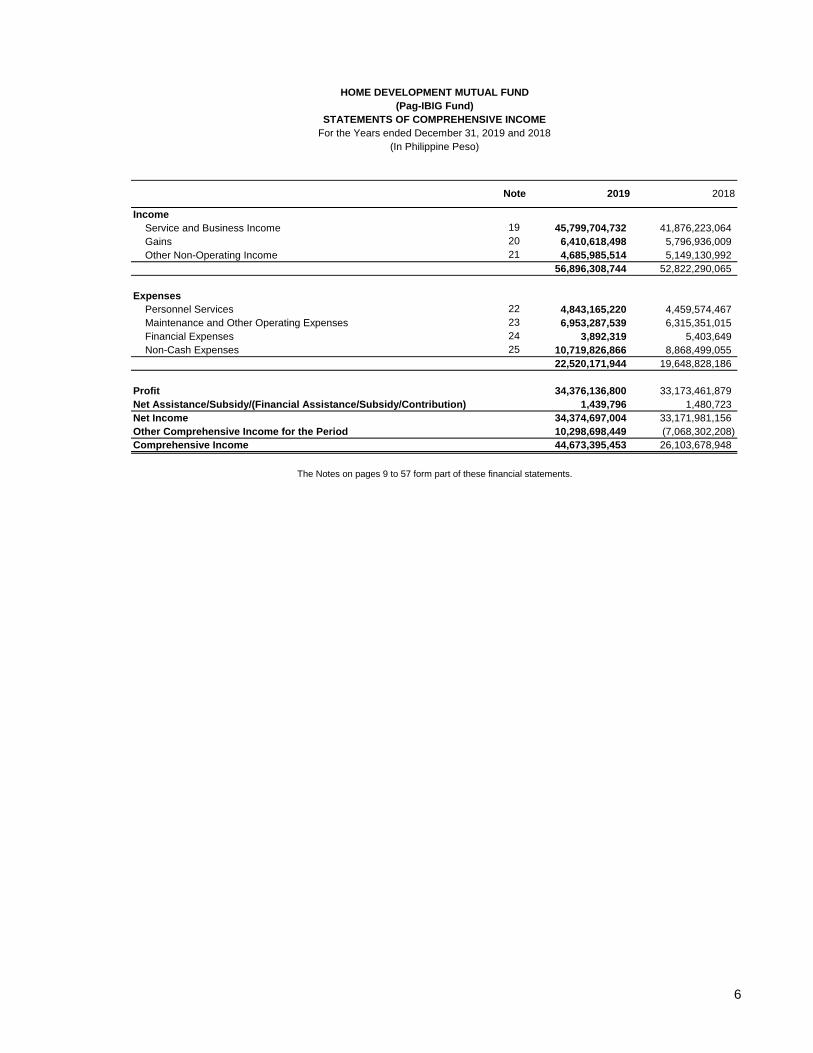
Income
1 Service and Business Income 19 45,799,704,732 41,876,223,064
3 20 6,410,618,498 5,796,936,009
4 Other Non-Operating Income 21 4,685,985,514 5,149,130,992
56,896,308,744 52,822,290,065
Expenses
5 Personnel Services 22 4,843,165,220 4,459,574,467
6 Maintenance and Other Operating Expenses 23 6,953,287,539 6,315,351,015
7 Financial Expenses 24 3,892,319 5,403,649
9 Non-Cash Expenses 25 10,719,826,866 8,868,499,055
22,520,171,944 19,648,828,186
Profit 34,376,136,800 33,173,461,879
10 Net Assistance/Subsidy/(Financial Assistance/Subsidy/Contribution) 1,439,796 1,480,723
Net Income 34,374,697,004 33,171,981,156
Other Comprehensive Income for the Period 10,298,698,449 (7,068,302,208)
Comprehensive Income 44,673,395,453 26,103,678,948
The Notes on pages 9 to 57 form part of these financial statements.
HOME DEVELOPMENT MUTUAL FUND
(Pag-IBIG Fund)
STATEMENTS OF COMPREHENSIVE INCOME
For the Years ended December 31, 2019 and 2018
Gains
2019Note
(In Philippine Peso)
2018
6

Cumulative Changes
in Fair Value
(Note 27)
Retained Earnings/
(Deficit)
(Note 28)
Members' Equity
(Note 26) Total
Balance, January 1, 2018 (5,333,274,428) 74,525,852,668 361,436,072,685 430,628,650,925
CHANGES IN EQUITY FOR 2018
Add/(Deduct):
Members' Contribution - - 40,591,517,204 40,591,517,204
Comprehensive Income for the year (7,068,302,208) 33,171,981,156 - 26,103,678,948
Dividends - (27,293,614,914) 27,293,614,914 -
Provident Claims - - (13,898,635,582) (13,898,635,582)
- (13,302,914) (6,586,200,191) (6,599,503,105)
Balance as at December 31, 2018 (12,401,576,636) 80,390,915,996 408,836,369,030 476,825,708,390
CHANGES IN EQUITY FOR 2019
Add/(Deduct):
Members' Contribution - - 49,681,081,902 49,681,081,902
Comprehensive Income for the year 10,298,698,449 34,374,697,004 - 44,673,395,453
Dividends - (28,229,448,836) 28,229,448,836 -
Provident Claims - - (15,886,246,219) (15,886,246,219)
- (13,656,575) (34,215,360,780) (34,229,017,355)
Balance as at December 31, 2019 (2,102,878,187) 86,522,507,589 436,645,292,769 521,064,922,171
(In Philippine Peso)
The Notes on pages 9 to 57 form part of these financial statements.
HOME DEVELOPMENT MUTAL FUND
(Pag-IBIG Fund)
STATEMENTS OF CHANGES IN EQUITY
For the Years Ended December 31, 2019 and 2018
Offsetting of Total Accumulated Value/Other Adjustments
Offsetting of Total Accumulated Value/Other Adjustments
7

Note 2019 2018
CASH FLOWS FROM OPERATING ACTIVITIES
Cash Inflows
2 Collection of Income/Revenue 36,186,088,009 35,289,721,328
3 Collection of Receivables 59,692,738,525 52,556,110,553
4 Proceeds from Matured Investments 615,494,336,333 373,021,164,220
55 Trust Receipts 429,519,748 254,050,363
5 Other Receipts 5,290,757,921 3,743,625,133
Total Cash Inflows 717,093,440,536 464,864,671,597
Adjustments 1,430,003,568 1,788,083,821
Adjusted Cash Inflows 718,523,444,104 466,652,755,418
Cash Outflows
6 Payment of Expenses (8,133,866,608) (8,200,861,460)
7 Purchase of Inventories (111,171,785) (144,000,152)
8 Grant of Cash Advances (39,909,108) (28,417,220)
9 Prepayments (23,293,293) (5,951,287)
10 Refund of Deposits (11,352,660) (7,604,718)
11 Payments of Accounts Payable (60,311,832) (31,871,001)
12 Remittance of Personnel Benefit Contributions and Mandatory Deductions (3,136,102,115) (2,385,905,760)
13 Grant of Financial Assistance/Subsidy/Contribution (556,008) (4,445,000)
14 Grant of Loans (122,799,323,243) (107,201,163,994)
15 Purchase/Acquisition of Investments (620,230,542,732) (373,011,067,493)
16 Other Disbursements (5,056,173,265) (1,889,814,010)
Total Cash Outflows (759,602,602,649) (492,911,102,095)
Adjustments (1,844,652,326) (2,254,993,762)
Adjusted Cash Outflows (761,447,254,975) (495,166,095,857)
Net Cash Provided by/(Used in) Operating Activities (42,923,810,871) (28,513,340,439)
CASH FLOWS FROM INVESTING ACTIVITIES
Cash Inflows
22 Proceeds from Sale/ Disposal of Investment Property 387,520,938 501,923,425
24 Sale of Investments 9,029,352,562 5,769,938,238
25 Receipt of Interest Earned 2,811,220,540 -
26 Receipt of Cash Dividends 7,506 45,345
Proceeds from Sale of Other Assets 803,545 8,718,752
Total Cash Inflows 12,228,905,091 6,280,625,760
Adjustments - -
Adjusted Cash Inflows 12,228,905,091 6,280,625,760
Cash Outflows
Purchase/Construction of Investment Property (4,363,294) -
32 Purchase/Construction of Property, Plant and Equipment (379,816,625) (325,774,892)
33 Purchase of Investments (6,129,864,436) (3,462,136,947)
36 Purchase of Intangible Assets (91,434,980) (44,317,714)
Total Cash Outflows (6,605,479,335) (3,832,229,553)
Adjustments - -
Adjusted Cash Outflows (6,605,479,335) (3,832,229,553)
Net Cash Provided By/(Used In) Investing Activities 5,623,425,756 2,448,396,207
CASH FLOWS FROM FINANCING ACTIVITIES
Cash Inflows
51 Proceeds from Members' Contributions 50,493,172,309 40,591,517,204
Total Cash Inflows 50,493,172,309 40,591,517,204
Adjustments 275,185,162 257,959,137
Adjusted Cash Inflows 50,768,357,471 40,849,476,341
Cash Outflows
52 Provident Benefit Claims (15,886,246,219) (13,898,635,582)
Total Cash Outflows (15,886,246,219) (13,898,635,582)
Adjustments (253,718,947) (189,016,131)
Adjusted Cash Outflows (16,139,965,166) (14,087,651,713)
Net Cash Provided By/(Used In) Financing Activities 34,628,392,305 26,761,824,628
INCREASE/(DECREASE) IN CASH AND CASH EQUIVALENTS (2,671,992,810) 696,880,396
Effects of Exchange Rate Changes on Cash and Cash Equivalents (30,823,367) 62,932,109
CASH AND CASH EQUIVALENTS, January 1 8,981,496,209 8,221,683,704
CASH AND CASH EQUIVALENTS, December 31 3 6,278,680,032 8,981,496,209
The Notes on pages 9 to 57 form part of these financial statements.
HOME DEVELOPMENT MUTAL FUND
Pag-IBIG Fund
STATEMENTS OF CASH FLOWS
For the Years Ended December 31, 2019 and 2018
(In Philippine Peso)
8

9
HOME DEVELOPMENT MUTUAL FUND (Pag-IBIG Fund)
NOTES TO FINANCIAL STATEMENTS (All amounts in Philippine Peso unless otherwise stated)
1. CORPORATE INFORMATION
1.1 Incorporation
The Home Development Mutual Fund (HDMF), also known as the Pag-IBIG Fund, or the Fund, was created on June 11, 1978 by virtue of Presidential Decree (PD) No. 1530 to address two of the country’s basic needs: generation of savings and provision of shelter for the Filipino workers.
Under this Decree, two agencies administered Pag-IBIG Fund namely: (a) Social Security System (SSS) for the funds from private employees, and (b) Government Service Insurance System (GSIS) for the funds from government workers. To meet the urgent need to consolidate all long-term, low-interest housing funds under the administration of a single agency to support the National Shelter Program of the then Ministry of Human Settlements, Executive Order (EO) No. 527 was issued on March 1, 1979, transferring the administration of Pag-IBIG Fund to National Home Mortgage Finance Corporation (NHMFC). As such, NHMFC took care of the administration, custody, disposal and utilization of the funds, including the authority to promulgate Implementing Rules and Regulations (IRRs) pertaining to the aforesaid functions. On June 4, 1979, EO No. 538 was issued merging the two funds into what is now known as Pag-IBIG Fund, which stands for Pagtutulungan sa Kinabukasan: Ikaw, Bangko, Industriya at Gobyerno. It remained under the administration of the NHMFC until PD No. 1530 was amended by PD No. 1752 on December 14, 1980, making it an independent corporation with its own Board of Trustees (BOT).
Shortly after the administration of President Corazon C. Aquino, Pag-IBIG contributions were suspended from May to July 1986. However, on August 1, 1986, former President Aquino issued EO No. 35 directing the resumption of mandatory Pag-IBIG membership under more liberal terms. The contribution rate was reduced from three per cent to one per cent of fund salary for employees earning over P1,500. Employer share was cut from three per cent to a fixed rate of two per cent while the maximum fund salary was raised from P3,000 to P5,000.
January 1, 1987 marked the return of Pag-IBIG membership to a voluntary program under EO No. 90. The next eight years witnessed the growth of Pag-IBIG Fund as a voluntary fund. On June 17, 1994, then President Fidel V. Ramos signed Republic Act (RA) No. 7742, which reverted Pag-IBIG membership back to mandatory effective January 1, 1995.
On July 21, 2009, then President Gloria Macapagal-Arroyo signed into law RA No. 9679, otherwise known as the “Home Development Mutual Fund Law of 2009.” The new law and its IRR took effect on August 27, 2009 and November 3, 2009, respectively. It repealed PD Nos. 1530 and 1752 as well as EO Nos. 35 and 90. Its landmark provisions are those expanding the mandatory coverage of the Pag-IBIG Fund to include all employees compulsorily covered by SSS and GSIS, as well as Filipinos employed by

10
foreign-based employer; exempting Pag-IBIG Fund employees from the coverage of the Salary Standardization Law; and restoring tax exemption privileges. Section 19 of RA No. 9679 states that all laws to the contrary notwithstanding, the Fund and all its assets and properties, all contributions collected and all accruals thereto and income or investment earning therefrom, as well as all supplies, equipment, papers or documents shall be exempt from any tax, assessment, fee, charge, or customs or import duty; and all benefit payments made by the Pag-IBIG Fund shall likewise be exempt from all kinds of taxes, fees, charge, and shall not be liable to attachments, garnishments, levy or seizure by or under any legal or equitable process whatsoever, either before or after receipt by the person or person entitled thereto, except to pay any debt of the member to the Fund. No tax measure of whatever nature enacted shall apply to the Fund, unless it expressly revokes the declared policy of the State in Section 2 of RA No. 9679 granting tax exemption to the Fund. Any tax assessment against the Fund shall be null and void.
Through the years, Pag-IBIG Fund has become the prime government financial institution tasked to continually perform two of the nation’s basic concerns: generation of savings and provision of access to home financing to the workers. As such, it mobilizes an efficient, dynamic, regular, and integrated nationwide savings system and at the same time enables low and middle-income families to realize their dream of having decent shelter.
At present, the Fund has its Corporate Headquarters (CHQ) at the Petron MegaPlaza Building, 358 Senator Gil J. Puyat Avenue, Makati City and it operates in 11 Housing Business Centers (HBCs), 18 Technical and Administrative Support (TAS), 100 Branches and 38 Member Services Offices (MSOs) throughout the country.
1.2 Approval of Financial Statements
The financial statements of the Fund as at and for the year ended December 31, 2019, including the comparative financial statements as at December 31, 2018, were authorized for issue by the BOT through Board Resolution No. ___ dated ______, 2020.
2. SUMMARY OF SIGNIFICANT ACCOUNTING POLICIES
The significant accounting policies that have been used in the preparation of these financial statements are summarized below. These policies have been consistently applied to all the years presented, unless otherwise stated.
2.1 Basis of financial statements preparation
a. Statement of compliance
The financial statements of the Fund have been prepared in accordance with Commission on Audit (COA) Circular No. 2017-004 dated December 13, 2017. The circular indicated the guidelines on the preparation of financial statements and other financial reports and implementation of the Philippine Financial Reporting Standards (PFRS) by Government Corporations classified as Government Business Enterprises (GBE).

11
The International Public Sector Accounting Standards Board (IPSASB) and International Accounting Standards Board (lASB), which promulgate the International Public Sector Accounting Standards (lPSAS) and International Financial Reporting Standards (IFRS), respectively, acknowledge the right of governments and national standards-setters to establish their respective accounting standards and guidelines for financial reporting in their jurisdictions.
With the adoption of Philippine Financial Reporting Standard (PFRS) 9 – Financial Instruments, the Fund needs the services of a Consultant who will assist in the implementation of the requirements of the said standard, particularly on the Classification & Measurement (C&M) of Financial Instruments and Impairment. As a kick-off activity, Pre-Procurement Conference for the Implementation of Philippine Financial Reporting Standard (PFRS) was held on February 11, 2020.
b. Presentation of financial statements
The financial statements are presented in accordance with Philippine Accounting Standards (PAS) 1, Presentation of Financial Statements. The Fund presents all items of income and expenses in a single Statement of Comprehensive Income (SCI).
c. Basis of consolidation
The Fund has no consolidated financial statements because it has no controlled subsidiaries and entities. Moreover, the Fund has no debt or equity securities traded in organized financial market and is not in the process of filing its financial statements with the Securities and Exchange Commission or other regulatory organization for the purpose of issuing any class of instruments in an organized financial market. Its equity consists of members’ contributions, the members being the owners of Pag-IBIG Fund, employers’ counterpart for employed members and the accumulated dividends.
The financial statements presented include the combined financial statements and transactions of the CHQ and its offices nationwide.
d. Functional and presentation currency
The combined financial statements are presented in Philippine Peso, which is the Fund’s functional and presentation currency. All values are rounded to the nearest peso, except when otherwise indicated.
e. Adoption of the COA Revised Chart of Accounts (RCA)
In compliance with COA Circular No. 2016-006 dated December 29, 2016, the Fund adopted the RCA in its trial balance for years 2019, 2018 and 2017. General Ledger (GL) and Subsidiary Ledger (SL) accounts were carefully analyzed and manually mapped to the RCA.
f. Deployment of Provident Fund Management System (PFMS) and Short Term Loans Management System (STLMS)

12
Two components of the Integrated Information Systems Project (IISP) – the PFMS and STLMS have been deployed in all branches before the end of CY 2017.
Under the said systems, operational and accounting processes have been automated, thus, more efficient with due regard for accuracy and sound internal control.
For control purposes, collections under the PFMS are electronically posted to the ledger of members with Member’s Identification (MID) Number. On the other hand, collections under the STLMS are electronically posted to the ledger of member-borrowers using the STL application number as reference. Collections not supported by the mandatory information are temporarily parked in Undistributed Collections (UC). During transition, collections pertaining to accounts not yet migrated to the IISP are, likewise, lodged to Undistributed Collections. Completion of the mandatory information and migration of data to the IISP systems are actively being pursued corporate wide.
Technical and Administrative Support (TAS) shall continue with the clean-up activities until the non-migratable accounts that remained in the legacy system are migrated to the PFMS and STLMS. After exhausting all efforts to clean up the accounts in the legacy system, any remaining non-migratable accounts shall be disposed of in accordance with business rules/policies setting the threshold for such.
g. Deployment of Real and Other Properties Acquired (ROPA) System
Another component of the IISP–ROPA System Phase II has been fully deployed in all operational and accounting units of HBCs before the end of CY 2018. Phase II of the said system encompasses automation of the operational and accounting processes which have been more efficient specifically on the recurring transactions such as acquisition, depreciation, impairment testing, and disposal. Migrated ROPA accounts were assigned a unique identification number referred to as ROPA ID. Such ID is utilized to extract all related transactions that occurred on a certain property which is far more efficient compared to the previous system.
2.2 Adoption of New and Amended Standards and Interpretations
a. Effective in CY 2019 that are relevant to the Fund i. PFRS 16, Leases, sets out the principles for the recognition, measurement,
presentation and disclosure of leases. The new accounting model under PFRS 16 requires a lessee to recognize an asset (right-of-use asset) and a financial liability to pay rentals (lease liability), which should be measured at the present value of the lease payments. The right-of-use asset is treated similarly to other non-financial assets and depreciated accordingly, and the liability accrues interest. The only exceptions are short-term leases (with a term of 12 months or less) and low-value leases. The new standard brings most leases on-balance sheet for lessees under a single model, eliminating distinction between operating and finance leases. Lessor accounting, however, will not change

13
significantly and the distinction between operating and finance lease is retained.
ii. Amendments to PFRS 9, Financial Instruments – Prepayment Features with
Negative Compensation. These amendments confirm that when a financial liability measured at amortized cost is modified without this resulting in de-recognition, a gain or loss should be recognized immediately in profit or loss. The gain or loss is calculated as the difference between the original contractual cash flows and the modified cash flows discounted at the original effective interest rates.
b. Effective in CY 2019 that are not relevant to the Fund
i. Amendments to PAS 19, Employee Benefits – Plan Amendment, Curtailment or Settlement. The amendments specify how companies remeasure a defined benefit plan when a change - an amendment, curtailment or settlement - to a plan takes place during a reporting period. It requires entities to use the updated assumptions from this remeasurement to determine current service cost and net interest cost for the remainder of the reporting period after the change to the plan.
ii. Amendments to PAS 28, Investment in Associates – Long-term Interests in Associates and Joint Ventures. These amendments clarify that an entity applies PFRS 9, Financial Instruments to long-term interests in an associate or joint venture that form part of the net investment in the associate or joint venture but to which the equity method is not applied.
iii. IFRIC 23, Uncertainty Over Income Tax Treatments. This IFRIC clarifies how the recognition and measurement requirements of PAS 12, Income Taxes, are applied where there is uncertainty over income tax treatments. IFRIC 23 explains how to recognize and measure deferred and current income tax assets and liabilities where there is uncertainty over a tax treatment.
iv. Annual improvements to PFRS (2015 – 2017 Cycle).
Amendments to PFRS 3, Business Combinations and PFRS 11, Joint Arrangements – Re-measurement of Previously Held Interests in a Joint Operation. The amendments to PFRS 3 clarify that when an entity obtains control of a business that is a joint operation, it re-measures previously held interests in that business. The amendments to PFRS 11 clarify that when an entity obtains joint control of a business that is a joint operation, the entity does not re-measure previously held interests in that business.
Amendments to PAS 12, Income Taxes – Tax Consequences of Dividends. The amendments clarify that the requirements in the former Paragraph 52B (to recognize the income tax consequences of dividends where the transactions or events that generated distributable profits are recognized) apply to all income tax consequences of dividends by moving the paragraph away from Paragraph 52A that only deals with situations where there are different tax rates for distributed and undistributed profits.

14
Amendment to PAS 23, Borrowing Costs – Eligibility for Capitalization. The amendments clarify that if any specific borrowing remains outstanding after the related asset is ready for its intended use or sale, that borrowing becomes part of the funds that an entity borrows generally when calculating the capitalization rate on general borrowings.
c. New Standards, Amendments and Interpretations Not Yet Adopted The following are new standards and amendments to standards and interpretations that are effective for annual periods after January 1, 2020 and have not been applied by the Fund in preparing the financial statements. Unless otherwise indicated, none of these is expected to have a significant effect on the financial statements.
Effective for reporting periods beginning on or after January 1, 2020:
i. Amendments to PFRS 3, Business Combinations – Definition of a Business.
The amendments clarify the minimum requirements to be a business, remove the assessment of a market participant’s ability to replace missing elements, and narrow the definition of outputs. The amendments also add guidance to assess whether an acquired process is substantive and add illustrative examples. An optional fair value concentration test is introduced which permits a simplified assessment of whether an acquired set of activities and assets is not a business.
ii. Amendments to PAS 1, Presentation of Financial Statements, and PAS 8, Accounting Policies, Changes in Accounting Estimates and Errors – Definition of Material. The amendments refine the definition of material in PAS 1 and align the definition used across PFRSs and other pronouncements. They are intended to improve the understanding of the existing requirements rather than to significantly impact an entity’s materiality judgments.
Effective for reporting periods beginning on or after January 1, 2021: PFRS 17, Insurance Contracts. PFRS 17 is a comprehensive new accounting standard for insurance contracts covering recognition and measurement, presentation and disclosure. Once effective, PFRS 17 will replace PFRS 4, Insurance Contracts, which currently permits a wide variety of practices in accounting for insurance contracts. This new standard applies to all types of insurance contracts, regardless of type of entities that issue them, as well as to certain guarantees and financial instruments with discretionary participation features. A few exceptions will apply. The overall objective of PFRS 17 is to provide an accounting model for insurance contracts that is more useful and consistent for insurers. In contrast to the requirements of PFRS 4, which are largely based on grandfathering of previous local accounting policies, PFRS 17 provides a comprehensive model for insurance contracts covering all relevant accounting aspects. The core of PFRS 17 is the general model, supplemented by:

15
A specific adaptation for contracts with direct participation features, or the so-called variable fee approach; or A simplified approach mainly for short-duration contracts, or the so-called premium allocation approach.
Effectivity Deferred Indefinitely: Amendments to PFRS 10, Consolidated Financial Statements, and to PAS 28, Investment in Associates and Joint Ventures – Sales or Contribution of Assets between an Investor and its Associates or Joint Venture. The amendments to PFRS 10 require full recognition in the investor’s financial statements of gains or losses arising on the sale or contribution of assets that constitute a business as defined in PFRS 3, between an investor and its associate or joint venture. Accordingly, the partial recognition of gains or losses (i.e., to the extent of the unrelated investor’s interests in an associate or joint venture) only applies to sale or contribution of assets that do not constitute a business. Corresponding amendments have been made to PAS 28 to reflect these changes. In addition, PAS 28 has been amended to clarify that when determining whether assets that are sold or contributed constitute a business, an entity shall consider whether the sale or contribution of those assets is part of multiple arrangements that should be accounted for as a single transaction.
Under the prevailing circumstances, the adoption of the foregoing new and amended standards, amendments and interpretations is not expected to have any material effect on the financial statements of HDMF.
2.3 Significant Accounting Judgments and Estimates
In the process of applying the Fund’s accounting policies, Management exercised judgment and estimates in determining the amounts recognized in the financial statements, with the most significant as follows:
a. Presentation of financial statements
The Fund applies materiality considerations to all parts of its financial statements. Each material class of similar items is presented separately and dissimilar items that are individually immaterial are aggregated. Materiality considerations are applied even when standard requires a specific disclosure and information is not obscured by aggregating or by providing immaterial information.
Notes to financial statements are presented in a systematic manner that considers the effect on understandability and comparability. Each item in the financial statements is cross-referred to any related information in the notes.
b. Financial instruments: Recognition and Measurement
Due to the deferment of adopting PFRS 9, investment accounts are still classified in accordance with PAS 39 categorization, i.e.: (i) Held for Trading (HFT); (ii) Available-for-Sale (AFS); and (iii) Loans and Receivable (L&R), but are mapped and grouped to the most appropriate accounts in the COA RCA. L&R are non-

16
derivative financial assets with fixed or determinable payments that are not quoted in an active market. They arise when the Fund provides money, goods or services directly to a debtor with no intention of trading the receivable. Interest earned on such L&R is reported as interest income.
All financial instruments are initially recognized at fair value. Transaction costs on purchases of financial instruments in the amount of two per cent and below of the amount of the financial instrument purchased is not capitalized and considered as outright expense. After initial recognition, measurement of financial instruments depends on their categories, to wit: i. Loans and Receivables
After initial measurement, L&R are subsequently measured at amortized cost using effective interest method, less allowance for impairment losses. Amortized cost is calculated taking into account any discount or premium on acquisition that are an integral part of the effective interest rate. The amortization is included in the ‘Service & Business Income’ section of SCI. Assets in this category are included in current assets except for those with maturities greater than 12 months after reporting period, which are classified as non-current assets.
ii. AFS Investments AFS investments are subsequently measured at fair values. The unrealized gains and losses arising from fair valuation of AFS investments are excluded from reported income and are reported as ‘Cumulative Changes in Fair Value on AFS investments’ in the equity section of the Statement of Financial Position (SFP). The effective yield component of AFS debt securities, as well as the impact of restatement of foreign currency-denominated AFS debt securities, is reported in the SCI. When the security is disposed of, cumulative gains or losses previously recognized in equity, under Other Comprehensive Income, are recognized as trading and investment securities gains (losses) in the SCI. AFS Investments are included under non-current assets unless the Fund intends to dispose of the investments within 12 months after the end of reporting period.
iii. Financial Instruments at Fair Value through Profit or Loss (FVTPL)
Financial Instruments at FVTPL are subsequently measured at fair value. The unrealized gains and losses, and dividend income are recognized directly in the SCI. Where the transaction price in a non-active market is different from the fair value from other observable current market transactions in the same instrument or based on a valuation technique whose variables include only data from observable market, the Fund considers its interest rates as the market rates for housing loans as they are mandated by the government.

17
Hence, the difference between the transaction price and fair value (“Day 1” difference) is not recognized in the SCI.
c. Fair Value Measurement
The method and assumptions used by the Fund in estimating the fair value of the financial instruments are:
i. Fair value of financial assets
Debt securities – Fair values are generally based upon quoted market prices. If the market prices are not readily available, fair values are estimated using adjusted quoted market prices of comparable investments.
Equity securities – Fair values are based on quoted prices published in markets.
L&R – Carrying amounts are net of provisions for impairment.
Short-term investments – Carrying amounts are approximately at fair values.
Cash and cash equivalents – Carrying amounts are approximately at fair values.
Financial assets with no available quoted market price are not reported at fair value.
ii. Fair value measurement
Fair value is the price that would be received to sell an asset or paid to transfer a liability in an orderly transaction between market participants at the measurement date. PFRS 13, Fair Value Measurement, establishes a framework for measuring fair value. It provides a fair value hierarchy that prioritizes the inputs to valuation techniques used to measure fair value. The hierarchy gives the highest priority to unadjusted quoted prices in active markets for identical assets or liabilities (Level 1) and the lowest priority to unobservable inputs (Level 3). The three levels of the fair value hierarchy under the standard are described as follows:
Level 1 Inputs to the valuation methodology are unadjusted quoted prices for identical assets or liabilities in active markets that the Fund has access into.
Level 2 Inputs to the valuation methodology include:
Quoted prices for similar assets or liabilities in active markets. Quoted prices for identical or similar assets or liabilities in inactive
markets. Inputs other than quoted prices that are observable for the asset or
liability.

18
Inputs that are derived principally from or corroborated by observable market data by correlation or other means.
If the asset or liability has a specified (contractual) term, the Level 2 input must be observed for substantially the full term of the asset or liability. Level 3 Inputs to the valuation methodology are unobservable and significant to the fair value measurement. Fair value of debt and equity security investments of the Fund are measured using Level 1 methodology, Level 2 measurement of fair value is applied to L&R and Level 3 technique is used for measurement of investment properties.
d. Impairment losses on L&R
The Fund adopted the Expected Credit Loss (ECL) Model in measuring the impairment, in accordance with the provisions of PFRS 9. In the absence of a more sophisticated loan loss estimation methodology and with the Bangko Sentral ng Pilipinas (BSP) as benchmark for best practice, the Fund employed the following impairment rates depending on the age of the loan:
Rate
(in per cent)
Mortgage / Sales Contract Receivables Current 0.45 1 – 30 days past due 0.45 31 – 60 days past due 15.00 61 – 90 days past due 15.00 91 – 180 days past due 20.00 181 – 270 days past due 30.00 271 – 365 days past due 35.00 Over 1 year 50.00 Over 2 years 50.00 Over 3 years 50.00
Referred to foreclosure 50.00 With extra-judicial foreclosure 50.00
On December 17, 2018, the Management Committee (ManCom) approved to revise ELR for Current and one to 30 days past due (dpd) buckets from 0.75 to 0.45 per cent while impairment rates for 31 dpd and onwards are retained as approved by the Board of Trustees on December 20, 2016. The decrease in ELR resulted from the improvement of the quality of portfolio due to the Fund’s extensive collection efforts. The Fund provided an additional 5% for account ages 31 days past due to 1 year since its credit risk management policies are moderate and relaxed compared with BSP.

19
The Fund reviews its L&R periodically or upon incurrence of loss events to assess whether an impairment loss should be recognized or reversed in the SCI.
2.4 Cash and cash equivalents
Cash includes cash on hand and in banks, both foreign and local. Cash in banks earn interest at the respective bank deposit rates. Cash equivalents, on the other hand, include highly liquid investments acquired three months or less before maturity and subject to insignificant risk of change in value resulting from change in interest rates.
2.5 Financial Assets
Financial Assets include AFS securities. AFS are those not classified as Held-to-Maturity (HTM), HFT or L&R. They include equities and bonds and other debt instruments, which are not intended for trading in the short-term period of not more than 90 days but may be sold in response to liquidity requirements or changes in market conditions. Included under this category are Treasury Notes/Bonds and Philippine Dollar Denominated Bonds issued by the Bureau of the Treasury (BTr) and Republic of the Philippines, Government Banks and Philippine Corporations.
A regular way purchase or sale of financial assets is recognized and derecognized by the Fund, as applicable, using settlement date accounting. The method is applied consistently for all purchases and sales of financial assets that belong to the same category of financial asset.
Investment in Bonds and Other Debt Instruments are carried at current market value. Cost of Bonds and Other Debt Instruments sold are accounted for using specific identification method.
Investment in stocks includes Philippine Long Distance Telephone (PLDT) Company shares listed in the Philippine Stock Exchange which are carried at current market value. The market value of the stocks is adjusted every end of the month. If the market value is more or less than the cost, the difference is treated as unrealized gains (losses) on mark-to-market and is presented as equity portion of the SFP and addition/reduction on the SCI.
Cost of stocks sold is computed using the weighted average cost method.
2.6 Other Investments
Other Investments consist of short-term placements with maturities of 91 days but not more than 1 year from the date of acquisition and are unrestricted as to withdrawal and earns interest at the respective bank deposit rates.

20
2.7 Receivables
Receivables are carried at book value, net of allowance for impairment losses, if any. They are classified into current and non-current.
Current portion refers to the aggregate principal amortizations due for the entire year succeeding the reporting year and those pertaining to the entire balance of receivables in arrears, over three months.
2.8 Non-Current Assets Held for Sale (NCAHS)
NCAHS consists of IP–ROPA that the Fund intends to sell within one year from the date of reclassification as held for sale. The Fund classifies an asset as NCAHS if its carrying amount will be recovered principally through a sale transaction rather than continuing use.
NCAHS is initially recognized at lower of carrying amounts immediately prior to its classification as assets held for sale or its fair value less cost to sell. The Fund recognizes an impairment loss for any initial and subsequent write-down of the asset to fair value less cost to sell. Gain on any subsequent increase in fair value less cost to sell an asset is recognized to the extent of the cumulative impairment loss previously recognized. NCAHS is not subject to depreciation. If the Fund has classified an asset as held for sale, but the criteria for it to be recognized as held for sale are no longer satisfied, the Fund shall cease to classify the asset as such. If the sale of the asset is extended beyond one year, the extension of the period required to complete the sale on the asset does not preclude an asset from being classified as held for sale if the delay is caused by events or circumstances beyond the Fund’s control and there is sufficient evidence that it remains committed to sell the asset.
2.9 Other Current Assets
a. Prepayments
Prepayments include amounts advanced/deposited for registration fees, leases/rentals and insurance premiums of the Fund’s property and equipment used in day-to-day operations. These are carried at cost and are expected to be realized or consumed within twelve (12) months after the end of the reporting period.
b. Inventories - Inventory Held for Consumption
Inventories are stated at the lower of cost or net realizable value (NRV). Cost is determined by using the First-In-First-Out (FIFO) method. Tangible assets with serviceable life of more than one year but small enough to be considered as Property and Equipment (PE), and items eventually treated as expense upon issuance are also included in this account.

21
c. Inventories – Semi-Expendable Items
This includes tangible items that are below the capitalization threshold of P15,000.
2.10 Investment Property (IP)
Real and Other Properties Acquired (ROPA), consisting of collaterals of cancelled Contracts to Sell (CTS) and foreclosed properties with registered Certificate of Sale, but still under the redemption period, as well as those with titles already consolidated in favor of the Fund, are classified as IPs. These are initially measured at their fair value, net of Asset Pricing Model (APM) as the deemed cost at foreclosure date and subsequently valued using the cost model.
Based on the cost model approach, depreciable amount (cost, net of residual value) of ROPA is allocated using straight line method over the remaining useful life as disclosed in the Appraisal Report, but not to exceed the prescribed life span as follows:
Type Estimated Useful Life
Predominantly wood 10 years Predominantly mixed 20 years Concrete 30 years
On November 24, 2017, the ManCom approved the use of the APM as a valuation methodology to determine the discount rate, which will be the basis for the initial recognition of the ROPA in the Fund’s books of accounts. IP–ROPA is presented net of Allowance for Impairment Losses and Accumulated Depreciation as shown in Note 9.
2.11 Property and Equipment (PE)
Pursuant to AMO No. 2016-012, Property and Equipment dated December 23, 2016 and AMO No. 2019-007, Amended AMO – Property and Equipment issued on September 2, 2019, the Fund adopted the cost model as its measurement policy for PE where the entire class of PE is carried at cost less accumulated depreciation and accumulated impairment loss, if any. An item of PE is recognized as an asset if: (1) it is probable that future economic benefits associated with the asset will flow to the Fund; and (2) the cost of the item can be measured reliably. Future economic benefits occur when the risks and rewards of the asset’s ownership have passed to the Fund and the asset will be used in its operation for more than one year from the date of issuance of Certificate of Acceptance or Receiving and Inspection Report.
PE is initially recognized at cost, which is its cash price equivalent at acquisition date. The initial cost of the asset includes its purchase price, including import duties and non-refundable purchase taxes after deducting trade discounts, trade-in discounts and rebates, any cost directly attributable to bringing the asset to the location and condition necessary for it to operate in the manner intended by

22
management, and the initial estimate of the costs of dismantling and removing the item as well as restoring the site on which it is located. The cost of an item of PE shall exclude cost of opening a new facility, cost of introducing a new product or service, cost of doing business in a new location and administrative and other general overhead costs.
Other expenditures subsequent to acquisition of PE, such as repairs and maintenance and relocation, are charged to expense as incurred. Replacement of parts shall be recognized as PE if the recognition criteria are met while cost of the parts replaced should be derecognized.
Depreciation is calculated on straight-line basis over the estimated and/or remaining useful life of the asset. Residual value of PE is set at ten per cent of the acquisition cost. As applicable, PE such as Leased Asset Improvements shall be depreciated over the useful life of the improvement or the lease term, whichever is shorter. The lease term would include any renewal option periods where extension of the lease is expected. Method of depreciation, useful life and residual value is reviewed at least every financial year-end to assess whether there has been significant change in expected pattern of consumption of future economic benefits embodied in the asset or expectations differ from previous estimates. Any change is accounted for as change in accounting estimates in accordance with AMO No. 2014-012, Accounting Policies, Changes in Accounting Estimates and Errors. When an item of PE is sold or retired, its cost and accumulated depreciation and amortization are dropped from the books and any gain or loss resulting from the disposal is reported in the SCI.
2.12 Intangibles
Information Technology Software costs are capitalized on the basis of the cost incurred to acquire and bring to use the specific software. These costs, net of residual value, are amortized over its useful life on a straight-line basis. The useful life is based on the nature of the asset acquired, which shall not exceed the period of contractual or other legal rights over the asset.
Maintenance costs associated with maintaining the computer software program is recognized as expense when incurred.
2.13 Leases
The Fund as a lessor classifies rental income as operating lease. Rentals received are recognized as income on a straight-line basis over the lease term. Assets held for operating leases are presented in Note 9. Likewise, the Fund as a lessee classifies rental payments as operating lease. Periodic rental is recognized as rent expense on a straight-line basis over the lease term.

23
2.14 Interest income recognition
Interest income on housing loans is recognized on accrual basis at month end. Interest on Calamity Loans under HDMF Circular Nos. 322, 375, 418 and 426, and interest on Multi-Purpose Loans (MPL) under HDMF Circular Nos. 323, 374, 419 and 425 are computed on a daily basis but recorded at month end. Recording of accrual stops once an account is over 90 days past due. Interest on existing MPL covered by HDMF Circular No. 56-I is capitalized and recognized as income regularly at end of month and upon receipt of monthly amortization.
a. Interest on multi-purpose loans/calamity loans
The policies adopted in setting the interest rates on short-term loans are set out as follows:
Operative Dates
HDMF Circular
No. Description
Interest Rate (in per cent)
February 3, 2017 374 Revised Guidelines on the Pag-IBIG MPL Program under the Short-Term Loans Management System of the Integrated Information Systems Project (STLMS - IISP)
10.50
February 28, 2017 375 Revised Guidelines on the Pag-IBIG Fund Calamity Loan Program
5.95
b. Interest on wholesale loan
The prevailing interest rate, in force by virtue of HDMF Circular No. 330, “Adoption of Full Risk-Based Pricing Framework for all Pag-IBIG Fund Wholesale Loan (WL) Programs”, effective January 1, 2015 are as follows:
Product Rate (in per cent)
1-year term, fixed 6.125 2-year term, fixed 6.750 3-year term, fixed 7.875

24
c. Interest on housing loans
Nominal interest rates for the end-user financing program for CY 2019 are as follows:
Fixing Period
Rate (in per cent)
January 1 to June 30, 2019
July 1, 2019 to December 31, 2019
End-user financing (Regular) 1-year Fixing 5.375 5.375
3-year Fixing 6.375 6.375 5-year Fixing 7.270 6.875
10-year Fixing 8.035 7.500 15-year Fixing 8.585 8.125 20-year Fixing 8.800 8.875 25-year Fixing 9.050 9.500 30-year Fixing 10.000 10.125
For end-user loans outstanding prior to January 1, 2019 prevailing interest rates are as follows:
Fixing Period
Rate (in per cent)
Feb. 14, 2018 to Dec. 31,
2018
Jan. 1, 2018 to Feb. 13,
2018
Jan. 1, 2017 to Dec. 31,
2017
Jan. 1, 2016 to Dec. 31,
2016
End-user financing (Regular)
1-year Fixing 5.375 5.500 5.500 5.500* 3-year Fixing 6.375 6.500 6.500 6.500 5-year Fixing 7.270 7.270 7.270 7.270
10-year Fixing 8.035 8.035 8.035 8.035 15-year Fixing 8.585 8.585 8.585 8.585 20-year Fixing 8.800 8.800 8.800 8.800 25-year Fixing 9.050 9.050 9.050 9.050 30-year Fixing 10.000 10.000 10.000 10.000
*July 1 to Dec 31

25
Nominal interest rates for Housing Loan Restructuring Program effective November 15, 2019 are as follows:
Fixing Period Rate (in per cent)
Housing Loan Restructuring Program
1-year Fixing 7.750 3-year Fixing 8.000
5-year Fixing 8.250 10-year Fixing 8.875 15-year Fixing 9.500 20-year Fixing 10.250 25-year Fixing 10.875 30-year Fixing 11.500
The following policies adopted the Full Risk-Based Pricing Model:
Operative Dates HDMF
Circular No. Description
July 15, 2014
343 Guidelines Implementing the Pag-IBIG Fund Home Rehabilitation Reconstruction Loan Program
July 24, 2014
344
Guidelines Implementing the Pag-IBIG Fund Take-Out Mechanism for Developer-Assisted Housing Program
November 26, 2014
351
Amended Guidelines on the Implementation of the Pag-IBIG Non-Performing Asset Resolution Program
August 2, 2017 385 Revised Guidelines Implementing the Pag-IBIG Fund Home Rehabilitation/Reconstruction Loan Program
August 30, 2017 389 Revised Guidelines on the Conversion to Full-Risk Based Pricing Program
January 9, 2018 396 Modified Guidelines on the Pag-IBIG Fund End-User Home Financing Program
May 23, 2018 403 Modified Guidelines on the Pag-IBIG Fund Affordable Housing Program
September 14, 2018 410 Adjustment on the Socialized Housing Loan Ceiling
October 24, 2018 413 Extended Application of the Subsidized Interest Rates Under the Pag-IBIG Fund Affordable Housing Program
December 18, 2018 414 Amended Guidelines on the Pag-IBIG Fund Housing Loan Restructuring Program
October 23, 2019
429
Revised Guidelines on the Implementation of the Pag-IBIG Non-Performing Asset Resolution Program for Retail Loans
HDMF Circular No. 396, “Modified Guidelines on the Pag-IBIG Fund End-User Home Financing Program” repealing Circular Nos. 310, 349, 353 and 361 took

26
effect on January 24, 2018. The circular prescribes comprehensive guidelines that cover all retail and developer-assisted housing loan accounts that will be processed and taken out upon its effectivity. Pursuant to HDMF Circular No. 396, interest rates on retail housing loans were based on a pricing framework approved by the BOT on June 6, 2012. Said interest rates shall be re-priced periodically depending on the re-pricing period chosen by the borrower whether every 3, 5, 10 or 15 years. Under HDMF Circular No. 317, “Program on the Conversion to Full Risk-Based Pricing Model,” all borrowers with housing loans taken out under HDMF Circular No. 247, “Guidelines on the Pag-IBIG Fund End-User Home Financing Program” or earlier circulars with interest rates above the prevailing market rates may avail of interest rate reduction under the Full Risk Based Pricing Program, subject to its terms and conditions. The program was amended by virtue of HDMF Circular No. 389.
Effective July 14, 2018, HDMF Circular No. 402, “Determination of Loanable Amount Based on Capacity to Pay and Loan-To-Appraised Value Ratio Under Pag-IBIG Fund End-User Home Financing Program” was issued to determine the ratio of the loan amount to the appraised value of the collateral which shall not exceed the following:
Loan Amount Loan-to-Appraisal
Value Ratio (in per cent)
Up to the Economic Housing Limit* 95 Over the Economic Housing Limit up to P6,000,000 90
* For developer-assisted housing loans up to the prevailing maximum limit for socialized housing loan, the LTV ratio shall be 100 per cent; provided, the developer's License to Sell is for a socialized housing project and the loan purpose is for the purchase of a residential unit.
To further enhance the benefits of housing loan borrowers, HDMF Circular No. 379, was issued covering all accounts of eligible borrowers processed and taken out beginning May 1, 2017. However, effective on June 7, 2018, for the Affordable Housing Program (AHP), HDMF Circular No. 403, “Modified Guidelines on the Pag-IBIG Fund Affordable Housing Program” prevails. HMDF Circular No. 379 and memoranda, rules, regulations, and other issuances inconsistent with HDMF Circular No. 403 are repealed. The new guidelines cover all AHP retail and developer-assisted housing loan applications received by the Fund upon its effectivity. Under this Circular, the ratio of the loan amount to the appraised value of the collateral shall not exceed the following:
Loan Amount Loan-to-Appraisal
Value Ratio (in per cent)
Up to the Socialized Housing Loan Ceiling 100 Over the Socialized Housing Loan Ceiling up to P750,000 95

27
It provides that for the first five or ten years of the loan, borrowers under each specific income cluster shall be charged with affordable interest rate as follows:
Details Maximum Gross Monthly Income/Cluster Limit
Income Cluster
Cluster 1 (NCR) Up to P15,000 Up to P17,500
Cluster 2 (Other Regions) Up to P12,000 Up to P14,000
Loan Amount Loans up to P450,000 Loans up to P750,000
Interest Rate 3.0% 6.5%
By virtue of HDMF Circular No. 340, “Socialized Housing Price Ceiling Adjustment,” the maximum loanable amount under the socialized housing program was raised to P450,000 from the previous limit of P400,000. At the end of the ten-year period, the interest rates shall be re-priced either based on the prevailing market rates using the Fund’s pricing framework or increased by two per cent, whichever is lower. The borrower shall also be given the option to choose the succeeding re-pricing period, whether it will be every three, five, ten or 15 years.
HDMF Circular No. 351, “Amended Guidelines on the Implementation of the Pag-IBIG Non-Performing Asset Resolution Program (NPARP)” amending HDMF Circular No. 311 took effect on November 26, 2014. The circulars are intended to enable highly delinquent borrowers to maintain their possession or use of the property under modified terms and conditions and to immediately dispose of non-performing assets at the highest value possible through cash, installment sale for a period of six months or 12 months, or through housing loan. Nominal interest rate for installment plan is set at 10.250 per cent. Discounts are provided depending on the chosen mode of settlement as follows:
Mode of Settlement Discount
(in per cent)
Cash 30 Six-month installment 20 12-month installment 10 Housing loan revaluation 5
HDMF Circular No. 429, “Revised Guidelines on the Implementation of the Pag-IBIG Non-Performing Asset Resolution Program for Retail Loans” took effect on October 23, 2019, which was intended to update and enhance the guidelines set in the HDMF Circular No. 351.
2.15 Foreign currency transactions
Foreign currency transactions are recorded based on the exchange rate on the date of transaction. Exchange rate difference arising from the settlement of monetary items or from reporting of foreign currency monetary items at rates other than the rate applied in recording the transaction or the rate adopted in previous financial statements are reported in the SCI. Pursuant to AMO No. 2019-005, US Dollar-denominated transactions are initially translated into the functional currency using the Spot Exchange Rate (SER) between the foreign currency and the functional currency on the date of transaction. SER is the exchange rate for the immediate delivery based on the weighted average rate of the previous business

28
day as published by Bankers Association of the Philippines (BAP). All other foreign currency-denominated transactions are translated to US Dollar currency first using the exchange rates published by Reuters before translating the same to Philippine peso.
2.16 Members’ equity
Members’ equity comprises of members’ contributions, employers’ counterpart for employed members and the accumulated dividends of the members as owners of Pag-IBIG Fund. It is credited for contributions collected and share in declared dividends and debited for set-up of Accounts Payable (AP)–Pag-IBIG 1 Members for membership maturing within one year from statement of financial position date (See Note 13), offsetting of member’s short-term or housing loans and withdrawal of savings.
3. CASH AND CASH EQUIVALENTS
This account is composed of the following:
Bank deposits on foreign currencies at December 31, 2019 were revalued based on the following rates as at December 27, 2019: P50.802 = US$1 and Can$1 = US$0.763 for third currency conversion from Canadian to US Dollar. Interest rates from cash equivalents with maturity of 90 days and below range from 0.29 to 3.04 per cent.
4. FINANCIAL ASSETS
This account consists of investment in treasury notes/bonds which includes the following:
2019 2018
Current
Financial Assets Designated at Fair Value Through Surplus/Profit or Deficit/Loss 4,420,171,602 -
4,420,171,602 -
Non-Current
Available-for-Sale 54,752,715,863 46,611,607,049
59,172,887,465 46,611,607,049
2019 2018
Cash on Hand 380,995,539 232,806,309
Cash in Bank – Local Currency 2,781,066,377 4,739,984,352
Cash in Bank – Foreign Currency 18,243,475 19,560,793
Cash Equivalents 3,098,374,641 3,989,144,755
6,278,680,032 8,981,496,209

29
Financial Assets Designated at Fair Value Through Surplus/Profit or Deficit/Loss (Local Equity Fund Managers) The Fund outsourced through Public Bidding-Consultancy Services, the management of its P5.000 billion equity investments to five well-established, technically, legally and financially competent and qualified Local Equity Fund Managers (LEFMs) taking into consideration the requirements for safety, liquidity and growth. As part of risk mitigating measures, the P5.000 billion total equity portfolio shall be equally divided into five lots amounting to P1.000 billion each. The Board, in its meeting on July 5, 2018, approved the Terms of Reference and Budget for the Contract for the Engagement of LEFMs under the Board Resolution No. 3293, series of 2018. Last January 25, 2019, the Fund started investing in LEFMs. As of December 31, 2019, total investment stood at P4.500 billion with a market value of P4.420 billion and losses of P79.828 million.
Under Managed Market Value Income/(Losses)
BPI Asset Management and Trust Corp. 900,000,000 909,768,203 9,768,203
BDO Unibank, Inc. – Trust and Investments Group 900,000,000 881,163,599 (18,836,401)
Philequity Management, Inc. 900,000,000 882,874,819 (17,125,181)
Metropolitan Bank and Trust Company 900,000,000 896,786,167 (3,213,833)
ATRAM Trust Corporation 900,000,000 849,578,814 (50,421,186)
4,500,000,000 4,420,171,602 (79,828,398)
Available-for-sale is composed of investment in bonds and other debt instruments and investment in stocks, details follow:
Included in this account group are Treasury notes/bonds for “Member’s Savings Reserve Fund” (MSRF) with face value of P19.092 billion and cost of P18.182 billion, the setting up of which was covered by HDMF AMO No. 2015-005. This is to ensure efficient liquidity management for benefit claims and return of members’ equity upon maturity, pursuant to Section 1(k), Rule III of the IRR and Section 4 (j) of the HDMF Charter, RA No. 9679.
Investment in Stocks consists of PLDT common shares converted from PLDT preferred shares carried at current market value amounting to P396,188. Interest rates for investment in bonds and other debt instruments range from 3.50 to 8.00 per cent with maturity dates from CYs 2021 to 2042.
2019 2018
Treasury notes/bonds 45,203,766,692 38,018,379,123
Corporate bonds 6,052,064,674 5,439,479,253
Dollar denominated bonds 3,496,124,105 3,152,933,344
Investment in stocks 760,392 815,329
54,752,715,863 46,611,607,049

30
5. OTHER INVESTMENTS This account consists of Investment in Time Deposit, which is a local currency, fixed-
term placement for a period of one year beginning August 20, 2019 and earns interest at 3.61 per cent. As at December 31, 2019, investment in time deposit amounted to P200 million.
6. RECEIVABLES
2019 2018
Current Receivables
Accounts Receivable 2,199,448,442 1,066,152,334
Allowance for Impairment (700,199,469) (652,953,559)
1,499,248,973 413,198,775
Interests Receivable 4,893,110,617 4,136,778,095
Allowance for Impairment (544,513,084) (277,918,902)
4,348,597,533 3,858,859,193
Mortgage/Sales Contracts Receivable 148,452,460,280 138,228,370,109
Allowance for Impairment (25,401,325,998) (25,256,867,204)
123,051,134,282 112,971,502,905
Loans Receivable-Others 44,147,203,381 40,824,309,821
Allowance for Impairment (104,667,311) (205,129,001)
44,042,536,070 40,619,180,820
Inter-Agency Receivables
Due from National Government Agencies 18,267,700 -
Due from Government Corporations 5,945,626 -
Due from Local Government Units 1,522,709 -
25,736,035 -
Other Receivables
Insurance Claims Receivable 130,189,524 -
Due from Officers and Employees 13,410,889 23,166,228
Receivables-Disallowances/Charges 5,665,125 -
Other Receivables 82,911,354 629,344,319
232,176,892 652,510,547
Total Current Receivables 173,199,429,785 158,515,252,240
Non-Current Receivables Mortgage/Sales Contracts Receivable 328,096,869,225 284,916,825,702
Allowance for Impairment (11,448,148,378) (11,357,166,254)
316,648,720,847 273,559,659,448

31
2019 2018
Loans Receivable-Other Government Corporations 3,160,261,372 3,173,428,846
Allowance for Impairment-Loans Receivable-OGCs (1,127,963,086) (1,141,130,561)
2,032,298,286 2,032,298,285
Loans Receivable-Others 20,778,806,392 19,448,012,670
Allowance for Impairment (55,646,784) (232,341,709)
20,723,159,608 19,215,670,961
Other Receivables
Due from Officers and Employees 33,687,194 38,818,275
33,687,194 38,818,275
Total Non-Current Receivables 339,437,865,935 294,846,446,969
512,637,295,720 453,362,785,836
6.1 Accounts Receivable (AR)
a. AR–Developers are receivables representing collection of loan amortizations
by developers for remittance to the Fund, which are within the float period of one week as embodied in the collection servicing agreement. They likewise include the buyback value of past due Sales Contract Receivable (SCR) and SCRs covered by CTS which the developer failed to convert to Real Estate Mortgages (REM), as well as deficiencies on conversion fees withheld from takeout proceeds.
b. AR–Borrowers consist of receivables from housing loan borrowers for
advances made by the Fund for renewal of insurance coverage of delinquent accounts and remaining balance of short term loans after deducting their Total Accumulated Value (TAV) upon withdrawal or claim.
c. AR–Collecting Agents are receivables from collecting agents representing
collection of Members' Contributions and/or loan amortizations due for remittance to the Fund, which are within the float period as embodied in the collection agreements.
The significant increase is due to implementation of mandatory enrollment and remittance by employers with at least ten employees through electronic payment and collection facilities accredited by the Fund.
d. AR–Others include, among others, the P582,940 remaining balance of
unremitted overseas collections from a former employee pursuant to Notice of Finality of Decision issued by the COA on January 18, 2011.

32
6.2 Interest Receivable includes interest earned by the Fund on its investments and loans receivable but not yet collected as at December 31, 2019. The Fund recognizes interest receivable on loans for up to three months of delinquency for accounts with monthly amortization schedule. For accounts with quarterly, semi-annual and annual amortization schedule, accrual ceases on the first month after due date.
6.3 Mortgage/Sales Contracts Receivable (M/SCR) represent loans to Pag-IBIG members that are backed-up by REMs/CTS under the various home lending programs of the Fund. The current M/SCRs of P123.051 billion and P112.972 billion for years 2019 and 2018, respectively, include past due accounts, zero to three months in arrears of P32.415 billion and P40.083 billion, respectively, which are immediately due and demandable.
Loan Sale and Purchase Agreement (LSPA) Between Pag-IBIG Fund and National Home Mortgage Finance Corporation (NHMFC) On June 18, 2019, Pag-IBIG Fund and NHMFC entered into a Loan Sale and Purchase Agreement (LSPA) covering the sale, transfer, assignment and conveyance to the latter, all the rights, obligations, titles and interests to a total of two thousand nine hundred twenty-five (2,925) residential housing loan accounts originating from various socialized housing units that meet the following criteria as of April 30, 2019, the agreed cut-off date:
Documented through Real Estate Mortgage (REM);
Seasoned for at least twenty-four (24) months from date of takeout;
Current in status of up to three (3) months in arrears as of cut-off date;
With loan term not exceeding thirty (30) years from date of takeout, and with remaining loan term of at least five (5) years as of cut-off date;
With original loan amount of up to P450,000.00;
With interest rate of 4.5%;
With loan-to-appraised value ratio not exceeding 100% as of takeout date; and
Properties covered by the sale must be house and lot / condominium unit. Total purchase price for the covered accounts is P1,057,751,733.11. Gains arising from the sale of individual accounts at P59.883 million is included in Note 20, while losses incurred in the amount of P4.521 million is presented as part of Losses under Non-Cash Expenses in Note 25. The Fund and NHMFC also entered a separate Servicing and Accounts Management Agreement for certain scope of services to the accounts covered by the LSPA, including collection of payments and remittance to NHMFC, effective for the period of one (1) year from cut-off date, for a servicing fee of 1.27% of the total purchase price. Service fee earned is included as part of Other Service Income presented in Note 19.

33
6.4 The current L&R of P44.043 billion and P40.619 billion for years 2019 and 2018, respectively, include past due accounts, zero to three months in arrears, of P16.030 billion and P15.180 billion, respectively, which are immediately due and demandable.
6.5 Movements in Allowance for Impairment Loss of receivables are as follows:
Balance
January 1, 2019
Additional Impairment
Loss
Recovery from Impairment
Loss Balance
December 31, 2019
Current ARs 652,953,559 59,756,820 12,510,910 700,199,469 Int. Rec. 277,918,902 275,428,200 8,834,018 544,513,084 MCR/SCRs 25,256,867,204 635,906,361 491,447,567 25,401,325,998 Others 205,129,001 9,502,201 109,963,891 104,667,311
26,392,868,666 980,593,582 622,756,386 26,750,705,862
Non-Current
MCR/SCRs 11,357,166,254 973,337,977 882,355,853 11,448,148,378
LR-Others 1,373,472,270 - 189,862,400 1,183,609,870
12,730,638,524 973,337,977 1,072,218,253 12,631,758,248
39,123,507,190 1,953,931,559 1,694,974,639 39,382,464,110
7. NON-CURRENT ASSETS HELD FOR SALE
IP–ROPA is reclassified to NCAHS upon payment of reservation fee by the buyer. They are derecognized from the books upon full payment of contract price and execution of Deed of Absolute Sale for cash purchase, upon execution of Deed of Conditional Sale for installment sale, and upon loan take out for housing loan. NCAHS is presented at the lower between carrying amount and fair value less cost to sell. The gain arising from the sale of assets held for sale is presented as part of Gains and Loss from sale is presented under Losses. Balance of NCAHS is at P1.655 billion and P2.271 billion as at December 31, 2019 and 2018, respectively, with gains of P5.317 billion included in Note 20 and loss in the amount of P9.772 million as part of Losses under Non-Cash Expenses in Note 25.
8. OTHER CURRENT ASSETS
These consist of the following:
2019 2018
Prepayments 200,605,455 160,352,733
Inventory Held for Consumption 79,251,738 89,772,978
Other Assets 5,509,927 3,908,277
285,367,120 254,033,988
Other assets include semi-expendable machinery, equipment, furniture, fixtures and books amounting to P4.463 million and P2.807 million as at December 31, 2019 and December 31, 2018, respectively.

34
9. INVESTMENT PROPERTY
The movements for this account are as follows:
2019 2018
Cost Balance, January 1 20,797,573,798 20,039,687,749 Additions 7,216,770,054 11,000,009,468 Reclassification to NCAHS (5,654,757,191) (9,925,417,426) Adjustments 501,448,430 (316,705,993)
Balance, December 31 22,861,035,091 20,797,573,798
Accumulated Depreciation
Balance, January 1 728,018,730 388,215,917 Additions 405,851,203 619,032,112 Reversals (105,616,733) (279,229,299)
Balance, December 31 1,028,253,200 728,018,730
Allowance for Impairment Loss Balance, January 1 2,349,560,827 2,321,076,553 Addition 25,575,396 560,349,248 Reversals (752,292,891) (531,864,974)
Balance, December 31 1,622,843,332 2,349,560,827
Net Book Value 20,209,938,559 17,719,994,241
Fair value is based on valuation performed by in-house appraisers. The Fund employed the following appraisal methods: (a) Market Data for the lot, and (b) Cost Approach for the house component of the property. As a matter of policy, ROPA is initially recognized at appraised value net of discount per APM and is subject to re-appraisal at least once every two years until its eventual disposal. The status of appraisals is shown below:
No. of Accounts
Book Value Appraised
Value*
With valid appraisal 53,111 19,869,851,426 32,412,859,024 With lapsed appraisal 8,101 2,991,183,665 4,570,480,798
61,212 22,861,035,091 36,983,339,822 * Appraised value excludes applicable discount under APM.
For accounts with lapsed appraisal as at December 31, 2019, units concerned are continuously exerting efforts to fully migrate the remaining ROPA accounts to the ROPA System.
ROPA System has been fully deployed in CY 2018. Said system is an efficient tool in recording ROPA transactions specifically geared towards volume of portfolio, complexity of the transactions and reasons, revaluation and computation of impairment and depreciation.
Total rental income on IP–ROPA for CY 2019 and CY 2018 amounted to P8.323 million and P13.919 million, respectively.

35
IP - Land consists of the following:
Land
Land Improvements Total
Cost January 1, 2019 302,632,050 1,354,392 303,986,442 Addition - - -
December 31, 2019 302,632,050 1,354,392 303,986,442
January 1, 2018 302,632,050 1,354,392 303,986,442 Addition - - -
December 31, 2018 302,632,050 1,354,392 303,986,442
Accumulated Depreciation
January 1, 2019 - 396,160 396,160 Addition - 121,895 121,895
December 31, 2019 - 518,055 518,055
January 1, 2018 - 274,264 274,264 Addition - 121,896 121,896
December 31, 2018 - 396,160 396,160
Net Book Value
December 31, 2019 302,632,505 836,337 303,468,387
Net Book Value
December 31, 2018 302,632,050 958,232 303,590,282
The pieces of property being held for rental and capital appreciation are located at the Manila Harbour Central Business District, Tondo, Manila. These consist of 18 lots with total area of 17,293.26 square meters acquired in December 1996 in exchange for the matured Smokey Mountain Project Participation Certificates as approved under Board Resolution No. 1234, series of 1996. The book value is inclusive of real estate tax paid upon acquisition. All the 18 lots on lease are as follows:
Lessee Block/Lot
No. Qty Contract Period Area
(in Sq.M.) Rent per
Sq.M.
SL Harbour Bulk Terminal Corp. B15, L1-6 6 Dec. 2019 – Dec. 2021 4,368.23 P261.00
SL Harbour Bulk Terminal Corp. B15, L7 1 Dec. 2019 – Dec. 2021 5,167.53 261.00 Moreta Shipping Lines Inc B18, L5-7 3 Mar. 2020 – Mar. 2022(T) 2,125.48 271.50 Moreta Shipping Lines Inc. B21, L5-12 8 Dec. 2019 – Dec.2021 5,632.02 261.00
18 17,293.26
Total rent/lease income on the properties for CY 2019 totaled P47.919 million, while expenses incurred, including real estate taxes and depreciation expenses on the installed water distribution system, amounted to P2.940 million.

36
As at December 31, 2019, the estimated minimum future annual rentals of the Fund are as follows:
2019 2018
Within one year 54,051,173 40,984,240 More than one year but not more than five years 53,572,281 576,000
107,623,454 41,560,240
On April 17, 2019, the appraisal value was at P640.762 million as determined by the in-house appraisers.
10. PROPERTY AND EQUIPMENT, NET
This account consists of the following: As at December 31, 2019
Land Land
Improvements
Buildings and Other Structures
Machinery and Equipment Total
Carrying Amount, January 1, 2019 104,212,774 385,248 468,553,113 786,214,777 1,359,365,912
Additions/Acquisitions 4,666,138 572,656 353,969,524 482,380,525 841,588,843
Total 108,878,912 957,904 822,522,637 1,268,595,302 2,200,954,755
Disposals - - (195,482,538) (165,668,994) (361,151,532)
Depreciation - (70,811) (113,600,010) (194,715,146) (308,385,967)
Carrying Amount, December 31, 2019 108,878,912 887,093 513,440,089 908,211,162 1,531,417,256
Gross Cost 108,878,912 1,588,428 1,485,248,315 2,278,694,165 3,874,409,820
Accumulated Depreciation - (701,335) (971,808,227) (1,370,483,002) (2,342,992,564)
Carrying Amount, December 31, 2019 108,878,912 887,093 513,440,088 908,211,163 1,531,417,256
As at December 31, 2018
Land Land
Improvements
Buildings and Other Structures
Machinery and Equipment Total
Carrying Amount, January 1, 2018 103,017,065 456,057 482,483,649 806,972,851 1,392,929,622
Additions/Acquisitions 1,195,709 - 41,434,222 276,381,879 319,011,810
Total 104,212,774 456,057 523,917,871 1,083,354,730 1,711,941,432
Disposals - - (10,420,773) (120,578,493) (130,999,265)
Depreciation - (70,809) (44,943,985) (176,561,460) (221,576,255)
Carrying Amount, December 31, 2018 104,212,774 385,248 468,553,113 786,214,777 1,359,365,912
Gross Cost 104,212,774 842,296 1,404,045,145 2,086,119,414 3,595,219,629
Accumulated Depreciation - (457,048) (935,492,032) (1,299,904,637) (2,235,853,717)
Carrying Amount, December 31, 2018 104,212,774 385,248 468,553,113 786,214,777 1,359,365,912
37
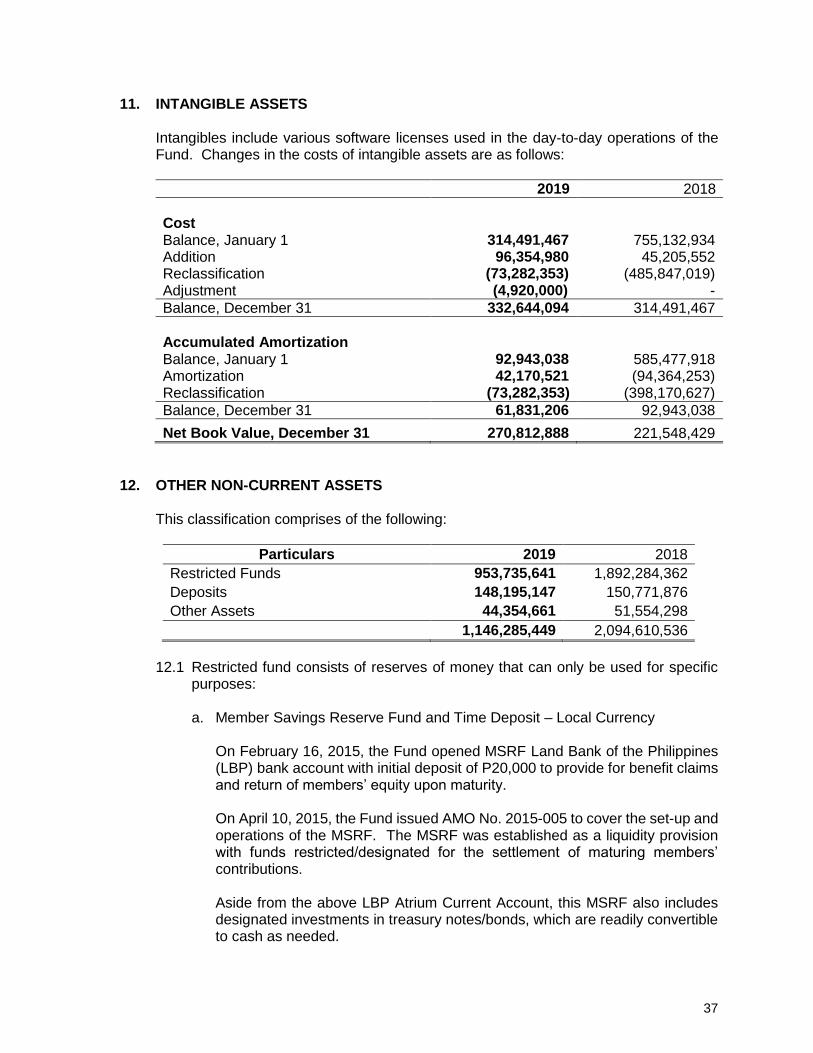
11. INTANGIBLE ASSETS
Intangibles include various software licenses used in the day-to-day operations of the Fund. Changes in the costs of intangible assets are as follows:
2019 2018
Cost
Balance, January 1 314,491,467 755,132,934 Addition 96,354,980 45,205,552 Reclassification (73,282,353) (485,847,019) Adjustment (4,920,000) -
Balance, December 31 332,644,094 314,491,467
Accumulated Amortization
Balance, January 1 92,943,038 585,477,918 Amortization 42,170,521 (94,364,253) Reclassification (73,282,353) (398,170,627)
Balance, December 31 61,831,206 92,943,038
Net Book Value, December 31 270,812,888 221,548,429
12. OTHER NON-CURRENT ASSETS
This classification comprises of the following:
Particulars 2019 2018
Restricted Funds 953,735,641 1,892,284,362
Deposits 148,195,147 150,771,876
Other Assets 44,354,661 51,554,298
1,146,285,449 2,094,610,536
12.1 Restricted fund consists of reserves of money that can only be used for specific
purposes: a. Member Savings Reserve Fund and Time Deposit – Local Currency
On February 16, 2015, the Fund opened MSRF Land Bank of the Philippines (LBP) bank account with initial deposit of P20,000 to provide for benefit claims and return of members’ equity upon maturity.
On April 10, 2015, the Fund issued AMO No. 2015-005 to cover the set-up and operations of the MSRF. The MSRF was established as a liquidity provision with funds restricted/designated for the settlement of maturing members’ contributions. Aside from the above LBP Atrium Current Account, this MSRF also includes designated investments in treasury notes/bonds, which are readily convertible to cash as needed.

38
b. A life and non-life insurance coverage as Contingency Trust Fund (CTF)1 and
CTF2, were established to cover for Mortgage Redemption Insurance (MRI)/Sales Redemption Insurance (SRI) and Fire and Allied Perils Insurance (FAPI) for loan releases of the Fund and pertinent collaterals for the loans. Initial set-up of CTF1 and CTF2 was at P890.970 million and P90.371 million, respectively.
As an interim measure, the monies collected from the borrowers for MRI/SRI premium shall be placed in the trust fund administered by a trustee bank and all claims relating to the same shall be paid out of the fund.
On October 28, 2014, the Fund formally entered into brokerage agreement with the new insurance, for yearly renewable term MRI/SRI coverage of housing loan borrowers starting November 1, 2014, effectively terminating CTF1. Based on the Fund’s Board approval, the P523.801 million remaining balance as at December 31, 2016, shall be distributed among active housing loan borrowers, after settlement of all claims covered by the interim period.
The Fund formally entered anew into brokerage agreement with the same insurance provider, the winning bidder, on January 11, 2018, for a five-year non-life insurance coverage of insured property starting January 12, 2018, effectively terminating also CTF2. On October 30, 2019, the Fund renewed its brokerage agreement for MRI/SRI coverage of housing loan borrowers for a period of five (5) years beginning November 1, 2019.
c. Funds Held in Trust–Trustee and Officers Liability Fund (TOLF) was created
and established on May 8, 2014 pursuant to and in compliance with the requirements of Governance Commission for GOCCs (GCG) Memorandum Circular (MC) No. 2012-10 (Re-issued). Its objective is to provide the Fund, the members of its governing board and its officers, the means to pursue their fiduciary duties and obligations to always act in the best interest of the Fund and with utmost good faith. It allows them the proper recovery of the costs of litigation and judgment liability imposed on them when they are sued on matters within their official functions and capacity and on matters where business judgment has been exercised in good faith. A Trust Fund Committee composed of officers of the Fund headed by the CEO was constituted, primarily to oversee the HDMF TOLF. A government financial institution was also constituted as TOLF Trustee pursuant to Item V of the aforementioned GCG MC. Initially set up at P244 million, the Committee shall replenish the trust fund in case usage thereof at any given time exceeds 20 per cent of the initial amount. As at December 31, 2019, the balance of TOLF is at P280.299 million with a reported income of P10.617 million from the administration of the fund for the year 2019.
12.2 Deposits consist of rental and other guaranty payments.
12.3 Other assets include other deferred charges, unserviceable property and
equipment and investment in joint venture.

39
13. FINANCIAL LIABILITIES
2019 2018
Accounts Payable 63,287,458,609 36,042,737,062
Insurance/Reinsurance Premium Payable 3,918,290,102 4,543,977,093
Due to Officers and Employees 5,345,118 8,472,650
Interest Payable - 188,200
67,211,093,829 40,595,375,005
13.1 Accounts Payable includes amount due to members at P38.699 billion and
P11.524 billion for the years ending December 31, 2019 and 2018, respectively. These totals represent TAV which have reached their maturity at SFP date but have not been withdrawn, as well as those that will mature in the succeeding year.
Payables also include amount due to developers/borrowers representing the amount deducted from their loan take out proceeds to defray expenses to be incurred in the conversion of CTSs to REMs. Similarly, it also consists of accrual of expenses, charges and taxes already incurred at year-end but have not yet been paid.
On January 20, 2020, the ManCom approved the reclassification of Long Outstanding Accounts Payable to Retained Earnings (see Note 28.2). This is in accordance with AMO No. 2018-013, which covers accounts payable where balance remains outstanding in the books of the Fund for two (2) years or more and is without actual claim filed.
13.2 Insurance/Reinsurance Premium Payable represents insurance premiums for
housing loans initially deducted from housing loan proceeds and subsequently collected as part of the monthly amortizations representing insurance premium prepayments for remittance to the insurance provider.
14. INTER-AGENCY PAYABLES
These accounts consist of the following:
2019 2018
Due to BIR 121,477,708 63,345,851
Due to Other Government Corporations 53,375,352 5,549,835
Due to GSIS 16,349,091 16,610,446
Due to NGAs 1,461,821 -
Due to PhilHealth 1,437,648 1,232,034
Due to SSS 1,417,375 -
Due to Pag-IBIG 919,875 3,165,181
Due to LGUs 149,176 -
196,588,046 89,903,347

40
14.1 Due to BIR consists of liability for income taxes withheld from employees' compensation and for taxes withheld from payment to suppliers for the account of the BIR for the month of December 2019 to be remitted in January 2020.
14.2 Due to Other Government Corporations includes collections for the Servicing and
Accounts Management Agreement that are due for remittance to NHMFC, which amounted to P19.225 million as at December 31, 2019. This account also includes housing loan amortization payments for the account of NHMFC.
14.3 Due to GSIS, Due to Pag-IBIG and Due to PhilHealth comprise of amortization of
loan availments, life and retirement insurance premiums payable to GSIS, contributions and amortization of loan availments payable to Pag-IBIG Fund, and medical insurance premiums payable to PhilHealth for the month of December 2019 to be remitted in January 2020.
15. TRUST LIABILITIES
2019 2018
Trust liabilities 839,824,996 826,023,312
Customers' deposits payable 2,290,299,070 2,380,527,122
Guaranty/security deposits payable 149,692,852 128,880,444
3,279,816,918 3,335,430,878
15.1 Trust liabilities include Trust Liabilities–Head Office in the amount of P227.607
million, Trust Liabilities–POP Members in the amount of P58.454 million, Trust Liabilities–Accountable Officers in the amount of P0.870 million as at December 31, 2019.
Trust Liabilities-POP Members refers to long outstanding membership contributions that remain unposted for the following reasons:
- Invalid payor’s ID and different membership type; - No available records with Pag-IBIG International Operations Group (PIOG); - Discrepancy in the payor’s name; and - Lack of over-the-counter daily collection report.
Set-up of Trust Liabilities–POP Members was made on May 25, 2015 in the amount of P58.807 million. Through various initiatives, e.g. strengthening the “one ID system” for each member, encoding/editing of ID numbers and period covered, verifying whether the unallocated accounts have been claimed already and coordinating with the manning agencies/OFW members for the submission of lacking collection lists, contributions lodged to Trust Liabilities–POP Members were posted/adjusted so that these can be debited from Trust Liabilities account.
Undistributed Collections (UC)-Housing Loan (HL) in the amount of P217.192 million representing dormant balances left by the defunct Billing and Ledgering Department (BLD)–MCR in the books of the CHQ after the decentralization of accounts in CY 1992, and Unidentifiable Collections in the amount of P6.818 million which includes collections of closed banks, were reclassified to Trust

41
Liability account on December 29, 2016 after reconciliation activities proved to be futile due to absence of supporting documents. These shall be gradually reduced upon request by operating units for transfer of payment records, triggered by the borrowers’ presentation of Pag-IBIG Fund Receipts (PFRs) covering previous payments.
15.2 Customers' deposits payable represents advance housing and multi-purpose loan
amortization to be allocated when they fall due.
15.3 Guaranty/security deposits payable pertains to suppliers’ deposits on bids and performance guarantee deposits.
16. PROVISIONS
2019 2018
Leave Benefits Payable 747,376,242 707,209,359
Other Provisions 1,487,471,302 54,766,887
2,234,847,544 761,976,246
In CY 2018, the cumulative leave credits and benefits previously recorded under Accounts Payable were reclassified to Leave Benefits Payable effective June 26, 2018, pursuant to AMO No. 2018-011. Pursuant to AMO No. 2019-018, “Accounting for Accrued and Deferred Expenses”, the remaining balances of accrued expenses accounts prior to accrual were reclassified to Other Provisions, effective December 27, 2019.
17. OTHER PAYABLES
The details of this classification are as follows:
2019 2018
Undistributed collections 878,994,272 1,174,405,315
Unclaimed balances 14,831,430 17,229,806
893,825,702 1,191,635,121
17.1 Undistributed collections include collections of members’ contributions, short term
loans and housing loan repayments which have not been allocated to the specific members’/borrowers’ accounts and collections under PFMS and STLMS due to absence of MID Number and STL Application Number. These also include collections which at month-end are still in transit for transfer to the branches carrying the account/s, thus, remain floating in the Due to/from accounts. The Posting Clearing Account (PCA) which falls under UC covers daily collections and checks subject to one day clearing period prior to allocation and posting to the members’/borrowers’ subsidiary ledger within five days from receipt of the journal ticket by the operating unit concerned.

42
The huge amount of PCA-MC and UC-MC had a material impact on the Fund’s financial statements because it consequently overstated the Current Liabilities and understated the Members’ Equity. This will likewise affect Pag-IBIG Fund’s Net Fund Assets (computed as Total Assets net of Current Liabilities) which is the basis of the Fund’s two per cent statutory limit for fund administration cost. A GL entry was made to adjust the balances of the UC-MC to MC-Unallocated account which was subsequently reversed in January 2020 to avoid double take-up because PFMS automatically debits PCA-MC account once MID numbers are available. This adjustment was made to present fairly the account in the financial statement.
17.2 Unclaimed balances represent checks dated over six months payable to members/borrowers/suppliers which have not been presented to bank for payment.
18. DEFERRED CREDITS/UNEARNED INCOME
2019 2018
Deferred Credits 7,829,334,386 8,255,204,296
Unearned Revenue/Income 676,763,705 1,819,900,328
8,506,098,091 10,075,104,624
18.1 Deferred credits account represents the capitalized interest income on
restructured housing loans which are credited to interest income and penalties upon amortization every month-end and rental payments on foreclosed properties under the redemption period or rent-to-own arrangement.
18.2 Unearned revenue/income includes capitalized origination fees on loans processed prior to May 30, 2001, being amortized and credited as income over the term of the loan and unearned income from housing loans.
19. SERVICE AND BUSINESS INCOME
The account comprises of interest income from the following:
2019 2018
Service income Fees and commissions income 375,487,609 367,881,135
Processing fees 286,956,170 294,594,593
Other service income 90,530,346 22,129,512
752,974,125 684,605,240
Business Income
Interest income 39,935,511,567 36,508,334,023
Income from acquired/foreclosed assets 3,451,442,355 3,333,958,217
Fines and Penalties-Business Income 1,598,232,674 1,255,353,855

43
2019 2018
Rent/lease income 57,452,456 65,101,067
Dividend income 192,744 222,584
Other business income 3,898,811 28,648,078
45,046,730,607 41,191,617,824
45,799,704,732 41,876,223,064
19.1 Fees and commissions income includes insurance service fees that are
administrative fees collected from the insurance provider equivalent to 0.02 per cent of the total amount insured, deducted from the remittances of premiums to the broker. It also includes Sales Administration Fee and Mortgage Origination Fee that are collected as part of the monthly amortization of housing loan borrowers who availed of loans under HDMF Circular Nos. 147 and 148, respectively, fees for appraisal services on properties offered as collateral for loan with the Fund, forfeited commitment fee from developers, handling fee, pre-termination fee and Housing Contributory Fund. Housing Contributory Fund represents a portion of the loan amortization on housing loans extended by the NHMFC to HDMF member-borrowers, subsequently assigned to the Fund in CY 1992. This was based on the premise that the few early borrowers favored by NHMFC’s home lending policies should share such favor with future generations as well as future borrowers who are likely to borrow at a time when long term funds and prevailing rates then may no longer be available.
19.2 Processing fees of P3,000 are collected from borrowers availing of loans under HDMF Circular Nos. 312, 343 and 396 and conversion to Full Risk-Based Pricing Model under HDMF Circular No. 317.
19.3 Interest income includes interest earned from housing loans, multi-purpose loans and investment in bonds.
19.4 Income from acquired/foreclosed assets includes income from acquired/foreclosed
property and income from repurchase of dacioned assets which are redeemed by the owners with the redemption period.
19.5 Fines and penalties-business income are fees imposed on late remittances of
HDMF contributions, amortizations of short-term loans and mortgage contracts receivable, and other housing related loans.

44
20. GAINS
2019 2018
Gain on sale of investment property 5,798,807,879 4,694,340,282
Gain on foreign exchange (forex) 214,687,159 433,907,124
Gain on sale/redemption/transfer of investments 160,265,608 214,048,729
Gain from changes in fair value of financial instruments 9,768,203 -
Gain on sale of property, plant and equipment 3,836,520 3,934,400
Other gains
Gain on revalued MCR 190,945,992 276,847,025
Gain on revalued SCR 20,166,493 45,960,231
Gain from redemption of auctioned properties 10,615,872 3,031,129
Gain on revalued wholesale loans 1,524,772 114,115,930
Gain on restructuring - 319,774
Gain on sale on disposal of items under litigation - 10,431,385
6,410,618,498 5,796,936,009
21. OTHER NON-OPERATING INCOME
2019 2018
Reversal of impairment loss 3,607,399,860 2,793,528,273 Miscellaneous income 1,078,585,654 2,355,602,719
4,685,985,514 5,149,130,992
21.1 Reversal of impairment loss pertains to recovery from provision of impairment
losses due to improvement in the quality of the loan portfolio and other housing-related assets of the Fund. Details for reversal of impairment loss is included in Notes 6 and 9.

45
22. PERSONNEL SERVICES
2019 2018
Salaries and wages Salaries and wages-regular 1,804,312,942 1,583,554,626
1,804,312,942 1,583,554,626
Other compensation
Year-end bonus 150,963,521 147,459,863
Personnel economic relief allowance 89,406,669 87,153,835
Overtime and night pay 81,012,247 86,952,780
Representation allowance 47,539,943 47,096,811
Transportation allowance 47,458,172 47,943,996
Clothing/uniform allowance 22,818,577 22,031,680
Cash gift 18,713,250 18,293,000
Quarters allowance 11,763,829 8,707,036
Longevity pay 17,047,505 16,484,017
Subsistence allowance 665,200 85,500
Honoraria 20,000 3,750,079
Other bonuses and allowances 1,374,602,443 1,061,734,482
1,862,011,356 1,547,693,079
Personnel benefit contributions
Provident/welfare fund contributions 814,075,997 713,353,608
Retirement and life insurance premiums 216,927,056 190,106,734
PhilHealth contributions 21,070,466 18,965,083
Pag-IBIG contributions 4,487,869 4,384,407
Employees compensation insurance premiums 4,424,457 4,332,209
1,060,985,845 931,142,041
Other personnel benefits
Terminal leave benefits 104,097,297 203,312,427
Retirement gratuity - 675
Other personnel benefits 11,757,780 193,871,619
115,855,077 397,184,721
4,843,165,220 4,459,574,467

46
23. MAINTENANCE AND OTHER OPERATING EXPENSES
This expense classification consists of:
2019 2018
General services 2,964,288,538 2,251,679,586
Litigation/acquired assets expenses 937,697,900 1,141,157,756
Rent/Lease Expenses 734,934,336 682,465,072
Confidential, Intelligence and Extraordinary Expenses 400,314,182 190,062,357
Supplies and materials expenses 292,221,232 273,359,354
Software charges 281,004,206 280,369,609
Utility expenses 222,293,302 231,472,735
Communication expenses 182,326,009 115,848,250
Members' benefits 175,998,494 163,187,372
Professional services 118,326,330 99,560,264
Traveling expenses 95,152,559 67,745,785
Repairs and maintenance 93,301,656 82,447,639
Training and scholarship expenses 48,279,821 42,084,292
Fees and commission expenses 39,974,870 53,211,176
Survey, research, exploration and development expenses 25,517,297 31,157,537
Printing and publication expenses 23,420,606 37,752,501
Taxes, insurance premiums and other fees 21,793,507 154,163,383
Loyalty card expenses 4,599,541 30,593,845
Other maintenance and operating expenses 291,843,153 387,032,502
6,953,287,539 6,315,351,015
23.1 General services consist of compensation of job order, agency-hired personnel
and payment for security, janitorial, allied, and other services.
23.2 Litigation/acquired assets account pertains to expenses incurred for litigation proceedings and registration/consolidation of ownership of acquired assets, as well as those incurred in their preservation/maintenance and expenses related to disposal of acquired assets.
23.3 Other maintenance and operating expenses include expenses incurred in relation
to advertising, promotional and marketing activities, representation, transportation and delivery and other expenses related to major events and conventions.

47
24. FINANCIAL EXPENSES
2019 2018
Management supervision/Trusteeship fees 1,967,342 3,207,996 Bank charges 1,924,977 2,160,653 Other financial charges - 35,000
3,892,319 5,403,649
25. NON-CASH EXPENSES
2019 2018
Impairment loss 8,085,213,859 6,510,195,230 Losses 1,817,941,195 1,594,934,672 Depreciation 774,501,291 677,090,549 Amortization 42,170,521 85,616,163 Discounts and rebates - 662,441
10,719,826,866 8,868,499,055
25.1 The provision for impairment is intended to absorb the potential future losses on
the Funds’ loans and receivables, investment properties, and properties and equipment.
25.2 Losses include loss on acquisition of ROPA amounting to P1.281 billion and P1.126 billion in 2019 and 2018, respectively.
26. MEMBERS’ EQUITY
This account reflects the equity of the members as owners of Pag-IBIG Fund amounting to P436.645 billion in CY 2019 and P408.836 billion in CY 2018, corresponding to members’ contributions, employers’ counterpart for employed members and the accumulated dividends. The account is reduced by the provident claims of members and offsetting of loans against the TAVs. Corollary to disclosure under Note 17.1, collections identified as MC amounting to P950.966 million were adjusted to MC-Unallocated account to record the members’ savings collections which cannot be posted to members’ individual ledger due to incomplete, incorrect or absence of MID number at year end. The adjustment was likewise reversed in January 2020.

48
27. CUMULATIVE CHANGES IN FAIR VALUE
Cumulative changes in fair value comprise of net unrealized gains (losses) from marking to market of available for sale investments. The net changes for each year are as follows:
2019 2018
Bonds and other debt instruments (1,178,171,564) (7,469,481,639) Bonds and other debt instruments – MSRF (924,202,293) (4,931,645,603) Stocks/equity securities (504,330) (449,394))
(2,102,878,187) (12,401,576,636)
The decrease in net unrealized losses is caused by the increase in the marking to market revaluation of AFS investments. In CY 2019, the favorable market conditions improve the inflation rate as well as BSP’s interest rates which favorably affected the Fund’s investment portfolio. The net unrealized gains (losses) are broken down as follows:
2019 2018
Net unrealized gains (losses), January 1 (12,401,576,636) (5,333,274,428)
Unrealized gains: Recognized during the year 14,750,397,842 4,185,442,384
Realized during the year (677,305,041) (1,299,086,817)
Net unrealized gains 14,073,092,801 2,886,355,567
Unrealized losses:
Recognized during the year (4,447,983,070) (11,706,012,441)
Realized during the year 673,588,718 1,751,354,666
Net unrealized losses (3,774,394,352) (9,954,657,775)
Net Unrealized Gains (Losses), December 31 (2,102,878,187) (12,401,576,636)
The realized gains and realized losses during the year amounting to P0.677 billion and P0.674 billion, respectively, were recorded as part of gain from sale/redemption and loss from sale/redemption of available for sale investments.
28. RETAINED EARNINGS (RE)
Retained Earnings consists of accumulated earnings of the Fund not paid out as dividends and donated surplus. RE amounting to P86.523 billion as at December 31, 2019, includes donated surplus, appropriations, and net income for CY 2019 pending dividend declaration.
28.1 Reserve for future claims
Pursuant to BOT approval per Resolution No. 2998 dated January 31, 2013, account reconciling items in the amount of P1.826 billion were lodged to this account. The set-up is intended for the settlement of valid future claims, subject to pertinent provisions of Rule XI, Section 1, Unclaimed Savings/Dividends of the IRR of RA No. 9679. As provided therein, any amount standing to the credit of any member for a period of one year after termination of membership shall be regarded

49
as unclaimed savings and shall be reclassified as an account payable to the former member of the Fund. If any such amount standing to the credit of such person remains unclaimed for a period of more than ten years, the same shall be reverted to the Fund’s retained earnings. In CY 2019, a reversal of P6.190 million prior year-end adjustments per Memo 2013-061 was made. As at December 31, 2019, the account has an outstanding balance of P0.375 million.
28.2 Appropriated and Unclaimed Balance Pursuant to AMO No. 2018-013 issued last August 28, 2018, Long Outstanding Accounts Payable aging 2 years but not more than 10 years are reclassified to Retained Earnings – Appropriated while payables aging more than 10 years are reclassified to Retained Earnings – Unclaimed Balances accounts. As at December 31, 2019, approved reclassification to Retained Earnings – Appropriated and Retained Earnings – Unclaimed Balance amounted to P2.057 million and P1.870 million, respectively.
28.3 Dividends For year 2019, dividends in the amount of P31.073 billion were appropriated from RE representing 90.00 per cent of the corresponding net income for the year in the amount of P34.525 billion excluding net foreign exchange loss of P150.636 million For prior years, dividends in the amount of P28.229 billion and P27.294 billion were appropriated from RE representing 85.63 per cent and 90.00 per cent of the corresponding net income for the year in the amount of P32.967 billion and P30.326 billion excluding net foreign exchange gain of P205.207 million and net foreign exchange loss of P58.126 million, for years 2018 and 2017, respectively.
28.4 Donated Surplus This account refers to the lot, where La Union Branch’s office building is located, acquired by the Fund through donation from the provincial government of La Union on October 27, 1997 which was recorded in the books at market value at the time of acquisition.
29. SUPPLEMENTARY INFORMATION
In compliance with the requirements set forth by Revenue Regulation No. 15-2010, hereunder, are the information on taxes, duties and licenses paid or accrued during the taxable year.

50
The components of taxes, duties and license fees paid and accrued during the year are as follows:
2019 2018
Taxes, duties and fees Taxes and licenses – ROPA 516,455,951 534,735,376 Real estate taxes – ROPA 83,262,877 74,694,033 Real estate taxes – Properties 2,968,430 2,211,488 Others 3,164,224 137,689,658
605,851,482 749,330,555
Withholding taxes
Tax on compensation and benefits 404,677,413 413,174,874 Creditable withholding taxes 313,932,751 254,877,838 Final withholding taxes 2,072,912 2,094,566
720,683,076 670,147,278
1,326,534,558 1,281,788,175
On September 28, 2011, BIR Revenue Memorandum Circular No. 43-2011 circularizing Section 19 of RA No. 9679 was issued highlighting the Fund’s exemption from tax payments relative to the said law. It also states the Fund’s exemption from the documentary stamp tax imposed under Title VII of the National Internal Revenue Code of 1997. The President of the Philippines signed into law the Package 1 of the Tax Reform Acceleration and Inclusion Law on December 19, 2017, otherwise known as the “TRAIN Law” under RA No. 10963. One of the salient features of the Train Law is the increase of the non-taxable personal income to P250,000 per year for compensation income earners and self-employed and/or professional. The result of which is the decrease in monthly withholding tax for employees compensation as shown above. This act took effect starting in January 2018. The taxes paid for ROPA cover tax assessment not paid by the borrowers prior to foreclosure of their properties, assumed by the Fund to facilitate consolidation of title.
The Fund has no deficiency assessments and tax cases under preliminary investigation, litigation and/or prosecution in courts or bodies outside the BIR.
30. RELATED PARTY DISCLOSURES
30.1 Key management compensation
The compensation of key management personnel which consists of short term benefits amounted to P48.179 million and P48.281 million for the year ending December 31, 2019 and 2018, respectively. Key management compensation forms part of the “Personnel Services” and “Maintenance and Other Operating Expenses” account under Notes 22 and 23. Salaries and allowances received, and expenses incurred by the key officers in the conduct of their official functions are as follows:

51
Particulars 2019 2018
Personnel services Salaries and wages 22,515,622 20,421,760 Other compensations 2,313,905 3,270,255 Personnel benefits contributions 10,132,030 9,189,792 Other personnel benefits 7,769,712 10,912,750
42,731,269 43,794,557
Maintenance and other operating expenses Survey, research, exploration
and development expenses 1,987,197 1,693,559 Amortization 1,334,235 987,667 Supplies and materials expenses 484,311 374,020 Other maintenance and operating expenses 1,641,794 1,430,991
5,447,537 4,486,237
48,178,806 48,280,794
30.2 Co-ownership of Atrium of Makati Condominium Building
The Fund owns 84 units of the 177 total condominium units and 83 slots of the 204 total parking slots of the Atrium of Makati Condominium Building, equivalent to 14,865.80 square meters or 52.73 per cent ownership of the 28,193.48 total floor area. The property is located along Makati Avenue, Urdaneta Village, Makati City.
31. RISK MANAGEMENT
Pending the creation of a formal risk management structure and approval by the GCG, a Risk Management Task Force (RMTF) was created. On December 29, 2015, a Special Order (SO) reassigning the Investment Risk Management Division (IRMD) staff, complemented by a staff from the Legal and General Counsel Group, to the RMTF was issued.
Per SO, the RMTF shall handle priority activities for the following functions:
- Design and deployment of the overall risk management framework to ensure that
the Fund’s exposures to its various risk-taking activities are appropriately identified, measured, monitored, reported and managed across the organization covering credit risk, liquidity risk, market risk and operational risk;
- Monitoring of business unit’s adherence to framework and strategy; - Compilation of data on risk across operating units and escalation of risk and control
issues to ManCom/Board Risk and Capital Committee (BRCC); - Aggregated risk reporting; and
- Recommendation on risk management decisions/mitigating activities to the
business units, ManCom, BRCC and BOT.

52
The Enterprise Risk Management Policy (ERMP) was approved by the BOT on July 6, 2017. The ERMP is the overarching framework for the overall direction and strategies of the Fund on enterprise risk management. It shall serve as guide for systems and procedures for risk assessment, monitoring, and communication and shall define the context for risk management activities.
In CY 2019, the RMTF started updating the ManCom, BRCC and the full Board on the financial risks (credit, market and liquidity) associated with the Fund’s operations by reporting to them monthly the Financial Risk Highlights (FRH). The FRH includes all the risk measurement tools/models/templates adopted by the Fund to calculate/compute market, credit and liquidity risks.
31.1 Credit risk
Credit risk is the risk of loss arising from the borrowers’ failure to fulfill their contractual obligations. To mitigate this risk, the Fund has adopted the following initiatives:
a. Implementation of the Borrower Evaluation System (BES)
The Fund has formulated the BES, a credit quality assessment process for the determination of the creditworthiness of housing loan borrowers which also factors in borrowers’ equity adjustments.
The assessment of the credit quality of housing portfolio taken out prior to July 2012 is based on the flow rate or payment behavior of the borrowers.
b. Adoption of the Single Borrower’s Limit (SBL) for Wholesale Loans (WL)
(HDMF Circular No. 306 dated April 10, 2012)
This aims to mitigate risks and limit the losses in the event of default by the borrower/s and avoid a situation where a single loss will adversely affect the profitability/financial condition of the Fund.
The total amount of loans, credit accommodations and guarantees that may be extended to any person, partnership, association, corporation or other entity shall, at any point in time, not exceed 25 per cent of the Free RE of the Fund. Free RE refers to the RE after declaration of dividends for the preceding year and net of the total capital valuation accounts.
c. Conversion to Full Risk Based Pricing Model (HDMF Circular No. 317, dated
August 8, 2012)
A pricing framework was adopted where a market based and full risk-based pricing of housing loans shall cover the Fund’s costs, its risks in terms of expected loss on defaults and reasonable spread. In support to the pricing framework, the Fund formulated models for the Probability of Default (PD) and Loss Given Default (LGD), which are components of the Expected Loss Rate (ELR). ELR is defined as the product of PD and LGD. These models will be applied to various loan programs and

53
subjected to periodic review for the required modifications to firm-up the models.
d. Credit Risk Management Policy
The Board approved the credit risk management policy last July 6, 2017. It was patterned from pertinent provisions of BSP Circular No. 855 series of 2014, Guidelines on Sound Credit Risk Management Practices.
e. Prepayment Rate Model (PRM) for End-User
This was presented to and approved by the ManCom and BRCC last July 29, 2019 and August 30, 2019, respectively. The Model aims to determine and monitor the Prepayment Rate of the End-User Financing Portfolio. Since its approval, it has formed part of the Financial Risk Highlights, a monthly report.
f. Model Risk Management Policy
The ManCom and BRCC approved the Model Risk Management Policy (MRMP) last December 9, 2019 and December 17, 2019, respectively. The MRMP shall enable proactive assessment, prioritization, and management of Model Risks to support the Fund’s vision, mission and objectives. It is patterned from different guidelines from European and US banks. This shall be implemented by phase and will form part of the Risk Management Manual.
31.2 Liquidity risk
Liquidity risk is defined as the risk that the Fund will encounter difficulty in meeting obligations associated with financial liabilities. Liquidity risk may arise because of the possibility that the Fund may be unable to meet its payment obligations when they fall due under both normal and stress circumstances. The Liquidity Risk Management Policy (LRMP) was approved by the BOT on July 6, 2017. The Fund ensures liquidity through a combination of active management of liabilities, a liquid asset portfolio composed substantially of deposits in government securities and securing of money market lines. The Funding and Liquidity Risk Framework (FLRF) and Contingency Funding Plan (CFP) Template were approved by the BOT on November 9, 2017. Maturity Analysis As at December 31, 2019, the Fund has no outstanding long-term liabilities. The amounts disclosed below are the contractual undiscounted cash flows of current liabilities in respect of balances due within 12 months. These generally equal their carrying amounts in the SFP as the impact of discounting is not significant.

54
Liabilities On demand up
to three months
More than three months up to 12
months
Accounts payable 26,812,699,548 40,393,049,163 Customers' Deposits Payable 2,290,299,070 - Provisions 2,234,847,544 - Trust liabilities 839,824,996 - Inter-agency payables 196,588,046 - Guaranty/Security Deposits Payable 149,692,852 - Unclaimed balances 14,831,430 - Due to officers and employees 5,345,118 -
To meet maturing obligations, aside from cash generated from operations, the Fund earmarks funds and invests in assets readily convertible into cash, such as time/special savings deposits, treasury bills, notes, bonds, both local and foreign denominated, and equity securities. As at December 31, 2019, balances of these assets are as follows:
Balance
Cash and cash equivalents 6,278,680,032 AFS securities 54,752,715,863
Of the total Investments, P18.182 billion is assigned to MSRF.
31.3 Operational risk
Operational risk refers to the risk of loss caused by inadequate or failed internal processes, people, and systems, or from external events (including legal risk). It is inherent in all activities, products and services, and cuts across multiple activities and operating units within the Fund. When controls fail to perform, operational risk can cause damage to reputation, have legal or regulatory implications, or lead to financial loss. The Fund cannot be expected to avoid all operational risks but endeavors to manage these risks through control measures embedded in its processes. These controls, which are measures to ensure achievement of objectives, include effective segregation of duties, access-authorization, computer-generated sequential pre-numbering of documents and forms, and reconciliation procedure, staff training and assessment process, as well as activities of the Internal Audit Services Group. The Operational Risk Management Policy (ORMP) and Reputational Risk Management Policy (RRMP) were approved by the Board last July 6, 2017. These are patterned from pertinent provisions of BSP Circular No. 900, Series of 2016, Guidelines on Operational Risk Management and “Designing Enterprise Risk Management in Organizations”, an Asia Risk Management Institute (ARIMI) module, and BSP Circular No. 747, Series of 2012, Revised Guidelines on Compliance, and articles of other authorities on Reputational Risk Management.

55
The Social Media Risk Management Policy, adapted from BSP Circular No. 949, and Business Continuity Management Policy, adapted from BSP Circular No. 951, were both approved on March 13, 2018. The Asia Risk Management Institute’s (ARIMI’s) Enterprise Value Risk Assessment (EVRA) was the basis for EVRA risk assessment process for the Fund’s operational risks. The Fund’s EVRA was approved by the ManCom on March 26, 2018 and presented to the BRCC and the full Board for information purposes on April 24 and May 18, 2018, respectively. The typical risk control self-assessment process identifies risks directly as internal and external factors affecting the organization. This approach does not provide assurance that risks needing prioritizing are identified. EVRA uses Organizational Context Analysis to determine the parameters within which the organization operates and can operate. Customer Analysis and Business Model Analysis identify key processes and resources critical to answering the needs of the customer in a competitive manner while making a profit and sustaining operations over time. Risk Tree Analysis identifies the causes and effects of a disruption to key processes and resources and determines crisis management and preventive measures. Only the risks that affect the key processes and resources, as well as Black Swans, or catastrophic losses, and Blue Swans, or unexpected opportunities, are identified, and measured in terms of likelihood and severity, and studied for other characteristics. Risk evaluation and treatment are based on a one-to-five scoring for risk likelihood and one-to-five scoring for risk severity. EVRA Cascading is conducted to raise awareness for the risk assessment process and proper filling out of Risk Management forms. In 2019, it was one of the bases for the determination of the Fund’s Top Operational Risks that were analyzed and presented to the ManCom, during the Strategic Planning for 2020, and to the BRCC. Sessions of EVRA technical assistance were likewise conducted in preparation for audits and to address specific Pag-IBIG unit concerns.
31.4 Market risk
Market risk is brought about by adverse movements in factors that affect the market value of instruments, products, and transactions in an institutions’ overall portfolio. It arises from market marking, dealing, and position-taking in interest rate, foreign exchange and equity markets. The Fund’s adoption of the Full Risk-Based Pricing Model is also intended to provide an objective pricing model, reflective of the market. The following market risk reports are being currently generated:
a. Mark-to-market – reports the fair value of financial instruments based on market prices.

56
b. Value-at-Risk (VaR) – measures the worst loss of the investment portfolio over a one-month horizon at 95 per cent confidence level.
c. Liquidity report – shows the cash flow from the investment portfolio grouped in different time buckets.
d. Duration – shows the percentage change in the value of the investment portfolio for a 100 basis point change in interest rates.
e. Stress test – reports the worst-case loss in the value of portfolio using scenario based on extremely probable market developments.
Market Risk Management Policy (MRMP) was approved by the Board on July 6, 2017. This is patterned from pertinent provisions of BSP Circular No. 544, series of 2006, Guidelines on Market Risk Management.
31.5 Capital Management Policy (CMP)
The adoption of the Capital Adequacy Framework established the minimum capital requirement in determining the amount of dividends to be declared. The Fund also manages its liquidity by maintaining Capital Adequacy Ratio (CAR) of not less than 16 per cent as directed by the BOT during its December 21, 2011 Board meeting.
On December 20, 2016 Board meeting, the BOT approved the inclusion of operational risk provisions in determining CAR. This is to ensure that the Fund’s level of capital is commensurate to its exposure to credit, market, and operational risks. To compute the Risk-Weighted Asset (RWA) equivalent for operational risk, the Basic Indicator Approach was approved with a modified rate of 12 per cent. Now, the approved maintaining minimum CAR level of the Fund is at least 17.50 per cent, recommended for Systemically Important Financial Institutions (SIFIs).
To supplement the CAR, the Fund is currently developing policies to improve risk management, governance and ability to absorb shocks arising from financial and economic stress via the adoption of Liquidity Coverage Ratio (LCR) and Net Stable Funding Ratio (NSFR).
The CMP shall guide the Fund in managing its Capital 1 (Members’ Contributions) and Capital 2 (Retained Earnings) using applicable provisions of Basel Accord on Capital Adequacy Ratio (CAR)–the ratio of capital to risk-weighted exposures.
The Fund shall maintain a minimum of 17.50 per cent CAR based on Capital 2 and at least 100 per cent Expanded CAR based on Capital 1 and 2, as recommended for SIFIs.