Interim report and unaudited financial statements - BlackRock
145
For the financial period ended 31 March 2021 Interim report and unaudited financial statements BlackRock Institutional Pooled Funds plc
-
Upload
khangminh22 -
Category
Documents
-
view
0 -
download
0
Transcript of Interim report and unaudited financial statements - BlackRock
For the financial period ended 31 March 2021
Interim report and unaudited financial statements
BlackRock Institutional Pooled Funds plc
BLACKROCK INSTITUTIONAL POOLED FUNDS PLCCONTENTS Page
Overview
General information 1
Background 2
Performance
Investment manager’s report 3
Financial statements
Condensed income statement 9
Condensed statement of changes in net assets attributable to redeemable participating shareholders 11
Condensed balance sheet 13
Notes to the financial statements 15
Schedules of investments 27
Additional information and regulatory disclosures
Schedules of material purchases and sales 127
Transactions with connected persons 133
Soft commissions 133
Cross investments 133
Efficient portfolio management and securities financing transactions 134
Disclaimers 142
1
BLACKROCK INSTITUTIONAL POOLED FUNDS PLCGENERAL INFORMATION
Board of Directors1
Paul McNaughton (Chairman) (Irish)2
Jessica Irschick (British) Paul McGowan (Irish)2
Barry O’Dwyer (Irish) Ros O’Shea (Irish)2
Deirdre Somers (Irish)2
1Non-executive Director2Independent Director
ManagerBlackRock Asset Management Ireland Limited1st Floor 2 Ballsbridge Park Ballsbridge Dublin 4, D04 YW83 Ireland
Currency Hedging Manager3
J.P. Morgan Chase Bank, N.A.25 Bank StreetCanary WharfLondon, E14 5JPUnited Kingdom
Administrator, Registrar and Transfer AgentJ.P. Morgan Administration Services (Ireland) Limited 200 Capital Dock 79 Sir John Rogerson’s Quay Dublin 2, D02 RK57 Ireland
DepositaryJ.P. Morgan Bank (Ireland) plc 200 Capital Dock 79 Sir John Rogerson’s Quay Dublin 2, D02 RK57Ireland
SecretarySanne Corporate Administration Services (Ireland) Limited Fourth Floor 76 Baggot Street Lower Dublin 2, D02 EK81 Ireland
Entity’s registered office200 Capital Dock 79 Sir John Rogerson’s Quay Dublin 2, D02 RK57Ireland
Investment ManagerBlackRock Investment Management LLC1 University Square DrivePrincetonUnited KingdomNJ 08540-6455USA
Principal DistributorBlackRock Investment Management (UK) Limited12 Throgmorton AvenueLondon, EC2N 2DLUnited Kingdom
Sub-Investment Advisers4
BlackRock Financial Management, Inc.55 East 52nd Street New York NY, 10055 USA
BlackRock Investment Management (Australia) LimitedLevel 18120 Collins StreetMelbourneVictoria 3000Australia
BlackRock Investment Management (UK) Limited12 Throgmorton AvenueLondon, EC2N 2DLUnited Kingdom
BlackRock Japan Co., Limited1-8-3 MarunouchiChiyoda-kuTokyo100-0005Japan
Independent AuditorErnst & YoungBlock 1, Harcourt CentreHarcourt StreetDublin 2, D02 YA40Ireland
Irish Legal AdviserWilliam Fry2 Grand Canal SquareDublin 2, D02 A342Ireland
Irish Sponsoring BrokerJ&E DavyDavy House49 Dawson StreetDublin 2, D02 PY05Ireland
Paying/Information Agent in GermanyJ.P. Morgan AGCIB/Investor Services – Trustee & FiduciaryTaunustor 1 (TaunusTurm)60310 Frankfurt am MainGermany
3In respect of the currency hedged share classes of certain Funds only.4In respect of certain Funds only.
Entity registration number: 362108 Please note that no notification for the distribution of shares according to section 310 of the German Capital Investment Code (Kapitalanlagegesetzbuch) has been made for the following Funds: BlackRock Euro Government Bond Fund and BlackRock Tailored Market Advantage Fund. Therefore, shares of these Funds may not be distributed in the Federal Republic of Germany. The Entity is duly registered with the Comisión Nacional de Mercado de Valores in Spain under number 1503.
2
BLACKROCK INSTITUTIONAL POOLED FUNDS PLCBACKGROUND
BlackRock Institutional Pooled Funds plc (the “Entity”) is an open-ended investment company with variable capital. The Entity was incorporated in Ireland on 1 October 2002 with limited liability between its funds and is organised under the laws of Ireland and is regulated by the Central Bank of Ireland (“CBI”) as a public limited company pursuant to the Companies Act 2014 (as amended) and the European Communities (Undertakings for Collective Investment in Transferable Securities) Regulations, 2011 (as amended) (the “UCITS Regulations”).
The Entity is structured as an umbrella fund and will comprises of separate funds (“Fund”) of the Entity. The shares of each Fund may be grouped into different classes of shares (each a “share class”). Each Fund will represent a separate portfolio of assets and may consist of one or more share classes. Each share class may apply different subscription and redemption provisions, charges, fees or brokerage arrangements. The creation of an additional class of shares will be notified to the CBI in advance. The portfolio of assets maintained for each Fund will be invested in accordance with the investment objectives and policies applicable to each Fund as set out in the prospectus.
The term “Fund” shall be deemed to mean either a Fund or Funds of the Entity, or if the context so requires, the Manager or its delegate acting for the accounts of the relevant Fund. The term “BlackRock” and “Investment Manager” are used to represent BlackRock Investment Management LLC as appropriate. All references to “redeemable shares” shall be deemed to mean redeemable participating shares when Fund shares are classified as financial liabilities. The term “Directors” means the directors of the Entity.
Further details, including the investment objectives and minimum subscription requirements, are set out in the Entity’s prospectus.
Changes to the Entity during the financial periodOn 17 December 2020, an updated prospectus was issued for the Entity to facilitate the appointment of Teresa O’Flynn as a non-executive Director.
On 11 February 2021, the Directors made the decision to close the BlackRock Euro Core Bond Fund.
On 5 March 2021, an updated prospectus was issued for the Entity incorporating the required elements under Level 1 provisions of the SustainableFinance Disclosure Regulation (“SFDR”).
On 9 March 2021, Teresa O’Flynn resigned as a non-executive Director.
Fund details The Entity had 6 Funds in operation as at 31 March 2021.
United Kingdom exit from European Union On 31 January 2020, the United Kingdom (the “UK”) formally withdrew and ceased being a member of the European Union (the “EU”). Following this, the UK entered into a transition period which lasted for the remainder of 2020, during which period the UK was subject to applicable EU laws and regulations. The transition period expired on 31 December 2020, and EU law no longer applies in the UK.
On 30 December 2020, the UK and the EU signed an EU-UK Trade and Cooperation Agreement (“UK/EU Trade Agreement”), which applies from 1 January 2021 and sets out the foundation of the economic and legal framework for trade between the UK and the EU. As the UK/EU Trade Agreement is a new legal framework, the implementation of the Agreement may result in uncertainty in its application and periods of volatility in both the UK and wider European markets throughout 2021 and beyond. The UK’s exit from the EU is expected to result in additional trade costs and disruptions in this trading relationship. While the UK/EU Trade Agreement provides for the free trade of goods, it provides only general commitments on market access in services together with a “most favoured nation” provision which is subject to many exceptions. Furthermore, there is the possibility that either party may impose tariffs on trade in the future in the event that regulatory standards between the EU and the UK diverge. The terms of the future relationship may cause continued uncertainty in the global financial markets, and adversely affect the performance of the Funds.
Volatility resulting from this uncertainty may mean that the returns of the Funds' investments are affected by market movements, the potential decline in the value of Sterling or Euro, and the potential downgrading of sovereign credit ratings of the UK or an EU member state.
Outbreak of COVID-19An outbreak of an infectious respiratory illness caused by a novel coronavirus known as COVID-19 has developed into a global pandemic. The impact of this significant event on the Funds' financial risk exposure is disclosed in Note 3.1.
The Manager has assessed the impact of market conditions arising from the COVID-19 outbreak on the Funds' ability to meet their investment objectives. Based on the latest available information, the Funds continue to be managed in line with their investment objectives, with no disruption to the operations of the Funds and the publication of Net Asset Values ("NAV").
Stock exchange listingsBlackRock Euro Core Bond Fund, BlackRock Euro Government Bond Fund and BlackRock Global Enhanced Index Fund have share classes which are listed on the Euronext Dublin.

3
BLACKROCK INSTITUTIONAL POOLED FUNDS PLCINVESTMENT MANAGER’S REPORT
Investment objective
BlackRock Euro Core Bond Fund The investment objective of the Fund is to realise total return by investing primarily in fixed and floating rate government, agency, corporate, collateralised and other debt securities (such as mortgage–backed and asset–backed securities) denominated in Euro.
BlackRock Euro Government Bond FundThe investment objective of the Fund is to seek to outperform the Bloomberg Barclays Euro Treasury Index by investing primarily in investment grade government, agency, supranational and corporate fixed income securities such as bills, notes (fixed-rate, floating-rate and medium term notes), gilts, bonds and inflation-protected securities.
BlackRock Europe Equity 1 FundThe investment objective of the Fund is to provide a total return, taking into account both capital and income returns, which reflects the total return of the European equity market.
BlackRock Global Enhanced Index FundThe investment objective of the Fund is to seek to outperform a broadly diversified index based on the world equity markets.
BlackRock Japan Equity 1 FundThe investment objective of the Fund is to provide a total return, taking into account both capital and income returns, which reflects the total return of the equity market in Japan.
BlackRock Tailored Market Advantage FundThe investment objective of the Fund is to provide a total return, taking into account both capital and income returns over the long term. This objective will be effected through strategic exposure to multiple asset classes which, through diversification, is expected to generate growth with comparatively lower risk than exposure to worldwide equities alone.
Investment management approachFor physically replicating funds, the investment management approach is to buy a portfolio of securities that as far as practicable consist of the securities that make up the benchmark index, in similar proportion to the weights represented in the benchmark index over a defined period of time.
Fund name Benchmark index/Performance measure Investment management approachBlackRock Euro Core Bond Fund1 FTSE Euro Broad Investment-Grade Bond
Index (EuroBIG)Active
BlackRock Euro Government Bond Fund1 Bloomberg Barclays Euro Treasury Index ActiveBlackRock Europe Equity 1 Fund MSCI Europe Index Index Tracking - replicatingBlackRock Global Enhanced Index Fund1 MSCI World Index ActiveBlackRock Japan Equity 1 Fund MSCI Japan Index Index Tracking - replicatingBlackRock Tailored Market Advantage Fund2 N/A Active
1The performance measure included in the table above is for reference only. Please refer to the prospectus for more detail.2No performance measure is calculated for this Fund.
4
BLACKROCK INSTITUTIONAL POOLED FUNDS PLCINVESTMENT MANAGER’S REPORT (continued)
Performance summary and tracking error
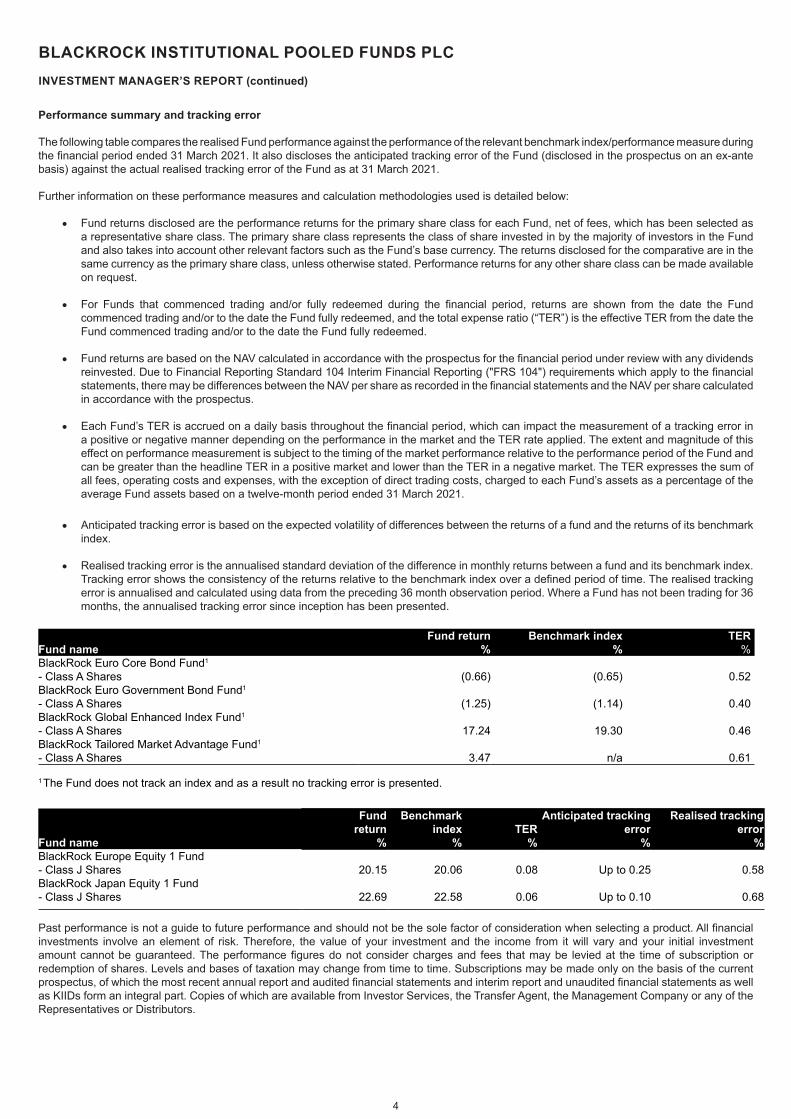
The following table compares the realised Fund performance against the performance of the relevant benchmark index/performance measure during the financial period ended 31 March 2021. It also discloses the anticipated tracking error of the Fund (disclosed in the prospectus on an ex-ante basis) against the actual realised tracking error of the Fund as at 31 March 2021.
Further information on these performance measures and calculation methodologies used is detailed below:
• Fund returns disclosed are the performance returns for the primary share class for each Fund, net of fees, which has been selected as a representative share class. The primary share class represents the class of share invested in by the majority of investors in the Fund and also takes into account other relevant factors such as the Fund’s base currency. The returns disclosed for the comparative are in the same currency as the primary share class, unless otherwise stated. Performance returns for any other share class can be made available on request.
• For Funds that commenced trading and/or fully redeemed during the financial period, returns are shown from the date the Fund commenced trading and/or to the date the Fund fully redeemed, and the total expense ratio (“TER”) is the effective TER from the date the Fund commenced trading and/or to the date the Fund fully redeemed.
• Fund returns are based on the NAV calculated in accordance with the prospectus for the financial period under review with any dividends reinvested. Due to Financial Reporting Standard 104 Interim Financial Reporting ("FRS 104") requirements which apply to the financial statements, there may be differences between the NAV per share as recorded in the financial statements and the NAV per share calculated in accordance with the prospectus.
• Each Fund’s TER is accrued on a daily basis throughout the financial period, which can impact the measurement of a tracking error in a positive or negative manner depending on the performance in the market and the TER rate applied. The extent and magnitude of this effect on performance measurement is subject to the timing of the market performance relative to the performance period of the Fund and can be greater than the headline TER in a positive market and lower than the TER in a negative market. The TER expresses the sum of all fees, operating costs and expenses, with the exception of direct trading costs, charged to each Fund’s assets as a percentage of the average Fund assets based on a twelve-month period ended 31 March 2021.
• Anticipated tracking error is based on the expected volatility of differences between the returns of a fund and the returns of its benchmark
index.
• Realised tracking error is the annualised standard deviation of the difference in monthly returns between a fund and its benchmark index. Tracking error shows the consistency of the returns relative to the benchmark index over a defined period of time. The realised tracking error is annualised and calculated using data from the preceding 36 month observation period. Where a Fund has not been trading for 36 months, the annualised tracking error since inception has been presented.
Fund nameFund return
% Benchmark index
%TER
%BlackRock Euro Core Bond Fund1
- Class A Shares (0.66) (0.65) 0.52BlackRock Euro Government Bond Fund1
- Class A Shares (1.25) (1.14) 0.40BlackRock Global Enhanced Index Fund1
- Class A Shares 17.24 19.30 0.46BlackRock Tailored Market Advantage Fund1
- Class A Shares 3.47 n/a 0.61
1The Fund does not track an index and as a result no tracking error is presented.
Fund name
Fund return
%
Benchmark index
%TER
%
Anticipated tracking error
%
Realised tracking error
%BlackRock Europe Equity 1 Fund- Class J Shares 20.15 20.06 0.08 Up to 0.25 0.58BlackRock Japan Equity 1 Fund- Class J Shares 22.69 22.58 0.06 Up to 0.10 0.68
Past performance is not a guide to future performance and should not be the sole factor of consideration when selecting a product. All financial investments involve an element of risk. Therefore, the value of your investment and the income from it will vary and your initial investment amount cannot be guaranteed. The performance figures do not consider charges and fees that may be levied at the time of subscription or redemption of shares. Levels and bases of taxation may change from time to time. Subscriptions may be made only on the basis of the current prospectus, of which the most recent annual report and audited financial statements and interim report and unaudited financial statements as well as KIIDs form an integral part. Copies of which are available from Investor Services, the Transfer Agent, the Management Company or any of the Representatives or Distributors.
5
BLACKROCK INSTITUTIONAL POOLED FUNDS PLCINVESTMENT MANAGER’S REPORT (continued)
Global economic overview
Global equities, as represented by the MSCI All Country World Index (“ACWI”) (in US Dollar terms), posted a return of 19.93% for the six months ended 31 March 2021. The reporting period was characterised by continued recovery from the sharp decline in financial markets that followed the emergence and spread of COVID-19 in early 2020. As countries adapted to the restrictions and behavioural changes necessitated by the pandemic, economies re-opened and most commercial activity resumed. Policy responses from governments and the promise of new treatments for COVID-19 helped drive equity gains. In the second half of the reporting period, the beginning of mass vaccination programs around the globe boosted investors’ optimism despite ongoing weakness in the real economy. The prospect of a return to normalcy and increased consumer spending due to pent-up demand led investors to increase their expectations for future inflation.
Prior to the beginning of the reporting period, driven by the COVID-19 outbreak, bond performance diverged significantly based on credit quality, as investors sought out higher-rated bonds in the face of uncertainty. However, the US Federal Reserve’s (the “Fed”) implementation of an unprecedented corporate bond purchasing facility provided significant support to US corporate bond prices. Consequently, the reporting period saw a reversal of the flight from risk as investor appetite for corporate bonds, particularly lower-quality, higher-yield bonds, increased substantially. As a result, high-yield corporate bonds posted a solid performance, while investment-grade corporate bonds declined slightly.
Demand was also high for US Treasuries, even as issuance increased to fund deficit spending, and the reporting period began with yields near historic lows. However, yields increased notably in early 2021 as investors’ inflation expectations picked up, leading to negative US Treasury returns for the six month period.
Stocks in emerging markets posted a strong advance for the reporting period. Asian stocks in particular were supported by an economic rebound in China, the only major country in the world that posted positive economic growth in calendar year 2020. China’s swift return to growth helped other emerging market countries in the region that trade heavily with China. US Dollar denominated, emerging market bond prices posted a slightly negative return for the six month period, similar to other global bonds.
In the commodities market, gold prices declined as investors moved toward riskier assets amid signs of economic recovery and mass vaccination programs. Oil prices advanced notably amid strong demand from Asia, as the prospects for further economic growth improved and global trade rebounded.
On the foreign exchanges, the US Dollar declined against many global currencies, reflecting ongoing monetary stimulus and historically low interest rates relative to other developed economies. Sterling and the Chinese Yuan advanced against the US Dollar, while the Swiss Franc and the Japanese Yen declined.
Economic conditions during the reporting period reflected an improvement following the relaxation of some travel and business restrictions put in place to counteract COVID-19. While growth slowed from the sharp rebound of the third quarter of 2020, most major economies continued to recover. In the fourth quarter, growth continued at a slower pace in the US and Japan, while the Eurozone economy contracted slightly amid renewed lockdowns. China continued its steady economic expansion in the final quarter of 2020, followed by record year-over-year growth in the first quarter of 2021.
Governments responded to the economic slowdown with massive fiscal and monetary stimulus. The US added to its already-substantial stimulus with an additional round in December, and many other countries around the world also provided fiscal stimulus to boost their economies. Late in the reporting period, the US government passed a $1.9 trillion stimulus package that sent further direct payments to individuals. The Fed maintained short-term interest rates near zero, and along with other influential central banks, continued a major bond-buying program to stabilise debt markets. The Fed further committed to a near-zero interest rate policy through 2022 in a bid to promote longer-term economic expansion.
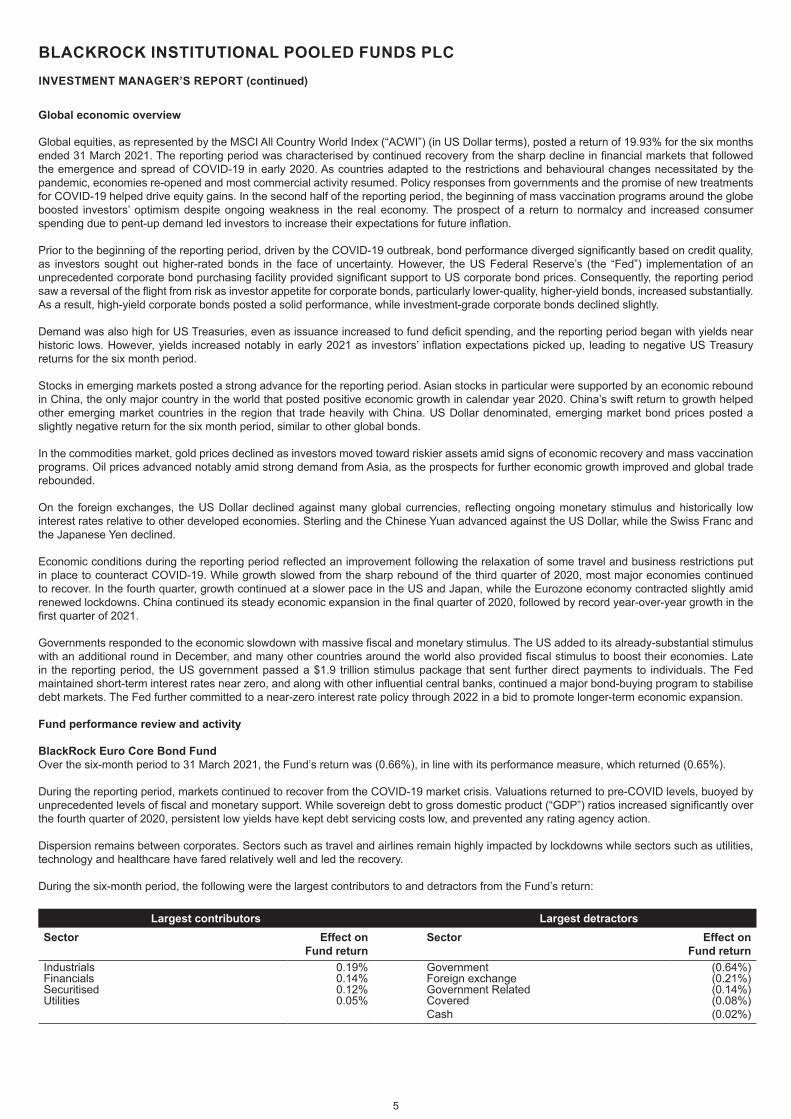
Fund performance review and activity
BlackRock Euro Core Bond FundOver the six-month period to 31 March 2021, the Fund’s return was (0.66%), in line with its performance measure, which returned (0.65%).
During the reporting period, markets continued to recover from the COVID-19 market crisis. Valuations returned to pre-COVID levels, buoyed by unprecedented levels of fiscal and monetary support. While sovereign debt to gross domestic product (“GDP”) ratios increased significantly over the fourth quarter of 2020, persistent low yields have kept debt servicing costs low, and prevented any rating agency action.
Dispersion remains between corporates. Sectors such as travel and airlines remain highly impacted by lockdowns while sectors such as utilities, technology and healthcare have fared relatively well and led the recovery.
During the six-month period, the following were the largest contributors to and detractors from the Fund’s return:
Largest contributors Largest detractorsSector Effect on
Fund returnSector Effect on
Fund returnIndustrials 0.19% Government (0.64%)Financials 0.14% Foreign exchange (0.21%)Securitised 0.12% Government Related (0.14%)Utilities 0.05% Covered (0.08%)
Cash (0.02%)
6
BLACKROCK INSTITUTIONAL POOLED FUNDS PLCINVESTMENT MANAGER’S REPORT (continued)
Corporate credit spreads continued to compress over the six-month period, driving positive returns for the asset class, versus the performance measure, allocations to industrials and utilities have contributed most to returns. The rise in yields over the first quarter of 2021 drove negative total returns for government and government related bonds, versus the performance measure, an underweight in Germany contributed to returns as did overweight’s in Italy, Greece and Portugal.
The following table details the significant portfolio weightings at 31 March 2021 and 30 September 2020:
31 March 2021 30 September 2020Sector Weighting Sector WeightingGovernment 38.25% Government 41.94%Government Related 14.34% Financials 14.82%Financials 14.99% Covered 13.17%Covered 13.44% Government Related 12.07%Industrials 9.34% Industrials 10.18%
BlackRock Euro Government Bond FundOver the six-month period to 31 March 2021, the Fund’s return was (1.25%), underperforming its performance measure, which returned (1.14%).
During the reporting period, markets continued to recover from the COVID-19 market crisis. Valuations returned to pre-COVID levels, buoyed by unprecedented levels of fiscal and monetary support. While sovereign debt to GDP ratios increased significantly over the fourth quarter of 2020, persistent low yields have kept debt servicing costs low, and prevented any rating agency action.
Towards the end of the review period risk-free yields rose significantly, driven by increased optimism on the growth outlook and vaccine rollout.
During the six-month period, the following were the largest contributors to and detractors from the Fund’s return:
Largest contributors Largest detractorsCountry Effect on
Fund returnCountry Effect on
Fund returnItaly 0.34% France (0.30%)United States 0.17% New Zealand (0.15%)Greece 0.02% Australia (0.10%)Hungary 0.02% Germany (0.08%)United Kingdom 0.01% Supranational (0.07%)
Sovereign spreads continued to compress over the six-month period. Italian government bonds exhibited volatility in the first quarter of 2021, driven by political uncertainty. Finally, the former European Central Bank president, Mario Draghi, was sworn in as the new Prime Minister, which is broadly viewed as positive by markets and drove strong positive returns. The rise in yields over the first quarter of 2021 drove negative total returns for high quality assets such as French and German government bonds. Long duration positions in Australia and New Zealand detracted from performance as these markets underperformed and led the global rates selloff in the first quarter of 2021.
The following table details the significant portfolio weightings at 31 March 2021 and 30 September 2020:
31 March 2021 30 September 2020Country Weighting Country WeightingFrance 22.17% France 20.64%Italy 19.21% Italy 18.01%Germany 17.10% Spain 16.31%Spain 14.10% Germany 13.73%Belgium 5.55% Belgium 5.57%
BlackRock Global Enhanced Index FundOver the six-month period to 31 March 2021, the Fund’s active return was 17.24%, underperforming its performance measure, which returned 19.30%.
Global equities performed strongly over the period, buoyed by the rollout of COVID-19 vaccinations and continued accommodative monetary and fiscal policy. The weak relative performance delivered by the Fund was largely a function of a difficult end to the fourth quarter of 2020. The portfolio struggled through company earnings season and suffered a further leg-down of performance as positive vaccination news gave rise to an aggressive rotation within the market.
The period started well with solid performance continuing through the opening weeks of October 2020. The portfolio was generally on the right side of weak earnings from US banks. However, losses accumulated sharply around the height of reporting season across positions in information technology motivated by a combination of momentum and quality insights. The portfolio suffered a further leg-down in performance as momentum experienced a rapid correction on Pfizer’s positive vaccine news. The Fund was wrong footed by the pace and aggressiveness of the rotation in the market. Trend-following sentiment signals constructed from both return and fundamental impulses were at the epicenter of losses.
Fund performance review and activity (continued)
BlackRock Euro Core Bond Fund (continued)
7
BLACKROCK INSTITUTIONAL POOLED FUNDS PLCINVESTMENT MANAGER’S REPORT (continued)
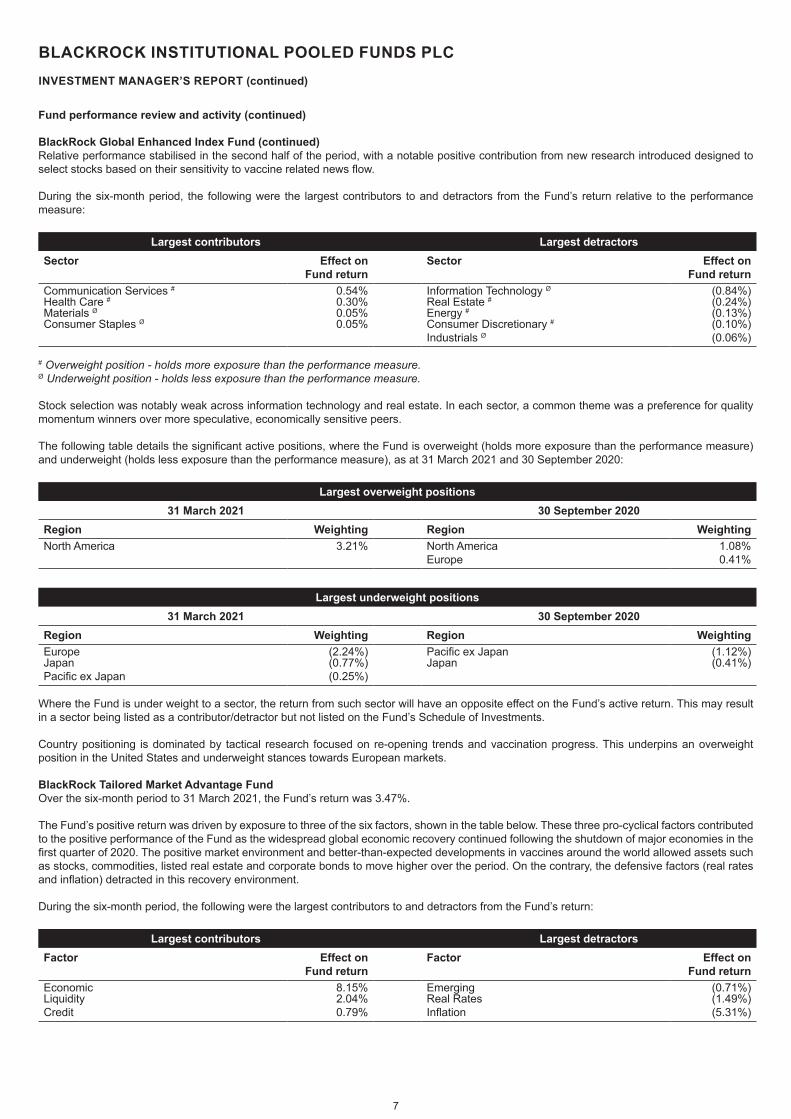
Relative performance stabilised in the second half of the period, with a notable positive contribution from new research introduced designed to select stocks based on their sensitivity to vaccine related news flow.
During the six-month period, the following were the largest contributors to and detractors from the Fund’s return relative to the performance measure:
Largest contributors Largest detractorsSector Effect on
Fund returnSector Effect on
Fund returnCommunication Services # 0.54% Information Technology Ø (0.84%)Health Care # 0.30% Real Estate # (0.24%)Materials Ø 0.05% Energy # (0.13%)Consumer Staples Ø 0.05% Consumer Discretionary # (0.10%)
Industrials Ø (0.06%)
# Overweight position - holds more exposure than the performance measure. Ø Underweight position - holds less exposure than the performance measure.
Stock selection was notably weak across information technology and real estate. In each sector, a common theme was a preference for quality momentum winners over more speculative, economically sensitive peers.
The following table details the significant active positions, where the Fund is overweight (holds more exposure than the performance measure) and underweight (holds less exposure than the performance measure), as at 31 March 2021 and 30 September 2020:
Largest overweight positions31 March 2021 30 September 2020
Region Weighting Region WeightingNorth America 3.21% North America 1.08%
Europe 0.41%
Largest underweight positions31 March 2021 30 September 2020
Region Weighting Region WeightingEurope (2.24%) Pacific ex Japan (1.12%)Japan (0.77%) Japan (0.41%)Pacific ex Japan (0.25%)
Where the Fund is under weight to a sector, the return from such sector will have an opposite effect on the Fund’s active return. This may result in a sector being listed as a contributor/detractor but not listed on the Fund’s Schedule of Investments.
Country positioning is dominated by tactical research focused on re-opening trends and vaccination progress. This underpins an overweight position in the United States and underweight stances towards European markets.
BlackRock Tailored Market Advantage FundOver the six-month period to 31 March 2021, the Fund’s return was 3.47%.
The Fund’s positive return was driven by exposure to three of the six factors, shown in the table below. These three pro-cyclical factors contributed to the positive performance of the Fund as the widespread global economic recovery continued following the shutdown of major economies in the first quarter of 2020. The positive market environment and better-than-expected developments in vaccines around the world allowed assets such as stocks, commodities, listed real estate and corporate bonds to move higher over the period. On the contrary, the defensive factors (real rates and inflation) detracted in this recovery environment.
During the six-month period, the following were the largest contributors to and detractors from the Fund’s return:
Largest contributors Largest detractorsFactor Effect on
Fund returnFactor Effect on
Fund returnEconomic 8.15% Emerging (0.71%)Liquidity 2.04% Real Rates (1.49%)Credit 0.79% Inflation (5.31%)
Fund performance review and activity (continued)
BlackRock Global Enhanced Index Fund (continued)
8
BLACKROCK INSTITUTIONAL POOLED FUNDS PLCINVESTMENT MANAGER’S REPORT (continued)
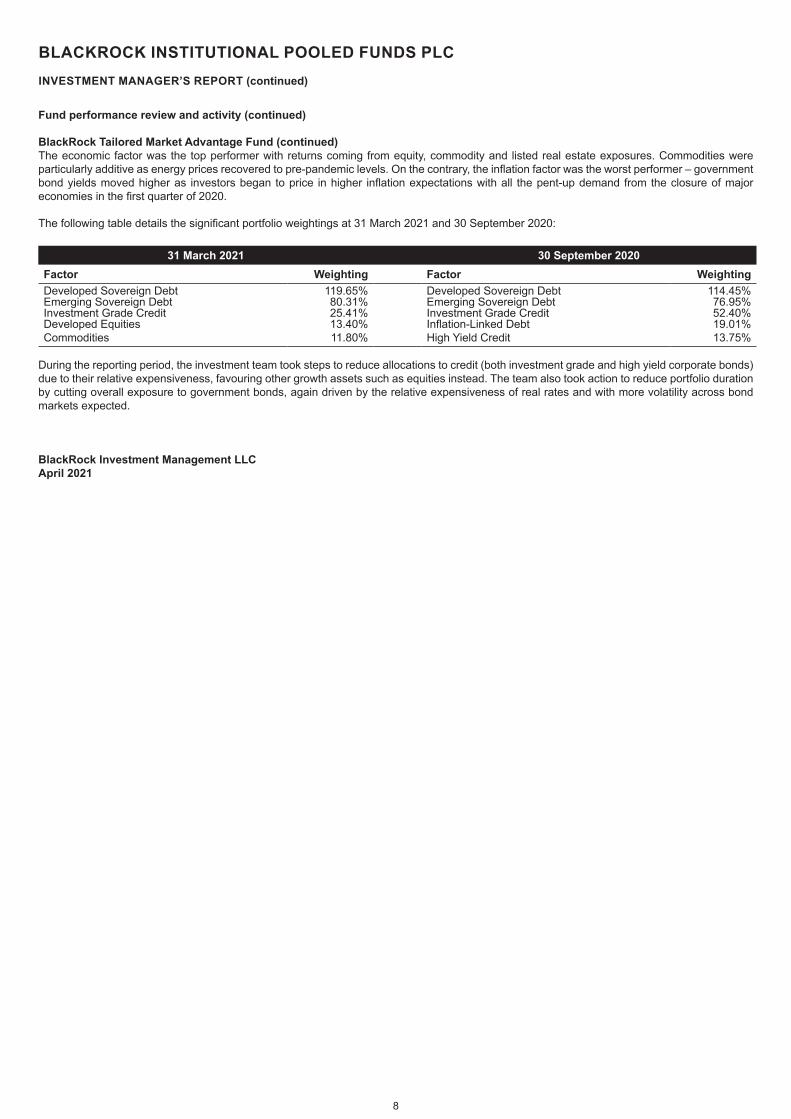
The economic factor was the top performer with returns coming from equity, commodity and listed real estate exposures. Commodities were particularly additive as energy prices recovered to pre-pandemic levels. On the contrary, the inflation factor was the worst performer – government bond yields moved higher as investors began to price in higher inflation expectations with all the pent-up demand from the closure of major economies in the first quarter of 2020.
The following table details the significant portfolio weightings at 31 March 2021 and 30 September 2020:
31 March 2021 30 September 2020Factor Weighting Factor WeightingDeveloped Sovereign Debt 119.65% Developed Sovereign Debt 114.45%Emerging Sovereign Debt 80.31% Emerging Sovereign Debt 76.95%Investment Grade Credit 25.41% Investment Grade Credit 52.40%Developed Equities 13.40% Inflation-Linked Debt 19.01%Commodities 11.80% High Yield Credit 13.75%
During the reporting period, the investment team took steps to reduce allocations to credit (both investment grade and high yield corporate bonds) due to their relative expensiveness, favouring other growth assets such as equities instead. The team also took action to reduce portfolio duration by cutting overall exposure to government bonds, again driven by the relative expensiveness of real rates and with more volatility across bond markets expected.
BlackRock Investment Management LLCApril 2021
Fund performance review and activity (continued)
BlackRock Tailored Market Advantage Fund (continued)
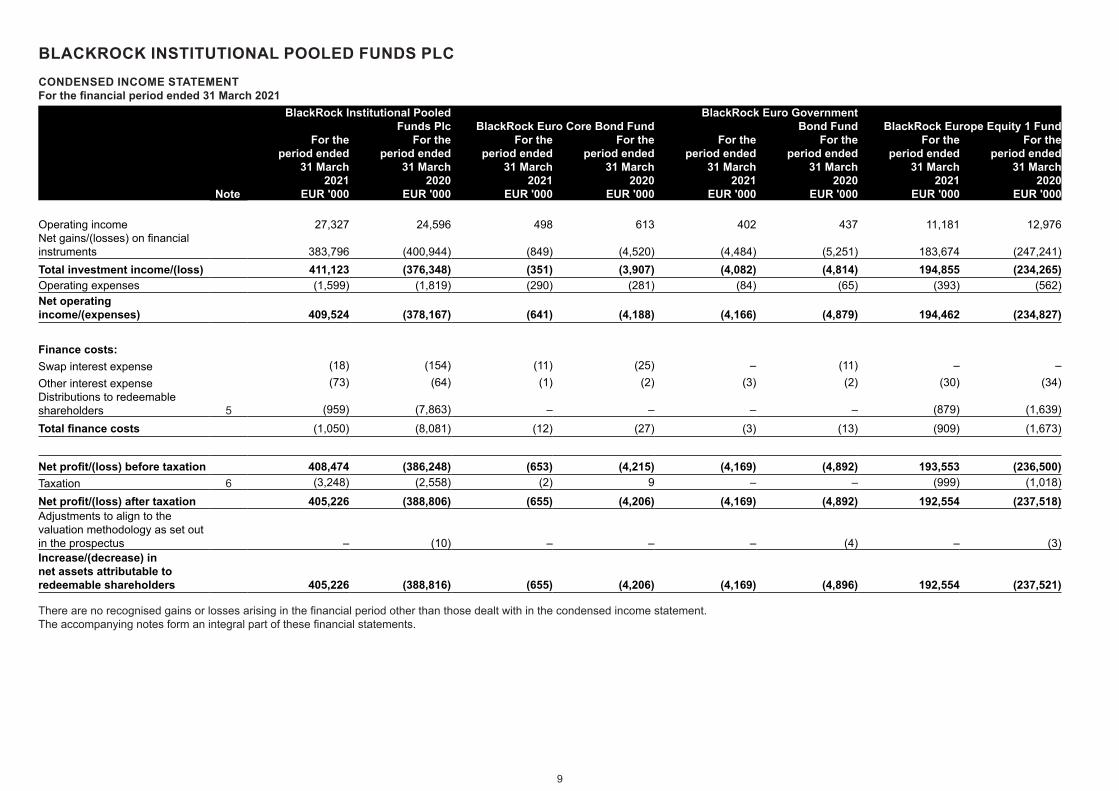
BLACKROCK INSTITUTIONAL POOLED FUNDS PLCCONDENSED INCOME STATEMENTFor the financial period ended 31 March 2021
9
BlackRock Institutional Pooled Funds Plc BlackRock Euro Core Bond Fund
BlackRock Euro Government Bond Fund BlackRock Europe Equity 1 Fund
Note
For the period ended
31 March 2021
EUR '000
For the period ended
31 March 2020
EUR '000
For the period ended
31 March 2021
EUR '000
For the period ended
31 March 2020
EUR '000
For the period ended
31 March 2021
EUR '000
For the period ended
31 March 2020
EUR '000
For the period ended
31 March 2021
EUR '000
For the period ended
31 March 2020
EUR '000
Operating income 27,327 24,596 498 613 402 437 11,181 12,976Net gains/(losses) on financial instruments 383,796 (400,944) (849) (4,520) (4,484) (5,251) 183,674 (247,241)Total investment income/(loss) 411,123 (376,348) (351) (3,907) (4,082) (4,814) 194,855 (234,265)Operating expenses (1,599) (1,819) (290) (281) (84) (65) (393) (562)Net operating income/(expenses) 409,524 (378,167) (641) (4,188) (4,166) (4,879) 194,462 (234,827)Finance costs: 9,208 (218) 45 – 24 – 2,604 –Finance costs: (1,142) 1 (24) (65) (6) (33) (939) (59)Swap interest expense (18) (154) (11) (25) – (11) – –Other interest expense (73) (64) (1) (2) (3) (2) (30) (34)Distributions to redeemable shareholders 5 (959) (7,863) – – – – (879) (1,639)Total finance costs (1,050) (8,081) (12) (27) (3) (13) (909) (1,673)
9,208 1 45 – 24 – 2,604 –Net profit/(loss) before taxation 408,474 (386,248) (653) (4,215) (4,169) (4,892) 193,553 (236,500)Taxation 6 (3,248) (2,558) (2) 9 – – (999) (1,018)Net profit/(loss) after taxation 405,226 (388,806) (655) (4,206) (4,169) (4,892) 192,554 (237,518)Adjustments to align to the valuation methodology as set out in the prospectus – (10) – – – (4) – (3)Increase/(decrease) in net assets attributable to redeemable shareholders 405,226 (388,816) (655) (4,206) (4,169) (4,896) 192,554 (237,521)
There are no recognised gains or losses arising in the financial period other than those dealt with in the condensed income statement. The accompanying notes form an integral part of these financial statements.
10
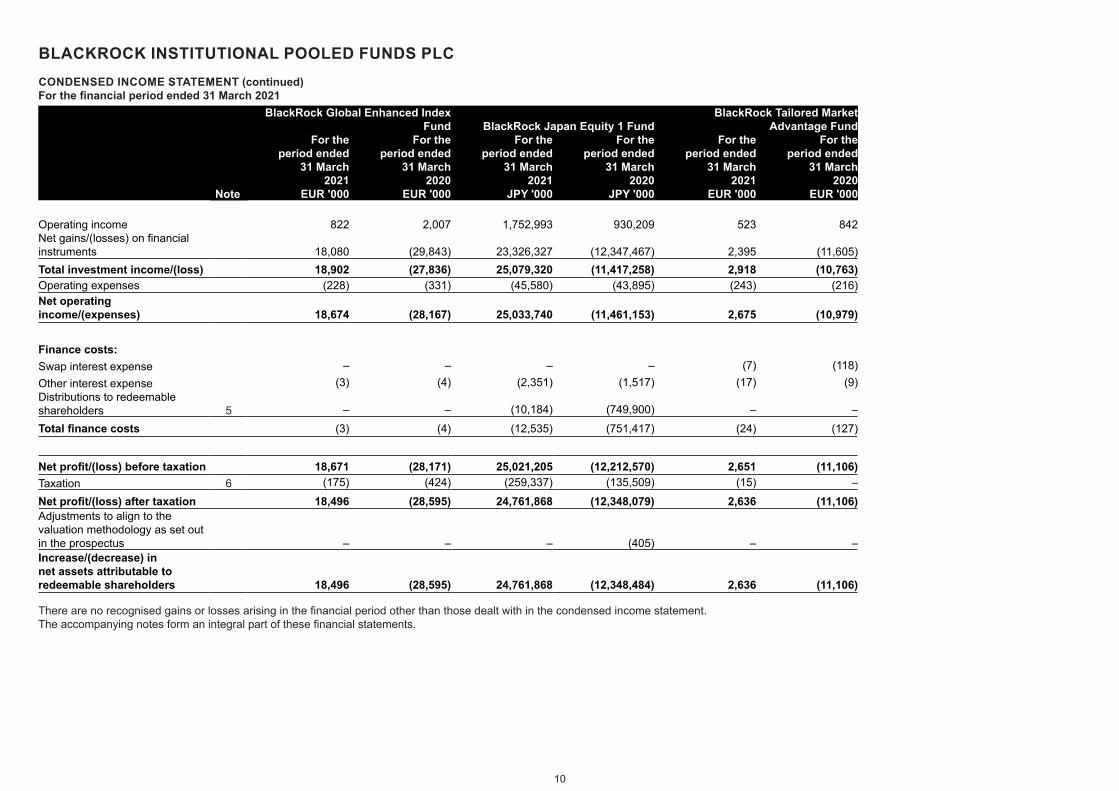
BLACKROCK INSTITUTIONAL POOLED FUNDS PLCCONDENSED INCOME STATEMENT (continued)For the financial period ended 31 March 2021
BlackRock Global Enhanced Index Fund BlackRock Japan Equity 1 Fund
BlackRock Tailored Market Advantage Fund
Note
For the period ended
31 March 2021
EUR '000
For the period ended
31 March 2020
EUR '000
For the period ended
31 March 2021
JPY '000
For the period ended
31 March 2020
JPY '000
For the period ended
31 March 2021
EUR '000
For the period ended
31 March 2020
EUR '000
Operating income 822 2,007 1,752,993 930,209 523 842Net gains/(losses) on financial instruments 18,080 (29,843) 23,326,327 (12,347,467) 2,395 (11,605)Total investment income/(loss) 18,902 (27,836) 25,079,320 (11,417,258) 2,918 (10,763)Operating expenses (228) (331) (45,580) (43,895) (243) (216)Net operating income/(expenses) 18,674 (28,167) 25,033,740 (11,461,153) 2,675 (10,979)Finance costs: 11 – 764,824 – 181 –Finance costs: (6) (5) (14,886) (2,159) (48) (491)Swap interest expense – – – – (7) (118)Other interest expense (3) (4) (2,351) (1,517) (17) (9)Distributions to redeemable shareholders 5 – – (10,184) (749,900) – –Total finance costs (3) (4) (12,535) (751,417) (24) (127)
11 – 764,824 – 181 –Net profit/(loss) before taxation 18,671 (28,171) 25,021,205 (12,212,570) 2,651 (11,106)Taxation 6 (175) (424) (259,337) (135,509) (15) –Net profit/(loss) after taxation 18,496 (28,595) 24,761,868 (12,348,079) 2,636 (11,106)Adjustments to align to the valuation methodology as set out in the prospectus – – – (405) – –Increase/(decrease) in net assets attributable to redeemable shareholders 18,496 (28,595) 24,761,868 (12,348,484) 2,636 (11,106)
There are no recognised gains or losses arising in the financial period other than those dealt with in the condensed income statement. The accompanying notes form an integral part of these financial statements.
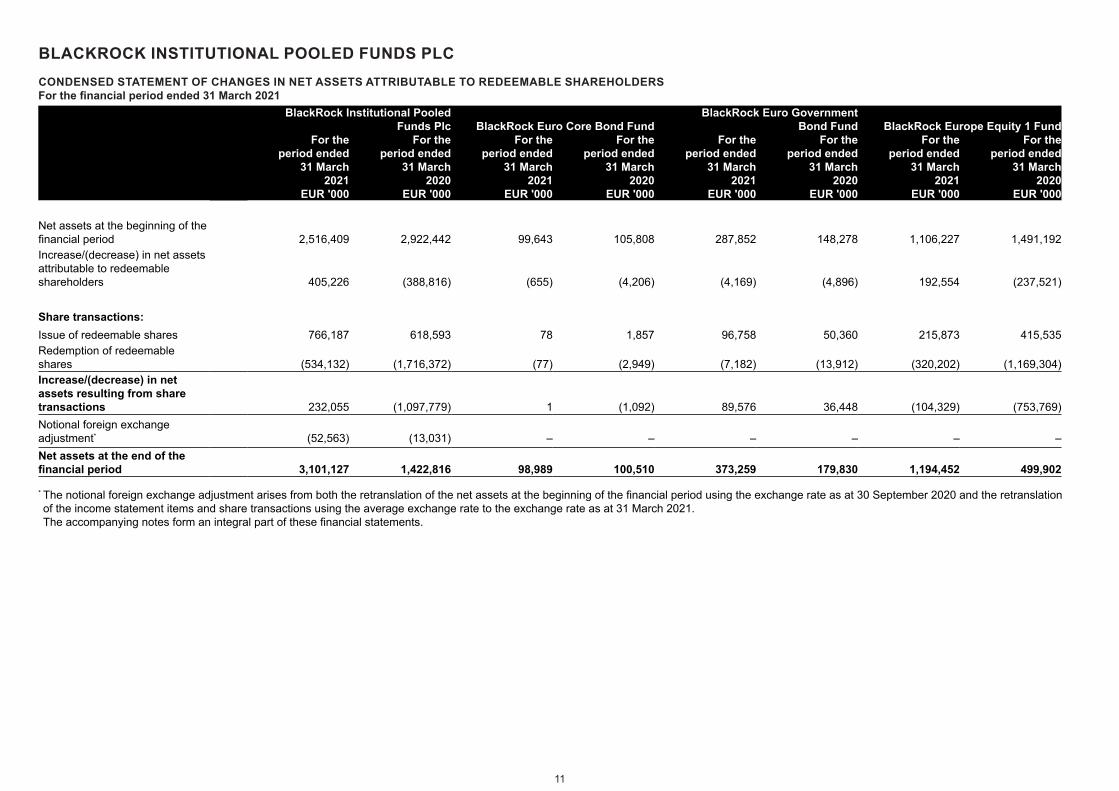
BLACKROCK INSTITUTIONAL POOLED FUNDS PLCCONDENSED STATEMENT OF CHANGES IN NET ASSETS ATTRIBUTABLE TO REDEEMABLE SHAREHOLDERSFor the financial period ended 31 March 2021
11
BlackRock Institutional Pooled Funds Plc BlackRock Euro Core Bond Fund
BlackRock Euro Government Bond Fund BlackRock Europe Equity 1 Fund
For the period ended
31 March 2021
EUR '000
For the period ended
31 March 2020
EUR '000
For the period ended
31 March 2021
EUR '000
For the period ended
31 March 2020
EUR '000
For the period ended
31 March 2021
EUR '000
For the period ended
31 March 2020
EUR '000
For the period ended
31 March 2021
EUR '000
For the period ended
31 March 2020
EUR '000
Net assets at the beginning of the financial period 2,516,409 2,922,442 99,643 105,808 287,852 148,278 1,106,227 1,491,192Increase/(decrease) in net assets attributable to redeemable shareholders 405,226 (388,816) (655) (4,206) (4,169) (4,896) 192,554 (237,521)
Share transactions:Issue of redeemable shares 766,187 618,593 78 1,857 96,758 50,360 215,873 415,535Redemption of redeemable shares (534,132) (1,716,372) (77) (2,949) (7,182) (13,912) (320,202) (1,169,304)Increase/(decrease) in net assets resulting from share transactions 232,055 (1,097,779) 1 (1,092) 89,576 36,448 (104,329) (753,769)Notional foreign exchange adjustment* (52,563) (13,031) – – – – – –Net assets at the end of the financial period 3,101,127 1,422,816 98,989 100,510 373,259 179,830 1,194,452 499,902
* The notional foreign exchange adjustment arises from both the retranslation of the net assets at the beginning of the financial period using the exchange rate as at 30 September 2020 and the retranslation of the income statement items and share transactions using the average exchange rate to the exchange rate as at 31 March 2021.The accompanying notes form an integral part of these financial statements.
12
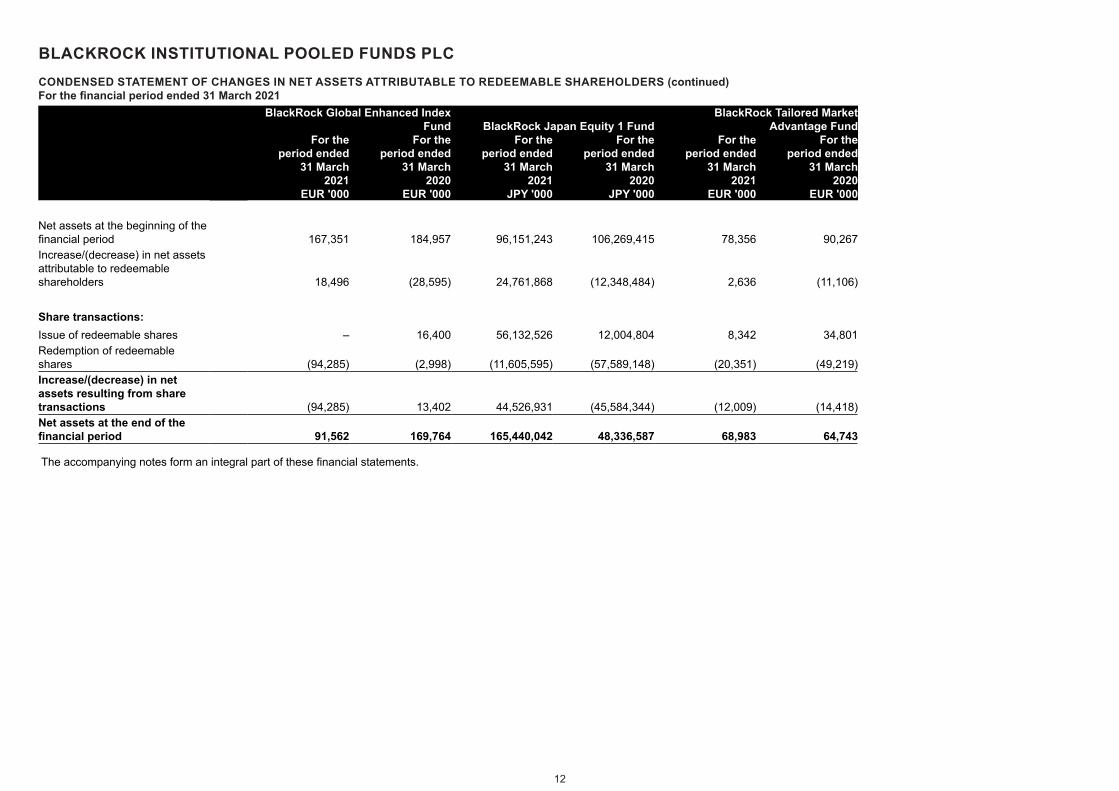
BLACKROCK INSTITUTIONAL POOLED FUNDS PLCCONDENSED STATEMENT OF CHANGES IN NET ASSETS ATTRIBUTABLE TO REDEEMABLE SHAREHOLDERS (continued)For the financial period ended 31 March 2021
BlackRock Global Enhanced Index Fund BlackRock Japan Equity 1 Fund
BlackRock Tailored Market Advantage Fund
For the period ended
31 March 2021
EUR '000
For the period ended
31 March 2020
EUR '000
For the period ended
31 March 2021
JPY '000
For the period ended
31 March 2020
JPY '000
For the period ended
31 March 2021
EUR '000
For the period ended
31 March 2020
EUR '000
Net assets at the beginning of the financial period 167,351 184,957 96,151,243 106,269,415 78,356 90,267Increase/(decrease) in net assets attributable to redeemable shareholders 18,496 (28,595) 24,761,868 (12,348,484) 2,636 (11,106)
Share transactions:Issue of redeemable shares – 16,400 56,132,526 12,004,804 8,342 34,801Redemption of redeemable shares (94,285) (2,998) (11,605,595) (57,589,148) (20,351) (49,219)Increase/(decrease) in net assets resulting from share transactions (94,285) 13,402 44,526,931 (45,584,344) (12,009) (14,418)Net assets at the end of the financial period 91,562 169,764 165,440,042 48,336,587 68,983 64,743
The accompanying notes form an integral part of these financial statements.
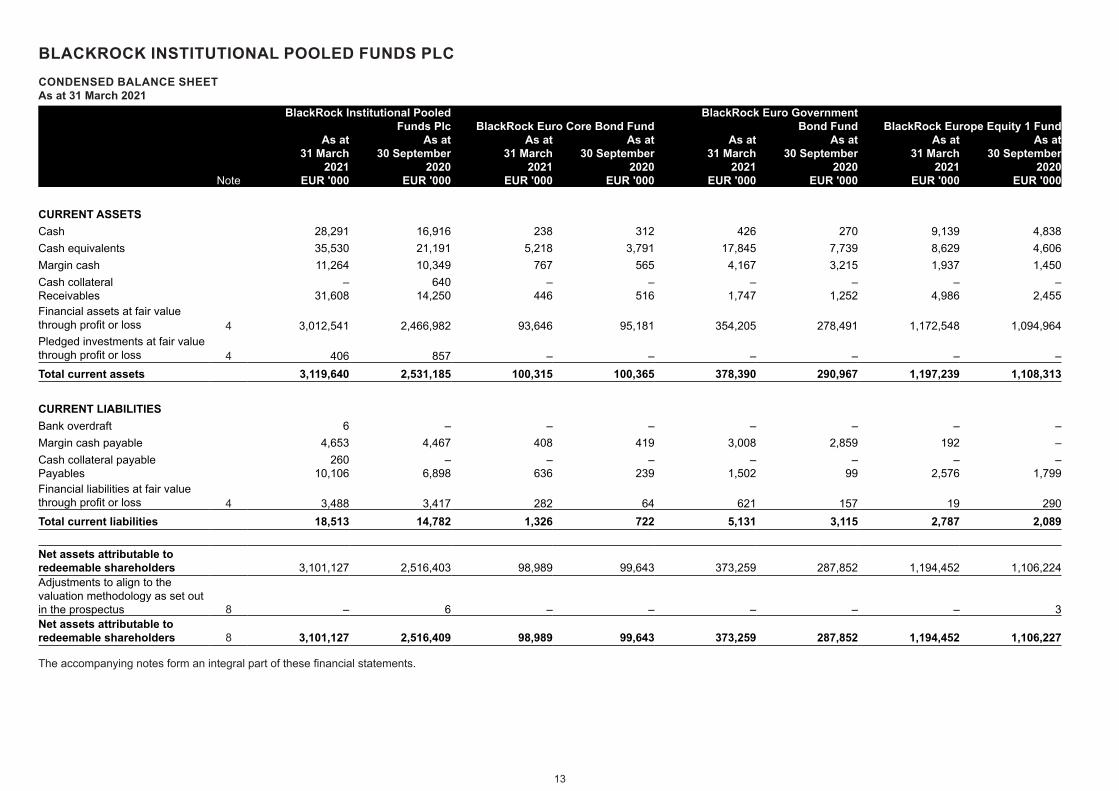
BLACKROCK INSTITUTIONAL POOLED FUNDS PLCCONDENSED BALANCE SHEETAs at 31 March 2021
13
BlackRock Institutional Pooled Funds Plc BlackRock Euro Core Bond Fund
BlackRock Euro Government Bond Fund BlackRock Europe Equity 1 Fund
Note
As at 31 March
2021 EUR '000
As at 30 September
2020 EUR '000
As at 31 March
2021 EUR '000
As at 30 September
2020 EUR '000
As at 31 March
2021 EUR '000
As at 30 September
2020 EUR '000
As at 31 March
2021 EUR '000
As at 30 September
2020 EUR '000
CURRENT ASSETSCash 28,291 16,916 238 312 426 270 9,139 4,838Cash equivalents 35,530 21,191 5,218 3,791 17,845 7,739 8,629 4,606Margin cash 11,264 10,349 767 565 4,167 3,215 1,937 1,450Cash collateral – 640 – – – – – –Receivables 31,608 14,250 446 516 1,747 1,252 4,986 2,455Financial assets at fair value through profit or loss 4 3,012,541 2,466,982 93,646 95,181 354,205 278,491 1,172,548 1,094,964Pledged investments at fair value through profit or loss 4 406 857 – – – – – –Total current assets 3,119,640 2,531,185 100,315 100,365 378,390 290,967 1,197,239 1,108,313
CURRENT LIABILITIESBank overdraft 6 – – – – – – –Margin cash payable 4,653 4,467 408 419 3,008 2,859 192 –Cash collateral payable 260 – – – – – – –Payables 10,106 6,898 636 239 1,502 99 2,576 1,799Financial liabilities at fair value through profit or loss 4 3,488 3,417 282 64 621 157 19 290Total current liabilities 18,513 14,782 1,326 722 5,131 3,115 2,787 2,089
Net assets attributable to redeemable shareholders 3,101,127 2,516,403 98,989 99,643 373,259 287,852 1,194,452 1,106,224Adjustments to align to the valuation methodology as set out in the prospectus 8 – 6 – – – – – 3Net assets attributable to redeemable shareholders 8 3,101,127 2,516,409 98,989 99,643 373,259 287,852 1,194,452 1,106,227
The accompanying notes form an integral part of these financial statements.
14
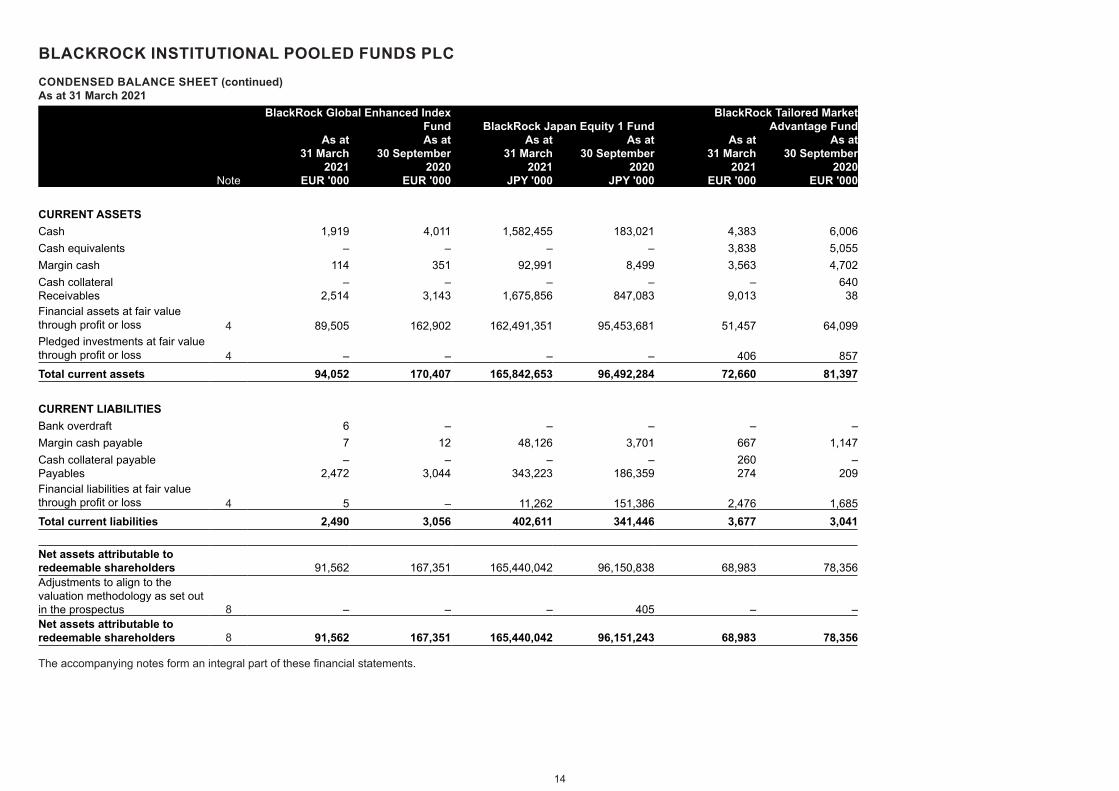
BLACKROCK INSTITUTIONAL POOLED FUNDS PLCCONDENSED BALANCE SHEET (continued)As at 31 March 2021
BlackRock Global Enhanced Index Fund BlackRock Japan Equity 1 Fund
BlackRock Tailored Market Advantage Fund
Note
As at 31 March
2021 EUR '000
As at 30 September
2020 EUR '000
As at 31 March
2021 JPY '000
As at 30 September
2020 JPY '000
As at 31 March
2021 EUR '000
As at 30 September
2020 EUR '000
CURRENT ASSETSCash 1,919 4,011 1,582,455 183,021 4,383 6,006Cash equivalents – – – – 3,838 5,055Margin cash 114 351 92,991 8,499 3,563 4,702Cash collateral – – – – – 640Receivables 2,514 3,143 1,675,856 847,083 9,013 38Financial assets at fair value through profit or loss 4 89,505 162,902 162,491,351 95,453,681 51,457 64,099Pledged investments at fair value through profit or loss 4 – – – – 406 857Total current assets 94,052 170,407 165,842,653 96,492,284 72,660 81,397
CURRENT LIABILITIESBank overdraft 6 – – – – –Margin cash payable 7 12 48,126 3,701 667 1,147Cash collateral payable – – – – 260 –Payables 2,472 3,044 343,223 186,359 274 209Financial liabilities at fair value through profit or loss 4 5 – 11,262 151,386 2,476 1,685Total current liabilities 2,490 3,056 402,611 341,446 3,677 3,041
Net assets attributable to redeemable shareholders 91,562 167,351 165,440,042 96,150,838 68,983 78,356Adjustments to align to the valuation methodology as set out in the prospectus 8 – – – 405 – –Net assets attributable to redeemable shareholders 8 91,562 167,351 165,440,042 96,151,243 68,983 78,356
The accompanying notes form an integral part of these financial statements.
15
BLACKROCK INSTITUTIONAL POOLED FUNDS PLCNOTES TO THE FINANCIAL STATEMENTS
1. General information
The Entity is an open-ended investment company domiciled and incorporated under the laws of Ireland as a public limited company. The Entity is authorised by the CBI and is governed by the provisions of the UCITS Regulations with its registered office at 200 Capital Dock, 79 Sir John Rogerson’s Quay, Dublin 2, D02 RK57, Ireland.
2. Significant accounting policies
2.1 Basis of preparation The financial statements of the Entity are prepared in accordance with FRS 104 applicable in the United Kingdom and Republic of Ireland. The principal accounting policies and estimation techniques are consistent with those applied to the previous annual financial statements with the exception of those outlined below.
On 11 February 2021, the Directors made the decision to close the BlackRock Euro Core Bond Fund. Therefore, the financial statements of BlackRock Euro Core Bond Fund have been prepared on a non-going concern basis. For the Fund prepared on a non-going concern basis, assets are recorded at recoverable amounts and liabilities are recorded at contractual settlement amounts, in addition liquidation costs are included where material.
All amounts have been rounded to the nearest thousand, unless otherwise indicated.
3. Financial risks
Each Fund’s investment activities expose it to the various types of risk which are associated with the financial instruments and markets in which it invests. The risks are substantially consistent with those disclosed in the previous annual financial statements with the exception of those outlined below.
3.1 Market risk arising from price risk Price risk is the risk that the fair value of future cash flows of a financial instrument will fluctuate because of changes in market prices (other than those arising from interest rate risk or currency risk), whether those changes are caused by factors specific to the individual financial instrument or its issuer, or factors affecting similar financial instruments traded in the market. Local, regional or global events such as war, acts of terrorism, the spread of infectious illness or other public health issue, recessions, or other events could have a significant impact on each Fund and the market price of its investments.
An outbreak of an infectious respiratory illness caused by a novel coronavirus known as COVID-19 has developed into a global pandemic and has resulted in travel restrictions, closed international borders, enhanced health screenings at ports of entry and elsewhere, disruption of and delays in healthcare service preparation and delivery, prolonged quarantines, cancellations, supply chain disruptions, and lower consumer demand, as well as general concern and uncertainty. The impact of COVID-19 has adversely affected the economies of many nations across the entire global economy, individual issuers and capital markets, and could continue to extents that cannot necessarily be foreseen. In addition, the impact of infectious illnesses in emerging market countries may be greater due to generally less established healthcare systems. Public health crises caused by the COVID-19 outbreak may exacerbate other pre-existing political, social and economic risks in certain countries or globally. The duration of the COVID-19 outbreak and its effects cannot be determined with certainty.
4. Fair value hierarchy
Each Fund classifies financial instruments measured at fair value using a fair value hierarchy. The fair value hierarchy has the following categories:
Level 1: The unadjusted quoted price in an active market for identical assets or liabilities that the entity can access at the measurement date.
Level 2: Inputs other than quoted prices included within Level 1 that are observable (i.e. developed using market data) for the asset or liability, either directly or indirectly. This category includes instruments valued using: quoted market prices in active markets for similar instruments; quoted prices for identical or similar instruments in markets that are considered less than active; or other valuation techniques where all significant inputs are directly or indirectly observable from market data.
Level 3: Inputs are unobservable (i.e. for which market data is unavailable) for the asset or liability. This category includes all instruments where the valuation techniques used include inputs not based on market data and these inputs could have a significant impact on the instrument’s valuation. This category also includes instruments that are valued based on quoted prices for similar instruments where significant entity determined adjustments or assumptions are required to reflect differences between the instruments and instruments for which there is no active market.
Specific valuation techniques used to value financial instruments classified as level 2 and/or level 3 include:(i) for debt and equity instruments, the use of quoted market prices or dealer quotes for similar instruments;(ii) for foreign equities, using independent fair value adjustment factors to reflect the difference between the last market close and the
valuation point of each Fund;(iii) for defaulted debt instruments, the use of recent transactions and defaulted equity instruments for which market data is unavailable;(iv) for interest rate swaps, the present value of the estimated future cash flows based on observable yield curves;(v) for foreign currency forwards, present value of future cash flows based on the forward exchange rates at the balance sheet date;(vi) for foreign currency options, option pricing models; and(vii) for other financial instruments, discounted cash flow analysis.
All of the resulting fair value estimates are included in level 2 except for unlisted equity securities, a contingent consideration receivable and certain derivative contracts, where the fair values have been determined based on present values and the discount rates used were adjusted for counterparty or own credit risk.
16
BLACKROCK INSTITUTIONAL POOLED FUNDS PLCNOTES TO THE FINANCIAL STATEMENTS (continued)
The level in the fair value hierarchy within which the fair value measurement is categorised in its entirety is determined on the basis of the lowest level input that is significant to the fair value measurement in its entirety. For this purpose, the significance of an input is assessed against the fair value measurement in its entirety. If a fair value measurement uses observable inputs that require significant adjustment based on unobservable inputs, that measurement is a level 3 measurement. Assessing the significance of a particular input to the fair value measurement in its entirety requires judgement, considering factors specific to the asset or liability.
The determination of what constitutes ‘observable’ inputs requires significant judgement. The Directors consider observable inputs to be market data that is readily available, regularly distributed or updated, reliable and verifiable, not proprietary, and provided by independent sources that are actively involved in the relevant market.
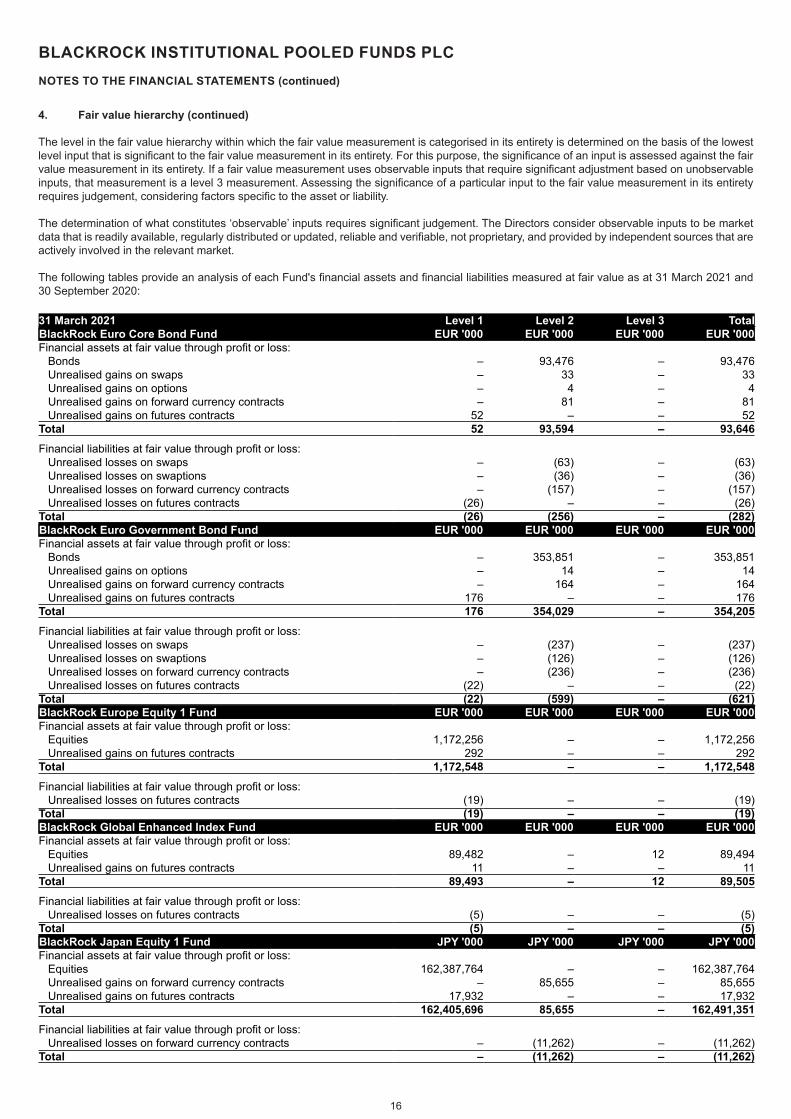
The following tables provide an analysis of each Fund's financial assets and financial liabilities measured at fair value as at 31 March 2021 and 30 September 2020:
31 March 2021 Level 1 Level 2 Level 3 TotalBlackRock Euro Core Bond Fund EUR '000 EUR '000 EUR '000 EUR '000Financial assets at fair value through profit or loss:
Bonds – 93,476 – 93,476Unrealised gains on swaps – 33 – 33Unrealised gains on options – 4 – 4Unrealised gains on forward currency contracts – 81 – 81Unrealised gains on futures contracts 52 – – 52
Total 52 93,594 – 93,646Financial liabilities at fair value through profit or loss:
Unrealised losses on swaps – (63) – (63)Unrealised losses on swaptions – (36) – (36)Unrealised losses on forward currency contracts – (157) – (157)Unrealised losses on futures contracts (26) – – (26)
Total (26) (256) – (282)BlackRock Euro Government Bond Fund EUR '000 EUR '000 EUR '000 EUR '000Financial assets at fair value through profit or loss:
Bonds – 353,851 – 353,851Unrealised gains on options – 14 – 14Unrealised gains on forward currency contracts – 164 – 164Unrealised gains on futures contracts 176 – – 176
Total 176 354,029 – 354,205Financial liabilities at fair value through profit or loss:
Unrealised losses on swaps – (237) – (237)Unrealised losses on swaptions – (126) – (126)Unrealised losses on forward currency contracts – (236) – (236)Unrealised losses on futures contracts (22) – – (22)
Total (22) (599) – (621)BlackRock Europe Equity 1 Fund EUR '000 EUR '000 EUR '000 EUR '000Financial assets at fair value through profit or loss:
Equities 1,172,256 – – 1,172,256Unrealised gains on futures contracts 292 – – 292
Total 1,172,548 – – 1,172,548Financial liabilities at fair value through profit or loss:
Unrealised losses on futures contracts (19) – – (19)Total (19) – – (19)BlackRock Global Enhanced Index Fund EUR '000 EUR '000 EUR '000 EUR '000Financial assets at fair value through profit or loss:
Equities 89,482 – 12 89,494Unrealised gains on futures contracts 11 – – 11
Total 89,493 – 12 89,505Financial liabilities at fair value through profit or loss:
Unrealised losses on futures contracts (5) – – (5)Total (5) – – (5)BlackRock Japan Equity 1 Fund JPY '000 JPY '000 JPY '000 JPY '000Financial assets at fair value through profit or loss:
Equities 162,387,764 – – 162,387,764Unrealised gains on forward currency contracts – 85,655 – 85,655Unrealised gains on futures contracts 17,932 – – 17,932
Total 162,405,696 85,655 – 162,491,351Financial liabilities at fair value through profit or loss:
Unrealised losses on forward currency contracts – (11,262) – (11,262)Total – (11,262) – (11,262)
4. Fair value hierarchy (continued)
17
BLACKROCK INSTITUTIONAL POOLED FUNDS PLCNOTES TO THE FINANCIAL STATEMENTS (continued)
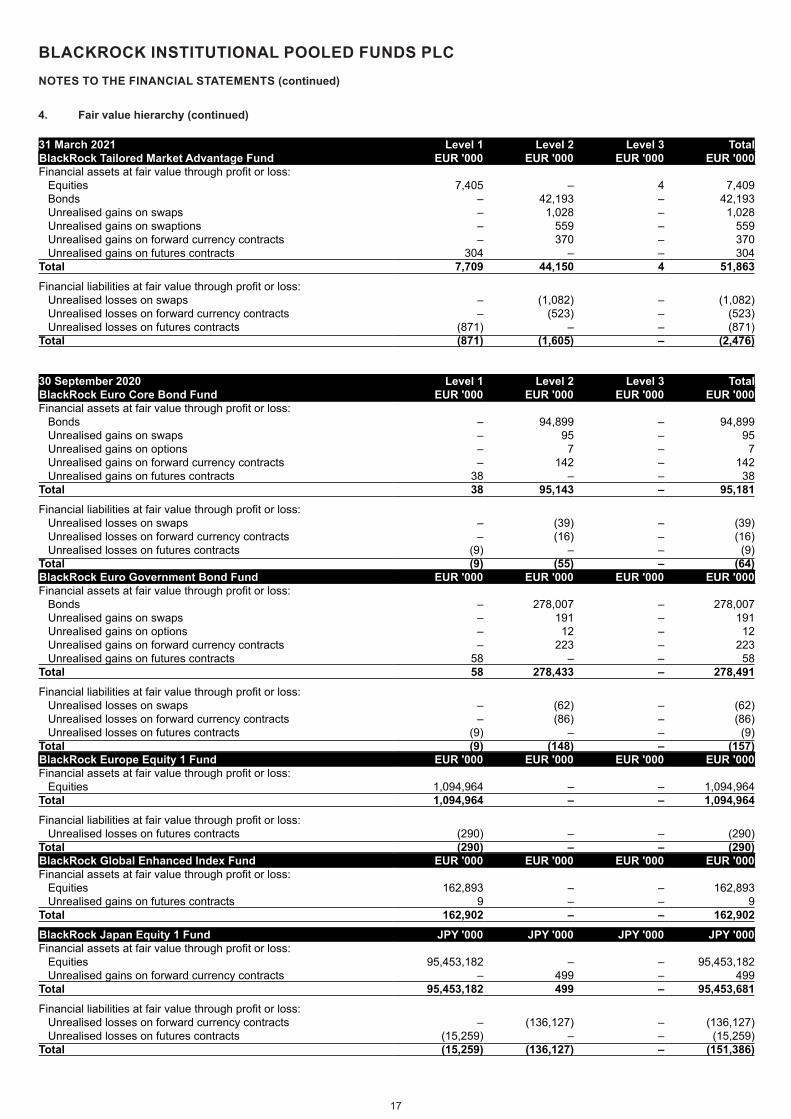
31 March 2021 Level 1 Level 2 Level 3 TotalBlackRock Tailored Market Advantage Fund EUR '000 EUR '000 EUR '000 EUR '000Financial assets at fair value through profit or loss:
Equities 7,405 – 4 7,409Bonds – 42,193 – 42,193Unrealised gains on swaps – 1,028 – 1,028Unrealised gains on swaptions – 559 – 559Unrealised gains on forward currency contracts – 370 – 370Unrealised gains on futures contracts 304 – – 304
Total 7,709 44,150 4 51,863Financial liabilities at fair value through profit or loss:
Unrealised losses on swaps – (1,082) – (1,082)Unrealised losses on forward currency contracts – (523) – (523)Unrealised losses on futures contracts (871) – – (871)
Total (871) (1,605) – (2,476)
30 September 2020 Level 1 Level 2 Level 3 TotalBlackRock Euro Core Bond Fund EUR '000 EUR '000 EUR '000 EUR '000Financial assets at fair value through profit or loss:
Bonds – 94,899 – 94,899Unrealised gains on swaps – 95 – 95Unrealised gains on options – 7 – 7Unrealised gains on forward currency contracts – 142 – 142Unrealised gains on futures contracts 38 – – 38
Total 38 95,143 – 95,181Financial liabilities at fair value through profit or loss:
Unrealised losses on swaps – (39) – (39)Unrealised losses on forward currency contracts – (16) – (16)Unrealised losses on futures contracts (9) – – (9)
Total (9) (55) – (64)BlackRock Euro Government Bond Fund EUR '000 EUR '000 EUR '000 EUR '000Financial assets at fair value through profit or loss:
Bonds – 278,007 – 278,007Unrealised gains on swaps – 191 – 191Unrealised gains on options – 12 – 12Unrealised gains on forward currency contracts – 223 – 223Unrealised gains on futures contracts 58 – – 58
Total 58 278,433 – 278,491Financial liabilities at fair value through profit or loss:
Unrealised losses on swaps – (62) – (62)Unrealised losses on forward currency contracts – (86) – (86)Unrealised losses on futures contracts (9) – – (9)
Total (9) (148) – (157)BlackRock Europe Equity 1 Fund EUR '000 EUR '000 EUR '000 EUR '000Financial assets at fair value through profit or loss:
Equities 1,094,964 – – 1,094,964Total 1,094,964 – – 1,094,964Financial liabilities at fair value through profit or loss:
Unrealised losses on futures contracts (290) – – (290)Total (290) – – (290)BlackRock Global Enhanced Index Fund EUR '000 EUR '000 EUR '000 EUR '000Financial assets at fair value through profit or loss:
Equities 162,893 – – 162,893Unrealised gains on futures contracts 9 – – 9
Total 162,902 – – 162,902BlackRock Japan Equity 1 Fund JPY '000 JPY '000 JPY '000 JPY '000Financial assets at fair value through profit or loss:
Equities 95,453,182 – – 95,453,182Unrealised gains on forward currency contracts – 499 – 499
Total 95,453,182 499 – 95,453,681Financial liabilities at fair value through profit or loss:
Unrealised losses on forward currency contracts – (136,127) – (136,127)Unrealised losses on futures contracts (15,259) – – (15,259)
Total (15,259) (136,127) – (151,386)
4. Fair value hierarchy (continued)
18
BLACKROCK INSTITUTIONAL POOLED FUNDS PLCNOTES TO THE FINANCIAL STATEMENTS (continued)
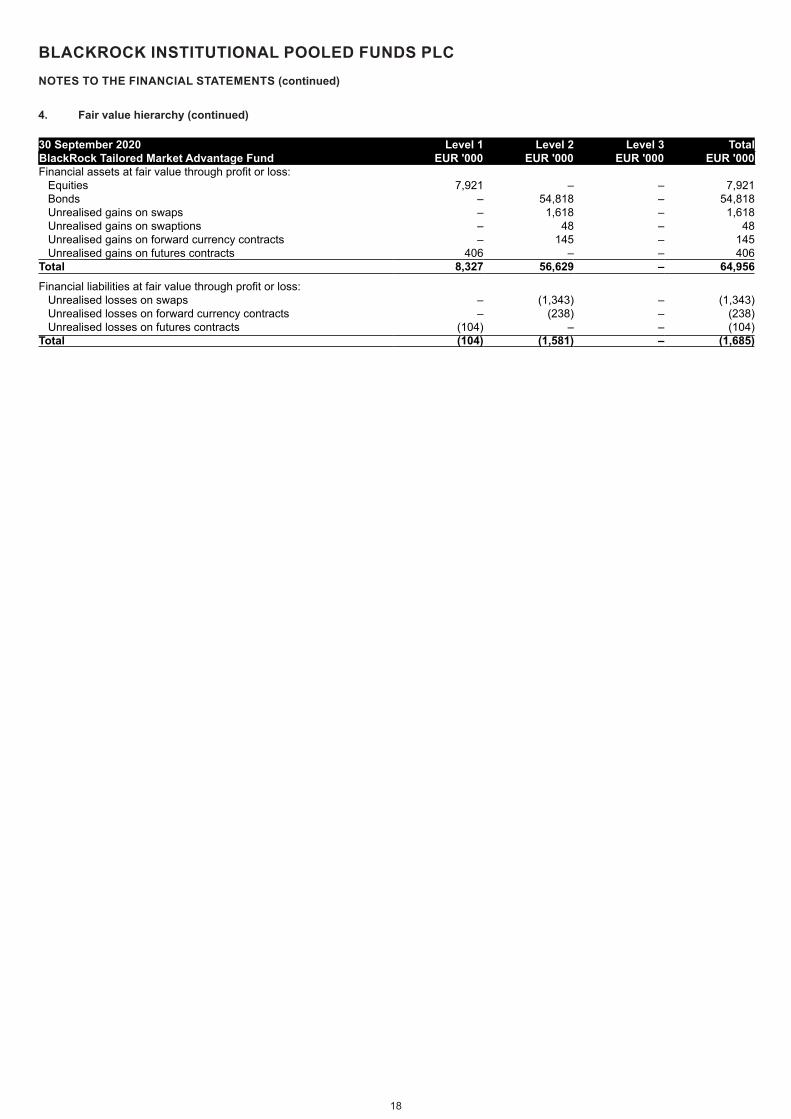
30 September 2020 Level 1 Level 2 Level 3 TotalBlackRock Tailored Market Advantage Fund EUR '000 EUR '000 EUR '000 EUR '000Financial assets at fair value through profit or loss:
Equities 7,921 – – 7,921Bonds – 54,818 – 54,818Unrealised gains on swaps – 1,618 – 1,618Unrealised gains on swaptions – 48 – 48Unrealised gains on forward currency contracts – 145 – 145Unrealised gains on futures contracts 406 – – 406
Total 8,327 56,629 – 64,956Financial liabilities at fair value through profit or loss:
Unrealised losses on swaps – (1,343) – (1,343)Unrealised losses on forward currency contracts – (238) – (238)Unrealised losses on futures contracts (104) – – (104)
Total (104) (1,581) – (1,685)
4. Fair value hierarchy (continued)
BLACKROCK INSTITUTIONAL POOLED FUNDS PLCNOTES TO THE FINANCIAL STATEMENTS (continued)
19
5. Distributions to redeemable shareholders
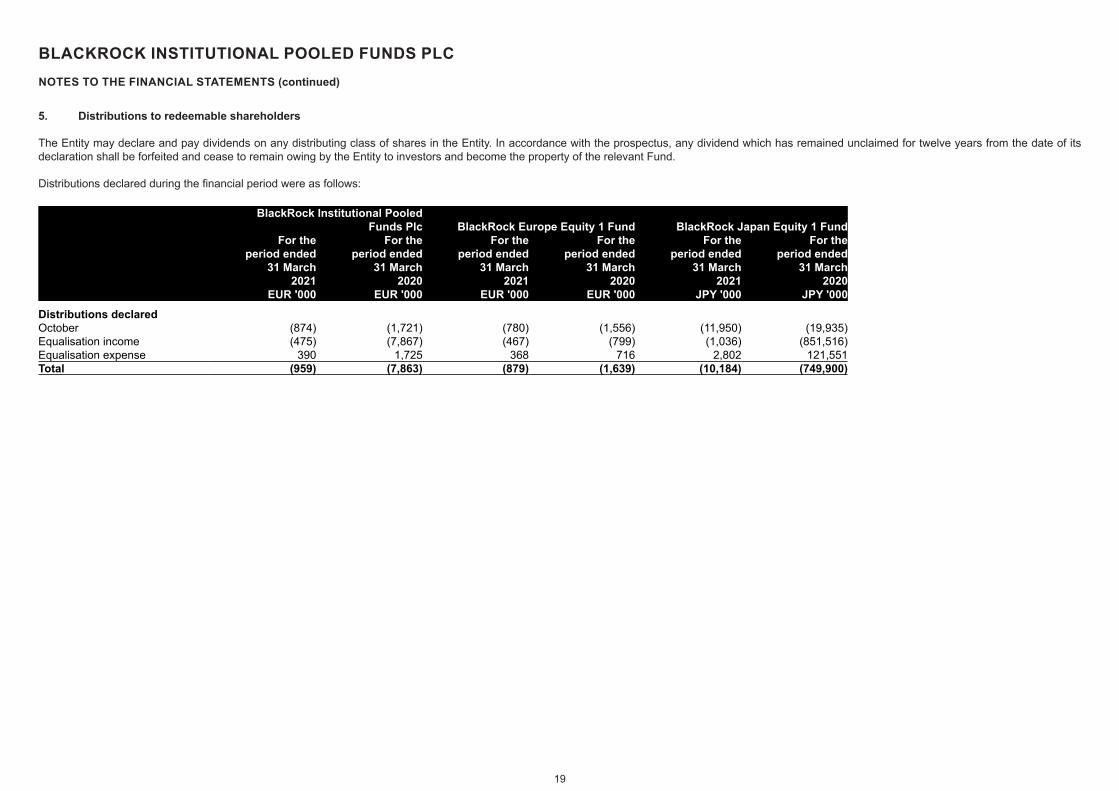
The Entity may declare and pay dividends on any distributing class of shares in the Entity. In accordance with the prospectus, any dividend which has remained unclaimed for twelve years from the date of its declaration shall be forfeited and cease to remain owing by the Entity to investors and become the property of the relevant Fund.
Distributions declared during the financial period were as follows:
BlackRock Institutional Pooled Funds Plc BlackRock Europe Equity 1 Fund BlackRock Japan Equity 1 Fund
For the period ended
31 March 2021
EUR '000
For the period ended
31 March 2020
EUR '000
For the period ended
31 March 2021
EUR '000
For the period ended
31 March 2020
EUR '000
For the period ended
31 March 2021
JPY '000
For the period ended
31 March 2020
JPY '000Distributions declared – 1,057 – –October (874) (1,721) (780) (1,556) (11,950) (19,935)Equalisation income (475) (7,867) (467) (799) (1,036) (851,516)Equalisation expense 390 1,725 368 716 2,802 121,551Total (959) (7,863) (879) (1,639) (10,184) (749,900)
BLACKROCK INSTITUTIONAL POOLED FUNDS PLCNOTES TO THE FINANCIAL STATEMENTS (continued)
20
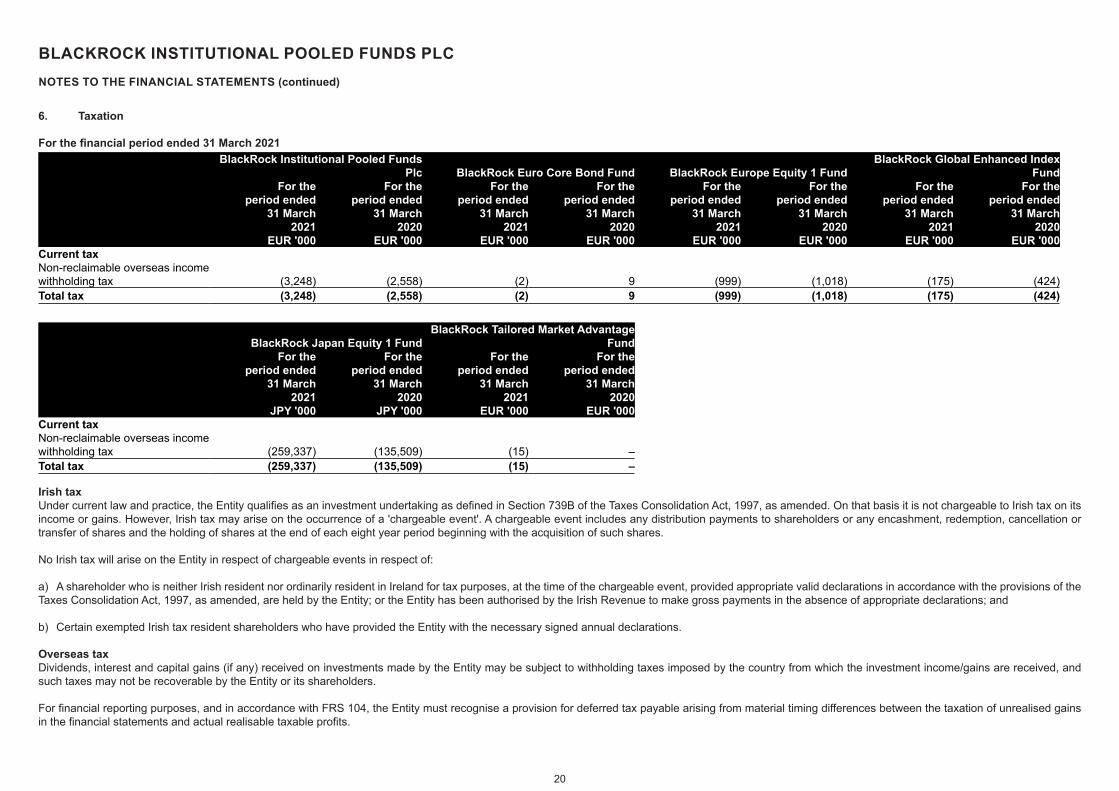
6. Taxation
For the financial period ended 31 March 2021BlackRock Institutional Pooled Funds
Plc BlackRock Euro Core Bond Fund BlackRock Europe Equity 1 FundBlackRock Global Enhanced Index
FundFor the
period ended 31 March
2021 EUR '000
For the period ended
31 March 2020
EUR '000
For the period ended
31 March 2021
EUR '000
For the period ended
31 March 2020
EUR '000
For the period ended
31 March 2021
EUR '000
For the period ended
31 March 2020
EUR '000
For the period ended
31 March 2021
EUR '000
For the period ended
31 March 2020
EUR '000Current taxNon-reclaimable overseas income withholding tax (3,248) (2,558) (2) 9 (999) (1,018) (175) (424)Total tax (3,248) (2,558) (2) 9 (999) (1,018) (175) (424)
BlackRock Japan Equity 1 FundBlackRock Tailored Market Advantage
FundFor the
period ended 31 March
2021 JPY '000
For the period ended
31 March 2020
JPY '000
For the period ended
31 March 2021
EUR '000
For the period ended
31 March 2020
EUR '000Current taxNon-reclaimable overseas income withholding tax (259,337) (135,509) (15) –Total tax (259,337) (135,509) (15) –
Irish taxUnder current law and practice, the Entity qualifies as an investment undertaking as defined in Section 739B of the Taxes Consolidation Act, 1997, as amended. On that basis it is not chargeable to Irish tax on its income or gains. However, Irish tax may arise on the occurrence of a 'chargeable event'. A chargeable event includes any distribution payments to shareholders or any encashment, redemption, cancellation or transfer of shares and the holding of shares at the end of each eight year period beginning with the acquisition of such shares.
No Irish tax will arise on the Entity in respect of chargeable events in respect of:
a) A shareholder who is neither Irish resident nor ordinarily resident in Ireland for tax purposes, at the time of the chargeable event, provided appropriate valid declarations in accordance with the provisions of the Taxes Consolidation Act, 1997, as amended, are held by the Entity; or the Entity has been authorised by the Irish Revenue to make gross payments in the absence of appropriate declarations; and
b) Certain exempted Irish tax resident shareholders who have provided the Entity with the necessary signed annual declarations.
Overseas tax Dividends, interest and capital gains (if any) received on investments made by the Entity may be subject to withholding taxes imposed by the country from which the investment income/gains are received, and such taxes may not be recoverable by the Entity or its shareholders.
For financial reporting purposes, and in accordance with FRS 104, the Entity must recognise a provision for deferred tax payable arising from material timing differences between the taxation of unrealised gains in the financial statements and actual realisable taxable profits.
21
BLACKROCK INSTITUTIONAL POOLED FUNDS PLCNOTES TO THE FINANCIAL STATEMENTS (continued)
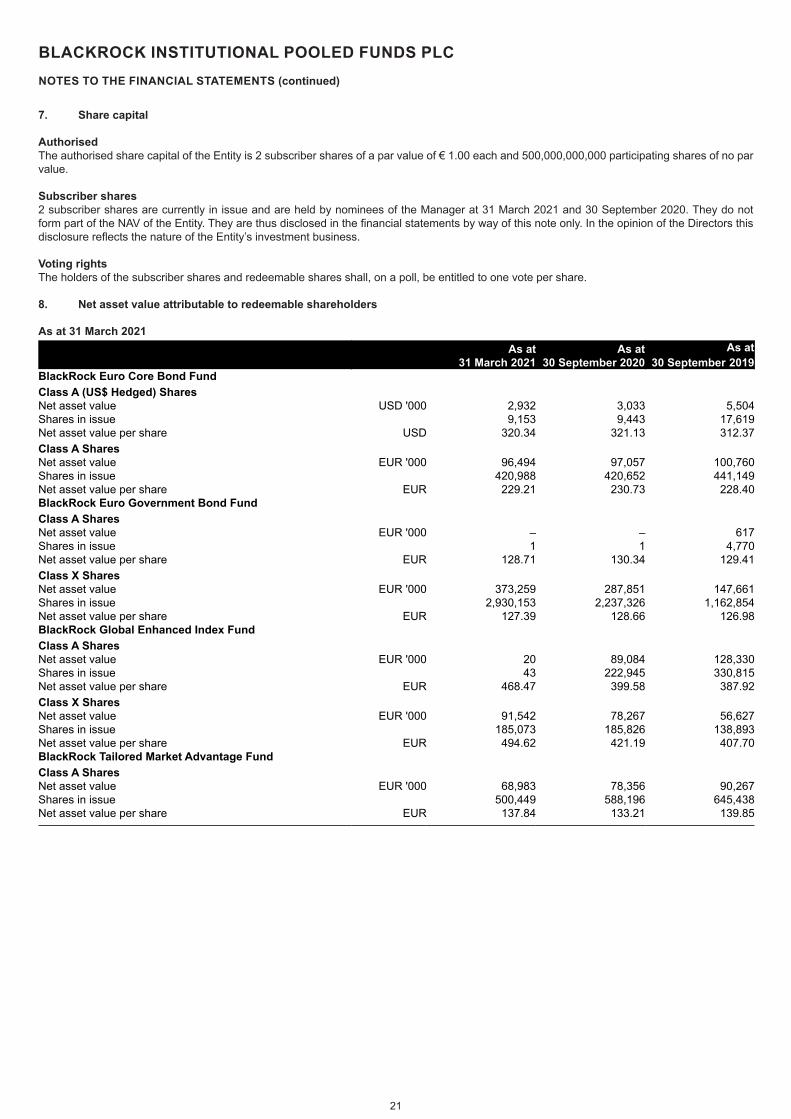
7. Share capital
Authorised The authorised share capital of the Entity is 2 subscriber shares of a par value of € 1.00 each and 500,000,000,000 participating shares of no par value.
Subscriber shares 2 subscriber shares are currently in issue and are held by nominees of the Manager at 31 March 2021 and 30 September 2020. They do not form part of the NAV of the Entity. They are thus disclosed in the financial statements by way of this note only. In the opinion of the Directors this disclosure reflects the nature of the Entity’s investment business.
Voting rightsThe holders of the subscriber shares and redeemable shares shall, on a poll, be entitled to one vote per share.
8. Net asset value attributable to redeemable shareholders
As at 31 March 2021As at
31 March 2021As at
30 September 2020As at
30 September 2019BlackRock Euro Core Bond FundClass A (US$ Hedged) SharesNet asset value USD '000 2,932 3,033 5,504Shares in issue 9,153 9,443 17,619Net asset value per share USD 320.34 321.13 312.37Class A SharesNet asset value EUR '000 96,494 97,057 100,760Shares in issue 420,988 420,652 441,149Net asset value per share EUR 229.21 230.73 228.40BlackRock Euro Government Bond FundClass A SharesNet asset value EUR '000 – – 617Shares in issue 1 1 4,770Net asset value per share EUR 128.71 130.34 129.41Class X SharesNet asset value EUR '000 373,259 287,851 147,661Shares in issue 2,930,153 2,237,326 1,162,854Net asset value per share EUR 127.39 128.66 126.98BlackRock Global Enhanced Index FundClass A SharesNet asset value EUR '000 20 89,084 128,330Shares in issue 43 222,945 330,815Net asset value per share EUR 468.47 399.58 387.92Class X SharesNet asset value EUR '000 91,542 78,267 56,627Shares in issue 185,073 185,826 138,893Net asset value per share EUR 494.62 421.19 407.70BlackRock Tailored Market Advantage FundClass A SharesNet asset value EUR '000 68,983 78,356 90,267Shares in issue 500,449 588,196 645,438Net asset value per share EUR 137.84 133.21 139.85
22
BLACKROCK INSTITUTIONAL POOLED FUNDS PLCNOTES TO THE FINANCIAL STATEMENTS (continued)
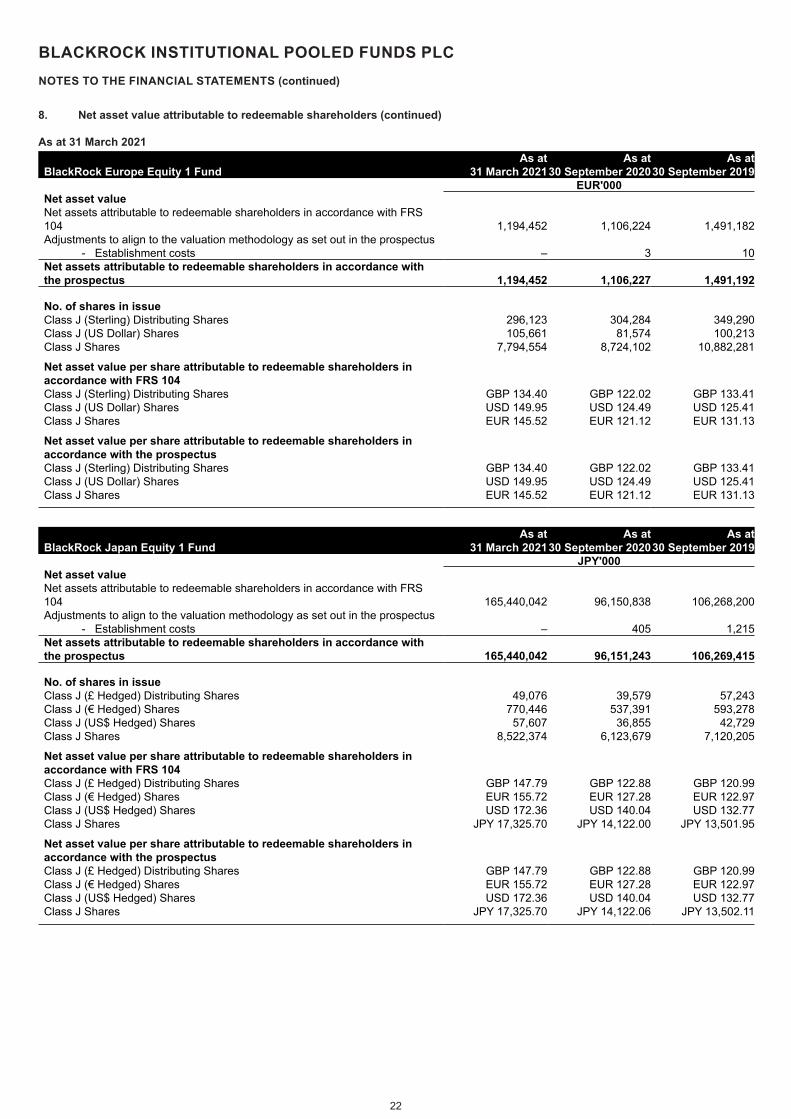
BlackRock Europe Equity 1 FundAs at
31 March 2021As at
30 September 2020As at
30 September 2019EUR'000
Net asset valueNet assets attributable to redeemable shareholders in accordance with FRS 104 1,194,452 1,106,224 1,491,182Adjustments to align to the valuation methodology as set out in the prospectus
- Establishment costs – 3 10Net assets attributable to redeemable shareholders in accordance with the prospectus 1,194,452 1,106,227 1,491,192
No. of shares in issueClass J (Sterling) Distributing Shares 296,123 304,284 349,290Class J (US Dollar) Shares 105,661 81,574 100,213Class J Shares 7,794,554 8,724,102 10,882,281
Net asset value per share attributable to redeemable shareholders in accordance with FRS 104Class J (Sterling) Distributing Shares GBP 134.40 GBP 122.02 GBP 133.41Class J (US Dollar) Shares USD 149.95 USD 124.49 USD 125.41Class J Shares EUR 145.52 EUR 121.12 EUR 131.13
Net asset value per share attributable to redeemable shareholders in accordance with the prospectusClass J (Sterling) Distributing Shares GBP 134.40 GBP 122.02 GBP 133.41Class J (US Dollar) Shares USD 149.95 USD 124.49 USD 125.41Class J Shares EUR 145.52 EUR 121.12 EUR 131.13
BlackRock Japan Equity 1 FundAs at
31 March 2021As at
30 September 2020As at
30 September 2019JPY'000
Net asset valueNet assets attributable to redeemable shareholders in accordance with FRS 104 165,440,042 96,150,838 106,268,200Adjustments to align to the valuation methodology as set out in the prospectus
- Establishment costs – 405 1,215Net assets attributable to redeemable shareholders in accordance with the prospectus 165,440,042 96,151,243 106,269,415
No. of shares in issueClass J (£ Hedged) Distributing Shares 49,076 39,579 57,243Class J (€ Hedged) Shares 770,446 537,391 593,278Class J (US$ Hedged) Shares 57,607 36,855 42,729Class J Shares 8,522,374 6,123,679 7,120,205
Net asset value per share attributable to redeemable shareholders in accordance with FRS 104Class J (£ Hedged) Distributing Shares GBP 147.79 GBP 122.88 GBP 120.99Class J (€ Hedged) Shares EUR 155.72 EUR 127.28 EUR 122.97Class J (US$ Hedged) Shares USD 172.36 USD 140.04 USD 132.77Class J Shares JPY 17,325.70 JPY 14,122.00 JPY 13,501.95
Net asset value per share attributable to redeemable shareholders in accordance with the prospectusClass J (£ Hedged) Distributing Shares GBP 147.79 GBP 122.88 GBP 120.99Class J (€ Hedged) Shares EUR 155.72 EUR 127.28 EUR 122.97Class J (US$ Hedged) Shares USD 172.36 USD 140.04 USD 132.77Class J Shares JPY 17,325.70 JPY 14,122.06 JPY 13,502.11
8. Net asset value attributable to redeemable shareholders (continued)
As at 31 March 2021
23
BLACKROCK INSTITUTIONAL POOLED FUNDS PLCNOTES TO THE FINANCIAL STATEMENTS (continued)
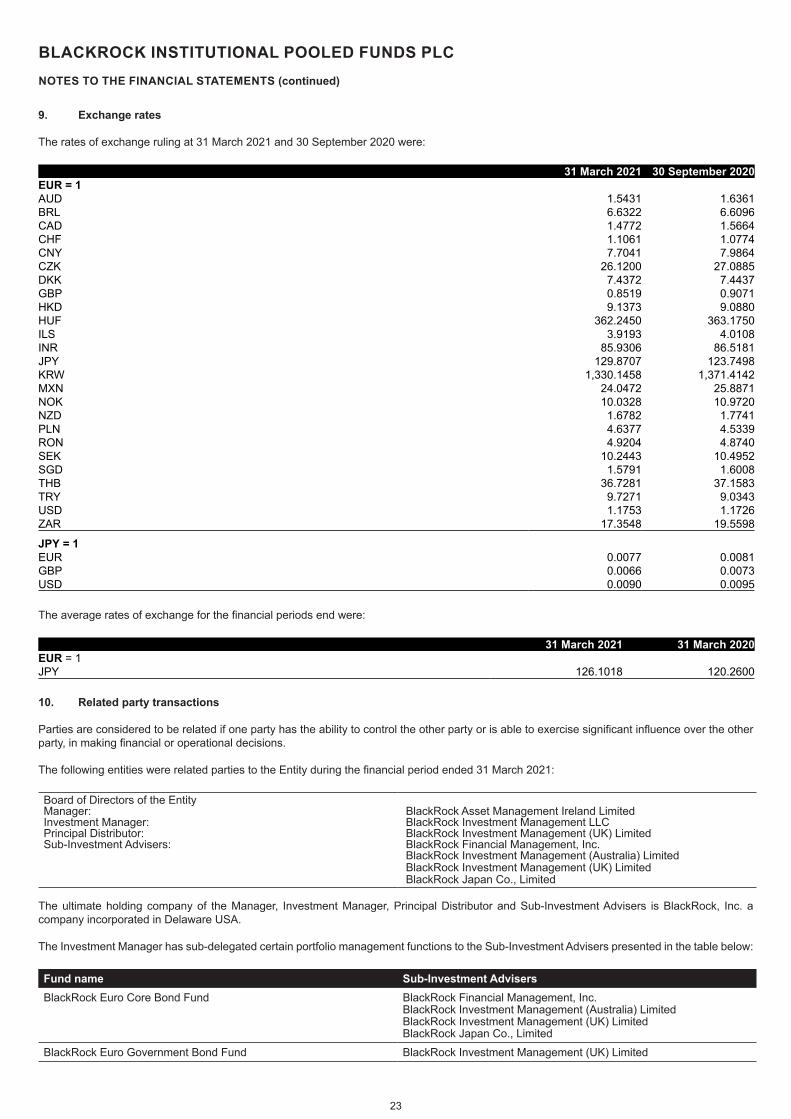
9. Exchange rates
The rates of exchange ruling at 31 March 2021 and 30 September 2020 were:
31 March 2021 30 September 2020EUR = 1 AUD 1.5431 1.6361BRL 6.6322 6.6096CAD 1.4772 1.5664CHF 1.1061 1.0774CNY 7.7041 7.9864CZK 26.1200 27.0885DKK 7.4372 7.4437GBP 0.8519 0.9071HKD 9.1373 9.0880HUF 362.2450 363.1750ILS 3.9193 4.0108INR 85.9306 86.5181JPY 129.8707 123.7498KRW 1,330.1458 1,371.4142MXN 24.0472 25.8871NOK 10.0328 10.9720NZD 1.6782 1.7741PLN 4.6377 4.5339RON 4.9204 4.8740SEK 10.2443 10.4952SGD 1.5791 1.6008THB 36.7281 37.1583TRY 9.7271 9.0343USD 1.1753 1.1726ZAR 17.3548 19.5598
JPY = 1 EUR 0.0077 0.0081GBP 0.0066 0.0073USD 0.0090 0.0095
The average rates of exchange for the financial periods end were:
31 March 2021 31 March 2020EUR = 1 JPY 126.1018 120.2600
10. Related party transactions
Parties are considered to be related if one party has the ability to control the other party or is able to exercise significant influence over the other party, in making financial or operational decisions.
The following entities were related parties to the Entity during the financial period ended 31 March 2021:
Board of Directors of the EntityManager: BlackRock Asset Management Ireland LimitedInvestment Manager: BlackRock Investment Management LLCPrincipal Distributor: BlackRock Investment Management (UK) LimitedSub-Investment Advisers: BlackRock Financial Management, Inc.
BlackRock Investment Management (Australia) Limited BlackRock Investment Management (UK) Limited BlackRock Japan Co., Limited
The ultimate holding company of the Manager, Investment Manager, Principal Distributor and Sub-Investment Advisers is BlackRock, Inc. a company incorporated in Delaware USA.
The Investment Manager has sub-delegated certain portfolio management functions to the Sub-Investment Advisers presented in the table below:
Fund name Sub-Investment AdvisersBlackRock Euro Core Bond Fund BlackRock Financial Management, Inc.
BlackRock Investment Management (Australia) LimitedBlackRock Investment Management (UK) LimitedBlackRock Japan Co., Limited
BlackRock Euro Government Bond Fund BlackRock Investment Management (UK) Limited
24
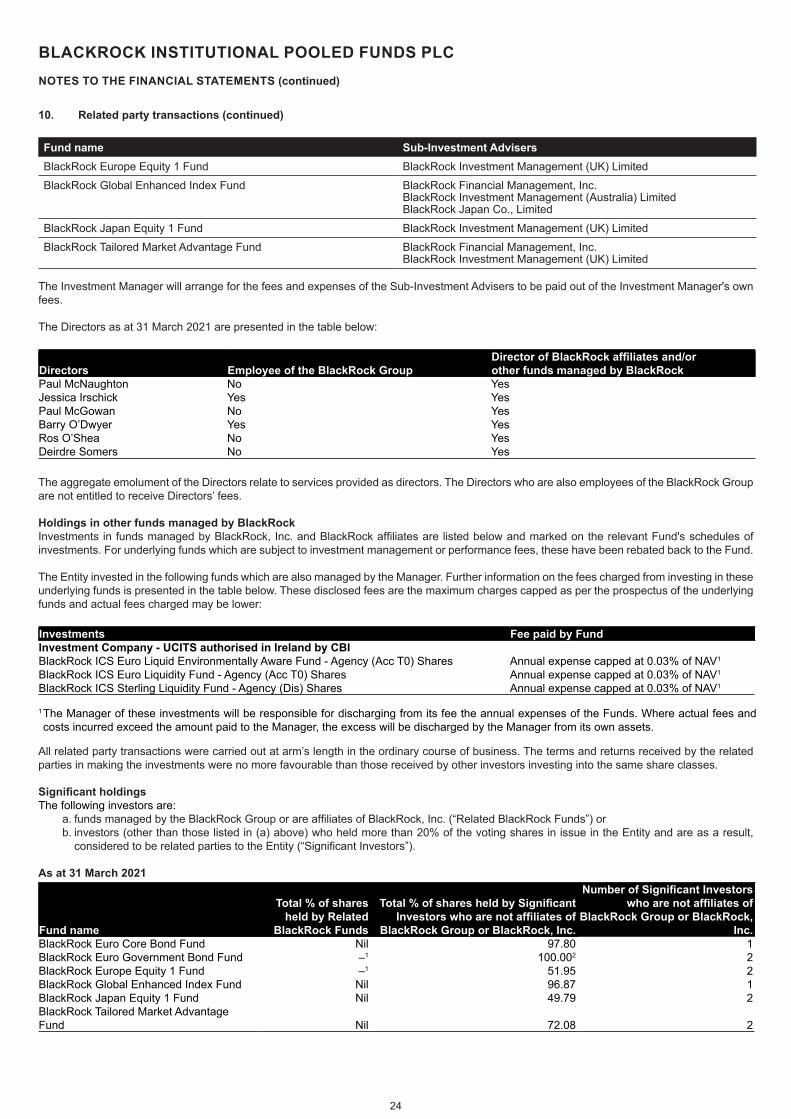
BLACKROCK INSTITUTIONAL POOLED FUNDS PLCNOTES TO THE FINANCIAL STATEMENTS (continued)
Fund name Sub-Investment AdvisersBlackRock Europe Equity 1 Fund BlackRock Investment Management (UK) LimitedBlackRock Global Enhanced Index Fund BlackRock Financial Management, Inc.
BlackRock Investment Management (Australia) LimitedBlackRock Japan Co., Limited
BlackRock Japan Equity 1 Fund BlackRock Investment Management (UK) LimitedBlackRock Tailored Market Advantage Fund BlackRock Financial Management, Inc.
BlackRock Investment Management (UK) Limited
The Investment Manager will arrange for the fees and expenses of the Sub-Investment Advisers to be paid out of the Investment Manager's own fees.
The Directors as at 31 March 2021 are presented in the table below:
Directors Employee of the BlackRock GroupDirector of BlackRock affiliates and/or other funds managed by BlackRock
Paul McNaughton No YesJessica Irschick Yes YesPaul McGowan No YesBarry O’Dwyer Yes YesRos O’Shea No YesDeirdre Somers No Yes
The aggregate emolument of the Directors relate to services provided as directors. The Directors who are also employees of the BlackRock Group are not entitled to receive Directors’ fees.
Holdings in other funds managed by BlackRockInvestments in funds managed by BlackRock, Inc. and BlackRock affiliates are listed below and marked on the relevant Fund's schedules of investments. For underlying funds which are subject to investment management or performance fees, these have been rebated back to the Fund.
The Entity invested in the following funds which are also managed by the Manager. Further information on the fees charged from investing in these underlying funds is presented in the table below. These disclosed fees are the maximum charges capped as per the prospectus of the underlying funds and actual fees charged may be lower:
Investments Fee paid by FundInvestment Company - UCITS authorised in Ireland by CBIBlackRock ICS Euro Liquid Environmentally Aware Fund - Agency (Acc T0) Shares Annual expense capped at 0.03% of NAV1
BlackRock ICS Euro Liquidity Fund - Agency (Acc T0) Shares Annual expense capped at 0.03% of NAV1
BlackRock ICS Sterling Liquidity Fund - Agency (Dis) Shares Annual expense capped at 0.03% of NAV1
1The Manager of these investments will be responsible for discharging from its fee the annual expenses of the Funds. Where actual fees and costs incurred exceed the amount paid to the Manager, the excess will be discharged by the Manager from its own assets.
All related party transactions were carried out at arm’s length in the ordinary course of business. The terms and returns received by the related parties in making the investments were no more favourable than those received by other investors investing into the same share classes.
Significant holdingsThe following investors are:
a. funds managed by the BlackRock Group or are affiliates of BlackRock, Inc. (“Related BlackRock Funds”) orb. investors (other than those listed in (a) above) who held more than 20% of the voting shares in issue in the Entity and are as a result,
considered to be related parties to the Entity (“Significant Investors”).
As at 31 March 2021
Fund name
Total % of shares held by Related
BlackRock Funds
Total % of shares held by Significant Investors who are not affiliates of
BlackRock Group or BlackRock, Inc.
Number of Significant Investors who are not affiliates of
BlackRock Group or BlackRock, Inc.
BlackRock Euro Core Bond Fund Nil 97.80 1BlackRock Euro Government Bond Fund –1 100.002 2BlackRock Europe Equity 1 Fund –1 51.95 2BlackRock Global Enhanced Index Fund Nil 96.87 1BlackRock Japan Equity 1 Fund Nil 49.79 2BlackRock Tailored Market Advantage Fund Nil 72.08 2
10. Related party transactions (continued)
25
BLACKROCK INSTITUTIONAL POOLED FUNDS PLCNOTES TO THE FINANCIAL STATEMENTS (continued)
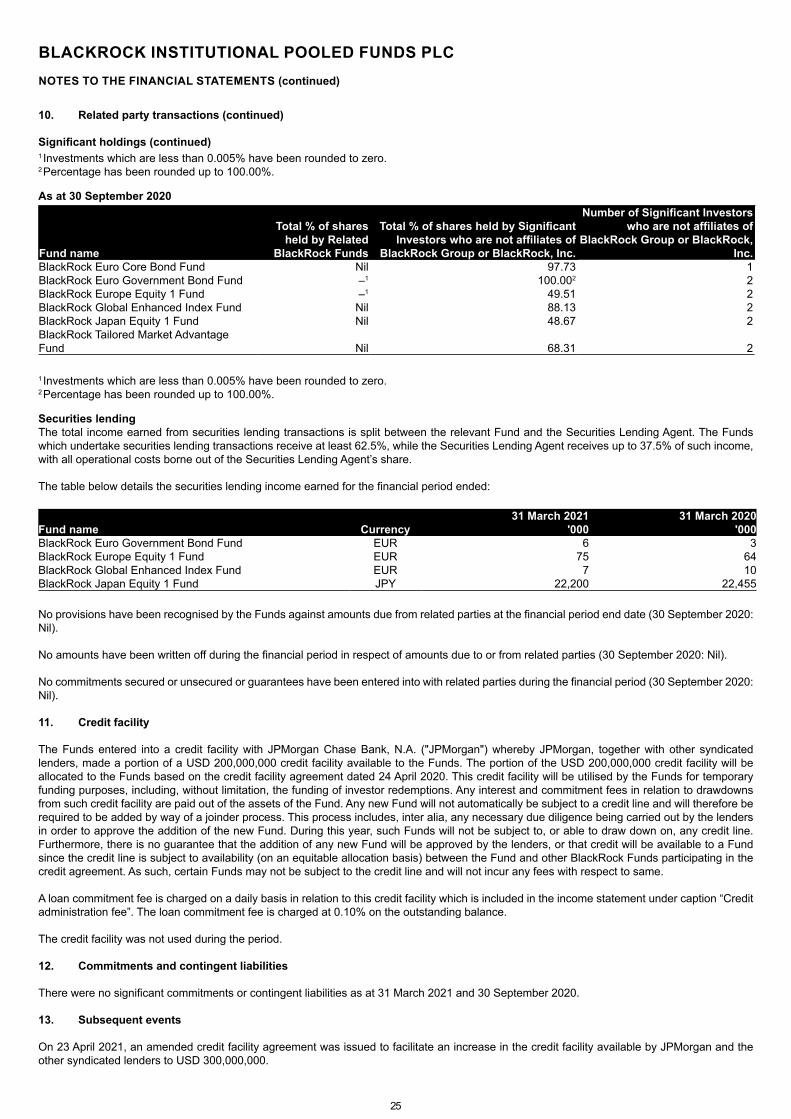
1 Investments which are less than 0.005% have been rounded to zero.2Percentage has been rounded up to 100.00%.
Asat30September2020
Fundname
Total % of shares heldbyRelated
BlackRockFunds
Total % of sharesheldbySignificantInvestorswhoarenotaffiliatesof
BlackRockGrouporBlackRock,Inc.
NumberofSignificantInvestorswhoarenotaffiliatesof
BlackRockGrouporBlackRock,Inc.
BlackRock Euro Core Bond Fund Nil 97.73 1BlackRock Euro Government Bond Fund –1 100.002 2BlackRock Europe Equity 1 Fund –1 49.51 2BlackRock Global Enhanced Index Fund Nil 88.13 2BlackRock Japan Equity 1 Fund Nil 48.67 2BlackRock Tailored Market Advantage Fund Nil 68.31 2
1 Investments which are less than 0.005% have been rounded to zero.2Percentage has been rounded up to 100.00%.
SecuritieslendingThe total income earned from securities lending transactions is split between the relevant Fund and the Securities Lending Agent. The Funds which undertake securities lending transactions receive at least 62.5%, while the Securities Lending Agent receives up to 37.5% of such income, with all operational costs borne out of the Securities Lending Agent’s share.
The table below details the securities lending income earned for the financial period ended:
Fundname Currency31March2021
'00031March2020
'000BlackRock Euro Government Bond Fund EUR 6 3BlackRock Europe Equity 1 Fund EUR 75 64BlackRock Global Enhanced Index Fund EUR 7 10BlackRock Japan Equity 1 Fund JPY 22,200 22,455
No provisions have been recognised by the Funds against amounts due from related parties at the financial period end date (30 September 2020: Nil).
No amounts have been written off during the financial period in respect of amounts due to or from related parties (30 September 2020: Nil).
No commitments secured or unsecured or guarantees have been entered into with related parties during the financial period (30 September 2020: Nil).
11. Creditfacility
The Funds entered into a credit facility with JPMorgan Chase Bank, N.A. ("JPMorgan") whereby JPMorgan, together with other syndicated lenders, made a portion of a USD 200,000,000 credit facility available to the Funds. The portion of the USD 200,000,000 credit facility will be allocated to the Funds based on the credit facility agreement dated 24 April 2020. This credit facility will be utilised by the Funds for temporary funding purposes, including, without limitation, the funding of investor redemptions. Any interest and commitment fees in relation to drawdowns from such credit facility are paid out of the assets of the Fund. Any new Fund will not automatically be subject to a credit line and will therefore be required to be added by way of a joinder process. This process includes, inter alia, any necessary due diligence being carried out by the lenders in order to approve the addition of the new Fund. During this year, such Funds will not be subject to, or able to draw down on, any credit line. Furthermore, there is no guarantee that the addition of any new Fund will be approved by the lenders, or that credit will be available to a Fund since the credit line is subject to availability (on an equitable allocation basis) between the Fund and other BlackRock Funds participating in the credit agreement. As such, certain Funds may not be subject to the credit line and will not incur any fees with respect to same.
A loan commitment fee is charged on a daily basis in relation to this credit facility which is included in the income statement under caption “Credit administration fee”. The loan commitment fee is charged at 0.10% on the outstanding balance.
The credit facility was not used during the period.
12. Commitmentsandcontingentliabilities
There were no significant commitments or contingent liabilities as at 31 March 2021 and 30 September 2020.
13. Subsequentevents
On 23 April 2021, an amended credit facility agreement was issued to facilitate an increase in the credit facility available by JPMorgan and the other syndicated lenders to USD 300,000,000.
10. Relatedpartytransactions(continued)
Significantholdings(continued)

26
BLACKROCK INSTITUTIONAL POOLED FUNDS PLCNOTES TO THE FINANCIAL STATEMENTS (continued)
13. Subsequentevents(continued)
On 19 May 2021, 99% of holdings were redeemed from the BlackRock Euro Core Bond Fund.
Other than the above, there have been no events subsequent to the financial period end, which, in the opinion of the Directors, may have had an impact on the financial statements for the financial period ended 31 March 2021.
14. Approvaldate
The financial statements were approved by the Directors on 26 May 2021.
27
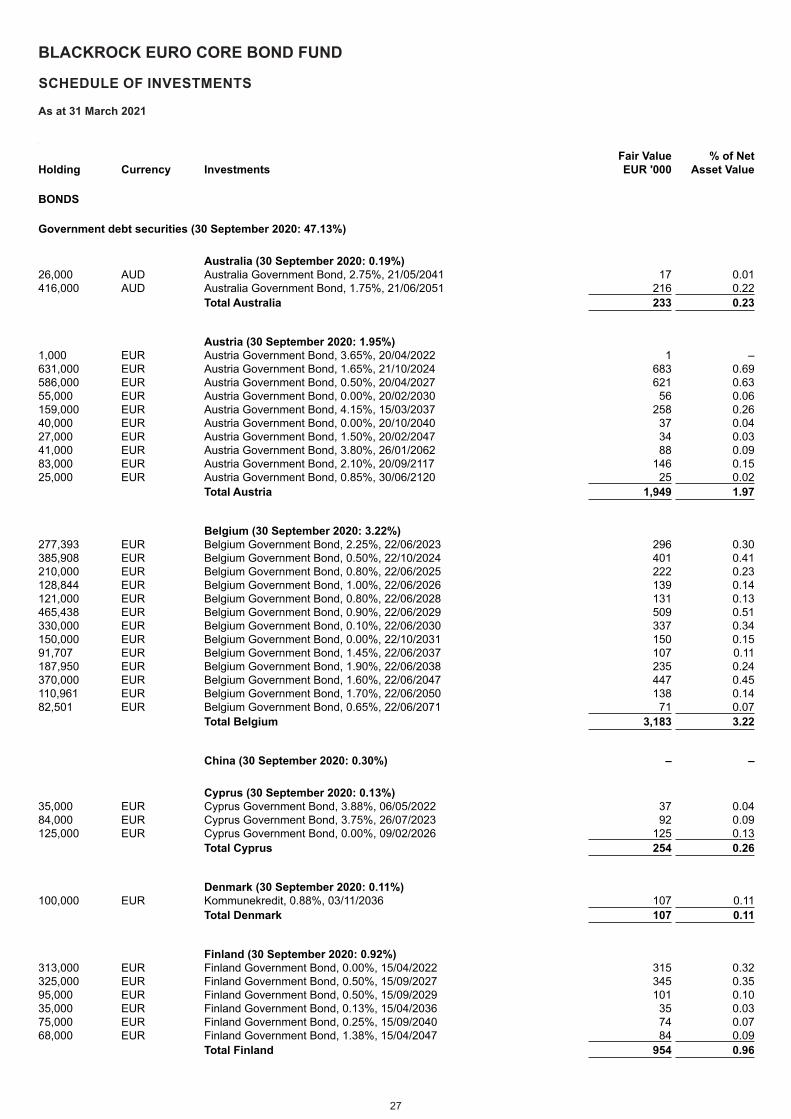
BLACKROCK EURO CORE BOND FUND
SCHEDULE OF INVESTMENTS
As at 31 March 2021
\
Holding Currency InvestmentsFair Value EUR '000
% of Net Asset Value
BONDS
Government debt securities (30 September 2020: 47.13%)
Australia (30 September 2020: 0.19%)26,000 AUD Australia Government Bond, 2.75%, 21/05/2041 17 0.01416,000 AUD Australia Government Bond, 1.75%, 21/06/2051 216 0.22
Total Australia 233 0.23
Austria (30 September 2020: 1.95%)1,000 EUR Austria Government Bond, 3.65%, 20/04/2022 1 –631,000 EUR Austria Government Bond, 1.65%, 21/10/2024 683 0.69586,000 EUR Austria Government Bond, 0.50%, 20/04/2027 621 0.6355,000 EUR Austria Government Bond, 0.00%, 20/02/2030 56 0.06159,000 EUR Austria Government Bond, 4.15%, 15/03/2037 258 0.2640,000 EUR Austria Government Bond, 0.00%, 20/10/2040 37 0.0427,000 EUR Austria Government Bond, 1.50%, 20/02/2047 34 0.0341,000 EUR Austria Government Bond, 3.80%, 26/01/2062 88 0.0983,000 EUR Austria Government Bond, 2.10%, 20/09/2117 146 0.1525,000 EUR Austria Government Bond, 0.85%, 30/06/2120 25 0.02
Total Austria 1,949 1.97
Belgium (30 September 2020: 3.22%)277,393 EUR Belgium Government Bond, 2.25%, 22/06/2023 296 0.30385,908 EUR Belgium Government Bond, 0.50%, 22/10/2024 401 0.41210,000 EUR Belgium Government Bond, 0.80%, 22/06/2025 222 0.23128,844 EUR Belgium Government Bond, 1.00%, 22/06/2026 139 0.14121,000 EUR Belgium Government Bond, 0.80%, 22/06/2028 131 0.13465,438 EUR Belgium Government Bond, 0.90%, 22/06/2029 509 0.51330,000 EUR Belgium Government Bond, 0.10%, 22/06/2030 337 0.34150,000 EUR Belgium Government Bond, 0.00%, 22/10/2031 150 0.1591,707 EUR Belgium Government Bond, 1.45%, 22/06/2037 107 0.11187,950 EUR Belgium Government Bond, 1.90%, 22/06/2038 235 0.24370,000 EUR Belgium Government Bond, 1.60%, 22/06/2047 447 0.45110,961 EUR Belgium Government Bond, 1.70%, 22/06/2050 138 0.1482,501 EUR Belgium Government Bond, 0.65%, 22/06/2071 71 0.07
Total Belgium 3,183 3.22
China (30 September 2020: 0.30%) – –
Cyprus (30 September 2020: 0.13%)35,000 EUR Cyprus Government Bond, 3.88%, 06/05/2022 37 0.0484,000 EUR Cyprus Government Bond, 3.75%, 26/07/2023 92 0.09125,000 EUR Cyprus Government Bond, 0.00%, 09/02/2026 125 0.13
Total Cyprus 254 0.26
Denmark (30 September 2020: 0.11%)100,000 EUR Kommunekredit, 0.88%, 03/11/2036 107 0.11
Total Denmark 107 0.11
Finland (30 September 2020: 0.92%)313,000 EUR Finland Government Bond, 0.00%, 15/04/2022 315 0.32325,000 EUR Finland Government Bond, 0.50%, 15/09/2027 345 0.3595,000 EUR Finland Government Bond, 0.50%, 15/09/2029 101 0.1035,000 EUR Finland Government Bond, 0.13%, 15/04/2036 35 0.0375,000 EUR Finland Government Bond, 0.25%, 15/09/2040 74 0.0768,000 EUR Finland Government Bond, 1.38%, 15/04/2047 84 0.09
Total Finland 954 0.96
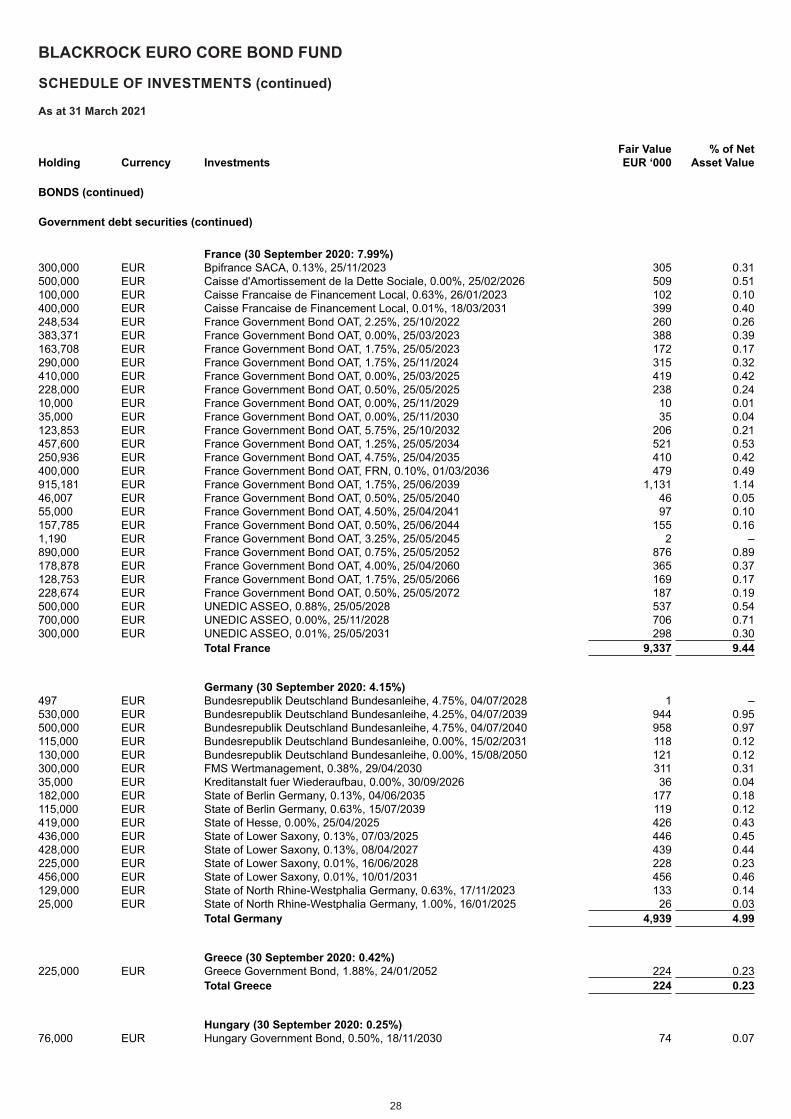
28
BLACKROCK EURO CORE BOND FUND
SCHEDULE OF INVESTMENTS (continued)
As at 31 March 2021
Holding Currency Investments Fair Value EUR ‘000
% of Net Asset Value
BONDS (continued)
Government debt securities (continued)
France (30 September 2020: 7.99%)300,000 EUR Bpifrance SACA, 0.13%, 25/11/2023 305 0.31500,000 EUR Caisse d'Amortissement de la Dette Sociale, 0.00%, 25/02/2026 509 0.51100,000 EUR Caisse Francaise de Financement Local, 0.63%, 26/01/2023 102 0.10400,000 EUR Caisse Francaise de Financement Local, 0.01%, 18/03/2031 399 0.40248,534 EUR France Government Bond OAT, 2.25%, 25/10/2022 260 0.26383,371 EUR France Government Bond OAT, 0.00%, 25/03/2023 388 0.39163,708 EUR France Government Bond OAT, 1.75%, 25/05/2023 172 0.17290,000 EUR France Government Bond OAT, 1.75%, 25/11/2024 315 0.32410,000 EUR France Government Bond OAT, 0.00%, 25/03/2025 419 0.42228,000 EUR France Government Bond OAT, 0.50%, 25/05/2025 238 0.2410,000 EUR France Government Bond OAT, 0.00%, 25/11/2029 10 0.0135,000 EUR France Government Bond OAT, 0.00%, 25/11/2030 35 0.04123,853 EUR France Government Bond OAT, 5.75%, 25/10/2032 206 0.21457,600 EUR France Government Bond OAT, 1.25%, 25/05/2034 521 0.53250,936 EUR France Government Bond OAT, 4.75%, 25/04/2035 410 0.42400,000 EUR France Government Bond OAT, FRN, 0.10%, 01/03/2036 479 0.49915,181 EUR France Government Bond OAT, 1.75%, 25/06/2039 1,131 1.1446,007 EUR France Government Bond OAT, 0.50%, 25/05/2040 46 0.0555,000 EUR France Government Bond OAT, 4.50%, 25/04/2041 97 0.10157,785 EUR France Government Bond OAT, 0.50%, 25/06/2044 155 0.161,190 EUR France Government Bond OAT, 3.25%, 25/05/2045 2 –890,000 EUR France Government Bond OAT, 0.75%, 25/05/2052 876 0.89178,878 EUR France Government Bond OAT, 4.00%, 25/04/2060 365 0.37128,753 EUR France Government Bond OAT, 1.75%, 25/05/2066 169 0.17228,674 EUR France Government Bond OAT, 0.50%, 25/05/2072 187 0.19500,000 EUR UNEDIC ASSEO, 0.88%, 25/05/2028 537 0.54700,000 EUR UNEDIC ASSEO, 0.00%, 25/11/2028 706 0.71300,000 EUR UNEDIC ASSEO, 0.01%, 25/05/2031 298 0.30
Total France 9,337 9.44
Germany (30 September 2020: 4.15%)497 EUR Bundesrepublik Deutschland Bundesanleihe, 4.75%, 04/07/2028 1 –530,000 EUR Bundesrepublik Deutschland Bundesanleihe, 4.25%, 04/07/2039 944 0.95500,000 EUR Bundesrepublik Deutschland Bundesanleihe, 4.75%, 04/07/2040 958 0.97115,000 EUR Bundesrepublik Deutschland Bundesanleihe, 0.00%, 15/02/2031 118 0.12130,000 EUR Bundesrepublik Deutschland Bundesanleihe, 0.00%, 15/08/2050 121 0.12300,000 EUR FMS Wertmanagement, 0.38%, 29/04/2030 311 0.3135,000 EUR Kreditanstalt fuer Wiederaufbau, 0.00%, 30/09/2026 36 0.04182,000 EUR State of Berlin Germany, 0.13%, 04/06/2035 177 0.18115,000 EUR State of Berlin Germany, 0.63%, 15/07/2039 119 0.12419,000 EUR State of Hesse, 0.00%, 25/04/2025 426 0.43436,000 EUR State of Lower Saxony, 0.13%, 07/03/2025 446 0.45428,000 EUR State of Lower Saxony, 0.13%, 08/04/2027 439 0.44225,000 EUR State of Lower Saxony, 0.01%, 16/06/2028 228 0.23456,000 EUR State of Lower Saxony, 0.01%, 10/01/2031 456 0.46129,000 EUR State of North Rhine-Westphalia Germany, 0.63%, 17/11/2023 133 0.1425,000 EUR State of North Rhine-Westphalia Germany, 1.00%, 16/01/2025 26 0.03
Total Germany 4,939 4.99
Greece (30 September 2020: 0.42%)225,000 EUR Greece Government Bond, 1.88%, 24/01/2052 224 0.23
Total Greece 224 0.23
Hungary (30 September 2020: 0.25%)76,000 EUR Hungary Government Bond, 0.50%, 18/11/2030 74 0.07
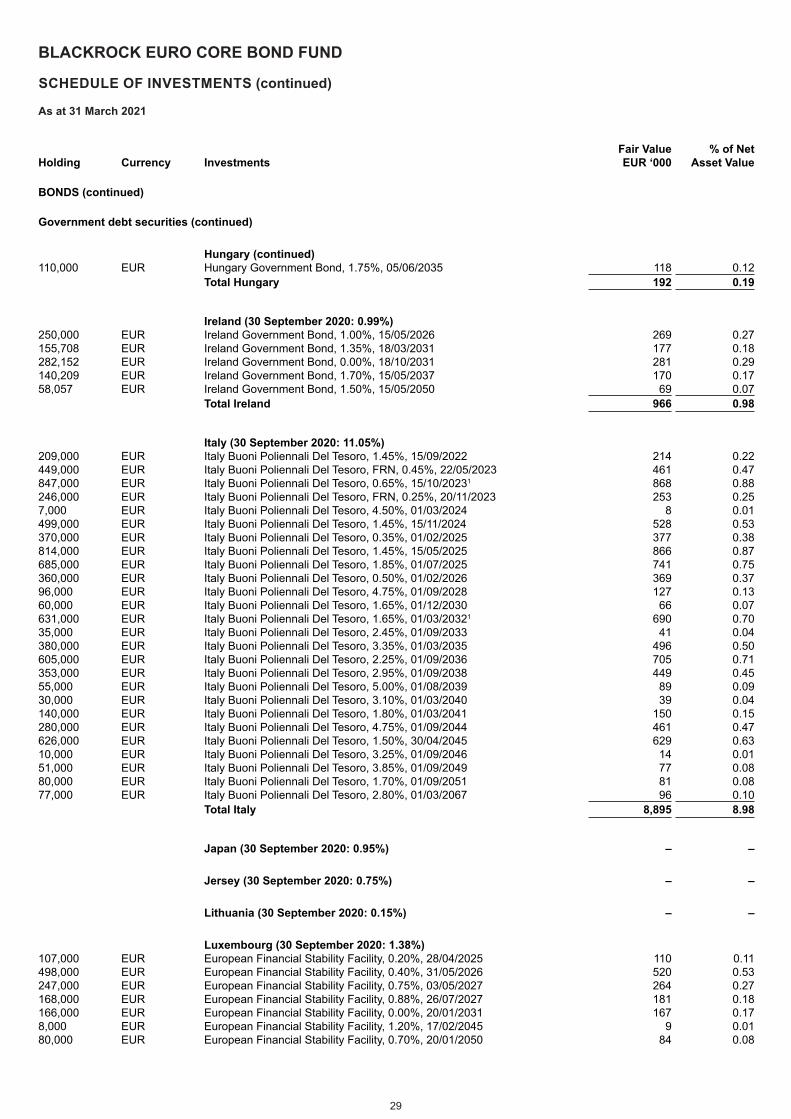
29
BLACKROCK EURO CORE BOND FUND
SCHEDULE OF INVESTMENTS (continued)
As at 31 March 2021
Holding Currency Investments Fair Value EUR ‘000
% of Net Asset Value
BONDS (continued)
Government debt securities (continued)
Hungary (continued) 110,000 EUR Hungary Government Bond, 1.75%, 05/06/2035 118 0.12
Total Hungary 192 0.19
Ireland (30 September 2020: 0.99%)250,000 EUR Ireland Government Bond, 1.00%, 15/05/2026 269 0.27155,708 EUR Ireland Government Bond, 1.35%, 18/03/2031 177 0.18282,152 EUR Ireland Government Bond, 0.00%, 18/10/2031 281 0.29140,209 EUR Ireland Government Bond, 1.70%, 15/05/2037 170 0.1758,057 EUR Ireland Government Bond, 1.50%, 15/05/2050 69 0.07
Total Ireland 966 0.98
Italy (30 September 2020: 11.05%)209,000 EUR Italy Buoni Poliennali Del Tesoro, 1.45%, 15/09/2022 214 0.22449,000 EUR Italy Buoni Poliennali Del Tesoro, FRN, 0.45%, 22/05/2023 461 0.47847,000 EUR Italy Buoni Poliennali Del Tesoro, 0.65%, 15/10/20231 868 0.88246,000 EUR Italy Buoni Poliennali Del Tesoro, FRN, 0.25%, 20/11/2023 253 0.257,000 EUR Italy Buoni Poliennali Del Tesoro, 4.50%, 01/03/2024 8 0.01499,000 EUR Italy Buoni Poliennali Del Tesoro, 1.45%, 15/11/2024 528 0.53370,000 EUR Italy Buoni Poliennali Del Tesoro, 0.35%, 01/02/2025 377 0.38814,000 EUR Italy Buoni Poliennali Del Tesoro, 1.45%, 15/05/2025 866 0.87685,000 EUR Italy Buoni Poliennali Del Tesoro, 1.85%, 01/07/2025 741 0.75360,000 EUR Italy Buoni Poliennali Del Tesoro, 0.50%, 01/02/2026 369 0.3796,000 EUR Italy Buoni Poliennali Del Tesoro, 4.75%, 01/09/2028 127 0.1360,000 EUR Italy Buoni Poliennali Del Tesoro, 1.65%, 01/12/2030 66 0.07631,000 EUR Italy Buoni Poliennali Del Tesoro, 1.65%, 01/03/20321 690 0.7035,000 EUR Italy Buoni Poliennali Del Tesoro, 2.45%, 01/09/2033 41 0.04380,000 EUR Italy Buoni Poliennali Del Tesoro, 3.35%, 01/03/2035 496 0.50605,000 EUR Italy Buoni Poliennali Del Tesoro, 2.25%, 01/09/2036 705 0.71353,000 EUR Italy Buoni Poliennali Del Tesoro, 2.95%, 01/09/2038 449 0.4555,000 EUR Italy Buoni Poliennali Del Tesoro, 5.00%, 01/08/2039 89 0.0930,000 EUR Italy Buoni Poliennali Del Tesoro, 3.10%, 01/03/2040 39 0.04140,000 EUR Italy Buoni Poliennali Del Tesoro, 1.80%, 01/03/2041 150 0.15280,000 EUR Italy Buoni Poliennali Del Tesoro, 4.75%, 01/09/2044 461 0.47626,000 EUR Italy Buoni Poliennali Del Tesoro, 1.50%, 30/04/2045 629 0.6310,000 EUR Italy Buoni Poliennali Del Tesoro, 3.25%, 01/09/2046 14 0.0151,000 EUR Italy Buoni Poliennali Del Tesoro, 3.85%, 01/09/2049 77 0.0880,000 EUR Italy Buoni Poliennali Del Tesoro, 1.70%, 01/09/2051 81 0.0877,000 EUR Italy Buoni Poliennali Del Tesoro, 2.80%, 01/03/2067 96 0.10
Total Italy 8,895 8.98
Japan (30 September 2020: 0.95%) – –
Jersey (30 September 2020: 0.75%) – –
Lithuania (30 September 2020: 0.15%) – –
Luxembourg (30 September 2020: 1.38%)107,000 EUR European Financial Stability Facility, 0.20%, 28/04/2025 110 0.11498,000 EUR European Financial Stability Facility, 0.40%, 31/05/2026 520 0.53247,000 EUR European Financial Stability Facility, 0.75%, 03/05/2027 264 0.27168,000 EUR European Financial Stability Facility, 0.88%, 26/07/2027 181 0.18166,000 EUR European Financial Stability Facility, 0.00%, 20/01/2031 167 0.178,000 EUR European Financial Stability Facility, 1.20%, 17/02/2045 9 0.0180,000 EUR European Financial Stability Facility, 0.70%, 20/01/2050 84 0.08
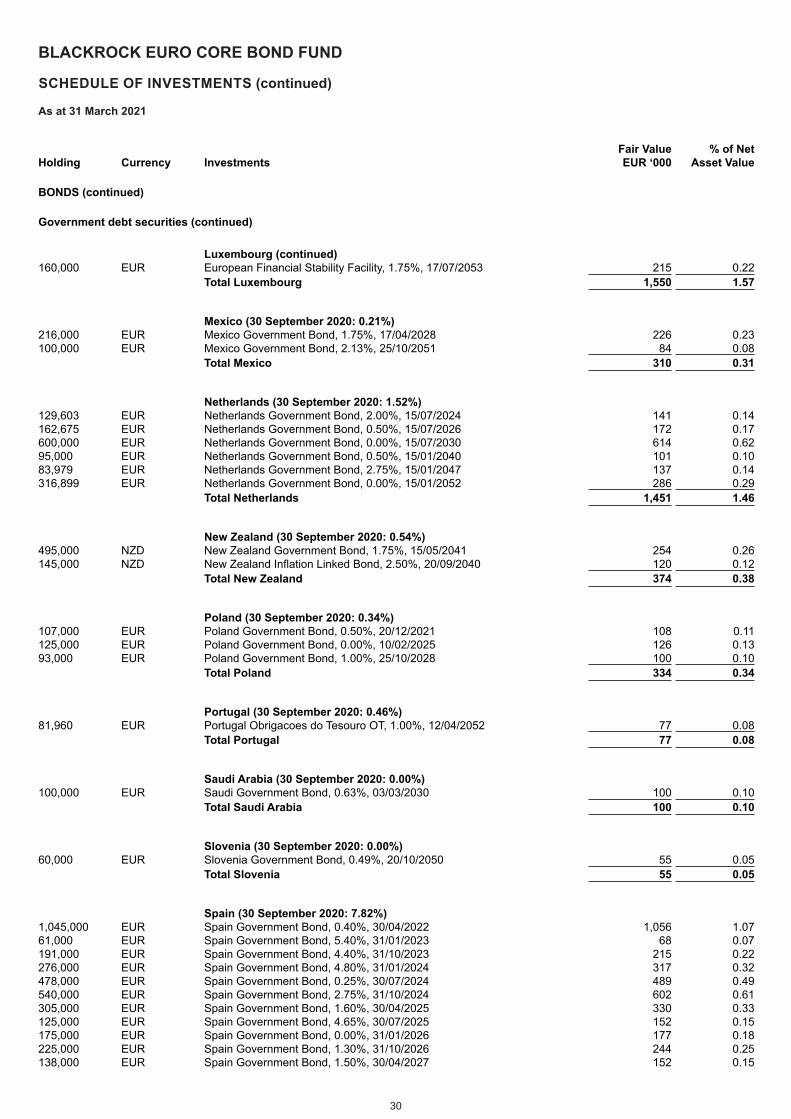
30
BLACKROCK EURO CORE BOND FUND
SCHEDULE OF INVESTMENTS (continued)
As at 31 March 2021
Holding Currency Investments Fair Value EUR ‘000
% of Net Asset Value
BONDS (continued)
Government debt securities (continued)
Luxembourg (continued) 160,000 EUR European Financial Stability Facility, 1.75%, 17/07/2053 215 0.22
Total Luxembourg 1,550 1.57
Mexico (30 September 2020: 0.21%)216,000 EUR Mexico Government Bond, 1.75%, 17/04/2028 226 0.23100,000 EUR Mexico Government Bond, 2.13%, 25/10/2051 84 0.08
Total Mexico 310 0.31
Netherlands (30 September 2020: 1.52%)129,603 EUR Netherlands Government Bond, 2.00%, 15/07/2024 141 0.14162,675 EUR Netherlands Government Bond, 0.50%, 15/07/2026 172 0.17600,000 EUR Netherlands Government Bond, 0.00%, 15/07/2030 614 0.6295,000 EUR Netherlands Government Bond, 0.50%, 15/01/2040 101 0.1083,979 EUR Netherlands Government Bond, 2.75%, 15/01/2047 137 0.14316,899 EUR Netherlands Government Bond, 0.00%, 15/01/2052 286 0.29
Total Netherlands 1,451 1.46
New Zealand (30 September 2020: 0.54%)495,000 NZD New Zealand Government Bond, 1.75%, 15/05/2041 254 0.26145,000 NZD New Zealand Inflation Linked Bond, 2.50%, 20/09/2040 120 0.12
Total New Zealand 374 0.38
Poland (30 September 2020: 0.34%)107,000 EUR Poland Government Bond, 0.50%, 20/12/2021 108 0.11125,000 EUR Poland Government Bond, 0.00%, 10/02/2025 126 0.1393,000 EUR Poland Government Bond, 1.00%, 25/10/2028 100 0.10
Total Poland 334 0.34
Portugal (30 September 2020: 0.46%)81,960 EUR Portugal Obrigacoes do Tesouro OT, 1.00%, 12/04/2052 77 0.08
Total Portugal 77 0.08
Saudi Arabia (30 September 2020: 0.00%)100,000 EUR Saudi Government Bond, 0.63%, 03/03/2030 100 0.10
Total Saudi Arabia 100 0.10
Slovenia (30 September 2020: 0.00%)60,000 EUR Slovenia Government Bond, 0.49%, 20/10/2050 55 0.05
Total Slovenia 55 0.05
Spain (30 September 2020: 7.82%)1,045,000 EUR Spain Government Bond, 0.40%, 30/04/2022 1,056 1.0761,000 EUR Spain Government Bond, 5.40%, 31/01/2023 68 0.07191,000 EUR Spain Government Bond, 4.40%, 31/10/2023 215 0.22276,000 EUR Spain Government Bond, 4.80%, 31/01/2024 317 0.32478,000 EUR Spain Government Bond, 0.25%, 30/07/2024 489 0.49540,000 EUR Spain Government Bond, 2.75%, 31/10/2024 602 0.61305,000 EUR Spain Government Bond, 1.60%, 30/04/2025 330 0.33125,000 EUR Spain Government Bond, 4.65%, 30/07/2025 152 0.15175,000 EUR Spain Government Bond, 0.00%, 31/01/2026 177 0.18225,000 EUR Spain Government Bond, 1.30%, 31/10/2026 244 0.25138,000 EUR Spain Government Bond, 1.50%, 30/04/2027 152 0.15
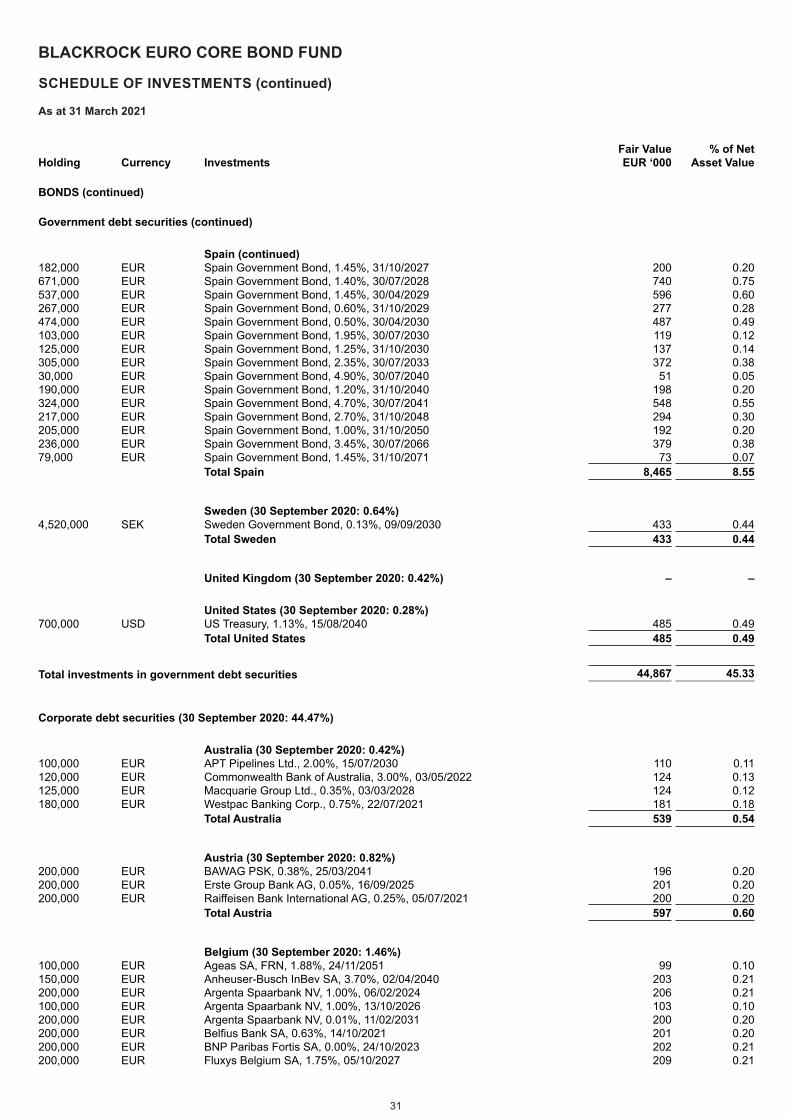
31
BLACKROCK EURO CORE BOND FUND
SCHEDULE OF INVESTMENTS (continued)
As at 31 March 2021
Holding Currency Investments Fair Value EUR ‘000
% of Net Asset Value
BONDS (continued)
Government debt securities (continued)
Spain (continued) 182,000 EUR Spain Government Bond, 1.45%, 31/10/2027 200 0.20671,000 EUR Spain Government Bond, 1.40%, 30/07/2028 740 0.75537,000 EUR Spain Government Bond, 1.45%, 30/04/2029 596 0.60267,000 EUR Spain Government Bond, 0.60%, 31/10/2029 277 0.28474,000 EUR Spain Government Bond, 0.50%, 30/04/2030 487 0.49103,000 EUR Spain Government Bond, 1.95%, 30/07/2030 119 0.12125,000 EUR Spain Government Bond, 1.25%, 31/10/2030 137 0.14305,000 EUR Spain Government Bond, 2.35%, 30/07/2033 372 0.3830,000 EUR Spain Government Bond, 4.90%, 30/07/2040 51 0.05190,000 EUR Spain Government Bond, 1.20%, 31/10/2040 198 0.20324,000 EUR Spain Government Bond, 4.70%, 30/07/2041 548 0.55217,000 EUR Spain Government Bond, 2.70%, 31/10/2048 294 0.30205,000 EUR Spain Government Bond, 1.00%, 31/10/2050 192 0.20236,000 EUR Spain Government Bond, 3.45%, 30/07/2066 379 0.3879,000 EUR Spain Government Bond, 1.45%, 31/10/2071 73 0.07
Total Spain 8,465 8.55
Sweden (30 September 2020: 0.64%)4,520,000 SEK Sweden Government Bond, 0.13%, 09/09/2030 433 0.44
Total Sweden 433 0.44
United Kingdom (30 September 2020: 0.42%) – –
United States (30 September 2020: 0.28%)700,000 USD US Treasury, 1.13%, 15/08/2040 485 0.49
Total United States 485 0.49
Total investments in government debt securities 44,867 45.33
Corporate debt securities (30 September 2020: 44.47%)
Australia (30 September 2020: 0.42%)100,000 EUR APT Pipelines Ltd., 2.00%, 15/07/2030 110 0.11120,000 EUR Commonwealth Bank of Australia, 3.00%, 03/05/2022 124 0.13125,000 EUR Macquarie Group Ltd., 0.35%, 03/03/2028 124 0.12180,000 EUR Westpac Banking Corp., 0.75%, 22/07/2021 181 0.18
Total Australia 539 0.54
Austria (30 September 2020: 0.82%)200,000 EUR BAWAG PSK, 0.38%, 25/03/2041 196 0.20200,000 EUR Erste Group Bank AG, 0.05%, 16/09/2025 201 0.20200,000 EUR Raiffeisen Bank International AG, 0.25%, 05/07/2021 200 0.20
Total Austria 597 0.60
Belgium (30 September 2020: 1.46%)100,000 EUR Ageas SA, FRN, 1.88%, 24/11/2051 99 0.10150,000 EUR Anheuser-Busch InBev SA, 3.70%, 02/04/2040 203 0.21200,000 EUR Argenta Spaarbank NV, 1.00%, 06/02/2024 206 0.21100,000 EUR Argenta Spaarbank NV, 1.00%, 13/10/2026 103 0.10200,000 EUR Argenta Spaarbank NV, 0.01%, 11/02/2031 200 0.20200,000 EUR Belfius Bank SA, 0.63%, 14/10/2021 201 0.20200,000 EUR BNP Paribas Fortis SA, 0.00%, 24/10/2023 202 0.21200,000 EUR Fluxys Belgium SA, 1.75%, 05/10/2027 209 0.21
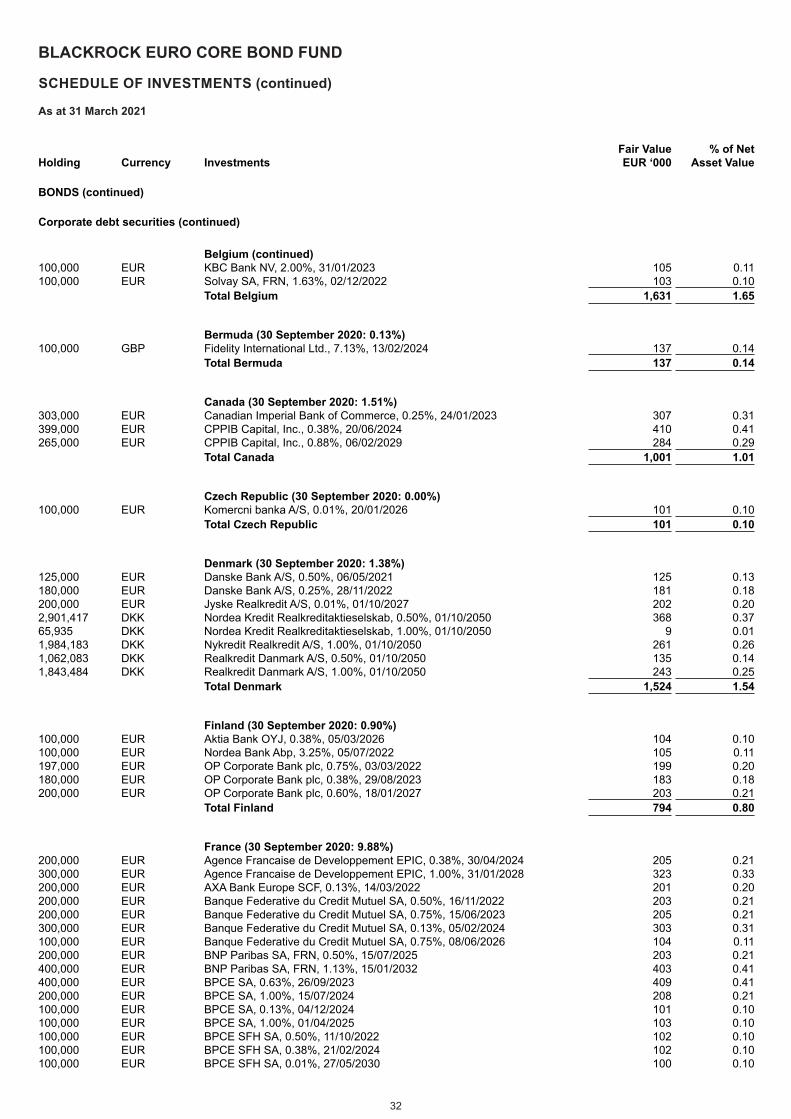
32
BLACKROCK EURO CORE BOND FUND
SCHEDULE OF INVESTMENTS (continued)
As at 31 March 2021
Holding Currency Investments Fair Value EUR ‘000
% of Net Asset Value
BONDS (continued)
Corporate debt securities (continued)
Belgium (continued) 100,000 EUR KBC Bank NV, 2.00%, 31/01/2023 105 0.11100,000 EUR Solvay SA, FRN, 1.63%, 02/12/2022 103 0.10
Total Belgium 1,631 1.65
Bermuda (30 September 2020: 0.13%)100,000 GBP Fidelity International Ltd., 7.13%, 13/02/2024 137 0.14
Total Bermuda 137 0.14
Canada (30 September 2020: 1.51%)303,000 EUR Canadian Imperial Bank of Commerce, 0.25%, 24/01/2023 307 0.31399,000 EUR CPPIB Capital, Inc., 0.38%, 20/06/2024 410 0.41265,000 EUR CPPIB Capital, Inc., 0.88%, 06/02/2029 284 0.29
Total Canada 1,001 1.01
Czech Republic (30 September 2020: 0.00%)100,000 EUR Komercni banka A/S, 0.01%, 20/01/2026 101 0.10
Total Czech Republic 101 0.10
Denmark (30 September 2020: 1.38%)125,000 EUR Danske Bank A/S, 0.50%, 06/05/2021 125 0.13180,000 EUR Danske Bank A/S, 0.25%, 28/11/2022 181 0.18200,000 EUR Jyske Realkredit A/S, 0.01%, 01/10/2027 202 0.202,901,417 DKK Nordea Kredit Realkreditaktieselskab, 0.50%, 01/10/2050 368 0.3765,935 DKK Nordea Kredit Realkreditaktieselskab, 1.00%, 01/10/2050 9 0.011,984,183 DKK Nykredit Realkredit A/S, 1.00%, 01/10/2050 261 0.261,062,083 DKK Realkredit Danmark A/S, 0.50%, 01/10/2050 135 0.141,843,484 DKK Realkredit Danmark A/S, 1.00%, 01/10/2050 243 0.25
Total Denmark 1,524 1.54
Finland (30 September 2020: 0.90%)100,000 EUR Aktia Bank OYJ, 0.38%, 05/03/2026 104 0.10100,000 EUR Nordea Bank Abp, 3.25%, 05/07/2022 105 0.11197,000 EUR OP Corporate Bank plc, 0.75%, 03/03/2022 199 0.20180,000 EUR OP Corporate Bank plc, 0.38%, 29/08/2023 183 0.18200,000 EUR OP Corporate Bank plc, 0.60%, 18/01/2027 203 0.21
Total Finland 794 0.80
France (30 September 2020: 9.88%)200,000 EUR Agence Francaise de Developpement EPIC, 0.38%, 30/04/2024 205 0.21300,000 EUR Agence Francaise de Developpement EPIC, 1.00%, 31/01/2028 323 0.33200,000 EUR AXA Bank Europe SCF, 0.13%, 14/03/2022 201 0.20200,000 EUR Banque Federative du Credit Mutuel SA, 0.50%, 16/11/2022 203 0.21200,000 EUR Banque Federative du Credit Mutuel SA, 0.75%, 15/06/2023 205 0.21300,000 EUR Banque Federative du Credit Mutuel SA, 0.13%, 05/02/2024 303 0.31100,000 EUR Banque Federative du Credit Mutuel SA, 0.75%, 08/06/2026 104 0.11200,000 EUR BNP Paribas SA, FRN, 0.50%, 15/07/2025 203 0.21400,000 EUR BNP Paribas SA, FRN, 1.13%, 15/01/2032 403 0.41400,000 EUR BPCE SA, 0.63%, 26/09/2023 409 0.41200,000 EUR BPCE SA, 1.00%, 15/07/2024 208 0.21100,000 EUR BPCE SA, 0.13%, 04/12/2024 101 0.10100,000 EUR BPCE SA, 1.00%, 01/04/2025 103 0.10100,000 EUR BPCE SFH SA, 0.50%, 11/10/2022 102 0.10100,000 EUR BPCE SFH SA, 0.38%, 21/02/2024 102 0.10100,000 EUR BPCE SFH SA, 0.01%, 27/05/2030 100 0.10
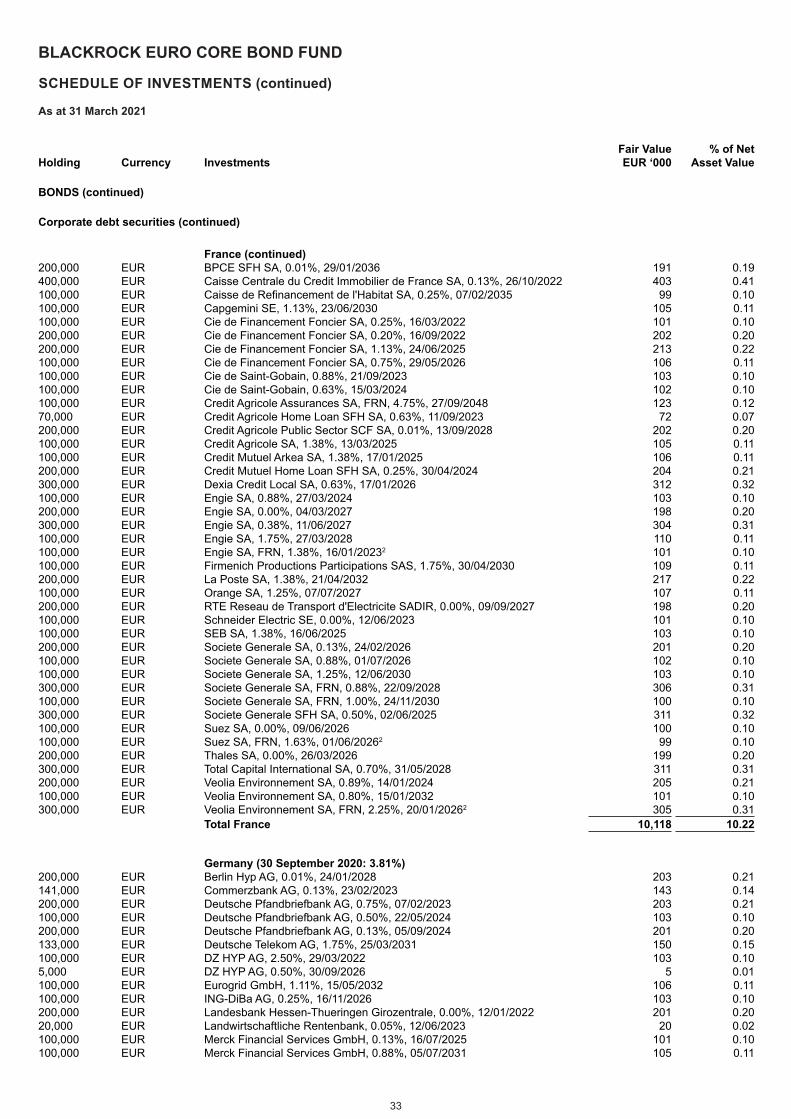
33
BLACKROCK EURO CORE BOND FUND
SCHEDULE OF INVESTMENTS (continued)
As at 31 March 2021
Holding Currency Investments Fair Value EUR ‘000
% of Net Asset Value
BONDS (continued)
Corporate debt securities (continued)
France (continued) 200,000 EUR BPCE SFH SA, 0.01%, 29/01/2036 191 0.19400,000 EUR Caisse Centrale du Credit Immobilier de France SA, 0.13%, 26/10/2022 403 0.41100,000 EUR Caisse de Refinancement de l'Habitat SA, 0.25%, 07/02/2035 99 0.10100,000 EUR Capgemini SE, 1.13%, 23/06/2030 105 0.11100,000 EUR Cie de Financement Foncier SA, 0.25%, 16/03/2022 101 0.10200,000 EUR Cie de Financement Foncier SA, 0.20%, 16/09/2022 202 0.20200,000 EUR Cie de Financement Foncier SA, 1.13%, 24/06/2025 213 0.22100,000 EUR Cie de Financement Foncier SA, 0.75%, 29/05/2026 106 0.11100,000 EUR Cie de Saint-Gobain, 0.88%, 21/09/2023 103 0.10100,000 EUR Cie de Saint-Gobain, 0.63%, 15/03/2024 102 0.10100,000 EUR Credit Agricole Assurances SA, FRN, 4.75%, 27/09/2048 123 0.1270,000 EUR Credit Agricole Home Loan SFH SA, 0.63%, 11/09/2023 72 0.07200,000 EUR Credit Agricole Public Sector SCF SA, 0.01%, 13/09/2028 202 0.20100,000 EUR Credit Agricole SA, 1.38%, 13/03/2025 105 0.11100,000 EUR Credit Mutuel Arkea SA, 1.38%, 17/01/2025 106 0.11200,000 EUR Credit Mutuel Home Loan SFH SA, 0.25%, 30/04/2024 204 0.21300,000 EUR Dexia Credit Local SA, 0.63%, 17/01/2026 312 0.32100,000 EUR Engie SA, 0.88%, 27/03/2024 103 0.10200,000 EUR Engie SA, 0.00%, 04/03/2027 198 0.20300,000 EUR Engie SA, 0.38%, 11/06/2027 304 0.31100,000 EUR Engie SA, 1.75%, 27/03/2028 110 0.11100,000 EUR Engie SA, FRN, 1.38%, 16/01/20232 101 0.10100,000 EUR Firmenich Productions Participations SAS, 1.75%, 30/04/2030 109 0.11200,000 EUR La Poste SA, 1.38%, 21/04/2032 217 0.22100,000 EUR Orange SA, 1.25%, 07/07/2027 107 0.11200,000 EUR RTE Reseau de Transport d'Electricite SADIR, 0.00%, 09/09/2027 198 0.20100,000 EUR Schneider Electric SE, 0.00%, 12/06/2023 101 0.10100,000 EUR SEB SA, 1.38%, 16/06/2025 103 0.10200,000 EUR Societe Generale SA, 0.13%, 24/02/2026 201 0.20100,000 EUR Societe Generale SA, 0.88%, 01/07/2026 102 0.10100,000 EUR Societe Generale SA, 1.25%, 12/06/2030 103 0.10300,000 EUR Societe Generale SA, FRN, 0.88%, 22/09/2028 306 0.31100,000 EUR Societe Generale SA, FRN, 1.00%, 24/11/2030 100 0.10300,000 EUR Societe Generale SFH SA, 0.50%, 02/06/2025 311 0.32100,000 EUR Suez SA, 0.00%, 09/06/2026 100 0.10100,000 EUR Suez SA, FRN, 1.63%, 01/06/20262 99 0.10200,000 EUR Thales SA, 0.00%, 26/03/2026 199 0.20300,000 EUR Total Capital International SA, 0.70%, 31/05/2028 311 0.31200,000 EUR Veolia Environnement SA, 0.89%, 14/01/2024 205 0.21100,000 EUR Veolia Environnement SA, 0.80%, 15/01/2032 101 0.10300,000 EUR Veolia Environnement SA, FRN, 2.25%, 20/01/20262 305 0.31
Total France 10,118 10.22
Germany (30 September 2020: 3.81%)200,000 EUR Berlin Hyp AG, 0.01%, 24/01/2028 203 0.21141,000 EUR Commerzbank AG, 0.13%, 23/02/2023 143 0.14200,000 EUR Deutsche Pfandbriefbank AG, 0.75%, 07/02/2023 203 0.21100,000 EUR Deutsche Pfandbriefbank AG, 0.50%, 22/05/2024 103 0.10200,000 EUR Deutsche Pfandbriefbank AG, 0.13%, 05/09/2024 201 0.20133,000 EUR Deutsche Telekom AG, 1.75%, 25/03/2031 150 0.15100,000 EUR DZ HYP AG, 2.50%, 29/03/2022 103 0.105,000 EUR DZ HYP AG, 0.50%, 30/09/2026 5 0.01100,000 EUR Eurogrid GmbH, 1.11%, 15/05/2032 106 0.11100,000 EUR ING-DiBa AG, 0.25%, 16/11/2026 103 0.10200,000 EUR Landesbank Hessen-Thueringen Girozentrale, 0.00%, 12/01/2022 201 0.2020,000 EUR Landwirtschaftliche Rentenbank, 0.05%, 12/06/2023 20 0.02100,000 EUR Merck Financial Services GmbH, 0.13%, 16/07/2025 101 0.10100,000 EUR Merck Financial Services GmbH, 0.88%, 05/07/2031 105 0.11
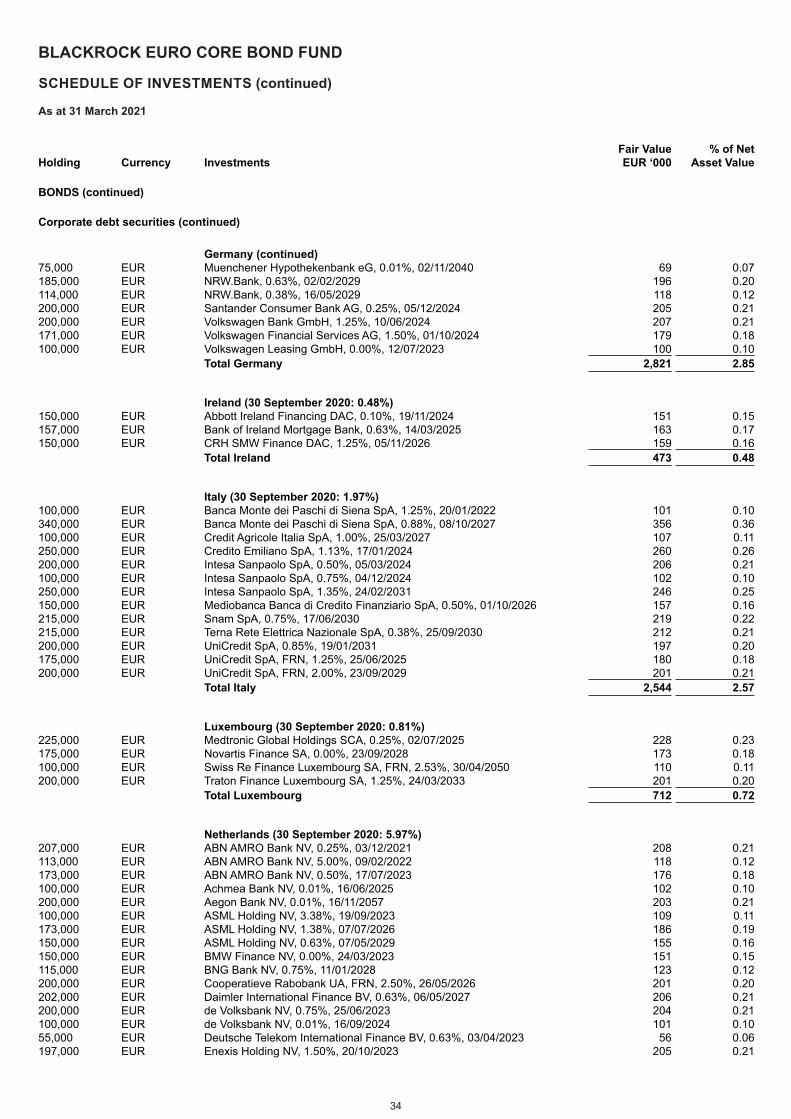
34
BLACKROCK EURO CORE BOND FUND
SCHEDULE OF INVESTMENTS (continued)
As at 31 March 2021
Holding Currency Investments Fair Value EUR ‘000
% of Net Asset Value
BONDS (continued)
Corporate debt securities (continued)
Germany (continued) 75,000 EUR Muenchener Hypothekenbank eG, 0.01%, 02/11/2040 69 0.07185,000 EUR NRW.Bank, 0.63%, 02/02/2029 196 0.20114,000 EUR NRW.Bank, 0.38%, 16/05/2029 118 0.12200,000 EUR Santander Consumer Bank AG, 0.25%, 05/12/2024 205 0.21200,000 EUR Volkswagen Bank GmbH, 1.25%, 10/06/2024 207 0.21171,000 EUR Volkswagen Financial Services AG, 1.50%, 01/10/2024 179 0.18100,000 EUR Volkswagen Leasing GmbH, 0.00%, 12/07/2023 100 0.10
Total Germany 2,821 2.85
Ireland (30 September 2020: 0.48%)150,000 EUR Abbott Ireland Financing DAC, 0.10%, 19/11/2024 151 0.15157,000 EUR Bank of Ireland Mortgage Bank, 0.63%, 14/03/2025 163 0.17150,000 EUR CRH SMW Finance DAC, 1.25%, 05/11/2026 159 0.16
Total Ireland 473 0.48
Italy (30 September 2020: 1.97%)100,000 EUR Banca Monte dei Paschi di Siena SpA, 1.25%, 20/01/2022 101 0.10340,000 EUR Banca Monte dei Paschi di Siena SpA, 0.88%, 08/10/2027 356 0.36100,000 EUR Credit Agricole Italia SpA, 1.00%, 25/03/2027 107 0.11250,000 EUR Credito Emiliano SpA, 1.13%, 17/01/2024 260 0.26200,000 EUR Intesa Sanpaolo SpA, 0.50%, 05/03/2024 206 0.21100,000 EUR Intesa Sanpaolo SpA, 0.75%, 04/12/2024 102 0.10250,000 EUR Intesa Sanpaolo SpA, 1.35%, 24/02/2031 246 0.25150,000 EUR Mediobanca Banca di Credito Finanziario SpA, 0.50%, 01/10/2026 157 0.16215,000 EUR Snam SpA, 0.75%, 17/06/2030 219 0.22215,000 EUR Terna Rete Elettrica Nazionale SpA, 0.38%, 25/09/2030 212 0.21200,000 EUR UniCredit SpA, 0.85%, 19/01/2031 197 0.20175,000 EUR UniCredit SpA, FRN, 1.25%, 25/06/2025 180 0.18200,000 EUR UniCredit SpA, FRN, 2.00%, 23/09/2029 201 0.21
Total Italy 2,544 2.57
Luxembourg (30 September 2020: 0.81%)225,000 EUR Medtronic Global Holdings SCA, 0.25%, 02/07/2025 228 0.23175,000 EUR Novartis Finance SA, 0.00%, 23/09/2028 173 0.18100,000 EUR Swiss Re Finance Luxembourg SA, FRN, 2.53%, 30/04/2050 110 0.11200,000 EUR Traton Finance Luxembourg SA, 1.25%, 24/03/2033 201 0.20
Total Luxembourg 712 0.72
Netherlands (30 September 2020: 5.97%)207,000 EUR ABN AMRO Bank NV, 0.25%, 03/12/2021 208 0.21113,000 EUR ABN AMRO Bank NV, 5.00%, 09/02/2022 118 0.12173,000 EUR ABN AMRO Bank NV, 0.50%, 17/07/2023 176 0.18100,000 EUR Achmea Bank NV, 0.01%, 16/06/2025 102 0.10200,000 EUR Aegon Bank NV, 0.01%, 16/11/2057 203 0.21100,000 EUR ASML Holding NV, 3.38%, 19/09/2023 109 0.11173,000 EUR ASML Holding NV, 1.38%, 07/07/2026 186 0.19150,000 EUR ASML Holding NV, 0.63%, 07/05/2029 155 0.16150,000 EUR BMW Finance NV, 0.00%, 24/03/2023 151 0.15115,000 EUR BNG Bank NV, 0.75%, 11/01/2028 123 0.12200,000 EUR Cooperatieve Rabobank UA, FRN, 2.50%, 26/05/2026 201 0.20202,000 EUR Daimler International Finance BV, 0.63%, 06/05/2027 206 0.21200,000 EUR de Volksbank NV, 0.75%, 25/06/2023 204 0.21100,000 EUR de Volksbank NV, 0.01%, 16/09/2024 101 0.1055,000 EUR Deutsche Telekom International Finance BV, 0.63%, 03/04/2023 56 0.06197,000 EUR Enexis Holding NV, 1.50%, 20/10/2023 205 0.21
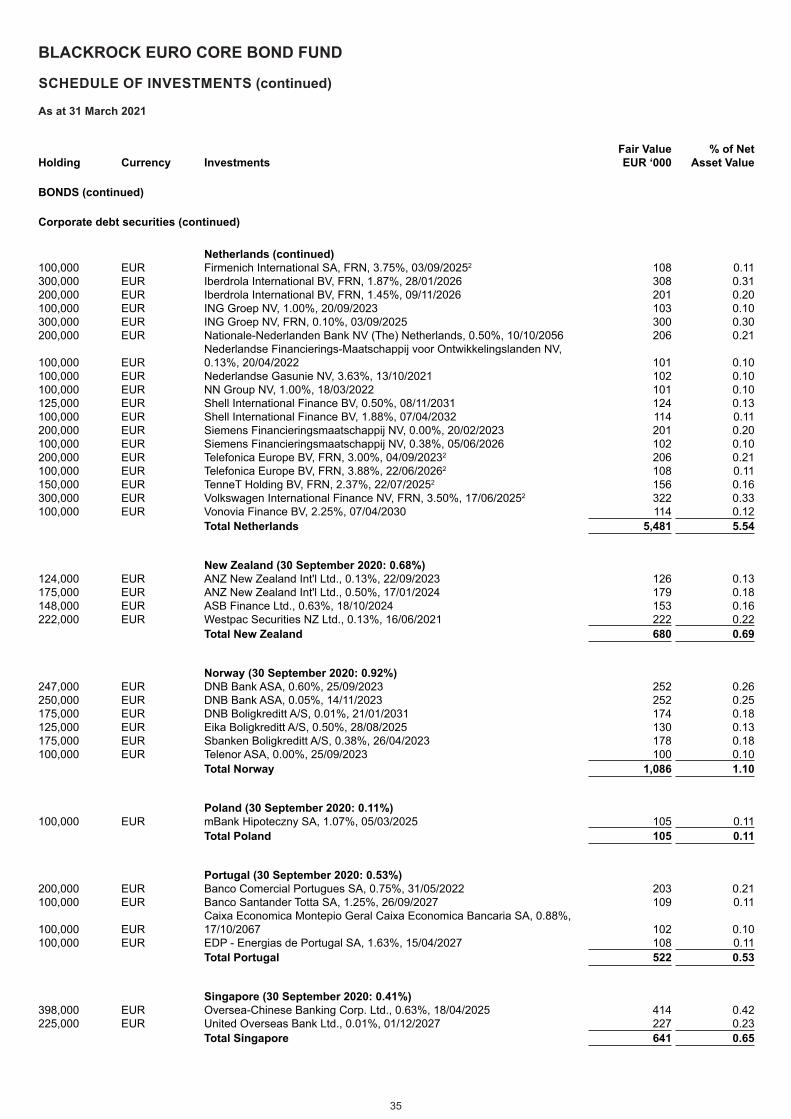
35
BLACKROCK EURO CORE BOND FUND
SCHEDULE OF INVESTMENTS (continued)
As at 31 March 2021
Holding Currency Investments Fair Value EUR ‘000
% of Net Asset Value
BONDS (continued)
Corporate debt securities (continued)
Netherlands (continued) 100,000 EUR Firmenich International SA, FRN, 3.75%, 03/09/20252 108 0.11300,000 EUR Iberdrola International BV, FRN, 1.87%, 28/01/2026 308 0.31200,000 EUR Iberdrola International BV, FRN, 1.45%, 09/11/2026 201 0.20100,000 EUR ING Groep NV, 1.00%, 20/09/2023 103 0.10300,000 EUR ING Groep NV, FRN, 0.10%, 03/09/2025 300 0.30200,000 EUR Nationale-Nederlanden Bank NV (The) Netherlands, 0.50%, 10/10/2056 206 0.21
100,000 EURNederlandse Financierings-Maatschappij voor Ontwikkelingslanden NV, 0.13%, 20/04/2022 101 0.10
100,000 EUR Nederlandse Gasunie NV, 3.63%, 13/10/2021 102 0.10100,000 EUR NN Group NV, 1.00%, 18/03/2022 101 0.10125,000 EUR Shell International Finance BV, 0.50%, 08/11/2031 124 0.13100,000 EUR Shell International Finance BV, 1.88%, 07/04/2032 114 0.11200,000 EUR Siemens Financieringsmaatschappij NV, 0.00%, 20/02/2023 201 0.20100,000 EUR Siemens Financieringsmaatschappij NV, 0.38%, 05/06/2026 102 0.10200,000 EUR Telefonica Europe BV, FRN, 3.00%, 04/09/20232 206 0.21100,000 EUR Telefonica Europe BV, FRN, 3.88%, 22/06/20262 108 0.11150,000 EUR TenneT Holding BV, FRN, 2.37%, 22/07/20252 156 0.16300,000 EUR Volkswagen International Finance NV, FRN, 3.50%, 17/06/20252 322 0.33100,000 EUR Vonovia Finance BV, 2.25%, 07/04/2030 114 0.12
Total Netherlands 5,481 5.54
New Zealand (30 September 2020: 0.68%)124,000 EUR ANZ New Zealand Int'l Ltd., 0.13%, 22/09/2023 126 0.13175,000 EUR ANZ New Zealand Int'l Ltd., 0.50%, 17/01/2024 179 0.18148,000 EUR ASB Finance Ltd., 0.63%, 18/10/2024 153 0.16222,000 EUR Westpac Securities NZ Ltd., 0.13%, 16/06/2021 222 0.22
Total New Zealand 680 0.69
Norway (30 September 2020: 0.92%)247,000 EUR DNB Bank ASA, 0.60%, 25/09/2023 252 0.26250,000 EUR DNB Bank ASA, 0.05%, 14/11/2023 252 0.25175,000 EUR DNB Boligkreditt A/S, 0.01%, 21/01/2031 174 0.18125,000 EUR Eika Boligkreditt A/S, 0.50%, 28/08/2025 130 0.13175,000 EUR Sbanken Boligkreditt A/S, 0.38%, 26/04/2023 178 0.18100,000 EUR Telenor ASA, 0.00%, 25/09/2023 100 0.10
Total Norway 1,086 1.10
Poland (30 September 2020: 0.11%)100,000 EUR mBank Hipoteczny SA, 1.07%, 05/03/2025 105 0.11
Total Poland 105 0.11
Portugal (30 September 2020: 0.53%)200,000 EUR Banco Comercial Portugues SA, 0.75%, 31/05/2022 203 0.21100,000 EUR Banco Santander Totta SA, 1.25%, 26/09/2027 109 0.11
100,000 EURCaixa Economica Montepio Geral Caixa Economica Bancaria SA, 0.88%, 17/10/2067 102 0.10
100,000 EUR EDP - Energias de Portugal SA, 1.63%, 15/04/2027 108 0.11Total Portugal 522 0.53
Singapore (30 September 2020: 0.41%)398,000 EUR Oversea-Chinese Banking Corp. Ltd., 0.63%, 18/04/2025 414 0.42225,000 EUR United Overseas Bank Ltd., 0.01%, 01/12/2027 227 0.23
Total Singapore 641 0.65
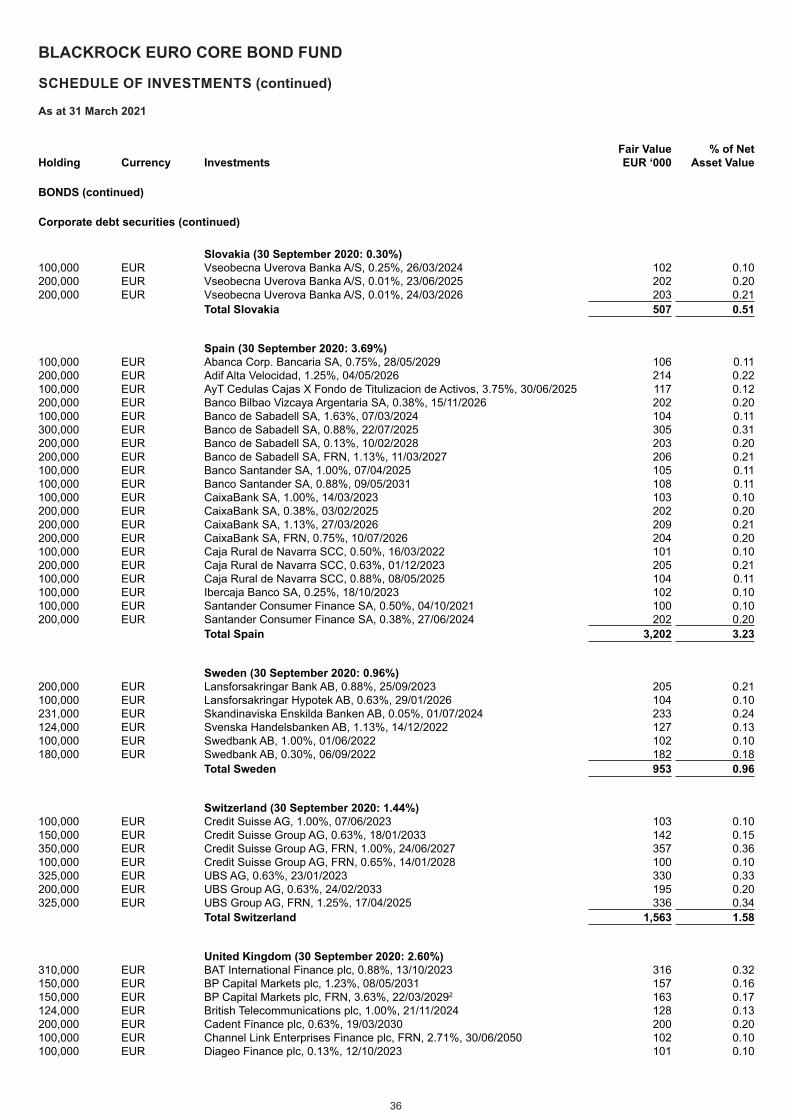
36
BLACKROCK EURO CORE BOND FUND
SCHEDULE OF INVESTMENTS (continued)
As at 31 March 2021
Holding Currency Investments Fair Value EUR ‘000
% of Net Asset Value
BONDS (continued)
Corporate debt securities (continued)
Slovakia (30 September 2020: 0.30%)100,000 EUR Vseobecna Uverova Banka A/S, 0.25%, 26/03/2024 102 0.10200,000 EUR Vseobecna Uverova Banka A/S, 0.01%, 23/06/2025 202 0.20200,000 EUR Vseobecna Uverova Banka A/S, 0.01%, 24/03/2026 203 0.21
Total Slovakia 507 0.51
Spain (30 September 2020: 3.69%)100,000 EUR Abanca Corp. Bancaria SA, 0.75%, 28/05/2029 106 0.11200,000 EUR Adif Alta Velocidad, 1.25%, 04/05/2026 214 0.22100,000 EUR AyT Cedulas Cajas X Fondo de Titulizacion de Activos, 3.75%, 30/06/2025 117 0.12200,000 EUR Banco Bilbao Vizcaya Argentaria SA, 0.38%, 15/11/2026 202 0.20100,000 EUR Banco de Sabadell SA, 1.63%, 07/03/2024 104 0.11300,000 EUR Banco de Sabadell SA, 0.88%, 22/07/2025 305 0.31200,000 EUR Banco de Sabadell SA, 0.13%, 10/02/2028 203 0.20200,000 EUR Banco de Sabadell SA, FRN, 1.13%, 11/03/2027 206 0.21100,000 EUR Banco Santander SA, 1.00%, 07/04/2025 105 0.11100,000 EUR Banco Santander SA, 0.88%, 09/05/2031 108 0.11100,000 EUR CaixaBank SA, 1.00%, 14/03/2023 103 0.10200,000 EUR CaixaBank SA, 0.38%, 03/02/2025 202 0.20200,000 EUR CaixaBank SA, 1.13%, 27/03/2026 209 0.21200,000 EUR CaixaBank SA, FRN, 0.75%, 10/07/2026 204 0.20100,000 EUR Caja Rural de Navarra SCC, 0.50%, 16/03/2022 101 0.10200,000 EUR Caja Rural de Navarra SCC, 0.63%, 01/12/2023 205 0.21100,000 EUR Caja Rural de Navarra SCC, 0.88%, 08/05/2025 104 0.11100,000 EUR Ibercaja Banco SA, 0.25%, 18/10/2023 102 0.10100,000 EUR Santander Consumer Finance SA, 0.50%, 04/10/2021 100 0.10200,000 EUR Santander Consumer Finance SA, 0.38%, 27/06/2024 202 0.20
Total Spain 3,202 3.23
Sweden (30 September 2020: 0.96%)200,000 EUR Lansforsakringar Bank AB, 0.88%, 25/09/2023 205 0.21100,000 EUR Lansforsakringar Hypotek AB, 0.63%, 29/01/2026 104 0.10231,000 EUR Skandinaviska Enskilda Banken AB, 0.05%, 01/07/2024 233 0.24124,000 EUR Svenska Handelsbanken AB, 1.13%, 14/12/2022 127 0.13100,000 EUR Swedbank AB, 1.00%, 01/06/2022 102 0.10180,000 EUR Swedbank AB, 0.30%, 06/09/2022 182 0.18
Total Sweden 953 0.96
Switzerland (30 September 2020: 1.44%)100,000 EUR Credit Suisse AG, 1.00%, 07/06/2023 103 0.10150,000 EUR Credit Suisse Group AG, 0.63%, 18/01/2033 142 0.15350,000 EUR Credit Suisse Group AG, FRN, 1.00%, 24/06/2027 357 0.36100,000 EUR Credit Suisse Group AG, FRN, 0.65%, 14/01/2028 100 0.10325,000 EUR UBS AG, 0.63%, 23/01/2023 330 0.33200,000 EUR UBS Group AG, 0.63%, 24/02/2033 195 0.20325,000 EUR UBS Group AG, FRN, 1.25%, 17/04/2025 336 0.34
Total Switzerland 1,563 1.58
United Kingdom (30 September 2020: 2.60%)310,000 EUR BAT International Finance plc, 0.88%, 13/10/2023 316 0.32150,000 EUR BP Capital Markets plc, 1.23%, 08/05/2031 157 0.16150,000 EUR BP Capital Markets plc, FRN, 3.63%, 22/03/20292 163 0.17124,000 EUR British Telecommunications plc, 1.00%, 21/11/2024 128 0.13200,000 EUR Cadent Finance plc, 0.63%, 19/03/2030 200 0.20100,000 EUR Channel Link Enterprises Finance plc, FRN, 2.71%, 30/06/2050 102 0.10100,000 EUR Diageo Finance plc, 0.13%, 12/10/2023 101 0.10
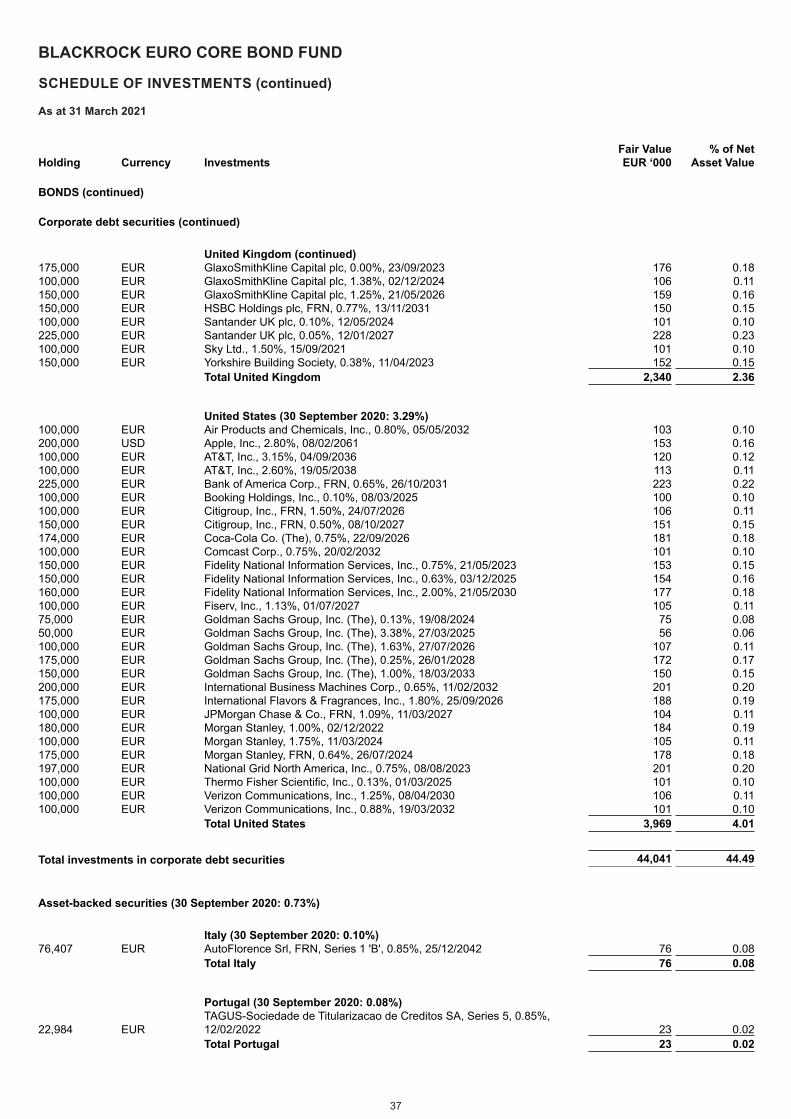
37
BLACKROCK EURO CORE BOND FUND
SCHEDULE OF INVESTMENTS (continued)
As at 31 March 2021
Holding Currency Investments Fair Value EUR ‘000
% of Net Asset Value
BONDS (continued)
Corporate debt securities (continued)
United Kingdom (continued) 175,000 EUR GlaxoSmithKline Capital plc, 0.00%, 23/09/2023 176 0.18100,000 EUR GlaxoSmithKline Capital plc, 1.38%, 02/12/2024 106 0.11150,000 EUR GlaxoSmithKline Capital plc, 1.25%, 21/05/2026 159 0.16150,000 EUR HSBC Holdings plc, FRN, 0.77%, 13/11/2031 150 0.15100,000 EUR Santander UK plc, 0.10%, 12/05/2024 101 0.10225,000 EUR Santander UK plc, 0.05%, 12/01/2027 228 0.23100,000 EUR Sky Ltd., 1.50%, 15/09/2021 101 0.10150,000 EUR Yorkshire Building Society, 0.38%, 11/04/2023 152 0.15
Total United Kingdom 2,340 2.36
United States (30 September 2020: 3.29%)100,000 EUR Air Products and Chemicals, Inc., 0.80%, 05/05/2032 103 0.10200,000 USD Apple, Inc., 2.80%, 08/02/2061 153 0.16100,000 EUR AT&T, Inc., 3.15%, 04/09/2036 120 0.12100,000 EUR AT&T, Inc., 2.60%, 19/05/2038 113 0.11225,000 EUR Bank of America Corp., FRN, 0.65%, 26/10/2031 223 0.22100,000 EUR Booking Holdings, Inc., 0.10%, 08/03/2025 100 0.10100,000 EUR Citigroup, Inc., FRN, 1.50%, 24/07/2026 106 0.11150,000 EUR Citigroup, Inc., FRN, 0.50%, 08/10/2027 151 0.15174,000 EUR Coca-Cola Co. (The), 0.75%, 22/09/2026 181 0.18100,000 EUR Comcast Corp., 0.75%, 20/02/2032 101 0.10150,000 EUR Fidelity National Information Services, Inc., 0.75%, 21/05/2023 153 0.15150,000 EUR Fidelity National Information Services, Inc., 0.63%, 03/12/2025 154 0.16160,000 EUR Fidelity National Information Services, Inc., 2.00%, 21/05/2030 177 0.18100,000 EUR Fiserv, Inc., 1.13%, 01/07/2027 105 0.1175,000 EUR Goldman Sachs Group, Inc. (The), 0.13%, 19/08/2024 75 0.0850,000 EUR Goldman Sachs Group, Inc. (The), 3.38%, 27/03/2025 56 0.06100,000 EUR Goldman Sachs Group, Inc. (The), 1.63%, 27/07/2026 107 0.11175,000 EUR Goldman Sachs Group, Inc. (The), 0.25%, 26/01/2028 172 0.17150,000 EUR Goldman Sachs Group, Inc. (The), 1.00%, 18/03/2033 150 0.15200,000 EUR International Business Machines Corp., 0.65%, 11/02/2032 201 0.20175,000 EUR International Flavors & Fragrances, Inc., 1.80%, 25/09/2026 188 0.19100,000 EUR JPMorgan Chase & Co., FRN, 1.09%, 11/03/2027 104 0.11180,000 EUR Morgan Stanley, 1.00%, 02/12/2022 184 0.19100,000 EUR Morgan Stanley, 1.75%, 11/03/2024 105 0.11175,000 EUR Morgan Stanley, FRN, 0.64%, 26/07/2024 178 0.18197,000 EUR National Grid North America, Inc., 0.75%, 08/08/2023 201 0.20100,000 EUR Thermo Fisher Scientific, Inc., 0.13%, 01/03/2025 101 0.10100,000 EUR Verizon Communications, Inc., 1.25%, 08/04/2030 106 0.11100,000 EUR Verizon Communications, Inc., 0.88%, 19/03/2032 101 0.10
Total United States 3,969 4.01
Total investments in corporate debt securities 44,041 44.49
Asset-backed securities (30 September 2020: 0.73%)
Italy (30 September 2020: 0.10%)76,407 EUR AutoFlorence Srl, FRN, Series 1 'B', 0.85%, 25/12/2042 76 0.08
Total Italy 76 0.08
Portugal (30 September 2020: 0.08%)
22,984 EURTAGUS-Sociedade de Titularizacao de Creditos SA, Series 5, 0.85%, 12/02/2022 23 0.02Total Portugal 23 0.02
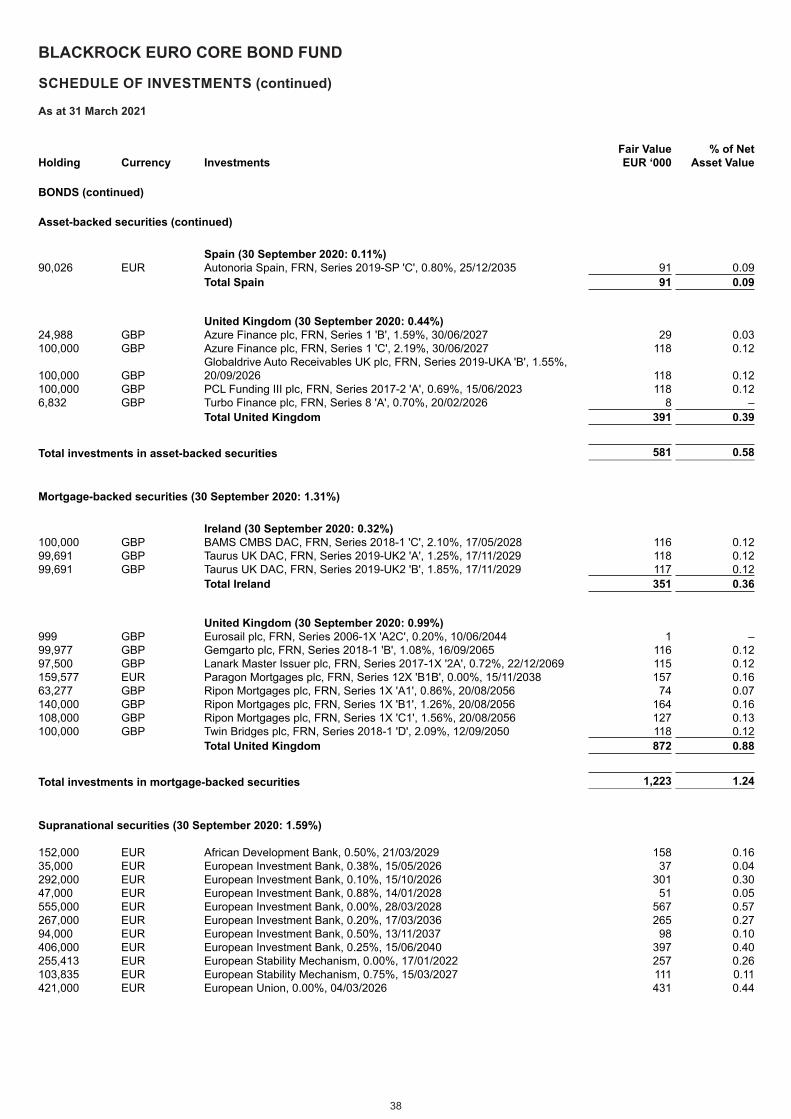
38
BLACKROCK EURO CORE BOND FUND
SCHEDULE OF INVESTMENTS (continued)
As at 31 March 2021
Holding Currency Investments Fair Value EUR ‘000
% of Net Asset Value
BONDS (continued)
Asset-backed securities (continued)
Spain (30 September 2020: 0.11%)90,026 EUR Autonoria Spain, FRN, Series 2019-SP 'C', 0.80%, 25/12/2035 91 0.09
Total Spain 91 0.09
United Kingdom (30 September 2020: 0.44%)24,988 GBP Azure Finance plc, FRN, Series 1 'B', 1.59%, 30/06/2027 29 0.03100,000 GBP Azure Finance plc, FRN, Series 1 'C', 2.19%, 30/06/2027 118 0.12
100,000 GBPGlobaldrive Auto Receivables UK plc, FRN, Series 2019-UKA 'B', 1.55%, 20/09/2026 118 0.12
100,000 GBP PCL Funding III plc, FRN, Series 2017-2 'A', 0.69%, 15/06/2023 118 0.126,832 GBP Turbo Finance plc, FRN, Series 8 'A', 0.70%, 20/02/2026 8 –
Total United Kingdom 391 0.39
Total investments in asset-backed securities 581 0.58
Mortgage-backed securities (30 September 2020: 1.31%)
Ireland (30 September 2020: 0.32%)100,000 GBP BAMS CMBS DAC, FRN, Series 2018-1 'C', 2.10%, 17/05/2028 116 0.1299,691 GBP Taurus UK DAC, FRN, Series 2019-UK2 'A', 1.25%, 17/11/2029 118 0.1299,691 GBP Taurus UK DAC, FRN, Series 2019-UK2 'B', 1.85%, 17/11/2029 117 0.12
Total Ireland 351 0.36
United Kingdom (30 September 2020: 0.99%)999 GBP Eurosail plc, FRN, Series 2006-1X 'A2C', 0.20%, 10/06/2044 1 –99,977 GBP Gemgarto plc, FRN, Series 2018-1 'B', 1.08%, 16/09/2065 116 0.1297,500 GBP Lanark Master Issuer plc, FRN, Series 2017-1X '2A', 0.72%, 22/12/2069 115 0.12159,577 EUR Paragon Mortgages plc, FRN, Series 12X 'B1B', 0.00%, 15/11/2038 157 0.1663,277 GBP Ripon Mortgages plc, FRN, Series 1X 'A1', 0.86%, 20/08/2056 74 0.07140,000 GBP Ripon Mortgages plc, FRN, Series 1X 'B1', 1.26%, 20/08/2056 164 0.16108,000 GBP Ripon Mortgages plc, FRN, Series 1X 'C1', 1.56%, 20/08/2056 127 0.13100,000 GBP Twin Bridges plc, FRN, Series 2018-1 'D', 2.09%, 12/09/2050 118 0.12
Total United Kingdom 872 0.88
Total investments in mortgage-backed securities 1,223 1.24
Supranational securities (30 September 2020: 1.59%) 152,000 EUR African Development Bank, 0.50%, 21/03/2029 158 0.1635,000 EUR European Investment Bank, 0.38%, 15/05/2026 37 0.04292,000 EUR European Investment Bank, 0.10%, 15/10/2026 301 0.3047,000 EUR European Investment Bank, 0.88%, 14/01/2028 51 0.05555,000 EUR European Investment Bank, 0.00%, 28/03/2028 567 0.57267,000 EUR European Investment Bank, 0.20%, 17/03/2036 265 0.2794,000 EUR European Investment Bank, 0.50%, 13/11/2037 98 0.10406,000 EUR European Investment Bank, 0.25%, 15/06/2040 397 0.40255,413 EUR European Stability Mechanism, 0.00%, 17/01/2022 257 0.26103,835 EUR European Stability Mechanism, 0.75%, 15/03/2027 111 0.11421,000 EUR European Union, 0.00%, 04/03/2026 431 0.44
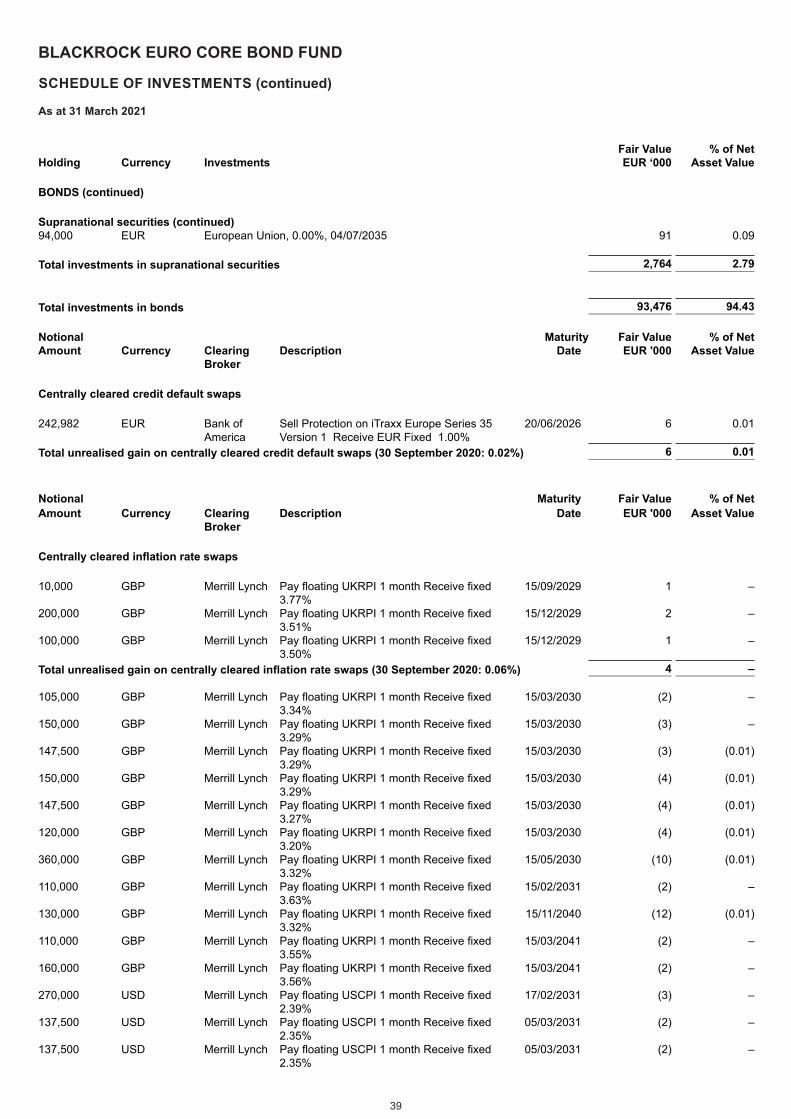
39
BLACKROCK EURO CORE BOND FUND
SCHEDULE OF INVESTMENTS (continued)
As at 31 March 2021
Holding Currency Investments Fair Value EUR ‘000
% of Net Asset Value
BONDS (continued)
Supranational securities (continued) 94,000 EUR European Union, 0.00%, 04/07/2035 91 0.09 Total investments in supranational securities 2,764 2.79 Total investments in bonds 93,476 94.43 Notional Maturity Fair Value % of Net Amount Currency Clearing
BrokerDescription Date EUR '000 Asset Value
Centrally cleared credit default swaps
242,982 EUR Bank of America
Sell Protection on iTraxx Europe Series 35 Version 1 Receive EUR Fixed 1.00%
20/06/2026 6 0.01
Total unrealised gain on centrally cleared credit default swaps (30 September 2020: 0.02%) 6 0.01 Notional Maturity Fair Value % of Net Amount Currency Clearing
BrokerDescription Date EUR '000 Asset Value
Centrally cleared inflation rate swaps
10,000 GBP Merrill Lynch Pay floating UKRPI 1 month Receive fixed 3.77%
15/09/2029 1 –
200,000 GBP Merrill Lynch Pay floating UKRPI 1 month Receive fixed 3.51%
15/12/2029 2 –
100,000 GBP Merrill Lynch Pay floating UKRPI 1 month Receive fixed 3.50%
15/12/2029 1 –
Total unrealised gain on centrally cleared inflation rate swaps (30 September 2020: 0.06%) 4 – 105,000 GBP Merrill Lynch Pay floating UKRPI 1 month Receive fixed
3.34%15/03/2030 (2) –
150,000 GBP Merrill Lynch Pay floating UKRPI 1 month Receive fixed 3.29%
15/03/2030 (3) –
147,500 GBP Merrill Lynch Pay floating UKRPI 1 month Receive fixed 3.29%
15/03/2030 (3) (0.01)
150,000 GBP Merrill Lynch Pay floating UKRPI 1 month Receive fixed 3.29%
15/03/2030 (4) (0.01)
147,500 GBP Merrill Lynch Pay floating UKRPI 1 month Receive fixed 3.27%
15/03/2030 (4) (0.01)
120,000 GBP Merrill Lynch Pay floating UKRPI 1 month Receive fixed 3.20%
15/03/2030 (4) (0.01)
360,000 GBP Merrill Lynch Pay floating UKRPI 1 month Receive fixed 3.32%
15/05/2030 (10) (0.01)
110,000 GBP Merrill Lynch Pay floating UKRPI 1 month Receive fixed 3.63%
15/02/2031 (2) –
130,000 GBP Merrill Lynch Pay floating UKRPI 1 month Receive fixed 3.32%
15/11/2040 (12) (0.01)
110,000 GBP Merrill Lynch Pay floating UKRPI 1 month Receive fixed 3.55%
15/03/2041 (2) –
160,000 GBP Merrill Lynch Pay floating UKRPI 1 month Receive fixed 3.56%
15/03/2041 (2) –
270,000 USD Merrill Lynch Pay floating USCPI 1 month Receive fixed 2.39%
17/02/2031 (3) –
137,500 USD Merrill Lynch Pay floating USCPI 1 month Receive fixed 2.35%
05/03/2031 (2) –
137,500 USD Merrill Lynch Pay floating USCPI 1 month Receive fixed 2.35%
05/03/2031 (2) –
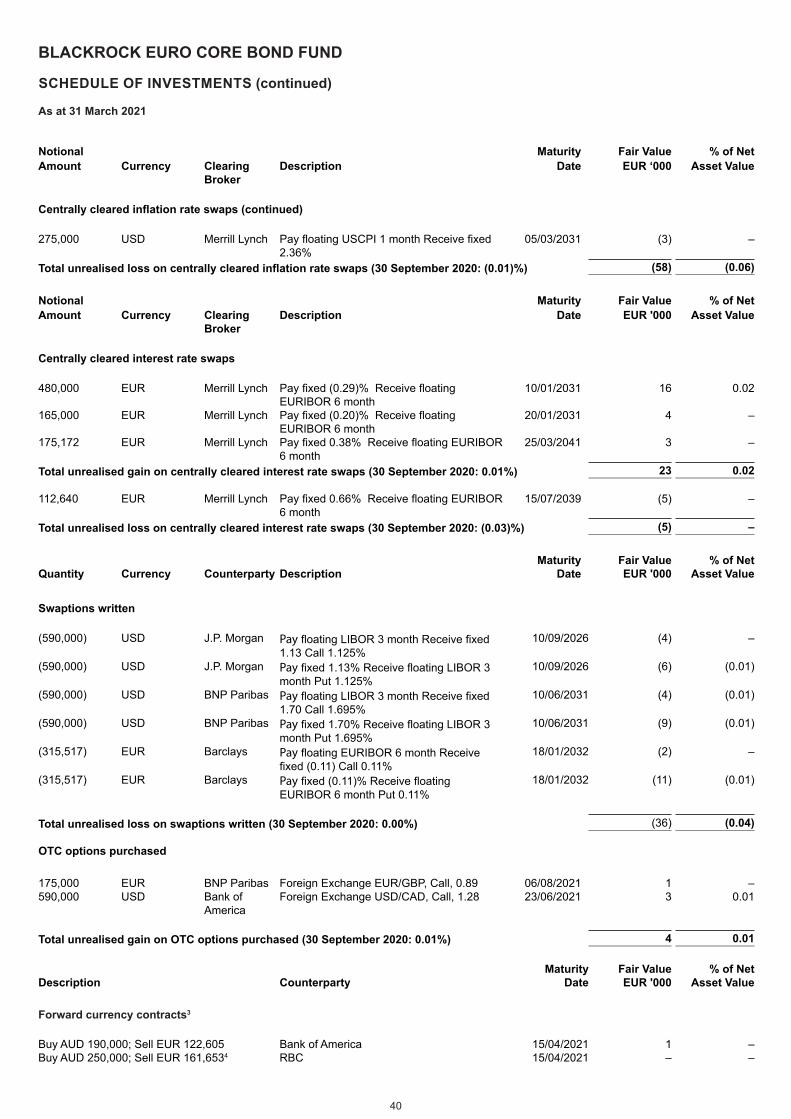
40
BLACKROCK EURO CORE BOND FUND
SCHEDULE OF INVESTMENTS (continued)
As at 31 March 2021
Notional Maturity Fair Value % of Net Amount Currency Clearing
BrokerDescription Date EUR ‘000
Asset Value
Centrally cleared inflation rate swaps (continued)
275,000 USD Merrill Lynch Pay floating USCPI 1 month Receive fixed 2.36%
05/03/2031 (3) –
Total unrealised loss on centrally cleared inflation rate swaps (30 September 2020: (0.01)%) (58) (0.06) Notional Maturity Fair Value % of Net Amount Currency Clearing
BrokerDescription Date EUR '000 Asset Value
Centrally cleared interest rate swaps
480,000 EUR Merrill Lynch Pay fixed (0.29)% Receive floating EURIBOR 6 month
10/01/2031 16 0.02
165,000 EUR Merrill Lynch Pay fixed (0.20)% Receive floating EURIBOR 6 month
20/01/2031 4 –
175,172 EUR Merrill Lynch Pay fixed 0.38% Receive floating EURIBOR 6 month
25/03/2041 3 –
Total unrealised gain on centrally cleared interest rate swaps (30 September 2020: 0.01%) 23 0.02 112,640 EUR Merrill Lynch Pay fixed 0.66% Receive floating EURIBOR
6 month15/07/2039 (5) –
Total unrealised loss on centrally cleared interest rate swaps (30 September 2020: (0.03)%) (5) –
Maturity Fair Value % of Net Quantity Currency Counterparty Description Date EUR '000 Asset Value
Swaptions written
(590,000) USD J.P. Morgan Pay floating LIBOR 3 month Receive fixed 1.13 Call 1.125%
10/09/2026 (4) –
(590,000) USD J.P. Morgan Pay fixed 1.13% Receive floating LIBOR 3 month Put 1.125%
10/09/2026 (6) (0.01)
(590,000) USD BNP Paribas Pay floating LIBOR 3 month Receive fixed 1.70 Call 1.695%
10/06/2031 (4) (0.01)
(590,000) USD BNP Paribas Pay fixed 1.70% Receive floating LIBOR 3 month Put 1.695%
10/06/2031 (9) (0.01)
(315,517) EUR Barclays Pay floating EURIBOR 6 month Receive fixed (0.11) Call 0.11%
18/01/2032 (2) –
(315,517) EUR Barclays Pay fixed (0.11)% Receive floating EURIBOR 6 month Put 0.11%
18/01/2032 (11) (0.01)
Total unrealised loss on swaptions written (30 September 2020: 0.00%) (36) (0.04) OTC options purchased
175,000 EUR BNP Paribas Foreign Exchange EUR/GBP, Call, 0.89 06/08/2021 1 –590,000 USD Bank of
AmericaForeign Exchange USD/CAD, Call, 1.28 23/06/2021 3 0.01
Total unrealised gain on OTC options purchased (30 September 2020: 0.01%) 4 0.01
Maturity Fair Value % of NetDescription Counterparty Date EUR '000 Asset Value
Forward currency contracts3
Buy AUD 190,000; Sell EUR 122,605 Bank of America 15/04/2021 1 –Buy AUD 250,000; Sell EUR 161,6534 RBC 15/04/2021 – –
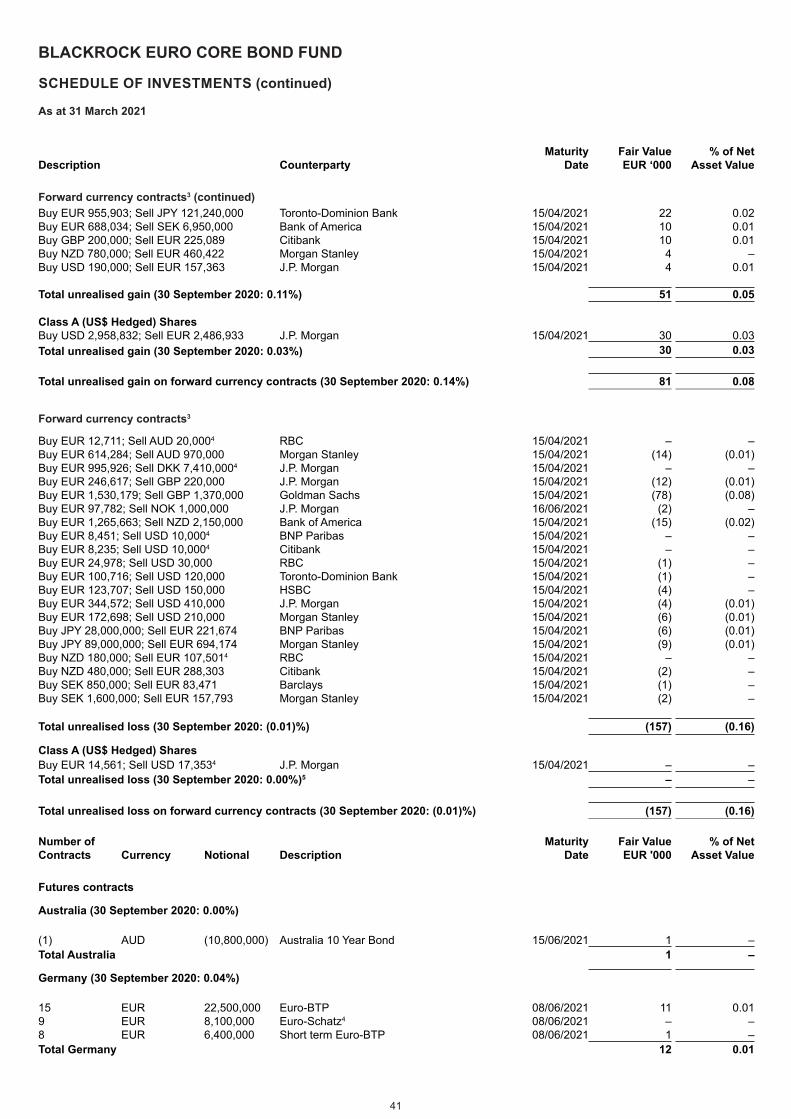
41
BLACKROCK EURO CORE BOND FUND
SCHEDULE OF INVESTMENTS (continued)
As at 31 March 2021
Maturity Fair Value % of NetDescription Counterparty Date EUR ‘000 Asset Value
Forward currency contracts3 (continued) Buy EUR 955,903; Sell JPY 121,240,000 Toronto-Dominion Bank 15/04/2021 22 0.02Buy EUR 688,034; Sell SEK 6,950,000 Bank of America 15/04/2021 10 0.01Buy GBP 200,000; Sell EUR 225,089 Citibank 15/04/2021 10 0.01Buy NZD 780,000; Sell EUR 460,422 Morgan Stanley 15/04/2021 4 –Buy USD 190,000; Sell EUR 157,363 J.P. Morgan 15/04/2021 4 0.01 Total unrealised gain (30 September 2020: 0.11%) 51 0.05
Class A (US$ Hedged) SharesBuy USD 2,958,832; Sell EUR 2,486,933 J.P. Morgan 15/04/2021 30 0.03Total unrealised gain (30 September 2020: 0.03%) 30 0.03 Total unrealised gain on forward currency contracts (30 September 2020: 0.14%) 81 0.08
Forward currency contracts3
Buy EUR 12,711; Sell AUD 20,0004 RBC 15/04/2021 – –Buy EUR 614,284; Sell AUD 970,000 Morgan Stanley 15/04/2021 (14) (0.01)Buy EUR 995,926; Sell DKK 7,410,0004 J.P. Morgan 15/04/2021 – –Buy EUR 246,617; Sell GBP 220,000 J.P. Morgan 15/04/2021 (12) (0.01)Buy EUR 1,530,179; Sell GBP 1,370,000 Goldman Sachs 15/04/2021 (78) (0.08)Buy EUR 97,782; Sell NOK 1,000,000 J.P. Morgan 16/06/2021 (2) –Buy EUR 1,265,663; Sell NZD 2,150,000 Bank of America 15/04/2021 (15) (0.02)Buy EUR 8,451; Sell USD 10,0004 BNP Paribas 15/04/2021 – –Buy EUR 8,235; Sell USD 10,0004 Citibank 15/04/2021 – –Buy EUR 24,978; Sell USD 30,000 RBC 15/04/2021 (1) –Buy EUR 100,716; Sell USD 120,000 Toronto-Dominion Bank 15/04/2021 (1) –Buy EUR 123,707; Sell USD 150,000 HSBC 15/04/2021 (4) –Buy EUR 344,572; Sell USD 410,000 J.P. Morgan 15/04/2021 (4) (0.01)Buy EUR 172,698; Sell USD 210,000 Morgan Stanley 15/04/2021 (6) (0.01)Buy JPY 28,000,000; Sell EUR 221,674 BNP Paribas 15/04/2021 (6) (0.01)Buy JPY 89,000,000; Sell EUR 694,174 Morgan Stanley 15/04/2021 (9) (0.01)Buy NZD 180,000; Sell EUR 107,5014 RBC 15/04/2021 – –Buy NZD 480,000; Sell EUR 288,303 Citibank 15/04/2021 (2) –Buy SEK 850,000; Sell EUR 83,471 Barclays 15/04/2021 (1) –Buy SEK 1,600,000; Sell EUR 157,793 Morgan Stanley 15/04/2021 (2) – Total unrealised loss (30 September 2020: (0.01)%) (157) (0.16)
Class A (US$ Hedged) SharesBuy EUR 14,561; Sell USD 17,3534 J.P. Morgan 15/04/2021 – –Total unrealised loss (30 September 2020: 0.00%)5 – – Total unrealised loss on forward currency contracts (30 September 2020: (0.01)%) (157) (0.16) Number of Maturity Fair Value % of NetContracts Currency Notional Description Date EUR '000 Asset Value
Futures contracts
Australia (30 September 2020: 0.00%)
(1) AUD (10,800,000) Australia 10 Year Bond 15/06/2021 1 –Total Australia 1 –
Germany (30 September 2020: 0.04%)
15 EUR 22,500,000 Euro-BTP 08/06/2021 11 0.019 EUR 8,100,000 Euro-Schatz4 08/06/2021 – –8 EUR 6,400,000 Short term Euro-BTP 08/06/2021 1 –Total Germany 12 0.01
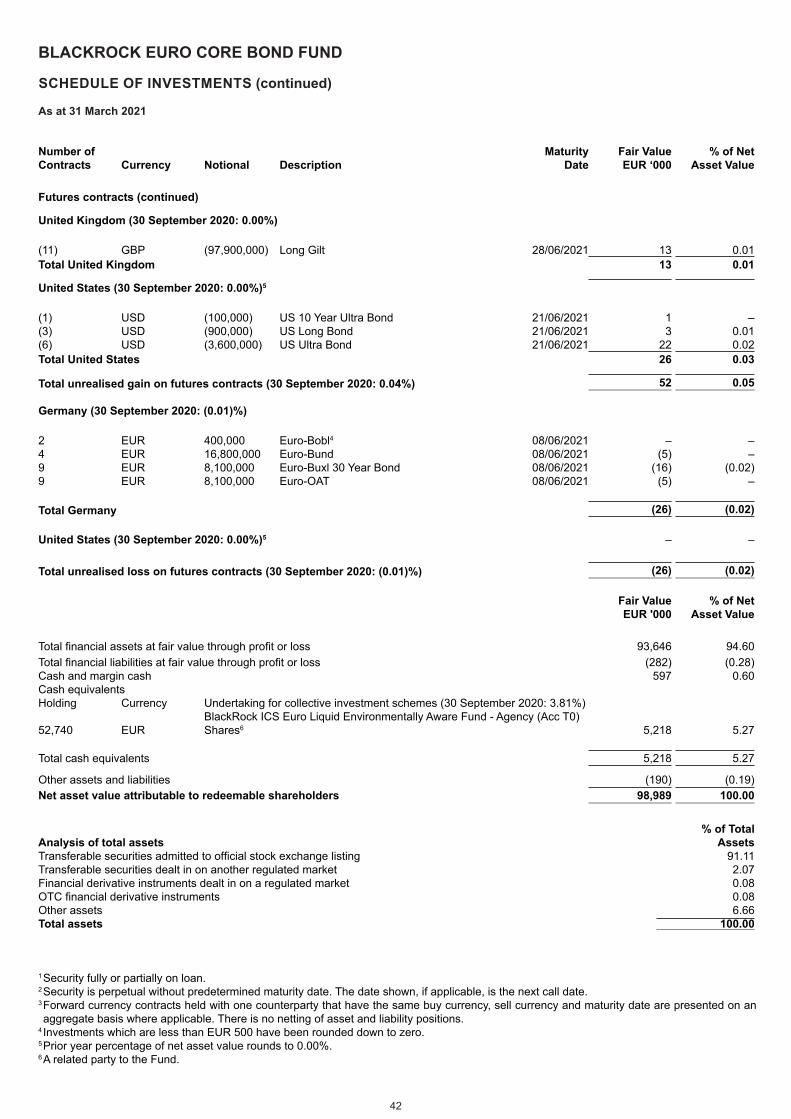
42
BLACKROCK EURO CORE BOND FUND
SCHEDULE OF INVESTMENTS (continued)
As at 31 March 2021
Number of Maturity Fair Value % of NetContracts Currency Notional Description Date EUR ‘000 Asset Value
Futures contracts (continued)
United Kingdom (30 September 2020: 0.00%)
(11) GBP (97,900,000) Long Gilt 28/06/2021 13 0.01Total United Kingdom 13 0.01
United States (30 September 2020: 0.00%)5
(1) USD (100,000) US 10 Year Ultra Bond 21/06/2021 1 –(3) USD (900,000) US Long Bond 21/06/2021 3 0.01(6) USD (3,600,000) US Ultra Bond 21/06/2021 22 0.02Total United States 26 0.03
Total unrealised gain on futures contracts (30 September 2020: 0.04%) 52 0.05 Germany (30 September 2020: (0.01)%)
2 EUR 400,000 Euro-Bobl4 08/06/2021 – –4 EUR 16,800,000 Euro-Bund 08/06/2021 (5) –9 EUR 8,100,000 Euro-Buxl 30 Year Bond 08/06/2021 (16) (0.02)9 EUR 8,100,000 Euro-OAT 08/06/2021 (5) – Total Germany (26) (0.02) United States (30 September 2020: 0.00%)5 – –
Total unrealised loss on futures contracts (30 September 2020: (0.01)%) (26) (0.02)
Fair Value EUR '000
% of Net Asset Value
Total financial assets at fair value through profit or loss 93,646 94.60Total financial liabilities at fair value through profit or loss (282) (0.28)Cash and margin cash 597 0.60Cash equivalentsHolding Currency Undertaking for collective investment schemes (30 September 2020: 3.81%)
52,740 EURBlackRock ICS Euro Liquid Environmentally Aware Fund - Agency (Acc T0) Shares6 5,218 5.27
Total cash equivalents 5,218 5.27
Other assets and liabilities (190) (0.19)Net asset value attributable to redeemable shareholders 98,989 100.00
Analysis of total assets % of Total
AssetsTransferable securities admitted to official stock exchange listing 91.11Transferable securities dealt in on another regulated market 2.07Financial derivative instruments dealt in on a regulated market 0.08OTC financial derivative instruments 0.08Other assets 6.66Total assets 100.00 1Security fully or partially on loan.2Security is perpetual without predetermined maturity date. The date shown, if applicable, is the next call date.3Forward currency contracts held with one counterparty that have the same buy currency, sell currency and maturity date are presented on an aggregate basis where applicable. There is no netting of asset and liability positions.
4 Investments which are less than EUR 500 have been rounded down to zero.5Prior year percentage of net asset value rounds to 0.00%.6A related party to the Fund.

43
BLACKROCK EURO CORE BOND FUND
SCHEDULE OF INVESTMENTS (continued)
As at 31 March 2021
Underlying exposureOn gains EUR '000
On losses EUR '000
Centrally cleared interest rate swaps 798 118Centrally cleared inflation rate swaps 365 2,608Centrally cleared credit default swaps 249 –Swaptions written – 1,330OTC options 183 –Forward currency contracts 5,276 7,233Futures contracts 7,337 4,256
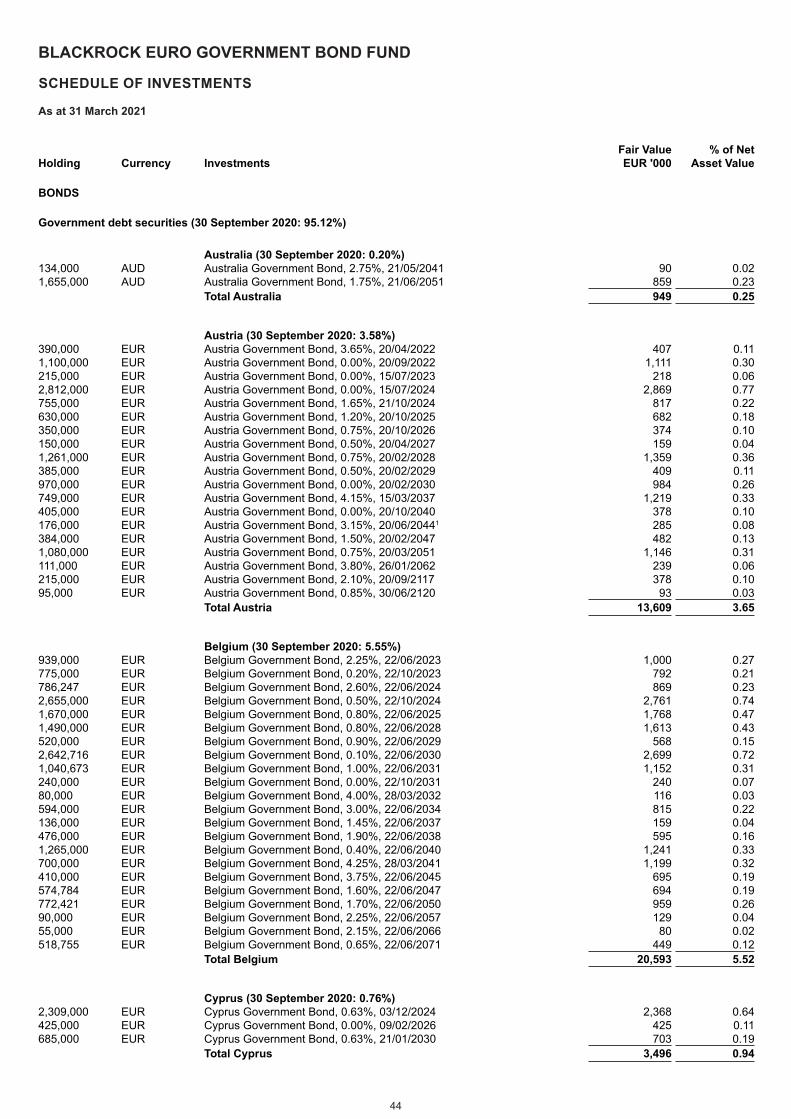
44
BLACKROCK EURO GOVERNMENT BOND FUND
SCHEDULE OF INVESTMENTS
As at 31 March 2021
Holding Currency InvestmentsFair Value EUR '000
% of Net Asset Value
BONDS
Government debt securities (30 September 2020: 95.12%)
Australia (30 September 2020: 0.20%)134,000 AUD Australia Government Bond, 2.75%, 21/05/2041 90 0.021,655,000 AUD Australia Government Bond, 1.75%, 21/06/2051 859 0.23
Total Australia 949 0.25
Austria (30 September 2020: 3.58%)390,000 EUR Austria Government Bond, 3.65%, 20/04/2022 407 0.111,100,000 EUR Austria Government Bond, 0.00%, 20/09/2022 1,111 0.30215,000 EUR Austria Government Bond, 0.00%, 15/07/2023 218 0.062,812,000 EUR Austria Government Bond, 0.00%, 15/07/2024 2,869 0.77755,000 EUR Austria Government Bond, 1.65%, 21/10/2024 817 0.22630,000 EUR Austria Government Bond, 1.20%, 20/10/2025 682 0.18350,000 EUR Austria Government Bond, 0.75%, 20/10/2026 374 0.10150,000 EUR Austria Government Bond, 0.50%, 20/04/2027 159 0.041,261,000 EUR Austria Government Bond, 0.75%, 20/02/2028 1,359 0.36385,000 EUR Austria Government Bond, 0.50%, 20/02/2029 409 0.11970,000 EUR Austria Government Bond, 0.00%, 20/02/2030 984 0.26749,000 EUR Austria Government Bond, 4.15%, 15/03/2037 1,219 0.33405,000 EUR Austria Government Bond, 0.00%, 20/10/2040 378 0.10176,000 EUR Austria Government Bond, 3.15%, 20/06/20441 285 0.08384,000 EUR Austria Government Bond, 1.50%, 20/02/2047 482 0.131,080,000 EUR Austria Government Bond, 0.75%, 20/03/2051 1,146 0.31111,000 EUR Austria Government Bond, 3.80%, 26/01/2062 239 0.06215,000 EUR Austria Government Bond, 2.10%, 20/09/2117 378 0.1095,000 EUR Austria Government Bond, 0.85%, 30/06/2120 93 0.03
Total Austria 13,609 3.65
Belgium (30 September 2020: 5.55%)939,000 EUR Belgium Government Bond, 2.25%, 22/06/2023 1,000 0.27775,000 EUR Belgium Government Bond, 0.20%, 22/10/2023 792 0.21786,247 EUR Belgium Government Bond, 2.60%, 22/06/2024 869 0.232,655,000 EUR Belgium Government Bond, 0.50%, 22/10/2024 2,761 0.741,670,000 EUR Belgium Government Bond, 0.80%, 22/06/2025 1,768 0.471,490,000 EUR Belgium Government Bond, 0.80%, 22/06/2028 1,613 0.43520,000 EUR Belgium Government Bond, 0.90%, 22/06/2029 568 0.152,642,716 EUR Belgium Government Bond, 0.10%, 22/06/2030 2,699 0.721,040,673 EUR Belgium Government Bond, 1.00%, 22/06/2031 1,152 0.31240,000 EUR Belgium Government Bond, 0.00%, 22/10/2031 240 0.0780,000 EUR Belgium Government Bond, 4.00%, 28/03/2032 116 0.03594,000 EUR Belgium Government Bond, 3.00%, 22/06/2034 815 0.22136,000 EUR Belgium Government Bond, 1.45%, 22/06/2037 159 0.04476,000 EUR Belgium Government Bond, 1.90%, 22/06/2038 595 0.161,265,000 EUR Belgium Government Bond, 0.40%, 22/06/2040 1,241 0.33700,000 EUR Belgium Government Bond, 4.25%, 28/03/2041 1,199 0.32410,000 EUR Belgium Government Bond, 3.75%, 22/06/2045 695 0.19574,784 EUR Belgium Government Bond, 1.60%, 22/06/2047 694 0.19772,421 EUR Belgium Government Bond, 1.70%, 22/06/2050 959 0.2690,000 EUR Belgium Government Bond, 2.25%, 22/06/2057 129 0.0455,000 EUR Belgium Government Bond, 2.15%, 22/06/2066 80 0.02518,755 EUR Belgium Government Bond, 0.65%, 22/06/2071 449 0.12
Total Belgium 20,593 5.52
Cyprus (30 September 2020: 0.76%)2,309,000 EUR Cyprus Government Bond, 0.63%, 03/12/2024 2,368 0.64425,000 EUR Cyprus Government Bond, 0.00%, 09/02/2026 425 0.11685,000 EUR Cyprus Government Bond, 0.63%, 21/01/2030 703 0.19
Total Cyprus 3,496 0.94

45
BLACKROCK EURO GOVERNMENT BOND FUND
SCHEDULE OF INVESTMENTS (continued)
As at 31 March 2021
Holding Currency Investments Fair Value EUR ‘000
% of Net Asset Value
BONDS (continued)
Government debt securities (continued)
Finland (30 September 2020: 1.33%)1,172,000 EUR Finland Government Bond, 0.00%, 15/09/2024 1,198 0.32420,000 EUR Finland Government Bond, 4.00%, 04/07/2025 503 0.13274,000 EUR Finland Government Bond, 0.50%, 15/04/2026 289 0.08270,000 EUR Finland Government Bond, 0.50%, 15/09/2027 287 0.08445,000 EUR Finland Government Bond, 0.50%, 15/09/2029 473 0.13300,000 EUR Finland Government Bond, 0.00%, 15/09/2030 304 0.08545,000 EUR Finland Government Bond, 0.75%, 15/04/2031 593 0.1680,000 EUR Finland Government Bond, 0.13%, 15/04/2036 79 0.02325,000 EUR Finland Government Bond, 0.25%, 15/09/2040 320 0.09215,000 EUR Finland Government Bond, 2.63%, 04/07/2042 317 0.08174,000 EUR Finland Government Bond, 1.38%, 15/04/2047 216 0.06170,000 EUR Finland Government Bond, 0.13%, 15/04/2052 152 0.04
Total Finland 4,731 1.27
France (30 September 2020: 20.00%)600,000 EUR Bpifrance SACA, 0.13%, 25/11/2023 609 0.16750,000 EUR France Government Bond OAT, 3.75%, 25/04/2021 752 0.201,834,036 EUR France Government Bond OAT, 0.00%, 25/05/2021 1,836 0.492,247,136 EUR France Government Bond OAT, 3.00%, 25/04/2022 2,334 0.632,669,000 EUR France Government Bond OAT, 0.00%, 25/05/20221 2,689 0.722,018,855 EUR France Government Bond OAT, 2.25%, 25/10/2022 2,111 0.573,670,000 EUR France Government Bond OAT, 0.00%, 25/03/2023 3,719 1.002,500,000 EUR France Government Bond OAT, 1.75%, 25/05/2023 2,630 0.71600,000 EUR France Government Bond OAT, 0.00%, 25/02/2024 611 0.16405,000 EUR France Government Bond OAT, 0.00%, 25/03/2024 413 0.111,120,000 EUR France Government Bond OAT, 2.25%, 25/05/2024 1,222 0.33597,000 EUR France Government Bond OAT, 1.75%, 25/11/2024 649 0.175,365,000 EUR France Government Bond OAT, 0.00%, 25/03/2025 5,489 1.473,615,000 EUR France Government Bond OAT, 0.50%, 25/05/2025 3,777 1.01630,000 EUR France Government Bond OAT, 1.00%, 25/11/2025 675 0.1810,330,000 EUR France Government Bond OAT, 0.00%, 25/02/2026 10,576 2.831,695,000 EUR France Government Bond OAT, 1.00%, 25/05/2027 1,842 0.49550,000 EUR France Government Bond OAT, 0.75%, 25/11/2028 593 0.161,815,000 EUR France Government Bond OAT, 0.00%, 25/11/2029 1,838 0.491,910,000 EUR France Government Bond OAT, 2.50%, 25/05/2030 2,371 0.643,725,000 EUR France Government Bond OAT, 0.00%, 25/11/2030 3,744 1.001,005,000 EUR France Government Bond OAT, 1.50%, 25/05/20311 1,161 0.31152,000 EUR France Government Bond OAT, 5.75%, 25/10/2032 253 0.07996,000 EUR France Government Bond OAT, 1.25%, 25/05/2034 1,133 0.301,374,221 EUR France Government Bond OAT, 4.75%, 25/04/2035 2,244 0.601,165,000 EUR France Government Bond OAT, FRN, 0.10%, 01/03/2036 1,395 0.3750,000 EUR France Government Bond OAT, 1.25%, 25/05/2036 57 0.02400,000 EUR France Government Bond OAT, 4.00%, 25/10/2038 647 0.171,671,400 EUR France Government Bond OAT, 1.75%, 25/06/2039 2,065 0.55145,000 EUR France Government Bond OAT, 0.50%, 25/05/2040 145 0.048,703,027 EUR France Government Bond OAT, 0.50%, 25/06/2044 8,530 2.295,145,000 EUR France Government Bond OAT, 0.75%, 25/05/2052 5,064 1.36517,000 EUR France Government Bond OAT, 4.00%, 25/04/2060 1,056 0.28567,000 EUR France Government Bond OAT, 1.75%, 25/05/2066 745 0.20802,956 EUR France Government Bond OAT, 0.50%, 25/05/2072 655 0.181,400,000 EUR UNEDIC ASSEO, 0.01%, 25/05/2031 1,390 0.37
Total France 77,020 20.63
Germany (30 September 2020: 15.51%)4,730,000 EUR Bundesobligation, 0.00%, 18/10/2024 4,850 1.307,800,000 EUR Bundesobligation, 0.00%, 10/10/2025 8,049 2.16450,000 EUR Bundesobligation, 0.00%, 10/04/2026 464 0.12

46
BLACKROCK EURO GOVERNMENT BOND FUND
SCHEDULE OF INVESTMENTS (continued)
As at 31 March 2021
Holding Currency Investments Fair Value EUR ‘000
% of Net Asset Value
BONDS (continued)
Government debt securities (continued)
Germany (continued) 1,956,000 EUR Bundesrepublik Deutschland Bundesanleihe, 0.50%, 15/02/20251 2,049 0.551,506,000 EUR Bundesrepublik Deutschland Bundesanleihe, 0.00%, 15/08/20261 1,558 0.42534,000 EUR Bundesrepublik Deutschland Bundesanleihe, 0.25%, 15/02/2027 561 0.151,390,000 EUR Bundesrepublik Deutschland Bundesanleihe, 0.50%, 15/08/2027 1,486 0.40250,000 EUR Bundesrepublik Deutschland Bundesanleihe, 0.00%, 15/08/20291 259 0.07273,000 EUR Bundesrepublik Deutschland Bundesanleihe, 6.25%, 04/01/2030 436 0.121,635,000 EUR Bundesrepublik Deutschland Bundesanleihe, 0.00%, 15/02/20301 1,690 0.451,275,000 EUR Bundesrepublik Deutschland Bundesanleihe, 0.00%, 15/08/2030 1,316 0.351,440,429 EUR Bundesrepublik Deutschland Bundesanleihe, 5.50%, 04/01/2031 2,280 0.61701,000 EUR Bundesrepublik Deutschland Bundesanleihe, 4.75%, 04/07/2034 1,166 0.31306,237 EUR Bundesrepublik Deutschland Bundesanleihe, 4.00%, 04/01/20371 504 0.142,335,918 EUR Bundesrepublik Deutschland Bundesanleihe, 4.25%, 04/07/20391 4,160 1.112,581,000 EUR Bundesrepublik Deutschland Bundesanleihe, 4.75%, 04/07/20401 4,944 1.32490,000 EUR Bundesrepublik Deutschland Bundesanleihe, 3.25%, 04/07/2042 821 0.22858,764 EUR Bundesrepublik Deutschland Bundesanleihe, 2.50%, 15/08/20461 1,359 0.36310,000 EUR Bundesrepublik Deutschland Bundesanleihe, 1.25%, 15/08/2048 395 0.112,555,000 EUR Bundesrepublik Deutschland Bundesanleihe, 0.00%, 15/08/20501 2,373 0.642,601,000 EUR Bundesrepublik Deutschland Bundesanleihe, 0.25%, 15/08/20281 2,747 0.742,665,000 EUR Bundesrepublik Deutschland Bundesanleihe, 0.00%, 15/08/2030 2,763 0.74100,000 EUR Bundesrepublik Deutschland Bundesanleihe, 0.00%, 15/02/2031 103 0.033,965,000 EUR Bundesschatzanweisungen, 0.00%, 16/09/2022 4,004 1.0711,500,000 EUR Bundesschatzanweisungen, 0.00%, 15/12/2022 11,636 3.121,150,000 EUR Bundesschatzanweisungen, 0.00%, 10/03/2023 1,166 0.31
Total Germany 63,139 16.92
Greece (30 September 2020: 0.62%)875,000 EUR Greece Government Bond, 1.88%, 24/01/2052 871 0.23
Total Greece 871 0.23
Hungary (30 September 2020: 0.25%)303,000 EUR Hungary Government Bond, 0.50%, 18/11/2030 297 0.08410,000 EUR Hungary Government Bond, 1.75%, 05/06/2035 439 0.12
Total Hungary 736 0.20
Iceland (30 September 2020: 0.53%) – –
Ireland (30 September 2020: 1.82%)830,000 EUR Ireland Government Bond, 0.00%, 18/10/2022 838 0.22990,000 EUR Ireland Government Bond, 5.40%, 13/03/2025 1,224 0.331,310,000 EUR Ireland Government Bond, 0.20%, 15/05/2027 1,357 0.36600,000 EUR Ireland Government Bond, 1.10%, 15/05/2029 662 0.18240,000 EUR Ireland Government Bond, 0.20%, 18/10/2030 245 0.071,172,854 EUR Ireland Government Bond, 0.00%, 18/10/2031 1,167 0.3155,000 EUR Ireland Government Bond, 1.30%, 15/05/2033 63 0.02300,000 EUR Ireland Government Bond, 0.40%, 15/05/2035 306 0.08314,600 EUR Ireland Government Bond, 1.70%, 15/05/2037 382 0.10285,000 EUR Ireland Government Bond, 2.00%, 18/02/2045 375 0.10375,000 EUR Ireland Government Bond, 1.50%, 15/05/2050 449 0.12
Total Ireland 7,068 1.89
Israel (30 September 2020: 0.10%) – –
Italy (30 September 2020: 17.82%)1,187,000 EUR Italy Buoni Poliennali Del Tesoro, FRN, 2.10%, 15/09/20211 1,381 0.372,292,000 EUR Italy Buoni Poliennali Del Tesoro, 5.00%, 01/03/2022 2,405 0.65
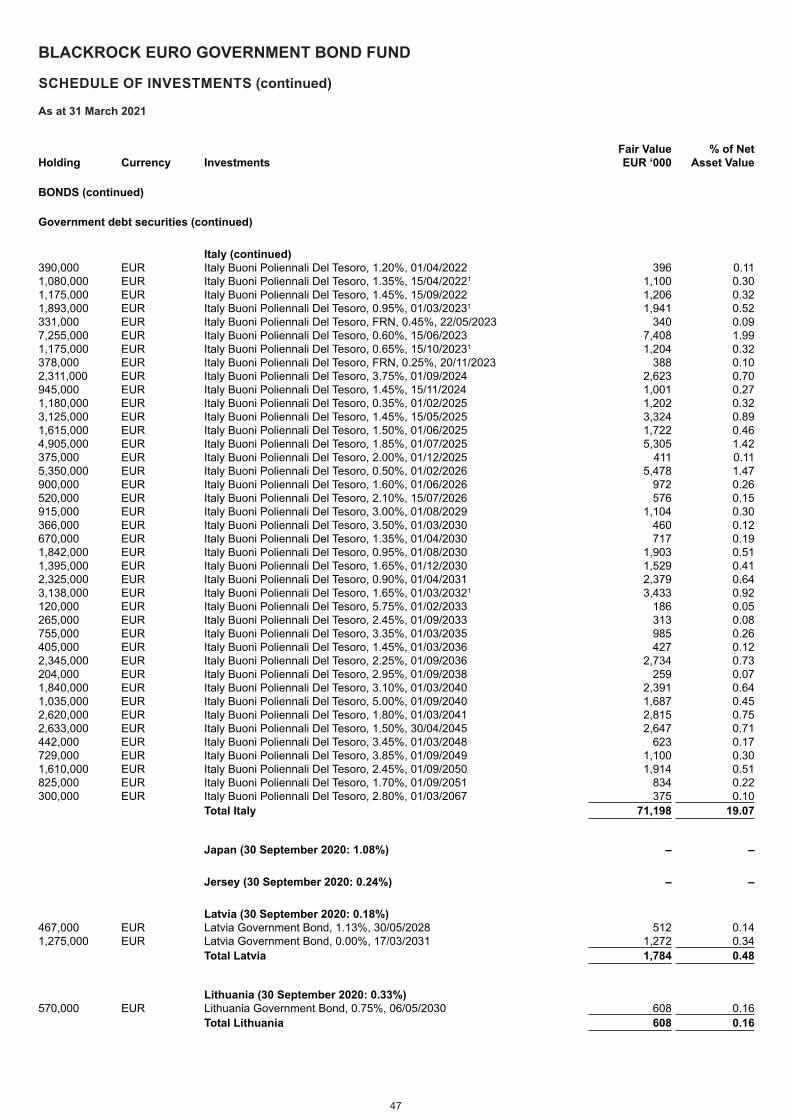
47
BLACKROCK EURO GOVERNMENT BOND FUND
SCHEDULE OF INVESTMENTS (continued)
As at 31 March 2021
Holding Currency Investments Fair Value EUR ‘000
% of Net Asset Value
BONDS (continued)
Government debt securities (continued)
Italy (continued) 390,000 EUR Italy Buoni Poliennali Del Tesoro, 1.20%, 01/04/2022 396 0.111,080,000 EUR Italy Buoni Poliennali Del Tesoro, 1.35%, 15/04/20221 1,100 0.301,175,000 EUR Italy Buoni Poliennali Del Tesoro, 1.45%, 15/09/2022 1,206 0.321,893,000 EUR Italy Buoni Poliennali Del Tesoro, 0.95%, 01/03/20231 1,941 0.52331,000 EUR Italy Buoni Poliennali Del Tesoro, FRN, 0.45%, 22/05/2023 340 0.097,255,000 EUR Italy Buoni Poliennali Del Tesoro, 0.60%, 15/06/2023 7,408 1.991,175,000 EUR Italy Buoni Poliennali Del Tesoro, 0.65%, 15/10/20231 1,204 0.32378,000 EUR Italy Buoni Poliennali Del Tesoro, FRN, 0.25%, 20/11/2023 388 0.102,311,000 EUR Italy Buoni Poliennali Del Tesoro, 3.75%, 01/09/2024 2,623 0.70945,000 EUR Italy Buoni Poliennali Del Tesoro, 1.45%, 15/11/2024 1,001 0.271,180,000 EUR Italy Buoni Poliennali Del Tesoro, 0.35%, 01/02/2025 1,202 0.323,125,000 EUR Italy Buoni Poliennali Del Tesoro, 1.45%, 15/05/2025 3,324 0.891,615,000 EUR Italy Buoni Poliennali Del Tesoro, 1.50%, 01/06/2025 1,722 0.464,905,000 EUR Italy Buoni Poliennali Del Tesoro, 1.85%, 01/07/2025 5,305 1.42375,000 EUR Italy Buoni Poliennali Del Tesoro, 2.00%, 01/12/2025 411 0.115,350,000 EUR Italy Buoni Poliennali Del Tesoro, 0.50%, 01/02/2026 5,478 1.47900,000 EUR Italy Buoni Poliennali Del Tesoro, 1.60%, 01/06/2026 972 0.26520,000 EUR Italy Buoni Poliennali Del Tesoro, 2.10%, 15/07/2026 576 0.15915,000 EUR Italy Buoni Poliennali Del Tesoro, 3.00%, 01/08/2029 1,104 0.30366,000 EUR Italy Buoni Poliennali Del Tesoro, 3.50%, 01/03/2030 460 0.12670,000 EUR Italy Buoni Poliennali Del Tesoro, 1.35%, 01/04/2030 717 0.191,842,000 EUR Italy Buoni Poliennali Del Tesoro, 0.95%, 01/08/2030 1,903 0.511,395,000 EUR Italy Buoni Poliennali Del Tesoro, 1.65%, 01/12/2030 1,529 0.412,325,000 EUR Italy Buoni Poliennali Del Tesoro, 0.90%, 01/04/2031 2,379 0.643,138,000 EUR Italy Buoni Poliennali Del Tesoro, 1.65%, 01/03/20321 3,433 0.92120,000 EUR Italy Buoni Poliennali Del Tesoro, 5.75%, 01/02/2033 186 0.05265,000 EUR Italy Buoni Poliennali Del Tesoro, 2.45%, 01/09/2033 313 0.08755,000 EUR Italy Buoni Poliennali Del Tesoro, 3.35%, 01/03/2035 985 0.26405,000 EUR Italy Buoni Poliennali Del Tesoro, 1.45%, 01/03/2036 427 0.122,345,000 EUR Italy Buoni Poliennali Del Tesoro, 2.25%, 01/09/2036 2,734 0.73204,000 EUR Italy Buoni Poliennali Del Tesoro, 2.95%, 01/09/2038 259 0.071,840,000 EUR Italy Buoni Poliennali Del Tesoro, 3.10%, 01/03/2040 2,391 0.641,035,000 EUR Italy Buoni Poliennali Del Tesoro, 5.00%, 01/09/2040 1,687 0.452,620,000 EUR Italy Buoni Poliennali Del Tesoro, 1.80%, 01/03/2041 2,815 0.752,633,000 EUR Italy Buoni Poliennali Del Tesoro, 1.50%, 30/04/2045 2,647 0.71442,000 EUR Italy Buoni Poliennali Del Tesoro, 3.45%, 01/03/2048 623 0.17729,000 EUR Italy Buoni Poliennali Del Tesoro, 3.85%, 01/09/2049 1,100 0.301,610,000 EUR Italy Buoni Poliennali Del Tesoro, 2.45%, 01/09/2050 1,914 0.51825,000 EUR Italy Buoni Poliennali Del Tesoro, 1.70%, 01/09/2051 834 0.22300,000 EUR Italy Buoni Poliennali Del Tesoro, 2.80%, 01/03/2067 375 0.10
Total Italy 71,198 19.07
Japan (30 September 2020: 1.08%) – –
Jersey (30 September 2020: 0.24%) – –
Latvia (30 September 2020: 0.18%)467,000 EUR Latvia Government Bond, 1.13%, 30/05/2028 512 0.141,275,000 EUR Latvia Government Bond, 0.00%, 17/03/2031 1,272 0.34
Total Latvia 1,784 0.48
Lithuania (30 September 2020: 0.33%)570,000 EUR Lithuania Government Bond, 0.75%, 06/05/2030 608 0.16
Total Lithuania 608 0.16

48
BLACKROCK EURO GOVERNMENT BOND FUND
SCHEDULE OF INVESTMENTS (continued)
As at 31 March 2021
Holding Currency Investments Fair Value EUR ‘000
% of Net Asset Value
BONDS (continued)
Government debt securities (continued)
Luxembourg (30 September 2020: 0.28%)2,026,000 EUR State of the Grand-Duchy of Luxembourg, 0.00%, 24/03/2031 2,039 0.55785,000 EUR State of the Grand-Duchy of Luxembourg, 0.00%, 14/09/2032 780 0.21
Total Luxembourg 2,819 0.76
Netherlands (30 September 2020: 4.18%)1,410,000 EUR Netherlands Government Bond, 0.00%, 15/01/2022 1,417 0.381,163,000 EUR Netherlands Government Bond, 0.00%, 15/01/2024 1,186 0.32936,000 EUR Netherlands Government Bond, 2.00%, 15/07/2024 1,019 0.271,265,000 EUR Netherlands Government Bond, 0.25%, 15/07/2025 1,313 0.35435,598 EUR Netherlands Government Bond, 0.50%, 15/07/2026 460 0.121,792,314 EUR Netherlands Government Bond, 0.00%, 15/01/2027 1,845 0.50395,000 EUR Netherlands Government Bond, 0.75%, 15/07/2027 426 0.11391,000 EUR Netherlands Government Bond, 0.75%, 15/07/2028 424 0.111,150,000 EUR Netherlands Government Bond, 0.25%, 15/07/2029 1,205 0.321,285,000 EUR Netherlands Government Bond, 0.00%, 15/07/20301 1,314 0.35360,000 EUR Netherlands Government Bond, 0.00%, 15/07/2031 366 0.10505,000 EUR Netherlands Government Bond, 2.50%, 15/01/2033 661 0.18500,000 EUR Netherlands Government Bond, 0.50%, 15/01/2040 531 0.142,583,276 EUR Netherlands Government Bond, 0.00%, 15/01/2052 2,334 0.63
Total Netherlands 14,501 3.88
New Zealand (30 September 2020: 0.45%)1,855,000 NZD New Zealand Government Bond, 1.75%, 15/05/2041 951 0.25561,000 NZD New Zealand Inflation Linked Bond, 2.50%, 20/09/2040 466 0.13
Total New Zealand 1,417 0.38
Poland (30 September 2020: 0.71%) – –
Portugal (30 September 2020: 2.65%)640,000 EUR Portugal Obrigacoes do Tesouro OT, 3.85%, 15/04/2021 641 0.17640,000 EUR Portugal Obrigacoes do Tesouro OT, 5.65%, 15/02/2024 753 0.201,269,331 EUR Portugal Obrigacoes do Tesouro OT, 2.88%, 15/10/2025 1,458 0.39420,324 EUR Portugal Obrigacoes do Tesouro OT, 2.88%, 21/07/2026 491 0.13180,000 EUR Portugal Obrigacoes do Tesouro OT, 4.13%, 14/04/2027 227 0.06965,000 EUR Portugal Obrigacoes do Tesouro OT, 0.70%, 15/10/2027 1,017 0.278,732 EUR Portugal Obrigacoes do Tesouro OT, 2.13%, 17/10/2028 10 –720,000 EUR Portugal Obrigacoes do Tesouro OT, 1.95%, 15/06/2029 831 0.22185,000 EUR Portugal Obrigacoes do Tesouro OT, 3.88%, 15/02/2030 246 0.07624,000 EUR Portugal Obrigacoes do Tesouro OT, 0.48%, 18/10/2030 639 0.17605,000 EUR Portugal Obrigacoes do Tesouro OT, 2.25%, 18/04/2034 738 0.20375,000 EUR Portugal Obrigacoes do Tesouro OT, 0.90%, 12/10/2035 389 0.11155,000 EUR Portugal Obrigacoes do Tesouro OT, 4.10%, 15/04/2037 236 0.06241,997 EUR Portugal Obrigacoes do Tesouro OT, 4.10%, 15/02/2045 399 0.11295,881 EUR Portugal Obrigacoes do Tesouro OT, 1.00%, 12/04/2052 277 0.08
Total Portugal 8,352 2.24
Slovakia (30 September 2020: 0.54%)1,011,486 EUR Slovakia Government Bond, 0.75%, 09/04/2030 1,091 0.29580,000 EUR Slovakia Government Bond, 1.00%, 14/05/2032 640 0.17210,000 EUR Slovakia Government Bond, 1.88%, 09/03/2037 258 0.07
Total Slovakia 1,989 0.53
Slovenia (30 September 2020: 0.43%)1,401,000 EUR Slovenia Government Bond, 0.28%, 14/01/2030 1,447 0.39
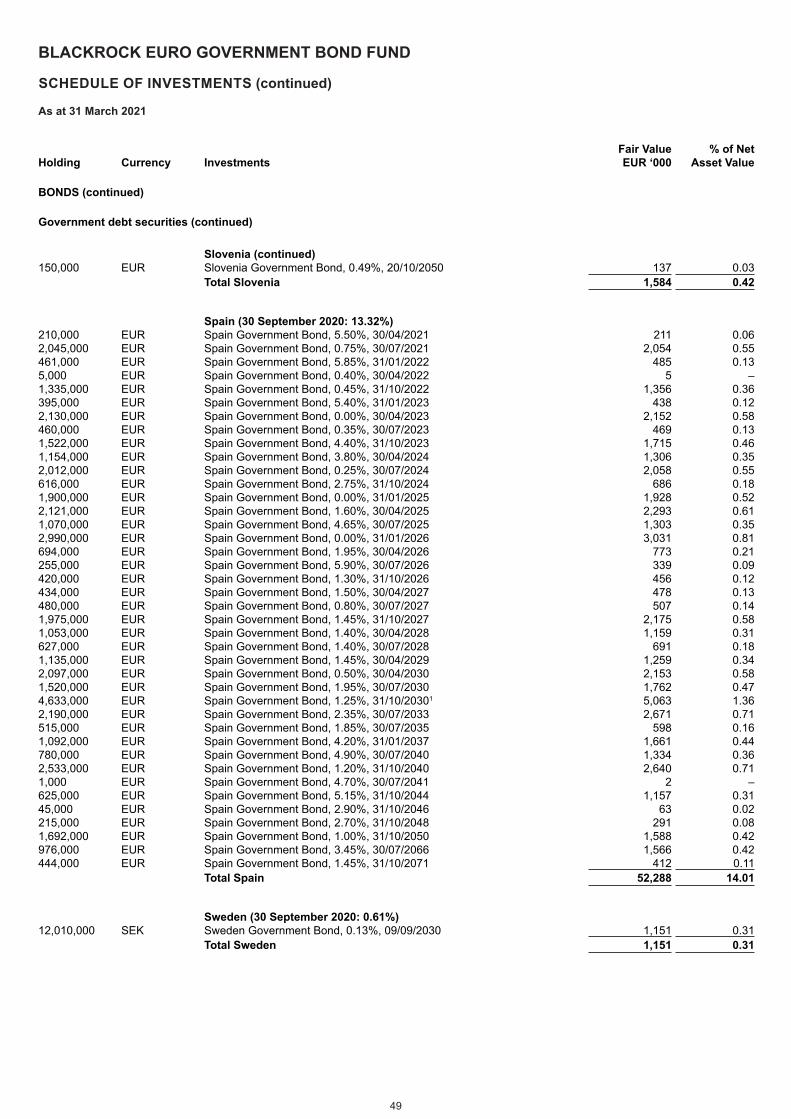
49
BLACKROCK EURO GOVERNMENT BOND FUND
SCHEDULE OF INVESTMENTS (continued)
As at 31 March 2021
Holding Currency Investments Fair Value EUR ‘000
% of Net Asset Value
BONDS (continued)
Government debt securities (continued)
Slovenia (continued) 150,000 EUR Slovenia Government Bond, 0.49%, 20/10/2050 137 0.03
Total Slovenia 1,584 0.42
Spain (30 September 2020: 13.32%)210,000 EUR Spain Government Bond, 5.50%, 30/04/2021 211 0.062,045,000 EUR Spain Government Bond, 0.75%, 30/07/2021 2,054 0.55461,000 EUR Spain Government Bond, 5.85%, 31/01/2022 485 0.135,000 EUR Spain Government Bond, 0.40%, 30/04/2022 5 –1,335,000 EUR Spain Government Bond, 0.45%, 31/10/2022 1,356 0.36395,000 EUR Spain Government Bond, 5.40%, 31/01/2023 438 0.122,130,000 EUR Spain Government Bond, 0.00%, 30/04/2023 2,152 0.58460,000 EUR Spain Government Bond, 0.35%, 30/07/2023 469 0.131,522,000 EUR Spain Government Bond, 4.40%, 31/10/2023 1,715 0.461,154,000 EUR Spain Government Bond, 3.80%, 30/04/2024 1,306 0.352,012,000 EUR Spain Government Bond, 0.25%, 30/07/2024 2,058 0.55616,000 EUR Spain Government Bond, 2.75%, 31/10/2024 686 0.181,900,000 EUR Spain Government Bond, 0.00%, 31/01/2025 1,928 0.522,121,000 EUR Spain Government Bond, 1.60%, 30/04/2025 2,293 0.611,070,000 EUR Spain Government Bond, 4.65%, 30/07/2025 1,303 0.352,990,000 EUR Spain Government Bond, 0.00%, 31/01/2026 3,031 0.81694,000 EUR Spain Government Bond, 1.95%, 30/04/2026 773 0.21255,000 EUR Spain Government Bond, 5.90%, 30/07/2026 339 0.09420,000 EUR Spain Government Bond, 1.30%, 31/10/2026 456 0.12434,000 EUR Spain Government Bond, 1.50%, 30/04/2027 478 0.13480,000 EUR Spain Government Bond, 0.80%, 30/07/2027 507 0.141,975,000 EUR Spain Government Bond, 1.45%, 31/10/2027 2,175 0.581,053,000 EUR Spain Government Bond, 1.40%, 30/04/2028 1,159 0.31627,000 EUR Spain Government Bond, 1.40%, 30/07/2028 691 0.181,135,000 EUR Spain Government Bond, 1.45%, 30/04/2029 1,259 0.342,097,000 EUR Spain Government Bond, 0.50%, 30/04/2030 2,153 0.581,520,000 EUR Spain Government Bond, 1.95%, 30/07/2030 1,762 0.474,633,000 EUR Spain Government Bond, 1.25%, 31/10/20301 5,063 1.362,190,000 EUR Spain Government Bond, 2.35%, 30/07/2033 2,671 0.71515,000 EUR Spain Government Bond, 1.85%, 30/07/2035 598 0.161,092,000 EUR Spain Government Bond, 4.20%, 31/01/2037 1,661 0.44780,000 EUR Spain Government Bond, 4.90%, 30/07/2040 1,334 0.362,533,000 EUR Spain Government Bond, 1.20%, 31/10/2040 2,640 0.711,000 EUR Spain Government Bond, 4.70%, 30/07/2041 2 –625,000 EUR Spain Government Bond, 5.15%, 31/10/2044 1,157 0.3145,000 EUR Spain Government Bond, 2.90%, 31/10/2046 63 0.02215,000 EUR Spain Government Bond, 2.70%, 31/10/2048 291 0.081,692,000 EUR Spain Government Bond, 1.00%, 31/10/2050 1,588 0.42976,000 EUR Spain Government Bond, 3.45%, 30/07/2066 1,566 0.42444,000 EUR Spain Government Bond, 1.45%, 31/10/2071 412 0.11
Total Spain 52,288 14.01
Sweden (30 September 2020: 0.61%)12,010,000 SEK Sweden Government Bond, 0.13%, 09/09/2030 1,151 0.31
Total Sweden 1,151 0.31
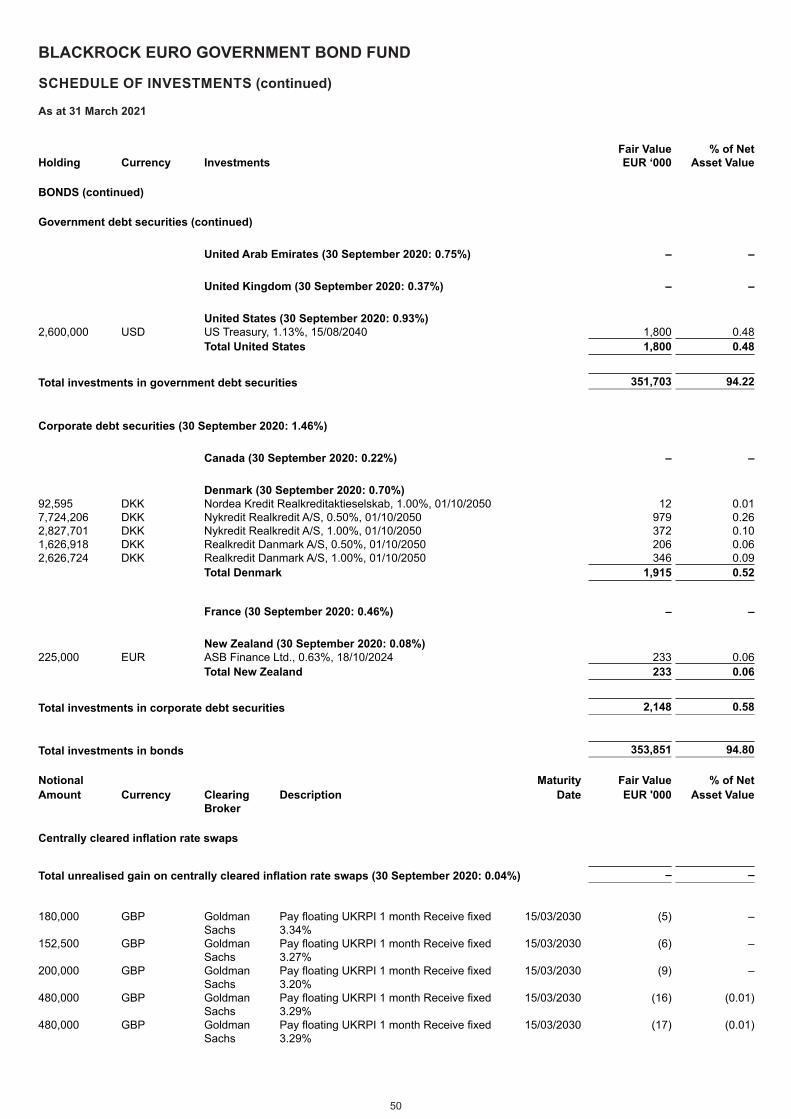
50
BLACKROCK EURO GOVERNMENT BOND FUND
SCHEDULE OF INVESTMENTS (continued)
As at 31 March 2021
Holding Currency Investments Fair Value EUR ‘000
% of Net Asset Value
BONDS (continued)
Government debt securities (continued)
United Arab Emirates (30 September 2020: 0.75%) – –
United Kingdom (30 September 2020: 0.37%) – –
United States (30 September 2020: 0.93%)2,600,000 USD US Treasury, 1.13%, 15/08/2040 1,800 0.48
Total United States 1,800 0.48
Total investments in government debt securities 351,703 94.22
Corporate debt securities (30 September 2020: 1.46%)
Canada (30 September 2020: 0.22%) – –
Denmark (30 September 2020: 0.70%)92,595 DKK Nordea Kredit Realkreditaktieselskab, 1.00%, 01/10/2050 12 0.017,724,206 DKK Nykredit Realkredit A/S, 0.50%, 01/10/2050 979 0.262,827,701 DKK Nykredit Realkredit A/S, 1.00%, 01/10/2050 372 0.101,626,918 DKK Realkredit Danmark A/S, 0.50%, 01/10/2050 206 0.062,626,724 DKK Realkredit Danmark A/S, 1.00%, 01/10/2050 346 0.09
Total Denmark 1,915 0.52
France (30 September 2020: 0.46%) – –
New Zealand (30 September 2020: 0.08%)225,000 EUR ASB Finance Ltd., 0.63%, 18/10/2024 233 0.06
Total New Zealand 233 0.06
Total investments in corporate debt securities 2,148 0.58 Total investments in bonds 353,851 94.80 Notional Maturity Fair Value % of Net Amount Currency Clearing
BrokerDescription Date EUR '000 Asset Value
Centrally cleared inflation rate swaps
Total unrealised gain on centrally cleared inflation rate swaps (30 September 2020: 0.04%) – – 180,000 GBP Goldman
SachsPay floating UKRPI 1 month Receive fixed 3.34%
15/03/2030 (5) –
152,500 GBP Goldman Sachs
Pay floating UKRPI 1 month Receive fixed 3.27%
15/03/2030 (6) –
200,000 GBP Goldman Sachs
Pay floating UKRPI 1 month Receive fixed 3.20%
15/03/2030 (9) –
480,000 GBP Goldman Sachs
Pay floating UKRPI 1 month Receive fixed 3.29%
15/03/2030 (16) (0.01)
480,000 GBP Goldman Sachs
Pay floating UKRPI 1 month Receive fixed 3.29%
15/03/2030 (17) (0.01)
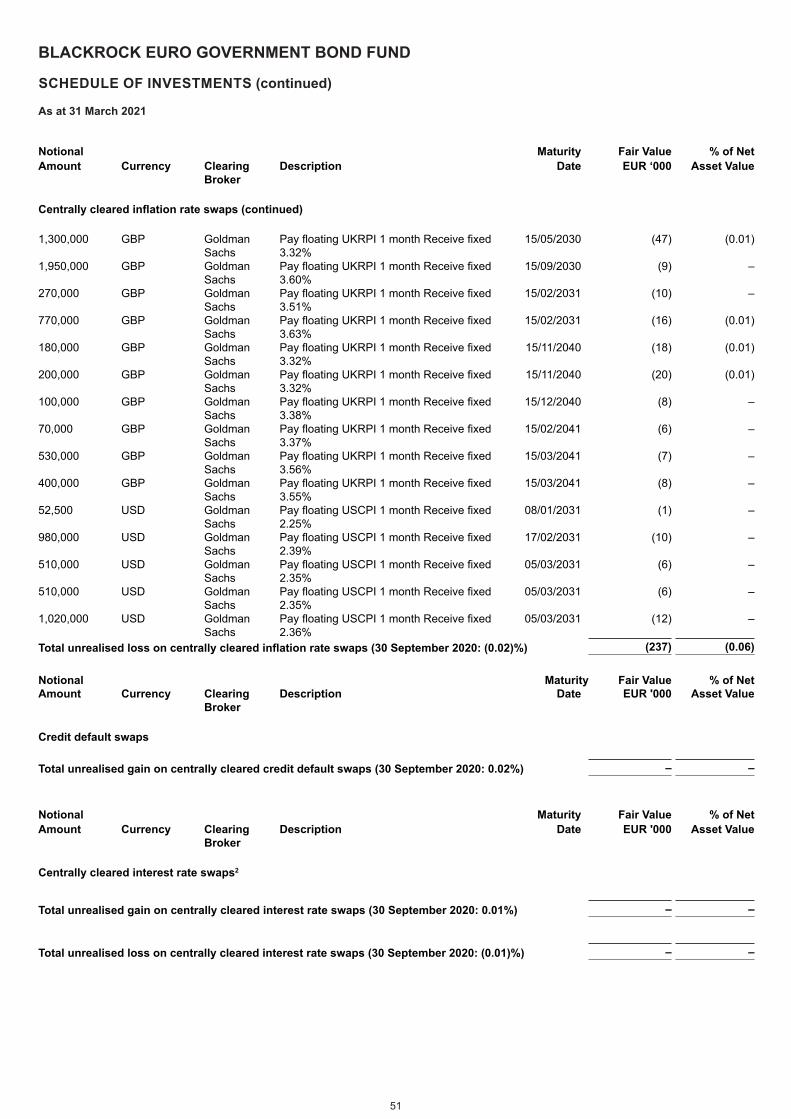
51
BLACKROCK EURO GOVERNMENT BOND FUND
SCHEDULE OF INVESTMENTS (continued)
As at 31 March 2021
Notional Maturity Fair Value % of Net Amount Currency Clearing
BrokerDescription Date EUR ‘000
Asset Value
Centrally cleared inflation rate swaps (continued)
1,300,000 GBP Goldman Sachs
Pay floating UKRPI 1 month Receive fixed 3.32%
15/05/2030 (47) (0.01)
1,950,000 GBP Goldman Sachs
Pay floating UKRPI 1 month Receive fixed 3.60%
15/09/2030 (9) –
270,000 GBP Goldman Sachs
Pay floating UKRPI 1 month Receive fixed 3.51%
15/02/2031 (10) –
770,000 GBP Goldman Sachs
Pay floating UKRPI 1 month Receive fixed 3.63%
15/02/2031 (16) (0.01)
180,000 GBP Goldman Sachs
Pay floating UKRPI 1 month Receive fixed 3.32%
15/11/2040 (18) (0.01)
200,000 GBP Goldman Sachs
Pay floating UKRPI 1 month Receive fixed 3.32%
15/11/2040 (20) (0.01)
100,000 GBP Goldman Sachs
Pay floating UKRPI 1 month Receive fixed 3.38%
15/12/2040 (8) –
70,000 GBP Goldman Sachs
Pay floating UKRPI 1 month Receive fixed 3.37%
15/02/2041 (6) –
530,000 GBP Goldman Sachs
Pay floating UKRPI 1 month Receive fixed 3.56%
15/03/2041 (7) –
400,000 GBP Goldman Sachs
Pay floating UKRPI 1 month Receive fixed 3.55%
15/03/2041 (8) –
52,500 USD Goldman Sachs
Pay floating USCPI 1 month Receive fixed 2.25%
08/01/2031 (1) –
980,000 USD Goldman Sachs
Pay floating USCPI 1 month Receive fixed 2.39%
17/02/2031 (10) –
510,000 USD Goldman Sachs
Pay floating USCPI 1 month Receive fixed 2.35%
05/03/2031 (6) –
510,000 USD Goldman Sachs
Pay floating USCPI 1 month Receive fixed 2.35%
05/03/2031 (6) –
1,020,000 USD Goldman Sachs
Pay floating USCPI 1 month Receive fixed 2.36%
05/03/2031 (12) –
Total unrealised loss on centrally cleared inflation rate swaps (30 September 2020: (0.02)%) (237) (0.06) Notional Maturity Fair Value % of Net Amount Currency Clearing
BrokerDescription Date EUR '000 Asset Value
Credit default swaps
Total unrealised gain on centrally cleared credit default swaps (30 September 2020: 0.02%) – – Notional Maturity Fair Value % of Net Amount Currency Clearing
BrokerDescription Date EUR '000 Asset Value
Centrally cleared interest rate swaps2
Total unrealised gain on centrally cleared interest rate swaps (30 September 2020: 0.01%) – – Total unrealised loss on centrally cleared interest rate swaps (30 September 2020: (0.01)%) – –
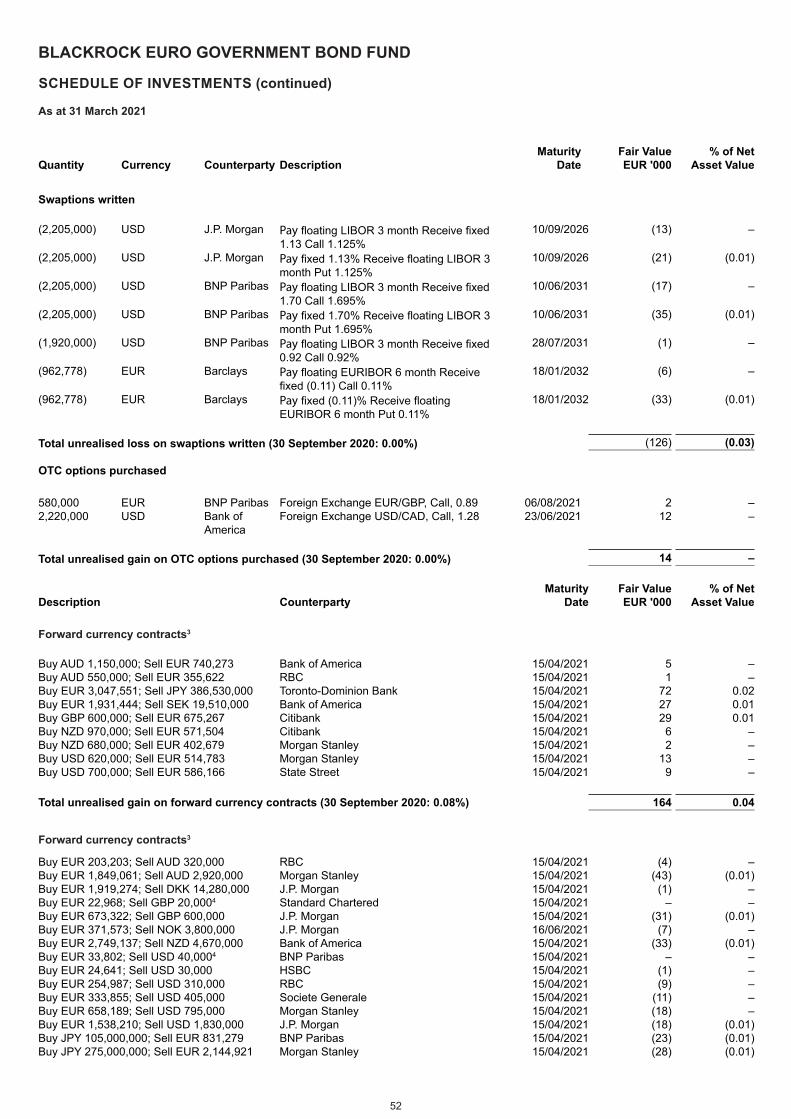
52
BLACKROCK EURO GOVERNMENT BOND FUND
SCHEDULE OF INVESTMENTS (continued)
As at 31 March 2021
Maturity Fair Value % of Net Quantity Currency Counterparty Description Date EUR '000 Asset Value
Swaptions written
(2,205,000) USD J.P. Morgan Pay floating LIBOR 3 month Receive fixed 1.13 Call 1.125%
10/09/2026 (13) –
(2,205,000) USD J.P. Morgan Pay fixed 1.13% Receive floating LIBOR 3 month Put 1.125%
10/09/2026 (21) (0.01)
(2,205,000) USD BNP Paribas Pay floating LIBOR 3 month Receive fixed 1.70 Call 1.695%
10/06/2031 (17) –
(2,205,000) USD BNP Paribas Pay fixed 1.70% Receive floating LIBOR 3 month Put 1.695%
10/06/2031 (35) (0.01)
(1,920,000) USD BNP Paribas Pay floating LIBOR 3 month Receive fixed 0.92 Call 0.92%
28/07/2031 (1) –
(962,778) EUR Barclays Pay floating EURIBOR 6 month Receive fixed (0.11) Call 0.11%
18/01/2032 (6) –
(962,778) EUR Barclays Pay fixed (0.11)% Receive floating EURIBOR 6 month Put 0.11%
18/01/2032 (33) (0.01)
Total unrealised loss on swaptions written (30 September 2020: 0.00%) (126) (0.03) OTC options purchased
580,000 EUR BNP Paribas Foreign Exchange EUR/GBP, Call, 0.89 06/08/2021 2 –2,220,000 USD Bank of
AmericaForeign Exchange USD/CAD, Call, 1.28 23/06/2021 12 –
Total unrealised gain on OTC options purchased (30 September 2020: 0.00%) 14 –
Maturity Fair Value % of NetDescription Counterparty Date EUR '000 Asset Value
Forward currency contracts3
Buy AUD 1,150,000; Sell EUR 740,273 Bank of America 15/04/2021 5 –Buy AUD 550,000; Sell EUR 355,622 RBC 15/04/2021 1 –Buy EUR 3,047,551; Sell JPY 386,530,000 Toronto-Dominion Bank 15/04/2021 72 0.02Buy EUR 1,931,444; Sell SEK 19,510,000 Bank of America 15/04/2021 27 0.01Buy GBP 600,000; Sell EUR 675,267 Citibank 15/04/2021 29 0.01Buy NZD 970,000; Sell EUR 571,504 Citibank 15/04/2021 6 –Buy NZD 680,000; Sell EUR 402,679 Morgan Stanley 15/04/2021 2 –Buy USD 620,000; Sell EUR 514,783 Morgan Stanley 15/04/2021 13 –Buy USD 700,000; Sell EUR 586,166 State Street 15/04/2021 9 – Total unrealised gain on forward currency contracts (30 September 2020: 0.08%) 164 0.04
Forward currency contracts3
Buy EUR 203,203; Sell AUD 320,000 RBC 15/04/2021 (4) –Buy EUR 1,849,061; Sell AUD 2,920,000 Morgan Stanley 15/04/2021 (43) (0.01)Buy EUR 1,919,274; Sell DKK 14,280,000 J.P. Morgan 15/04/2021 (1) –Buy EUR 22,968; Sell GBP 20,0004 Standard Chartered 15/04/2021 – –Buy EUR 673,322; Sell GBP 600,000 J.P. Morgan 15/04/2021 (31) (0.01)Buy EUR 371,573; Sell NOK 3,800,000 J.P. Morgan 16/06/2021 (7) –Buy EUR 2,749,137; Sell NZD 4,670,000 Bank of America 15/04/2021 (33) (0.01)Buy EUR 33,802; Sell USD 40,0004 BNP Paribas 15/04/2021 – –Buy EUR 24,641; Sell USD 30,000 HSBC 15/04/2021 (1) –Buy EUR 254,987; Sell USD 310,000 RBC 15/04/2021 (9) –Buy EUR 333,855; Sell USD 405,000 Societe Generale 15/04/2021 (11) –Buy EUR 658,189; Sell USD 795,000 Morgan Stanley 15/04/2021 (18) –Buy EUR 1,538,210; Sell USD 1,830,000 J.P. Morgan 15/04/2021 (18) (0.01)Buy JPY 105,000,000; Sell EUR 831,279 BNP Paribas 15/04/2021 (23) (0.01)Buy JPY 275,000,000; Sell EUR 2,144,921 Morgan Stanley 15/04/2021 (28) (0.01)
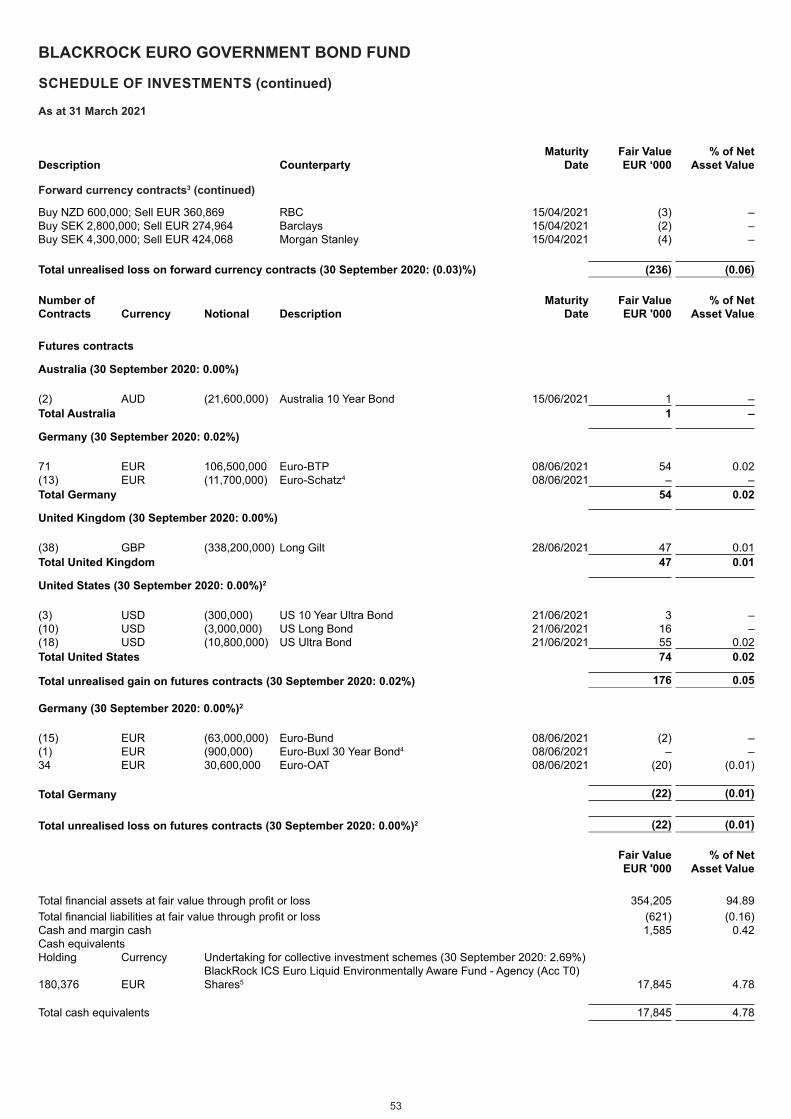
53
BLACKROCK EURO GOVERNMENT BOND FUND
SCHEDULE OF INVESTMENTS (continued)
As at 31 March 2021
Maturity Fair Value % of NetDescription Counterparty Date EUR ‘000 Asset Value
Forward currency contracts3 (continued) Buy NZD 600,000; Sell EUR 360,869 RBC 15/04/2021 (3) –Buy SEK 2,800,000; Sell EUR 274,964 Barclays 15/04/2021 (2) –Buy SEK 4,300,000; Sell EUR 424,068 Morgan Stanley 15/04/2021 (4) – Total unrealised loss on forward currency contracts (30 September 2020: (0.03)%) (236) (0.06) Number of Maturity Fair Value % of NetContracts Currency Notional Description Date EUR '000 Asset Value
Futures contracts
Australia (30 September 2020: 0.00%)
(2) AUD (21,600,000) Australia 10 Year Bond 15/06/2021 1 –Total Australia 1 –
Germany (30 September 2020: 0.02%)
71 EUR 106,500,000 Euro-BTP 08/06/2021 54 0.02(13) EUR (11,700,000) Euro-Schatz4 08/06/2021 – –Total Germany 54 0.02
United Kingdom (30 September 2020: 0.00%)
(38) GBP (338,200,000) Long Gilt 28/06/2021 47 0.01Total United Kingdom 47 0.01
United States (30 September 2020: 0.00%)2
(3) USD (300,000) US 10 Year Ultra Bond 21/06/2021 3 –(10) USD (3,000,000) US Long Bond 21/06/2021 16 –(18) USD (10,800,000) US Ultra Bond 21/06/2021 55 0.02Total United States 74 0.02
Total unrealised gain on futures contracts (30 September 2020: 0.02%) 176 0.05 Germany (30 September 2020: 0.00%)2
(15) EUR (63,000,000) Euro-Bund 08/06/2021 (2) –(1) EUR (900,000) Euro-Buxl 30 Year Bond4 08/06/2021 – –34 EUR 30,600,000 Euro-OAT 08/06/2021 (20) (0.01) Total Germany (22) (0.01) Total unrealised loss on futures contracts (30 September 2020: 0.00%)2 (22) (0.01)
Fair Value EUR '000
% of Net Asset Value
Total financial assets at fair value through profit or loss 354,205 94.89Total financial liabilities at fair value through profit or loss (621) (0.16)Cash and margin cash 1,585 0.42Cash equivalentsHolding Currency Undertaking for collective investment schemes (30 September 2020: 2.69%)
180,376 EURBlackRock ICS Euro Liquid Environmentally Aware Fund - Agency (Acc T0) Shares5 17,845 4.78
Total cash equivalents 17,845 4.78

54
BLACKROCK EURO GOVERNMENT BOND FUND
SCHEDULE OF INVESTMENTS (continued)
As at 31 March 2021
Fair Value EUR ‘000
% of Net Asset Value
Other assets and liabilities 245 0.07Net asset value attributable to redeemable shareholders 373,259 100.00
Analysis of total assets % of Total
AssetsTransferable securities admitted to official stock exchange listing 93.39Transferable securities dealt in on another regulated market 0.12Financial derivative instruments dealt in on a regulated market 0.05OTC financial derivative instruments 0.05Other assets 6.39Total assets 100.00 1Security fully or partially on loan.2Prior year percentage of net asset value rounds to 0.00%.3Forward currency contracts held with one counterparty that have the same buy currency, sell currency and maturity date are presented on an aggregate basis where applicable. There is no netting of asset and liability positions.
4 Investments which are less than EUR 500 have been rounded down to zero.5A related party to the Fund.
Underlying exposureOn gains EUR '000
On losses EUR '000
Centrally cleared inflation rate swaps – 10,892Swaptions written – 4,748OTC options 675 –Forward currency contracts 8,793 14,787Futures contracts 22,376 8,268
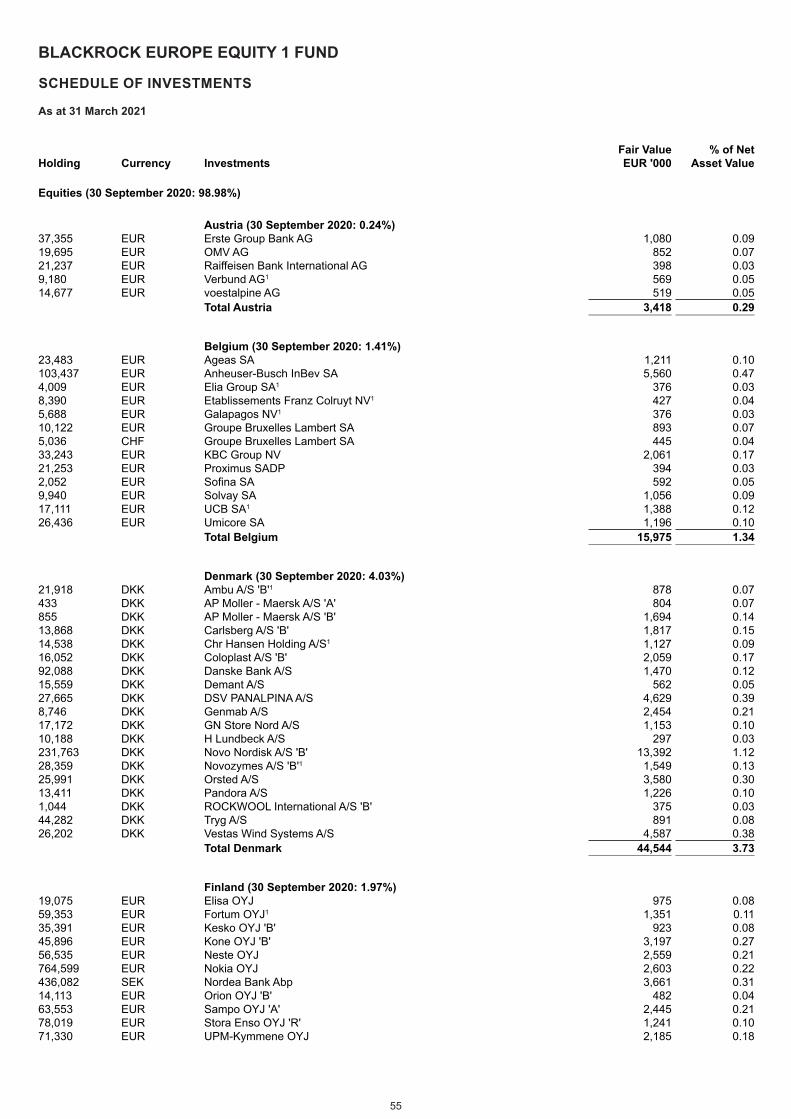
55
BLACKROCK EUROPE EQUITY 1 FUND
SCHEDULE OF INVESTMENTS
As at 31 March 2021
Holding Currency InvestmentsFair Value EUR '000
% of Net Asset Value
Equities (30 September 2020: 98.98%)
Austria (30 September 2020: 0.24%)37,355 EUR Erste Group Bank AG 1,080 0.0919,695 EUR OMV AG 852 0.0721,237 EUR Raiffeisen Bank International AG 398 0.039,180 EUR Verbund AG1 569 0.0514,677 EUR voestalpine AG 519 0.05
Total Austria 3,418 0.29
Belgium (30 September 2020: 1.41%)23,483 EUR Ageas SA 1,211 0.10103,437 EUR Anheuser-Busch InBev SA 5,560 0.474,009 EUR Elia Group SA1 376 0.038,390 EUR Etablissements Franz Colruyt NV1 427 0.045,688 EUR Galapagos NV1 376 0.0310,122 EUR Groupe Bruxelles Lambert SA 893 0.075,036 CHF Groupe Bruxelles Lambert SA 445 0.0433,243 EUR KBC Group NV 2,061 0.1721,253 EUR Proximus SADP 394 0.032,052 EUR Sofina SA 592 0.059,940 EUR Solvay SA 1,056 0.0917,111 EUR UCB SA1 1,388 0.1226,436 EUR Umicore SA 1,196 0.10
Total Belgium 15,975 1.34
Denmark (30 September 2020: 4.03%)21,918 DKK Ambu A/S 'B'1 878 0.07433 DKK AP Moller - Maersk A/S 'A' 804 0.07855 DKK AP Moller - Maersk A/S 'B' 1,694 0.1413,868 DKK Carlsberg A/S 'B' 1,817 0.1514,538 DKK Chr Hansen Holding A/S1 1,127 0.0916,052 DKK Coloplast A/S 'B' 2,059 0.1792,088 DKK Danske Bank A/S 1,470 0.1215,559 DKK Demant A/S 562 0.0527,665 DKK DSV PANALPINA A/S 4,629 0.398,746 DKK Genmab A/S 2,454 0.2117,172 DKK GN Store Nord A/S 1,153 0.1010,188 DKK H Lundbeck A/S 297 0.03231,763 DKK Novo Nordisk A/S 'B' 13,392 1.1228,359 DKK Novozymes A/S 'B'1 1,549 0.1325,991 DKK Orsted A/S 3,580 0.3013,411 DKK Pandora A/S 1,226 0.101,044 DKK ROCKWOOL International A/S 'B' 375 0.0344,282 DKK Tryg A/S 891 0.0826,202 DKK Vestas Wind Systems A/S 4,587 0.38
Total Denmark 44,544 3.73
Finland (30 September 2020: 1.97%)19,075 EUR Elisa OYJ 975 0.0859,353 EUR Fortum OYJ1 1,351 0.1135,391 EUR Kesko OYJ 'B' 923 0.0845,896 EUR Kone OYJ 'B' 3,197 0.2756,535 EUR Neste OYJ 2,559 0.21764,599 EUR Nokia OYJ 2,603 0.22436,082 SEK Nordea Bank Abp 3,661 0.3114,113 EUR Orion OYJ 'B' 482 0.0463,553 EUR Sampo OYJ 'A' 2,445 0.2178,019 EUR Stora Enso OYJ 'R' 1,241 0.1071,330 EUR UPM-Kymmene OYJ 2,185 0.18

56
BLACKROCK EUROPE EQUITY 1 FUND
SCHEDULE OF INVESTMENTS (continued)
As at 31 March 2021
Holding Currency Investments Fair Value EUR ‘000
% of Net Asset Value
Equities (continued)
Finland (continued) 62,306 EUR Wartsila OYJ Abp 557 0.05
Total Finland 22,179 1.86
France (30 September 2020: 15.95%)25,518 EUR Accor SA 821 0.074,120 EUR Aeroports de Paris1 420 0.0463,808 EUR Air Liquide SA 8,888 0.7435,952 EUR Alstom SA1 1,529 0.137,653 EUR Amundi SA 522 0.049,262 EUR Arkema SA 957 0.0813,180 EUR Atos SE 877 0.07261,950 EUR AXA SA 5,995 0.505,556 EUR BioMerieux 603 0.05151,628 EUR BNP Paribas SA 7,866 0.66124,732 EUR Bollore SA 514 0.0430,571 EUR Bouygues SA 1,045 0.0939,397 EUR Bureau Veritas SA 956 0.0821,584 EUR Capgemini SE 3,132 0.2681,198 EUR Carrefour SA1 1,254 0.1169,272 EUR Cie de Saint-Gobain 3,486 0.2922,738 EUR Cie Generale des Etablissements Michelin SCA 2,903 0.2423,704 EUR CNP Assurances 384 0.036,812 EUR Covivio, REIT1 497 0.04155,564 EUR Credit Agricole SA 1,920 0.1682,357 EUR Danone SA 4,818 0.40363 EUR Dassault Aviation SA1 345 0.0317,723 EUR Dassault Systemes SE 3,233 0.2732,810 EUR Edenred 1,461 0.1211,354 EUR Eiffage SA 969 0.0883,247 EUR Electricite de France SA 952 0.08244,856 EUR Engie SA 2,964 0.2538,599 EUR EssilorLuxottica SA 5,359 0.454,800 EUR Eurazeo SE 312 0.0315,273 EUR Faurecia SE 694 0.066,149 EUR Gecina SA, REIT 722 0.0659,009 EUR Getlink SE 772 0.064,238 EUR Hermes International 4,001 0.332,399 EUR Iliad SA 389 0.034,637 EUR Ipsen SA 339 0.0310,265 EUR Kering SA 6,042 0.5124,356 EUR Klepierre SA, REIT 484 0.0411,767 EUR La Francaise des Jeux SAEM 456 0.0435,789 EUR Legrand SA 2,839 0.2433,807 EUR L'Oreal SA 11,048 0.9237,366 EUR LVMH Moet Hennessy Louis Vuitton SE 21,228 1.78131,604 EUR Natixis SA 537 0.04268,764 EUR Orange SA 2,823 0.246,927 EUR Orpea SA 684 0.0627,876 EUR Pernod Ricard SA 4,462 0.3731,114 EUR Publicis Groupe SA 1,619 0.143,242 EUR Remy Cointreau SA1 511 0.0425,779 EUR Renault SA 952 0.0843,494 EUR Safran SA 5,047 0.42152,505 EUR Sanofi 12,849 1.083,739 EUR Sartorius Stedim Biotech 1,313 0.1172,508 EUR Schneider Electric SE 9,444 0.7919,923 EUR SCOR SE 580 0.053,584 EUR SEB SA 539 0.05107,871 EUR Societe Generale SA 2,407 0.2011,865 EUR Sodexo SA 970 0.08
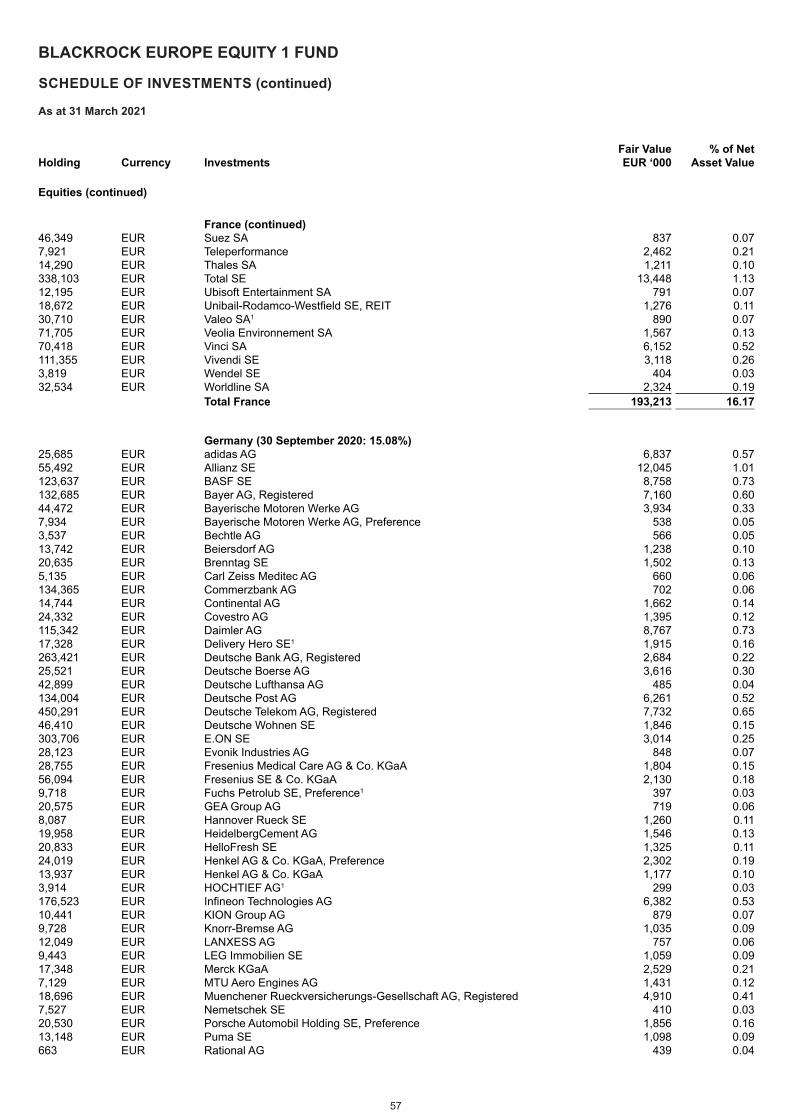
57
BLACKROCK EUROPE EQUITY 1 FUND
SCHEDULE OF INVESTMENTS (continued)
As at 31 March 2021
Holding Currency Investments Fair Value EUR ‘000
% of Net Asset Value
Equities (continued)
France (continued) 46,349 EUR Suez SA 837 0.077,921 EUR Teleperformance 2,462 0.2114,290 EUR Thales SA 1,211 0.10338,103 EUR Total SE 13,448 1.1312,195 EUR Ubisoft Entertainment SA 791 0.0718,672 EUR Unibail-Rodamco-Westfield SE, REIT 1,276 0.1130,710 EUR Valeo SA1 890 0.0771,705 EUR Veolia Environnement SA 1,567 0.1370,418 EUR Vinci SA 6,152 0.52111,355 EUR Vivendi SE 3,118 0.263,819 EUR Wendel SE 404 0.0332,534 EUR Worldline SA 2,324 0.19
Total France 193,213 16.17
Germany (30 September 2020: 15.08%)25,685 EUR adidas AG 6,837 0.5755,492 EUR Allianz SE 12,045 1.01123,637 EUR BASF SE 8,758 0.73132,685 EUR Bayer AG, Registered 7,160 0.6044,472 EUR Bayerische Motoren Werke AG 3,934 0.337,934 EUR Bayerische Motoren Werke AG, Preference 538 0.053,537 EUR Bechtle AG 566 0.0513,742 EUR Beiersdorf AG 1,238 0.1020,635 EUR Brenntag SE 1,502 0.135,135 EUR Carl Zeiss Meditec AG 660 0.06134,365 EUR Commerzbank AG 702 0.0614,744 EUR Continental AG 1,662 0.1424,332 EUR Covestro AG 1,395 0.12115,342 EUR Daimler AG 8,767 0.7317,328 EUR Delivery Hero SE1 1,915 0.16263,421 EUR Deutsche Bank AG, Registered 2,684 0.2225,521 EUR Deutsche Boerse AG 3,616 0.3042,899 EUR Deutsche Lufthansa AG 485 0.04134,004 EUR Deutsche Post AG 6,261 0.52450,291 EUR Deutsche Telekom AG, Registered 7,732 0.6546,410 EUR Deutsche Wohnen SE 1,846 0.15303,706 EUR E.ON SE 3,014 0.2528,123 EUR Evonik Industries AG 848 0.0728,755 EUR Fresenius Medical Care AG & Co. KGaA 1,804 0.1556,094 EUR Fresenius SE & Co. KGaA 2,130 0.189,718 EUR Fuchs Petrolub SE, Preference1 397 0.0320,575 EUR GEA Group AG 719 0.068,087 EUR Hannover Rueck SE 1,260 0.1119,958 EUR HeidelbergCement AG 1,546 0.1320,833 EUR HelloFresh SE 1,325 0.1124,019 EUR Henkel AG & Co. KGaA, Preference 2,302 0.1913,937 EUR Henkel AG & Co. KGaA 1,177 0.103,914 EUR HOCHTIEF AG1 299 0.03176,523 EUR Infineon Technologies AG 6,382 0.5310,441 EUR KION Group AG 879 0.079,728 EUR Knorr-Bremse AG 1,035 0.0912,049 EUR LANXESS AG 757 0.069,443 EUR LEG Immobilien SE 1,059 0.0917,348 EUR Merck KGaA 2,529 0.217,129 EUR MTU Aero Engines AG 1,431 0.1218,696 EUR Muenchener Rueckversicherungs-Gesellschaft AG, Registered 4,910 0.417,527 EUR Nemetschek SE 410 0.0320,530 EUR Porsche Automobil Holding SE, Preference 1,856 0.1613,148 EUR Puma SE 1,098 0.09663 EUR Rational AG 439 0.04
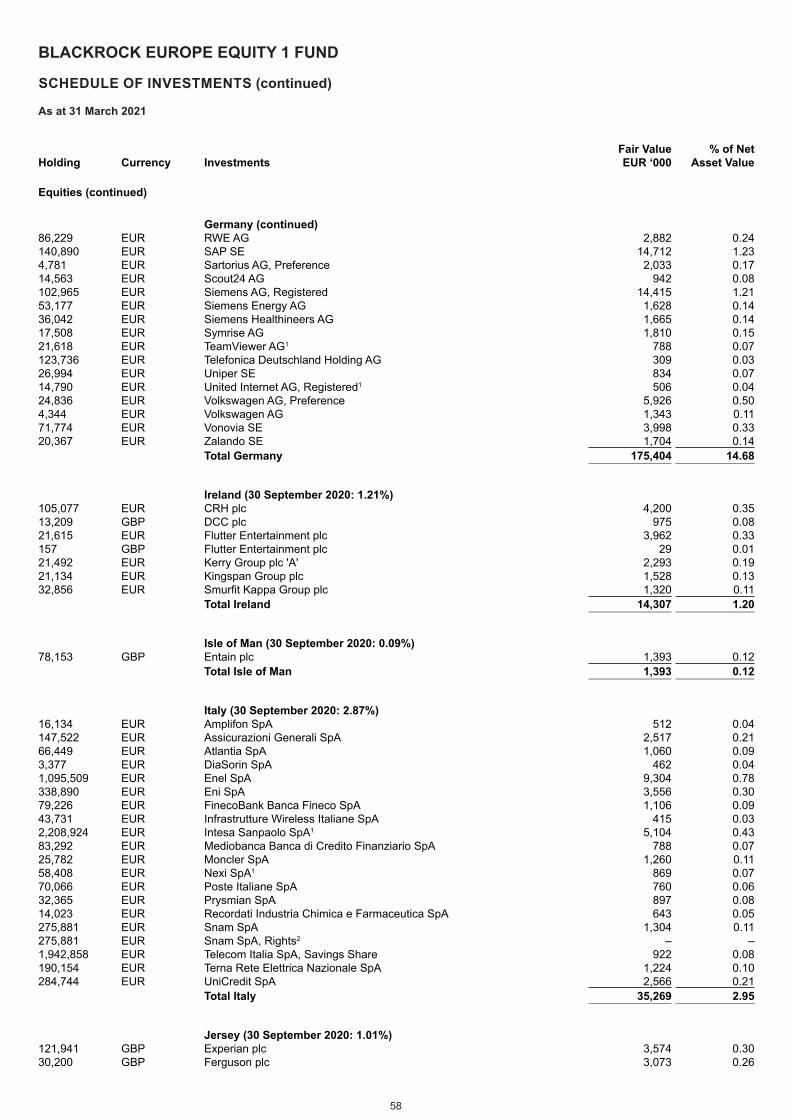
58
BLACKROCK EUROPE EQUITY 1 FUND
SCHEDULE OF INVESTMENTS (continued)
As at 31 March 2021
Holding Currency Investments Fair Value EUR ‘000
% of Net Asset Value
Equities (continued)
Germany (continued) 86,229 EUR RWE AG 2,882 0.24140,890 EUR SAP SE 14,712 1.234,781 EUR Sartorius AG, Preference 2,033 0.1714,563 EUR Scout24 AG 942 0.08102,965 EUR Siemens AG, Registered 14,415 1.2153,177 EUR Siemens Energy AG 1,628 0.1436,042 EUR Siemens Healthineers AG 1,665 0.1417,508 EUR Symrise AG 1,810 0.1521,618 EUR TeamViewer AG1 788 0.07123,736 EUR Telefonica Deutschland Holding AG 309 0.0326,994 EUR Uniper SE 834 0.0714,790 EUR United Internet AG, Registered1 506 0.0424,836 EUR Volkswagen AG, Preference 5,926 0.504,344 EUR Volkswagen AG 1,343 0.1171,774 EUR Vonovia SE 3,998 0.3320,367 EUR Zalando SE 1,704 0.14
Total Germany 175,404 14.68
Ireland (30 September 2020: 1.21%)105,077 EUR CRH plc 4,200 0.3513,209 GBP DCC plc 975 0.0821,615 EUR Flutter Entertainment plc 3,962 0.33157 GBP Flutter Entertainment plc 29 0.0121,492 EUR Kerry Group plc 'A' 2,293 0.1921,134 EUR Kingspan Group plc 1,528 0.1332,856 EUR Smurfit Kappa Group plc 1,320 0.11
Total Ireland 14,307 1.20
Isle of Man (30 September 2020: 0.09%)78,153 GBP Entain plc 1,393 0.12
Total Isle of Man 1,393 0.12
Italy (30 September 2020: 2.87%)16,134 EUR Amplifon SpA 512 0.04147,522 EUR Assicurazioni Generali SpA 2,517 0.2166,449 EUR Atlantia SpA 1,060 0.093,377 EUR DiaSorin SpA 462 0.041,095,509 EUR Enel SpA 9,304 0.78338,890 EUR Eni SpA 3,556 0.3079,226 EUR FinecoBank Banca Fineco SpA 1,106 0.0943,731 EUR Infrastrutture Wireless Italiane SpA 415 0.032,208,924 EUR Intesa Sanpaolo SpA1 5,104 0.4383,292 EUR Mediobanca Banca di Credito Finanziario SpA 788 0.0725,782 EUR Moncler SpA 1,260 0.1158,408 EUR Nexi SpA1 869 0.0770,066 EUR Poste Italiane SpA 760 0.0632,365 EUR Prysmian SpA 897 0.0814,023 EUR Recordati Industria Chimica e Farmaceutica SpA 643 0.05275,881 EUR Snam SpA 1,304 0.11275,881 EUR Snam SpA, Rights2 – –1,942,858 EUR Telecom Italia SpA, Savings Share 922 0.08190,154 EUR Terna Rete Elettrica Nazionale SpA 1,224 0.10284,744 EUR UniCredit SpA 2,566 0.21
Total Italy 35,269 2.95
Jersey (30 September 2020: 1.01%)121,941 GBP Experian plc 3,574 0.3030,200 GBP Ferguson plc 3,073 0.26
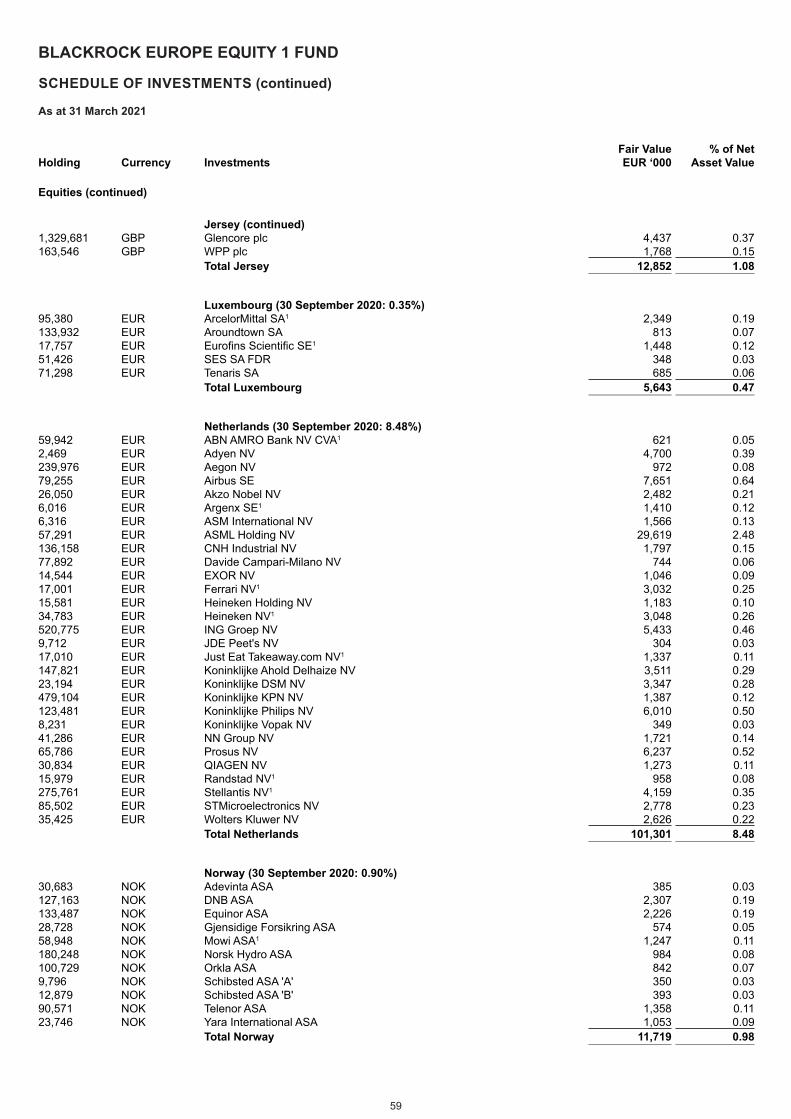
59
BLACKROCK EUROPE EQUITY 1 FUND
SCHEDULE OF INVESTMENTS (continued)
As at 31 March 2021
Holding Currency Investments Fair Value EUR ‘000
% of Net Asset Value
Equities (continued)
Jersey (continued) 1,329,681 GBP Glencore plc 4,437 0.37163,546 GBP WPP plc 1,768 0.15
Total Jersey 12,852 1.08
Luxembourg (30 September 2020: 0.35%)95,380 EUR ArcelorMittal SA1 2,349 0.19133,932 EUR Aroundtown SA 813 0.0717,757 EUR Eurofins Scientific SE1 1,448 0.1251,426 EUR SES SA FDR 348 0.0371,298 EUR Tenaris SA 685 0.06
Total Luxembourg 5,643 0.47
Netherlands (30 September 2020: 8.48%)59,942 EUR ABN AMRO Bank NV CVA1 621 0.052,469 EUR Adyen NV 4,700 0.39239,976 EUR Aegon NV 972 0.0879,255 EUR Airbus SE 7,651 0.6426,050 EUR Akzo Nobel NV 2,482 0.216,016 EUR Argenx SE1 1,410 0.126,316 EUR ASM International NV 1,566 0.1357,291 EUR ASML Holding NV 29,619 2.48136,158 EUR CNH Industrial NV 1,797 0.1577,892 EUR Davide Campari-Milano NV 744 0.0614,544 EUR EXOR NV 1,046 0.0917,001 EUR Ferrari NV1 3,032 0.2515,581 EUR Heineken Holding NV 1,183 0.1034,783 EUR Heineken NV1 3,048 0.26520,775 EUR ING Groep NV 5,433 0.469,712 EUR JDE Peet's NV 304 0.0317,010 EUR Just Eat Takeaway.com NV1 1,337 0.11147,821 EUR Koninklijke Ahold Delhaize NV 3,511 0.2923,194 EUR Koninklijke DSM NV 3,347 0.28479,104 EUR Koninklijke KPN NV 1,387 0.12123,481 EUR Koninklijke Philips NV 6,010 0.508,231 EUR Koninklijke Vopak NV 349 0.0341,286 EUR NN Group NV 1,721 0.1465,786 EUR Prosus NV 6,237 0.5230,834 EUR QIAGEN NV 1,273 0.1115,979 EUR Randstad NV1 958 0.08275,761 EUR Stellantis NV1 4,159 0.3585,502 EUR STMicroelectronics NV 2,778 0.2335,425 EUR Wolters Kluwer NV 2,626 0.22
Total Netherlands 101,301 8.48
Norway (30 September 2020: 0.90%)30,683 NOK Adevinta ASA 385 0.03127,163 NOK DNB ASA 2,307 0.19133,487 NOK Equinor ASA 2,226 0.1928,728 NOK Gjensidige Forsikring ASA 574 0.0558,948 NOK Mowi ASA1 1,247 0.11180,248 NOK Norsk Hydro ASA 984 0.08100,729 NOK Orkla ASA 842 0.079,796 NOK Schibsted ASA 'A' 350 0.0312,879 NOK Schibsted ASA 'B' 393 0.0390,571 NOK Telenor ASA 1,358 0.1123,746 NOK Yara International ASA 1,053 0.09
Total Norway 11,719 0.98
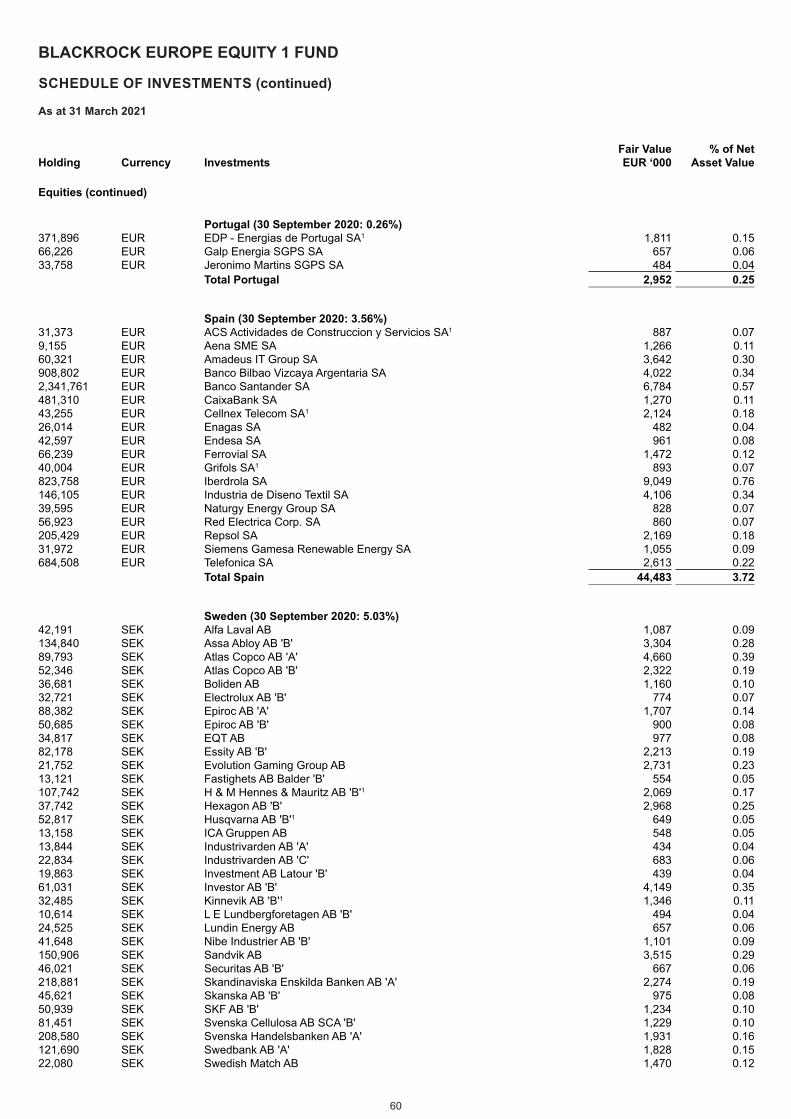
60
BLACKROCK EUROPE EQUITY 1 FUND
SCHEDULE OF INVESTMENTS (continued)
As at 31 March 2021
Holding Currency Investments Fair Value EUR ‘000
% of Net Asset Value
Equities (continued)
Portugal (30 September 2020: 0.26%)371,896 EUR EDP - Energias de Portugal SA1 1,811 0.1566,226 EUR Galp Energia SGPS SA 657 0.0633,758 EUR Jeronimo Martins SGPS SA 484 0.04
Total Portugal 2,952 0.25
Spain (30 September 2020: 3.56%)31,373 EUR ACS Actividades de Construccion y Servicios SA1 887 0.079,155 EUR Aena SME SA 1,266 0.1160,321 EUR Amadeus IT Group SA 3,642 0.30908,802 EUR Banco Bilbao Vizcaya Argentaria SA 4,022 0.342,341,761 EUR Banco Santander SA 6,784 0.57481,310 EUR CaixaBank SA 1,270 0.1143,255 EUR Cellnex Telecom SA1 2,124 0.1826,014 EUR Enagas SA 482 0.0442,597 EUR Endesa SA 961 0.0866,239 EUR Ferrovial SA 1,472 0.1240,004 EUR Grifols SA1 893 0.07823,758 EUR Iberdrola SA 9,049 0.76146,105 EUR Industria de Diseno Textil SA 4,106 0.3439,595 EUR Naturgy Energy Group SA 828 0.0756,923 EUR Red Electrica Corp. SA 860 0.07205,429 EUR Repsol SA 2,169 0.1831,972 EUR Siemens Gamesa Renewable Energy SA 1,055 0.09684,508 EUR Telefonica SA 2,613 0.22
Total Spain 44,483 3.72
Sweden (30 September 2020: 5.03%)42,191 SEK Alfa Laval AB 1,087 0.09134,840 SEK Assa Abloy AB 'B' 3,304 0.2889,793 SEK Atlas Copco AB 'A' 4,660 0.3952,346 SEK Atlas Copco AB 'B' 2,322 0.1936,681 SEK Boliden AB 1,160 0.1032,721 SEK Electrolux AB 'B' 774 0.0788,382 SEK Epiroc AB 'A' 1,707 0.1450,685 SEK Epiroc AB 'B' 900 0.0834,817 SEK EQT AB 977 0.0882,178 SEK Essity AB 'B' 2,213 0.1921,752 SEK Evolution Gaming Group AB 2,731 0.2313,121 SEK Fastighets AB Balder 'B' 554 0.05107,742 SEK H & M Hennes & Mauritz AB 'B'1 2,069 0.1737,742 SEK Hexagon AB 'B' 2,968 0.2552,817 SEK Husqvarna AB 'B'1 649 0.0513,158 SEK ICA Gruppen AB 548 0.0513,844 SEK Industrivarden AB 'A' 434 0.0422,834 SEK Industrivarden AB 'C' 683 0.0619,863 SEK Investment AB Latour 'B' 439 0.0461,031 SEK Investor AB 'B' 4,149 0.3532,485 SEK Kinnevik AB 'B'1 1,346 0.1110,614 SEK L E Lundbergforetagen AB 'B' 494 0.0424,525 SEK Lundin Energy AB 657 0.0641,648 SEK Nibe Industrier AB 'B' 1,101 0.09150,906 SEK Sandvik AB 3,515 0.2946,021 SEK Securitas AB 'B' 667 0.06218,881 SEK Skandinaviska Enskilda Banken AB 'A' 2,274 0.1945,621 SEK Skanska AB 'B' 975 0.0850,939 SEK SKF AB 'B' 1,234 0.1081,451 SEK Svenska Cellulosa AB SCA 'B' 1,229 0.10208,580 SEK Svenska Handelsbanken AB 'A' 1,931 0.16121,690 SEK Swedbank AB 'A' 1,828 0.1522,080 SEK Swedish Match AB 1,470 0.12
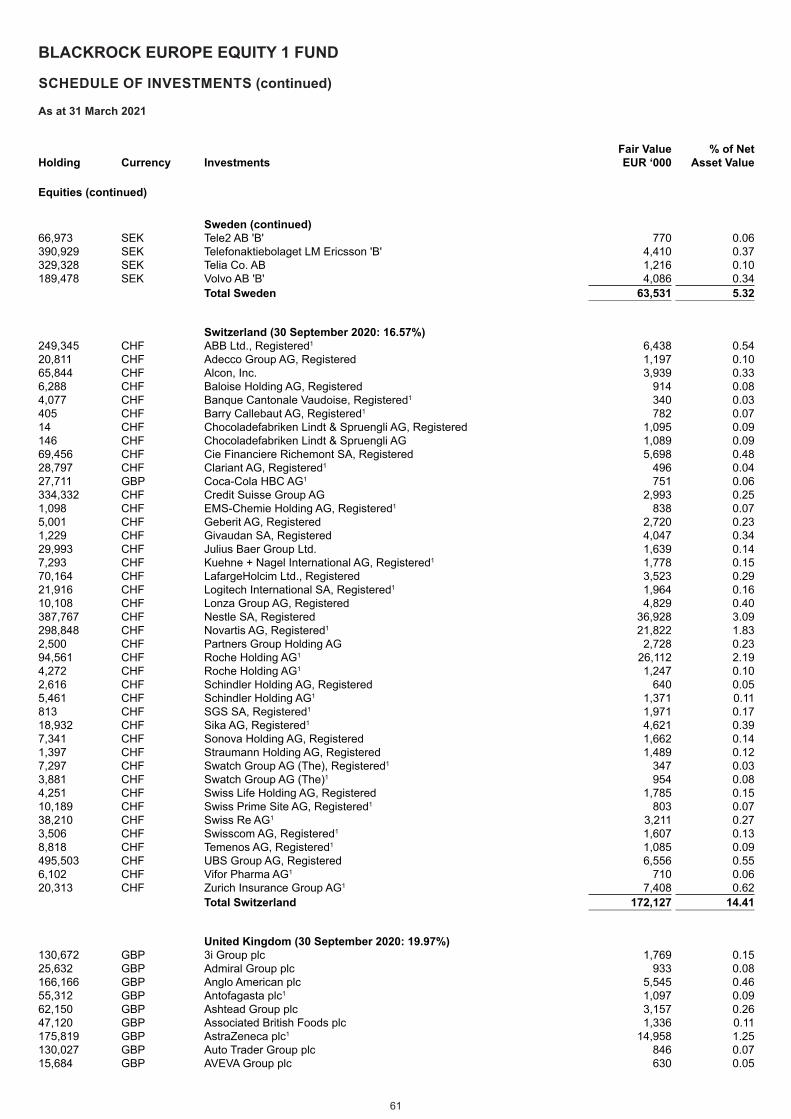
61
BLACKROCK EUROPE EQUITY 1 FUND
SCHEDULE OF INVESTMENTS (continued)
As at 31 March 2021
Holding Currency Investments Fair Value EUR ‘000
% of Net Asset Value
Equities (continued)
Sweden (continued) 66,973 SEK Tele2 AB 'B' 770 0.06390,929 SEK Telefonaktiebolaget LM Ericsson 'B' 4,410 0.37329,328 SEK Telia Co. AB 1,216 0.10189,478 SEK Volvo AB 'B' 4,086 0.34
Total Sweden 63,531 5.32
Switzerland (30 September 2020: 16.57%)249,345 CHF ABB Ltd., Registered1 6,438 0.5420,811 CHF Adecco Group AG, Registered 1,197 0.1065,844 CHF Alcon, Inc. 3,939 0.336,288 CHF Baloise Holding AG, Registered 914 0.084,077 CHF Banque Cantonale Vaudoise, Registered1 340 0.03405 CHF Barry Callebaut AG, Registered1 782 0.0714 CHF Chocoladefabriken Lindt & Spruengli AG, Registered 1,095 0.09146 CHF Chocoladefabriken Lindt & Spruengli AG 1,089 0.0969,456 CHF Cie Financiere Richemont SA, Registered 5,698 0.4828,797 CHF Clariant AG, Registered1 496 0.0427,711 GBP Coca-Cola HBC AG1 751 0.06334,332 CHF Credit Suisse Group AG 2,993 0.251,098 CHF EMS-Chemie Holding AG, Registered1 838 0.075,001 CHF Geberit AG, Registered 2,720 0.231,229 CHF Givaudan SA, Registered 4,047 0.3429,993 CHF Julius Baer Group Ltd. 1,639 0.147,293 CHF Kuehne + Nagel International AG, Registered1 1,778 0.1570,164 CHF LafargeHolcim Ltd., Registered 3,523 0.2921,916 CHF Logitech International SA, Registered1 1,964 0.1610,108 CHF Lonza Group AG, Registered 4,829 0.40387,767 CHF Nestle SA, Registered 36,928 3.09298,848 CHF Novartis AG, Registered1 21,822 1.832,500 CHF Partners Group Holding AG 2,728 0.2394,561 CHF Roche Holding AG1 26,112 2.194,272 CHF Roche Holding AG1 1,247 0.102,616 CHF Schindler Holding AG, Registered 640 0.055,461 CHF Schindler Holding AG1 1,371 0.11813 CHF SGS SA, Registered1 1,971 0.1718,932 CHF Sika AG, Registered1 4,621 0.397,341 CHF Sonova Holding AG, Registered 1,662 0.141,397 CHF Straumann Holding AG, Registered 1,489 0.127,297 CHF Swatch Group AG (The), Registered1 347 0.033,881 CHF Swatch Group AG (The)1 954 0.084,251 CHF Swiss Life Holding AG, Registered 1,785 0.1510,189 CHF Swiss Prime Site AG, Registered1 803 0.0738,210 CHF Swiss Re AG1 3,211 0.273,506 CHF Swisscom AG, Registered1 1,607 0.138,818 CHF Temenos AG, Registered1 1,085 0.09495,503 CHF UBS Group AG, Registered 6,556 0.556,102 CHF Vifor Pharma AG1 710 0.0620,313 CHF Zurich Insurance Group AG1 7,408 0.62
Total Switzerland 172,127 14.41
United Kingdom (30 September 2020: 19.97%)130,672 GBP 3i Group plc 1,769 0.1525,632 GBP Admiral Group plc 933 0.08166,166 GBP Anglo American plc 5,545 0.4655,312 GBP Antofagasta plc1 1,097 0.0962,150 GBP Ashtead Group plc 3,157 0.2647,120 GBP Associated British Foods plc 1,336 0.11175,819 GBP AstraZeneca plc1 14,958 1.25130,027 GBP Auto Trader Group plc 846 0.0715,684 GBP AVEVA Group plc 630 0.05
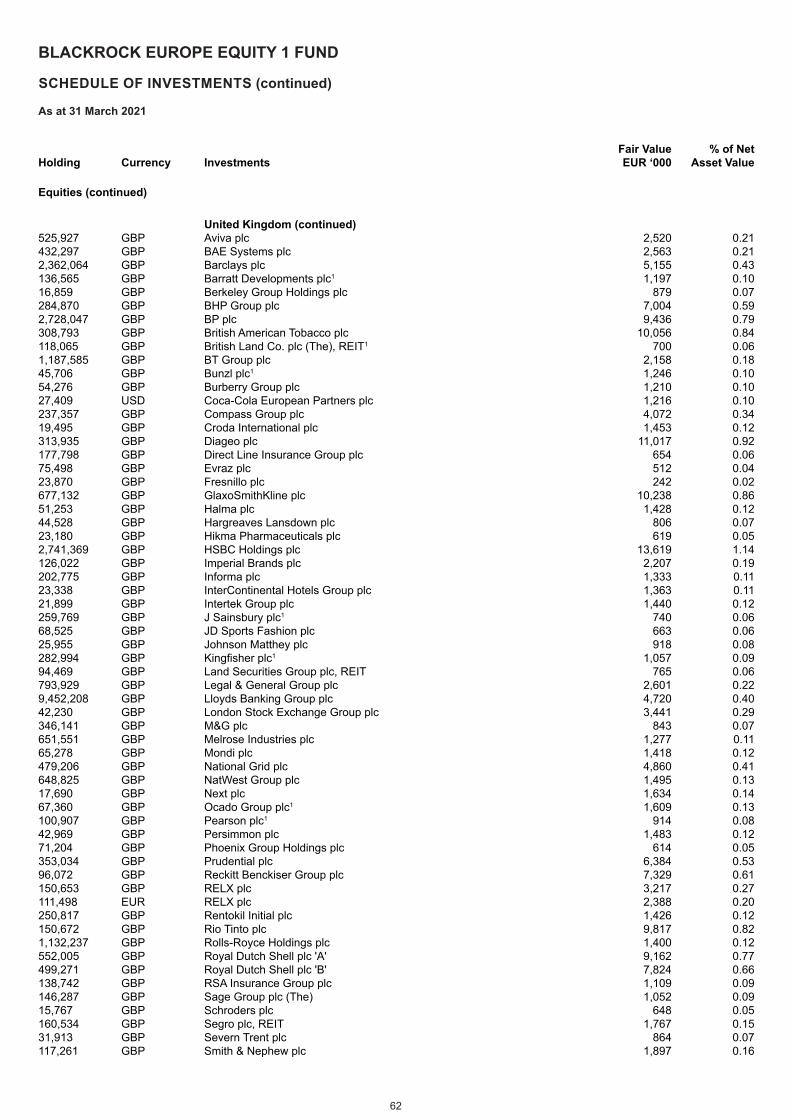
62
BLACKROCK EUROPE EQUITY 1 FUND
SCHEDULE OF INVESTMENTS (continued)
As at 31 March 2021
Holding Currency Investments Fair Value EUR ‘000
% of Net Asset Value
Equities (continued)
United Kingdom (continued) 525,927 GBP Aviva plc 2,520 0.21432,297 GBP BAE Systems plc 2,563 0.212,362,064 GBP Barclays plc 5,155 0.43136,565 GBP Barratt Developments plc1 1,197 0.1016,859 GBP Berkeley Group Holdings plc 879 0.07284,870 GBP BHP Group plc 7,004 0.592,728,047 GBP BP plc 9,436 0.79308,793 GBP British American Tobacco plc 10,056 0.84118,065 GBP British Land Co. plc (The), REIT1 700 0.061,187,585 GBP BT Group plc 2,158 0.1845,706 GBP Bunzl plc1 1,246 0.1054,276 GBP Burberry Group plc 1,210 0.1027,409 USD Coca-Cola European Partners plc 1,216 0.10237,357 GBP Compass Group plc 4,072 0.3419,495 GBP Croda International plc 1,453 0.12313,935 GBP Diageo plc 11,017 0.92177,798 GBP Direct Line Insurance Group plc 654 0.0675,498 GBP Evraz plc 512 0.0423,870 GBP Fresnillo plc 242 0.02677,132 GBP GlaxoSmithKline plc 10,238 0.8651,253 GBP Halma plc 1,428 0.1244,528 GBP Hargreaves Lansdown plc 806 0.0723,180 GBP Hikma Pharmaceuticals plc 619 0.052,741,369 GBP HSBC Holdings plc 13,619 1.14126,022 GBP Imperial Brands plc 2,207 0.19202,775 GBP Informa plc 1,333 0.1123,338 GBP InterContinental Hotels Group plc 1,363 0.1121,899 GBP Intertek Group plc 1,440 0.12259,769 GBP J Sainsbury plc1 740 0.0668,525 GBP JD Sports Fashion plc 663 0.0625,955 GBP Johnson Matthey plc 918 0.08282,994 GBP Kingfisher plc1 1,057 0.0994,469 GBP Land Securities Group plc, REIT 765 0.06793,929 GBP Legal & General Group plc 2,601 0.229,452,208 GBP Lloyds Banking Group plc 4,720 0.4042,230 GBP London Stock Exchange Group plc 3,441 0.29346,141 GBP M&G plc 843 0.07651,551 GBP Melrose Industries plc 1,277 0.1165,278 GBP Mondi plc 1,418 0.12479,206 GBP National Grid plc 4,860 0.41648,825 GBP NatWest Group plc 1,495 0.1317,690 GBP Next plc 1,634 0.1467,360 GBP Ocado Group plc1 1,609 0.13100,907 GBP Pearson plc1 914 0.0842,969 GBP Persimmon plc 1,483 0.1271,204 GBP Phoenix Group Holdings plc 614 0.05353,034 GBP Prudential plc 6,384 0.5396,072 GBP Reckitt Benckiser Group plc 7,329 0.61150,653 GBP RELX plc 3,217 0.27111,498 EUR RELX plc 2,388 0.20250,817 GBP Rentokil Initial plc 1,426 0.12150,672 GBP Rio Tinto plc 9,817 0.821,132,237 GBP Rolls-Royce Holdings plc 1,400 0.12552,005 GBP Royal Dutch Shell plc 'A' 9,162 0.77499,271 GBP Royal Dutch Shell plc 'B' 7,824 0.66138,742 GBP RSA Insurance Group plc 1,109 0.09146,287 GBP Sage Group plc (The) 1,052 0.0915,767 GBP Schroders plc 648 0.05160,534 GBP Segro plc, REIT 1,767 0.1531,913 GBP Severn Trent plc 864 0.07117,261 GBP Smith & Nephew plc 1,897 0.16
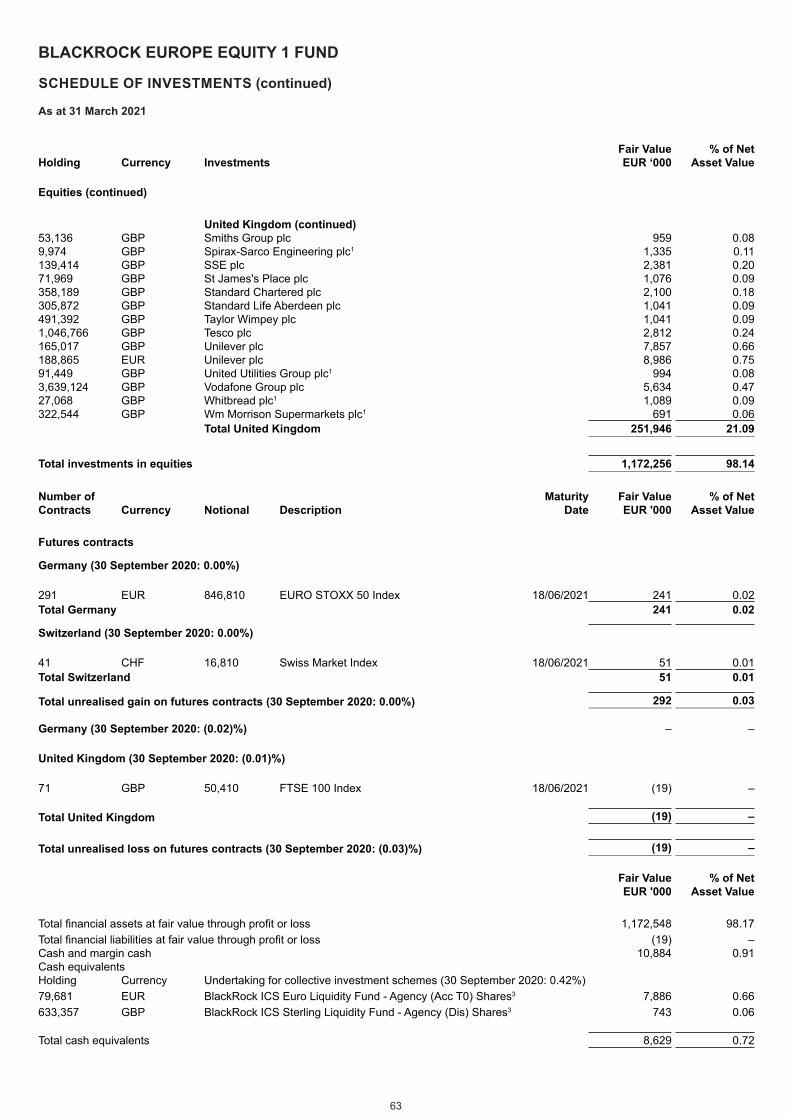
63
BLACKROCK EUROPE EQUITY 1 FUND
SCHEDULE OF INVESTMENTS (continued)
As at 31 March 2021
Holding Currency Investments Fair Value EUR ‘000
% of Net Asset Value
Equities (continued)
United Kingdom (continued) 53,136 GBP Smiths Group plc 959 0.089,974 GBP Spirax-Sarco Engineering plc1 1,335 0.11139,414 GBP SSE plc 2,381 0.2071,969 GBP St James's Place plc 1,076 0.09358,189 GBP Standard Chartered plc 2,100 0.18305,872 GBP Standard Life Aberdeen plc 1,041 0.09491,392 GBP Taylor Wimpey plc 1,041 0.091,046,766 GBP Tesco plc 2,812 0.24165,017 GBP Unilever plc 7,857 0.66188,865 EUR Unilever plc 8,986 0.7591,449 GBP United Utilities Group plc1 994 0.083,639,124 GBP Vodafone Group plc 5,634 0.4727,068 GBP Whitbread plc1 1,089 0.09322,544 GBP Wm Morrison Supermarkets plc1 691 0.06
Total United Kingdom 251,946 21.09
Total investments in equities 1,172,256 98.14 Number of Maturity Fair Value % of NetContracts Currency Notional Description Date EUR '000 Asset Value
Futures contracts
Germany (30 September 2020: 0.00%)
291 EUR 846,810 EURO STOXX 50 Index 18/06/2021 241 0.02Total Germany 241 0.02
Switzerland (30 September 2020: 0.00%)
41 CHF 16,810 Swiss Market Index 18/06/2021 51 0.01Total Switzerland 51 0.01
Total unrealised gain on futures contracts (30 September 2020: 0.00%) 292 0.03 Germany (30 September 2020: (0.02)%) – –
United Kingdom (30 September 2020: (0.01)%)
71 GBP 50,410 FTSE 100 Index 18/06/2021 (19) – Total United Kingdom (19) – Total unrealised loss on futures contracts (30 September 2020: (0.03)%) (19) –
Fair Value EUR '000
% of Net Asset Value
Total financial assets at fair value through profit or loss 1,172,548 98.17Total financial liabilities at fair value through profit or loss (19) –Cash and margin cash 10,884 0.91Cash equivalentsHolding Currency Undertaking for collective investment schemes (30 September 2020: 0.42%)79,681 EUR BlackRock ICS Euro Liquidity Fund - Agency (Acc T0) Shares3 7,886 0.66633,357 GBP BlackRock ICS Sterling Liquidity Fund - Agency (Dis) Shares3 743 0.06
Total cash equivalents 8,629 0.72
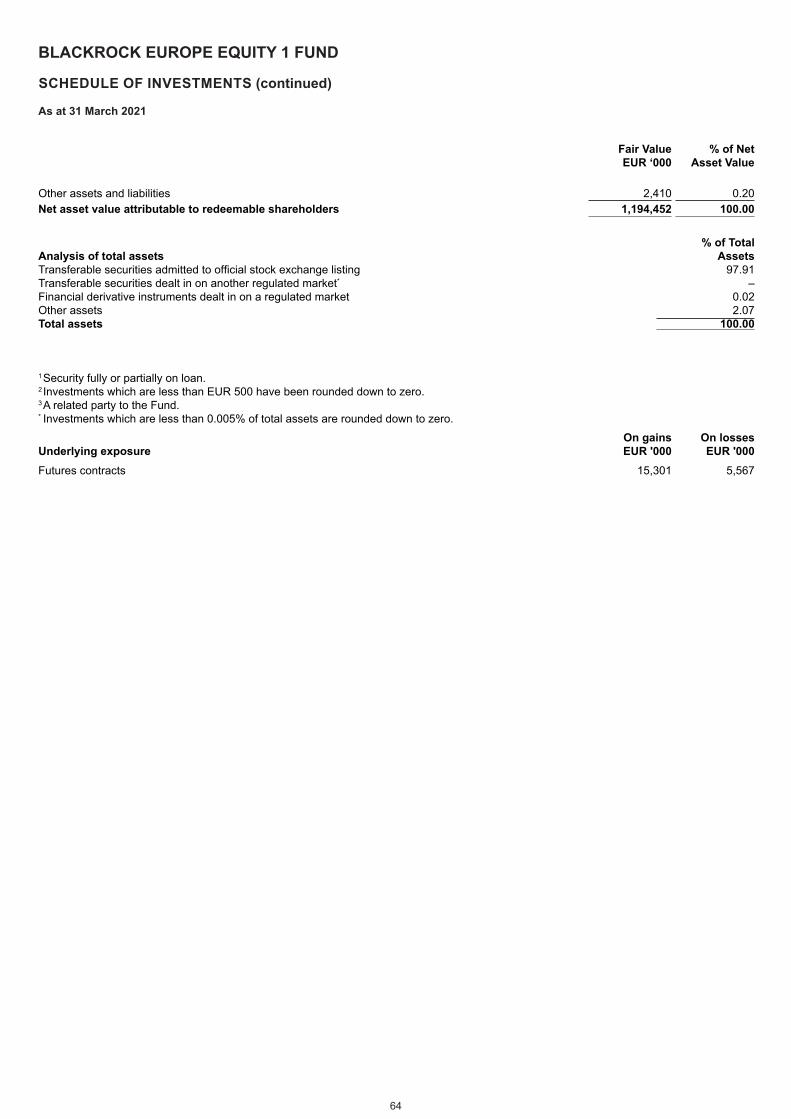
64
BLACKROCK EUROPE EQUITY 1 FUND
SCHEDULE OF INVESTMENTS (continued)
As at 31 March 2021
Fair Value EUR ‘000
% of Net Asset Value
Other assets and liabilities 2,410 0.20Net asset value attributable to redeemable shareholders 1,194,452 100.00
Analysis of total assets % of Total
AssetsTransferable securities admitted to official stock exchange listing 97.91Transferable securities dealt in on another regulated market* –Financial derivative instruments dealt in on a regulated market 0.02Other assets 2.07Total assets 100.00 1Security fully or partially on loan.2 Investments which are less than EUR 500 have been rounded down to zero.3A related party to the Fund.* Investments which are less than 0.005% of total assets are rounded down to zero.
Underlying exposureOn gains EUR '000
On losses EUR '000
Futures contracts 15,301 5,567
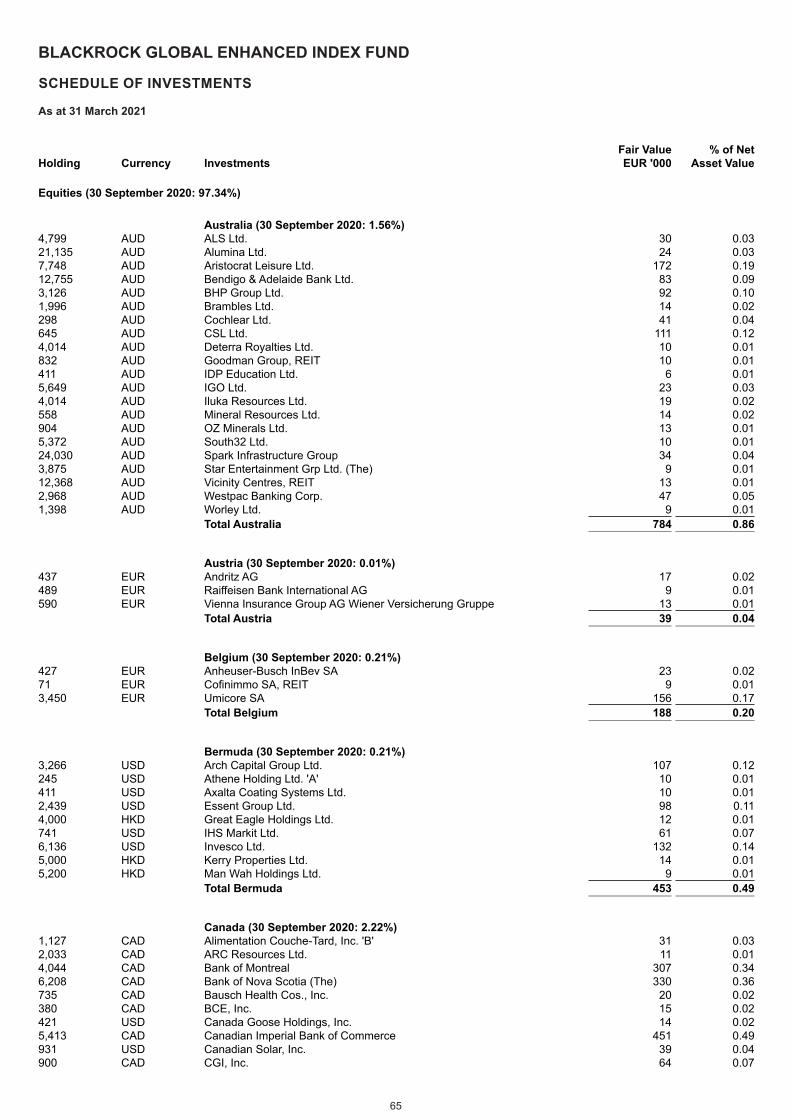
65
BLACKROCK GLOBAL ENHANCED INDEX FUND
SCHEDULE OF INVESTMENTS
As at 31 March 2021
Holding Currency InvestmentsFair Value EUR '000
% of Net Asset Value
Equities (30 September 2020: 97.34%)
Australia (30 September 2020: 1.56%)4,799 AUD ALS Ltd. 30 0.0321,135 AUD Alumina Ltd. 24 0.037,748 AUD Aristocrat Leisure Ltd. 172 0.1912,755 AUD Bendigo & Adelaide Bank Ltd. 83 0.093,126 AUD BHP Group Ltd. 92 0.101,996 AUD Brambles Ltd. 14 0.02298 AUD Cochlear Ltd. 41 0.04645 AUD CSL Ltd. 111 0.124,014 AUD Deterra Royalties Ltd. 10 0.01832 AUD Goodman Group, REIT 10 0.01411 AUD IDP Education Ltd. 6 0.015,649 AUD IGO Ltd. 23 0.034,014 AUD Iluka Resources Ltd. 19 0.02558 AUD Mineral Resources Ltd. 14 0.02904 AUD OZ Minerals Ltd. 13 0.015,372 AUD South32 Ltd. 10 0.0124,030 AUD Spark Infrastructure Group 34 0.043,875 AUD Star Entertainment Grp Ltd. (The) 9 0.0112,368 AUD Vicinity Centres, REIT 13 0.012,968 AUD Westpac Banking Corp. 47 0.051,398 AUD Worley Ltd. 9 0.01
Total Australia 784 0.86
Austria (30 September 2020: 0.01%)437 EUR Andritz AG 17 0.02489 EUR Raiffeisen Bank International AG 9 0.01590 EUR Vienna Insurance Group AG Wiener Versicherung Gruppe 13 0.01
Total Austria 39 0.04
Belgium (30 September 2020: 0.21%)427 EUR Anheuser-Busch InBev SA 23 0.0271 EUR Cofinimmo SA, REIT 9 0.013,450 EUR Umicore SA 156 0.17
Total Belgium 188 0.20
Bermuda (30 September 2020: 0.21%)3,266 USD Arch Capital Group Ltd. 107 0.12245 USD Athene Holding Ltd. 'A' 10 0.01411 USD Axalta Coating Systems Ltd. 10 0.012,439 USD Essent Group Ltd. 98 0.114,000 HKD Great Eagle Holdings Ltd. 12 0.01741 USD IHS Markit Ltd. 61 0.076,136 USD Invesco Ltd. 132 0.145,000 HKD Kerry Properties Ltd. 14 0.015,200 HKD Man Wah Holdings Ltd. 9 0.01
Total Bermuda 453 0.49
Canada (30 September 2020: 2.22%)1,127 CAD Alimentation Couche-Tard, Inc. 'B' 31 0.032,033 CAD ARC Resources Ltd. 11 0.014,044 CAD Bank of Montreal 307 0.346,208 CAD Bank of Nova Scotia (The) 330 0.36735 CAD Bausch Health Cos., Inc. 20 0.02380 CAD BCE, Inc. 15 0.02421 USD Canada Goose Holdings, Inc. 14 0.025,413 CAD Canadian Imperial Bank of Commerce 451 0.49931 USD Canadian Solar, Inc. 39 0.04900 CAD CGI, Inc. 64 0.07
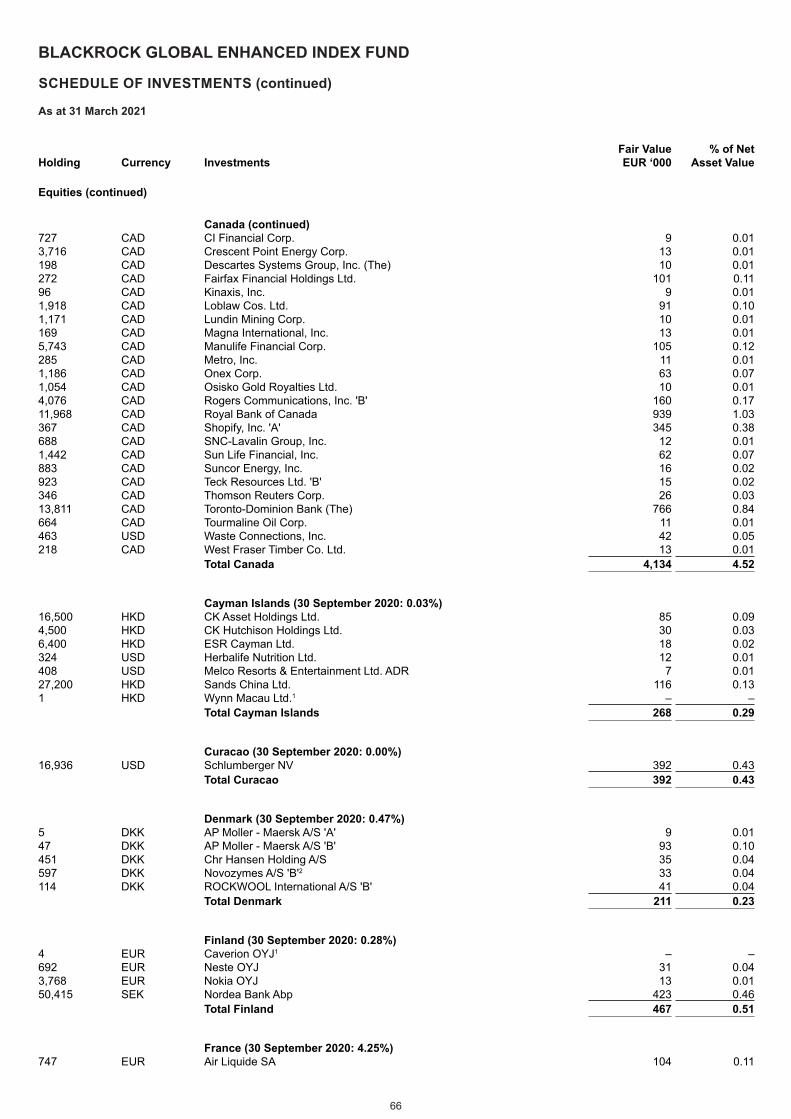
66
BLACKROCK GLOBAL ENHANCED INDEX FUND
SCHEDULE OF INVESTMENTS (continued)
As at 31 March 2021
Holding Currency Investments Fair Value EUR ‘000
% of Net Asset Value
Equities (continued)
Canada (continued) 727 CAD CI Financial Corp. 9 0.013,716 CAD Crescent Point Energy Corp. 13 0.01198 CAD Descartes Systems Group, Inc. (The) 10 0.01272 CAD Fairfax Financial Holdings Ltd. 101 0.1196 CAD Kinaxis, Inc. 9 0.011,918 CAD Loblaw Cos. Ltd. 91 0.101,171 CAD Lundin Mining Corp. 10 0.01169 CAD Magna International, Inc. 13 0.015,743 CAD Manulife Financial Corp. 105 0.12285 CAD Metro, Inc. 11 0.011,186 CAD Onex Corp. 63 0.071,054 CAD Osisko Gold Royalties Ltd. 10 0.014,076 CAD Rogers Communications, Inc. 'B' 160 0.1711,968 CAD Royal Bank of Canada 939 1.03367 CAD Shopify, Inc. 'A' 345 0.38688 CAD SNC-Lavalin Group, Inc. 12 0.011,442 CAD Sun Life Financial, Inc. 62 0.07883 CAD Suncor Energy, Inc. 16 0.02923 CAD Teck Resources Ltd. 'B' 15 0.02346 CAD Thomson Reuters Corp. 26 0.0313,811 CAD Toronto-Dominion Bank (The) 766 0.84664 CAD Tourmaline Oil Corp. 11 0.01463 USD Waste Connections, Inc. 42 0.05218 CAD West Fraser Timber Co. Ltd. 13 0.01
Total Canada 4,134 4.52
Cayman Islands (30 September 2020: 0.03%)16,500 HKD CK Asset Holdings Ltd. 85 0.094,500 HKD CK Hutchison Holdings Ltd. 30 0.036,400 HKD ESR Cayman Ltd. 18 0.02324 USD Herbalife Nutrition Ltd. 12 0.01408 USD Melco Resorts & Entertainment Ltd. ADR 7 0.0127,200 HKD Sands China Ltd. 116 0.131 HKD Wynn Macau Ltd.1 – –
Total Cayman Islands 268 0.29
Curacao (30 September 2020: 0.00%)16,936 USD Schlumberger NV 392 0.43
Total Curacao 392 0.43
Denmark (30 September 2020: 0.47%)5 DKK AP Moller - Maersk A/S 'A' 9 0.0147 DKK AP Moller - Maersk A/S 'B' 93 0.10451 DKK Chr Hansen Holding A/S 35 0.04597 DKK Novozymes A/S 'B'2 33 0.04114 DKK ROCKWOOL International A/S 'B' 41 0.04
Total Denmark 211 0.23
Finland (30 September 2020: 0.28%)4 EUR Caverion OYJ1 – –692 EUR Neste OYJ 31 0.043,768 EUR Nokia OYJ 13 0.0150,415 SEK Nordea Bank Abp 423 0.46
Total Finland 467 0.51
France (30 September 2020: 4.25%)747 EUR Air Liquide SA 104 0.11
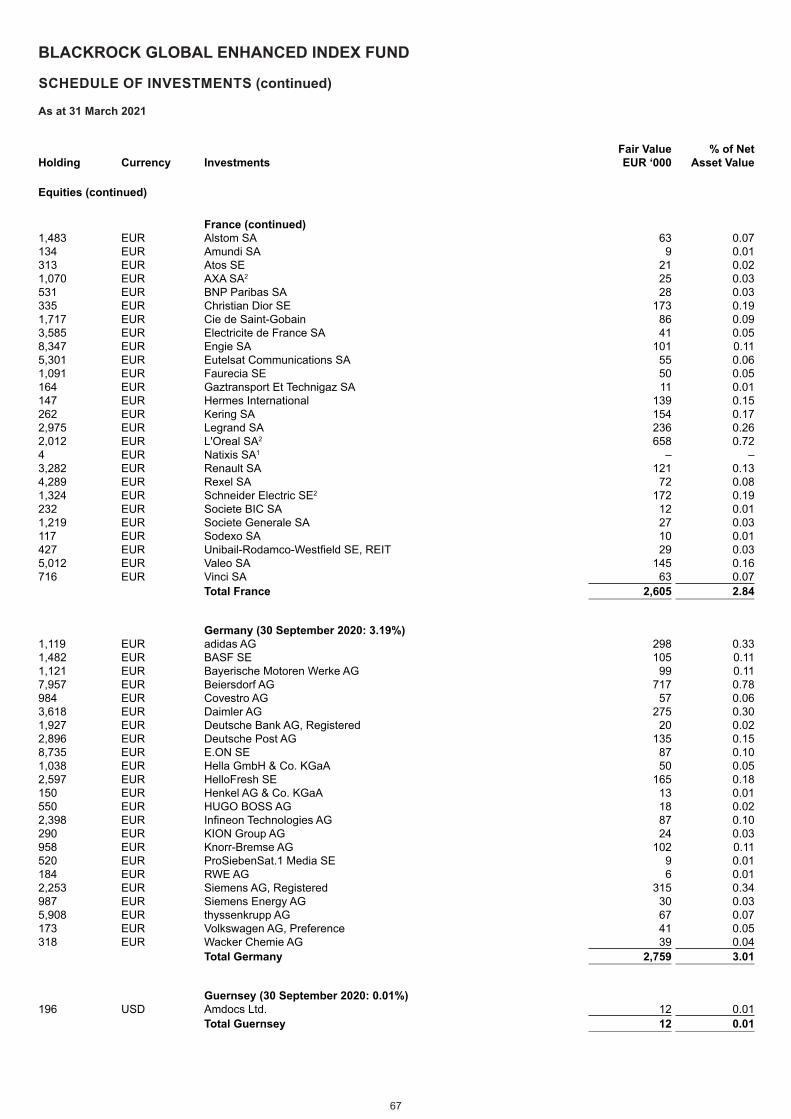
67
BLACKROCK GLOBAL ENHANCED INDEX FUND
SCHEDULE OF INVESTMENTS (continued)
As at 31 March 2021
Holding Currency Investments Fair Value EUR ‘000
% of Net Asset Value
Equities (continued)
France (continued) 1,483 EUR Alstom SA 63 0.07134 EUR Amundi SA 9 0.01313 EUR Atos SE 21 0.021,070 EUR AXA SA2 25 0.03531 EUR BNP Paribas SA 28 0.03335 EUR Christian Dior SE 173 0.191,717 EUR Cie de Saint-Gobain 86 0.093,585 EUR Electricite de France SA 41 0.058,347 EUR Engie SA 101 0.115,301 EUR Eutelsat Communications SA 55 0.061,091 EUR Faurecia SE 50 0.05164 EUR Gaztransport Et Technigaz SA 11 0.01147 EUR Hermes International 139 0.15262 EUR Kering SA 154 0.172,975 EUR Legrand SA 236 0.262,012 EUR L'Oreal SA2 658 0.724 EUR Natixis SA1 – –3,282 EUR Renault SA 121 0.134,289 EUR Rexel SA 72 0.081,324 EUR Schneider Electric SE2 172 0.19232 EUR Societe BIC SA 12 0.011,219 EUR Societe Generale SA 27 0.03117 EUR Sodexo SA 10 0.01427 EUR Unibail-Rodamco-Westfield SE, REIT 29 0.035,012 EUR Valeo SA 145 0.16716 EUR Vinci SA 63 0.07
Total France 2,605 2.84
Germany (30 September 2020: 3.19%)1,119 EUR adidas AG 298 0.331,482 EUR BASF SE 105 0.111,121 EUR Bayerische Motoren Werke AG 99 0.117,957 EUR Beiersdorf AG 717 0.78984 EUR Covestro AG 57 0.063,618 EUR Daimler AG 275 0.301,927 EUR Deutsche Bank AG, Registered 20 0.022,896 EUR Deutsche Post AG 135 0.158,735 EUR E.ON SE 87 0.101,038 EUR Hella GmbH & Co. KGaA 50 0.052,597 EUR HelloFresh SE 165 0.18150 EUR Henkel AG & Co. KGaA 13 0.01550 EUR HUGO BOSS AG 18 0.022,398 EUR Infineon Technologies AG 87 0.10290 EUR KION Group AG 24 0.03958 EUR Knorr-Bremse AG 102 0.11520 EUR ProSiebenSat.1 Media SE 9 0.01184 EUR RWE AG 6 0.012,253 EUR Siemens AG, Registered 315 0.34987 EUR Siemens Energy AG 30 0.035,908 EUR thyssenkrupp AG 67 0.07173 EUR Volkswagen AG, Preference 41 0.05318 EUR Wacker Chemie AG 39 0.04
Total Germany 2,759 3.01
Guernsey (30 September 2020: 0.01%)196 USD Amdocs Ltd. 12 0.01
Total Guernsey 12 0.01
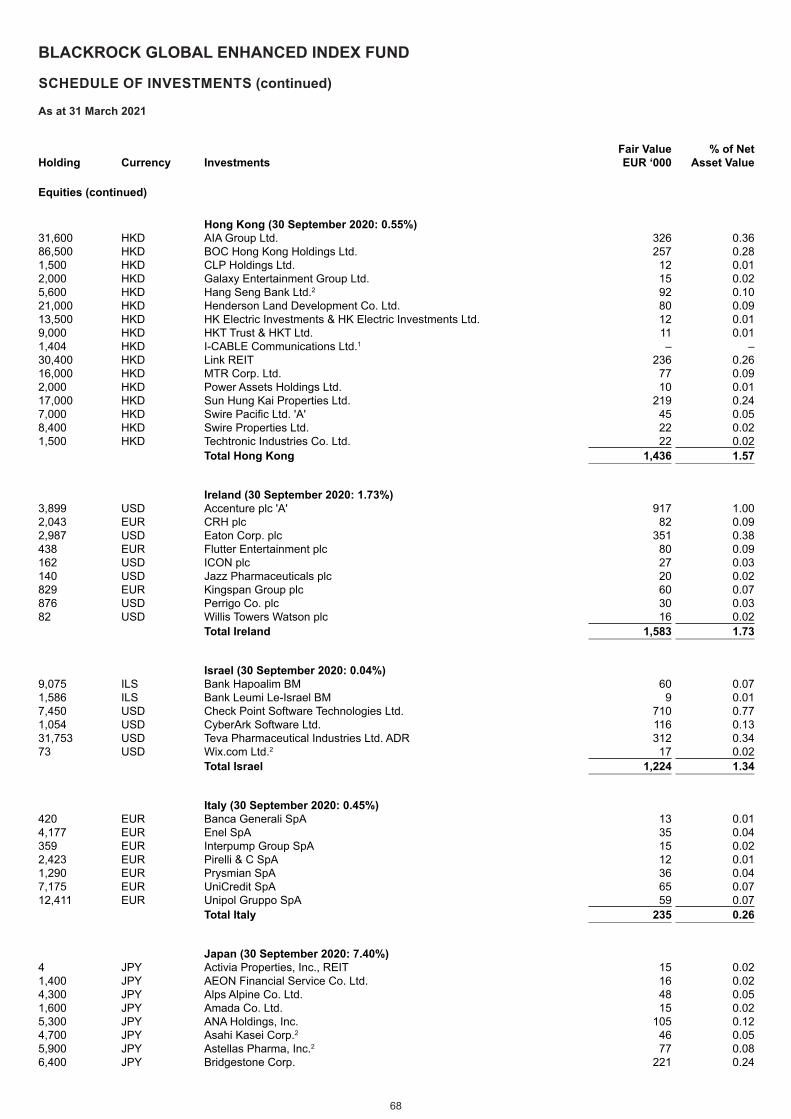
68
BLACKROCK GLOBAL ENHANCED INDEX FUND
SCHEDULE OF INVESTMENTS (continued)
As at 31 March 2021
Holding Currency Investments Fair Value EUR ‘000
% of Net Asset Value
Equities (continued)
Hong Kong (30 September 2020: 0.55%)31,600 HKD AIA Group Ltd. 326 0.3686,500 HKD BOC Hong Kong Holdings Ltd. 257 0.281,500 HKD CLP Holdings Ltd. 12 0.012,000 HKD Galaxy Entertainment Group Ltd. 15 0.025,600 HKD Hang Seng Bank Ltd.2 92 0.1021,000 HKD Henderson Land Development Co. Ltd. 80 0.0913,500 HKD HK Electric Investments & HK Electric Investments Ltd. 12 0.019,000 HKD HKT Trust & HKT Ltd. 11 0.011,404 HKD I-CABLE Communications Ltd.1 – –30,400 HKD Link REIT 236 0.2616,000 HKD MTR Corp. Ltd. 77 0.092,000 HKD Power Assets Holdings Ltd. 10 0.0117,000 HKD Sun Hung Kai Properties Ltd. 219 0.247,000 HKD Swire Pacific Ltd. 'A' 45 0.058,400 HKD Swire Properties Ltd. 22 0.021,500 HKD Techtronic Industries Co. Ltd. 22 0.02
Total Hong Kong 1,436 1.57
Ireland (30 September 2020: 1.73%)3,899 USD Accenture plc 'A' 917 1.002,043 EUR CRH plc 82 0.092,987 USD Eaton Corp. plc 351 0.38438 EUR Flutter Entertainment plc 80 0.09162 USD ICON plc 27 0.03140 USD Jazz Pharmaceuticals plc 20 0.02829 EUR Kingspan Group plc 60 0.07876 USD Perrigo Co. plc 30 0.0382 USD Willis Towers Watson plc 16 0.02
Total Ireland 1,583 1.73
Israel (30 September 2020: 0.04%)9,075 ILS Bank Hapoalim BM 60 0.071,586 ILS Bank Leumi Le-Israel BM 9 0.017,450 USD Check Point Software Technologies Ltd. 710 0.771,054 USD CyberArk Software Ltd. 116 0.1331,753 USD Teva Pharmaceutical Industries Ltd. ADR 312 0.3473 USD Wix.com Ltd.2 17 0.02
Total Israel 1,224 1.34
Italy (30 September 2020: 0.45%)420 EUR Banca Generali SpA 13 0.014,177 EUR Enel SpA 35 0.04359 EUR Interpump Group SpA 15 0.022,423 EUR Pirelli & C SpA 12 0.011,290 EUR Prysmian SpA 36 0.047,175 EUR UniCredit SpA 65 0.0712,411 EUR Unipol Gruppo SpA 59 0.07
Total Italy 235 0.26
Japan (30 September 2020: 7.40%)4 JPY Activia Properties, Inc., REIT 15 0.021,400 JPY AEON Financial Service Co. Ltd. 16 0.024,300 JPY Alps Alpine Co. Ltd. 48 0.051,600 JPY Amada Co. Ltd. 15 0.025,300 JPY ANA Holdings, Inc. 105 0.124,700 JPY Asahi Kasei Corp.2 46 0.055,900 JPY Astellas Pharma, Inc.2 77 0.086,400 JPY Bridgestone Corp. 221 0.24
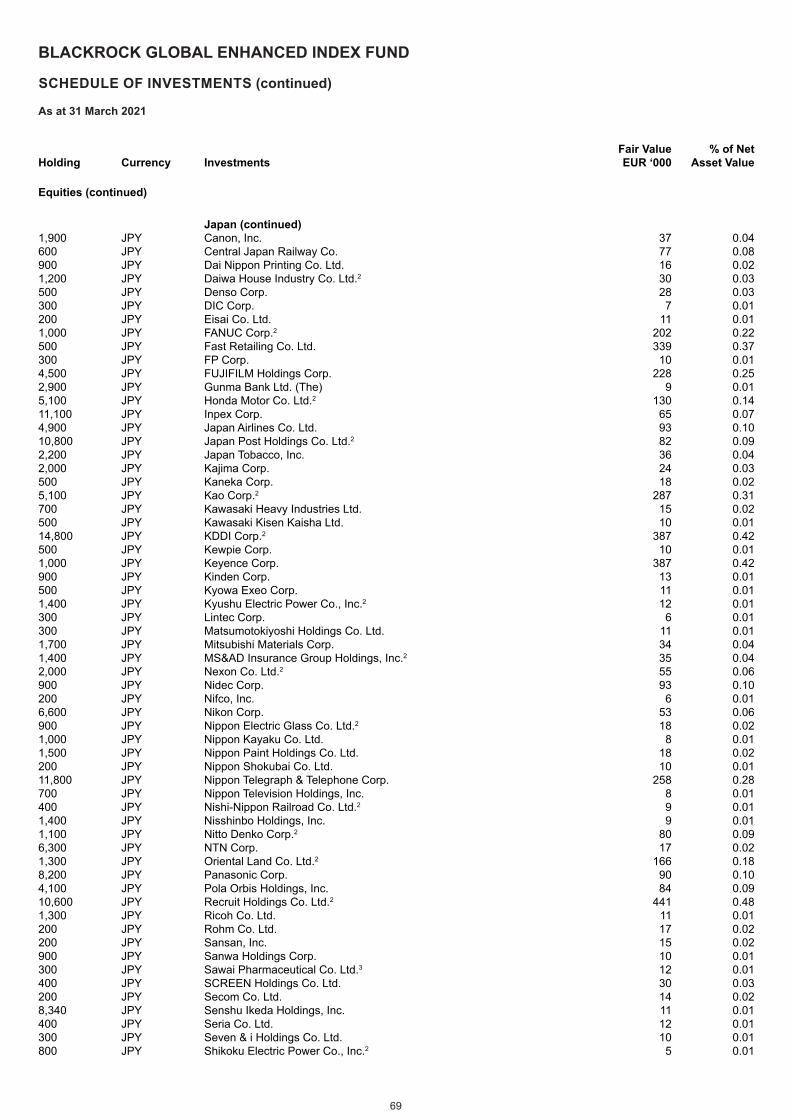
69
BLACKROCK GLOBAL ENHANCED INDEX FUND
SCHEDULE OF INVESTMENTS (continued)
As at 31 March 2021
Holding Currency Investments Fair Value EUR ‘000
% of Net Asset Value
Equities (continued)
Japan (continued) 1,900 JPY Canon, Inc. 37 0.04600 JPY Central Japan Railway Co. 77 0.08900 JPY Dai Nippon Printing Co. Ltd. 16 0.021,200 JPY Daiwa House Industry Co. Ltd.2 30 0.03500 JPY Denso Corp. 28 0.03300 JPY DIC Corp. 7 0.01200 JPY Eisai Co. Ltd. 11 0.011,000 JPY FANUC Corp.2 202 0.22500 JPY Fast Retailing Co. Ltd. 339 0.37300 JPY FP Corp. 10 0.014,500 JPY FUJIFILM Holdings Corp. 228 0.252,900 JPY Gunma Bank Ltd. (The) 9 0.015,100 JPY Honda Motor Co. Ltd.2 130 0.1411,100 JPY Inpex Corp. 65 0.074,900 JPY Japan Airlines Co. Ltd. 93 0.1010,800 JPY Japan Post Holdings Co. Ltd.2 82 0.092,200 JPY Japan Tobacco, Inc. 36 0.042,000 JPY Kajima Corp. 24 0.03500 JPY Kaneka Corp. 18 0.025,100 JPY Kao Corp.2 287 0.31700 JPY Kawasaki Heavy Industries Ltd. 15 0.02500 JPY Kawasaki Kisen Kaisha Ltd. 10 0.0114,800 JPY KDDI Corp.2 387 0.42500 JPY Kewpie Corp. 10 0.011,000 JPY Keyence Corp. 387 0.42900 JPY Kinden Corp. 13 0.01500 JPY Kyowa Exeo Corp. 11 0.011,400 JPY Kyushu Electric Power Co., Inc.2 12 0.01300 JPY Lintec Corp. 6 0.01300 JPY Matsumotokiyoshi Holdings Co. Ltd. 11 0.011,700 JPY Mitsubishi Materials Corp. 34 0.041,400 JPY MS&AD Insurance Group Holdings, Inc.2 35 0.042,000 JPY Nexon Co. Ltd.2 55 0.06900 JPY Nidec Corp. 93 0.10200 JPY Nifco, Inc. 6 0.016,600 JPY Nikon Corp. 53 0.06900 JPY Nippon Electric Glass Co. Ltd.2 18 0.021,000 JPY Nippon Kayaku Co. Ltd. 8 0.011,500 JPY Nippon Paint Holdings Co. Ltd. 18 0.02200 JPY Nippon Shokubai Co. Ltd. 10 0.0111,800 JPY Nippon Telegraph & Telephone Corp. 258 0.28700 JPY Nippon Television Holdings, Inc. 8 0.01400 JPY Nishi-Nippon Railroad Co. Ltd.2 9 0.011,400 JPY Nisshinbo Holdings, Inc. 9 0.011,100 JPY Nitto Denko Corp.2 80 0.096,300 JPY NTN Corp. 17 0.021,300 JPY Oriental Land Co. Ltd.2 166 0.188,200 JPY Panasonic Corp. 90 0.104,100 JPY Pola Orbis Holdings, Inc. 84 0.0910,600 JPY Recruit Holdings Co. Ltd.2 441 0.481,300 JPY Ricoh Co. Ltd. 11 0.01200 JPY Rohm Co. Ltd. 17 0.02200 JPY Sansan, Inc. 15 0.02900 JPY Sanwa Holdings Corp. 10 0.01300 JPY Sawai Pharmaceutical Co. Ltd.3 12 0.01400 JPY SCREEN Holdings Co. Ltd. 30 0.03200 JPY Secom Co. Ltd. 14 0.028,340 JPY Senshu Ikeda Holdings, Inc. 11 0.01400 JPY Seria Co. Ltd. 12 0.01300 JPY Seven & i Holdings Co. Ltd. 10 0.01800 JPY Shikoku Electric Power Co., Inc.2 5 0.01

70
BLACKROCK GLOBAL ENHANCED INDEX FUND
SCHEDULE OF INVESTMENTS (continued)
As at 31 March 2021
Holding Currency Investments Fair Value EUR ‘000
% of Net Asset Value
Equities (continued)
Japan (continued) 200 JPY Shimano, Inc. 41 0.04100 JPY SMC Corp. 50 0.055,900 JPY SoftBank Corp.2 65 0.073,100 JPY SoftBank Group Corp.2 223 0.242,300 JPY Subaru Corp.2 39 0.0414,800 JPY Sumitomo Chemical Co. Ltd.2 65 0.07300 JPY Sumitomo Heavy Industries Ltd. 7 0.012,600 JPY Sumitomo Mitsui Financial Group, Inc.2 80 0.09200 JPY Suntory Beverage & Food Ltd. 6 0.01500 JPY Sysmex Corp. 46 0.053,300 JPY Teijin Ltd. 49 0.05300 JPY Tokyo Electron Ltd. 108 0.12500 JPY Tokyo Gas Co. Ltd. 10 0.012,400 JPY Toray Industries, Inc. 13 0.017,500 JPY Toshiba Corp.2 216 0.241,100 JPY Toyo Seikan Group Holdings Ltd. 11 0.011,000 JPY Toyota Boshoku Corp. 14 0.02200 JPY Toyota Motor Corp.2 13 0.021,600 JPY Ube Industries Ltd. 29 0.03800 JPY Ulvac, Inc. 29 0.033,100 JPY Unicharm Corp.2 111 0.121,000 JPY Yakult Honsha Co. Ltd. 43 0.055,900 JPY Yamada Holdings Co. Ltd. 27 0.03200 JPY Yamaha Corp. 9 0.01600 JPY Yaskawa Electric Corp.2 26 0.031,000 JPY Zeon Corp. 14 0.02
Total Japan 6,117 6.68
Jersey (30 September 2020: 0.50%)204 USD Aptiv plc 24 0.036,598 GBP Experian plc 193 0.2149,568 GBP Glencore plc 165 0.18820 USD Janus Henderson Group plc 22 0.022,082 GBP WPP plc 23 0.03
Total Jersey 427 0.47
Luxembourg (30 September 2020: 0.11%)2,009 NOK Subsea 7 SA 17 0.02
Total Luxembourg 17 0.02
Netherlands (30 September 2020: 1.81%)6,090 EUR ABN AMRO Bank NV CVA 63 0.0760,462 EUR Aegon NV 245 0.27177 EUR Akzo Nobel NV 17 0.02203 EUR Euronext NV 18 0.02693 EUR Heineken NV 61 0.0715,827 EUR ING Groep NV 165 0.1811,580 EUR Koninklijke Ahold Delhaize NV 275 0.301,905 EUR NN Group NV 79 0.09310 USD NXP Semiconductors NV 53 0.061,962 EUR Prosus NV 186 0.201,594 EUR Randstad NV2 96 0.10943 EUR SBM Offshore NV 15 0.025,057 EUR Signify NV 222 0.247,652 EUR Stellantis NV 115 0.13962 EUR STMicroelectronics NV 31 0.03269 USD Technip Energies NV ADR 3 –
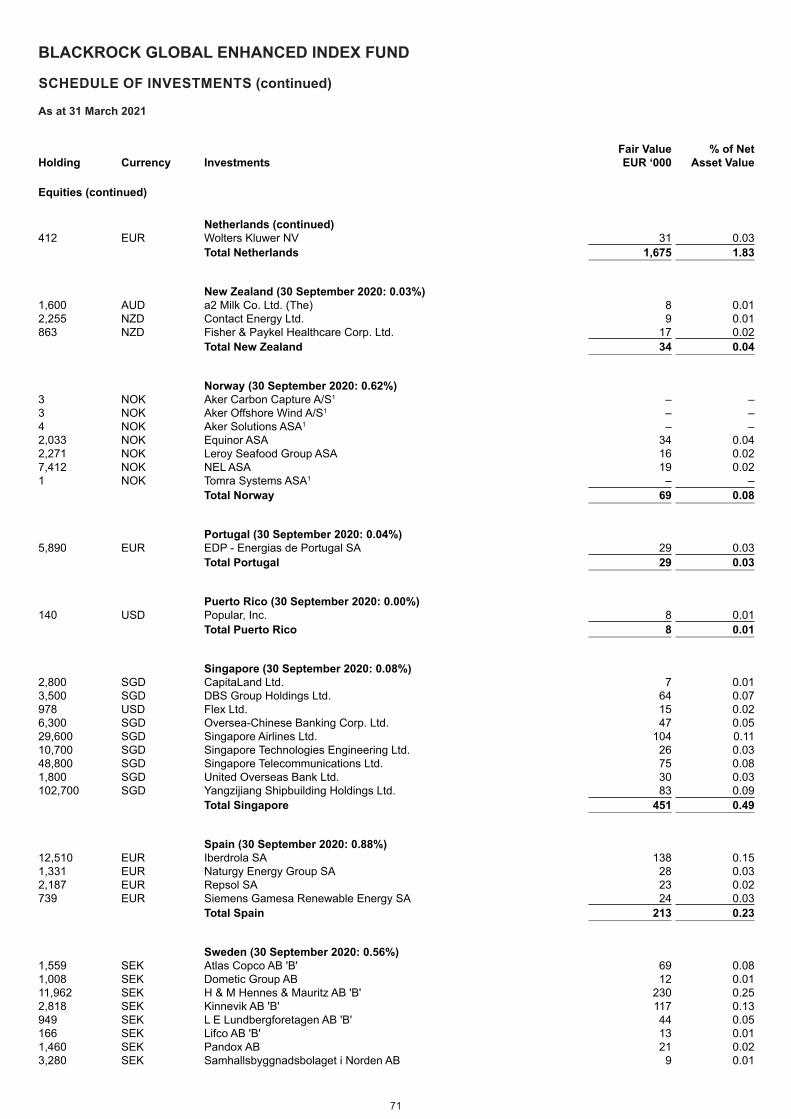
71
BLACKROCK GLOBAL ENHANCED INDEX FUND
SCHEDULE OF INVESTMENTS (continued)
As at 31 March 2021
Holding Currency Investments Fair Value EUR ‘000
% of Net Asset Value
Equities (continued)
Netherlands (continued) 412 EUR Wolters Kluwer NV 31 0.03
Total Netherlands 1,675 1.83
New Zealand (30 September 2020: 0.03%)1,600 AUD a2 Milk Co. Ltd. (The) 8 0.012,255 NZD Contact Energy Ltd. 9 0.01863 NZD Fisher & Paykel Healthcare Corp. Ltd. 17 0.02
Total New Zealand 34 0.04
Norway (30 September 2020: 0.62%)3 NOK Aker Carbon Capture A/S1 – –3 NOK Aker Offshore Wind A/S1 – –4 NOK Aker Solutions ASA1 – –2,033 NOK Equinor ASA 34 0.042,271 NOK Leroy Seafood Group ASA 16 0.027,412 NOK NEL ASA 19 0.021 NOK Tomra Systems ASA1 – –
Total Norway 69 0.08
Portugal (30 September 2020: 0.04%)5,890 EUR EDP - Energias de Portugal SA 29 0.03
Total Portugal 29 0.03
Puerto Rico (30 September 2020: 0.00%)140 USD Popular, Inc. 8 0.01
Total Puerto Rico 8 0.01
Singapore (30 September 2020: 0.08%)2,800 SGD CapitaLand Ltd. 7 0.013,500 SGD DBS Group Holdings Ltd. 64 0.07978 USD Flex Ltd. 15 0.026,300 SGD Oversea-Chinese Banking Corp. Ltd. 47 0.0529,600 SGD Singapore Airlines Ltd. 104 0.1110,700 SGD Singapore Technologies Engineering Ltd. 26 0.0348,800 SGD Singapore Telecommunications Ltd. 75 0.081,800 SGD United Overseas Bank Ltd. 30 0.03102,700 SGD Yangzijiang Shipbuilding Holdings Ltd. 83 0.09
Total Singapore 451 0.49
Spain (30 September 2020: 0.88%)12,510 EUR Iberdrola SA 138 0.151,331 EUR Naturgy Energy Group SA 28 0.032,187 EUR Repsol SA 23 0.02739 EUR Siemens Gamesa Renewable Energy SA 24 0.03
Total Spain 213 0.23
Sweden (30 September 2020: 0.56%)1,559 SEK Atlas Copco AB 'B' 69 0.081,008 SEK Dometic Group AB 12 0.0111,962 SEK H & M Hennes & Mauritz AB 'B' 230 0.252,818 SEK Kinnevik AB 'B' 117 0.13949 SEK L E Lundbergforetagen AB 'B' 44 0.05166 SEK Lifco AB 'B' 13 0.011,460 SEK Pandox AB 21 0.023,280 SEK Samhallsbyggnadsbolaget i Norden AB 9 0.01
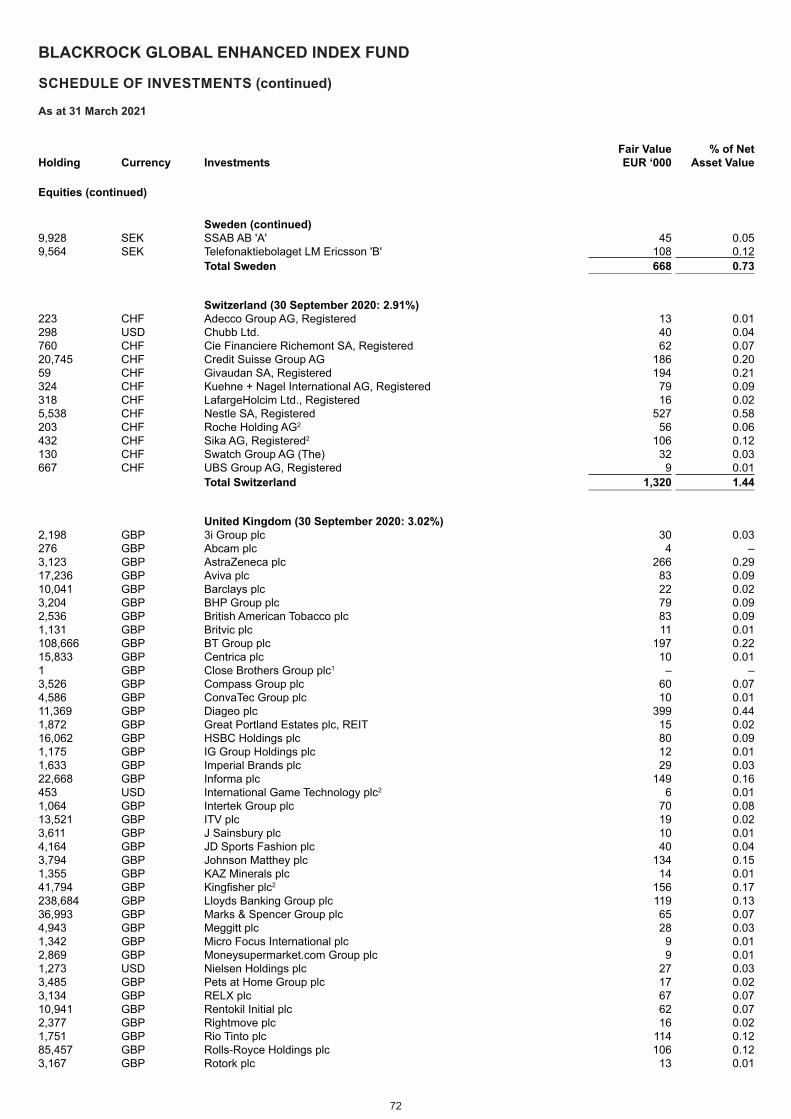
72
BLACKROCK GLOBAL ENHANCED INDEX FUND
SCHEDULE OF INVESTMENTS (continued)
As at 31 March 2021
Holding Currency Investments Fair Value EUR ‘000
% of Net Asset Value
Equities (continued)
Sweden (continued) 9,928 SEK SSAB AB 'A' 45 0.059,564 SEK Telefonaktiebolaget LM Ericsson 'B' 108 0.12
Total Sweden 668 0.73
Switzerland (30 September 2020: 2.91%)223 CHF Adecco Group AG, Registered 13 0.01298 USD Chubb Ltd. 40 0.04760 CHF Cie Financiere Richemont SA, Registered 62 0.0720,745 CHF Credit Suisse Group AG 186 0.2059 CHF Givaudan SA, Registered 194 0.21324 CHF Kuehne + Nagel International AG, Registered 79 0.09318 CHF LafargeHolcim Ltd., Registered 16 0.025,538 CHF Nestle SA, Registered 527 0.58203 CHF Roche Holding AG2 56 0.06432 CHF Sika AG, Registered2 106 0.12130 CHF Swatch Group AG (The) 32 0.03667 CHF UBS Group AG, Registered 9 0.01
Total Switzerland 1,320 1.44
United Kingdom (30 September 2020: 3.02%)2,198 GBP 3i Group plc 30 0.03276 GBP Abcam plc 4 –3,123 GBP AstraZeneca plc 266 0.2917,236 GBP Aviva plc 83 0.0910,041 GBP Barclays plc 22 0.023,204 GBP BHP Group plc 79 0.092,536 GBP British American Tobacco plc 83 0.091,131 GBP Britvic plc 11 0.01108,666 GBP BT Group plc 197 0.2215,833 GBP Centrica plc 10 0.011 GBP Close Brothers Group plc1 – –3,526 GBP Compass Group plc 60 0.074,586 GBP ConvaTec Group plc 10 0.0111,369 GBP Diageo plc 399 0.441,872 GBP Great Portland Estates plc, REIT 15 0.0216,062 GBP HSBC Holdings plc 80 0.091,175 GBP IG Group Holdings plc 12 0.011,633 GBP Imperial Brands plc 29 0.0322,668 GBP Informa plc 149 0.16453 USD International Game Technology plc2 6 0.011,064 GBP Intertek Group plc 70 0.0813,521 GBP ITV plc 19 0.023,611 GBP J Sainsbury plc 10 0.014,164 GBP JD Sports Fashion plc 40 0.043,794 GBP Johnson Matthey plc 134 0.151,355 GBP KAZ Minerals plc 14 0.0141,794 GBP Kingfisher plc2 156 0.17238,684 GBP Lloyds Banking Group plc 119 0.1336,993 GBP Marks & Spencer Group plc 65 0.074,943 GBP Meggitt plc 28 0.031,342 GBP Micro Focus International plc 9 0.012,869 GBP Moneysupermarket.com Group plc 9 0.011,273 USD Nielsen Holdings plc 27 0.033,485 GBP Pets at Home Group plc 17 0.023,134 GBP RELX plc 67 0.0710,941 GBP Rentokil Initial plc 62 0.072,377 GBP Rightmove plc 16 0.021,751 GBP Rio Tinto plc 114 0.1285,457 GBP Rolls-Royce Holdings plc 106 0.123,167 GBP Rotork plc 13 0.01
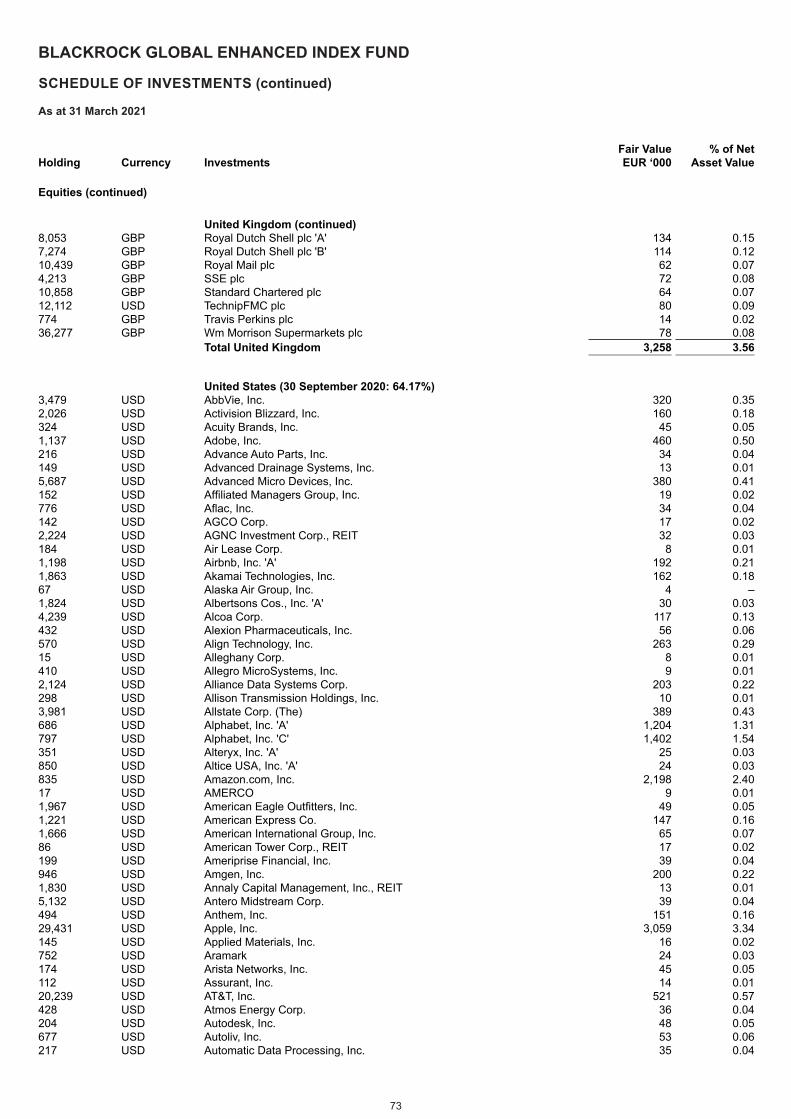
73
BLACKROCK GLOBAL ENHANCED INDEX FUND
SCHEDULE OF INVESTMENTS (continued)
As at 31 March 2021
Holding Currency Investments Fair Value EUR ‘000
% of Net Asset Value
Equities (continued)
United Kingdom (continued) 8,053 GBP Royal Dutch Shell plc 'A' 134 0.157,274 GBP Royal Dutch Shell plc 'B' 114 0.1210,439 GBP Royal Mail plc 62 0.074,213 GBP SSE plc 72 0.0810,858 GBP Standard Chartered plc 64 0.0712,112 USD TechnipFMC plc 80 0.09774 GBP Travis Perkins plc 14 0.0236,277 GBP Wm Morrison Supermarkets plc 78 0.08
Total United Kingdom 3,258 3.56
United States (30 September 2020: 64.17%)3,479 USD AbbVie, Inc. 320 0.352,026 USD Activision Blizzard, Inc. 160 0.18324 USD Acuity Brands, Inc. 45 0.051,137 USD Adobe, Inc. 460 0.50216 USD Advance Auto Parts, Inc. 34 0.04149 USD Advanced Drainage Systems, Inc. 13 0.015,687 USD Advanced Micro Devices, Inc. 380 0.41152 USD Affiliated Managers Group, Inc. 19 0.02776 USD Aflac, Inc. 34 0.04142 USD AGCO Corp. 17 0.022,224 USD AGNC Investment Corp., REIT 32 0.03184 USD Air Lease Corp. 8 0.011,198 USD Airbnb, Inc. 'A' 192 0.211,863 USD Akamai Technologies, Inc. 162 0.1867 USD Alaska Air Group, Inc. 4 –1,824 USD Albertsons Cos., Inc. 'A' 30 0.034,239 USD Alcoa Corp. 117 0.13432 USD Alexion Pharmaceuticals, Inc. 56 0.06570 USD Align Technology, Inc. 263 0.2915 USD Alleghany Corp. 8 0.01410 USD Allegro MicroSystems, Inc. 9 0.012,124 USD Alliance Data Systems Corp. 203 0.22298 USD Allison Transmission Holdings, Inc. 10 0.013,981 USD Allstate Corp. (The) 389 0.43686 USD Alphabet, Inc. 'A' 1,204 1.31797 USD Alphabet, Inc. 'C' 1,402 1.54351 USD Alteryx, Inc. 'A' 25 0.03850 USD Altice USA, Inc. 'A' 24 0.03835 USD Amazon.com, Inc. 2,198 2.4017 USD AMERCO 9 0.011,967 USD American Eagle Outfitters, Inc. 49 0.051,221 USD American Express Co. 147 0.161,666 USD American International Group, Inc. 65 0.0786 USD American Tower Corp., REIT 17 0.02199 USD Ameriprise Financial, Inc. 39 0.04946 USD Amgen, Inc. 200 0.221,830 USD Annaly Capital Management, Inc., REIT 13 0.015,132 USD Antero Midstream Corp. 39 0.04494 USD Anthem, Inc. 151 0.1629,431 USD Apple, Inc. 3,059 3.34145 USD Applied Materials, Inc. 16 0.02752 USD Aramark 24 0.03174 USD Arista Networks, Inc. 45 0.05112 USD Assurant, Inc. 14 0.0120,239 USD AT&T, Inc. 521 0.57428 USD Atmos Energy Corp. 36 0.04204 USD Autodesk, Inc. 48 0.05677 USD Autoliv, Inc. 53 0.06217 USD Automatic Data Processing, Inc. 35 0.04

74
BLACKROCK GLOBAL ENHANCED INDEX FUND
SCHEDULE OF INVESTMENTS (continued)
As at 31 March 2021
Holding Currency Investments Fair Value EUR ‘000
% of Net Asset Value
Equities (continued)
United States (continued) 1,704 USD AutoNation, Inc. 135 0.1512 USD AutoZone, Inc. 14 0.023,923 USD Avangrid, Inc. 166 0.185,145 USD Baker Hughes Co. 95 0.1010,354 USD Bank of America Corp. 341 0.3715,902 USD Bank of New York Mellon Corp. (The) 640 0.70398 USD Bank OZK 14 0.021,199 USD Becton Dickinson and Co. 248 0.27825 USD Bed Bath & Beyond, Inc. 20 0.022,886 USD Berkshire Hathaway, Inc. 'B' 627 0.69483 USD Berry Global Group, Inc. 25 0.032,753 USD Best Buy Co., Inc. 269 0.29493 USD Biogen, Inc. 117 0.1398 USD Bio-Rad Laboratories, Inc. 'A' 48 0.052,467 USD BorgWarner, Inc. 97 0.117 USD Bright Horizons Family Solutions, Inc. 1 –555 USD Brighthouse Financial, Inc. 21 0.0217,950 USD Bristol-Myers Squibb Co. 964 1.05645 USD Brixmor Property Group, Inc., REIT 11 0.01172 USD Brunswick Corp. 14 0.02663 USD Bumble, Inc. 'A' 35 0.041,647 USD Cadence Design Systems, Inc. 192 0.21202 USD Campbell Soup Co. 9 0.01890 USD Capital One Financial Corp. 96 0.1180 USD Cardlytics, Inc. 7 0.01205 USD Carter's, Inc. 16 0.021,100 USD Caterpillar, Inc. 217 0.2410,523 USD Centene Corp. 572 0.621,035 USD Cerner Corp. 63 0.073,005 USD Charles Schwab Corp. (The) 167 0.181,641 USD Chegg, Inc. 120 0.131,009 USD Chevron Corp. 90 0.10286 USD Chipotle Mexican Grill, Inc. 346 0.38180 USD Church & Dwight Co., Inc. 13 0.012,972 USD Cigna Corp. 611 0.67232 USD Cimarex Energy Co. 12 0.01546 USD Cirrus Logic, Inc. 39 0.043,421 USD Citigroup, Inc. 212 0.23861 USD Citizens Financial Group, Inc. 32 0.041,072 USD Cleveland-Cliffs, Inc. 18 0.02807 USD Clorox Co. (The) 132 0.141,251 USD Cloudera, Inc. 13 0.01337 USD Cloudflare, Inc. 'A' 20 0.02494 USD CME Group, Inc. 86 0.09561 USD CMS Energy Corp. 29 0.038,047 USD Coca-Cola Co. (The) 361 0.39624 USD Colfax Corp. 23 0.033,454 USD Colgate-Palmolive Co. 232 0.25557 USD Columbia Sportswear Co. 50 0.058,999 USD Comcast Corp. 'A' 414 0.45106 USD Concentrix Corp. 13 0.012,497 USD Consolidated Edison, Inc. 159 0.171,567 USD ContextLogic, Inc. 'A' 21 0.022,881 USD Continental Resources, Inc. 63 0.07349 USD Copart, Inc. 32 0.0438 USD CoStar Group, Inc. 27 0.03675 USD Costco Wholesale Corp. 202 0.2271 USD Credit Acceptance Corp. 22 0.02185 USD Crocs, Inc. 13 0.01294 USD CubeSmart, REIT 9 0.013,502 USD Cummins, Inc. 772 0.84
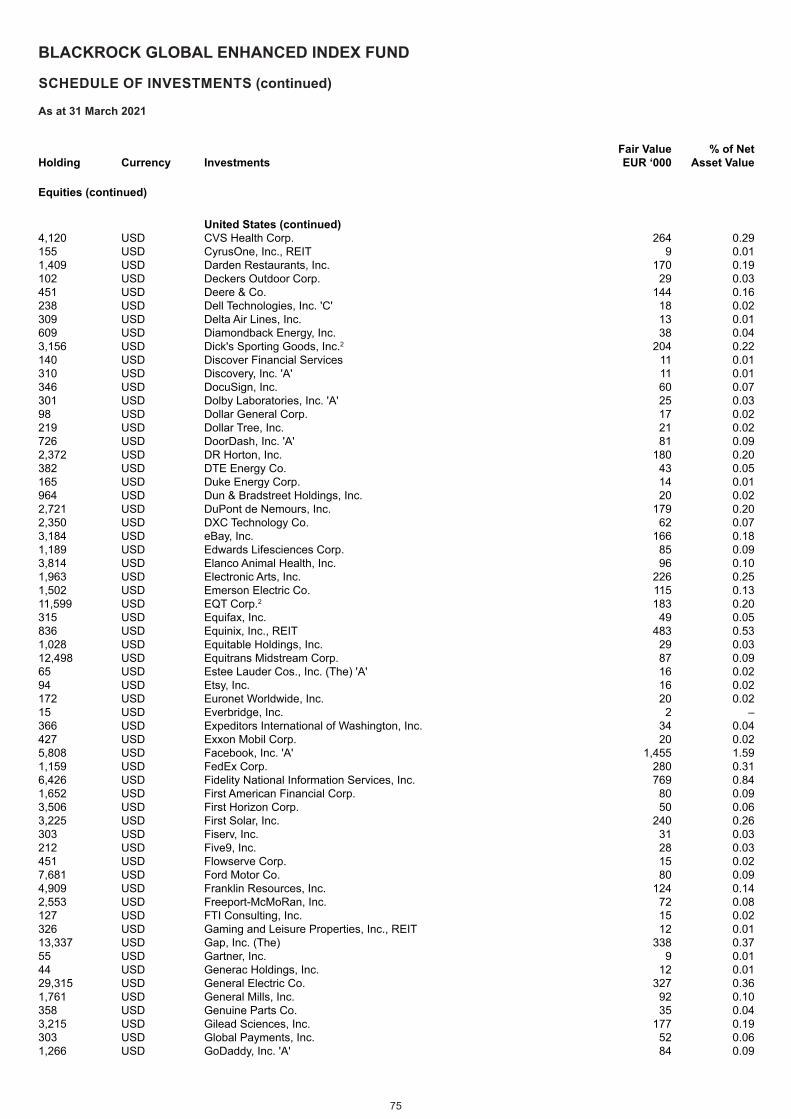
75
BLACKROCK GLOBAL ENHANCED INDEX FUND
SCHEDULE OF INVESTMENTS (continued)
As at 31 March 2021
Holding Currency Investments Fair Value EUR ‘000
% of Net Asset Value
Equities (continued)
United States (continued) 4,120 USD CVS Health Corp. 264 0.29155 USD CyrusOne, Inc., REIT 9 0.011,409 USD Darden Restaurants, Inc. 170 0.19102 USD Deckers Outdoor Corp. 29 0.03451 USD Deere & Co. 144 0.16238 USD Dell Technologies, Inc. 'C' 18 0.02309 USD Delta Air Lines, Inc. 13 0.01609 USD Diamondback Energy, Inc. 38 0.043,156 USD Dick's Sporting Goods, Inc.2 204 0.22140 USD Discover Financial Services 11 0.01310 USD Discovery, Inc. 'A' 11 0.01346 USD DocuSign, Inc. 60 0.07301 USD Dolby Laboratories, Inc. 'A' 25 0.0398 USD Dollar General Corp. 17 0.02219 USD Dollar Tree, Inc. 21 0.02726 USD DoorDash, Inc. 'A' 81 0.092,372 USD DR Horton, Inc. 180 0.20382 USD DTE Energy Co. 43 0.05165 USD Duke Energy Corp. 14 0.01964 USD Dun & Bradstreet Holdings, Inc. 20 0.022,721 USD DuPont de Nemours, Inc. 179 0.202,350 USD DXC Technology Co. 62 0.073,184 USD eBay, Inc. 166 0.181,189 USD Edwards Lifesciences Corp. 85 0.093,814 USD Elanco Animal Health, Inc. 96 0.101,963 USD Electronic Arts, Inc. 226 0.251,502 USD Emerson Electric Co. 115 0.1311,599 USD EQT Corp.2 183 0.20315 USD Equifax, Inc. 49 0.05836 USD Equinix, Inc., REIT 483 0.531,028 USD Equitable Holdings, Inc. 29 0.0312,498 USD Equitrans Midstream Corp. 87 0.0965 USD Estee Lauder Cos., Inc. (The) 'A' 16 0.0294 USD Etsy, Inc. 16 0.02172 USD Euronet Worldwide, Inc. 20 0.0215 USD Everbridge, Inc. 2 –366 USD Expeditors International of Washington, Inc. 34 0.04427 USD Exxon Mobil Corp. 20 0.025,808 USD Facebook, Inc. 'A' 1,455 1.591,159 USD FedEx Corp. 280 0.316,426 USD Fidelity National Information Services, Inc. 769 0.841,652 USD First American Financial Corp. 80 0.093,506 USD First Horizon Corp. 50 0.063,225 USD First Solar, Inc. 240 0.26303 USD Fiserv, Inc. 31 0.03212 USD Five9, Inc. 28 0.03451 USD Flowserve Corp. 15 0.027,681 USD Ford Motor Co. 80 0.094,909 USD Franklin Resources, Inc. 124 0.142,553 USD Freeport-McMoRan, Inc. 72 0.08127 USD FTI Consulting, Inc. 15 0.02326 USD Gaming and Leisure Properties, Inc., REIT 12 0.0113,337 USD Gap, Inc. (The) 338 0.3755 USD Gartner, Inc. 9 0.0144 USD Generac Holdings, Inc. 12 0.0129,315 USD General Electric Co. 327 0.361,761 USD General Mills, Inc. 92 0.10358 USD Genuine Parts Co. 35 0.043,215 USD Gilead Sciences, Inc. 177 0.19303 USD Global Payments, Inc. 52 0.061,266 USD GoDaddy, Inc. 'A' 84 0.09
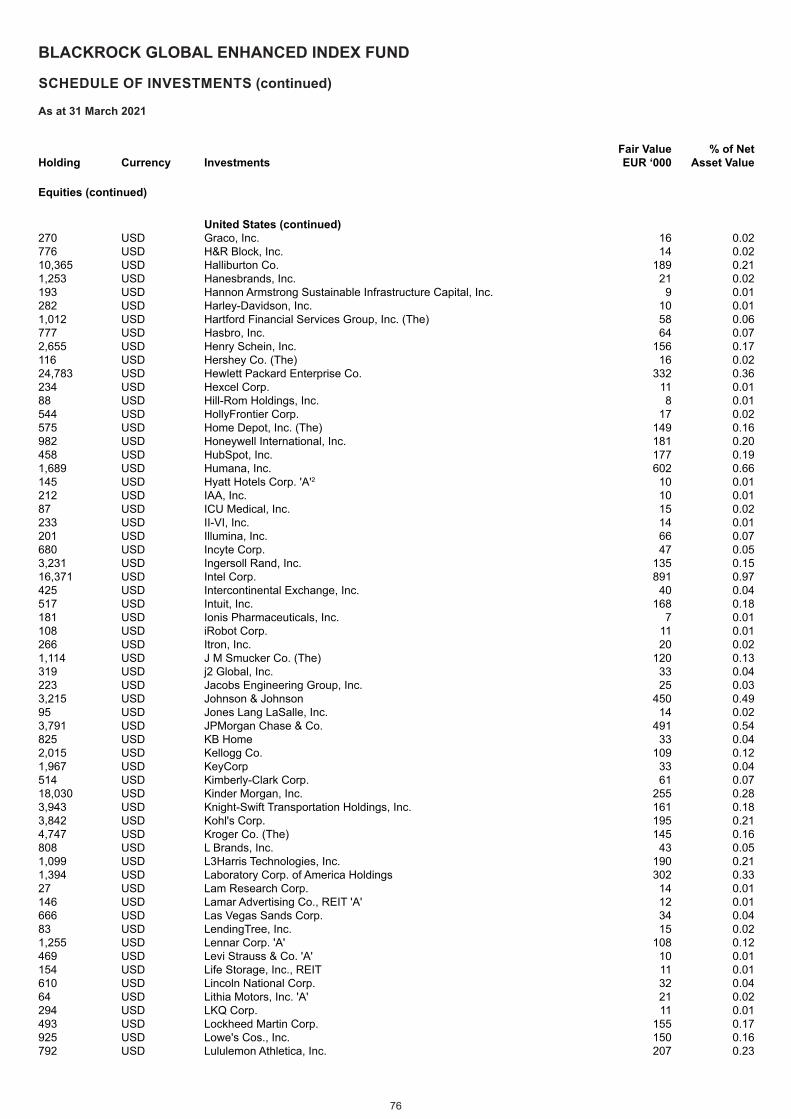
76
BLACKROCK GLOBAL ENHANCED INDEX FUND
SCHEDULE OF INVESTMENTS (continued)
As at 31 March 2021
Holding Currency Investments Fair Value EUR ‘000
% of Net Asset Value
Equities (continued)
United States (continued) 270 USD Graco, Inc. 16 0.02776 USD H&R Block, Inc. 14 0.0210,365 USD Halliburton Co. 189 0.211,253 USD Hanesbrands, Inc. 21 0.02193 USD Hannon Armstrong Sustainable Infrastructure Capital, Inc. 9 0.01282 USD Harley-Davidson, Inc. 10 0.011,012 USD Hartford Financial Services Group, Inc. (The) 58 0.06777 USD Hasbro, Inc. 64 0.072,655 USD Henry Schein, Inc. 156 0.17116 USD Hershey Co. (The) 16 0.0224,783 USD Hewlett Packard Enterprise Co. 332 0.36234 USD Hexcel Corp. 11 0.0188 USD Hill-Rom Holdings, Inc. 8 0.01544 USD HollyFrontier Corp. 17 0.02575 USD Home Depot, Inc. (The) 149 0.16982 USD Honeywell International, Inc. 181 0.20458 USD HubSpot, Inc. 177 0.191,689 USD Humana, Inc. 602 0.66145 USD Hyatt Hotels Corp. 'A'2 10 0.01212 USD IAA, Inc. 10 0.0187 USD ICU Medical, Inc. 15 0.02233 USD II-VI, Inc. 14 0.01201 USD Illumina, Inc. 66 0.07680 USD Incyte Corp. 47 0.053,231 USD Ingersoll Rand, Inc. 135 0.1516,371 USD Intel Corp. 891 0.97425 USD Intercontinental Exchange, Inc. 40 0.04517 USD Intuit, Inc. 168 0.18181 USD Ionis Pharmaceuticals, Inc. 7 0.01108 USD iRobot Corp. 11 0.01266 USD Itron, Inc. 20 0.021,114 USD J M Smucker Co. (The) 120 0.13319 USD j2 Global, Inc. 33 0.04223 USD Jacobs Engineering Group, Inc. 25 0.033,215 USD Johnson & Johnson 450 0.4995 USD Jones Lang LaSalle, Inc. 14 0.023,791 USD JPMorgan Chase & Co. 491 0.54825 USD KB Home 33 0.042,015 USD Kellogg Co. 109 0.121,967 USD KeyCorp 33 0.04514 USD Kimberly-Clark Corp. 61 0.0718,030 USD Kinder Morgan, Inc. 255 0.283,943 USD Knight-Swift Transportation Holdings, Inc. 161 0.183,842 USD Kohl's Corp. 195 0.214,747 USD Kroger Co. (The) 145 0.16808 USD L Brands, Inc. 43 0.051,099 USD L3Harris Technologies, Inc. 190 0.211,394 USD Laboratory Corp. of America Holdings 302 0.3327 USD Lam Research Corp. 14 0.01146 USD Lamar Advertising Co., REIT 'A' 12 0.01666 USD Las Vegas Sands Corp. 34 0.0483 USD LendingTree, Inc. 15 0.021,255 USD Lennar Corp. 'A' 108 0.12469 USD Levi Strauss & Co. 'A' 10 0.01154 USD Life Storage, Inc., REIT 11 0.01610 USD Lincoln National Corp. 32 0.0464 USD Lithia Motors, Inc. 'A' 21 0.02294 USD LKQ Corp. 11 0.01493 USD Lockheed Martin Corp. 155 0.17925 USD Lowe's Cos., Inc. 150 0.16792 USD Lululemon Athletica, Inc. 207 0.23
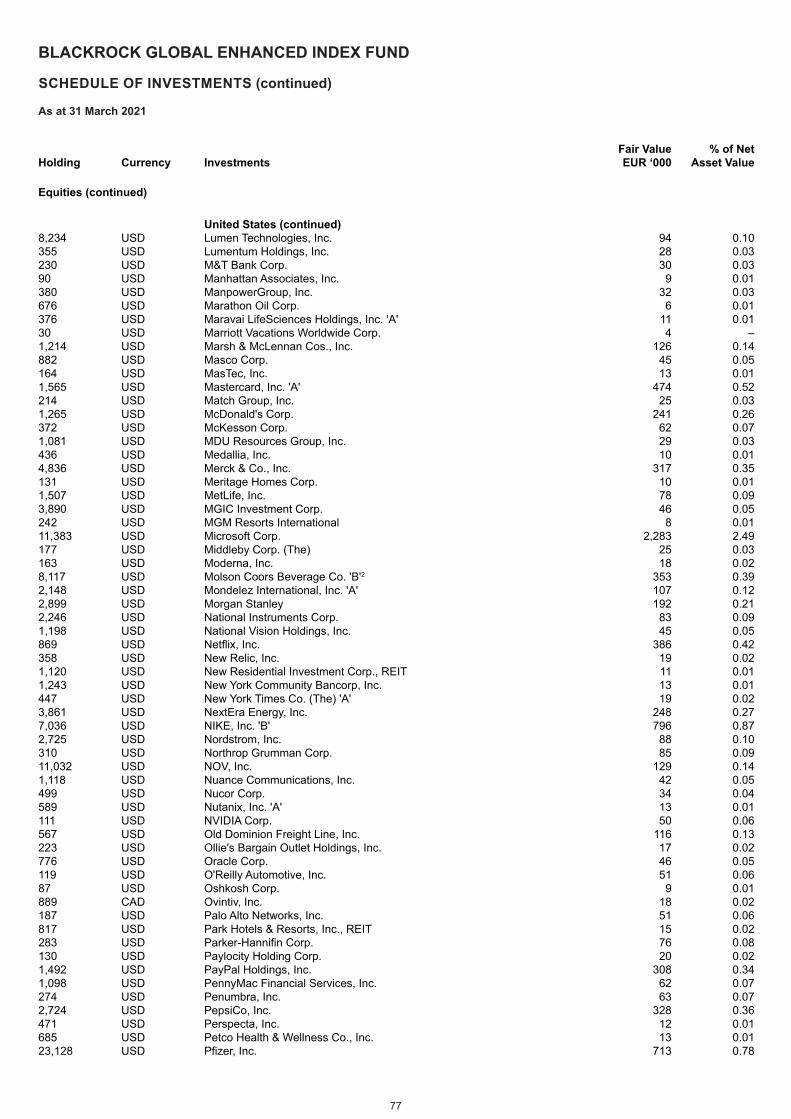
77
BLACKROCK GLOBAL ENHANCED INDEX FUND
SCHEDULE OF INVESTMENTS (continued)
As at 31 March 2021
Holding Currency Investments Fair Value EUR ‘000
% of Net Asset Value
Equities (continued)
United States (continued) 8,234 USD Lumen Technologies, Inc. 94 0.10355 USD Lumentum Holdings, Inc. 28 0.03230 USD M&T Bank Corp. 30 0.0390 USD Manhattan Associates, Inc. 9 0.01380 USD ManpowerGroup, Inc. 32 0.03676 USD Marathon Oil Corp. 6 0.01376 USD Maravai LifeSciences Holdings, Inc. 'A' 11 0.0130 USD Marriott Vacations Worldwide Corp. 4 –1,214 USD Marsh & McLennan Cos., Inc. 126 0.14882 USD Masco Corp. 45 0.05164 USD MasTec, Inc. 13 0.011,565 USD Mastercard, Inc. 'A' 474 0.52214 USD Match Group, Inc. 25 0.031,265 USD McDonald's Corp. 241 0.26372 USD McKesson Corp. 62 0.071,081 USD MDU Resources Group, Inc. 29 0.03436 USD Medallia, Inc. 10 0.014,836 USD Merck & Co., Inc. 317 0.35131 USD Meritage Homes Corp. 10 0.011,507 USD MetLife, Inc. 78 0.093,890 USD MGIC Investment Corp. 46 0.05242 USD MGM Resorts International 8 0.0111,383 USD Microsoft Corp. 2,283 2.49177 USD Middleby Corp. (The) 25 0.03163 USD Moderna, Inc. 18 0.028,117 USD Molson Coors Beverage Co. 'B'2 353 0.392,148 USD Mondelez International, Inc. 'A' 107 0.122,899 USD Morgan Stanley 192 0.212,246 USD National Instruments Corp. 83 0.091,198 USD National Vision Holdings, Inc. 45 0.05869 USD Netflix, Inc. 386 0.42358 USD New Relic, Inc. 19 0.021,120 USD New Residential Investment Corp., REIT 11 0.011,243 USD New York Community Bancorp, Inc. 13 0.01447 USD New York Times Co. (The) 'A' 19 0.023,861 USD NextEra Energy, Inc. 248 0.277,036 USD NIKE, Inc. 'B' 796 0.872,725 USD Nordstrom, Inc. 88 0.10310 USD Northrop Grumman Corp. 85 0.0911,032 USD NOV, Inc. 129 0.141,118 USD Nuance Communications, Inc. 42 0.05499 USD Nucor Corp. 34 0.04589 USD Nutanix, Inc. 'A' 13 0.01111 USD NVIDIA Corp. 50 0.06567 USD Old Dominion Freight Line, Inc. 116 0.13223 USD Ollie's Bargain Outlet Holdings, Inc. 17 0.02776 USD Oracle Corp. 46 0.05119 USD O'Reilly Automotive, Inc. 51 0.0687 USD Oshkosh Corp. 9 0.01889 CAD Ovintiv, Inc. 18 0.02187 USD Palo Alto Networks, Inc. 51 0.06817 USD Park Hotels & Resorts, Inc., REIT 15 0.02283 USD Parker-Hannifin Corp. 76 0.08130 USD Paylocity Holding Corp. 20 0.021,492 USD PayPal Holdings, Inc. 308 0.341,098 USD PennyMac Financial Services, Inc. 62 0.07274 USD Penumbra, Inc. 63 0.072,724 USD PepsiCo, Inc. 328 0.36471 USD Perspecta, Inc. 12 0.01685 USD Petco Health & Wellness Co., Inc. 13 0.0123,128 USD Pfizer, Inc. 713 0.78
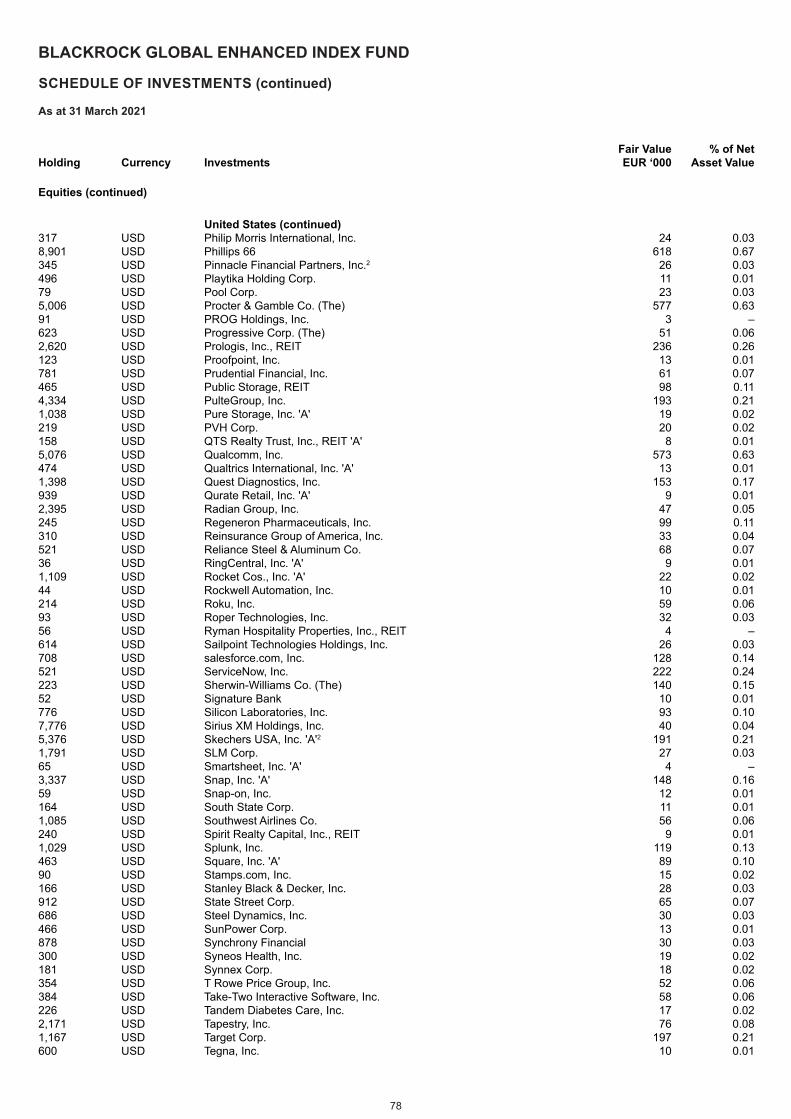
78
BLACKROCK GLOBAL ENHANCED INDEX FUND
SCHEDULE OF INVESTMENTS (continued)
As at 31 March 2021
Holding Currency Investments Fair Value EUR ‘000
% of Net Asset Value
Equities (continued)
United States (continued) 317 USD Philip Morris International, Inc. 24 0.038,901 USD Phillips 66 618 0.67345 USD Pinnacle Financial Partners, Inc.2 26 0.03496 USD Playtika Holding Corp. 11 0.0179 USD Pool Corp. 23 0.035,006 USD Procter & Gamble Co. (The) 577 0.6391 USD PROG Holdings, Inc. 3 –623 USD Progressive Corp. (The) 51 0.062,620 USD Prologis, Inc., REIT 236 0.26123 USD Proofpoint, Inc. 13 0.01781 USD Prudential Financial, Inc. 61 0.07465 USD Public Storage, REIT 98 0.114,334 USD PulteGroup, Inc. 193 0.211,038 USD Pure Storage, Inc. 'A' 19 0.02219 USD PVH Corp. 20 0.02158 USD QTS Realty Trust, Inc., REIT 'A' 8 0.015,076 USD Qualcomm, Inc. 573 0.63474 USD Qualtrics International, Inc. 'A' 13 0.011,398 USD Quest Diagnostics, Inc. 153 0.17939 USD Qurate Retail, Inc. 'A' 9 0.012,395 USD Radian Group, Inc. 47 0.05245 USD Regeneron Pharmaceuticals, Inc. 99 0.11310 USD Reinsurance Group of America, Inc. 33 0.04521 USD Reliance Steel & Aluminum Co. 68 0.0736 USD RingCentral, Inc. 'A' 9 0.011,109 USD Rocket Cos., Inc. 'A' 22 0.0244 USD Rockwell Automation, Inc. 10 0.01214 USD Roku, Inc. 59 0.0693 USD Roper Technologies, Inc. 32 0.0356 USD Ryman Hospitality Properties, Inc., REIT 4 –614 USD Sailpoint Technologies Holdings, Inc. 26 0.03708 USD salesforce.com, Inc. 128 0.14521 USD ServiceNow, Inc. 222 0.24223 USD Sherwin-Williams Co. (The) 140 0.1552 USD Signature Bank 10 0.01776 USD Silicon Laboratories, Inc. 93 0.107,776 USD Sirius XM Holdings, Inc. 40 0.045,376 USD Skechers USA, Inc. 'A'2 191 0.211,791 USD SLM Corp. 27 0.0365 USD Smartsheet, Inc. 'A' 4 –3,337 USD Snap, Inc. 'A' 148 0.1659 USD Snap-on, Inc. 12 0.01164 USD South State Corp. 11 0.011,085 USD Southwest Airlines Co. 56 0.06240 USD Spirit Realty Capital, Inc., REIT 9 0.011,029 USD Splunk, Inc. 119 0.13463 USD Square, Inc. 'A' 89 0.1090 USD Stamps.com, Inc. 15 0.02166 USD Stanley Black & Decker, Inc. 28 0.03912 USD State Street Corp. 65 0.07686 USD Steel Dynamics, Inc. 30 0.03466 USD SunPower Corp. 13 0.01878 USD Synchrony Financial 30 0.03300 USD Syneos Health, Inc. 19 0.02181 USD Synnex Corp. 18 0.02354 USD T Rowe Price Group, Inc. 52 0.06384 USD Take-Two Interactive Software, Inc. 58 0.06226 USD Tandem Diabetes Care, Inc. 17 0.022,171 USD Tapestry, Inc. 76 0.081,167 USD Target Corp. 197 0.21600 USD Tegna, Inc. 10 0.01
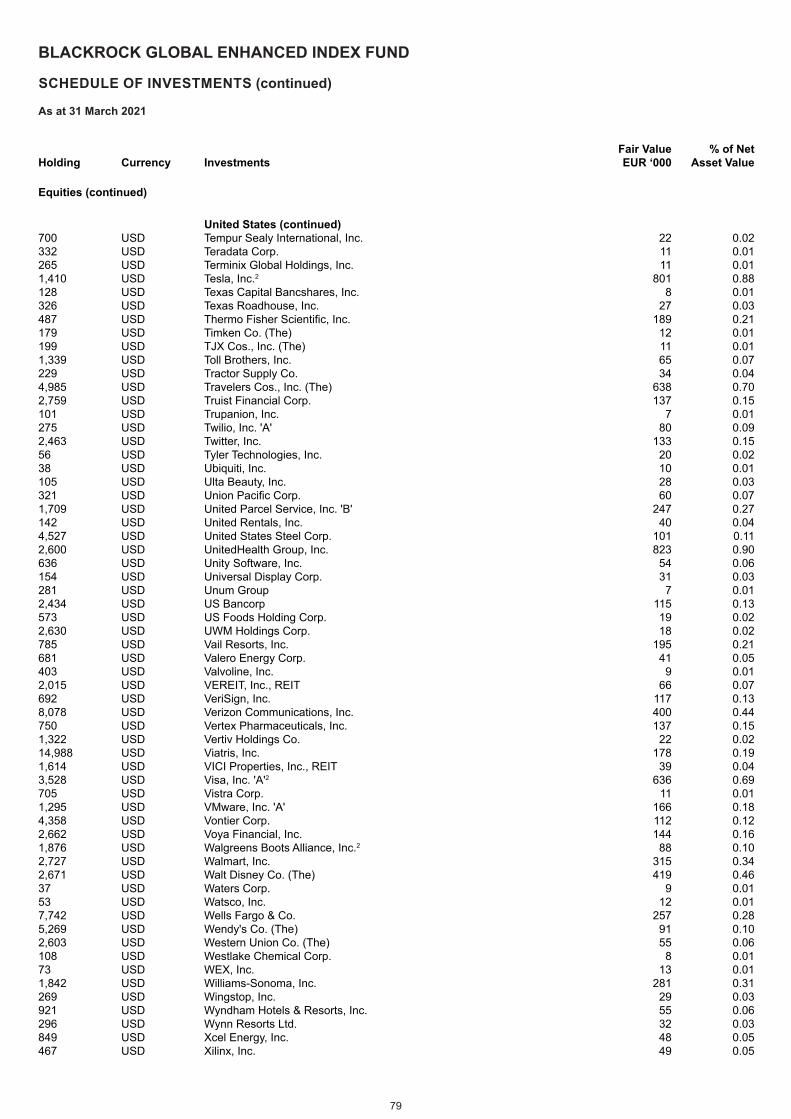
79
BLACKROCK GLOBAL ENHANCED INDEX FUND
SCHEDULE OF INVESTMENTS (continued)
As at 31 March 2021
Holding Currency Investments Fair Value EUR ‘000
% of Net Asset Value
Equities (continued)
United States (continued) 700 USD Tempur Sealy International, Inc. 22 0.02332 USD Teradata Corp. 11 0.01265 USD Terminix Global Holdings, Inc. 11 0.011,410 USD Tesla, Inc.2 801 0.88128 USD Texas Capital Bancshares, Inc. 8 0.01326 USD Texas Roadhouse, Inc. 27 0.03487 USD Thermo Fisher Scientific, Inc. 189 0.21179 USD Timken Co. (The) 12 0.01199 USD TJX Cos., Inc. (The) 11 0.011,339 USD Toll Brothers, Inc. 65 0.07229 USD Tractor Supply Co. 34 0.044,985 USD Travelers Cos., Inc. (The) 638 0.702,759 USD Truist Financial Corp. 137 0.15101 USD Trupanion, Inc. 7 0.01275 USD Twilio, Inc. 'A' 80 0.092,463 USD Twitter, Inc. 133 0.1556 USD Tyler Technologies, Inc. 20 0.0238 USD Ubiquiti, Inc. 10 0.01105 USD Ulta Beauty, Inc. 28 0.03321 USD Union Pacific Corp. 60 0.071,709 USD United Parcel Service, Inc. 'B' 247 0.27142 USD United Rentals, Inc. 40 0.044,527 USD United States Steel Corp. 101 0.112,600 USD UnitedHealth Group, Inc. 823 0.90636 USD Unity Software, Inc. 54 0.06154 USD Universal Display Corp. 31 0.03281 USD Unum Group 7 0.012,434 USD US Bancorp 115 0.13573 USD US Foods Holding Corp. 19 0.022,630 USD UWM Holdings Corp. 18 0.02785 USD Vail Resorts, Inc. 195 0.21681 USD Valero Energy Corp. 41 0.05403 USD Valvoline, Inc. 9 0.012,015 USD VEREIT, Inc., REIT 66 0.07692 USD VeriSign, Inc. 117 0.138,078 USD Verizon Communications, Inc. 400 0.44750 USD Vertex Pharmaceuticals, Inc. 137 0.151,322 USD Vertiv Holdings Co. 22 0.0214,988 USD Viatris, Inc. 178 0.191,614 USD VICI Properties, Inc., REIT 39 0.043,528 USD Visa, Inc. 'A'2 636 0.69705 USD Vistra Corp. 11 0.011,295 USD VMware, Inc. 'A' 166 0.184,358 USD Vontier Corp. 112 0.122,662 USD Voya Financial, Inc. 144 0.161,876 USD Walgreens Boots Alliance, Inc.2 88 0.102,727 USD Walmart, Inc. 315 0.342,671 USD Walt Disney Co. (The) 419 0.4637 USD Waters Corp. 9 0.0153 USD Watsco, Inc. 12 0.017,742 USD Wells Fargo & Co. 257 0.285,269 USD Wendy's Co. (The) 91 0.102,603 USD Western Union Co. (The) 55 0.06108 USD Westlake Chemical Corp. 8 0.0173 USD WEX, Inc. 13 0.011,842 USD Williams-Sonoma, Inc. 281 0.31269 USD Wingstop, Inc. 29 0.03921 USD Wyndham Hotels & Resorts, Inc. 55 0.06296 USD Wynn Resorts Ltd. 32 0.03849 USD Xcel Energy, Inc. 48 0.05467 USD Xilinx, Inc. 49 0.05
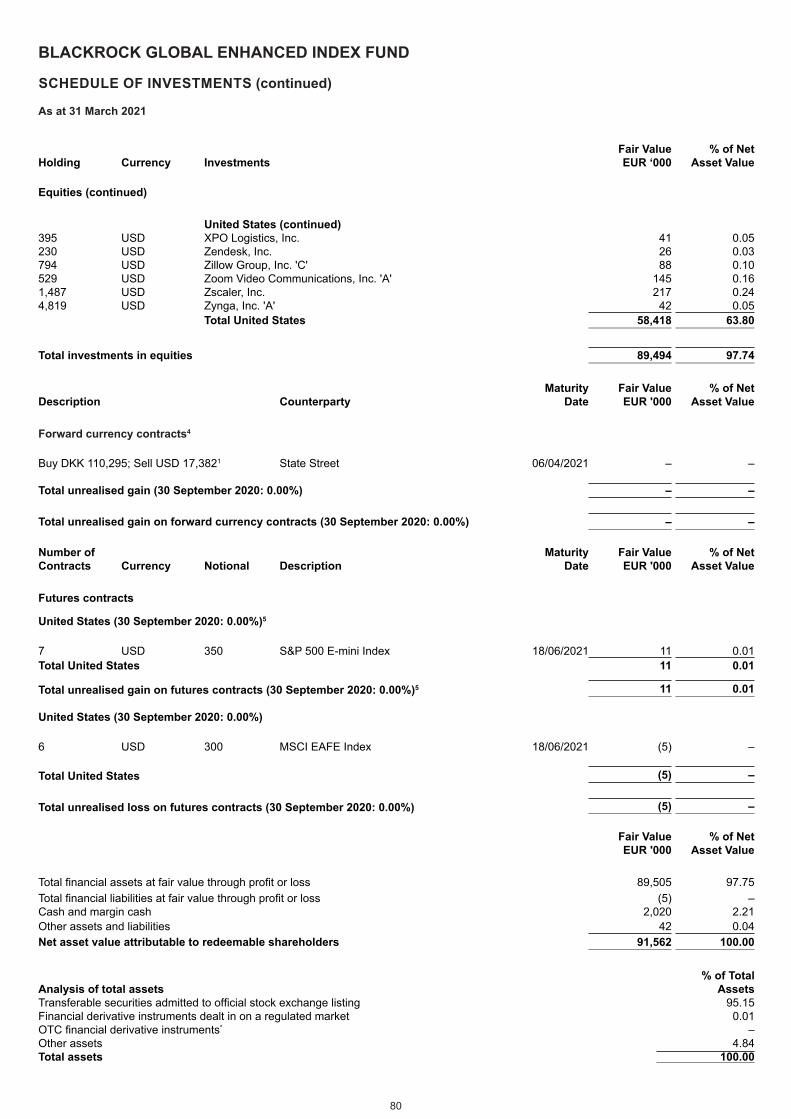
80
BLACKROCK GLOBAL ENHANCED INDEX FUND
SCHEDULE OF INVESTMENTS (continued)
As at 31 March 2021
Holding Currency Investments Fair Value EUR ‘000
% of Net Asset Value
Equities (continued)
United States (continued) 395 USD XPO Logistics, Inc. 41 0.05230 USD Zendesk, Inc. 26 0.03794 USD Zillow Group, Inc. 'C' 88 0.10529 USD Zoom Video Communications, Inc. 'A' 145 0.161,487 USD Zscaler, Inc. 217 0.244,819 USD Zynga, Inc. 'A' 42 0.05
Total United States 58,418 63.80
Total investments in equities 89,494 97.74
Maturity Fair Value % of NetDescription Counterparty Date EUR '000 Asset Value
Forward currency contracts4
Buy DKK 110,295; Sell USD 17,3821 State Street 06/04/2021 – – Total unrealised gain (30 September 2020: 0.00%) – – Total unrealised gain on forward currency contracts (30 September 2020: 0.00%) – – Number of Maturity Fair Value % of NetContracts Currency Notional Description Date EUR '000 Asset Value
Futures contracts
United States (30 September 2020: 0.00%)5
7 USD 350 S&P 500 E-mini Index 18/06/2021 11 0.01Total United States 11 0.01
Total unrealised gain on futures contracts (30 September 2020: 0.00%)5 11 0.01 United States (30 September 2020: 0.00%)
6 USD 300 MSCI EAFE Index 18/06/2021 (5) – Total United States (5) – Total unrealised loss on futures contracts (30 September 2020: 0.00%) (5) –
Fair Value EUR '000
% of Net Asset Value
Total financial assets at fair value through profit or loss 89,505 97.75Total financial liabilities at fair value through profit or loss (5) –Cash and margin cash 2,020 2.21Other assets and liabilities 42 0.04Net asset value attributable to redeemable shareholders 91,562 100.00
Analysis of total assets % of Total
AssetsTransferable securities admitted to official stock exchange listing 95.15Financial derivative instruments dealt in on a regulated market 0.01OTC financial derivative instruments* –Other assets 4.84Total assets 100.00
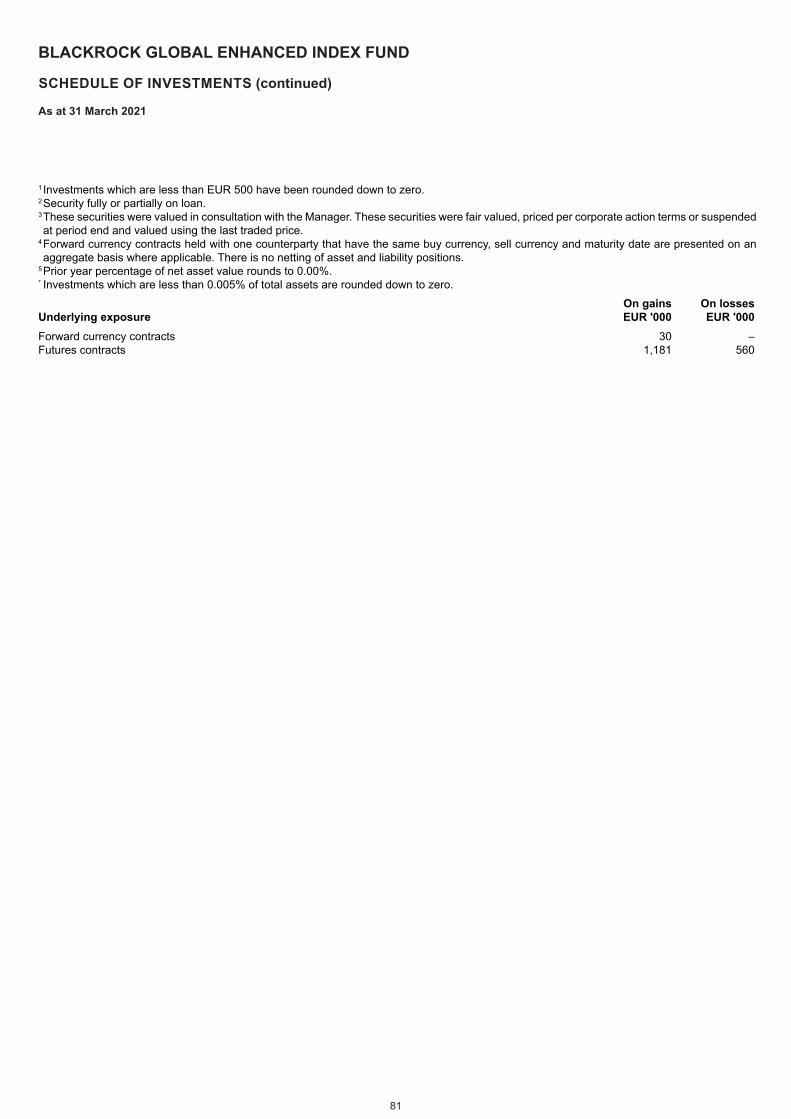
81
BLACKROCK GLOBAL ENHANCED INDEX FUND
SCHEDULE OF INVESTMENTS (continued)
As at 31 March 2021
1 Investments which are less than EUR 500 have been rounded down to zero.2Security fully or partially on loan.3These securities were valued in consultation with the Manager. These securities were fair valued, priced per corporate action terms or suspended at period end and valued using the last traded price.
4Forward currency contracts held with one counterparty that have the same buy currency, sell currency and maturity date are presented on an aggregate basis where applicable. There is no netting of asset and liability positions.
5Prior year percentage of net asset value rounds to 0.00%.* Investments which are less than 0.005% of total assets are rounded down to zero.
Underlying exposureOn gains EUR '000
On losses EUR '000
Forward currency contracts 30 –Futures contracts 1,181 560
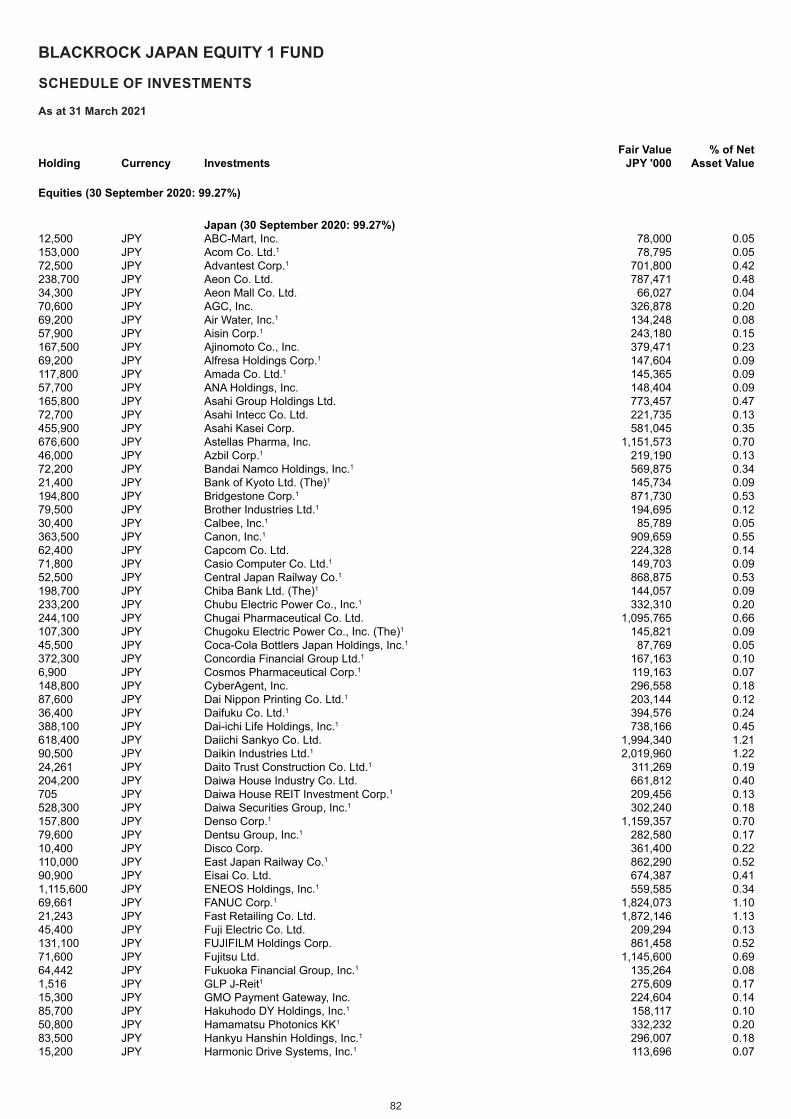
82
BLACKROCK JAPAN EQUITY 1 FUND
SCHEDULE OF INVESTMENTS
As at 31 March 2021
Holding Currency InvestmentsFair Value
JPY '000% of Net
Asset Value
Equities (30 September 2020: 99.27%)
Japan (30 September 2020: 99.27%)12,500 JPY ABC-Mart, Inc. 78,000 0.05153,000 JPY Acom Co. Ltd.1 78,795 0.0572,500 JPY Advantest Corp.1 701,800 0.42238,700 JPY Aeon Co. Ltd. 787,471 0.4834,300 JPY Aeon Mall Co. Ltd. 66,027 0.0470,600 JPY AGC, Inc. 326,878 0.2069,200 JPY Air Water, Inc.1 134,248 0.0857,900 JPY Aisin Corp.1 243,180 0.15167,500 JPY Ajinomoto Co., Inc. 379,471 0.2369,200 JPY Alfresa Holdings Corp.1 147,604 0.09117,800 JPY Amada Co. Ltd.1 145,365 0.0957,700 JPY ANA Holdings, Inc. 148,404 0.09165,800 JPY Asahi Group Holdings Ltd. 773,457 0.4772,700 JPY Asahi Intecc Co. Ltd. 221,735 0.13455,900 JPY Asahi Kasei Corp. 581,045 0.35676,600 JPY Astellas Pharma, Inc. 1,151,573 0.7046,000 JPY Azbil Corp.1 219,190 0.1372,200 JPY Bandai Namco Holdings, Inc.1 569,875 0.3421,400 JPY Bank of Kyoto Ltd. (The)1 145,734 0.09194,800 JPY Bridgestone Corp.1 871,730 0.5379,500 JPY Brother Industries Ltd.1 194,695 0.1230,400 JPY Calbee, Inc.1 85,789 0.05363,500 JPY Canon, Inc.1 909,659 0.5562,400 JPY Capcom Co. Ltd. 224,328 0.1471,800 JPY Casio Computer Co. Ltd.1 149,703 0.0952,500 JPY Central Japan Railway Co.1 868,875 0.53198,700 JPY Chiba Bank Ltd. (The)1 144,057 0.09233,200 JPY Chubu Electric Power Co., Inc.1 332,310 0.20244,100 JPY Chugai Pharmaceutical Co. Ltd. 1,095,765 0.66107,300 JPY Chugoku Electric Power Co., Inc. (The)1 145,821 0.0945,500 JPY Coca-Cola Bottlers Japan Holdings, Inc.1 87,769 0.05372,300 JPY Concordia Financial Group Ltd.1 167,163 0.106,900 JPY Cosmos Pharmaceutical Corp.1 119,163 0.07148,800 JPY CyberAgent, Inc. 296,558 0.1887,600 JPY Dai Nippon Printing Co. Ltd.1 203,144 0.1236,400 JPY Daifuku Co. Ltd.1 394,576 0.24388,100 JPY Dai-ichi Life Holdings, Inc.1 738,166 0.45618,400 JPY Daiichi Sankyo Co. Ltd. 1,994,340 1.2190,500 JPY Daikin Industries Ltd.1 2,019,960 1.2224,261 JPY Daito Trust Construction Co. Ltd.1 311,269 0.19204,200 JPY Daiwa House Industry Co. Ltd. 661,812 0.40705 JPY Daiwa House REIT Investment Corp.1 209,456 0.13528,300 JPY Daiwa Securities Group, Inc.1 302,240 0.18157,800 JPY Denso Corp.1 1,159,357 0.7079,600 JPY Dentsu Group, Inc.1 282,580 0.1710,400 JPY Disco Corp. 361,400 0.22110,000 JPY East Japan Railway Co.1 862,290 0.5290,900 JPY Eisai Co. Ltd. 674,387 0.411,115,600 JPY ENEOS Holdings, Inc.1 559,585 0.3469,661 JPY FANUC Corp.1 1,824,073 1.1021,243 JPY Fast Retailing Co. Ltd. 1,872,146 1.1345,400 JPY Fuji Electric Co. Ltd. 209,294 0.13131,100 JPY FUJIFILM Holdings Corp. 861,458 0.5271,600 JPY Fujitsu Ltd. 1,145,600 0.6964,442 JPY Fukuoka Financial Group, Inc.1 135,264 0.081,516 JPY GLP J-Reit1 275,609 0.1715,300 JPY GMO Payment Gateway, Inc. 224,604 0.1485,700 JPY Hakuhodo DY Holdings, Inc.1 158,117 0.1050,800 JPY Hamamatsu Photonics KK1 332,232 0.2083,500 JPY Hankyu Hanshin Holdings, Inc.1 296,007 0.1815,200 JPY Harmonic Drive Systems, Inc.1 113,696 0.07
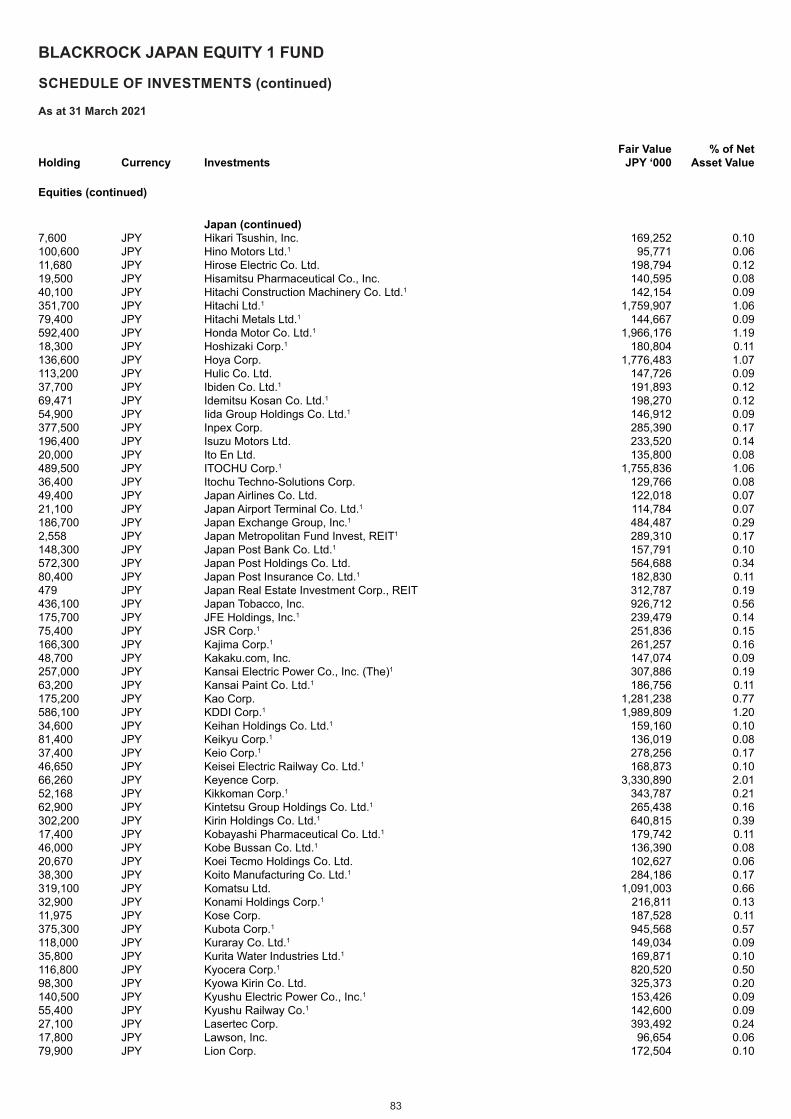
83
BLACKROCK JAPAN EQUITY 1 FUND
SCHEDULE OF INVESTMENTS (continued)
As at 31 March 2021
Holding Currency Investments Fair Value
JPY ‘000 % of Net
Asset Value
Equities (continued)
Japan (continued) 7,600 JPY Hikari Tsushin, Inc. 169,252 0.10100,600 JPY Hino Motors Ltd.1 95,771 0.0611,680 JPY Hirose Electric Co. Ltd. 198,794 0.1219,500 JPY Hisamitsu Pharmaceutical Co., Inc. 140,595 0.0840,100 JPY Hitachi Construction Machinery Co. Ltd.1 142,154 0.09351,700 JPY Hitachi Ltd.1 1,759,907 1.0679,400 JPY Hitachi Metals Ltd.1 144,667 0.09592,400 JPY Honda Motor Co. Ltd.1 1,966,176 1.1918,300 JPY Hoshizaki Corp.1 180,804 0.11136,600 JPY Hoya Corp. 1,776,483 1.07113,200 JPY Hulic Co. Ltd. 147,726 0.0937,700 JPY Ibiden Co. Ltd.1 191,893 0.1269,471 JPY Idemitsu Kosan Co. Ltd.1 198,270 0.1254,900 JPY Iida Group Holdings Co. Ltd.1 146,912 0.09377,500 JPY Inpex Corp. 285,390 0.17196,400 JPY Isuzu Motors Ltd. 233,520 0.1420,000 JPY Ito En Ltd. 135,800 0.08489,500 JPY ITOCHU Corp.1 1,755,836 1.0636,400 JPY Itochu Techno-Solutions Corp. 129,766 0.0849,400 JPY Japan Airlines Co. Ltd. 122,018 0.0721,100 JPY Japan Airport Terminal Co. Ltd.1 114,784 0.07186,700 JPY Japan Exchange Group, Inc.1 484,487 0.292,558 JPY Japan Metropolitan Fund Invest, REIT1 289,310 0.17148,300 JPY Japan Post Bank Co. Ltd.1 157,791 0.10572,300 JPY Japan Post Holdings Co. Ltd. 564,688 0.3480,400 JPY Japan Post Insurance Co. Ltd.1 182,830 0.11479 JPY Japan Real Estate Investment Corp., REIT 312,787 0.19436,100 JPY Japan Tobacco, Inc. 926,712 0.56175,700 JPY JFE Holdings, Inc.1 239,479 0.1475,400 JPY JSR Corp.1 251,836 0.15166,300 JPY Kajima Corp.1 261,257 0.1648,700 JPY Kakaku.com, Inc. 147,074 0.09257,000 JPY Kansai Electric Power Co., Inc. (The)1 307,886 0.1963,200 JPY Kansai Paint Co. Ltd.1 186,756 0.11175,200 JPY Kao Corp. 1,281,238 0.77586,100 JPY KDDI Corp.1 1,989,809 1.2034,600 JPY Keihan Holdings Co. Ltd.1 159,160 0.1081,400 JPY Keikyu Corp.1 136,019 0.0837,400 JPY Keio Corp.1 278,256 0.1746,650 JPY Keisei Electric Railway Co. Ltd.1 168,873 0.1066,260 JPY Keyence Corp. 3,330,890 2.0152,168 JPY Kikkoman Corp.1 343,787 0.2162,900 JPY Kintetsu Group Holdings Co. Ltd.1 265,438 0.16302,200 JPY Kirin Holdings Co. Ltd.1 640,815 0.3917,400 JPY Kobayashi Pharmaceutical Co. Ltd.1 179,742 0.1146,000 JPY Kobe Bussan Co. Ltd.1 136,390 0.0820,670 JPY Koei Tecmo Holdings Co. Ltd. 102,627 0.0638,300 JPY Koito Manufacturing Co. Ltd.1 284,186 0.17319,100 JPY Komatsu Ltd. 1,091,003 0.6632,900 JPY Konami Holdings Corp.1 216,811 0.1311,975 JPY Kose Corp. 187,528 0.11375,300 JPY Kubota Corp.1 945,568 0.57118,000 JPY Kuraray Co. Ltd.1 149,034 0.0935,800 JPY Kurita Water Industries Ltd.1 169,871 0.10116,800 JPY Kyocera Corp.1 820,520 0.5098,300 JPY Kyowa Kirin Co. Ltd. 325,373 0.20140,500 JPY Kyushu Electric Power Co., Inc.1 153,426 0.0955,400 JPY Kyushu Railway Co.1 142,600 0.0927,100 JPY Lasertec Corp. 393,492 0.2417,800 JPY Lawson, Inc. 96,654 0.0679,900 JPY Lion Corp. 172,504 0.10
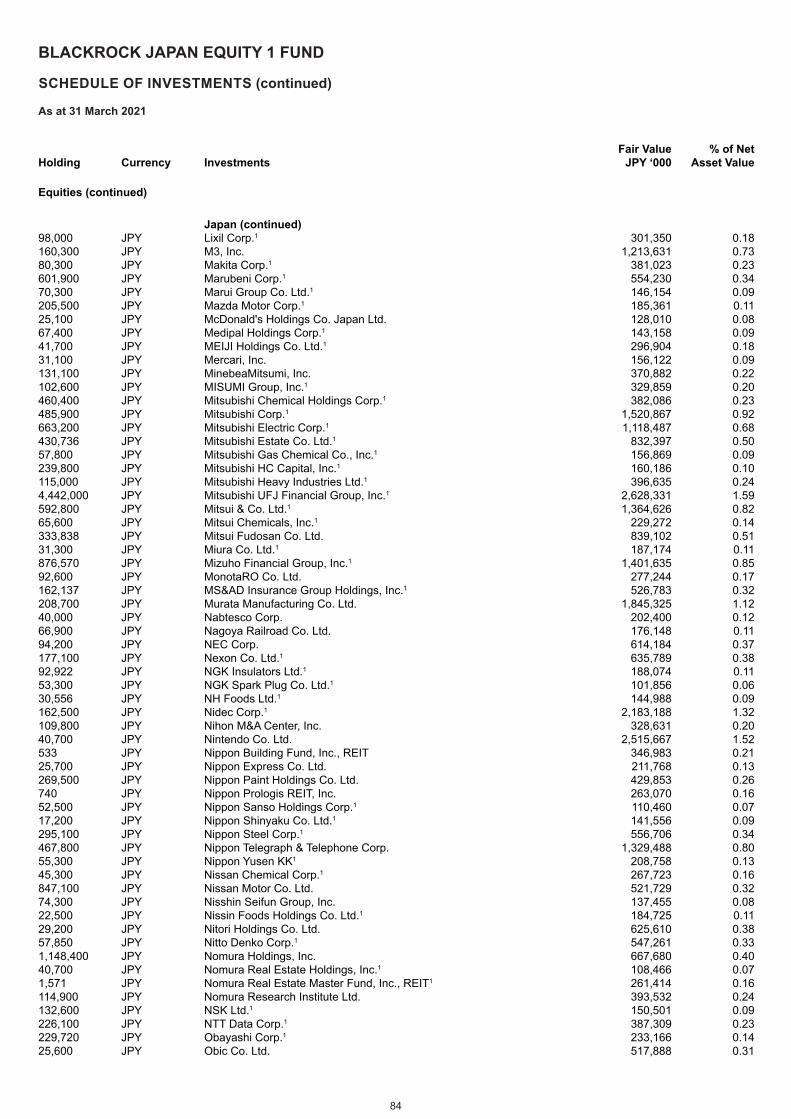
84
BLACKROCK JAPAN EQUITY 1 FUND
SCHEDULE OF INVESTMENTS (continued)
As at 31 March 2021
Holding Currency Investments Fair Value
JPY ‘000 % of Net
Asset Value
Equities (continued)
Japan (continued) 98,000 JPY Lixil Corp.1 301,350 0.18160,300 JPY M3, Inc. 1,213,631 0.7380,300 JPY Makita Corp.1 381,023 0.23601,900 JPY Marubeni Corp.1 554,230 0.3470,300 JPY Marui Group Co. Ltd.1 146,154 0.09205,500 JPY Mazda Motor Corp.1 185,361 0.1125,100 JPY McDonald's Holdings Co. Japan Ltd. 128,010 0.0867,400 JPY Medipal Holdings Corp.1 143,158 0.0941,700 JPY MEIJI Holdings Co. Ltd.1 296,904 0.1831,100 JPY Mercari, Inc. 156,122 0.09131,100 JPY MinebeaMitsumi, Inc. 370,882 0.22102,600 JPY MISUMI Group, Inc.1 329,859 0.20460,400 JPY Mitsubishi Chemical Holdings Corp.1 382,086 0.23485,900 JPY Mitsubishi Corp.1 1,520,867 0.92663,200 JPY Mitsubishi Electric Corp.1 1,118,487 0.68430,736 JPY Mitsubishi Estate Co. Ltd.1 832,397 0.5057,800 JPY Mitsubishi Gas Chemical Co., Inc.1 156,869 0.09239,800 JPY Mitsubishi HC Capital, Inc.1 160,186 0.10115,000 JPY Mitsubishi Heavy Industries Ltd.1 396,635 0.244,442,000 JPY Mitsubishi UFJ Financial Group, Inc.1 2,628,331 1.59592,800 JPY Mitsui & Co. Ltd.1 1,364,626 0.8265,600 JPY Mitsui Chemicals, Inc.1 229,272 0.14333,838 JPY Mitsui Fudosan Co. Ltd. 839,102 0.5131,300 JPY Miura Co. Ltd.1 187,174 0.11876,570 JPY Mizuho Financial Group, Inc.1 1,401,635 0.8592,600 JPY MonotaRO Co. Ltd. 277,244 0.17162,137 JPY MS&AD Insurance Group Holdings, Inc.1 526,783 0.32208,700 JPY Murata Manufacturing Co. Ltd. 1,845,325 1.1240,000 JPY Nabtesco Corp. 202,400 0.1266,900 JPY Nagoya Railroad Co. Ltd. 176,148 0.1194,200 JPY NEC Corp. 614,184 0.37177,100 JPY Nexon Co. Ltd.1 635,789 0.3892,922 JPY NGK Insulators Ltd.1 188,074 0.1153,300 JPY NGK Spark Plug Co. Ltd.1 101,856 0.0630,556 JPY NH Foods Ltd.1 144,988 0.09162,500 JPY Nidec Corp.1 2,183,188 1.32109,800 JPY Nihon M&A Center, Inc. 328,631 0.2040,700 JPY Nintendo Co. Ltd. 2,515,667 1.52533 JPY Nippon Building Fund, Inc., REIT 346,983 0.2125,700 JPY Nippon Express Co. Ltd. 211,768 0.13269,500 JPY Nippon Paint Holdings Co. Ltd. 429,853 0.26740 JPY Nippon Prologis REIT, Inc. 263,070 0.1652,500 JPY Nippon Sanso Holdings Corp.1 110,460 0.0717,200 JPY Nippon Shinyaku Co. Ltd.1 141,556 0.09295,100 JPY Nippon Steel Corp.1 556,706 0.34467,800 JPY Nippon Telegraph & Telephone Corp. 1,329,488 0.8055,300 JPY Nippon Yusen KK1 208,758 0.1345,300 JPY Nissan Chemical Corp.1 267,723 0.16847,100 JPY Nissan Motor Co. Ltd. 521,729 0.3274,300 JPY Nisshin Seifun Group, Inc. 137,455 0.0822,500 JPY Nissin Foods Holdings Co. Ltd.1 184,725 0.1129,200 JPY Nitori Holdings Co. Ltd. 625,610 0.3857,850 JPY Nitto Denko Corp.1 547,261 0.331,148,400 JPY Nomura Holdings, Inc. 667,680 0.4040,700 JPY Nomura Real Estate Holdings, Inc.1 108,466 0.071,571 JPY Nomura Real Estate Master Fund, Inc., REIT1 261,414 0.16114,900 JPY Nomura Research Institute Ltd. 393,532 0.24132,600 JPY NSK Ltd.1 150,501 0.09226,100 JPY NTT Data Corp.1 387,309 0.23229,720 JPY Obayashi Corp.1 233,166 0.1425,600 JPY Obic Co. Ltd. 517,888 0.31
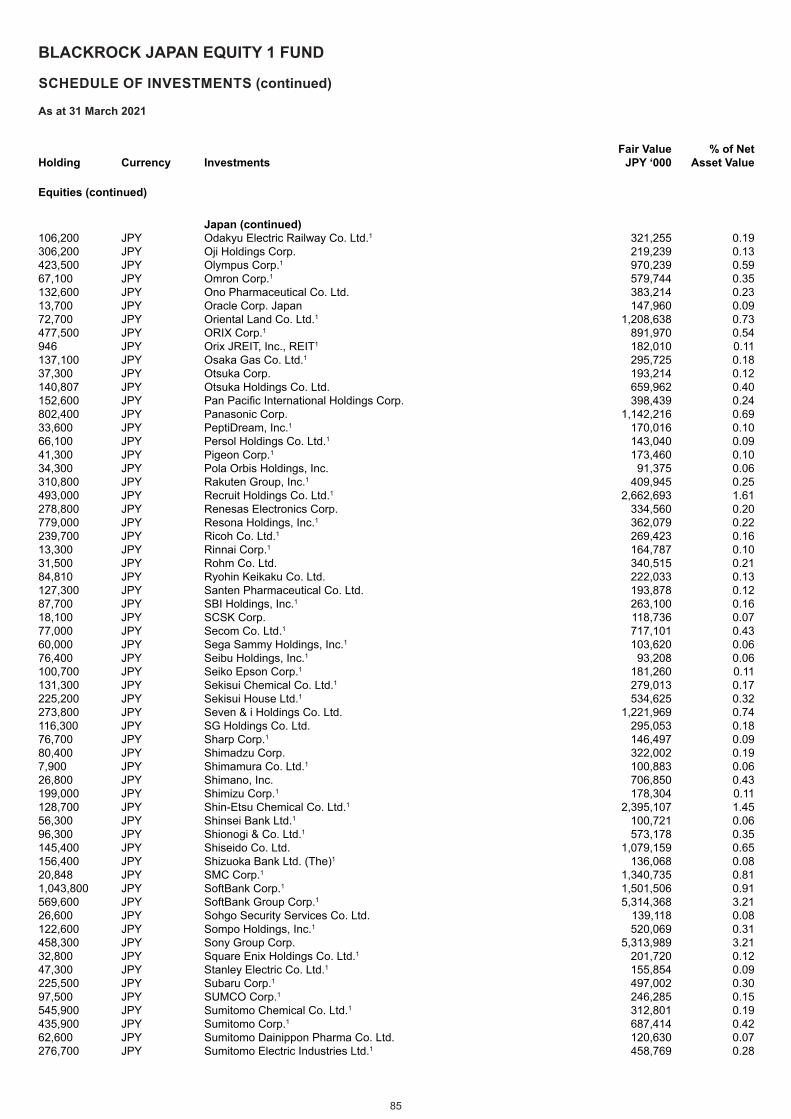
85
BLACKROCK JAPAN EQUITY 1 FUND
SCHEDULE OF INVESTMENTS (continued)
As at 31 March 2021
Holding Currency Investments Fair Value
JPY ‘000 % of Net
Asset Value
Equities (continued)
Japan (continued) 106,200 JPY Odakyu Electric Railway Co. Ltd.1 321,255 0.19306,200 JPY Oji Holdings Corp. 219,239 0.13423,500 JPY Olympus Corp.1 970,239 0.5967,100 JPY Omron Corp.1 579,744 0.35132,600 JPY Ono Pharmaceutical Co. Ltd. 383,214 0.2313,700 JPY Oracle Corp. Japan 147,960 0.0972,700 JPY Oriental Land Co. Ltd.1 1,208,638 0.73477,500 JPY ORIX Corp.1 891,970 0.54946 JPY Orix JREIT, Inc., REIT1 182,010 0.11137,100 JPY Osaka Gas Co. Ltd.1 295,725 0.1837,300 JPY Otsuka Corp. 193,214 0.12140,807 JPY Otsuka Holdings Co. Ltd. 659,962 0.40152,600 JPY Pan Pacific International Holdings Corp. 398,439 0.24802,400 JPY Panasonic Corp. 1,142,216 0.6933,600 JPY PeptiDream, Inc.1 170,016 0.1066,100 JPY Persol Holdings Co. Ltd.1 143,040 0.0941,300 JPY Pigeon Corp.1 173,460 0.1034,300 JPY Pola Orbis Holdings, Inc. 91,375 0.06310,800 JPY Rakuten Group, Inc.1 409,945 0.25493,000 JPY Recruit Holdings Co. Ltd.1 2,662,693 1.61278,800 JPY Renesas Electronics Corp. 334,560 0.20779,000 JPY Resona Holdings, Inc.1 362,079 0.22239,700 JPY Ricoh Co. Ltd.1 269,423 0.1613,300 JPY Rinnai Corp.1 164,787 0.1031,500 JPY Rohm Co. Ltd. 340,515 0.2184,810 JPY Ryohin Keikaku Co. Ltd. 222,033 0.13127,300 JPY Santen Pharmaceutical Co. Ltd. 193,878 0.1287,700 JPY SBI Holdings, Inc.1 263,100 0.1618,100 JPY SCSK Corp. 118,736 0.0777,000 JPY Secom Co. Ltd.1 717,101 0.4360,000 JPY Sega Sammy Holdings, Inc.1 103,620 0.0676,400 JPY Seibu Holdings, Inc.1 93,208 0.06100,700 JPY Seiko Epson Corp.1 181,260 0.11131,300 JPY Sekisui Chemical Co. Ltd.1 279,013 0.17225,200 JPY Sekisui House Ltd.1 534,625 0.32273,800 JPY Seven & i Holdings Co. Ltd. 1,221,969 0.74116,300 JPY SG Holdings Co. Ltd. 295,053 0.1876,700 JPY Sharp Corp.1 146,497 0.0980,400 JPY Shimadzu Corp. 322,002 0.197,900 JPY Shimamura Co. Ltd.1 100,883 0.0626,800 JPY Shimano, Inc. 706,850 0.43199,000 JPY Shimizu Corp.1 178,304 0.11128,700 JPY Shin-Etsu Chemical Co. Ltd.1 2,395,107 1.4556,300 JPY Shinsei Bank Ltd.1 100,721 0.0696,300 JPY Shionogi & Co. Ltd.1 573,178 0.35145,400 JPY Shiseido Co. Ltd. 1,079,159 0.65156,400 JPY Shizuoka Bank Ltd. (The)1 136,068 0.0820,848 JPY SMC Corp.1 1,340,735 0.811,043,800 JPY SoftBank Corp.1 1,501,506 0.91569,600 JPY SoftBank Group Corp.1 5,314,368 3.2126,600 JPY Sohgo Security Services Co. Ltd. 139,118 0.08122,600 JPY Sompo Holdings, Inc.1 520,069 0.31458,300 JPY Sony Group Corp. 5,313,989 3.2132,800 JPY Square Enix Holdings Co. Ltd.1 201,720 0.1247,300 JPY Stanley Electric Co. Ltd.1 155,854 0.09225,500 JPY Subaru Corp.1 497,002 0.3097,500 JPY SUMCO Corp.1 246,285 0.15545,900 JPY Sumitomo Chemical Co. Ltd.1 312,801 0.19435,900 JPY Sumitomo Corp.1 687,414 0.4262,600 JPY Sumitomo Dainippon Pharma Co. Ltd. 120,630 0.07276,700 JPY Sumitomo Electric Industries Ltd.1 458,769 0.28
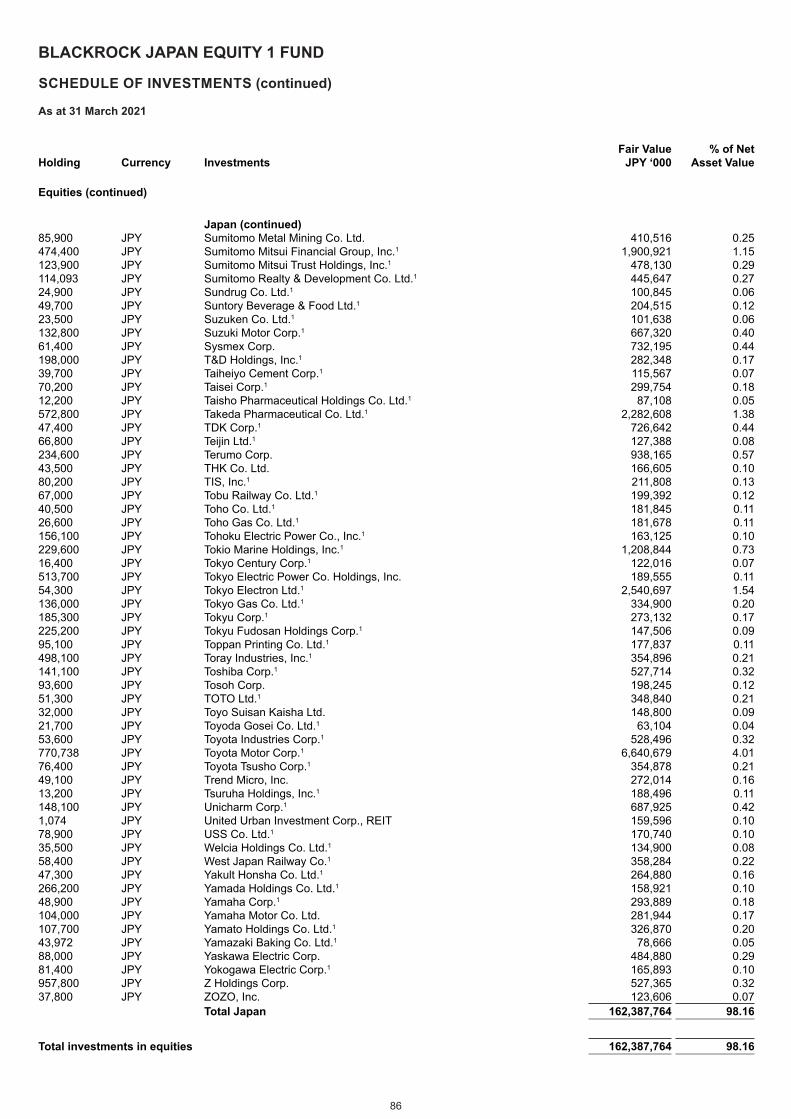
86
BLACKROCK JAPAN EQUITY 1 FUND
SCHEDULE OF INVESTMENTS (continued)
As at 31 March 2021
Holding Currency Investments Fair Value
JPY ‘000 % of Net
Asset Value
Equities (continued)
Japan (continued) 85,900 JPY Sumitomo Metal Mining Co. Ltd. 410,516 0.25474,400 JPY Sumitomo Mitsui Financial Group, Inc.1 1,900,921 1.15123,900 JPY Sumitomo Mitsui Trust Holdings, Inc.1 478,130 0.29114,093 JPY Sumitomo Realty & Development Co. Ltd.1 445,647 0.2724,900 JPY Sundrug Co. Ltd.1 100,845 0.0649,700 JPY Suntory Beverage & Food Ltd.1 204,515 0.1223,500 JPY Suzuken Co. Ltd.1 101,638 0.06132,800 JPY Suzuki Motor Corp.1 667,320 0.4061,400 JPY Sysmex Corp. 732,195 0.44198,000 JPY T&D Holdings, Inc.1 282,348 0.1739,700 JPY Taiheiyo Cement Corp.1 115,567 0.0770,200 JPY Taisei Corp.1 299,754 0.1812,200 JPY Taisho Pharmaceutical Holdings Co. Ltd.1 87,108 0.05572,800 JPY Takeda Pharmaceutical Co. Ltd.1 2,282,608 1.3847,400 JPY TDK Corp.1 726,642 0.4466,800 JPY Teijin Ltd.1 127,388 0.08234,600 JPY Terumo Corp. 938,165 0.5743,500 JPY THK Co. Ltd. 166,605 0.1080,200 JPY TIS, Inc.1 211,808 0.1367,000 JPY Tobu Railway Co. Ltd.1 199,392 0.1240,500 JPY Toho Co. Ltd.1 181,845 0.1126,600 JPY Toho Gas Co. Ltd.1 181,678 0.11156,100 JPY Tohoku Electric Power Co., Inc.1 163,125 0.10229,600 JPY Tokio Marine Holdings, Inc.1 1,208,844 0.7316,400 JPY Tokyo Century Corp.1 122,016 0.07513,700 JPY Tokyo Electric Power Co. Holdings, Inc. 189,555 0.1154,300 JPY Tokyo Electron Ltd.1 2,540,697 1.54136,000 JPY Tokyo Gas Co. Ltd.1 334,900 0.20185,300 JPY Tokyu Corp.1 273,132 0.17225,200 JPY Tokyu Fudosan Holdings Corp.1 147,506 0.0995,100 JPY Toppan Printing Co. Ltd.1 177,837 0.11498,100 JPY Toray Industries, Inc.1 354,896 0.21141,100 JPY Toshiba Corp.1 527,714 0.3293,600 JPY Tosoh Corp. 198,245 0.1251,300 JPY TOTO Ltd.1 348,840 0.2132,000 JPY Toyo Suisan Kaisha Ltd. 148,800 0.0921,700 JPY Toyoda Gosei Co. Ltd.1 63,104 0.0453,600 JPY Toyota Industries Corp.1 528,496 0.32770,738 JPY Toyota Motor Corp.1 6,640,679 4.0176,400 JPY Toyota Tsusho Corp.1 354,878 0.2149,100 JPY Trend Micro, Inc. 272,014 0.1613,200 JPY Tsuruha Holdings, Inc.1 188,496 0.11148,100 JPY Unicharm Corp.1 687,925 0.421,074 JPY United Urban Investment Corp., REIT 159,596 0.1078,900 JPY USS Co. Ltd.1 170,740 0.1035,500 JPY Welcia Holdings Co. Ltd.1 134,900 0.0858,400 JPY West Japan Railway Co.1 358,284 0.2247,300 JPY Yakult Honsha Co. Ltd.1 264,880 0.16266,200 JPY Yamada Holdings Co. Ltd.1 158,921 0.1048,900 JPY Yamaha Corp.1 293,889 0.18104,000 JPY Yamaha Motor Co. Ltd. 281,944 0.17107,700 JPY Yamato Holdings Co. Ltd.1 326,870 0.2043,972 JPY Yamazaki Baking Co. Ltd.1 78,666 0.0588,000 JPY Yaskawa Electric Corp. 484,880 0.2981,400 JPY Yokogawa Electric Corp.1 165,893 0.10957,800 JPY Z Holdings Corp. 527,365 0.3237,800 JPY ZOZO, Inc. 123,606 0.07
Total Japan 162,387,764 98.16
Total investments in equities 162,387,764 98.16
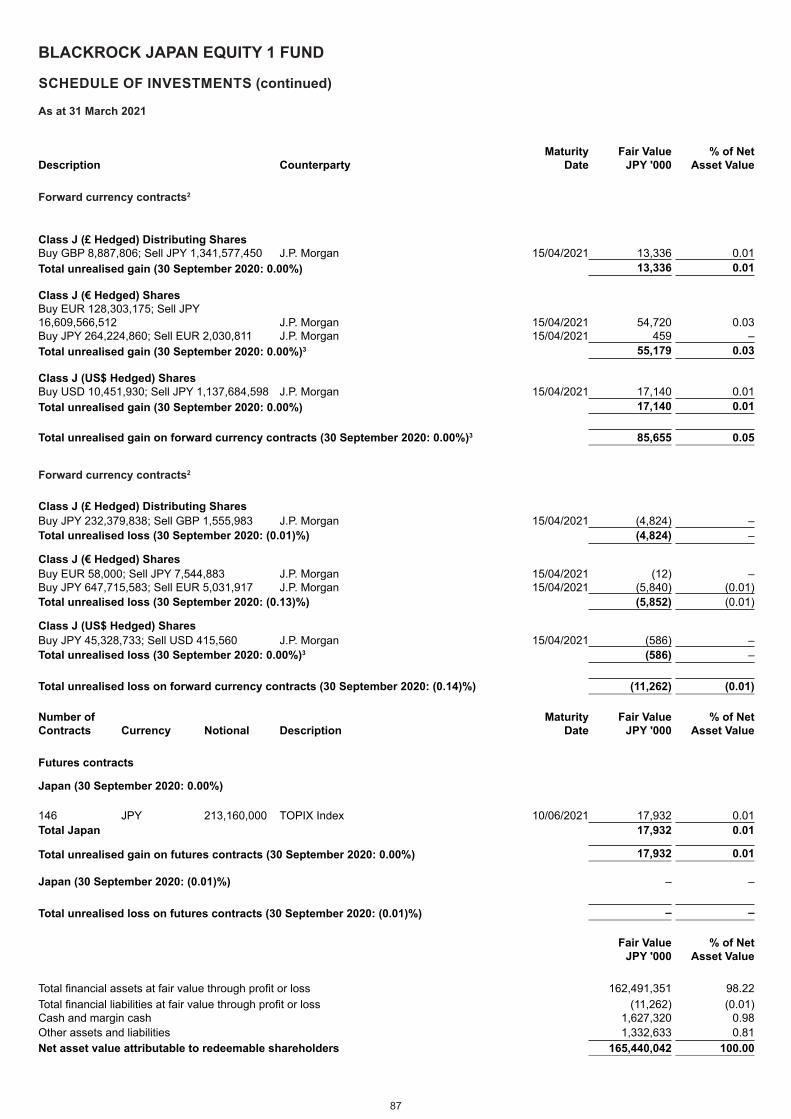
87
BLACKROCK JAPAN EQUITY 1 FUND
SCHEDULE OF INVESTMENTS (continued)
As at 31 March 2021
Maturity Fair Value % of NetDescription Counterparty Date JPY '000 Asset Value
Forward currency contracts2
Class J (£ Hedged) Distributing SharesBuy GBP 8,887,806; Sell JPY 1,341,577,450 J.P. Morgan 15/04/2021 13,336 0.01Total unrealised gain (30 September 2020: 0.00%) 13,336 0.01
Class J (€ Hedged) SharesBuy EUR 128,303,175; Sell JPY 16,609,566,512 J.P. Morgan 15/04/2021 54,720 0.03Buy JPY 264,224,860; Sell EUR 2,030,811 J.P. Morgan 15/04/2021 459 –Total unrealised gain (30 September 2020: 0.00%)3 55,179 0.03
Class J (US$ Hedged) SharesBuy USD 10,451,930; Sell JPY 1,137,684,598 J.P. Morgan 15/04/2021 17,140 0.01Total unrealised gain (30 September 2020: 0.00%) 17,140 0.01 Total unrealised gain on forward currency contracts (30 September 2020: 0.00%)3 85,655 0.05
Forward currency contracts2
Class J (£ Hedged) Distributing SharesBuy JPY 232,379,838; Sell GBP 1,555,983 J.P. Morgan 15/04/2021 (4,824) –Total unrealised loss (30 September 2020: (0.01)%) (4,824) –
Class J (€ Hedged) SharesBuy EUR 58,000; Sell JPY 7,544,883 J.P. Morgan 15/04/2021 (12) –Buy JPY 647,715,583; Sell EUR 5,031,917 J.P. Morgan 15/04/2021 (5,840) (0.01)Total unrealised loss (30 September 2020: (0.13)%) (5,852) (0.01)
Class J (US$ Hedged) SharesBuy JPY 45,328,733; Sell USD 415,560 J.P. Morgan 15/04/2021 (586) –Total unrealised loss (30 September 2020: 0.00%)3 (586) – Total unrealised loss on forward currency contracts (30 September 2020: (0.14)%) (11,262) (0.01) Number of Maturity Fair Value % of NetContracts Currency Notional Description Date JPY '000 Asset Value
Futures contracts
Japan (30 September 2020: 0.00%)
146 JPY 213,160,000 TOPIX Index 10/06/2021 17,932 0.01Total Japan 17,932 0.01
Total unrealised gain on futures contracts (30 September 2020: 0.00%) 17,932 0.01 Japan (30 September 2020: (0.01)%) – –
Total unrealised loss on futures contracts (30 September 2020: (0.01)%) – –
Fair Value JPY '000
% of Net Asset Value
Total financial assets at fair value through profit or loss 162,491,351 98.22Total financial liabilities at fair value through profit or loss (11,262) (0.01)Cash and margin cash 1,627,320 0.98Other assets and liabilities 1,332,633 0.81Net asset value attributable to redeemable shareholders 165,440,042 100.00

88
BLACKROCK JAPAN EQUITY 1 FUND
SCHEDULE OF INVESTMENTS (continued)
As at 31 March 2021
Analysis of total assets % of Total
AssetsTransferable securities admitted to official stock exchange listing 97.92Financial derivative instruments dealt in on a regulated market 0.01OTC financial derivative instruments 0.05Other assets 2.02Total assets 100.00 1Security fully or partially on loan.2Forward currency contracts held with one counterparty that have the same buy currency, sell currency and maturity date are presented on an aggregate basis where applicable. There is no netting of asset and liability positions.
3Prior year percentage of net asset value rounds to 0.00%.
Underlying exposureOn gains JPY '000
On losses JPY '000
Forward currency contracts 19,434,455 942,957Futures contracts 2,887,880 –
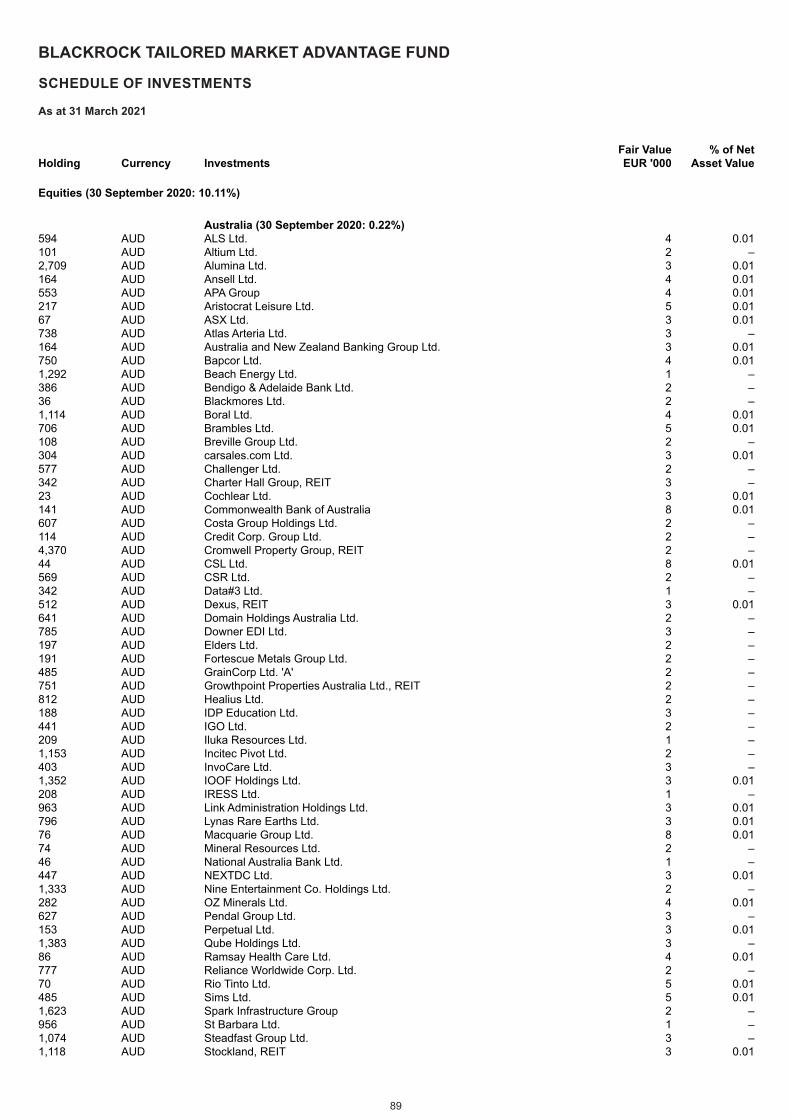
89
BLACKROCK TAILORED MARKET ADVANTAGE FUND
SCHEDULE OF INVESTMENTS
As at 31 March 2021
Holding Currency InvestmentsFair Value EUR '000
% of Net Asset Value
Equities (30 September 2020: 10.11%)
Australia (30 September 2020: 0.22%)594 AUD ALS Ltd. 4 0.01101 AUD Altium Ltd. 2 –2,709 AUD Alumina Ltd. 3 0.01164 AUD Ansell Ltd. 4 0.01553 AUD APA Group 4 0.01217 AUD Aristocrat Leisure Ltd. 5 0.0167 AUD ASX Ltd. 3 0.01738 AUD Atlas Arteria Ltd. 3 –164 AUD Australia and New Zealand Banking Group Ltd. 3 0.01750 AUD Bapcor Ltd. 4 0.011,292 AUD Beach Energy Ltd. 1 –386 AUD Bendigo & Adelaide Bank Ltd. 2 –36 AUD Blackmores Ltd. 2 –1,114 AUD Boral Ltd. 4 0.01706 AUD Brambles Ltd. 5 0.01108 AUD Breville Group Ltd. 2 –304 AUD carsales.com Ltd. 3 0.01577 AUD Challenger Ltd. 2 –342 AUD Charter Hall Group, REIT 3 –23 AUD Cochlear Ltd. 3 0.01141 AUD Commonwealth Bank of Australia 8 0.01607 AUD Costa Group Holdings Ltd. 2 –114 AUD Credit Corp. Group Ltd. 2 –4,370 AUD Cromwell Property Group, REIT 2 –44 AUD CSL Ltd. 8 0.01569 AUD CSR Ltd. 2 –342 AUD Data#3 Ltd. 1 –512 AUD Dexus, REIT 3 0.01641 AUD Domain Holdings Australia Ltd. 2 –785 AUD Downer EDI Ltd. 3 –197 AUD Elders Ltd. 2 –191 AUD Fortescue Metals Group Ltd. 2 –485 AUD GrainCorp Ltd. 'A' 2 –751 AUD Growthpoint Properties Australia Ltd., REIT 2 –812 AUD Healius Ltd. 2 –188 AUD IDP Education Ltd. 3 –441 AUD IGO Ltd. 2 –209 AUD Iluka Resources Ltd. 1 –1,153 AUD Incitec Pivot Ltd. 2 –403 AUD InvoCare Ltd. 3 –1,352 AUD IOOF Holdings Ltd. 3 0.01208 AUD IRESS Ltd. 1 –963 AUD Link Administration Holdings Ltd. 3 0.01796 AUD Lynas Rare Earths Ltd. 3 0.0176 AUD Macquarie Group Ltd. 8 0.0174 AUD Mineral Resources Ltd. 2 –46 AUD National Australia Bank Ltd. 1 –447 AUD NEXTDC Ltd. 3 0.011,333 AUD Nine Entertainment Co. Holdings Ltd. 2 –282 AUD OZ Minerals Ltd. 4 0.01627 AUD Pendal Group Ltd. 3 –153 AUD Perpetual Ltd. 3 0.011,383 AUD Qube Holdings Ltd. 3 –86 AUD Ramsay Health Care Ltd. 4 0.01777 AUD Reliance Worldwide Corp. Ltd. 2 –70 AUD Rio Tinto Ltd. 5 0.01485 AUD Sims Ltd. 5 0.011,623 AUD Spark Infrastructure Group 2 –956 AUD St Barbara Ltd. 1 –1,074 AUD Steadfast Group Ltd. 3 –1,118 AUD Stockland, REIT 3 0.01
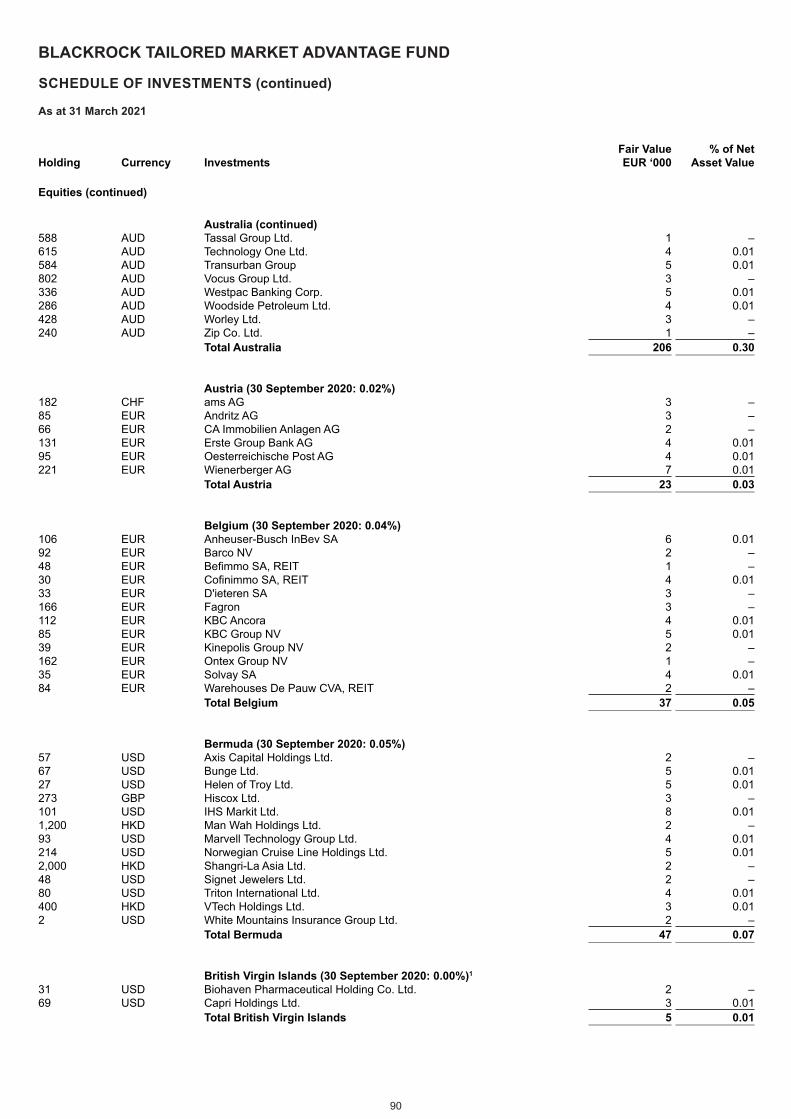
90
BLACKROCK TAILORED MARKET ADVANTAGE FUND
SCHEDULE OF INVESTMENTS (continued)
As at 31 March 2021
Holding Currency InvestmentsFair Value EUR ‘000
% of Net Asset Value
Equities (continued)
Australia (continued) 588 AUD Tassal Group Ltd. 1 –615 AUD Technology One Ltd. 4 0.01584 AUD Transurban Group 5 0.01802 AUD Vocus Group Ltd. 3 –336 AUD Westpac Banking Corp. 5 0.01286 AUD Woodside Petroleum Ltd. 4 0.01428 AUD Worley Ltd. 3 –240 AUD Zip Co. Ltd. 1 –
Total Australia 206 0.30
Austria (30 September 2020: 0.02%)182 CHF ams AG 3 –85 EUR Andritz AG 3 –66 EUR CA Immobilien Anlagen AG 2 –131 EUR Erste Group Bank AG 4 0.0195 EUR Oesterreichische Post AG 4 0.01221 EUR Wienerberger AG 7 0.01
Total Austria 23 0.03
Belgium (30 September 2020: 0.04%)106 EUR Anheuser-Busch InBev SA 6 0.0192 EUR Barco NV 2 –48 EUR Befimmo SA, REIT 1 –30 EUR Cofinimmo SA, REIT 4 0.0133 EUR D'ieteren SA 3 –166 EUR Fagron 3 –112 EUR KBC Ancora 4 0.0185 EUR KBC Group NV 5 0.0139 EUR Kinepolis Group NV 2 –162 EUR Ontex Group NV 1 –35 EUR Solvay SA 4 0.0184 EUR Warehouses De Pauw CVA, REIT 2 –
Total Belgium 37 0.05
Bermuda (30 September 2020: 0.05%)57 USD Axis Capital Holdings Ltd. 2 –67 USD Bunge Ltd. 5 0.0127 USD Helen of Troy Ltd. 5 0.01273 GBP Hiscox Ltd. 3 –101 USD IHS Markit Ltd. 8 0.011,200 HKD Man Wah Holdings Ltd. 2 –93 USD Marvell Technology Group Ltd. 4 0.01214 USD Norwegian Cruise Line Holdings Ltd. 5 0.012,000 HKD Shangri-La Asia Ltd. 2 –48 USD Signet Jewelers Ltd. 2 –80 USD Triton International Ltd. 4 0.01400 HKD VTech Holdings Ltd. 3 0.012 USD White Mountains Insurance Group Ltd. 2 –
Total Bermuda 47 0.07
British Virgin Islands (30 September 2020: 0.00%)1
31 USD Biohaven Pharmaceutical Holding Co. Ltd. 2 –69 USD Capri Holdings Ltd. 3 0.01
Total British Virgin Islands 5 0.01
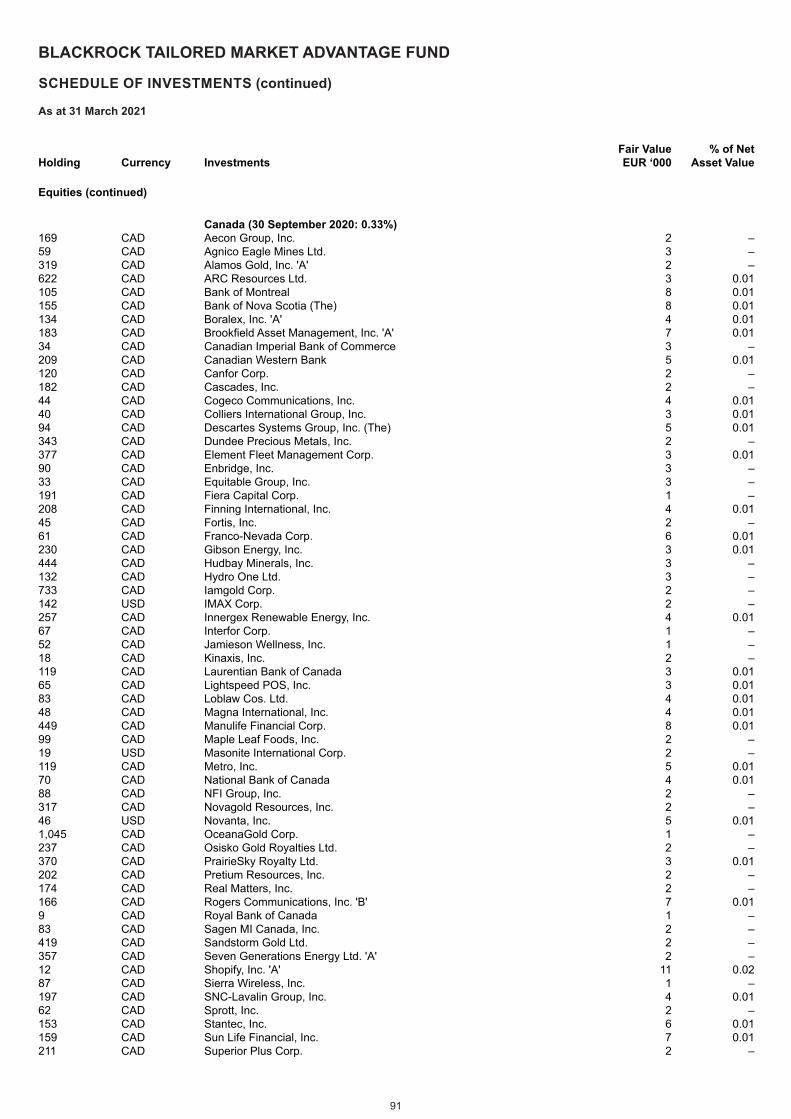
91
BLACKROCK TAILORED MARKET ADVANTAGE FUND
SCHEDULE OF INVESTMENTS (continued)
As at 31 March 2021
Holding Currency InvestmentsFair Value EUR ‘000
% of Net Asset Value
Equities (continued)
Canada (30 September 2020: 0.33%)169 CAD Aecon Group, Inc. 2 –59 CAD Agnico Eagle Mines Ltd. 3 –319 CAD Alamos Gold, Inc. 'A' 2 –622 CAD ARC Resources Ltd. 3 0.01105 CAD Bank of Montreal 8 0.01155 CAD Bank of Nova Scotia (The) 8 0.01134 CAD Boralex, Inc. 'A' 4 0.01183 CAD Brookfield Asset Management, Inc. 'A' 7 0.0134 CAD Canadian Imperial Bank of Commerce 3 –209 CAD Canadian Western Bank 5 0.01120 CAD Canfor Corp. 2 –182 CAD Cascades, Inc. 2 –44 CAD Cogeco Communications, Inc. 4 0.0140 CAD Colliers International Group, Inc. 3 0.0194 CAD Descartes Systems Group, Inc. (The) 5 0.01343 CAD Dundee Precious Metals, Inc. 2 –377 CAD Element Fleet Management Corp. 3 0.0190 CAD Enbridge, Inc. 3 –33 CAD Equitable Group, Inc. 3 –191 CAD Fiera Capital Corp. 1 –208 CAD Finning International, Inc. 4 0.0145 CAD Fortis, Inc. 2 –61 CAD Franco-Nevada Corp. 6 0.01230 CAD Gibson Energy, Inc. 3 0.01444 CAD Hudbay Minerals, Inc. 3 –132 CAD Hydro One Ltd. 3 –733 CAD Iamgold Corp. 2 –142 USD IMAX Corp. 2 –257 CAD Innergex Renewable Energy, Inc. 4 0.0167 CAD Interfor Corp. 1 –52 CAD Jamieson Wellness, Inc. 1 –18 CAD Kinaxis, Inc. 2 –119 CAD Laurentian Bank of Canada 3 0.0165 CAD Lightspeed POS, Inc. 3 0.0183 CAD Loblaw Cos. Ltd. 4 0.0148 CAD Magna International, Inc. 4 0.01449 CAD Manulife Financial Corp. 8 0.0199 CAD Maple Leaf Foods, Inc. 2 –19 USD Masonite International Corp. 2 –119 CAD Metro, Inc. 5 0.0170 CAD National Bank of Canada 4 0.0188 CAD NFI Group, Inc. 2 –317 CAD Novagold Resources, Inc. 2 –46 USD Novanta, Inc. 5 0.011,045 CAD OceanaGold Corp. 1 –237 CAD Osisko Gold Royalties Ltd. 2 –370 CAD PrairieSky Royalty Ltd. 3 0.01202 CAD Pretium Resources, Inc. 2 –174 CAD Real Matters, Inc. 2 –166 CAD Rogers Communications, Inc. 'B' 7 0.019 CAD Royal Bank of Canada 1 –83 CAD Sagen MI Canada, Inc. 2 –419 CAD Sandstorm Gold Ltd. 2 –357 CAD Seven Generations Energy Ltd. 'A' 2 –12 CAD Shopify, Inc. 'A' 11 0.0287 CAD Sierra Wireless, Inc. 1 –197 CAD SNC-Lavalin Group, Inc. 4 0.0162 CAD Sprott, Inc. 2 –153 CAD Stantec, Inc. 6 0.01159 CAD Sun Life Financial, Inc. 7 0.01211 CAD Superior Plus Corp. 2 –
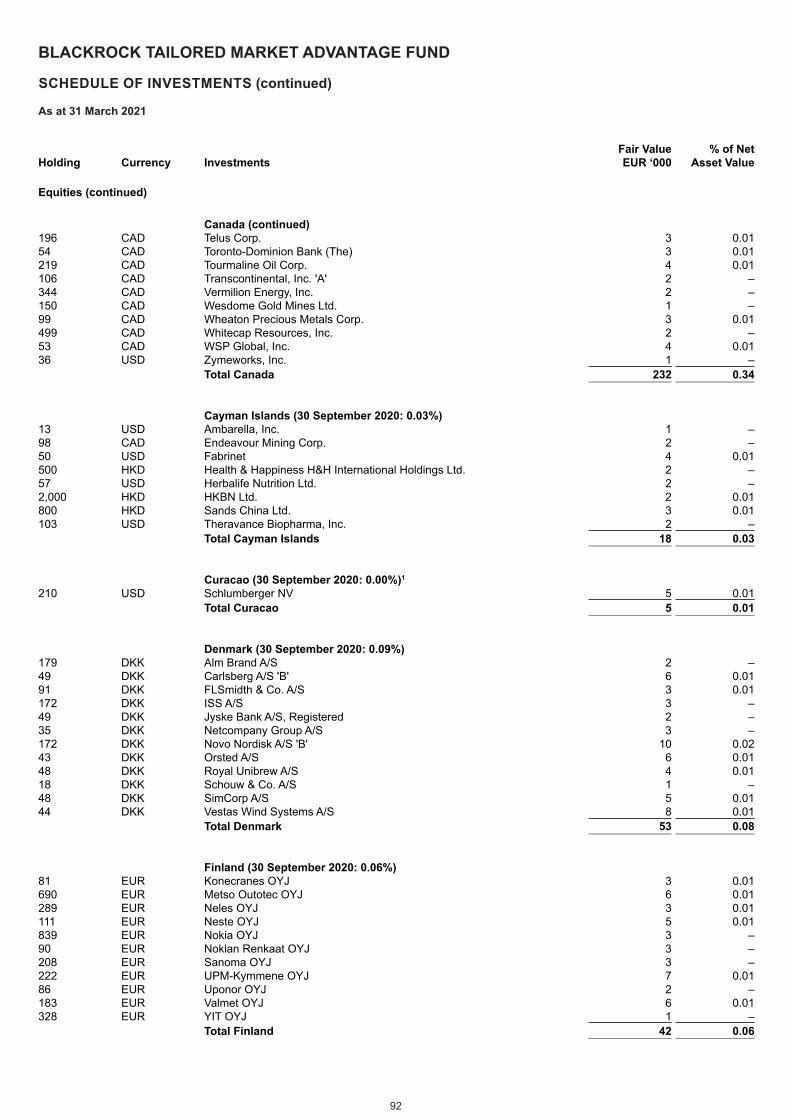
92
BLACKROCK TAILORED MARKET ADVANTAGE FUND
SCHEDULE OF INVESTMENTS (continued)
As at 31 March 2021
Holding Currency InvestmentsFair Value EUR ‘000
% of Net Asset Value
Equities (continued)
Canada (continued) 196 CAD Telus Corp. 3 0.0154 CAD Toronto-Dominion Bank (The) 3 0.01219 CAD Tourmaline Oil Corp. 4 0.01106 CAD Transcontinental, Inc. 'A' 2 –344 CAD Vermilion Energy, Inc. 2 –150 CAD Wesdome Gold Mines Ltd. 1 –99 CAD Wheaton Precious Metals Corp. 3 0.01499 CAD Whitecap Resources, Inc. 2 –53 CAD WSP Global, Inc. 4 0.0136 USD Zymeworks, Inc. 1 –
Total Canada 232 0.34
Cayman Islands (30 September 2020: 0.03%)13 USD Ambarella, Inc. 1 –98 CAD Endeavour Mining Corp. 2 –50 USD Fabrinet 4 0.01500 HKD Health & Happiness H&H International Holdings Ltd. 2 –57 USD Herbalife Nutrition Ltd. 2 –2,000 HKD HKBN Ltd. 2 0.01800 HKD Sands China Ltd. 3 0.01103 USD Theravance Biopharma, Inc. 2 –
Total Cayman Islands 18 0.03
Curacao (30 September 2020: 0.00%)1
210 USD Schlumberger NV 5 0.01Total Curacao 5 0.01
Denmark (30 September 2020: 0.09%)179 DKK Alm Brand A/S 2 –49 DKK Carlsberg A/S 'B' 6 0.0191 DKK FLSmidth & Co. A/S 3 0.01172 DKK ISS A/S 3 –49 DKK Jyske Bank A/S, Registered 2 –35 DKK Netcompany Group A/S 3 –172 DKK Novo Nordisk A/S 'B' 10 0.0243 DKK Orsted A/S 6 0.0148 DKK Royal Unibrew A/S 4 0.0118 DKK Schouw & Co. A/S 1 –48 DKK SimCorp A/S 5 0.0144 DKK Vestas Wind Systems A/S 8 0.01
Total Denmark 53 0.08
Finland (30 September 2020: 0.06%)81 EUR Konecranes OYJ 3 0.01690 EUR Metso Outotec OYJ 6 0.01289 EUR Neles OYJ 3 0.01111 EUR Neste OYJ 5 0.01839 EUR Nokia OYJ 3 –90 EUR Nokian Renkaat OYJ 3 –208 EUR Sanoma OYJ 3 –222 EUR UPM-Kymmene OYJ 7 0.0186 EUR Uponor OYJ 2 –183 EUR Valmet OYJ 6 0.01328 EUR YIT OYJ 1 –
Total Finland 42 0.06
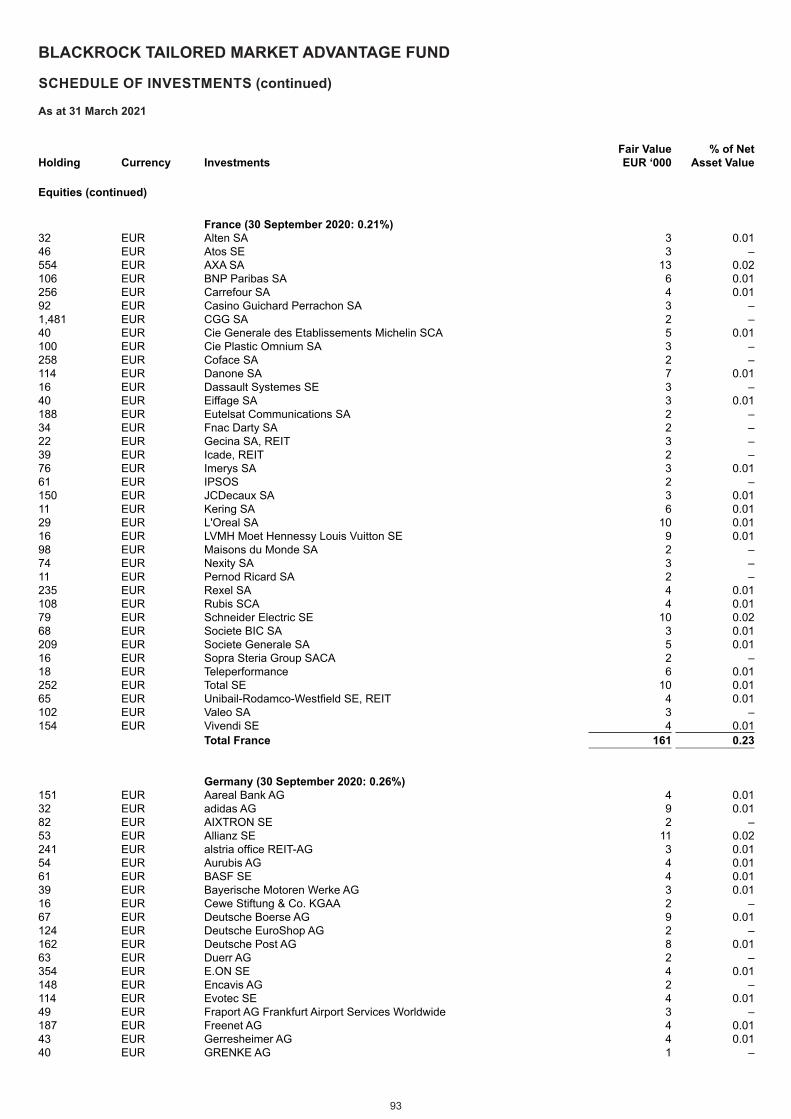
93
BLACKROCK TAILORED MARKET ADVANTAGE FUND
SCHEDULE OF INVESTMENTS (continued)
As at 31 March 2021
Holding Currency InvestmentsFair Value EUR ‘000
% of Net Asset Value
Equities (continued)
France (30 September 2020: 0.21%)32 EUR Alten SA 3 0.0146 EUR Atos SE 3 –554 EUR AXA SA 13 0.02106 EUR BNP Paribas SA 6 0.01256 EUR Carrefour SA 4 0.0192 EUR Casino Guichard Perrachon SA 3 –1,481 EUR CGG SA 2 –40 EUR Cie Generale des Etablissements Michelin SCA 5 0.01100 EUR Cie Plastic Omnium SA 3 –258 EUR Coface SA 2 –114 EUR Danone SA 7 0.0116 EUR Dassault Systemes SE 3 –40 EUR Eiffage SA 3 0.01188 EUR Eutelsat Communications SA 2 –34 EUR Fnac Darty SA 2 –22 EUR Gecina SA, REIT 3 –39 EUR Icade, REIT 2 –76 EUR Imerys SA 3 0.0161 EUR IPSOS 2 –150 EUR JCDecaux SA 3 0.0111 EUR Kering SA 6 0.0129 EUR L'Oreal SA 10 0.0116 EUR LVMH Moet Hennessy Louis Vuitton SE 9 0.0198 EUR Maisons du Monde SA 2 –74 EUR Nexity SA 3 –11 EUR Pernod Ricard SA 2 –235 EUR Rexel SA 4 0.01108 EUR Rubis SCA 4 0.0179 EUR Schneider Electric SE 10 0.0268 EUR Societe BIC SA 3 0.01209 EUR Societe Generale SA 5 0.0116 EUR Sopra Steria Group SACA 2 –18 EUR Teleperformance 6 0.01252 EUR Total SE 10 0.0165 EUR Unibail-Rodamco-Westfield SE, REIT 4 0.01102 EUR Valeo SA 3 –154 EUR Vivendi SE 4 0.01
Total France 161 0.23
Germany (30 September 2020: 0.26%)151 EUR Aareal Bank AG 4 0.0132 EUR adidas AG 9 0.0182 EUR AIXTRON SE 2 –53 EUR Allianz SE 11 0.02241 EUR alstria office REIT-AG 3 0.0154 EUR Aurubis AG 4 0.0161 EUR BASF SE 4 0.0139 EUR Bayerische Motoren Werke AG 3 0.0116 EUR Cewe Stiftung & Co. KGAA 2 –67 EUR Deutsche Boerse AG 9 0.01124 EUR Deutsche EuroShop AG 2 –162 EUR Deutsche Post AG 8 0.0163 EUR Duerr AG 2 –354 EUR E.ON SE 4 0.01148 EUR Encavis AG 2 –114 EUR Evotec SE 4 0.0149 EUR Fraport AG Frankfurt Airport Services Worldwide 3 –187 EUR Freenet AG 4 0.0143 EUR Gerresheimer AG 4 0.0140 EUR GRENKE AG 1 –
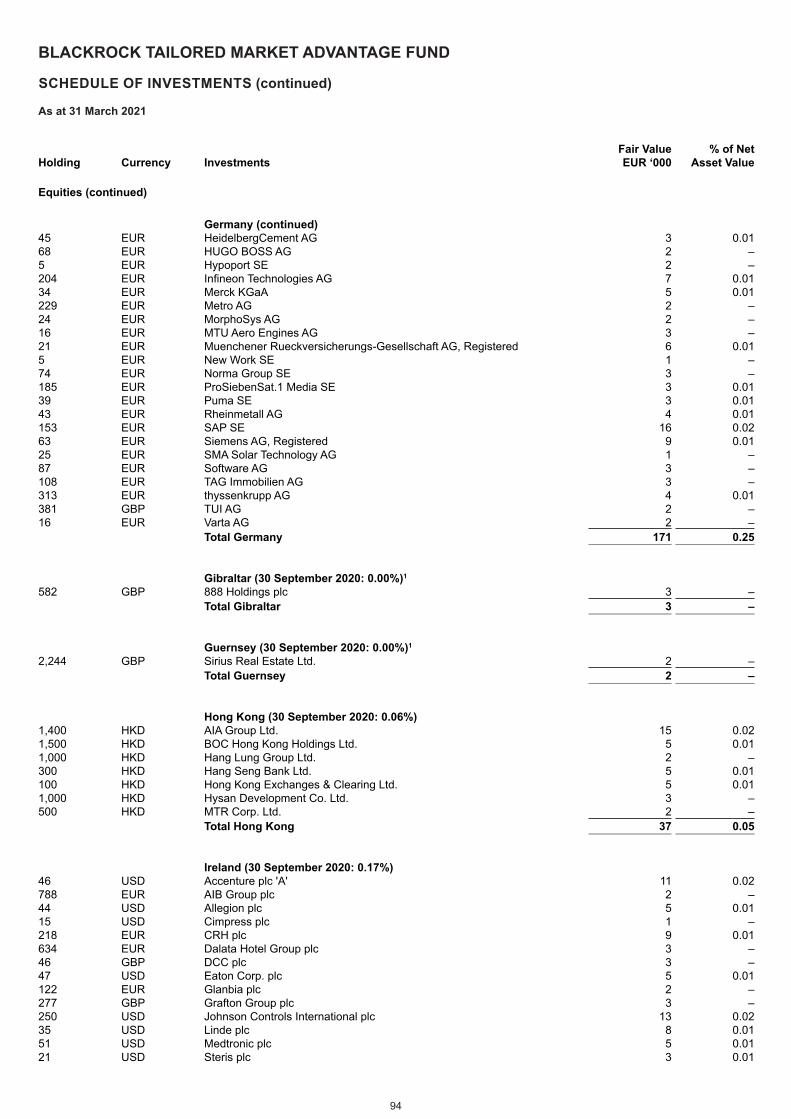
94
BLACKROCK TAILORED MARKET ADVANTAGE FUND
SCHEDULE OF INVESTMENTS (continued)
As at 31 March 2021
Holding Currency InvestmentsFair Value EUR ‘000
% of Net Asset Value
Equities (continued)
Germany (continued) 45 EUR HeidelbergCement AG 3 0.0168 EUR HUGO BOSS AG 2 –5 EUR Hypoport SE 2 –204 EUR Infineon Technologies AG 7 0.0134 EUR Merck KGaA 5 0.01229 EUR Metro AG 2 –24 EUR MorphoSys AG 2 –16 EUR MTU Aero Engines AG 3 –21 EUR Muenchener Rueckversicherungs-Gesellschaft AG, Registered 6 0.015 EUR New Work SE 1 –74 EUR Norma Group SE 3 –185 EUR ProSiebenSat.1 Media SE 3 0.0139 EUR Puma SE 3 0.0143 EUR Rheinmetall AG 4 0.01153 EUR SAP SE 16 0.0263 EUR Siemens AG, Registered 9 0.0125 EUR SMA Solar Technology AG 1 –87 EUR Software AG 3 –108 EUR TAG Immobilien AG 3 –313 EUR thyssenkrupp AG 4 0.01381 GBP TUI AG 2 –16 EUR Varta AG 2 –
Total Germany 171 0.25
Gibraltar (30 September 2020: 0.00%)1
582 GBP 888 Holdings plc 3 –Total Gibraltar 3 –
Guernsey (30 September 2020: 0.00%)1
2,244 GBP Sirius Real Estate Ltd. 2 –Total Guernsey 2 –
Hong Kong (30 September 2020: 0.06%)1,400 HKD AIA Group Ltd. 15 0.021,500 HKD BOC Hong Kong Holdings Ltd. 5 0.011,000 HKD Hang Lung Group Ltd. 2 –300 HKD Hang Seng Bank Ltd. 5 0.01100 HKD Hong Kong Exchanges & Clearing Ltd. 5 0.011,000 HKD Hysan Development Co. Ltd. 3 –500 HKD MTR Corp. Ltd. 2 –
Total Hong Kong 37 0.05
Ireland (30 September 2020: 0.17%)46 USD Accenture plc 'A' 11 0.02788 EUR AIB Group plc 2 –44 USD Allegion plc 5 0.0115 USD Cimpress plc 1 –218 EUR CRH plc 9 0.01634 EUR Dalata Hotel Group plc 3 –46 GBP DCC plc 3 –47 USD Eaton Corp. plc 5 0.01122 EUR Glanbia plc 2 –277 GBP Grafton Group plc 3 –250 USD Johnson Controls International plc 13 0.0235 USD Linde plc 8 0.0151 USD Medtronic plc 5 0.0121 USD Steris plc 3 0.01

95
BLACKROCK TAILORED MARKET ADVANTAGE FUND
SCHEDULE OF INVESTMENTS (continued)
As at 31 March 2021
Holding Currency InvestmentsFair Value EUR ‘000
% of Net Asset Value
Equities (continued)
Ireland (continued) 75 USD Trane Technologies plc 11 0.02258 GBP UDG Healthcare plc 2 –
Total Ireland 86 0.12
Israel (30 September 2020: 0.00%)394 ILS Amot Investments Ltd. 2 –2,326 ILS Bezeq The Israeli Telecommunication Corp. Ltd. 2 –127 ILS First International Bank of Israel Ltd. 3 0.01456 ILS Isracard Ltd. 1 –316 ILS Partner Communications Co. Ltd. 1 –23 ILS Paz Oil Co. Ltd. 2 –120 ILS Strauss Group Ltd. 3 0.01108 ILS Tower Semiconductor Ltd. 3 –12 USD Wix.com Ltd. 3 0.01
Total Israel 20 0.03
Italy (30 September 2020: 0.07%)986 EUR A2A SpA 2 –59 EUR ASTM SpA 2 –246 EUR Autogrill SpA 2 –405 EUR Banca Mediolanum SpA 3 0.011,012 EUR Banca Popolare di Sondrio SCPA 3 –665 EUR Banco BPM SpA 2 –837 EUR BPER Banca 2 –966 EUR Enel SpA 8 0.01169 EUR ERG SpA 4 0.01227 EUR Falck Renewables SpA 1 –75 EUR Gruppo MutuiOnline SpA 3 0.01364 EUR Hera SpA 1 –2,877 EUR Intesa Sanpaolo SpA 7 0.01448 EUR Italgas SpA 2 –761 EUR Pirelli & C SpA 4 0.01696 EUR Unipol Gruppo SpA 3 0.01
Total Italy 49 0.07
Japan (30 September 2020: 0.68%)200 JPY ADEKA Corp. 3 0.012 JPY Advance Residence Investment Corp., REIT 5 0.01100 JPY Aeon Co. Ltd. 3 –300 JPY AEON Financial Service Co. Ltd. 3 0.013 JPY AEON REIT Investment Corp. 3 0.01200 JPY Alps Alpine Co. Ltd. 2 –100 JPY Anicom Holdings, Inc. 1 –200 JPY Anritsu Corp. 4 0.01200 JPY Aozora Bank Ltd. 4 0.01500 JPY Asahi Kasei Corp. 5 0.01200 JPY Asics Corp. 3 –400 JPY Astellas Pharma, Inc. 5 0.01100 JPY Autobacs Seven Co. Ltd. 1 –100 JPY Benesse Holdings, Inc. 2 –100 JPY Canon Marketing Japan, Inc. 2 –100 JPY Chugai Pharmaceutical Co. Ltd. 3 0.01200 JPY Chugoku Bank Ltd. (The) 1 –700 JPY Citizen Watch Co. Ltd. 2 –2 JPY Comforia Residential REIT, Inc. 5 0.01100 JPY COMSYS Holdings Corp. 3 –200 JPY Credit Saison Co. Ltd. 2 –200 JPY Daiichi Sankyo Co. Ltd. 5 0.01
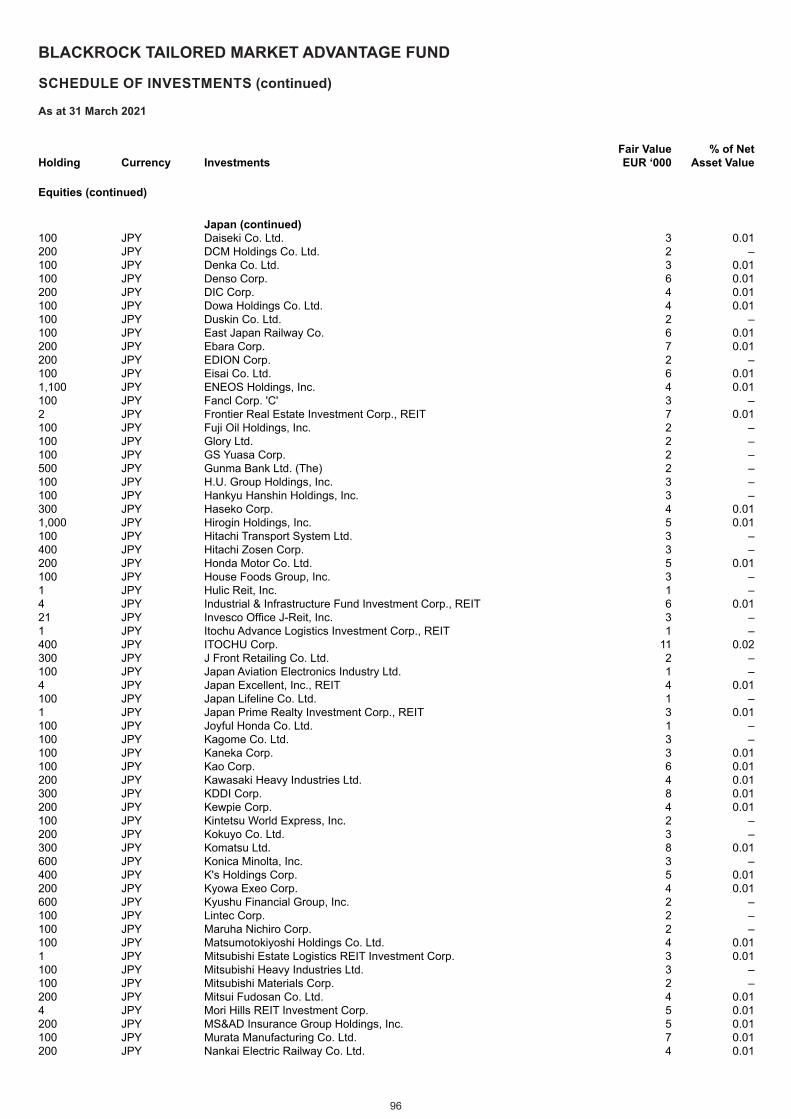
96
BLACKROCK TAILORED MARKET ADVANTAGE FUND
SCHEDULE OF INVESTMENTS (continued)
As at 31 March 2021
Holding Currency InvestmentsFair Value EUR ‘000
% of Net Asset Value
Equities (continued)
Japan (continued) 100 JPY Daiseki Co. Ltd. 3 0.01200 JPY DCM Holdings Co. Ltd. 2 –100 JPY Denka Co. Ltd. 3 0.01100 JPY Denso Corp. 6 0.01200 JPY DIC Corp. 4 0.01100 JPY Dowa Holdings Co. Ltd. 4 0.01100 JPY Duskin Co. Ltd. 2 –100 JPY East Japan Railway Co. 6 0.01200 JPY Ebara Corp. 7 0.01200 JPY EDION Corp. 2 –100 JPY Eisai Co. Ltd. 6 0.011,100 JPY ENEOS Holdings, Inc. 4 0.01100 JPY Fancl Corp. 'C' 3 –2 JPY Frontier Real Estate Investment Corp., REIT 7 0.01100 JPY Fuji Oil Holdings, Inc. 2 –100 JPY Glory Ltd. 2 –100 JPY GS Yuasa Corp. 2 –500 JPY Gunma Bank Ltd. (The) 2 –100 JPY H.U. Group Holdings, Inc. 3 –100 JPY Hankyu Hanshin Holdings, Inc. 3 –300 JPY Haseko Corp. 4 0.011,000 JPY Hirogin Holdings, Inc. 5 0.01100 JPY Hitachi Transport System Ltd. 3 –400 JPY Hitachi Zosen Corp. 3 –200 JPY Honda Motor Co. Ltd. 5 0.01100 JPY House Foods Group, Inc. 3 –1 JPY Hulic Reit, Inc. 1 –4 JPY Industrial & Infrastructure Fund Investment Corp., REIT 6 0.0121 JPY Invesco Office J-Reit, Inc. 3 –1 JPY Itochu Advance Logistics Investment Corp., REIT 1 –400 JPY ITOCHU Corp. 11 0.02300 JPY J Front Retailing Co. Ltd. 2 –100 JPY Japan Aviation Electronics Industry Ltd. 1 –4 JPY Japan Excellent, Inc., REIT 4 0.01100 JPY Japan Lifeline Co. Ltd. 1 –1 JPY Japan Prime Realty Investment Corp., REIT 3 0.01100 JPY Joyful Honda Co. Ltd. 1 –100 JPY Kagome Co. Ltd. 3 –100 JPY Kaneka Corp. 3 0.01100 JPY Kao Corp. 6 0.01200 JPY Kawasaki Heavy Industries Ltd. 4 0.01300 JPY KDDI Corp. 8 0.01200 JPY Kewpie Corp. 4 0.01100 JPY Kintetsu World Express, Inc. 2 –200 JPY Kokuyo Co. Ltd. 3 –300 JPY Komatsu Ltd. 8 0.01600 JPY Konica Minolta, Inc. 3 –400 JPY K's Holdings Corp. 5 0.01200 JPY Kyowa Exeo Corp. 4 0.01600 JPY Kyushu Financial Group, Inc. 2 –100 JPY Lintec Corp. 2 –100 JPY Maruha Nichiro Corp. 2 –100 JPY Matsumotokiyoshi Holdings Co. Ltd. 4 0.011 JPY Mitsubishi Estate Logistics REIT Investment Corp. 3 0.01100 JPY Mitsubishi Heavy Industries Ltd. 3 –100 JPY Mitsubishi Materials Corp. 2 –200 JPY Mitsui Fudosan Co. Ltd. 4 0.014 JPY Mori Hills REIT Investment Corp. 5 0.01200 JPY MS&AD Insurance Group Holdings, Inc. 5 0.01100 JPY Murata Manufacturing Co. Ltd. 7 0.01200 JPY Nankai Electric Railway Co. Ltd. 4 0.01
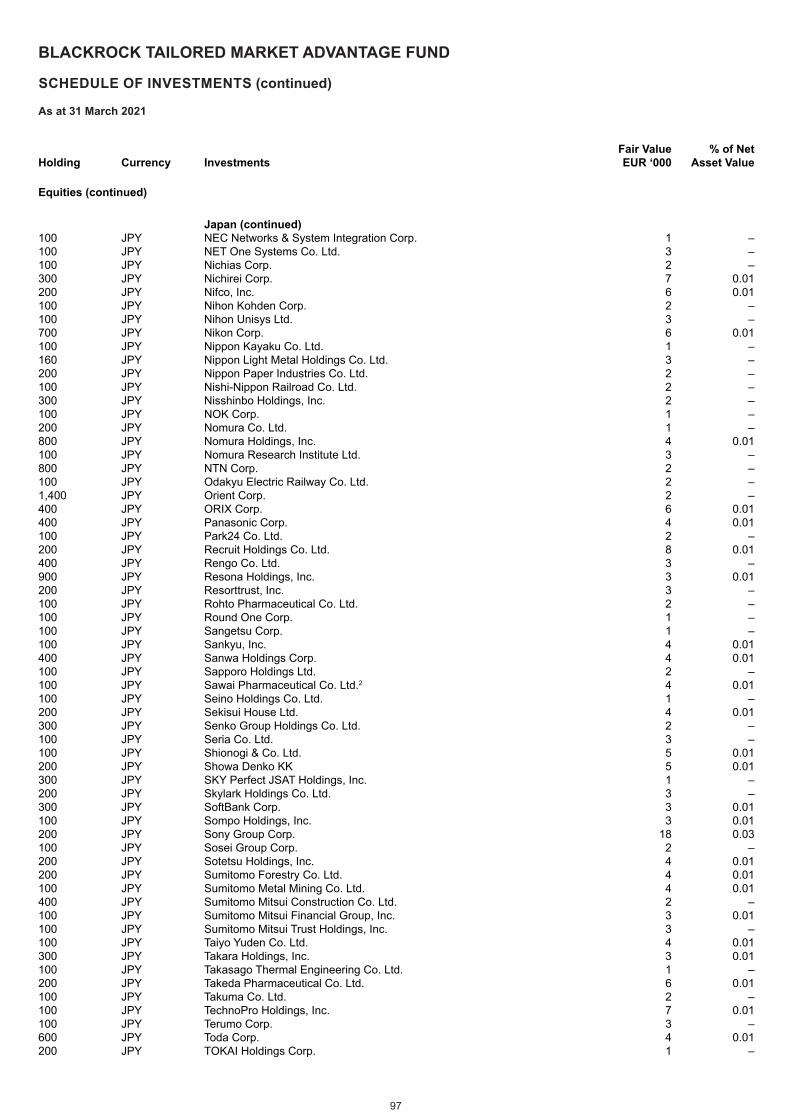
97
BLACKROCK TAILORED MARKET ADVANTAGE FUND
SCHEDULE OF INVESTMENTS (continued)
As at 31 March 2021
Holding Currency InvestmentsFair Value EUR ‘000
% of Net Asset Value
Equities (continued)
Japan (continued) 100 JPY NEC Networks & System Integration Corp. 1 –100 JPY NET One Systems Co. Ltd. 3 –100 JPY Nichias Corp. 2 –300 JPY Nichirei Corp. 7 0.01200 JPY Nifco, Inc. 6 0.01100 JPY Nihon Kohden Corp. 2 –100 JPY Nihon Unisys Ltd. 3 –700 JPY Nikon Corp. 6 0.01100 JPY Nippon Kayaku Co. Ltd. 1 –160 JPY Nippon Light Metal Holdings Co. Ltd. 3 –200 JPY Nippon Paper Industries Co. Ltd. 2 –100 JPY Nishi-Nippon Railroad Co. Ltd. 2 –300 JPY Nisshinbo Holdings, Inc. 2 –100 JPY NOK Corp. 1 –200 JPY Nomura Co. Ltd. 1 –800 JPY Nomura Holdings, Inc. 4 0.01100 JPY Nomura Research Institute Ltd. 3 –800 JPY NTN Corp. 2 –100 JPY Odakyu Electric Railway Co. Ltd. 2 –1,400 JPY Orient Corp. 2 –400 JPY ORIX Corp. 6 0.01400 JPY Panasonic Corp. 4 0.01100 JPY Park24 Co. Ltd. 2 –200 JPY Recruit Holdings Co. Ltd. 8 0.01400 JPY Rengo Co. Ltd. 3 –900 JPY Resona Holdings, Inc. 3 0.01200 JPY Resorttrust, Inc. 3 –100 JPY Rohto Pharmaceutical Co. Ltd. 2 –100 JPY Round One Corp. 1 –100 JPY Sangetsu Corp. 1 –100 JPY Sankyu, Inc. 4 0.01400 JPY Sanwa Holdings Corp. 4 0.01100 JPY Sapporo Holdings Ltd. 2 –100 JPY Sawai Pharmaceutical Co. Ltd.2 4 0.01100 JPY Seino Holdings Co. Ltd. 1 –200 JPY Sekisui House Ltd. 4 0.01300 JPY Senko Group Holdings Co. Ltd. 2 –100 JPY Seria Co. Ltd. 3 –100 JPY Shionogi & Co. Ltd. 5 0.01200 JPY Showa Denko KK 5 0.01300 JPY SKY Perfect JSAT Holdings, Inc. 1 –200 JPY Skylark Holdings Co. Ltd. 3 –300 JPY SoftBank Corp. 3 0.01100 JPY Sompo Holdings, Inc. 3 0.01200 JPY Sony Group Corp. 18 0.03100 JPY Sosei Group Corp. 2 –200 JPY Sotetsu Holdings, Inc. 4 0.01200 JPY Sumitomo Forestry Co. Ltd. 4 0.01100 JPY Sumitomo Metal Mining Co. Ltd. 4 0.01400 JPY Sumitomo Mitsui Construction Co. Ltd. 2 –100 JPY Sumitomo Mitsui Financial Group, Inc. 3 0.01100 JPY Sumitomo Mitsui Trust Holdings, Inc. 3 –100 JPY Taiyo Yuden Co. Ltd. 4 0.01300 JPY Takara Holdings, Inc. 3 0.01100 JPY Takasago Thermal Engineering Co. Ltd. 1 –200 JPY Takeda Pharmaceutical Co. Ltd. 6 0.01100 JPY Takuma Co. Ltd. 2 –100 JPY TechnoPro Holdings, Inc. 7 0.01100 JPY Terumo Corp. 3 –600 JPY Toda Corp. 4 0.01200 JPY TOKAI Holdings Corp. 1 –

98
BLACKROCK TAILORED MARKET ADVANTAGE FUND
SCHEDULE OF INVESTMENTS (continued)
As at 31 March 2021
Holding Currency InvestmentsFair Value EUR ‘000
% of Net Asset Value
Equities (continued)
Japan (continued) 100 JPY Tokio Marine Holdings, Inc. 4 0.01100 JPY Tokyo Gas Co. Ltd. 2 –400 JPY Tokyo Tatemono Co. Ltd. 5 0.01200 JPY Tokyu Corp. 2 –100 JPY Tomy Co. Ltd. 1 –600 JPY Toray Industries, Inc. 3 0.01100 JPY Toyo Ink SC Holdings Co. Ltd. 2 –100 JPY Toyo Seikan Group Holdings Ltd. 1 –200 JPY Toyobo Co. Ltd. 2 –200 JPY Toyota Motor Corp. 13 0.02200 JPY Ube Industries Ltd. 4 0.01100 JPY Ulvac, Inc. 4 0.01100 JPY United Super Markets Holdings, Inc. 1 –100 JPY Ushio, Inc. 1 –500 JPY Yamaguchi Financial Group, Inc. 3 –100 JPY Yaskawa Electric Corp. 4 0.01500 JPY Z Holdings Corp. 2 –
Total Japan 550 0.80
Jersey (30 September 2020: 0.06%)63 USD Aptiv plc 7 0.01869 GBP boohoo Group plc 4 0.011,939 GBP Centamin plc 2 –83 GBP Ferguson plc 9 0.01703 GBP IWG plc 3 –270 USD Janus Henderson Group plc 7 0.0199 USD Mimecast Ltd. 3 0.01429 GBP WPP plc 5 0.01
Total Jersey 40 0.06
Luxembourg (30 September 2020: 0.01%)65 EUR APERAM SA 2 –93 SEK Millicom International Cellular SA SDR 3 –101 USD Orion Engineered Carbons SA 2 –377 NOK Subsea 7 SA 3 0.0172 USD Trinseo SA 4 0.01
Total Luxembourg 14 0.02
Malta (30 September 2020: 0.00%)1
280 SEK Kindred Group plc SDR 4 0.01Total Malta 4 0.01
Netherlands (30 September 2020: 0.14%)50 EUR Accell Group NV 2 –71 USD AerCap Holdings NV 4 0.0171 EUR Akzo Nobel NV 7 0.0192 EUR Arcadis NV 3 –44 EUR ASML Holding NV 23 0.0384 EUR ASR Nederland NV 3 –76 EUR Basic-Fit NV 2 –49 EUR BE Semiconductor Industries NV 3 0.0194 EUR Boskalis Westminster 3 –367 EUR CNH Industrial NV 5 0.0179 USD Core Laboratories NV 2 –44 USD Elastic NV 4 0.0187 EUR Eurocommercial Properties NV, REIT CVA 2 –45 EUR Euronext NV 4 0.01
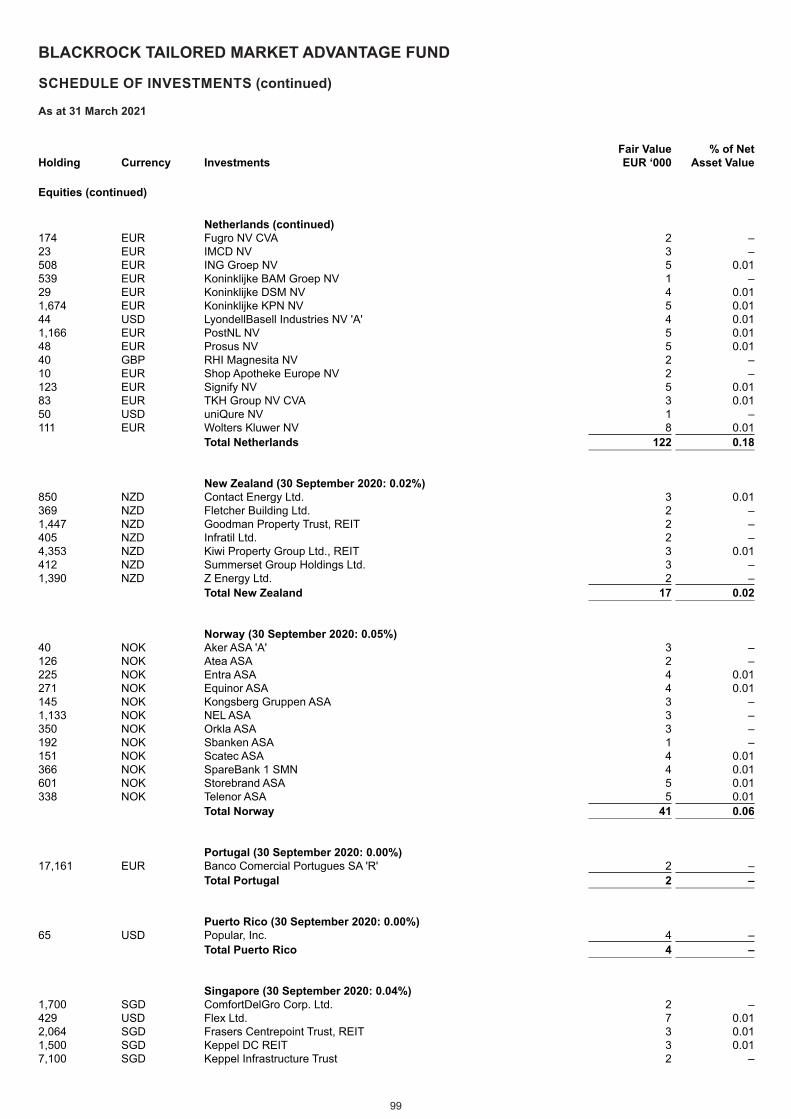
99
BLACKROCK TAILORED MARKET ADVANTAGE FUND
SCHEDULE OF INVESTMENTS (continued)
As at 31 March 2021
Holding Currency InvestmentsFair Value EUR ‘000
% of Net Asset Value
Equities (continued)
Netherlands (continued) 174 EUR Fugro NV CVA 2 –23 EUR IMCD NV 3 –508 EUR ING Groep NV 5 0.01539 EUR Koninklijke BAM Groep NV 1 –29 EUR Koninklijke DSM NV 4 0.011,674 EUR Koninklijke KPN NV 5 0.0144 USD LyondellBasell Industries NV 'A' 4 0.011,166 EUR PostNL NV 5 0.0148 EUR Prosus NV 5 0.0140 GBP RHI Magnesita NV 2 –10 EUR Shop Apotheke Europe NV 2 –123 EUR Signify NV 5 0.0183 EUR TKH Group NV CVA 3 0.0150 USD uniQure NV 1 –111 EUR Wolters Kluwer NV 8 0.01
Total Netherlands 122 0.18
New Zealand (30 September 2020: 0.02%)850 NZD Contact Energy Ltd. 3 0.01369 NZD Fletcher Building Ltd. 2 –1,447 NZD Goodman Property Trust, REIT 2 –405 NZD Infratil Ltd. 2 –4,353 NZD Kiwi Property Group Ltd., REIT 3 0.01412 NZD Summerset Group Holdings Ltd. 3 –1,390 NZD Z Energy Ltd. 2 –
Total New Zealand 17 0.02
Norway (30 September 2020: 0.05%)40 NOK Aker ASA 'A' 3 –126 NOK Atea ASA 2 –225 NOK Entra ASA 4 0.01271 NOK Equinor ASA 4 0.01145 NOK Kongsberg Gruppen ASA 3 –1,133 NOK NEL ASA 3 –350 NOK Orkla ASA 3 –192 NOK Sbanken ASA 1 –151 NOK Scatec ASA 4 0.01366 NOK SpareBank 1 SMN 4 0.01601 NOK Storebrand ASA 5 0.01338 NOK Telenor ASA 5 0.01
Total Norway 41 0.06
Portugal (30 September 2020: 0.00%)17,161 EUR Banco Comercial Portugues SA 'R' 2 –
Total Portugal 2 –
Puerto Rico (30 September 2020: 0.00%)65 USD Popular, Inc. 4 –
Total Puerto Rico 4 –
Singapore (30 September 2020: 0.04%)1,700 SGD ComfortDelGro Corp. Ltd. 2 –429 USD Flex Ltd. 7 0.012,064 SGD Frasers Centrepoint Trust, REIT 3 0.011,500 SGD Keppel DC REIT 3 0.017,100 SGD Keppel Infrastructure Trust 2 –
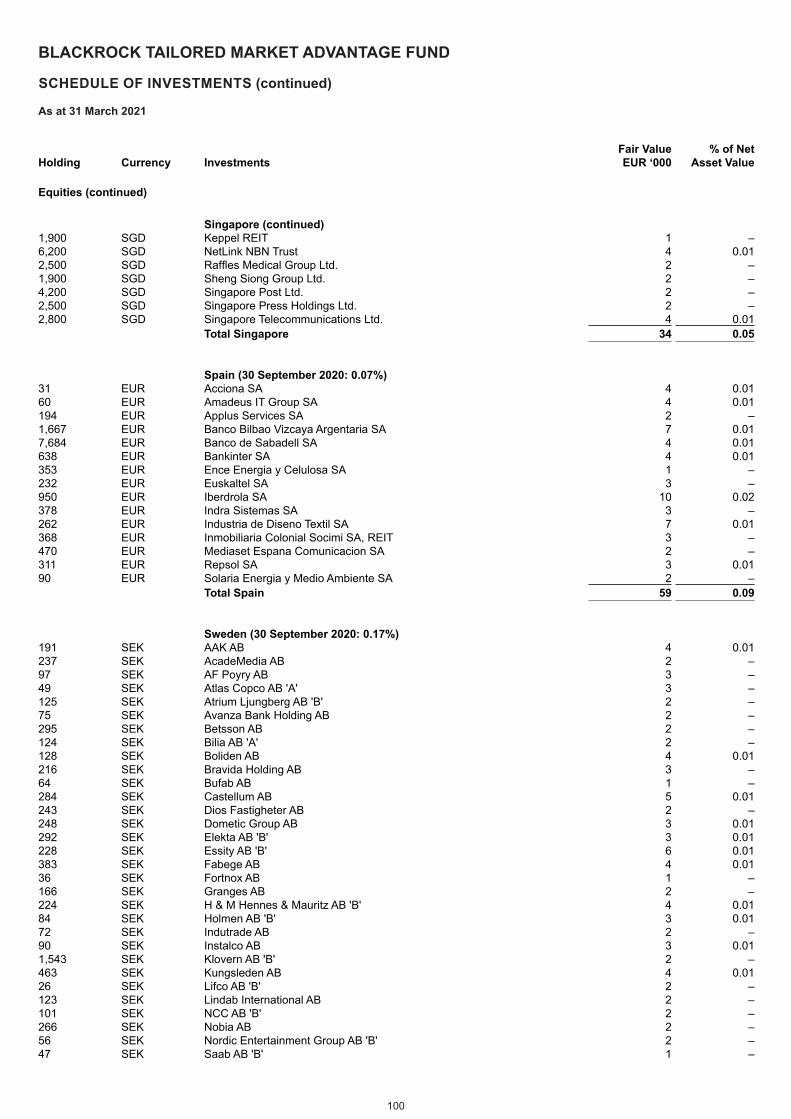
100
BLACKROCK TAILORED MARKET ADVANTAGE FUND
SCHEDULE OF INVESTMENTS (continued)
As at 31 March 2021
Holding Currency InvestmentsFair Value EUR ‘000
% of Net Asset Value
Equities (continued)
Singapore (continued) 1,900 SGD Keppel REIT 1 –6,200 SGD NetLink NBN Trust 4 0.012,500 SGD Raffles Medical Group Ltd. 2 –1,900 SGD Sheng Siong Group Ltd. 2 –4,200 SGD Singapore Post Ltd. 2 –2,500 SGD Singapore Press Holdings Ltd. 2 –2,800 SGD Singapore Telecommunications Ltd. 4 0.01
Total Singapore 34 0.05
Spain (30 September 2020: 0.07%)31 EUR Acciona SA 4 0.0160 EUR Amadeus IT Group SA 4 0.01194 EUR Applus Services SA 2 –1,667 EUR Banco Bilbao Vizcaya Argentaria SA 7 0.017,684 EUR Banco de Sabadell SA 4 0.01638 EUR Bankinter SA 4 0.01353 EUR Ence Energia y Celulosa SA 1 –232 EUR Euskaltel SA 3 –950 EUR Iberdrola SA 10 0.02378 EUR Indra Sistemas SA 3 –262 EUR Industria de Diseno Textil SA 7 0.01368 EUR Inmobiliaria Colonial Socimi SA, REIT 3 –470 EUR Mediaset Espana Comunicacion SA 2 –311 EUR Repsol SA 3 0.0190 EUR Solaria Energia y Medio Ambiente SA 2 –
Total Spain 59 0.09
Sweden (30 September 2020: 0.17%)191 SEK AAK AB 4 0.01237 SEK AcadeMedia AB 2 –97 SEK AF Poyry AB 3 –49 SEK Atlas Copco AB 'A' 3 –125 SEK Atrium Ljungberg AB 'B' 2 –75 SEK Avanza Bank Holding AB 2 –295 SEK Betsson AB 2 –124 SEK Bilia AB 'A' 2 –128 SEK Boliden AB 4 0.01216 SEK Bravida Holding AB 3 –64 SEK Bufab AB 1 –284 SEK Castellum AB 5 0.01243 SEK Dios Fastigheter AB 2 –248 SEK Dometic Group AB 3 0.01292 SEK Elekta AB 'B' 3 0.01228 SEK Essity AB 'B' 6 0.01383 SEK Fabege AB 4 0.0136 SEK Fortnox AB 1 –166 SEK Granges AB 2 –224 SEK H & M Hennes & Mauritz AB 'B' 4 0.0184 SEK Holmen AB 'B' 3 0.0172 SEK Indutrade AB 2 –90 SEK Instalco AB 3 0.011,543 SEK Klovern AB 'B' 2 –463 SEK Kungsleden AB 4 0.0126 SEK Lifco AB 'B' 2 –123 SEK Lindab International AB 2 –101 SEK NCC AB 'B' 2 –266 SEK Nobia AB 2 –56 SEK Nordic Entertainment Group AB 'B' 2 –47 SEK Saab AB 'B' 1 –
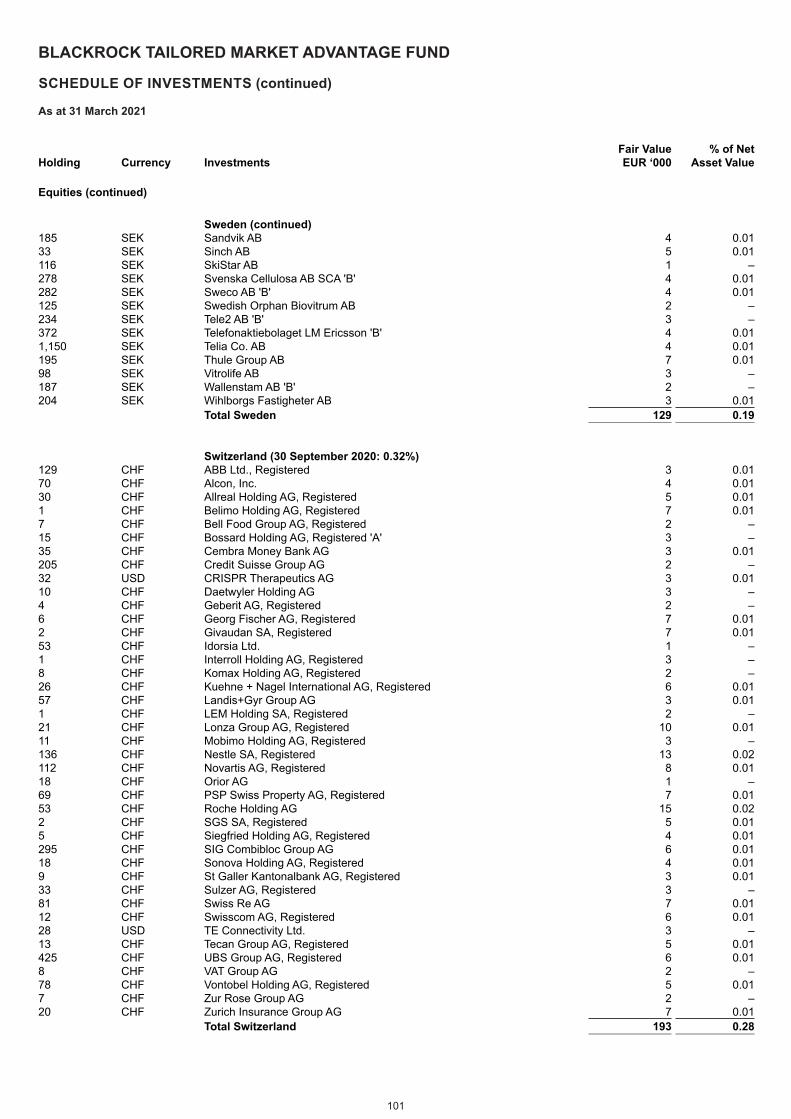
101
BLACKROCK TAILORED MARKET ADVANTAGE FUND
SCHEDULE OF INVESTMENTS (continued)
As at 31 March 2021
Holding Currency InvestmentsFair Value EUR ‘000
% of Net Asset Value
Equities (continued)
Sweden (continued) 185 SEK Sandvik AB 4 0.0133 SEK Sinch AB 5 0.01116 SEK SkiStar AB 1 –278 SEK Svenska Cellulosa AB SCA 'B' 4 0.01282 SEK Sweco AB 'B' 4 0.01125 SEK Swedish Orphan Biovitrum AB 2 –234 SEK Tele2 AB 'B' 3 –372 SEK Telefonaktiebolaget LM Ericsson 'B' 4 0.011,150 SEK Telia Co. AB 4 0.01195 SEK Thule Group AB 7 0.0198 SEK Vitrolife AB 3 –187 SEK Wallenstam AB 'B' 2 –204 SEK Wihlborgs Fastigheter AB 3 0.01
Total Sweden 129 0.19
Switzerland (30 September 2020: 0.32%)129 CHF ABB Ltd., Registered 3 0.0170 CHF Alcon, Inc. 4 0.0130 CHF Allreal Holding AG, Registered 5 0.011 CHF Belimo Holding AG, Registered 7 0.017 CHF Bell Food Group AG, Registered 2 –15 CHF Bossard Holding AG, Registered 'A' 3 –35 CHF Cembra Money Bank AG 3 0.01205 CHF Credit Suisse Group AG 2 –32 USD CRISPR Therapeutics AG 3 0.0110 CHF Daetwyler Holding AG 3 –4 CHF Geberit AG, Registered 2 –6 CHF Georg Fischer AG, Registered 7 0.012 CHF Givaudan SA, Registered 7 0.0153 CHF Idorsia Ltd. 1 –1 CHF Interroll Holding AG, Registered 3 –8 CHF Komax Holding AG, Registered 2 –26 CHF Kuehne + Nagel International AG, Registered 6 0.0157 CHF Landis+Gyr Group AG 3 0.011 CHF LEM Holding SA, Registered 2 –21 CHF Lonza Group AG, Registered 10 0.0111 CHF Mobimo Holding AG, Registered 3 –136 CHF Nestle SA, Registered 13 0.02112 CHF Novartis AG, Registered 8 0.0118 CHF Orior AG 1 –69 CHF PSP Swiss Property AG, Registered 7 0.0153 CHF Roche Holding AG 15 0.022 CHF SGS SA, Registered 5 0.015 CHF Siegfried Holding AG, Registered 4 0.01295 CHF SIG Combibloc Group AG 6 0.0118 CHF Sonova Holding AG, Registered 4 0.019 CHF St Galler Kantonalbank AG, Registered 3 0.0133 CHF Sulzer AG, Registered 3 –81 CHF Swiss Re AG 7 0.0112 CHF Swisscom AG, Registered 6 0.0128 USD TE Connectivity Ltd. 3 –13 CHF Tecan Group AG, Registered 5 0.01425 CHF UBS Group AG, Registered 6 0.018 CHF VAT Group AG 2 –78 CHF Vontobel Holding AG, Registered 5 0.017 CHF Zur Rose Group AG 2 –20 CHF Zurich Insurance Group AG 7 0.01
Total Switzerland 193 0.28
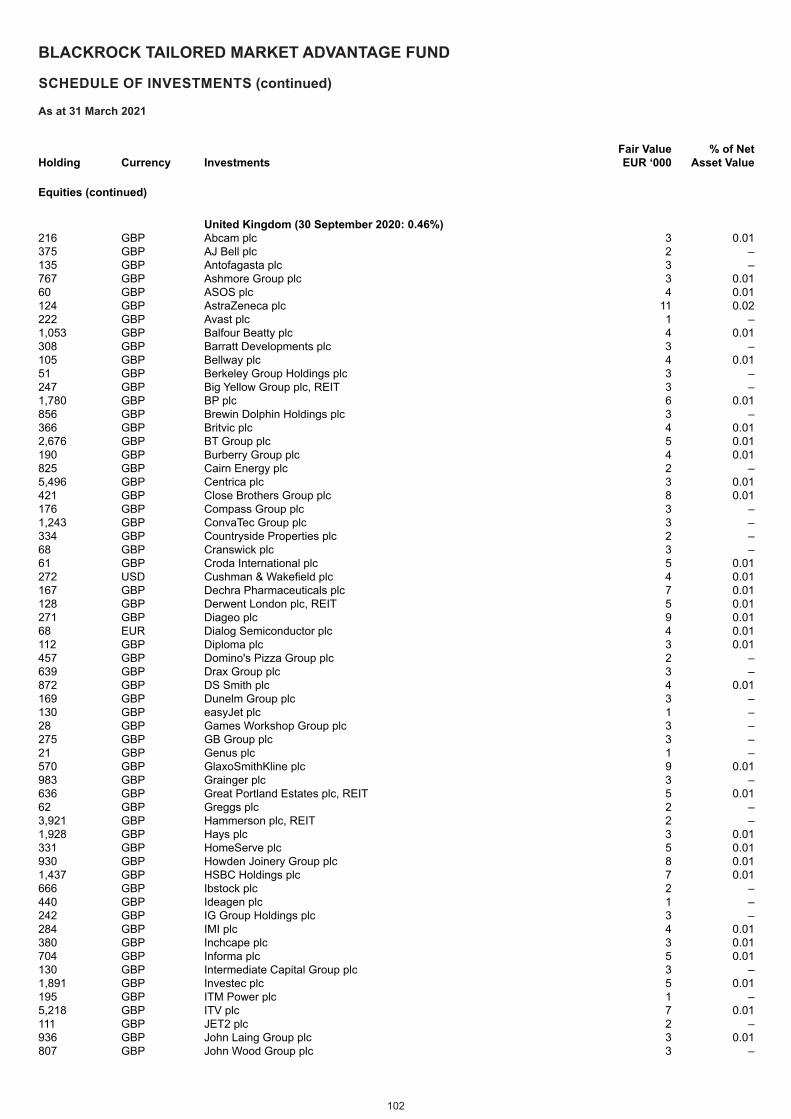
102
BLACKROCK TAILORED MARKET ADVANTAGE FUND
SCHEDULE OF INVESTMENTS (continued)
As at 31 March 2021
Holding Currency InvestmentsFair Value EUR ‘000
% of Net Asset Value
Equities (continued)
United Kingdom (30 September 2020: 0.46%)216 GBP Abcam plc 3 0.01375 GBP AJ Bell plc 2 –135 GBP Antofagasta plc 3 –767 GBP Ashmore Group plc 3 0.0160 GBP ASOS plc 4 0.01124 GBP AstraZeneca plc 11 0.02222 GBP Avast plc 1 –1,053 GBP Balfour Beatty plc 4 0.01308 GBP Barratt Developments plc 3 –105 GBP Bellway plc 4 0.0151 GBP Berkeley Group Holdings plc 3 –247 GBP Big Yellow Group plc, REIT 3 –1,780 GBP BP plc 6 0.01856 GBP Brewin Dolphin Holdings plc 3 –366 GBP Britvic plc 4 0.012,676 GBP BT Group plc 5 0.01190 GBP Burberry Group plc 4 0.01825 GBP Cairn Energy plc 2 –5,496 GBP Centrica plc 3 0.01421 GBP Close Brothers Group plc 8 0.01176 GBP Compass Group plc 3 –1,243 GBP ConvaTec Group plc 3 –334 GBP Countryside Properties plc 2 –68 GBP Cranswick plc 3 –61 GBP Croda International plc 5 0.01272 USD Cushman & Wakefield plc 4 0.01167 GBP Dechra Pharmaceuticals plc 7 0.01128 GBP Derwent London plc, REIT 5 0.01271 GBP Diageo plc 9 0.0168 EUR Dialog Semiconductor plc 4 0.01112 GBP Diploma plc 3 0.01457 GBP Domino's Pizza Group plc 2 –639 GBP Drax Group plc 3 –872 GBP DS Smith plc 4 0.01169 GBP Dunelm Group plc 3 –130 GBP easyJet plc 1 –28 GBP Games Workshop Group plc 3 –275 GBP GB Group plc 3 –21 GBP Genus plc 1 –570 GBP GlaxoSmithKline plc 9 0.01983 GBP Grainger plc 3 –636 GBP Great Portland Estates plc, REIT 5 0.0162 GBP Greggs plc 2 –3,921 GBP Hammerson plc, REIT 2 –1,928 GBP Hays plc 3 0.01331 GBP HomeServe plc 5 0.01930 GBP Howden Joinery Group plc 8 0.011,437 GBP HSBC Holdings plc 7 0.01666 GBP Ibstock plc 2 –440 GBP Ideagen plc 1 –242 GBP IG Group Holdings plc 3 –284 GBP IMI plc 4 0.01380 GBP Inchcape plc 3 0.01704 GBP Informa plc 5 0.01130 GBP Intermediate Capital Group plc 3 –1,891 GBP Investec plc 5 0.01195 GBP ITM Power plc 1 –5,218 GBP ITV plc 7 0.01111 GBP JET2 plc 2 –936 GBP John Laing Group plc 3 0.01807 GBP John Wood Group plc 3 –
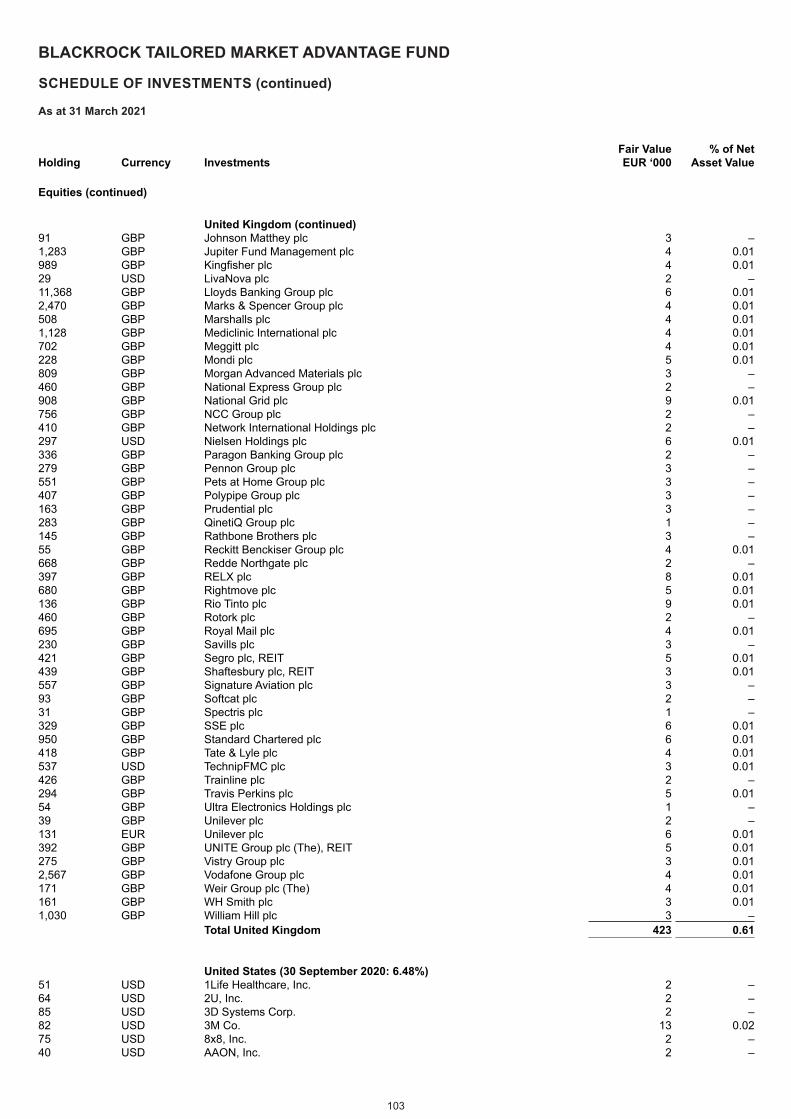
103
BLACKROCK TAILORED MARKET ADVANTAGE FUND
SCHEDULE OF INVESTMENTS (continued)
As at 31 March 2021
Holding Currency InvestmentsFair Value EUR ‘000
% of Net Asset Value
Equities (continued)
United Kingdom (continued) 91 GBP Johnson Matthey plc 3 –1,283 GBP Jupiter Fund Management plc 4 0.01989 GBP Kingfisher plc 4 0.0129 USD LivaNova plc 2 –11,368 GBP Lloyds Banking Group plc 6 0.012,470 GBP Marks & Spencer Group plc 4 0.01508 GBP Marshalls plc 4 0.011,128 GBP Mediclinic International plc 4 0.01702 GBP Meggitt plc 4 0.01228 GBP Mondi plc 5 0.01809 GBP Morgan Advanced Materials plc 3 –460 GBP National Express Group plc 2 –908 GBP National Grid plc 9 0.01756 GBP NCC Group plc 2 –410 GBP Network International Holdings plc 2 –297 USD Nielsen Holdings plc 6 0.01336 GBP Paragon Banking Group plc 2 –279 GBP Pennon Group plc 3 –551 GBP Pets at Home Group plc 3 –407 GBP Polypipe Group plc 3 –163 GBP Prudential plc 3 –283 GBP QinetiQ Group plc 1 –145 GBP Rathbone Brothers plc 3 –55 GBP Reckitt Benckiser Group plc 4 0.01668 GBP Redde Northgate plc 2 –397 GBP RELX plc 8 0.01680 GBP Rightmove plc 5 0.01136 GBP Rio Tinto plc 9 0.01460 GBP Rotork plc 2 –695 GBP Royal Mail plc 4 0.01230 GBP Savills plc 3 –421 GBP Segro plc, REIT 5 0.01439 GBP Shaftesbury plc, REIT 3 0.01557 GBP Signature Aviation plc 3 –93 GBP Softcat plc 2 –31 GBP Spectris plc 1 –329 GBP SSE plc 6 0.01950 GBP Standard Chartered plc 6 0.01418 GBP Tate & Lyle plc 4 0.01537 USD TechnipFMC plc 3 0.01426 GBP Trainline plc 2 –294 GBP Travis Perkins plc 5 0.0154 GBP Ultra Electronics Holdings plc 1 –39 GBP Unilever plc 2 –131 EUR Unilever plc 6 0.01392 GBP UNITE Group plc (The), REIT 5 0.01275 GBP Vistry Group plc 3 0.012,567 GBP Vodafone Group plc 4 0.01171 GBP Weir Group plc (The) 4 0.01161 GBP WH Smith plc 3 0.011,030 GBP William Hill plc 3 –
Total United Kingdom 423 0.61
United States (30 September 2020: 6.48%)51 USD 1Life Healthcare, Inc. 2 –64 USD 2U, Inc. 2 –85 USD 3D Systems Corp. 2 –82 USD 3M Co. 13 0.0275 USD 8x8, Inc. 2 –40 USD AAON, Inc. 2 –
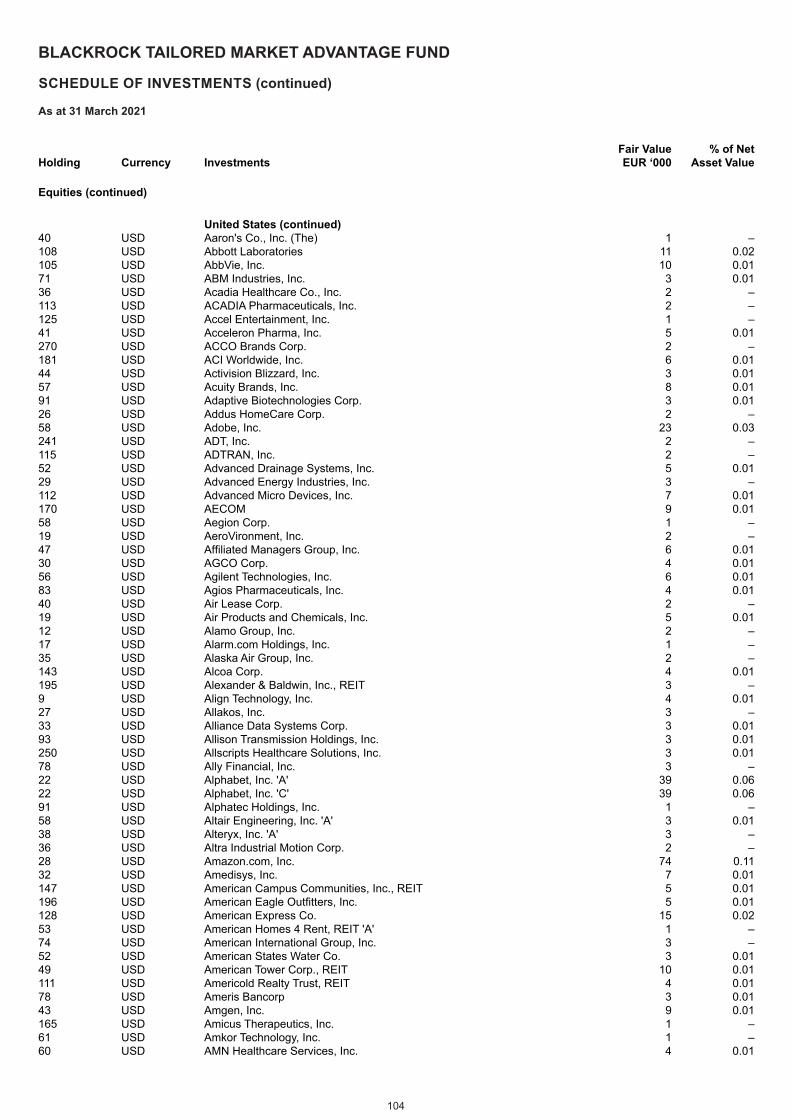
104
BLACKROCK TAILORED MARKET ADVANTAGE FUND
SCHEDULE OF INVESTMENTS (continued)
As at 31 March 2021
Holding Currency InvestmentsFair Value EUR ‘000
% of Net Asset Value
Equities (continued)
United States (continued) 40 USD Aaron's Co., Inc. (The) 1 –108 USD Abbott Laboratories 11 0.02105 USD AbbVie, Inc. 10 0.0171 USD ABM Industries, Inc. 3 0.0136 USD Acadia Healthcare Co., Inc. 2 –113 USD ACADIA Pharmaceuticals, Inc. 2 –125 USD Accel Entertainment, Inc. 1 –41 USD Acceleron Pharma, Inc. 5 0.01270 USD ACCO Brands Corp. 2 –181 USD ACI Worldwide, Inc. 6 0.0144 USD Activision Blizzard, Inc. 3 0.0157 USD Acuity Brands, Inc. 8 0.0191 USD Adaptive Biotechnologies Corp. 3 0.0126 USD Addus HomeCare Corp. 2 –58 USD Adobe, Inc. 23 0.03241 USD ADT, Inc. 2 –115 USD ADTRAN, Inc. 2 –52 USD Advanced Drainage Systems, Inc. 5 0.0129 USD Advanced Energy Industries, Inc. 3 –112 USD Advanced Micro Devices, Inc. 7 0.01170 USD AECOM 9 0.0158 USD Aegion Corp. 1 –19 USD AeroVironment, Inc. 2 –47 USD Affiliated Managers Group, Inc. 6 0.0130 USD AGCO Corp. 4 0.0156 USD Agilent Technologies, Inc. 6 0.0183 USD Agios Pharmaceuticals, Inc. 4 0.0140 USD Air Lease Corp. 2 –19 USD Air Products and Chemicals, Inc. 5 0.0112 USD Alamo Group, Inc. 2 –17 USD Alarm.com Holdings, Inc. 1 –35 USD Alaska Air Group, Inc. 2 –143 USD Alcoa Corp. 4 0.01195 USD Alexander & Baldwin, Inc., REIT 3 –9 USD Align Technology, Inc. 4 0.0127 USD Allakos, Inc. 3 –33 USD Alliance Data Systems Corp. 3 0.0193 USD Allison Transmission Holdings, Inc. 3 0.01250 USD Allscripts Healthcare Solutions, Inc. 3 0.0178 USD Ally Financial, Inc. 3 –22 USD Alphabet, Inc. 'A' 39 0.0622 USD Alphabet, Inc. 'C' 39 0.0691 USD Alphatec Holdings, Inc. 1 –58 USD Altair Engineering, Inc. 'A' 3 0.0138 USD Alteryx, Inc. 'A' 3 –36 USD Altra Industrial Motion Corp. 2 –28 USD Amazon.com, Inc. 74 0.1132 USD Amedisys, Inc. 7 0.01147 USD American Campus Communities, Inc., REIT 5 0.01196 USD American Eagle Outfitters, Inc. 5 0.01128 USD American Express Co. 15 0.0253 USD American Homes 4 Rent, REIT 'A' 1 –74 USD American International Group, Inc. 3 –52 USD American States Water Co. 3 0.0149 USD American Tower Corp., REIT 10 0.01111 USD Americold Realty Trust, REIT 4 0.0178 USD Ameris Bancorp 3 0.0143 USD Amgen, Inc. 9 0.01165 USD Amicus Therapeutics, Inc. 1 –61 USD Amkor Technology, Inc. 1 –60 USD AMN Healthcare Services, Inc. 4 0.01
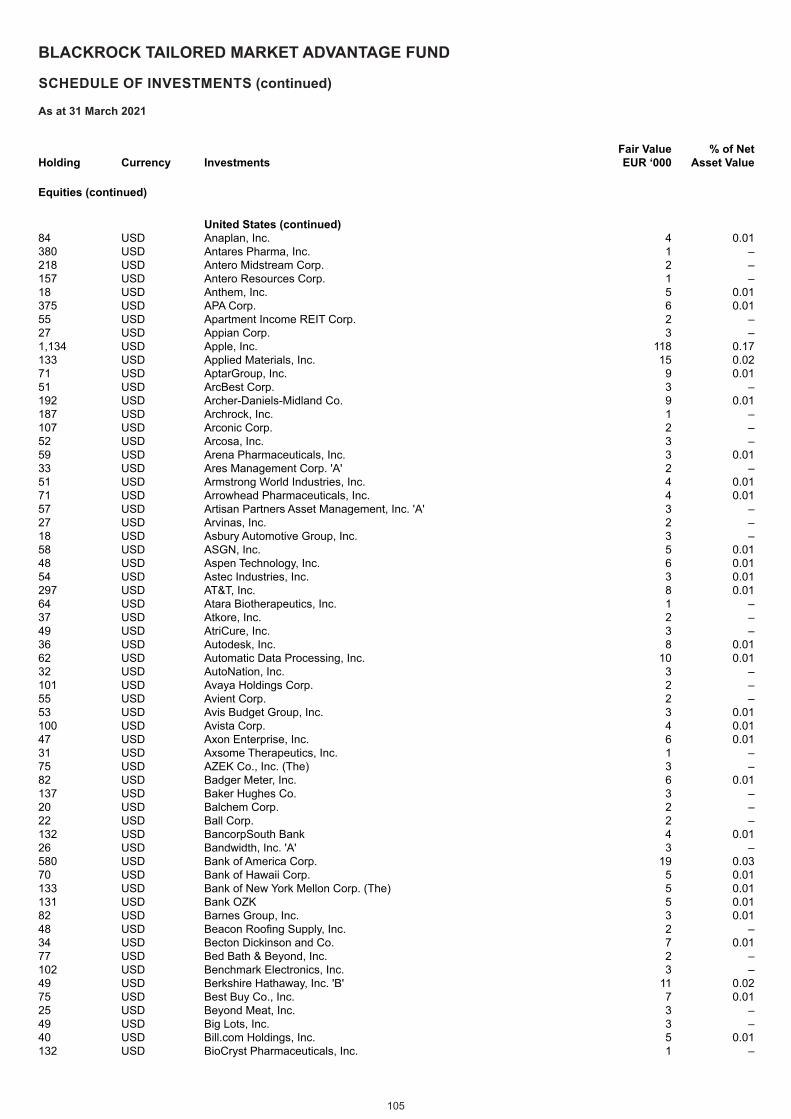
105
BLACKROCK TAILORED MARKET ADVANTAGE FUND
SCHEDULE OF INVESTMENTS (continued)
As at 31 March 2021
Holding Currency InvestmentsFair Value EUR ‘000
% of Net Asset Value
Equities (continued)
United States (continued) 84 USD Anaplan, Inc. 4 0.01380 USD Antares Pharma, Inc. 1 –218 USD Antero Midstream Corp. 2 –157 USD Antero Resources Corp. 1 –18 USD Anthem, Inc. 5 0.01375 USD APA Corp. 6 0.0155 USD Apartment Income REIT Corp. 2 –27 USD Appian Corp. 3 –1,134 USD Apple, Inc. 118 0.17133 USD Applied Materials, Inc. 15 0.0271 USD AptarGroup, Inc. 9 0.0151 USD ArcBest Corp. 3 –192 USD Archer-Daniels-Midland Co. 9 0.01187 USD Archrock, Inc. 1 –107 USD Arconic Corp. 2 –52 USD Arcosa, Inc. 3 –59 USD Arena Pharmaceuticals, Inc. 3 0.0133 USD Ares Management Corp. 'A' 2 –51 USD Armstrong World Industries, Inc. 4 0.0171 USD Arrowhead Pharmaceuticals, Inc. 4 0.0157 USD Artisan Partners Asset Management, Inc. 'A' 3 –27 USD Arvinas, Inc. 2 –18 USD Asbury Automotive Group, Inc. 3 –58 USD ASGN, Inc. 5 0.0148 USD Aspen Technology, Inc. 6 0.0154 USD Astec Industries, Inc. 3 0.01297 USD AT&T, Inc. 8 0.0164 USD Atara Biotherapeutics, Inc. 1 –37 USD Atkore, Inc. 2 –49 USD AtriCure, Inc. 3 –36 USD Autodesk, Inc. 8 0.0162 USD Automatic Data Processing, Inc. 10 0.0132 USD AutoNation, Inc. 3 –101 USD Avaya Holdings Corp. 2 –55 USD Avient Corp. 2 –53 USD Avis Budget Group, Inc. 3 0.01100 USD Avista Corp. 4 0.0147 USD Axon Enterprise, Inc. 6 0.0131 USD Axsome Therapeutics, Inc. 1 –75 USD AZEK Co., Inc. (The) 3 –82 USD Badger Meter, Inc. 6 0.01137 USD Baker Hughes Co. 3 –20 USD Balchem Corp. 2 –22 USD Ball Corp. 2 –132 USD BancorpSouth Bank 4 0.0126 USD Bandwidth, Inc. 'A' 3 –580 USD Bank of America Corp. 19 0.0370 USD Bank of Hawaii Corp. 5 0.01133 USD Bank of New York Mellon Corp. (The) 5 0.01131 USD Bank OZK 5 0.0182 USD Barnes Group, Inc. 3 0.0148 USD Beacon Roofing Supply, Inc. 2 –34 USD Becton Dickinson and Co. 7 0.0177 USD Bed Bath & Beyond, Inc. 2 –102 USD Benchmark Electronics, Inc. 3 –49 USD Berkshire Hathaway, Inc. 'B' 11 0.0275 USD Best Buy Co., Inc. 7 0.0125 USD Beyond Meat, Inc. 3 –49 USD Big Lots, Inc. 3 –40 USD Bill.com Holdings, Inc. 5 0.01132 USD BioCryst Pharmaceuticals, Inc. 1 –
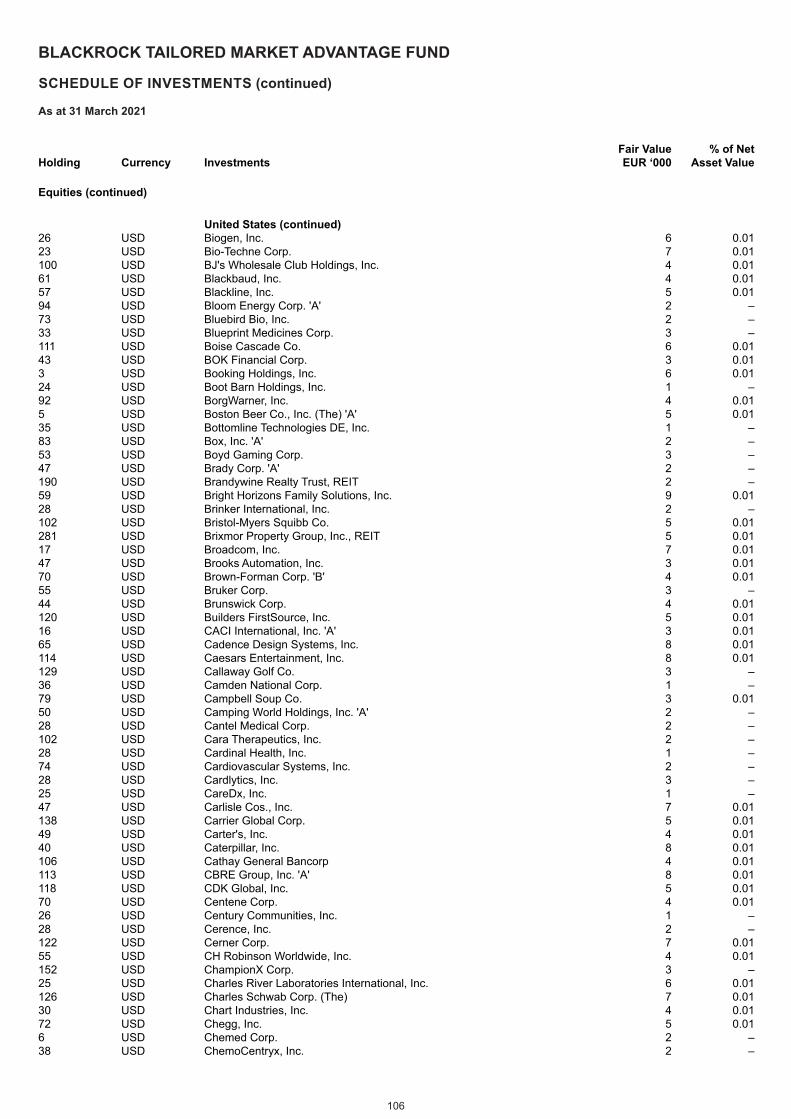
106
BLACKROCK TAILORED MARKET ADVANTAGE FUND
SCHEDULE OF INVESTMENTS (continued)
As at 31 March 2021
Holding Currency InvestmentsFair Value EUR ‘000
% of Net Asset Value
Equities (continued)
United States (continued) 26 USD Biogen, Inc. 6 0.0123 USD Bio-Techne Corp. 7 0.01100 USD BJ's Wholesale Club Holdings, Inc. 4 0.0161 USD Blackbaud, Inc. 4 0.0157 USD Blackline, Inc. 5 0.0194 USD Bloom Energy Corp. 'A' 2 –73 USD Bluebird Bio, Inc. 2 –33 USD Blueprint Medicines Corp. 3 –111 USD Boise Cascade Co. 6 0.0143 USD BOK Financial Corp. 3 0.013 USD Booking Holdings, Inc. 6 0.0124 USD Boot Barn Holdings, Inc. 1 –92 USD BorgWarner, Inc. 4 0.015 USD Boston Beer Co., Inc. (The) 'A' 5 0.0135 USD Bottomline Technologies DE, Inc. 1 –83 USD Box, Inc. 'A' 2 –53 USD Boyd Gaming Corp. 3 –47 USD Brady Corp. 'A' 2 –190 USD Brandywine Realty Trust, REIT 2 –59 USD Bright Horizons Family Solutions, Inc. 9 0.0128 USD Brinker International, Inc. 2 –102 USD Bristol-Myers Squibb Co. 5 0.01281 USD Brixmor Property Group, Inc., REIT 5 0.0117 USD Broadcom, Inc. 7 0.0147 USD Brooks Automation, Inc. 3 0.0170 USD Brown-Forman Corp. 'B' 4 0.0155 USD Bruker Corp. 3 –44 USD Brunswick Corp. 4 0.01120 USD Builders FirstSource, Inc. 5 0.0116 USD CACI International, Inc. 'A' 3 0.0165 USD Cadence Design Systems, Inc. 8 0.01114 USD Caesars Entertainment, Inc. 8 0.01129 USD Callaway Golf Co. 3 –36 USD Camden National Corp. 1 –79 USD Campbell Soup Co. 3 0.0150 USD Camping World Holdings, Inc. 'A' 2 –28 USD Cantel Medical Corp. 2 –102 USD Cara Therapeutics, Inc. 2 –28 USD Cardinal Health, Inc. 1 –74 USD Cardiovascular Systems, Inc. 2 –28 USD Cardlytics, Inc. 3 –25 USD CareDx, Inc. 1 –47 USD Carlisle Cos., Inc. 7 0.01138 USD Carrier Global Corp. 5 0.0149 USD Carter's, Inc. 4 0.0140 USD Caterpillar, Inc. 8 0.01106 USD Cathay General Bancorp 4 0.01113 USD CBRE Group, Inc. 'A' 8 0.01118 USD CDK Global, Inc. 5 0.0170 USD Centene Corp. 4 0.0126 USD Century Communities, Inc. 1 –28 USD Cerence, Inc. 2 –122 USD Cerner Corp. 7 0.0155 USD CH Robinson Worldwide, Inc. 4 0.01152 USD ChampionX Corp. 3 –25 USD Charles River Laboratories International, Inc. 6 0.01126 USD Charles Schwab Corp. (The) 7 0.0130 USD Chart Industries, Inc. 4 0.0172 USD Chegg, Inc. 5 0.016 USD Chemed Corp. 2 –38 USD ChemoCentryx, Inc. 2 –
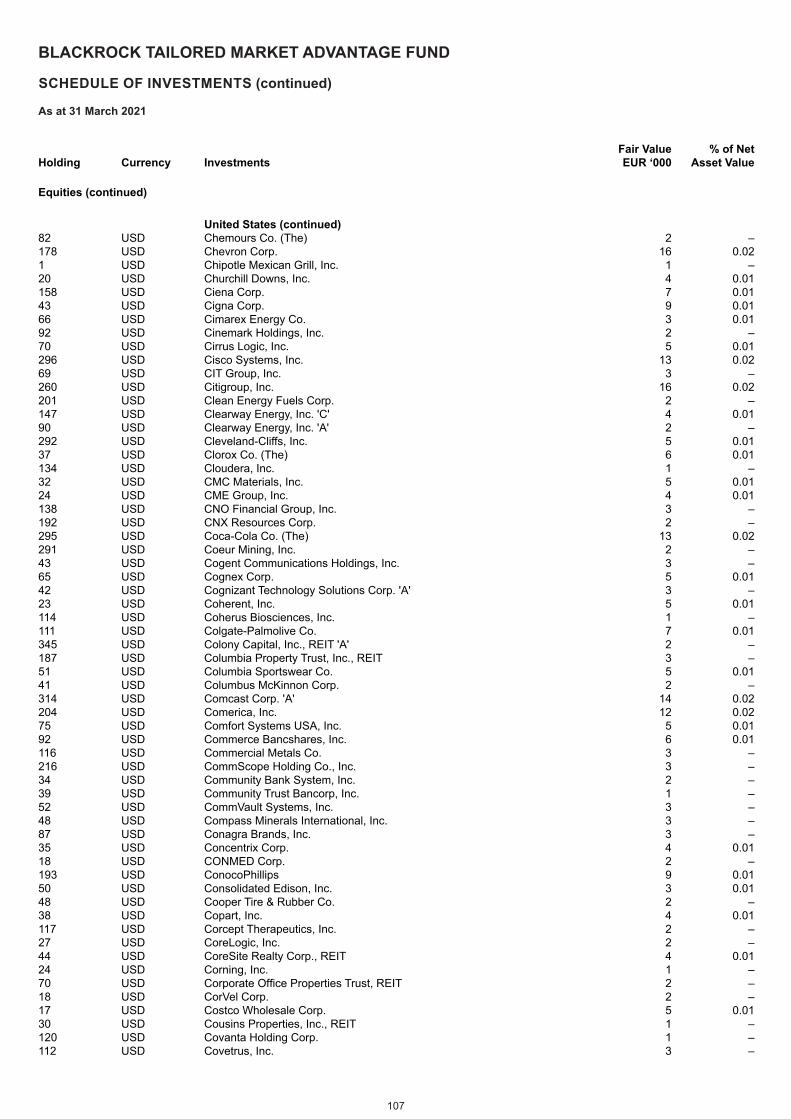
107
BLACKROCK TAILORED MARKET ADVANTAGE FUND
SCHEDULE OF INVESTMENTS (continued)
As at 31 March 2021
Holding Currency InvestmentsFair Value EUR ‘000
% of Net Asset Value
Equities (continued)
United States (continued) 82 USD Chemours Co. (The) 2 –178 USD Chevron Corp. 16 0.021 USD Chipotle Mexican Grill, Inc. 1 –20 USD Churchill Downs, Inc. 4 0.01158 USD Ciena Corp. 7 0.0143 USD Cigna Corp. 9 0.0166 USD Cimarex Energy Co. 3 0.0192 USD Cinemark Holdings, Inc. 2 –70 USD Cirrus Logic, Inc. 5 0.01296 USD Cisco Systems, Inc. 13 0.0269 USD CIT Group, Inc. 3 –260 USD Citigroup, Inc. 16 0.02201 USD Clean Energy Fuels Corp. 2 –147 USD Clearway Energy, Inc. 'C' 4 0.0190 USD Clearway Energy, Inc. 'A' 2 –292 USD Cleveland-Cliffs, Inc. 5 0.0137 USD Clorox Co. (The) 6 0.01134 USD Cloudera, Inc. 1 –32 USD CMC Materials, Inc. 5 0.0124 USD CME Group, Inc. 4 0.01138 USD CNO Financial Group, Inc. 3 –192 USD CNX Resources Corp. 2 –295 USD Coca-Cola Co. (The) 13 0.02291 USD Coeur Mining, Inc. 2 –43 USD Cogent Communications Holdings, Inc. 3 –65 USD Cognex Corp. 5 0.0142 USD Cognizant Technology Solutions Corp. 'A' 3 –23 USD Coherent, Inc. 5 0.01114 USD Coherus Biosciences, Inc. 1 –111 USD Colgate-Palmolive Co. 7 0.01345 USD Colony Capital, Inc., REIT 'A' 2 –187 USD Columbia Property Trust, Inc., REIT 3 –51 USD Columbia Sportswear Co. 5 0.0141 USD Columbus McKinnon Corp. 2 –314 USD Comcast Corp. 'A' 14 0.02204 USD Comerica, Inc. 12 0.0275 USD Comfort Systems USA, Inc. 5 0.0192 USD Commerce Bancshares, Inc. 6 0.01116 USD Commercial Metals Co. 3 –216 USD CommScope Holding Co., Inc. 3 –34 USD Community Bank System, Inc. 2 –39 USD Community Trust Bancorp, Inc. 1 –52 USD CommVault Systems, Inc. 3 –48 USD Compass Minerals International, Inc. 3 –87 USD Conagra Brands, Inc. 3 –35 USD Concentrix Corp. 4 0.0118 USD CONMED Corp. 2 –193 USD ConocoPhillips 9 0.0150 USD Consolidated Edison, Inc. 3 0.0148 USD Cooper Tire & Rubber Co. 2 –38 USD Copart, Inc. 4 0.01117 USD Corcept Therapeutics, Inc. 2 –27 USD CoreLogic, Inc. 2 –44 USD CoreSite Realty Corp., REIT 4 0.0124 USD Corning, Inc. 1 –70 USD Corporate Office Properties Trust, REIT 2 –18 USD CorVel Corp. 2 –17 USD Costco Wholesale Corp. 5 0.0130 USD Cousins Properties, Inc., REIT 1 –120 USD Covanta Holding Corp. 1 –112 USD Covetrus, Inc. 3 –
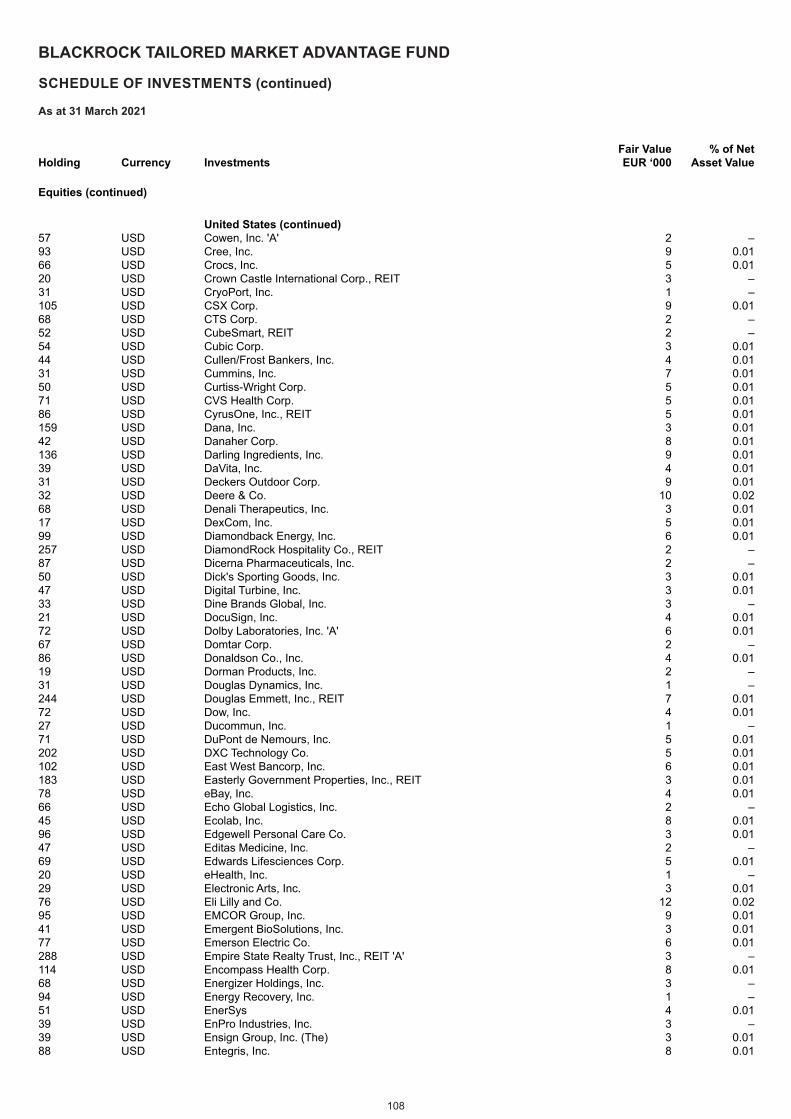
108
BLACKROCK TAILORED MARKET ADVANTAGE FUND
SCHEDULE OF INVESTMENTS (continued)
As at 31 March 2021
Holding Currency InvestmentsFair Value EUR ‘000
% of Net Asset Value
Equities (continued)
United States (continued) 57 USD Cowen, Inc. 'A' 2 –93 USD Cree, Inc. 9 0.0166 USD Crocs, Inc. 5 0.0120 USD Crown Castle International Corp., REIT 3 –31 USD CryoPort, Inc. 1 –105 USD CSX Corp. 9 0.0168 USD CTS Corp. 2 –52 USD CubeSmart, REIT 2 –54 USD Cubic Corp. 3 0.0144 USD Cullen/Frost Bankers, Inc. 4 0.0131 USD Cummins, Inc. 7 0.0150 USD Curtiss-Wright Corp. 5 0.0171 USD CVS Health Corp. 5 0.0186 USD CyrusOne, Inc., REIT 5 0.01159 USD Dana, Inc. 3 0.0142 USD Danaher Corp. 8 0.01136 USD Darling Ingredients, Inc. 9 0.0139 USD DaVita, Inc. 4 0.0131 USD Deckers Outdoor Corp. 9 0.0132 USD Deere & Co. 10 0.0268 USD Denali Therapeutics, Inc. 3 0.0117 USD DexCom, Inc. 5 0.0199 USD Diamondback Energy, Inc. 6 0.01257 USD DiamondRock Hospitality Co., REIT 2 –87 USD Dicerna Pharmaceuticals, Inc. 2 –50 USD Dick's Sporting Goods, Inc. 3 0.0147 USD Digital Turbine, Inc. 3 0.0133 USD Dine Brands Global, Inc. 3 –21 USD DocuSign, Inc. 4 0.0172 USD Dolby Laboratories, Inc. 'A' 6 0.0167 USD Domtar Corp. 2 –86 USD Donaldson Co., Inc. 4 0.0119 USD Dorman Products, Inc. 2 –31 USD Douglas Dynamics, Inc. 1 –244 USD Douglas Emmett, Inc., REIT 7 0.0172 USD Dow, Inc. 4 0.0127 USD Ducommun, Inc. 1 –71 USD DuPont de Nemours, Inc. 5 0.01202 USD DXC Technology Co. 5 0.01102 USD East West Bancorp, Inc. 6 0.01183 USD Easterly Government Properties, Inc., REIT 3 0.0178 USD eBay, Inc. 4 0.0166 USD Echo Global Logistics, Inc. 2 –45 USD Ecolab, Inc. 8 0.0196 USD Edgewell Personal Care Co. 3 0.0147 USD Editas Medicine, Inc. 2 –69 USD Edwards Lifesciences Corp. 5 0.0120 USD eHealth, Inc. 1 –29 USD Electronic Arts, Inc. 3 0.0176 USD Eli Lilly and Co. 12 0.0295 USD EMCOR Group, Inc. 9 0.0141 USD Emergent BioSolutions, Inc. 3 0.0177 USD Emerson Electric Co. 6 0.01288 USD Empire State Realty Trust, Inc., REIT 'A' 3 –114 USD Encompass Health Corp. 8 0.0168 USD Energizer Holdings, Inc. 3 –94 USD Energy Recovery, Inc. 1 –51 USD EnerSys 4 0.0139 USD EnPro Industries, Inc. 3 –39 USD Ensign Group, Inc. (The) 3 0.0188 USD Entegris, Inc. 8 0.01
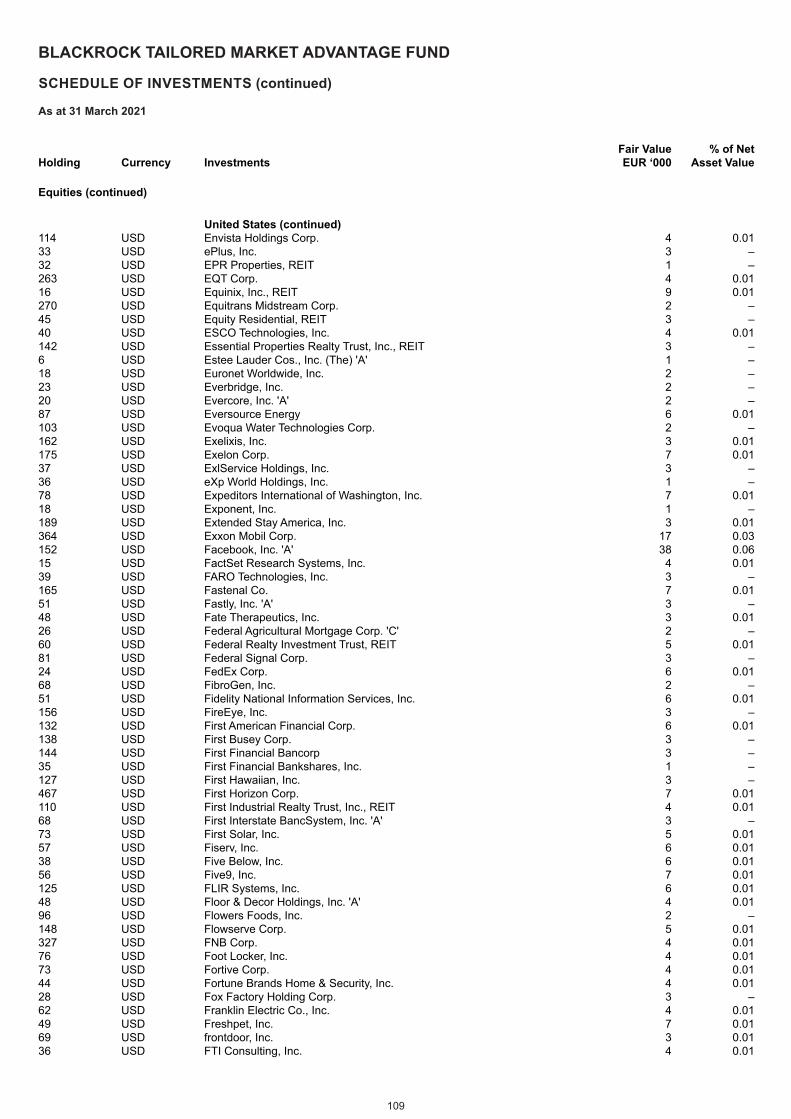
109
BLACKROCK TAILORED MARKET ADVANTAGE FUND
SCHEDULE OF INVESTMENTS (continued)
As at 31 March 2021
Holding Currency InvestmentsFair Value EUR ‘000
% of Net Asset Value
Equities (continued)
United States (continued) 114 USD Envista Holdings Corp. 4 0.0133 USD ePlus, Inc. 3 –32 USD EPR Properties, REIT 1 –263 USD EQT Corp. 4 0.0116 USD Equinix, Inc., REIT 9 0.01270 USD Equitrans Midstream Corp. 2 –45 USD Equity Residential, REIT 3 –40 USD ESCO Technologies, Inc. 4 0.01142 USD Essential Properties Realty Trust, Inc., REIT 3 –6 USD Estee Lauder Cos., Inc. (The) 'A' 1 –18 USD Euronet Worldwide, Inc. 2 –23 USD Everbridge, Inc. 2 –20 USD Evercore, Inc. 'A' 2 –87 USD Eversource Energy 6 0.01103 USD Evoqua Water Technologies Corp. 2 –162 USD Exelixis, Inc. 3 0.01175 USD Exelon Corp. 7 0.0137 USD ExlService Holdings, Inc. 3 –36 USD eXp World Holdings, Inc. 1 –78 USD Expeditors International of Washington, Inc. 7 0.0118 USD Exponent, Inc. 1 –189 USD Extended Stay America, Inc. 3 0.01364 USD Exxon Mobil Corp. 17 0.03152 USD Facebook, Inc. 'A' 38 0.0615 USD FactSet Research Systems, Inc. 4 0.0139 USD FARO Technologies, Inc. 3 –165 USD Fastenal Co. 7 0.0151 USD Fastly, Inc. 'A' 3 –48 USD Fate Therapeutics, Inc. 3 0.0126 USD Federal Agricultural Mortgage Corp. 'C' 2 –60 USD Federal Realty Investment Trust, REIT 5 0.0181 USD Federal Signal Corp. 3 –24 USD FedEx Corp. 6 0.0168 USD FibroGen, Inc. 2 –51 USD Fidelity National Information Services, Inc. 6 0.01156 USD FireEye, Inc. 3 –132 USD First American Financial Corp. 6 0.01138 USD First Busey Corp. 3 –144 USD First Financial Bancorp 3 –35 USD First Financial Bankshares, Inc. 1 –127 USD First Hawaiian, Inc. 3 –467 USD First Horizon Corp. 7 0.01110 USD First Industrial Realty Trust, Inc., REIT 4 0.0168 USD First Interstate BancSystem, Inc. 'A' 3 –73 USD First Solar, Inc. 5 0.0157 USD Fiserv, Inc. 6 0.0138 USD Five Below, Inc. 6 0.0156 USD Five9, Inc. 7 0.01125 USD FLIR Systems, Inc. 6 0.0148 USD Floor & Decor Holdings, Inc. 'A' 4 0.0196 USD Flowers Foods, Inc. 2 –148 USD Flowserve Corp. 5 0.01327 USD FNB Corp. 4 0.0176 USD Foot Locker, Inc. 4 0.0173 USD Fortive Corp. 4 0.0144 USD Fortune Brands Home & Security, Inc. 4 0.0128 USD Fox Factory Holding Corp. 3 –62 USD Franklin Electric Co., Inc. 4 0.0149 USD Freshpet, Inc. 7 0.0169 USD frontdoor, Inc. 3 0.0136 USD FTI Consulting, Inc. 4 0.01
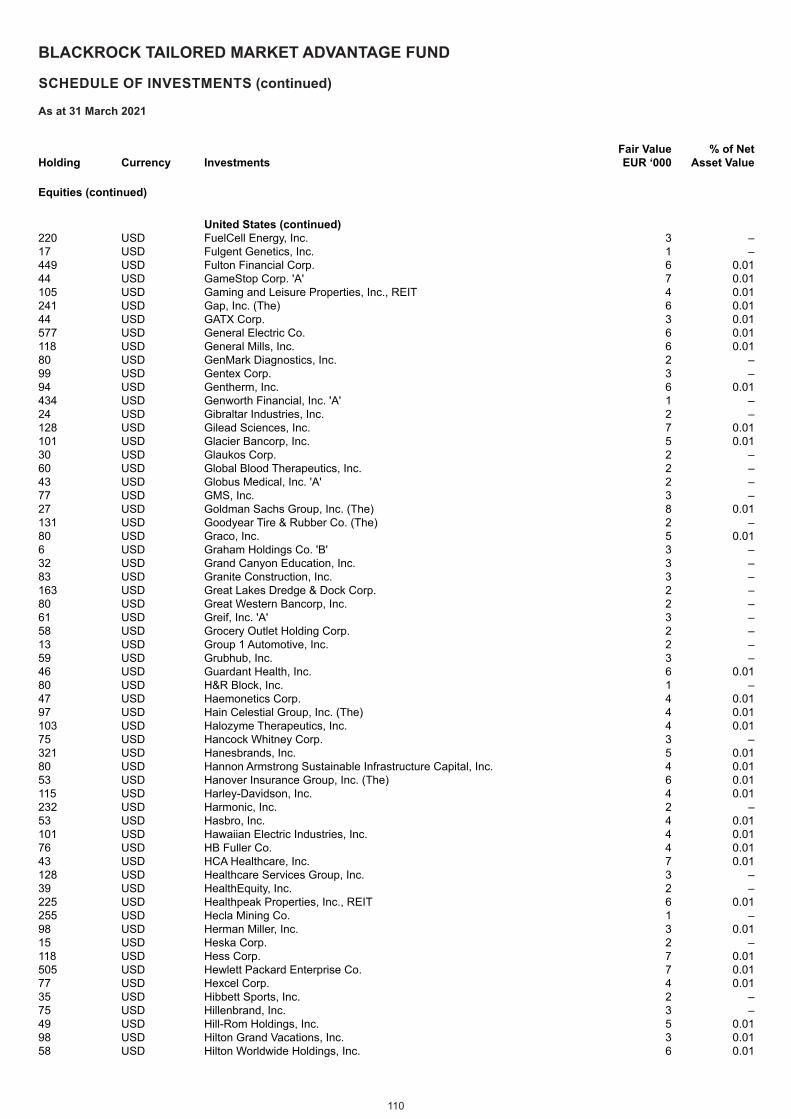
110
BLACKROCK TAILORED MARKET ADVANTAGE FUND
SCHEDULE OF INVESTMENTS (continued)
As at 31 March 2021
Holding Currency InvestmentsFair Value EUR ‘000
% of Net Asset Value
Equities (continued)
United States (continued) 220 USD FuelCell Energy, Inc. 3 –17 USD Fulgent Genetics, Inc. 1 –449 USD Fulton Financial Corp. 6 0.0144 USD GameStop Corp. 'A' 7 0.01105 USD Gaming and Leisure Properties, Inc., REIT 4 0.01241 USD Gap, Inc. (The) 6 0.0144 USD GATX Corp. 3 0.01577 USD General Electric Co. 6 0.01118 USD General Mills, Inc. 6 0.0180 USD GenMark Diagnostics, Inc. 2 –99 USD Gentex Corp. 3 –94 USD Gentherm, Inc. 6 0.01434 USD Genworth Financial, Inc. 'A' 1 –24 USD Gibraltar Industries, Inc. 2 –128 USD Gilead Sciences, Inc. 7 0.01101 USD Glacier Bancorp, Inc. 5 0.0130 USD Glaukos Corp. 2 –60 USD Global Blood Therapeutics, Inc. 2 –43 USD Globus Medical, Inc. 'A' 2 –77 USD GMS, Inc. 3 –27 USD Goldman Sachs Group, Inc. (The) 8 0.01131 USD Goodyear Tire & Rubber Co. (The) 2 –80 USD Graco, Inc. 5 0.016 USD Graham Holdings Co. 'B' 3 –32 USD Grand Canyon Education, Inc. 3 –83 USD Granite Construction, Inc. 3 –163 USD Great Lakes Dredge & Dock Corp. 2 –80 USD Great Western Bancorp, Inc. 2 –61 USD Greif, Inc. 'A' 3 –58 USD Grocery Outlet Holding Corp. 2 –13 USD Group 1 Automotive, Inc. 2 –59 USD Grubhub, Inc. 3 –46 USD Guardant Health, Inc. 6 0.0180 USD H&R Block, Inc. 1 –47 USD Haemonetics Corp. 4 0.0197 USD Hain Celestial Group, Inc. (The) 4 0.01103 USD Halozyme Therapeutics, Inc. 4 0.0175 USD Hancock Whitney Corp. 3 –321 USD Hanesbrands, Inc. 5 0.0180 USD Hannon Armstrong Sustainable Infrastructure Capital, Inc. 4 0.0153 USD Hanover Insurance Group, Inc. (The) 6 0.01115 USD Harley-Davidson, Inc. 4 0.01232 USD Harmonic, Inc. 2 –53 USD Hasbro, Inc. 4 0.01101 USD Hawaiian Electric Industries, Inc. 4 0.0176 USD HB Fuller Co. 4 0.0143 USD HCA Healthcare, Inc. 7 0.01128 USD Healthcare Services Group, Inc. 3 –39 USD HealthEquity, Inc. 2 –225 USD Healthpeak Properties, Inc., REIT 6 0.01255 USD Hecla Mining Co. 1 –98 USD Herman Miller, Inc. 3 0.0115 USD Heska Corp. 2 –118 USD Hess Corp. 7 0.01505 USD Hewlett Packard Enterprise Co. 7 0.0177 USD Hexcel Corp. 4 0.0135 USD Hibbett Sports, Inc. 2 –75 USD Hillenbrand, Inc. 3 –49 USD Hill-Rom Holdings, Inc. 5 0.0198 USD Hilton Grand Vacations, Inc. 3 0.0158 USD Hilton Worldwide Holdings, Inc. 6 0.01
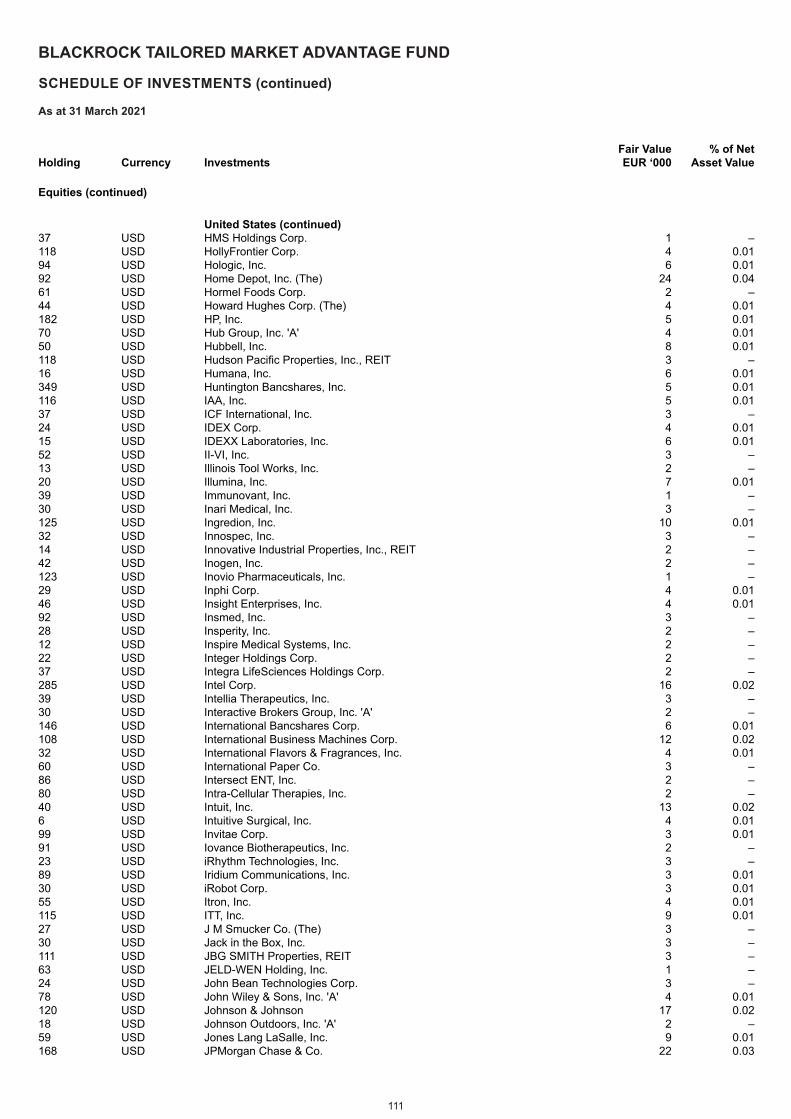
111
BLACKROCK TAILORED MARKET ADVANTAGE FUND
SCHEDULE OF INVESTMENTS (continued)
As at 31 March 2021
Holding Currency InvestmentsFair Value EUR ‘000
% of Net Asset Value
Equities (continued)
United States (continued) 37 USD HMS Holdings Corp. 1 –118 USD HollyFrontier Corp. 4 0.0194 USD Hologic, Inc. 6 0.0192 USD Home Depot, Inc. (The) 24 0.0461 USD Hormel Foods Corp. 2 –44 USD Howard Hughes Corp. (The) 4 0.01182 USD HP, Inc. 5 0.0170 USD Hub Group, Inc. 'A' 4 0.0150 USD Hubbell, Inc. 8 0.01118 USD Hudson Pacific Properties, Inc., REIT 3 –16 USD Humana, Inc. 6 0.01349 USD Huntington Bancshares, Inc. 5 0.01116 USD IAA, Inc. 5 0.0137 USD ICF International, Inc. 3 –24 USD IDEX Corp. 4 0.0115 USD IDEXX Laboratories, Inc. 6 0.0152 USD II-VI, Inc. 3 –13 USD Illinois Tool Works, Inc. 2 –20 USD Illumina, Inc. 7 0.0139 USD Immunovant, Inc. 1 –30 USD Inari Medical, Inc. 3 –125 USD Ingredion, Inc. 10 0.0132 USD Innospec, Inc. 3 –14 USD Innovative Industrial Properties, Inc., REIT 2 –42 USD Inogen, Inc. 2 –123 USD Inovio Pharmaceuticals, Inc. 1 –29 USD Inphi Corp. 4 0.0146 USD Insight Enterprises, Inc. 4 0.0192 USD Insmed, Inc. 3 –28 USD Insperity, Inc. 2 –12 USD Inspire Medical Systems, Inc. 2 –22 USD Integer Holdings Corp. 2 –37 USD Integra LifeSciences Holdings Corp. 2 –285 USD Intel Corp. 16 0.0239 USD Intellia Therapeutics, Inc. 3 –30 USD Interactive Brokers Group, Inc. 'A' 2 –146 USD International Bancshares Corp. 6 0.01108 USD International Business Machines Corp. 12 0.0232 USD International Flavors & Fragrances, Inc. 4 0.0160 USD International Paper Co. 3 –86 USD Intersect ENT, Inc. 2 –80 USD Intra-Cellular Therapies, Inc. 2 –40 USD Intuit, Inc. 13 0.026 USD Intuitive Surgical, Inc. 4 0.0199 USD Invitae Corp. 3 0.0191 USD Iovance Biotherapeutics, Inc. 2 –23 USD iRhythm Technologies, Inc. 3 –89 USD Iridium Communications, Inc. 3 0.0130 USD iRobot Corp. 3 0.0155 USD Itron, Inc. 4 0.01115 USD ITT, Inc. 9 0.0127 USD J M Smucker Co. (The) 3 –30 USD Jack in the Box, Inc. 3 –111 USD JBG SMITH Properties, REIT 3 –63 USD JELD-WEN Holding, Inc. 1 –24 USD John Bean Technologies Corp. 3 –78 USD John Wiley & Sons, Inc. 'A' 4 0.01120 USD Johnson & Johnson 17 0.0218 USD Johnson Outdoors, Inc. 'A' 2 –59 USD Jones Lang LaSalle, Inc. 9 0.01168 USD JPMorgan Chase & Co. 22 0.03
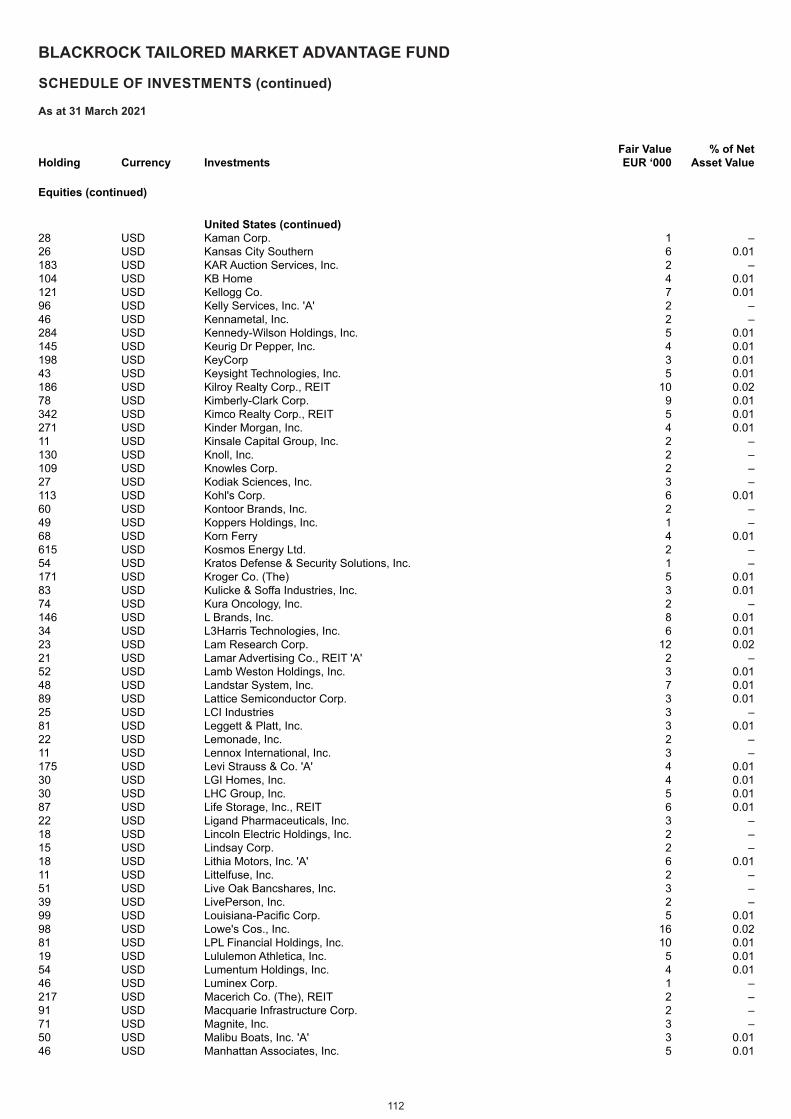
112
BLACKROCK TAILORED MARKET ADVANTAGE FUND
SCHEDULE OF INVESTMENTS (continued)
As at 31 March 2021
Holding Currency InvestmentsFair Value EUR ‘000
% of Net Asset Value
Equities (continued)
United States (continued) 28 USD Kaman Corp. 1 –26 USD Kansas City Southern 6 0.01183 USD KAR Auction Services, Inc. 2 –104 USD KB Home 4 0.01121 USD Kellogg Co. 7 0.0196 USD Kelly Services, Inc. 'A' 2 –46 USD Kennametal, Inc. 2 –284 USD Kennedy-Wilson Holdings, Inc. 5 0.01145 USD Keurig Dr Pepper, Inc. 4 0.01198 USD KeyCorp 3 0.0143 USD Keysight Technologies, Inc. 5 0.01186 USD Kilroy Realty Corp., REIT 10 0.0278 USD Kimberly-Clark Corp. 9 0.01342 USD Kimco Realty Corp., REIT 5 0.01271 USD Kinder Morgan, Inc. 4 0.0111 USD Kinsale Capital Group, Inc. 2 –130 USD Knoll, Inc. 2 –109 USD Knowles Corp. 2 –27 USD Kodiak Sciences, Inc. 3 –113 USD Kohl's Corp. 6 0.0160 USD Kontoor Brands, Inc. 2 –49 USD Koppers Holdings, Inc. 1 –68 USD Korn Ferry 4 0.01615 USD Kosmos Energy Ltd. 2 –54 USD Kratos Defense & Security Solutions, Inc. 1 –171 USD Kroger Co. (The) 5 0.0183 USD Kulicke & Soffa Industries, Inc. 3 0.0174 USD Kura Oncology, Inc. 2 –146 USD L Brands, Inc. 8 0.0134 USD L3Harris Technologies, Inc. 6 0.0123 USD Lam Research Corp. 12 0.0221 USD Lamar Advertising Co., REIT 'A' 2 –52 USD Lamb Weston Holdings, Inc. 3 0.0148 USD Landstar System, Inc. 7 0.0189 USD Lattice Semiconductor Corp. 3 0.0125 USD LCI Industries 3 –81 USD Leggett & Platt, Inc. 3 0.0122 USD Lemonade, Inc. 2 –11 USD Lennox International, Inc. 3 –175 USD Levi Strauss & Co. 'A' 4 0.0130 USD LGI Homes, Inc. 4 0.0130 USD LHC Group, Inc. 5 0.0187 USD Life Storage, Inc., REIT 6 0.0122 USD Ligand Pharmaceuticals, Inc. 3 –18 USD Lincoln Electric Holdings, Inc. 2 –15 USD Lindsay Corp. 2 –18 USD Lithia Motors, Inc. 'A' 6 0.0111 USD Littelfuse, Inc. 2 –51 USD Live Oak Bancshares, Inc. 3 –39 USD LivePerson, Inc. 2 –99 USD Louisiana-Pacific Corp. 5 0.0198 USD Lowe's Cos., Inc. 16 0.0281 USD LPL Financial Holdings, Inc. 10 0.0119 USD Lululemon Athletica, Inc. 5 0.0154 USD Lumentum Holdings, Inc. 4 0.0146 USD Luminex Corp. 1 –217 USD Macerich Co. (The), REIT 2 –91 USD Macquarie Infrastructure Corp. 2 –71 USD Magnite, Inc. 3 –50 USD Malibu Boats, Inc. 'A' 3 0.0146 USD Manhattan Associates, Inc. 5 0.01
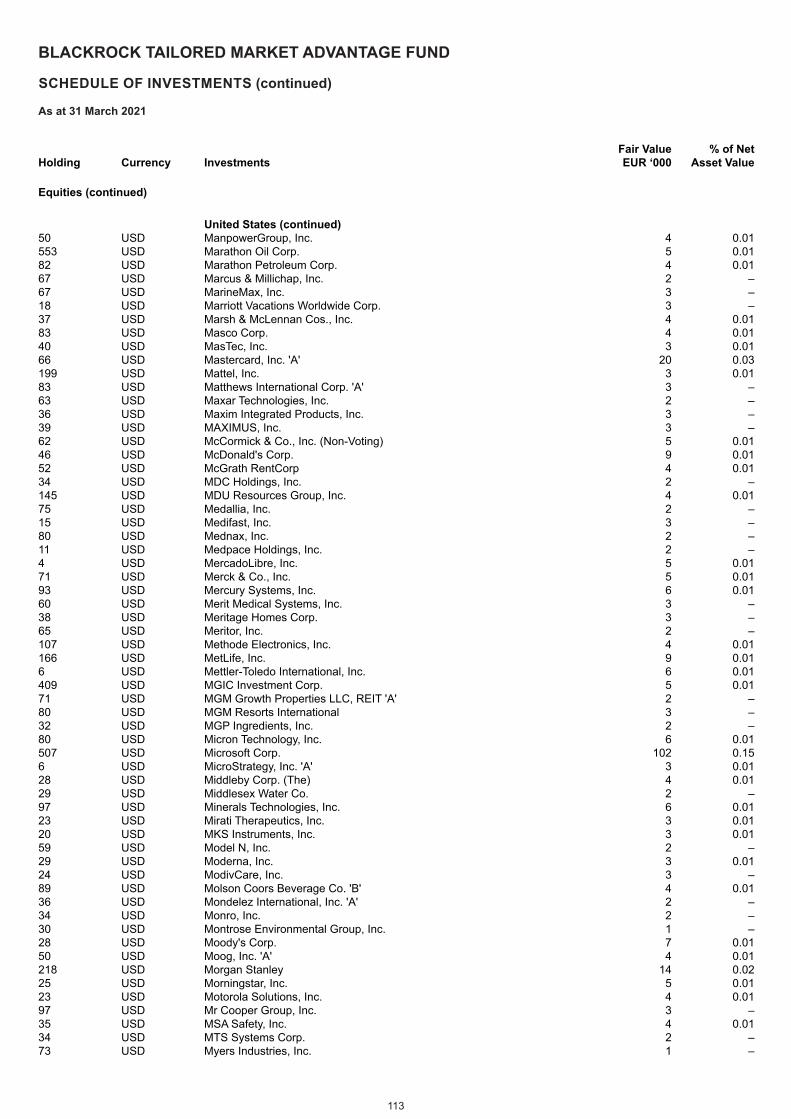
113
BLACKROCK TAILORED MARKET ADVANTAGE FUND
SCHEDULE OF INVESTMENTS (continued)
As at 31 March 2021
Holding Currency InvestmentsFair Value EUR ‘000
% of Net Asset Value
Equities (continued)
United States (continued) 50 USD ManpowerGroup, Inc. 4 0.01553 USD Marathon Oil Corp. 5 0.0182 USD Marathon Petroleum Corp. 4 0.0167 USD Marcus & Millichap, Inc. 2 –67 USD MarineMax, Inc. 3 –18 USD Marriott Vacations Worldwide Corp. 3 –37 USD Marsh & McLennan Cos., Inc. 4 0.0183 USD Masco Corp. 4 0.0140 USD MasTec, Inc. 3 0.0166 USD Mastercard, Inc. 'A' 20 0.03199 USD Mattel, Inc. 3 0.0183 USD Matthews International Corp. 'A' 3 –63 USD Maxar Technologies, Inc. 2 –36 USD Maxim Integrated Products, Inc. 3 –39 USD MAXIMUS, Inc. 3 –62 USD McCormick & Co., Inc. (Non-Voting) 5 0.0146 USD McDonald's Corp. 9 0.0152 USD McGrath RentCorp 4 0.0134 USD MDC Holdings, Inc. 2 –145 USD MDU Resources Group, Inc. 4 0.0175 USD Medallia, Inc. 2 –15 USD Medifast, Inc. 3 –80 USD Mednax, Inc. 2 –11 USD Medpace Holdings, Inc. 2 –4 USD MercadoLibre, Inc. 5 0.0171 USD Merck & Co., Inc. 5 0.0193 USD Mercury Systems, Inc. 6 0.0160 USD Merit Medical Systems, Inc. 3 –38 USD Meritage Homes Corp. 3 –65 USD Meritor, Inc. 2 –107 USD Methode Electronics, Inc. 4 0.01166 USD MetLife, Inc. 9 0.016 USD Mettler-Toledo International, Inc. 6 0.01409 USD MGIC Investment Corp. 5 0.0171 USD MGM Growth Properties LLC, REIT 'A' 2 –80 USD MGM Resorts International 3 –32 USD MGP Ingredients, Inc. 2 –80 USD Micron Technology, Inc. 6 0.01507 USD Microsoft Corp. 102 0.156 USD MicroStrategy, Inc. 'A' 3 0.0128 USD Middleby Corp. (The) 4 0.0129 USD Middlesex Water Co. 2 –97 USD Minerals Technologies, Inc. 6 0.0123 USD Mirati Therapeutics, Inc. 3 0.0120 USD MKS Instruments, Inc. 3 0.0159 USD Model N, Inc. 2 –29 USD Moderna, Inc. 3 0.0124 USD ModivCare, Inc. 3 –89 USD Molson Coors Beverage Co. 'B' 4 0.0136 USD Mondelez International, Inc. 'A' 2 –34 USD Monro, Inc. 2 –30 USD Montrose Environmental Group, Inc. 1 –28 USD Moody's Corp. 7 0.0150 USD Moog, Inc. 'A' 4 0.01218 USD Morgan Stanley 14 0.0225 USD Morningstar, Inc. 5 0.0123 USD Motorola Solutions, Inc. 4 0.0197 USD Mr Cooper Group, Inc. 3 –35 USD MSA Safety, Inc. 4 0.0134 USD MTS Systems Corp. 2 –73 USD Myers Industries, Inc. 1 –
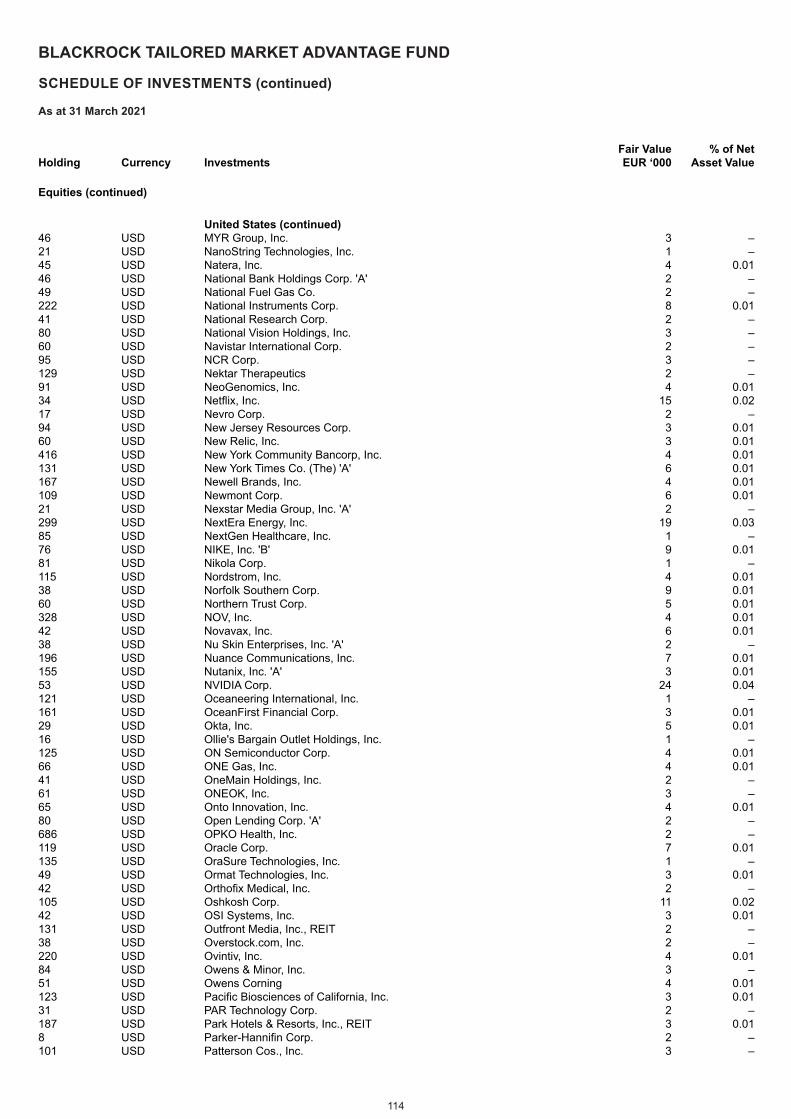
114
BLACKROCK TAILORED MARKET ADVANTAGE FUND
SCHEDULE OF INVESTMENTS (continued)
As at 31 March 2021
Holding Currency InvestmentsFair Value EUR ‘000
% of Net Asset Value
Equities (continued)
United States (continued) 46 USD MYR Group, Inc. 3 –21 USD NanoString Technologies, Inc. 1 –45 USD Natera, Inc. 4 0.0146 USD National Bank Holdings Corp. 'A' 2 –49 USD National Fuel Gas Co. 2 –222 USD National Instruments Corp. 8 0.0141 USD National Research Corp. 2 –80 USD National Vision Holdings, Inc. 3 –60 USD Navistar International Corp. 2 –95 USD NCR Corp. 3 –129 USD Nektar Therapeutics 2 –91 USD NeoGenomics, Inc. 4 0.0134 USD Netflix, Inc. 15 0.0217 USD Nevro Corp. 2 –94 USD New Jersey Resources Corp. 3 0.0160 USD New Relic, Inc. 3 0.01416 USD New York Community Bancorp, Inc. 4 0.01131 USD New York Times Co. (The) 'A' 6 0.01167 USD Newell Brands, Inc. 4 0.01109 USD Newmont Corp. 6 0.0121 USD Nexstar Media Group, Inc. 'A' 2 –299 USD NextEra Energy, Inc. 19 0.0385 USD NextGen Healthcare, Inc. 1 –76 USD NIKE, Inc. 'B' 9 0.0181 USD Nikola Corp. 1 –115 USD Nordstrom, Inc. 4 0.0138 USD Norfolk Southern Corp. 9 0.0160 USD Northern Trust Corp. 5 0.01328 USD NOV, Inc. 4 0.0142 USD Novavax, Inc. 6 0.0138 USD Nu Skin Enterprises, Inc. 'A' 2 –196 USD Nuance Communications, Inc. 7 0.01155 USD Nutanix, Inc. 'A' 3 0.0153 USD NVIDIA Corp. 24 0.04121 USD Oceaneering International, Inc. 1 –161 USD OceanFirst Financial Corp. 3 0.0129 USD Okta, Inc. 5 0.0116 USD Ollie's Bargain Outlet Holdings, Inc. 1 –125 USD ON Semiconductor Corp. 4 0.0166 USD ONE Gas, Inc. 4 0.0141 USD OneMain Holdings, Inc. 2 –61 USD ONEOK, Inc. 3 –65 USD Onto Innovation, Inc. 4 0.0180 USD Open Lending Corp. 'A' 2 –686 USD OPKO Health, Inc. 2 –119 USD Oracle Corp. 7 0.01135 USD OraSure Technologies, Inc. 1 –49 USD Ormat Technologies, Inc. 3 0.0142 USD Orthofix Medical, Inc. 2 –105 USD Oshkosh Corp. 11 0.0242 USD OSI Systems, Inc. 3 0.01131 USD Outfront Media, Inc., REIT 2 –38 USD Overstock.com, Inc. 2 –220 USD Ovintiv, Inc. 4 0.0184 USD Owens & Minor, Inc. 3 –51 USD Owens Corning 4 0.01123 USD Pacific Biosciences of California, Inc. 3 0.0131 USD PAR Technology Corp. 2 –187 USD Park Hotels & Resorts, Inc., REIT 3 0.018 USD Parker-Hannifin Corp. 2 –101 USD Patterson Cos., Inc. 3 –
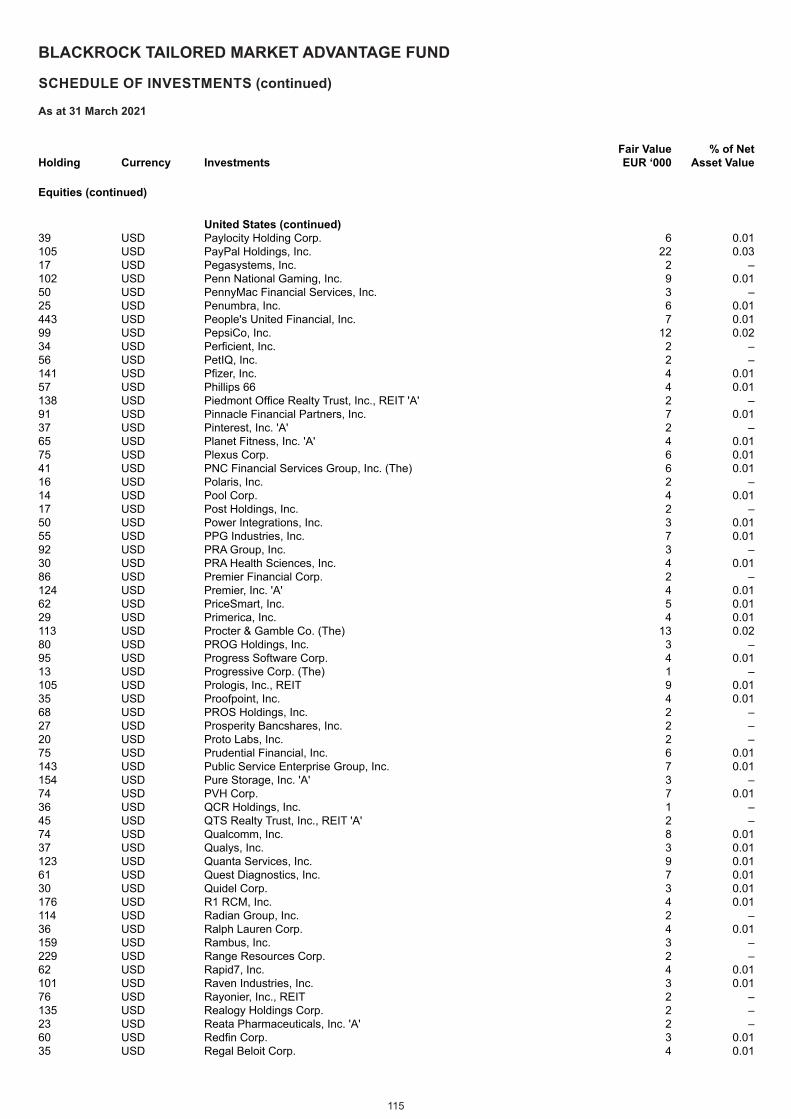
115
BLACKROCK TAILORED MARKET ADVANTAGE FUND
SCHEDULE OF INVESTMENTS (continued)
As at 31 March 2021
Holding Currency InvestmentsFair Value EUR ‘000
% of Net Asset Value
Equities (continued)
United States (continued) 39 USD Paylocity Holding Corp. 6 0.01105 USD PayPal Holdings, Inc. 22 0.0317 USD Pegasystems, Inc. 2 –102 USD Penn National Gaming, Inc. 9 0.0150 USD PennyMac Financial Services, Inc. 3 –25 USD Penumbra, Inc. 6 0.01443 USD People's United Financial, Inc. 7 0.0199 USD PepsiCo, Inc. 12 0.0234 USD Perficient, Inc. 2 –56 USD PetIQ, Inc. 2 –141 USD Pfizer, Inc. 4 0.0157 USD Phillips 66 4 0.01138 USD Piedmont Office Realty Trust, Inc., REIT 'A' 2 –91 USD Pinnacle Financial Partners, Inc. 7 0.0137 USD Pinterest, Inc. 'A' 2 –65 USD Planet Fitness, Inc. 'A' 4 0.0175 USD Plexus Corp. 6 0.0141 USD PNC Financial Services Group, Inc. (The) 6 0.0116 USD Polaris, Inc. 2 –14 USD Pool Corp. 4 0.0117 USD Post Holdings, Inc. 2 –50 USD Power Integrations, Inc. 3 0.0155 USD PPG Industries, Inc. 7 0.0192 USD PRA Group, Inc. 3 –30 USD PRA Health Sciences, Inc. 4 0.0186 USD Premier Financial Corp. 2 –124 USD Premier, Inc. 'A' 4 0.0162 USD PriceSmart, Inc. 5 0.0129 USD Primerica, Inc. 4 0.01113 USD Procter & Gamble Co. (The) 13 0.0280 USD PROG Holdings, Inc. 3 –95 USD Progress Software Corp. 4 0.0113 USD Progressive Corp. (The) 1 –105 USD Prologis, Inc., REIT 9 0.0135 USD Proofpoint, Inc. 4 0.0168 USD PROS Holdings, Inc. 2 –27 USD Prosperity Bancshares, Inc. 2 –20 USD Proto Labs, Inc. 2 –75 USD Prudential Financial, Inc. 6 0.01143 USD Public Service Enterprise Group, Inc. 7 0.01154 USD Pure Storage, Inc. 'A' 3 –74 USD PVH Corp. 7 0.0136 USD QCR Holdings, Inc. 1 –45 USD QTS Realty Trust, Inc., REIT 'A' 2 –74 USD Qualcomm, Inc. 8 0.0137 USD Qualys, Inc. 3 0.01123 USD Quanta Services, Inc. 9 0.0161 USD Quest Diagnostics, Inc. 7 0.0130 USD Quidel Corp. 3 0.01176 USD R1 RCM, Inc. 4 0.01114 USD Radian Group, Inc. 2 –36 USD Ralph Lauren Corp. 4 0.01159 USD Rambus, Inc. 3 –229 USD Range Resources Corp. 2 –62 USD Rapid7, Inc. 4 0.01101 USD Raven Industries, Inc. 3 0.0176 USD Rayonier, Inc., REIT 2 –135 USD Realogy Holdings Corp. 2 –23 USD Reata Pharmaceuticals, Inc. 'A' 2 –60 USD Redfin Corp. 3 0.0135 USD Regal Beloit Corp. 4 0.01
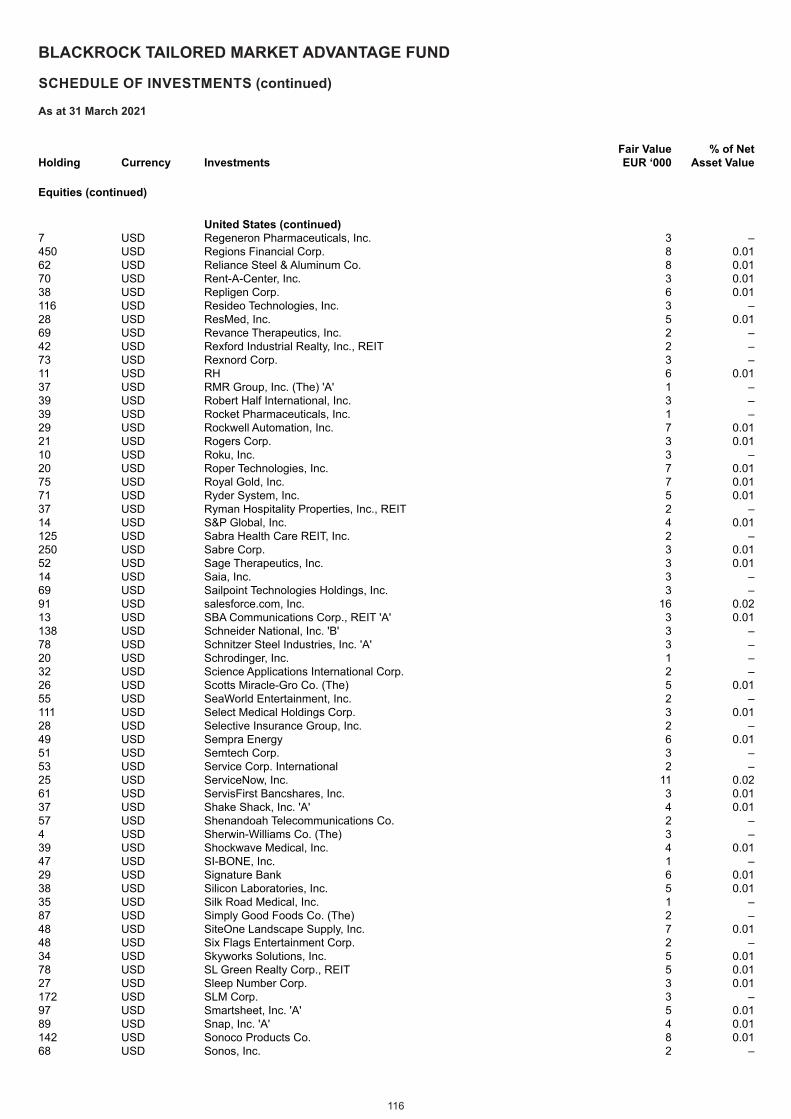
116
BLACKROCK TAILORED MARKET ADVANTAGE FUND
SCHEDULE OF INVESTMENTS (continued)
As at 31 March 2021
Holding Currency InvestmentsFair Value EUR ‘000
% of Net Asset Value
Equities (continued)
United States (continued) 7 USD Regeneron Pharmaceuticals, Inc. 3 –450 USD Regions Financial Corp. 8 0.0162 USD Reliance Steel & Aluminum Co. 8 0.0170 USD Rent-A-Center, Inc. 3 0.0138 USD Repligen Corp. 6 0.01116 USD Resideo Technologies, Inc. 3 –28 USD ResMed, Inc. 5 0.0169 USD Revance Therapeutics, Inc. 2 –42 USD Rexford Industrial Realty, Inc., REIT 2 –73 USD Rexnord Corp. 3 –11 USD RH 6 0.0137 USD RMR Group, Inc. (The) 'A' 1 –39 USD Robert Half International, Inc. 3 –39 USD Rocket Pharmaceuticals, Inc. 1 –29 USD Rockwell Automation, Inc. 7 0.0121 USD Rogers Corp. 3 0.0110 USD Roku, Inc. 3 –20 USD Roper Technologies, Inc. 7 0.0175 USD Royal Gold, Inc. 7 0.0171 USD Ryder System, Inc. 5 0.0137 USD Ryman Hospitality Properties, Inc., REIT 2 –14 USD S&P Global, Inc. 4 0.01125 USD Sabra Health Care REIT, Inc. 2 –250 USD Sabre Corp. 3 0.0152 USD Sage Therapeutics, Inc. 3 0.0114 USD Saia, Inc. 3 –69 USD Sailpoint Technologies Holdings, Inc. 3 –91 USD salesforce.com, Inc. 16 0.0213 USD SBA Communications Corp., REIT 'A' 3 0.01138 USD Schneider National, Inc. 'B' 3 –78 USD Schnitzer Steel Industries, Inc. 'A' 3 –20 USD Schrodinger, Inc. 1 –32 USD Science Applications International Corp. 2 –26 USD Scotts Miracle-Gro Co. (The) 5 0.0155 USD SeaWorld Entertainment, Inc. 2 –111 USD Select Medical Holdings Corp. 3 0.0128 USD Selective Insurance Group, Inc. 2 –49 USD Sempra Energy 6 0.0151 USD Semtech Corp. 3 –53 USD Service Corp. International 2 –25 USD ServiceNow, Inc. 11 0.0261 USD ServisFirst Bancshares, Inc. 3 0.0137 USD Shake Shack, Inc. 'A' 4 0.0157 USD Shenandoah Telecommunications Co. 2 –4 USD Sherwin-Williams Co. (The) 3 –39 USD Shockwave Medical, Inc. 4 0.0147 USD SI-BONE, Inc. 1 –29 USD Signature Bank 6 0.0138 USD Silicon Laboratories, Inc. 5 0.0135 USD Silk Road Medical, Inc. 1 –87 USD Simply Good Foods Co. (The) 2 –48 USD SiteOne Landscape Supply, Inc. 7 0.0148 USD Six Flags Entertainment Corp. 2 –34 USD Skyworks Solutions, Inc. 5 0.0178 USD SL Green Realty Corp., REIT 5 0.0127 USD Sleep Number Corp. 3 0.01172 USD SLM Corp. 3 –97 USD Smartsheet, Inc. 'A' 5 0.0189 USD Snap, Inc. 'A' 4 0.01142 USD Sonoco Products Co. 8 0.0168 USD Sonos, Inc. 2 –
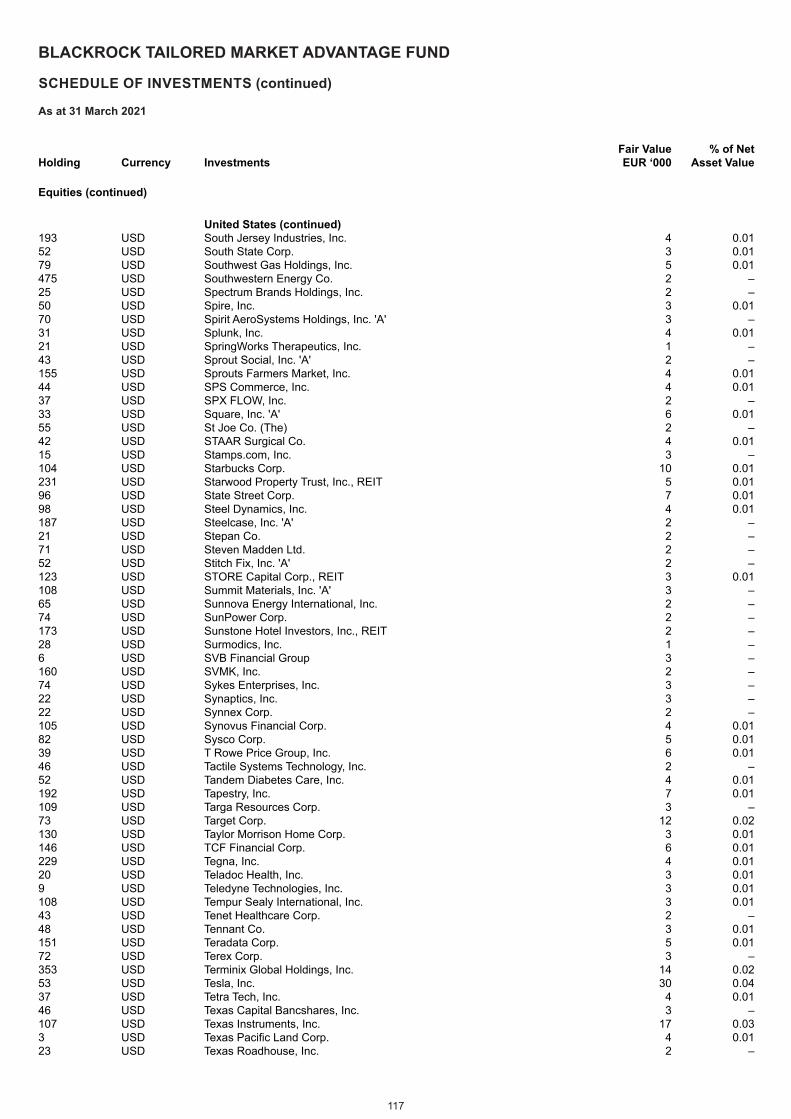
117
BLACKROCK TAILORED MARKET ADVANTAGE FUND
SCHEDULE OF INVESTMENTS (continued)
As at 31 March 2021
Holding Currency InvestmentsFair Value EUR ‘000
% of Net Asset Value
Equities (continued)
United States (continued) 193 USD South Jersey Industries, Inc. 4 0.0152 USD South State Corp. 3 0.0179 USD Southwest Gas Holdings, Inc. 5 0.01475 USD Southwestern Energy Co. 2 –25 USD Spectrum Brands Holdings, Inc. 2 –50 USD Spire, Inc. 3 0.0170 USD Spirit AeroSystems Holdings, Inc. 'A' 3 –31 USD Splunk, Inc. 4 0.0121 USD SpringWorks Therapeutics, Inc. 1 –43 USD Sprout Social, Inc. 'A' 2 –155 USD Sprouts Farmers Market, Inc. 4 0.0144 USD SPS Commerce, Inc. 4 0.0137 USD SPX FLOW, Inc. 2 –33 USD Square, Inc. 'A' 6 0.0155 USD St Joe Co. (The) 2 –42 USD STAAR Surgical Co. 4 0.0115 USD Stamps.com, Inc. 3 –104 USD Starbucks Corp. 10 0.01231 USD Starwood Property Trust, Inc., REIT 5 0.0196 USD State Street Corp. 7 0.0198 USD Steel Dynamics, Inc. 4 0.01187 USD Steelcase, Inc. 'A' 2 –21 USD Stepan Co. 2 –71 USD Steven Madden Ltd. 2 –52 USD Stitch Fix, Inc. 'A' 2 –123 USD STORE Capital Corp., REIT 3 0.01108 USD Summit Materials, Inc. 'A' 3 –65 USD Sunnova Energy International, Inc. 2 –74 USD SunPower Corp. 2 –173 USD Sunstone Hotel Investors, Inc., REIT 2 –28 USD Surmodics, Inc. 1 –6 USD SVB Financial Group 3 –160 USD SVMK, Inc. 2 –74 USD Sykes Enterprises, Inc. 3 –22 USD Synaptics, Inc. 3 –22 USD Synnex Corp. 2 –105 USD Synovus Financial Corp. 4 0.0182 USD Sysco Corp. 5 0.0139 USD T Rowe Price Group, Inc. 6 0.0146 USD Tactile Systems Technology, Inc. 2 –52 USD Tandem Diabetes Care, Inc. 4 0.01192 USD Tapestry, Inc. 7 0.01109 USD Targa Resources Corp. 3 –73 USD Target Corp. 12 0.02130 USD Taylor Morrison Home Corp. 3 0.01146 USD TCF Financial Corp. 6 0.01229 USD Tegna, Inc. 4 0.0120 USD Teladoc Health, Inc. 3 0.019 USD Teledyne Technologies, Inc. 3 0.01108 USD Tempur Sealy International, Inc. 3 0.0143 USD Tenet Healthcare Corp. 2 –48 USD Tennant Co. 3 0.01151 USD Teradata Corp. 5 0.0172 USD Terex Corp. 3 –353 USD Terminix Global Holdings, Inc. 14 0.0253 USD Tesla, Inc. 30 0.0437 USD Tetra Tech, Inc. 4 0.0146 USD Texas Capital Bancshares, Inc. 3 –107 USD Texas Instruments, Inc. 17 0.033 USD Texas Pacific Land Corp. 4 0.0123 USD Texas Roadhouse, Inc. 2 –
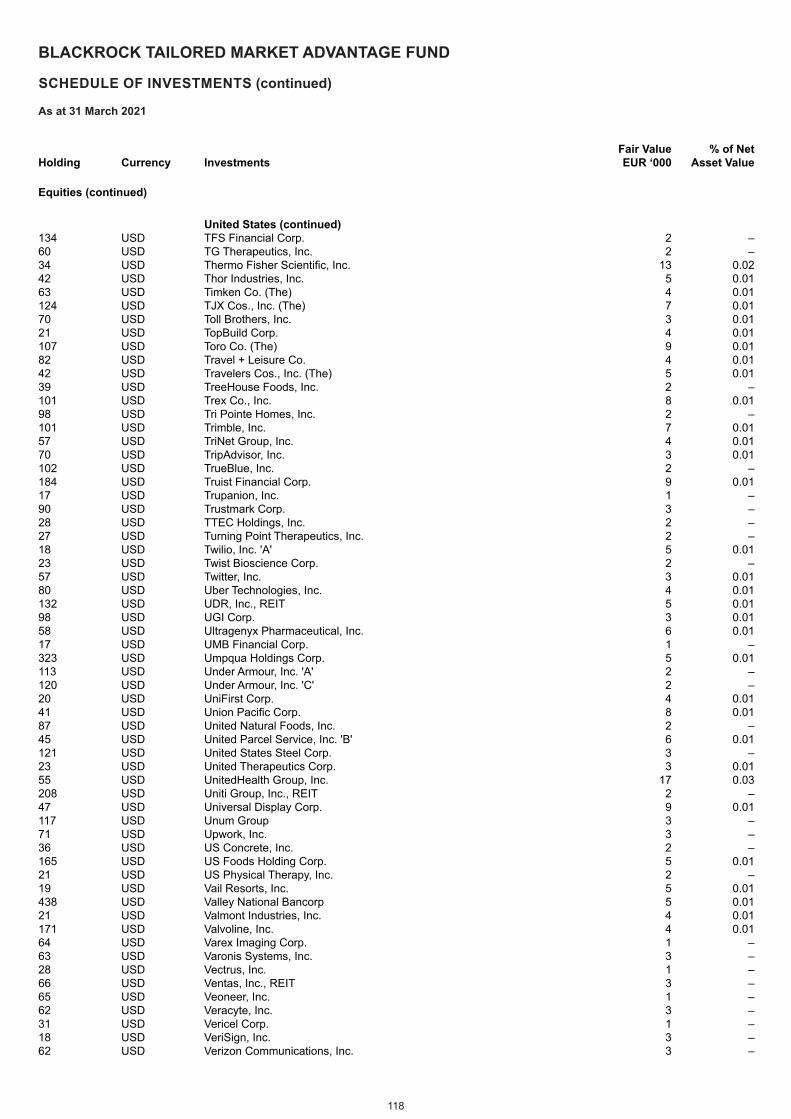
118
BLACKROCK TAILORED MARKET ADVANTAGE FUND
SCHEDULE OF INVESTMENTS (continued)
As at 31 March 2021
Holding Currency InvestmentsFair Value EUR ‘000
% of Net Asset Value
Equities (continued)
United States (continued) 134 USD TFS Financial Corp. 2 –60 USD TG Therapeutics, Inc. 2 –34 USD Thermo Fisher Scientific, Inc. 13 0.0242 USD Thor Industries, Inc. 5 0.0163 USD Timken Co. (The) 4 0.01124 USD TJX Cos., Inc. (The) 7 0.0170 USD Toll Brothers, Inc. 3 0.0121 USD TopBuild Corp. 4 0.01107 USD Toro Co. (The) 9 0.0182 USD Travel + Leisure Co. 4 0.0142 USD Travelers Cos., Inc. (The) 5 0.0139 USD TreeHouse Foods, Inc. 2 –101 USD Trex Co., Inc. 8 0.0198 USD Tri Pointe Homes, Inc. 2 –101 USD Trimble, Inc. 7 0.0157 USD TriNet Group, Inc. 4 0.0170 USD TripAdvisor, Inc. 3 0.01102 USD TrueBlue, Inc. 2 –184 USD Truist Financial Corp. 9 0.0117 USD Trupanion, Inc. 1 –90 USD Trustmark Corp. 3 –28 USD TTEC Holdings, Inc. 2 –27 USD Turning Point Therapeutics, Inc. 2 –18 USD Twilio, Inc. 'A' 5 0.0123 USD Twist Bioscience Corp. 2 –57 USD Twitter, Inc. 3 0.0180 USD Uber Technologies, Inc. 4 0.01132 USD UDR, Inc., REIT 5 0.0198 USD UGI Corp. 3 0.0158 USD Ultragenyx Pharmaceutical, Inc. 6 0.0117 USD UMB Financial Corp. 1 –323 USD Umpqua Holdings Corp. 5 0.01113 USD Under Armour, Inc. 'A' 2 –120 USD Under Armour, Inc. 'C' 2 –20 USD UniFirst Corp. 4 0.0141 USD Union Pacific Corp. 8 0.0187 USD United Natural Foods, Inc. 2 –45 USD United Parcel Service, Inc. 'B' 6 0.01121 USD United States Steel Corp. 3 –23 USD United Therapeutics Corp. 3 0.0155 USD UnitedHealth Group, Inc. 17 0.03208 USD Uniti Group, Inc., REIT 2 –47 USD Universal Display Corp. 9 0.01117 USD Unum Group 3 –71 USD Upwork, Inc. 3 –36 USD US Concrete, Inc. 2 –165 USD US Foods Holding Corp. 5 0.0121 USD US Physical Therapy, Inc. 2 –19 USD Vail Resorts, Inc. 5 0.01438 USD Valley National Bancorp 5 0.0121 USD Valmont Industries, Inc. 4 0.01171 USD Valvoline, Inc. 4 0.0164 USD Varex Imaging Corp. 1 –63 USD Varonis Systems, Inc. 3 –28 USD Vectrus, Inc. 1 –66 USD Ventas, Inc., REIT 3 –65 USD Veoneer, Inc. 1 –62 USD Veracyte, Inc. 3 –31 USD Vericel Corp. 1 –18 USD VeriSign, Inc. 3 –62 USD Verizon Communications, Inc. 3 –
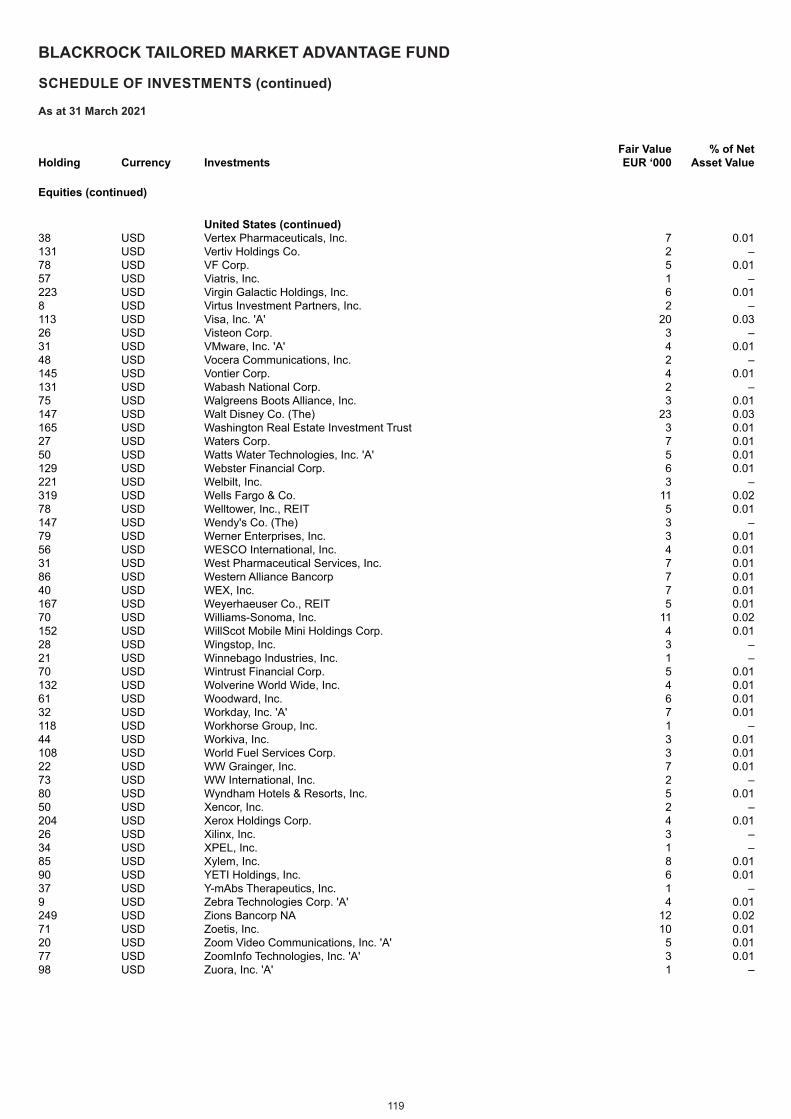
119
BLACKROCK TAILORED MARKET ADVANTAGE FUND
SCHEDULE OF INVESTMENTS (continued)
As at 31 March 2021
Holding Currency InvestmentsFair Value EUR ‘000
% of Net Asset Value
Equities (continued)
United States (continued) 38 USD Vertex Pharmaceuticals, Inc. 7 0.01131 USD Vertiv Holdings Co. 2 –78 USD VF Corp. 5 0.0157 USD Viatris, Inc. 1 –223 USD Virgin Galactic Holdings, Inc. 6 0.018 USD Virtus Investment Partners, Inc. 2 –113 USD Visa, Inc. 'A' 20 0.0326 USD Visteon Corp. 3 –31 USD VMware, Inc. 'A' 4 0.0148 USD Vocera Communications, Inc. 2 –145 USD Vontier Corp. 4 0.01131 USD Wabash National Corp. 2 –75 USD Walgreens Boots Alliance, Inc. 3 0.01147 USD Walt Disney Co. (The) 23 0.03165 USD Washington Real Estate Investment Trust 3 0.0127 USD Waters Corp. 7 0.0150 USD Watts Water Technologies, Inc. 'A' 5 0.01129 USD Webster Financial Corp. 6 0.01221 USD Welbilt, Inc. 3 –319 USD Wells Fargo & Co. 11 0.0278 USD Welltower, Inc., REIT 5 0.01147 USD Wendy's Co. (The) 3 –79 USD Werner Enterprises, Inc. 3 0.0156 USD WESCO International, Inc. 4 0.0131 USD West Pharmaceutical Services, Inc. 7 0.0186 USD Western Alliance Bancorp 7 0.0140 USD WEX, Inc. 7 0.01167 USD Weyerhaeuser Co., REIT 5 0.0170 USD Williams-Sonoma, Inc. 11 0.02152 USD WillScot Mobile Mini Holdings Corp. 4 0.0128 USD Wingstop, Inc. 3 –21 USD Winnebago Industries, Inc. 1 –70 USD Wintrust Financial Corp. 5 0.01132 USD Wolverine World Wide, Inc. 4 0.0161 USD Woodward, Inc. 6 0.0132 USD Workday, Inc. 'A' 7 0.01118 USD Workhorse Group, Inc. 1 –44 USD Workiva, Inc. 3 0.01108 USD World Fuel Services Corp. 3 0.0122 USD WW Grainger, Inc. 7 0.0173 USD WW International, Inc. 2 –80 USD Wyndham Hotels & Resorts, Inc. 5 0.0150 USD Xencor, Inc. 2 –204 USD Xerox Holdings Corp. 4 0.0126 USD Xilinx, Inc. 3 –34 USD XPEL, Inc. 1 –85 USD Xylem, Inc. 8 0.0190 USD YETI Holdings, Inc. 6 0.0137 USD Y-mAbs Therapeutics, Inc. 1 –9 USD Zebra Technologies Corp. 'A' 4 0.01249 USD Zions Bancorp NA 12 0.0271 USD Zoetis, Inc. 10 0.0120 USD Zoom Video Communications, Inc. 'A' 5 0.0177 USD ZoomInfo Technologies, Inc. 'A' 3 0.0198 USD Zuora, Inc. 'A' 1 –
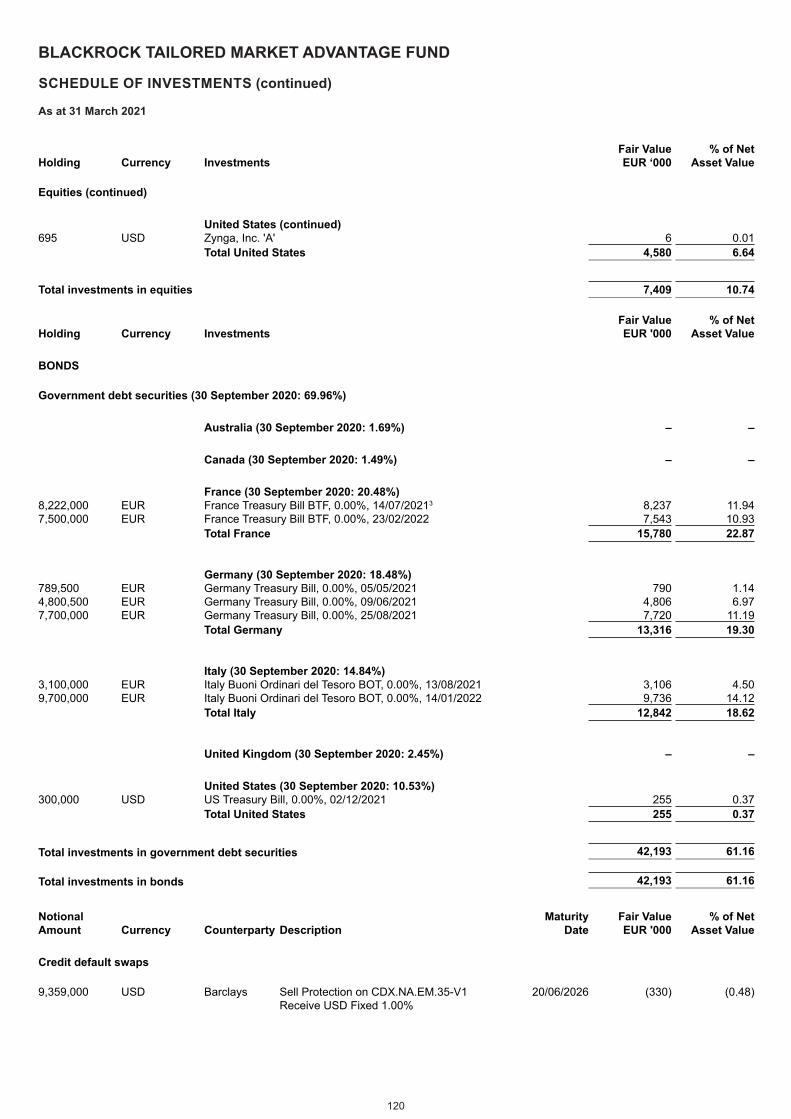
120
BLACKROCK TAILORED MARKET ADVANTAGE FUND
SCHEDULE OF INVESTMENTS (continued)
As at 31 March 2021
Holding Currency InvestmentsFair Value EUR ‘000
% of Net Asset Value
Equities (continued)
United States (continued) 695 USD Zynga, Inc. 'A' 6 0.01
Total United States 4,580 6.64
Total investments in equities 7,409 10.74
Holding Currency InvestmentsFair Value EUR '000
% of Net Asset Value
BONDS
Government debt securities (30 September 2020: 69.96%)
Australia (30 September 2020: 1.69%) – –
Canada (30 September 2020: 1.49%) – –
France (30 September 2020: 20.48%)8,222,000 EUR France Treasury Bill BTF, 0.00%, 14/07/20213 8,237 11.947,500,000 EUR France Treasury Bill BTF, 0.00%, 23/02/2022 7,543 10.93
Total France 15,780 22.87
Germany (30 September 2020: 18.48%)789,500 EUR Germany Treasury Bill, 0.00%, 05/05/2021 790 1.144,800,500 EUR Germany Treasury Bill, 0.00%, 09/06/2021 4,806 6.977,700,000 EUR Germany Treasury Bill, 0.00%, 25/08/2021 7,720 11.19
Total Germany 13,316 19.30
Italy (30 September 2020: 14.84%)3,100,000 EUR Italy Buoni Ordinari del Tesoro BOT, 0.00%, 13/08/2021 3,106 4.509,700,000 EUR Italy Buoni Ordinari del Tesoro BOT, 0.00%, 14/01/2022 9,736 14.12
Total Italy 12,842 18.62
United Kingdom (30 September 2020: 2.45%) – –
United States (30 September 2020: 10.53%)300,000 USD US Treasury Bill, 0.00%, 02/12/2021 255 0.37
Total United States 255 0.37
Total investments in government debt securities 42,193 61.16 Total investments in bonds 42,193 61.16
Notional Maturity Fair Value % of Net Amount Currency Counterparty Description Date EUR '000 Asset Value
Credit default swaps
9,359,000 USD Barclays Sell Protection on CDX.NA.EM.35-V1 Receive USD Fixed 1.00%
20/06/2026 (330) (0.48)
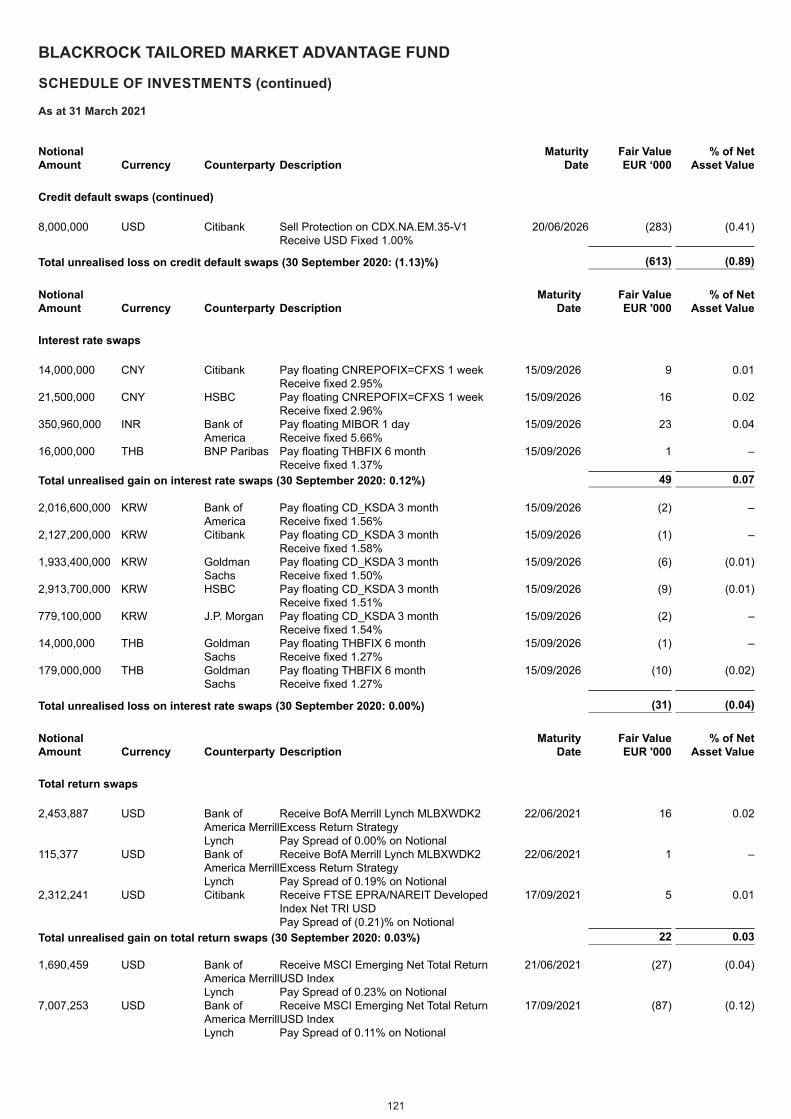
121
BLACKROCK TAILORED MARKET ADVANTAGE FUND
SCHEDULE OF INVESTMENTS (continued)
As at 31 March 2021
Notional Maturity Fair Value % of Net Amount Currency Counterparty Description Date EUR ‘000 Asset Value
Credit default swaps (continued)
8,000,000 USD Citibank Sell Protection on CDX.NA.EM.35-V1 Receive USD Fixed 1.00%
20/06/2026 (283) (0.41)
Total unrealised loss on credit default swaps (30 September 2020: (1.13)%) (613) (0.89) Notional Maturity Fair Value % of Net Amount Currency Counterparty Description Date EUR '000 Asset Value
Interest rate swaps
14,000,000 CNY Citibank Pay floating CNREPOFIX=CFXS 1 week Receive fixed 2.95%
15/09/2026 9 0.01
21,500,000 CNY HSBC Pay floating CNREPOFIX=CFXS 1 week Receive fixed 2.96%
15/09/2026 16 0.02
350,960,000 INR Bank of America
Pay floating MIBOR 1 day Receive fixed 5.66%
15/09/2026 23 0.04
16,000,000 THB BNP Paribas Pay floating THBFIX 6 month Receive fixed 1.37%
15/09/2026 1 –
Total unrealised gain on interest rate swaps (30 September 2020: 0.12%) 49 0.07 2,016,600,000 KRW Bank of
AmericaPay floating CD_KSDA 3 month Receive fixed 1.56%
15/09/2026 (2) –
2,127,200,000 KRW Citibank Pay floating CD_KSDA 3 month Receive fixed 1.58%
15/09/2026 (1) –
1,933,400,000 KRW Goldman Sachs
Pay floating CD_KSDA 3 month Receive fixed 1.50%
15/09/2026 (6) (0.01)
2,913,700,000 KRW HSBC Pay floating CD_KSDA 3 month Receive fixed 1.51%
15/09/2026 (9) (0.01)
779,100,000 KRW J.P. Morgan Pay floating CD_KSDA 3 month Receive fixed 1.54%
15/09/2026 (2) –
14,000,000 THB Goldman Sachs
Pay floating THBFIX 6 month Receive fixed 1.27%
15/09/2026 (1) –
179,000,000 THB Goldman Sachs
Pay floating THBFIX 6 month Receive fixed 1.27%
15/09/2026 (10) (0.02)
Total unrealised loss on interest rate swaps (30 September 2020: 0.00%) (31) (0.04) Notional Maturity Fair Value % of Net Amount Currency Counterparty Description Date EUR '000 Asset Value
Total return swaps
2,453,887 USD Bank of America Merrill Lynch
Receive BofA Merrill Lynch MLBXWDK2 Excess Return Strategy Pay Spread of 0.00% on Notional
22/06/2021 16 0.02
115,377 USD Bank of America Merrill Lynch
Receive BofA Merrill Lynch MLBXWDK2 Excess Return Strategy Pay Spread of 0.19% on Notional
22/06/2021 1 –
2,312,241 USD Citibank Receive FTSE EPRA/NAREIT Developed Index Net TRI USD Pay Spread of (0.21)% on Notional
17/09/2021 5 0.01
Total unrealised gain on total return swaps (30 September 2020: 0.03%) 22 0.03 1,690,459 USD Bank of
America Merrill Lynch
Receive MSCI Emerging Net Total Return USD Index Pay Spread of 0.23% on Notional
21/06/2021 (27) (0.04)
7,007,253 USD Bank of America Merrill Lynch
Receive MSCI Emerging Net Total Return USD Index Pay Spread of 0.11% on Notional
17/09/2021 (87) (0.12)
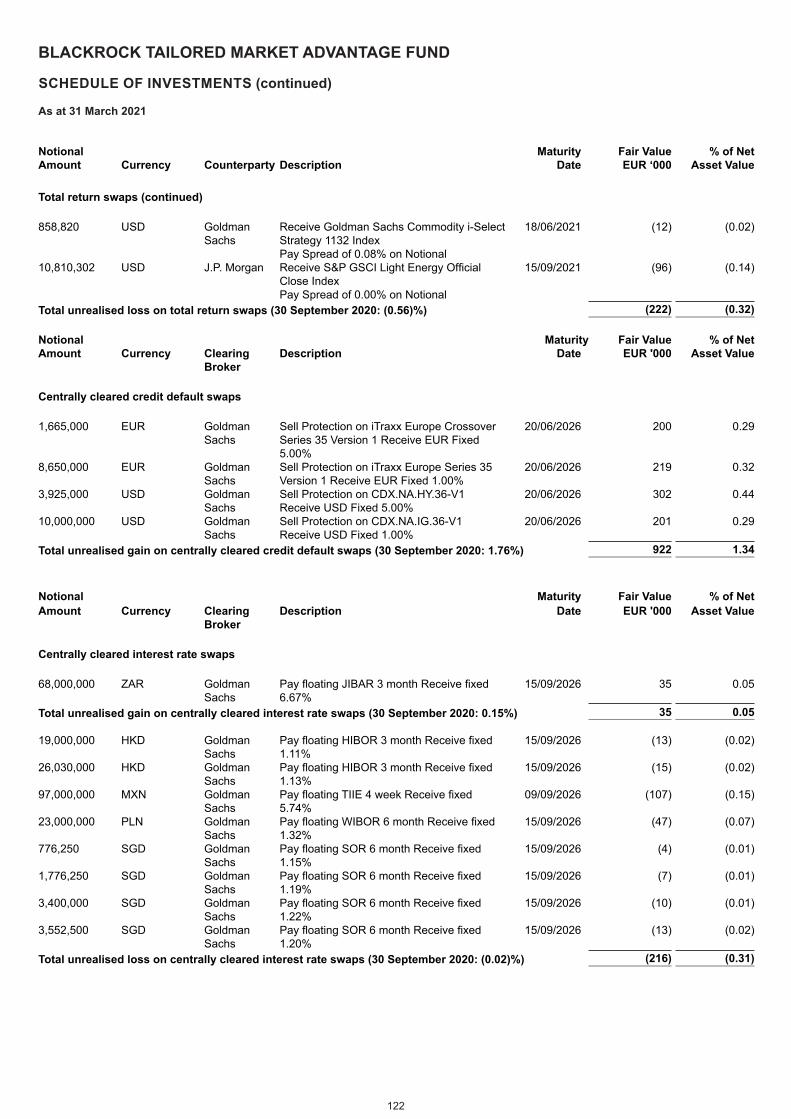
122
BLACKROCK TAILORED MARKET ADVANTAGE FUND
SCHEDULE OF INVESTMENTS (continued)
As at 31 March 2021
Notional Maturity Fair Value % of Net Amount Currency Counterparty Description Date EUR ‘000 Asset Value
Total return swaps (continued)
858,820 USD Goldman Sachs
Receive Goldman Sachs Commodity i-Select Strategy 1132 Index Pay Spread of 0.08% on Notional
18/06/2021 (12) (0.02)
10,810,302 USD J.P. Morgan Receive S&P GSCI Light Energy Official Close Index Pay Spread of 0.00% on Notional
15/09/2021 (96) (0.14)
Total unrealised loss on total return swaps (30 September 2020: (0.56)%) (222) (0.32) Notional Maturity Fair Value % of Net Amount Currency Clearing
BrokerDescription Date EUR '000 Asset Value
Centrally cleared credit default swaps
1,665,000 EUR Goldman Sachs
Sell Protection on iTraxx Europe Crossover Series 35 Version 1 Receive EUR Fixed 5.00%
20/06/2026 200 0.29
8,650,000 EUR Goldman Sachs
Sell Protection on iTraxx Europe Series 35 Version 1 Receive EUR Fixed 1.00%
20/06/2026 219 0.32
3,925,000 USD Goldman Sachs
Sell Protection on CDX.NA.HY.36-V1 Receive USD Fixed 5.00%
20/06/2026 302 0.44
10,000,000 USD Goldman Sachs
Sell Protection on CDX.NA.IG.36-V1 Receive USD Fixed 1.00%
20/06/2026 201 0.29
Total unrealised gain on centrally cleared credit default swaps (30 September 2020: 1.76%) 922 1.34 Notional Maturity Fair Value % of Net Amount Currency Clearing
BrokerDescription Date EUR '000 Asset Value
Centrally cleared interest rate swaps
68,000,000 ZAR Goldman Sachs
Pay floating JIBAR 3 month Receive fixed 6.67%
15/09/2026 35 0.05
Total unrealised gain on centrally cleared interest rate swaps (30 September 2020: 0.15%) 35 0.05 19,000,000 HKD Goldman
SachsPay floating HIBOR 3 month Receive fixed 1.11%
15/09/2026 (13) (0.02)
26,030,000 HKD Goldman Sachs
Pay floating HIBOR 3 month Receive fixed 1.13%
15/09/2026 (15) (0.02)
97,000,000 MXN Goldman Sachs
Pay floating TIIE 4 week Receive fixed 5.74%
09/09/2026 (107) (0.15)
23,000,000 PLN Goldman Sachs
Pay floating WIBOR 6 month Receive fixed 1.32%
15/09/2026 (47) (0.07)
776,250 SGD Goldman Sachs
Pay floating SOR 6 month Receive fixed 1.15%
15/09/2026 (4) (0.01)
1,776,250 SGD Goldman Sachs
Pay floating SOR 6 month Receive fixed 1.19%
15/09/2026 (7) (0.01)
3,400,000 SGD Goldman Sachs
Pay floating SOR 6 month Receive fixed 1.22%
15/09/2026 (10) (0.01)
3,552,500 SGD Goldman Sachs
Pay floating SOR 6 month Receive fixed 1.20%
15/09/2026 (13) (0.02)
Total unrealised loss on centrally cleared interest rate swaps (30 September 2020: (0.02)%) (216) (0.31)
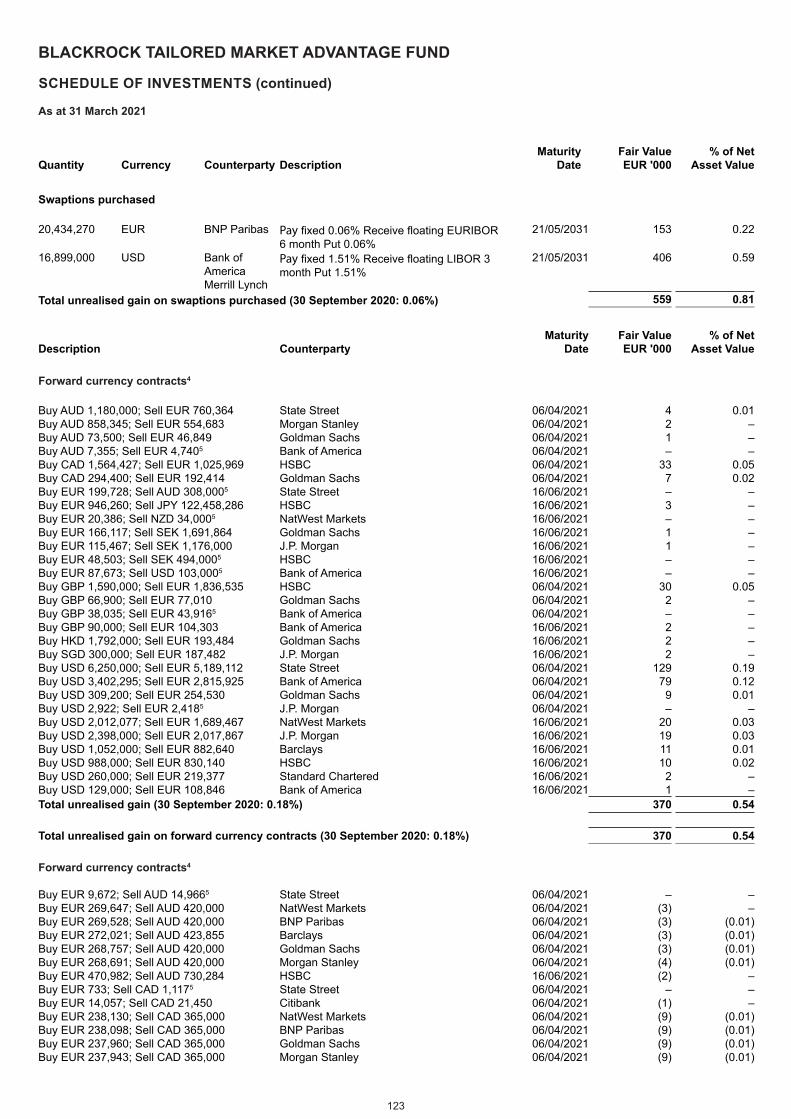
123
BLACKROCK TAILORED MARKET ADVANTAGE FUND
SCHEDULE OF INVESTMENTS (continued)
As at 31 March 2021
Maturity Fair Value % of Net Quantity Currency Counterparty Description Date EUR '000 Asset Value
Swaptions purchased
20,434,270 EUR BNP Paribas Pay fixed 0.06% Receive floating EURIBOR 6 month Put 0.06%
21/05/2031 153 0.22
16,899,000 USD Bank of America Merrill Lynch
Pay fixed 1.51% Receive floating LIBOR 3 month Put 1.51%
21/05/2031 406 0.59
Total unrealised gain on swaptions purchased (30 September 2020: 0.06%) 559 0.81
Maturity Fair Value % of NetDescription Counterparty Date EUR '000 Asset Value
Forward currency contracts4
Buy AUD 1,180,000; Sell EUR 760,364 State Street 06/04/2021 4 0.01Buy AUD 858,345; Sell EUR 554,683 Morgan Stanley 06/04/2021 2 –Buy AUD 73,500; Sell EUR 46,849 Goldman Sachs 06/04/2021 1 –Buy AUD 7,355; Sell EUR 4,7405 Bank of America 06/04/2021 – –Buy CAD 1,564,427; Sell EUR 1,025,969 HSBC 06/04/2021 33 0.05Buy CAD 294,400; Sell EUR 192,414 Goldman Sachs 06/04/2021 7 0.02Buy EUR 199,728; Sell AUD 308,0005 State Street 16/06/2021 – –Buy EUR 946,260; Sell JPY 122,458,286 HSBC 16/06/2021 3 –Buy EUR 20,386; Sell NZD 34,0005 NatWest Markets 16/06/2021 – –Buy EUR 166,117; Sell SEK 1,691,864 Goldman Sachs 16/06/2021 1 –Buy EUR 115,467; Sell SEK 1,176,000 J.P. Morgan 16/06/2021 1 –Buy EUR 48,503; Sell SEK 494,0005 HSBC 16/06/2021 – –Buy EUR 87,673; Sell USD 103,0005 Bank of America 16/06/2021 – –Buy GBP 1,590,000; Sell EUR 1,836,535 HSBC 06/04/2021 30 0.05Buy GBP 66,900; Sell EUR 77,010 Goldman Sachs 06/04/2021 2 –Buy GBP 38,035; Sell EUR 43,9165 Bank of America 06/04/2021 – –Buy GBP 90,000; Sell EUR 104,303 Bank of America 16/06/2021 2 –Buy HKD 1,792,000; Sell EUR 193,484 Goldman Sachs 16/06/2021 2 –Buy SGD 300,000; Sell EUR 187,482 J.P. Morgan 16/06/2021 2 –Buy USD 6,250,000; Sell EUR 5,189,112 State Street 06/04/2021 129 0.19Buy USD 3,402,295; Sell EUR 2,815,925 Bank of America 06/04/2021 79 0.12Buy USD 309,200; Sell EUR 254,530 Goldman Sachs 06/04/2021 9 0.01Buy USD 2,922; Sell EUR 2,4185 J.P. Morgan 06/04/2021 – –Buy USD 2,012,077; Sell EUR 1,689,467 NatWest Markets 16/06/2021 20 0.03Buy USD 2,398,000; Sell EUR 2,017,867 J.P. Morgan 16/06/2021 19 0.03Buy USD 1,052,000; Sell EUR 882,640 Barclays 16/06/2021 11 0.01Buy USD 988,000; Sell EUR 830,140 HSBC 16/06/2021 10 0.02Buy USD 260,000; Sell EUR 219,377 Standard Chartered 16/06/2021 2 –Buy USD 129,000; Sell EUR 108,846 Bank of America 16/06/2021 1 –Total unrealised gain (30 September 2020: 0.18%) 370 0.54 Total unrealised gain on forward currency contracts (30 September 2020: 0.18%) 370 0.54 Forward currency contracts4
Buy EUR 9,672; Sell AUD 14,9665 State Street 06/04/2021 – –Buy EUR 269,647; Sell AUD 420,000 NatWest Markets 06/04/2021 (3) –Buy EUR 269,528; Sell AUD 420,000 BNP Paribas 06/04/2021 (3) (0.01)Buy EUR 272,021; Sell AUD 423,855 Barclays 06/04/2021 (3) (0.01)Buy EUR 268,757; Sell AUD 420,000 Goldman Sachs 06/04/2021 (3) (0.01)Buy EUR 268,691; Sell AUD 420,000 Morgan Stanley 06/04/2021 (4) (0.01)Buy EUR 470,982; Sell AUD 730,284 HSBC 16/06/2021 (2) –Buy EUR 733; Sell CAD 1,1175 State Street 06/04/2021 – –Buy EUR 14,057; Sell CAD 21,450 Citibank 06/04/2021 (1) –Buy EUR 238,130; Sell CAD 365,000 NatWest Markets 06/04/2021 (9) (0.01)Buy EUR 238,098; Sell CAD 365,000 BNP Paribas 06/04/2021 (9) (0.01)Buy EUR 237,960; Sell CAD 365,000 Goldman Sachs 06/04/2021 (9) (0.01)Buy EUR 237,943; Sell CAD 365,000 Morgan Stanley 06/04/2021 (9) (0.01)
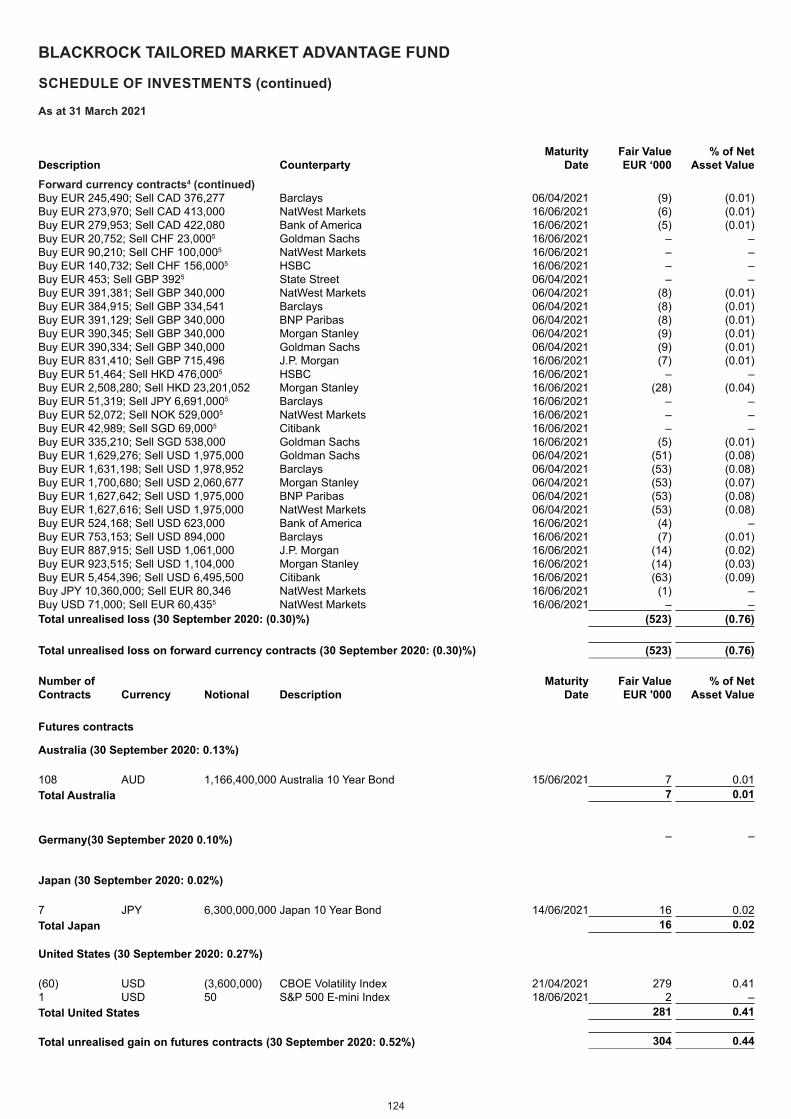
124
BLACKROCK TAILORED MARKET ADVANTAGE FUND
SCHEDULE OF INVESTMENTS (continued)
As at 31 March 2021
Maturity Fair Value % of NetDescription Counterparty Date EUR ‘000 Asset ValueForward currency contracts4 (continued) Buy EUR 245,490; Sell CAD 376,277 Barclays 06/04/2021 (9) (0.01)Buy EUR 273,970; Sell CAD 413,000 NatWest Markets 16/06/2021 (6) (0.01)Buy EUR 279,953; Sell CAD 422,080 Bank of America 16/06/2021 (5) (0.01)Buy EUR 20,752; Sell CHF 23,0005 Goldman Sachs 16/06/2021 – –Buy EUR 90,210; Sell CHF 100,0005 NatWest Markets 16/06/2021 – –Buy EUR 140,732; Sell CHF 156,0005 HSBC 16/06/2021 – –Buy EUR 453; Sell GBP 3925 State Street 06/04/2021 – –Buy EUR 391,381; Sell GBP 340,000 NatWest Markets 06/04/2021 (8) (0.01)Buy EUR 384,915; Sell GBP 334,541 Barclays 06/04/2021 (8) (0.01)Buy EUR 391,129; Sell GBP 340,000 BNP Paribas 06/04/2021 (8) (0.01)Buy EUR 390,345; Sell GBP 340,000 Morgan Stanley 06/04/2021 (9) (0.01)Buy EUR 390,334; Sell GBP 340,000 Goldman Sachs 06/04/2021 (9) (0.01)Buy EUR 831,410; Sell GBP 715,496 J.P. Morgan 16/06/2021 (7) (0.01)Buy EUR 51,464; Sell HKD 476,0005 HSBC 16/06/2021 – –Buy EUR 2,508,280; Sell HKD 23,201,052 Morgan Stanley 16/06/2021 (28) (0.04)Buy EUR 51,319; Sell JPY 6,691,0005 Barclays 16/06/2021 – –Buy EUR 52,072; Sell NOK 529,0005 NatWest Markets 16/06/2021 – –Buy EUR 42,989; Sell SGD 69,0005 Citibank 16/06/2021 – –Buy EUR 335,210; Sell SGD 538,000 Goldman Sachs 16/06/2021 (5) (0.01)Buy EUR 1,629,276; Sell USD 1,975,000 Goldman Sachs 06/04/2021 (51) (0.08)Buy EUR 1,631,198; Sell USD 1,978,952 Barclays 06/04/2021 (53) (0.08)Buy EUR 1,700,680; Sell USD 2,060,677 Morgan Stanley 06/04/2021 (53) (0.07)Buy EUR 1,627,642; Sell USD 1,975,000 BNP Paribas 06/04/2021 (53) (0.08)Buy EUR 1,627,616; Sell USD 1,975,000 NatWest Markets 06/04/2021 (53) (0.08)Buy EUR 524,168; Sell USD 623,000 Bank of America 16/06/2021 (4) –Buy EUR 753,153; Sell USD 894,000 Barclays 16/06/2021 (7) (0.01)Buy EUR 887,915; Sell USD 1,061,000 J.P. Morgan 16/06/2021 (14) (0.02)Buy EUR 923,515; Sell USD 1,104,000 Morgan Stanley 16/06/2021 (14) (0.03)Buy EUR 5,454,396; Sell USD 6,495,500 Citibank 16/06/2021 (63) (0.09)Buy JPY 10,360,000; Sell EUR 80,346 NatWest Markets 16/06/2021 (1) –Buy USD 71,000; Sell EUR 60,4355 NatWest Markets 16/06/2021 – –Total unrealised loss (30 September 2020: (0.30)%) (523) (0.76) Total unrealised loss on forward currency contracts (30 September 2020: (0.30)%) (523) (0.76) Number of Maturity Fair Value % of NetContracts Currency Notional Description Date EUR '000 Asset Value
Futures contracts
Australia (30 September 2020: 0.13%)
108 AUD 1,166,400,000 Australia 10 Year Bond 15/06/2021 7 0.01Total Australia 7 0.01 Germany (30 September 2020: 0.10%) – –Germany(30 September 2020 0.10%) – –
Japan (30 September 2020: 0.02%)
7 JPY 6,300,000,000 Japan 10 Year Bond 14/06/2021 16 0.02Total Japan 16 0.02 United States (30 September 2020: 0.27%)
(60) USD (3,600,000) CBOE Volatility Index 21/04/2021 279 0.411 USD 50 S&P 500 E-mini Index 18/06/2021 2 –Total United States 281 0.41 Total unrealised gain on futures contracts (30 September 2020: 0.52%) 304 0.44
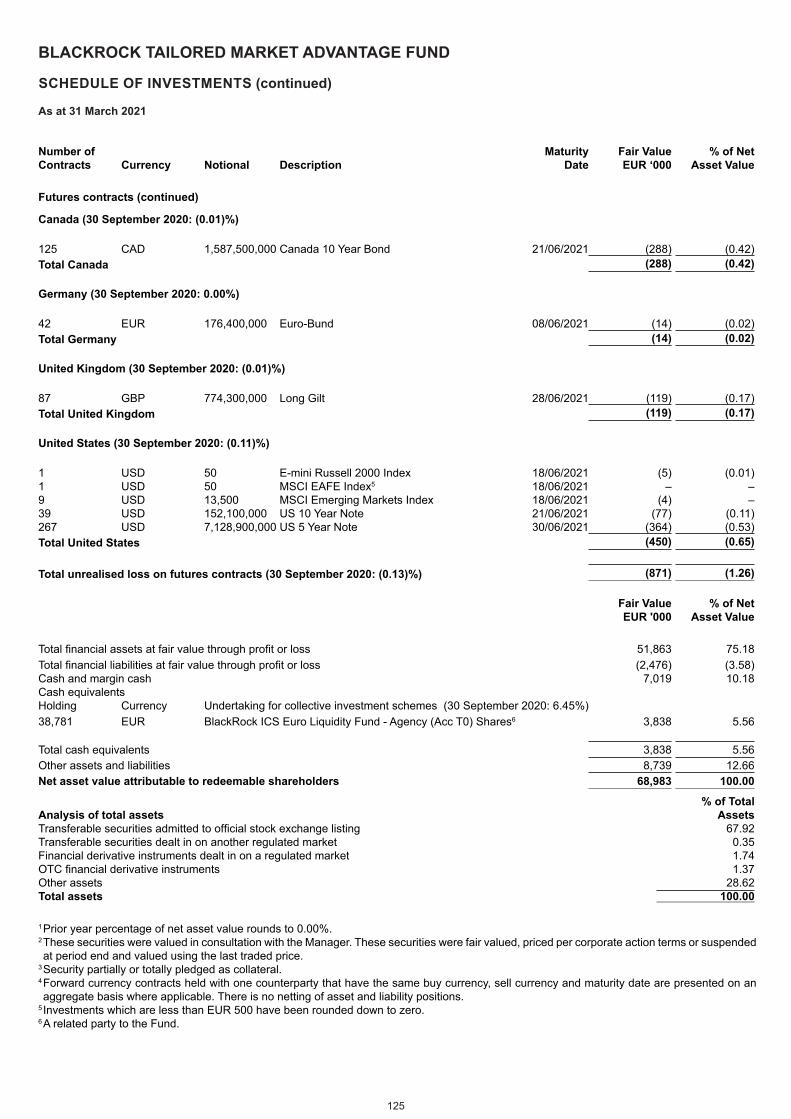
125
BLACKROCK TAILORED MARKET ADVANTAGE FUND
SCHEDULE OF INVESTMENTS (continued)
As at 31 March 2021
Number of Maturity Fair Value % of NetContracts Currency Notional Description Date EUR ‘000 Asset Value
Futures contracts (continued)
Canada (30 September 2020: (0.01)%)
125 CAD 1,587,500,000 Canada 10 Year Bond 21/06/2021 (288) (0.42)Total Canada (288) (0.42) Germany (30 September 2020: 0.00%)
42 EUR 176,400,000 Euro-Bund 08/06/2021 (14) (0.02)Total Germany (14) (0.02) United Kingdom (30 September 2020: (0.01)%)
87 GBP 774,300,000 Long Gilt 28/06/2021 (119) (0.17)Total United Kingdom (119) (0.17) United States (30 September 2020: (0.11)%)
1 USD 50 E-mini Russell 2000 Index 18/06/2021 (5) (0.01)1 USD 50 MSCI EAFE Index5 18/06/2021 – –9 USD 13,500 MSCI Emerging Markets Index 18/06/2021 (4) –39 USD 152,100,000 US 10 Year Note 21/06/2021 (77) (0.11)267 USD 7,128,900,000 US 5 Year Note 30/06/2021 (364) (0.53)Total United States (450) (0.65) Total unrealised loss on futures contracts (30 September 2020: (0.13)%) (871) (1.26)
Fair Value EUR '000
% of Net Asset Value
Total financial assets at fair value through profit or loss 51,863 75.18Total financial liabilities at fair value through profit or loss (2,476) (3.58)Cash and margin cash 7,019 10.18Cash equivalentsHolding Currency Undertaking for collective investment schemes (30 September 2020: 6.45%)38,781 EUR BlackRock ICS Euro Liquidity Fund - Agency (Acc T0) Shares6 3,838 5.56
Total cash equivalents 3,838 5.56Other assets and liabilities 8,739 12.66Net asset value attributable to redeemable shareholders 68,983 100.00
Analysis of total assets % of Total
AssetsTransferable securities admitted to official stock exchange listing 67.92Transferable securities dealt in on another regulated market 0.35Financial derivative instruments dealt in on a regulated market 1.74OTC financial derivative instruments 1.37Other assets 28.62Total assets 100.00 1Prior year percentage of net asset value rounds to 0.00%.2These securities were valued in consultation with the Manager. These securities were fair valued, priced per corporate action terms or suspended at period end and valued using the last traded price.
3Security partially or totally pledged as collateral.4Forward currency contracts held with one counterparty that have the same buy currency, sell currency and maturity date are presented on an aggregate basis where applicable. There is no netting of asset and liability positions.
5 Investments which are less than EUR 500 have been rounded down to zero.6A related party to the Fund.

126
BLACKROCK TAILORED MARKET ADVANTAGE FUND
SCHEDULE OF INVESTMENTS (continued)
As at 31 March 2021
Underlying exposureOn gains EUR '000
On losses EUR '000
Interest rate swaps 9,177 12,575Credit default swaps – 14,152Total return swaps 3,967 16,175Centrally cleared interest rate swaps 3,913 19,690Centrally cleared credit default swaps 23,082 –Swaptions purchased 22,684 –Forward currency contracts 20,989 27,110Futures contracts 21,415 66,668
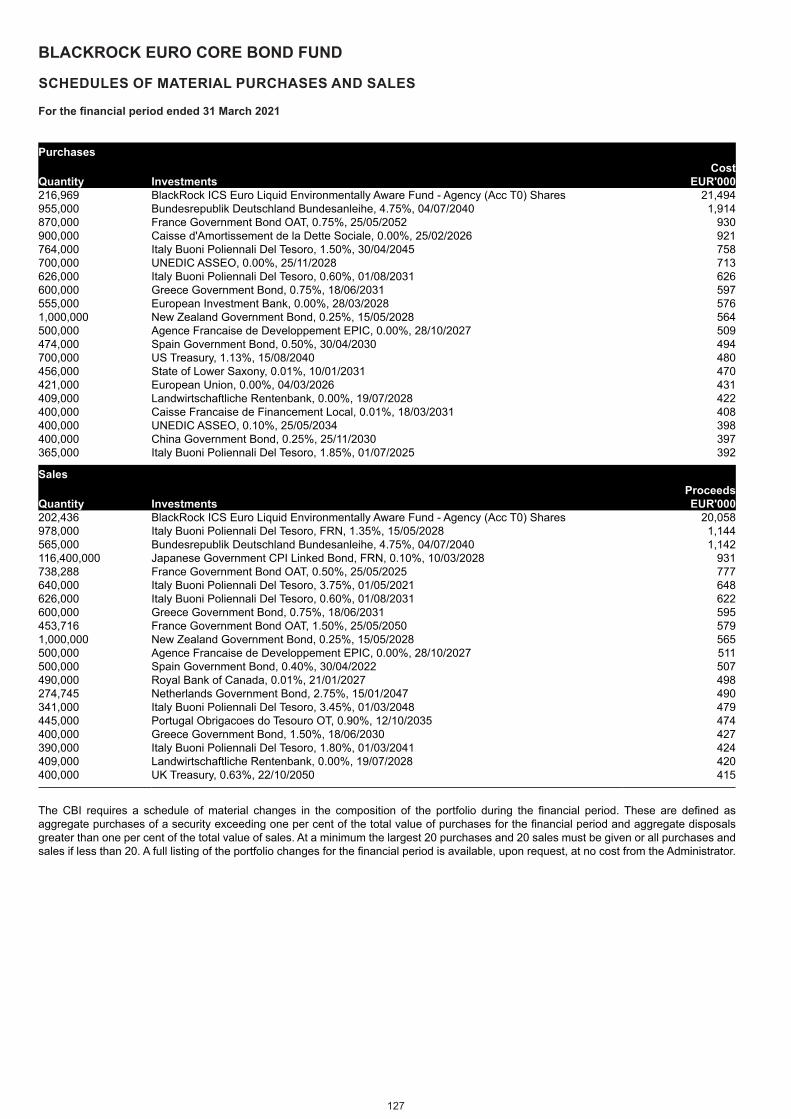
127
BLACKROCK EURO CORE BOND FUND
SCHEDULES OF MATERIAL PURCHASES AND SALES
For the financial period ended 31 March 2021
PurchasesCost
Quantity Investments EUR'000216,969 BlackRock ICS Euro Liquid Environmentally Aware Fund - Agency (Acc T0) Shares 21,494955,000 Bundesrepublik Deutschland Bundesanleihe, 4.75%, 04/07/2040 1,914870,000 France Government Bond OAT, 0.75%, 25/05/2052 930900,000 Caisse d'Amortissement de la Dette Sociale, 0.00%, 25/02/2026 921764,000 Italy Buoni Poliennali Del Tesoro, 1.50%, 30/04/2045 758700,000 UNEDIC ASSEO, 0.00%, 25/11/2028 713626,000 Italy Buoni Poliennali Del Tesoro, 0.60%, 01/08/2031 626600,000 Greece Government Bond, 0.75%, 18/06/2031 597555,000 European Investment Bank, 0.00%, 28/03/2028 5761,000,000 New Zealand Government Bond, 0.25%, 15/05/2028 564500,000 Agence Francaise de Developpement EPIC, 0.00%, 28/10/2027 509474,000 Spain Government Bond, 0.50%, 30/04/2030 494700,000 US Treasury, 1.13%, 15/08/2040 480456,000 State of Lower Saxony, 0.01%, 10/01/2031 470421,000 European Union, 0.00%, 04/03/2026 431409,000 Landwirtschaftliche Rentenbank, 0.00%, 19/07/2028 422400,000 Caisse Francaise de Financement Local, 0.01%, 18/03/2031 408400,000 UNEDIC ASSEO, 0.10%, 25/05/2034 398400,000 China Government Bond, 0.25%, 25/11/2030 397365,000 Italy Buoni Poliennali Del Tesoro, 1.85%, 01/07/2025 392
SalesProceeds
Quantity Investments EUR'000202,436 BlackRock ICS Euro Liquid Environmentally Aware Fund - Agency (Acc T0) Shares 20,058978,000 Italy Buoni Poliennali Del Tesoro, FRN, 1.35%, 15/05/2028 1,144565,000 Bundesrepublik Deutschland Bundesanleihe, 4.75%, 04/07/2040 1,142116,400,000 Japanese Government CPI Linked Bond, FRN, 0.10%, 10/03/2028 931738,288 France Government Bond OAT, 0.50%, 25/05/2025 777640,000 Italy Buoni Poliennali Del Tesoro, 3.75%, 01/05/2021 648626,000 Italy Buoni Poliennali Del Tesoro, 0.60%, 01/08/2031 622600,000 Greece Government Bond, 0.75%, 18/06/2031 595453,716 France Government Bond OAT, 1.50%, 25/05/2050 5791,000,000 New Zealand Government Bond, 0.25%, 15/05/2028 565500,000 Agence Francaise de Developpement EPIC, 0.00%, 28/10/2027 511500,000 Spain Government Bond, 0.40%, 30/04/2022 507490,000 Royal Bank of Canada, 0.01%, 21/01/2027 498274,745 Netherlands Government Bond, 2.75%, 15/01/2047 490341,000 Italy Buoni Poliennali Del Tesoro, 3.45%, 01/03/2048 479445,000 Portugal Obrigacoes do Tesouro OT, 0.90%, 12/10/2035 474400,000 Greece Government Bond, 1.50%, 18/06/2030 427390,000 Italy Buoni Poliennali Del Tesoro, 1.80%, 01/03/2041 424409,000 Landwirtschaftliche Rentenbank, 0.00%, 19/07/2028 420400,000 UK Treasury, 0.63%, 22/10/2050 415
The CBI requires a schedule of material changes in the composition of the portfolio during the financial period. These are defined as aggregate purchases of a security exceeding one per cent of the total value of purchases for the financial period and aggregate disposals greater than one per cent of the total value of sales. At a minimum the largest 20 purchases and 20 sales must be given or all purchases and sales if less than 20. A full listing of the portfolio changes for the financial period is available, upon request, at no cost from the Administrator.
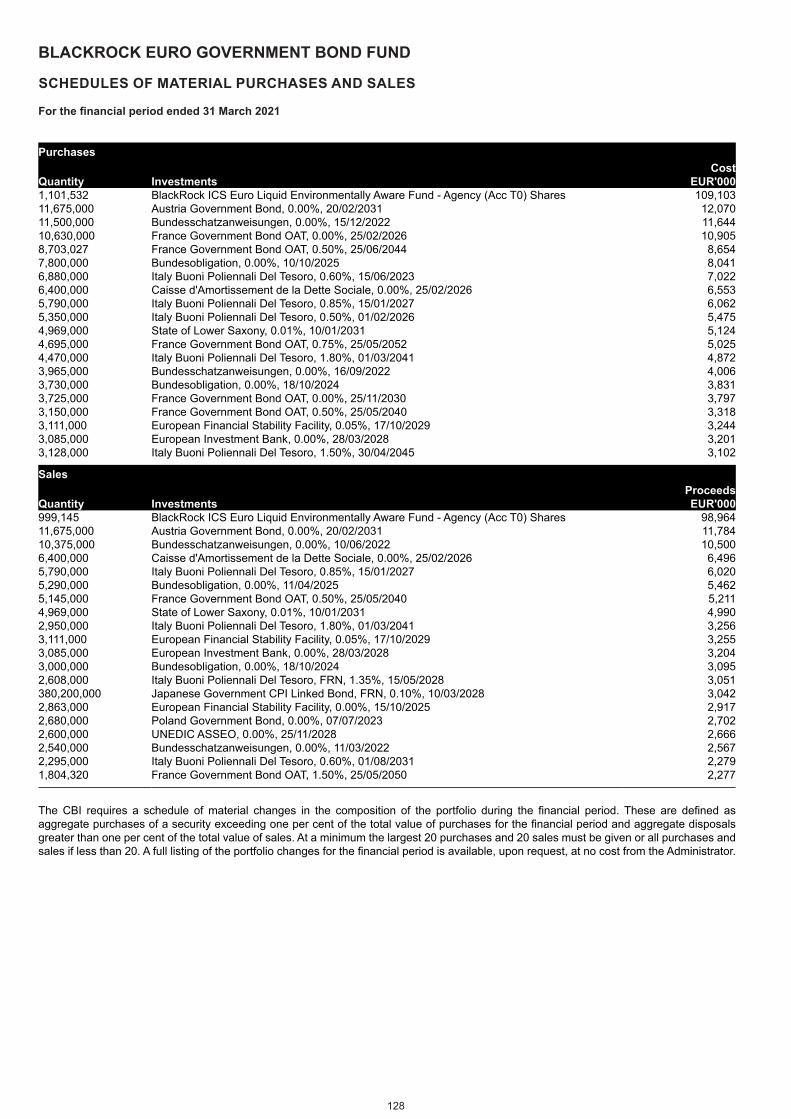
128
BLACKROCK EURO GOVERNMENT BOND FUND
SCHEDULES OF MATERIAL PURCHASES AND SALES
For the financial period ended 31 March 2021
PurchasesCost
Quantity Investments EUR'0001,101,532 BlackRock ICS Euro Liquid Environmentally Aware Fund - Agency (Acc T0) Shares 109,10311,675,000 Austria Government Bond, 0.00%, 20/02/2031 12,07011,500,000 Bundesschatzanweisungen, 0.00%, 15/12/2022 11,64410,630,000 France Government Bond OAT, 0.00%, 25/02/2026 10,9058,703,027 France Government Bond OAT, 0.50%, 25/06/2044 8,6547,800,000 Bundesobligation, 0.00%, 10/10/2025 8,0416,880,000 Italy Buoni Poliennali Del Tesoro, 0.60%, 15/06/2023 7,0226,400,000 Caisse d'Amortissement de la Dette Sociale, 0.00%, 25/02/2026 6,5535,790,000 Italy Buoni Poliennali Del Tesoro, 0.85%, 15/01/2027 6,0625,350,000 Italy Buoni Poliennali Del Tesoro, 0.50%, 01/02/2026 5,4754,969,000 State of Lower Saxony, 0.01%, 10/01/2031 5,1244,695,000 France Government Bond OAT, 0.75%, 25/05/2052 5,0254,470,000 Italy Buoni Poliennali Del Tesoro, 1.80%, 01/03/2041 4,8723,965,000 Bundesschatzanweisungen, 0.00%, 16/09/2022 4,0063,730,000 Bundesobligation, 0.00%, 18/10/2024 3,8313,725,000 France Government Bond OAT, 0.00%, 25/11/2030 3,7973,150,000 France Government Bond OAT, 0.50%, 25/05/2040 3,3183,111,000 European Financial Stability Facility, 0.05%, 17/10/2029 3,2443,085,000 European Investment Bank, 0.00%, 28/03/2028 3,2013,128,000 Italy Buoni Poliennali Del Tesoro, 1.50%, 30/04/2045 3,102
SalesProceeds
Quantity Investments EUR'000999,145 BlackRock ICS Euro Liquid Environmentally Aware Fund - Agency (Acc T0) Shares 98,96411,675,000 Austria Government Bond, 0.00%, 20/02/2031 11,78410,375,000 Bundesschatzanweisungen, 0.00%, 10/06/2022 10,5006,400,000 Caisse d'Amortissement de la Dette Sociale, 0.00%, 25/02/2026 6,4965,790,000 Italy Buoni Poliennali Del Tesoro, 0.85%, 15/01/2027 6,0205,290,000 Bundesobligation, 0.00%, 11/04/2025 5,4625,145,000 France Government Bond OAT, 0.50%, 25/05/2040 5,2114,969,000 State of Lower Saxony, 0.01%, 10/01/2031 4,9902,950,000 Italy Buoni Poliennali Del Tesoro, 1.80%, 01/03/2041 3,2563,111,000 European Financial Stability Facility, 0.05%, 17/10/2029 3,2553,085,000 European Investment Bank, 0.00%, 28/03/2028 3,2043,000,000 Bundesobligation, 0.00%, 18/10/2024 3,0952,608,000 Italy Buoni Poliennali Del Tesoro, FRN, 1.35%, 15/05/2028 3,051380,200,000 Japanese Government CPI Linked Bond, FRN, 0.10%, 10/03/2028 3,0422,863,000 European Financial Stability Facility, 0.00%, 15/10/2025 2,9172,680,000 Poland Government Bond, 0.00%, 07/07/2023 2,7022,600,000 UNEDIC ASSEO, 0.00%, 25/11/2028 2,6662,540,000 Bundesschatzanweisungen, 0.00%, 11/03/2022 2,5672,295,000 Italy Buoni Poliennali Del Tesoro, 0.60%, 01/08/2031 2,2791,804,320 France Government Bond OAT, 1.50%, 25/05/2050 2,277
The CBI requires a schedule of material changes in the composition of the portfolio during the financial period. These are defined as aggregate purchases of a security exceeding one per cent of the total value of purchases for the financial period and aggregate disposals greater than one per cent of the total value of sales. At a minimum the largest 20 purchases and 20 sales must be given or all purchases and sales if less than 20. A full listing of the portfolio changes for the financial period is available, upon request, at no cost from the Administrator.
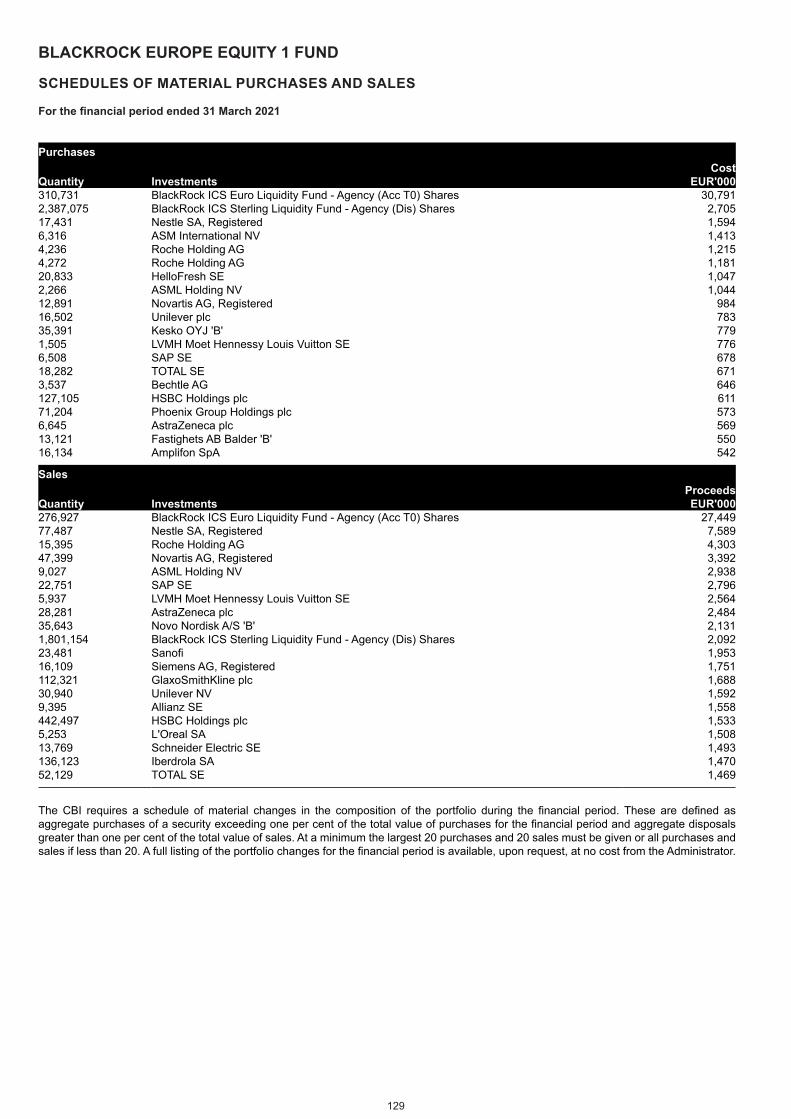
129
BLACKROCK EUROPE EQUITY 1 FUND
SCHEDULES OF MATERIAL PURCHASES AND SALES
For the financial period ended 31 March 2021
PurchasesCost
Quantity Investments EUR'000310,731 BlackRock ICS Euro Liquidity Fund - Agency (Acc T0) Shares 30,7912,387,075 BlackRock ICS Sterling Liquidity Fund - Agency (Dis) Shares 2,70517,431 Nestle SA, Registered 1,5946,316 ASM International NV 1,4134,236 Roche Holding AG 1,2154,272 Roche Holding AG 1,18120,833 HelloFresh SE 1,0472,266 ASML Holding NV 1,04412,891 Novartis AG, Registered 98416,502 Unilever plc 78335,391 Kesko OYJ 'B' 7791,505 LVMH Moet Hennessy Louis Vuitton SE 7766,508 SAP SE 67818,282 TOTAL SE 6713,537 Bechtle AG 646127,105 HSBC Holdings plc 61171,204 Phoenix Group Holdings plc 5736,645 AstraZeneca plc 56913,121 Fastighets AB Balder 'B' 55016,134 Amplifon SpA 542
SalesProceeds
Quantity Investments EUR'000276,927 BlackRock ICS Euro Liquidity Fund - Agency (Acc T0) Shares 27,44977,487 Nestle SA, Registered 7,58915,395 Roche Holding AG 4,30347,399 Novartis AG, Registered 3,3929,027 ASML Holding NV 2,93822,751 SAP SE 2,7965,937 LVMH Moet Hennessy Louis Vuitton SE 2,56428,281 AstraZeneca plc 2,48435,643 Novo Nordisk A/S 'B' 2,1311,801,154 BlackRock ICS Sterling Liquidity Fund - Agency (Dis) Shares 2,09223,481 Sanofi 1,95316,109 Siemens AG, Registered 1,751112,321 GlaxoSmithKline plc 1,68830,940 Unilever NV 1,5929,395 Allianz SE 1,558442,497 HSBC Holdings plc 1,5335,253 L'Oreal SA 1,50813,769 Schneider Electric SE 1,493136,123 Iberdrola SA 1,47052,129 TOTAL SE 1,469
The CBI requires a schedule of material changes in the composition of the portfolio during the financial period. These are defined as aggregate purchases of a security exceeding one per cent of the total value of purchases for the financial period and aggregate disposals greater than one per cent of the total value of sales. At a minimum the largest 20 purchases and 20 sales must be given or all purchases and sales if less than 20. A full listing of the portfolio changes for the financial period is available, upon request, at no cost from the Administrator.
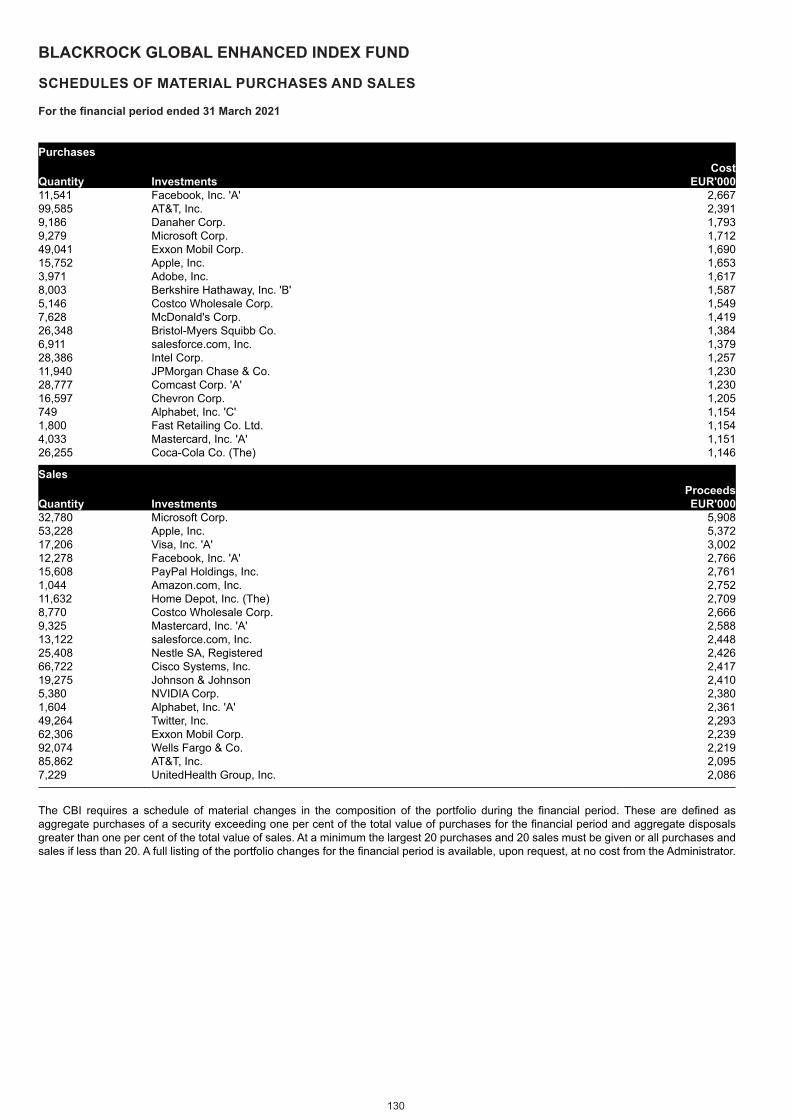
130
BLACKROCK GLOBAL ENHANCED INDEX FUND
SCHEDULES OF MATERIAL PURCHASES AND SALES
For the financial period ended 31 March 2021
PurchasesCost
Quantity Investments EUR'00011,541 Facebook, Inc. 'A' 2,66799,585 AT&T, Inc. 2,3919,186 Danaher Corp. 1,7939,279 Microsoft Corp. 1,71249,041 Exxon Mobil Corp. 1,69015,752 Apple, Inc. 1,6533,971 Adobe, Inc. 1,6178,003 Berkshire Hathaway, Inc. 'B' 1,5875,146 Costco Wholesale Corp. 1,5497,628 McDonald's Corp. 1,41926,348 Bristol-Myers Squibb Co. 1,3846,911 salesforce.com, Inc. 1,37928,386 Intel Corp. 1,25711,940 JPMorgan Chase & Co. 1,23028,777 Comcast Corp. 'A' 1,23016,597 Chevron Corp. 1,205749 Alphabet, Inc. 'C' 1,1541,800 Fast Retailing Co. Ltd. 1,1544,033 Mastercard, Inc. 'A' 1,15126,255 Coca-Cola Co. (The) 1,146
SalesProceeds
Quantity Investments EUR'00032,780 Microsoft Corp. 5,90853,228 Apple, Inc. 5,37217,206 Visa, Inc. 'A' 3,00212,278 Facebook, Inc. 'A' 2,76615,608 PayPal Holdings, Inc. 2,7611,044 Amazon.com, Inc. 2,75211,632 Home Depot, Inc. (The) 2,7098,770 Costco Wholesale Corp. 2,6669,325 Mastercard, Inc. 'A' 2,58813,122 salesforce.com, Inc. 2,44825,408 Nestle SA, Registered 2,42666,722 Cisco Systems, Inc. 2,41719,275 Johnson & Johnson 2,4105,380 NVIDIA Corp. 2,3801,604 Alphabet, Inc. 'A' 2,36149,264 Twitter, Inc. 2,29362,306 Exxon Mobil Corp. 2,23992,074 Wells Fargo & Co. 2,21985,862 AT&T, Inc. 2,0957,229 UnitedHealth Group, Inc. 2,086
The CBI requires a schedule of material changes in the composition of the portfolio during the financial period. These are defined as aggregate purchases of a security exceeding one per cent of the total value of purchases for the financial period and aggregate disposals greater than one per cent of the total value of sales. At a minimum the largest 20 purchases and 20 sales must be given or all purchases and sales if less than 20. A full listing of the portfolio changes for the financial period is available, upon request, at no cost from the Administrator.
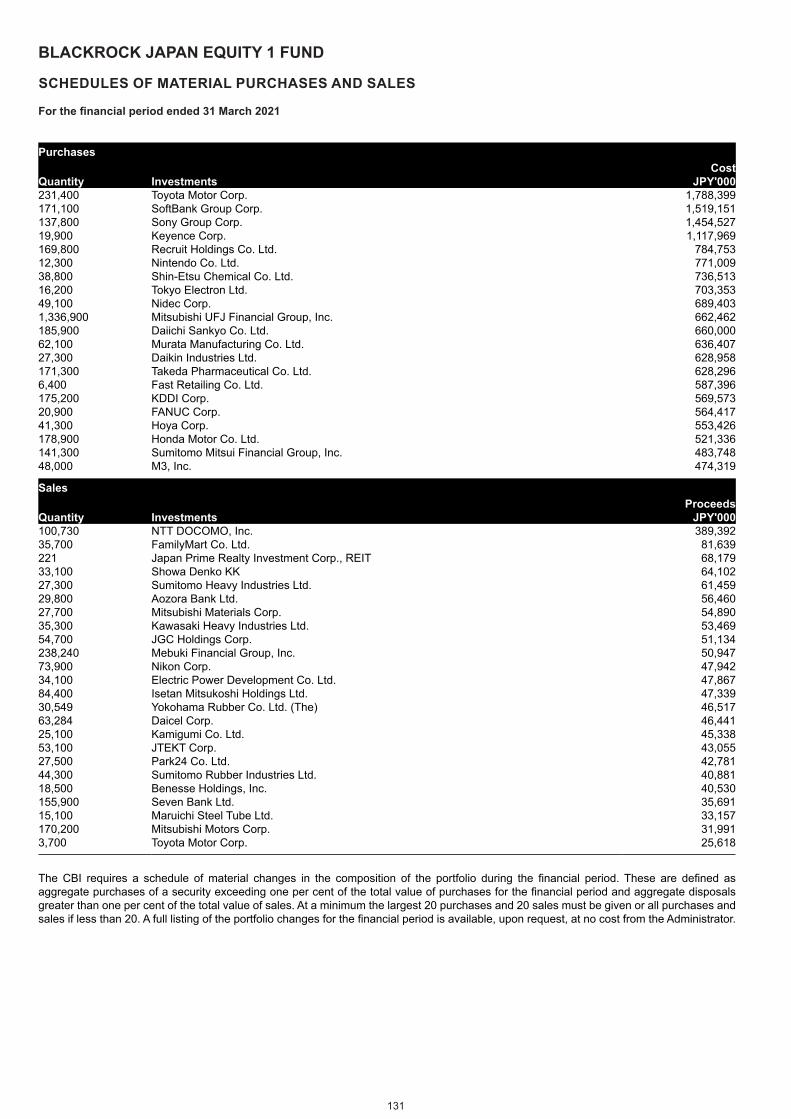
131
BLACKROCK JAPAN EQUITY 1 FUND
SCHEDULES OF MATERIAL PURCHASES AND SALES
For the financial period ended 31 March 2021
PurchasesCost
Quantity Investments JPY'000231,400 Toyota Motor Corp. 1,788,399171,100 SoftBank Group Corp. 1,519,151137,800 Sony Group Corp. 1,454,52719,900 Keyence Corp. 1,117,969169,800 Recruit Holdings Co. Ltd. 784,75312,300 Nintendo Co. Ltd. 771,00938,800 Shin-Etsu Chemical Co. Ltd. 736,51316,200 Tokyo Electron Ltd. 703,35349,100 Nidec Corp. 689,4031,336,900 Mitsubishi UFJ Financial Group, Inc. 662,462185,900 Daiichi Sankyo Co. Ltd. 660,00062,100 Murata Manufacturing Co. Ltd. 636,40727,300 Daikin Industries Ltd. 628,958171,300 Takeda Pharmaceutical Co. Ltd. 628,2966,400 Fast Retailing Co. Ltd. 587,396175,200 KDDI Corp. 569,57320,900 FANUC Corp. 564,41741,300 Hoya Corp. 553,426178,900 Honda Motor Co. Ltd. 521,336141,300 Sumitomo Mitsui Financial Group, Inc. 483,74848,000 M3, Inc. 474,319
SalesProceeds
Quantity Investments JPY'000100,730 NTT DOCOMO, Inc. 389,39235,700 FamilyMart Co. Ltd. 81,639221 Japan Prime Realty Investment Corp., REIT 68,17933,100 Showa Denko KK 64,10227,300 Sumitomo Heavy Industries Ltd. 61,45929,800 Aozora Bank Ltd. 56,46027,700 Mitsubishi Materials Corp. 54,89035,300 Kawasaki Heavy Industries Ltd. 53,46954,700 JGC Holdings Corp. 51,134238,240 Mebuki Financial Group, Inc. 50,94773,900 Nikon Corp. 47,94234,100 Electric Power Development Co. Ltd. 47,86784,400 Isetan Mitsukoshi Holdings Ltd. 47,33930,549 Yokohama Rubber Co. Ltd. (The) 46,51763,284 Daicel Corp. 46,44125,100 Kamigumi Co. Ltd. 45,33853,100 JTEKT Corp. 43,05527,500 Park24 Co. Ltd. 42,78144,300 Sumitomo Rubber Industries Ltd. 40,88118,500 Benesse Holdings, Inc. 40,530155,900 Seven Bank Ltd. 35,69115,100 Maruichi Steel Tube Ltd. 33,157170,200 Mitsubishi Motors Corp. 31,9913,700 Toyota Motor Corp. 25,618
The CBI requires a schedule of material changes in the composition of the portfolio during the financial period. These are defined as aggregate purchases of a security exceeding one per cent of the total value of purchases for the financial period and aggregate disposals greater than one per cent of the total value of sales. At a minimum the largest 20 purchases and 20 sales must be given or all purchases and sales if less than 20. A full listing of the portfolio changes for the financial period is available, upon request, at no cost from the Administrator.
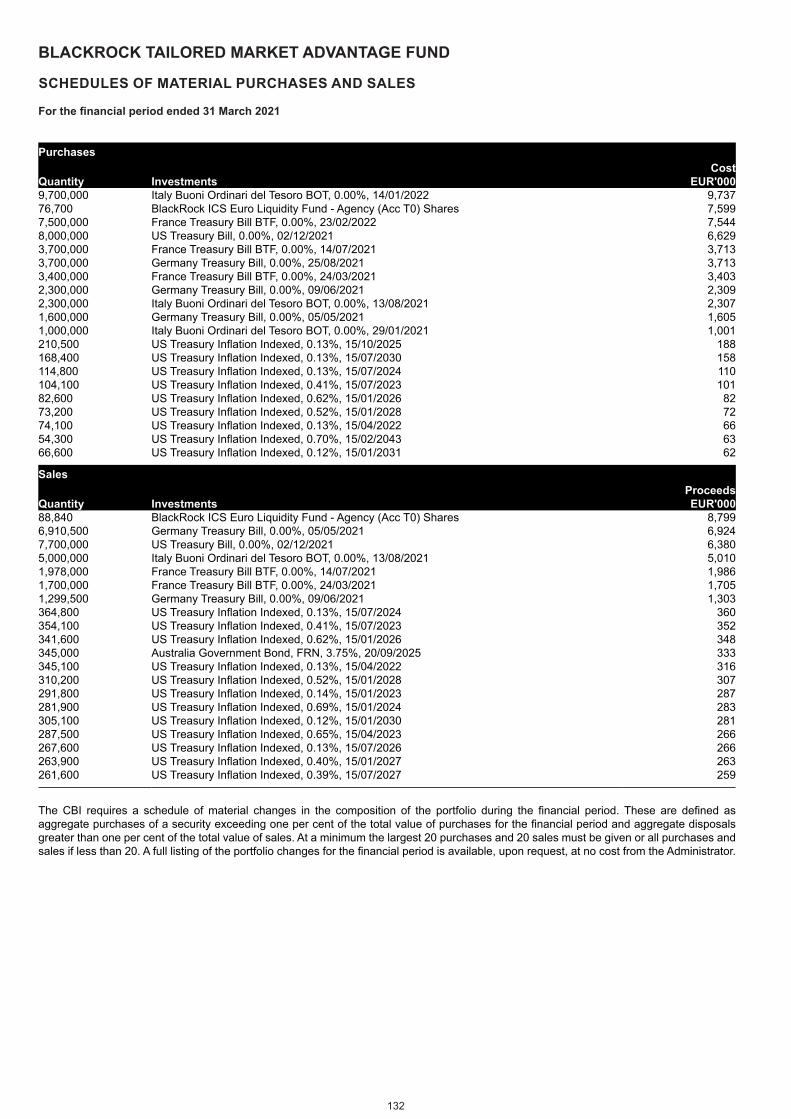
132
BLACKROCK TAILORED MARKET ADVANTAGE FUND
SCHEDULES OF MATERIAL PURCHASES AND SALES
For the financial period ended 31 March 2021
PurchasesCost
Quantity Investments EUR'0009,700,000 Italy Buoni Ordinari del Tesoro BOT, 0.00%, 14/01/2022 9,73776,700 BlackRock ICS Euro Liquidity Fund - Agency (Acc T0) Shares 7,5997,500,000 France Treasury Bill BTF, 0.00%, 23/02/2022 7,5448,000,000 US Treasury Bill, 0.00%, 02/12/2021 6,6293,700,000 France Treasury Bill BTF, 0.00%, 14/07/2021 3,7133,700,000 Germany Treasury Bill, 0.00%, 25/08/2021 3,7133,400,000 France Treasury Bill BTF, 0.00%, 24/03/2021 3,4032,300,000 Germany Treasury Bill, 0.00%, 09/06/2021 2,3092,300,000 Italy Buoni Ordinari del Tesoro BOT, 0.00%, 13/08/2021 2,3071,600,000 Germany Treasury Bill, 0.00%, 05/05/2021 1,6051,000,000 Italy Buoni Ordinari del Tesoro BOT, 0.00%, 29/01/2021 1,001210,500 US Treasury Inflation Indexed, 0.13%, 15/10/2025 188168,400 US Treasury Inflation Indexed, 0.13%, 15/07/2030 158114,800 US Treasury Inflation Indexed, 0.13%, 15/07/2024 110104,100 US Treasury Inflation Indexed, 0.41%, 15/07/2023 10182,600 US Treasury Inflation Indexed, 0.62%, 15/01/2026 8273,200 US Treasury Inflation Indexed, 0.52%, 15/01/2028 7274,100 US Treasury Inflation Indexed, 0.13%, 15/04/2022 6654,300 US Treasury Inflation Indexed, 0.70%, 15/02/2043 6366,600 US Treasury Inflation Indexed, 0.12%, 15/01/2031 62
SalesProceeds
Quantity Investments EUR'00088,840 BlackRock ICS Euro Liquidity Fund - Agency (Acc T0) Shares 8,7996,910,500 Germany Treasury Bill, 0.00%, 05/05/2021 6,9247,700,000 US Treasury Bill, 0.00%, 02/12/2021 6,3805,000,000 Italy Buoni Ordinari del Tesoro BOT, 0.00%, 13/08/2021 5,0101,978,000 France Treasury Bill BTF, 0.00%, 14/07/2021 1,9861,700,000 France Treasury Bill BTF, 0.00%, 24/03/2021 1,7051,299,500 Germany Treasury Bill, 0.00%, 09/06/2021 1,303364,800 US Treasury Inflation Indexed, 0.13%, 15/07/2024 360354,100 US Treasury Inflation Indexed, 0.41%, 15/07/2023 352341,600 US Treasury Inflation Indexed, 0.62%, 15/01/2026 348345,000 Australia Government Bond, FRN, 3.75%, 20/09/2025 333345,100 US Treasury Inflation Indexed, 0.13%, 15/04/2022 316310,200 US Treasury Inflation Indexed, 0.52%, 15/01/2028 307291,800 US Treasury Inflation Indexed, 0.14%, 15/01/2023 287281,900 US Treasury Inflation Indexed, 0.69%, 15/01/2024 283305,100 US Treasury Inflation Indexed, 0.12%, 15/01/2030 281287,500 US Treasury Inflation Indexed, 0.65%, 15/04/2023 266267,600 US Treasury Inflation Indexed, 0.13%, 15/07/2026 266263,900 US Treasury Inflation Indexed, 0.40%, 15/01/2027 263261,600 US Treasury Inflation Indexed, 0.39%, 15/07/2027 259
The CBI requires a schedule of material changes in the composition of the portfolio during the financial period. These are defined as aggregate purchases of a security exceeding one per cent of the total value of purchases for the financial period and aggregate disposals greater than one per cent of the total value of sales. At a minimum the largest 20 purchases and 20 sales must be given or all purchases and sales if less than 20. A full listing of the portfolio changes for the financial period is available, upon request, at no cost from the Administrator.

133
BLACKROCK INSTITUTIONAL POOLED FUNDS PLCTRANSACTIONS WITH CONNECTED PERSONS
In accordance with the requirements of the CBI, the Manager shall ensure that any transactions carried out between each Fund and the Manager or Depositary to a Fund, the delegates or sub-delegates of the Manager or Depositary (excluding any non-group company sub-custodians appointed by a Depositary) and any associated or group company of the Manager, Depositary, delegate or sub-delegate (“Connected Persons”) must be conducted at arm’s length and in the best interests of the shareholders.
The Directors are satisfied that there are arrangements in place, as evidenced by written procedures, to ensure that the obligations set out above are applied to all transactions with Connected Persons and that transactions with Connected Persons entered into during the financial period complied with this obligation.
SOFT COMMISSIONS
There were no soft commission arrangements entered into by the Investment Manager on behalf of each Fund during the financial period ended 31 March 2021.
CROSS INVESTMENTS
As at 31 March 2021, there were no cross umbrella investments held by any Fund within the Entity.
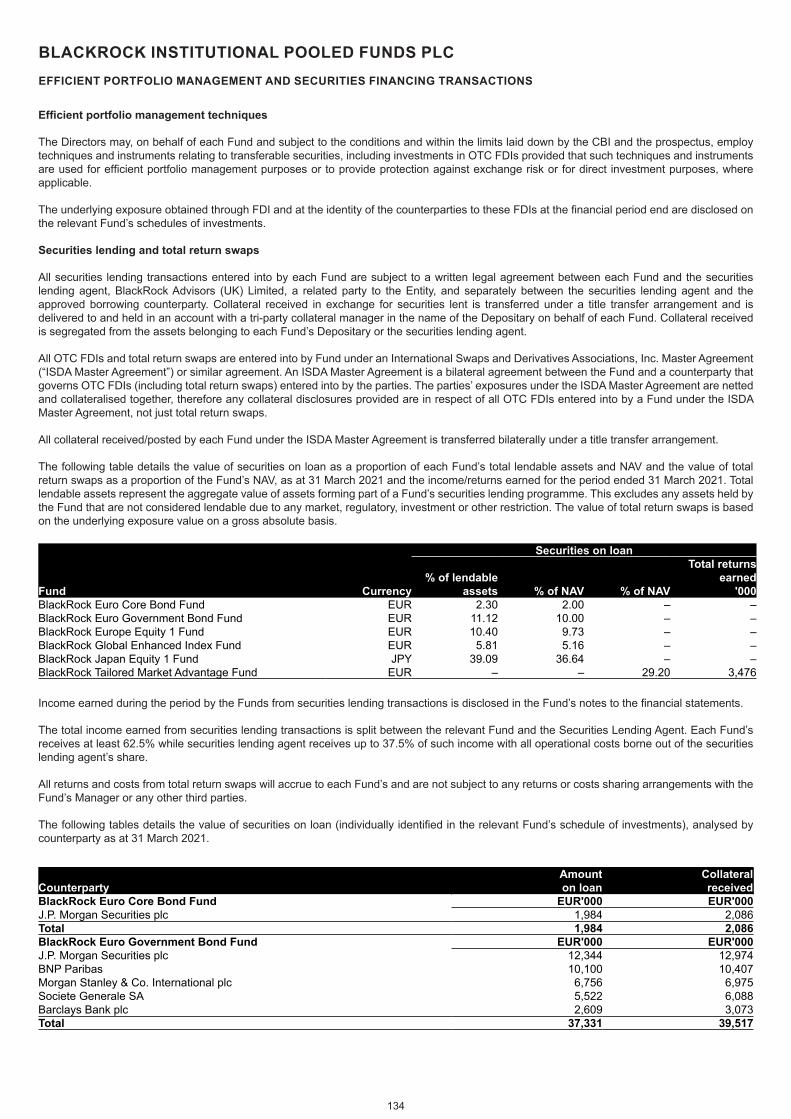
134
BLACKROCK INSTITUTIONAL POOLED FUNDS PLCEFFICIENT PORTFOLIO MANAGEMENT AND SECURITIES FINANCING TRANSACTIONS
Efficient portfolio management techniques
The Directors may, on behalf of each Fund and subject to the conditions and within the limits laid down by the CBI and the prospectus, employ techniques and instruments relating to transferable securities, including investments in OTC FDIs provided that such techniques and instruments are used for efficient portfolio management purposes or to provide protection against exchange risk or for direct investment purposes, where applicable.
The underlying exposure obtained through FDI and at the identity of the counterparties to these FDIs at the financial period end are disclosed on the relevant Fund’s schedules of investments.
Securities lending and total return swaps
All securities lending transactions entered into by each Fund are subject to a written legal agreement between each Fund and the securities lending agent, BlackRock Advisors (UK) Limited, a related party to the Entity, and separately between the securities lending agent and the approved borrowing counterparty. Collateral received in exchange for securities lent is transferred under a title transfer arrangement and is delivered to and held in an account with a tri-party collateral manager in the name of the Depositary on behalf of each Fund. Collateral received is segregated from the assets belonging to each Fund’s Depositary or the securities lending agent.
All OTC FDIs and total return swaps are entered into by Fund under an International Swaps and Derivatives Associations, Inc. Master Agreement (“ISDA Master Agreement”) or similar agreement. An ISDA Master Agreement is a bilateral agreement between the Fund and a counterparty that governs OTC FDIs (including total return swaps) entered into by the parties. The parties’ exposures under the ISDA Master Agreement are netted and collateralised together, therefore any collateral disclosures provided are in respect of all OTC FDIs entered into by a Fund under the ISDA Master Agreement, not just total return swaps.
All collateral received/posted by each Fund under the ISDA Master Agreement is transferred bilaterally under a title transfer arrangement.
The following table details the value of securities on loan as a proportion of each Fund’s total lendable assets and NAV and the value of total return swaps as a proportion of the Fund’s NAV, as at 31 March 2021 and the income/returns earned for the period ended 31 March 2021. Total lendable assets represent the aggregate value of assets forming part of a Fund’s securities lending programme. This excludes any assets held by the Fund that are not considered lendable due to any market, regulatory, investment or other restriction. The value of total return swaps is based on the underlying exposure value on a gross absolute basis.
Securities on loan
Fund Currency% of lendable
assets % of NAV % of NAV
Total returns earned
'000BlackRock Euro Core Bond Fund EUR 2.30 2.00 – –BlackRock Euro Government Bond Fund EUR 11.12 10.00 – –BlackRock Europe Equity 1 Fund EUR 10.40 9.73 – –BlackRock Global Enhanced Index Fund EUR 5.81 5.16 – –BlackRock Japan Equity 1 Fund JPY 39.09 36.64 – –BlackRock Tailored Market Advantage Fund EUR – – 29.20 3,476
Income earned during the period by the Funds from securities lending transactions is disclosed in the Fund’s notes to the financial statements.
The total income earned from securities lending transactions is split between the relevant Fund and the Securities Lending Agent. Each Fund’s receives at least 62.5% while securities lending agent receives up to 37.5% of such income with all operational costs borne out of the securities lending agent’s share.
All returns and costs from total return swaps will accrue to each Fund’s and are not subject to any returns or costs sharing arrangements with the Fund’s Manager or any other third parties.
The following tables details the value of securities on loan (individually identified in the relevant Fund’s schedule of investments), analysed by counterparty as at 31 March 2021.
CounterpartyAmount on loan
Collateral received
BlackRock Euro Core Bond Fund EUR'000 EUR'000J.P. Morgan Securities plc 1,984 2,086Total 1,984 2,086BlackRock Euro Government Bond Fund EUR'000 EUR'000J.P. Morgan Securities plc 12,344 12,974BNP Paribas 10,100 10,407Morgan Stanley & Co. International plc 6,756 6,975Societe Generale SA 5,522 6,088Barclays Bank plc 2,609 3,073Total 37,331 39,517
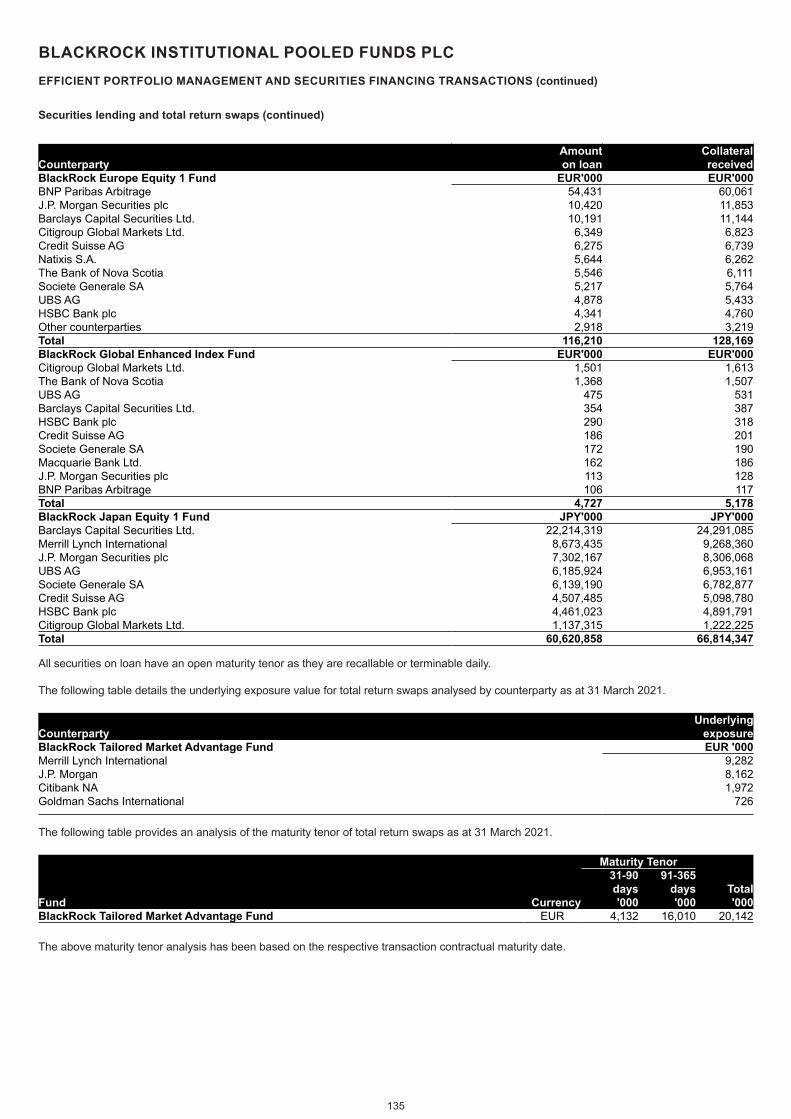
135
BLACKROCK INSTITUTIONAL POOLED FUNDS PLCEFFICIENT PORTFOLIO MANAGEMENT AND SECURITIES FINANCING TRANSACTIONS (continued)
CounterpartyAmount on loan
Collateral received
BlackRock Europe Equity 1 Fund EUR'000 EUR'000BNP Paribas Arbitrage 54,431 60,061J.P. Morgan Securities plc 10,420 11,853Barclays Capital Securities Ltd. 10,191 11,144Citigroup Global Markets Ltd. 6,349 6,823Credit Suisse AG 6,275 6,739Natixis S.A. 5,644 6,262The Bank of Nova Scotia 5,546 6,111Societe Generale SA 5,217 5,764UBS AG 4,878 5,433HSBC Bank plc 4,341 4,760Other counterparties 2,918 3,219Total 116,210 128,169BlackRock Global Enhanced Index Fund EUR'000 EUR'000Citigroup Global Markets Ltd. 1,501 1,613The Bank of Nova Scotia 1,368 1,507UBS AG 475 531Barclays Capital Securities Ltd. 354 387HSBC Bank plc 290 318Credit Suisse AG 186 201Societe Generale SA 172 190Macquarie Bank Ltd. 162 186J.P. Morgan Securities plc 113 128BNP Paribas Arbitrage 106 117Total 4,727 5,178BlackRock Japan Equity 1 Fund JPY'000 JPY'000Barclays Capital Securities Ltd. 22,214,319 24,291,085Merrill Lynch International 8,673,435 9,268,360J.P. Morgan Securities plc 7,302,167 8,306,068UBS AG 6,185,924 6,953,161Societe Generale SA 6,139,190 6,782,877Credit Suisse AG 4,507,485 5,098,780HSBC Bank plc 4,461,023 4,891,791Citigroup Global Markets Ltd. 1,137,315 1,222,225Total 60,620,858 66,814,347
All securities on loan have an open maturity tenor as they are recallable or terminable daily.
The following table details the underlying exposure value for total return swaps analysed by counterparty as at 31 March 2021.
CounterpartyUnderlying
exposureBlackRock Tailored Market Advantage Fund EUR '000Merrill Lynch International 9,282J.P. Morgan 8,162Citibank NA 1,972Goldman Sachs International 726
The following table provides an analysis of the maturity tenor of total return swaps as at 31 March 2021.
Maturity Tenor
Fund Currency
31-90 days '000
91-365 days '000
Total '000
BlackRock Tailored Market Advantage Fund EUR 4,132 16,010 20,142
The above maturity tenor analysis has been based on the respective transaction contractual maturity date.
Securities lending and total return swaps (continued)
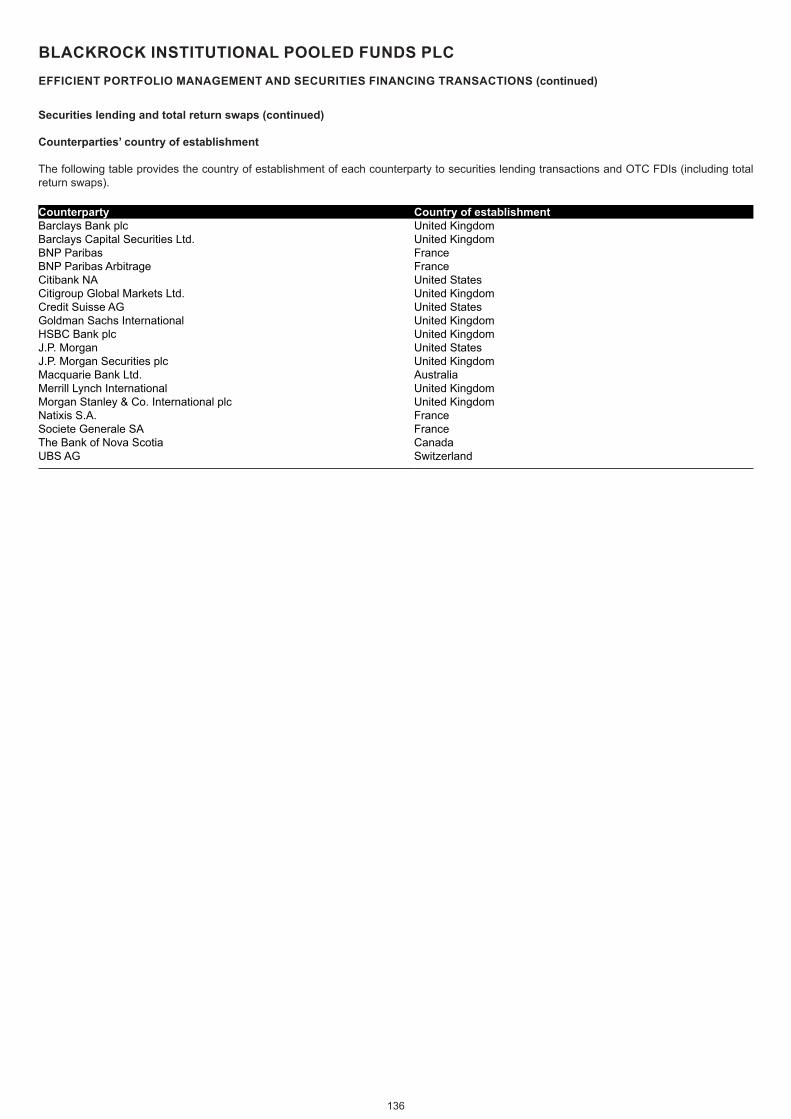
136
BLACKROCK INSTITUTIONAL POOLED FUNDS PLCEFFICIENT PORTFOLIO MANAGEMENT AND SECURITIES FINANCING TRANSACTIONS (continued)
Counterparties’ country of establishment
The following table provides the country of establishment of each counterparty to securities lending transactions and OTC FDIs (including total return swaps).
Counterparty Country of establishmentBarclays Bank plc United KingdomBarclays Capital Securities Ltd. United KingdomBNP Paribas FranceBNP Paribas Arbitrage FranceCitibank NA United StatesCitigroup Global Markets Ltd. United KingdomCredit Suisse AG United StatesGoldman Sachs International United KingdomHSBC Bank plc United KingdomJ.P. Morgan United StatesJ.P. Morgan Securities plc United KingdomMacquarie Bank Ltd. AustraliaMerrill Lynch International United KingdomMorgan Stanley & Co. International plc United KingdomNatixis S.A. FranceSociete Generale SA FranceThe Bank of Nova Scotia CanadaUBS AG Switzerland
Securities lending and total return swaps (continued)
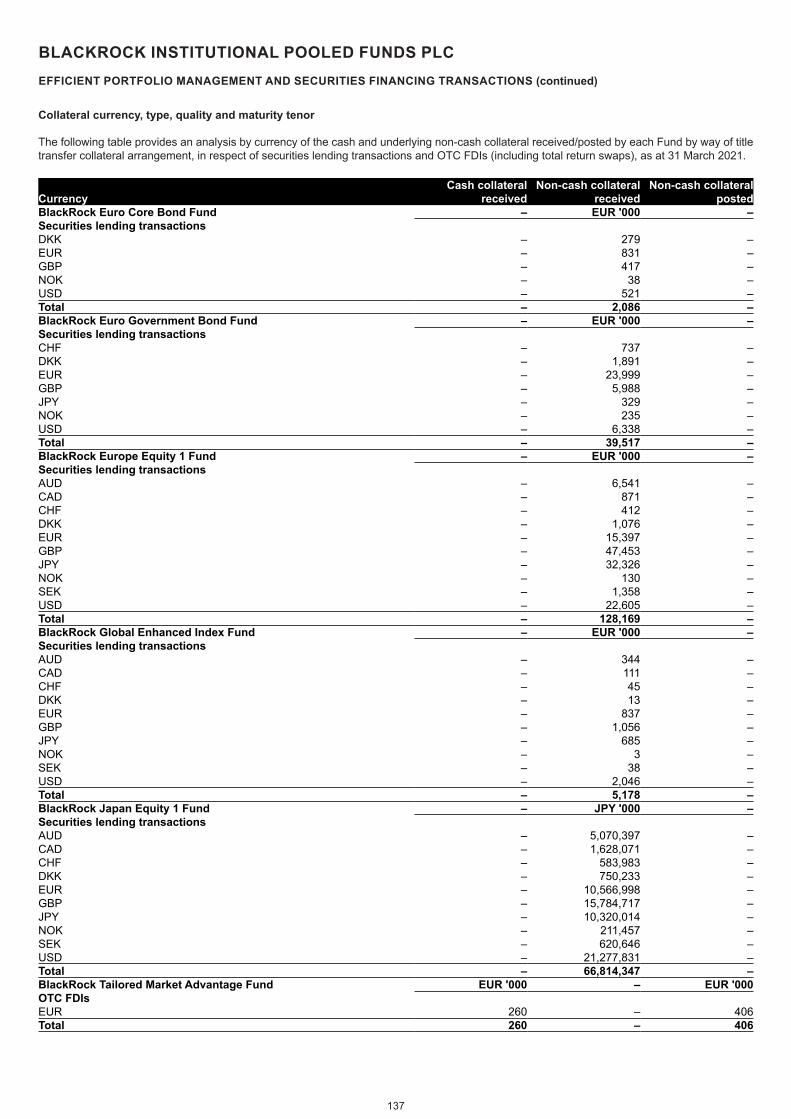
137
BLACKROCK INSTITUTIONAL POOLED FUNDS PLCEFFICIENT PORTFOLIO MANAGEMENT AND SECURITIES FINANCING TRANSACTIONS (continued)
Collateral currency, type, quality and maturity tenor
The following table provides an analysis by currency of the cash and underlying non-cash collateral received/posted by each Fund by way of title transfer collateral arrangement, in respect of securities lending transactions and OTC FDIs (including total return swaps), as at 31 March 2021.
CurrencyCash collateral
receivedNon-cash collateral
receivedNon-cash collateral
postedBlackRock Euro Core Bond Fund – EUR '000 –Securities lending transactionsDKK – 279 –EUR – 831 –GBP – 417 –NOK – 38 –USD – 521 –Total – 2,086 –BlackRock Euro Government Bond Fund – EUR '000 –Securities lending transactionsCHF – 737 –DKK – 1,891 –EUR – 23,999 –GBP – 5,988 –JPY – 329 –NOK – 235 –USD – 6,338 –Total – 39,517 –BlackRock Europe Equity 1 Fund – EUR '000 –Securities lending transactionsAUD – 6,541 –CAD – 871 –CHF – 412 –DKK – 1,076 –EUR – 15,397 –GBP – 47,453 –JPY – 32,326 –NOK – 130 –SEK – 1,358 –USD – 22,605 –Total – 128,169 –BlackRock Global Enhanced Index Fund – EUR '000 –Securities lending transactionsAUD – 344 –CAD – 111 –CHF – 45 –DKK – 13 –EUR – 837 –GBP – 1,056 –JPY – 685 –NOK – 3 –SEK – 38 –USD – 2,046 –Total – 5,178 –BlackRock Japan Equity 1 Fund – JPY '000 –Securities lending transactionsAUD – 5,070,397 –CAD – 1,628,071 –CHF – 583,983 –DKK – 750,233 –EUR – 10,566,998 –GBP – 15,784,717 –JPY – 10,320,014 –NOK – 211,457 –SEK – 620,646 –USD – 21,277,831 –Total – 66,814,347 –BlackRock Tailored Market Advantage Fund EUR '000 – EUR '000OTC FDIsEUR 260 – 406Total 260 – 406
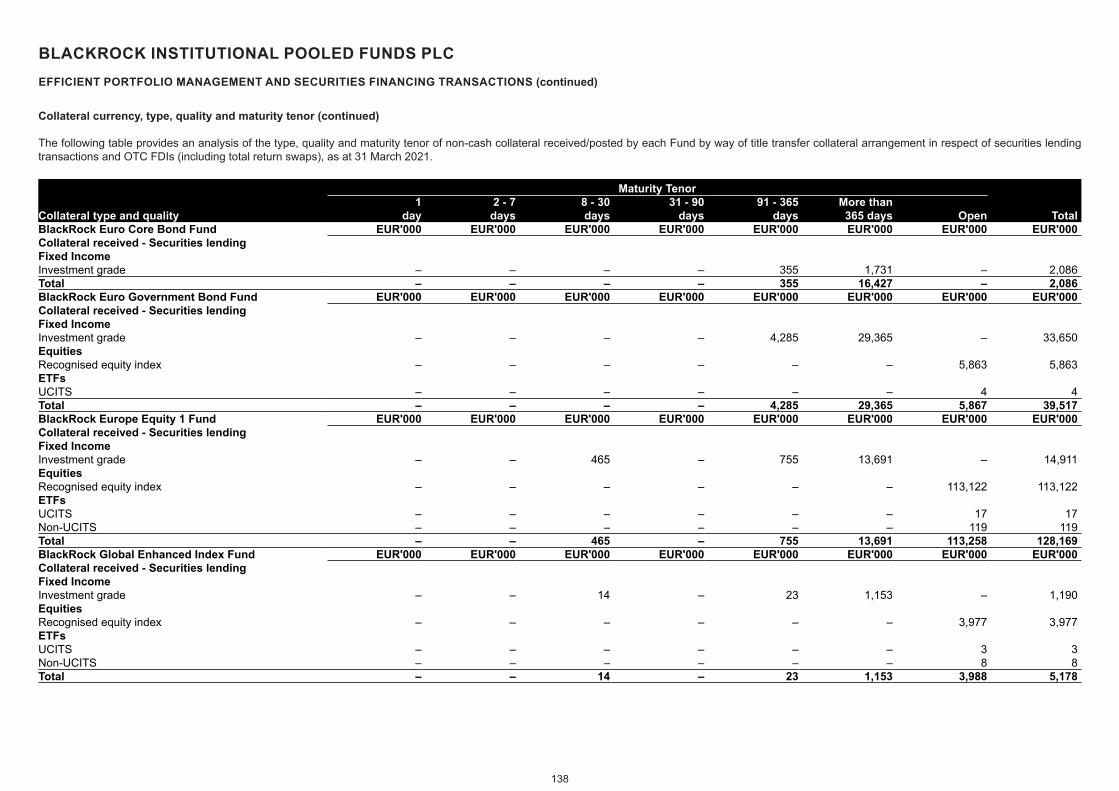
BLACKROCK INSTITUTIONAL POOLED FUNDS PLCEFFICIENT PORTFOLIO MANAGEMENT AND SECURITIES FINANCING TRANSACTIONS (continued)
138
The following table provides an analysis of the type, quality and maturity tenor of non-cash collateral received/posted by each Fund by way of title transfer collateral arrangement in respect of securities lending transactions and OTC FDIs (including total return swaps), as at 31 March 2021.
Maturity Tenor
Collateral type and quality31 - 91
day2 - 7
days8 - 30 days
31 - 90 days
91 - 365 days
More than 365 days Open Total
BlackRock Euro Core Bond Fund EUR'000 EUR'000 EUR'000 EUR'000 EUR'000 EUR'000 EUR'000 EUR'000Collateral received - Securities lendingFixed IncomeInvestment grade – – – – 355 1,731 – 2,086Total – – – – 355 16,427 – 2,086BlackRock Euro Government Bond Fund EUR'000 EUR'000 EUR'000 EUR'000 EUR'000 EUR'000 EUR'000 EUR'000Collateral received - Securities lendingFixed IncomeInvestment grade – – – – 4,285 29,365 – 33,650EquitiesRecognised equity index – – – – – – 5,863 5,863ETFsUCITS – – – – – – 4 4Total – – – – 4,285 29,365 5,867 39,517BlackRock Europe Equity 1 Fund EUR'000 EUR'000 EUR'000 EUR'000 EUR'000 EUR'000 EUR'000 EUR'000Collateral received - Securities lendingFixed IncomeInvestment grade – – 465 – 755 13,691 – 14,911EquitiesRecognised equity index – – – – – – 113,122 113,122ETFsUCITS – – – – – – 17 17Non-UCITS – – – – – – 119 119Total – – 465 – 755 13,691 113,258 128,169BlackRock Global Enhanced Index Fund EUR'000 EUR'000 EUR'000 EUR'000 EUR'000 EUR'000 EUR'000 EUR'000Collateral received - Securities lendingFixed IncomeInvestment grade – – 14 – 23 1,153 – 1,190EquitiesRecognised equity index – – – – – – 3,977 3,977ETFsUCITS – – – – – – 3 3Non-UCITS – – – – – – 8 8Total – – 14 – 23 1,153 3,988 5,178
Collateral currency, type, quality and maturity tenor (continued)
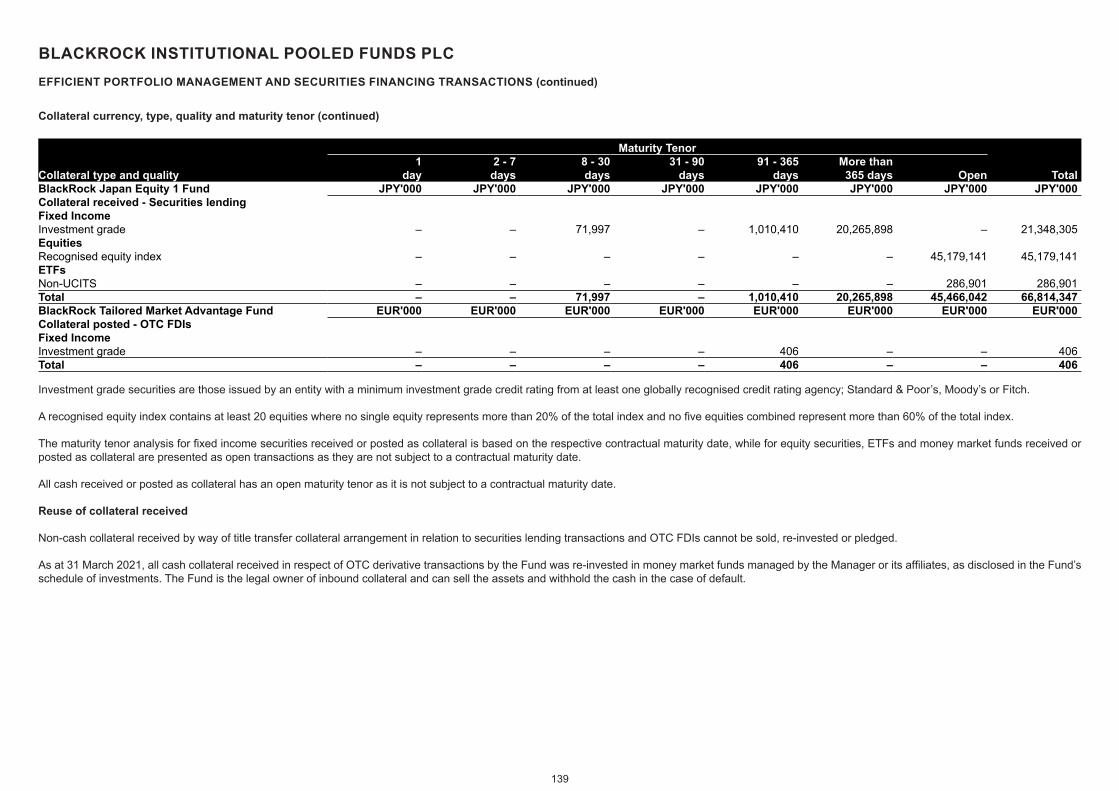
BLACKROCK INSTITUTIONAL POOLED FUNDS PLCEFFICIENT PORTFOLIO MANAGEMENT AND SECURITIES FINANCING TRANSACTIONS (continued)
139
Maturity Tenor
Collateral type and quality31 - 91
day2 - 7
days8 - 30 days
31 - 90 days
91 - 365 days
More than 365 days Open Total
BlackRock Japan Equity 1 Fund JPY'000 JPY'000 JPY'000 JPY'000 JPY'000 JPY'000 JPY'000 JPY'000Collateral received - Securities lendingFixed IncomeInvestment grade – – 71,997 – 1,010,410 20,265,898 – 21,348,305EquitiesRecognised equity index – – – – – – 45,179,141 45,179,141ETFsNon-UCITS – – – – – – 286,901 286,901Total – – 71,997 – 1,010,410 20,265,898 45,466,042 66,814,347BlackRock Tailored Market Advantage Fund EUR'000 EUR'000 EUR'000 EUR'000 EUR'000 EUR'000 EUR'000 EUR'000Collateral posted - OTC FDIsFixed IncomeInvestment grade – – – – 406 – – 406Total – – – – 406 – – 406
Investment grade securities are those issued by an entity with a minimum investment grade credit rating from at least one globally recognised credit rating agency; Standard & Poor’s, Moody’s or Fitch.
A recognised equity index contains at least 20 equities where no single equity represents more than 20% of the total index and no five equities combined represent more than 60% of the total index.
The maturity tenor analysis for fixed income securities received or posted as collateral is based on the respective contractual maturity date, while for equity securities, ETFs and money market funds received or posted as collateral are presented as open transactions as they are not subject to a contractual maturity date.
All cash received or posted as collateral has an open maturity tenor as it is not subject to a contractual maturity date.
Reuse of collateral received
Non-cash collateral received by way of title transfer collateral arrangement in relation to securities lending transactions and OTC FDIs cannot be sold, re-invested or pledged.
As at 31 March 2021, all cash collateral received in respect of OTC derivative transactions by the Fund was re-invested in money market funds managed by the Manager or its affiliates, as disclosed in the Fund’s schedule of investments. The Fund is the legal owner of inbound collateral and can sell the assets and withhold the cash in the case of default.
Collateral currency, type, quality and maturity tenor (continued)
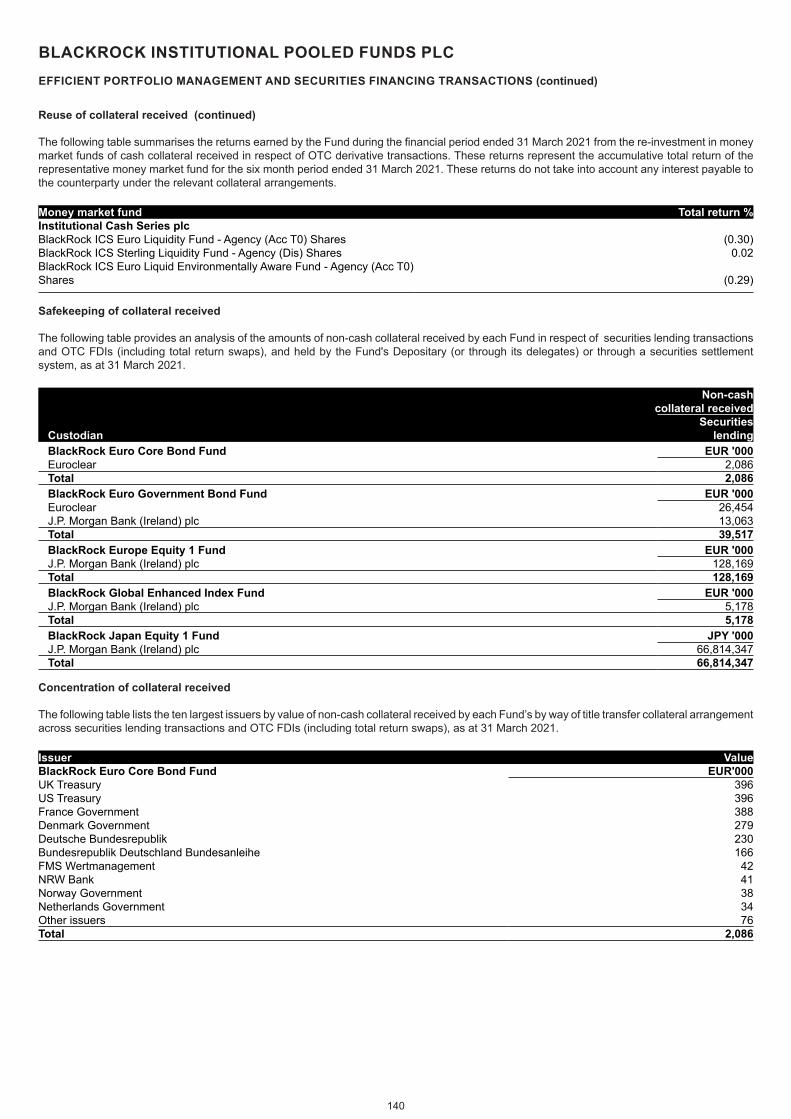
140
BLACKROCK INSTITUTIONAL POOLED FUNDS PLCEFFICIENT PORTFOLIO MANAGEMENT AND SECURITIES FINANCING TRANSACTIONS (continued)
The following table summarises the returns earned by the Fund during the financial period ended 31 March 2021 from the re-investment in money market funds of cash collateral received in respect of OTC derivative transactions. These returns represent the accumulative total return of the representative money market fund for the six month period ended 31 March 2021. These returns do not take into account any interest payable to the counterparty under the relevant collateral arrangements.
Money market fund Total return %Institutional Cash Series plcBlackRock ICS Euro Liquidity Fund - Agency (Acc T0) Shares (0.30)BlackRock ICS Sterling Liquidity Fund - Agency (Dis) Shares 0.02BlackRock ICS Euro Liquid Environmentally Aware Fund - Agency (Acc T0) Shares (0.29)
Safekeeping of collateral received
The following table provides an analysis of the amounts of non-cash collateral received by each Fund in respect of securities lending transactions and OTC FDIs (including total return swaps), and held by the Fund's Depositary (or through its delegates) or through a securities settlement system, as at 31 March 2021.
Non-cash collateral received
CustodianSecurities
lendingBlackRock Euro Core Bond Fund EUR '000Euroclear 2,086Total 2,086BlackRock Euro Government Bond Fund EUR '000Euroclear 26,454J.P. Morgan Bank (Ireland) plc 13,063Total 39,517BlackRock Europe Equity 1 Fund EUR '000J.P. Morgan Bank (Ireland) plc 128,169Total 128,169BlackRock Global Enhanced Index Fund EUR '000J.P. Morgan Bank (Ireland) plc 5,178Total 5,178BlackRock Japan Equity 1 Fund JPY '000J.P. Morgan Bank (Ireland) plc 66,814,347Total 66,814,347
Concentration of collateral received
The following table lists the ten largest issuers by value of non-cash collateral received by each Fund’s by way of title transfer collateral arrangement across securities lending transactions and OTC FDIs (including total return swaps), as at 31 March 2021.
Issuer ValueBlackRock Euro Core Bond Fund EUR'000UK Treasury 396US Treasury 396France Government 388Denmark Government 279Deutsche Bundesrepublik 230Bundesrepublik Deutschland Bundesanleihe 166FMS Wertmanagement 42NRW Bank 41Norway Government 38Netherlands Government 34Other issuers 76Total 2,086
Reuse of collateral received (continued)
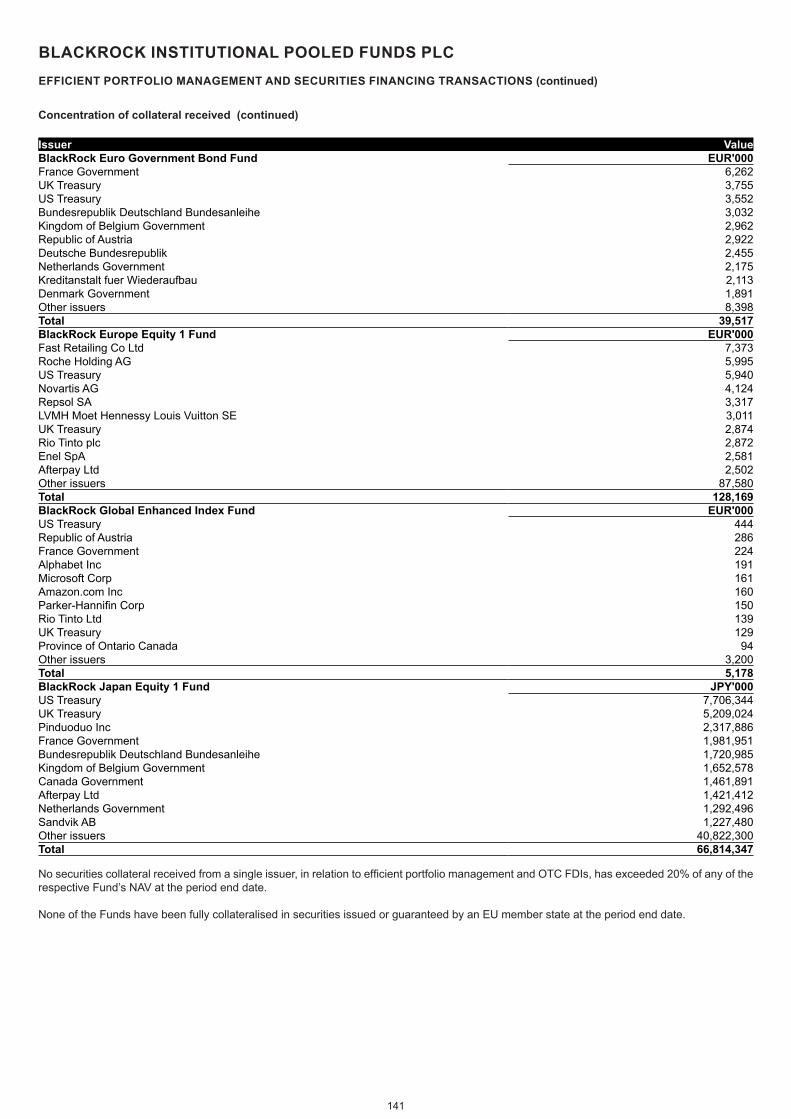
141
BLACKROCK INSTITUTIONAL POOLED FUNDS PLCEFFICIENT PORTFOLIO MANAGEMENT AND SECURITIES FINANCING TRANSACTIONS (continued)
Issuer ValueBlackRock Euro Government Bond Fund EUR'000France Government 6,262UK Treasury 3,755US Treasury 3,552Bundesrepublik Deutschland Bundesanleihe 3,032Kingdom of Belgium Government 2,962Republic of Austria 2,922Deutsche Bundesrepublik 2,455Netherlands Government 2,175Kreditanstalt fuer Wiederaufbau 2,113Denmark Government 1,891Other issuers 8,398Total 39,517BlackRock Europe Equity 1 Fund EUR'000Fast Retailing Co Ltd 7,373Roche Holding AG 5,995US Treasury 5,940Novartis AG 4,124Repsol SA 3,317LVMH Moet Hennessy Louis Vuitton SE 3,011UK Treasury 2,874Rio Tinto plc 2,872Enel SpA 2,581Afterpay Ltd 2,502Other issuers 87,580Total 128,169BlackRock Global Enhanced Index Fund EUR'000US Treasury 444Republic of Austria 286France Government 224Alphabet Inc 191Microsoft Corp 161Amazon.com Inc 160Parker-Hannifin Corp 150Rio Tinto Ltd 139UK Treasury 129Province of Ontario Canada 94Other issuers 3,200Total 5,178BlackRock Japan Equity 1 Fund JPY'000US Treasury 7,706,344UK Treasury 5,209,024Pinduoduo Inc 2,317,886France Government 1,981,951Bundesrepublik Deutschland Bundesanleihe 1,720,985Kingdom of Belgium Government 1,652,578Canada Government 1,461,891Afterpay Ltd 1,421,412Netherlands Government 1,292,496Sandvik AB 1,227,480Other issuers 40,822,300Total 66,814,347
No securities collateral received from a single issuer, in relation to efficient portfolio management and OTC FDIs, has exceeded 20% of any of the respective Fund’s NAV at the period end date.
None of the Funds have been fully collateralised in securities issued or guaranteed by an EU member state at the period end date.
Concentration of collateral received (continued)
142
BLACKROCK INSTITUTIONAL POOLED FUNDS PLCDISCLAIMERS
Disclaimer for Reference to Benchmark Index and Index Provider Website
In accordance with CBI requirements, the Entity and the BlackRock Europe Equity 1 Fund and BlackRock Japan Equity 1 Fund (“Index Funds”) are required to provide details of the relevant index provider’s website (“Website”) to enable shareholders to obtain further details of the relevant Index Fund’s Benchmark Index (including the index constituents). The Entity and the Index Funds have no responsibility for each Website and are not involved in any way in sponsoring, endorsing or otherwise involved in the establishment or maintenance of each Website or the contents thereof. Furthermore, the Entity and the Index Funds have no responsibility for the index provider’s Benchmark Index nor for the quality, accuracy or completeness of data in respect of their Benchmark Indices nor that the published indices will be managed in line with their described index methodologies.
MSCI Indices ("MSCI Indices")
The BlackRock Japan Equity 1 Fund and the BlackRock Europe Equity 1 Fund (hereinafter, the “Funds”) are not sponsored, endorsed, sold or promoted by Morgan Stanley Capital International Inc. (“MSCI”), any of its affiliates, any of its information providers or any other third party involved in, or related to, compiling, computing or creating any MSCI Index (collectively the "MSCI Parties"). The MSCI Indexes are the exclusive property of MSCI. MSCI and the MSCI Index names are service mark(s) of MSCI or its affiliates and have been licensed for use for certain purposes by BlackRock or its affiliates. None of the MSCI parties makes any representation or warranty, express or implied, to the issuer or owners of this Fund/account or any other person or entity regarding the advisability of investing in Funds generally or in the Funds particularly or the ability of any MSCI Index to track corresponding stock market performance. MSCI or its affiliates are the licensors of certain trademarks, service marks and trade names and of the MSCI Indexes which are determined, composed and calculated by MSCI without regard to the Funds or the issuer or owners of the Funds or any other person or entity into consideration in determining, composing or calculating the MSCI Indexes. None of the MSCI parties is responsible for or has participated in the determination of the timing of, prices at, or quantities of the Funds to be issued or in the determination or calculation of the equation by or the consideration into which the Funds are redeemable. Further, none of the MSCI parties has any obligation or liability to the issuer or owners of the Funds or any other person or entity in connection with the administration, marketing or offering of the Funds.
Although MSCI shall obtain information for inclusion in or for use in the calculation of the MSCI Indexes from sources that MSCI considers reliable, none of the MSCI Parties warrants or guarantees the originality, accuracy and/or the completeness of any MSCI Index or any data included therein. None of the MSCI parties make any warranty, express or implied, as to the results to be obtained by the issuer of the Funds, owners of the Funds, or any other person or entity, from the use of the MSCI Index or any data included therein. None of the MSCI parties shall have any liability for any errors, omissions or interruptions of or in connection with any MSCI Index or any data included therein. Further, none of the MSCI parties makes any express or implied warranties of any kind, and the MSCI parties hereby expressly disclaim all warranties of merchantability and fitness for a particular purpose, with respect to each MSCI Index and any data included therein. Without limiting any of the foregoing, in no event shall any of the MSCI parties have any liability for any direct, indirect, special, punitive, consequential or any other damages (including lost profits) even if notified of the possibility of such damages.
No purchaser, seller, owner or holder of this security, account, product or fund, or any other person or entity, should use or refer to any MSCI trade name, trademark or service mark to sponsor, endorse, market or promote this security, account product or fund without first contacting MSCI to determine whether MSCI's permission is required. Under no circumstances may any person or entity claim any affiliation with MSCI without the prior written permission of MSCI.

Go paperless. . .It’s Easy, Economical and Green!Go to www.blackrock.com/edelivery
Want to know more?blackrockinternational.com +44 (0)20 7743 3300
© 2021 BlackRock, Inc. All Rights reserved. BLACKROCK, BLACKROCK SOLUTIONS, iSHARES, SO WHAT DO I DO WITH MY MONEY, INVESTING FOR A NEW WORLD, and BUILT FOR THESE TIMES are registered and unregistered trademarks of BlackRock, Inc. or its subsidiaries in the United States and elsewhere. All other trademarks are those of their respective owners.