iSHARES VII PLC 2018 EN Annual Report - BlackRock
329
For the fina Annu audite iSHAR ancial year al rep ed fina RES VII ended 31 J ort an ancial PLC July 2018 nd statem ments s
-
Upload
khangminh22 -
Category
Documents
-
view
0 -
download
0
Transcript of iSHARES VII PLC 2018 EN Annual Report - BlackRock

For the fina
AnnuauditeiSHAR
ancial year
al reped fina
RES VII
ended 31 J
ort anancial PLC
July 2018
nd statemmentss

iSHARES VII PLC
i S H A R E S V I I P L C A N N U A L R E P O R T [ 1 ]
Contents Overview
General information 2
Chairman’s Statement 4
Background 6 Performance
Investment Manager’s report 9 Governance
Board of Directors 24
Corporate Governance Statement 26
Audit Committee Report 32
Statement of Directors’ Responsibilities 35
Directors’ Report 37
Depositary’s report to the shareholders 39
Independent Auditors’ report 40 Financial Statements
Income statement 47
Statement of changes in net assets attributable to redeemable participating shareholders 55
Balance sheet 63
Notes to the financial statements 71
Schedules of investments 130 Additional Information and Regulatory Disclosures (unaudited)
Schedules of material purchases and sales 262
Calendar year performance 295
PEA Eligibility 296
Transactions with connected parties 296
Global exposure 296
Leverage 296
Transaction costs 297
Report on Remuneration 298
Supplementary Information 302
Glossary 324
Disclaimers 325
This annual report and audited financial statements (the “Report and Accounts”) may be translated into other languages. Any such translation shall only contain the same information and have the same meaning as the English language Report and Accounts. To the extent that there is any inconsistency between the English language Report and Accounts and the Report and Accounts in another language, the English language Report and Accounts will prevail, except to the extent (and only to the extent) that it is required by law of any jurisdiction where the shares are sold, that in an action based upon disclosure in a Report and Accounts in a language other than English, the language of the Report and Accounts on which such action is based shall prevail. Any disputes as to the terms of the Report and Accounts, regardless of the language of the Report and Accounts, shall be governed by and construed in accordance with the laws of Ireland.

iSHARES VII PLC
[ 2 ] i S H A R E S V I I P L C A N N U A L R E P O R T
Board of Directors1 Sub-Investment Managers (continued) Paul McNaughton (Chairman) (Irish) BlackRock (Singapore) Limited Paul McGowan (Irish) 20 Anson Road Barry O’Dwyer (Irish) #18-01 Teresa O’Flynn (Irish) Singapore 079912 David Moroney (Irish) Singapore Jessica Irschick (British) BlackRock Asset Management North Asia Limited Audit Committee Members 16/F Champion Tower Paul McGowan (Chairman) Three Garden Road Paul McNaughton Central Hong Kong
Nomination Committee Members Paul McNaughton (Chairman) BlackRock Asset Management Deutschland AG Paul McGowan Lenbachplatz 1 1st Floor Barry O'Dwyer Munich 80333-MN3 Germany Manager BlackRock Asset Management Ireland Limited Depositary J.P. Morgan House State Street Custodial Services (Ireland) Limited International Financial Services Centre 78 Sir John Rogerson’s Quay Dublin 1 Dublin 2 Ireland Ireland Administrator and Registrar Registered office of the Company State Street Fund Services (Ireland) Limited J.P. Morgan House 78 Sir John Rogerson’s Quay International Financial Services Centre Dublin 2 Dublin 1 Ireland Ireland Company Secretary Legal Advisors to the Company Sanne Corporate Administration Services Ireland Limited William Fry Fourth Floor 2 Grand Canal Square 76 Baggot Street Lower Dublin 2 Dublin 2 Ireland Ireland Independent Auditors Investment Manager, Promoter and Securities Lending Agent PricewaterhouseCoopers BlackRock Advisors (UK) Limited Chartered Accountants and Registered Auditors 12 Throgmorton Avenue One Spencer Dock London EC2N 2DL North Wall Quay England Dublin 1 Ireland Sub-Investment Managers BlackRock Financial Management Inc. Paying Agent 40 East 52nd Street Citibank N.A., London Branch New York Citigroup Centre NY 10022 25 Canada Square United States Canary Wharf London E14 5LB England
1 All Directors are non-executive Directors.
General information

iSHARES VII PLC
i S H A R E S V I I P L C A N N U A L R E P O R T [ 3 ]
Representative in Switzerland German Information Agent BlackRock Asset Management Schweiz AG State Street Bank International GmbH Bahnhofstrasse 39 Briennerstrasse 59 8001 Zurich 80333 Munich Switzerland Germany Paying Agent in Switzerland Austrian Paying and Information Agent State Street Bank International GmbH UniCredit Bank Austria AG Munich Attn: 8398/Custody Zurich Branch Julius Tandler Platz 3 Beethovenstrasse 19 1090 Vienna CH-8027 Zurich Austria Switzerland The Company is duly registered with the Comisión Nacional del Mercado de Valores in Spain under number 886.
General information (continued)

iSHARES VII PLC
Chairman’s Statement
[ 4 ] i S H A R E S V I I P L C A N N U A L R E P O R T
The Board of Directors considers corporate governance matters and adherence to codes of best practice to be of the utmost importance. As Chairman of the Board, I believe that it has operated effectively throughout the financial year and that its role and its composition are well defined, appropriate and support the long-term development of the Company. Overview of the Company
iShares VII public limited company (the “Company”) is organised as an open-ended Investment Company with variable capital (an "Investment Company"). The Company was incorporated in Ireland on 9 April 2009 with limited liability and segregated liability between its Funds and is organised under the laws of Ireland as a Public Limited Company (“PLC”) pursuant to the Companies Act 2014 (as amended) and the European Communities (Undertakings for Collective Investment in Transferable Securities) Regulations 2011 (as amended) (the “UCITS Regulations”) and is regulated by the Central Bank of Ireland (the "CBI"). The Company is structured as an umbrella Fund and comprises separate Funds (“Funds”) of the Company. The term “Fund” shall be deemed to mean either a Fund of the Company, or if the context so requires, BlackRock Asset Management Ireland Limited (the “Manager”) or its delegate acting for the account of the relevant Fund. The term “BlackRock” is used to represent BlackRock Advisors (UK) Limited. The investment objectives and policies of each Fund are set out in the prospectus. The Funds of the Company pursue strategies of either tracking or replicating the performance of a benchmark index in order to deliver the objectives of each Fund. The Manager has delegated the administration of the Company and its Funds to State Street Fund Services (Ireland) Limited (the “Administrator”) including the calculation of the daily net asset value ("NAV"), and the preparation of the financial statements of the Company subject to the overall supervision of the Directors and the Manager. State Street Fund Services (Ireland) Limited (the "Registrar") has also been appointed as the registrar of the Company. The Company has appointed State Street Custodial Services (Ireland) Limited (the “Depositary”) as Depositary of the assets with responsibility for the safe keeping of such assets, pursuant to the UCITS Regulations. As part of its fiduciary responsibility to the Company, the Depositary provides a certain level of ongoing oversight of the Company, as well as reporting on the conduct of the Company in each annual accounting period as set out in the Statement of the Depositary’s Responsibilities. In accordance with Guidance Note 4/07 on the Organisation of Management Companies issued by the CBI, the Board of the Manager has identified BlackRock Group personnel who monitor and control the management functions as outlined therein. These BlackRock Group personnel report to the Board of the Manager and the Company on a regular basis. The management functions delegated by the Manager are subject to appropriate reporting and ratification procedures, which are designed to ensure that the appropriate reports are received in a timely fashion such that the Manager and the Board can discharge their duties, as part of the governance framework put in place by the Manager and the Company. The Board reviews risk reporting on a regular basis together with an annual review of internal controls and risk management from the Manager. The Board
The Board comprises six Directors, two of whom are independent. The members of the Board were chosen for their range of skills and experience. Paul McGowan has extensive experience in the area of tax, financial services and corporate governance, Teresa O’Flynn has over eighteen years’ experience in tax, corporate finance, project finance and the renewable energy infrastructure sector. Barry O’Dwyer has extensive knowledge and experience in corporate governance and I have over twenty-five years’ experience in the banking and finance, fund management and securities processing industries. David Moroney has been appointed as a non-executive Director effective 15 November 2017. David has over twenty years of experience in securities, derivatives and regulated funds and has had responsibilities in trading, structuring, custom indices, risk and governance. Jessica Irschick has been appointed as a non-executive Director effective 20 November 2017. Jessica has extensive experience in fixed income and equity trading, financing, securities lending and foreign exchange.

iSHARES VII PLC
Chairman’s Statement (continued)
i S H A R E S V I I P L C A N N U A L R E P O R T [ 5 ]
Matters relating to the Company during the financial year
There were 30 Funds in operation at 31 July 2018. It is the opinion of the Board that all Funds have performed in line with their objectives and that any tracking differences have been explained in the Investment Manager’s report. Additional information on the Funds’ performance can be found in the Investment Manager’s report. Paul McNaughton Chairman 28 November 2018

iSHARES VII PLC
Background
[ 6 ] i S H A R E S V I I P L C A N N U A L R E P O R T
iShares VII public limited company (the “Company”) is organised as an open-ended Investment Company with variable capital. The Company was incorporated in Ireland on 9 April 2009 with limited liability and segregated liability between its Funds and is organised under the laws of Ireland as a Public Limited Company (“PLC”) pursuant to the Companies Act 2014 (as amended) and the European Communities (Undertakings for Collective Investment in Transferable Securities) Regulations, 2011 (as amended) (the “UCITS Regulations”) and is regulated by the CBI. The term “Fund” shall be deemed to mean either a fund of the Company, or if the context so requires, the Manager or its delegate acting for the account of the relevant Fund. The term “BlackRock” is used to represent BlackRock Advisors (UK) Limited. The investment objectives and policies of each Fund are set out in the prospectus. The Company is structured as an umbrella Fund and comprises separate Funds of the Company. Each Fund of the Company comprises a distinct portfolio of investments. The shares of each Fund may be issued with different rights, features and on different terms and conditions to those of other Funds. Shares of a Fund may be divided into different share classes with different dividend policies, currency hedging and valuation currencies and may therefore have different fees and expenses. While assets and liabilities that are specific to a share class within a Fund would be attributable to (and should be borne by) only that share class, there is no segregation of liabilities between share classes as a matter of Irish law. Due to the lack of segregation of liabilities as a matter of law, there is a risk that the creditors of a share class may bring a claim against the assets of the Fund notionally allocated to other share classes. The financial instruments and risks section of the financial statements provides more details on the management of foreign currency risk in relation to the currency hedged share classes. The Investment Manager may use derivatives (for example, forward currency contracts, futures contracts and options, or such other instruments as are permitted) to hedge the rate of exchange between the currency of all or some of the currencies in which the assets of a Fund (including cash and income) are denominated and the share class valuation currencies. The transactions, costs and related liabilities and benefits arising from instruments entered into for the purposes of hedging the currency exposure for the benefit of any particular currency hedged share classes shall be attributed only to the relevant currency hedged share classes. Currency exposures of different share classes may not be combined or offset and currency exposures of the assets of a Fund may not be allocated to separate share classes. Changes to the Company On 4 September 2017, iShares FTSE Italia Mid-Small Cap UCITS ETF was launched. Effective 15 September 2017, the Company Secretary changed its name from Chartered Corporate Services to Sanne Corporate Administration Services Ireland Limited. Effective 1 October 2017, Commerzbank AG was replaced by State Street Bank International GmbH as German information agent for the Company. BlackRock Asset Management North Asia Limited has been appointed as sub-investment manager effective from 5 October 2017. David Moroney has been appointed as a non-executive Director effective 15 November 2017. Jessica Irschick has been appointed as a non-executive Director effective 20 November 2017. BlackRock Asset Management Deutschland AG was appointed as a sub-investment manager effective 4 December 2017.

iSHARES VII PLC
Background (continued)
i S H A R E S V I I P L C A N N U A L R E P O R T [ 7 ]
Changes to the Company (continued) On 18 December 2017, an updated prospectus was issued by the Company to incorporate the following changes:
The launch of iShares FTSE Italia Mid-Small Cap UCITS ETF. The anticipated tracking error of iShares MSCI Korea UCITS ETF USD (Acc) was updated from 0.70% to 0.30%. The anticipated tracking error of iShares MSCI UK Small Cap UCITS ETF was updated from 0.25% to 0.20%.
On 31 May 2018, an updated prospectus was issued by the Company to incorporate the following changes:
The Total Expense Ratio ("TER") of iShares MSCI EMU UCITS ETF EUR (Acc) and EUR (Dist) classes was updated from 0.33% to 0.12%. The anticipated tracking error of iShares Nikkei 225 UCITS ETF was updated from 0.80% to 0.20%. New share classes were launched on the following Funds during the financial year as detailed in the below table:
Fund Share Class Launch Date iShares MSCI EMU UCITS ETF GBP Hedged (Dist) 4 June 2018 iShares Core S&P 500 UCITS ETF GBP Hedged (Dist) 3 July 2018 iShares $ Treasury Bond 3-7yr UCITS ETF USD (Dist) 12 July 2018
Potential implication of Brexit
In a referendum held on 23 June 2016, the electorate of the United Kingdom (“UK”) resolved to leave the European Union (“EU”). The result has led to political and economic instability and volatility in the financial markets of the UK and more broadly across Europe. It may also lead to weakening in consumer, corporate and financial confidence in such markets as the UK finalises the terms of its exit from the EU. The extent of the impact will depend in part on the nature of the arrangements that are put in place between the UK and the EU following the eventual Brexit deal and the extent to which the UK continues to apply laws that are based on EU legislation. The longer term process to implement the political, economic and legal framework that is agreed between the UK and the EU is likely to lead to continuing uncertainty and periods of exacerbated volatility in both the UK and in wider European markets. The UK’s exit from the EU, the anticipation of the exit, or the terms of the exit could also create significant uncertainty in the UK (and potentially global) financial markets, which may materially and adversely affect the performance of the Funds, the Funds’ NAV, the Funds’ earning and returns to Shareholders. It could also potentially make it more difficult to raise capital in the EU and/or increase the regulatory compliance burden which could restrict the Funds’ future activities and thereby negatively affect returns. Currency volatility resulting from this uncertainty may mean that the returns of the Fund and its investments are adversely affected by market movements, potential decline in the value of the British Pound and/or Euro, and any downgrading of UK sovereign credit rating. This may also make it more difficult, or more expensive, for the Company to execute prudent currency hedging policies. This mid to long term uncertainty may have an adverse effect on the economy generally and on the ability of the Company and its investments to execute their respective strategies and to receive attractive returns, and may also result in increased costs to the Company.

iSHARES VII PLC
Background (continued)
[ 8 ] i S H A R E S V I I P L C A N N U A L R E P O R T
Fund details
There were 30 Funds in operation at 31 July 2018. The investment objective of the Funds is to provide investors with a total return, taking into account the capital and income returns, which reflect the total returns of the respective benchmark listed in the table below:
Fund Benchmark Index
Investment Management Approach*
iShares $ Treasury Bond 1-3yr UCITS ETF USD (Acc) B ICE U.S. Treasury 1-3 Year Bond Index Non-replicating iShares $ Treasury Bond 3-7yr UCITS ETF ICE U.S. Treasury 3-7 Year Bond Index Non-replicating iShares $ Treasury Bond 7-10yr UCITS ETF USD (Acc) ICE U.S. Treasury 7-10 Year Bond Index Non-replicating iShares € Govt Bond 1-3yr UCITS ETF EUR (Acc) Bloomberg Barclays Euro Government Bond 1-3 Year Term
Index Non-replicating
iShares € Govt Bond 3-7yr UCITS ETF Bloomberg Barclays Euro Government Bond 3-7 Year Term Index
Non-replicating
iShares € Govt Bond 7-10yr UCITS ETF EUR (Acc) Bloomberg Barclays Euro Government Bond 10 Year Term Index
Non-replicating
iShares Core EURO STOXX 50 UCITS ETF EURO STOXX 50 Index Replicating iShares Core MSCI Pacific ex-Japan UCITS ETF MSCI Pacific ex Japan Index Replicating iShares Core S&P 500 UCITS ETF S&P 500 Index Replicating iShares Dow Jones Industrial Average UCITS ETF Dow Jones Industrial Average Index Replicating iShares FTSE 100 UCITS ETF FTSE 100 Index Replicating iShares FTSE MIB UCITS ETF EUR (Acc) FTSE MIB Index Replicating iShares MSCI Brazil UCITS ETF USD (Acc) MSCI Brazil Index Net USD Replicating iShares MSCI Canada UCITS ETF MSCI Canada Index Replicating iShares MSCI EM Asia UCITS ETF MSCI EM Asia Index Net USD Non-replicating iShares MSCI EMU CHF Hedged UCITS ETF (Acc)^ MSCI EMU 100% Hedged to CHF Index Replicating iShares MSCI EMU Small Cap UCITS ETF MSCI EMU Small Cap Index Non-replicating iShares MSCI EMU UCITS ETF MSCI EMU Index Replicating iShares MSCI EMU USD Hedged UCITS ETF (Acc)^ MSCI EMU 100% Hedged to USD Index Replicating iShares MSCI Japan UCITS ETF USD (Acc) MSCI Japan Index Replicating iShares MSCI Korea UCITS ETF USD (Acc) MSCI Korea Index Net USD Replicating iShares MSCI Mexico Capped UCITS ETF MSCI Mexico Capped Index Net USD Replicating iShares MSCI Russia ADR/GDR UCITS ETF MSCI Russia ADR/GDR Index Net USD Replicating iShares MSCI UK Small Cap UCITS ETF MSCI UK Small Cap Index Non-replicating iShares MSCI UK UCITS ETF MSCI UK Index Replicating iShares MSCI USA Small Cap UCITS ETF MSCI USA Small Cap Index Non-replicating iShares MSCI USA UCITS ETF MSCI USA Index Replicating iShares NASDAQ 100 UCITS ETF NASDAQ 100 Index Replicating iShares Nikkei 225 UCITS ETF Nikkei 225 Index Replicating iShares FTSE Italia Mid-Small Cap UCITS ETF FTSE Italia PIR Mid Small Cap Index Replicating
* Please refer to the Investment Manager’s report for further information on the meaning of replicating and non-replicating Funds. ^ Currency hedged Fund.
All figures relating to each Fund/Share Class are shown in the relevant functional currency. The financial statements of the Company are presented in Euro. These Funds are Exchange Traded Funds (“ETFs”), which provide the flexibility of a share with the diversification of a Fund. They can be bought and sold like any other share listed on a stock exchange, but provide instant exposure to many companies or various financial instruments relevant to the Fund and its benchmark index. Stock exchange listings
The Company maintained a listing on the London Stock Exchange (“LSE”).

iSHARES VII PLC
Investment Manager’s report
i S H A R E S V I I P L C A N N U A L R E P O R T [ 9 ]
INVESTMENT OBJECTIVE
The investment objective of the Funds is to provide investors with a total return, taking into account the capital and income returns, which reflect the total returns of the respective benchmark listed in Fund details in the Background section.
FUND PERFORMANCE, TRACKING DIFFERENCE AND TRACKING ERROR
The Fund performance figures are the aggregated net monthly returns based on the NAV calculated in accordance with the prospectus for the financial year under review. Due to Financial Reporting Standard ("FRS") 102 requirements which apply to the financial statements, there may be differences between the NAV per share as recorded in the financial statements and the NAV per share calculated in accordance with the prospectus. The returns are net of the TER. Tracking difference is defined as the difference in returns between a Fund and its benchmark index. Tracking difference is based on the NAV calculated in accordance with the prospectus. Realised tracking error is the annualised standard deviation of the difference in monthly returns between a Fund and its benchmark index. Tracking error shows the consistency of the returns relative to the benchmark index over a defined period of time. Tracking error is based on the NAV calculated in accordance with the prospectus. Anticipated tracking error is based on the expected volatility of differences between the returns of a Fund and the returns of its benchmark index. For physically replicating Funds, the investment management approach is to buy a portfolio of securities that as far as practicable consist of the securities that make up the benchmark index, in similar proportion to the weights represented in the benchmark index. For non-replicating Funds, the investment management approach aims to match the main risk characteristics of the benchmark index by investing in a portfolio that is primarily made up of securities that represent the benchmark index. The objective is to generate a return which is as close as practicable to the total return of the index net of transaction costs, gross of fees and other costs. Cash management, efficient portfolio management techniques including securities lending, transaction costs from rebalancing and currency hedging can have an impact on tracking difference and tracking error. Importantly, these impacts can be either positive or negative depending on the underlying circumstances. Each Fund’s TER is accrued on a daily basis throughout the financial year, which can impact the measurement of a tracking error in a positive or negative manner depending on the performance in the market and the TER rate applied. The extent and magnitude of this effect on performance measurement is subject to the timing of the market performance relative to the performance period and can be greater than the headline TER in a positive market and lower than the TER in a negative market. In addition to the above, the Funds may also have a tracking difference and tracking error due to withholding tax suffered by the Funds on any income received from its investments. The level and quantum of tracking difference arising due to withholding taxes depends on various factors such as any reclaims filed on behalf of the Funds with various tax authorities, any benefits obtained by the Funds under a tax treaty or any securities lending activities carried out by the Funds.

iSHARES VII PLC
Investment Manager’s report (continued)
[ 1 0 ] i S H A R E S V I I P L C A N N U A L R E P O R T
FUND PERFORMANCE, TRACKING DIFFERENCE AND TRACKING ERROR (continued)
The following table below compares the realised performance of the Funds against the performance of the relevant benchmark index during the financial year ended 31 July 2018, the anticipated tracking error of the Funds (disclosed in the prospectus on an ex-ante basis) against the actual realised tracking error of the Funds as at 31 July 2018 and an explanation of the tracking difference gross of TER. An explanation of the difference in tracking error is also provided where the realised tracking error is greater than the anticipated tracking error. The realised tracking error is annualised and calculated using data from the preceding 36 month observation period. Where a Fund has not been trading for 36 months, the annualised tracking error since inception has been presented.
Fund
Fund return for the
financial year ended 31/07/2018
%
Benchmark return for the
financial year ended 31/07/2018
%
Tracking difference
net of TER
%TER
%
Tracking difference
gross of TER
% Tracking difference explanation
Anticipated tracking
error%
Realised tracking
error% Tracking error explanation
iShares $ Treasury Bond 1-3yr UCITS ETF USD (Acc) B
(0.38) (0.21) (0.17) 0.20 0.03 The Fund performed in line with the index before costs (TER).
Up to 0.150 0.02 The Fund has tracked its benchmark index within its anticipated tracking error.
iShares $ Treasury Bond 3-7yr UCITS ETF
(1.94) (1.81) (0.13) 0.20 0.07 The outperformance of the Fund was due to sampling techniques employed and transaction costs.
Up to 0.150 0.03 The Fund has tracked its benchmark index within its anticipated tracking error.
iShares $ Treasury Bond 7-10yr UCITS ETF USD (Acc)
(2.82) (2.72) (0.10) 0.20 0.10 The outperformance of the Fund was due to sampling techniques employed and transaction costs.
Up to 0.200 0.03 The Fund has tracked its benchmark index within its anticipated tracking error.
iShares € Govt Bond 1-3yr UCITS ETF EUR (Acc)
(0.58) (0.37) (0.21) 0.20 (0.01) The Fund performed in line with the index before costs (TER).
Up to 0.050 0.01 The Fund has tracked its benchmark index within its anticipated tracking error.
iShares € Govt Bond 3-7yr UCITS ETF (0.30) (0.12) (0.18) 0.20 0.02 The Fund performed in line with the index before costs (TER).
Up to 0.100 0.01 The Fund has tracked its benchmark index within its anticipated tracking error.
iShares € Govt Bond 7-10yr UCITS ETF EUR (Acc)
1.43 1.60 (0.17) 0.20 0.03 The Fund performed in line with the index before costs (TER).
Up to 0.100 0.01 The Fund has tracked its benchmark index within its anticipated tracking error.
iShares Core EURO STOXX 50 UCITS ETF
5.53 4.96 0.57 0.10 0.67 The outperformance of the Fund was due to differences in the tax rates applied to dividends received in the Fund versus the tax rates assumed in the total return calculation of the benchmark index.
Up to 0.350 0.27 The Fund has tracked its benchmark index within its anticipated tracking error.

iSHARES VII PLC
Investment Manager’s report (continued)
i S H A R E S V I I P L C A N N U A L R E P O R T [ 1 1 ]
FUND PERFORMANCE, TRACKING DIFFERENCE AND TRACKING ERROR (continued)
Fund
Fund return for the
financial year ended 31/07/2018
%
Benchmark return for the
financial year ended 31/07/2018
%
Tracking difference
net of TER
%TER
%
Tracking difference
gross of TER
% Tracking difference explanation
Anticipated tracking
error%
Realised tracking
error% Tracking error explanation
iShares Core MSCI Pacific ex-Japan UCITS ETF
6.12 6.23 (0.11) 0.20 0.09 The outperformance of the Fund was due to differences in the tax rates applied to dividends received in the Fund versus the tax rates assumed in the total return calculation of the benchmark index.
Up to 0.150 0.06 The Fund has tracked its benchmark index within its anticipated tracking error.
iShares Core S&P 500 UCITS ETF 15.85 15.57 0.28 0.07 0.35 The outperformance of the Fund was due to differences in the tax rates applied to dividends received in the Fund versus the tax rates assumed in the total return calculation of the benchmark index.
Up to 0.100 0.04 The Fund has tracked its benchmark index within its anticipated tracking error.
iShares Dow Jones Industrial Average UCITS ETF
17.99 17.95 0.04 0.33 0.37 The outperformance of the Fund was due to differences in the tax rates applied to dividends received in the Fund versus the tax rates assumed in the total return calculation of the benchmark index.
Up to 0.150 0.07 The Fund has tracked its benchmark index within its anticipated tracking error.
iShares FTSE 100 UCITS ETF 9.35 9.44 (0.09) 0.07 (0.02) The Fund performed in line with the index before costs (TER).
Up to 0.100 0.03 The Fund has tracked its benchmark index within its anticipated tracking error.

iSHARES VII PLC
Investment Manager’s report (continued)
[ 1 2 ] i S H A R E S V I I P L C A N N U A L R E P O R T
FUND PERFORMANCE, TRACKING DIFFERENCE AND TRACKING ERROR (continued)
Fund
Fund return for the
financial year ended 31/07/2018
%
Benchmark return for the
financial year ended 31/07/2018
%
Tracking difference
net of TER
%TER
%
Tracking difference
gross of TER
% Tracking difference explanation
Anticipated tracking
error%
Realised tracking
error% Tracking error explanation
iShares FTSE MIB UCITS ETF EUR (Acc)
6.30 6.07 0.23 0.33 0.56 The outperformance of the Fund was due to differences in the tax rates applied to dividends received in the Fund versus the tax rates assumed in the total return calculation of the benchmark index.
Up to 0.300 0.25 The Fund has tracked its benchmark index within its anticipated tracking error.
iShares MSCI Brazil UCITS ETF USD (Acc)
(0.36) 0.45 (0.81) 0.65 (0.16) The underperformance of the Fund was due to differences in the tax rates applied to dividends received in the Fund versus the tax rates assumed in the total return calculation of the benchmark index.
Up to 0.300 0.20 The Fund has tracked its benchmark index within its anticipated tracking error.
iShares MSCI Canada UCITS ETF 7.16 7.50 (0.34) 0.48 0.14 The outperformance of the Fund was due to securities lending revenue.
Up to 0.100 0.03 The Fund has tracked its benchmark index within its anticipated tracking error.
iShares MSCI EM Asia UCITS ETF 4.32 5.00 (0.68) 0.65 (0.03) The Fund performed in line with the index before costs (TER).
Up to 1.000 0.24 The Fund has tracked its benchmark index within its anticipated tracking error.
iShares MSCI EMU CHF Hedged UCITS ETF (Acc)
6.22 6.08 0.14 0.38 0.52 The outperformance of the Fund was due to differences in the tax rates applied to dividends received in the Fund versus the tax rates assumed in the total return calculation of the benchmark index.
Up to 0.350 0.25 The Fund has tracked its benchmark index within its anticipated tracking error.

iSHARES VII PLC
Investment Manager’s report (continued)
i S H A R E S V I I P L C A N N U A L R E P O R T [ 1 3 ]
FUND PERFORMANCE, TRACKING DIFFERENCE AND TRACKING ERROR (continued)
Fund
Fund return for the
financial year ended 31/07/2018
%
Benchmark return for the
financial year ended 31/07/2018
%
Tracking difference
net of TER
%TER
%
Tracking difference
gross of TER
% Tracking difference explanation
Anticipated tracking
error%
Realised tracking
error% Tracking error explanation
iShares MSCI EMU Small Cap UCITS ETF
8.62 8.58 0.04 0.58 0.62 The outperformance of the Fund was due to differences in tax rates applied to dividends received in the Fund versus the tax rates assumed in the total return calculation of the benchmark index and due to securities lending transactions.
Up to 0.900 0.16 The Fund has tracked its benchmark index within its anticipated tracking error.
iShares MSCI EMU UCITS ETF* 6.81 6.53 0.28 0.30 0.58 The outperformance of the Fund was due to differences in the tax rates applied to dividends received in the Fund versus the tax rates assumed in the total return calculation of the benchmark index.
Up to 0.250 0.24 The Fund has tracked its benchmark index within its anticipated tracking error.
iShares MSCI EMU USD Hedged UCITS ETF (Acc)
9.18 9.06 0.12 0.38 0.50 The outperformance of the Fund was due to differences in the tax rates applied to dividends received in the Fund versus the tax rates assumed in the total return calculation of the benchmark index.
Up to 0.350 0.29 The Fund has tracked its benchmark index within its anticipated tracking error.
iShares MSCI Japan UCITS ETF USD (Acc)
8.26 8.75 (0.49) 0.48 (0.01) The Fund performed in line with the index before costs (TER).
Up to 0.150 0.61 The tracking error was predominately caused due to Fund holidays that led to a difference in the valuation point of the Fund and the pricing point of the benchmark index.
* During the financial year the TER of this Fund was amended. The TER shown is the effective TER applicable as at 31 July 2018. Please refer to the background section for details of all changes to the TER's during the financial year.

iSHARES VII PLC
Investment Manager’s report (continued)
[ 1 4 ] i S H A R E S V I I P L C A N N U A L R E P O R T
FUND PERFORMANCE, TRACKING DIFFERENCE AND TRACKING ERROR (continued)
Fund
Fund return for the
financial year ended 31/07/2018
%
Benchmark return for the
financial year ended 31/07/2018
%
Tracking difference
net of TER
%TER
%
Tracking difference
gross of TER
% Tracking difference explanation
Anticipated tracking
error%
Realised tracking
error% Tracking error explanation
iShares MSCI Korea UCITS ETF USD (Acc)
(1.97) (1.34) (0.63) 0.65 0.02 The Fund performed in line with the index before costs (TER).
Up to 0.300 0.24 The Fund has tracked its benchmark index within its anticipated tracking error.
iShares MSCI Mexico Capped UCITS ETF
(5.92) (5.43) (0.49) 0.65 0.16 The outperformance of the Fund was due to differences in the tax rates applied to dividends received in the Fund versus the tax rates assumed in the total return calculation of the benchmark index.
Up to 0.100 0.08 The Fund has tracked its benchmark index within its anticipated tracking error.
iShares MSCI Russia ADR/GDR UCITS ETF
26.10 27.02 (0.92) 0.65 (0.27) The underperformance of the Fund was due to differences in performance between the benchmark and index futures held for efficient portfolio management.
Up to 1.300 0.31 The Fund has tracked its benchmark index within its anticipated tracking error.
iShares MSCI UK Small Cap UCITS ETF
11.24 11.98 (0.74) 0.58 (0.16) The underperformance of the Fund was due to differences in performance between the benchmark and index futures held for efficient portfolio management and UK transaction costs.
Up to 0.200 0.08 The Fund has tracked its benchmark index within its anticipated tracking error.
iShares MSCI UK UCITS ETF 8.37 8.73 (0.36) 0.33 (0.03) The Fund performed in line with the index before costs (TER).
Up to 0.100 0.03 The Fund has tracked its benchmark index within its anticipated tracking error.

iSHARES VII PLC
Investment Manager’s report (continued)
i S H A R E S V I I P L C A N N U A L R E P O R T [ 1 5 ]
FUND PERFORMANCE, TRACKING DIFFERENCE AND TRACKING ERROR (continued)
Fund
Fund return for the
financial year ended 31/07/2018
%
Benchmark return for the
financial year ended 31/07/2018
%
Tracking difference
net of TER
%TER
%
Tracking difference
gross of TER
% Tracking difference explanation
Anticipated tracking
error%
Realised tracking
error% Tracking error explanation
iShares MSCI USA Small Cap UCITS ETF
17.41 17.65 (0.24) 0.43 0.19 The outperformance of the Fund was due to differences in the tax rates applied to dividends received in the Fund versus the tax rates assumed in the total return calculation of the benchmark index.
Up to 0.400 0.16 The Fund has tracked its benchmark index within its anticipated tracking error.
iShares MSCI USA UCITS ETF 15.59 15.62 (0.03) 0.33 0.30 The outperformance of the Fund was due to differences in the tax rates applied to dividends received in the Fund versus the tax rates assumed in the total return calculation of the benchmark index.
Up to 0.100 0.03 The Fund has tracked its benchmark index within its anticipated tracking error.
iShares NASDAQ 100 UCITS ETF 23.72 23.90 (0.18) 0.33 0.15 The outperformance of the Fund was due to differences in the tax rates applied to dividends received in the Fund versus the tax rates assumed in the total return calculation of the benchmark index.
Up to 0.100 0.04 The Fund has tracked its benchmark index within its anticipated tracking error.
iShares Nikkei 225 UCITS ETF 14.50 14.93 (0.43) 0.48 0.05 The Fund performed in line with the index before costs (TER).
Up to 0.200 1.19 The tracking error was predominately caused due to Fund holidays that led to a difference in the valuation point of the Fund and the pricing point of the benchmark index.

iSHARES VII PLC
Investment Manager’s report (continued)
[ 1 6 ] i S H A R E S V I I P L C A N N U A L R E P O R T
FUND PERFORMANCE, TRACKING DIFFERENCE AND TRACKING ERROR (continued)
Fund
Fund return for the
financial year ended 31/07/2018
%
Benchmark return for the
financial year ended 31/07/2018
%
Tracking difference
net of TER
%TER
%
Tracking difference
gross of TER
% Tracking difference explanation
Anticipated tracking
error%
Realised tracking
error% Tracking error explanation
iShares FTSE Italia Mid-Small Cap UCITS ETF*
3.84 3.97 (0.13) 0.30 0.17 The outperformance of the Fund was due to differences in the tax rates applied to dividends received in the Fund versus the tax rates assumed in the total return calculation of the benchmark index.
Up to 0.400 0.17^ The Fund has tracked its benchmark index within its anticipated tracking error.
* As this Fund launched during the financial year, performance figures are shown from launch date to 31 July 2018 and the TER is the effective TER from launch date to the financial year end date. ^ The realised tracking error is normally computed from 36 months of returns. The Fund's return history is too short to give a statistically significant tracking error.
Past performance may not necessarily be repeated and future performance may vary. The performance and tracking error returns are for the primary share class for each Fund, which has been selected as a representative share class. Performance returns for other share classes are available at www.ishares.com.

iSHARES VII PLC
Investment Manager’s report (continued)
i S H A R E S V I I P L C A N N U A L R E P O R T [ 1 7 ]
MARKET REVIEW Equities US equities This market review summary covers iShares Core S&P 500 UCITS ETF, iShares Dow Jones Industrial Average UCITS ETF, iShares MSCI USA Small Cap UCITS ETF, iShares MSCI USA UCITS ETF and iShares NASDAQ 100 UCITS ETF.
US equities delivered strong returns over the Company’s review year, significantly outperforming relative to global equities. The bulk of the gains arose over the first half of the review year as a combination of confidence in the economic outlook, both for the US and globally, and encouraging corporate earnings updates boosted valuations. However, even as positive corporate news flow remained very positive, concerns that US interest rates could rise more steeply than investors had expected and rising global trade tensions subsequently acted as a slight headwind to US equities. Despite positive signs from the economy, the US market began the review year on a mixed note as investors assessed the implications of the devastation caused by Hurricanes Harvey and Irma. Some element of political uncertainty also weighed on sentiment as President Donald Trump’s handling of violent confrontations in Charlottesville drew criticism from business leaders, resulting in deteriorating relations between the administration and some executives, and the subsequent disbanding of White House business councils. Nevertheless, US equities soon pushed higher, buoyed by a stream of encouraging corporate earnings and economic headlines. Compared to growth of 1.20% on an annualised basis during the first quarter of 2017, revised data suggested that the US economy had grown by 3.10% during the April to June 2017 period, while the robust jobs market continued to support consumer activity. US equities set a succession of all-time highs during the final quarter of 2017, bolstered by signs that economic growth was strengthening further, a robust rally in the energy sector following Organisation of the Petroleum Exporting Countries (“OPEC”) production agreement with Russia and a political accord that would cut the main US corporate tax rate from 35.00% to 21.00%. Having soared by over 10.00% between mid November 2017 and late January 2018, US equities fell sharply from their new all-time high of 26th January as stronger than expected US inflation and pay data heightened concerns that interest rates could rise more steeply, and to a greater extent, than investors had expected. Despite a marked upturn in volatility, valuations nevertheless stabilised over the remainder of the first quarter of 2018. Notwithstanding a short lived decline in the Information Technology (“IT”) sector as a data security scandal hit Facebook and a fatal accident raised new questions over the safety of autonomous vehicles, official economic data suggested that the US trading environment remained highly supportive. Compared to revised data showing that the US economy had grown by 2.90% during the final quarter of 2017, provisional figures suggested that growth remained firm at 2.20% during the first quarter of 2018. Meanwhile, the jobs market demonstrated further strength as the unemployment rate fell to 3.90% in April 2018, compared to 4.40% in August 2017. Notwithstanding concerns over the growing risk of a full blown global trade war as President Trump imposed tariffs on steel and aluminium imports, also threatening further measures should China retaliate, while irking European allies by raising the prospect of tariffs on goods such as cars, US equities ended the Company’s review year on a firm note. This reflected another positive quarterly corporate reporting season, with optimism that negotiations could yet defuse trade tensions and news that the US economy had grown by 4.10% during the second quarter of 2018, its strongest growth in nearly four years. Although concerns over the growing risk of global trade war weighed on sentiment towards export orientated large cap stocks, smaller companies outperformed, reflecting their greater relative reliance on the robust domestic US economy. The technology heavy NASDAQ index performed particularly strongly, underpinned by robust trading updates from sector heavyweights such as Amazon, Microsoft and Alphabet. The Dow Jones Industrial Average also rose ahead of the broader US market, boosted by the large representation of cyclical industrial stocks, particularly during their strong performance over first half of the review year, and low exposure to underperforming utilities. Japanese equities This market review summary covers iShares MSCI Japan UCITS ETF USD (Acc) and iShares Nikkei 225 UCITS ETF.
Having generated strong returns during the first half of the Company’s review year, Japanese equities subsequently struggled in the face of the cooling domestic economy and concerns over the risk of a global trade war. Over the review year as a whole, Nikkei 225 equities outperformed their global peers, although the MSCI Japan index underperformed, reflecting a marked recovery in the US Dollar versus the Japanese Yen from mid February 2018 that more than offset the US currency’s previous decline since the beginning of the Company’s review year. The US Dollar’s recovery against the Japanese Yen during the second quarter of 2018 eased some of the pressure on Japanese exporters that had been feeling the effects of currency induced weakness in the earnings from the key US market.

iSHARES VII PLC
Investment Manager’s report (continued)
[ 1 8 ] i S H A R E S V I I P L C A N N U A L R E P O R T
MARKET REVIEW (continued) Equities (continued) Japanese equities (continued) Japanese equities enjoyed solid price gains early in the review year, boosted by very positive company trading updates and supportive domestic economic data, notably rising business confidence. Following setbacks in late August and early September 2017 as North Korea defied the international community by threatening its neighbours and test firing a missile over Japan, the Japanese market soon recovered its poise, lifted by further positive economic and corporate news flow. Notwithstanding the impact on international revenues from the Japanese Yen’s strength against the US Dollar, trading updates from leading industrial and IT companies, including makers of precision instruments and electric machinery, were particularly encouraging. Politics also lent support to the rally as Prime Minister (“PM”) Shinzo Abe unexpectedly called – and won – a 22 October 2017 snap election, with his Liberal Democratic Party thereby gaining a fresh mandate for market friendly ‘Abenonomics’. Despite some signs that the Japanese economy had been gradually cooling, with provisional third quarter data suggesting growth of 0.60%, compared to 0.70% three months previously, a year end surge in wider global equities, spurred by rising oil prices and US tax cuts, saw Japanese equities end 2017 on a firm note. With strength in global stock markets and a robust Tankan business confidence survey helping Japanese stocks to hit 26 year highs in late January 2018, Japanese equities subsequently plunged alongside their global peers into early February 2018 amid fears over the outlook for US interest rates. Although the Japanese market soon stabilised, Japanese equities would nevertheless perform poorly relative to their global counterparts over the remainder of the Company’s review year. While allegations of political impropriety, linking PM Abe’s wife to an organisation that had seemingly benefitted from favourable terms over a land deal, caught the domestic headlines, investors also fretted over the prospect that Japanese policymakers could soon follow the lead of their Eurozone counterparts by scaling down the quantitative easing (“QE”) support programme. Subsequently, despite the ongoing strength of the labour market as the jobless rate fell to a 25 year low of 2.20%, concerns that waning consumer activity was acting as a drag on the domestic economy were soon vindicated by news that the economy contracted by (0.20)% during the first quarter of 2018. Meanwhile, despite a recovery in the US Dollar easing some pressure on exporters’ revenues, the effect was largely offset by deepening worries over the risk of a global trade war after President Trump acted on his earlier threat to impose steep tariffs on some imports.
European equities This market review summary covers iShares Core EURO STOXX 50 UCITS ETF, iShares FTSE MIB UCITS ETF EUR (Acc), iShares MSCI EMU CHF Hedged UCITS ETF, iShares MSCI EMU Small Cap UCITS ETF, iShares MSCI EMU UCITS ETF, iShares MSCI EMU USD Hedged UCITS ETF (Acc) and iShares FTSE Italia Mid-Small Cap UCITS ETF.
European equities produced only muted gains over the Company’s review year, underperforming by a substantial margin compared to their global counterparts. Despite the region’s positive economic backdrop, concerns over political developments in Europe, the effects of the Euro’s strength against the US Dollar on exporters’ earnings for much of the review year and rising global trade tensions weighed on sentiment towards European equities. European bourses began the year on a relatively flat note. Notwithstanding evidence that the domestic economic environment remained supportive, with the Eurozone economy having grown by 0.60% during the second quarter of 2017, speculation that the European Central Bank (“ECB”) could pare back its QE economic support plan acted as a slight headwind. The prospect of tighter monetary policy in Europe underpinned the Euro versus the US Dollar, thereby acting to dilute Eurozone based companies’ earnings from the US market. Although improving sentiment towards global equities in late 2017 helped European markets to gain ground, domestic political uncertainties acted as a slight drag. Following Angela Merkel’s hollow victory at September’s elections, her Christian Democratic Union (“CDU”) party struggled to form a coalition government following an upturn in support for the anti immigration Alternative for Germany party. Meanwhile, the Spanish Central Bank noted that political uncertainty related to Catalonia’s independence movement was impairing the country’s economic recovery. Nevertheless, economic activity across the single currency zone as a whole remained solid, with second quarter growth revised up to 0.70%, while third quarter growth was estimated at 0.60%. With investors further reassured by the ECB’s cautious approach to paring back QE, trimming monthly purchases from €60 billion to €30 billion from January 2018, European equities followed their global counterparts higher amid higher oil prices and the breakthrough over US tax cuts.

iSHARES VII PLC
Investment Manager’s report (continued)
i S H A R E S V I I P L C A N N U A L R E P O R T [ 1 9 ]
MARKET REVIEW (continued) Equities (continued) European equities (continued) Having peaked in late January 2018, European equities followed their global counterparts sharply lower into early February 2018, with the prospect of faster than expected US interest rate rises likely to hasten the eventual winding down of the Eurozone QE. Meanwhile, although Angela Merkel’s CDU party finally reached an agreement over forming a coalition with the Christian Social Union party, political concerns mounted after the anti EU Five Star and Lega parties performed strongly at March’s Italian elections. Following protracted negotiations, the two parties eventually formed a government led by law professor and political novice Giuseppe Conte. However, with the anti establishment parties’ tax and spending plans seemingly setting Italy on a collision course with EU budget rules, volatility in the Italian stock and bond markets rippled out across wider European and global markets for much of May and June 2018. Although a recovery in the US Dollar, helped by ‘safe haven’ buying and the prospect of faster than expected US interest rate rises, lent some support to export orientated Eurozone based companies, concerns over the growing risk of a global trade war capped the market’s gains. Meanwhile, with Brexit related uncertainties further clouding the region’s political and economic outlook, revised data released in June 2018 showed that Eurozone economic growth slowed to a disappointing 0.40% during the first quarter of 2018. Nevertheless, the ECB announced a further tapering of QE, with the programme to finally end in September 2018. On the final day of the review year, provisional figures suggested that growth had slowed further, with the eurozone economy growing by just 0.30% during the April to June 2018 period, its weakest growth since the second quarter of 2016. European small caps broadly outperformed their larger counterparts, reflecting high levels of confidence over the prospects for the domestic economy, with smaller companies also less exposed to currency induced international earnings erosion during the US Dollar’s slide early in the review year. US Dollar hedged exposure to European equities outperformed Euro and Swiss Franc based exposure over the 12 months as a whole. Italian equities performed broadly in line with wider European markets over the review year, as early outperformance amid optimism over the more positive economic backdrop was subsequently offset by poor post March relative returns as political concerns mounted. Since the launch of iShares FTSE Italia Mid-Small Cap UCITS ETF domestically focused Italian smaller companies underperformed their larger counterparts on concerns that political uncertainty would weigh on economic activity. EURO STOXX 50 equities, representing Europe’s largest listed companies, underperformed broader based European equity indices, largely resulting from poor relative returns from larger caps amid concerns over the effect of the strong Euro during the first half of the review year. UK equities This market review summary covers iShares FTSE 100 UCITS ETF, iShares MSCI UK Small Cap UCITS ETF and iShares MSCI UK UCITS ETF.
Having lagged behind global equities during the first half of the review year amid a slowdown in the domestic economy, UK equities subsequently generated improved returns, boosted by growing optimism that business activity was gradually picking up. Nevertheless, weighed to some extent by political uncertainties amid a lack of clarity over the UK’s future trading relationship with the EU, UK equities generally underperformed compared to their wider global counterparts. Smaller UK companies outperformed their larger peers, partly reflecting their greater reliance on the recovering UK economy, with their focus on the domestic market implying reduced exposure to Brexit related uncertainties. However, the UK’s largest capitalised companies, as represented by the FTSE 100 index, marginally outperformed the wider UK market, reflecting the substantial representation of their earnings that the UK’s biggest companies derive from international operations. UK equities began the review year on a mixed note amid signs that the economy’s post June 2016 EU referendum resilience was gradually dwindling, weighed to some degree by the lack of political clarity over the UK’s future relationship with the EU following the country’s scheduled departure at the end of March 2019. In addition to ‘hard’ data demonstrating the economic slowdown, with the economy growing by 0.20% and 0.30% during the first and second quarters of 2017 respectively, compared to 0.70% during the final quarter of 2016, trading updates from companies such as advertising giant WPP and electricals retailer Dixons Carphone suggested that clients were adopting a more cautious spending approach. Despite ongoing strength in the jobs market, rising inflation and muted pay rises added to the strain on consumer finances, with inflation hitting 3.10% in November 2017, while pay growth held close to 2.50%. Against this backdrop, seeking to bring inflation back to the official 2.00% target, the Bank of England (“BoE”) raised interest rates by 0.25% to 0.50% the same month, effectively reversing the ‘emergency’ cut imposed in the aftermath of the EU referendum. Nevertheless, despite the decidedly mixed domestic economic picture, strength in global equities as the world economic outlook improved helped to lift the UK market, partly reflecting the global earnings footprint of many of the UK’s largest companies.

iSHARES VII PLC
Investment Manager’s report (continued)
[ 2 0 ] i S H A R E S V I I P L C A N N U A L R E P O R T
MARKET REVIEW (continued) Equities (continued) UK equities (continued) UK equities largely tracked the gyrations in global equities around the turn of the calendar year, peaking in late January 2018 as the UK’s relatively large energy sector benefitted from soaring oil prices, then following other markets lower amid concerns over the likely pace of future US interest rate rises. However, disappointing domestic economic data weighed on UK equities returns over much of the first quarter amid ongoing signs that political uncertainties surrounding Brexit were continuing to act as a dampener on consumer and business spending. Data would subsequently show that the UK economy grew by just 0.20% during the first quarter of 2018. Although extreme weather would act as a further drag on activity early in the second quarter, the strength of the jobs market and improving survey data from the dominant services sector triggered speculation that the BoE could soon raise interest rates. Nevertheless, UK equities performed well relative to their global peers over the final months of the review year amid signs that previous pessimism over UK listed companies’ earnings outlook may have been overdone. Notwithstanding a mixed response to PM Theresa May’s proposals to break the Brexit negotiations deadlock, and only a limited pickup in business activity, the BoE duly lifted interest rates to 0.75% in early August 2018. Canadian equities This market review summary covers iShares MSCI Canada UCITS ETF.
Canadian equities produced modest returns, underperforming their global counterparts, largely due to modest relative returns during the first half of the review year. This partly reflected uncertainty over the future of the North America Free Trade Agreement (“NAFTA”), while the relatively low representation of outperforming IT stocks in the Canadian market index also acted as a drag on returns. The Canadian market began the review year on a steady footing, buoyed by a combination of healthy corporate news flow and optimism that the ongoing global economic recovery would continue to support demand for Canadian goods & services. Investors also drew encouragement from the strength of the domestic economy; compared to 0.90% during the first quarter of 2017, the economy grew by 1.10% during the second quarter, according to data released in August 2017. Although this figure would subsequently be revised down to 1.00% and growth in the third quarter of 2017 would slip to just 0.40% as exports fell, firmer global oil prices in late 2017 lent some support to Canadian equities given the country’s relatively large energy sector. The oil & gas sector represents around 21.40% of the MSCI Canada index, compared to approximately 6.30% for the MSCI World index). However, low relative exposure to the IT sector, approximately 4.20% in the Canadian index, compared to around 19.00% in the global index) meant that strong returns from global IT companies in late 2017 were not fully reflected in the Canadian market. After rising broadly in line with global equities around the turn of the calendar year before subsequently tracking their international peers sharply lower into early February, Canadian equities performed poorly in early 2018. Although the strong employment market had helped to support personal consumption, concerns mounted that progressively higher interest rates could weigh on consumer activity. Having raised interest rates by 0.25% in July and September 2017, the Bank of Canada (“BoC”) followed the Federal Reserve's (the "Fed") December move with another 0.25% rise in January 2018. Meanwhile, NAFTA related uncertainty also weighed on investors’ minds as President Trump threatened to withdraw from the trade agreement should Canada and Mexico fail to agree to his proposed changes. Although the Canadian market broadly reflected the recovery in global equities during the second quarter of 2018, with energy and industrial companies leading the gains, concerns persisted over the outlook for consumer activity against the backdrop of subdued economic growth and rising interest rates. Despite ongoing concerns over trade tariffs on exports to the US and confirmation that the economy grew by just 0.30% during the first quarter of 2018, the BoC raised interest rates to 1.50% in July 2018, reflecting rising inflationary pressures.

iSHARES VII PLC
Investment Manager’s report (continued)
i S H A R E S V I I P L C A N N U A L R E P O R T [ 2 1 ]
MARKET REVIEW (continued) Equities (continued) Emerging markets equities This market review summary covers iShares Core MSCI Pacific ex-Japan UCITS ETF, iShares MSCI Brazil UCITS ETF USD (Acc), iShares MSCI EM Asia UCITS ETF, iShares MSCI Korea UCITS ETF USD (Acc), iShares MSCI Mexico Capped UCITS ETF and iShares MSCI Russia ADR/GDR UCITS ETF.
Emerging market equities produced positive returns in the main over the Company’s review year, albeit that substantial gains over the first half of the period were largely reversed as investors’ appetite for risk declined sharply in early 2018. In regional terms, Far East emerging markets broadly outperformed their Latin American peers, with the Mexican and Brazilian markets increasingly impacted by political and economic concerns. However, the strength in oil & gas prices helped the energy rich Russian market to deliver substantial gains. Very supportive global economic news flow helped export orientated emerging market equities to perform well early in the Company’s review year. Although sporadic North Korea related tension impacted on investors’ enthusiasm for markets regarded as higher risk, very encouraging corporate earnings, not least from a range of Far East technology companies, and positive economic data, particularly from China’s industrial and consumer sectors, helped emerging market equities to push higher. Positive political developments in South Korea and Brazil, coupled with rising commodity prices, helped emerging markets to sustain the rally towards the end of 2017. However, Mexican equities lagged behind the broader advance amid rising interest rates as policymakers sought to combat higher inflation. Fears that the US could pull out of NAFTA also had an effect; approximately 84% of Mexican exports are destined for NAFTA partner markets of the US and Canada. Nevertheless, despite Mexico’s woes, wider emerging markets extended their gains into January, as US tax reform and ongoing positive investor sentiment towards riskier assets pushed global equities higher, with the Russian market a particular beneficiary of the country’s agreement with OPEC over production cuts. However, emerging market stocks tumbled from their January 2018 peaks, underperforming even plunging developed market equities amid fears over the potential impact of faster than expected US interest rate rises. Although reassuring economic data shored up Chinese equities to some extent, broader emerging markets fared poorly over the first quarter of 2018 as a whole, partly reflecting a marked reduction in investors’ appetite for risk amid rising global trade tensions. Country specific issues also impacted on investors’ enthusiasm for emerging markets, with Argentina applying to the International Monetary Fund for an emergency loan and Turkey grappling with a slide in the Turkish Lira against the US Dollar, triggering fears over the health of the banking sector exposed to foreign currency loans. Although Mexican equities demonstrated some resilience as populist candidate Andrés Manuel López Obrador, who clinched victory at July 2018’s Presidential election, appeared to moderate his previous anti business rhetoric, Brazilian equities ended the review year on a weak note, as fears over the economic outlook in the face of growing resistance, including significant industrial unrest, to economic reform all but wiped out the market’s earlier gains. Despite their poor returns over much of the second half of the review year, Asia Pacific markets broadly retained some of their previous gains. However, Korean stocks ended lower; despite relief over the marked reductions in tensions with its northern neighbour, fears over the potential impact of a global trade war weighed on sentiment towards export oriented companies during the final weeks of the review year, with Samsung Electronics and steel group POSCO losing ground.
Fixed income US government bonds This market review summary covers iShares $ Treasury Bond 1-3yr UCITS ETF USD (Acc) B, iShares $ Treasury Bond 3-7yr UCITS ETF and iShares $ Treasury Bond 7-10yr UCITS ETF USD (Acc).
US Treasury bond markets lost ground over the Company’s review year, underperforming compared to their broader global government bond counterparts. Given the robust performance of the US economy, with consumer activity underpinned by the tight labour market, and the steady rise in US inflation, investors increasingly priced in a steeper than expected future path for US borrowing costs. Against this backdrop, longer dated bonds underperformed their shorter dated peers over the Company’s review year.

iSHARES VII PLC
Investment Manager’s report (continued)
[ 2 2 ] i S H A R E S V I I P L C A N N U A L R E P O R T
MARKET REVIEW (continued) Fixed income (continued) US government bonds (continued) US Treasury bond prices inched higher in August 2017, underpinned by a combination of subdued US inflation and ‘safe haven’ buying amid rising geopolitical tensions following North Korean belligerence, including a threat to attack the US territory of Guam. Despite a marked pickup in US economic growth from 1.20% during the first quarter of 2017 to a revised 3.10% for the subsequent three months, inflation hit 1.70% in July, compared to 2.70% as recently as the previous February. Nevertheless, growing investor conviction that inflation would rise as US economic growth built momentum would increasingly weigh on US Treasury bond prices over the remainder of 2017. With third quarter 2017 growth picking up to 3.20% and unemployment dipping to a 17 year low of 4.10%, the Fed began to reduce its balance sheet, gradually beginning the reversal of its massive QE program from October 2017. Meanwhile, outgoing Fed Chair Janet Yellen, while admitting that policymakers could not fully explain the subdued pattern of inflation, forecast that, as pricing pressures were nonetheless growing, policymakers should not be overly timid in raising interest rates. With inflation duly rising to 2.20% in November 2017, investors largely priced in December 2017’s 0.25% Fed hike, a move that took benchmark lending costs to 1.50%. Nevertheless, Treasury bond prices slid around the turn of the calendar year following the political breakthrough over sweeping tax cuts and the OPEC/Russia agreement that looked set to underpin energy prices. The bond market weakness gathered pace in mid January 2018 as incoming Fed Chair Jerome Powell delivered an upbeat testimony over the outlook for the US economy, while robust pay and inflation data prompted investors to reassess the likely pace and extent of future US interest rate rises. Nevertheless, Treasury bond markets stabilised over the remainder of the first quarter of 2018. Despite the ongoing strength of the jobs market, concerns that rising global trade tensions could act as a headwind to economic activity lent some support to global bond markets. Signs that the US economy, although continuing to grow, may have been losing some momentum given fears over the possible expansion of new import tariffs on steel and aluminium to cover other goods & services were partly vindicated as economic growth for the first quarter of 2018 eased to 2.20% compared to 2.80% and 2.30% over the third and fourth quarters of 2017. Nevertheless, amid renewed strength in the labour market as the jobless rate dipped to 3.80% in May 2018, inflationary pressures continued to rise, partly reflecting firm oil prices amid supply concerns as President Trump ratcheted up pressure on Iran. Compared to 2.00% in January 2018, inflation soared to 2.90% in June 2018, its highest level in over six years. Against this backdrop the Fed followed up March 2018’s 0.25% interest rate rise with a similar move in June 2018, taking US borrowing costs to 2.00%, while suggesting that two further rises in 2018 were on the agenda. Against this backdrop, US 10 year bond yields rose from 2.30% to 3.00% over the review year, touching their highest level since 2011. European government bonds This market review summary covers iShares € Govt Bond 1-3yr UCITS ETF EUR (Acc), iShares € Govt Bond 3-7yr UCITS ETF and iShares € Govt Bond 7-10yr UCITS ETF EUR (Acc).
European government bond markets produced generally muted performance over the Company’s review year but marginally outperformed relative to their wider global counterparts. Although short dated European government bonds saw modest price declines, their longer dated counterparts generated positive returns, with longer dated bonds’ outperformance of their shorter dated peers most pronounced during the second half of the review year. Despite a jump in Italian bond yields amid concern over the new coalition government’s economic policies, some moderation in Eurozone economic growth and optimism that the rise in inflation should soon fade underpinned sentiment towards longer dated European bonds. However, with the ECB calling an end to QE, and other leading central banks adopting tighter monetary policy, the prospect that Eurozone interest rates could rise during the second half of 2019 weighed to some extent on short dated debt prices. European government bond markets firmed early in the review year. Despite ongoing signs that the Eurozone economy was performing well, North Korea related tension and some easing in inflation underpinned the market. Compared to 2.00% in January 2017, inflation across the single currency zone slipped to 1.50% in August 2017. However, with second quarter economic growth revised up to 0.70% and forward looking surveys increasingly positive, bond markets came under some pressure during the final quarter of 2017 amid speculation that the Eurozone economy no longer warranted exceptional levels of central bank stimulus. However, with inflation remaining in a tight 1.30% to 1.50% range during the final quarter of 2017 and political uncertainty rising as Angela Merkel struggled to form a coalition to lead Germany, Eurozone bond markets held up well relative to their US counterparts in late 2017.

iSHARES VII PLC
Investment Manager’s report (continued)
i S H A R E S V I I P L C A N N U A L R E P O R T [ 2 3 ]
MARKET REVIEW (continued) Fixed income (continued) European government bonds (continued) Nevertheless, having fallen alongside their international counterparts around the turn of the calendar year as energy prices rose and investors assessed the inflationary potential of sweeping cuts to US taxes, Eurozone bond markets stabilised in February and early March 2018. Cushioned to some extent by investors seeking safe havens from volatile stock markets, Eurozone bond markets also found support from a dip in inflation, which fell to just 1.10% in January 2018. Nevertheless, bond markets endured a bout of elevated volatility during the second quarter of 2018 as, following protracted talks, Italy’s Five Star and Lega parties formed a government, with the coalition’s plans over higher spending and lower taxes seemingly setting a collision course with the EU’s deficit rules. Although higher oil prices increasingly fed through to boost Eurozone inflation, which would subsequently jump to 2.00% in June 2018, Eurozone government debt markets, particularly longer dated bonds, showed considerable resilience over the remainder of the review year, even as the ECB finally signaled the end of QE. This reflected investors’ reduced appetite for risk as fears grew over the potential for a global trade war, and a broader slowdown in economic activity. Figures released on the final day of the Company’s review year showed that Eurozone economic growth slowed from 0.40% during the first quarter of 2018 to 0.30% during the second quarter of 2018, compared to revised quarterly growth of 0.70% throughout 2017. BlackRock Advisors (UK) Limited August 2018

iSHARES VII PLC
Board of Directors
[ 2 4 ] i S H A R E S V I I P L C A N N U A L R E P O R T
Paul McNaughton (Irish) Chairman of the Board, Independent non-executive Director, member of the Audit Committee and Nomination Committee (appointed 1 July 2013): Mr. McNaughton has over 25 years’ experience in the Banking/Finance, Fund Management and Securities Processing Industries. In addition Mr. McNaughton spent 10 years with IDA (Ireland) both in Dublin and in the USA marketing Ireland as a location for multinational investment. He went on to establish Bank of Ireland’s IFSC Fund’s business before joining Deutsche Bank to establish their funds business in Ireland. He was overall Head of Deutsche Bank’s Offshore Funds business, including their hedge fund administration businesses primarily based in Dublin and the Cayman Islands, before assuming the role of Global Head of Deutsche’s Fund Servicing business worldwide. Mr. McNaughton left Deutsche Bank in August 2004 after leading the sale of Deutsche’s Global Custody and Funds businesses to State Street Bank and now acts as an advisor and non-executive director for several investment companies and other financial entities in Ireland including several alternative/hedge fund entities. Mr. McNaughton holds an Honours Economics Degree from Trinity College Dublin. He was the founding Chairman of the Irish Funds Industry Association ("Irish Funds") and a member of the Irish Government Task Force on Mutual Fund Administration. He was instrumental in the growth of the funds business in Ireland both for traditional and alternative asset classes. Paul McGowan (Irish) Chairman of the Audit Committee, Independent non-executive Director, Senior Independent Director and Member of the Nomination Committee (appointed 1 July 2013): Mr. McGowan was a financial services tax partner in KPMG (Ireland) for more than 25 years and was Global Head of Financial Services Tax for KPMG (International). He is a former Chairman of both Irish Funds and the IFSC Funds Working Group. He currently holds a number of non-executive directorships including Chairman of AEGON Ireland Plc and Coronation Capital Ltd and is a Director of Epoch Investments Fund Plc. He was appointed to the EU Arbitration Panel on transfer pricing by the Irish Government. Mr. McGowan is a Fellow of the Institute of Chartered Accountants in Ireland and holds a Business Studies degree from Trinity College Dublin and a Diploma in Corporate Financial Management from Harvard Business School. Barry O’Dwyer (Irish) Non-Executive Director and member of the Nomination Committee (appointed 1 July 2013): Mr. O'Dwyer is a Managing Director of BlackRock. He is the Head of Funds Governance for BlackRock's European open-ended fund range and is the Chief Operating Officer for BlackRock's Irish business. He serves as a Director on a number of BlackRock corporate, fund, and management companies in Ireland, Luxembourg, Switzerland and Germany and on BlackRock's UK Life company. He was the chairman of the Irish Funds Industry Association 2014-2015, is a board director of Financial Services Ireland and is a member of An Taoiseach's Financial Services Industry Advisory Committee.
He joined BlackRock Advisors (UK) Limited in 1999 as head of risk management and moved to his present role in 2006. Prior to joining BlackRock Advisors (UK) Limited, Mr. O'Dwyer worked as a risk manager at Gartmore Investment Management and at HypoVereinsbank and National Westminster Bank. Mr. O'Dwyer graduated from Trinity College Dublin with a degree in Business Studies and Economics in 1991. He holds a Chartered Association of Certified Accountants qualification and an MBA from London City University Business School. Teresa O’Flynn (Irish) Non-Executive Director (appointed 6 January 2016): Ms. O’Flynn is a Managing Director at BlackRock and is Global Head of BlackRock Real Assets Sustainable Investing and a senior Portfolio Manager with BlackRock's Global Renewable Power platform. BlackRock Real Assets comprises the Infrastructure and Real Estate platforms, which has 375+ professionals across 25 cities globally, and manages over $40 billion in equity and debt assets and investor commitments. Ms. O’Flynn is responsible for ensuring sustainable investing themes are embedded across BlackRock Real Assets investments, portfolio management, product development, reporting and communications. Ms. O’Flynn joined BlackRock in 2011 to establish the Renewable Power Infrastructure business which currently has $5bn of assets under management ("AUM"). She is responsible for originating investment opportunities, establishing industry partnerships and developing new investment strategies in the renewable power sector. She sits on the World Economic Forum's Future of Energy Council, is a member of the Board of the Terrawatt Initiative and also serves as a Director on BlackRock's Index and Cash Irish fund companies. Prior to joining BlackRock, Ms. O'Flynn was a Senior Corporate Finance Executive at NTR Plc, a private infrastructure developer, operator and business owner. Ms. O'Flynn trained as a Chartered Accountant (FCA) and tax advisor (AITI) with Arthur Andersen and KPMG. Ms. O'Flynn earned a BComm Degree, with first class honors and distinction, from University College Galway, Ireland.

iSHARES VII PLC
Board of Directors (continued)
i S H A R E S V I I P L C A N N U A L R E P O R T [ 2 5 ]
David Moroney (Irish) Non-Executive Director (appointed 15 November 2017): Mr. Moroney is a Managing Director at BlackRock and is the EMEA Product Head for ETF and Index Investments. Mr. Moroney joined BlackRock in January 2017. Prior to assuming his current responsibilities, he worked at Royal Bank of Scotland since 2008 where he held positions including Global Head of Investor Product Structuring and Structured Funds and Chief Operating Officer of Capital Resolution UK. He has over 20 years of experience in securities, derivatives and regulated funds and has had responsibilities in trading, structuring, custom indices, risk and governance. Mr. Moroney holds a Ph.D. in Electromagnetics from Trinity College Dublin, an M.Sc. from the University of Oxford and a B.A. in Mathematics also from Trinity College. Jessica Irschick (British) Non-executive Director (appointed 20 November 2017): Ms. Irschick is a Managing Director at BlackRock and is the Global Head of Institutional Index business within ETF and Index Investments. Ms. Irschick is responsible for the institutional product offering, pricing, and investment strategy for Equity Indexing and for coordinating with Global Fixed Income to have a globally consistent institutional client strategy for Fixed Income Indexing. In addition, she is the Global Head of Equity Index Product Strategy. Ms. Irschick joined BlackRock in November 2016 from Bank of America Merrill Lynch, where she was the Global Head of Sales Strategy of the Equity Division, based in London. Previously, Ms. Irschick was the Global Head of Treasury and Trading for Norges Bank Investment Management (NBIM) where she was responsible for Fixed Income and Equity trading, financing, securities lending and foreign exchange. Prior to her role at NBIM she worked at UBS, Morgan Stanley and Goldman Sachs for over 13 years in a variety of roles in equity trading, sales and client relationship management. Before these roles, Ms. Irschick worked as the Global Head of Equity and Fixed Income trading at Wells Fargo Nikko Investment Advisors in San Francisco, one of the predecessor organisations of BlackRock. Ms. Irschick started her career at Salomon Brothers, where she worked in Tokyo developing algorithms for the Fixed Income and Equity trading desks. Ms. Irschick graduated from Cornell University in 1987 with a Bachelor's degree in Operations Research and Economics.

iSHARES VII PLC
Corporate Governance Statement
[ 2 6 ] i S H A R E S V I I P L C A N N U A L R E P O R T
Introduction
The Board is committed to maintaining the highest standards of corporate governance and is accountable to shareholders for the governance of the Company’s affairs. The Company has voluntarily adopted the governance standards set out in the UK Corporate Governance Code (the “Code”) issued by the Financial Reporting Council (“FRC”) which is applicable to accounting periods beginning on or after 17 June 2016. The Company is also subject to corporate governance practices imposed by the UCITS Regulations which can be obtained from the CBI’s website at http://www.centralbank.ie/regulation/industry-sectors/funds/ucits/Pages/default.aspx and are available for inspection at the registered office of the Company. The Board has considered the principles and recommendations of the Code and has put in place a framework for corporate governance which it believes both adheres to best practice and is appropriate for the Company, given the nature of its structure as an Investment Company. The Code is published by the FRC and is available to download from http://www.frc.org.uk. The Company has also voluntarily adopted the Irish Funds Industry Association Corporate Governance Code for Collective Investment Schemes and Management Companies (Dec 2011) (the "Irish Funds Code") and, in addition, refers to this Code for the financial year under review. The Irish Funds Code can be obtained from the Irish Funds website at https://www.irishfunds.ie/regulatory-technical/corporate-governance. The sole objective of the Company is the collective investment in transferable securities and /or other liquid financial assets referred to in Regulation 68 of the Central Bank UCITS Regulations of capital raised from the public and which operates on the principle of risk spreading. The Articles of Association of the Company provide that the Company may offer separate classes of shares, each representing interests in a Fund comprising a distinct portfolio of investments. The shares of each Fund are issued on different terms and conditions to those of the other Funds. The specific investment objectives and policies of each Fund are formulated by the Directors at the time of the creation of the Fund and any change to a Fund’s investment objective and/or material change to the investment policy of a Fund is subject to the prior consent of Shareholders evidenced by either a majority vote at a meeting of Shareholders of a Fund or by written consent of all the Shareholders. This statement summarises the corporate governance structure and processes in place for the Company for the financial year under review. Compliance
The Board has made the appropriate disclosures in this report to ensure the Company meets its continuing obligations pursuant to the code. The Company has no employees and the Directors are all non-executive. The Board recognises that the shareholders of the Company invest into a regulated Investment Company and considers that the governance structure and operational processes in place for the Company are suitable for an Investment Company. The Board considers that the Company has complied with the relevant provisions contained within the Code throughout this accounting period except, as explained below, where departure from the Code is considered appropriate given the Company’s position as an Investment Company. This Corporate Governance Statement, together with the Statement of Directors’ Responsibilities, describes how the main principles of the Code are applied to the Company. The Code includes provisions relating to:
(i) the appointment and role of the Chief Executive; (ii) executive Directors’ remuneration; (iii) the need for an internal audit function; and (iv) the need to establish a Remuneration Committee. Due to the nature of its structure as an Investment Company, the Board does not consider these provisions appropriate to the Company. Therefore the Company was not compliant with these provisions during and post the financial year under review.

iSHARES VII PLC
Corporate Governance Statement (continued)
i S H A R E S V I I P L C A N N U A L R E P O R T [ 2 7 ]
Compliance (continued)
The Code also includes provisions for the re-election of Directors by shareholders with which the Company was in compliance during the financial year under review. Additionally the Articles of Association provide that retiring Directors are eligible for re-appointment by the other Directors every three financial years. The Board considers that the Company has been in full compliance with the Irish Funds Code during the financial year under review. Board composition
The Board currently consists of six non-executive Directors, two of whom are independent. The Board is committed to maintaining an appropriate balance of skills, experience, independence and knowledge amongst its members. In accordance with the Code, the Board has carried out an assessment based on the independence requirements set out therein and has determined that, in its judgement the Chairman, Mr. Paul McNaughton, and Mr. Paul McGowan are independent within the meaning of those requirements. They are independent of the Manager, the Investment Manager and other third party service providers such as the Administrator and Depositary. The Board has also considered and is satisfied that the presence of two non-executive independent Directors (including the Chairman) is an appropriate balance for the Board. The Board has appointed Mr. Paul McGowan as the Senior Independent Director. The Directors’ biographies, collectively demonstrate a breadth of investment knowledge, business and financial skills which enables them to provide effective strategic leadership, oversight and proper governance of the Company. Delegation of responsibilities
The Directors of the Company have delegated the following areas of responsibility: Management and Administration
The Directors of the Company have delegated the investment management, distribution and administration of the Company and its Funds to the Manager. The Manager has delegated the management of the investment portfolio and distribution of the Company's shares to the Investment Manager. The Investment Manager operates under guidelines determined by the Manager and as detailed in the Company’s prospectus relating to the Company’s Funds. The Investment Manager has direct responsibility for the decisions relating to the day-to-day running of the Company’s Funds and is accountable to the Board of the Manager and the Company for the investment performance of the Funds. The Board has established a Nominations Committee and an Audit Committee. The Directors of the Company have delegated certain functions to these committees. Please see the “Committees of the Board” section in this Corporate Governance Statement for further details. Insurance
The Company has maintained appropriate Directors’ and Officers’ liability insurance cover throughout the financial year. Board’s responsibilities
The Board meets monthly and also on an ad hoc basis as required. All Directors are expected to attend each meeting and the attendance at board and committee meetings during the financial year is set out on the following pages. Directors are provided with relevant papers in advance of each meeting. In addition, electronic copies of meeting papers and other relevant information are available to Directors. If a Director is unable to attend a meeting, they will still receive the supporting papers. During the financial year, ad hoc Board meetings were arranged at short notice and it was not always possible for all Directors to attend. The Board reserves to itself decisions relating to the determination of investment policy and objectives, any change in investment strategy, the appointment and removal of the Company Secretary and entering into any material contracts. The Board also approves the prospectus, circulars to shareholders, listing particulars and other relevant legal documentation. A formal schedule of matters specifically reserved for decision by the Board is maintained.

iSHARES VII PLC
Corporate Governance Statement (continued)
[ 2 8 ] i S H A R E S V I I P L C A N N U A L R E P O R T
Board’s responsibilities (continued)
Any Director who resigns his/her position is obliged to confirm to the Board and the CBI that the resignation is not connected with any issues with or claims against the Company. Furthermore, any Director who has concerns about the running of the Company or a proposed course of action may provide a written statement to the Chairman outlining his/her concerns for circulation to the Board or alternatively may have his/her concerns formally recorded in the minutes of a board meeting. The Board has responsibility for ensuring that the Company keeps proper accounting records which disclose with reasonable accuracy at any time the financial position of the Company and which enable it to ensure that the financial statements comply with the Companies Act 2014 (as amended) and relevant accounting standards. It is the Board’s responsibility to present a balanced and understandable assessment of the Company’s financial position, which extends to interim financial statements and other reports made available to shareholders and the public. The Board is also responsible for safeguarding the assets of the Company and for taking reasonable steps in the prevention and detection of fraud and other irregularities. The Directors have access to the advice and services of the Company Secretary, external counsel and the resources of the Investment Manager should they be needed. Where necessary, in the furtherance of their duties, the Board and individual Directors may seek independent professional advice at the expense of the Manager. Directors’ induction and training
Prior to his/her appointment, each new Director receives a full and formal tailored induction incorporating relevant information regarding the Company and his/her duties and responsibilities as a Director. In addition, a new Director is required to spend some time with representatives of the Investment Manager so that the new Director will become familiar with the various processes which the Investment Manager considers necessary for the performance of his/her duties and responsibilities to the Company. The Company’s policy is to encourage Directors to keep up to date with developments relevant to the Company. The Directors have attended and will continue to attend updates and briefings run by the Investment Manager which are relevant to the Company. The Directors also receive regular briefings from, amongst others, PricewaterhouseCoopers Ireland (the “External Auditors”), investment strategists, depositaries and legal advisors regarding any proposed product developments or changes in laws or regulations that could affect the Company. The Board is supplied with information in a timely manner and in a form and of a quality appropriate to enable it to discharge its duties. The training needs of the Directors are evaluated as part of the annual performance evaluation of the Board. Further information in respect of performance evaluation is provided below. Performance evaluation
The Board formally reviews its performance on an annual basis and an appraisal system has been implemented for the Board, its supporting Committees and the individual Directors, including the Chairman. This evaluation process assists in identifying individual Directors training and development needs. The Board is satisfied with the robustness of the appraisal system and considers the current review and evaluation process adequate. The Board evaluation for 2017 was completed on 14 February 2018. Committees of the Board
The Nominations Committee The Board has established a Nominations Committee comprising a majority of independent Directors. The Nominations Committee comprises of Mr. Paul McNaughton (Chairman), Mr. Paul McGowan and Mr. Barry O’Dwyer. The key objective of the Nominations Committee is to ensure the Board comprises individuals with the appropriate balance of skills, experience, independence and knowledge appropriate to the Company to ensure that it is effective in discharging its responsibilities and oversight of all matters relating to corporate governance. The Nominations committee is responsible for evaluating and nominating for the approval of the Board, candidates to fill Board vacancies as and when they arise. Before a proposal is made to the Board, the Committee members will ensure that the capabilities required for a particular appointment have been considered. They will also ensure that on appointment to the Board, Non-Executive Directors receive a formal letter of appointment setting out clearly what is expected of them in terms of time commitment, committee service and involvement outside Board meetings.

iSHARES VII PLC
Corporate Governance Statement (continued)
i S H A R E S V I I P L C A N N U A L R E P O R T [ 2 9 ]
Committees of the Board (continued)
The Nominations Committee (continued) The terms of reference of the Nominations Committee are available upon request. The Nominations Committee met on 30 November 2017 in order to review the Committee’s terms of reference and its own performance and to review the structure, size and composition of the Board. Diversity Report The Nominations Committee, together with the Board, acknowledges the importance of diversity to enhance its operation. During the selection process the Board and Nominations Committee are committed to selecting those with diversity of business skills, experience and gender and candidates for appointment are considered based on these attributes. The Board’s principle is that each member of the Board must have the skills, experience, knowledge and overall suitability that will enable each director to contribute individually, and as part of the board team, to the effectiveness of the Board. Subject to that overriding principle, the Board believe that diversity of experience and approach, including educational and professional background, gender, age and geographical provenance, amongst board members is of great value when considering overall board balance in making new appointments to the Board. The Boards’ priority is to ensure that it continues to have strong leadership and the relevant skills to deliver the business strategy. The implementation of the Boards diversity policy is monitored by the Nomination Committee which reviews the balance of skills, knowledge, experience and diversity on the Board and leads succession planning for appointments to the Board. The Nominations Committee will ensure that all selection decisions are based on merit and that recruitment is fair and non-discriminatory. The Board’s policy is to aspire to have women make up at least 30% of the Boards’ membership and currently has a female representation of 33%. The current Board composition reflects diverse age, gender, educational and professional backgrounds. Audit Committee The Company has established an Audit Committee which reports directly to the Board and meets regularly throughout the financial year in order to discharge its duties. Further information on how the Audit Committee carried out its duties during the financial year under review is contained in the Audit Committee report. The Board considered that all of the members of the Audit Committee were suitably qualified and had sufficient experience to discharge their responsibilities effectively. Furthermore, Paul McGowan is a qualified accountant with relevant experience in financial matters as they pertain to investment companies. The number of Board and Audit Committee meetings and their attendance by members are set out on the table below:
Attendance Record
Board1
1 August 2017 to 31 July 2018
Audit Committee2 of the Company 1 August 2017 to
31 July 2018
Nominations Committee of the Company 1 August 2017 to
31 July 2018 A* B* A* B* A* B*
Barry O’Dwyer 13 13 N/A N/A 1 1
Paul McNaughton 13 13 13 13 1 1
Paul McGowan 13 13 13 13 1 1
Teresa O'Flynn 13 8 N/A N/A N/A N/A
David Moroney** 10 10 N/A N/A N/A N/A
Jessica Irschick*** 10 6 N/A N/A N/A N/A
* Column A indicates the number of meetings held during the financial year the Director was a member of the Board or Committee and was eligible to attend. Column B indicates the number of meetings attended. ** Appointed 15 November 2017. *** Appointed 20 November 2017. 1 There were 12 scheduled and 1 ad-hoc Board meetings held during the financial year. 2 There were 11 scheduled and 2 ad-hoc Audit Committee meetings held during the financial year.

iSHARES VII PLC
Corporate Governance Statement (continued)
[ 3 0 ] i S H A R E S V I I P L C A N N U A L R E P O R T
Internal Control and Risk Management
The Board is responsible for the risk management and internal controls of the Company and for reviewing their effectiveness, for ensuring that financial information published or used within the business is reliable, and for regularly monitoring compliance with regulations governing the operation of the Company. Particular responsibilities have been delegated to the Audit Committee as outlined in the Audit Committee report. The system is designed to manage rather than eliminate the risk of failure to achieve the Company’s business objectives and can only provide reasonable and not absolute assurance against material misstatement or loss and relies on the operating controls established by the service providers. The Board is also responsible for overseeing the management of the most significant risks through the regular review of risk exposures and related key controls. The Board reviews the Company’s principal risks and the control processes over the risks identified. The control processes cover financial, operational, compliance and risk management, and are embedded in the operations of the Manager, the Investment Manager and other third party service providers including the Administrator and the Depositary. There is a monitoring and reporting process to review these controls, which has been in place throughout the financial year under review and up to the date of this report. The Board can confirm that they have carried out a robust assessment of the principal risks facing the Company, including those that would threaten its business model, future performance, solvency and liquidity, which are identified and explored in greater detail within the section ‘Financial Instruments and Risks’ which forms part of the financial statements. This section also explains how these risks are being managed and mitigated. The Board is responsible for establishing and maintaining adequate internal control and risk management systems of the Company in relation to the financial reporting process. The Company has procedures in place to ensure all relevant accounting records are properly maintained and are readily available, including production of annual and half-yearly financial statements. These procedures include appointing the Administrator to maintain the accounting records of the Company independently of the Investment Manager and the Depositary. The annual and half-yearly financial statements of the Company are required to be approved by the Board of Directors of the Company and filed with the CBI and the LSE. The financial statements are prepared in accordance with accounting standards generally accepted in Ireland, the Companies Act 2014 (as amended) and the UCITS Regulations. The accounting information given in the annual report is required to be audited. The External Auditors’ report, including any qualifications, is reproduced in full in the annual report of the Company. Monitoring and review activities There are procedures designed for monitoring the system of internal control and risk management and to capture and evaluate any failings or weaknesses. Should a case be categorised by the Board as significant, procedures exist to ensure that necessary action is taken to remedy the failings. During the financial year under review the Depositary reported to the Board on a quarterly basis. The Depositary and the Administrator provide an annual Service Organisational Control ("SOC1") Reports outlining an overview of the controls environment adopted and applied by the Depositary and the Administrator to the Investment Manager. The Investment Manager reports annually on it to the Audit Committee of the Company. The Manager receives a report from the Administrator on the internal controls of the administrative operations of the Company and the Administrator reports to the Board on an annual basis. Review of effectiveness The Board has reviewed the effectiveness of the internal control and risk management systems (including financial, operational and compliance controls) in accordance with the Code for the financial year under review and up to the date of approval of the financial statements. The Board is not aware of any significant failings or weaknesses in internal control arising during this review. Had there been any such failings or weaknesses, the Board confirms that necessary action would have been taken to remedy them. Going Concern and Viability Statement
The going concern statement is set out in the Directors’ Report. Remuneration
The Company is an Investment Company and has no employees or executive Directors. The Board believes that the principles of Section D of the Code relating to remuneration do not apply to the Company, except as outlined below, as the Company has no executive Directors. No Director past or present has any entitlement to pensions, and the Company has not awarded any share options or long-term performance incentives to any of them. No element of Directors’ remuneration is performance-related.

iSHARES VII PLC
Corporate Governance Statement (continued)
i S H A R E S V I I P L C A N N U A L R E P O R T [ 3 1 ]
Remuneration (continued)
Those Directors who are also employees of the BlackRock Group are not entitled to receive a Director’s fee. All other Directors have fees paid to them which are set out in service contracts with the Investment Manager. The Board believes that the level of remuneration for those Directors who take a fee properly reflects the time commitment and responsibilities of their roles. The maximum amount of remuneration payable to the Directors is determined by the Board and is set out in the prospectus of the Company. The terms of the aforementioned service contracts are for one financial year and include an assessment of the time commitment expected of each Director. The Directors also have a continuing obligation to ensure they have sufficient time to discharge their duties. The detail of each Director’s, including the Chairman’s, other appointments and commitments are made available to the Board for inspection and all new appointments or significant commitments require the prior approval of the Investment Manager. The Directors, who are employees of the BlackRock Group, have executed letters of appointment which include an assessment of the time commitment expected. Extracts of the service contracts as they relate to the Company and letters of appointment are available for inspection on request and at each Annual General Meeting ("AGM"). Communication with Shareholders
The Company is an Investment Company and the shareholders invest in its range of Funds in order to, inter alia, gain exposure to the expertise of the Investment Manager and its investment strategies. Given the nature of the Company, it is not necessary or desirable for the Chairman or any of the other Directors to discuss investment strategy with shareholders. Furthermore, the Manager has appointed the Investment Manager as distributor and it is this entity which is tasked with actively managing the relationship between the Company and its shareholders. The Board reviews monthly reports on shareholder communications and in addition, the Board reviews reports from the Manager’s compliance function which include updates on shareholder complaints. The Board is responsible for convening the AGM and all other general meetings of the Company. All shareholders have the opportunity to attend and vote at general meetings. Notice of general meetings is issued in accordance with the Companies Act and the Articles of Association of the Company and notice of the AGM is sent out at least 20 working days in advance of the meeting, and any item not of an entirely routine nature is explained in a covering circular. For all other general meetings the notice is sent at least 14 working days in advance. All substantive matters put before a general meeting are dealt with by way of separate resolution. Proxy voting figures are noted by the chairman of the general meeting and the results of each general meeting, including the number of votes withheld, will be announced and made available on the iShares website shortly after the meeting. When it is the opinion of the Board that a significant proportion of votes have been cast against a resolution at any general meeting, the Board will explain when announcing the results what actions it intends to take to investigate and understand the reasoning behind the result. General meetings are managed and run by the Company Secretary. Strategic issues and all operational matters of a material nature are determined by the Board. If the shareholders wish to engage on matters relating to the management of the Company then invariably they will wish to discuss these matters or meet with the Investment Manager. However, the Board will accept requests to make individual Directors available to shareholders. One of the independent Directors is always available to attend general meetings. The Chairman of the Audit and Nominations Committees will be available to attend general meetings and to answer questions, if required, while the Senior Independent Director will be also available to liaise with shareholders, where required. Every holder of participating shares present in person or by proxy who votes on a show of hands is entitled to one vote. On a poll, every holder of participating shares present in person or by proxy is entitled to one vote in respect of each share held by him. The poll may be demanded by the chairman of a general meeting or at least five members present in person or by proxy or by any holder or holders of shares present in person or by proxy representing at least one tenth of the shares in issue having the right to vote at such meeting.

iSHARES VII PLC
Audit Committee Report
[ 3 2 ] i S H A R E S V I I P L C A N N U A L R E P O R T
The Board has established an Audit Committee whose roles and responsibilities are detailed below. Roles and Responsibilities
The main responsibilities of the Audit Committee include considering and recommending to the Board for approval the contents of the interim and annual financial statements, and providing an opinion as to whether the annual financial statements, taken as a whole, are fair, balanced and understandable and provide the information necessary for shareholders to assess the Company’s performance, business model and strategy. The Audit Committee also reviews related information presented within the financial statements, including statements concerning internal controls and risk management. In addition, the Audit Committee is responsible for approving the audit fees of the External Auditor, conducting a review of the External Auditors’ report on the annual financial statements and reviewing and forming an opinion on the effectiveness of the external audit process and audit quality. Other duties include reviewing the appropriateness of the Company’s accounting and reporting to the Board on how it has discharged its responsibilities. There are formal terms of reference in place for the Audit Committee. The terms of reference of the Audit Committee are available to shareholders on request. The Audit Committee has met 13 times during the financial year. These meetings were to consider various items including updates in the regulatory environment as they relate to the financial statements of the Company, updates on the Company’s accounting policies and progress reports on the audit. The significant issues considered by the Audit Committee in relation to the financial statements are discussed below and overleaf. Financial Statements
The Audit Committee reviewed the interim financial statements, annual financial statements and the audit findings presentation from the External Auditors. Significant issues considered in relation to the financial statements
During the financial year, the Audit Committee considered a number of significant issues and areas of key audit risk in respect of the Annual Report and Financial Statements. The Committee reviewed the external audit plan at an early stage and concluded that the appropriate areas of audit risk relevant to the Company had been identified in the audit plan and that suitable audit procedures had been put in place to obtain reasonable assurance that the financial statements as a whole would be free of material misstatements. Below sets out the key areas of risk identified and also explains how these were addressed by the Committee.
1. Valuation The Board has in place a hierarchical structure for the pricing of every asset class of the Company which details the primary, secondary and tertiary pricing sources (the “Pricing Hierarchy”). The Administrator has been appointed for the purposes of valuing each asset class of the Company. The Administrator follows the Pricing Hierarchy in this regard. During the financial year under review, monthly reporting was provided by the Investment Manager in which any exceptions to this process were identified and investigated and referred to the Board. The Audit Committee considers that the procedures that the Board has in place to monitor the Administrator and Investment Manager are adequate and appropriate. The Audit Committee discussed with the External Auditor the results of the financial year end audit procedures over the valuation of investments. No significant exceptions to valuation of the assets were noted during the financial year under review. 2. Existence In order to gain comfort on the existence of the assets of the Company, a daily reconciliation of all asset classes is performed by the Administrator between their records and the separate records held by counterparties, the Depositary and the Investment Manager. During the financial year under review, any material exceptions identified by these reconciliations were reported on a monthly basis by the Investment Manager and quarterly by the Administrator and Depositary. The Depositary also provided a report in relation to the oversight of its global sub-custodian and global custody network and any exceptional items regarding existence of assets of the Company were referred for consideration by the Audit Committee. The Audit Committee considers that the procedures that the Board has in place to monitor the Administrator and Investment Manager are adequate and appropriate. The Audit Committee discussed with the External Auditor the results of the financial year end audit procedures over the existence of investments. No significant exceptions to the existence of the assets were noted during the financial year under review.

iSHARES VII PLC
Audit Committee Report (continued)
i S H A R E S V I I P L C A N N U A L R E P O R T [ 3 3 ]
Roles and Responsibilities (continued)
Significant issues considered in relation to the financial statements (continued)
3. Risk of Management Override The Depositary and Administrator provided reports to the Board on an annual basis on the controls in place to minimise the risk of management override. In addition to this, the Manager has reviewed the SOC1 prepared by the Depositary and Administrator to further ensure that the relevant control procedures were in place to minimise the risk of management override. The SOC1 of the Investment Manager is also presented annually for review. Any exceptions noted were referred to the Audit Committee for further review. No significant exceptions in respect of the risk of management override were noted during the financial year under review. Fair, Balanced and Understandable
The production and audit of the financial statements is a comprehensive process requiring input from a number of different contributors. Following the adoption of the Code by the Company, the Board requested that the Audit Committee advises on whether it believes the financial statements, taken as a whole, are fair, balanced and understandable and provide the information necessary for shareholders to assess the Company’s position and performance, business model and strategy. In doing so the Audit Committee has given consideration to the following:
The comprehensive reviews that are undertaken at different levels in the production process of the financial statements, by the Manager and the Administrator;
The comprehensive review also undertaken during the production process by the Investment Manager;
The comprehensive review undertaken by the Audit Committee that is aimed to ensure consistency, overall balance and appropriate disclosure;
The controls that are in place at the Investment Manager, the Administrator and Depositary, to ensure the completeness and accuracy of the Company’s financial records and the security of the Company’s assets;
The existence of satisfactory SOC1 control reports reviewing the effectiveness of the internal controls of the Investment Manager, the Administrator and the Depositary; and
The timely identification and resolution of any significant audit risks, process errors or control breaches that may have impacted the Company’s NAV and accounting records and how successfully any issues in respect of areas of accounting judgement were identified and resolved.
As a result of the work performed, the Audit Committee has concluded that the financial statements for the financial year ended 31 July 2018, taken as a whole, are fair, balanced and understandable and provide the information necessary for shareholders to assess the Company’s performance, business model and strategy. The Audit Committee has reported on these findings to the Board and recommended the approval of the financial statements to the Board. The Board’s conclusions in this respect are set out in the Statement of Directors’ Responsibilities. External Auditor
To assess the effectiveness of the external audit, members of the Audit Committee work closely with the Investment Manager and the Manager to obtain a good understanding of the progress and efficiency of the audit. Feedback in relation to the audit process and the efficiency of the Investment Manager and the Manager in performing their role is sought from relevant involved parties, notably the audit partner and audit team. The External Auditor is invited to attend the Audit Committee meetings at which the annual financial statements are considered. PricewaterhouseCoopers Ireland, in their capacity as statutory auditor, has acted as the External Auditor for the Company since 20 December 2013 and the lead audit partner rotates every five years to assure independence. To form a conclusion with regard to the independence of the External Auditor, the Audit Committee considers whether their skills and experience make them a suitable supplier of non-audit services and whether there are safeguards in place to ensure that there is no threat to their objectivity and independence in the conduct of the audit resulting from the provision of such services. The audit and assurance services fees are disclosed in note 16 of the financial statements of the Company.

iSHARES VII PLC
Audit Committee Report (continued)
[ 3 4 ] i S H A R E S V I I P L C A N N U A L R E P O R T
External Auditor (continued)
On an annual basis, the External Auditor reviews the independence of its relationship with the Company and reports this to the Board. The Audit Committee also receives information about policies and processes for maintaining independence and monitoring compliance with relevant requirements from the Company’s External Auditors, including information on the rotation of audit partners and staff, details of any relationships between the audit firm and its staff and the Company as well as an overall confirmation from the External Auditors of their independence and objectivity. As a result of its review, the Audit Committee has concluded that PricewaterhouseCoopers Ireland, as External Auditor, is independent of the Company. The Audit Committee has conducted a review of independence of the External Auditor and has in place a pre-approval policy on the engagement of the External Auditor to supply non-audit services. On 16 June 2014, the European parliament and council passed into law a new Audit Directive and Regulation (‘Directive’) which updated the EU regulatory framework on statutory audits. Member states had two years to implement legislation to transpose, adopt and publish the provisions to comply with the directive, and on 15 June 2016 a Statutory Instrument was signed in Ireland that gave effect to the Directive. Accordingly, such legislation will apply to the year-end commencing 1 March 2017, being the first financial year starting on or after 17 June 2016. The legislation covers mandatory audit firm rotation, additional restrictions on the provision of non-audit services, requirements relating to audit committee oversight of the performance of the audit, and new requirements regarding reporting by the Auditor. The Audit Committee conducted a competitive tender process during 2017 for the position of auditor of the Company, resulting in a recommendation, which was endorsed by the Board, that Deloitte be appointed as External Auditor for the financial year commencing 1 August 2018. A resolution proposing this appointment will be presented to shareholders at the November 2018 AGM. The process undertaken to reach this decision involved written submissions and presentations by each of the invited firms. This transition process will continue to be a focus for the Board in 2018. Internal Audit
The Board considers it appropriate for the Company not to have its own internal audit function as all of the management and administration of the Company is delegated to the Manager, Investment Manager, Administrator and Depositary. The internal audit report prepared by the Investment Manager is provided to the Audit Committee on a quarterly basis. Whistleblowing Policy
The Investment Manager has a “Whistleblowing” policy under which its staff, in confidence, may raise concerns about possible improprieties in matters of financial reporting or other matters insofar as they may affect the Company. As the Company does not have any employees, the Board review this policy on an annual basis and have adopted this policy as the Company’s “Whistleblowing” policy. Audit Committee Effectiveness
The performance of the Audit Committee is reviewed at least annually. The Audit Committee evaluation for 2017 was completed on 14 February 2018. Paul McGowan Chairman of the Audit Committee 28 November 2018

iSHARES VII PLC
Statement of Directors’ Responsibilities
i S H A R E S V I I P L C A N N U A L R E P O R T [ 3 5 ]
The Directors are responsible for preparing the annual report and the financial statements in accordance with Irish law and the European Communities (Undertakings for Collective Investment in Transferable Securities) Regulations 2011 (as amended) (the "UCITS Regulations"). Irish law requires the Directors to prepare financial statements for each financial year that give a true and fair view of the Company’s assets, liabilities and financial position as at the end of the financial year and of the profit or loss of the Company for the financial year. Under that law the Directors have prepared the financial statements in accordance with Generally Accepted Accounting Practice in Ireland (accounting standards issued by the FRC of the UK, including Financial Reporting Standard 102 "The Financial Reporting Standard applicable in the UK and Republic of Ireland" and issued by the FRC). Under Irish law, the Directors shall not approve the financial statements unless they are satisfied that they give a true and fair view of the Company’s assets, liabilities and financial position as at the end of the financial year and the profit or loss of the Company for the financial year. In preparing these financial statements, the Directors are required to:
select suitable accounting policies and then apply them consistently;
make judgements and estimates that are reasonable and prudent;
state whether the financial statements have been prepared in accordance with applicable accounting standards and identify the standards in question, subject to any material departures from those standards being disclosed and explained in the notes to the financial statements; and
prepare the financial statements on a going concern basis unless it is inappropriate to presume that the Company will continue in business.
The Directors are responsible for keeping adequate accounting records that are sufficient to:
correctly record and explain the transactions of the Company;
enable, at any time, the assets, liabilities, financial position and profit or loss of the Company to be determined with reasonable accuracy; and
enable the Directors to ensure that the financial statements comply with the Companies Act 2014 (as amended) and enable those financial statements to be audited.
The measures taken by the Directors to secure compliance with the Company’s obligation to keep adequate accounting records are the appointment of State Street Fund Services (Ireland) Limited for the purpose of maintaining adequate accounting records. Accordingly, the accounting records are kept at the following address on behalf of the Administrator: State Street Fund Services (Ireland) Limited 78 Sir John Rogerson’s Quay Dublin 2 Ireland The Directors are also responsible for safeguarding the assets of the Company and hence for taking reasonable steps for the prevention and detection of fraud and other irregularities. The Directors have entrusted the assets of the Company to the Depositary for safekeeping in accordance with the Memorandum and Articles of Association of the Company. In this regard the Directors have appointed State Street Custodial Services (Ireland) Limited as Depositary pursuant to the terms of the Depositary Agreement. The address at which this business is conducted is as follows: State Street Custodial Services (Ireland) Limited 78 Sir John Rogerson’s Quay Dublin 2 Ireland

iSHARES VII PLC
Statement of Directors’ Responsibilities (continued)
[ 3 6 ] i S H A R E S V I I P L C A N N U A L R E P O R T
Under applicable law and regulations, the Directors are also responsible for preparing a corporate governance statement that complies with that law and those regulations. The financial statements are published on the www.ishares.com website. The Directors, together with the Manager and the Investment Manager are responsible for the maintenance and integrity of the financial information included in this website. Legislation in the Republic of Ireland governing the presentation and dissemination of the financial statements may differ from legislation in other jurisdictions. The Directors confirm to the best of their knowledge, that:
The annual report and financial statements of the Company and the Funds are prepared in accordance with accounting standards generally accepted in Ireland, the Companies Act and the UCITS Regulations and disclose with reasonable accuracy the financial position of the Company and give a true and fair view of the assets, liabilities and financial position and profit or loss of the Company and Funds for the financial year;
The annual report and financial statements of the Company and the Funds include a fair review of the development and performance of the business and the position of the Company together with a description of the principal risks and uncertainties that it faces.
The Code also requires Directors to ensure that the annual report and financial statements are fair, balanced and understandable and provide the information necessary for shareholder to assess the Company’s position and performance, business model and strategy. In order to reach a conclusion on this matter, the Board of Directors have requested that the Audit Committee advise on whether they consider that the financial statements fulfil these requirements. The process by which the Audit Committee has reached these conclusions is set out in the Audit Committee report. As a result of a comprehensive review, the Directors have concluded that the financial statements for the financial year ended 31 July 2018, taken as a whole, are fair, balanced and understandable and provide the information necessary for shareholder to assess the Company’s performance, business model and strategy. Directors’ Compliance Statement In accordance with Section 225 of the Companies Act 2014 (as amended), the Directors are required to acknowledge that the Company is in compliance with its relevant obligations. The Directors further confirm that, based on the procedures implemented and review process established, they have used all reasonable endeavors to secure the Company’s compliance with the following obligations and requirements: 1. A compliance policy has been prepared setting out the Company’s procedures (that, in the Directors’ opinion, are appropriate to the Company)
for ensuring compliance by the Company with its relevant obligations;
2. An adequate structure is in place, that in the Directors’ opinion, is designed to secure material compliance with the Company’s relevant obligations; and
3. An annual review procedure has been put in place to review the Company’s relevant obligation and ensure a structure is in place to comply with these obligations.
On behalf of the Board of Directors Paul McNaughton Paul McGowan Director Director 28 November 2018 28 November 2018

iSHARES VII PLC
Directors’ Report
i S H A R E S V I I P L C A N N U A L R E P O R T [ 3 7 ]
The Directors present the financial statements for the financial year from 1 August 2017 to 31 July 2018. Review of Business and Future Developments
The financial statements have been prepared in accordance with applicable Irish law and Generally Accepted Accounting Practice in Ireland including the accounting standards issued by the FRC and comply with the Irish Companies Act 2014 (as amended) and the UCITS Regulations. The specific investment objectives and policies, as set out in the Investment Manager’s report, of each Fund are formulated by Directors at the time of the creation of the Fund. Investors in a Fund are expected to be informed investors who have taken professional advice, are able to bear capital and income risk, and should view investment in a Fund as a medium to long term investment. A description of the Funds, market review and market outlook can be found in the Background section and the Investment Manager’s report. Market review encompasses tracking error and tracking difference disclosures which are key metrics as to how well the Funds have been managed against their benchmark indices. Risk management objectives and policies
The financial instruments and risks facing the Company are set out on pages 76 to 98. The Company’s corporate governance statement is set out on pages 26 to 31. Results and Dividends
The results and dividends for the financial year are set out in the income statement on pages 47 to 54. Subsequent Events
The subsequent events which have occurred since the balance sheet date are set out in note 17 of the notes to the financial statements of the Company. Directors’ and Company Secretary’s Interests and Related Party Transactions
The Directors and Company Secretary had no interest in the shares of the Company during the financial year ended 31 July 2018 other than those disclosed in the related party transactions note 15 of the financial statements of the Company. No Director had at any time during the financial year, a material interest in any contract of significance, during or at the end of the financial year in relation to the business of the Company. All related party transactions are set out in note 15 of the notes to the financial statements of the Company. Board of Directors
The Board of Directors of the Company and their biographies are set out on pages 24 to 25. Statement of Directors’ Responsibilities
The Statement of Directors’ Responsibilities in respect of the financial statements is set out on pages 35 and 36. Going Concern
The financial statements of the Company have been prepared on a going concern basis. The Company is able to meet all of its liabilities from its assets. The performance, marketability and risks of the Funds are reviewed on a regular basis throughout the financial year. Therefore the Directors believe that the Company will continue in operational existence for the foreseeable future and is financially sound. The Directors are satisfied that, at the time of approving the financial statements, it is appropriate to adopt the going concern basis in preparing the financial statements of the Company.

iSHARES VII PLC
Directors’ Report (continued)
[ 3 8 ] i S H A R E S V I I P L C A N N U A L R E P O R T
Viability Statement
The updated Code includes a proposal for companies to include a “Viability Statement” addressed to shareholders with the intention of providing an improved and broader assessment of long term solvency and liquidity. The Code does not define “long term” but expects the period to be longer than 12 months with individual companies choosing a financial period appropriate to the nature of their own business. The Board conducted this review for the financial period up to the AGM in 2021, being a three year period from the date that this annual report will be approved by Shareholders. The reason the Directors consider three years to be an appropriate financial period to review is that they do not expect there to be any significant change in the Company’s current principal risks and adequacy of the mitigating controls during that financial period. Furthermore, the Directors do not envisage any change in the objective of the Company, as disclosed in the Background section of the annual report and audited financial statements, or any other events that would prevent the Company from continuing to operate over that financial period as the Company’s assets are sufficiently liquid and the Company intends to continue to operate as an Investment Company. This financial period has been chosen, as a financial period longer than three years creates a level of future uncertainty for which a Viability Statement cannot, in the Directors’ view, be made meaningfully. In making this assessment the Board has considered the following factors:
the Company’s principal risks as set out in the Financial Instruments and Risks section of the financial statements;
the ongoing relevance of the Company’s objective in the current environment; and
the level of investor demand for the Funds offered by the Company. The Board has also considered a number of financial metrics in its assessment, including:
the level of ongoing charges, both current and historic;
the level of capital activity, both current and historic;
the level of income generated;
the liquidity, tracking error and tracking difference of each Fund.
The Board has concluded that the Company would be able to meet its ongoing operating costs as they fall due as a consequence of:
a diverse product offering that meets the needs of investors;
overheads which comprise a small percentage of net assets. Based on the results of their analysis, the Directors have a reasonable expectation that the Company will be able to continue in operation and meet its liabilities as they fall due over the financial period of their assessment. Independent Auditors
So far as the Directors are aware, there is no relevant audit information of which the Company’s auditors are unaware. The Directors have taken all the steps that should have been taken as Directors in order to make themselves aware of any relevant audit information and to establish that the Company’s auditors are aware of that information. Following the 2017 audit tender process, the Directors recommend the appointment of Deloitte as independent auditors, in accordance with section 382 of the Companies Act 2014 (as amended). On behalf of the Board of Directors Paul McNaughton Paul McGowan Director Director 28 November 2018 28 November 2018

iSHARES VII PLC
Depositary’s report to the shareholders
i S H A R E S V I I P L C A N N U A L R E P O R T [ 3 9 ]
We have enquired into the conduct of iShares VII plc (‘the Company’) for the financial year ended 31 July 2018, in our capacity as Depositary to the Company. This report including the opinion has been prepared for and solely for the shareholders in the Company as a body, in accordance with Regulation 34, (1), (3) and (4) in Part 5 of the UCITS Regulations, and for no other purpose. We do not, in giving this opinion, accept or assume responsibility for any other purpose or to any other person to whom this report is shown. Responsibilities of the Depositary
Our duties and responsibilities are outlined in Regulation 34, (1), (3) and (4) in Part 5 of the UCITS Regulations. One of those duties is to enquire into the conduct of the Company in each annual accounting period and report thereon to the shareholders. Our report shall state whether, in our opinion, the Company has been managed in that financial period in accordance with the provisions of the Company’s Constitution (the "Constitution") and the UCITS Regulations. It is the overall responsibility of the Company to comply with these provisions. If the Company has not so complied, we as Depositary must state why this is the case and outline the steps which we have taken to rectify the situation. Basis of Depositary opinion
The Depositary conducts such reviews as it, in its reasonable opinion, considers necessary in order to comply with its duties as outlined in Regulation 34, (1), (3) and (4) in Part 5 of the UCITS Regulations and to ensure that, in all material respects, the Company has been managed: (i) In accordance with the limitations imposed on its investment and borrowing powers by the provisions of the Company’s Constitution and the
UCITS Regulations ; and
(ii) Otherwise in accordance with the Company’s constitutional documentation and the appropriate regulations. Opinion
In our opinion, the Company has been managed during the financial year, in all material respects: (i) in accordance with the limitations imposed on the investment and borrowing powers of the Company by the Constitution, the UCITS
Regulations and the Central Bank (Supervision and Enforcement) Act 2013 (Section 48(1)) (Undertakings for Collective Investment in Transferable Securities) Regulations 2015 (‘the Central Bank UCITS Regulations’); and
(ii) otherwise in accordance with the provisions of the Constitution, the UCITS Regulations and the Central Bank UCITS Regulations. For and on behalf of State Street Custodial Services (Ireland) Limited 78 Sir John Rogerson’s Quay Dublin 2 Ireland 28 November 2018

Into
P r i cT : + C h a [ 4 0 ]
ReOpiIn ou
We hcom
Our BasWe c
Our repo
Ind
We rIrelaresp
To thCom
We h
dependthe me
c e w a t e r h o u s+ 3 5 3 ( 0 ) 1 7 9
a r t e r e d A c c o
] i S H A R E S
port on theinion ur opinion, iSha
give a trueand of the
have beenFinancial UK and R
have been(Undertak
have audited theprise:
the Balan the Incom the Statem the Sched the notes
policies.
opinion is consi
sis for opiniconducted our a
responsibilities ort. We believe t
dependence
remained indepnd, which includonsibilities in ac
he best of our kmpany.
have provided n
dent auembers
e C o o p e r s , O9 2 6 0 0 0 , F :
u n t a n t s
V I I P L C A N
e audit of th
res VII plc’s fina
e and fair view oeir results for then properly prepaReporting Coun
Republic of Irelann properly prepakings for Collect
e financial state
ce sheet as at 3me statement forment of changedule of investmeto the financial
istent with our re
on audit in accorda
under ISAs (Irethat the audit ev
endent of the Cdes IAASA’s Ethccordance with
nowledge and b
no non-audit ser
uditors’ s of iSh
O n e S p e n c e r + 3 5 3 ( 0 ) 1 7
N U A L R E P O
he financia
ancial statemen
of the Companye year then endared in accordancil of the UK, innd” and Irish lawared in accordative Investment
ements, included
31 July 2018; r the year then es in net assets aents for each of statements for
eporting to the A
ance with Interna
eland) are furthevidence we have
Company in accohical Standard athese requireme
belief, we declar
rvices to the Co
report ares VI
D o c k , N o r t h7 9 2 6 2 0 0 , w w
R T
al statemen
ts:
y’s and Funds’ (ed;
ance with Generncluding Financw); and
ance with the reqin Transferable
d within the Ann
ended; attributable to rethe Funds as athe Company a
Audit Committe
ational Standard
er described in te obtained is su
ordance with theas applicable toents.
re that non-aud
ompany in the pe
II plc
h W a l l Q u a y ,w w . p w c . c o m /
nts
(as listed on pag
rally Accepted Acial Reporting St
quirements of the Securities) Reg
nual report and
edeemable partat 31 July 2018; and for each of i
ee.
ds on Auditing (
the Auditors’ resufficient and app
e ethical requireo listed public int
it services proh
eriod from 1 Au
D u b l i n 1 , I r/ i e
ge 8) assets, lia
Accounting Practandard 102 “Th
he Companies Agulations 2011
audited financia
ticipating sharehand
its Funds, which
(Ireland) (“ISAs
sponsibilities forpropriate to prov
ements that areterest entities, a
ibited by IAASA
gust 2017 to 31
r e l a n d , I . D . E
abilities and fina
ctice in Ireland (ahe Financial Re
Act 2014 and th(as amended).
al statements (th
holders for the y
h include a desc
(Ireland)”) and a
r the audit of thevide a basis for o
relevant to our and we have fulf
A’s Ethical Stand
July 2018.
E . B o x N o . 1
ancial position as
(accounting staneporting Standar
he European Co
he “Annual Rep
year then ended
cription of the si
applicable law.
e financial stateour opinion.
audit of the finafilled our other e
dard were not p
3 7
s at 31 July 201
ndards issued brd applicable in
ommunities
port”), which
d;
gnificant accou
ments section o
ancial statemenethical
provided to the
18
by the the
nting
of our
nts in

Into
P r i cT : + C h a
OurOve
The
As pwe loall ofby th
Key
Key of thauditefforcontematt
Key
Exis
See
for
TheBala201 Thiselem
dependthe me
c e w a t e r h o u s+ 3 5 3 ( 0 ) 1 7 9
a r t e r e d A c c o
r audit apprerview
e scope of o
part of designingooked at where f our audits, we he directors that
y audit matt
audit matters ae current periodtors, including trts of the engageext of our audit ers. This is not
y audit matter
stence of finan
e accounting p
further details
e financial assetance Sheet of e8.
s is considered ment of the finan
dent auembers
e C o o p e r s , O9 2 6 0 0 0 , F :
u n t a n t s
roach
our audit
g our audit, we dthe directors malso addressed
t represented a
ters
re those matterd and include thhose which hadement team. Thof the financial a complete list
ncial assets at
olicy a) of the
.
ts at fair value theach Fund are h
a key audit matncial statements
uditors’ s of iSh
O n e S p e n c e r + 3 5 3 ( 0 ) 1 7
Mat
Aud
Key
determined matmade subjective d the risk of manrisk of material
s that, in the auhe most significad the greatest efhese matters, anstatements as aof all risks ident
fair value thro
Notes to the fin
hrough profit or held in the Fund
tter as it represes.
report ares VI
D o c k , N o r t h7 9 2 6 2 0 0 , w w
eriality
Overall materiCompany’s Fu
dit scope
The CompanyBlackRock Assresponsibilitiesscope of our ainvolvement ofthe industry in level.
y audit matters
Existence of fiValuation of fin
eriality and assejudgements, fornagement overrmisstatement d
ditors’ professioant assessed risffect on: the ovend any commena whole, and in tified by our aud
ugh profit or lo
nancial statem
loss included in's name at 31 J
ents the principa
II plc (c
h W a l l Q u a y ,w w . p w c . c o m /
ality: 50 basis punds.
y is an open-endset Managemens with regards to
audit taking into f the third partie which the Com
nancial assets nancial assets a
essed the risks r example the sride of internal cdue to fraud.
onal judgementsks of material merall audit stratents we make onforming our op
dit.
How o
oss
ments
n the July
al
We obinvestmto the
continued
D u b l i n 1 , I r/ i e
i S
points of Net As
ded investment nt Ireland Limiteo the day-to-dayaccount the typ
es referred to ovmpany operates.
at fair value throat fair value thro
of material misselection of prici
controls, includin
, were of most smisstatement (wegy; the allocatio
the results of oinion thereon, a
our audit addre
btained indepenment portfolio haccounting reco
d)
r e l a n d , I . D . E
H A R E S V I I
set Value ("NAV
Company with ved (the “Managey management
pes of investmenverleaf, the acco We look at eac
ough profit or loough profit or los
statement in theng sources to vng evaluating w
significance in thwhether or not don of resources our procedures tand we do not pr
essed the key a
dent confirmatioeld at 31 July 2ords.
E . B o x N o . 1
P L C A N N U A
V") at 31 July 20
variable capital er”) to manage cof the Compannts within the Founting processch of the Funds
oss. ss.
e financial statevalue the investmwhether there wa
he audit of the fdue to fraud) ide
in the audit; anthereon, were arovide a separa
audit matter
on from the Dep2018, agreeing t
3 7
L R E P O R T
018 for each of
and engages certain duties ay. We tailored thunds, the
ses and controlsat an individua
ments. In particment portfolio. Aas evidence of b
financial statementified by the nd directing the addressed in theate opinion on th
positary of the he amounts hel
[ 4 1 ]
the
nd he
s, and l
cular, As in bias
ents
e hese
ld

Into
P r i cT : + C h a [ 4 2 ]
Key
Key
Val
See
fina
TheBalaline
Thiselem
Ho
We ttakin
As aattrib
The enga
The Servbehaof thinto ainter
Ma
The qualfinanstate
Base
Over
Rati
We aNAVmiss
dependthe me
c e w a t e r h o u s+ 3 5 3 ( 0 ) 1 7 9
a r t e r e d A c c o
] i S H A R E S
y audit matt
y audit matter
uation of finan
e accounting p
ancial statemen
e financial assetance Sheet of ewith Generally
s is considered ment of the finan
w we tailor
tailored the scopng into account t
at 31 July 2018 tbutable to redee
Directors controages the Manag
Manager has avices (Ireland) Lalf by the Admine Company's asaccount the nat
raction with the A
teriality
scope of our auitative considera
ncial statement ements as a who
ed on our profes
rall materiality
onale for benc
agreed with the V, for NAV per sstatements below
dent auembers
e C o o p e r s , O9 2 6 0 0 0 , F :
u n t a n t s
V I I P L C A N
ters (continu
ncial assets at f
olicy a) and no
nts for further
ts at fair value theach Fund at 31Accepted Acco
a key audit matncial statements
red the aud
pe of our audit tthe structure of
there are 30 Fuemable participa
ol the affairs of tger to manage c
lso delegated cimited (the 'Adm
nistrator. The Cossets. In establiture, likelihood aAdministrator, a
udit was influencations, helped uline items and dole.
ssional judgeme
y and how we d
chmark applied
Audit Committehare impacting w that amount t
uditors’ s of iSh
O n e S p e n c e r + 3 5 3 ( 0 ) 1 7
N U A L R E P O
ued)
fair value throu
ote 4(e) of the N
details.
hrough profit or July 2018 are v
ounting Principle
tter as it represes.
dit scope
to ensure that wthe Company, t
nds in operationating shareholde
the Company acertain duties an
certain responsibministrator'). Theompany has appishing the overaand potential maand we assesse
ced by our applus to determine disclosures and
ent, we determin
determined it
d
ee that we wouldifferences (20
that, in our view
report ares VI
D o c k , N o r t h7 9 2 6 2 0 0 , w w
R T
ugh profit or lo
Notes to the
loss included invalued at fair va
es in Ireland.
ents the principa
we performed enthe accounting
n. The Companyers are an aggre
nd are responsnd responsibilitie
bilities to BlackRe financial statepointed State Sall approach to oagnitude of any
ed the control en
ication of materthe scope of ouin evaluating th
ned materiality f
50 basis pointhe CompanWe have appinvestors wit
d report to them17: 5 basis poin
w, warranted rep
II plc (c
h W a l l Q u a y ,w w . p w c . c o m /
How o
oss
n the alue in
al
We tesvaluat
nough work to bprocesses and
y's Balance sheegation of the p
ible for the overes with regards
Rock Advisors (ements, which reStreet Custodial our audit we assy misstatement. nvironment in pl
riality. We set ceur audit and the he effect of miss
for the financial
nts (2017: 50 bay’s Funds. plied this benchth a total return
m misstatementsnts of each Fundporting for qualit
continued
D u b l i n 1 , I r/ i e
our audit addre
sted the investmion of investmen
be able to give acontrols, and th
eet, Income statpositions and res
rall investment pto the day to da
(UK) Limited (themain the respoServices (Irelansessed the risk As part of our rlace at the Adm
ertain quantitativnature, timing a
statements, both
statements of e
asis points) of N
hmark because at a Fund level
s identified durind's NAV, for NAative reasons.
d)
r e l a n d , I . D . E
essed the key a
ment portfolios bnts to third party
an opinion on thhe industry in wh
tement, and Stasults of the Fund
policy which is day management
e 'Investment Monsibility of the Dnd) Limited (the of material missisk assessmentinistrator.
ve thresholds foand extent of ouh individually an
each of the Com
Net Asset Value
the main object
ng our audit aboAV per share imp
E . B o x N o . 1
audit matter
by independently vendor source
he financial statehich it operates
atement of chands.
determined by tt of the Compan
Manager') and toDirectors, are p'Depositary') to
statement at a Ft, we considered
or materiality. Thur audit procedund in aggregate
mpany’s Funds
e ("NAV") at 31 J
tive of the Comp
ove 5 basis poinpacting differen
3 7
y agreeing the es.
ements as a wh.
ges in net asse
hem. The Compny.
o State Street Frepared on thei
o act as DepositFund level, takind the Company'
hese, together wures on the indivon the financia
as follows:
July 2018 for ea
pany is to provid
nts of each Fundces) as well as
ole,
ets
pany
und r ary ng 's
with vidual l
ach of
de
d's

Into
P r i cT : + C h a
Goi
In ac
Rep
We attestatadostatuncovefina
RepThe our aotheassuconsappeprocbasefact.
With
Base(CA1 Dire
Cor
dependthe me
c e w a t e r h o u s+ 3 5 3 ( 0 ) 1 7 9
a r t e r e d A c c o
ing concern
ccordance with
porting obligat
are required to ention to in respetements about wopt the going contements and thecertainties to ther a period of at ncial statement
porting on other informatio
auditors’ report r information an
urance thereon. sider whether thears to be mateedures to concl
ed on the work wWe have nothin
respect to the
ed on the respo14) require us to
ectors’ Repo
In our opin31 July 20
Based on oidentified a
rporate Gov
In our opinthe internaStatement,2014. (CA1
Based on ostatementsmanageme
dent auembers
e C o o p e r s , O9 2 6 0 0 0 , F :
u n t a n t s
n
ISAs (Ireland) w
ion
report if we havect of the direct
whether the direncern basis of a
e directors’ idene Company’s ableast twelve mo
ts.
other infoon comprises althereon. The di
nd, accordingly, In connection w
he other informarially misstated.lude whether thwe have performng to report bas
Directors’ Repo
nsibilities descro also report ce
ort
nion, based on th18 is consistent
our knowledge aany material mis
vernance Sta
nion, based on thal control and ris, is consistent w14)
our knowledge as, we have not ient systems in r
uditors’ s of iSh
O n e S p e n c e r + 3 5 3 ( 0 ) 1 7
we report as foll
ve anything mattors’ statement iectors considereaccounting in prtification of any
bility to continue onths from the d
rmation l of the informatrectors are respwe do not expr
with our audit ofation is materiall. If we identify aere is a materiamed, we concludsed on these res
ort, we also cons
ribed above andrtain opinions a
he work undertat with the financ
and understandsstatements in t
atement
he work undertask managementwith the financia
and understanddentified materirelation to the fin
report ares VI
D o c k , N o r t h7 9 2 6 2 0 0 , w w
ows:
terial to add or din the financial
ed it appropriatereparing the finamaterial as a going con
date of approval
tion in the Annuponsible for the ress an audit opf the financial stay inconsistent w
an apparent matal misstatement de that there is sponsibilities.
sidered whether
d our work undend matters as d
aken in the courcial statements a
ding of the Comphe Directors’ Re
aken in the court systems in relal statements an
ding of the Compial misstatemennancial reporting
II plc (c
h W a l l Q u a y ,w w . p w c . c o m /
Outco
draw
e to ancial
ncern l of the
We habecaustatemas a g
ual report and auother informatio
pinion or, excepttatements, our rwith the financiaterial inconsisteof the financial a material miss
r the disclosure
ertaken in the codescribed below
rse of the audit,and has been p
pany and its eneport. (CA14)
rse of the audit ation to the finannd has been pre
pany and its ennts in the descripg process inclu
continued
D u b l i n 1 , I r/ i e
i S
ome
ave nothing matse not all future
ment is not a guaoing concern.
udited financial on. Our opinion t to the extent o
responsibility is al statements or ncy or material statements or a
statement of this
s required by th
ourse of the audw (required by IS
the informationrepared in acco
vironment obtai
of the financial ncial reporting ppared in accord
vironment obtaiption of the maided in the Corp
d)
r e l a n d , I . D . E
H A R E S V I I
erial to add or toe events or condarantee as to th
statements otheon the financia
otherwise explicito read the otheour knowledge misstatement, w
a material missts other informati
he Companies A
dit, ISAs (IrelandSAs (Ireland) un
n given in the Diordance with app
ined in the cour
statements, theprocess includeddance with sectio
ined in the courn features of theorate Governan
E . B o x N o . 1
P L C A N N U A
o draw attentionditions can be phe Company’s a
er than the final statements doitly stated in thiser information a obtained in thewe are requiredtatement of the ion, we are requ
Act 2014 have b
d) and the Compnless otherwise
irectors’ Reportplicable legal re
rse of the audit,
e description of d in the Corporaon 1373(2)(c) o
rse of the audit oe internal contronce Statement.
3 7
L R E P O R T
n to. However, redicted, this bility to continue
ncial statementsoes not cover thes report, any fornd, in doing so,
e audit, or otherwd to perform other informatiouired to report th
been included.
panies Act 2014stated).
for the year enequirements. (CA
we have not
the main featureate Governanceof the Companie
of the financial ol and risk (CA14)
[ 4 3 ]
e
s and e rm of wise
on. If, hat
4
ded A14)
es of e es Act

Into
P r i cT : + C h a [ 4 4 ]
Cor
Thethe
As arepo
We h
Oth
As a
We h ReRes
As ein ac
The are f
dependthe me
c e w a t e r h o u s+ 3 5 3 ( 0 ) 1 7 9
a r t e r e d A c c o
] i S H A R E S
rporate Gov
In our opinsection 137Diversity In(CA14)
e directors’ solvency o
a result of the dirort to you if we h
The directothe Compa
The disclos The directo
period theyexpectationassessmen
have nothing to
her Code Pro
a result of the dir
The statemunderstandperformancperforming
The sectiocommunica
have nothing to
sponsibilitisponsibilitie
explained more fccordance with t
directors are alsfree from materi
dent auembers
e C o o p e r s , O9 2 6 0 0 0 , F :
u n t a n t s
V I I P L C A N
vernance Sta
nion, based on th73(2)(a),(b),(e) nformation by ce
assessmenor liquidity o
rectors’ voluntahave anything m
ors’ confirmationany, including thsures in the Annors’ explanationy have done so n that the Compnt, including any
report in respe
ovisions
rectors’ volunta
ment given by thdable, and provce, business mo
g our audit. n of the Annual ated by us to th
report in respe
ies for the es of the Dir
fully in the Statethe applicable fr
so responsible fial misstatemen
uditors’ s of iSh
O n e S p e n c e r + 3 5 3 ( 0 ) 1 7
N U A L R E P O
atement (co
he work undertaand (f) of the Certain large und
t of the prosof the Compa
ry reporting on material to add o
n on page 30 ofhose that would nual Report tha
n on page 38 of and why they c
pany will be abley related disclos
ct of this respon
ry reporting on
he directors, on ides the informaodel and strateg
Report on pagee Audit Commit
ct of this respon
financial srectors for th
ement of Directoramework and f
for such internant, whether due
report ares VI
D o c k , N o r t h7 9 2 6 2 0 0 , w w
R T
ontinued)
aken during the ompanies Act 2ertakings and g
spects of thany
how they have aor draw attention
f the Annual Rethreaten its bust describe thosethe Annual Rep
consider that pee to continue in sures drawing a
nsibility.
how they have a
page 36, that thation necessarygy is materially i
e 32 describing ttee.
nsibility.
tatements he financial
ors' Responsibilfor being satisfie
al control as theyto fraud or error
II plc (c
h W a l l Q u a y ,w w . p w c . c o m /
course of the a2014 and regulagroups) Regulat
he Company
applied the UK n to regarding:
port that they hsiness model, fue risks and explport as to how thriod to be approoperation and m
attention to any
applied the Cod
hey consider they for the membeinconsistent wit
the work of the
and the al statements
lities the directoed that they give
y determine is nr.
continued
D u b l i n 1 , I r/ i e
audit of the finanation 6 of the Eutions 2017 is co
y and of the
Corporate Gove
ave carried out uture performanain how they arhey have assesopriate, and themeet its liabilitienecessary qual
de, we are requ
e Annual Reporers to assess theh our knowledg
e Audit Committe
udit s
ors are responsie a true and fair
necessary to en
d)
r e l a n d , I . D . E
ncial statementsropean Union (ntained in the C
principal ris
ernance Code (
a robust assessnce, solvency orre being managesed the prospecir statement as
es as they fall duifications or ass
ired to report to
t taken as a whe Company’s ane of the Compa
ee does not app
ble for the prepr view.
able the prepar
E . B o x N o . 1
s, the informatio(Disclosure of NCorporate Gove
sks that wou
(the “Code”), we
sment of the prir liquidity. ed or mitigated.cts of the Compto whether theyue over the persumptions.
you if, in our op
ole to be fair, band Funds’ positiany obtained in
propriately addr
paration of the fi
ration of financia
3 7
on required by Non-Financial an
rnance Stateme
uld threaten
e are required to
incipal risks fac
. pany, over what y have a reasoniod of their
pinion:
alanced and ion and the course of
ress matters
nancial stateme
al statements th
nd ent.
n
o
ing
nable
ents
hat

Independent auditors’ report to the members of iShares VII plc (continued)
P r i c e w a t e r h o u s e C o o p e r s , O n e S p e n c e r D o c k , N o r t h W a l l Q u a y , D u b l i n 1 , I r e l a n d , I . D . E . B o x N o . 1 3 7 T : + 3 5 3 ( 0 ) 1 7 9 2 6 0 0 0 , F : + 3 5 3 ( 0 ) 1 7 9 2 6 2 0 0 , w w w . p w c . c o m / i e C h a r t e r e d A c c o u n t a n t s
i S H A R E S V I I P L C A N N U A L R E P O R T [ 4 5 ]
Responsibilities for the financial statements and the audit (continued)
Responsibilities of the Directors for the financial statements (continued)
In preparing the financial statements, the directors are responsible for assessing the Company’s and Funds’ ability to continue as going concerns,
disclosing as applicable, matters related to going concern and using the going concern basis of accounting unless the directors either intend to
liquidate the Company or to cease operations, or have no realistic alternative but to do so.
Auditors’ responsibilities for the audit of the financial statements
Our objectives are to obtain reasonable assurance about whether the financial statements as a whole are free from material misstatement,
whether due to fraud or error, and to issue an auditors’ report that includes our opinion. Reasonable assurance is a high level of assurance, but is
not a guarantee that an audit conducted in accordance with ISAs (Ireland) will always detect a material misstatement when it exists. Misstatements
can arise from fraud or error and are considered material if, individually or in the aggregate, they could reasonably be expected to influence the
economic decisions of users taken on the basis of these financial statements.
A further description of our responsibilities for the audit of the financial statements is located on the IAASA website at:
https://www.iaasa.ie/getmedia/b2389013-1cf6-458b-9b8f-a98202dc9c3a/Description_of_auditors_responsibilities_for_audit.pdf.
This description forms part of our auditors’ report.
Use of this report
This report, including the opinions, has been prepared for and only for the Company’s members as a body in accordance with section 391 of the
Companies Act 2014 and for no other purpose. We do not, in giving these opinions, accept or assume responsibility for any other purpose or to
any other person to whom this report is shown or into whose hands it may come save where expressly agreed by our prior consent in writing.
Other required reporting
Companies Act 2014 opinions on other matters
We have obtained all the information and explanations which we consider necessary for the purposes of our audit.
In our opinion the accounting records of the Company were sufficient to permit the financial statements to be readily and properly audited.
The financial statements are in agreement with the accounting records.
Companies Act 2014 exception reporting
Directors’ remuneration and transactions
Under the Companies Act 2014 we are required to report to you if, in our opinion, the disclosures of directors’ remuneration and transactions
specified by sections 305 to 312 of that Act have not been made. We have no exceptions to report arising from this responsibility.
Appointment
We were appointed by the directors on 6 January 2014 to audit the financial statements for the year ended 31 July 2014 and subsequent financial
periods. The period of total uninterrupted engagement is 5 years, covering the years ended 31 July 2014 to 31 July 2018.
Other voluntary reporting
Going concern
The directors have requested that we review the statement on page 37 in relation to going concern as if the Company were a premium listed
company on the London Stock Exchange. We have nothing to report having performed our review.

Into
P r i cT : + C h a [ 4 6 ]
OthThethreThe assepreminquprovenvir
OthThe comrepoprov
Maryfor aChaDubIrela 28 N
dependthe me
c e w a t e r h o u s+ 3 5 3 ( 0 ) 1 7 9
a r t e r e d A c c o
] i S H A R E S
her voluntae directors’eaten the sdirectors have r
essment of the pmium listed comiries and considisions of the Coronment obtaine
her Code prdirectors have ppany on the Lon
ort when the direision of the Cod
y Ruane and on behalf ortered Accounlin
and
November 2018
dent auembers
e C o o p e r s , O9 2 6 0 0 0 , F :
u n t a n t s
V I I P L C A N
ary reportin assessmeolvency or requested that wprincipal risks fapany on the Lon
dering the directode; and consided in the course
rovisions prepared a corpndon Stock Excectors’ statemende specified, un
of Pricewaterhotants and Statu
8
uditors’ s of iSh
O n e S p e n c e r + 3 5 3 ( 0 ) 1 7
N U A L R E P O
ng (continunt of the prliquidity of
we perform a reacing the Compandon Stock Exctors’ process suering whether th
e of the audit. W
porate governanchange. We havnt relating to theder the Listing R
ouseCoopers utory Audit Fir
report ares VI
D o c k , N o r t h7 9 2 6 2 0 0 , w w
R T
ued)
rospects of f the Compaeview of the direany and in relat
change. Our revpporting their sthe statements a
We have nothing
nce statement ave nothing to repe Company’s coRules, for review
rm
II plc (c
h W a l l Q u a y ,w w . p w c . c o m /
the Compaany ectors’ statemention to the longeview was substatatements; checare consistent wg to report havin
and requested thport in respect oompliance with tw by the auditor
continued
D u b l i n 1 , I r/ i e
any and of t
nts on pages 30er-term viability oantially less in sccking that the st
with the knowledg performed thi
hat we review it of the requiremehe Code does nrs.
d)
r e l a n d , I . D . E
the principa
and 38 that theof the Companycope than an autatements are indge and understs review.
as though the Cent for the auditonot properly disc
E . B o x N o . 1
al risks tha
ey have carried y, as if the Comudit and only con alignment withtanding of the C
Company were ors of premium close a departu
3 7
t would
out a robust pany were a
onsisted of makih the relevant Company and its
a premium listelisted companiere from a releva
ng
s
ed es to ant

iSHARES VII PLC INCOME STATEMENT
i S H A R E S V I I P L C A N N U A L R E P O R T [ 4 7 ]
For the financial year ended 31 July 2018 and 31 July 2017
Company Total iShares $ Treasury Bond 1-3yr
UCITS ETF USD (Acc) B iShares $ Treasury Bond 3-7yr
UCITS ETF iShares $ Treasury Bond 7-10yr
UCITS ETF USD (Acc)
Note31 Jul 2018
€’00031 Jul 2017
€’00031 Jul 2018
$’00031 Jul 2017
$’00031 Jul 2018
$’00031 Jul 2017
$’00031 Jul 2018
$’00031 Jul 2017
$’000 Interest income 21,266 14,415 1,525 734 16,361 10,684 4,521 2,334
Dividend income 824,747 680,079 - - - - - -
Securities lending income 8,112 6,443 19 32 519 402 170 102
Management fee rebate 1 - - - - - - -
Net gains/(losses) on financial assets/liabilities at
fair value through profit or loss 5 3,639,912 3,680,402 (1,541) (680) (29,255) (20,143) (9,332) (6,720)
Total gains/(losses) 4,494,038 4,381,339 3 86 (12,375) (9,057) (4,641) (4,284)
Operating expenses 6 (60,440) (46,227) (181) (152) (1,637) (1,362) (372) (241)
Negative yield on financial assets (486) (280) - - - - - -
Net operating profit/(loss) 4,433,112 4,334,832 (178) (66) (14,012) (10,419) (5,013) (4,525) Finance costs:
Distributions to redeemable participating
shareholders 7 290 - - - 13 - - -
Interest expense (294) (206) - - (27) - (3) (1)
Total finance costs (4) (206) - - (14) - (3) (1)
Net profit/(loss) for the financial year before tax 4,433,108 4,334,626 (178) (66) (14,026) (10,419) (5,016) (4,526)
Taxation 8 (95,529) (80,467) - - - - - -
Net profit/(loss) for the financial year after tax 4,337,579 4,254,159 (178) (66) (14,026) (10,419) (5,016) (4,526)
Adjustment to align to the valuation methodology as
set out in the prospectus - (9,613) - - - - - -
Increase/(decrease) in net assets attributable to
redeemable participating shareholders from
operations 4,337,579 4,244,546 (178) (66) (14,026) (10,419) (5,016) (4,526) There are no recognised gains or losses arising in the financial year other than those dealt with in the income statement. In arriving at the results of the financial year, all amounts relate to continuing operations. In arriving at the results of the previous financial year, all amounts relate to continuing operations, except for amounts relating to discontinued operations on iShares MSCI UK Large Cap UCITS ETF. The accompanying notes are an integral part of the notes to the financial statements.

iSHARES VII PLC INCOME STATEMENT (continued)
[ 4 8 ] i S H A R E S V I I P L C A N N U A L R E P O R T
For the financial year ended 31 July 2018 and 31 July 2017
iShares € Govt Bond 1-3yr UCITS
ETF EUR (Acc) iShares € Govt Bond 3-7yr
UCITS ETF iShares € Govt Bond 7-10yr UCITS
ETF EUR (Acc) iShares Core EURO STOXX 50
UCITS ETF
Note31 Jul 2018
€’00031 Jul 2017
€’00031 Jul 2018
€’00031 Jul 2017
€’00031 Jul 2018
€’00031 Jul 2017
€’00031 Jul 2018
€’00031 Jul 2017
€’000 Interest income 86 66 1,449 1,018 410 359 - -
Dividend income - - - - - - 137,989 93,911
Securities lending income 19 21 75 78 21 29 265 107
Net (losses)/gains on financial assets/liabilities at
fair value through profit or loss 5 (928) 441 (1,628) (2,110) 284 (1,902) 88,580 251,114
Total (losses)/gains (823) 528 (104) (1,014) 715 (1,514) 226,834 345,132
Operating expenses 6 (396) (208) (642) (583) (91) (88) (4,047) (2,469)
Negative yield on financial assets (320) (26) (166) (254) - - - -
Net operating (loss)/profit (1,539) 294 (912) (1,851) 624 (1,602) 222,787 342,663
Finance costs:
Interest expense (6) (1) (8) (6) (1) (1) (107) (82)
Total finance costs (6) (1) (8) (6) (1) (1) (107) (82)
Net (loss)/profit for the financial year before tax (1,545) 293 (920) (1,857) 623 (1,603) 222,680 342,581
Taxation 8 - - - - - - (10,052) (6,772)
Net (loss)/profit for the financial year after tax (1,545) 293 (920) (1,857) 623 (1,603) 212,628 335,809
Adjustment to align to the valuation methodology as
set out in the prospectus - (10) - (25) - (8) - (1,444)
(Decrease)/increase in net assets attributable to
redeemable participating shareholders from
operations (1,545) 283 (920) (1,882) 623 (1,611) 212,628 334,365 There are no recognised gains or losses arising in the financial year other than those dealt with in the income statement. In arriving at the results of the financial year, all amounts relate to continuing operations. The accompanying notes are an integral part of the notes to the financial statements.

iSHARES VII PLC INCOME STATEMENT (continued)
i S H A R E S V I I P L C A N N U A L R E P O R T [ 4 9 ]
For the financial year ended 31 July 2018 and 31 July 2017
iShares Core MSCI Pacific ex-
Japan UCITS ETF iShares Core S&P 500
UCITS ETF iShares Dow Jones Industrial
Average UCITS ETF iShares FTSE 100
UCITS ETF
Note31 Jul 2018
$’00031 Jul 2017
$’00031 Jul 2018
$’00031 Jul 2017
$’00031 Jul 2018
$’00031 Jul 2017
$’00031 Jul 2018
£’00031 Jul 2017
£’000 Interest income 67 22 487 368 12 8 - 1
Dividend income 57,017 31,267 494,847 410,259 8,226 7,231 17,887 16,160
Securities lending income 339 194 1,424 1,433 26 19 72 45
Net gains on financial assets/liabilities at fair value
through profit or loss 5 14,557 113,706 3,378,679 2,591,671 52,099 52,395 22,587 31,919
Total gains 71,980 145,189 3,875,437 3,003,731 60,363 59,653 40,546 48,125
Operating expenses 6 (2,760) (1,625) (17,942) (13,613) (1,235) (967) (310) (267)
Net operating profit 69,220 143,564 3,857,495 2,990,118 59,128 58,686 40,236 47,858
Finance costs:
Distributions to redeemable participating
shareholders 7 - - 317 - - - - -
Interest expense (7) - - - - (1) - (1)
Total finance costs (7) - 317 - - (1) - (1)
Net profit for the financial year before tax 69,213 143,564 3,857,812 2,990,118 59,128 58,685 40,236 47,857
Taxation 8 (981) (894) (70,946) (57,429) (1,234) (1,085) (200) (47)
Net profit for the financial year after tax 68,232 142,670 3,786,866 2,932,689 57,894 57,600 40,036 47,810
Adjustment to align to the valuation methodology as
set out in the prospectus - (532) - (3,704) - (59) - (76)
Increase in net assets attributable to redeemable
participating shareholders from operations 68,232 142,138 3,786,866 2,928,985 57,894 57,541 40,036 47,734 There are no recognised gains or losses arising in the financial year other than those dealt with in the income statement. In arriving at the results of the financial year, all amounts relate to continuing operations. The accompanying notes are an integral part of the notes to the financial statements.

iSHARES VII PLC INCOME STATEMENT (continued)
[ 5 0 ] i S H A R E S V I I P L C A N N U A L R E P O R T
For the financial year ended 31 July 2018 and 31 July 2017
iShares FTSE MIB UCITS ETF
EUR (Acc) iShares MSCI Brazil UCITS ETF
USD (Acc) iShares MSCI Canada
UCITS ETF iShares MSCI EM Asia
UCITS ETF
Note31 Jul 2018
€’00031 Jul 2017
€’00031 Jul 2018
$’00031 Jul 2017
$’00031 Jul 2018
$’00031 Jul 2017
$’00031 Jul 2018
$’00031 Jul 2017
$’000 Interest income - - - - 12 12 4 2
Dividend income 3,362 3,907 1,024 827 26,199 22,151 12,627 6,959
Securities lending income 72 57 - - 1,518 1,933 186 53
Management fee rebate - - - - - - 1 -
Net gains/(losses) on financial assets/liabilities at
fair value through profit or loss 5 4,700 28,637 (755) 3,409 36,566 64,737 (1,408) 61,925
Total gains 8,134 32,601 269 4,236 64,295 88,833 11,410 68,939
Operating expenses 6 (351) (409) (208) (169) (4,280) (3,785) (3,273) (1,635)
Net operating profit 7,783 32,192 61 4,067 60,015 85,048 8,137 67,304
Finance costs:
Interest expense (3) (4) - - (1) (4) (1) (7)
Total finance costs (3) (4) - - (1) (4) (1) (7)
Net profit for the financial year before tax 7,780 32,188 61 4,067 60,014 85,044 8,136 67,297
Taxation 8 (492) (570) (735) (584) (6,547) (5,584) (1,708) (942)
Net profit/(loss) for the financial year after tax 7,288 31,618 (674) 3,483 53,467 79,460 6,428 66,355
Adjustment to align to the valuation methodology as
set out in the prospectus - (118) - (13) - (693) - (131)
Increase/(decrease) in net assets attributable to
redeemable participating shareholders from
operations 7,288 31,500 (674) 3,470 53,467 78,767 6,428 66,224 There are no recognised gains or losses arising in the financial year other than those dealt with in the income statement. In arriving at the results of the financial year, all amounts relate to continuing operations. The accompanying notes are an integral part of the notes to the financial statements.

iSHARES VII PLC INCOME STATEMENT (continued)
i S H A R E S V I I P L C A N N U A L R E P O R T [ 5 1 ]
For the financial year ended 31 July 2018 and 31 July 2017
iShares MSCI EMU CHF Hedged
UCITS ETF (Acc) iShares MSCI EMU Small Cap
UCITS ETF iShares MSCI EMU
UCITS ETF iShares MSCI EMU USD Hedged
UCITS ETF (Acc)
Note31 Jul 2018
Fr’00031 Jul 2017
Fr’00031 Jul 2018
€’00031 Jul 2017
€’00031 Jul 2018
€’00031 Jul 2017
€’00031 Jul 2018
$’00031 Jul 2017
$’000 Interest income - - - - - - 3 -
Dividend income 836 965 27,915 17,088 54,640 41,386 10,153 2,580
Securities lending income 3 1 2,905 1,359 222 154 43 3
Net gains on financial assets/liabilities at
fair value through profit or loss 5 1,092 5,293 59,469 106,211 65,581 182,936 12,433 10,940
Total gains 1,931 6,259 90,289 124,658 120,443 224,476 22,632 13,523
Operating expenses 6 (108) (130) (6,392) (3,405) (5,175) (4,283) (1,115) (293)
Net operating profit 1,823 6,129 83,897 121,253 115,268 220,193 21,517 13,230
Finance costs: Distributions to redeemable participating
shareholders 7 - - - - 14 - - -
Interest expense (1) (3) (59) (29) (46) (47) (17) (6)
Total finance costs (1) (3) (59) (29) (32) (47) (17) (6)
Net profit for the financial year before tax 1,822 6,126 83,838 121,224 115,236 220,146 21,500 13,224
Taxation 8 (65) (71) (2,743) (1,602) (4,177) (2,852) (773) (186)
Net profit for the financial year after tax 1,757 6,055 81,095 119,622 111,059 217,294 20,727 13,038 Adjustment to align to the valuation methodology as
set out in the prospectus - (35) - (701) - (1,184) - (47)
Increase in net assets attributable to redeemable
participating shareholders from operations 1,757 6,020 81,095 118,921 111,059 216,110 20,727 12,991 There are no recognised gains or losses arising in the financial year other than those dealt with in the income statement. In arriving at the results of the financial year, all amounts relate to continuing operations. The accompanying notes are an integral part of the notes to the financial statements.

iSHARES VII PLC INCOME STATEMENT (continued)
[ 5 2 ] i S H A R E S V I I P L C A N N U A L R E P O R T
For the financial year ended 31 July 2018 and 31 July 2017
iShares MSCI Japan UCITS ETF
USD (Acc) iShares MSCI Korea UCITS ETF
USD (Acc) iShares MSCI Mexico Capped
UCITS ETF iShares MSCI Russia ADR/GDR
UCITS ETF
Note31 Jul 2018
$’00031 Jul 2017
$’00031 Jul 2018
$’00031 Jul 2017
$’00031 Jul 2018
$’00031 Jul 2017
$’00031 Jul 2018
$’00031 Jul 2017
$’000 Interest income 19 3 - - - 1 19 1
Dividend income 10,782 10,211 1,106 910 1,172 1,563 16,766 13,639
Securities lending income 194 141 36 31 - - - -
Net gains/(losses) on financial assets/liabilities at
fair value through profit or loss 5 35,932 42,461 (2,165) 13,006 (4,165) 9,943 42,871 2,164
Total gains/(losses) 46,927 52,816 (1,023) 13,947 (2,993) 11,507 59,656 15,804
Operating expenses 6 (2,478) (1,905) (343) (331) (366) (438) (2,447) (1,753)
Net operating profit/(loss) 44,449 50,911 (1,366) 13,616 (3,359) 11,069 57,209 14,051
Finance costs:
Interest expense (6) (5) - - - - - -
Total finance costs (6) (5) - - - - - -
Net profit/(loss) for the financial year before tax 44,443 50,906 (1,366) 13,616 (3,359) 11,069 57,209 14,051
Taxation 8 (1,617) (1,468) (241) (200) (47) (46) (2,030) (1,829)
Net profit/(loss) for the financial year after tax 42,826 49,438 (1,607) 13,416 (3,406) 11,023 55,179 12,222
Adjustment to align to the valuation methodology as
set out in the prospectus - (729) - (24) - (61) - (56)
Increase/(decrease) in net assets attributable to
redeemable participating shareholders from
operations 42,826 48,709 (1,607) 13,392 (3,406) 10,962 55,179 12,166 There are no recognised gains or losses arising in the financial year other than those dealt with in the income statement. In arriving at the results of the financial year, all amounts relate to continuing operations. The accompanying notes are an integral part of the notes to the financial statements

iSHARES VII PLC INCOME STATEMENT (continued)
i S H A R E S V I I P L C A N N U A L R E P O R T [ 5 3 ]
For the financial year ended 31 July 2018 and 31 July 2017
iShares MSCI UK Large Cap
UCITS ETF* iShares MSCI UK Small Cap
UCITS ETF iShares MSCI UK
UCITS ETF iShares MSCI USA Small Cap
UCITS ETF
Note31 Jul 2017
£’00031 Jul 2018
£’00031 Jul 2017
£’00031 Jul 2018
£’00031 Jul 2017
£’00031 Jul 2018
$’00031 Jul 2017
$’000 Interest income - - - - - 6 5
Dividend income 469 2,922 2,344 5,327 5,192 8,484 7,706
Securities lending income 3 123 93 25 19 286 289
Net gains on financial assets/liabilities at
fair value through profit or loss 5 903 11,051 11,708 6,280 10,949 80,028 62,198
Total gains 1,375 14,096 14,145 11,632 16,160 88,804 70,198
Operating expenses 6 (52) (607) (471) (428) (412) (2,385) (2,026)
Net operating profit 1,323 13,489 13,674 11,204 15,748 86,419 68,172
Finance costs:
Interest expense - - - - - - (2)
Total finance costs - - - - - - (2)
Net profit for the financial year before tax 1,323 13,489 13,674 11,204 15,748 86,419 68,170
Taxation 8 - (42) (29) (57) (12) (1,218) (1,062)
Net profit for the financial year after tax 1,323 13,447 13,645 11,147 15,736 85,201 67,108
Adjustment to align to the valuation methodology as
set out in the prospectus (2) - (43) - (26) - (127)
Increase in net assets attributable to redeemable
participating shareholders from operations 1,321 13,447 13,602 11,147 15,710 85,201 66,981
* Fund closed during the financial year ended 31 July 2017.
There are no recognised gains or losses arising in the financial year other than those dealt with in the income statement. In arriving at the results of the financial year, all amounts relate to continuing operations. In arriving at the results of the previous financial year, all amounts relate to continuing operations, except for amounts relating to discontinued operations on iShares MSCI UK Large Cap UCITS ETF. The accompanying notes are an integral part of the notes to the financial statements.

iSHARES VII PLC INCOME STATEMENT (continued)
[ 5 4 ] i S H A R E S V I I P L C A N N U A L R E P O R T
For the financial year ended 31 July 2018 and 31 July 2017
iShares MSCI USA
UCITS ETF iShares NASDAQ 100
UCITS ETF iShares Nikkei 225
UCITS ETF iShares FTSE Italia Mid-Small Cap
UCITS ETF*
Note 31 Jul 2018
$’00031 Jul 2017
$’00031 Jul 2018
$’000 31 Jul 2017
$’00031 Jul 2018
¥’00031 Jul 2017
¥’00031 Jul 2018
€’000 Interest income 6 2 35 14 - - -
Dividend income 10,081 9,833 16,665 12,721 661,401 392,021 344
Securities lending income 27 14 217 168 12,174 6,123 -
Net gains/(losses) on financial assets/liabilities at
fair value through profit or loss 5 68,379 61,654 323,946 236,019 4,241,900 3,682,963 (692)
Total gains/(losses) 78,493 71,503 340,863 248,922 4,915,475 4,081,107 (348)
Operating expenses 6 (1,753) (1,554) (5,386) (3,471) (178,652) (118,144) (56)
Net operating profit/(loss) 76,740 69,949 335,477 245,451 4,736,823 3,962,963 (404)
Finance costs:
Interest expense - - - - (1,339) (939) (1)
Total finance costs - - - - (1,339) (939) (1) Net profit/(loss) for the financial year/period before tax 76,740 69,949 335,477 245,451 4,735,484 3,962,024 (405)
Taxation 8 (1,419) (1,408) (2,312) (1,715) (99,295) (56,010) (52) Net profit/(loss) for the financial year/period after tax 75,321 68,541 333,165 243,736 4,636,189 3,906,014 (457) Adjustment to align to the valuation methodology as
set out in the prospectus - (102) - (156) - (18,657) -
Increase/(decrease) in net assets attributable to
redeemable participating shareholders from
operations 75,321 68,439 333,165 243,580 4,636,189 3,887,357 (457)
* Fund launched during the financial year ended 31 July 2018. There are no recognised gains or losses arising in the financial year other than those dealt with in the income statement. In arriving at the results of the financial year, all amounts relate to continuing operations. The accompanying notes are an integral part of the notes to the financial statements.

iSHARES VII PLC STATEMENT OF CHANGES IN NET ASSETS ATTRIBUTABLE TO REDEEMABLE PARTICIPATING SHAREHOLDERS
i S H A R E S V I I P L C A N N U A L R E P O R T [ 5 5 ]
For the financial year ended 31 July 2018 and 31 July 2017
Company Total iShares $ Treasury Bond 1-3yr
UCITS ETF USD (Acc) B iShares $ Treasury Bond 3-7yr
UCITS ETF iShares $ Treasury Bond
7-10yr UCITS ETF USD (Acc)
31 Jul 2018
€’00031 Jul 2017
€’00031 Jul 2018
$’000 31 Jul 2017
$’00031 Jul 2018
$’00031 Jul 2017
$’00031 Jul 2018
$’000 31 Jul 2017
$’000 Net assets attributable to redeemable participating shareholders
at the beginning of the financial year 32,762,076 22,857,512 65,842 74,323 639,525 721,222 106,595 125,496
Notional foreign exchange adjustment* 383,085 (1,585,410) - - - - - -
Increase/(decrease) in net assets attributable to redeemable
participating shareholders from operations 4,337,579 4,244,546 (178) (66) (14,026) (10,419) (5,016) (4,526)
Share transactions:
Proceeds from issue of redeemable participating shares 12,931,296 12,368,702 145,894 48,747 1,092,626 351,948 272,640 105,295
Payments on redemption of redeemable participating shares (7,316,469) (5,123,274) (76,148) (57,162) (344,343) (423,226) (156,126) (119,670)
Increase/(decrease) in net assets resulting from share
transactions 5,614,827 7,245,428 69,746 (8,415) 748,283 (71,278) 116,514 (14,375)
Net assets attributable to redeemable participating
shareholders at the end of the financial year 43,097,567 32,762,076 135,410 65,842 1,373,782 639,525 218,093 106,595
* The notional foreign exchange adjustment arises from the retranslation of the net assets at the beginning of the financial year using the exchange rate as at 31 July 2018. The average exchange rate for the financial year is applied to income statement items and share transactions (see note 14).
The accompanying notes form an integral part of these financial statements.

iSHARES VII PLC STATEMENT OF CHANGES IN NET ASSETS ATTRIBUTABLE TO REDEEMABLE PARTICIPATING SHAREHOLDERS (continued)
[ 5 6 ] i S H A R E S V I I P L C A N N U A L R E P O R T
For the financial year ended 31 July 2018 and 31 July 2017
iShares € Govt Bond 1-3yr UCITS
ETF EUR (Acc) iShares € Govt Bond 3-7yr
UCITS ETF iShares € Govt Bond 7-10yr UCITS
ETF EUR (Acc) iShares Core EURO STOXX
50 UCITS ETF
31 Jul 2018
€’00031 Jul 2017
€’00031 Jul 2018
€’000 31 Jul 2017
€’00031 Jul 2018
€’00031 Jul 2017
€’00031 Jul 2018
€’000 31 Jul 2017
€’000 Net assets attributable to redeemable participating shareholders
at the beginning of the financial year 136,363 85,681 322,757 213,028 44,269 55,173 3,943,518 1,621,402
(Decrease)/increase in net assets attributable to redeemable
participating shareholders from operations (1,545) 283 (920) (1,882) 623 (1,611) 212,628 334,365
Share transactions:
Proceeds from issue of redeemable participating shares 233,865 58,797 203,515 181,115 11,807 18,613 241,053 2,068,436
Payments on redemption of redeemable participating shares (100,886) (8,398) (181,722) (69,504) (16,524) (27,906) (435,856) (80,685)
Increase/(decrease) in net assets resulting from share
transactions 132,979 50,399 21,793 111,611 (4,717) (9,293) (194,803) 1,987,751
Net assets attributable to redeemable participating
shareholders at the end of the financial year 267,797 136,363 343,630 322,757 40,175 44,269 3,961,343 3,943,518 The accompanying notes form an integral part of these financial statements.

iSHARES VII PLC STATEMENT OF CHANGES IN NET ASSETS ATTRIBUTABLE TO REDEEMABLE PARTICIPATING SHAREHOLDERS (continued)
i S H A R E S V I I P L C A N N U A L R E P O R T [ 5 7 ]
For the financial year ended 31 July 2018 and 31 July 2017
iShares Core MSCI Pacific ex-
Japan UCITS ETF iShares Core S&P 500
UCITS ETF iShares Dow Jones Industrial
Average UCITS ETF iShares FTSE 100
UCITS ETF
31 Jul 2018
$’00031 Jul 2017
$’00031 Jul 2018
$’000 31 Jul 2017
$’00031 Jul 2018
$’00031 Jul 2017
$’00031 Jul 2018
£’000 31 Jul 2017
£’000 Net assets attributable to redeemable participating shareholders
at the beginning of the financial year 1,151,666 421,457 22,423,870 15,795,982 310,174 232,258 428,410 356,997
Increase in net assets attributable to redeemable participating
shareholders from operations 68,232 142,138 3,786,866 2,928,985 57,894 57,541 40,036 47,734
Share transactions:
Proceeds from issue of redeemable participating shares 924,727 619,673 7,879,976 6,172,002 163,237 149,472 - 63,091
Payments on redemption of redeemable participating shares (401,885) (31,602) (3,935,964) (2,473,099) (165,341) (129,097) - (39,412)
Increase/(decrease) in net assets resulting from share
transactions 522,842 588,071 3,944,012 3,698,903 (2,104) 20,375 - 23,679
Net assets attributable to redeemable participating
shareholders at the end of the financial year 1,742,740 1,151,666 30,154,748 22,423,870 365,964 310,174 468,446 428,410 The accompanying notes form an integral part of these financial statements.

iSHARES VII PLC STATEMENT OF CHANGES IN NET ASSETS ATTRIBUTABLE TO REDEEMABLE PARTICIPATING SHAREHOLDERS (continued)
[ 5 8 ] i S H A R E S V I I P L C A N N U A L R E P O R T
For the financial year ended 31 July 2018 and 31 July 2017
iShares FTSE MIB UCITS ETF
EUR (Acc) iShares MSCI Brazil UCITS ETF
USD (Acc) iShares MSCI Canada
UCITS ETF iShares MSCI EM Asia
UCITS ETF
31 Jul 2018
€’00031 Jul 2017
€’00031 Jul 2018
$’000 31 Jul 2017
$’00031 Jul 2018
$’00031 Jul 2017
$’00031 Jul 2018
$’000 31 Jul 2017
$’000 Net assets attributable to redeemable participating shareholders
at the beginning of the financial year 118,193 134,837 28,843 26,521 797,749 627,271 380,257 185,408
Increase/(decrease) in net assets attributable to redeemable
participating shareholders from operations 7,288 31,500 (674) 3,470 53,467 78,767 6,428 66,224
Share transactions:
Proceeds from issue of redeemable participating shares 38,707 45,599 - 4,904 339,844 506,995 177,774 181,934
Payments on redemption of redeemable participating shares (67,387) (93,743) - (6,052) (217,885) (415,284) (40,726) (53,309)
(Decrease)/increase in net assets resulting from share
transactions (28,680) (48,144) - (1,148) 121,959 91,711 137,048 128,625
Net assets attributable to redeemable participating
shareholders at the end of the financial year 96,801 118,193 28,169 28,843 973,175 797,749 523,733 380,257 The accompanying notes form an integral part of these financial statements.

iSHARES VII PLC STATEMENT OF CHANGES IN NET ASSETS ATTRIBUTABLE TO REDEEMABLE PARTICIPATING SHAREHOLDERS (continued)
i S H A R E S V I I P L C A N N U A L R E P O R T [ 5 9 ]
For the financial year ended 31 July 2018 and 31 July 2017
iShares MSCI EMU CHF Hedged
UCITS ETF (Acc) iShares MSCI EMU Small Cap
UCITS ETF iShares MSCI EMU
UCITS ETF iShares MSCI EMU USD
Hedged UCITS ETF (Acc)
31 Jul 2018
Fr’00031 Jul 2017
Fr’00031 Jul 2018
€’000 31 Jul 2017
€’00031 Jul 2018
€’00031 Jul 2017
€’00031 Jul 2018
$’000 31 Jul 2017
$’000 Net assets attributable to redeemable participating shareholders
at the beginning of the financial year 28,318 34,657 874,464 417,104 1,570,438 1,147,951 136,976 46,016
Increase in net assets attributable to redeemable participating
shareholders from operations 1,757 6,020 81,095 118,921 111,059 216,110 20,727 12,991
Share transactions:
Proceeds from issue of redeemable participating shares 2,687 2,404 362,572 412,411 396,574 344,456 224,140 106,226
Payments on redemption of redeemable participating shares (2,682) (14,763) (254,710) (73,972) (403,568) (138,079) (101,045) (28,257)
Increase/(decrease) in net assets resulting from share
transactions 5 (12,359) 107,862 338,439 (6,994) 206,377 123,095 77,969 Net assets attributable to redeemable participating
shareholders at the end of the financial year 30,080 28,318 1,063,421 874,464 1,674,503 1,570,438 280,798 136,976 The accompanying notes form an integral part of these financial statements.

iSHARES VII PLC STATEMENT OF CHANGES IN NET ASSETS ATTRIBUTABLE TO REDEEMABLE PARTICIPATING SHAREHOLDERS (continued)
[ 6 0 ] i S H A R E S V I I P L C A N N U A L R E P O R T
For the financial year ended 31 July 2018 and 31 July 2017
iShares MSCI Japan UCITS
ETF USD (Acc) iShares MSCI Korea UCITS ETF
USD (Acc) iShares MSCI Mexico Capped
UCITS ETF iShares MSCI Russia ADR/GDR UCITS ETF
31 Jul 2018
$’00031 Jul 2017
$’00031 Jul 2018
$’000 31 Jul 2017
$’00031 Jul 2018
$’00031 Jul 2017
$’00031 Jul 2018
$’000 31 Jul 2017
$’000 Net assets attributable to redeemable participating shareholders
at the beginning of the financial year 464,810 473,649 61,562 44,191 66,883 65,839 271,722 166,055
Increase/(decrease) in net assets attributable to redeemable
participating shareholders from operations 42,826 48,709 (1,607) 13,392 (3,406) 10,962 55,179 12,166
Share transactions:
Proceeds from issue of redeemable participating shares 240,221 335,913 - 14,281 33,229 55,819 328,920 218,789
Payments on redemption of redeemable participating shares (225,653) (393,461) (11,391) (10,302) (27,603) (65,737) (342,538) (125,288)
Increase/(decrease) in net assets resulting from share
transactions 14,568 (57,548) (11,391) 3,979 5,626 (9,918) (13,618) 93,501
Net assets attributable to redeemable participating
shareholders at the end of the financial year 522,204 464,810 48,564 61,562 69,103 66,883 313,283 271,722 The accompanying notes form an integral part of these financial statements.

iSHARES VII PLC STATEMENT OF CHANGES IN NET ASSETS ATTRIBUTABLE TO REDEEMABLE PARTICIPATING SHAREHOLDERS (continued)
i S H A R E S V I I P L C A N N U A L R E P O R T [ 6 1 ]
For the financial year ended 31 July 2018 and 31 July 2017
iShares MSCI UK Large Cap
UCITS ETF* iShares MSCI UK Small Cap
UCITS ETF iShares MSCI UK
UCITS ETF iShares MSCI USA Small Cap
UCITS ETF
31 Jul 2017
£’00031 Jul 2018
£’000 31 Jul 2017
£’00031 Jul 2018
£’00031 Jul 2017
£’00031 Jul 2018
$’000 31 Jul 2017
$’000 Net assets attributable to redeemable participating shareholders
at the beginning of the financial year 10,624 90,901 68,141 127,963 119,401 502,509 295,564
Increase in net assets attributable to redeemable participating
shareholders from operations 1,321 13,447 13,602 11,147 15,710 85,201 66,981
Share transactions:
Proceeds from issue of redeemable participating shares 2,693 73,938 64,386 5,053 7,153 264,604 314,544
Payments on redemption of redeemable participating shares (14,638) (32,257) (55,228) (13,810) (14,301) (159,722) (174,580)
(Decrease)/increase in net assets resulting from share
transactions (11,945) 41,681 9,158 (8,757) (7,148) 104,882 139,964
Net assets attributable to redeemable participating
shareholders at the end of the financial year - 146,029 90,901 130,353 127,963 692,592 502,509
* Fund closed during the financial year ended 31 July 2017.
The accompanying notes form an integral part of these financial statements.

iSHARES VII PLC STATEMENT OF CHANGES IN NET ASSETS ATTRIBUTABLE TO REDEEMABLE PARTICIPATING SHAREHOLDERS (continued)
[ 6 2 ] i S H A R E S V I I P L C A N N U A L R E P O R T
For the financial year ended 31 July 2018 and 31 July 2017
iShares MSCI USA
UCITS ETF iShares NASDAQ 100
UCITS ETF iShares Nikkei 225
UCITS ETF iShares FTSE Italia Mid-Small
Cap UCITS ETF*
31 Jul 2018
$’00031 Jul 2017
$’00031 Jul 2018
$’000 31 Jul 2017
$’00031 Jul 2018
¥’00031 Jul 2017
¥’00031 Jul 2018
€’000 Net assets attributable to redeemable participating shareholders
at the beginning of the financial year/period 451,002 431,154 1,268,040 818,156 38,782,447 13,119,454 -
Increase/(decrease) in net assets attributable to redeemable
participating shareholders from operations 75,321 68,439 333,165 243,580 4,636,189 3,887,357 (457)
Share transactions:
Proceeds from issue of redeemable participating shares 112,686 96,876 1,013,897 338,390 33,398,832 33,969,360 34,407
Payments on redemption of redeemable participating shares (31,120) (145,467) (241,711) (132,086) (47,048,040) (12,193,724) (19,486)
Increase/(decrease) in net assets resulting from share
transactions 81,566 (48,591) 772,186 206,304 (13,649,208) 21,775,636 14,921
Net assets attributable to redeemable participating
shareholders at the end of the financial year/period 607,889 451,002 2,373,391 1,268,040 29,769,428 38,782,447 14,464
* Fund launched during the financial year ended 31 July 2018.
The accompanying notes form an integral part of these financial statements.

iSHARES VII PLC BALANCE SHEET
i S H A R E S V I I P L C A N N U A L R E P O R T [ 6 3 ]
As at 31 July 2018 and 31 July 2017
Company Total iShares $ Treasury Bond 1-3yr
UCITS ETF USD (Acc) B iShares $ Treasury Bond 3-7yr
UCITS ETF iShares $ Treasury Bond 7-10yr
UCITS ETF USD (Acc)
Note31 Jul 2018
€’00031 Jul 2017
€’00031 Jul 2018
$’00031 Jul 2017
$’00031 Jul 2018
$’00031 Jul 2017
$’00031 Jul 2018
$’00031 Jul 2017
$’000 CURRENT ASSETS Cash 173,885 78,416 360 113 1,927 852 138 85
Cash equivalents 2,555 7,224 - - 2,225 7,512 - -
Margin cash account 6,371 4,845 - - - - - -
Receivables 11 111,347 253,263 649 241 7,423 3,411 1,813 821
Financial assets at fair value through profit or loss 42,900,712 32,592,065 134,424 65,499 1,362,445 635,307 216,181 105,707
Total current assets 43,194,870 32,935,813 135,433 65,853 1,374,020 647,082 218,132 106,613
CURRENT LIABILITIES Margin cash account - (3) - - - - - -
Payables 12 (93,240) (167,830) (23) (11) (238) (7,557) (39) (18)
Provision for deferred capital gains tax (874) (386) - - - - - -
Financial liabilities at fair value through profit or loss (3,189) (5,518) - - - - - - Total current liabilities excluding net assets attributable to redeemable participating shareholders (97,303) (173,737) (23) (11) (238) (7,557) (39) (18)
Net asset value attributable to redeemable
participating shareholders at the end of the
financial year 43,097,567 32,762,076 135,410 65,842 1,373,782 639,525 218,093 106,595
The accompanying notes form an integral part of these financial statements.
Approved on behalf of the Board of Directors Paul McNaughton Paul McGowan Director Director
28 November 2018 28 November 2018

iSHARES VII PLC BALANCE SHEET (continued)
[ 6 4 ] i S H A R E S V I I P L C A N N U A L R E P O R T
As at 31 July 2018 and 31 July 2017
iShares € Govt Bond 1-3yr UCITS
ETF EUR (Acc) iShares € Govt Bond 3-7yr
UCITS ETF iShares € Govt Bond 7-10yr UCITS
ETF EUR (Acc) iShares Core EURO STOXX 50
UCITS ETF
Note31 Jul 2018
€’00031 Jul 2017
€’00031 Jul 2018
€’00031 Jul 2017
€’00031 Jul 2018
€’00031 Jul 2017
€’00031 Jul 2018
€’00031 Jul 2017
€’000 CURRENT ASSETS Cash 275 91 300 321 36 70 12,931 685
Cash equivalents - - 653 852 - - - -
Margin cash account - - - - - - 979 328
Receivables 11 42 11,869 2,854 3,265 177 238 8,570 16,904
Financial assets at fair value through profit or loss 267,528 136,199 339,881 318,374 39,969 43,968 3,939,198 3,937,459
Total current assets 267,845 148,159 343,688 322,812 40,182 44,276 3,961,678 3,955,376
CURRENT LIABILITIES Payables 12 (48) (11,796) (58) (55) (7) (7) (335) (11,804)
Financial liabilities at fair value through profit or loss - - - - - - - (54) Total current liabilities excluding net assets attributable to redeemable participating shareholders (48) (11,796) (58) (55) (7) (7) (335) (11,858)
Net asset value attributable to redeemable
participating shareholders at the end of the
financial year 267,797 136,363 343,630 322,757 40,175 44,269 3,961,343 3,943,518
The accompanying notes form an integral part of these financial statements.

iSHARES VII PLC BALANCE SHEET (continued)
i S H A R E S V I I P L C A N N U A L R E P O R T [ 6 5 ]
As at 31 July 2018 and 31 July 2017
iShares Core MSCI Pacific ex-
Japan UCITS ETF iShares Core S&P 500
UCITS ETF iShares Dow Jones Industrial
Average UCITS ETF iShares FTSE 100
UCITS ETF
Note31 Jul 2018
$’00031 Jul 2017
$’00031 Jul 2018
$’00031 Jul 2017
$’00031 Jul 2018
$’00031 Jul 2017
$’00031 Jul 2018
£’00031 Jul 2017
£’000 CURRENT ASSETS Cash 13,009 4,200 97,053 36,806 1,104 5,805 3,871 1,029
Margin cash account 600 219 2,204 1,929 31 75 171 108
Receivables 11 2,260 1,173 45,609 184,945 207 224 1,460 1,102
Financial assets at fair value through profit or loss 1,728,647 1,146,485 30,065,700 22,335,198 364,722 304,156 462,971 426,230
Total current assets 1,744,516 1,152,077 30,210,566 22,558,878 366,064 310,260 468,473 428,469
CURRENT LIABILITIES
Margin cash account - (1) - - - - - -
Payables 12 (1,743) (384) (52,568) (135,008) (100) (86) (27) (26)
Financial liabilities at fair value through profit or loss (33) (26) (3,250) - - - - (33) Total current liabilities excluding net assets attributable to redeemable participating shareholders (1,776) (411) (55,818) (135,008) (100) (86) (27) (59)
Net asset value attributable to redeemable
participating shareholders at the end of the
financial year 1,742,740 1,151,666 30,154,748 22,423,870 365,964 310,174 468,446 428,410
The accompanying notes form an integral part of these financial statements.

iSHARES VII PLC BALANCE SHEET (continued)
[ 6 6 ] i S H A R E S V I I P L C A N N U A L R E P O R T
As at 31 July 2018 and 31 July 2017
iShares FTSE MIB UCITS ETF
EUR (Acc) iShares MSCI Brazil UCITS ETF
USD (Acc) iShares MSCI Canada
UCITS ETF iShares MSCI EM Asia
UCITS ETF
Note 31 Jul 2018
€’00031 Jul 2017
€’00031 Jul 2018
$’00031 Jul 2017
$’00031 Jul 2018
$’00031 Jul 2017
$’00031 Jul 2018
$’00031 Jul 2017
$’000 CURRENT ASSETS Cash 447 420 69 14 4,881 7,723 2,829 1,646
Margin cash account 35 36 11 - 82 112 192 7
Receivables 11 5 5 64 72 1,219 1,115 3,244 2,479
Financial assets at fair value through profit or loss 96,340 117,765 29,067 29,227 970,650 795,236 517,803 376,690
Total current assets 96,827 118,226 29,211 29,313 976,832 804,186 524,068 380,822 CURRENT LIABILITIES Payables 12 (26) (33) (15) (15) (3,657) (6,433) (335) (565)
Provision for deferred capital gains tax - - (1,023) (455) - - - -
Financial liabilities at fair value through profit or loss - - (4) - - (4) - - Total current liabilities excluding net assets attributable to redeemable participating shareholders (26) (33) (1,042) (470) (3,657) (6,437) (335) (565)
Net asset value attributable to redeemable
participating shareholders at the end of the
financial year 96,801 118,193 28,169 28,843 973,175 797,749 523,733 380,257 The accompanying notes form an integral part of these financial statements.

iSHARES VII PLC BALANCE SHEET (continued)
i S H A R E S V I I P L C A N N U A L R E P O R T [ 6 7 ]
As at 31 July 2018 and 31 July 2017
iShares MSCI EMU CHF Hedged
UCITS ETF (Acc) iShares MSCI EMU Small Cap
UCITS ETF iShares MSCI EMU
UCITS ETF iShares MSCI EMU USD Hedged
UCITS ETF (Acc)
Note 31 Jul 2018
Fr’00031 Jul 2017
Fr’00031 Jul 2018
€’00031 Jul 2017
€’00031 Jul 2018
€’00031 Jul 2017
€’00031 Jul 2018
$’00031 Jul 2017
$’000 CURRENT ASSETS Cash 214 154 9,433 5,881 11,773 10,372 4,245 898
Margin cash account 29 16 460 595 779 1,159 249 79
Receivables 11 67 1,209 2,878 6,773 4,044 6,148 407 3,552
Financial assets at fair value through profit or loss 29,783 28,325 1,051,792 867,096 1,658,925 1,556,263 276,021 137,278
Total current assets 30,093 29,704 1,064,563 880,345 1,675,521 1,573,942 280,922 141,807 CURRENT LIABILITIES Margin cash account - (1) - - - - - (1)
Payables 12 (10) (68) (1,142) (5,753) (735) (3,256) (95) (283)
Financial liabilities at fair value through profit or loss (3) (1,317) - (128) (283) (248) (29) (4,547) Total current liabilities excluding net assets attributable to redeemable participating shareholders (13) (1,386) (1,142) (5,881) (1,018) (3,504) (124) (4,831)
Net asset value attributable to redeemable
participating shareholders at the end of the
financial year 30,080 28,318 1,063,421 874,464 1,674,503 1,570,438 280,798 136,976
The accompanying notes form an integral part of these financial statements.

iSHARES VII PLC BALANCE SHEET (continued)
[ 6 8 ] i S H A R E S V I I P L C A N N U A L R E P O R T
As at 31 July 2018 and 31 July 2017
iShares MSCI Japan UCITS ETF
USD (Acc) iShares MSCI Korea UCITS
ETF USD (Acc) iShares MSCI Mexico Capped
UCITS ETF iShares MSCI Russia ADR/GDR
UCITS ETF
Note 31 Jul 2018
$’00031 Jul 2017
$’00031 Jul 2018
$’000 31 Jul 2017
$’00031 Jul 2018
$’00031 Jul 2017
$’00031 Jul 2018
$’00031 Jul 2017
$’000 CURRENT ASSETS Cash 4,082 450 130 51 156 534 1,147 1,138
Margin cash account 108 15 299 316 7 21 368 18
Receivables 11 683 30,094 135 85 2 434 8,959 7,776
Financial assets at fair value through profit or loss 517,586 436,014 48,037 61,144 68,974 65,931 302,978 262,936
Total current assets 522,459 466,573 48,601 61,596 69,139 66,920 313,452 271,868 CURRENT LIABILITIES Payables 12 (216) (1,763) (27) (34) (36) (37) (169) (146)
Financial liabilities at fair value through profit or loss (39) - (10) - - - - - Total current liabilities excluding net assets attributable to redeemable participating shareholders (255) (1,763) (37) (34) (36) (37) (169) (146)
Net asset value attributable to redeemable
participating shareholders at the end of the
financial year 522,204 464,810 48,564 61,562 69,103 66,883 313,283 271,722 The accompanying notes form an integral part of these financial statements.

iSHARES VII PLC BALANCE SHEET (continued)
i S H A R E S V I I P L C A N N U A L R E P O R T [ 6 9 ]
As at 31 July 2018 and 31 July 2017
iShares MSCI UK Large Cap
UCITS ETF* iShares MSCI UK Small Cap
UCITS ETF iShares MSCI UK
UCITS ETF iShares MSCI USA Small Cap
UCITS ETF
Note 31 Jul 2017
£’00031 Jul 2018
£’000 31 Jul 2017
£’00031 Jul 2018
£’00031 Jul 2017
£’00031 Jul 2018
$’00031 Jul 2017
$’000 CURRENT ASSETS Cash 51 383 829 1,459 92 10,966 1,849
Margin cash account - 19 25 49 16 166 64
Receivables 11 - 332 160 415 1,328 1,752 231
Financial assets at fair value through profit or loss - 145,371 89,976 128,466 127,557 689,121 500,548
Total current assets 51 146,105 90,990 130,389 128,993 702,005 502,692 CURRENT LIABILITIES Payables 12 (51) (76) (89) (36) (1,025) (9,381) (183)
Financial liabilities at fair value through profit or loss - - - - (5) (32) - Total current liabilities excluding net assets attributable to redeemable participating shareholders (51) (76) (89) (36) (1,030) (9,413) (183)
Net asset value attributable to redeemable
participating shareholders at the end of the
financial year - 146,029 90,901 130,353 127,963 692,592 502,509
* Fund closed during the financial year ended 31 July 2017.
The accompanying notes form an integral part of these financial statements.

iSHARES VII PLC BALANCE SHEET (continued)
[ 7 0 ] i S H A R E S V I I P L C A N N U A L R E P O R T
As at 31 July 2018 and 31 July 2017
iShares MSCI USA
UCITS ETF iShares NASDAQ 100
UCITS ETF iShares Nikkei 225
UCITS ETF iShares FTSE Italia Mid-Small Cap
UCITS ETF*
Note 31 Jul 2018
$’00031 Jul 2017
$’00031 Jul 2018
$’000 31 Jul 2017
$’00031 Jul 2018
¥’00031 Jul 2017
¥’00031 Jul 2018
€’000 CURRENT ASSETS Cash 8,484 2,250 834 2,760 351,173 159,944 17
Margin cash account 54 72 3 18 11,401 6,347 -
Receivables 11 417 350 30,415 236 37,703 375,345 1
Financial assets at fair value through profit or loss 605,710 448,548 2,372,762 1,265,373 29,381,557 38,748,168 14,450
Total current assets 614,665 451,220 2,404,014 1,268,387 29,781,834 39,289,804 14,468 CURRENT LIABILITIES Margin cash account - - - - - (2) -
Payables 12 (6,776) (218) (30,623) (347) (12,406) (506,598) (4)
Financial liabilities at fair value through profit or loss - - - - - (757) - Total current liabilities excluding net assets attributable to redeemable participating shareholders (6,776) (218) (30,623) (347) (12,406) (507,357) (4)
Net asset value attributable to redeemable
participating shareholders at the end of the
financial year/period 607,889 451,002 2,373,391 1,268,040 29,769,428 38,782,447 14,464
* Fund launched during the financial year ended 31 July 2018.
The accompanying notes form an integral part of these financial statements.

iSHARES VII PLC NOTES TO THE FINANCIAL STATEMENTS For the financial year ended 31 July 2018
i S H A R E S V I I P L C A N N U A L R E P O R T [ 7 1 ]
1. COMPANY DETAILS
iShares VII public limited company is organised as an open-ended Investment Company with variable capital. The Company was incorporated in Ireland on 9 April 2009 with limited liability and segregated liability between its Funds and is organised under the laws of Ireland as a Public Limited Company ("PLC") pursuant to the Companies Act 2014 (as amended) and the UCITS Regulations and is regulated by the CBI. The registered office of the Company is J.P. Morgan House, International Financial Services Centre, Dublin 1, Ireland. 2. BASIS OF PREPARATION
The financial statements have been prepared for the financial year ended 31 July 2018. All amounts are rounded to nearest thousand, unless otherwise stated. Statement of compliance The financial statements are prepared in accordance with accounting standards generally accepted in Ireland including FRS 102, the financial reporting standard applicable in the UK and Republic of Ireland and Irish statute comprising the Companies Act 2014 (as amended) and the provisions of the UCITS Regulations. Accounting standards generally accepted in Ireland in preparing financial statements which present a true and fair view are issued by FRC. Due to the special nature of the Company's business, the Directors have adapted the arrangement and headings and sub-headings of the financial statements otherwise required by Schedule 3 to the Companies Act 2014 (as amended). The Company has availed of the exemption available to open ended investment funds that hold a substantial proportion of highly liquid and fair valued investments under Section 7 of FRS 102 and is not presenting cash flow statements. The information required by FRS 102 to be included in a statement of comprehensive income is contained in the income statement of each Fund. Fair value measurement and recognition
On initial application of FRS 102, in accounting for its financial instruments a reporting entity is required to apply either a) the full provisions of section 11 “Basic Financial Instruments” and section 12 “Other Financial Instruments” of FRS 102, b) the recognition and measurement provisions of IAS 39 Financial Instruments: Recognition and Measurement and only the disclosure requirements of Sections 11 and 12 of FRS 102; or c) the recognition and measurement provisions of IFRS 9 Financial Instruments and/or IAS 39 (as amended following the publication of IFRS 9) and only the disclosure requirements of Sections 11 and 12 of FRS 102. The Company has chosen to implement the recognition and measurement provisions of IAS 39 and only the disclosure requirements of Sections 11 and 12 of FRS 102 as they relate to financial instruments. Basis of measurement The financial statements are prepared under the historical cost convention as modified by the revaluation of financial assets and financial liabilities held at fair value through profit or loss. The Company will continue as a going concern and the financial statements of all Funds have been prepared on a going concern basis. All references to net assets throughout this document refer to net assets attributable to redeemable participating shareholders unless otherwise stated. Functional and presentation currency The presentation currency of the Company's financial statements is Euro. Foreign currency items included in the Funds' financial statements are measured in the Funds' functional currency which is shown for each Fund in the headings of the financial statements.

iSHARES VII PLC NOTES TO THE FINANCIAL STATEMENTS (continued) For the financial year ended 31 July 2018
[ 7 2 ] i S H A R E S V I I P L C A N N U A L R E P O R T
2. BASIS OF PREPARATION (continued)
Functional and presentation currency (continued) The presentation currency of the Funds' financial statements is the same as the functional currency. The Company’s balance sheet, income statement and the statement of changes in net assets attributable to redeemable participating shareholders are an aggregation of the positions and results of the Funds. Critical accounting estimates and judgements The preparation of financial statements in conformity with FRS 102 requires the use of certain critical accounting estimates. It also requires management to exercise its judgement in the process of applying the Company's accounting policies. The estimates and associated judgements are based on historical experience and various other factors that are believed to be reasonable under the circumstances, the results of which form the basis of making the judgements about carrying values of assets and liabilities that are not readily apparent from other sources. Management also makes estimates and assumptions concerning the future. The resulting accounting estimates will, by definition, seldom equal the actual results. Actual results may differ from these estimates and these differences could be material. The estimates and assumptions that have a significant risk of causing a material adjustment to the carrying amounts of assets and liabilities predominantly relate to the fair value of financial instruments, as discussed in the accounting policies.
3. ACCOUNTING POLICIES
The significant accounting policies adopted by the Company are:
a) Investments
Classification of investments The Company classifies its investments as financial assets and financial liabilities at fair value through profit or loss. The category of financial assets and financial liabilities through profit or loss comprises financial instruments (equities, ETF’s, rights, bonds, forward currency contracts, warrants and futures contracts), designated by the Investment Manager, at inception, as being at fair value through profit or loss. Financial assets and financial liabilities designated at fair value through profit or loss at inception are those that are managed and their performance evaluated on a fair value basis in accordance with the documented investment strategy. Recognition/derecognition of investments Purchases and sales of investments are accounted for on the date the trade transaction takes place. Investments are derecognised when the rights to receive cashflows from the investments have expired or the risks and rewards of ownership have all been substantially transferred. Realised gains and losses on disposals are calculated using the average cost method and are reflected as net gains/(losses) on financial assets/liabilities at fair value through profit or loss in the income statement.
Initial measurement of investments Financial assets and financial liabilities at fair value through profit or loss are initially recognised at fair value. Gains and losses arising from changes in the fair value of the financial assets or financial liabilities are presented in the income statement in the financial year in which they arise. Valuation of investments The estimation of fair value, after initial recognition, is determined as follows: i) Listed investments
As at financial year end, investments which are quoted, listed, traded or dealt on a market or exchange are based on quoted prices which, for the purpose of the financial statements is in line with the valuation methodology prescribed in the prospectus. Depending on the nature of the underlying security this could be either at the closing price, closing mid-market price or bid price on the relevant market. ii) Exchange Traded Funds (“ETFs”)
The fair value of any investment which is a unit of participation in an ETF shall be calculated on the relevant Fund’s valuation date by reference to the unaudited NAV of such unit of participation. The referenced NAV will be as calculated by the administrator of the ETF, and in accordance with the requirements of the scheme which the investment is a unit of.

iSHARES VII PLC NOTES TO THE FINANCIAL STATEMENTS (continued) For the financial year ended 31 July 2018
i S H A R E S V I I P L C A N N U A L R E P O R T [ 7 3 ]
3. ACCOUNTING POLICIES (continued)
a) Investments (continued)
iii) Financial derivative instruments
The Company’s derivatives comprise futures contracts and forward currency contracts and are recognised initially at fair value. Transaction costs are expensed in the income statement. Subsequent to initial recognition they are measured at fair value with changes in fair value recognised in the income statement. Where appropriate, gains and losses from certain financial derivative instruments are included in income or as net gains/(losses) on financial assets/liabilities at fair value through profit or loss in the income statement depending on whether they are used to protect or enhance income or capital. For further details on the types of derivatives held by the Company at financial year end please see the Glossary. iv) Prices calculated in consultation with the Manager
A number of securities were valued by the Administrator in consultation with the Manager in the absence of year end vendor prices. The total value of securities valued using a price calculated by the Manager as at 31 July 2018 and 31 July 2017 is less than 1% of the NAV of the applicable Fund. Please refer to the Valuation of financial instruments in note 4 for further details. b) Income/expenses
i) Dividend income
Dividend income is recognised when the securities are declared ex-dividend. Dividend income is shown gross of any non-reclaimable withholding tax, which is disclosed separately in the income statement.
ii) Interest income/expense
Bank, cash equivalent and bond interest income and expense are accrued on a daily basis using the effective interest basis and are disclosed in the income statement as operating income and interest expense respectively. iii) Amortisation/accretion of premium/discounts on purchase of interest-bearing investments
Premiums or discounts on the purchase of fixed and variable interest rate investments are amortised over the life of the investment on an effective interest basis. iv) Securities lending income
Securities lending income is earned from lending securities owned by the Fund to a number of third-party borrowers. Securities lending income is accounted for on an accruals basis. v) Management fee rebate
A management fee rebate is accrued on the portion of a Fund's assets invested in another iShares Fund based on the management fee rate charged by that Fund. The rebate is accounted for in the income statement. The management fee rebate is calculated based on the amount invested by iShares MSCI EM Asia UCITS ETF in iShares MSCI China A UCITS ETF (the “underlying fund”) multiplied by the management fee rate charged by the underlying fund. c) Fees and expenses
Expenses are accounted for on an accruals basis with the exception of transaction charges relating to the acquisition and realisation of investments which are charged as incurred.

iSHARES VII PLC NOTES TO THE FINANCIAL STATEMENTS (continued) For the financial year ended 31 July 2018
[ 7 4 ] i S H A R E S V I I P L C A N N U A L R E P O R T
3. ACCOUNTING POLICIES (continued)
d) Distributions
Distributions are accounted for as finance costs in the income statement. The Company may declare distributions for each distributing Fund or share class, in respect of each financial period. Dividends will normally be declared monthly, quarterly, semi-annually or such other times as the Directors deem appropriate. With the exception of iShares $ Treasury Bond 3-7yr UCITS ETF USD (Dist), iShares Core S&P 500 UCITS ETF GBP Hedged (Dist), iShares MSCI EMU UCITS ETF EUR (Dist), iShares MSCI EMU UCITS ETF GBP Hedged (Dist), all Funds or share classes are accumulating. As of 31 July 2018 and 31 July 2017, all of the Funds have adopted UK Reporting Fund Status. Any dividend amounts which have remained unclaimed for twelve years from the date of its declaration shall be forfeited and cease to remain owing by the Company to investors and become the property of the relevant Fund. e) Redeemable participating shares
Subscriptions and redemptions are accounted for on the day the trade transaction takes place. Redeemable participating shares are redeemable at the option of the shareholders and are classified as financial liabilities. f) Transaction costs
Transaction costs on purchases and sales of financial assets and financial liabilities are included in net gains/(losses) on financial assets at fair value through profit or loss in the income statement of the Fund. Separately identifiable transaction costs are disclosed in the transaction costs note in the additional information and regulatory disclosures section. Custody transaction costs are not separately identifiable as they form part of TER of the Fund. The Manager is responsible for discharging all operational expenses of the Fund. See additional information and regulatory disclosures section for more details. g) Foreign currency
Transactions and balances Transactions in foreign currencies are translated into the functional currency of each Fund at the foreign currency exchange rate in effect at the date of the transaction.
Subscriptions and redemptions of shares in foreign currencies are translated at the foreign currency exchange rate in effect at the date of the transaction. Foreign currency assets and liabilities, including investments, are translated at the exchange rate prevailing at year end. The foreign exchange gain or loss based on the translation of the investments, as well as the gain or loss arising on the translation of other assets and liabilities, is included in net gains/(losses) on financial assets/liabilities at fair value through profit or loss in the income statement. For aggregation purposes, all assets and liabilities for all Funds are translated into the presentation currency of the Company, at the financial year-end exchange rate. All income, expenses and capital transactions are translated at the average rate. h) Receivables
Receivables are recognised initially at fair value plus transaction costs that are directly attributable to their acquisition. They are subsequently measured at amortised cost using the effective interest basis less provision for impairment. i) Payables
Payables are recognised initially at fair value and subsequently stated at amortised cost. The difference between proceeds and the amount payable is recognised over the period of the payable using the effective interest method.

iSHARES VII PLC NOTES TO THE FINANCIAL STATEMENTS (continued) For the financial year ended 31 July 2018
i S H A R E S V I I P L C A N N U A L R E P O R T [ 7 5 ]
3. ACCOUNTING POLICIES (continued)
j) Cash and cash equivalents
Cash in the balance sheet includes deposits held on call with banks. Cash equivalents includes short-term liquid investments that are readily convertible to known amounts of cash and which are subject to an insignificant risk of changes in value. Bank overdrafts are classified as liabilities in the balance sheet. k) Margin cash
Cash balances held as margin with relevant brokers relating to investments in derivatives at the reporting date are included in current assets/liabilities in the balance sheet. l) Negative yield on financial assets
Negative yield on financial assets relating to interest from a negative effective interest rate on a financial asset is accreted daily and is recognised in the income statement over the life of the underlying instrument. m) Collateral
Cash collateral provided by the Company is identified on the balance sheet as pledged cash collateral and is not included as a component of cash and cash equivalents. Cash collateral provided to the Company by counterparties is identified on the balance sheet as cash collateral payable. The Company may reinvest this cash collateral and the assets purchased are included in financial assets at fair value through profit or loss on the balance sheet. For collateral received from counterparties other than cash, a disclosure of the value of collateral provided is made in the notes to the financial statements in the financial instrument and risk note. n) Adjustment to align to the valuation methodology as set out in the prospectus
The accounting policy of the Company is to value its investments at the relevant fair value at the balance sheet date. Fair value is considered to be the relevant price methodology outlined in the prospectus as at 31 July 2018. Depending on the nature of the underlying security this could be either at the closing price, closing mid-market or bid price on the relevant market. o) Equalisation on distributions
For tax and accounting purposes, the Manager implements income equalisation arrangements, to ensure that the level of income derived from investments is not affected by the issue, conversion or redemption of shares during the accounting period. Equalisation income and/or expense amounts are included in note 7 in the notes to the financial statements of the Company. p) Comparative financial year
Certain prior financial year figures have been reclassified to correspond to current financial year presentation. q) Taxation
Current tax Current tax is recognised in the income statement as the amount of income tax paid or payable in respect of the overseas taxable profit for the current or past reporting periods using the tax rates and laws that that have been enacted or substantively enacted by the reporting date.

iSHARES VII PLC NOTES TO THE FINANCIAL STATEMENTS (continued) For the financial year ended 31 July 2018
[ 7 6 ] i S H A R E S V I I P L C A N N U A L R E P O R T
3. ACCOUNTING POLICIES (continued)
q) Taxation (continued)
Deferred tax A provision for deferred tax payable is recognised in respect of material timing differences on the taxation of gains that have originated but not reversed at the balance sheet date. A deferred tax asset is not recognised to the extent that the transfer of economic benefits in the future is uncertain. Timing differences are differences between the Company’s overseas taxable profits and its results as stated in the financial statements that arise from the inclusion of income and expenses in tax assessments in periods different from those in which they are recognised in the financial statements. r) Segmental reporting
An operating segment is a component of the Company that engages in business activities from which it may earn revenues and incur expenses, including revenues and expenses that relates to transactions with any of the Company’s other components, whose operating results are reviewed regularly to make decisions about resources allocated to the segment and assess its performance, and for which discrete financial information is available. Segment results that are reported include items directly attributable to a segment as well as those that can be allocated on a reasonable basis. It is considered that each Fund is an operating segment which is investing in line with its investment objective. The segment information provided to the Investment Manager is the same as that disclosed in the income statement and balance sheet for each Fund. 4. FINANCIAL INSTRUMENTS AND RISKS
Introduction and overview The Company's investment activities expose it to the various types of risk which are associated with the financial instruments and markets in which it invests. The following information is not intended to be a comprehensive summary of all risks and investors should refer to the prospectus for a more detailed discussion of the risks inherent in investing in the Company. Risk management framework The Directors of the Company review quarterly investment performance reports and receive semi-annual presentations from the Investment Manager covering the Company’s performance and risk profile during the financial year. The Directors have delegated all the powers, duties and discretions exercisable in respect of the management of the Company and of the Funds to the Manager. The Manager has in turn delegated its investment management and advisory functions to the Investment Manager. The Investment Manager is responsible for ensuring that the Company is managed within the terms of the Funds’ investment guidelines and limits set out in the prospectus. The Board reserves to themselves the investment performance, product risk monitoring and oversight and the responsibility for the monitoring and oversight of regulatory and operational risk for the Company. The Manager has appointed a Risk Manager who has responsibility for the daily risk management process with assistance from key risk management personnel of the Investment Manager, including members of the BlackRock Risk and Quantitative Analysis Group (“RQA Group”) which is a centralised independent risk management function. The RQA Group independently identifies measures and monitors investment risk. The RQA Group tracks the actual risk management practices being deployed across the different Funds. By breaking down the components of the process, the RQA Group has the ability to determine if the appropriate risk management processes are in place across the Funds. This captures the risk management tools employed, how the levels of risk are controlled, ensuring risk/return is considered in portfolio construction and reviewing outcomes. The principal risk exposure of the Funds is set out as follows: a) Market risk
Market risk arises mainly from uncertainty about future values of financial instruments influenced by other price, currency and interest rate movements. It represents the potential loss the Funds may suffer through holding market positions in the face of market movements. The Funds are exposed to market risk by virtue of their investments in equities, ETF’s, rights, bonds, forward currency contracts, warrants and futures contracts.

iSHARES VII PLC NOTES TO THE FINANCIAL STATEMENTS (continued) For the financial year ended 31 July 2018
i S H A R E S V I I P L C A N N U A L R E P O R T [ 7 7 ]
4. FINANCIAL INSTRUMENTS AND RISKS (continued)
a) Market risk (continued)
There is no assurance that each benchmark index will continue to be calculated on the basis described in the prospectus or that they will not be amended significantly. The past performance of each benchmark index is not necessarily a guide to future performance. A key metric the RQA Group uses to measure market risk is Value at Risk ("VaR") which encompasses price, currency and interest rate risk. The RQA Group is a centralised group which performs an independent risk management function. The group independently identifies measures and monitors investment risk.
VaR is a statistical risk measure that estimates the potential portfolio loss from adverse market moves in an ordinary market environment. VaR analysis reflects the interdependencies between risk variables, unlike a traditional sensitivity analysis. The VaR calculations are based on an adjusted historical simulation model with a confidence level of 99%, a holding period of one day and a historical observation period of not less than one year (250 days). A VaR number is defined at a specified probability and a specified time horizon. A 99% one day VaR means that the expectation is that 99% of the time over a one day period the Fund will lose no more than this number in percentage terms. Therefore, higher VaR numbers indicate higher risk. It is noted that the use of the VaR methodology has limitations, namely assumptions that the use of historical market data as a basis for estimating future events does not encompass all possible scenarios, particularly those that are of an extreme nature and that the use of a specified confidence level (e.g. 99%) does not take into account losses that occur beyond this level. There is some probability that the loss could be greater than the VaR amounts. These limitations and the nature of the VaR measure mean that the Fund can neither guarantee that losses will not exceed the VaR amounts indicated, nor that losses in excess of the VaR amounts, will not occur more frequently. The Funds’ one day VaR as at 31 July 2018 and 31 July 2017 based on a 99% confidence level is outlined in the table below:
Fund
31 July 2018
%
31 July2017
%iShares $ Treasury Bond 1-3yr UCITS ETF USD (Acc) B 0.13 0.12iShares $ Treasury Bond 3-7yr UCITS ETF 0.36 0.38iShares $ Treasury Bond 7-10yr UCITS ETF USD (Acc) 0.66 0.68iShares € Govt Bond 1-3yr UCITS ETF EUR (Acc) 0.30 0.11iShares € Govt Bond 3-7yr UCITS ETF 0.54 0.37iShares € Govt Bond 7-10yr UCITS ETF EUR (Acc) 0.66 0.82iShares Core EURO STOXX 50 UCITS ETF 2.07 1.83iShares Core MSCI Pacific ex-Japan UCITS ETF 1.72 1.77iShares Core S&P 500 UCITS ETF 2.51 1.34iShares Dow Jones Industrial Average UCITS ETF 2.52 1.22iShares FTSE 100 UCITS ETF 2.04 1.57iShares FTSE MIB UCITS ETF EUR (Acc) 2.80 2.61iShares MSCI Brazil UCITS ETF USD (Acc) 4.51 4.56iShares MSCI Canada UCITS ETF 1.88 1.82iShares MSCI EM Asia UCITS ETF 2.38 1.73iShares MSCI EMU CHF Hedged UCITS ETF (Acc) 1.92 1.71iShares MSCI EMU Small Cap UCITS ETF 1.95 1.72iShares MSCI EMU UCITS ETF 1.94 1.72iShares MSCI EMU USD Hedged UCITS ETF (Acc) 1.92 1.73iShares MSCI Japan UCITS ETF USD (Acc) 2.08 1.97iShares MSCI Korea UCITS ETF USD (Acc) 2.95 2.61

iSHARES VII PLC NOTES TO THE FINANCIAL STATEMENTS (continued) For the financial year ended 31 July 2018
[ 7 8 ] i S H A R E S V I I P L C A N N U A L R E P O R T
4. FINANCIAL INSTRUMENTS AND RISKS (continued)
a) Market risk (continued)
Fund
31 July 2018
%
31 July2017
%iShares MSCI Mexico Capped UCITS ETF 3.72 2.82iShares MSCI Russia ADR/GDR UCITS ETF 3.70 3.04iShares MSCI UK Small Cap UCITS ETF 1.77 1.55iShares MSCI UK UCITS ETF 2.05 1.57iShares MSCI USA Small Cap UCITS ETF 2.31 1.96iShares MSCI USA UCITS ETF 2.49 1.35iShares NASDAQ 100 UCITS ETF 3.04 1.98iShares Nikkei 225 UCITS ETF 2.72 2.04iShares FTSE Italia Mid-Small Cap UCITS ETF* 2.65 -
* Fund launched during the financial year ended 31 July 2018.
i) Market risk arising from foreign currency risk
Exposure to foreign currency risk
Foreign currency risk is the risk that the fair value or future cash flows of a financial instrument will fluctuate because of changes in foreign exchange rates. The Funds may invest in securities, which as far as possible and practicable, consist of the component securities of the benchmark index of each Fund, and which may be denominated in currencies other than its reporting currency. The Funds with the exception of the currency hedged Funds (as listed in the background section), in line with their benchmarks, are unhedged and are therefore exposed to foreign currency risk. Consequently, each Fund is exposed to the risk of currency fluctuations between the base currency of the benchmark index and the base currency of the constituent securities of the benchmark index. In addition, certain Funds may have share classes which have different valuation currencies from the base currency of the Fund. Consequently, the investments of a share class may be acquired in currencies which are not the valuation currency of the share class. Currency hedged share classes use a currency hedging approach whereby the hedge is proportionately adjusted for net subscriptions and redemptions in the relevant currency hedged share class. An adjustment is made to the hedge to account for the price movements of the underlying securities held for the relevant currency hedged share class, however, the hedge will only be reset or adjusted on a monthly basis and as and when a pre-determined tolerance is triggered intra-month and not whenever there is market movement in the underlying securities. In the event that, the over-hedged or under-hedged position on any single underlying portfolio currency exposure of a currency hedged share class exceeds the pre-determined tolerance as at the close of a Business Day (for example, due to market movement), the hedge in respect of that underlying currency will be reset on the next Business Day (on which the relevant currency markets are open). Over-hedged positions shall not exceed 105% of the NAV of the relevant currency hedged share class and under-hedged positions shall not fall short of 95% of the portion of the NAV of the relevant currency hedged share class that is to be hedged against currency risk. As a result of this currency hedging approach the currency hedge share classes are considered to be immaterially exposed to foreign currency risk. Currency hedged share classes, where offered in a Fund, aim to reduce the impact of exchange rate fluctuations between the underlying portfolio currency exposures of the Fund and the valuation currency of the currency hedged share class on returns of the relevant benchmark index to investors in that share class, through entering into foreign exchange contracts for currency hedging. The realised or unrealised gains or losses relating to these forward currency contracts are allocated to the relevant share class. The details of such contracts are disclosed as hedged forwards in the Fund’s schedule of investments. The Funds may also invest in forward currency contracts and thus gain further exposure to foreign currency risk.

iSHARES VII PLC NOTES TO THE FINANCIAL STATEMENTS (continued) For the financial year ended 31 July 2018
i S H A R E S V I I P L C A N N U A L R E P O R T [ 7 9 ]
4. FINANCIAL INSTRUMENTS AND RISKS (continued)
a) Market risk (continued)
i) Market risk arising from foreign currency risk (continued)
Management of foreign currency risk To minimise this risk, the currency hedged Funds invest in forward currency contracts that as far as possible track the hedging methodology of the benchmark index. The benchmark indices of the currency hedged Funds are designed to represent a close approximation of the return that can be achieved by hedging the currency exposures of the index in the one month forward market at the end of each month. Exchange rate exposures are managed where appropriate and in compliance with the prospectus utilising forward currency contracts. The details of the contracts in place at the financial year-end date are disclosed in the schedules of investments. The Investment Manager will monitor the currency exposure and gain or loss arising from hedge positions of each currency hedged share class against the pre-determined tolerances daily and will determine when a currency hedge should be reset and the gain or loss arising from the currency forwards reinvested or settled, while taking into consideration the frequency and associated transaction and reinvestment costs of resetting the currency forwards. ii) Market risk arising from other price risk
Exposure to other price risk
Other price risk is the risk that the fair value or future cash flows of a financial instrument will fluctuate because of changes in market prices (other than those arising from interest rate risk or currency risk), whether those changes are caused by factors specific to the individual financial instrument or its issuer, or factors affecting similar financial instruments traded in the market.
The Funds are exposed to market risk arising by virtue of their investments in equities, ETF’s, rights, bonds, forward currency contracts, warrants and futures contracts. The movements in the prices of these investments result in movements in the performance of the Funds. The investment concentrations within the portfolio are disclosed in the schedules of investments by investment type. Management of other price risk The Investment Manager manages the Funds’ market risk on a daily basis in accordance with the Funds’ investment objective. The investment objective of the Funds is to provide investors with a total return, taking into account the capital and income returns, which reflect the total returns of the respective benchmark. The Fund’s performance is correlated to its benchmark. The correlation of the Fund’s performance against the benchmark is a metric monitored by key management personnel. iii) Market risk arising from interest rate risk
Exposure to interest rate risk Interest rate risk is the risk that the fair value or future cash flows of a financial instrument will fluctuate because of changes in market interest rates. The Funds are exposed to interest rate risk through their cash and cash equivalent holdings including margin cash held with brokers. The Funds are also exposed to interest rate risk through their investments in bonds, where the value of these securities may fluctuate as a result of a change in interest rates. The Funds also have indirect exposure to interest rate risk through their investments into futures contracts, whereby the value of the underlying asset may fluctuate as a result of a change in interest rates.

iSHARES VII PLC NOTES TO THE FINANCIAL STATEMENTS (continued) For the financial year ended 31 July 2018
[ 8 0 ] i S H A R E S V I I P L C A N N U A L R E P O R T
4. FINANCIAL INSTRUMENTS AND RISKS (continued)
a) Market risk (continued)
iii) Market risk arising from interest rate risk (continued)
Management of interest rate risk Movements in the prices of these investments are derived from movements in market interest rates and issuer creditworthiness. Issuer creditworthiness and credit spreads are monitored by the Investment Manager regularly. The securities in which the Funds invest will generally have a minimum rating of "investment grade" (Investment grade securities are those issued by an entity with a minimum investment grade credit rating from at least one globally recognised credit rating agency; Standard & Poor’s, Moody’s or Fitch) from a ratings agency as set out in the investment policy of the Funds. b) Counterparty credit risk
Exposure to counterparty credit risk
Counterparty credit risk is the risk that one party to a financial instrument will cause a financial loss for the other party by failing to discharge an obligation. The Funds are exposed to counterparty credit risk from the parties with which they trade and will bear the risk of settlement default. Management of counterparty credit risk Counterparty credit risk is monitored and managed by BlackRock’s RQA Counterparty & Concentration Risk Team. The team is headed by BlackRock’s Chief Counterparty Credit Officer who reports to the Global Head of RQA. Credit authority resides with the Chief Counterparty Credit Officer and selected team members to whom specific credit authority has been delegated. As such, counterparty approvals may be granted by the Chief Counterparty Credit Officer, or by identified RQA Credit Risk Officers who have been formally delegated authority by the Chief Counterparty Credit Officer. The BlackRock RQA Counterparty & Concentration Risk Team completes a formal review of each new counterparty, monitors and reviews all approved counterparties on an ongoing basis and maintains an active oversight of counterparty exposures and the collateral management process. There were no past due or impaired balances in relation to transactions with counterparties as at 31 July 2018 or 31 July 2017. i) Financial derivative instruments The Funds’ holdings in exchange traded futures contracts and over-the-counter ("OTC") financial derivative instruments exposes the Funds to counterparty credit risk. Management of counterparty credit risk related to financial derivative instruments
Exchange traded financial derivative instruments The exposure to futures contracts is limited by trading the contracts through a clearing house. The Funds’ exposure to counterparty credit risk on contracts in which it currently has a gain position is reduced by such gains received in cash from the counterparty under the daily mark-to-market mechanism on exchange traded futures contracts (variation margin). The Funds’ exposure to counterparty credit risk on contracts in which it currently has a loss position is equal to the amount of margin posted to the counterparty which has not been transferred to the exchange under the daily mark-to-market mechanism. The counterparties for futures contracts are Credit Suisse AG and Morgan Stanley & Co International Plc. The lowest long term credit rating of any of the counterparties as at 31 July 2018 is A (31 July 2017: A) (Standard & Poor's rating). Margin is paid or received on futures contracts to cover any exposure by the counterparty or the Funds to each other. “Margin cash account” on the balance sheet consists of margin receivable from or payable to the Fund's clearing brokers and the futures contracts counterparties.

iSHARES VII PLC NOTES TO THE FINANCIAL STATEMENTS (continued) For the financial year ended 31 July 2018
i S H A R E S V I I P L C A N N U A L R E P O R T [ 8 1 ]
4. FINANCIAL INSTRUMENTS AND RISKS (continued)
b) Counterparty credit risk (continued)
i) Financial derivative instruments (continued)
OTC financial derivative instruments
The Funds’ holdings in OTC financial derivative instruments expose the Funds to counterparty credit risk. Counterparty credit risk in relation to OTC financial derivative instruments arises from the failure of the counterparty to perform according to the terms of the contract. The Funds exposure to counterparty credit risk is limited to the contracts in which it currently has a financial asset position reduced by any collateral received from the counterparty, or to counterparties who have received collateral from the Funds. All OTC derivative transactions are entered into by the Funds under an International Swaps and Derivatives Associations, Inc. Master Agreement (“ISDA Master Agreement”) or similar agreement. An ISDA Master Agreement is a bilateral agreement between the Funds and a counterparty that governs OTC derivative transactions entered into by the parties. The parties’ exposures under the ISDA Master Agreement are netted and collateralised together, therefore any collateral disclosures provided are in respect of all OTC derivative transactions entered into by the Funds under the ISDA Master Agreement. All non-cash collateral received/posted by the Funds under the ISDA Master Agreement is transferred bilaterally under a title transfer arrangement. The carrying value of financial assets together with cash held with counterparties best represents the Fund’s gross maximum exposure to counterparty credit risk at the reporting date, before including the effect of ISDA Master Agreements and close-out netting, which reduces the overall counterparty credit risk exposure. Cash held as security by the counterparty to derivative contracts is subject to the credit risk of the counterparty. The Funds’ maximum exposure to counterparty credit risk from holding forward currency contracts will be equal to the notional amount of the currency and any net unrealised gains as disclosed in the schedules of investments. Management of counterparty credit risk related to OTC financial derivative instruments Forward currency contracts do not require variation margins and thus the counterparty credit risk is monitored through the BlackRock RQA Counterparty & Concentration Risk Team who monitor the credit-worthiness of the counterparty. The counterparties for forward currency contracts are disclosed in the relevant schedules of investments. The lowest credit rating of any one counterparty is AA- (31 July 2017: A-) (Standard & Poor’s rating). ii) Depositary
The Funds’ Depositary is State Street Custodial Services (Ireland) Limited (the "Depositary"). The majority of the investments are held by the Depositary at financial year end. Investments are segregated from the assets of the Depositary, with ownership rights remaining with the Funds. Bankruptcy or insolvency of the Depositary may cause the Funds’ rights with respect to its investments held by the Depositary to be delayed or limited. The maximum exposure to this risk is the amount of long investments disclosed in the schedules of investments.
The Depositary has appointed State Street Bank and Trust Company (the “Sub-Custodian”) as its global Sub-Custodian. Substantially all of the cash of the Company is held with the Sub-Custodian. The Funds’ cash balances are held by the Sub-Custodian in its account together with its own cash balances and with those cash balances that are held on behalf of other clients. The Funds’ cash balances are separately identifiable within the records of the Sub-Custodian. In respect of the cash held by the Sub-Custodian or other depositaries it appoints, the Funds will be exposed to counterparty credit risk of the Sub-Custodian or those depositaries. In the event of the insolvency or bankruptcy of the Sub-Custodian or other depositaries, the Funds will be treated as a general creditor of the Sub-Custodian or the depositaries.

iSHARES VII PLC NOTES TO THE FINANCIAL STATEMENTS (continued) For the financial year ended 31 July 2018
[ 8 2 ] i S H A R E S V I I P L C A N N U A L R E P O R T
4. FINANCIAL INSTRUMENTS AND RISKS (continued)
b) Counterparty credit risk (continued)
ii) Depositary (continued)
Management of counterparty credit risk related to the Depositary
To mitigate the Funds’ exposure to the Depositary, the Investment Manager employs specific procedures to ensure that the Depositary is a reputable institution and that the counterparty credit risk is acceptable to the Funds. The Funds only transacts with Depositary’s that are regulated entities subject to prudential supervision, or with "high credit ratings" assigned by international credit rating agencies. The long term credit rating of the parent company of the Depositary and Sub-Custodian, State Street Corporation, as at 31 July 2018 is A (31 July 2017: A) (Standard & Poor’s rating). In order to further mitigate the Fund’s counterparty credit risk exposure to the Sub-Custodian or depositary banks, the Funds may enter into additional arrangements such as the placing of residual cash in a money market fund for example Institutional Cash Series Plc (“ICS”) shown as a cash equivalent on the balance sheet. ICS is a BlackRock umbrella fund and an open-ended Investment Company with variable capital incorporated in Ireland and having segregated liability between its funds. ICS is authorised as a UCITS. iii) Counterparties
All transactions in listed securities are settled/paid for upon delivery using approved brokers. The risk of default is considered minimal, as delivery of securities sold is only made once the broker has received payment. Payment is made on a purchase once the securities have been received by the broker. The trade will fail if either party fails to meet its obligation. Counterparty credit risk arising on transactions with brokers relates to transactions awaiting settlement. Risk relating to unsettled transactions is considered small due to the short settlement period involved and the high credit quality of the brokers used. Management of counterparty credit risk related to counterparties RQA monitors the credit rating and financial position of the brokers used to further mitigate this risk. iv) Securities lending
The Funds that engage in securities lending activities expose such Funds to counterparty credit risk. The maximum exposure to each Fund is equal to the value of the securities loaned. Securities lending transactions entered into by the Funds are subject to a written legal agreement between the Funds and the Securities Lending Agent, BlackRock Advisors (UK) Limited, a related party to the Company, and separately between the Securities Lending Agent and the approved borrowing counterparty. Collateral received in exchange for securities lent is transferred under a title transfer arrangement and is delivered to and held in an account with a tri-party collateral manager in the name of the Depositary on behalf of the Funds. Collateral received is segregated from the assets belonging to the Funds’ Depositary or the Lending Agent. The value of securities on loan at the financial year end and the value of collateral held at the financial year end on behalf of the Funds is shown below:
31 July 2018 31 July 2017
Fund Currency
Value of Securities
on loan‘000
Value of Collateral received
‘000
Value of Securities
on loan‘000
Value of Collateral received
‘000 Company Total € 3,867,786 4,222,003 2,361,332 2,613,301iShares $ Treasury Bond 1-3yr UCITS ETF USD (Acc) B $ 30,152 33,103 20,058 22,176iShares $ Treasury Bond 3-7yr UCITS ETF $ 819,387 900,305 448,818 497,934iShares $ Treasury Bond 7-10yr UCITS ETF USD (Acc) $ 184,021 202,089 80,783 89,170iShares € Govt Bond 1-3yr UCITS ETF EUR (Acc) € 73,157 80,486 24,323 26,817iShares € Govt Bond 3-7yr UCITS ETF € 83,629 92,089 83,088 91,149iShares € Govt Bond 7-10yr UCITS ETF EUR (Acc) € 10,671 11,726 13,388 14,674iShares Core EURO STOXX 50 UCITS ETF € 317,330 340,944 67,830 74,561

iSHARES VII PLC NOTES TO THE FINANCIAL STATEMENTS (continued) For the financial year ended 31 July 2018
i S H A R E S V I I P L C A N N U A L R E P O R T [ 8 3 ]
4. FINANCIAL INSTRUMENTS AND RISKS (continued)
b) Counterparty credit risk (continued)
iv) Securities lending (continued)
31 July 2018 31 July 2017
Fund Currency
Value of Securities
on loan‘000
Value of Collateral received
‘000
Value of Securities
on loan‘000
Value of Collateral received
‘000 iShares Core MSCI Pacific ex-Japan UCITS ETF $ 364,765 399,598 171,124 194,748iShares Core S&P 500 UCITS ETF $ 1,230,922 1,340,780 1,006,111 1,110,763iShares Dow Jones Industrial Average UCITS ETF $ - - 8,385 9,396iShares FTSE 100 UCITS ETF £ 15,038 16,319 4,259 4,677iShares FTSE MIB UCITS ETF EUR (Acc) € 26,597 29,073 27,068 29,823iShares MSCI Canada UCITS ETF $ 92,785 100,233 88,692 98,050iShares MSCI EM Asia UCITS ETF $ 84,401 93,068 39,987 43,915iShares MSCI EMU CHF Hedged UCITS ETF (Acc) Fr 3,708 3,994 105 116iShares MSCI EMU Small Cap UCITS ETF € 321,841 351,342 251,007 275,836iShares MSCI EMU UCITS ETF € 142,888 155,157 68,830 75,995iShares MSCI EMU USD Hedged UCITS ETF (Acc) $ 22,345 23,985 834 929iShares MSCI Japan UCITS ETF USD (Acc) $ 100,132 110,472 45,295 50,788iShares MSCI Korea UCITS ETF USD (Acc) $ 4,416 4,751 1,716 1,893iShares MSCI UK Small Cap UCITS ETF £ 28,242 30,477 10,139 11,163iShares MSCI UK UCITS ETF £ 11,090 12,066 6,671 7,379iShares MSCI USA Small Cap UCITS ETF $ 127,634 140,268 100,477 111,326iShares MSCI USA UCITS ETF $ 34,662 38,727 3,472 3,801iShares NASDAQ 100 UCITS ETF $ 128,689 137,789 36,115 39,687iShares Nikkei 225 UCITS ETF ¥ 9,406,040 10,332,695 6,352,889 7,125,054
Management of counterparty credit risk related to securities lending
To mitigate this risk, the Funds which undertake securities lending transactions receive either cash or securities as collateral equal to a certain percentage in excess of the fair value of the securities loaned. The Investment Manager monitors the fair value of the securities loaned and additional collateral is obtained, if necessary. As at the 31 July 2018 and 31 July 2017, all non-cash collateral received consists of securities admitted to or dealt on a regulated market. The Funds also benefit from a borrower default indemnity provided by BlackRock, Inc. The indemnity allows for full replacement of securities lent. BlackRock, Inc. bears the cost of indemnification against borrower default. c) Issuer credit risk relating to debt securities
Issuer credit risk is the default risk of one of the issuers of any securities held by the Funds. Bonds or other debt securities involve credit risk to the issuer which may be evidenced by the issuer’s credit rating. Securities which are subordinated and/or have a lower credit rating are generally considered to have a higher credit risk and a greater possibility of default than more highly rated. A number of the Funds invest into sovereign and corporate debt. This exposes the Funds to the risk that the issuer of the bonds may default on interest or principal payments.

iSHARES VII PLC NOTES TO THE FINANCIAL STATEMENTS (continued) For the financial year ended 31 July 2018
[ 8 4 ] i S H A R E S V I I P L C A N N U A L R E P O R T
4. FINANCIAL INSTRUMENTS AND RISKS (continued)
c) Issuer credit risk relating to debt securities (continued)
Management of issuer credit risk related to debt securities
To manage this risk, the Investment Manager invests in a wide range of debt securities, subject to the investment objectives of each Fund and monitors the credit ratings of the investments as disclosed in the schedules of investments. The ratings of the debt securities are continually monitored by the BlackRock Portfolio Management Group (“PMG”). The following tables detail the credit rating profile of the debt securities held by the Funds as at 31 July 2018 and 31 July 2017:
31 July 2018 Currency
Investment grade
%
Non-investment grade
% Not rated
%Total
%iShares $ Treasury Bond 1-3yr UCITS ETF USD (Acc) B $ 100.00 - - 100.00
iShares $ Treasury Bond 3-7yr UCITS ETF $ 100.00 - - 100.00
iShares $ Treasury Bond 7-10yr UCITS ETF USD (Acc) $ 100.00 - - 100.00
iShares € Govt Bond 1-3yr UCITS ETF EUR (Acc) € 100.00 - - 100.00
iShares € Govt Bond 3-7yr UCITS ETF € 100.00 - - 100.00
iShares € Govt Bond 7-10yr UCITS ETF EUR (Acc) € 100.00 - - 100.00
31 July 2017 Currency
Investment grade
%
Non-investment grade
% Not rated
%Total
%iShares $ Treasury Bond 1-3yr UCITS ETF USD (Acc) B $ 100.00 - - 100.00
iShares $ Treasury Bond 3-7yr UCITS ETF $ 100.00 - - 100.00
iShares $ Treasury Bond 7-10yr UCITS ETF USD (Acc) $ 100.00 - - 100.00
iShares € Govt Bond 1-3yr UCITS ETF EUR (Acc) € 100.00 - - 100.00
iShares € Govt Bond 3-7yr UCITS ETF € 100.00 - - 100.00
iShares € Govt Bond 7-10yr UCITS ETF EUR (Acc) € 100.00 - - 100.00
d) Liquidity risk
Exposure to liquidity risk
Liquidity risk is the risk that the Funds will encounter difficulties in meeting their obligations associated with financial liabilities. Liquidity risk to the Funds arises from the redemption requests of investors and the liquidity of the underlying investments the Funds are invested in. The Funds’ shareholders may redeem their shares on the close of any daily dealing deadline for cash equal to a proportionate share of the Funds’ NAV. The Funds are therefore potentially exposed to the liquidity risk of meeting the shareholders’ redemptions and may need to sell assets at prevailing market prices to meet liquidity demands. It is also exposed to the liquidity risk of daily margin calls on derivatives. All derivative and non-derivative financial liabilities of the Funds held at the financial years ended 31 July 2018 and 31 July 2017 based on contractual maturities, fall due within one month, with the exception of those disclosed in the tables below:

iSHARES VII PLC NOTES TO THE FINANCIAL STATEMENTS (continued) For the financial year ended 31 July 2018
i S H A R E S V I I P L C A N N U A L R E P O R T [ 8 5 ]
4. FINANCIAL INSTRUMENTS AND RISKS (continued)
d) Liquidity risk (continued)
Exposure to liquidity risk (continued)
As at 31 July 2018
Fund Name Currency 1-3 Months
'000iShares MSCI Brazil UCITS ETF USD (Acc) - Futures contracts $ (4)
iShares MSCI EMU CHF Hedged UCITS ETF (Acc) - Forward currency contracts Fr (2)
iShares MSCI Japan UCITS ETF USD (Acc) - Futures contracts $ (39)
iShares MSCI Korea UCITS ETF USD (Acc) - Futures contracts $ (10)
iShares MSCI USA Small Cap UCITS ETF - Futures contracts $ (32)
As at 31 July 2017
Fund Name Currency 1-3 Months
'000iShares Core EURO STOXX 50 UCITS ETF - Futures contracts € (54)
iShares Core MSCI Pacific ex-Japan UCITS ETF - Futures contracts $ (26)
iShares FTSE 100 UCITS ETF - Futures contracts £ (33)
iShares MSCI Canada UCITS ETF - Futures contracts $ (4)
iShares MSCI EMU CHF Hedged UCITS ETF (Acc) - Forward currency contracts Fr (1)
iShares MSCI EMU Small Cap UCITS ETF - Futures contracts € (112)iShares MSCI EMU UCITS ETF - Futures contracts € (216)iShares MSCI UK UCITS ETF - Futures contracts £ (5)iShares Nikkei 225 UCITS ETF - Futures contracts ¥ (757)

iSHARES VII PLC NOTES TO THE FINANCIAL STATEMENTS (continued) For the financial year ended 31 July 2018
[ 8 6 ] i S H A R E S V I I P L C A N N U A L R E P O R T
4. FINANCIAL INSTRUMENTS AND RISKS (continued)
d) Liquidity risk (continued)
Exposure to liquidity risk (continued)
Management of liquidity risk
Liquidity risk is minimised by holding sufficient liquid investments which can be readily realised to meet liquidity demands. To manage this risk, if redemption requests on any dealing day represent 10% or more of the shares in issue in respect of any Fund, the Manager may, in its discretion, refuse to redeem any shares representing in excess of 10% of the NAV of the Fund (at any time including after the cut-off time on the dealing day). Any request for redemptions on such dealing day shall be reduced rateably and the redemption requests shall be treated as if they were received on each subsequent dealing day until all shares to which the original request related have been redeemed. In any event settlement for redemptions will normally be made within fourteen days of the dealing day. The Fund's liquidity risk is managed on a daily basis by the Investment Manager in accordance with established policies and procedures in place. The portfolio managers review daily forward looking cash reports which project cash obligations. These reports allow them to manage their cash obligations. The Funds benefit from the ETF creation and redemption process which, through the use of Authorised Participants, benefit from economies of scale and access to market participants with a visible market presence and a driver of large trading volumes. Investors and the Funds benefit from the ETF creation and redemption process, which allows an investor, through Authorised Participants, to create and redeem a large number of shares, therefore giving them access to significant market depth. This helps to mitigate liquidity risk and investor concentration risks for the Funds and mitigates investor concentration risks given that the Authorised Participants either receive the assets directly from the Fund on redemption, or for the minority of Funds a fee is charged to cover trading costs. e) Valuation of financial instruments
The Funds classify financial instruments measured at fair value using a fair value hierarchy. The fair value hierarchy has the following categories:
Level 1 - Quoted prices for identical instruments in active markets A financial instrument is regarded as quoted in an active market if quoted prices are readily and regularly available and those prices represent actual and regularly occurring market transactions on an arm’s length basis. The Fund does not adjust the quoted price for these instruments. Level 2 - Valuation techniques using observable inputs This category includes instruments valued using: quoted prices in active markets for similar instruments; quoted prices for similar instruments in markets that are considered less than active; or other valuation techniques where all significant inputs are directly or indirectly observable from market data. Valuation techniques used for non-standardised financial instruments such as OTC derivatives, include the use of comparable recent arm’s length transactions, reference to other instruments that are substantially the same, discounted cash flow analysis, option pricing models and other valuation techniques commonly used by market participants making the maximum use of market inputs and relying as little as possible on entity determined inputs.

iSHARES VII PLC NOTES TO THE FINANCIAL STATEMENTS (continued) For the financial year ended 31 July 2018
i S H A R E S V I I P L C A N N U A L R E P O R T [ 8 7 ]
4. FINANCIAL INSTRUMENTS AND RISKS (continued)
e) Valuation of financial instruments (continued)
Level 3 - Valuation techniques using significant unobservable inputs This category includes all instruments where the valuation techniques used include inputs not based on market data and these inputs could have a significant impact on the instrument’s valuation. This category also includes instruments that are valued based on quoted prices for similar instruments where significant entity determined adjustments or assumptions are required to reflect differences between the instruments and instruments for which there is no active market. The level in the fair value hierarchy within which the fair value measurement is categorised in its entirety is determined on the basis of the lowest level input that is significant to the fair value measurement in its entirety. For this purpose, the significance of an input is assessed against the fair value measurement in its entirety. If a fair value measurement uses observable inputs that require significant adjustment based on unobservable inputs, that measurement is a level 3 measurement. Assessing the significance of a particular input to the fair value measurement in its entirety requires judgement, considering factors specific to the asset or liability. The determination of what constitutes ‘observable’ inputs requires significant judgement by the investment Manager. The Investment Manager considers observable inputs to be that market data that is readily available, regularly distributed or updated, reliable and verifiable, not proprietary, and provided by independent sources that are actively involved in the relevant market. There were no level 3 securities held on the Funds with a fair value greater than 1% of the relevant Fund’s NAV at the financial year ended 31 July 2018 or 31 July 2017. The tables below and overleaf are an analysis of the Funds’ financial assets and financial liabilities measured at fair value at 31 July 2018.
31 July 2018
Level 1 Level 2 Level 3 TotaliShares $ Treasury Bond 1-3yr UCITS ETF USD (Acc) B $‘000 $‘000 $‘000 $‘000
Financial assets at fair value through profit or loss
- Bonds - 134,424 - 134,424
Total - 134,424 - 134,424
iShares $ Treasury Bond 3-7yr UCITS ETF $‘000 $‘000 $‘000 $‘000
Financial assets at fair value through profit or loss
- Bonds - 1,362,445 - 1,362,445
Total - 1,362,445 - 1,362,445
iShares $ Treasury Bond 7-10yr UCITS ETF USD (Acc) $‘000 $‘000 $‘000 $‘000
Financial assets at fair value through profit or loss
- Bonds - 216,181 - 216,181
Total - 216,181 - 216,181
iShares € Govt Bond 1-3yr UCITS ETF EUR (Acc) €‘000 €‘000 €‘000 €‘000
Financial assets at fair value through profit or loss
- Bonds - 267,528 - 267,528
Total - 267,528 - 267,528

iSHARES VII PLC NOTES TO THE FINANCIAL STATEMENTS (continued) For the financial year ended 31 July 2018
[ 8 8 ] i S H A R E S V I I P L C A N N U A L R E P O R T
4. FINANCIAL INSTRUMENTS AND RISKS (continued)
e) Valuation of financial instruments (continued)
31 July 2018 (continued)
Level 1 Level 2 Level 3 TotaliShares € Govt Bond 3-7yr UCITS ETF €‘000 €‘000 €‘000 €‘000
Financial assets at fair value through profit or loss
- Bonds - 339,881 - 339,881
Total - 339,881 - 339,881
iShares € Govt Bond 7-10yr UCITS ETF EUR (Acc) €‘000 €‘000 €‘000 €‘000
Financial assets at fair value through profit or loss
- Bonds - 39,969 - 39,969
Total - 39,969 - 39,969
iShares Core EURO STOXX 50 UCITS ETF €‘000 €‘000 €‘000 €‘000
Financial assets at fair value through profit or loss
- Equities 3,938,652 - - 3,938,652
- Futures contracts 546 - - 546
Total 3,939,198 - - 3,939,198
iShares Core MSCI Pacific ex-Japan UCITS ETF $‘000 $‘000 $‘000 $‘000
Financial assets at fair value through profit or loss
- Equities 1,728,447 - - 1,728,447
- Futures contracts 200 - - 200
Total 1,728,647 - - 1,728,647
Financial liabilities at fair value through profit or loss
- Futures contracts (33) - - (33)
Total (33) - - (33)
iShares Core S&P 500 UCITS ETF $‘000 $‘000 $‘000 $‘000
Financial assets at fair value through profit or loss
- Equities 30,063,941 - - 30,063,941
- Futures contracts 1,759 - - 1,759
Total 30,065,700 - - 30,065,700
Financial liabilities at fair value through profit or loss
- Forward currency contracts - (3,250) - (3,250)
Total - (3,250) - (3,250)

iSHARES VII PLC NOTES TO THE FINANCIAL STATEMENTS (continued) For the financial year ended 31 July 2018
i S H A R E S V I I P L C A N N U A L R E P O R T [ 8 9 ]
4. FINANCIAL INSTRUMENTS AND RISKS (continued)
e) Valuation of financial instruments (continued)
31 July 2018 (continued)
Level 1 Level 2 Level 3 TotaliShares Dow Jones Industrial Average UCITS ETF $‘000 $‘000 $‘000 $‘000
Financial assets at fair value through profit or loss
- Equities 364,705 - - 364,705
- Futures contracts 17 - - 17
Total 364,722 - - 364,722
iShares FTSE 100 UCITS ETF £‘000 £‘000 £‘000 £‘000
Financial assets at fair value through profit or loss
- Equities 462,874 - - 462,874
- Futures contracts 97 - - 97
Total 462,971 - - 462,971
iShares FTSE MIB UCITS ETF EUR (Acc) €‘000 €‘000 €‘000 €‘000
Financial assets at fair value through profit or loss
- Equities 96,325 - - 96,325
- Futures contracts 15 - - 15
Total 96,340 - - 96,340
iShares MSCI Brazil UCITS ETF USD (Acc) $‘000 $‘000 $‘000 $‘000
Financial assets at fair value through profit or loss
- Equities 29,067 - - 29,067
Total 29,067 - - 29,067
Financial liabilities at fair value through profit or loss
- Futures contracts (4) - - (4)
Total (4) - - (4)
iShares MSCI Canada UCITS ETF $‘000 $‘000 $‘000 $‘000
Financial assets at fair value through profit or loss
- Equities 970,623 - - 970,623
- Futures contracts 27 - - 27
Total 970,650 - - 970,650
iShares MSCI EM Asia UCITS ETF $‘000 $‘000 $‘000 $‘000
Financial assets at fair value through profit or loss
- Equities* 515,439 - - 515,439
- Rights 2 - - 2
- UCITS exchange traded fund 2,239 - - 2,239
- Futures contracts 123 - - 123
Total 517,803 - - 517,803
* Level 3 securities which are less than $500 are rounded to zero.

iSHARES VII PLC NOTES TO THE FINANCIAL STATEMENTS (continued) For the financial year ended 31 July 2018
[ 9 0 ] i S H A R E S V I I P L C A N N U A L R E P O R T
4. FINANCIAL INSTRUMENTS AND RISKS (continued)
e) Valuation of financial instruments (continued)
31 July 2018 (continued)
Level 1 Level 2 Level 3 TotaliShares MSCI EMU CHF Hedged UCITS ETF (Acc) Fr‘000 Fr‘000 Fr‘000 Fr‘000
Financial assets at fair value through profit or loss
- Equities 29,760 - - 29,760
- Forward currency contracts - 16 - 16
- Futures contracts 7 - - 7
Total 29,767 16 - 29,783
Financial liabilities at fair value through profit or loss
- Forward currency contracts - (3) - (3)
Total - (3) - (3)
iShares MSCI EMU Small Cap UCITS ETF €‘000 €‘000 €‘000 €‘000
Financial assets at fair value through profit or loss
- Equities* 1,051,510 - - 1,051,510
- Warrants - - 9 9
- Futures contracts 273 - - 273
Total 1,051,783 - 9 1,051,792
iShares MSCI EMU UCITS ETF €‘000 €‘000 €‘000 €‘000
Financial assets at fair value through profit or loss
- Equities 1,658,561 - - 1,658,561
- Forward currency contracts - 20 - 20
- Futures contracts 344 - - 344
Total 1,658,905 20 - 1,658,925
Financial liabilities at fair value through profit or loss
- Forward currency contracts - (283) - (283)
Total - (283) - (283)
iShares MSCI EMU USD Hedged UCITS ETF (Acc) $‘000 $‘000 $‘000 $‘000
Financial assets at fair value through profit or loss
- Equities 275,795 - - 275,795
- Forward currency contracts - 119 - 119
- Futures contracts 107 - - 107
Total 275,902 119 - 276,021
Financial liabilities at fair value through profit or loss
- Forward currency contracts - (29) - (29)
Total - (29) - (29)
* Level 3 securities which are less than €500 are rounded to zero.

iSHARES VII PLC NOTES TO THE FINANCIAL STATEMENTS (continued) For the financial year ended 31 July 2018
i S H A R E S V I I P L C A N N U A L R E P O R T [ 9 1 ]
4. FINANCIAL INSTRUMENTS AND RISKS (continued)
e) Valuation of financial instruments (continued)
31 July 2018 (continued)
Level 1 Level 2 Level 3 TotaliShares MSCI Japan UCITS ETF USD (Acc) $‘000 $‘000 $‘000 $‘000
Financial assets at fair value through profit or loss
- Equities 517,586 - - 517,586
Total 517,586 - - 517,586
Financial assets at fair value through profit or loss
- Futures contracts (39) - - (39)
Total (39) - - (39)
iShares MSCI Korea UCITS ETF USD (Acc) $‘000 $‘000 $‘000 $‘000
Financial assets at fair value through profit or loss
- Equities 48,037 - - 48,037
Total 48,037 - - 48,037
Financial assets at fair value through profit or loss
- Futures contracts (10) - - (10)
Total (10) - - (10)
iShares MSCI Mexico Capped UCITS ETF $‘000 $‘000 $‘000 $‘000
Financial assets at fair value through profit or loss
- Equities 68,973 - - 68,973
- Futures contracts 1 - - 1
Total 68,974 - - 68,974
iShares MSCI Russia ADR/GDR UCITS ETF $‘000 $‘000 $‘000 $‘000
Financial assets at fair value through profit or loss
- Equities 302,738 - - 302,738
- Futures contracts 240 - - 240
Total 302,978 - - 302,978
iShares MSCI UK Small Cap UCITS ETF £‘000 £‘000 £‘000 £‘000
Financial assets at fair value through profit or loss
- Equities* 145,364 - - 145,364
- Futures contracts 7 - - 7
Total 145,371 - - 145,371
* Level 3 securities which are less than £500 are rounded to zero.

iSHARES VII PLC NOTES TO THE FINANCIAL STATEMENTS (continued) For the financial year ended 31 July 2018
[ 9 2 ] i S H A R E S V I I P L C A N N U A L R E P O R T
4. FINANCIAL INSTRUMENTS AND RISKS (continued)
e) Valuation of financial instruments (continued)
31 July 2018 (continued)
Level 1 Level 2 Level 3 TotaliShares MSCI UK UCITS ETF £‘000 £‘000 £‘000 £‘000
Financial assets at fair value through profit or loss
- Equities 128,425 - - 128,425
- Futures contracts 41 - - 41
Total 128,466 - - 128,466
iShares MSCI USA Small Cap UCITS ETF $‘000 $‘000 $‘000 $‘000
Financial assets at fair value through profit or loss
- Equities 689,079 - 42 689,121
Total 689,079 - 42 689,121
Financial assets at fair value through profit or loss
- Futures contracts (32) - - (32)
Total (32) - - (32)
iShares MSCI USA UCITS ETF $‘000 $‘000 $‘000 $‘000
Financial assets at fair value through profit or loss
- Equities 605,670 - - 605,670
- Futures contracts 40 - - 40
Total 605,710 - - 605,710
iShares NASDAQ 100 UCITS ETF $‘000 $‘000 $‘000 $‘000
Financial assets at fair value through profit or loss
- Equities 2,372,760 - - 2,372,760
- Futures contracts 2 - - 2
Total 2,372,762 - - 2,372,762
iShares Nikkei 225 UCITS ETF ¥‘000 ¥‘000 ¥‘000 ¥‘000
Financial assets at fair value through profit or loss
- Equities 29,380,077 - - 29,380,077
- Futures contracts 1,480 - - 1,480
Total 29,381,557 - - 29,381,557
iShares FTSE Italia Mid-Small Cap UCITS ETF €‘000 €‘000 €‘000 €‘000
Financial assets at fair value through profit or loss
- Equities 14,450 - - 14,450
- Rights* - - - -
Total 14,450 - - 14,450
* Level 1 securities which are less than €500 are rounded to zero.

iSHARES VII PLC NOTES TO THE FINANCIAL STATEMENTS (continued) For the financial year ended 31 July 2018
i S H A R E S V I I P L C A N N U A L R E P O R T [ 9 3 ]
4. FINANCIAL INSTRUMENTS AND RISKS (continued)
e) Valuation of financial instruments (continued)
The tables below and overleaf are an analysis of the Funds’ financial assets and liabilities measured at fair value as at 31 July 2017:
31 July 2017
Level 1 Level 2 Level 3 TotaliShares $ Treasury Bond 1-3yr UCITS ETF USD (Acc) B $‘000 $‘000 $‘000 $‘000
Financial assets at fair value through profit or loss
- Bonds - 65,499 - 65,499Total - 65,499 - 65,499
iShares $ Treasury Bond 3-7yr UCITS ETF $‘000 $‘000 $‘000 $‘000
Financial assets at fair value through profit or loss
- Bonds - 635,307 - 635,307Total - 635,307 - 635,307
iShares $ Treasury Bond 7-10yr UCITS ETF USD (Acc) $‘000 $‘000 $‘000 $‘000
Financial assets at fair value through profit or loss
- Bonds - 105,707 - 105,707Total - 105,707 - 105,707
iShares € Govt Bond 1-3yr UCITS ETF EUR (Acc) €‘000 €‘000 €‘000 €‘000
Financial assets at fair value through profit or loss
- Bonds - 136,199 - 136,199Total - 136,199 - 136,199 iShares € Govt Bond 3-7yr UCITS ETF €‘000 €‘000 €‘000 €‘000
Financial assets at fair value through profit or loss
- Bonds - 318,374 - 318,374Total - 318,374 - 318,374
iShares € Govt Bond 7-10yr UCITS ETF EUR (Acc) €‘000 €‘000 €‘000 €‘000
Financial assets at fair value through profit or loss
- Bonds - 43,968 - 43,968Total - 43,968 - 43,968 iShares Core EURO STOXX 50 UCITS ETF €‘000 €‘000 €‘000 €‘000
Financial assets at fair value through profit or loss
- Equities 3,937,459 - - 3,937,459Total 3,937,459 - - 3,937,459Financial liabilities at fair value through profit or loss
- Futures contracts (54) - - (54)Total (54) - - (54)

iSHARES VII PLC NOTES TO THE FINANCIAL STATEMENTS (continued) For the financial year ended 31 July 2018
[ 9 4 ] i S H A R E S V I I P L C A N N U A L R E P O R T
4. FINANCIAL INSTRUMENTS AND RISKS (continued)
e) Valuation of financial instruments (continued)
31 July 2017 (continued)
Level 1 Level 2 Level 3 TotaliShares Core MSCI Pacific ex-Japan UCITS ETF $‘000 $‘000 $‘000 $‘000
Financial assets at fair value through profit or loss
- Equities 1,146,473 - - 1,146,473- Futures contracts 12 - - 12Total 1,146,485 - - 1,146,485Financial liabilities at fair value through profit or loss
- Futures contracts (26) - - (26)Total (26) - - (26)
iShares Core S&P 500 UCITS ETF $‘000 $‘000 $‘000 $‘000
Financial assets at fair value through profit or loss - Equities 22,334,100 - - 22,334,100- Futures contracts 1,098 - - 1,098Total 22,335,198 - - 22,335,198
iShares Dow Jones Industrial Average UCITS ETF $‘000 $‘000 $‘000 $‘000
Financial assets at fair value through profit or loss
- Equities 303,982 - - 303,982- Futures contracts 174 - - 174Total 304,156 - - 304,156 iShares FTSE 100 UCITS ETF £‘000 £‘000 £‘000 £‘000
Financial assets at fair value through profit or loss
- Equities 426,230 - - 426,230Total 426,230 - - 426,230Financial liabilities at fair value through profit or loss - Futures contracts (33) - - (33)Total (33) - - (33) iShares FTSE MIB UCITS ETF EUR (Acc) €‘000 €‘000 €‘000 €‘000
Financial assets at fair value through profit or loss
- Equities* 117,760 - - 117,760- Futures contracts 5 - - 5Total 117,765 - - 117,765* Level 3 securities which are less than €500 are rounded to zero.

iSHARES VII PLC NOTES TO THE FINANCIAL STATEMENTS (continued) For the financial year ended 31 July 2018
i S H A R E S V I I P L C A N N U A L R E P O R T [ 9 5 ]
4. FINANCIAL INSTRUMENTS AND RISKS (continued)
e) Valuation of financial instruments (continued)
31 July 2017 (continued)
Level 1 Level 2 Level 3 TotaliShares MSCI Brazil UCITS ETF USD (Acc) $‘000 $‘000 $‘000 $‘000
Financial assets at fair value through profit or loss
- Equities 29,224 - - 29,224- Futures contracts 3 - - 3Total 29,227 - - 29,227 iShares MSCI Canada UCITS ETF $‘000 $‘000 $‘000 $‘000
Financial assets at fair value through profit or loss
- Equities 795,236 - - 795,236Total 795,236 - - 795,236Financial liabilities at fair value through profit or loss - Futures contracts (4) - - (4)Total (4) - - (4)
iShares MSCI EM Asia UCITS ETF $‘000 $‘000 $‘000 $‘000
Financial assets at fair value through profit or loss - Equities 376,394 - 154 376,548- Futures contracts 142 - - 142Total 376,536 - 154 376,690 iShares MSCI EMU CHF Hedged UCITS ETF (Acc) Fr‘000 Fr‘000 Fr‘000 Fr‘000
Financial assets at fair value through profit or loss
- Equities 28,192 - - 28,192- Rights 1 - - 1- Forward currency contracts - 132 - 132- Futures contracts* - - - -Total 28,193 132 - 28,325Financial liabilities at fair value through profit or loss
- Forward currency contracts - (1,316) - (1,316)- Futures contracts (1) - - (1)Total (1) (1,316) - (1,317)* Level 1 securities which are less than Fr500 are rounded to zero.

iSHARES VII PLC NOTES TO THE FINANCIAL STATEMENTS (continued) For the financial year ended 31 July 2018
[ 9 6 ] i S H A R E S V I I P L C A N N U A L R E P O R T
4. FINANCIAL INSTRUMENTS AND RISKS (continued)
e) Valuation of financial instruments (continued)
31 July 2017 (continued)
Level 1 Level 2 Level 3 TotaliShares MSCI EMU Small Cap UCITS ETF €‘000 €‘000 €‘000 €‘000
Financial assets at fair value through profit or loss
- Equities* 867,082 - - 867,082- Rights* - - - -- Warrants - - 9 9- Futures contracts 5 - - 5Total 867,087 - 9 867,096Financial liabilities at fair value through profit or loss - Futures contracts (128) - - (128)Total (128) - - (128)
iShares MSCI EMU UCITS ETF €‘000 €‘000 €‘000 €‘000
Financial assets at fair value through profit or loss
- Equities 1,556,222 - - 1,556,222- Rights 41 - - 41Total 1,556,263 - - 1,556,263Financial liabilities at fair value through profit or loss - Futures contracts (248) - - (248)Total (248) - - (248)
iShares MSCI EMU USD Hedged UCITS ETF (Acc) $‘000 $‘000 $‘000 $‘000
Financial assets at fair value through profit or loss
- Equities 137,099 - - 137,099- Rights 4 - - 4- Forward currency contracts - 175 - 175Total 137,103 175 - 137,278Financial liabilities at fair value through profit or loss
- Forward currency contracts - (4,542) - (4,542)- Futures contracts (5) - - (5)Total (5) (4,542) - (4,547)
iShares MSCI Japan UCITS ETF USD (Acc) $‘000 $‘000 $‘000 $‘000
Financial assets at fair value through profit or loss
- Equities 436,007 - - 436,007- Futures contracts 7 - - 7Total 436,014 - - 436,014* Level 3 securities which are less than €500 are rounded to zero.

iSHARES VII PLC NOTES TO THE FINANCIAL STATEMENTS (continued) For the financial year ended 31 July 2018
i S H A R E S V I I P L C A N N U A L R E P O R T [ 9 7 ]
4. FINANCIAL INSTRUMENTS AND RISKS (continued)
e) Valuation of financial instruments (continued)
31 July 2017 (continued)
Level 1 Level 2 Level 3 TotaliShares MSCI Korea UCITS ETF USD (Acc) $‘000 $‘000 $‘000 $‘000
Financial assets at fair value through profit or loss
- Equities 61,138 - - 61,138- Futures contracts 6 - - 6Total 61,144 - - 61,144
iShares MSCI Mexico Capped UCITS ETF $‘000 $‘000 $‘000 $‘000
Financial assets at fair value through profit or loss
- Equities 65,916 - - 65,916- Futures contracts 15 - - 15Total 65,931 - - 65,931
iShares MSCI Russia ADR/GDR UCITS ETF $‘000 $‘000 $‘000 $‘000
Financial assets at fair value through profit or loss
- Equities 262,553 - - 262,553- Futures contracts 383 - - 383Total 262,936 - - 262,936
iShares MSCI UK Small Cap UCITS ETF £‘000 £‘000 £‘000 £‘000
Financial assets at fair value through profit or loss
- Equities 89,962 - - 89,962- Futures contracts 14 - - 14Total 89,976 - - 89,976
iShares MSCI UK UCITS ETF £‘000 £‘000 £‘000 £‘000
Financial assets at fair value through profit or loss
- Equities 127,557 - - 127,557Total 127,557 - - 127,557Financial liabilities at fair value through profit or loss - Futures contracts (5) - - (5)Total (5) - - (5) iShares MSCI USA Small Cap UCITS ETF $‘000 $‘000 $‘000 $‘000
Financial assets at fair value through profit or loss
- Equities 500,500 - 40 500,540- Futures contracts 8 - - 8Total 500,508 - 40 500,548

iSHARES VII PLC NOTES TO THE FINANCIAL STATEMENTS (continued) For the financial year ended 31 July 2018
[ 9 8 ] i S H A R E S V I I P L C A N N U A L R E P O R T
4. FINANCIAL INSTRUMENTS AND RISKS (continued)
e) Valuation of financial instruments (continued)
31 July 2017 (continued)
Level 1 Level 2 Level 3 TotaliShares MSCI USA UCITS ETF $‘000 $‘000 $‘000 $‘000
Financial assets at fair value through profit or loss
- Equities 448,535 - - 448,535- Futures contracts 13 - - 13Total 448,548 - - 448,548
iShares NASDAQ 100 UCITS ETF $‘000 $‘000 $‘000 $‘000
Financial assets at fair value through profit or loss
- Equities 1,265,311 - - 1,265,311- Futures contracts 62 - - 62Total 1,265,373 - - 1,265,373
iShares Nikkei 225 UCITS ETF ¥‘000 ¥‘000 ¥‘000 ¥‘000
Financial assets at fair value through profit or loss
- Equities 38,748,168 - - 38,748,168Total 38,748,168 - - 38,748,168Financial liabilities at fair value through profit or loss
- Futures contracts (757) - - (757)Total (757) - - (757)

iSHARES VII PLC NOTES TO THE FINANCIAL STATEMENTS (continued) For the financial year ended 31 July 2018
i S H A R E S V I I P L C A N N U A L R E P O R T [ 9 9 ]
5. NET GAINS/(LOSSES) ON FINANCIAL ASSETS/LIABILITIES AT FAIR VALUE THROUGH PROFIT OR LOSS
Company Total iShares $ Treasury Bond 1-3yr
UCITS ETF USD (Acc) B iShares $ Treasury Bond 3-7yr
UCITS ETF iShares $ Treasury Bond
7-10yr UCITS ETF USD (Acc)
31 Jul 2018
€’00031 Jul 2017
€’00031 Jul 2018
$’00031 Jul 2017
$’00031 Jul 2018
$’00031 Jul 2017
$’00031 Jul 2018
$’00031 Jul 2017
$’000 Net gains/(losses) on investments in securities
held at fair value through profit or loss 3,621,393 3,669,678 (1,541) (680) (29,258) (20,140) (9,333) (6,719)
Net gains/(losses) on forward currency contracts 6,457 (9,649) - - - - - -
Net gains on futures contracts 12,508 20,984 - - - - - -
Net (losses)/gains on foreign currency transactions (446) (611) - - 3 (3) 1 (1)
3,639,912 3,680,402 (1,541) (680) (29,255) (20,143) (9,332) (6,720)
iShares € Govt Bond 1-3yr UCITS
ETF EUR (Acc) iShares € Govt Bond 3-7yr
UCITS ETF iShares € Govt Bond 7-10yr UCITS
ETF EUR (Acc) iShares Core EURO STOXX 50
UCITS ETF
31 Jul 2018
€’00031 Jul 2017
€’00031 Jul 2018
€’00031 Jul 2017
€’00031 Jul 2018
€’00031 Jul 2017
€’00031 Jul 2018
€’00031 Jul 2017
€’000 Net (losses)/gains on investments in securities
held at fair value through profit or loss (928) 441 (1,628) (2,110) 284 (1,902) 87,557 250,304
Net gains on futures contracts - - - - - - 990 801
Net gains on foreign currency transactions - - - - - - 33 9
(928) 441 (1,628) (2,110) 284 (1,902) 88,580 251,114

iSHARES VII PLC NOTES TO THE FINANCIAL STATEMENTS (continued) For the financial year ended 31 July 2018
[ 1 0 0 ] i S H A R E S V I I P L C A N N U A L R E P O R T
5. NET GAINS/(LOSSES) ON FINANCIAL ASSETS/LIABILITIES AT FAIR VALUE THROUGH PROFIT OR LOSS (continued)
iShares Core MSCI Pacific ex-Japan
UCITS ETF iShares Core S&P 500
UCITS ETF iShares Dow Jones Industrial
Average UCITS ETF iShares FTSE 100
UCITS ETF
31 Jul 2018
$’00031 Jul 2017
$’00031 Jul 2018
$’00031 Jul 2017
$’00031 Jul 2018
$’00031 Jul 2017
$’00031 Jul 2018
£’00031 Jul 2017
£’000 Net gains on investments in securities held at fair
value through profit or loss 14,641 113,036 3,372,090 2,577,652 51,555 51,767 22,293 31,554
Net losses on forward currency contracts - - (3,190) - - - - -
Net gains on futures contracts 260 714 9,877 14,006 544 628 259 363
Net (losses)/gains on foreign currency transactions (344) (44) (98) 13 - - 35 2
14,557 113,706 3,378,679 2,591,671 52,099 52,395 22,587 31,919
iShares FTSE MIB UCITS ETF
EUR (Acc) iShares MSCI Brazil UCITS ETF
USD (Acc) iShares MSCI Canada
UCITS ETF iShares MSCI EM Asia
UCITS ETF
31 Jul 2018
€’00031 Jul 2017
€’00031 Jul 2018
$’00031 Jul 2017
$’00031 Jul 2018
$’00031 Jul 2017
$’00031 Jul 2018
$’00031 Jul 2017
$’000 Net gains/(losses) on investments in securities
held at fair value through profit or loss 4,747 28,575 (750) 3,374 36,260 64,715 (1,530) 61,661
Net (losses)/gains on futures contracts (47) 67 8 24 318 66 179 406
Net (losses)/gains on foreign currency transactions - (5) (13) 11 (12) (44) (57) (142)
4,700 28,637 (755) 3,409 36,566 64,737 (1,408) 61,925

iSHARES VII PLC NOTES TO THE FINANCIAL STATEMENTS (continued) For the financial year ended 31 July 2018
i S H A R E S V I I P L C A N N U A L R E P O R T [ 1 0 1 ]
5. NET GAINS/(LOSSES) ON FINANCIAL ASSETS/LIABILITIES AT FAIR VALUE THROUGH PROFIT OR LOSS (continued)
iShares MSCI EMU CHF Hedged
UCITS ETF (Acc) iShares MSCI EMU Small Cap
UCITS ETF iShares MSCI EMU
UCITS ETF iShares MSCI EMU USD Hedged
UCITS ETF (Acc)
31 Jul 2018
Fr’00031 Jul 2017
Fr’00031 Jul 2018
€’00031 Jul 2017
€’00031 Jul 2018
€’00031 Jul 2017
€’00031 Jul 2018
$’00031 Jul 2017
$’000 Net gains on investments in securities held at fair
value through profit or loss 1,806 6,857 59,657 105,790 66,578 182,021 481 19,496
Net (losses)/gains on forward currency contracts (739) (1,719) - - (168) - 11,862 (8,818)
Net (losses)/gains on futures contracts (19) 124 (223) 442 (592) 916 (128) 182
Net gains/(losses) on foreign currency transactions 44 31 35 (21) (237) (1) 218 80
1,092 5,293 59,469 106,211 65,581 182,936 12,433 10,940
iShares MSCI Japan UCITS
ETF USD (Acc) iShares MSCI Korea UCITS ETF
USD (Acc) iShares MSCI Mexico Capped
UCITS ETF iShares MSCI Russia ADR/GDR
UCITS ETF
31 Jul 2018
$’00031 Jul 2017
$’00031 Jul 2018
$’00031 Jul 2017
$’00031 Jul 2018
$’00031 Jul 2017
$’00031 Jul 2018
$’00031 Jul 2017
$’000 Net gains/(losses) on investments in securities
held at fair value through profit or loss 35,539 42,259 (2,125) 12,823 (4,146) 9,935 42,385 1,482
Net gains/(losses) on futures contracts 526 810 (36) 147 (14) 16 486 682
Net (losses)/gains on foreign currency transactions (133) (608) (4) 36 (5) (8) - -
35,932 42,461 (2,165) 13,006 (4,165) 9,943 42,871 2,164
iShares MSCI UK Large Cap
UCITS ETF* iShares MSCI UK Small Cap
UCITS ETF iShares MSCI UK
UCITS ETF iShares MSCI USA Small Cap
UCITS ETF
31 Jul 2017
£’00031 Jul 2018
£’00031 Jul 2017
£’00031 Jul 2018
£’00031 Jul 2017
£’00031 Jul 2018
$’00031 Jul 2017
$’000 Net gains on investments in securities held at fair
value through profit or loss 890 11,004 11,648 6,165 10,719 79,715 61,839
Net gains on futures contracts - 46 59 104 232 312 349
Net gains/(losses) on foreign currency transactions 13 1 1 11 (2) 1 10
903 11,051 11,708 6,280 10,949 80,028 62,198
* Fund closed during the financial year ended 31 July 2017.

iSHARES VII PLC NOTES TO THE FINANCIAL STATEMENTS (continued) For the financial year ended 31 July 2018
[ 1 0 2 ] i S H A R E S V I I P L C A N N U A L R E P O R T
5. NET GAINS/(LOSSES) ON FINANCIAL ASSETS/LIABILITIES AT FAIR VALUE THROUGH PROFIT OR LOSS (continued)
iShares MSCI USA
UCITS ETF iShares NASDAQ 100
UCITS ETF iShares Nikkei 225
UCITS ETF iShares FTSE Italia Mid-Small Cap
UCITS ETF*
31 Jul 2018
$’00031 Jul 2017
$’00031 Jul 2018
$’00031 Jul 2017
$’00031 Jul 2018
¥’00031 Jul 2017
¥’00031 Jul 2018
€’000
Net gains/(losses) on investments in securities
held at fair value through profit or loss 68,117 61,325 322,616 235,181 4,204,685 3,642,184 (689)
Net gains/(losses) on futures contracts 261 329 1,331 840 36,858 40,363 (3)
Net gains/(losses) on foreign currency transactions 1 - (1) (2) 357 416 -
68,379 61,654 323,946 236,019 4,241,900 3,682,963 (692) * Fund launched during the financial year ended 31 July 2018.

iSHARES VII PLC NOTES TO THE FINANCIAL STATEMENTS (continued) For the financial year ended 31 July 2018
i S H A R E S V I I P L C A N N U A L R E P O R T [ 1 0 3 ]
6. OPERATING EXPENSES
The Company employs an “all in one” fee structure for its Funds, with each Fund paying all of its fees, operating costs and expenses (and its due proportion of any costs and expenses allocated to it) as a single flat fee (the TER). Where a Fund has multiple Share Classes, any fees, operating costs and expenses which are attributable to a particular Share Class (rather than the entire Fund) will be deducted from the assets notionally allocated by the Fund to that Share Class. The TER is calculated in accordance with the Committee of European Securities Regulators (“CESR”) guidelines on the methodology for calculation of the ongoing charges figure in the Key Investor Information Document ("KIID") or the product page of the website at www.ishares.com. The Manager is responsible for discharging all operational expenses, including but not limited to fees and expenses of the Directors, Investment Manager, Depositary, Administrator, Transfer Agent and Registrar from the amounts received by the Manager from the TER. Such operational expenses include regulatory and audit fees but exclude transaction costs and extraordinary legal costs. In the event a Fund’s costs and expenses in connection with the operation of the Fund exceed the stated TER, the Manager will discharge any excess amount out of its own assets. Management fees (inclusive of investment management fees):
The Manager is entitled to an annual fee at rates not exceeding those set out on the following table. These rates are the maximum fee rates as at 31 July 2018:
Fund/Share Class*
TER(%) Currency hedged
fund/share classes
TER (%) Unhedged
fund/share classes iShares $ Treasury Bond 1-3yr UCITS ETF USD (Acc) B - 0.20
iShares $ Treasury Bond 3-7yr UCITS ETF USD (Acc) - 0.20
iShares $ Treasury Bond 3-7yr UCITS ETF USD (Dist) - 0.20
iShares $ Treasury Bond 7-10yr UCITS ETF USD (Acc) - 0.20
iShares € Govt Bond 1-3yr UCITS ETF EUR (Acc) - 0.20
iShares € Govt Bond 3-7yr UCITS ETF - 0.20
iShares € Govt Bond 7-10yr UCITS ETF EUR (Acc) - 0.20
iShares Core EURO STOXX 50 UCITS ETF - 0.10
iShares Core MSCI Pacific ex-Japan UCITS ETF - 0.20
iShares Core S&P 500 UCITS ETF USD (Acc) - 0.07
iShares Core S&P 500 UCITS ETF GBP Hedged (Dist)** 0.10 -
iShares Dow Jones Industrial Average UCITS ETF - 0.33
iShares FTSE 100 UCITS ETF - 0.07
iShares FTSE MIB UCITS ETF EUR (Acc) - 0.33
iShares MSCI Brazil UCITS ETF USD (Acc) - 0.65
iShares MSCI Canada UCITS ETF - 0.48
iShares MSCI EM Asia UCITS ETF - 0.65
iShares MSCI EMU CHF Hedged UCITS ETF (Acc) 0.38 -
iShares MSCI EMU Small Cap UCITS ETF - 0.58
iShares MSCI EMU UCITS ETF EUR (Acc)*** - 0.12
iShares MSCI EMU UCITS ETF EUR (Dist)*** - 0.12
iShares MSCI EMU UCITS ETF GBP Hedged (Dist)** 0.12 -
iShares MSCI EMU USD Hedged UCITS ETF (Acc) 0.38 -
iShares MSCI Japan UCITS ETF USD (Acc) - 0.48
iShares MSCI Korea UCITS ETF USD (Acc) - 0.65
* Where a Fund has multiple share classes, any fees, operating costs and expenses which are attributable to a particular share class (rather than the entire Fund) will be deducted from the assets notionally allocated by the Fund to that share class. ** This charge can be up to 1.00%. Any increase in this charge will be subject to prior shareholder approval. ***The TER of this Fund was amended during the financial year. The TER % in the table above is the maximum fee rate at 31 July 2018. The annualised TER % for the financal year is 0.30% for the (Acc) share class and 0.28% for the (Dist) share class.

iSHARES VII PLC NOTES TO THE FINANCIAL STATEMENTS (continued) For the financial year ended 31 July 2018
[ 1 0 4 ] i S H A R E S V I I P L C A N N U A L R E P O R T
6. OPERATING EXPENSES (continued)
Management fees (inclusive of investment management fees) (continued):
Fund/Share Class*
TER(%) Currency hedged
fund/share classes
TER (%) Unhedged
fund/share classes iShares MSCI Mexico Capped UCITS ETF - 0.65
iShares MSCI Russia ADR/GDR UCITS ETF - 0.65
iShares MSCI UK Small Cap UCITS ETF - 0.58
iShares MSCI UK UCITS ETF - 0.33
iShares MSCI USA Small Cap UCITS ETF - 0.43
iShares MSCI USA UCITS ETF - 0.33
iShares NASDAQ 100 UCITS ETF - 0.33
iShares Nikkei 225 UCITS ETF - 0.48
iShares FTSE Italia Mid-Small Cap UCITS ETF** - 0.33
* Where a Fund has multiple share classes, any fees, operating costs and expenses which are attributable to a particular share class (rather than the entire Fund) will be deducted from the assets notionally allocated by the Fund to that share class. ** As this Fund launched during the financial year, the fees, operating costs and expenses used to calculate the TER have been annualised.
Whilst it is anticipated that the TER borne by a Fund or share class shall not exceed the amounts set out above during the life of the Fund or share class (respectively) such amounts may need to be increased. Any such increase will be subject to the prior Shareholder approval of the relevant Fund or share class evidenced either by a majority vote at a meeting of shareholders or by a written resolution of all of the shareholders. As disclosed, no commissions, discounts, brokerages or other special terms have been granted or are payable by the Company in connection with the issue or sale of any capital of the Company.

iSHARES VII PLC NOTES TO THE FINANCIAL STATEMENTS (continued) For the financial year ended 31 July 2018
i S H A R E S V I I P L C A N N U A L R E P O R T [ 1 0 5 ]
7. DISTRIBUTIONS TO REDEEMABLE PARTICIPATING SHAREHOLDERS
The Company may declare and pay dividends on any distributing class of shares in the Company. In accordance with the prospectus, any dividend which has remained unclaimed for twelve years from the date of its declaration shall be forfeited and cease to remain owing by the Company to investors and become the property of the relevant Fund.
Distributions declared during the financial year were as follows:
Company Total iShares $ Treasury Bond 3-7yr
UCITS ETF iShares Core S&P 500
UCITS ETF iShares MSCI EMU
UCITS ETF
31 Jul 2018
€’00031 Jul 2018
$’000 31 Jul 2018
$’00031 Jul 2018
€’000
August 40 - - 40 February 28 - - 28
Distributions declared during the financial year 68 - - 68 Equalisation income (627) (13) (317) (351) Equalisation expense 269 - - 269
Total (290) (13) (317) (14) There were no distributions paid or declared during the financial year ended 31 July 2017.

iSHARES VII PLC NOTES TO THE FINANCIAL STATEMENTS (continued) For the financial year ended 31 July 2018
[ 1 0 6 ] i S H A R E S V I I P L C A N N U A L R E P O R T
8. TAXATION
Below is an analysis of the tax charge for the financial year:
Company Total iShares Core EURO STOXX 50
UCITS ETF iShares Core MSCI Pacific ex-Japan
UCITS ETF iShares Core S&P 500
UCITS ETF
31 Jul 2018
€’00031 Jul 2017
€’00031 Jul 2018
€’000 31 Jul 2017
€’00031 Jul 2018
$’00031 Jul 2017
$’00031 Jul 2018
$’000 31 Jul 2017
$’000 Current tax
Non-reclaimable overseas income withholding tax (95,042) (80,051) (10,052) (6,772) (981) (894) (70,946) (57,429)
Non-reclaimable overseas capital gains tax (11) - - - - - - -
Deferred tax
Provision for overseas capital gains tax payable (476) (416) - - - - - - Total tax (95,529) (80,467) (10,052) (6,772) (981) (894) (70,946) (57,429)
iShares Dow Jones Industrial
Average UCITS ETF iShares FTSE 100
UCITS ETF iShares FTSE MIB UCITS ETF
EUR (Acc) iShares MSCI Brazil UCITS ETF
USD (Acc)
31 Jul 2018
$’00031 Jul 2017
$’00031 Jul 2018
£’000 31 Jul 2017
£’00031 Jul 2018
€’00031 Jul 2017
€’00031 Jul 2018
$’000 31 Jul 2017
$’000 Current tax Non-reclaimable overseas income withholding tax (1,234) (1,085) (200) (47) (492) (570) (154) (129) Non-reclaimable overseas capital gains tax - - - - - - (13) - Deferred tax Provision for overseas capital gains tax payable - - - - - - (568) (455) Total tax (1,234) (1,085) (200) (47) (492) (570) (735) (584)
iShares MSCI Canada
UCITS ETF iShares MSCI EM Asia
UCITS ETF iShares MSCI EMU CHF Hedged
UCITS ETF (Acc) iShares MSCI EMU Small Cap
UCITS ETF
31 Jul 2018
$’00031 Jul 2017
$’00031 Jul 2018
$’000 31 Jul 2017
$’00031 Jul 2018
Fr’00031 Jul 2017
Fr’00031 Jul 2018
€’000 31 Jul 2017
€’000 Current tax Non-reclaimable overseas income withholding tax (6,547) (5,584) (1,708) (942) (65) (71) (2,743) (1,602) Total tax (6,547) (5,584) (1,708) (942) (65) (71) (2,743) (1,602)

iSHARES VII PLC NOTES TO THE FINANCIAL STATEMENTS (continued) For the financial year ended 31 July 2018
i S H A R E S V I I P L C A N N U A L R E P O R T [ 1 0 7 ]
8. TAXATION (continued)
iShares MSCI EMU
UCITS ETF iShares MSCI EMU USD Hedged
UCITS ETF (Acc) iShares MSCI Japan UCITS
ETF USD (Acc) iShares MSCI Korea UCITS ETF
USD (Acc)
31 Jul 2018
€’00031 Jul 2017
€’00031 Jul 2018
$’000 31 Jul 2017
$’00031 Jul 2018
$’00031 Jul 2017
$’00031 Jul 2018
$’000 31 Jul 2017
$’000 Current tax
Non-reclaimable overseas income withholding tax (4,177) (2,852) (773) (186) (1,617) (1,468) (241) (200) Total tax (4,177) (2,852) (773) (186) (1,617) (1,468) (241) (200)
iShares MSCI Mexico Capped
UCITS ETF iShares MSCI Russia ADR/GDR
UCITS ETF iShares MSCI UK Small Cap
UCITS ETF iShares MSCI UK
UCITS ETF
31 Jul 2018
$’00031 Jul 2017
$’00031 Jul 2018
$’000 31 Jul 2017
$’00031 Jul 2018
£’00031 Jul 2017
£’00031 Jul 2018
£’000 31 Jul 2017
£’000 Current tax
Non-reclaimable overseas income withholding tax (47) (46) (2,030) (1,829) (42) (29) (57) (12) Total tax (47) (46) (2,030) (1,829) (42) (29) (57) (12)
iShares MSCI USA Small Cap
UCITS ETF iShares MSCI USA
UCITS ETF iShares NASDAQ 100
UCITS ETF iShares Nikkei 225
UCITS ETF
31 Jul 2018
$’00031 Jul 2017
$’00031 Jul 2018
$’000 31 Jul 2017
$’00031 Jul 2018
$’00031 Jul 2017
$’00031 Jul 2018
¥’000 31 Jul 2017
¥’000 Current tax Non-reclaimable overseas income withholding tax (1,218) (1,062) (1,419) (1,408) (2,312) (1,715) (99,295) (56,010) Total tax (1,218) (1,062) (1,419) (1,408) (2,312) (1,715) (99,295) (56,010)
iShares FTSE Italia Mid-Small Cap
UCITS ETF*
31 Jul 2018
€’000
Current tax Non-reclaimable overseas income withholding tax (52) Total tax (52)
* Fund launched during the financial year ended 31 July 2018.

iSHARES VII PLC NOTES TO THE FINANCIAL STATEMENTS (continued) For the financial year ended 31 July 2018
[ 1 0 8 ] i S H A R E S V I I P L C A N N U A L R E P O R T
8. TAXATION (continued)
Irish tax Under current law and practice, the Company qualifies as an investment undertaking as defined in Section 739B of the Taxes Consolidation Act, 1997, as amended. On that basis it is not chargeable to Irish tax on its income or gains. However, Irish tax may arise on the occurrence of a 'chargeable event'. A chargeable event includes any distribution payments to shareholders or any encashment, redemption, cancellation or transfer of shares and the holding of shares at the end of each eight year period beginning with the acquisition of such shares. No Irish tax will arise on the Company in respect of chargeable events in respect of: a) A shareholder who is neither Irish resident nor ordinarily resident in Ireland for tax purposes, at the time of the chargeable event, provided
appropriate valid declarations in accordance with the provisions of the Taxes Consolidation Act, 1997, as amended, are held by the Company; or the Company has been authorised by the Irish Revenue to make gross payments in the absence of appropriate declarations; and
b) Certain exempted Irish tax resident shareholders who have provided the Company with the necessary signed annual declarations; and
c) Any transaction (which might otherwise be a chargeable event) in relation to shares held in a recognised clearing system as designated by order of the Irish Revenue Commissioners (such as CREST) will not constitute a chargeable event. It is the current intention of the Directors that all the shares in the Company will be held in CREST or another recognised clearing system.
Overseas tax Dividends, interest and capital gains (if any) received on investments made by the Company may be subject to withholding taxes imposed by the country from which the investment income/gains are received and such taxes may not be recoverable by the Company or its shareholders.
For financial reporting purposes, and in accordance with FRS 102, the Company must recognise a provision for deferred tax payable arising from material timing differences between the taxation of unrealised gains in the financial statements and actual realisable taxable profits.

iSHARES VII PLC NOTES TO THE FINANCIAL STATEMENTS (continued) For the financial year ended 31 July 2018
i S H A R E S V I I P L C A N N U A L R E P O R T [ 1 0 9 ]
9. SHARE CAPITAL
The issued and fully paid redeemable participating share capital is at all times equal to the NAV of the Company. Redeemable participating shares are redeemable at the shareholders' option and are classified as financial liabilities. Redeemable Participating Shares - issued and fully paid
Company Total iShares $ Treasury Bond 1-3yr UCITS
ETF USD (Acc) B iShares $ Treasury Bond 3-7yr
UCITS ETF USD (Acc) iShares $ Treasury Bond 3-7yr
UCITS ETF USD (Dist)*
31 July 2018
No. of Shares31 July 2017
No. of Shares31 July 2018
No. of Shares31 July 2017
No. of Shares31 July 2018
No. of Shares31 July 2017
No. of Shares31 July 2018
No. of Shares Balance at the beginning of financial year 236,319,757 173,898,279 620,000 700,000 5,140,000 5,720,000 - Issued during the financial year 209,191,525 105,572,000 1,380,000 460,000 8,560,000 2,840,000 8,794,000 Redeemed during the financial year (70,478,982) (43,150,522) (720,000) (540,000) (2,800,000) (3,420,000) - Balance at the end of financial year 375,032,300 236,319,757 1,280,000 620,000 10,900,000 5,140,000 8,794,000
iShares $ Treasury Bond
7-10yr UCITS ETF USD (Acc) iShares € Govt Bond 1-3yr UCITS
ETF EUR (Acc) iShares € Govt Bond 3-7yr
UCITS ETF iShares € Govt Bond 7-10yr UCITS
ETF EUR (Acc)
31 July 2018
No. of Shares31 July 2017
No. of Shares31 July 2018
No. of Shares31 July 2017
No. of Shares31 July 2018
No. of Shares31 July 2017
No. of Shares31 July 2018
No. of Shares 31 July 2017
No. of Shares Balance at the beginning of financial year 760,000 860,000 1,215,000 765,000 2,430,000 1,590,000 285,000 345,000 Issued during the financial year 1,980,000 760,000 2,085,000 525,000 1,530,000 1,365,000 75,000 120,000 Redeemed during the financial year (1,140,000) (860,000) (900,000) (75,000) (1,365,000) (525,000) (105,000) (180,000) Balance at the end of financial year 1,600,000 760,000 2,400,000 1,215,000 2,595,000 2,430,000 255,000 285,000
iShares Core EURO STOXX 50
UCITS ETF iShares Core MSCI Pacific ex-Japan
UCITS ETF iShares Core S&P 500 UCITS ETF USD (Acc)
iShares Core S&P 500 UCITS ETF GBP Hedged (Dist)*
31 July 2018
No. of Shares31 July 2017
No. of Shares31 July 2018
No. of Shares31 July 2017
No. of Shares31 July 2018
No. of Shares31 July 2017
No. of Shares31 July 2018
No. of Shares Balance at the beginning of financial year 37,949,637 18,549,637 8,275,285 3,525,285 95,023,809 77,398,809 - Issued during the financial year 2,300,000 20,225,000 6,325,000 5,000,000 28,800,000 28,775,000 69,290,930 Redeemed during the financial year (4,125,000) (825,000) (2,800,000) (250,000) (15,244,282) (11,150,000) - Balance at the end of financial year 36,124,637 37,949,637 11,800,285 8,275,285 108,579,527 95,023,809 69,290,930
* Share class launched during the financial year ended 31 July 2018.

iSHARES VII PLC NOTES TO THE FINANCIAL STATEMENTS (continued) For the financial year ended 31 July 2018
[ 1 1 0 ] i S H A R E S V I I P L C A N N U A L R E P O R T
9. SHARE CAPITAL (continued)
iShares Dow Jones Industrial Average
UCITS ETF iShares FTSE 100
UCITS ETF iShares FTSE MIB UCITS ETF
EUR (Acc) iShares MSCI Brazil UCITS ETF
USD (Acc)
31 July 2018
No. of Shares31 July 2017
No. of Shares31 July 2018
No. of Shares31 July 2017
No. of Shares31 July 2018
No. of Shares31 July 2017
No. of Shares31 July 2018
No. of Shares 31 July 2017
No. of Shares Balance at the beginning of financial year 1,324,995 1,199,995 3,950,158 3,750,158 1,525,078 2,275,078 421,000 446,000 Issued during the financial year 625,000 725,000 - 600,000 475,000 700,000 - 75,000 Redeemed during the financial year (625,000) (600,000) - (400,000) (825,000) (1,450,000) - (100,000) Balance at the end of financial year 1,324,995 1,324,995 3,950,158 3,950,158 1,175,078 1,525,078 421,000 421,000
iShares MSCI Canada
UCITS ETF iShares MSCI EM Asia
UCITS ETF iShares MSCI EMU CHF Hedged
UCITS ETF (Acc) iShares MSCI EMU Small Cap
UCITS ETF
31 July 2018
No. of Shares31 July 2017
No. of Shares31 July 2018
No. of Shares31 July 2017
No. of Shares31 July 2018
No. of Shares31 July 2017
No. of Shares31 July 2018
No. of Shares 31 July 2017
No. of Shares Balance at the beginning of financial year 6,502,008 5,727,008 2,653,886 1,653,886 5,500,000 8,000,000 4,600,368 2,700,368 Issued during the financial year 2,625,000 4,400,000 1,125,000 1,450,000 500,000 500,000 1,800,000 2,375,000 Redeemed during the financial year (1,725,000) (3,625,000) (275,000) (450,000) (500,000) (3,000,000) (1,250,000) (475,000) Balance at the end of financial year 7,402,008 6,502,008 3,503,886 2,653,886 5,500,000 5,500,000 5,150,368 4,600,368
iShares MSCI EMU
UCITS ETF EUR (Acc) iShares MSCI EMU
UCITS ETF EUR (Dist) iShares MSCI EMU
UCITS ETF GBP Hedged (Dist)* iShares MSCI EMU USD Hedged
UCITS ETF (Acc)
31 July 2018
No. of Shares31 July 2017
No. of Shares31 July 2018
No. of Shares31 July 2017
No. of Shares31 July 2018
No. of Shares31 July 2018
No. of Shares 31 July 2017
No. of Shares Balance at the beginning of financial year 14,324,403 12,524,403 502,000 - - 24,500,000 10,000,000 Issued during the financial year 2,936,000 3,275,000 4,093,516 502,000 7,942,079 38,500,000 20,000,000 Redeemed during the financial year (3,404,700) (1,475,000) (2,850,000) - - (17,000,000) (5,500,000) Balance at the end of financial year 13,855,703 14,324,403 1,745,516 502,000 7,942,079 46,000,000 24,500,000
* Share class launched during the financial year ended 31 July 2018.

iSHARES VII PLC NOTES TO THE FINANCIAL STATEMENTS (continued) For the financial year ended 31 July 2018
i S H A R E S V I I P L C A N N U A L R E P O R T [ 1 1 1 ]
9. SHARE CAPITAL (continued)
iShares MSCI Japan UCITS
ETF USD (Acc) iShares MSCI Korea UCITS ETF
USD (Acc) iShares MSCI Mexico Capped
UCITS ETF iShares MSCI Russia ADR/GDR
UCITS ETF
31 July 2018
No. of Shares31 July 2017
No. of Shares31 July 2018
No. of Shares31 July 2017
No. of Shares31 July 2018
No. of Shares31 July 2017
No. of Shares31 July 2018
No. of Shares 31 July 2017
No. of Shares Balance at the beginning of financial year 3,307,322 3,832,322 384,000 359,000 509,355 584,355 3,210,000 2,210,000 Issued during the financial year 1,575,000 2,575,000 - 100,000 275,000 525,000 3,125,000 2,450,000 Redeemed during the financial year (1,450,000) (3,100,000) (75,000) (75,000) (225,000) (600,000) (3,400,000) (1,450,000) Balance at the end of financial year 3,432,322 3,307,322 309,000 384,000 559,355 509,355 2,935,000 3,210,000
iShares MSCI UK Large Cap
UCITS ETF* iShares MSCI UK Small Cap
UCITS ETF iShares MSCI UK
UCITS ETF iShares MSCI USA Small Cap
UCITS ETF
31 July 2017
No. of Shares31 July 2018
No. of Shares31 July 2017
No. of Shares31 July 2018
No. of Shares31 July 2017
No. of Shares31 July 2018
No. of Shares 31 July 2017
No. of Shares Balance at the beginning of financial year 100,522 450,322 400,322 1,249,653 1,324,653 1,725,414 1,175,414 Issued during the financial year 25,000 350,000 350,000 50,000 75,000 825,000 1,175,000 Redeemed during the financial year (125,522) (150,000) (300,000) (125,000) (150,000) (525,000) (625,000) Balance at the end of financial year - 650,322 450,322 1,174,653 1,249,653 2,025,414 1,725,414
iShares MSCI USA
UCITS ETF iShares NASDAQ 100
UCITS ETF iShares Nikkei 225
UCITS ETF iShares FTSE Italia Mid-Small Cap
UCITS ETF**
31 July 2018
No. of Shares31 July 2017
No. of Shares31 July 2018
No. of Shares31 July 2017
No. of Shares31 July 2018
No. of Shares31 July 2017
No. of Shares31 July 2018
No. of Shares Balance at the beginning of financial year/period 1,957,281 2,157,281 3,900,037 3,150,037 2,123,746 873,746 - Issued during the financial year/period 450,000 475,000 2,650,000 1,200,000 1,650,000 1,950,000 6,500,000 Redeemed during the financial year/period (125,000) (675,000) (650,000) (450,000) (2,350,000) (700,000) (3,750,000) Balance at the end of financial year/period 2,282,281 1,957,281 5,900,037 3,900,037 1,423,746 2,123,746 2,750,000
* Fund closed during the financial year ended 31 July 2017. ** Fund launched during the financial year ended 31 July 2018.

iSHARES VII PLC NOTES TO THE FINANCIAL STATEMENTS (continued) For the financial year ended 31 July 2018
[ 1 1 2 ] i S H A R E S V I I P L C A N N U A L R E P O R T
9. SHARE CAPITAL (continued)
Authorised The authorised share capital of the Company was €2.00 divided into 2 Subscriber Shares of a par value of €1.00 each and 1,000,000,000,000 Shares of no par value ("NPV"). Subscriber shares The 2 subscriber shares are currently in issue and are held by the Manager and nominees of the Manager at 31 July 2018 and 31 July 2017. They do not form part of the NAV of the Company. They are thus disclosed in the financial statements by way of this note only. In the opinion of the Directors this disclosure reflects the nature of the Company’s investment business. Voting Rights The holders of the subscriber shares and redeemable participating shares shall, on a poll, be entitled to one vote per share. 10. NET ASSETS ATTRIBUTABLE TO REDEEMABLE PARTICIPATING SHAREHOLDERS
iShares $ Treasury Bond 1-3yr UCITS ETF
USD (Acc) B
iShares $ Treasury Bond 3-7yr
UCITS ETF USD (Acc)
iShares $ Treasury Bond 3-7yr
UCITS ETF USD (Dist)*
iShares $ Treasury Bond 7-10yr UCITS
ETF USD (Acc)
iShares € Govt Bond 1-3yr UCITS ETF
EUR (Acc) iShares € Govt Bond
3-7yr UCITS ETF Net asset value $’000 $’000 $’000 $’000 €’000 €’000 As at 31 July 2018 135,410 1,329,918 43,864 218,093 267,797 343,630 As at 31 July 2017 65,842 639,525 - 106,595 136,363 322,757 As at 31 July 2016 74,323 721,222 - 125,496 85,681 213,028
Shares in issue No. of Shares No. of Shares No. of Shares No. of Shares No. of Shares No. of SharesAs at 31 July 2018 1,280,000 10,900,000 8,794,000 1,600,000 2,400,000 2,595,000 As at 31 July 2017 620,000 5,140,000 - 760,000 1,215,000 2,430,000 As at 31 July 2016 700,000 5,720,000 - 860,000 765,000 1,590,000
Net asset value per share $ $ $ $ € € As at 31 July 2018 105.79 122.01 4.99 136.31 111.58 132.42
As at 31 July 2017 106.20 124.42 - 140.26 112.23 132.82
As at 31 July 2016 106.18 126.09 - 145.93 112.00 133.98
* Share class launched during the financial year ended 31 July 2018.

iSHARES VII PLC NOTES TO THE FINANCIAL STATEMENTS (continued) For the financial year ended 31 July 2018
i S H A R E S V I I P L C A N N U A L R E P O R T [ 1 1 3 ]
10. NET ASSETS ATTRIBUTABLE TO REDEEMABLE PARTICIPATING SHAREHOLDERS (continued)
iShares € Govt Bond 7-10yr UCITS
ETF EUR (Acc) iShares Core EURO
STOXX 50 UCITS ETF
iShares Core MSCI Pacific ex-Japan
UCITS ETF iShares Core S&P 500 UCITS ETF USD (Acc)
iShares Core S&P 500 UCITS ETF GBP Hedged (Dist)*
iShares Dow Jones Industrial Average
UCITS ETF Net asset value €’000 €’000 $’000 $‘000 £‘000 $‘000 As at 31 July 2018 40,175 3,961,343 1,742,740 29,683,735 359,072 365,964 As at 31 July 2017 44,269 3,943,518 1,151,666 22,423,870 - 310,174 As at 31 July 2016 55,173 1,621,402 421,457 15,795,982 - 232,258
Shares in issue No. of Shares No. of Shares No. of Shares No. of Shares No. of Shares No. of SharesAs at 31 July 2018 255,000 36,124,637 11,800,285 108,579,527 69,290,930 1,324,995
As at 31 July 2017 285,000 37,949,637 8,275,285 95,023,809 - 1,324,995
As at 31 July 2016 345,000 18,549,637 3,525,285 77,398,809 - 1,199,995
Net asset value per share € € $ $ £ $ As at 31 July 2018 157.55 109.66 147.69 273.38 5.18 276.20
As at 31 July 2017 155.33 103.91 139.17 235.98 - 234.09
As at 31 July 2016 159.92 87.41 119.55 204.09 - 193.55
* Share class launched during the financial year ended 31 July 2018.

iSHARES VII PLC NOTES TO THE FINANCIAL STATEMENTS (continued) For the financial year ended 31 July 2018
[ 1 1 4 ] i S H A R E S V I I P L C A N N U A L R E P O R T
10. NET ASSETS ATTRIBUTABLE TO REDEEMABLE PARTICIPATING SHAREHOLDERS (continued)
iShares FTSE 100
UCITS ETF iShares FTSE MIB
UCITS ETF EUR (Acc) iShares MSCI Brazil
UCITS ETF USD (Acc) iShares MSCI Canada
UCITS ETF iShares MSCI EM Asia
UCITS ETF
iShares MSCI EMU CHF Hedged UCITS
ETF (Acc) Net asset value £‘000 €‘000 $’000 $’000 $’000 Fr‘000 As at 31 July 2018 468,446 96,801 28,169 973,175 523,733 30,080 As at 31 July 2017 428,410 118,193 28,843 797,749 380,257 28,318 As at 31 July 2016 356,997 134,837 26,521 627,271 185,408 34,657
Shares in issue No. of Shares No. of Shares No. of Shares No. of Shares No. of Shares No. of SharesAs at 31 July 2018 3,950,158 1,175,078 421,000 7,402,008 3,503,886 5,500,000 As at 31 July 2017 3,950,158 1,525,078 421,000 6,502,008 2,653,886 5,500,000 As at 31 July 2016 3,750,158 2,275,078 446,000 5,727,008 1,653,886 8,000,000
Net asset value per share £ € $ $ $ Fr As at 31 July 2018 118.59 82.38 66.91 131.47 149.47 5.47
As at 31 July 2017 108.45 77.50 68.51 122.69 143.28 5.15
As at 31 July 2016 95.20 59.27 59.46 109.53 112.10 4.33

iSHARES VII PLC NOTES TO THE FINANCIAL STATEMENTS (continued) For the financial year ended 31 July 2018
i S H A R E S V I I P L C A N N U A L R E P O R T [ 1 1 5 ]
10. NET ASSETS ATTRIBUTABLE TO REDEEMABLE PARTICIPATING SHAREHOLDERS (continued)
iShares MSCI EMU Small Cap UCITS ETF
iShares MSCI EMU UCITS ETF (Acc)
iShares MSCI EMU UCITS ETF EUR (Dist)
iShares MSCI EMU UCITS ETF GBP Hedged (Dist)*
iShares MSCI EMU USD Hedged UCITS
ETF (Acc) iShares MSCI Japan
UCITS ETF USD (Acc) Net asset value €’000 €’000 €’000 £’000 $’000 $’000 As at 31 July 2018 1,063,421 1,619,970 9,081 40,543 280,798 522,204 As at 31 July 2017 874,464 1,567,946 2,492 - 136,976 464,810 As at 31 July 2016 417,104 1,147,951 - - 46,016 473,649
Shares in issue No. of Shares No. of Shares No. of Shares No. of Shares No. of Shares No. of SharesAs at 31 July 2018 5,150,368 13,855,703 1,745,516 7,942,079 46,000,000 3,432,322 As at 31 July 2017 4,600,368 14,324,403 502,000 - 24,500,000 3,307,322 As at 31 July 2016 2,700,368 12,524,403 - - 10,000,000 3,832,322
Net asset value per share € € € £ $ $ As at 31 July 2018 206.47 116.92 5.20 5.10 6.10 152.14
As at 31 July 2017 190.09 109.46 4.96 - 5.59 140.54
As at 31 July 2016 154.46 91.66 - - 4.60 123.59
* Share class launched during the financial year ended 31 July 2018.

iSHARES VII PLC NOTES TO THE FINANCIAL STATEMENTS (continued) For the financial year ended 31 July 2018
[ 1 1 6 ] i S H A R E S V I I P L C A N N U A L R E P O R T
10. NET ASSETS ATTRIBUTABLE TO REDEEMABLE PARTICIPATING SHAREHOLDERS (continued)
iShares MSCI Korea
UCITS ETF USD (Acc) iShares MSCI Mexico Capped UCITS ETF
iShares MSCI Russia ADR/GDR UCITS ETF
iShares MSCI UK Large Cap UCITS ETF*
iShares MSCI UK Small Cap UCITS ETF
iShares MSCI UK UCITS ETF
Net asset value $’000 $’000 $’000 £’000 £’000 £’000 As at 31 July 2018 48,564 69,103 313,283 - 146,029 130,353 As at 31 July 2017 61,562 66,883 271,722 - 90,901 127,963 As at 31 July 2016 44,191 65,839 166,055 10,624 68,141 119,401
Shares in issue No. of Shares No. of Shares No. of Shares No. of Shares No. of Shares No. of SharesAs at 31 July 2018 309,000 559,355 2,935,000 - 650,322 1,174,653 As at 31 July 2017 384,000 509,355 3,210,000 - 450,322 1,249,653 As at 31 July 2016 359,000 584,355 2,210,000 100,522 400,322 1,324,653
Net asset value per share $ $ $ £ £ £ As at 31 July 2018 157.17 123.54 106.74 - 224.55 110.97
As at 31 July 2017 160.32 131.31 84.65 - 201.86 102.40
As at 31 July 2016 123.09 112.67 75.14 105.68 170.22 90.14
* Fund closed during the financial year ended 31 July 2017.

iSHARES VII PLC NOTES TO THE FINANCIAL STATEMENTS (continued) For the financial year ended 31 July 2018
i S H A R E S V I I P L C A N N U A L R E P O R T [ 1 1 7 ]
10. NET ASSETS ATTRIBUTABLE TO REDEEMABLE PARTICIPATING SHAREHOLDERS (continued)
iShares MSCI USA
Small Cap UCITS ETF iShares MSCI USA
UCITS ETF iShares NASDAQ 100
UCITS ETF iShares Nikkei 225
UCITS ETF iShares FTSE Italia Mid-Small cap UCITS ETF*
Net asset value $’000 $’000 $’000 ¥‘000 €‘000As at 31 July 2018 692,592 607,889 2,373,391 29,769,428 14,464As at 31 July 2017 502,509 451,002 1,268,040 38,782,447 -As at 31 July 2016 295,564 431,154 818,156 13,119,454 -
Shares in issue No. of Shares No. of Shares No. of Shares No. of Shares No. of SharesAs at 31 July 2018 2,025,414 2,282,281 5,900,037 1,423,746 2,750,000As at 31 July 2017 1,725,414 1,957,281 3,900,037 2,123,746 -As at 31 July 2016 1,175,414 2,157,281 3,150,037 873,746 -
Net asset value per share $ $ $ ¥ €As at 31 July 2018 341.95 266.35 402.27 20,909.23 5.26
As at 31 July 2017 291.24 230.42 325.14 18,261.34 -
As at 31 July 2016 251.46 199.86 259.73 15,015.18 -
* Fund launched during the financial year ended 31 July 2018.

iSHARES VII PLC NOTES TO THE FINANCIAL STATEMENTS (continued) For the financial year ended 31 July 2018
[ 1 1 8 ] i S H A R E S V I I P L C A N N U A L R E P O R T
10. NET ASSETS ATTRIBUTABLE TO REDEEMABLE PARTICIPATING SHAREHOLDERS (continued)
iShares MSCI Brazil UCITS ETF USD (Acc)
31 July 2018 $’000
31 July 2017$’000
31 July 2016$’000
Net asset value Net asset value attributable to redeemable participating shareholders in accordance with FRS 102 28,169 28,843 26,521 Add: Provision for deferred tax payable 1,023 455 - Net asset value attributable to redeemable participating shareholders in accordance with the prospectus 29,192 29,298 26,521
No. of Shares Shares in issue 421,000 421,000 446,000
Net asset value per share attributable to redeemable participating shareholders in accordance with FRS 102 66.91 68.51 59.46 Net asset value per share attributable to redeemable participating shareholders in accordance with the prospectus 69.34 69.59 59.46

iSHARES VII PLC NOTES TO THE FINANCIAL STATEMENTS (continued) For the financial year ended 31 July 2018
i S H A R E S V I I P L C A N N U A L R E P O R T [ 1 1 9 ]
11. RECEIVABLES
Company Total iShares $ Treasury Bond 1-3yr
UCITS ETF USD (Acc) B iShares $ Treasury Bond 3-7yr
UCITS ETF iShares $ Treasury Bond
7-10yr UCITS ETF USD (Acc)
31 Jul 2018
€’00031 Jul 2017
€’00031 Jul 2018
$’000 31 Jul 2017
$’00031 Jul 2018
$’00031 Jul 2017
$’00031 Jul 2018
$’000 31 Jul 2017
$’000 Sale of securities awaiting settlement 2,267 165,021 - - - - - - Subscription for shares awaiting settlement 45,921 35,625 - - - - - - Dividend income receivable 37,864 34,578 - - - - - - Interest income receivable 11,449 7,317 646 239 7,365 3,359 1,794 811 Securities lending income receivable 787 580 3 2 58 52 19 10 Tax reclaim receivable 13,056 10,140 - - - - - - Management fee rebate 1 - - - - - - - Other receivables 2 2 - - - - - -
111,347 253,263 649 241 7,423 3,411 1,813 821
iShares € Govt Bond 1-3yr UCITS
ETF EUR (Acc) iShares € Govt Bond 3-7yr
UCITS ETF iShares € Govt Bond 7-10yr UCITS
ETF EUR (Acc) iShares Core EURO STOXX 50
UCITS ETF
31 Jul 2018
€’00031 Jul 2017
€’00031 Jul 2018
€’000 31 Jul 2017
€’00031 Jul 2018
€’00031 Jul 2017
€’00031 Jul 2018
€’000 31 Jul 2017
€’000 Sale of securities awaiting settlement - - - - - - - 11,468 Subscription for shares awaiting settlement - 11,782 - - - - - - Dividend income receivable - - - - - - 1,376 16 Interest income receivable 40 85 2,848 3,255 176 236 - - Securities lending income receivable 2 2 6 10 1 2 34 13 Tax reclaim receivable - - - - - - 7,160 5,407
42 11,869 2,854 3,265 177 238 8,570 16,904

iSHARES VII PLC NOTES TO THE FINANCIAL STATEMENTS (continued) For the financial year ended 31 July 2018
[ 1 2 0 ] i S H A R E S V I I P L C A N N U A L R E P O R T
11. RECEIVABLES (continued)
iShares Core MSCI Pacific ex-Japan
UCITS ETF iShares Core S&P 500
UCITS ETF iShares Dow Jones Industrial
Average UCITS ETF iShares FTSE 100
UCITS ETF
31 Jul 2018
$’00031 Jul 2017
$’00031 Jul 2018
$’000 31 Jul 2017
$’00031 Jul 2018
$’00031 Jul 2017
$’00031 Jul 2018
£’000 31 Jul 2017
£’000 Sale of securities awaiting settlement 6 - 313 160,050 - - - - Subscription for shares awaiting settlement - - 23,726 - - - - - Dividend income receivable 2,190 1,152 21,440 24,774 207 223 1,393 1,067 Interest income receivable 6 1 - - - - - - Securities lending income receivable 33 20 129 120 - 1 2 1 Tax reclaim receivable 25 - 1 1 - - 65 34
2,260 1,173 45,609 184,945 207 224 1,460 1,102
iShares FTSE MIB UCITS ETF
EUR (Acc) iShares MSCI Brazil UCITS ETF
USD (Acc) iShares MSCI Canada
UCITS ETF iShares MSCI EM Asia
UCITS ETF
31 Jul 2018
€’00031 Jul 2017
€’00031 Jul 2018
$’000 31 Jul 2017
$’00031 Jul 2018
$’00031 Jul 2017
$’00031 Jul 2018
$’000 31 Jul 2017
$’000 Sale of securities awaiting settlement - - - - - - 46 569 Dividend income receivable - - 64 72 1,100 972 3,169 1,902 Securities lending income receivable 5 5 - - 118 141 28 8 Management fee rebate - - - - - - 1 - Other receivables - - - - 1 2 - -
5 5 64 72 1,219 1,115 3,244 2,479
iShares MSCI EMU CHF Hedged
UCITS ETF (Acc) iShares MSCI EMU Small Cap
UCITS ETF iShares MSCI EMU
UCITS ETF iShares MSCI EMU USD Hedged
UCITS ETF (Acc)
31 Jul 2018
Fr’00031 Jul 2017
Fr’00031 Jul 2018
€’000 31 Jul 2017
€’00031 Jul 2018
€’00031 Jul 2017
€’00031 Jul 2018
$’000 31 Jul 2017
$’000 Sale of securities awaiting settlement - 1,146 636 5,309 - 2,808 - 3,383 Dividend income receivable 9 4 167 91 400 60 66 17 Securities lending income receivable 1 - 290 160 17 10 4 - Tax reclaim receivable 57 59 1,785 1,213 3,626 3,270 337 152 Other receivables - - - - 1 - - -
67 1,209 2,878 6,773 4,044 6,148 407 3,552

iSHARES VII PLC NOTES TO THE FINANCIAL STATEMENTS (continued) For the financial year ended 31 July 2018
i S H A R E S V I I P L C A N N U A L R E P O R T [ 1 2 1 ]
11. RECEIVABLES (continued)
iShares MSCI Japan UCITS
ETF USD (Acc) iShares MSCI Korea UCITS ETF
USD (Acc) iShares MSCI Mexico Capped
UCITS ETF iShares MSCI Russia ADR/GDR
UCITS ETF
31 Jul 2018
$’00031 Jul 2017
$’00031 Jul 2018
$’000 31 Jul 2017
$’00031 Jul 2018
$’00031 Jul 2017
$’00031 Jul 2018
$’000 31 Jul 2017
$’000 Sale of securities awaiting settlement - 1,466 - - - 433 - - Subscription for shares awaiting settlement - 28,111 - - - - - - Dividend income receivable 661 502 130 84 2 - 8,954 7,776 Interest income receivable - - - - - 1 - - Securities lending income receivable 22 15 5 1 - - - - Tax reclaim receivable - - - - - - 5 -
683 30,094 135 85 2 434 8,959 7,776
iShares MSCI UK Small Cap
UCITS ETF iShares MSCI UK
UCITS ETF iShares MSCI USA Small Cap
UCITS ETF iShares MSCI USA
UCITS ETF
31 Jul 2018
£’00031 Jul 2017
£’00031 Jul 2018
£’000 31 Jul 2017
£’00031 Jul 2018
$’00031 Jul 2017
$’00031 Jul 2018
$’000 31 Jul 2017
$’000 Sale of securities awaiting settlement - - - 989 1,542 50 1 - Dividend income receivable 290 136 400 327 190 145 408 345 Securities lending income receivable 16 11 1 1 20 36 4 1 Tax reclaim receivable 26 13 14 11 - - 4 4
332 160 415 1,328 1,752 231 417 350

iSHARES VII PLC NOTES TO THE FINANCIAL STATEMENTS (continued) For the financial year ended 31 July 2018
[ 1 2 2 ] i S H A R E S V I I P L C A N N U A L R E P O R T
11. RECEIVABLES (continued)
iShares NASDAQ 100
UCITS ETF iShares Nikkei 225
UCITS ETF iShares FTSE Italia Mid-Small Cap
UCITS ETF*
31 Jul 2018
$’00031 Jul 2017
$’00031 Jul 2018
¥’000 31 Jul 2017
¥’00031 Jul 2018
€’000
Sale of securities awaiting settlement - - - 334,374 - Subscription for shares awaiting settlement 30,008 - - - - Dividend income receivable 382 223 36,400 39,977 1 Securities lending income receivable 25 13 1,303 994 -
30,415 236 37,703 375,345 1
* Fund launched during the financial year ended 31 July 2018. 12. PAYABLES
Company Total iShares $ Treasury Bond 1-3yr
UCITS ETF USD (Acc) B iShares $ Treasury Bond 3-7yr
UCITS ETF iShares $ Treasury Bond
7-10yr UCITS ETF USD (Acc)
31 Jul 2018
€’00031 Jul 2017
€’00031 Jul 2018
$’000 31 Jul 2017
$’00031 Jul 2018
$’00031 Jul 2017
$’00031 Jul 2018
$’000 31 Jul 2017
$’000 Purchase of securities awaiting settlement (67,506) (103,254) - - - (7,451) - - Payable for fund shares repurchased (20,242) (60,089) - - - - - - Interest payable (33) (20) - - (17) - - - Management fees payable (5,455) (4,410) (23) (11) (221) (106) (39) (18) Other payables (4) (57) - - - - - - (93,240) (167,830) (23) (11) (238) (7,557) (39) (18)
iShares € Govt Bond 1-3yr UCITS
ETF EUR (Acc) iShares € Govt Bond 3-7yr
UCITS ETF iShares € Govt Bond 7-10yr UCITS
ETF EUR (Acc) iShares Core EURO STOXX 50
UCITS ETF
31 Jul 2018
€’00031 Jul 2017
€’00031 Jul 2018
€’000 31 Jul 2017
€’00031 Jul 2018
€’00031 Jul 2017
€’00031 Jul 2018
€’000 31 Jul 2017
€’000 Purchase of securities awaiting settlement - (11,775) - - - - - (11,467) Interest payable - - - - - - (5) (8) Management fees payable (48) (21) (58) (55) (7) (7) (330) (329) (48) (11,796) (58) (55) (7) (7) (335) (11,804)

iSHARES VII PLC NOTES TO THE FINANCIAL STATEMENTS (continued) For the financial year ended 31 July 2018
i S H A R E S V I I P L C A N N U A L R E P O R T [ 1 2 3 ]
12. PAYABLES (continued)
iShares Core MSCI Pacific ex-Japan
UCITS ETF iShares Core S&P 500
UCITS ETF iShares Dow Jones Industrial
Average UCITS ETF iShares FTSE 100
UCITS ETF
31 Jul 2018
$’00031 Jul 2017
$’00031 Jul 2018
$’000 31 Jul 2017
$’00031 Jul 2018
$’00031 Jul 2017
$’00031 Jul 2018
£’000 31 Jul 2017
£’000 Purchase of securities awaiting settlement (1,450) (195) (27,138) (62,839) - - - - Payable for fund shares repurchased - - (23,685) (70,845) - - - - Interest payable - - - - - - - (1) Management fees payable (293) (189) (1,745) (1,324) (100) (86) (27) (25) (1,743) (384) (52,568) (135,008) (100) (86) (27) (26)
iShares FTSE MIB UCITS ETF
EUR (Acc) iShares MSCI Brazil UCITS ETF
USD (Acc) iShares MSCI Canada
UCITS ETF iShares MSCI EM Asia
UCITS ETF
31 Jul 2018
€’00031 Jul 2017
€’00031 Jul 2018
$’000 31 Jul 2017
$’00031 Jul 2018
$’00031 Jul 2017
$’00031 Jul 2018
$’000 31 Jul 2017
$’000 Purchase of securities awaiting settlement - - - - (3,264) (6,115) (45) (361) Management fees payable (26) (33) (15) (15) (388) (318) (290) (204) Other payables - - - - (5) - - - (26) (33) (15) (15) (3,657) (6,433) (335) (565)
iShares MSCI EMU CHF Hedged
UCITS ETF (Acc) iShares MSCI EMU Small Cap
UCITS ETF iShares MSCI EMU
UCITS ETF iShares MSCI EMU USD Hedged
UCITS ETF (Acc)
31 Jul 2018
Fr’00031 Jul 2017
Fr’00031 Jul 2018
€’000 31 Jul 2017
€’00031 Jul 2018
€’00031 Jul 2017
€’00031 Jul 2018
$’000 31 Jul 2017
$’000 Purchase of securities awaiting settlement - (59) (608) (5,327) (562) (2,807) - (239) Interest payable - - (4) (3) (6) (5) (2) - Management fees payable (10) (9) (530) (423) (167) (444) (93) (44) (10) (68) (1,142) (5,753) (735) (3,256) (95) (283)

iSHARES VII PLC NOTES TO THE FINANCIAL STATEMENTS (continued) For the financial year ended 31 July 2018
[ 1 2 4 ] i S H A R E S V I I P L C A N N U A L R E P O R T
12. PAYABLES (continued)
iShares MSCI Japan UCITS
ETF USD (Acc) iShares MSCI Korea UCITS ETF
USD (Acc) iShares MSCI Mexico Capped
UCITS ETF iShares MSCI Russia ADR/GDR
UCITS ETF
31 Jul 2018
$’00031 Jul 2017
$’00031 Jul 2018
$’000 31 Jul 2017
$’00031 Jul 2018
$’00031 Jul 2017
$’00031 Jul 2018
$’000 31 Jul 2017
$’000 Purchase of securities awaiting settlement - (1,590) - - - - - - Interest payable (1) (1) - - - - - - Management fees payable (215) (172) (27) (34) (36) (37) (169) (146) (216) (1,763) (27) (34) (36) (37) (169) (146)
iShares MSCI UK Large Cap
UCITS ETF* iShares MSCI UK Small Cap
UCITS ETF iShares MSCI UK
UCITS ETF iShares MSCI USA Small Cap
UCITS ETF
31 Jul 2017
£’00031 Jul 2018
£’000 31 Jul 2017
£’00031 Jul 2018
£’00031 Jul 2017
£’00031 Jul 2018
$’000 31 Jul 2017
$’000 Purchase of securities awaiting settlement - - (45) - - (9,136) - Payable for fund shares repurchased - - - - (989) - - Management fees payable - (76) (44) (36) (36) (245) (183) Other payables (51) - - - - - - (51) (76) (89) (36) (1,025) (9,381) (183)
iShares MSCI USA
UCITS ETF iShares NASDAQ 100
UCITS ETF iShares Nikkei 225
UCITS ETF iShares FTSE Italia Mid-Small Cap
UCITS ETF**
31 Jul 2018
$’00031 Jul 2017
$’00031 Jul 2018
$’000 31 Jul 2017
$’00031 Jul 2018
¥’00031 Jul 2017
¥’00031 Jul 2018
€’000
Purchase of securities awaiting settlement (6,609) (89) (29,978) - - (490,629) - Interest payable - - - - (103) (242) - Management fees payable (167) (129) (645) (347) (12,303) (15,727) (4) (6,776) (218) (30,623) (347) (12,406) (506,598) (4)
* Fund closed during the financial year ended 31 July 2017. ** Fund launched during the financial year ended 31 July 2018.

iSHARES VII PLC NOTES TO THE FINANCIAL STATEMENTS (continued) For the financial year ended 31 July 2018
i S H A R E S V I I P L C A N N U A L R E P O R T [ 1 2 5 ]
13. COMMITMENTS AND CONTINGENT LIABILITIES
There were no significant commitments or contingent liabilities at the financial years ended 31 July 2018 and 31 July 2017 other than those disclosed in the financial statements of the Funds.
14. EXCHANGE RATES
The rates of exchange ruling at 31 July 2018 and 31 July 2017 were:
31 July
2018 31 July
2017CHF1= EUR 0.8633 0.8791 GBP 0.7700 0.7862 USD 1.0101 1.0364 EUR1= CHF 1.1583 1.1376 GBP 0.8920 0.8943 JPY 130.9754 130.2737 USD 1.1701 1.1790 GBP1= EUR 1.1211 1.1182 USD 1.3118 1.3183 JPY1= EUR 0.0076 0.0077 GBP 0.0068 0.0069 USD1= AUD 1.3452 1.2526 BRL 3.7567 3.1250 CAD 1.3020 1.2506 CNH 6.8152 6.7312 CNY 6.8265 - EUR 0.8547 0.8482 GBP 0.7623 0.7585 HKD 7.8472 7.8102 IDR 14,420.0000 13,324.0000 INR 68.5863 64.1513 JPY 111.9400 110.4950 KRW 1,118.6500 1,119.0500 MXN 18.6590 17.8492 MYR 4.0650 4.2815 NZD 1.4689 1.3338 PHP 53.1050 50.4600 PKR 123.8500 105.3800 SGD 1.3613 1.3572 THB 33.2700 33.2765 TWD 30.6140 30.1955
The average daily rates of exchange at each financial year end were:
31 July
2018 31 July
2017EUR1= CHF 1.1628 1.0820 GBP 0.8862 0.8634 JPY 131.6429 120.0613 USD 1.1944 1.0940

iSHARES VII PLC NOTES TO THE FINANCIAL STATEMENTS (continued) For the financial year ended 31 July 2018
[ 1 2 6 ] i S H A R E S V I I P L C A N N U A L R E P O R T
15. RELATED PARTY TRANSACTIONS
Parties are considered to be related if one party has the ability to control the other party or is able to exercise significant influence over the other party, in making financial or operational decisions. The following entities were related parties to the Company during the financial year ended 31 July 2018: Board of Directors of the Company Manager: BlackRock Asset Management Ireland Limited
Investment Manager, Promoter and Securities Lending Agent: BlackRock Advisors (UK) Limited
Sub-Investment Managers: BlackRock Financial Management, Inc.
BlackRock (Singapore) Limited
BlackRock Asset Management North Asia Limited
BlackRock Asset Management Deutschland AG
Representative in Switzerland: BlackRock Asset Management Schweiz AG The ultimate holding Company of the Manager, Investment Manager, Promoter, Sub-Investment Managers, Securities Lending Agent and Representative in Switzerland is BlackRock, Inc. a company incorporated in Delaware USA. PNC Financial Services Group, Inc. (“PNC”), is a substantial shareholder in BlackRock, Inc. PNC did not provide any services to the Company in the financial years ended 31 July 2018 and 31 July 2017. Fees paid to the Manager during the financial year, the nature of these transactions and the balances outstanding at the financial year end are disclosed in note 6 and in note 12 respectively. Securities lending income earned by each Fund is disclosed in the income statement. There were no soft commissions arrangements entered into by the Investment Manager on behalf of the Company during the financial year ended 31 July 2018 and 31 July 2017. The non-executive Directors of the Company as at 31 July 2018 are presented in the table below:
Director Employee of the BlackRock Group Director of BlackRock affiliates and/or other
funds managed by BlackRock Paul McNaughton No Yes Paul McGowan No Yes Barry O’Dwyer Yes Yes Teresa O'Flynn Yes Yes David Moroney Yes Yes Jessica Irschick Yes Yes
The Directors of the Company and the Manager who are also employees of the BlackRock Group are not entitled to receive Directors’ fees. David Moroney and Jessica Irschick have been appointed as non-executive Director's effective 15 November 2017 and 20 November 2017 respectively. Holdings in other Funds managed by BlackRock Investments in Funds managed by BlackRock, Inc. and BlackRock affiliates are listed overleaf and marked on the relevant Funds’ Schedules of Investments. Details of the management fee rebates applied to investments in iShares Funds are set out in the income statements and receivables note of the Company. The investments into ICS funds is included in cash equivalents and is managed by BlackRock Asset Management Ireland Limited. No management fees are included as a result of any of the investments in ICS however an annual expense capped at 0.03% of NAV is charged.

iSHARES VII PLC NOTES TO THE FINANCIAL STATEMENTS (continued) For the financial year ended 31 July 2018
i S H A R E S V I I P L C A N N U A L R E P O R T [ 1 2 7 ]
15. RELATED PARTY TRANSACTIONS (continued)
Holdings in other Funds managed by BlackRock (continued) The Company invested in the following Funds which are also managed by BlackRock Asset Management Ireland Limited. Further information on the fees charged from investing in these underlying funds is presented in the table below. These disclosed fees are the maximum charges capped as per the prospectus of the underlying funds and actual fees charged may be lower:
Investments Fee paid by Fund Investment Company – UCITS authorised in Ireland by CBI iShares $ Treasury Bond 3-7yr UCITS ETF Institutional Cash Series Plc - Institutional US Dollar Liquidity Fund Annual expense capped at 0.03% of NAV
iShares € Govt Bond 3-7yr UCITS ETF Institutional Cash Series Plc - Institutional Euro Liquidity Fund Annual expense capped at 0.03% of NAV
iShares € Govt Bond 7-10yr UCITS ETF EUR (Acc) Institutional Cash Series Plc - Institutional Euro Liquidity Fund Annual expense capped at 0.03% of NAV
iShares MSCI EM Asia UCITS ETF iShares MSCI China A UCITS ETF Total expense ratio of 0.40%
All related party transactions were carried out at arm’s length in the ordinary course of business. The terms and returns received by the related parties in making the investments were no more favourable than those received by other investors investing into the same share classes. Significant holdings The following investors
i) are funds managed by the BlackRock Group or are affiliates of BlackRock, Inc. or
ii) are investors (other than those listed in (i) above) who held more than 20% of the voting shares in issue in the Company and are as a result, considered to be related parties to the Company
31 July 2018
Total % of shares held by funds managed by the BlackRock Group or held by affiliates of BlackRock, Inc.
Number of investors holding 20% or more of the voting shares in issue who
are not affiliates of BlackRock Group or BlackRock, Inc.
Total % of shares held by shareholders holding 20% or more of the voting shares
in issue who are not affiliates of BlackRock Group or BlackRock, Inc.
Nil 1 100.00
31 July 2017
Total % of shares held by funds managed by the BlackRock Group or held by affiliates of BlackRock, Inc.
Number of investors holding 20% or more of the voting shares in issue who
are not affiliates of BlackRock Group or BlackRock, Inc.
Total % of shares held by shareholders holding 20% or more of the voting shares
in issue who are not affiliates of BlackRock Group or BlackRock, Inc.
Nil 1 100.00
No provisions have been recognised by the Funds against amounts due from related parties at the financial year end date (31 July 2017: Nil). No amounts have been written off during the financial year in respect of amounts due to or from related parties (31 July 2017: Nil). No commitments secured or unsecured or guarantees have been entered into with related parties during the financial year (31 July 2017: Nil).

iSHARES VII PLC NOTES TO THE FINANCIAL STATEMENTS (continued) For the financial year ended 31 July 2018
[ 1 2 8 ] i S H A R E S V I I P L C A N N U A L R E P O R T
15. RELATED PARTY TRANSACTIONS (continued)
The Investment Manager has appointed BlackRock Financial Management Inc. and BlackRock (Singapore) Limited, as sub-investment managers to perform certain portfolio management functions in respect of the following Funds: Fund iShares $ Treasury Bond 1-3yr UCITS ETF USD (Acc) B iShares $ Treasury Bond 3-7yr UCITS ETF iShares $ Treasury Bond 7-10yr UCITS ETF USD (Acc) iShares € Govt Bond 1-3yr UCITS ETF EUR (Acc) iShares € Govt Bond 3-7yr UCITS ETF iShares € Govt Bond 7-10yr UCITS ETF EUR (Acc)
The Investment Manager has appointed BlackRock Asset Management North Asia Limited and BlackRock Asset Management Deutschland AG, as sub-investment managers to perform certain portfolio management functions in respect of the following Funds: Fund iShares Core EURO STOXX 50 UCITS ETF iShares Core MSCI Pacific ex-Japan UCITS ETF iShares Core S&P 500 UCITS ETF iShares Dow Jones Industrial Average UCITS ETF iShares FTSE 100 UCITS ETF iShares FTSE MIB UCITS ETF EUR (Acc) iShares MSCI Brazil UCITS ETF USD (Acc) iShares MSCI Canada UCITS ETF iShares MSCI EM Asia UCITS ETF iShares MSCI EMU CHF Hedged UCITS ETF (Acc) iShares MSCI EMU Small Cap UCITS ETF iShares MSCI EMU UCITS ETF iShares MSCI EMU USD Hedged UCITS ETF (Acc) iShares MSCI Japan UCITS ETF USD (Acc) iShares MSCI Korea UCITS ETF USD (Acc) iShares MSCI Mexico Capped UCITS ETF iShares MSCI Russia ADR/GDR UCITS ETF iShares MSCI UK Small Cap UCITS ETF iShares MSCI UK UCITS ETF iShares MSCI USA Small Cap UCITS ETF iShares MSCI USA UCITS ETF iShares NASDAQ 100 UCITS ETF iShares Nikkei 225 UCITS ETF iShares FTSE Italia Mid-Small Cap UCITS ETF
Securities Lending The total income earned from securities lending transactions is split between the relevant Fund and the Securities Lending Agent. The Funds which undertake securities lending transactions receive at least 62.5%, while the Securities Lending Agent receives up to 37.5% of such income, with all operational costs borne out of the Securities Lending Agent’s share. Income earned during the financial year by the Funds from securities lending transactions is disclosed in the income statement.

iSHARES VII PLC
NOTES TO THE FINANCIAL STATEMENTS (continued)
For the financial year ended 31 July 2018
i S H A R E S V I I P L C A N N U A L R E P O R T [ 1 2 9 ]
16. STATUTORY INFORMATION
The following fees were included in management fees for the financial year:
Financial year ended
31 July 2018
€’000
Financial year ended
31 July 2017
€’000
Directors’ fees (25) (25)
Audit fees (including expenses) relating to the audit of the annual financial statements (221) (277)
Directors’ fees will not exceed the sum of €40,000 per annum per Director without the approval of the Board of Directors. There were no other
assurance, tax, advisory or non audit fees other than the audit fees disclosed above paid to PricewaterhouseCoopers in Dublin, Ireland as the
Statutory Auditor of the Company as no other services were provided.
17. SUBSEQUENT EVENTS
The ex-date and pay date for distributions of the below Fund occurred post financial year end to date of signing.
Fund Distribution Amount ('000)
iShares $ Treasury Bond 3-7yr UCITS ETF $55
iShares Core S&P 500 UCITS ETF $455
iShares MSCI EMU UCITS ETF €338
New share classes were launched on the following Funds post financial year end to date of signing as detailed in the below table:
Fund Share Class Launch Date
iShares NASDAQ 100 UCITS ETF EUR Hedged (Acc) 7 September 2018
Effective 22 November 2018, iShares FTSE 100 UCITS ETF changed its name to iShares Core FTSE 100 UCITS ETF GBP (Acc), iShares MSCI
EMU UCITS ETF changed its name to iShares Core MSCI EMU UCITS ETF and iShares MSCI Japan UCITS ETF USD (Acc) changed its name
to iShares MSCI Japan UCITS ETF. An updated prospectus was also issued at this date.
Other than the above, there have been no events subsequent to the financial year end, which, in the opinion of the Directors of the Company, may
have had an impact on the financial statements for the financial year ended 31 July 2018.
18. APPROVAL DATE
The financial statements were approved and authorised for issue by the Directors on 28 November 2018.

iSHARES VII PLC
Schedule of Investments iSHARES $ TREASURY BOND 1-3yr UCITS ETF USD (Acc) B As at 31 July 2018
[ 1 3 0 ] i S H A R E S V I I P L C A N N U A L R E P O R T
Ccy Holding Investment Fair value
$'000
% of netassetvalue
Transferable Securities Admitted to an Official Stock Exchange Listing or traded on a Regulated Market (31 July 2017: 99.48%)
Bonds (31 July 2017: 99.48%) United States (31 July 2017: 99.48%) Government Bonds
USD 1,472,000 United States Treasury Note/Bond 0.75% 15/07/2019 1,449 1.07
USD 1,408,000 United States Treasury Note/Bond 0.75% 15/08/2019 1,383 1.02
USD 896,000 United States Treasury Note/Bond 0.875% 31/07/2019 882 0.65
USD 1,408,000 United States Treasury Note/Bond 0.875% 15/09/2019 1,383 1.02
USD 896,000 United States Treasury Note/Bond 1% 31/08/2019 882 0.65
USD 1,152,000 United States Treasury Note/Bond 1% 30/09/2019 1,132 0.84
USD 1,472,000 United States Treasury Note/Bond 1% 15/10/2019^ 1,445 1.07
USD 1,344,000 United States Treasury Note/Bond 1% 15/11/2019 1,318 0.97
USD 1,280,000 United States Treasury Note/Bond 1% 30/11/2019 1,254 0.93
USD 1,280,000 United States Treasury Note/Bond 1.125% 31/12/2019 1,254 0.93
USD 1,408,000 United States Treasury Note/Bond 1.125% 30/04/2020 1,372 1.01
USD 3,712,000 United States Treasury Note/Bond 1.125% 28/02/2021 3,563 2.63
USD 2,176,000 United States Treasury Note/Bond 1.125% 30/06/2021 2,077 1.53
USD 896,000 United States Treasury Note/Bond 1.25% 31/10/2019 882 0.65
USD 2,112,000 United States Treasury Note/Bond 1.25% 31/01/2020 2,070 1.53
USD 1,152,000 United States Treasury Note/Bond 1.25% 29/02/2020 1,128 0.83
USD 4,032,000 United States Treasury Note/Bond 1.25% 31/03/2021 3,877 2.86
USD 960,000 United States Treasury Note/Bond 1.375% 31/07/2019 950 0.70
USD 1,536,000 United States Treasury Note/Bond 1.375% 30/09/2019 1,516 1.12
USD 1,472,000 United States Treasury Note/Bond 1.375% 15/12/2019^ 1,448 1.07
USD 2,560,000 United States Treasury Note/Bond 1.375% 15/01/2020^ 2,516 1.86
USD 1,408,000 United States Treasury Note/Bond 1.375% 31/01/2020 1,383 1.02
USD 1,600,000 United States Treasury Note/Bond 1.375% 15/02/2020 1,570 1.16
USD 2,112,000 United States Treasury Note/Bond 1.375% 29/02/2020^ 2,072 1.53
USD 2,880,000 United States Treasury Note/Bond 1.375% 31/03/2020 2,821 2.08
USD 3,264,000 United States Treasury Note/Bond 1.375% 30/04/2020 3,193 2.36
USD 1,408,000 United States Treasury Note/Bond 1.375% 31/05/2020 1,376 1.02
Ccy Holding InvestmentFair value
$'000
% of netassetvalue
United States (31 July 2017: 99.48%) (cont) Government Bonds (cont)
USD 4,608,000 United States Treasury Note/Bond 1.375% 31/08/2020^ 4,486 3.31
USD 4,992,000 United States Treasury Note/Bond 1.375% 30/09/2020^ 4,854 3.59
USD 4,544,000 United States Treasury Note/Bond 1.375% 31/10/2020 4,412 3.26
USD 3,584,000 United States Treasury Note/Bond 1.375% 31/01/2021^ 3,467 2.56
USD 2,240,000 United States Treasury Note/Bond 1.375% 30/04/2021 2,159 1.59
USD 2,240,000 United States Treasury Note/Bond 1.375% 31/05/2021 2,156 1.59
USD 3,456,000 United States Treasury Note/Bond 1.5% 31/10/2019^ 3,412 2.52
USD 2,048,000 United States Treasury Note/Bond 1.5% 30/11/2019^ 2,020 1.49
USD 1,344,000 United States Treasury Note/Bond 1.5% 15/04/2020 1,318 0.97
USD 2,176,000 United States Treasury Note/Bond 1.5% 31/05/2020 2,131 1.57
USD 1,536,000 United States Treasury Note/Bond 1.5% 15/06/2020 1,504 1.11
USD 1,984,000 United States Treasury Note/Bond 1.625% 31/07/2019^ 1,967 1.45
USD 2,112,000 United States Treasury Note/Bond 1.625% 31/08/2019^ 2,092 1.55
USD 1,536,000 United States Treasury Note/Bond 1.625% 31/12/2019 1,516 1.12
USD 2,112,000 United States Treasury Note/Bond 1.625% 15/03/2020 2,078 1.54
USD 3,584,000 United States Treasury Note/Bond 1.625% 30/06/2020^ 3,515 2.60
USD 3,328,000 United States Treasury Note/Bond 1.625% 31/07/2020 3,260 2.41
USD 2,112,000 United States Treasury Note/Bond 1.625% 30/11/2020 2,060 1.52
USD 2,112,000 United States Treasury Note/Bond 1.75% 30/09/2019 2,094 1.55
USD 4,160,000 United States Treasury Note/Bond 1.75% 31/12/2020^ 4,066 3.00
USD 1,152,000 United States Treasury Note/Bond 1.875% 31/12/2019 1,141 0.84
USD 1,472,000 United States Treasury Note/Bond 2% 30/11/2020 1,448 1.07
USD 2,496,000 United States Treasury Note/Bond 2% 28/02/2021 2,450 1.81
USD 3,200,000 United States Treasury Note/Bond 2.25% 15/02/2021 3,161 2.34
USD 576,000 United States Treasury Note/Bond 2.5% 31/05/2020 574 0.42
USD 1,984,000 United States Treasury Note/Bond 2.625% 15/08/2020^ 1,982 1.46
USD 5,504,000 United States Treasury Note/Bond 2.625% 15/11/2020^ 5,491 4.06
USD 2,048,000 United States Treasury Note/Bond 2.625% 15/05/2021 2,040 1.51
USD 2,048,000 United States Treasury Note/Bond 2.625% 15/06/2021 2,040 1.51

iSHARES VII PLC
Schedule of Investments (continued) iSHARES $ TREASURY BOND 1-3yr UCITS ETF USD (Acc) B (continued) As at 31 July 2018
i S H A R E S V I I P L C A N N U A L R E P O R T [ 1 3 1 ]
Ccy Holding Investment Fair value
$'000
% of netassetvalue
Bonds (31 July 2017: 99.48%) (cont) United States (31 July 2017: 99.48%) (cont) Government Bonds (cont)
USD 768,000 United States Treasury Note/Bond 3.125% 15/05/2021 775 0.57
USD 1,920,000 United States Treasury Note/Bond 3.375% 15/11/2019^ 1,940 1.43
USD 2,752,000 United States Treasury Note/Bond 3.5% 15/05/2020 2,792 2.06
USD 1,664,000 United States Treasury Note/Bond 3.625% 15/08/2019 1,683 1.24
USD 2,240,000 United States Treasury Note/Bond 3.625% 15/02/2020 2,274 1.68
USD 3,392,000 United States Treasury Note/Bond 3.625% 15/02/2021 3,464 2.56
USD 384,000 United States Treasury Note/Bond 8.125% 15/08/2019 406 0.30Total United States 134,424 99.27 Total bonds 134,424 99.27
Fair value
$'000
% of netassetvalue
Total value of investments 134,424 99.27 Cash† 360 0.27 Other net assets 626 0.46 Net asset value attributable to redeemable participating shareholders at the end of the financial year 135,410 100.00
† Substantially all cash positions are held with State Street Bank and Trust Company. ^ These securities are partially or fully transferred as securities lent.
Fixed income securities are primarily classified by country of issuer for government type fixed income securities.
Analysis of total current assets gross of all liabilities
Fair value$'000
% of totalcurrentassets
Transferable securities admitted to an official stock exchange listing 131,220 96.89Transferable securities dealt in on another regulated market 3,204 2.37Other assets 1,009 0.74Total current assets 135,433 100.00

iSHARES VII PLC
Schedule of Investments (continued) iSHARES $ TREASURY BOND 3-7yr UCITS ETF As at 31 July 2018
[ 1 3 2 ] i S H A R E S V I I P L C A N N U A L R E P O R T
Ccy Holding Investment Fair value
$'000
% of netassetvalue
Transferable Securities Admitted to an Official Stock Exchange Listing or traded on a Regulated Market (31 July 2017: 99.34%)
Bonds (31 July 2017: 99.34%) United States (31 July 2017: 99.34%) Government Bonds
USD 16,359,000 United States Treasury Note/Bond 1.125% 31/07/2021^ 15,586 1.14
USD 17,364,000 United States Treasury Note/Bond 1.125% 31/08/2021 16,518 1.20
USD 13,488,000 United States Treasury Note/Bond 1.125% 30/09/2021^ 12,815 0.93
USD 8,992,000 United States Treasury Note/Bond 1.25% 31/10/2021 8,565 0.62
USD 19,088,000 United States Treasury Note/Bond 1.25% 31/07/2023^ 17,668 1.29
USD 5,730,000 United States Treasury Note/Bond 1.375% 30/06/2023 5,344 0.39
USD 14,088,000 United States Treasury Note/Bond 1.375% 31/08/2023^ 13,103 0.95
USD 14,088,000 United States Treasury Note/Bond 1.375% 30/09/2023^ 13,086 0.95
USD 11,240,000 United States Treasury Note/Bond 1.5% 31/01/2022^ 10,755 0.78
USD 29,243,000 United States Treasury Note/Bond 1.5% 28/02/2023^ 27,567 2.01
USD 14,088,000 United States Treasury Note/Bond 1.5% 31/03/2023^ 13,267 0.97
USD 24,747,000 United States Treasury Note/Bond 1.625% 15/08/2022^ 23,626 1.72
USD 10,720,000 United States Treasury Note/Bond 1.625% 31/08/2022 10,227 0.74
USD 26,995,000 United States Treasury Note/Bond 1.625% 15/11/2022^ 25,687 1.87
USD 13,488,000 United States Treasury Note/Bond 1.625% 30/04/2023^ 12,761 0.93
USD 17,483,000 United States Treasury Note/Bond 1.625% 31/05/2023^ 16,523 1.20
USD 14,088,000 United States Treasury Note/Bond 1.625% 31/10/2023^ 13,239 0.96
USD 13,488,000 United States Treasury Note/Bond 1.75% 30/11/2021^ 13,042 0.95
USD 10,720,000 United States Treasury Note/Bond 1.75% 28/02/2022^ 10,339 0.75
USD 10,116,000 United States Treasury Note/Bond 1.75% 31/03/2022 9,746 0.71
USD 8,472,000 United States Treasury Note/Bond 1.75% 30/04/2022 8,154 0.59
USD 28,723,000 United States Treasury Note/Bond 1.75% 15/05/2022^ 27,632 2.01
USD 8,472,000 United States Treasury Note/Bond 1.75% 31/05/2022^ 8,147 0.59
USD 15,235,000 United States Treasury Note/Bond 1.75% 30/06/2022^ 14,635 1.07
USD 20,251,000 United States Treasury Note/Bond 1.75% 30/09/2022^ 19,400 1.41
USD 33,269,000 United States Treasury Note/Bond 1.75% 31/01/2023^ 31,754 2.31
Ccy Holding InvestmentFair value
$'000
% of netassetvalue
United States (31 July 2017: 99.34%) (cont) Government Bonds (cont)
USD 25,351,000 United States Treasury Note/Bond 1.75% 15/05/2023^ 24,115 1.76
USD 12,364,000 United States Treasury Note/Bond 1.875% 30/11/2021 12,006 0.87
USD 13,488,000 United States Treasury Note/Bond 1.875% 31/01/2022^ 13,073 0.95
USD 14,608,000 United States Treasury Note/Bond 1.875% 28/02/2022^ 14,149 1.03
USD 12,968,000 United States Treasury Note/Bond 1.875% 31/03/2022^ 12,548 0.91
USD 12,968,000 United States Treasury Note/Bond 1.875% 30/04/2022^ 12,538 0.91
USD 11,844,000 United States Treasury Note/Bond 1.875% 31/05/2022^ 11,443 0.83
USD 15,235,000 United States Treasury Note/Bond 1.875% 31/07/2022^ 14,693 1.07
USD 11,844,000 United States Treasury Note/Bond 1.875% 31/08/2022 11,413 0.83
USD 14,608,000 United States Treasury Note/Bond 1.875% 30/09/2022^ 14,064 1.02
USD 12,364,000 United States Treasury Note/Bond 1.875% 31/10/2022^ 11,896 0.87
USD 10,720,000 United States Treasury Note/Bond 2% 31/08/2021^ 10,475 0.76
USD 12,968,000 United States Treasury Note/Bond 2% 31/10/2021 12,651 0.92
USD 26,995,000 United States Treasury Note/Bond 2% 15/11/2021^ 26,329 1.92
USD 12,364,000 United States Treasury Note/Bond 2% 31/12/2021^ 12,044 0.88
USD 29,847,000 United States Treasury Note/Bond 2% 15/02/2022^ 29,046 2.12
USD 13,488,000 United States Treasury Note/Bond 2% 31/07/2022^ 13,073 0.95
USD 15,732,000 United States Treasury Note/Bond 2% 31/10/2022^ 15,213 1.11
USD 23,623,000 United States Treasury Note/Bond 2% 30/11/2022^ 22,829 1.66
USD 28,119,000 United States Treasury Note/Bond 2% 15/02/2023^ 27,124 1.97
USD 14,088,000 United States Treasury Note/Bond 2% 30/04/2024^ 13,427 0.98
USD 13,488,000 United States Treasury Note/Bond 2% 31/05/2024^ 12,845 0.94
USD 13,488,000 United States Treasury Note/Bond 2% 30/06/2024^ 12,833 0.93
USD 29,847,000 United States Treasury Note/Bond 2% 15/02/2025^ 28,212 2.05
USD 26,475,000 United States Treasury Note/Bond 2.125% 15/08/2021^ 25,973 1.89
USD 13,488,000 United States Treasury Note/Bond 2.125% 30/09/2021 13,221 0.96
USD 17,483,000 United States Treasury Note/Bond 2.125% 31/12/2021^ 17,103 1.25
USD 11,240,000 United States Treasury Note/Bond 2.125% 30/06/2022^ 10,955 0.80

iSHARES VII PLC
Schedule of Investments (continued) iSHARES $ TREASURY BOND 3-7yr UCITS ETF (continued) As at 31 July 2018
i S H A R E S V I I P L C A N N U A L R E P O R T [ 1 3 3 ]
Ccy Holding Investment Fair value
$'000
% of netassetvalue
Bonds (31 July 2017: 99.34%) (cont) United States (31 July 2017: 99.34%) (cont) Government Bonds (cont)
USD 24,747,000 United States Treasury Note/Bond 2.125% 31/12/2022^ 24,020 1.75
USD 13,488,000 United States Treasury Note/Bond 2.125% 30/11/2023^ 12,992 0.95
USD 13,488,000 United States Treasury Note/Bond 2.125% 29/02/2024^ 12,964 0.94
USD 13,488,000 United States Treasury Note/Bond 2.125% 31/03/2024^ 12,953 0.94
USD 13,488,000 United States Treasury Note/Bond 2.125% 31/07/2024^ 12,914 0.94
USD 13,488,000 United States Treasury Note/Bond 2.125% 30/09/2024^ 12,895 0.94
USD 26,475,000 United States Treasury Note/Bond 2.125% 30/11/2024^ 25,276 1.84
USD 31,649,000 United States Treasury Note/Bond 2.125% 15/05/2025^ 30,091 2.19
USD 14,064,000 United States Treasury Note/Bond 2.25% 31/07/2021^ 13,854 1.01
USD 13,488,000 United States Treasury Note/Bond 2.25% 31/12/2023^ 13,067 0.95
USD 14,088,000 United States Treasury Note/Bond 2.25% 31/01/2024^ 13,640 0.99
USD 14,088,000 United States Treasury Note/Bond 2.25% 31/10/2024^ 13,559 0.99
USD 31,491,000 United States Treasury Note/Bond 2.25% 15/11/2024^ 30,294 2.21
USD 27,578,000 United States Treasury Note/Bond 2.25% 31/12/2024^ 26,509 1.93
USD 44,371,000 United States Treasury Note/Bond 2.375% 15/08/2024^ 43,075 3.14
USD 24,227,000 United States Treasury Note/Bond 2.5% 15/08/2023^ 23,830 1.74
USD 30,367,000 United States Treasury Note/Bond 2.5% 15/05/2024^ 29,731 2.16
USD 14,088,000 United States Treasury Note/Bond 2.5% 31/01/2025^ 13,742 1.00
USD 9,596,000 United States Treasury Note/Bond 2.625% 28/02/2023^ 9,511 0.69
USD 17,363,000 United States Treasury Note/Bond 2.75% 30/04/2023^ 17,288 1.26
USD 9,596,000 United States Treasury Note/Bond 2.75% 31/05/2023^ 9,557 0.70
USD 28,119,000 United States Treasury Note/Bond 2.75% 15/11/2023^ 27,962 2.04
USD 24,747,000 United States Treasury Note/Bond 2.75% 15/02/2024^ 24,584 1.79
USD 29,847,000 United States Treasury Note/Bond 2.75% 28/02/2025^ 29,550 2.15
USD 13,255,000 United States Treasury Note/Bond 2.875% 30/04/2025 13,216 0.96
USD 6,976,000 United States Treasury Note/Bond 2.875% 31/05/2025 6,954 0.51
USD 3,372,000 United States Treasury Note/Bond 7.25% 15/08/2022 3,940 0.29Total United States 1,362,445 99.18Total bonds 1,362,445 99.18
Ccy Holding InvestmentFair value
$'000
% of netassetvalue
Total value of investments 1,362,445 99.18
Cash equivalents (31 July 2017: 1.18%) UCITS collective investment schemes - Money Market Funds (31 July 2017: 1.18%)
USD 2,225,039 Institutional Cash Series Plc - Institutional US Dollar Liquidity Fund* 2,225 0.16 Cash† 1,927 0.14 Other net assets 7,185 0.52 Net asset value attributable to redeemable participating shareholders at the end of the financial year 1,373,782 100.00
† Substantially all cash positions are held with State Street Bank and Trust Company. ^ These securities are partially or fully transferred as securities lent. * Investment in related party.
Fixed income securities are primarily classified by country of issuer for government type fixed income securities.
Analysis of total current assets gross of all liabilities
Fair value$'000
% of totalcurrentassets
Transferable securities admitted to an official stock exchange listing 1,362,445 99.16UCITS collective investment schemes - Money Market Funds 2,225 0.16Other assets 9,350 0.68Total current assets 1,374,020 100.00

iSHARES VII PLC
Schedule of Investments (continued) iSHARES $ TREASURY BOND 7-10yr UCITS ETF USD (Acc) As at 31 July 2018
[ 1 3 4 ] i S H A R E S V I I P L C A N N U A L R E P O R T
Ccy Holding Investment Fair value
$'000
% of netassetvalue
Transferable Securities Admitted to an Official Stock Exchange Listing or traded on a Regulated Market (31 July 2017: 99.17%)
Bonds (31 July 2017: 99.17%) United States (31 July 2017: 99.17%) Government Bonds
USD 17,840,000 United States Treasury Note/Bond 1.5% 15/08/2026^ 15,997 7.33
USD 18,160,000 United States Treasury Note/Bond 1.625% 15/02/2026^ 16,550 7.59
USD 18,720,000 United States Treasury Note/Bond 1.625% 15/05/2026^ 17,010 7.80
USD 15,520,000 United States Treasury Note/Bond 2% 15/08/2025^ 14,607 6.70
USD 18,400,000 United States Treasury Note/Bond 2% 15/11/2026^ 17,114 7.85
USD 22,160,000 United States Treasury Note/Bond 2.25% 15/11/2025^ 21,168 9.72
USD 17,680,000 United States Treasury Note/Bond 2.25% 15/02/2027^ 16,743 7.68
USD 18,400,000 United States Treasury Note/Bond 2.25% 15/08/2027^ 17,364 7.96
USD 18,960,000 United States Treasury Note/Bond 2.25% 15/11/2027^ 17,864 8.19
USD 17,680,000 United States Treasury Note/Bond 2.375% 15/05/2027^ 16,890 7.74
USD 19,360,000 United States Treasury Note/Bond 2.75% 15/02/2028^ 19,013 8.72
USD 12,240,000 United States Treasury Note/Bond 2.875% 15/05/2028^ 12,146 5.57
USD 2,320,000 United States Treasury Note/Bond 6% 15/02/2026^ 2,802 1.28
USD 2,720,000 United States Treasury Note/Bond 6.125% 15/11/2027^ 3,415 1.57
USD 1,120,000 United States Treasury Note/Bond 6.375% 15/08/2027^ 1,424 0.65
USD 1,520,000 United States Treasury Note/Bond 6.5% 15/11/2026^ 1,918 0.88
USD 1,040,000 United States Treasury Note/Bond 6.625% 15/02/2027^ 1,329 0.61
USD 1,120,000 United States Treasury Note/Bond 6.75% 15/08/2026^ 1,426 0.65
USD 1,120,000 United States Treasury Note/Bond 6.875% 15/08/2025 1,401 0.64Total United States 216,181 99.13Total bonds 216,181 99.13 Total value of investments 216,181 99.13 Cash† 138 0.06 Other net assets 1,774 0.81 Net asset value attributable to redeemable participating shareholders at the end of the financial year 218,093 100.00
† Substantially all cash positions are held with State Street Bank and Trust Company. ^ These securities are partially or fully transferred as securities lent.
Fixed income securities are primarily classified by country of the issuer for government type fixed income securities.
Analysis of total current assets gross of all liabilities
Fair value$'000
% of totalcurrentassets
Transferable securities admitted to an official stock exchange listing 216,181 99.11Other assets 1,951 0.89Total current assets 218,132 100.00

iSHARES VII PLC
Schedule of Investments (continued) iSHARES € GOVT BOND 1-3YR UCITS ETF EUR (Acc) As at 31 July 2018
i S H A R E S V I I P L C A N N U A L R E P O R T [ 1 3 5 ]
Ccy Holding Investment Fair value
€'000
% of netassetvalue
Transferable Securities Admitted to an Official Stock Exchange Listing or traded on a Regulated Market (31 July 2017: 99.88%)
Bonds (31 July 2017: 99.88%) France (31 July 2017: Nil) Government Bonds
EUR 39,680,000 French Republic Government Bond OAT 0% 25/02/2020^ 40,002 14.94
EUR 33,280,000 French Republic Government Bond OAT 0% 25/02/2021^ 33,618 12.55Total France 73,620 27.49
Germany (31 July 2017: Nil) Government Bonds
EUR 20,800,000 Bundesschatzanweisungen 0% 13/09/2019 20,951 7.82
EUR 20,800,000 Bundesschatzanweisungen 0% 13/12/2019 20,978 7.84
EUR 20,640,000 Bundesschatzanweisungen 0% 13/03/2020 20,839 7.78
EUR 15,840,000 Bundesschatzanweisungen 0% 12/06/2020 16,012 5.98Total Germany 78,780 29.42
Italy (31 July 2017: 70.72%) Government Bonds
EUR 21,920,000 Italy Buoni Poliennali Del Tesoro 0.05% 15/10/2019 21,830 8.15
EUR 16,320,000 Italy Buoni Poliennali Del Tesoro 0.05% 15/04/2021 15,852 5.92
EUR 27,680,000 Italy Buoni Poliennali Del Tesoro 0.2% 15/10/2020 27,269 10.18
EUR 25,760,000 Italy Buoni Poliennali Del Tesoro 0.35% 15/06/2020^ 25,572 9.55Total Italy 90,523 33.80
Spain (31 July 2017: 29.16%) Government Bonds
EUR 24,480,000 Spain Government Bond 0.05% 31/01/2021^ 24,605 9.19Total Spain 24,605 9.19Total bonds 267,528 99.90
Fair value
€'000
% of netassetvalue
Total value of investments 267,528 99.90 Cash† 275 0.10 Other net liabilities (6) 0.00 Net asset value attributable to redeemable participating shareholders at the end of the financial year 267,797 100.00
† Substantially all cash positions are held with State Street Bank and Trust Company. ^ These securities are partially or fully transferred as securities lent.
Fixed income securities are primarily classified by country of issuer for government type fixed income securities.
Analysis of total current assets gross of all liabilities
Fair value€'000
% of totalcurrentassets
Transferable securities admitted to an official stock exchange listing 267,528 99.88Other assets 317 0.12Total current assets 267,845 100.00

iSHARES VII PLC
Schedule of Investments (continued) iSHARES € GOVT BOND 3-7YR UCITS ETF As at 31 July 2018
[ 1 3 6 ] i S H A R E S V I I P L C A N N U A L R E P O R T
Ccy Holding Investment Fair value
€'000
% of netassetvalue
Transferable Securities Admitted to an Official Stock Exchange Listing or traded on a Regulated Market (31 July 2017: 98.64%)
Bonds (31 July 2017: 98.64%) France (31 July 2017: 21.82%) Government Bonds
EUR 5,882,000 French Republic Government Bond OAT 0% 25/05/2022 5,933 1.73
EUR 6,228,000 French Republic Government Bond OAT 0% 25/03/2023^ 6,249 1.82
EUR 8,304,000 French Republic Government Bond OAT 0.5% 25/05/2025 8,449 2.46
EUR 10,034,000 French Republic Government Bond OAT 1.75% 25/05/2023^ 10,919 3.18
EUR 10,380,000 French Republic Government Bond OAT 1.75% 25/11/2024 11,419 3.32
EUR 9,342,000 French Republic Government Bond OAT 2.25% 25/10/2022 10,307 3.00
EUR 8,304,000 French Republic Government Bond OAT 2.25% 25/05/2024^ 9,352 2.72
EUR 9,342,000 French Republic Government Bond OAT 3% 25/04/2022^ 10,482 3.05
EUR 10,726,000 French Republic Government Bond OAT 3.25% 25/10/2021 11,976 3.48Total France 85,086 24.76
Germany (31 July 2017: 23.34%) Government Bonds
EUR 5,017,000 Bundesobligation 0% 08/10/2021 5,088 1.48EUR 4,844,000 Bundesobligation 0%
08/04/2022^ 4,911 1.43EUR 6,574,000 Bundesrepublik Deutschland
Bundesanleihe 0.5% 15/02/2025^ 6,781 1.97
EUR 4,325,000 Bundesrepublik Deutschland Bundesanleihe 1% 15/08/2024^ 4,598 1.34
EUR 5,017,000 Bundesrepublik Deutschland Bundesanleihe 1.5% 04/09/2022 5,395 1.57
EUR 5,190,000 Bundesrepublik Deutschland Bundesanleihe 1.5% 15/02/2023^ 5,608 1.63
EUR 5,017,000 Bundesrepublik Deutschland Bundesanleihe 1.5% 15/05/2023^ 5,433 1.58
EUR 5,363,000 Bundesrepublik Deutschland Bundesanleihe 1.5% 15/05/2024^ 5,854 1.70
EUR 7,266,000 Bundesrepublik Deutschland Bundesanleihe 1.75% 04/07/2022^ 7,870 2.29
EUR 5,190,000 Bundesrepublik Deutschland Bundesanleihe 1.75% 15/02/2024^ 5,728 1.67
EUR 5,536,000 Bundesrepublik Deutschland Bundesanleihe 2% 04/01/2022^ 5,997 1.75
EUR 5,017,000 Bundesrepublik Deutschland Bundesanleihe 2% 15/08/2023^ 5,572 1.62
EUR 3,806,000 Bundesrepublik Deutschland Bundesanleihe 2.25% 04/09/2021 4,127 1.20
Ccy Holding InvestmentFair value
€'000
% of netassetvalue
Germany (31 July 2017: 23.34%) (cont) Government Bonds (cont)
EUR 4,844,000 Bundesrepublik Deutschland Bundesanleihe 3.25% 04/07/2021^ 5,377 1.57Total Germany 78,339 22.80
Italy (31 July 2017: 30.79%) Government Bonds
EUR 3,114,000 Italy Buoni Poliennali Del Tesoro 0.35% 01/11/2021 3,024 0.88
EUR 4,152,000 Italy Buoni Poliennali Del Tesoro 0.65% 15/10/2023 3,891 1.13
EUR 3,287,000 Italy Buoni Poliennali Del Tesoro 0.9% 01/08/2022 3,195 0.93
EUR 1,384,000 Italy Buoni Poliennali Del Tesoro 0.95% 01/03/2023 1,332 0.39
EUR 3,633,000 Italy Buoni Poliennali Del Tesoro 0.95% 15/03/2023 3,499 1.02
EUR 4,671,000 Italy Buoni Poliennali Del Tesoro 1.2% 01/04/2022 4,618 1.34
EUR 4,844,000 Italy Buoni Poliennali Del Tesoro 1.35% 15/04/2022 4,811 1.40
EUR 4,844,000 Italy Buoni Poliennali Del Tesoro 1.45% 15/09/2022 4,805 1.40
EUR 3,979,000 Italy Buoni Poliennali Del Tesoro 1.45% 15/11/2024 3,796 1.10
EUR 2,768,000 Italy Buoni Poliennali Del Tesoro 1.45% 15/05/2025 2,615 0.76
EUR 5,017,000 Italy Buoni Poliennali Del Tesoro 1.5% 01/06/2025 4,753 1.38
EUR 4,671,000 Italy Buoni Poliennali Del Tesoro 1.85% 15/05/2024 4,600 1.34
EUR 5,709,000 Italy Buoni Poliennali Del Tesoro 2.15% 15/12/2021 5,857 1.70
EUR 5,709,000 Italy Buoni Poliennali Del Tesoro 2.5% 01/12/2024 5,801 1.69
EUR 3,979,000 Italy Buoni Poliennali Del Tesoro 3.75% 01/09/2024 4,321 1.26
EUR 5,709,000 Italy Buoni Poliennali Del Tesoro 4.5% 01/05/2023 6,391 1.86
EUR 5,363,000 Italy Buoni Poliennali Del Tesoro 4.5% 01/03/2024 6,031 1.76
EUR 5,190,000 Italy Buoni Poliennali Del Tesoro 4.75% 01/09/2021 5,729 1.67
EUR 5,882,000 Italy Buoni Poliennali Del Tesoro 5% 01/03/2022 6,593 1.92
EUR 5,536,000 Italy Buoni Poliennali Del Tesoro 5.5% 01/09/2022 6,364 1.85
EUR 5,190,000 Italy Buoni Poliennali Del Tesoro 5.5% 01/11/2022 5,975 1.74Total Italy 98,001 28.52
Netherlands (31 July 2017: 5.57%) Government Bonds
EUR 2,941,000 Netherlands Government Bond 0% 15/01/2022 2,975 0.86
EUR 1,903,000 Netherlands Government Bond 0% 15/01/2024 1,905 0.55

iSHARES VII PLC
Schedule of Investments (continued) iSHARES € GOVT BOND 3-7YR UCITS ETF (continued) As at 31 July 2018
i S H A R E S V I I P L C A N N U A L R E P O R T [ 1 3 7 ]
Ccy Holding Investment Fair value
€'000
% of netassetvalue
Bonds (31 July 2017: 98.64%) (cont) Netherlands (31 July 2017: 5.57%) (cont) Government Bonds (cont)
EUR 216,000 Netherlands Government Bond 1.75% 15/07/2023 236 0.07
EUR 4,455,000 Netherlands Government Bond 1.75% 15/07/2023 4,875 1.42
EUR 4,325,000 Netherlands Government Bond 2% 15/07/2024 4,835 1.41
EUR 4,325,000 Netherlands Government Bond 2.25% 15/07/2022 4,766 1.39
EUR 4,152,000 Netherlands Government Bond 3.25% 15/07/2021 4,611 1.34Total Netherlands 24,203 7.04
Spain (31 July 2017: 17.12%) Government Bonds
EUR 184,000 Spain Government Bond 0.4% 30/04/2022 186 0.05
EUR 3,795,000 Spain Government Bond 0.4% 30/04/2022 3,846 1.12
EUR 3,460,000 Spain Government Bond 0.45% 31/10/2022 3,504 1.02
EUR 5,190,000 Spain Government Bond 0.75% 30/07/2021 5,327 1.55
EUR 4,844,000 Spain Government Bond 1.6% 30/04/2025 5,114 1.49
EUR 5,882,000 Spain Government Bond 2.75% 31/10/2024 6,640 1.93
EUR 6,228,000 Spain Government Bond 3.8% 30/04/2024 7,364 2.14
EUR 6,055,000 Spain Government Bond 4.4% 31/10/2023 7,301 2.13
EUR 6,055,000 Spain Government Bond 5.4% 31/01/2023 7,461 2.17
EUR 6,228,000 Spain Government Bond 5.85% 31/01/2022 7,509 2.19Total Spain 54,252 15.79Total bonds 339,881 98.91
Total value of investments 339,881 98.91
Cash equivalents (31 July 2017: 0.26%) UCITS collective investment schemes - Money Market Funds (31 July 2017: 0.26%)
EUR 653,042 Institutional Cash Series Plc - Institutional Euro Liquidity Fund* 653 0.19
Fair value
€'000
% of netassetvalue
Cash† 300 0.09 Other net assets 2,796 0.81 Net asset value attributable to redeemable participating shareholders at the end of the financial year 343,630 100.00
† Substantially all cash positions are held with State Street Bank and Trust Company. ^ These securities are partially or fully transferred as securities lent. * Investment in related party.
Fixed income securities are primarily classified by country of issuer for government type fixed income securities.
Analysis of total current assets gross of all liabilities
Fair value€'000
% of totalcurrentassets
Transferable securities admitted to an official stock exchange listing 220,909 64.27Transferable securities dealt in an another regulated market 118,972 34.62UCITS collective investment schemes - Money Market Funds 653 0.19Other assets 3,154 0.92Total current assets 343,688 100.00

iSHARES VII PLC
Schedule of Investments (continued) iSHARES € GOVT BOND 7-10YR UCITS ETF EUR (Acc) As at 31 July 2018
[ 1 3 8 ] i S H A R E S V I I P L C A N N U A L R E P O R T
Ccy Holding Investment Fair value
€'000
% of netassetvalue
Transferable Securities Admitted to an Official Stock Exchange Listing or traded on a Regulated Market (31 July 2017: 99.32%)
Bonds (31 July 2017: 99.32%) France (31 July 2017: 27.40%) Government Bonds
EUR 2,125,000 French Republic Government Bond OAT 0.25% 25/11/2026^ 2,089 5.20
EUR 2,176,000 French Republic Government Bond OAT 0.5% 25/05/2026 2,196 5.47
EUR 2,244,000 French Republic Government Bond OAT 0.75% 25/05/2028 2,261 5.63
EUR 1,870,000 French Republic Government Bond OAT 1% 25/11/2025 1,964 4.89
EUR 2,176,000 French Republic Government Bond OAT 1% 25/05/2027 2,264 5.63Total France 10,774 26.82
Germany (31 July 2017: 19.56%) Government Bonds
EUR 1,598,000 Bundesrepublik Deutschland Bundesanleihe 0% 15/08/2026^ 1,573 3.91
EUR 1,853,000 Bundesrepublik Deutschland Bundesanleihe 0.25% 15/02/2027^ 1,852 4.61
EUR 1,853,000 Bundesrepublik Deutschland Bundesanleihe 0.5% 15/02/2026 1,904 4.74
EUR 1,785,000 Bundesrepublik Deutschland Bundesanleihe 0.5% 15/08/2027^ 1,814 4.52
EUR 1,326,000 Bundesrepublik Deutschland Bundesanleihe 0.5% 15/02/2028^ 1,341 3.34
EUR 1,547,000 Bundesrepublik Deutschland Bundesanleihe 1% 15/08/2025^ 1,648 4.10Total Germany 10,132 25.22
Italy (31 July 2017: 22.27%) Government Bonds
EUR 1,207,000 Italy Buoni Poliennali Del Tesoro 1.25% 01/12/2026^ 1,097 2.73
EUR 1,207,000 Italy Buoni Poliennali Del Tesoro 1.6% 01/06/2026^ 1,134 2.82
EUR 1,139,000 Italy Buoni Poliennali Del Tesoro 2% 01/12/2025 1,109 2.76
EUR 1,309,000 Italy Buoni Poliennali Del Tesoro 2% 01/02/2028^ 1,232 3.07
EUR 1,377,000 Italy Buoni Poliennali Del Tesoro 2.05% 01/08/2027 1,309 3.26
EUR 1,190,000 Italy Buoni Poliennali Del Tesoro 2.2% 01/06/2027 1,150 2.86Total Italy 7,031 17.50
Netherlands (31 July 2017: 8.12%) Government Bonds
EUR 986,000 Netherlands Government Bond 0.25% 15/07/2025 992 2.47
EUR 1,054,000 Netherlands Government Bond 0.5% 15/07/2026 1,071 2.67
Ccy Holding InvestmentFair value
€'000
% of netassetvalue
Netherlands (31 July 2017: 8.12%) (cont) Government Bonds (cont)
EUR 1,071,000 Netherlands Government Bond 0.75% 15/07/2027 1,102 2.74Total Netherlands 3,165 7.88
Spain (31 July 2017: 21.97%) Government Bonds
EUR 1,564,000 Spain Government Bond 1.3% 31/10/2026 1,590 3.96
EUR 1,377,000 Spain Government Bond 1.4% 30/04/2028^ 1,386 3.45
EUR 1,564,000 Spain Government Bond 1.45% 31/10/2027 1,590 3.96
EUR 1,224,000 Spain Government Bond 1.5% 30/04/2027 1,254 3.12
EUR 1,343,000 Spain Government Bond 1.95% 30/04/2026 1,438 3.58
EUR 1,479,000 Spain Government Bond 2.15% 31/10/2025 1,609 4.00Total Spain 8,867 22.07Total bonds 39,969 99.49
Total value of investments 39,969 99.49
Cash equivalents (31 July 2017: Nil) UCITS collective investment schemes - Money Market Funds (31 July 2017: Nil)
EUR 80 Institutional Cash Series Plc - Institutional Euro Liquidity Fund* - 0.00
Cash† 36 0.09 Other net assets 170 0.42 Net asset value attributable to redeemable participating shareholders at the end of the financial year 40,175 100.00
† Substantially all cash positions are held with State Street Bank and Trust Company. ^ These securities are partially or fully transferred as securities lent. * Investment in related party.
Fixed income securities are primarily classified by country of issuer for government type fixed income securities
Analysis of total current assets gross of all liabilities
Fair value€'000
% of totalcurrentassets
Transferable securities admitted to an official stock exchange listing 37,726 93.89Transferable securities dealt in on another regulated market 2,243 5.58Other assets 213 0.53Total current assets 40,182 100.00

iSHARES VII PLC
Schedule of Investments (continued) iSHARES CORE EURO STOXX 50 UCITS ETF As at 31 July 2018
i S H A R E S V I I P L C A N N U A L R E P O R T [ 1 3 9 ]
Ccy Holding Investment Fair value
€'000
% of netassetvalue
Transferable Securities Admitted to an Official Stock Exchange Listing or traded on a Regulated Market (31 July 2017: 99.84%)
Equities (31 July 2017: 99.84%) Belgium (31 July 2017: 3.22%) Beverages
EUR 1,231,245 Anheuser-Busch InBev SA/NV 106,613 2.69Total Belgium 106,613 2.69
Finland (31 July 2017: 1.34%) Telecommunications
EUR 9,121,615 Nokia Oyj 42,379 1.07Total Finland 42,379 1.07
France (31 July 2017: 33.84%) Aerospace & defence
EUR 580,932 Safran SA 61,608 1.56Apparel retailers
EUR 436,334 LVMH Moet Hennessy Louis Vuitton SE 130,398 3.29Banks
EUR 1,866,375 BNP Paribas SA 103,901 2.62EUR 1,308,626 Societe Generale SA 49,872 1.26
Building materials and fixtures EUR 896,601 Cie de Saint-Gobain^ 34,138 0.86
Chemicals EUR 694,480 Air Liquide SA 76,046 1.92
Cosmetics & personal care EUR 398,769 L'Oreal SA^ 83,542 2.11
Electrical components & equipment EUR 872,575 Schneider Electric SE 60,068 1.52
Electricity EUR 2,993,874 Engie SA 41,360 1.04
Engineering & construction EUR 900,377 Vinci SA 77,432 1.95
Food EUR 1,031,007 Danone SA 69,294 1.75
Healthcare products EUR 354,935 Essilor International Cie
Generale d'Optique SA 44,793 1.13Insurance
EUR 3,374,385 AXA SA 72,887 1.84Media
EUR 1,673,178 Vivendi SA^ 37,145 0.94Oil & gas
EUR 4,306,465 Total SA 240,559 6.07Pharmaceuticals
EUR 1,830,371 Sanofi 136,125 3.44Real estate investment trusts
EUR 225,030 Unibail-Rodamco-Westfield 42,722 1.08
Ccy Holding InvestmentFair value
€'000
% of netassetvalue
France (31 July 2017: 33.84%) (cont) Telecommunications
EUR 3,319,817 Orange SA 48,519 1.22Total France 1,410,409 35.60
Germany (31 July 2017: 32.42%) Apparel retailers
EUR 294,627 Adidas AG^ 55,729 1.41Auto manufacturers
EUR 519,039 Bayerische Motoren Werke AG^ 42,919 1.08EUR 1,446,494 Daimler AG 85,560 2.16EUR 296,539 Volkswagen AG 45,139 1.14
Banks EUR 3,081,328 Deutsche Bank AG^ 34,474 0.87
Chemicals EUR 1,487,800 BASF SE 122,238 3.09
Electricity EUR 3,565,091 E.ON SE 34,382 0.87
Healthcare services EUR 662,528 Fresenius SE & Co KGaA 43,740 1.10
Insurance EUR 713,153 Allianz SE 134,886 3.40EUR 242,231 Muenchener
Rueckversicherungs-Gesellschaft AG 45,963 1.16Miscellaneous manufacturers
EUR 1,376,896 Siemens AG 166,274 4.20Pharmaceuticals
EUR 1,510,613 Bayer AG 143,901 3.63Software
EUR 1,750,625 SAP SE 174,800 4.41Telecommunications
EUR 5,253,082 Deutsche Telekom AG 74,331 1.88Transportation
EUR 1,587,744 Deutsche Post AG 47,934 1.21Total Germany 1,252,270 31.61
Ireland (31 July 2017: 1.06%) Building materials and fixtures
EUR 1,366,081 CRH Plc 39,999 1.01Total Ireland 39,999 1.01
Italy (31 July 2017: 4.84%) Banks
EUR 23,752,407 Intesa Sanpaolo SpA^ 62,564 1.58Electricity
EUR 12,583,069 Enel SpA^ 60,021 1.52Oil & gas
EUR 4,114,757 Eni SpA 67,745 1.71Total Italy 190,330 4.81

iSHARES VII PLC
Schedule of Investments (continued) iSHARES CORE EURO STOXX 50 UCITS ETF (continued) As at 31 July 2018
[ 1 4 0 ] i S H A R E S V I I P L C A N N U A L R E P O R T
Ccy Holding Investment Fair value
€'000
% of netassetvalue
Equities (31 July 2017: 99.84%) (cont) Netherlands (31 July 2017: 11.94%) Aerospace & defence
EUR 925,508 Airbus SE 98,104 2.48 Banks
EUR 6,303,275 ING Groep NV 82,585 2.08 Cosmetics & personal care
EUR 2,451,224 Unilever NV^ 120,698 3.05 Food
EUR 2,019,496 Koninklijke Ahold Delhaize NV^ 43,934 1.11Healthcare products
EUR 1,524,058 Koninklijke Philips NV 57,213 1.44Semiconductors
EUR 698,913 ASML Holding NV 128,251 3.24Total Netherlands 530,785 13.40
Spain (31 July 2017: 11.18%) Banks
EUR 10,800,600 Banco Bilbao Vizcaya Argentaria SA 67,893 1.71
EUR 26,138,056 Banco Santander SA 125,972 3.18Electricity
EUR 9,535,057 Iberdrola SA 63,408 1.60Retail
EUR 1,800,217 Industria de Diseno Textil SA 50,496 1.28Telecommunications
EUR 7,553,963 Telefonica SA 58,098 1.47Total Spain 365,867 9.24Total equities 3,938,652 99.43
CcyNo. of
contracts
Underlying exposure
€'000 Fair value
€'000
% of netassetsvalue
Financial derivative instruments (31 July 2017: 0.00%) Futures contracts (31 July 2017: 0.00%)
EUR 605 Euro Stoxx 50 Index Futures September 2018 20,780 546 0.01Total unrealised gains on futures contracts 546 0.01Total financial derivative instruments 546 0.01
Fair value€'000
% of net assetvalue
Total value of investments 3,939,198 99.44 Cash† 13,910 0.35 Other net assets 8,235 0.21 Net asset value attributable to redeemable participating shareholders at the end of the financial year 3,961,343 100.00
† Cash holdings of €12,931,452 are held with State Street Bank and Trust Company. €978,563 is held as security for futures contracts with Credit Suisse AG. ^ These securities are partially or fully transferred as securities lent.
Equities are primarily classified by country of incorporation of the entity in which the Fund holds shares. Underlying exposure has been calculated according to the guidelines issued the European Securities and Markets Authority ("ESMA") and represents the market value of an equivalent position in the assets underlying each financial derivative instrument.
Analysis of total current assets gross of all liabilities
Fair value€'000
% of totalcurrentassets
Transferable securities admitted to an official stock exchange listing 3,938,652 99.43Exchange traded financial derivative instruments 546 0.01Other assets 22,480 0.56Total current assets 3,961,678 100.00

iSHARES VII PLC
Schedule of Investments (continued) iSHARES CORE MSCI PACIFIC EX-JAPAN UCITS ETF As at 31 July 2018
i S H A R E S V I I P L C A N N U A L R E P O R T [ 1 4 1 ]
Ccy Holding Investment Fair value
$'000
% of netassetvalue
Transferable Securities Admitted to an Official Stock Exchange Listing or traded on a Regulated Market (31 July 2017: 99.55%)
Equities (31 July 2017: 99.55%) Australia (31 July 2017: 57.75%) Banks
AUD 2,868,058 Australia & New Zealand Banking Group Ltd 62,471 3.58
AUD 390,755 Bank of Queensland Ltd^ 3,227 0.18AUD 476,732 Bendigo & Adelaide Bank Ltd^ 4,150 0.24AUD 1,720,032 Commonwealth Bank of
Australia^ 95,632 5.49AUD 317,472 Macquarie Group Ltd 28,987 1.66AUD 2,669,997 National Australia Bank Ltd 56,232 3.23AUD 3,340,897 Westpac Banking Corp^ 73,167 4.20
Beverages AUD 529,390 Coca-Cola Amatil Ltd^ 3,770 0.22AUD 707,932 Treasury Wine Estates Ltd^ 9,694 0.55
Biotechnology AUD 443,869 CSL Ltd 64,876 3.72
Building materials and fixtures AUD 1,152,579 Boral Ltd^ 5,698 0.33
Chemicals AUD 1,624,864 Incitec Pivot Ltd^ 4,578 0.26
Commercial services AUD 1,564,765 Brambles Ltd 11,493 0.66AUD 2,185,384 Transurban Group^ 19,008 1.09
Computers AUD 456,333 Computershare Ltd 6,171 0.36
Diversified financial services AUD 190,456 ASX Ltd 9,301 0.53
Electricity AUD 644,775 AGL Energy Ltd 10,541 0.61AUD 1,752,202 AusNet Services^ 2,123 0.12AUD 1,704,663 Origin Energy Ltd 12,381 0.71
Engineering & construction AUD 93,665 CIMIC Group Ltd 3,365 0.19AUD 574,281 LendLease Group 8,594 0.50AUD 1,086,504 Sydney Airport 5,711 0.33
Entertainment AUD 564,806 Aristocrat Leisure Ltd 13,520 0.77AUD 1,894,838 Tabcorp Holdings Ltd^ 6,578 0.38
Food AUD 1,113,083 Wesfarmers Ltd 40,926 2.35AUD 1,281,186 Woolworths Group Ltd^ 28,659 1.64
Healthcare products AUD 56,631 Cochlear Ltd^ 8,561 0.49
Healthcare services AUD 1,671,092 Healthscope Ltd 2,708 0.16AUD 138,580 Ramsay Health Care Ltd^ 5,794 0.33AUD 396,735 Sonic Healthcare Ltd 7,692 0.44
Hotels
AUD 381,619 Crown Resorts Ltd 3,830 0.22
Ccy Holding InvestmentFair value
$'000
% of netassetvalue
Australia (31 July 2017: 57.75%) (cont) Insurance
AUD 2,870,317 AMP Ltd^ 7,255 0.42AUD 560,419 Challenger Ltd^ 5,182 0.30AUD 2,326,577 Insurance Australia Group Ltd 13,906 0.80AUD 2,752,684 Medibank Pvt Ltd 6,364 0.36AUD 1,337,149 QBE Insurance Group Ltd^ 10,040 0.58AUD 1,273,729 Suncorp Group Ltd 14,175 0.81
Internet AUD 328,024 Seek Ltd^ 5,211 0.30
Iron & steel AUD 549,414 BlueScope Steel Ltd 7,213 0.42AUD 1,503,990 Fortescue Metals Group Ltd^ 4,886 0.28
Leisure time AUD 56,176 Flight Centre Travel Group Ltd^ 2,840 0.16
Mining AUD 2,427,120 Alumina Ltd^ 5,106 0.29AUD 3,151,956 BHP Billiton Ltd^ 81,683 4.69AUD 754,439 Newcrest Mining Ltd 12,131 0.70AUD 404,965 Rio Tinto Ltd^ 24,445 1.40AUD 5,033,058 South32 Ltd 13,358 0.77
Miscellaneous manufacturers AUD 372,322 Orica Ltd^ 4,866 0.28
Oil & gas AUD 255,957 Caltex Australia Ltd 6,195 0.36AUD 1,801,270 Santos Ltd 8,543 0.49AUD 884,285 Woodside Petroleum Ltd 23,758 1.36
Packaging & containers AUD 1,138,375 Amcor Ltd^ 12,753 0.73
Pipelines AUD 1,145,129 APA Group 8,215 0.47
Real estate investment & services AUD 51,691 REA Group Ltd^ 3,335 0.19
Real estate investment trusts AUD 1,000,516 Dexus 7,497 0.43AUD 1,593,445 Goodman Group 11,407 0.65AUD 1,774,465 GPT Group 6,807 0.39AUD 3,589,674 Mirvac Group 6,084 0.35AUD 5,231,223 Scentre Group 16,528 0.95AUD 2,362,448 Stockland 7,289 0.42AUD 3,258,008 Vicinity Centres 6,443 0.37
Retail AUD 63,821 Domino's Pizza Enterprises Ltd^ 2,370 0.14AUD 553,481 Harvey Norman Holdings Ltd^ 1,460 0.08
Telecommunications AUD 4,093,742 Telstra Corp Ltd 8,643 0.49AUD 353,974 TPG Telecom Ltd^ 1,516 0.09
Transportation AUD 1,969,856 Aurizon Holdings Ltd 6,663 0.38
Total Australia 983,605 56.44

iSHARES VII PLC
Schedule of Investments (continued) iSHARES CORE MSCI PACIFIC EX-JAPAN UCITS ETF (continued) As at 31 July 2018
[ 1 4 2 ] i S H A R E S V I I P L C A N N U A L R E P O R T
Ccy Holding Investment Fair value
$'000
% of netassetvalue
Equities (31 July 2017: 99.55%) (cont) Bermuda (31 July 2017: 3.03%) Apparel retailers
HKD 734,000 Yue Yuen Industrial Holdings Ltd 1,974 0.11Distribution & wholesale
HKD 5,825,000 Li & Fung Ltd^ 1,974 0.11Engineering & construction
HKD 658,500 CK Infrastructure Holdings Ltd^ 4,888 0.28Food
USD 331,700 Dairy Farm International Holdings Ltd^ 2,710 0.16Holding companies - diversified operations
USD 215,900 Jardine Matheson Holdings Ltd 14,573 0.84USD 220,600 Jardine Strategic Holdings Ltd 8,798 0.50HKD 1,532,361 NWS Holdings Ltd 2,769 0.16
Hotels HKD 1,218,000 Shangri-La Asia Ltd^ 1,993 0.11
Real estate investment & services USD 1,142,700 Hongkong Land Holdings Ltd 8,307 0.48HKD 653,750 Kerry Properties Ltd 3,312 0.19
Total Bermuda 51,298 2.94
Cayman Islands (31 July 2017: 5.23%) Auto parts & equipment
HKD 788,000 Minth Group Ltd^ 2,972 0.17Food
HKD 8,653,500 WH Group Ltd 6,947 0.40Holding companies - diversified operations
HKD 2,654,958 CK Hutchison Holdings Ltd 28,860 1.66Hotels
USD 245,829 Melco Resorts & Entertainment Ltd 6,357 0.36
HKD 938,000 MGM China Holdings Ltd^ 2,018 0.12HKD 2,380,000 Sands China Ltd^ 12,253 0.70HKD 1,539,792 Wynn Macau Ltd^ 4,533 0.26
Real estate investment & services HKD 2,543,936 CK Asset Holdings Ltd 19,467 1.12HKD 1,218,073 Wharf Real Estate Investment Co
Ltd 8,871 0.51Semiconductors
HKD 295,150 ASM Pacific Technology Ltd^ 3,553 0.20Total Cayman Islands 95,831 5.50
Hong Kong (31 July 2017: 20.60%) Banks
HKD 1,252,339 Bank of East Asia Ltd^ 4,979 0.28HKD 3,626,250 BOC Hong Kong Holdings Ltd 17,560 1.01HKD 750,500 Hang Seng Bank Ltd 20,429 1.17
Diversified financial services
HKD 1,156,191 Hong Kong Exchanges & Clearing Ltd^ 34,124 1.96
Ccy Holding InvestmentFair value
$'000
% of netassetvalue
Hong Kong (31 July 2017: 20.60%) (cont) Electricity
HKD 1,617,000 CLP Holdings Ltd 18,473 1.06HKD 2,591,000 HK Electric Investments & HK
Electric Investments Ltd^ 2,648 0.15HKD 1,377,000 Power Assets Holdings Ltd 9,748 0.56
Gas HKD 9,077,402 Hong Kong & China Gas Co Ltd^ 18,532 1.06
Hand & machine tools HKD 1,370,000 Techtronic Industries Co Ltd^ 7,630 0.44
Holding companies - diversified operations HKD 487,476 Swire Pacific Ltd^ 5,286 0.30HKD 1,217,073 Wharf Holdings Ltd 4,025 0.23
Hotels HKD 2,329,500 Galaxy Entertainment Group Ltd^ 18,717 1.07HKD 1,997,819 SJM Holdings Ltd 2,426 0.14
Insurance HKD 11,858,224 AIA Group Ltd 103,514 5.94
Real estate investment & services HKD 888,000 Hang Lung Group Ltd 2,625 0.15HKD 1,981,500 Hang Lung Properties Ltd 4,167 0.24HKD 1,301,509 Henderson Land Development
Co Ltd 7,256 0.42HKD 609,034 Hysan Development Co Ltd 3,333 0.19HKD 5,968,952 New World Development Co Ltd 8,504 0.49HKD 3,146,972 Sino Land Co Ltd 5,406 0.31HKD 1,553,334 Sun Hung Kai Properties Ltd 24,348 1.40HKD 1,161,200 Swire Properties Ltd 4,573 0.26HKD 838,500 Wheelock & Co Ltd 5,941 0.34
Real estate investment trusts HKD 2,139,888 Link REIT 21,216 1.22
Telecommunications HKD 3,775,540 HKT Trust & HKT Ltd 5,042 0.29HKD 4,149,500 PCCW Ltd 2,422 0.14
Transportation HKD 1,479,777 MTR Corp Ltd 8,297 0.48
Total Hong Kong 371,221 21.30
Ireland (31 July 2017: 0.39%) Building materials and fixtures
AUD 434,179 James Hardie Industries Plc 6,939 0.40Total Ireland 6,939 0.40
Isle of Man (31 July 2017: 0.30%) Mauritius (31 July 2017: 0.12%) Agriculture
SGD 7,186,400 Golden Agri-Resources Ltd^ 1,478 0.08Total Mauritius 1,478 0.08

iSHARES VII PLC
Schedule of Investments (continued) iSHARES CORE MSCI PACIFIC EX-JAPAN UCITS ETF (continued) As at 31 July 2018
i S H A R E S V I I P L C A N N U A L R E P O R T [ 1 4 3 ]
Ccy Holding Investment Fair value
$'000
% of netassetvalue
Equities (31 July 2017: 99.55%) (cont) New Zealand (31 July 2017: 1.43%) Building materials and fixtures
NZD 863,766 Fletcher Building Ltd^ 4,134 0.24Electricity
NZD 1,265,244 Meridian Energy Ltd^ 2,705 0.16Engineering & construction
NZD 949,311 Auckland International Airport Ltd 4,314 0.25Food
NZD 720,133 a2 Milk Co Ltd 5,128 0.29Healthcare products
NZD 555,053 Fisher & Paykel Healthcare Corp Ltd^ 5,593 0.32Healthcare services
NZD 389,547 Ryman Healthcare Ltd^ 3,227 0.18Telecommunications
NZD 1,769,027 Spark New Zealand Ltd 4,661 0.27Total New Zealand 29,762 1.71
Papua New Guinea (31 July 2017: 0.42%) Oil & gas
AUD 1,348,830 Oil Search Ltd 9,004 0.52Total Papua New Guinea 9,004 0.52
Singapore (31 July 2017: 10.28%) Airlines
SGD 527,800 Singapore Airlines Ltd 3,823 0.22Banks
SGD 1,763,778 DBS Group Holdings Ltd 34,659 1.99SGD 3,094,841 Oversea-Chinese Banking Corp
Ltd 26,304 1.51SGD 1,315,119 United Overseas Bank Ltd 26,103 1.50
Distribution & wholesale SGD 100,188 Jardine Cycle & Carriage Ltd^ 2,474 0.14
Diversified financial services SGD 808,100 Singapore Exchange Ltd 4,417 0.25
Electricity SGD 1,011,200 Sembcorp Industries Ltd^ 1,991 0.11
Electronics SGD 268,800 Venture Corp Ltd 3,294 0.19
Engineering & construction SGD 670,800 SATS Ltd 2,558 0.15SGD 1,570,800 Singapore Technologies
Engineering Ltd 3,946 0.22Entertainment
SGD 5,932,200 Genting Singapore Ltd 5,578 0.32Food
SGD 1,891,500 Wilmar International Ltd^ 4,349 0.25Holding companies - diversified operations
SGD 1,428,900 Keppel Corp Ltd 7,211 0.41
Ccy Holding InvestmentFair value
$'000
% of netassetvalue
Singapore (31 July 2017: 10.28%) (cont) Hotels
SGD 410,100 City Developments Ltd 3,016 0.17Marine transportation
SGD 2,305,200 Yangzijiang Shipbuilding Holdings Ltd 1,600 0.09Media
SGD 833,800 Singapore Press Holdings Ltd^ 1,782 0.10Real estate investment & services
SGD 2,514,200 CapitaLand Ltd 5,965 0.35SGD 503,514 UOL Group Ltd 2,652 0.15
Real estate investment trusts SGD 2,486,326 Ascendas Real Estate
Investment Trust 5,023 0.29SGD 2,459,400 CapitaLand Commercial Trust 3,162 0.18SGD 2,468,200 CapitaLand Mall Trust 3,916 0.23SGD 2,093,900 Suntec Real Estate Investment
Trust 2,830 0.16Telecommunications
SGD 8,018,483 Singapore Telecommunications Ltd^ 18,908 1.09Transportation
SGD 2,171,100 ComfortDelGro Corp Ltd 3,748 0.22Total Singapore 179,309 10.29Total equities 1,728,447 99.18
CcyNo. of
contracts
Underlying exposure
$'000 Fair value
$'000
% of netassetsvalue
Financial derivative instruments (31 July 2017: 0.00%) Futures contracts (31 July 2017: 0.00%)
HKD 23 Hang Seng Index Futures August 2018 4,200 (33) 0.00
SGD 65 MSCI Singapore Index Futures August 2018 1,753 9 0.00
AUD 73 SPI 200 Index Futures September 2018 8,244 191 0.01Unrealised gains on futures contracts 200 0.01Total unrealised losses on futures contracts (33) 0.00Net unrealised gains on futures contracts 167 0.01Total financial derivative instruments 167 0.01

iSHARES VII PLC
Schedule of Investments (continued) iSHARES CORE MSCI PACIFIC EX-JAPAN UCITS ETF (continued) As at 31 July 2018
[ 1 4 4 ] i S H A R E S V I I P L C A N N U A L R E P O R T
Fair value
$'000
% of net assetvalue
Total value of investments 1,728,614 99.19 Cash† 13,609 0.78 Other net assets 517 0.03 Net asset value attributable to redeemable participating shareholders at the end of the financial year 1,742,740 100.00
† Cash holdings of $13,008,557 are held with State Street Bank and Trust Company. $600,083 is held as security for futures contracts with Credit Suisse AG. ^ These securities are partially or fully transferred as securities lent.
Equities are primarily classified by country of incorporation of the entity in which the Fund holds shares. Underlying exposure has been calculated according to the guidelines issued by the ESMA and represents the market value of an equivalent position in the assets underlying each financial derivative instrument.
Analysis of total current assets gross of all liabilities
Fair value$'000
% of totalcurrentassets
Transferable securities admitted to an official stock exchange listing 1,728,447 99.08Exchange traded financial derivative instruments 200 0.01Other assets 15,869 0.91Total current assets 1,744,516 100.00

iSHARES VII PLC
Schedule of Investments (continued) iSHARES CORE S&P 500 UCITS ETF As at 31 July 2018
i S H A R E S V I I P L C A N N U A L R E P O R T [ 1 4 5 ]
Ccy Holding Investment Fair value
$'000
% of netassetvalue
Transferable Securities Admitted to an Official Stock Exchange Listing or traded on a Regulated Market (31 July 2017: 99.60%)
Equities (31 July 2017: 99.60%) Bermuda (31 July 2017: 0.27%) Commercial services
USD 453,450 IHS Markit Ltd^ 24,047 0.08Diversified financial services
USD 516,968 Invesco Ltd 13,953 0.05Insurance
USD 51,654 Everest Re Group Ltd 11,279 0.04USD 325,352 XL Group Ltd 18,294 0.06
Leisure time USD 260,487 Norwegian Cruise Line Holdings
Ltd^ 13,032 0.04Total Bermuda 80,605 0.27
British Virgin Islands (31 July 2017: 0.03%) Apparel retailers
USD 188,827 Michael Kors Holdings Ltd 12,600 0.04Total British Virgin Islands 12,600 0.04
Curacao (31 July 2017: 0.45%) Oil & gas services
USD 1,745,383 Schlumberger Ltd 117,848 0.39Total Curacao 117,848 0.39
Ireland (31 July 2017: 2.02%) Building materials and fixtures
USD 1,166,110 Johnson Controls International Plc 43,741 0.15Computers
USD 810,351 Accenture Plc 129,113 0.43USD 361,027 Seagate Technology Plc 18,998 0.06
Electronics USD 118,996 Allegion Plc 9,703 0.03
Healthcare products USD 1,706,419 Medtronic Plc 153,970 0.51
Insurance USD 206,635 Pentair Plc 9,226 0.03USD 166,146 Willis Towers Watson Plc 26,487 0.09
Miscellaneous manufacturers USD 549,737 Eaton Corp Plc 45,721 0.15USD 312,666 Ingersoll-Rand Plc 30,801 0.10
Pharmaceuticals USD 427,252 Allergan Plc 78,653 0.26USD 163,041 Perrigo Co Plc 13,128 0.04
Total Ireland 559,541 1.85
Jersey (31 July 2017: 0.11%) Auto parts & equipment
USD 332,280 Aptiv Plc 32,587 0.11Total Jersey 32,587 0.11
Ccy Holding InvestmentFair value
$'000
% of netassetvalue
Liberia (31 July 2017: 0.09%) Leisure time
USD 212,119 Royal Caribbean Cruises Ltd 23,919 0.08Total Liberia 23,919 0.08
Netherlands (31 July 2017: 0.22%) Chemicals
USD 405,117 LyondellBasell Industries NV 44,883 0.15Pharmaceuticals
USD 649,333 Mylan NV 24,226 0.08Total Netherlands 69,109 0.23
Panama (31 July 2017: 0.13%) Leisure time
USD 510,947 Carnival Corp 30,268 0.10Total Panama 30,268 0.10
Singapore (31 July 2017: 0.47%) Switzerland (31 July 2017: 0.48%) Electronics
USD 140,486 Garmin Ltd 8,774 0.03USD 441,724 TE Connectivity Ltd 41,332 0.14
Insurance USD 586,940 Chubb Ltd 82,007 0.27
Total Switzerland 132,113 0.44
United Kingdom (31 July 2017: 0.29%) Commercial services
USD 418,326 Nielsen Holdings Plc 9,856 0.03Insurance
USD 308,060 Aon Plc 44,222 0.15Oil & gas services
USD 544,610 TechnipFMC Plc 17,727 0.06Total United Kingdom 71,805 0.24
United States (31 July 2017: 95.04%) Advertising
USD 492,509 Interpublic Group of Cos Inc^ 11,106 0.04USD 288,609 Omnicom Group Inc^ 19,865 0.06
Aerospace & defence USD 531,623 Arconic Inc 11,531 0.04USD 690,024 Boeing Co 245,856 0.82USD 347,542 General Dynamics Corp 69,425 0.23USD 149,747 Harris Corp 24,701 0.08USD 99,875 L3 Technologies Inc 21,417 0.07USD 313,052 Lockheed Martin Corp 102,086 0.34USD 219,746 Northrop Grumman Corp 66,031 0.22USD 361,952 Raytheon Co 71,677 0.24USD 206,129 Rockwell Collins Inc 28,650 0.09USD 61,445 TransDigm Group Inc^ 23,075 0.08USD 937,532 United Technologies Corp 127,261 0.42

iSHARES VII PLC
Schedule of Investments (continued) iSHARES CORE S&P 500 UCITS ETF (continued) As at 31 July 2018
[ 1 4 6 ] i S H A R E S V I I P L C A N N U A L R E P O R T
Ccy Holding Investment Fair value
$'000
% of netassetvalue
Equities (31 July 2017: 99.60%) (cont) United States (31 July 2017: 95.04%) (cont) Agriculture
USD 2,384,890 Altria Group Inc 139,945 0.47USD 703,459 Archer-Daniels-Midland Co 33,949 0.11USD 1,958,745 Philip Morris International Inc 169,040 0.56
Airlines USD 153,425 Alaska Air Group Inc^ 9,640 0.03USD 529,061 American Airlines Group Inc^ 20,919 0.07USD 815,340 Delta Air Lines Inc 44,371 0.15USD 671,483 Southwest Airlines Co 39,053 0.13USD 297,290 United Continental Holdings Inc 23,902 0.08
Apparel retailers USD 452,149 Hanesbrands Inc^ 10,065 0.03USD 1,616,263 Nike Inc 124,307 0.41USD 97,340 PVH Corp 14,944 0.05USD 70,157 Ralph Lauren Corp 9,470 0.03USD 229,413 Under Armour Inc 4,581 0.02USD 236,130 Under Armour Inc Class 'C'^ 4,425 0.01USD 412,535 VF Corp 37,982 0.13
Auto manufacturers USD 4,923,632 Ford Motor Co 49,433 0.16USD 1,595,403 General Motors Co 60,482 0.20USD 443,851 Paccar Inc 29,170 0.10
Auto parts & equipment USD 248,890 BorgWarner Inc 11,454 0.04USD 310,389 Goodyear Tire & Rubber Co 7,515 0.02
Banks USD 11,881,924 Bank of America Corp 366,914 1.22USD 1,273,539 Bank of New York Mellon Corp^ 68,096 0.23USD 981,956 BB&T Corp 49,893 0.17USD 612,944 Capital One Financial Corp 57,813 0.19USD 3,213,074 Citigroup Inc 230,988 0.77USD 609,762 Citizens Financial Group Inc 24,256 0.08USD 215,355 Comerica Inc 20,876 0.07USD 866,993 Fifth Third Bancorp 25,654 0.08USD 443,149 Goldman Sachs Group Inc 105,217 0.35USD 1,390,453 Huntington Bancshares Inc 21,468 0.07USD 4,290,228 JPMorgan Chase & Co 493,162 1.63USD 1,336,819 KeyCorp 27,899 0.09USD 182,538 M&T Bank Corp 31,643 0.10USD 1,717,636 Morgan Stanley 86,844 0.29USD 267,997 Northern Trust Corp 29,271 0.10USD 591,595 PNC Financial Services Group
Inc* 85,681 0.28USD 1,412,884 Regions Financial Corp 26,294 0.09USD 460,068 State Street Corp 40,629 0.13USD 583,937 SunTrust Banks Inc 42,084 0.14USD 66,744 SVB Financial Group 20,549 0.07USD 1,966,150 US Bancorp 104,226 0.35USD 5,526,162 Wells Fargo & Co 316,594 1.05USD 247,105 Zions Bancorporation^ 12,775 0.04
Ccy Holding InvestmentFair value
$'000
% of netassetvalue
United States (31 July 2017: 95.04%) (cont) Beverages
USD 329,871 Brown-Forman Corp^ 17,556 0.06USD 4,825,740 Coca-Cola Co 225,024 0.75USD 211,707 Constellation Brands Inc 44,507 0.15USD 231,949 Molson Coors Brewing Co 15,540 0.05USD 516,656 Monster Beverage Corp 31,010 0.10USD 1,786,589 PepsiCo Inc 205,458 0.68
Biotechnology USD 280,992 Alexion Pharmaceuticals Inc 37,361 0.12USD 839,194 Amgen Inc 164,944 0.55USD 266,673 Biogen Inc 89,167 0.29USD 890,672 Celgene Corp 80,241 0.27USD 1,638,398 Gilead Sciences Inc 127,516 0.42USD 185,231 Illumina Inc 60,081 0.20USD 220,635 Incyte Corp 14,681 0.05USD 97,453 Regeneron Pharmaceuticals Inc 35,864 0.12USD 321,024 Vertex Pharmaceuticals Inc 56,195 0.19
Building materials and fixtures USD 183,486 Fortune Brands Home & Security
Inc 10,642 0.04USD 79,324 Martin Marietta Materials Inc^ 15,819 0.05USD 390,410 Masco Corp 15,745 0.05USD 165,698 Vulcan Materials Co^ 18,558 0.06
Chemicals USD 276,861 Air Products & Chemicals Inc 45,452 0.15USD 138,774 Albemarle Corp^ 13,073 0.04USD 294,481 CF Industries Holdings Inc 13,081 0.04USD 2,924,359 DowDuPont Inc 201,108 0.67USD 178,870 Eastman Chemical Co 18,535 0.06USD 169,272 FMC Corp 15,214 0.05USD 100,474 International Flavors &
Fragrances Inc^ 13,339 0.05USD 442,594 Mosaic Co 13,326 0.04USD 314,167 PPG Industries Inc 34,766 0.12USD 362,100 Praxair Inc^ 60,652 0.20USD 103,756 Sherwin-Williams Co 45,728 0.15
Commercial services USD 555,098 Automatic Data Processing Inc 74,933 0.25USD 109,765 Cintas Corp^ 22,445 0.08USD 326,979 Ecolab Inc 46,006 0.15USD 151,633 Equifax Inc 19,030 0.06USD 113,744 FleetCor Technologies Inc 24,682 0.08USD 115,670 Gartner Inc^ 15,665 0.05USD 200,273 Global Payments Inc 22,545 0.08USD 258,786 H&R Block Inc 6,511 0.02USD 210,389 Moody's Corp 36,002 0.12USD 1,406,429 PayPal Holdings Inc 115,524 0.38USD 192,370 Quanta Services Inc 6,554 0.02USD 158,626 Robert Half International Inc 12,017 0.04USD 317,037 S&P Global Inc 63,547 0.21USD 208,164 Total System Services Inc 19,055 0.07

iSHARES VII PLC
Schedule of Investments (continued) iSHARES CORE S&P 500 UCITS ETF (continued) As at 31 July 2018
i S H A R E S V I I P L C A N N U A L R E P O R T [ 1 4 7 ]
Ccy Holding Investment Fair value
$'000
% of netassetvalue
Equities (31 July 2017: 99.60%) (cont) United States (31 July 2017: 95.04%) (cont) Commercial services (cont)
USD 106,566 United Rentals Inc 15,857 0.05USD 195,088 Verisk Analytics Inc^ 21,581 0.07USD 578,937 Western Union Co^ 11,671 0.04
Computers USD 6,193,420 Apple Inc 1,178,546 3.91USD 738,254 Cognizant Technology Solutions
Corp 60,168 0.20USD 358,134 DXC Technology Co 30,348 0.10USD 1,921,216 Hewlett Packard Enterprise Co 29,664 0.10USD 2,068,309 HP Inc 47,736 0.16USD 1,075,742 International Business Machines
Corp 155,907 0.52USD 337,215 NetApp Inc 26,141 0.08USD 376,024 Western Digital Corp 26,378 0.09
Cosmetics & personal care USD 1,099,176 Colgate-Palmolive Co 73,656 0.24USD 590,722 Coty Inc 7,921 0.03USD 282,786 Estee Lauder Cos Inc 38,159 0.13USD 3,168,556 Procter & Gamble Co 256,273 0.85
Distribution & wholesale USD 362,448 Fastenal Co^ 20,634 0.07USD 389,098 LKQ Corp 13,043 0.04USD 64,256 WW Grainger Inc 22,268 0.08
Diversified financial services USD 68,260 Affiliated Managers Group Inc 10,922 0.04USD 60,745 Alliance Data Systems Corp^ 13,660 0.04USD 899,077 American Express Co 89,476 0.30USD 183,584 Ameriprise Financial Inc 26,743 0.09USD 155,416 BlackRock Inc* 78,137 0.26USD 141,428 Cboe Global Markets Inc 13,737 0.04USD 1,511,482 Charles Schwab Corp 77,176 0.26USD 429,052 CME Group Inc 68,271 0.23USD 439,753 Discover Financial Services 31,403 0.10USD 336,388 E*TRADE Financial Corp 20,120 0.07USD 405,413 Franklin Resources Inc 13,914 0.05USD 730,105 Intercontinental Exchange Inc 53,962 0.18USD 391,946 Jefferies Financial Group Inc 9,505 0.03USD 1,155,330 Mastercard Inc 228,755 0.76USD 147,421 Nasdaq Inc 13,474 0.04USD 162,114 Raymond James Financial Inc 14,848 0.05USD 892,468 Synchrony Financial 25,828 0.08USD 306,129 T Rowe Price Group Inc 36,454 0.12USD 2,250,681 Visa Inc^ 307,758 1.02
Electrical components & equipment USD 292,216 AMETEK Inc 22,734 0.08USD 793,953 Emerson Electric Co 57,387 0.19
Electricity USD 833,005 AES Corp 11,129 0.04USD 292,181 Alliant Energy Corp 12,555 0.04
Ccy Holding InvestmentFair value
$'000
% of netassetvalue
United States (31 July 2017: 95.04%) (cont) Electricity (cont)
USD 307,200 Ameren Corp 19,065 0.06USD 620,812 American Electric Power Co Inc 44,165 0.15USD 542,644 CenterPoint Energy Inc 15,455 0.05USD 355,391 CMS Energy Corp 17,180 0.06USD 391,555 Consolidated Edison Inc 30,905 0.10USD 821,857 Dominion Energy Inc^ 58,935 0.20USD 228,690 DTE Energy Co 24,822 0.08USD 883,305 Duke Energy Corp 72,095 0.24USD 410,541 Edison International 27,354 0.09USD 227,870 Entergy Corp^ 18,521 0.06USD 341,367 Evergy Inc 19,147 0.06USD 397,897 Eversource Energy 24,161 0.08USD 1,216,462 Exelon Corp 51,700 0.17USD 563,413 FirstEnergy Corp^ 19,962 0.07USD 594,061 NextEra Energy Inc 99,529 0.33USD 377,000 NRG Energy Inc^ 11,940 0.04USD 650,471 PG&E Corp 28,022 0.09USD 141,339 Pinnacle West Capital Corp 11,368 0.04USD 879,427 PPL Corp 25,301 0.08USD 636,572 Public Service Enterprise Group
Inc 32,822 0.11USD 179,735 Scana Corp 7,188 0.02USD 332,514 Sempra Energy^ 38,435 0.13USD 1,274,720 Southern Co 61,951 0.20USD 397,594 WEC Energy Group Inc^ 26,388 0.09USD 641,101 Xcel Energy Inc 30,042 0.10
Electronics USD 402,283 Agilent Technologies Inc 26,567 0.09USD 380,977 Amphenol Corp 35,625 0.12USD 1,044,767 Corning Inc^ 34,665 0.11USD 172,234 FLIR Systems Inc 10,093 0.03USD 385,302 Fortive Corp 31,626 0.10USD 941,165 Honeywell International Inc 150,257 0.50USD 31,983 Mettler-Toledo International Inc 18,950 0.06USD 139,749 PerkinElmer Inc^ 11,065 0.04USD 99,754 Waters Corp 19,679 0.07
Engineering & construction USD 176,829 Fluor Corp 9,063 0.03USD 150,709 Jacobs Engineering Group Inc 10,192 0.03
Environmental control USD 282,509 Republic Services Inc 20,476 0.07USD 107,192 Stericycle Inc^ 7,488 0.02USD 500,761 Waste Management Inc 45,069 0.15
Food USD 241,093 Campbell Soup Co^ 9,861 0.03USD 501,107 Conagra Brands Inc 18,396 0.06USD 747,118 General Mills Inc 34,412 0.11USD 175,255 Hershey Co 17,212 0.06USD 338,013 Hormel Foods Corp^ 12,158 0.04

iSHARES VII PLC
Schedule of Investments (continued) iSHARES CORE S&P 500 UCITS ETF (continued) As at 31 July 2018
[ 1 4 8 ] i S H A R E S V I I P L C A N N U A L R E P O R T
Ccy Holding Investment Fair value
$'000
% of netassetvalue
Equities (31 July 2017: 99.60%) (cont) United States (31 July 2017: 95.04%) (cont) Food (cont)
USD 143,368 JM Smucker Co^ 15,931 0.05USD 314,689 Kellogg Co^ 22,352 0.07USD 752,778 Kraft Heinz Co^ 45,355 0.15USD 1,023,104 Kroger Co 29,670 0.10USD 152,942 McCormick & Co Inc^ 17,977 0.06USD 1,858,725 Mondelez International Inc 80,631 0.27USD 603,968 Sysco Corp 40,593 0.14USD 374,042 Tyson Foods Inc^ 21,564 0.07
Forest products & paper USD 520,981 International Paper Co 27,992 0.09
Gas USD 423,379 NiSource Inc^ 11,084 0.04
Hand & machine tools USD 71,305 Snap-on Inc^ 12,093 0.04USD 193,819 Stanley Black & Decker Inc 28,970 0.10
Healthcare products USD 2,209,151 Abbott Laboratories 144,788 0.48USD 53,239 ABIOMED Inc 18,875 0.06USD 90,916 Align Technology Inc 32,425 0.11USD 621,760 Baxter International Inc 45,046 0.15USD 336,299 Becton Dickinson and Co 84,199 0.28USD 1,735,993 Boston Scientific Corp 58,347 0.19USD 61,771 Cooper Cos Inc^ 16,091 0.05USD 774,643 Danaher Corp 79,463 0.26USD 286,476 Dentsply Sirona Inc 13,782 0.05USD 266,396 Edwards Lifesciences Corp 37,948 0.13USD 192,607 Henry Schein Inc^ 15,295 0.05USD 342,917 Hologic Inc^ 14,714 0.05USD 110,272 IDEXX Laboratories Inc 27,009 0.09USD 142,968 Intuitive Surgical Inc 72,655 0.24USD 179,532 ResMed Inc 18,991 0.06USD 404,986 Stryker Corp 66,114 0.22USD 506,390 Thermo Fisher Scientific Inc 118,764 0.39USD 116,126 Varian Medical Systems Inc 13,407 0.05USD 256,132 Zimmer Biomet Holdings Inc 32,150 0.11
Healthcare services USD 412,146 Aetna Inc 77,644 0.26USD 321,513 Anthem Inc 81,343 0.27USD 258,561 Centene Corp 33,698 0.11USD 306,631 Cigna Corp 55,016 0.18USD 175,631 DaVita Inc 12,343 0.04USD 150,719 Envision Healthcare Corp 6,671 0.02USD 351,047 HCA Healthcare Inc 43,611 0.15USD 173,189 Humana Inc 54,412 0.18USD 205,043 IQVIA Holdings Inc 25,003 0.08USD 129,358 Laboratory Corp of America
Holdings 22,682 0.08USD 170,933 Quest Diagnostics Inc 18,413 0.06USD 1,210,877 UnitedHealth Group Inc 306,618 1.02
Ccy Holding InvestmentFair value
$'000
% of netassetvalue
United States (31 July 2017: 95.04%) (cont) Healthcare services (cont)
USD 109,815 Universal Health Services Inc 13,408 0.04Home builders
USD 430,866 DR Horton Inc 18,829 0.06USD 344,295 Lennar Corp 17,996 0.06USD 336,546 PulteGroup Inc^ 9,588 0.03
Home furnishings USD 163,941 Leggett & Platt Inc^ 7,143 0.02USD 81,283 Whirlpool Corp^ 10,656 0.04
Hotels USD 353,528 Hilton Worldwide Holdings Inc 27,808 0.09USD 374,435 Marriott International Inc 47,868 0.16USD 634,128 MGM Resorts International 19,893 0.07USD 107,550 Wynn Resorts Ltd 17,937 0.06
Household goods & home construction USD 110,792 Avery Dennison Corp 12,706 0.04USD 308,025 Church & Dwight Co Inc^ 17,219 0.06USD 163,095 Clorox Co^ 22,045 0.07USD 440,789 Kimberly-Clark Corp 50,188 0.17
Household products USD 607,994 Newell Brands Inc^ 15,923 0.05
Insurance USD 977,473 Aflac Inc 45,492 0.15USD 443,891 Allstate Corp 42,223 0.14USD 1,131,175 American International Group Inc 62,452 0.21USD 228,511 Arthur J Gallagher & Co 16,304 0.05USD 65,729 Assurant Inc 7,250 0.02USD 2,425,296 Berkshire Hathaway Inc 479,893 1.59USD 151,033 Brighthouse Financial Inc 6,559 0.02USD 187,764 Cincinnati Financial Corp 14,201 0.05USD 451,705 Hartford Financial Services
Group Inc 23,805 0.08USD 276,296 Lincoln National Corp 18,816 0.06USD 329,761 Loews Corp 16,745 0.06USD 639,196 Marsh & McLennan Cos Inc 53,283 0.18USD 1,277,946 MetLife Inc 58,453 0.19USD 336,841 Principal Financial Group Inc 19,564 0.06USD 732,139 Progressive Corp 43,936 0.15USD 528,351 Prudential Financial Inc 53,316 0.18USD 134,006 Torchmark Corp 11,802 0.04USD 340,537 Travelers Cos Inc 44,318 0.15USD 280,123 Unum Group 11,129 0.04
Internet USD 376,311 Alphabet Inc 461,816 1.53USD 382,558 Alphabet Inc Class 'C' 465,673 1.54USD 507,476 Amazon.com Inc 902,008 2.99USD 60,717 Booking Holdings Inc 123,178 0.41USD 1,163,835 eBay Inc 38,930 0.13USD 153,726 Expedia Group Inc 20,575 0.07USD 76,601 F5 Networks Inc 13,128 0.04USD 3,022,404 Facebook Inc 521,607 1.73

iSHARES VII PLC
Schedule of Investments (continued) iSHARES CORE S&P 500 UCITS ETF (continued) As at 31 July 2018
i S H A R E S V I I P L C A N N U A L R E P O R T [ 1 4 9 ]
Ccy Holding Investment Fair value
$'000
% of netassetvalue
Equities (31 July 2017: 99.60%) (cont) United States (31 July 2017: 95.04%) (cont) Internet (cont)
USD 547,735 Netflix Inc 184,833 0.61USD 780,828 Symantec Corp 15,788 0.05USD 137,037 TripAdvisor Inc^ 7,947 0.03USD 824,539 Twitter Inc 26,278 0.09USD 121,739 VeriSign Inc 17,680 0.06
Iron & steel USD 399,436 Nucor Corp^ 26,734 0.09
Leisure time USD 212,752 Harley-Davidson Inc 9,125 0.03
Machinery - diversified USD 194,540 Cummins Inc 27,782 0.09USD 408,642 Deere & Co 59,167 0.20USD 162,618 Flowserve Corp^ 7,209 0.02USD 159,641 Rockwell Automation Inc 29,942 0.10USD 130,452 Roper Technologies Inc 39,384 0.13USD 226,725 Xylem Inc 17,358 0.06
Machinery, construction & mining USD 753,414 Caterpillar Inc 108,341 0.36
Marine transportation USD 55,894 Huntington Ingalls Industries Inc 13,026 0.04
Media USD 430,072 CBS Corp^ 22,652 0.07USD 233,397 Charter Communications Inc 71,088 0.24USD 5,786,503 Comcast Corp 207,041 0.69USD 195,983 Discovery Inc^ 5,209 0.02USD 430,512 Discovery Inc Class 'C' 10,569 0.03USD 289,013 DISH Network Corp 9,121 0.03USD 471,457 News Corp 7,105 0.02USD 149,747 News Corp Class 'B' 2,291 0.01USD 1,327,084 Twenty-First Century Fox Inc 59,719 0.20USD 552,141 Twenty-First Century Fox Inc
Class 'B' 24,526 0.08USD 445,399 Viacom Inc 12,939 0.04USD 1,873,428 Walt Disney Co^ 212,747 0.71
Mining USD 1,696,034 Freeport-McMoRan Inc 27,984 0.10USD 671,636 Newmont Mining Corp 24,636 0.08
Miscellaneous manufacturers USD 748,116 3M Co 158,840 0.53USD 180,834 AO Smith Corp 10,765 0.04USD 193,337 Dover Corp 16,043 0.05USD 10,944,248 General Electric Co 149,170 0.50USD 384,223 Illinois Tool Works Inc 55,071 0.18USD 167,373 Parker-Hannifin Corp 28,295 0.09USD 322,532 Textron Inc 22,019 0.07
Office & business equipment USD 269,627 Xerox Corp 7,002 0.02
Oil & gas
USD 648,742 Anadarko Petroleum Corp 47,456 0.16
Ccy Holding InvestmentFair value
$'000
% of netassetvalue
United States (31 July 2017: 95.04%) (cont) Oil & gas (cont)
USD 174,926 Andeavor 26,249 0.09USD 481,493 Apache Corp^ 22,149 0.07USD 567,473 Cabot Oil & Gas Corp^ 13,336 0.04USD 2,407,948 Chevron Corp 304,052 1.01USD 120,859 Cimarex Energy Co^ 11,917 0.04USD 239,447 Concho Resources Inc 34,923 0.12USD 1,474,353 ConocoPhillips 106,404 0.35USD 658,041 Devon Energy Corp 29,619 0.10USD 729,387 EOG Resources Inc 94,047 0.31USD 317,822 EQT Corp 15,789 0.05USD 5,334,908 Exxon Mobil Corp 434,848 1.44USD 135,722 Helmerich & Payne Inc^ 8,327 0.03USD 329,743 Hess Corp^ 21,641 0.07USD 221,369 HollyFrontier Corp 16,510 0.05USD 1,073,123 Marathon Oil Corp 22,664 0.08USD 582,004 Marathon Petroleum Corp 47,043 0.16USD 251,720 Newfield Exploration Co 7,229 0.02USD 616,407 Noble Energy Inc^ 22,246 0.07USD 964,938 Occidental Petroleum Corp 80,987 0.27USD 528,848 Phillips 66 65,228 0.22USD 214,767 Pioneer Natural Resources Co 40,649 0.14USD 542,771 Valero Energy Corp 64,237 0.21
Oil & gas services USD 531,995 Baker Hughes a GE Co^ 18,396 0.06USD 1,103,833 Halliburton Co 46,825 0.15USD 481,332 National Oilwell Varco Inc^ 23,402 0.08
Packaging & containers USD 440,080 Ball Corp 17,150 0.06USD 119,531 Packaging Corp of America 13,495 0.04USD 207,691 Sealed Air Corp^ 9,153 0.03USD 323,046 WestRock Co 18,730 0.06
Pharmaceuticals USD 1,909,616 AbbVie Inc 176,124 0.58USD 204,138 AmerisourceBergen Corp 16,705 0.06USD 2,059,638 Bristol-Myers Squibb Co 121,004 0.40USD 392,555 Cardinal Health Inc^ 19,608 0.06USD 1,281,044 CVS Health Corp 83,088 0.28USD 1,202,793 Eli Lilly & Co 118,848 0.39USD 706,507 Express Scripts Holding Co 56,139 0.19USD 3,379,690 Johnson & Johnson 447,877 1.49USD 254,614 McKesson Corp 31,979 0.11USD 3,389,946 Merck & Co Inc 223,296 0.74USD 200,733 Nektar Therapeutics 10,559 0.03USD 7,370,875 Pfizer Inc 294,319 0.98USD 609,692 Zoetis Inc 52,726 0.17
Pipelines USD 2,390,743 Kinder Morgan Inc 42,508 0.14USD 517,225 ONEOK Inc 36,433 0.12USD 1,041,441 Williams Cos Inc 30,983 0.11

iSHARES VII PLC
Schedule of Investments (continued) iSHARES CORE S&P 500 UCITS ETF (continued) As at 31 July 2018
[ 1 5 0 ] i S H A R E S V I I P L C A N N U A L R E P O R T
Ccy Holding Investment Fair value
$'000
% of netassetvalue
Equities (31 July 2017: 99.60%) (cont) United States (31 July 2017: 95.04%) (cont) Real estate investment & services
USD 379,958 CBRE Group Inc 18,922 0.06Real estate investment trusts
USD 130,257 Alexandria Real Estate Equities Inc 16,600 0.05
USD 556,514 American Tower Corp^ 82,498 0.27USD 197,636 Apartment Investment &
Management Co 8,429 0.03USD 173,832 AvalonBay Communities Inc 30,742 0.10USD 193,884 Boston Properties Inc 24,338 0.08USD 522,680 Crown Castle International Corp 57,929 0.19USD 259,524 Digital Realty Trust Inc 31,511 0.10USD 447,701 Duke Realty Corp 13,037 0.04USD 100,139 Equinix Inc 43,989 0.14USD 464,146 Equity Residential 30,369 0.10USD 83,230 Essex Property Trust Inc 20,013 0.07USD 158,885 Extra Space Storage Inc 14,930 0.05USD 92,719 Federal Realty Investment Trust 11,636 0.04USD 797,082 GGP Inc 16,994 0.06USD 590,133 HCP Inc 15,285 0.05USD 931,914 Host Hotels & Resorts Inc 19,514 0.06USD 354,057 Iron Mountain Inc 12,431 0.04USD 529,743 Kimco Realty Corp 8,841 0.03USD 137,171 Macerich Co 8,101 0.03USD 143,640 Mid-America Apartment
Communities Inc 14,476 0.05USD 671,233 Prologis Inc 44,046 0.15USD 188,816 Public Storage 41,130 0.14USD 357,647 Realty Income Corp 19,946 0.07USD 185,712 Regency Centers Corp 11,817 0.04USD 146,274 SBA Communications Corp 23,148 0.08USD 390,206 Simon Property Group Inc 68,758 0.23USD 112,178 SL Green Realty Corp 11,567 0.04USD 336,906 UDR Inc 12,964 0.04USD 449,417 Ventas Inc 25,338 0.08USD 217,026 Vornado Realty Trust 15,609 0.05USD 468,843 Welltower Inc 29,350 0.10USD 951,178 Weyerhaeuser Co 32,511 0.11
Retail USD 94,337 Advance Auto Parts Inc 13,323 0.04USD 33,617 AutoZone Inc 23,718 0.08USD 309,159 Best Buy Co Inc 23,196 0.08USD 223,293 CarMax Inc^ 16,676 0.06USD 30,819 Chipotle Mexican Grill Inc 13,365 0.04USD 254,399 Copart Inc 14,600 0.05USD 552,654 Costco Wholesale Corp 120,871 0.40USD 155,100 Darden Restaurants Inc 16,586 0.05USD 320,229 Dollar General Corp 31,430 0.10USD 299,885 Dollar Tree Inc 27,374 0.09USD 149,023 Foot Locker Inc 7,274 0.02
Ccy Holding InvestmentFair value
$'000
% of netassetvalue
United States (31 July 2017: 95.04%) (cont) Retail (cont)
USD 272,141 Gap Inc^ 8,210 0.03USD 184,453 Genuine Parts Co 17,949 0.06USD 1,453,519 Home Depot Inc 287,099 0.95USD 211,096 Kohl's Corp 15,594 0.05USD 307,924 L Brands Inc^ 9,752 0.03USD 1,036,295 Lowe's Cos Inc 102,946 0.34USD 386,075 Macy's Inc 15,339 0.05USD 988,611 McDonald's Corp 155,746 0.52USD 148,181 Nordstrom Inc^ 7,766 0.03USD 104,131 O'Reilly Automotive Inc 31,864 0.11USD 479,398 Ross Stores Inc 41,914 0.14USD 1,738,887 Starbucks Corp 91,100 0.30USD 361,915 Tapestry Inc 17,053 0.06USD 671,088 Target Corp 54,143 0.18USD 128,412 Tiffany & Co 17,664 0.06USD 790,148 TJX Cos Inc 76,850 0.25USD 154,599 Tractor Supply Co 12,065 0.04USD 72,022 Ulta Salon Cosmetics &
Fragrance Inc 17,601 0.06USD 1,074,650 Walgreens Boots Alliance Inc 72,668 0.24USD 1,822,949 Walmart Inc 162,662 0.54USD 405,750 Yum! Brands Inc 32,172 0.11
Savings & loans USD 432,968 People's United Financial Inc^ 7,893 0.03
Semiconductors USD 1,036,909 Advanced Micro Devices Inc^ 19,007 0.06USD 467,447 Analog Devices Inc^ 44,940 0.15USD 1,270,214 Applied Materials Inc 61,771 0.20USD 505,889 Broadcom Inc 112,191 0.37USD 5,871,921 Intel Corp 282,440 0.94USD 47,375 IPG Photonics Corp 7,771 0.03USD 196,435 KLA-Tencor Corp 23,065 0.08USD 206,716 Lam Research Corp 39,408 0.13USD 296,473 Microchip Technology Inc^ 27,700 0.09USD 1,461,396 Micron Technology Inc^ 77,147 0.26USD 764,842 NVIDIA Corp^ 187,279 0.62USD 158,422 Qorvo Inc^ 12,953 0.04USD 1,868,235 Qualcomm Inc 119,735 0.40USD 229,427 Skyworks Solutions Inc 21,699 0.07USD 1,233,526 Texas Instruments Inc 137,316 0.45USD 318,792 Xilinx Inc 22,975 0.08
Software USD 959,148 Activision Blizzard Inc 70,421 0.23USD 620,565 Adobe Systems Inc 151,840 0.50USD 214,076 Akamai Technologies Inc 16,111 0.05USD 106,739 Ansys Inc 18,026 0.06USD 276,804 Autodesk Inc 35,553 0.12USD 148,768 Broadridge Financial Solutions
Inc 16,808 0.06USD 392,456 CA Inc 17,350 0.06

iSHARES VII PLC
Schedule of Investments (continued) iSHARES CORE S&P 500 UCITS ETF (continued) As at 31 July 2018
i S H A R E S V I I P L C A N N U A L R E P O R T [ 1 5 1 ]
Ccy Holding Investment Fair value
$'000
% of netassetvalue
Equities (31 July 2017: 99.60%) (cont) United States (31 July 2017: 95.04%) (cont) Software (cont)
USD 353,658 Cadence Design Systems Inc 15,593 0.05USD 395,915 Cerner Corp 24,578 0.08USD 162,177 Citrix Systems Inc 17,835 0.06USD 386,650 Electronic Arts Inc 49,781 0.17USD 417,125 Fidelity National Information
Services Inc 43,018 0.14USD 517,528 Fiserv Inc 39,063 0.13USD 307,279 Intuit Inc 62,759 0.21USD 9,681,333 Microsoft Corp 1,026,996 3.41USD 113,104 MSCI Inc 18,797 0.06USD 3,755,107 Oracle Corp 179,043 0.59USD 401,456 Paychex Inc 27,708 0.09USD 223,894 Red Hat Inc^ 31,621 0.11USD 888,745 Salesforce.com Inc 121,891 0.40USD 187,788 Synopsys Inc 16,794 0.06USD 144,383 Take-Two Interactive Software
Inc 16,318 0.05Telecommunications
USD 9,150,211 AT&T Inc 292,532 0.97USD 1,235,072 CenturyLink Inc^ 23,182 0.08USD 5,925,962 Cisco Systems Inc 250,609 0.83USD 440,679 Juniper Networks Inc 11,608 0.04
Ccy Holding InvestmentFair value
$'000
% of netassetvalue
United States (31 July 2017: 95.04%) (cont) Telecommunications (cont)
USD 203,496 Motorola Solutions Inc 24,684 0.08USD 5,206,466 Verizon Communications Inc 268,862 0.89
Textile USD 79,894 Mohawk Industries Inc 15,049 0.05
Toys USD 143,522 Hasbro Inc^ 14,296 0.05USD 426,486 Mattel Inc^ 6,769 0.02
Transportation USD 174,695 CH Robinson Worldwide Inc 16,112 0.05USD 1,103,005 CSX Corp 77,960 0.26USD 220,316 Expeditors International of
Washington Inc 16,782 0.06USD 309,837 FedEx Corp 76,180 0.25USD 108,726 JB Hunt Transport Services Inc 13,036 0.04USD 129,346 Kansas City Southern 15,039 0.05USD 356,039 Norfolk Southern Corp 60,171 0.20USD 976,690 Union Pacific Corp 146,396 0.48USD 868,896 United Parcel Service Inc 104,172 0.35
Water USD 224,361 American Water Works Co Inc 19,800 0.07
Total United States 28,933,546 95.95Total equities 30,063,941 99.70
Currency Amount
Purchased Currency Amount
SoldUnderlying
Exposure ($)Maturity
date
Unrealisedgain/(loss)
$'000
% of netassetvalue
Financial derivative instruments (31 July 2017: 0.01%) Forward currency contracts** (31 July 2017: Nil)
GBP 10,000 USD 13,114 13,118 02/08/2018 - 0.00GBP 356,992,895 USD 471,536,070 468,285,668 02/08/2018 (3,250) (0.01)
Total unrealised losses on forward currency contracts (3,250) (0.01)
CcyNo. of
contracts
Underlying exposure
$'000 Fair value
$'000
% of netassetsvalue
Financial derivative instruments (31 July 2017: 0.01%) Futures contracts (31 July 2017: 0.01%)
USD 657 S&P 500 E Mini Index Futures September 2018 90,783 1,759 0.01Total unrealised gains on futures contracts 1,759 0.01Total financial derivative instruments (1,491) 0.00

iSHARES VII PLC
Schedule of Investments (continued) iSHARES CORE S&P 500 UCITS ETF (continued) As at 31 July 2018
[ 1 5 2 ] i S H A R E S V I I P L C A N N U A L R E P O R T
Fair value
$'000
% of net assetvalue
Total value of investments 30,062,450 99.70 Cash† 99,257 0.32 Other net liabilities (6,959) (0.02) Net asset value attributable to redeemable participating shareholders at the end of the financial year 30,154,748 100.00
† Cash holdings of $97,053,063 are due with State Street Bank and Trust Company. $2,204,018 is due as security for futures contracts with Credit Suisse AG ^ These securities are partially or fully transferred as securities lent. * Investment in related party. ** The counterparty for forward currency contracts is State Street Bank and Trust Company. All forward currency contracts relate to the GBP Hedged (Dist) Class.
Equities are primarily classified by country of incorporation of the entity in which the Fund holds shares. Underlying exposure has been calculated according to the guidelines issued by the ESMA and represents the market value of an equivalent position in the assets underlying each financial derivative instrument.
Analysis of total current assets gross of all liabilities
Fair value$'000
% of totalcurrentassets
Transferable securities admitted to an official stock exchange listing 30,063,941 99.51Exchange traded financial derivative instruments 1,759 0.01Other assets 144,866 0.48Total current assets 30,210,566 100.00

iSHARES VII PLC
Schedule of Investments (continued) iSHARES DOW JONES INDUSTRIAL AVERAGE UCITS ETF As at 31 July 2018
i S H A R E S V I I P L C A N N U A L R E P O R T [ 1 5 3 ]
Ccy Holding Investment Fair value
$'000
% of netassetvalue
Transferable Securities Admitted to an Official Stock Exchange Listing or traded on a Regulated Market (31 July 2017: 98.00%)
Equities (31 July 2017: 98.00%) United States (31 July 2017: 98.00%) Aerospace & defence
USD 97,300 Boeing Co 34,668 9.47USD 97,300 United Technologies Corp 13,207 3.61
Apparel retailers USD 97,300 Nike Inc 7,483 2.05
Banks USD 97,300 Goldman Sachs Group Inc 23,102 6.31USD 97,300 JPMorgan Chase & Co 11,185 3.06
Beverages USD 97,300 Coca-Cola Co 4,537 1.24
Chemicals USD 97,300 DowDuPont Inc 6,691 1.83
Computers USD 97,300 Apple Inc 18,515 5.06USD 97,300 International Business Machines
Corp 14,102 3.85Cosmetics & personal care
USD 97,300 Procter & Gamble Co 7,870 2.15Diversified financial services
USD 97,300 American Express Co 9,683 2.65USD 97,300 Visa Inc 13,305 3.63
Healthcare services USD 97,300 UnitedHealth Group Inc 24,638 6.73
Insurance USD 97,300 Travelers Cos Inc 12,663 3.46
Machinery, construction & mining USD 97,300 Caterpillar Inc 13,992 3.82
Media USD 97,300 Walt Disney Co 11,049 3.02
Miscellaneous manufacturers USD 97,300 3M Co 20,659 5.65
Oil & gas USD 97,300 Chevron Corp 12,286 3.36USD 97,300 Exxon Mobil Corp 7,931 2.16
Pharmaceuticals USD 97,300 Johnson & Johnson 12,895 3.53USD 97,300 Merck & Co Inc 6,409 1.75USD 97,300 Pfizer Inc 3,885 1.06
Retail USD 97,300 Home Depot Inc 19,219 5.25USD 97,300 McDonald's Corp 15,329 4.19USD 97,300 Walgreens Boots Alliance Inc 6,579 1.80USD 97,300 Walmart Inc 8,682 2.37
Semiconductors USD 97,300 Intel Corp 4,680 1.28
Ccy Holding InvestmentFair value
$'000
% of netassetvalue
United States (31 July 2017: 98.00%) (cont) Software
USD 97,300 Microsoft Corp 10,322 2.82Telecommunications
USD 97,300 Cisco Systems Inc 4,115 1.13USD 97,300 Verizon Communications Inc 5,024 1.37
Total United States 364,705 99.66Total equities 364,705 99.66
CcyNo. of
contracts
Underlying exposure
$'000 Fair value
$'000
% of netassetsvalue
Financial derivative instruments (31 July 2017: 0.06%) Futures contracts (31 July 2017: 0.06%)
USD 9 DJIA Mini E-Cbot Index Futures September 2018 1,126 17 0.00Total unrealised gains on futures contracts 17 0.00Total financial derivative instruments 17 0.00
Fair value$'000
% of net assetvalue
Total value of investments 364,722 99.66 Cash† 1,135 0.31 Other net assets 107 0.03 Net asset value attributable to redeemable participating shareholders at the end of the financial year 365,964 100.00
† Cash holdings of $1,103,523 are held with State Street Bank and Trust Company. $31,365 is held as security for futures contracts with Credit Suisse AG.
Equities are primarily classified by country of incorporation of the entity in which the Fund holds shares. Underlying exposure has been calculated according to the guidelines issued by the ESMA and represents the market value of an equivalent position in the assets underlying each financial derivative instrument.
Analysis of total current assets gross of all liabilities
Fair value$'000
% of totalcurrentassets
Transferable securities admitted to an official stock exchange listing 364,705 99.63Exchange traded financial derivative instruments 17 0.00Other assets 1,342 0.37Total current assets 366,064 100.00

iSHARES VII PLC
Schedule of Investments (continued) iSHARES FTSE 100 UCITS ETF As at 31 July 2018
[ 1 5 4 ] i S H A R E S V I I P L C A N N U A L R E P O R T
Ccy Holding Investment Fair value
£'000
% of netassetvalue
Transferable Securities Admitted to an Official Stock Exchange Listing or traded on a Regulated Market (31 July 2017: 99.49%)
Equities (31 July 2017: 99.49%) Germany (31 July 2017: 0.27%) Leisure time
GBP 99,650 TUI AG 1,625 0.35Total Germany 1,625 0.35
Ireland (31 July 2017: 2.09%) Building materials and fixtures
GBP 194,289 CRH Plc 5,077 1.08Entertainment
GBP 19,200 Paddy Power Betfair Plc 1,591 0.34Forest products & paper
GBP 55,119 Smurfit Kappa Group Plc 1,725 0.37Oil & gas
GBP 20,691 DCC Plc 1,459 0.31Total Ireland 9,852 2.10
Isle of Man (31 July 2017: Nil) Entertainment
GBP 126,661 GVC Holdings Plc 1,482 0.32Total Isle of Man 1,482 0.32
Jersey (31 July 2017: 6.74%) Advertising
GBP 283,677 WPP Plc^ 3,381 0.72Biotechnology
GBP 206,748 Shire Plc 8,996 1.92Commercial services
GBP 211,331 Experian Plc 3,960 0.84Distribution & wholesale
GBP 54,586 Ferguson Plc 3,281 0.70Mining
GBP 2,694,296 Glencore Plc 9,012 1.93GBP 21,762 Randgold Resources Ltd 1,234 0.26
Total Jersey 29,864 6.37
Spain (31 July 2017: 0.51%) Airlines
GBP 378,688 International Consolidated Airlines Group SA^ 2,689 0.57Total Spain 2,689 0.57
Switzerland (31 July 2017: 0.23%) Beverages
GBP 45,570 Coca-Cola HBC AG 1,246 0.27Total Switzerland 1,246 0.27
Ccy Holding InvestmentFair value
£'000
% of netassetvalue
United Kingdom (31 July 2017: 89.65%) Aerospace & defence
GBP 735,286 BAE Systems Plc 4,803 1.03GBP 382,781 Rolls-Royce Holdings Plc 3,793 0.81
Agriculture GBP 526,575 British American Tobacco Plc 22,121 4.72GBP 218,788 Imperial Brands Plc 6,393 1.37
Airlines GBP 57,866 easyJet Plc 937 0.20
Apparel retailers GBP 96,000 Burberry Group Plc 2,023 0.43
Banks GBP 3,933,422 Barclays Plc 7,629 1.63GBP 4,635,076 HSBC Holdings Plc 33,859 7.23GBP 16,544,047 Lloyds Banking Group Plc 10,320 2.20GBP 1,040,814 Royal Bank of Scotland Group
Plc 2,658 0.57GBP 622,282 Standard Chartered Plc 4,282 0.91
Beverages GBP 557,325 Diageo Plc 15,616 3.33
Chemicals GBP 29,066 Croda International Plc 1,494 0.32GBP 43,529 Johnson Matthey Plc^ 1,637 0.35
Commercial services GBP 112,566 Ashtead Group Plc 2,635 0.56GBP 36,980 Intertek Group Plc 2,175 0.47GBP 239,506 Relx Plc 3,982 0.85GBP 427,968 Rentokil Initial Plc 1,452 0.31
Cosmetics & personal care GBP 264,204 Unilever Plc 11,506 2.46
Distribution & wholesale GBP 76,884 Bunzl Plc 1,742 0.37
Diversified financial services GBP 218,504 3i Group Plc 2,070 0.44GBP 60,541 Hargreaves Lansdown Plc 1,257 0.27GBP 71,671 London Stock Exchange Group
Plc 3,151 0.67GBP 25,590 Schroders Plc 797 0.17GBP 121,303 St James's Place Plc 1,462 0.31GBP 627,475 Standard Life Aberdeen Plc 1,960 0.42
Electricity GBP 233,905 SSE Plc 2,924 0.62
Electronics GBP 87,354 Halma Plc 1,229 0.26
Equity investment instruments GBP 326,869 Scottish Mortgage Investment
Trust Plc 1,747 0.37Food
GBP 80,829 Associated British Foods Plc 1,984 0.42GBP 369,148 J Sainsbury Plc^ 1,207 0.26GBP 126,592 Ocado Group Pl^c 1,400 0.30

iSHARES VII PLC
Schedule of Investments (continued) iSHARES FTSE 100 UCITS ETF (continued) As at 31 July 2018
i S H A R E S V I I P L C A N N U A L R E P O R T [ 1 5 5 ]
Ccy Holding Investment Fair value
£'000
% of netassetvalue
Equities (31 July 2017: 99.49%) (cont) United Kingdom (31 July 2017: 89.65%) (cont) Food (cont)
GBP 2,228,793 Tesco Plc 5,802 1.24GBP 503,227 Wm Morrison Supermarkets Plc^ 1,315 0.28
Food Service GBP 364,386 Compass Group Plc 5,974 1.28
Forest products & paper GBP 83,990 Mondi Plc 1,761 0.38
Gas GBP 1,296,816 Centrica Plc 1,929 0.41GBP 772,846 National Grid Plc 6,286 1.34
Healthcare products GBP 202,419 Smith & Nephew Plc 2,673 0.57
Healthcare services GBP 19,825 NMC Health Plc^ 753 0.16
Home builders GBP 233,497 Barratt Developments Plc 1,247 0.27GBP 29,087 Berkeley Group Holdings Plc 1,086 0.23GBP 71,695 Persimmon Plc 1,779 0.38GBP 744,274 Taylor Wimpey Plc 1,302 0.28
Hotels GBP 43,991 InterContinental Hotels Group Plc 2,070 0.44GBP 41,986 Whitbread Plc^ 1,644 0.35
Household goods & home construction GBP 144,363 Reckitt Benckiser Group Plc 9,812 2.10
Insurance GBP 47,354 Admiral Group Plc 938 0.20GBP 923,498 Aviva Plc 4,617 0.98GBP 315,415 Direct Line Insurance Group Plc 1,085 0.23GBP 1,368,212 Legal & General Group Plc 3,594 0.77GBP 597,671 Prudential Plc 10,788 2.30GBP 236,997 RSA Insurance Group Plc 1,527 0.33
Internet GBP 132,474 Just Eat Plc^ 1,051 0.22GBP 20,704 Rightmove Plc 1,008 0.22
Investment services GBP 1,006,093 Melrose Industries Plc 2,172 0.46
Iron & steel GBP 117,463 Evraz Plc 654 0.14
Leisure time GBP 39,977 Carnival Plc 1,769 0.38
Media GBP 286,390 Informa Plc 2,261 0.48GBP 853,873 ITV Plc^ 1,408 0.30GBP 179,557 Pearson Plc^ 1,660 0.36GBP 238,874 Sky Plc 3,639 0.78
Mining GBP 228,155 Anglo American Plc^ 3,953 0.84GBP 79,326 Antofagasta Plc 796 0.17GBP 479,548 BHP Billiton Plc 8,414 1.80
Ccy Holding InvestmentFair value
£'000
% of netassetvalue
United Kingdom (31 July 2017: 89.65%) (cont) Mining (cont)
GBP 41,953 Fresnillo Plc 436 0.09GBP 265,524 Rio Tinto Plc 11,143 2.38
Miscellaneous manufacturers GBP 90,673 Smiths Group Plc 1,464 0.31
Oil & gas GBP 4,505,097 BP Plc 25,828 5.52GBP 1,061,074 Royal Dutch Shell Plc 27,747 5.92GBP 864,503 Royal Dutch Shell Plc (Class 'B) 23,095 4.93
Packaging & containers GBP 291,532 DS Smith Plc 1,469 0.31
Pharmaceuticals GBP 292,180 AstraZeneca Plc 17,136 3.66GBP 1,124,299 GlaxoSmithKline Plc 17,782 3.79
Real estate investment trusts GBP 225,255 British Land Co Plc 1,487 0.32GBP 163,284 Land Securities Group Plc 1,540 0.33GBP 234,025 Segro Plc 1,556 0.33
Retail GBP 500,827 Kingfisher Plc^ 1,486 0.32GBP 372,450 Marks & Spencer Group Plc^ 1,147 0.24GBP 31,561 Next Plc^ 1,874 0.40
Software GBP 99,560 Micro Focus International Plc 1,245 0.27GBP 248,078 Sage Group Plc^ 1,543 0.33
Telecommunications GBP 1,933,582 BT Group Plc 4,515 0.96GBP 6,158,808 Vodafone Group Plc 11,455 2.45
Transportation GBP 210,023 Royal Mail Plc 985 0.21
Water GBP 54,108 Severn Trent Plc 1,047 0.22GBP 156,366 United Utilities Group Plc 1,124 0.24
Total United Kingdom 416,116 88.83Total equities 462,874 98.81
CcyNo. of
contracts
Underlying exposure
£'000 Fair value
£'000
% of netassetsvalue
Financial derivative instruments (31 July 2017: (0.01)%) Futures contracts (31 July 2017: (0.01)%)
GBP 71 FTSE 100 Index Futures September 2018 5,373 97 0.02Total unrealised gains on futures contracts 97 0.02Total financial derivative instruments 97 0.02

iSHARES VII PLC
Schedule of Investments (continued) iSHARES FTSE 100 UCITS ETF (continued) As at 31 July 2018
[ 1 5 6 ] i S H A R E S V I I P L C A N N U A L R E P O R T
Fair value
£'000
% of net assetvalue
Total value of investments 462,971 98.83 Cash† 4,042 0.86 Other net assets 1,433 0.31 Net asset value attributable to redeemable participating shareholders at the end of the financial year 468,446 100.00
† Cash holdings of £3,870,594 are held with State Street Bank and Trust Company £171,450 is held as security for futures contracts with Credit Suisse AG. ^ These securities are partially or fully transferred as securities lent
Equities are primarily classified by country of incorporation of the entity in which the Fund holds shares. Underlying exposure has been calculated according to the guidelines issued by the ESMA and represents the market value of an equivalent position in the assets underlying each financial derivative instrument.
Analysis of total current assets gross of all liabilities
Fair value£'000
% of totalcurrentassets
Transferable securities admitted to an official stock exchange listing 462,874 98.81Exchange traded financial derivative instruments 97 0.02Other assets 5,502 1.17Total current assets 468,473 100.00

iSHARES VII PLC
Schedule of Investments (continued) iSHARES FTSE MIB UCITS ETF EUR (Acc) As at 31 July 2018
i S H A R E S V I I P L C A N N U A L R E P O R T [ 1 5 7 ]
Ccy Holding Investment Fair value
€'000
% of netassetvalue
Transferable Securities Admitted to an Official Stock Exchange Listing or traded on a Regulated Market (31 July 2017: 99.63%)
Equities (31 July 2017: 99.63%) Italy (31 July 2017: 82.89%) Aerospace & defence
EUR 100,883 Leonardo SpA^ 1,034 1.07Apparel retailers
EUR 44,306 Moncler SpA 1,671 1.73Auto parts & equipment
EUR 43,180 Brembo SpA^ 506 0.52EUR 103,488 Pirelli & C SpA^ 773 0.80
Banks EUR 15,900 Banca Generali SpA^ 367 0.38EUR 67,918 Banca Mediolanum SpA^ 417 0.43EUR 425,426 Banco BPM SpA 1,157 1.20EUR 112,698 BPER Banca^ 539 0.56EUR 109,596 FinecoBank Banca Fineco SpA 1,101 1.14EUR 3,783,847 Intesa Sanpaolo SpA^ 9,967 10.30EUR 166,986 Mediobanca Banca di Credito
Finanziario SpA 1,483 1.53EUR 623,434 UniCredit SpA 9,454 9.77EUR 283,883 Unione di Banche Italiane SpA^ 1,006 1.04
Beverages EUR 158,147 Davide Campari-Milano SpA^ 1,140 1.18
Building materials and fixtures EUR 19,911 Buzzi Unicem SpA 375 0.39
Commercial services EUR 148,559 Atlantia SpA 3,769 3.89
Diversified financial services EUR 31,278 Azimut Holding SpA^ 449 0.46
Electrical components & equipment EUR 63,958 Prysmian SpA 1,404 1.45
Electricity EUR 431,754 A2A SpA 678 0.70EUR 2,171,486 Enel SpA 10,358 10.70EUR 394,917 Terna Rete Elettrica Nazionale
SpA^ 1,892 1.95Gas
EUR 137,939 Italgas SpA^ 679 0.70EUR 630,382 Snam SpA 2,317 2.39
Insurance EUR 362,236 Assicurazioni Generali SpA^ 5,506 5.69EUR 128,513 Poste Italiane SpA^ 1,024 1.06EUR 153,527 Unipol Gruppo SpA 546 0.56EUR 212,160 UnipolSai Assicurazioni SpA^ 414 0.43
Media EUR 87,261 Mediaset SpA^ 253 0.26
Oil & gas EUR 698,701 Eni SpA 11,504 11.88
Ccy Holding InvestmentFair value
€'000
% of netassetvalue
Italy (31 July 2017: 82.89%) (cont) Oil & gas services
EUR 157,509 Saipem SpA^ 704 0.73Pharmaceuticals
EUR 26,652 Recordati SpA 852 0.87Retail
EUR 43,479 Luxottica Group SpA 2,518 2.60EUR 12,184 Salvatore Ferragamo SpA^ 241 0.25
Telecommunications EUR 3,009,910 Telecom Italia SpA^ 1,985 2.05
Total Italy 78,083 80.66
Luxembourg (31 July 2017: 1.86%) Metal fabricate/ hardware
EUR 130,740 Tenaris SA 2,044 2.11Total Luxembourg 2,044 2.11
Netherlands (31 July 2017: 14.88%) Auto manufacturers
EUR 35,021 Ferrari NV 3,985 4.12EUR 307,334 Fiat Chrysler Automobiles NV^ 4,487 4.64
Investment services EUR 29,775 Exor NV 1,676 1.73
Machinery - diversified EUR 278,267 CNH Industrial NV^ 2,792 2.88
Semiconductors EUR 174,945 STMicroelectronics NV^ 3,258 3.37
Total Netherlands 16,198 16.74Total equities 96,325 99.51
CcyNo. of
contracts
Underlying exposure
€'000 Fair value
€'000
% of netassetsvalue
Financial derivative instruments (31 July 2017: 0.00%) Futures contracts (31 July 2017: 0.00%)
EUR 4 FTSE MIB Mini Index Futures September 2018 429 15 0.01Total unrealised gains on futures contracts 15 0.01Total financial derivative instruments 15 0.01

iSHARES VII PLC
Schedule of Investments (continued) iSHARES FTSE MIB UCITS ETF EUR (Acc) (continued) As at 31 July 2018
[ 1 5 8 ] i S H A R E S V I I P L C A N N U A L R E P O R T
Fair value
€'000
% of net assetvalue
Total value of investments 96,340 99.52 Cash† 482 0.50 Other net liabilities (21) (0.02) Net asset value attributable to redeemable participating shareholders at the end of the financial year 96,801 100.00
† Cash holdings of €447,441 are held with State Street Bank and Trust Company. €34,583 is held as security for futures contracts with Credit Suisse AG. ^ These securities are partially or fully transferred as securities lent.
Equities are primarily classified by country of incorporation of the entity in which the Fund holds shares. Underlying exposure has been calculated according to the guidelines issued by the ESMA and represents the market value of an equivalent position in the assets underlying each financial derivative instrument.
Analysis of total current assets gross of all liabilities
Fair value€'000
% of totalcurrentassets
Transferable securities admitted to an official stock exchange listing 96,325 99.48Exchange traded financial derivative instruments 15 0.02Other assets 487 0.50Total current assets 96,827 100.00

iSHARES VII PLC
Schedule of Investments (continued) iSHARES MSCI BRAZIL UCITS ETF USD (Acc) As at 31 July 2018
i S H A R E S V I I P L C A N N U A L R E P O R T [ 1 5 9 ]
Ccy Holding Investment Fair value
$'000
% of netassetvalue
Transferable Securities Admitted to an Official Stock Exchange Listing or traded on a Regulated Market (31 July 2017: 101.32%)
Equities (31 July 2017: 101.32%) Brazil (31 July 2017: 101.32%) Aerospace & defence
BRL 56,673 Embraer SA 290 1.03Banks
BRL 85,821 Banco Bradesco SA 637 2.26BRL 286,071 Banco Bradesco SA (Preference) 2,325 8.25BRL 73,190 Banco do Brasil SA 633 2.25BRL 35,006 Banco Santander Brasil SA 340 1.21BRL 275,057 Itau Unibanco Holding SA 3,295 11.70
Beverages BRL 401,469 Ambev SA 2,074 7.36
Chemicals BRL 14,644 Braskem SA 213 0.76
Commercial services BRL 103,026 CCR SA 289 1.03BRL 103,977 Cielo SA 397 1.41BRL 118,546 Kroton Educacional SA 356 1.26BRL 42,834 Localiza Rent a Car SA 271 0.96
Cosmetics & personal care BRL 16,448 Natura Cosmeticos SA 127 0.45
Diversified financial services BRL 175,319 B3 SA - Brasil Bolsa Balcao 1,110 3.94
Electricity BRL 18,866 Centrais Eletricas Brasileiras SA 87 0.31BRL 19,509 Centrais Eletricas Brasileiras SA
(Preference) 100 0.36BRL 74,407 Cia Energetica de Minas Gerais 163 0.58BRL 26,115 EDP - Energias do Brasil SA 95 0.33BRL 13,830 Engie Brasil Energia SA 138 0.49BRL 14,383 Equatorial Energia SA 234 0.83
Food BRL 45,092 BRF SA 272 0.96BRL 13,473 Cia Brasileira de Distribuicao 298 1.06BRL 81,645 JBS SA 196 0.70BRL 8,807 M Dias Branco SA 90 0.32
Forest products & paper BRL 21,200 Fibria Celulose SA 417 1.48BRL 59,996 Klabin SA 323 1.15BRL 37,789 Suzano Papel e Celulose SA 448 1.59
Holding companies - diversified operations BRL 378,888 Itausa - Investimentos Itau SA 1,051 3.73
Insurance BRL 59,516 BB Seguridade Participacoes SA 388 1.38BRL 9,298 IRB Brasil Resseguros 132 0.47BRL 22,744 Odontoprev SA 81 0.28BRL 8,258 Porto Seguro SA 109 0.39BRL 17,468 Sul America SA 103 0.36
Ccy Holding InvestmentFair value
$'000
% of netassetvalue
Brazil (31 July 2017: 101.32%) (cont) Iron & steel
BRL 53,653 Cia Siderurgica Nacional SA 131 0.47BRL 87,682 Gerdau SA 390 1.38BRL 270,121 Vale SA 3,943 14.00
Machinery - diversified BRL 71,556 WEG SA 353 1.25
Oil & gas BRL 13,844 Cosan SA 136 0.48BRL 29,757 Petrobras Distribuidora SA 154 0.55BRL 253,466 Petroleo Brasileiro SA 1,480 5.26BRL 333,879 Petroleo Brasileiro SA
(Preference) 1,753 6.22BRL 30,759 Ultrapar Participacoes SA 333 1.18
Pharmaceuticals BRL 29,538 Hypera SA 218 0.77
Real estate investment & services BRL 70,355 BR Malls Participacoes SA 187 0.66BRL 23,967 Multiplan Empreendimentos
Imobiliarios SA 128 0.46Retail
BRL 33,600 Atacadao Distribuicao Comercio e Industria Ltda 140 0.50
BRL 62,929 Lojas Americanas SA 304 1.08BRL 60,659 Lojas Renner SA 499 1.77BRL 6,491 Magazine Luiza SA 228 0.81BRL 19,778 Raia Drogasil SA 391 1.39
Telecommunications BRL 38,079 Telefonica Brasil SA 416 1.48BRL 72,584 Tim Participacoes SA 240 0.85
Transportation BRL 92,781 Rumo SA 367 1.30
Water BRL 29,007 Cia de Saneamento Basico do
Estado de Sao Paulo 194 0.68Total Brazil 29,067 103.18Total equities 29,067 103.18
CcyNo. of
contracts
Underlying exposure
$'000 Fair value
$'000
% of netassetsvalue
Financial derivative instruments (31 July 2017: 0.01%) Futures contracts (31 July 2017: 0.01%)
USD 2 Mini MSCI Emerging Markets Futures September 2018 114 (4) (0.01)Total unrealised losses on futures contracts (4) (0.01)Total financial derivative instruments (4) (0.01)

iSHARES VII PLC
Schedule of Investments (continued) iSHARES MSCI BRAZIL UCITS ETF USD (Acc) (continued) As at 31 July 2018
[ 1 6 0 ] i S H A R E S V I I P L C A N N U A L R E P O R T
Fair value
$'000
% of net assetvalue
Total value of investments 29,063 103.17 Cash† 80 0.28 Other net liabilities (974) (3.45) Net asset value attributable to redeemable participating shareholders at the end of the financial year 28,169 100.00
† Cash holdings of $69,439 are held with State Street Bank and Trust Company. $10,760 is held as security for futures contracts with Credit Suisse AG.
Equities are primarily classified by country of incorporation of the entity in which the Fund holds shares. Underlying exposure has been calculated according to the guidelines issued by the ESMA and represents the market value of an equivalent position in the assets underlying each financial derivative instrument.
Analysis of total current assets gross of all liabilities
Fair value$'000
% of totalcurrentassets
Transferable securities admitted to an official stock exchange listing 29,067 99.51Other assets 144 0.49Total current assets 29,211 100.00

iSHARES VII PLC
Schedule of Investments (continued) iSHARES MSCI CANADA UCITS ETF As at 31 July 2018
i S H A R E S V I I P L C A N N U A L R E P O R T [ 1 6 1 ]
Ccy Holding Investment Fair value
$'000
% of netassetvalue
Transferable Securities Admitted to an Official Stock Exchange Listing or traded on a Regulated Market (31 July 2017: 99.69%)
Equities (31 July 2017: 99.69%) Canada (31 July 2017: 99.69%) Aerospace & defence
CAD 1,431,049 Bombardier Inc 5,386 0.55CAD 181,683 CAE Inc 3,781 0.39
Apparel retailers CAD 149,699 Gildan Activewear Inc 3,853 0.40
Auto parts & equipment CAD 31,240 Linamar Corp 1,426 0.15CAD 232,348 Magna International Inc 14,141 1.45
Banks CAD 440,010 Bank of Montreal^ 34,846 3.58CAD 817,015 Bank of Nova Scotia 48,375 4.97CAD 299,469 Canadian Imperial Bank of
Commerce 27,306 2.81CAD 233,313 National Bank of Canada 11,427 1.17CAD 983,006 Royal Bank of Canada 76,670 7.88CAD 1,254,164 Toronto-Dominion Bank^ 74,335 7.64
Chemicals CAD 45,732 Methanex Corp 3,156 0.32CAD 437,494 Nutrien Ltd 23,740 2.44
Computers CAD 347,844 BlackBerry Ltd 3,412 0.35CAD 174,135 CGI Group Inc 11,232 1.15
Diversified financial services CAD 572,623 Brookfield Asset Management
Inc 24,141 2.48CAD 187,280 CI Financial Corp 3,269 0.34CAD 56,675 IGM Financial Inc 1,700 0.17CAD 58,871 Onex Corp 4,403 0.45
Electricity CAD 52,441 Atco Ltd 1,606 0.17CAD 39,192 Emera Inc^ 1,269 0.13CAD 287,128 Fortis Inc 9,432 0.97CAD 223,466 Hydro One Ltd 3,261 0.33
Engineering & construction CAD 120,246 SNC-Lavalin Group Inc^ 5,321 0.55CAD 70,617 WSP Global Inc 4,010 0.41
Food CAD 118,084 Empire Co Ltd 2,432 0.25CAD 34,546 George Weston Ltd 2,871 0.30CAD 130,654 Loblaw Cos Ltd 6,902 0.71CAD 165,361 Metro Inc^ 5,571 0.57CAD 158,424 Saputo Inc 5,277 0.54
Forest products & paper CAD 41,277 West Fraser Timber Co Ltd 2,562 0.26
Gas CAD 88,368 Canadian Utilities Ltd 2,202 0.23
Ccy Holding InvestmentFair value
$'000
% of netassetvalue
Canada (31 July 2017: 99.69%) (cont) Hand & machine tools
CAD 112,864 Finning International Inc 2,953 0.30Insurance
CAD 18,903 Fairfax Financial Holdings Ltd 10,671 1.10CAD 199,794 Great-West Lifeco Inc 4,934 0.51CAD 73,299 Industrial Alliance Insurance &
Financial Services Inc 3,012 0.31CAD 94,600 Intact Financial Corp 7,211 0.74CAD 1,349,017 Manulife Financial Corp 25,032 2.57CAD 240,922 Power Corp of Canada 5,475 0.56CAD 171,862 Power Financial Corp 4,026 0.41CAD 416,177 Sun Life Financial Inc 17,005 1.75
Internet CAD 59,576 Shopify Inc 8,292 0.85
Media CAD 308,692 Shaw Communications Inc 6,451 0.67CAD 192,979 Thomson Reuters Corp 8,001 0.82
Mining CAD 158,080 Agnico Eagle Mines Ltd 6,617 0.68CAD 793,673 Barrick Gold Corp 8,888 0.91CAD 267,209 Cameco Corp 2,886 0.30CAD 471,002 First Quantum Minerals Ltd 7,340 0.75CAD 126,038 Franco-Nevada Corp 9,237 0.95CAD 591,387 Goldcorp Inc 7,385 0.76CAD 857,113 Kinross Gold Corp 3,094 0.32CAD 444,914 Lundin Mining Corp 2,460 0.25CAD 350,094 Teck Resources Ltd 9,123 0.94CAD 675,742 Turquoise Hill Resources Ltd 1,874 0.19CAD 301,822 Wheaton Precious Metals Corp 6,319 0.65
Oil & gas CAD 239,413 ARC Resources Ltd 2,841 0.29CAD 830,349 Canadian Natural Resources Ltd 30,484 3.13CAD 713,654 Cenovus Energy Inc 7,153 0.74CAD 375,643 Crescent Point Energy Corp 2,559 0.26CAD 662,031 Encana Corp^ 9,127 0.94CAD 237,664 Husky Energy Inc 4,038 0.41CAD 197,871 Imperial Oil Ltd^ 6,771 0.70CAD 144,307 PrairieSky Royalty Ltd^ 2,735 0.28CAD 181,691 Seven Generations Energy Ltd 2,074 0.21CAD 1,116,011 Suncor Energy Inc 46,955 4.83CAD 175,754 Tourmaline Oil Corp^ 3,469 0.36CAD 98,540 Vermilion Energy Inc 3,389 0.35
Packaging & containers CAD 101,263 CCL Industries Inc 5,133 0.53
Pharmaceuticals CAD 442,383 Aurora Cannabis Inc 2,385 0.24CAD 213,987 Bausch Health Cos Inc 4,646 0.48
Pipelines CAD 179,259 AltaGas Ltd^ 3,644 0.38CAD 1,155,486 Enbridge Inc^ 41,001 4.21

iSHARES VII PLC
Schedule of Investments (continued) iSHARES MSCI CANADA UCITS ETF (continued) As at 31 July 2018
[ 1 6 2 ] i S H A R E S V I I P L C A N N U A L R E P O R T
Ccy Holding Investment Fair value
$'000
% of netassetvalue
Equities (31 July 2017: 99.69%) (cont) Canada (31 July 2017: 99.69%) (cont) Pipelines (cont)
CAD 259,753 Inter Pipeline Ltd^ 4,948 0.51CAD 139,872 Keyera Corp^ 4,046 0.42CAD 341,061 Pembina Pipeline Corp 12,259 1.26CAD 600,543 TransCanada Corp 26,988 2.77
Real estate investment & services CAD 116,888 First Capital Realty Inc 1,821 0.19
Real estate investment trusts CAD 98,783 H&R Real Estate Investment
Trust 1,531 0.16CAD 105,201 RioCan Real Estate Investment
Trust 2,006 0.21CAD 44,130 SmartCentres Real Estate
Investment Trust 1,028 0.10Retail
CAD 294,300 Alimentation Couche-Tard Inc^ 13,506 1.39CAD 42,835 Canadian Tire Corp Ltd^ 5,829 0.60CAD 212,453 Dollarama Inc 7,669 0.79CAD 158,008 Restaurant Brands International
Inc 10,071 1.03Software
CAD 13,754 Constellation Software Inc^ 9,962 1.02CAD 179,965 Open Text Corp 6,691 0.69
Telecommunications CAD 105,207 BCE Inc 4,467 0.46CAD 246,558 Rogers Communications Inc 12,559 1.29CAD 132,179 Telus Corp 4,827 0.50
Transportation CAD 503,800 Canadian National Railway Co 44,932 4.62CAD 98,305 Canadian Pacific Railway Ltd 19,478 2.00
Total Canada 970,623 99.75Total equities 970,623 99.75
CcyNo. of
contracts
Underlying exposure
$'000 Fair value
$'000
% of netassetsvalue
Financial derivative instruments (31 July 2017: 0.00%) Futures contracts (31 July 2017: 0.00%)
CAD 14 S&P TSX 60 Index Futures September 2018 2,077 27 0.00Total unrealised gains on futures contracts 27 0.00Total financial derivative instruments 27 0.00
Fair value$'000
% of net assetvalue
Total value of investments 970,650 99.75 Cash† 4,963 0.50 Other net liabilities (2,438) (0.25) Net asset value attributable to redeemable participating shareholders at the end of the financial year 973,175 100.00
† Cash holdings of $4,881,101 are held with State Street Bank and Trust Company. $82,209 is held as security for futures contracts with Credit Suisse AG. ^ These securities are partially or fully transferred as securities lent.
Equities are primarily classified by country of incorporation of the entity in which the Fund holds shares. Underlying exposure has been calculated according to the guidelines issued by the ESMA and represents the market value of an equivalent position in the assets underlying each financial derivative instrument.
Analysis of total current assets gross of all liabilities
Fair value$'000
% of totalcurrentassets
Transferable securities admitted to an official stock exchange listing 970,623 99.36Exchange traded financial derivative instruments 27 0.00Other assets 6,182 0.64Total current assets 976,832 100.00

iSHARES VII PLC
Schedule of Investments (continued) iSHARES MSCI EM ASIA UCITS ETF As at 31 July 2018
i S H A R E S V I I P L C A N N U A L R E P O R T [ 1 6 3 ]
Ccy Holding Investment Fair value
$'000
% of netassetvalue
Transferable Securities Admitted to an Official Stock Exchange Listing or traded on a Regulated Market (31 July 2017: 99.03%)
Equities (31 July 2017: 99.03%) Bermuda (31 July 2017: 1.02%) Auto manufacturers
HKD 395,094 Brilliance China Automotive Holdings Ltd^ 516 0.10Commercial services
HKD 251,414 COSCO Shipping Ports Ltd^ 236 0.04HKD 119,000 Shenzhen International Holdings
Ltd^ 219 0.04Distribution & wholesale
HKD 2,932,000 HengTen Networks Group Ltd 93 0.02Entertainment
HKD 1,670,000 Alibaba Pictures Group Ltd^ 198 0.04Forest products & paper
HKD 232,000 Nine Dragons Paper Holdings Ltd^ 287 0.05Gas
HKD 228,754 China Gas Holdings Ltd^ 927 0.18HKD 124,000 China Resources Gas Group
Ltd^ 588 0.11Home furnishings
HKD 162,000 Haier Electronics Group Co Ltd 473 0.09HKD 238,000 Skyworth Digital Holdings Ltd 93 0.02
Oil & gas HKD 421,809 Kunlun Energy Co Ltd^ 364 0.07
Pharmaceuticals HKD 150,000 Luye Pharma Group Ltd^ 146 0.03HKD 523,000 Sihuan Pharmaceutical Holdings
Group Ltd^ 113 0.02Retail
HKD 1,420,000 GOME Retail Holdings Ltd^ 150 0.03Semiconductors
HKD 601,000 Hanergy Thin Film Power Group Ltd* - 0.00Software
HKD 454,000 Alibaba Health Information Technology Ltd 465 0.09Water
HKD 728,000 Beijing Enterprises Water Group Ltd^ 397 0.07Total Bermuda 5,265 1.00
Cayman Islands (31 July 2017: 19.78%) Apparel retailers
HKD 97,000 Shenzhou International Group Holdings Ltd 1,190 0.23Auto manufacturers
HKD 647,000 Geely Automobile Holdings Ltd^ 1,476 0.28Auto parts & equipment
HKD 123,000 Nexteer Automotive Group Ltd^ 175 0.03
Ccy Holding InvestmentFair value
$'000
% of netassetvalue
Cayman Islands (31 July 2017: 19.78%) (cont) Biotechnology
HKD 155,500 3SBio Inc 332 0.06Building materials and fixtures
HKD 256,000 China Resources Cement Holdings Ltd^ 292 0.06Chemicals
HKD 86,000 Kingboard Chemical Holdings Ltd 300 0.06HKD 141,000 Kingboard Laminates Holdings
Ltd^ 168 0.03Commercial services
HKD 97,000 CAR Inc 96 0.02HKD 221,000 China Conch Venture Holdings
Ltd^ 832 0.16HKD 420,000 China First Capital Group Ltd 273 0.05USD 18,419 New Oriental Education &
Technology Group Inc 1,585 0.30USD 43,765 TAL Education Group 1,400 0.27
Computers TWD 18,000 General Interface Solution
Holding Ltd 122 0.02Diversified financial services
TWD 151,890 Chailease Holding Co Ltd 496 0.09HKD 2,208,000 Chong Sing Holdings FinTech
Gr^ 169 0.03USD 3,711 Noah Holdings Ltd 189 0.04
Electronics HKD 96,500 AAC Technologies Holdings Inc^ 1,230 0.23TWD 60,000 Zhen Ding Technology Holding
Ltd 141 0.03Energy - alternate sources
HKD 1,675,000 GCL-Poly Energy Holdings Ltd^ 147 0.03HKD 392,000 Xinyi Solar Holdings Ltd^ 117 0.02
Engineering & construction HKD 284,000 China State Construction
International Holdings Ltd^ 338 0.07Food
HKD 12,127 China Huishan Dairy Holdings Co Ltd* - 0.00
HKD 358,772 China Mengniu Dairy Co Ltd^ 1,111 0.21HKD 268,000 Dali Foods Group Co Ltd 225 0.04HKD 258,379 Tingyi Cayman Islands Holding
Corp^ 597 0.12HKD 171,000 Uni-President China Holdings Ltd 198 0.04HKD 656,019 Want Want China Holdings Ltd^ 542 0.10
Gas HKD 100,430 ENN Energy Holdings Ltd^ 1,022 0.20HKD 126,000 Towngas China Co Ltd 125 0.02
Healthcare products HKD 182,860 China Medical System Holdings
Ltd 313 0.06HKD 92,992 Hengan International Group Co
Ltd^ 828 0.16

iSHARES VII PLC
Schedule of Investments (continued) iSHARES MSCI EM ASIA UCITS ETF (continued) As at 31 July 2018
[ 1 6 4 ] i S H A R E S V I I P L C A N N U A L R E P O R T
Ccy Holding Investment Fair value
$'000
% of netassetvalue
Equities (31 July 2017: 99.03%) (cont) Cayman Islands (31 July 2017: 19.78%) (cont) Healthcare services
HKD 106,000 Genscript Biotech Corp 259 0.05Hotels
USD 17,097 Huazhu Group Ltd 684 0.13Internet
USD 3,222 51job Inc^ 296 0.06USD 12,422 58.com Inc 836 0.16USD 151,878 Alibaba Group Holding Ltd^ 28,436 5.43USD 7,689 Autohome Inc 744 0.14USD 36,283 Baidu Inc 8,968 1.71HKD 23,600 China Literature Ltd 197 0.04USD 51,494 Ctrip.com International Ltd^ 2,119 0.40USD 27,217 Fang Holdings Ltd 88 0.02USD 94,790 JD.com Inc 3,399 0.65USD 8,748 SINA Corp 704 0.13HKD 749,710 Tencent Holdings Ltd 33,936 6.48USD 54,648 Vipshop Holdings Ltd 527 0.10USD 6,424 Weibo Corp^ 532 0.10USD 5,951 YY Inc^ 555 0.11
Machinery - diversified HKD 94,000 Haitian International Holdings Ltd 222 0.04
Metal fabricate/ hardware HKD 213,200 China Zhongwang Holdings Ltd 104 0.02
Miscellaneous manufacturers TWD 15,000 Airtac International Group 163 0.03HKD 93,600 Sunny Optical Technology Group
Co Ltd^ 1,545 0.30Packaging & containers
HKD 226,000 Lee & Man Paper Manufacturing Ltd^ 220 0.04Pharmaceuticals
HKD 891,000 Sino Biopharmaceutical Ltd 1,217 0.23HKD 194,000 SSY Group Ltd 185 0.04HKD 63,500 Wuxi Biologics Cayman Inc 646 0.12
Real estate investment & services HKD 224,000 Agile Group Holdings Ltd^ 344 0.07HKD 349,501 China Evergrande Group^ 964 0.18HKD 367,062 China Resources Land Ltd 1,342 0.26HKD 468,000 CIFI Holdings Group Co Ltd^ 304 0.06HKD 995,220 Country Garden Holdings Co
Ltd^ 1,542 0.29HKD 910,000 Fullshare Holdings Ltd^ 401 0.08HKD 230,000 Future Land Development
Holdings Ltd 207 0.04HKD 112,000 Greentown China Holdings Ltd 132 0.03HKD 134,000 Jiayuan International Group Ltd 260 0.05HKD 289,000 Kaisa Group Holdings Ltd 117 0.02HKD 166,000 KWG Property Holding Ltd 189 0.04HKD 176,000 Logan Property Holdings Co Ltd^ 220 0.04HKD 194,561 Longfor Group Holdings Ltd^ 547 0.10
Ccy Holding InvestmentFair value
$'000
% of netassetvalue
Cayman Islands (31 July 2017: 19.78%) (cont) Real estate investment & services (cont)
HKD 155,097 Shimao Property Holdings Ltd^ 440 0.08HKD 473,500 Shui On Land Ltd^ 110 0.02HKD 290,655 Soho China Ltd^ 137 0.03HKD 328,000 Sunac China Holdings Ltd^ 1,066 0.20HKD 216,000 Yuzhou Properties Co Ltd 122 0.02
Retail HKD 141,000 Anta Sports Products Ltd 719 0.14HKD 74,000 Zhongsheng Group Holdings
Ltd^ 168 0.03Semiconductors
HKD 397,800 Semiconductor Manufacturing International Corp 481 0.09Software
HKD 258,000 Kingdee International Software Group Co Ltd 286 0.05
HKD 109,000 Kingsoft Corp Ltd^ 264 0.05USD 14,922 Momo Inc 612 0.12USD 10,400 NetEase Inc 2,683 0.51
Telecommunications USD 7,641 GDS Holdings Ltd^ 167 0.03HKD 224,000 Meitu Inc^ 173 0.04
Total Cayman Islands 116,608 22.26
Hong Kong (31 July 2017: 4.72%) Agriculture
HKD 274,000 China Agri-Industries Holdings Ltd 109 0.02Auto manufacturers
HKD 91,000 Sinotruk Hong Kong Ltd^ 129 0.02Banks
HKD 767,977 Citic Ltd^ 1,084 0.21Beverages
HKD 188,860 China Resources Beer Holdings Co Ltd^ 850 0.16Commercial services
HKD 186,830 China Merchants Port Holdings Co Ltd^ 387 0.07Computers
HKD 951,457 Lenovo Group Ltd^ 527 0.10Diversified financial services
HKD 132,000 China Everbright Ltd 233 0.05HKD 279,000 Far East Horizon Ltd 269 0.05
Electricity HKD 601,000 China Power International
Development Ltd 149 0.03HKD 252,914 China Resources Power
Holdings Co Ltd 488 0.09Electronics
HKD 90,500 BYD Electronic International Co Ltd^ 106 0.02Energy - alternate sources
HKD 315,000 China Everbright International Ltd^ 384 0.07

iSHARES VII PLC
Schedule of Investments (continued) iSHARES MSCI EM ASIA UCITS ETF (continued) As at 31 July 2018
i S H A R E S V I I P L C A N N U A L R E P O R T [ 1 6 5 ]
Ccy Holding Investment Fair value
$'000
% of netassetvalue
Equities (31 July 2017: 99.03%) (cont) Hong Kong (31 July 2017: 4.72%) (cont)
Gas HKD 73,032 Beijing Enterprises Holdings Ltd 355 0.07
Insurance HKD 212,134 China Taiping Insurance
Holdings Co Ltd 726 0.14HKD 339,396 Fosun International Ltd 620 0.12
Leisure time HKD 286,000 China Travel International
Investment Hong Kong Ltd 115 0.02Mining
HKD 304,000 MMG Ltd 186 0.04Oil & gas
HKD 2,346,072 CNOOC Ltd 3,922 0.75Pharmaceuticals
HKD 206,500 China Resources Pharmaceutical Group Ltd 301 0.06
HKD 296,000 China Traditional Chinese Medicine Holdings Co Ltd^ 218 0.04
HKD 618,000 CSPC Pharmaceutical Group Ltd 1,614 0.31Real estate investment & services
HKD 686,000 China Jinmao Holdings Group Ltd^ 329 0.07
HKD 500,757 China Overseas Land & Investment Ltd^ 1,573 0.30
HKD 69,948 Shanghai Industrial Holdings Ltd 163 0.03HKD 420,000 Shenzhen Investment Ltd^ 151 0.03HKD 397,909 Sino-Ocean Group Holding Ltd 225 0.04HKD 894,000 Yuexiu Property Co Ltd 170 0.03
Retail HKD 331,500 Sun Art Retail Group Ltd^ 422 0.08
Telecommunications HKD 806,223 China Mobile Ltd 7,274 1.39HKD 802,260 China Unicom Hong Kong Ltd^ 989 0.19
Water HKD 378,000 Guangdong Investment Ltd 651 0.12
Total Hong Kong 24,719 4.72
India (31 July 2017: 12.22%) Agriculture
INR 447,409 ITC Ltd 1,942 0.37Airlines
INR 12,008 InterGlobe Aviation Ltd 163 0.03Auto manufacturers
INR 157,906 Ashok Leyland Ltd 260 0.05INR 1,701 Eicher Motors Ltd 690 0.13INR 97,640 Mahindra & Mahindra Ltd 1,332 0.25INR 13,859 Maruti Suzuki India Ltd 1,924 0.37INR 119,510 Tata Motors Ltd 460 0.09
USD 19,801 Tata Motors Ltd ADR^ 360 0.07Auto parts & equipment
INR 1,007 Bosch Ltd 275 0.05INR 88,521 Motherson Sumi Systems Ltd 416 0.08
Ccy Holding InvestmentFair value
$'000
% of netassetvalue
India (31 July 2017: 12.22%) (cont) Banks
INR 235,205 Axis Bank Ltd 1,888 0.36INR 160,541 ICICI Bank Ltd 712 0.14
USD 75,163 ICICI Bank Ltd ADR 664 0.13INR 19,461 State Bank of India 83 0.01
USD 21,737 State Bank of India GDR 925 0.18INR 214,600 Yes Bank Ltd 1,151 0.22
Beverages INR 34,762 United Spirits Ltd 297 0.06
Building materials and fixtures INR 83,423 Ambuja Cements Ltd 281 0.05INR 41,371 Grasim Industries Ltd 618 0.12INR 1,149 Shree Cement Ltd 285 0.06INR 12,121 UltraTech Cement Ltd 741 0.14
Chemicals INR 37,667 Asian Paints Ltd 797 0.15INR 48,731 UPL Ltd 458 0.09
Coal INR 83,200 Coal India Ltd 317 0.06
Commercial services INR 67,776 Adani Ports & Special Economic
Zone Ltd 395 0.08Computers
INR 186,557 Infosys Ltd 3,713 0.71USD 41,956 Infosys Ltd ADR 847 0.16INR 123,453 Tata Consultancy Services Ltd 3,492 0.66INR 10,663 Wipro Ltd 43 0.01
USD 111,588 Wipro Ltd ADR 565 0.11Cosmetics & personal care
INR 72,496 Dabur India Ltd 446 0.08Diversified financial services
INR 22,159 Bajaj Finance Ltd 872 0.17INR 209,111 Housing Development Finance
Corp Ltd 6,082 1.16INR 36,292 Indiabulls Housing Finance Ltd 686 0.13INR 41,151 LIC Housing Finance Ltd 317 0.06INR 38,535 Mahindra & Mahindra Financial
Services Ltd 289 0.06INR 91,758 Rural Electrification Corp Ltd 156 0.03INR 19,502 Shriram Transport Finance Co
Ltd 393 0.07INR 59,997 Vakrangee Ltd 42 0.01
Electrical components & equipment INR 120,181 Bharat Heavy Electricals Ltd 130 0.02INR 34,781 Havells India Ltd 321 0.06INR 9,973 Siemens Ltd 144 0.03
Electricity INR 257,487 NTPC Ltd 581 0.11INR 204,215 Power Grid Corp of India Ltd 543 0.11INR 154,914 Tata Power Co Ltd 168 0.03
Engineering & construction USD 65,438 Larsen & Toubro Ltd 1,233 0.24

iSHARES VII PLC
Schedule of Investments (continued) iSHARES MSCI EM ASIA UCITS ETF (continued) As at 31 July 2018
[ 1 6 6 ] i S H A R E S V I I P L C A N N U A L R E P O R T
Ccy Holding Investment Fair value
$'000
% of netassetvalue
Equities (31 July 2017: 99.03%) (cont) India (31 July 2017: 12.22%) (cont)
Food INR 16,245 Avenue Supermarts Ltd 392 0.08INR 3,963 Britannia Industries Ltd 378 0.07INR 3,186 Nestle India Ltd 489 0.09
Gas INR 93,544 GAIL India Ltd 512 0.10
Household goods & home construction INR 31,208 Godrej Consumer Products Ltd 599 0.12INR 85,113 Hindustan Unilever Ltd 2,149 0.41INR 62,401 Marico Ltd 331 0.06
Insurance INR 4,880 Bajaj Finserv Ltd 496 0.09
Iron & steel INR 104,505 JSW Steel Ltd 503 0.10INR 48,291 Tata Steel Ltd 397 0.07
Leisure time INR 11,730 Bajaj Auto Ltd 462 0.09INR 6,334 Hero MotoCorp Ltd 304 0.06
Media INR 62,863 Zee Entertainment Enterprises
Ltd 483 0.09Metal fabricate/ hardware
INR 28,459 Bharat Forge Ltd 266 0.05Mining
INR 150,804 Hindalco Industries Ltd 469 0.09INR 66,316 Vedanta Ltd 215 0.04
USD 26,258 Vedanta Ltd ADR 339 0.06Miscellaneous manufacturers
INR 15,862 Pidilite Industries Ltd 260 0.05Oil & gas
INR 102,343 Bharat Petroleum Corp Ltd 582 0.11INR 79,977 Hindustan Petroleum Corp Ltd 332 0.06INR 189,069 Indian Oil Corp Ltd 453 0.09INR 168,691 Oil & Natural Gas Corp Ltd 407 0.08INR 220,103 Reliance Industries Ltd 3,806 0.73
USD 78,099 Reliance Industries Ltd GDR^ 2,671 0.51Pharmaceuticals
INR 36,389 Aurobindo Pharma Ltd 314 0.06INR 25,917 Cadila Healthcare Ltd 144 0.03INR 47,752 Cipla Ltd 447 0.09INR 6,495 Dr Reddy's Laboratories Ltd 201 0.04
USD 7,862 Dr Reddy's Laboratories Ltd ADR^ 246 0.05
INR 20,786 Glenmark Pharmaceuticals Ltd 176 0.03INR 27,404 Lupin Ltd 329 0.06INR 11,201 Piramal Enterprises Ltd 438 0.08INR 109,930 Sun Pharmaceutical Industries
Ltd 911 0.17
Ccy Holding InvestmentFair value
$'000
% of netassetvalue
India (31 July 2017: 12.22%) (cont) Pipelines
INR 79,195 Petronet LNG Ltd 265 0.05Retail
INR 39,254 Titan Co Ltd 522 0.10Software
INR 72,878 HCL Technologies Ltd 1,026 0.20INR 58,749 Tech Mahindra Ltd 583 0.11
Telecommunications INR 181,598 Bharti Airtel Ltd 1,034 0.20INR 45,606 Bharti Infratel Ltd 191 0.03INR 255,176 Idea Cellular Ltd 204 0.04
Transportation INR 22,368 Container Corp Of India Ltd 218 0.04
Total India 63,041 12.04
Indonesia (31 July 2017: 3.19%) Agriculture
IDR 986,500 Charoen Pokphand Indonesia Tbk PT 309 0.06
IDR 65,000 Gudang Garam Tbk PT 339 0.06IDR 1,284,900 Hanjaya Mandala Sampoerna
Tbk PT 342 0.07Banks
IDR 1,292,400 Bank Central Asia Tbk PT 2,086 0.40IDR 465,600 Bank Danamon Indonesia Tbk
PT 212 0.04IDR 2,435,300 Bank Mandiri Persero Tbk PT 1,123 0.21IDR 1,042,200 Bank Negara Indonesia Persero
Tbk PT 535 0.10IDR 7,266,500 Bank Rakyat Indonesia Persero
Tbk PT 1,547 0.30IDR 580,500 Bank Tabungan Negara Persero
Tbk PT 95 0.02Building materials and fixtures
IDR 253,700 Indocement Tunggal Prakarsa Tbk PT 248 0.05
IDR 365,800 Semen Indonesia Persero Tbk PT 193 0.04Coal
IDR 1,984,700 Adaro Energy Tbk PT 262 0.05Distribution & wholesale
IDR 194,600 AKR Corporindo Tbk PT 57 0.01Engineering & construction
IDR 307,090 Jasa Marga Persero Tbk PT 100 0.02IDR 438,900 Waskita Karya Persero Tbk PT 64 0.01
Food IDR 254,900 Indofood CBP Sukses Makmur
Tbk PT 154 0.03IDR 602,100 Indofood Sukses Makmur Tbk PT 265 0.05
Forest products & paper IDR 356,400 Indah Kiat Pulp & Paper Corp
Tbk PT 475 0.09

iSHARES VII PLC
Schedule of Investments (continued) iSHARES MSCI EM ASIA UCITS ETF (continued) As at 31 July 2018
i S H A R E S V I I P L C A N N U A L R E P O R T [ 1 6 7 ]
Ccy Holding Investment Fair value
$'000
% of netassetvalue
Equities (31 July 2017: 99.03%) (cont) Indonesia (31 July 2017: 3.19%) (cont)
Gas IDR 1,273,000 Perusahaan Gas Negara Persero
Tbk 150 0.03Household goods & home construction
IDR 195,600 Unilever Indonesia Tbk PT 587 0.11Machinery, construction & mining
IDR 215,500 United Tractors Tbk PT 527 0.10Media
IDR 719,500 Surya Citra Media Tbk PT 102 0.02Pharmaceuticals
IDR 2,912,700 Kalbe Farma Tbk PT 262 0.05Real estate investment & services
IDR 1,081,200 Bumi Serpong Damai Tbk PT 101 0.02IDR 2,086,000 Pakuwon Jati Tbk PT 75 0.01
Retail IDR 2,648,800 Astra International Tbk PT 1,313 0.25IDR 364,000 Matahari Department Store Tbk
PT 203 0.04Telecommunications
IDR 6,602,000 Telekomunikasi Indonesia Persero Tbk PT 1,634 0.31
IDR 237,900 Tower Bersama Infrastructure Tbk PT 87 0.02Total Indonesia 13,447 2.57
Malaysia (31 July 2017: 3.04%) Agriculture
MYR 18,500 British American Tobacco Malaysia Bhd 156 0.03
MYR 229,200 FGV Holdings Bhd 97 0.02MYR 30,900 Genting Plantations Bhd 71 0.01MYR 85,600 HAP Seng Consolidated Bhd 206 0.04MYR 247,000 IOI Corp Bhd 281 0.05MYR 59,400 Kuala Lumpur Kepong Bhd 362 0.07MYR 307,838 Sime Darby Plantation Bhd 398 0.08
Airlines MYR 203,100 AirAsia Group Bhd 178 0.03
Auto manufacturers MYR 67,800 UMW Holdings Bhd 100 0.02
Banks MYR 106,300 Alliance Bank Malaysia Bhd 105 0.02MYR 242,800 AMMB Holdings Bhd 240 0.05MYR 626,683 CIMB Group Holdings Bhd 900 0.17MYR 87,880 Hong Leong Bank Bhd 412 0.08MYR 497,524 Malayan Banking Bhd 1,201 0.23MYR 382,030 Public Bank Bhd 2,261 0.43MYR 112,963 RHB Bank Bhd 151 0.03
Beverages MYR 16,900 Fraser & Neave Holdings Bhd 155 0.03
Ccy Holding InvestmentFair value
$'000
% of netassetvalue
Malaysia (31 July 2017: 3.04%) (cont) Chemicals
MYR 336,600 Petronas Chemicals Group Bhd 740 0.14Commercial services
MYR 141,300 Westports Holdings Bhd 129 0.02Distribution & wholesale
MYR 307,838 Sime Darby Bhd 191 0.04Diversified financial services
MYR 30,200 Hong Leong Financial Group Bhd 134 0.03Electricity
MYR 408,600 Tenaga Nasional Bhd 1,576 0.30Engineering & construction
MYR 236,800 Gamuda Bhd 225 0.04MYR 114,980 Malaysia Airports Holdings Bhd 262 0.05
Food MYR 7,200 Nestle Malaysia Bhd 261 0.05MYR 82,200 PPB Group Bhd 334 0.06
Healthcare services MYR 323,600 IHH Healthcare Bhd 471 0.09
Holding companies - diversified operations MYR 399,400 IJM Corp Bhd 192 0.04MYR 405,707 YTL Corp Bhd 135 0.02
Hotels MYR 277,700 Genting Bhd 598 0.11MYR 410,000 Genting Malaysia Bhd 510 0.10
Media MYR 214,800 Astro Malaysia Holdings Bhd 97 0.02
Mining MYR 180,600 Press Metal Aluminium Holdings
Bhd 213 0.04Miscellaneous manufacturers
MYR 190,700 Hartalega Holdings Bhd 288 0.06MYR 91,700 Top Glove Corp Bhd 229 0.04
Oil & gas MYR 33,300 Petronas Dagangan Bhd 221 0.04
Oil & gas services MYR 438,300 Dialog Group Bhd 358 0.07
Pipelines MYR 85,500 Petronas Gas Bhd 394 0.08
Real estate investment & services MYR 192,438 IOI Properties Group Bhd 90 0.02MYR 307,838 Sime Darby Property Bhd 101 0.02MYR 162,600 SP Setia Bhd Group 119 0.02
Telecommunications MYR 368,047 Axiata Group Bhd 398 0.07MYR 426,100 DiGi.Com Bhd 477 0.09MYR 294,500 Maxis Bhd 419 0.08

iSHARES VII PLC
Schedule of Investments (continued) iSHARES MSCI EM ASIA UCITS ETF (continued) As at 31 July 2018
[ 1 6 8 ] i S H A R E S V I I P L C A N N U A L R E P O R T
Ccy Holding Investment Fair value
$'000
% of netassetvalue
Equities (31 July 2017: 99.03%) (cont) Malaysia (31 July 2017: 3.04%) (cont) Telecommunications (cont)
MYR 138,700 Telekom Malaysia Bhd 135 0.03Transportation
MYR 146,400 MISC Bhd 241 0.05Total Malaysia 16,812 3.21
Pakistan (31 July 2017: 0.14%) Banks
PKR 73,000 Habib Bank Ltd 105 0.02PKR 50,900 MCB Bank Ltd 85 0.02PKR 60,300 United Bank Ltd 85 0.01
Building materials and fixtures PKR 12,200 Lucky Cement Ltd 54 0.01
Oil & gas PKR 82,100 Oil & Gas Development Co Ltd 101 0.02
Total Pakistan 430 0.08
People's Republic of China (31 July 2017: 13.09%) Aerospace & defence
HKD 301,000 AviChina Industry & Technology Co Ltd^ 185 0.04Airlines
HKD 240,757 Air China Ltd 222 0.04HKD 178,000 China Eastern Airlines Corp Ltd 111 0.02HKD 280,000 China Southern Airlines Co Ltd 197 0.04
Auto manufacturers HKD 231,500 BAIC Motor Corp Ltd 192 0.04HKD 85,000 Byd Co Ltd^ 481 0.09HKD 98,300 Chongqing Changan Automobile
Co Ltd 86 0.01HKD 358,451 Dongfeng Motor Group Co Ltd 359 0.07HKD 423,464 Great Wall Motor Co Ltd 304 0.06HKD 408,000 Guangzhou Automobile Group
Co Ltd 383 0.07Auto parts & equipment
HKD 63,200 Fuyao Glass Industry Group Co Ltd^ 229 0.04
HKD 255,876 Weichai Power Co Ltd^ 312 0.06Banks
HKD 3,895,997 Agricultural Bank of China Ltd 1,886 0.36HKD 10,435,294 Bank of China Ltd 4,894 0.93HKD 1,152,244 Bank of Communications Co Ltd^ 831 0.16HKD 1,176,200 China CITIC Bank Corp Ltd 754 0.14HKD 12,637,558 China Construction Bank Corp 11,450 2.19HKD 409,000 China Everbright Bank Co Ltd^ 179 0.03HKD 513,761 China Merchants Bank Co Ltd^ 2,007 0.38HKD 814,094 China Minsheng Banking Corp
Ltd^ 603 0.12HKD 324,000 Chongqing Rural Commercial
Bank Co Ltd 198 0.04
Ccy Holding InvestmentFair value
$'000
% of netassetvalue
People's Republic of China (31 July 2017: 13.09%) (cont)Banks (cont)
HKD 9,123,386 Industrial & Commercial Bank of China Ltd 6,755 1.29
HKD 361,000 Postal Savings Bank of China Co Ltd^ 242 0.05Beverages
HKD 50,000 Tsingtao Brewery Co Ltd^ 267 0.05Building materials and fixtures
HKD 167,306 Anhui Conch Cement Co Ltd^ 1,071 0.21HKD 307,000 BBMG Corp 121 0.02HKD 531,327 China National Building Material
Co Ltd 576 0.11Chemicals
HKD 432,000 Sinopec Shanghai Petrochemical Co Ltd 259 0.05Coal
HKD 268,000 China Coal Energy Co Ltd 112 0.02HKD 448,005 China Shenhua Energy Co Ltd 1,011 0.19USD 138,200 Inner Mongolia Yitai Coal Co Ltd 182 0.04HKD 253,897 Yanzhou Coal Mining Co Ltd^ 316 0.06
Commercial services HKD 182,000 Jiangsu Expressway Co Ltd 221 0.04HKD 188,000 Zhejiang Expressway Co Ltd^ 160 0.03
Diversified financial services HKD 1,242,000 China Cinda Asset Management
Co Ltd 348 0.07HKD 448,500 China Galaxy Securities Co Ltd^ 232 0.04HKD 1,381,000 China Huarong Asset
Management Co Ltd^ 352 0.07HKD 136,400 China International Capital Corp
Ltd 235 0.04HKD 310,500 CITIC Securities Co Ltd^ 620 0.12HKD 173,200 GF Securities Co Ltd^ 242 0.05HKD 78,000 Guotai Junan Securities Co Ltd 162 0.03HKD 440,800 Haitong Securities Co Ltd^ 445 0.08HKD 220,400 Huatai Securities Co Ltd^ 346 0.07
Electrical components & equipment HKD 80,600 Xinjiang Goldwind Science &
Technology Co Ltd 103 0.02Electricity
HKD 1,518,000 CGN Power Co Ltd^ 402 0.08HKD 443,000 China Longyuan Power Group
Corp Ltd 413 0.08HKD 404,000 Datang International Power
Generation Co Ltd 117 0.02HKD 210,000 Huadian Power International
Corp Ltd 99 0.02HKD 562,000 Huaneng Power International
Inc^ 422 0.08HKD 646,000 Huaneng Renewables Corp Ltd 240 0.04
Engineering & construction HKD 246,000 Beijing Capital International
Airport Co Ltd^ 280 0.05HKD 592,472 China Communications
Construction Co Ltd 655 0.13

iSHARES VII PLC
Schedule of Investments (continued) iSHARES MSCI EM ASIA UCITS ETF (continued) As at 31 July 2018
i S H A R E S V I I P L C A N N U A L R E P O R T [ 1 6 9 ]
Ccy Holding Investment Fair value
$'000
% of netassetvalue
Equities (31 July 2017: 99.03%) (cont) People's Republic of China (31 July 2017: 13.09%) (cont) Engineering & construction (cont)
HKD 310,000 China Communications Services Corp Ltd 196 0.04
HKD 277,000 China Railway Construction Corp Ltd 334 0.06
HKD 495,501 China Railway Group Ltd 430 0.08HKD 373,000 Metallurgical Corp of China Ltd 109 0.02
Healthcare products HKD 261,897 Shandong Weigao Group
Medical Polymer Co Ltd 200 0.04Holding companies - diversified operations
HKD 43,600 Legend Holdings Corp 130 0.02Insurance
HKD 978,128 China Life Insurance Co Ltd^ 2,441 0.47HKD 344,780 China Pacific Insurance Group
Co Ltd 1,344 0.26HKD 744,000 China Reinsurance Group Corp^ 156 0.03HKD 110,300 New China Life Insurance Co Ltd 507 0.10HKD 1,007,000 People's Insurance Co Group of
China Ltd 449 0.08HKD 930,496 PICC Property & Casualty Co Ltd 1,049 0.20HKD 684,666 Ping An Insurance Group Co of
China Ltd^ 6,352 1.21HKD 21,200 ZhongAn Online P&C Insurance
Co Ltd^ 97 0.02Iron & steel
HKD 140,000 Angang Steel Co Ltd^ 148 0.03Machinery, construction & mining
HKD 338,000 Shanghai Electric Group Co Ltd^ 113 0.02Mining
HKD 560,000 Aluminum Corp of China Ltd 255 0.05HKD 504,000 China Molybdenum Co Ltd^ 257 0.05HKD 161,984 Jiangxi Copper Co Ltd 204 0.04HKD 137,000 Zhaojin Mining Industry Co Ltd 111 0.02HKD 840,141 Zijin Mining Group Co Ltd 310 0.06
Miscellaneous manufacturers HKD 56,100 China International Marine
Containers Group Co Ltd 65 0.01HKD 195,000 China Railway Signal &
Communication Corp Ltd 138 0.03HKD 574,095 CRRC Corp Ltd^ 503 0.10HKD 72,500 Zhuzhou CRRC Times Electric
Co Ltd^ 435 0.08Oil & gas
HKD 3,354,086 China Petroleum & Chemical Corp 3,236 0.62
HKD 2,773,319 PetroChina Co Ltd 2,117 0.40Oil & gas services
HKD 268,539 China Oilfield Services Ltd^ 247 0.05HKD 173,000 Sinopec Engineering Group Co
Ltd^ 176 0.03
Ccy Holding InvestmentFair value
$'000
% of netassetvalue
People's Republic of China (31 July 2017: 13.09%) (cont)Pharmaceuticals
HKD 62,000 Shanghai Fosun Pharmaceutical Group Co Ltd^ 296 0.05
HKD 156,995 Sinopharm Group Co Ltd 664 0.13HKD 71,000 Tong Ren Tang Technologies Co
Ltd 105 0.02Real estate investment & services
HKD 169,600 China Vanke Co Ltd^ 541 0.11HKD 123,600 Guangzhou R&F Properties Co
Ltd^ 222 0.04USD 124,980 Shanghai Lujiazui Finance &
Trade Zone Development Co Ltd 174 0.03Retail
HKD 114,200 Shanghai Pharmaceuticals Holding Co Ltd 303 0.06Software
HKD 123,000 TravelSky Technology Ltd 349 0.07Telecommunications
HKD 1,822,095 China Telecom Corp Ltd 862 0.17HKD 94,255 ZTE Corp 161 0.03
Transportation HKD 491,000 COSCO Shipping Development
Co Ltd 78 0.02HKD 156,000 COSCO Shipping Energy
Transportation Co Ltd 68 0.01HKD 336,500 COSCO Shipping Holdings Co
Ltd^ 141 0.03HKD 266,000 Sinotrans Ltd 123 0.02
Total People's Republic of China 69,065 13.19
Philippines (31 July 2017: 1.55%) Banks
PHP 112,113 Bank of the Philippine Islands 207 0.04PHP 250,645 BDO Unibank Inc 623 0.12PHP 110,715 Metropolitan Bank & Trust Co 154 0.03PHP 31,260 Security Bank Corp 119 0.02
Commercial services PHP 72,430 International Container Terminal
Services Inc 121 0.02Electricity
PHP 208,500 Aboitiz Power Corp 146 0.03PHP 31,010 Manila Electric Co 222 0.04
Engineering & construction PHP 549,900 DMCI Holdings Inc 122 0.02
Food PHP 351,380 JG Summit Holdings Inc 370 0.07PHP 121,930 Universal Robina Corp 294 0.06
Holding companies - diversified operations PHP 270,700 Aboitiz Equity Ventures Inc 292 0.06PHP 565,400 Alliance Global Group Inc 127 0.02

iSHARES VII PLC
Schedule of Investments (continued) iSHARES MSCI EM ASIA UCITS ETF (continued) As at 31 July 2018
[ 1 7 0 ] i S H A R E S V I I P L C A N N U A L R E P O R T
Ccy Holding Investment Fair value
$'000
% of netassetvalue
Equities (31 July 2017: 99.03%) (cont) Philippines (31 July 2017: 1.55%) (cont) Investment services
PHP 12,454 GT Capital Holdings Inc 228 0.05Real estate investment & services
PHP 31,700 Ayala Corp 596 0.11PHP 956,200 Ayala Land Inc 735 0.14PHP 1,567,400 Megaworld Corp 137 0.03PHP 283,836 Robinsons Land Corp 105 0.02PHP 1,314,850 SM Prime Holdings Inc 935 0.18
Retail PHP 59,480 Jollibee Foods Corp 303 0.06PHP 30,358 SM Investments Corp 543 0.10
Telecommunications PHP 4,775 Globe Telecom Inc 165 0.03PHP 11,905 PLDT Inc 300 0.06
Water PHP 1,831,700 Metro Pacific Investments Corp 162 0.03
Total Philippines 7,006 1.34
Republic of South Korea (31 July 2017: 20.78%) Advertising
KRW 9,540 Cheil Worldwide Inc 172 0.03Aerospace & defence
KRW 9,298 Korea Aerospace Industries Ltd^ 292 0.05Agriculture
KRW 15,282 KT&G Corp^ 1,510 0.29Airlines
KRW 6,057 Korean Air Lines Co Ltd 158 0.03Auto manufacturers
KRW 20,217 Hyundai Motor Co^ 2,340 0.45KRW 3,129 Hyundai Motor Co (Preference) 229 0.04KRW 5,197 Hyundai Motor Co (2nd
Preference) 408 0.08KRW 34,478 Kia Motors Corp^ 977 0.18
Auto parts & equipment KRW 10,273 Hankook Tire Co Ltd 408 0.08KRW 26,102 Hanon Systems^ 250 0.05KRW 8,923 Hyundai Mobis Co Ltd^ 1,818 0.34
Banks KRW 34,266 Industrial Bank of Korea 479 0.09KRW 62,284 Woori Bank^ 941 0.18
Biotechnology KRW 566 Medy-Tox Inc 363 0.07KRW 2,177 Samsung Biologics Co Ltd^ 726 0.14
Chemicals KRW 14,091 Hanwha Chemical Corp 267 0.05KRW 835 KCC Corp^ 253 0.05KRW 2,320 Kumho Petrochemical Co Ltd 234 0.04KRW 6,012 LG Chem Ltd 2,016 0.39KRW 1,104 LG Chem Ltd (Preference) 213 0.04KRW 2,254 Lotte Chemical Corp^ 724 0.14
Ccy Holding InvestmentFair value
$'000
% of netassetvalue
Republic of South Korea (31 July 2017: 20.78%) (cont) Commercial services
KRW 2,180 S-1 Corp 169 0.03Computers
KRW 4,580 Samsung SDS Co Ltd 858 0.16KRW 4,138 SK Holdings Co Ltd 974 0.19
Cosmetics & personal care KRW 4,208 Amorepacific Corp^ 1,006 0.19KRW 1,290 Amorepacific Corp (Preference) 165 0.03KRW 3,598 Amorepacific Group^ 308 0.06KRW 1,231 LG Household & Health Care
Ltd^ 1,332 0.26KRW 289 LG Household & Health Care Ltd
(Preference) 172 0.03Distribution & wholesale
KRW 4,879 Hanwha Corp 140 0.03KRW 12,484 LG Corp 842 0.16KRW 5,970 Posco Daewoo Corp 102 0.02
Diversified financial services KRW 37,279 BNK Financial Group Inc 299 0.06KRW 21,491 DGB Financial Group Inc^ 180 0.03KRW 38,687 Hana Financial Group Inc 1,553 0.30KRW 52,087 KB Financial Group Inc 2,496 0.48KRW 5,655 Korea Investment Holdings Co
Ltd 361 0.07KRW 50,452 Mirae Asset Daewoo Co Ltd 367 0.07KRW 17,344 NH Investment & Securities Co
Ltd^ 201 0.04KRW 3,993 Samsung Card Co Ltd^ 126 0.02KRW 7,791 Samsung Securities Co Ltd^ 226 0.04KRW 55,945 Shinhan Financial Group Co Ltd 2,178 0.41
Electrical components & equipment KRW 1,997 LG Innotek Co Ltd 291 0.05
Electricity KRW 33,292 Korea Electric Power Corp 991 0.19
Electronics KRW 30,139 LG Display Co Ltd^ 573 0.11KRW 7,565 Samsung Electro-Mechanics Co
Ltd 1,038 0.20Energy - alternate sources
KRW 2,402 OCI Co Ltd^ 212 0.04Engineering & construction
KRW 3,427 Daelim Industrial Co Ltd^ 240 0.05KRW 21,869 Daewoo Engineering &
Construction Co Ltd^ 111 0.02KRW 6,533 GS Engineering & Construction
Corp 265 0.05KRW 4,624 HDC Hyundai Development Co-
Engineering & Construction 238 0.04KRW 9,868 Hyundai Engineering &
Construction Co Ltd^ 516 0.10KRW 3,194 Kepco Plant Service &
Engineering Co Ltd 98 0.02KRW 20,103 Samsung Engineering Co Ltd^ 305 0.06

iSHARES VII PLC
Schedule of Investments (continued) iSHARES MSCI EM ASIA UCITS ETF (continued) As at 31 July 2018
i S H A R E S V I I P L C A N N U A L R E P O R T [ 1 7 1 ]
Ccy Holding Investment Fair value
$'000
% of netassetvalue
Equities (31 July 2017: 99.03%) (cont) Republic of South Korea (31 July 2017: 20.78%) (cont)
Food KRW 1,114 BGF retail Co Ltd 168 0.03KRW 1,112 CJ CheilJedang Corp 336 0.07KRW 4,487 Dongsuh Cos Inc^ 102 0.02KRW 3,881 Lotte Corp 183 0.04KRW 2,716 Orion Corp^ 324 0.06KRW 158 Ottogi Corp 125 0.02
Gas KRW 3,918 Korea Gas Corp 204 0.04
Healthcare services KRW 6,846 SillaJen Inc^ 320 0.06
Holding companies - diversified operations KRW 1,919 CJ Corp 241 0.05
Home furnishings KRW 6,369 Coway Co Ltd 534 0.10KRW 1,393 Hanssem Co Ltd^ 120 0.02KRW 13,754 LG Electronics Inc^ 920 0.18
Hotels KRW 16,273 Kangwon Land Inc^ 378 0.07
Insurance KRW 6,493 DB Insurance Co Ltd 374 0.07KRW 39,007 Hanwha Life Insurance Co Ltd 180 0.04KRW 8,637 Hyundai Marine & Fire Insurance
Co Ltd 283 0.05KRW 4,511 ING Life Insurance Korea Ltd^ 170 0.03KRW 4,005 Samsung Fire & Marine
Insurance Co Ltd 978 0.19KRW 9,119 Samsung Life Insurance Co Ltd^ 785 0.15
Internet KRW 6,258 Kakao Corp^ 629 0.12KRW 3,679 NAVER Corp^ 2,355 0.45KRW 2,375 NCSoft Corp 819 0.16
Investment services KRW 1,286 Hyundai Heavy Industries
Holdings Co Ltd 386 0.07Iron & steel
KRW 10,381 Hyundai Steel Co 498 0.10KRW 10,322 POSCO 3,050 0.58
Machinery - diversified KRW 6,921 Doosan Heavy Industries &
Construction Co Ltd 93 0.02Machinery, construction & mining
KRW 4,615 Doosan Bobcat Inc 137 0.03Marine transportation
KRW 4,036 HLB Inc^ 246 0.04KRW 5,027 Hyundai Heavy Industries Co
Ltd^ 479 0.09KRW 51,583 Samsung Heavy Industries Co
Ltd 298 0.06Mining
KRW 1,157 Korea Zinc Co Ltd 427 0.08
Ccy Holding InvestmentFair value
$'000
% of netassetvalue
Republic of South Korea (31 July 2017: 20.78%) (cont) Oil & gas
KRW 6,726 GS Holdings Corp 323 0.06KRW 5,849 S-Oil Corp 614 0.12KRW 8,473 SK Innovation Co Ltd 1,504 0.29
Pharmaceuticals KRW 4,523 Celltrion Healthcare Co Ltd^ 369 0.07KRW 10,672 Celltrion Inc^ 2,590 0.50KRW 1,998 Celltrion Pharm Inc 125 0.02KRW 835 Hanmi Pharm Co Ltd 317 0.06KRW 1,855 Hanmi Science Co Ltd 115 0.02KRW 1,764 ViroMed Co Ltd 315 0.06KRW 1,223 Yuhan Corp 244 0.05
Retail KRW 1,399 CJ ENM Co Ltd 290 0.06KRW 2,827 E-Mart Inc 552 0.10KRW 3,709 GS Retail Co Ltd^ 110 0.02KRW 4,304 Hotel Shilla Co Ltd 384 0.07KRW 2,112 Hyundai Department Store Co
Ltd 186 0.04KRW 1,445 Lotte Shopping Co Ltd 266 0.05KRW 9,932 Samsung C&T Corp 1,096 0.21KRW 1,013 Shinsegae Inc 301 0.06
Semiconductors KRW 633,694 Samsung Electronics Co Ltd 26,200 5.00KRW 112,668 Samsung Electronics Co Ltd
(Preference) 3,852 0.73KRW 76,490 SK Hynix Inc 5,901 1.13
Software KRW 3,494 Netmarble Corp 451 0.09
Telecommunications KRW 4,270 KT Corp 109 0.02KRW 7,198 Samsung SDI Co Ltd^ 1,473 0.28KRW 2,767 SK Telecom Co Ltd 620 0.12
Toys KRW 738 Pearl Abyss Corp 145 0.03
Transportation KRW 971 CJ Logistics Corp 131 0.03KRW 2,466 Hyundai Glovis Co Ltd 302 0.06KRW 28,380 Pan Ocean Co Ltd 131 0.02
Total Republic of South Korea 98,869 18.88
Singapore (31 July 2017: Nil) Diversified financial services
HKD 27,200 BOC Aviation Ltd 171 0.03Total Singapore 171 0.03
Taiwan (31 July 2017: 16.24%) Airlines
TWD 421,000 China Airlines Ltd 136 0.03TWD 270,858 Eva Airways Corp 133 0.02

iSHARES VII PLC
Schedule of Investments (continued) iSHARES MSCI EM ASIA UCITS ETF (continued) As at 31 July 2018
[ 1 7 2 ] i S H A R E S V I I P L C A N N U A L R E P O R T
Ccy Holding Investment Fair value
$'000
% of netassetvalue
Equities (31 July 2017: 99.03%) (cont) Taiwan (31 July 2017: 16.24%) (cont) Apparel retailers
TWD 24,869 Eclat Textile Co Ltd 286 0.06TWD 33,884 Feng TAY Enterprise Co Ltd 195 0.04TWD 305,000 Pou Chen Corp 335 0.06
Auto parts & equipment TWD 243,154 Cheng Shin Rubber Industry Co
Ltd 376 0.07Banks
TWD 725,304 Chang Hwa Commercial Bank Ltd 429 0.08
TWD 505,784 Taiwan Business Bank 167 0.03Biotechnology
TWD 24,000 TaiMed Biologics Inc 201 0.04Building materials and fixtures
TWD 310,385 Asia Cement Corp 413 0.08TWD 546,700 Taiwan Cement Corp 703 0.13
Chemicals TWD 461,190 Formosa Chemicals & Fibre Corp 1,815 0.35TWD 576,520 Formosa Plastics Corp 2,118 0.40TWD 662,260 Nan Ya Plastics Corp 1,837 0.35
Computers TWD 413,942 Acer Inc 338 0.06TWD 47,745 Advantech Co Ltd 316 0.06TWD 90,000 Asustek Computer Inc 775 0.15TWD 72,591 Chicony Electronics Co Ltd 164 0.03TWD 574,000 Compal Electronics Inc 356 0.07TWD 118,770 Foxconn Technology Co Ltd 294 0.06TWD 1,139,176 Innolux Corp 428 0.08TWD 273,000 Inventec Corp 218 0.04TWD 288,572 Lite-On Technology Corp 379 0.07TWD 353,000 Quanta Computer Inc 610 0.12TWD 350,706 Wistron Corp 271 0.05
Diversified financial services TWD 1,708,000 China Development Financial
Holding Corp 625 0.12TWD 2,303,847 CTBC Financial Holding Co Ltd 1,561 0.30TWD 1,323,489 E.Sun Financial Holding Co Ltd 923 0.18TWD 1,323,042 First Financial Holding Co Ltd 910 0.17TWD 875,436 Fubon Financial Holding Co Ltd 1,450 0.28TWD 985,838 Hua Nan Financial Holdings Co
Ltd 591 0.11TWD 1,425,578 Mega Financial Holding Co Ltd 1,269 0.24TWD 1,456,978 SinoPac Financial Holdings Co
Ltd 547 0.10TWD 1,246,234 Taishin Financial Holding Co Ltd 611 0.12TWD 1,143,864 Taiwan Cooperative Financial
Holding Co Ltd 699 0.13TWD 1,305,853 Yuanta Financial Holding Co Ltd 601 0.12
Electrical components & equipment TWD 276,196 Delta Electronics Inc 961 0.18
Ccy Holding InvestmentFair value
$'000
% of netassetvalue
Taiwan (31 July 2017: 16.24%) (cont) Electronics
TWD 1,139,000 AU Optronics Corp 491 0.09TWD 2,161,485 Hon Hai Precision Industry Co
Ltd 5,917 1.13TWD 92,000 Micro-Star International Co Ltd 316 0.06TWD 256,000 Pegatron Corp 569 0.11TWD 174,300 Synnex Technology International
Corp 249 0.05TWD 43,000 Walsin Technology Corp 487 0.09TWD 213,000 WPG Holdings Ltd 295 0.06TWD 34,745 Yageo Corp 886 0.17
Food TWD 56,012 Standard Foods Corp 108 0.02TWD 632,548 Uni-President Enterprises Corp 1,670 0.32
Home furnishings TWD 23,000 Nien Made Enterprise Co Ltd 199 0.04
Insurance TWD 1,071,227 Cathay Financial Holding Co Ltd 1,844 0.35TWD 332,687 China Life Insurance Co Ltd 352 0.07TWD 1,137,358 Shin Kong Financial Holding Co
Ltd 431 0.08Iron & steel
TWD 1,661,323 China Steel Corp 1,357 0.26Leisure time
TWD 32,000 Giant Manufacturing Co Ltd 137 0.03Machinery - diversified
TWD 275,000 Teco Electric and Machinery Co Ltd 201 0.04Metal fabricate/ hardware
TWD 84,000 Catcher Technology Co Ltd 1,033 0.20Miscellaneous manufacturers
TWD 29,763 Hiwin Technologies Corp 291 0.05TWD 14,000 Largan Precision Co Ltd 2,355 0.45
Oil & gas TWD 157,000 Formosa Petrochemical Corp 618 0.12
Real estate investment & services TWD 82,400 Highwealth Construction Corp 127 0.02TWD 97,800 Ruentex Development Co Ltd 109 0.02
Retail TWD 38,000 Hotai Motor Co Ltd 330 0.06TWD 71,000 President Chain Store Corp 781 0.15TWD 78,000 Ruentex Industries Ltd 149 0.03
Semiconductors TWD 458,571 ASE Technology Holding Co Ltd 1,174 0.22TWD 30,000 Globalwafers Co Ltd 507 0.10TWD 253,000 Macronix International 351 0.07TWD 200,352 MediaTek Inc 1,662 0.32TWD 135,000 Nanya Technology Corp 347 0.07TWD 79,000 Novatek Microelectronics Corp 382 0.07TWD 20,000 Phison Electronics Corp 166 0.03TWD 95,000 Powertech Technology Inc 268 0.05

iSHARES VII PLC
Schedule of Investments (continued) iSHARES MSCI EM ASIA UCITS ETF (continued) As at 31 July 2018
i S H A R E S V I I P L C A N N U A L R E P O R T [ 1 7 3 ]
Ccy Holding Investment Fair value
$'000
% of netassetvalue
Equities (31 July 2017: 99.03%) (cont) Taiwan (31 July 2017: 16.24%) (cont) Semiconductors (cont)
TWD 64,000 Realtek Semiconductor Corp 257 0.05TWD 3,236,000 Taiwan Semiconductor
Manufacturing Co Ltd 26,003 4.96TWD 1,572,000 United Microelectronics Corp 901 0.17TWD 124,000 Vanguard International
Semiconductor Corp 316 0.06TWD 49,000 Win Semiconductors Corp 237 0.05TWD 406,000 Winbond Electronics Corp 265 0.05
Telecommunications TWD 497,000 Chunghwa Telecom Co Ltd 1,721 0.33TWD 210,000 Far EasTone
Telecommunications Co Ltd 498 0.09TWD 81,000 HTC Corp 142 0.03TWD 210,000 Taiwan Mobile Co Ltd 724 0.14
Textile TWD 450,277 Far Eastern New Century Corp 479 0.09TWD 132,000 Formosa Taffeta Co Ltd 140 0.03
Transportation TWD 261,666 Evergreen Marine Corp Taiwan
Ltd 118 0.02TWD 242,000 Taiwan High Speed Rail Corp 197 0.04
Total Taiwan 82,198 15.69
Thailand (31 July 2017: 2.88%) Banks
THB 31,100 Bangkok Bank PCL 194 0.04THB 153,611 Kasikornbank PCL 1,039 0.20THB 82,000 Kasikornbank PCL (NVDR) 535 0.10THB 491,200 Krung Thai Bank PCL 281 0.05THB 242,199 Siam Commercial Bank PCL 1,019 0.19THB 1,278,000 TMB Bank PCL 88 0.02
Chemicals THB 200,500 Indorama Ventures PCL 358 0.07THB 1,381,400 IRPC PCL 268 0.05THB 292,996 PTT Global Chemical PCL 720 0.14
Coal THB 280,125 Banpu PCL 178 0.03
Electricity THB 16,300 Electricity Generating PCL 113 0.02THB 70,800 Glow Energy PCL 199 0.04
Electronics THB 72,902 Delta Electronics Thailand PCL 153 0.03
Energy - alternate sources THB 169,400 Energy Absolute PCL 182 0.03
Engineering & construction THB 560,600 Airports of Thailand PCL 1,116 0.21
Food THB 170,800 Berli Jucker PCL 293 0.06THB 411,551 Charoen Pokphand Foods PCL 337 0.06THB 214,800 Thai Union Group PCL 106 0.02
Ccy Holding InvestmentFair value
$'000
% of netassetvalue
Thailand (31 July 2017: 2.88%) (cont) Healthcare services
THB 537,600 Bangkok Dusit Medical Services PCL 428 0.08
THB 53,900 Bumrungrad Hospital PCL 294 0.06Holding companies - diversified operations
THB 49,887 Siam Cement PCL 672 0.13Home builders
THB 389,000 Land & Houses PCL 140 0.03Oil & gas
THB 182,091 PTT Exploration & Production PCL 758 0.14
THB 1,384,960 PTT PCL 2,134 0.41THB 153,922 Thai Oil PCL 371 0.07
Real estate investment & services THB 184,700 Central Pattana PCL 421 0.08
Retail THB 650,268 CP ALL PCL 1,466 0.28THB 550,300 Home Product Center PCL 243 0.05THB 297,620 Minor International PCL 340 0.06THB 69,900 Robinson PCL 133 0.03
Telecommunications THB 132,629 Advanced Info Service PCL 805 0.15THB 1,257,490 True Corp PCL 236 0.05
Transportation THB 895,200 Bangkok Expressway & Metro
PCL 225 0.04THB 814,300 BTS Group Holdings PCL 231 0.05
Total Thailand 16,076 3.07
United States (31 July 2017: 0.38%) Retail
USD 48,005 Yum China Holdings Inc^ 1,732 0.33Total United States 1,732 0.33Total equities 515,439 98.41
Rights (31 July 2017: Nil) Taiwan (31 July 2017: Nil)
TWD 479 ACER - Rights 6 July 2018 - 0.00TWD 990 HIWIN Technologies - Rights 31
August 2018 2 0.00Total Taiwan 2 0.00Total rights 2 0.00 ETF (31 July 2017: Nil) Ireland (31 July 2017: Nil)
USD 593,732 iShares MSCI China A UCITS ETF**^ 2,239 0.43Total Ireland 2,239 0.43Total ETF 2,239 0.43

iSHARES VII PLC
Schedule of Investments (continued) iSHARES MSCI EM ASIA UCITS ETF (continued) As at 31 July 2018
[ 1 7 4 ] i S H A R E S V I I P L C A N N U A L R E P O R T
CcyNo. of
contracts
Underlying exposure
$'000 Fair value
$'000
% of netassetsvalue
Financial derivative instruments (31 July 2017: 0.04%) Futures contracts (31 July 2017: 0.04%)
USD 103 MSCI Emerging Markets Index Futures September 2018 5,523 123 0.02Total unrealised gains on futures contracts 123 0.02Total financial derivative instruments 123 0.02
Fair value$'000
% of net assetvalue
Total value of investments 517,803 98.86 Cash† 3,021 0.58 Other net assets 2,909 0.56 Net asset value attributable to redeemable participating shareholders at the end of the financial year 523,733 100.00
† Cash holdings of $2,828,755 are held with State Street Bank and Trust Company. $192,163 is held as security for futures contracts with Credit Suisse AG. ^ These securities are partially or fully transferred as securities lent. * These securities were valued in consultation with the Manager. These securities were priced at zero at financial year end. ** Investment in related party.
Equities are primarily classified by country of incorporation of the entity in which the Fund holds shares. Exchange Traded Funds are primarily classified by the country of domicile of the ETF. Underlying exposure has been calculated according to the guidelines issued by the ESMA and represents the market value of an equivalent position in the assets underlying each financial derivative instrument.
Analysis of total current assets gross of all liabilities
Fair value$'000
% of totalcurrentassets
Transferable securities admitted to an official stock exchange listing 517,680 98.78Exchange traded financial derivative instruments 123 0.02Other assets 6,265 1.20Total current assets 524,068 100.00

iSHARES VII PLC
Schedule of Investments (continued) iSHARES MSCI EMU CHF HEDGED UCITS ETF (Acc) As at 31 July 2018
i S H A R E S V I I P L C A N N U A L R E P O R T [ 1 7 5 ]
Ccy Holding Investment Fair value
Fr'000
% of netassetvalue
Transferable Securities Admitted to an Official Stock Exchange Listing or traded on a Regulated Market (31 July 2017: 99.55%)
Equities (31 July 2017: 99.55%) Austria (31 July 2017: 0.77%) Banks
EUR 1,904 Erste Group Bank AG 81 0.27EUR 926 Raiffeisen Bank International AG 31 0.10
Iron & steel EUR 726 Voestalpine AG^ 36 0.12
Machinery - diversified EUR 474 Andritz AG 27 0.09
Oil & gas EUR 947 OMV AG 53 0.18
Total Austria 228 0.76
Belgium (31 July 2017: 3.68%) Banks
EUR 1,587 KBC Group NV 121 0.40Beverages
EUR 4,664 Anheuser-Busch InBev SA/NV 468 1.56Chemicals
EUR 470 Solvay SA 64 0.21EUR 1,326 Umicore SA 77 0.26
Food EUR 375 Colruyt SA^ 22 0.07
Insurance EUR 1,203 Ageas 64 0.21
Investment services EUR 518 Groupe Bruxelles Lambert SA 54 0.18
Media EUR 317 Telenet Group Holding NV 15 0.05
Pharmaceuticals EUR 801 UCB SA 68 0.23
Telecommunications EUR 987 Proximus SADP 24 0.08
Total Belgium 977 3.25
Finland (31 July 2017: 3.11%) Auto parts & equipment
EUR 716 Nokian Renkaat Oyj^ 31 0.10Electricity
EUR 2,812 Fortum Oyj 70 0.23Forest products & paper
EUR 3,499 Stora Enso Oyj 57 0.19EUR 3,374 UPM-Kymmene Oyj 119 0.40
Insurance EUR 2,801 Sampo Oyj 141 0.47
Machinery - diversified EUR 2,138 Kone Oyj^ 116 0.39EUR 699 Metso Oyj 25 0.08
Ccy Holding InvestmentFair value
Fr'000
% of netassetvalue
Finland (31 July 2017: 3.11%) (cont) Miscellaneous manufacturers
EUR 2,809 Wartsila Oyj Abp 60 0.20Oil & gas
EUR 812 Neste Oyj 66 0.22Pharmaceuticals
EUR 642 Orion Oyj^ 22 0.07Telecommunications
EUR 910 Elisa Oyj 39 0.13EUR 34,696 Nokia Oyj 187 0.62
Total Finland 933 3.10
France (31 July 2017: 30.02%) Advertising
EUR 462 JCDecaux SA^ 15 0.05EUR 1,313 Publicis Groupe SA 83 0.28
Aerospace & defence EUR 17 Dassault Aviation SA^ 31 0.11EUR 2,037 Safran SA 250 0.83EUR 672 Thales SA 88 0.29
Apparel retailers EUR 199 Hermes International 125 0.42EUR 478 Kering SA 252 0.84EUR 1,707 LVMH Moet Hennessy Louis
Vuitton SE 591 1.96Auto manufacturers
EUR 3,721 Peugeot SA 106 0.35EUR 1,216 Renault SA 106 0.35
Auto parts & equipment EUR 1,077 Cie Generale des Etablissements
Michelin SCA 137 0.46EUR 497 Faurecia SA 34 0.11EUR 1,516 Valeo SA 74 0.24
Banks EUR 6,869 BNP Paribas SA 443 1.47EUR 7,203 Credit Agricole SA 100 0.33EUR 5,959 Natixis SA^ 43 0.14EUR 4,691 Societe Generale SA 207 0.69
Beverages EUR 1,340 Pernod Ricard SA 214 0.71EUR 145 Remy Cointreau SA 20 0.07
Building materials and fixtures EUR 3,041 Cie de Saint-Gobain 134 0.45EUR 238 Imerys SA 18 0.06
Chemicals EUR 2,620 Air Liquide SA 332 1.10EUR 431 Arkema SA 54 0.18
Commercial services EUR 1,705 Bureau Veritas SA^ 44 0.15EUR 1,490 Edenred^ 58 0.19

iSHARES VII PLC
Schedule of Investments (continued) iSHARES MSCI EMU CHF HEDGED UCITS ETF (Acc) (continued) As at 31 July 2018
[ 1 7 6 ] i S H A R E S V I I P L C A N N U A L R E P O R T
Ccy Holding Investment Fair value
Fr'000
% of netassetvalue
Equities (31 July 2017: 99.55%) (cont) France (31 July 2017: 30.02%) (cont) Computers
EUR 600 Atos SE 80 0.27EUR 1,011 Capgemini SE 129 0.43EUR 371 Ingenico Group SA^ 30 0.10EUR 372 Teleperformance 67 0.22
Cosmetics & personal care EUR 1,542 L'Oreal SA 374 1.24
Distribution & wholesale EUR 2,023 Rexel SA 31 0.10
Diversified financial services EUR 373 Amundi SA 26 0.09EUR 288 Eurazeo SA 22 0.07
Electrical components & equipment EUR 1,681 Legrand SA 122 0.41EUR 3,285 Schneider Electric SE 262 0.87
Electricity EUR 3,707 Electricite de France SA 55 0.18EUR 11,182 Engie SA 179 0.60
Engineering & construction EUR 185 Aeroports de Paris 41 0.14EUR 1,387 Bouygues SA 60 0.20EUR 496 Eiffage SA 55 0.18EUR 3,068 Vinci SA 306 1.02
Food EUR 3,678 Carrefour SA^ 65 0.22EUR 345 Casino Guichard Perrachon SA^ 14 0.05EUR 3,687 Danone SA 287 0.95
Food Service EUR 573 Sodexo SA^ 63 0.21
Healthcare products EUR 1,273 Essilor International Cie
Generale d'Optique SA^ 186 0.62Healthcare services
EUR 256 BioMerieux 21 0.07Holding companies - diversified operations
EUR 5,048 Bollore SA^ 23 0.08Home furnishings
EUR 141 SEB SA 27 0.09Hotels
EUR 1,196 Accor SA 61 0.20Household goods & home construction
EUR 177 Societe BIC SA^ 17 0.05Insurance
EUR 11,844 AXA SA 296 0.99EUR 1,086 CNP Assurances 25 0.08EUR 1,024 SCOR SE 40 0.13
Internet EUR 171 Iliad SA^ 27 0.09
Investment services EUR 184 Wendel SA 27 0.09
Ccy Holding InvestmentFair value
Fr'000
% of netassetvalue
France (31 July 2017: 30.02%) (cont) Media
EUR 6,352 Vivendi SA^ 163 0.54Miscellaneous manufacturers
EUR 984 Alstom SA 44 0.14Oil & gas
EUR 14,705 Total SA 951 3.16Pharmaceuticals
EUR 239 Ipsen SA 40 0.13EUR 6,899 Sanofi 594 1.98
Real estate investment trusts EUR 238 Covivio^ 25 0.08EUR 295 Gecina SA 50 0.17EUR 202 ICADE 19 0.06EUR 1,292 Klepierre SA 48 0.16EUR 853 Unibail-Rodamco-Westfield 188 0.63
Software EUR 819 Dassault Systemes SE 121 0.40EUR 487 Ubisoft Entertainment SA 54 0.18
Telecommunications EUR 1,062 Eutelsat Communications SA^ 22 0.07EUR 12,203 Orange SA 207 0.69
Transportation EUR 2,992 Getlink 39 0.13
Water EUR 2,309 Suez 32 0.11EUR 3,389 Veolia Environnement SA 77 0.25
Total France 9,251 30.75
Germany (31 July 2017: 28.58%) Aerospace & defence
EUR 334 MTU Aero Engines AG^ 70 0.23Airlines
EUR 1,511 Deutsche Lufthansa AG 42 0.14Apparel retailers
EUR 1,153 Adidas AG^ 253 0.84EUR 19 Puma SE 9 0.03EUR 34 Puma SE (Italy listed) 17 0.06
Auto manufacturers EUR 2,028 Bayerische Motoren Werke AG 194 0.64EUR 349 Bayerische Motoren Werke AG
(Preference) 29 0.10EUR 5,550 Daimler AG 380 1.26EUR 969 Porsche Automobil Holding SE 65 0.22EUR 208 Volkswagen AG 36 0.12EUR 1,137 Volkswagen AG (Preference) 200 0.67
Auto parts & equipment EUR 694 Continental AG 158 0.53EUR 1,101 Schaeffler AG^ 15 0.05
Banks EUR 6,472 Commerzbank AG 69 0.23EUR 12,260 Deutsche Bank AG^ 159 0.53

iSHARES VII PLC
Schedule of Investments (continued) iSHARES MSCI EMU CHF HEDGED UCITS ETF (Acc) (continued) As at 31 July 2018
i S H A R E S V I I P L C A N N U A L R E P O R T [ 1 7 7 ]
Ccy Holding Investment Fair value
Fr'000
% of netassetvalue
Equities (31 July 2017: 99.55%) (cont) Germany (31 July 2017: 28.58%) (cont)
Building materials and fixtures EUR 942 HeidelbergCement AG 79 0.26
Chemicals EUR 5,616 BASF SE 534 1.78EUR 978 Brenntag AG 58 0.19EUR 1,216 Covestro AG 116 0.38EUR 1,033 Evonik Industries AG 38 0.13EUR 429 Fuchs Petrolub SE^ 24 0.08EUR 1,213 K+S AG 32 0.11EUR 554 Lanxess AG 45 0.15EUR 1,171 Linde AG 286 0.95EUR 781 Symrise AG 70 0.23
Commercial services EUR 742 Wirecard AG 137 0.46
Cosmetics & personal care EUR 638 Beiersdorf AG 74 0.24
Diversified financial services EUR 1,219 Deutsche Boerse AG 159 0.53
Electrical components & equipment EUR 609 OSRAM Licht AG^ 27 0.09
Electricity EUR 13,484 E.ON SE 151 0.50EUR 885 Innogy SE^ 38 0.13EUR 3,280 RWE AG^ 85 0.28EUR 1,243 Uniper SE 38 0.13
Electronics EUR 233 Sartorius AG 38 0.12
Engineering & construction EUR 266 Fraport AG Frankfurt Airport
Services Worldwide 26 0.09EUR 123 Hochtief AG 22 0.07
Food EUR 1,075 Metro AG^ 13 0.04
Healthcare products EUR 935 Siemens Healthineers AG^ 41 0.14
Healthcare services EUR 1,363 Fresenius Medical Care AG & Co
KGaA^ 132 0.44EUR 2,547 Fresenius SE & Co KGaA^ 195 0.65
Household goods & home construction EUR 657 Henkel AG & Co KGaA 70 0.23EUR 1,126 Henkel AG & Co KGaA
(Preference) 140 0.47Insurance
EUR 2,692 Allianz SE 590 1.96EUR 385 Hannover Rueck SE 51 0.17EUR 948 Muenchener
Rueckversicherungs-Gesellschaft AG^ 208 0.69
Ccy Holding InvestmentFair value
Fr'000
% of netassetvalue
Germany (31 July 2017: 28.58%) (cont) Internet
EUR 582 Delivery Hero SE 33 0.11EUR 779 United Internet AG 41 0.14
Iron & steel EUR 2,759 ThyssenKrupp AG 73 0.24
Machinery - diversified EUR 1,077 GEA Group AG^ 42 0.14EUR 455 Kion Group AG 31 0.10EUR 223 MAN SE 25 0.08
Media EUR 308 Axel Springer SE 23 0.08EUR 1,497 ProSiebenSat.1 Media SE 40 0.13
Miscellaneous manufacturers EUR 4,661 Siemens AG 652 2.17
Pharmaceuticals EUR 5,455 Bayer AG 602 2.00EUR 818 Merck KGaA^ 83 0.28
Real estate investment & services EUR 2,242 Deutsche Wohnen SE 108 0.36EUR 3,067 Vonovia SE 147 0.49
Retail EUR 407 Hugo Boss AG 37 0.12EUR 692 Zalando SE 39 0.13
Semiconductors EUR 7,175 Infineon Technologies AG^ 188 0.63
Software EUR 5,990 SAP SE 693 2.30
Telecommunications EUR 327 1&1 Drillisch AG^ 19 0.06EUR 20,408 Deutsche Telekom AG 335 1.11EUR 4,770 Telefonica Deutschland Holding
AG^ 21 0.07Transportation
EUR 6,018 Deutsche Post AG 211 0.70Total Germany 8,656 28.78
Ireland (31 July 2017: 1.36%) Airlines
EUR 847 Ryanair Holdings Plc 14 0.05Banks
EUR 5,027 AIB Group Plc 29 0.10EUR 6,123 Bank of Ireland Group Plc 52 0.17
Building materials and fixtures EUR 5,137 CRH Plc 174 0.58
Entertainment EUR 536 Paddy Power Betfair Plc 58 0.19
Food EUR 1,003 Kerry Group Plc 105 0.35
Forest products & paper EUR 1,427 Smurfit Kappa Group Plc 58 0.19
Total Ireland 490 1.63

iSHARES VII PLC
Schedule of Investments (continued) iSHARES MSCI EMU CHF HEDGED UCITS ETF (Acc) (continued) As at 31 July 2018
[ 1 7 8 ] i S H A R E S V I I P L C A N N U A L R E P O R T
Ccy Holding Investment Fair value
Fr'000
% of netassetvalue
Equities (31 July 2017: 99.55%) (cont)
Italy (31 July 2017: 6.21%) Aerospace & defence
EUR 2,228 Leonardo SpA 26 0.09Apparel retailers
EUR 1,142 Moncler SpA^ 50 0.16Auto parts & equipment
EUR 2,532 Pirelli & C SpA 22 0.07Banks
EUR 82,301 Intesa Sanpaolo SpA 251 0.84EUR 5,631 Intesa Sanpaolo SpA (non-
voting) 18 0.06EUR 3,918 Mediobanca Banca di Credito
Finanziario SpA 40 0.13EUR 12,674 UniCredit SpA 223 0.74
Beverages EUR 3,586 Davide Campari-Milano SpA 30 0.10
Commercial services EUR 3,135 Atlantia SpA 92 0.30
Electrical components & equipment EUR 1,524 Prysmian SpA 39 0.13
Electricity EUR 49,840 Enel SpA 275 0.91EUR 8,909 Terna Rete Elettrica Nazionale
SpA 50 0.17Gas
EUR 14,643 Snam SpA 62 0.21Insurance
EUR 7,589 Assicurazioni Generali SpA 133 0.44EUR 3,139 Poste Italiane SpA^ 29 0.10
Oil & gas EUR 15,567 Eni SpA 297 0.99
Pharmaceuticals EUR 640 Recordati SpA 24 0.08
Retail EUR 1,074 Luxottica Group SpA 72 0.24
Telecommunications EUR 73,309 Telecom Italia SpA 56 0.19EUR 38,765 Telecom Italia SpA (non-voting)^ 26 0.08
Total Italy 1,815 6.03
Luxembourg (31 July 2017: 0.92%) Healthcare services
EUR 73 Eurofins Scientific SE^ 39 0.13Iron & steel
EUR 4,193 ArcelorMittal 134 0.45Media
EUR 235 RTL Group SA 17 0.06Metal fabricate/ hardware
EUR 2,990 Tenaris SA^ 54 0.18Telecommunications
EUR 2,315 SES SA^ 46 0.15Total Luxembourg 290 0.97
Ccy Holding InvestmentFair value
Fr'000
% of netassetvalue
Netherlands (31 July 2017: 13.58%) Aerospace & defence
EUR 3,554 Airbus SE 436 1.45Auto manufacturers
EUR 776 Ferrari NV^ 103 0.34EUR 6,813 Fiat Chrysler Automobiles NV 115 0.38
Banks EUR 2,678 ABN Amro Group NV 73 0.24EUR 23,772 ING Groep NV 361 1.20
Beverages EUR 740 Heineken Holding NV^ 71 0.24EUR 1,637 Heineken NV 164 0.54
Chemicals EUR 1,596 Akzo Nobel NV 146 0.49EUR 1,147 Koninklijke DSM NV 121 0.40
Commercial services EUR 764 Randstad NV 48 0.16EUR 6,105 Relx NV 132 0.44
Cosmetics & personal care EUR 9,434 Unilever NV^ 538 1.79
Diversified financial services USD 817 AerCap Holdings NV^ 45 0.15
Food EUR 7,621 Koninklijke Ahold Delhaize NV 192 0.64
Healthcare products EUR 5,758 Koninklijke Philips NV 250 0.83EUR 1,445 Qiagen NV 52 0.17
Insurance EUR 11,280 Aegon NV 74 0.25EUR 1,941 NN Group NV 85 0.28
Investment services EUR 676 Exor NV 44 0.15
Machinery - diversified EUR 6,476 CNH Industrial NV^ 75 0.25
Media EUR 1,836 Wolters Kluwer NV^ 110 0.36
Pipelines EUR 425 Koninklijke Vopak NV 20 0.07
Semiconductors EUR 2,503 ASML Holding NV 532 1.77USD 2,169 NXP Semiconductors NV^ 205 0.68EUR 4,318 STMicroelectronics NV 93 0.31
Telecommunications EUR 21,337 Koninklijke KPN NV^ 61 0.20
Total Netherlands 4,146 13.78
Portugal (31 July 2017: 0.46%) Electricity
EUR 16,206 EDP - Energias de Portugal SA 66 0.22Food
EUR 1,620 Jeronimo Martins SGPS SA 24 0.08

iSHARES VII PLC
Schedule of Investments (continued) iSHARES MSCI EMU CHF HEDGED UCITS ETF (Acc) (continued) As at 31 July 2018
i S H A R E S V I I P L C A N N U A L R E P O R T [ 1 7 9 ]
Ccy Holding Investment Fair value
Fr'000
% of netassetvalue
Equities (31 July 2017: 99.55%) (cont) Portugal (31 July 2017: 0.46%) (cont) Oil & gas
EUR 3,214 Galp Energia SGPS SA 65 0.22Total Portugal 155 0.52
Spain (31 July 2017: 10.66%) Airlines
EUR 4,018 International Consolidated Airlines Group SA 37 0.12Banks
EUR 40,660 Banco Bilbao Vizcaya Argentaria SA 296 0.98
EUR 35,510 Banco de Sabadell SA 59 0.20EUR 98,336 Banco Santander SA 549 1.83EUR 7,774 Bankia SA 30 0.10EUR 4,383 Bankinter SA 42 0.14EUR 22,579 CaixaBank SA 104 0.34
Electricity EUR 2,055 Endesa SA 47 0.16EUR 35,305 Iberdrola SA 272 0.90EUR 1,008 Iberdrola SA (RFD) 8 0.02EUR 2,394 Red Electrica Corp SA 50 0.17
Energy - alternate sources EUR 1,511 Siemens Gamesa Renewable
Energy SA^ 21 0.07Engineering & construction
EUR 1,627 ACS Actividades de Construccion y Servicios SA 71 0.24
EUR 425 Aena SME SA 76 0.25EUR 3,114 Ferrovial SA 64 0.21
Ccy Holding InvestmentFair value
Fr'000
% of netassetvalue
Spain (31 July 2017: 10.66%) (cont) Gas
EUR 1,224 Enagas SA 34 0.11EUR 2,233 Naturgy Energy Group SA 60 0.20
Insurance EUR 6,567 Mapfre SA 20 0.07
Oil & gas EUR 8,547 Repsol SA 168 0.56
Pharmaceuticals EUR 1,879 Grifols SA 54 0.18
Retail EUR 6,633 Industria de Diseno Textil SA 216 0.72
Software EUR 2,760 Amadeus IT Group SA 233 0.78
Telecommunications EUR 28,505 Telefonica SA 254 0.84
Total Spain 2,765 9.19
United Kingdom (31 July 2017: 0.20%) Beverages
USD 1,326 Coca-Cola European Partners Plc 54 0.18Total United Kingdom 54 0.18Total equities 29,760 98.94
Rights (31 July 2017: 0.00%) France (31 July 2017: 0.00%)
Currency Amount
Purchased Currency Amount
SoldUnderlying
Exposure (Fr)Maturity
date
Unrealisedgain/(loss)
Fr'000
% of netassetvalue
Financial derivative instruments (31 July 2017: (4.18)%) Forward currency contracts* (31 July 2017: (4.18)%)
CHF 29,451,562 EUR 25,412,148 29,436,160 03/08/2018 15 0.05CHF 29,716,365 EUR 25,662,687 29,718,294 04/09/2018 (3) (0.01)CHF 346,917 USD 350,283 346,780 03/08/2018 - 0.00CHF 334,424 USD 338,726 334,425 05/09/2018 - 0.00EUR 737,180 CHF 854,617 853,912 03/08/2018 1 0.00USD 11,557 CHF 11,451 11,441 03/08/2018 - 0.00USD 30,760 CHF 30,370 30,370 05/09/2018 - 0.00
Total unrealised gains on forward currency contracts 16 0.05 Total unrealised losses on forward currency contracts (3) (0.01) Net unrealised gains on forward currency contracts 13 0.04

iSHARES VII PLC
Schedule of Investments (continued) iSHARES MSCI EMU CHF HEDGED UCITS ETF (Acc) (continued) As at 31 July 2018
[ 1 8 0 ] i S H A R E S V I I P L C A N N U A L R E P O R T
CcyNo. of
contracts
Underlying exposure
Fr'000 Fair value
Fr'000
% of netassetsvalue
Financial derivative instruments (31 July 2017: (4.18)%) (cont) Futures contracts (31 July 2017: 0.00%)
EUR 7 Euro Stoxx 50 Index Futures September 2018 279 7 0.02
EUR 1 Ibex Mini Index Futures August 2018 11 - 0.00Total unrealised gains on futures contracts 7 0.02Total financial derivative instruments 20 0.06
Fair valueFr'000
% of net assetvalue
Total value of investments 29,780 99.00 Cash† 243 0.81 Other net assets 57 0.19 Net asset value attributable to redeemable participating shareholders at the end of the financial year 30,080 100.00
† Cash holdings of Fr213,731 are held with State Street Bank and Trust Company. Fr29,392 is held as security for futures contracts with Morgan Stanley & Co International Plc. * The counterparty for forward currency contracts is State Street Bank and Trust Company. ^ These securities are partially or fully transferred as securities lent.
Equities are primarily classified by country of incorporation of the entity in which the Fund holds shares. Underlying exposure has been calculated according to the guidelines issued by the ESMA and represents the market value of an equivalent position in the assets underlying each financial derivative instrument.
Analysis of total current assets gross of all liabilities
Fair valueFr'000
% of totalcurrentassets
Transferable securities admitted to an official stock exchange listing 29,760 98.90Exchange traded financial derivative instruments 7 0.02Over-the-counter financial derivative instruments 16 0.05Other assets 310 1.03Total current assets 30,093 100.00

iSHARES VII PLC
Schedule of Investments (continued) iSHARES MSCI EMU SMALL CAP UCITS ETF As at 31 July 2018
i S H A R E S V I I P L C A N N U A L R E P O R T [ 1 8 1 ]
Ccy Holding Investment Fair value
€'000
% of netassetvalue
Transferable Securities Admitted to an Official Stock Exchange Listing or traded on a Regulated Market (31 July 2017: 99.15%)
Equities (31 July 2017: 99.15%) Austria (31 July 2017: 3.88%) Aerospace & defence
EUR 44,553 FACC AG^ 847 0.08Auto manufacturers
EUR 27,941 Polytec Holding AG^ 377 0.04Banks
EUR 79,994 BAWAG Group AG^ 3,225 0.30Building materials and fixtures
EUR 235,003 Wienerberger AG^ 4,930 0.46Chemicals
EUR 25,936 Lenzing AG^ 2,814 0.27Computers
EUR 11,082 Kapsch TrafficCom AG^ 438 0.04EUR 95,065 S&T AG^ 2,310 0.22
Electrical components & equipment EUR 57,319 Zumtobel Group AG^ 353 0.03
Electricity EUR 70,974 EVN AG 1,208 0.11
Electronics EUR 50,768 AT&S Austria Technologie &
Systemtechnik AG^ 1,021 0.10Engineering & construction
EUR 21,735 Porr AG^ 659 0.06Food
EUR 25,036 Agrana Beteiligungs AG 571 0.05Food Service
EUR 13,320 DO & CO AG^ 799 0.08Insurance
EUR 241,518 UNIQA Insurance Group AG^ 2,069 0.20EUR 75,040 Vienna Insurance Group AG
Wiener Versicherung Gruppe 1,826 0.17Miscellaneous manufacturers
EUR 20,089 Semperit AG Holding^ 342 0.03Oil & gas services
EUR 21,886 Schoeller-Bleckmann Oilfield Equipment AG^ 2,138 0.20Real estate investment & services
EUR 128,441 CA Immobilien Anlagen AG^ 3,843 0.36EUR 182,666 Immofinanz AG 4,110 0.39EUR 87,900 S IMMO AG 1,635 0.15
Telecommunications EUR 324,597 Telekom Austria AG 2,415 0.23
Transportation EUR 67,535 Oesterreichische Post AG 2,738 0.26
Total Austria 40,668 3.83
Ccy Holding Investment Fair value
€'000
% of netassetvalue
Belgium (31 July 2017: 7.22%) Apparel retailers
EUR 10,732 Van de Velde NV 322 0.03Chemicals
EUR 76,950 Recticel SA^ 759 0.07EUR 55,902 Tessenderlo Group SA^ 1,923 0.18
Computers EUR 269,596 Econocom Group SA/NV^ 815 0.08
Distribution & wholesale EUR 48,625 D'ieteren SA/NV 1,811 0.17
Diversified financial services EUR 46,874 Ackermans & van Haaren NV 7,312 0.69EUR 38,965 Gimv NV 1,980 0.18
Electrical components & equipment EUR 70,766 Bekaert SA^ 1,703 0.16
Electricity EUR 54,801 Elia System Operator SA/NV 2,921 0.27
Electronics EUR 18,231 Barco NV 2,210 0.21EUR 23,799 EVS Broadcast Equipment SA^ 474 0.04
Engineering & construction EUR 22,328 Akka Technologies^ 1,407 0.13EUR 14,840 Cie d'Entreprises CFE^ 1,585 0.15
Entertainment EUR 29,404 Kinepolis Group NV^ 1,608 0.15
Food EUR 28,738 Greenyard NV^ 306 0.03
Healthcare products EUR 59,566 Biocartis NV 749 0.07EUR 39,410 Ion Beam Applications^ 881 0.08EUR 24,465 Mithra Pharmaceuticals SA^ 822 0.08
Holding companies - diversified operations EUR 30,806 Sofina SA 4,775 0.45
Household goods & home construction EUR 148,211 Ontex Group NV^ 3,830 0.36
Investment services EUR 78,289 KBC Ancora 3,676 0.35
Mining EUR 170,445 Nyrstar NV^ 699 0.07
Miscellaneous manufacturers EUR 342,654 AGFA-Gevaert NV^ 1,400 0.13
Pharmaceuticals EUR 87,756 Fagron 1,388 0.13EUR 81,478 Galapagos NV^ 7,677 0.72
Real estate investment trusts EUR 35,949 Aedifica SA 2,934 0.27EUR 39,982 Befimmo SA 2,055 0.19EUR 44,577 Cofinimmo SA 4,993 0.47

iSHARES VII PLC
Schedule of Investments (continued) iSHARES MSCI EMU SMALL CAP UCITS ETF (continued) As at 31 July 2018
[ 1 8 2 ] i S H A R E S V I I P L C A N N U A L R E P O R T
Ccy Holding Investment Fair value
€'000
% of netassetvalue
Equities (31 July 2017: 99.15%) (cont) Belgium (31 July 2017: 7.22%) (cont) Real estate investment trusts (cont)
EUR 26,571 Intervest Offices & Warehouses NV 595 0.06
EUR 13,674 Retail Estates NV 1,058 0.10EUR 34,094 Warehouses De Pauw CVA 3,914 0.37
Semiconductors EUR 40,474 Melexis NV^ 3,220 0.31EUR 114,998 X-Fab Silicon Foundries SE^ 983 0.09
Telecommunications EUR 58,623 Orange Belgium SA 804 0.08
Textile EUR 13,755 Sioen Industries NV 371 0.03
Transportation EUR 195,399 bpost SA 2,632 0.25EUR 306,509 Euronav NV 2,221 0.21EUR 57,013 Exmar NV 346 0.03
Total Belgium 79,159 7.44
Cyprus (31 July 2017: 0.00%) Banks
EUR 1,964,233 Cyprus Popular Bank PCL* - 0.00Total Cyprus - 0.00
Finland (31 July 2017: 5.88%) Airlines
EUR 110,997 Finnair Oyj 884 0.08Chemicals
EUR 197,294 Kemira Oyj 2,216 0.21EUR 74,968 Tikkurila Oyj^ 1,178 0.11
Commercial services EUR 176,016 Caverion Oyj^ 1,261 0.12EUR 74,234 Cramo Oyj 1,355 0.13EUR 153,151 Ramirent Oyj 1,312 0.12
Computers EUR 186,161 F-Secure Oyj 678 0.07EUR 108,613 Tieto Oyj 2,893 0.27
Diversified financial services EUR 25,361 Ferratum Oyj^ 450 0.04
Engineering & construction EUR 62,524 Lehto Group Oyj^ 637 0.06
Food EUR 22,377 Atria Oyj 212 0.02EUR 129,702 Kesko Oyj 6,234 0.59
Hand & machine tools EUR 134,148 Konecranes Oyj 4,439 0.42
Home builders EUR 308,370 YIT Oyj^ 1,792 0.17
Iron & steel EUR 610,190 Outokumpu Oyj^ 3,539 0.33
Ccy Holding Investment Fair value
€'000
% of netassetvalue
Finland (31 July 2017: 5.88%) (cont) Leisure time
EUR 221,357 Amer Sports Oyj^ 6,076 0.57Machinery - diversified
EUR 21,116 Ponsse Oyj 653 0.06EUR 254,736 Valmet Oyj 4,522 0.43
Machinery, construction & mining EUR 292,941 Outotec Oyj 2,061 0.19
Media EUR 148,889 Sanoma Oyj 1,262 0.12
Miscellaneous manufacturers EUR 107,640 Uponor Oyj^ 1,401 0.13
Packaging & containers EUR 215,481 Huhtamaki Oyj^ 6,626 0.62EUR 383,519 Metsa Board Oyj 3,402 0.32
Pharmaceuticals EUR 238,319 Oriola Oyj^ 658 0.06
Real estate investment & services EUR 786,839 Citycon Oyj^ 1,416 0.13EUR 294,762 Technopolis Oyj 1,138 0.11
Retail EUR 58,579 Stockmann Oyj Abp^ 247 0.02EUR 97,767 Tokmanni Group Corp 694 0.07
Telecommunications EUR 105,810 DNA Oyj^ 1,794 0.17
Transportation EUR 75,482 Cargotec Oyj 3,206 0.30
Total Finland 64,236 6.04
France (31 July 2017: 16.04%) Advertising
EUR 71,087 Ipsos 2,034 0.19Aerospace & defence
EUR 14,764 Figeac Aero^ 206 0.02EUR 37,436 LISI^ 1,110 0.10EUR 129,479 Ste Industrielle d'Aviation
Latecoere SA 524 0.05Airlines
EUR 377,155 Air France-KLM^ 2,946 0.28Auto parts & equipment
EUR 18,307 AKWEL 390 0.03EUR 120,766 Cie Plastic Omnium SA^ 4,332 0.41
Biotechnology EUR 61,237 Cellectis SA^ 1,544 0.15EUR 54,810 Genfit^ 1,328 0.12EUR 88,707 Innate Pharma SA 433 0.04
Building materials and fixtures EUR 47,101 Oeneo SA 485 0.05EUR 62,710 Tarkett SA^ 1,441 0.13EUR 40,407 Vicat SA 2,237 0.21

iSHARES VII PLC
Schedule of Investments (continued) iSHARES MSCI EMU SMALL CAP UCITS ETF (continued) As at 31 July 2018
i S H A R E S V I I P L C A N N U A L R E P O R T [ 1 8 3 ]
Ccy Holding Investment Fair value
€'000
% of netassetvalue
Equities (31 July 2017: 99.15%) (cont) France (31 July 2017: 16.04%) (cont)
Chemicals EUR 16,436 Plastivaloire 247 0.02
Commercial services EUR 197,403 ALD SA 3,016 0.28EUR 11,227 Assystem 314 0.03EUR 9,991 Devoteam SA 1,043 0.10EUR 394,808 Elis SA^ 7,762 0.73EUR 209,289 Europcar Mobility Group^ 1,801 0.17EUR 15,294 GL Events 373 0.04EUR 5,541 Groupe Crit 402 0.04EUR 14,320 Synergie SA 572 0.05
Computers EUR 10,533 Aubay 395 0.04EUR 28,740 Sopra Steria Group 4,351 0.41
Cosmetics & personal care EUR 24,790 Interparfums SA^ 936 0.09
Distribution & wholesale EUR 26,990 Jacquet Metal Service SA 680 0.06
Diversified financial services EUR 66,144 ABC Arbitrage^ 472 0.04EUR 12,760 FFP 1,465 0.14
Electrical components & equipment EUR 29,976 Mersen SA 1,061 0.10EUR 55,126 Nexans SA^ 1,579 0.15
Electricity EUR 50,851 Albioma SA 967 0.09EUR 22,559 Direct Energie 950 0.09
Engineering & construction EUR 57,492 Alten SA 4,884 0.46EUR 465,286 Altran Technologies SA^ 3,794 0.36EUR 37,070 Gaztransport Et Technigaz SA 2,078 0.20EUR 231,061 SPIE SA^ 3,750 0.35
Entertainment EUR 20,431 Cie des Alpes 605 0.06EUR 725,787 Technicolor SA^ 870 0.08
Environmental control EUR 192,274 Derichebourg SA 996 0.09
Food EUR 28,129 Bonduelle SCA^ 875 0.08EUR 10,498 Naturex^ 1,421 0.14EUR 53,462 Rallye SA^ 539 0.05
Food Service EUR 219,400 Elior Group SA^ 3,072 0.29
Gas EUR 170,087 Rubis SCA 8,581 0.81
Healthcare products EUR 10,614 Guerbet^ 631 0.06EUR 55,313 Sartorius Stedim Biotech^ 5,631 0.53
Ccy Holding Investment Fair value
€'000
% of netassetvalue
France (31 July 2017: 16.04%) (cont) Healthcare services
EUR 97,149 Korian SA^ 2,911 0.28EUR 9,906 LNA Sante SA 541 0.05EUR 90,345 Orpea 10,629 1.00
Home builders EUR 33,699 Kaufman & Broad SA^ 1,474 0.14
Hotels EUR 8,816 Pierre & Vacances SA^ 238 0.02
Insurance EUR 185,144 Coface SA 1,418 0.13
Internet EUR 1,110,774 Solocal Group^ 1,274 0.12
Leisure time EUR 72,801 Beneteau SA^ 1,024 0.10EUR 17,409 Trigano SA^ 2,141 0.20
Machinery - diversified EUR 21,733 Haulotte Group SA 279 0.03
Machinery, construction & mining EUR 23,733 Manitou BF SA 774 0.07
Media EUR 209,785 Lagardere SCA 5,242 0.50EUR 47,628 Metropole Television SA 878 0.08EUR 79,176 Television Francaise 1^ 735 0.07
Metal fabricate/ hardware EUR 641,061 Vallourec SA^ 3,539 0.33
Mining EUR 18,138 Eramet^ 1,540 0.15
Miscellaneous manufacturers EUR 35,937 Chargeurs SA^ 890 0.08
Office & business equipment EUR 67,579 Neopost SA 1,493 0.14
Oil & gas EUR 5,734 Esso SA Francaise 264 0.02EUR 113,769 Etablissements Maurel et Prom 714 0.07
Oil & gas services EUR 60,884 Bourbon Corp^ 266 0.02EUR 1,302,049 CGG SA 3,047 0.29
Packaging & containers EUR 13,256 Groupe Guillin 372 0.04
Pharmaceuticals EUR 13,186 Boiron SA^ 890 0.08EUR 40,071 DBV Technologies SA^ 1,218 0.12EUR 7,946 Virbac SA^ 970 0.09
Real estate investment & services EUR 87,306 Nexity SA 4,601 0.43
Real estate investment trusts EUR 99,318 Mercialys SA 1,522 0.14
Retail EUR 34,656 Fnac Darty SA 2,693 0.25EUR 90,797 Maisons du Monde SA 2,375 0.22

iSHARES VII PLC
Schedule of Investments (continued) iSHARES MSCI EMU SMALL CAP UCITS ETF (continued) As at 31 July 2018
[ 1 8 4 ] i S H A R E S V I I P L C A N N U A L R E P O R T
Ccy Holding Investment Fair value
€'000
% of netassetvalue
Equities (31 July 2017: 99.15%) (cont) France (31 July 2017: 16.04%) (cont) Retail (cont)
EUR 44,394 SRP Groupe SA^ 288 0.03Semiconductors
EUR 37,623 Soitec 2,760 0.26Software
EUR 11,903 Axway Software SA 230 0.02EUR 79,287 Worldline SA^ 4,043 0.38
Storage & warehousing EUR 4,696 ID Logistics Group^ 661 0.06
Total France 149,057 14.02
Germany (31 July 2017: 25.04%) Advertising
EUR 55,536 Stroeer SE & Co KGaA 2,916 0.27Aerospace & defence
EUR 10,251 OHB SE^ 305 0.03Agriculture
EUR 26,215 BayWa AG^ 762 0.07Apparel retailers
EUR 48,515 Gerry Weber International AG^ 280 0.03Auto parts & equipment
EUR 10,896 Bertrandt AG 943 0.09EUR 63,351 ElringKlinger AG^ 687 0.06EUR 13,876 Grammer AG 833 0.08EUR 29,145 JOST Werke AG 1,078 0.10EUR 87,095 Rheinmetall AG 8,997 0.85
Banks EUR 55,656 Comdirect Bank AG^ 705 0.06EUR 268,912 Deutsche Pfandbriefbank AG 3,603 0.34
Biotechnology EUR 38,652 Biotest AG 953 0.09EUR 58,706 MorphoSys AG 6,598 0.62
Building materials and fixtures EUR 16,838 Bauer AG 319 0.03EUR 4,954 STO SE & Co KGaA 545 0.05EUR 14,346 Surteco Group SE 358 0.03
Chemicals EUR 23,717 H&R GmbH & Co KGaA 272 0.03EUR 4,634 KWS Saat SE^ 1,562 0.15EUR 120,984 SGL Carbon SE^ 1,223 0.11
Commercial services EUR 10,517 Amadeus Fire AG 973 0.09EUR 250,691 Evotec AG 4,452 0.42EUR 47,899 Hamburger Hafen und Logistik
AG 945 0.09EUR 23,878 Sixt SE 2,646 0.25EUR 32,557 Sixt SE (non-voting) 2,321 0.22
Computers EUR 58,802 Bechtle AG 4,513 0.43EUR 65,086 Cancom SE^ 3,012 0.28
Ccy Holding Investment Fair value
€'000
% of netassetvalue
Germany (31 July 2017: 25.04%) (cont) Computers (cont)
EUR 16,327 Diebold Nixdorf AG^ 949 0.09EUR 103,011 Jenoptik AG 3,539 0.33EUR 24,747 SLM Solutions Group AG^ 611 0.06
Diversified financial services EUR 114,571 Aareal Bank AG^ 4,503 0.42EUR 46,586 Aurelius Equity Opportunities SE
& Co KGaA 2,460 0.23EUR 26,468 Deutsche Beteiligungs AG 986 0.09EUR 48,721 Grenke AG^ 4,606 0.43EUR 6,816 Hypoport AG^ 1,146 0.11EUR 3,866 MBB SE^ 368 0.04EUR 115,444 MLP SE 644 0.06EUR 23,365 Sixt Leasing SE 399 0.04EUR 45,807 Wuestenrot &
Wuerttembergische AG 855 0.08Electrical components & equipment
EUR 65,330 Leoni AG^ 2,846 0.27EUR 20,817 SMA Solar Technology AG 752 0.07EUR 26,728 Varta AG^ 634 0.06EUR 20,291 Vossloh AG^ 899 0.08
Electronics EUR 32,064 Isra Vision AG 1,687 0.16
Energy - alternate sources EUR 179,535 Encavis AG^ 1,113 0.10EUR 126,309 Nordex SE^ 1,212 0.11EUR 44,671 Verbio Vereinigte BioEnergie
AG^ 277 0.03Engineering & construction
EUR 60,466 Bilfinger SE 2,663 0.25Entertainment
EUR 5,252 bet-at-home.com AG^ 311 0.03EUR 120,099 Borussia Dortmund GmbH & Co
KGaA 742 0.07Food
EUR 80,035 HelloFresh SE 1,157 0.11EUR 139,638 Suedzucker AG^ 1,741 0.16
Hand & machine tools EUR 38,834 DMG Mori AG^ 1,761 0.17
Healthcare products EUR 80,471 Carl Zeiss Meditec AG^ 5,347 0.50EUR 6,307 Draegerwerk AG & Co KGaA 329 0.03EUR 14,153 Draegerwerk AG & Co KGaA
(non-voting)^ 929 0.09EUR 9,224 Stratec Biomedical AG^ 665 0.06
Healthcare services EUR 40,170 Rhoen Klinikum AG^ 1,009 0.09
Home furnishings EUR 6,825 Rational AG^ 3,999 0.38
Internet EUR 21,371 FinTech Group AG 636 0.06EUR 148,688 Rocket Internet SE^ 4,419 0.42EUR 215,175 Scout24 AG 9,575 0.90

iSHARES VII PLC
Schedule of Investments (continued) iSHARES MSCI EMU SMALL CAP UCITS ETF (continued) As at 31 July 2018
i S H A R E S V I I P L C A N N U A L R E P O R T [ 1 8 5 ]
Ccy Holding Investment Fair value
€'000
% of netassetvalue
Equities (31 July 2017: 99.15%) (cont) Germany (31 July 2017: 25.04%) (cont) Internet (cont)
EUR 5,486 XING SE^ 1,528 0.14EUR 12,128 Zooplus AG^ 1,797 0.17
Iron & steel EUR 78,201 Salzgitter AG^ 3,308 0.31
Leisure time EUR 115,182 CTS Eventim AG & Co KGaA^ 4,644 0.44
Machinery - diversified EUR 14,912 Aumann AG 890 0.08EUR 2,504 Basler AG^ 476 0.04EUR 237,976 Deutz AG 1,850 0.17EUR 103,776 Duerr AG 3,894 0.37EUR 517,405 Heidelberger Druckmaschinen
AG^ 1,271 0.12EUR 96,174 Jungheinrich AG 3,027 0.29EUR 28,099 Koenig & Bauer AG^ 1,869 0.18EUR 31,643 Krones AG 3,348 0.32EUR 13,814 Pfeiffer Vacuum Technology AG 1,939 0.18EUR 21,849 Washtec AG^ 1,632 0.15
Machinery, construction & mining EUR 54,827 Wacker Neuson SE 1,211 0.11
Metal fabricate/ hardware EUR 76,410 Aurubis AG 5,350 0.50EUR 146,585 Kloeckner & Co SE^ 1,381 0.13EUR 63,723 Norma Group SE^ 3,454 0.33
Miscellaneous manufacturers EUR 35,826 Indus Holding AG 1,924 0.18
Packaging & containers EUR 62,781 Gerresheimer AG^ 4,570 0.43
Pharmaceuticals EUR 39,863 Stada Arzneimittel AG 3,253 0.31
Real estate investment & services EUR 69,050 Adler Real Estate AG 986 0.09EUR 83,143 Consus Real Estate AG^ 624 0.06EUR 96,639 Deutsche EuroShop AG 2,915 0.28EUR 87,453 DIC Asset AG 853 0.08EUR 126,365 LEG Immobilien AG 12,161 1.14EUR 90,231 Patrizia Immobilien AG^ 1,741 0.16EUR 248,992 TAG Immobilien AG 4,818 0.45EUR 183,629 TLG Immobilien AG^ 4,106 0.39
Real estate investment trusts EUR 288,523 Alstria Office REIT AG 3,832 0.36EUR 127,523 Hamborner REIT AG 1,163 0.11
Retail EUR 348,310 CECONOMY AG^ 2,447 0.23EUR 9,881 Cewe Stiftung & Co KGAA 774 0.07EUR 15,760 Hornbach Baumarkt AG^ 399 0.04EUR 20,794 Hornbach Holding AG & Co
KGaA 1,237 0.12
Ccy Holding Investment Fair value
€'000
% of netassetvalue
Germany (31 July 2017: 25.04%) (cont) Retail (cont)
EUR 65,145 Takkt AG 1,050 0.10EUR 14,096 Vapiano SE^ 269 0.02
Semiconductors EUR 225,573 Aixtron SE 2,776 0.26EUR 22,121 Elmos Semiconductor AG 510 0.05EUR 41,987 Siltronic AG^ 6,262 0.59
Software EUR 46,804 CompuGroup Medical SE 2,232 0.21EUR 31,001 GFT Technologies SE^ 423 0.04EUR 38,488 Nemetschek SE^ 4,572 0.43EUR 68,659 RIB Software SE 1,304 0.12EUR 99,815 Software AG^ 4,031 0.38
Telecommunications EUR 78,386 ADVA Optical Networking SE^ 564 0.05EUR 256,077 Freenet AG^ 6,274 0.59
Transportation EUR 70,298 Hapag-Lloyd AG^ 2,438 0.23EUR 26,010 VTG AG^ 1,449 0.14
Total Germany 242,396 22.79
Ireland (31 July 2017: 3.75%) Agriculture
EUR 248,136 Origin Enterprises Plc 1,499 0.14Banks
EUR 295,939 Permanent TSB Group Holdings Plc 621 0.06Beverages
EUR 621,693 C&C Group Plc 2,139 0.20Building materials and fixtures
EUR 304,976 Kingspan Group Plc 12,114 1.14Food
EUR 414,400 Glanbia Plc 5,830 0.55Home builders
EUR 1,446,934 Cairn Homes Plc 2,489 0.23EUR 1,000,394 Glenveagh Properties Plc 1,120 0.11EUR 166,732 Glenveagh Properties Plc (non-
voting)* — 0.00Hotels
EUR 358,915 Dalata Hotel Group Plc 2,441 0.23Real estate investment trusts
EUR 1,281,486 Green REIT Plc 1,930 0.18EUR 1,352,812 Hibernia REIT Plc 1,969 0.18EUR 673,839 Irish Residential Properties REIT
Plc 926 0.09Transportation
EUR 313,385 Irish Continental Group Plc 1,642 0.16Total Ireland 34,720 3.27

iSHARES VII PLC
Schedule of Investments (continued) iSHARES MSCI EMU SMALL CAP UCITS ETF (continued) As at 31 July 2018
[ 1 8 6 ] i S H A R E S V I I P L C A N N U A L R E P O R T
Ccy Holding Investment Fair value
€'000
% of netassetvalue
Equities (31 July 2017: 99.15%) (cont)
Italy (31 July 2017: 15.87%) Apparel retailers
EUR 67,988 Brunello Cucinelli SpA^ 2,413 0.23EUR 152,538 Geox SpA^ 347 0.03EUR 20,085 Tod's SpA^ 1,096 0.10
Auto parts & equipment EUR 300,551 Brembo SpA^ 3,523 0.33EUR 88,774 Sogefi SpA^ 189 0.02
Banks EUR 68,010,012 Banca Carige SpA^ 605 0.06EUR 118,354 Banca Generali SpA^ 2,732 0.26EUR 520,444 Banca Mediolanum SpA^ 3,198 0.30EUR 557,023 Banca Monte dei Paschi di Siena
SpA^ 1,481 0.14EUR 893,575 Banca Popolare di Sondrio
SCPA^ 3,313 0.31EUR 3,029,754 Banco BPM SpA 8,241 0.77EUR 818,078 BPER Banca^ 3,911 0.37EUR 162,999 Credito Emiliano SpA^ 1,035 0.10EUR 16,915,816 Credito Valtellinese SpA 1,796 0.17EUR 804,832 FinecoBank Banca Fineco SpA 8,089 0.76EUR 2,059,352 Unione di Banche Italiane SpA^ 7,294 0.68
Building materials and fixtures EUR 149,546 Buzzi Unicem SpA^ 2,819 0.26EUR 82,532 Buzzi Unicem SpA (non-voting) 878 0.08EUR 86,631 Cementir Holding SpA^ 602 0.06EUR 31,244 Italmobiliare SpA 641 0.06
Commercial services EUR 87,042 ASTM SpA^ 2,028 0.19EUR 155,626 Societa Iniziative Autostradali e
Servizi SpA^ 2,362 0.22Distribution & wholesale
EUR 64,997 MARR SpA 1,501 0.14EUR 73,639 Safilo Group SpA^ 324 0.03
Diversified financial services EUR 658,285 Anima Holding SpA 3,025 0.28EUR 249,871 Azimut Holding SpA^ 3,589 0.34EUR 170,066 Banca Farmafactoring SpA^ 909 0.09EUR 42,376 Banca IFIS SpA^ 1,136 0.11EUR 78,169 doBank SpA^ 817 0.08EUR 34,750 Fila SpA^ 648 0.06EUR 208,038 Tamburi Investment Partners
SpA^ 1,311 0.12Electricity
EUR 3,132,352 A2A SpA 4,923 0.46EUR 105,102 ACEA SpA^ 1,422 0.13EUR 105,194 ERG SpA^ 2,024 0.19EUR 1,638,197 Hera SpA^ 4,646 0.44EUR 1,168,205 Iren SpA^ 2,829 0.27
Electronics EUR 20,734 El.En. SpA^ 586 0.06
Ccy Holding Investment Fair value
€'000
% of netassetvalue
Italy (31 July 2017: 15.87%) (cont) Energy - alternate sources
EUR 14,251 Bio On Spa^ 801 0.08EUR 238,766 Falck Renewables SpA^ 540 0.05
Engineering & construction EUR 22,601 Aeroporto Guglielmo Marconi Di
Bologna SpA^ 345 0.03EUR 541,654 Enav SpA^ 2,387 0.23EUR 335,114 Salini Impregilo SpA^ 757 0.07
Entertainment EUR 841,279 Juventus Football Club SpA^ 735 0.07EUR 186,128 Rai Way SpA 906 0.08
Food EUR 19,046 La Doria SpA^ 200 0.02
Food Service EUR 248,556 Autogrill SpA 2,324 0.22
Gas EUR 131,382 Ascopiave SpA^ 418 0.04EUR 970,798 Italgas SpA^ 4,777 0.45
Hand & machine tools EUR 34,512 IMA Industria Macchine
Automatiche SpA^ 2,485 0.23Healthcare products
EUR 44,774 DiaSorin SpA^ 4,110 0.39Holding companies - diversified operations
EUR 606,128 CIR-Compagnie Industriali Riunite SpA^ 630 0.06Home furnishings
EUR 134,526 De' Longhi SpA^ 3,385 0.32Insurance
EUR 301,111 Societa Cattolica di Assicurazioni SC^ 2,370 0.22
EUR 794,035 Unipol Gruppo SpA 2,825 0.27EUR 48,898 Vittoria Assicurazioni SpA^ 682 0.06
Internet EUR 390,549 Cerved Group SpA 3,839 0.36EUR 41,136 Reply SpA^ 2,382 0.23
Investment services EUR 171,885 DeA Capital SpA 222 0.02
Leisure time EUR 323,093 Piaggio & C SpA 730 0.07EUR 180,866 Technogym SpA 1,687 0.16
Machinery - diversified EUR 27,605 Biesse SpA^ 974 0.09EUR 70,376 Gima TT SpA^ 938 0.09EUR 152,396 Interpump Group SpA^ 4,106 0.38EUR 8,189 Prima Industrie SpA^ 298 0.03
Machinery, construction & mining EUR 25,637 Danieli & C Officine Meccaniche
SpA^ 539 0.05EUR 72,824 Danieli & C Officine Meccaniche
SpA (non-voting) 1,092 0.10

iSHARES VII PLC
Schedule of Investments (continued) iSHARES MSCI EMU SMALL CAP UCITS ETF (continued) As at 31 July 2018
i S H A R E S V I I P L C A N N U A L R E P O R T [ 1 8 7 ]
Ccy Holding Investment Fair value
€'000
% of netassetvalue
Equities (31 July 2017: 99.15%) (cont) Italy (31 July 2017: 15.87%) (cont)
Marine transportation EUR 969,334 Fincantieri SpA^ 1,251 0.12
Media EUR 233,723 Arnoldo Mondadori Editore SpA^ 341 0.03EUR 145,136 Cairo Communication SpA^ 470 0.05EUR 708,598 Mediaset SpA^ 2,057 0.19
Office & business equipment EUR 40,842 Datalogic SpA^ 1,176 0.11
Oil & gas EUR 929,109 Saras SpA^ 1,905 0.18
Oil & gas services EUR 274,928 Maire Tecnimont SpA 1,220 0.11EUR 1,212,933 Saipem SpA^ 5,423 0.51
Packaging & containers EUR 56,518 Zignago Vetro SpA^ 459 0.04
Pharmaceuticals EUR 158,406 Amplifon SpA^ 3,035 0.29
Real estate investment trusts EUR 1,781,995 Beni Stabili SpA SIIQ^ 1,345 0.12EUR 115,286 Immobiliare Grande Distribuzione
SIIQ SpA^ 834 0.08Retail
EUR 377,013 OVS SpA^ 1,052 0.10EUR 98,948 Salvatore Ferragamo SpA 1,958 0.18
Software EUR 15,499 Sesa SpA 468 0.04
Telecommunications EUR 33,129 Ei Towers SpA^ 1,888 0.18EUR 468,956 Infrastrutture Wireless Italiane
SpA^ 3,283 0.31Textile
EUR 29,614 Aquafil SpA 384 0.04Total Italy 164,316 15.45
Luxembourg (31 July 2017: 1.12%) Auto parts & equipment
EUR 89,047 SAF-Holland SA^ 1,266 0.12Computers
EUR 39,589 Solutions 30 SE 1,793 0.17Diversified financial services
EUR 25,549 Corestate Capital Holding SA^ 1,187 0.11Electrical components & equipment
EUR 48,530 Senvion SA^ 385 0.03Iron & steel
EUR 102,574 Aperam SA^ 4,142 0.39Machinery - diversified
EUR 49,383 Stabilus SA 3,595 0.34
Ccy Holding Investment Fair value
€'000
% of netassetvalue
Luxembourg (31 July 2017: 1.12%) (cont) Real estate investment & services
EUR 60,311 ADO Properties SA 2,943 0.28EUR 230,651 Grand City Properties SA 5,125 0.48
Total Luxembourg 20,436 1.92
Marshall Islands (31 July 2017: 0.08%) Netherlands (31 July 2017: 9.01%) Agriculture
EUR 74,369 ForFarmers NV 723 0.07Banks
EUR 105,609 SNS REAAL NV* — 0.00Biotechnology
EUR 1,157,828 Pharming Group NV^ 1,501 0.14Chemicals
EUR 105,170 IMCD NV 6,536 0.61EUR 147,737 OCI NV^ 3,821 0.36
Commercial services EUR 37,201 Brunel International NV^ 521 0.05EUR 125,835 Intertrust NV 1,875 0.17
Computers EUR 153,694 Gemalto NV^ 7,666 0.72
Diversified financial services EUR 111,017 BinckBank NV 575 0.05EUR 111,969 Euronext NV 5,951 0.56EUR 65,143 Flow Traders^ 1,655 0.16
Electrical components & equipment EUR 224,269 Signify NV^ 5,320 0.50
Electronics EUR 77,068 TKH Group NV 4,127 0.39
Energy - alternate sources EUR 21,190 SIF Holding NV^ 376 0.03
Engineering & construction EUR 136,639 Arcadis NV^ 2,137 0.20EUR 173,338 Boskalis Westminster^ 4,548 0.43EUR 456,632 Koninklijke BAM Groep NV^ 1,605 0.15EUR 62,526 Koninklijke Volkerwessels NV^ 1,154 0.11
Food EUR 117,025 Corbion NV^ 3,429 0.33EUR 43,161 Takeaway.com NV^ 2,465 0.23EUR 152,119 Wessanen^ 1,936 0.18
Insurance EUR 293,942 ASR Nederland NV 11,258 1.06
Leisure time EUR 48,728 Accell Group^ 867 0.08EUR 59,946 Basic-Fit NV^ 1,673 0.16
Machinery - diversified EUR 25,030 Kendrion NV 926 0.09

iSHARES VII PLC
Schedule of Investments (continued) iSHARES MSCI EMU SMALL CAP UCITS ETF (continued) As at 31 July 2018
[ 1 8 8 ] i S H A R E S V I I P L C A N N U A L R E P O R T
Ccy Holding Investment Fair value
€'000
% of netassetvalue
Equities (31 July 2017: 99.15%) (cont) Netherlands (31 July 2017: 9.01%) (cont)
Metal fabricate/ hardware EUR 56,808 AMG Advanced Metallurgical
Group NV 2,874 0.27Mining
USD 242,078 Constellium NV 2,710 0.25Miscellaneous manufacturers
EUR 199,009 Aalberts Industries NV 7,722 0.73Oil & gas services
EUR 169,111 Fugro NV^ 2,086 0.19EUR 349,575 SBM Offshore NV 4,644 0.44
Real estate investment & services EUR 40,687 Instone Real Estate Group BV 895 0.08
Real estate investment trusts EUR 89,204 Eurocommercial Properties NV 3,229 0.30EUR 35,888 NSI NV 1,197 0.11EUR 26,658 Vastned Retail NV 1,035 0.10EUR 78,691 Wereldhave NV^ 2,501 0.24
Retail EUR 16,815 Shop Apotheke Europe NV^ 841 0.08
Semiconductors EUR 93,427 ASM International NV^ 4,619 0.43EUR 152,112 BE Semiconductor Industries
NV^ 2,829 0.27Software
USD 142,640 InterXion Holding NV 7,909 0.74EUR 260,034 TomTom NV^ 2,278 0.22
Transportation EUR 842,139 PostNL NV 2,846 0.27
Total Netherlands 122,860 11.55
Portugal (31 July 2017: 1.50%) Banks
EUR 18,133,560 Banco Comercial Portugues SA^ 4,867 0.46Commercial services
EUR 267,509 CTT-Correios de Portugal SA^ 804 0.07Electricity
EUR 800,473 REN - Redes Energeticas Nacionais SGPS SA^ 2,006 0.19Engineering & construction
EUR 118,739 Mota-Engil SGPS SA 340 0.03Food
EUR 1,599,718 Sonae SGPS SA^ 1,556 0.15Forest products & paper
EUR 135,268 Altri SGPS SA^ 1,184 0.11EUR 74,455 Corticeira Amorim SGPS SA^ 841 0.08EUR 430,433 Navigator Co SA 2,102 0.20EUR 47,650 Semapa-Sociedade de
Investimento e Gestao 958 0.09Media
EUR 503,310 NOS SGPS SA^ 2,507 0.24Total Portugal 17,165 1.62
Ccy Holding Investment Fair value
€'000
% of netassetvalue
Spain (31 July 2017: 9.14%) Auto parts & equipment
EUR 144,463 CIE Automotive SA^ 3,799 0.36EUR 337,350 Gestamp Automocion SA^ 2,173 0.20
Banks EUR 3,720,069 Liberbank SA^ 1,875 0.18EUR 1,771,007 Unicaja Banco SA 2,557 0.24
Biotechnology EUR 367,223 Pharma Mar SA^ 570 0.05
Chemicals EUR 199,732 Ercros SA 975 0.09
Commercial services EUR 257,400 Applus Services SA 3,187 0.30EUR 203,288 Global Dominion Access SA^ 909 0.09EUR 542,625 Prosegur Cia de Seguridad SA 3,087 0.29
Computers EUR 240,938 Indra Sistemas SA^ 2,503 0.24
Diversified financial services EUR 149,823 Bolsas y Mercados Espanoles
SHMSF SA^ 4,126 0.39Engineering & construction
EUR 45,578 Acciona SA^ 3,351 0.32EUR 151,331 Fomento de Construcciones y
Contratas SA^ 1,683 0.16EUR 257,834 Obrascon Huarte Lain SA^ 777 0.07EUR 15,934 Sacyr SA 43 0.00EUR 691,075 Sacyr SA^ 1,887 0.18EUR 66,105 Tecnicas Reunidas SA^ 1,910 0.18
Entertainment EUR 109,205 Codere SA 925 0.09
Environmental control EUR 101,346 Fluidra SA^ 1,220 0.11
Food EUR 1,054,895 Distribuidora Internacional de
Alimentacion SA^ 2,018 0.19EUR 153,829 Ebro Foods SA^ 2,846 0.27EUR 8,349 Pescanova SA^ 7 0.00EUR 78,992 Viscofan SA^ 4,660 0.44
Forest products & paper EUR 276,083 Ence Energia y Celulosa SA^ 2,228 0.21EUR 25,008 Miquel y Costas & Miquel SA 794 0.07EUR 89,308 Papeles y Cartones de Europa
SA 1,491 0.14Hotels
EUR 223,721 Melia Hotels International SA 2,517 0.23EUR 350,207 NH Hotel Group SA 2,201 0.21
Insurance EUR 84,336 Grupo Catalana Occidente SA 3,083 0.29
Internet EUR 119,504 eDreams ODIGEO SA^ 462 0.04EUR 23,944 Masmovil Ibercom SA^ 2,315 0.22
Investment services EUR 28,691 Corp Financiera Alba SA 1,413 0.13

iSHARES VII PLC
Schedule of Investments (continued) iSHARES MSCI EMU SMALL CAP UCITS ETF (continued) As at 31 July 2018
i S H A R E S V I I P L C A N N U A L R E P O R T [ 1 8 9 ]
Ccy Holding Investment Fair value
€'000
% of netassetvalue
Equities (31 July 2017: 99.15%) (cont) Spain (31 July 2017: 9.14%) (cont)
Iron & steel EUR 330,344 Acerinox SA^ 4,088 0.38
Machinery - diversified EUR 192,660 Talgo SA 882 0.09EUR 367,706 Zardoya Otis SA 3,008 0.28
Media EUR 176,443 Atresmedia Corp de Medios de
Comunicacion SA^ 1,182 0.11EUR 327,937 Mediaset Espana Comunicacion
SA^ 2,209 0.21EUR 279,046 Promotora de Informaciones SA^ 508 0.05
Metal fabricate/ hardware EUR 228,844 Tubacex SA^ 721 0.07
Pharmaceuticals EUR 127,099 Almirall SA^ 1,556 0.14EUR 533,494 Faes Farma SA 1,992 0.19
Real estate investment & services EUR 47,951 Aedas Homes SAU 1,453 0.14EUR 90,978 Metrovacesa SA 1,252 0.12EUR 157,977 Neinor Homes SA^ 2,559 0.24EUR 440,974 Realia Business SA 470 0.04
Real estate investment trusts EUR 520,104 Inmobiliaria Colonial Socimi SA 4,793 0.45EUR 183,071 Lar Espana Real Estate Socimi
SA 1,666 0.16EUR 702,201 Merlin Properties Socimi SA 8,883 0.83
Retail EUR 203,029 Telepizza Group SA 1,107 0.10
Telecommunications EUR 300,217 Cellnex Telecom SA^ 6,818 0.64EUR 178,613 Euskaltel SA^ 1,421 0.14EUR 38,771 Let's GOWEX SA*^ — 0.00
Transportation EUR 106,195 Cia de Distribucion Integral
Logista Holdings SA 2,151 0.20EUR 36,834 Construcciones y Auxiliar de
Ferrocarriles SA^ 1,400 0.13Total Spain 113,711 10.69
Switzerland (31 July 2017: 0.02%) Auto parts & equipment
EUR 18,498 EDAG Engineering Group AG 324 0.03Total Switzerland 324 0.03
United Kingdom (31 July 2017: 0.60%) Pharmaceuticals
EUR 7,162 Stallergenes Greer Plc^ 196 0.02Semiconductors
EUR 152,750 Dialog Semiconductor Plc^ 2,266 0.21Total United Kingdom 2,462 0.23Total equities 1,051,510 98.88
Ccy Holding Investment Fair value
€'000
% of netassetvalue
Rights (31 July 2017: 0.00%) France (31 July 2017: 0.00%) Warrants (31 July 2017: 0.00%) Spain (31 July 2017: 0.00%)
EUR 869,866 Abengoa SA Warrants 31 March 2025^* 9 0.00Total Spain 9 0.00Total Warrants 9 0.00
CcyNo. of
contracts
Underlying exposure
€'000 Fair value
€'000
% of netassetsvalue
Financial derivative instruments (31 July 2017: (0.01)%) Futures contracts (31 July 2017: (0.01)%)
EUR 293 Euro Stoxx 50 Index Futures September 2018 10,056 273 0.03Total unrealised gains on futures contracts 273 0.03Total financial derivative instruments 273 0.03
Fair value€'000
% of net assetvalue
Total value of investments 1,051,792 98.91 Cash† 9,893 0.93 Other net assets 1,736 0.16 Net asset value attributable to redeemable participating shareholders at the end of the financial year 1,063,421 100.00
† Cash holdings of €9,432,571 are held with State Street Bank and Trust Company. €460,331 is held as security for futures contracts with Credit Suisse AG. ^ These securities are partially or fully transferred as securities lent. * These securities were valued in consultation with the Investment Manager. These securities were delisted, suspended or priced at zero at the financial year end.
Equities are primarily classified by country of incorporation of the entity in which the Fund holds shares. Underlying exposure has been calculated according to the guidelines issued by the ESMA and represents the market value of an equivalent position in the assets underlying each financial derivative instrument.

iSHARES VII PLC
Schedule of Investments (continued) iSHARES MSCI EMU SMALL CAP UCITS ETF (continued) As at 31 July 2018
[ 1 9 0 ] i S H A R E S V I I P L C A N N U A L R E P O R T
Analysis of total current assets gross of all liabilities
Fair value€'000
% of totalcurrentassets
Transferable securities admitted to an official stock exchange listing 1,051,519 98.77Transferable securities dealt in on another regulated market - 0.00Other transferable securities of the type referred to in Regulation 68(1)(a), (b) and (c) - 0.00Exchange traded financial derivative instruments 273 0.03Other assets 12,771 1.20Total current assets 1,064,563 100.00

iSHARES VII PLC
Schedule of Investments (continued) iSHARES MSCI EMU UCITS ETF As at 31 July 2018
i S H A R E S V I I P L C A N N U A L R E P O R T [ 1 9 1 ]
Ccy Holding Investment Fair value
€'000
% of netassetvalue
Transferable Securities Admitted to an Official Stock Exchange Listing or traded on a Regulated Market (31 July 2017: 99.10%)
Equities (31 July 2017: 99.10%) Austria (31 July 2017: 0.77%) Banks
EUR 118,163 Erste Group Bank AG 4,367 0.26EUR 58,911 Raiffeisen Bank International AG 1,681 0.10
Iron & steel EUR 45,782 Voestalpine AG^ 1,963 0.12
Machinery - diversified EUR 29,713 Andritz AG 1,442 0.08
Oil & gas EUR 58,999 OMV AG 2,853 0.17
Total Austria 12,306 0.73
Belgium (31 July 2017: 3.66%) Banks
EUR 100,491 KBC Group NV 6,608 0.39Beverages
EUR 305,179 Anheuser-Busch InBev SA/NV 26,425 1.58Chemicals
EUR 29,766 Solvay SA 3,490 0.21EUR 82,730 Umicore SA^ 4,137 0.25
Food EUR 23,616 Colruyt SA^ 1,207 0.07
Insurance EUR 74,258 Ageas 3,405 0.20
Investment services EUR 32,576 Groupe Bruxelles Lambert SA 2,961 0.18
Media EUR 20,602 Telenet Group Holding NV 848 0.05
Pharmaceuticals EUR 49,944 UCB SA 3,669 0.22
Telecommunications EUR 60,990 Proximus SADP 1,277 0.08
Total Belgium 54,027 3.23
Finland (31 July 2017: 3.08%) Auto parts & equipment
EUR 45,108 Nokian Renkaat Oyj^ 1,673 0.10Electricity
EUR 177,106 Fortum Oyj 3,804 0.23Forest products & paper
EUR 217,386 Stora Enso Oyj 3,073 0.18EUR 211,923 UPM-Kymmene Oyj 6,434 0.39
Insurance EUR 174,538 Sampo Oyj 7,585 0.45
Machinery - diversified EUR 133,493 Kone Oyj^ 6,246 0.37EUR 44,898 Metso Oyj 1,406 0.09
Ccy Holding Investment Fair value
€'000
% of netassetvalue
Finland (31 July 2017: 3.08%) (cont) Miscellaneous manufacturers
EUR 177,204 Wartsila Oyj Abp 3,277 0.20Oil & gas
EUR 50,855 Neste Oyj 3,591 0.21Pharmaceuticals
EUR 41,493 Orion Oyj 1,222 0.07Telecommunications
EUR 56,262 Elisa Oyj 2,091 0.12EUR 2,305,064 Nokia Oyj 10,710 0.64
Total Finland 51,112 3.05
France (31 July 2017: 29.85%) Advertising
EUR 31,206 JCDecaux SA^ 872 0.05EUR 83,301 Publicis Groupe SA^ 4,553 0.27
Aerospace & defence EUR 954 Dassault Aviation SA 1,508 0.09EUR 133,598 Safran SA 14,168 0.85EUR 42,555 Thales SA 4,785 0.28
Apparel retailers EUR 12,605 Hermes International 6,827 0.41EUR 30,402 Kering SA 13,863 0.83EUR 111,721 LVMH Moet Hennessy Louis
Vuitton SE 33,388 1.99Auto manufacturers
EUR 238,407 Peugeot SA 5,867 0.35EUR 76,924 Renault SA 5,792 0.35
Auto parts & equipment EUR 68,393 Cie Generale des Etablissements
Michelin SCA 7,530 0.45EUR 29,998 Faurecia SA 1,744 0.10EUR 94,662 Valeo SA 3,976 0.24
Banks EUR 450,039 BNP Paribas SA 25,054 1.50EUR 449,226 Credit Agricole SA 5,397 0.32EUR 374,322 Natixis SA 2,302 0.14EUR 307,188 Societe Generale SA 11,707 0.70
Beverages EUR 84,938 Pernod Ricard SA 11,717 0.70EUR 8,982 Remy Cointreau SA^ 1,049 0.06
Building materials and fixtures EUR 197,933 Cie de Saint-Gobain 7,536 0.45EUR 13,611 Imerys SA 904 0.05
Chemicals EUR 171,562 Air Liquide SA 18,786 1.12EUR 26,774 Arkema SA 2,872 0.17
Commercial services EUR 107,396 Bureau Veritas SA 2,366 0.14EUR 93,985 Edenred 3,164 0.19

iSHARES VII PLC
Schedule of Investments (continued) iSHARES MSCI EMU UCITS ETF (continued) As at 31 July 2018
[ 1 9 2 ] i S H A R E S V I I P L C A N N U A L R E P O R T
Ccy Holding Investment Fair value
€'000
% of netassetvalue
Equities (31 July 2017: 99.10%) (cont) France (31 July 2017: 29.85%) (cont) Computers
EUR 37,614 Atos SE 4,320 0.26EUR 63,526 Capgemini SE 6,975 0.42EUR 23,705 Ingenico Group SA^ 1,682 0.10EUR 22,745 Teleperformance 3,567 0.21
Cosmetics & personal care EUR 100,929 L'Oreal SA 21,145 1.26
Distribution & wholesale EUR 120,577 Rexel SA 1,614 0.10
Diversified financial services EUR 23,753 Amundi SA 1,402 0.09EUR 18,414 Eurazeo SA 1,218 0.07
Electrical components & equipment EUR 106,351 Legrand SA 6,683 0.40EUR 215,103 Schneider Electric SE 14,808 0.88
Electricity EUR 230,705 Electricite de France SA 2,953 0.18EUR 730,824 Engie SA 10,096 0.60
Engineering & construction EUR 11,909 Aeroports de Paris 2,279 0.14EUR 88,165 Bouygues SA 3,316 0.20EUR 31,370 Eiffage SA 3,003 0.18EUR 201,490 Vinci SA 17,328 1.03
Food EUR 229,258 Carrefour SA^ 3,522 0.21EUR 22,619 Casino Guichard Perrachon SA^ 788 0.05EUR 241,635 Danone SA 16,240 0.97
Food Service EUR 35,667 Sodexo SA^ 3,377 0.20
Healthcare products EUR 83,263 Essilor International Cie
Generale d'Optique SA^ 10,508 0.63Healthcare services
EUR 16,237 BioMerieux 1,156 0.07Holding companies - diversified operations
EUR 359,111 Bollore SA 1,430 0.09Home furnishings
EUR 9,082 SEB SA 1,477 0.09Hotels
EUR 75,442 Accor SA 3,326 0.20Household goods & home construction
EUR 11,329 Societe BIC SA 926 0.06Insurance
EUR 776,755 AXA SA 16,778 1.00EUR 70,255 CNP Assurances 1,405 0.08EUR 68,795 SCOR SE 2,287 0.14
Internet EUR 10,459 Iliad SA 1,417 0.08
Ccy Holding Investment Fair value
€'000
% of netassetvalue
France (31 July 2017: 29.85%) (cont) Investment services
EUR 11,343 Wendel SA 1,414 0.08Media
EUR 414,773 Vivendi SA 9,208 0.55Miscellaneous manufacturers
EUR 63,926 Alstom SA 2,454 0.15Oil & gas
EUR 965,008 Total SA 53,905 3.22Pharmaceuticals
EUR 14,941 Ipsen SA 2,124 0.12EUR 451,926 Sanofi 33,610 2.01
Real estate investment trusts EUR 14,920 Covivio 1,330 0.08EUR 18,786 Gecina SA 2,741 0.16EUR 12,681 ICADE 1,050 0.06EUR 87,677 Klepierre SA 2,829 0.17EUR 55,337 Unibail-Rodamco-Westfield^ 10,506 0.63
Software EUR 51,583 Dassault Systemes SE 6,592 0.39EUR 30,960 Ubisoft Entertainment SA 2,924 0.18
Telecommunications EUR 67,569 Eutelsat Communications SA 1,238 0.07EUR 798,318 Orange SA 11,667 0.70
Transportation EUR 186,368 Getlink 2,105 0.13
Water EUR 143,386 Suez^ 1,736 0.10EUR 213,895 Veolia Environnement SA 4,178 0.25
Total France 516,364 30.84
Germany (31 July 2017: 28.43%) Aerospace & defence
EUR 20,542 MTU Aero Engines AG 3,718 0.22Airlines
EUR 94,057 Deutsche Lufthansa AG 2,257 0.13Apparel retailers
EUR 75,440 Adidas AG 14,269 0.85EUR 578 Puma SE 248 0.02EUR 2,741 Puma SE (Italy listed) 1,176 0.07
Auto manufacturers EUR 132,564 Bayerische Motoren Werke AG 10,962 0.65EUR 22,095 Bayerische Motoren Werke AG
(Preference)^ 1,564 0.09EUR 364,149 Daimler AG^ 21,540 1.29EUR 60,566 Porsche Automobil Holding SE^ 3,507 0.21EUR 12,912 Volkswagen AG^ 1,912 0.11EUR 74,222 Volkswagen AG (Preference) 11,298 0.68
Auto parts & equipment EUR 44,059 Continental AG 8,679 0.52EUR 65,849 Schaeffler AG 772 0.04

iSHARES VII PLC
Schedule of Investments (continued) iSHARES MSCI EMU UCITS ETF (continued) As at 31 July 2018
i S H A R E S V I I P L C A N N U A L R E P O R T [ 1 9 3 ]
Ccy Holding Investment Fair value
€'000
% of netassetvalue
Equities (31 July 2017: 99.10%) (cont) Germany (31 July 2017: 28.43%) (cont) Banks
EUR 421,199 Commerzbank AG^ 3,890 0.23EUR 816,572 Deutsche Bank AG^ 9,136 0.55
Building materials and fixtures EUR 59,616 HeidelbergCement AG 4,329 0.26
Chemicals EUR 367,829 BASF SE 30,221 1.80EUR 61,335 Brenntag AG 3,145 0.19EUR 76,878 Covestro AG 6,312 0.38EUR 65,224 Evonik Industries AG 2,064 0.12EUR 28,358 Fuchs Petrolub SE 1,369 0.08EUR 78,469 K+S AG 1,773 0.11EUR 36,419 Lanxess AG 2,560 0.15EUR 74,297 Linde AG 15,684 0.94EUR 48,882 Symrise AG^ 3,778 0.22
Commercial services EUR 47,243 Wirecard AG 7,547 0.45
Cosmetics & personal care EUR 40,461 Beiersdorf AG 4,030 0.24
Diversified financial services EUR 76,351 Deutsche Boerse AG^ 8,605 0.51
Electrical components & equipment EUR 39,125 OSRAM Licht AG^ 1,494 0.09
Electricity EUR 882,410 E.ON SE 8,510 0.51EUR 56,607 Innogy SE 2,086 0.12EUR 206,528 RWE AG 4,635 0.28EUR 79,183 Uniper SE 2,113 0.13
Electronics EUR 14,172 Sartorius AG 1,970 0.12
Engineering & construction EUR 16,449 Fraport AG Frankfurt Airport
Services Worldwide 1,404 0.08EUR 7,508 Hochtief AG 1,154 0.07
Food EUR 73,368 Metro AG^ 775 0.05
Healthcare products EUR 59,855 Siemens Healthineers AG^ 2,280 0.14
Healthcare services EUR 86,728 Fresenius Medical Care AG & Co
KGaA 7,245 0.43EUR 166,424 Fresenius SE & Co KGaA^ 10,988 0.66
Household goods & home construction EUR 41,489 Henkel AG & Co KGaA 3,805 0.23EUR 70,565 Henkel AG & Co KGaA
(Preference) 7,568 0.45Insurance
EUR 176,235 Allianz SE 33,333 1.99EUR 23,970 Hannover Rueck SE 2,733 0.17
Ccy Holding Investment Fair value
€'000
% of netassetvalue
Germany (31 July 2017: 28.43%) (cont) Insurance (cont)
EUR 61,988 Muenchener Rueckversicherungs-Gesellschaft AG 11,762 0.70Internet
EUR 36,719 Delivery Hero SE 1,784 0.11EUR 48,471 United Internet AG 2,229 0.13
Iron & steel EUR 174,323 ThyssenKrupp AG 3,978 0.24
Machinery - diversified EUR 71,881 GEA Group AG^ 2,401 0.14EUR 28,328 Kion Group AG 1,664 0.10EUR 14,121 MAN SE 1,355 0.08
Media EUR 19,378 Axel Springer SE 1,238 0.07EUR 92,808 ProSiebenSat.1 Media SE 2,148 0.13
Miscellaneous manufacturers EUR 306,434 Siemens AG 37,005 2.21
Pharmaceuticals EUR 359,785 Bayer AG 34,273 2.04EUR 51,149 Merck KGaA 4,495 0.27
Real estate investment & services EUR 141,752 Deutsche Wohnen SE 5,905 0.35EUR 191,929 Vonovia SE 7,948 0.48
Retail EUR 25,992 Hugo Boss AG 2,003 0.12EUR 44,350 Zalando SE 2,176 0.13
Semiconductors EUR 449,066 Infineon Technologies AG^ 10,176 0.61
Software EUR 393,590 SAP SE 39,300 2.35
Telecommunications EUR 20,907 1&1 Drillisch AG^ 1,063 0.06EUR 1,334,339 Deutsche Telekom AG 18,881 1.13EUR 273,051 Telefonica Deutschland Holding
AG^ 1,023 0.06Transportation
EUR 393,376 Deutsche Post AG 11,876 0.71Total Germany 483,121 28.85
Ireland (31 July 2017: 1.35%) Airlines
EUR 65,987 Ryanair Holdings Plc 930 0.05Banks
EUR 320,053 AIB Group Plc 1,568 0.09EUR 386,328 Bank of Ireland Group Plc 2,838 0.17
Building materials and fixtures EUR 335,651 CRH Plc 9,828 0.59
Entertainment EUR 33,831 Paddy Power Betfair Plc 3,155 0.19

iSHARES VII PLC
Schedule of Investments (continued) iSHARES MSCI EMU UCITS ETF (continued) As at 31 July 2018
[ 1 9 4 ] i S H A R E S V I I P L C A N N U A L R E P O R T
Ccy Holding Investment Fair value
€'000
% of netassetvalue
Equities (31 July 2017: 99.10%) (cont) Ireland (31 July 2017: 1.35%) (cont)
Food EUR 62,513 Kerry Group Plc 5,670 0.34
Forest products & paper EUR 90,035 Smurfit Kappa Group Plc 3,158 0.19
Total Ireland 27,147 1.62
Italy (31 July 2017: 6.19%) Aerospace & defence
EUR 154,827 Leonardo SpA^ 1,587 0.10Apparel retailers
EUR 71,430 Moncler SpA 2,694 0.16Auto parts & equipment
EUR 159,765 Pirelli & C SpA^ 1,194 0.07Banks
EUR 5,395,581 Intesa Sanpaolo SpA^ 14,212 0.85EUR 336,219 Intesa Sanpaolo SpA (Savings
share)^ 918 0.05EUR 243,640 Mediobanca Banca di Credito
Finanziario SpA 2,164 0.13EUR 803,216 UniCredit SpA 12,180 0.73
Beverages EUR 228,198 Davide Campari-Milano SpA^ 1,645 0.10
Commercial services EUR 198,016 Atlantia SpA 5,024 0.30
Electrical components & equipment EUR 93,983 Prysmian SpA 2,063 0.12
Electricity EUR 3,255,670 Enel SpA 15,529 0.93EUR 554,254 Terna Rete Elettrica Nazionale
SpA 2,655 0.16Gas
EUR 933,378 Snam SpA 3,430 0.21Insurance
EUR 489,615 Assicurazioni Generali SpA^ 7,442 0.44EUR 207,295 Poste Italiane SpA^ 1,651 0.10
Oil & gas EUR 1,018,372 Eni SpA 16,767 1.00
Pharmaceuticals EUR 41,619 Recordati SpA 1,331 0.08
Retail EUR 67,022 Luxottica Group SpA 3,881 0.23
Telecommunications EUR 4,499,077 Telecom Italia SpA^ 2,967 0.18EUR 2,437,892 Telecom Italia SpA (non-voting)^ 1,389 0.08
Total Italy 100,723 6.02
Luxembourg (31 July 2017: 0.93%) Healthcare services
EUR 4,674 Eurofins Scientific SE^ 2,181 0.13
Ccy Holding Investment Fair value
€'000
% of netassetvalue
Luxembourg (31 July 2017: 0.93%) (cont) Iron & steel
EUR 264,113 ArcelorMittal 7,267 0.43Media
EUR 15,409 RTL Group SA 982 0.06Metal fabricate/ hardware
EUR 191,119 Tenaris SA 2,987 0.18Telecommunications
EUR 146,914 SES SA^ 2,512 0.15Total Luxembourg 15,929 0.95
Netherlands (31 July 2017: 13.50%) Aerospace & defence
EUR 232,581 Airbus SE 24,654 1.47Auto manufacturers
EUR 49,592 Ferrari NV 5,643 0.34EUR 434,216 Fiat Chrysler Automobiles NV 6,339 0.38
Banks EUR 169,827 ABN Amro Group NV 4,025 0.24EUR 1,555,750 ING Groep NV 20,383 1.22
Beverages EUR 46,146 Heineken Holding NV^ 3,814 0.23EUR 103,947 Heineken NV 8,996 0.53
Chemicals EUR 101,397 Akzo Nobel NV 8,020 0.48EUR 71,613 Koninklijke DSM NV 6,527 0.39
Commercial services USD 54,769 AerCap Holdings NV 2,627 0.16EUR 47,215 Randstad NV 2,562 0.15EUR 388,527 Relx NV^ 7,225 0.43
Cosmetics & personal care EUR 618,046 Unilever NV^ 30,433 1.82
Food EUR 505,689 Koninklijke Ahold Delhaize NV 11,001 0.66
Healthcare products EUR 376,623 Koninklijke Philips NV 14,139 0.84EUR 91,166 Qiagen NV^ 2,825 0.17
Insurance EUR 695,413 Aegon NV^ 3,923 0.24EUR 120,115 NN Group NV 4,543 0.27
Investment services EUR 42,798 Exor NV 2,409 0.14
Machinery - diversified EUR 406,937 CNH Industrial NV 4,084 0.24
Media EUR 114,921 Wolters Kluwer NV 5,925 0.35
Pipelines EUR 28,345 Koninklijke Vopak NV^ 1,142 0.07
Semiconductors EUR 164,118 ASML Holding NV 30,115 1.80USD 138,369 NXP Semiconductors NV 11,275 0.67

iSHARES VII PLC
Schedule of Investments (continued) iSHARES MSCI EMU UCITS ETF (continued) As at 31 July 2018
i S H A R E S V I I P L C A N N U A L R E P O R T [ 1 9 5 ]
Ccy Holding Investment Fair value
€'000
% of netassetvalue
Equities (31 July 2017: 99.10%) (cont) Netherlands (31 July 2017: 13.50%) (cont) Semiconductors (cont)
EUR 273,038 STMicroelectronics NV 5,080 0.31Telecommunications
EUR 1,357,717 Koninklijke KPN NV^ 3,360 0.20Total Netherlands 231,069 13.80
Portugal (31 July 2017: 0.45%) Electricity
EUR 1,022,413 EDP - Energias de Portugal SA 3,567 0.21Food
EUR 102,827 Jeronimo Martins SGPS SA^ 1,309 0.08Oil & gas
EUR 204,395 Galp Energia SGPS SA 3,595 0.22Total Portugal 8,471 0.51
Spain (31 July 2017: 10.69%) Airlines
EUR 242,153 International Consolidated Airlines Group SA 1,924 0.11Banks
EUR 2,669,137 Banco Bilbao Vizcaya Argentaria SA 16,778 1.00
EUR 2,247,574 Banco de Sabadell SA 3,211 0.19EUR 6,461,868 Banco Santander SA 31,143 1.86EUR 483,298 Bankia SA^ 1,629 0.10EUR 267,454 Bankinter SA 2,210 0.13EUR 1,438,729 CaixaBank SA 5,693 0.34
Electricity EUR 129,916 Endesa SA 2,570 0.15EUR 2,319,429 Iberdrola SA 15,424 0.92EUR 65,896 Iberdrola SA (RFD) 438 0.03EUR 199,214 Red Electrica Corp SA 3,614 0.22
Ccy Holding Investment Fair value
€'000
% of netassetvalue
Spain (31 July 2017: 10.69%) (cont) Energy - alternate sources
EUR 92,641 Siemens Gamesa Renewable Energy SA^ 1,120 0.07Engineering & construction
EUR 102,639 ACS Actividades de Construccion y Servicios SA 3,851 0.23
EUR 27,001 Aena SME SA 4,196 0.25EUR 193,896 Ferrovial SA^ 3,428 0.21
Gas EUR 79,794 Enagas SA 1,909 0.11EUR 137,682 Naturgy Energy Group SA 3,191 0.19
Insurance EUR 447,283 Mapfre SA 1,203 0.07
Oil & gas EUR 545,041 Repsol SA 9,252 0.55
Pharmaceuticals EUR 120,295 Grifols SA 2,989 0.18
Retail EUR 436,568 Industria de Diseno Textil SA 12,246 0.73
Software EUR 175,583 Amadeus IT Group SA 12,817 0.77
Telecommunications EUR 1,870,423 Telefonica SA 14,385 0.86
Total Spain 155,221 9.27
United Kingdom (31 July 2017: 0.20%) Beverages
USD 87,138 Coca-Cola European Partners Plc 3,071 0.18Total United Kingdom 3,071 0.18Total equities 1,658,561 99.05 Rights (31 July 2017: 0.00%) France (31 July 2017: 0.00%)
Currency Amount
Purchased Currency Amount
SoldUnderlying
Exposure (€)Maturity
date
Unrealisedgain/(loss)
€'000
% of netassetvalue
Financial derivative instruments (31 July 2017: (0.01)%) Forward currency contracts* (31 July 2017: Nil)
EUR 1,188,865 GBP 1,052,486 1,179,948 02/08/2018 9 0.00GBP 6,610,422 EUR 7,401,494 7,410,984 02/08/2018 9 0.00GBP 33,179,883 EUR 37,477,803 37,198,168 02/08/2018 (280) (0.02)GBP 74,150 USD 96,436 83,129 02/08/2018 1 0.00GBP 386,244 USD 510,372 433,020 02/08/2018 (3) 0.00GBP 599,958 USD 455,184 512,763 02/08/2018 1 0.00GBP 6,850 USD 5,209 5,854 02/08/2018 - 0.00USD 70,442 GBP 53,527 60,204 02/08/2018 - 0.00
Total unrealised gains on forward currency contracts 20 0.00 Total unrealised losses on forward currency contracts (283) (0.02) Net unrealised losses on forward currency contracts (263) (0.02)

iSHARES VII PLC
Schedule of Investments (continued) iSHARES MSCI EMU UCITS ETF (continued) As at 31 July 2018
[ 1 9 6 ] i S H A R E S V I I P L C A N N U A L R E P O R T
CcyNo. of
contracts
Underlying exposure
€'000 Fair value
€'000
% of netassetsvalue
Financial derivative instruments (31 July 2017: (0.01)%) (cont) Futures contracts (31 July 2017: (0.01)%)
EUR 450 Euro Stoxx 50 Index Futures September 2018 15,518 344 0.02Total unrealised gains on futures contracts 344 0.02Total financial derivative instruments 81 0.00
Fair value€'000
% of net assetvalue
Total value of investments 1,658,642 99.05 Cash† 12,552 0.75
Other net assets 3,309 0.20
Net asset value attributable to redeemable participating shareholders at the end of the financial year 1,674,503 100.00
† Cash holdings of €11,772,783 are held with State Street Bank and Trust Company. €778,783 is held as security for futures contracts with Credit Suisse AG. ^ These securities are partially or fully transferred as securities lent. * The counterparty for forward currency contracts is State Street Bank and Trust Company. All forward currency contracts relate to the GBP Hedged (Dist) Class.
Equities are primarily classified by country of incorporation of the entity in which the Fund holds shares. Underlying exposure has been calculated according to the guidelines issued by the ESMA and represents the market value of an equivalent position in the assets underlying each financial derivative instrument.
Analysis of total current assets gross of all liabilities
Fair value€'000
% of totalcurrentassets
Transferable securities admitted to an official stock exchange listing 1,658,561 98.99Exchange traded financial derivative instruments 344 0.02Over-the-counter financial derivative instruments 20 0.00Other assets 16,596 0.99Total current assets 1,675,521 100.00

iSHARES VII PLC
Schedule of Investments (continued) iSHARES MSCI EMU USD HEDGED UCITS ETF (Acc) As at 31 July 2018
i S H A R E S V I I P L C A N N U A L R E P O R T [ 1 9 7 ]
Ccy Holding Investment Fair value
$'000
% of netassetvalue
Transferable Securities Admitted to an Official Stock Exchange Listing or traded on a Regulated Market (31 July 2017: 100.09%)
Equities (31 July 2017: 100.09%) Austria (31 July 2017: 0.77%) Banks
EUR 17,284 Erste Group Bank AG 748 0.27EUR 8,332 Raiffeisen Bank International AG 278 0.10
Iron & steel EUR 6,799 Voestalpine AG^ 341 0.12
Machinery - diversified EUR 4,319 Andritz AG 245 0.09
Oil & gas EUR 8,464 OMV AG 479 0.17
Total Austria 2,091 0.75
Belgium (31 July 2017: 3.71%) Banks
EUR 14,489 KBC Group NV 1,115 0.40Beverages
EUR 42,907 Anheuser-Busch InBev SA/NV 4,347 1.55Chemicals
EUR 4,257 Solvay SA 584 0.21EUR 12,044 Umicore SA 705 0.25
Food EUR 3,464 Colruyt SA^ 207 0.07
Insurance EUR 10,840 Ageas 581 0.21
Investment services EUR 4,637 Groupe Bruxelles Lambert SA 493 0.17
Media EUR 2,947 Telenet Group Holding NV 142 0.05
Pharmaceuticals EUR 7,265 UCB SA 624 0.22
Telecommunications EUR 9,215 Proximus SADP 226 0.08
Total Belgium 9,024 3.21
Finland (31 July 2017: 3.14%) Auto parts & equipment
EUR 6,898 Nokian Renkaat Oyj^ 299 0.11Electricity
EUR 25,505 Fortum Oyj 641 0.23Forest products & paper
EUR 31,629 Stora Enso Oyj 523 0.19EUR 30,783 UPM-Kymmene Oyj 1,094 0.39
Insurance EUR 26,051 Sampo Oyj 1,325 0.47
Machinery - diversified EUR 19,499 Kone Oyj^ 1,067 0.38EUR 5,777 Metso Oyj 212 0.07
Ccy Holding Investment Fair value
$'000
% of netassetvalue
Finland (31 July 2017: 3.14%) (cont) Miscellaneous manufacturers
EUR 25,463 Wartsila Oyj Abp 551 0.20Oil & gas
EUR 7,365 Neste Oyj 608 0.22Pharmaceuticals
EUR 6,007 Orion Oyj 207 0.07Telecommunications
EUR 8,374 Elisa Oyj 364 0.13EUR 316,932 Nokia Oyj 1,723 0.61
Total Finland 8,614 3.07
France (31 July 2017: 30.22%) Advertising
EUR 4,291 JCDecaux SA 140 0.05EUR 11,943 Publicis Groupe SA 764 0.27
Aerospace & defence EUR 136 Dassault Aviation SA 251 0.09EUR 18,728 Safran SA 2,324 0.83EUR 6,119 Thales SA 805 0.28
Apparel retailers EUR 1,844 Hermes International 1,168 0.41EUR 4,421 Kering SA 2,359 0.84EUR 15,725 LVMH Moet Hennessy Louis
Vuitton SE 5,499 1.96Auto manufacturers
EUR 33,819 Peugeot SA 974 0.34EUR 11,084 Renault SA 976 0.35
Auto parts & equipment EUR 9,851 Cie Generale des Etablissements
Michelin SCA 1,269 0.45EUR 4,515 Faurecia SA 307 0.11EUR 13,782 Valeo SA 677 0.24
Banks EUR 63,225 BNP Paribas SA 4,118 1.47EUR 65,487 Credit Agricole SA 921 0.33EUR 54,617 Natixis SA 393 0.14EUR 43,114 Societe Generale SA 1,922 0.68
Beverages EUR 12,443 Pernod Ricard SA 2,009 0.71EUR 1,393 Remy Cointreau SA^ 190 0.07
Building materials and fixtures EUR 27,982 Cie de Saint-Gobain 1,246 0.44EUR 2,016 Imerys SA 157 0.06
Chemicals EUR 24,122 Air Liquide SA 3,091 1.10EUR 3,921 Arkema SA 492 0.18
Commercial services EUR 15,491 Bureau Veritas SA 400 0.14EUR 13,510 Edenred 532 0.19

iSHARES VII PLC
Schedule of Investments (continued) iSHARES MSCI EMU USD HEDGED UCITS ETF (Acc) (continued) As at 31 July 2018
[ 1 9 8 ] i S H A R E S V I I P L C A N N U A L R E P O R T
Ccy Holding Investment Fair value
$'000
% of netassetvalue
Equities (31 July 2017: 100.09%) (cont) France (31 July 2017: 30.22%) (cont) Computers
EUR 5,464 Atos SE 734 0.26EUR 9,252 Capgemini SE 1,189 0.42EUR 3,432 Ingenico Group SA 285 0.10EUR 3,343 Teleperformance 613 0.22
Cosmetics & personal care EUR 14,199 L'Oreal SA 3,481 1.24
Distribution & wholesale EUR 16,971 Rexel SA 266 0.09
Diversified financial services EUR 3,394 Amundi SA 234 0.08EUR 2,514 Eurazeo SA 195 0.07
Electrical components & equipment EUR 15,354 Legrand SA 1,129 0.40EUR 30,238 Schneider Electric SE 2,435 0.87
Electricity EUR 33,602 Electricite de France SA 503 0.18EUR 102,803 Engie SA 1,662 0.59
Engineering & construction EUR 1,726 Aeroports de Paris 386 0.14EUR 12,581 Bouygues SA 554 0.20EUR 4,515 Eiffage SA 506 0.18EUR 28,221 Vinci SA 2,840 1.01
Food EUR 33,334 Carrefour SA^ 599 0.21EUR 3,074 Casino Guichard Perrachon SA 126 0.05EUR 33,916 Danone SA 2,667 0.95
Food Service EUR 5,215 Sodexo SA^ 578 0.21
Healthcare products EUR 11,702 Essilor International Cie
Generale d'Optique SA 1,728 0.62Healthcare services
EUR 2,292 BioMerieux 191 0.07Holding companies - diversified operations
EUR 64,427 Bollore SA 300 0.11Home furnishings
EUR 1,322 SEB SA 251 0.09Hotels
EUR 10,810 Accor SA 558 0.20Household goods & home construction
EUR 1,457 Societe BIC SA^ 139 0.05Insurance
EUR 108,927 AXA SA 2,753 0.98EUR 9,873 CNP Assurances 231 0.08EUR 9,283 SCOR SE 361 0.13
Internet EUR 1,537 Iliad SA 244 0.09
Ccy Holding Investment Fair value
$'000
% of netassetvalue
France (31 July 2017: 30.22%) (cont) Investment services
EUR 1,561 Wendel SA 228 0.08Media
EUR 58,447 Vivendi SA 1,518 0.54Miscellaneous manufacturers
EUR 8,980 Alstom SA 403 0.14Oil & gas
EUR 135,176 Total SA 8,835 3.15Pharmaceuticals
EUR 2,210 Ipsen SA 367 0.13EUR 63,547 Sanofi 5,530 1.97
Real estate investment trusts EUR 2,153 Covivio 225 0.08EUR 2,595 Gecina SA 443 0.16EUR 2,036 ICADE 197 0.07EUR 11,604 Klepierre SA 438 0.16EUR 7,786 Unibail-Rodamco-Westfield^ 1,729 0.61
Software EUR 7,488 Dassault Systemes SE 1,120 0.40EUR 4,502 Ubisoft Entertainment SA 497 0.18
Telecommunications EUR 9,770 Eutelsat Communications SA 209 0.08EUR 112,163 Orange SA 1,918 0.68
Transportation EUR 27,279 Getlink 361 0.13
Water EUR 21,473 Suez 304 0.11EUR 30,741 Veolia Environnement SA 703 0.25
Total France 85,747 30.54
Germany (31 July 2017: 28.77%) Aerospace & defence
EUR 2,993 MTU Aero Engines AG 634 0.23Airlines
EUR 13,527 Deutsche Lufthansa AG 380 0.13Apparel retailers
EUR 10,615 Adidas AG 2,349 0.84EUR 596 Puma SE 299 0.10
Auto manufacturers EUR 18,673 Bayerische Motoren Werke AG 1,807 0.64EUR 3,317 Bayerische Motoren Werke AG
(Preference) 275 0.10EUR 51,231 Daimler AG^ 3,546 1.26EUR 8,802 Porsche Automobil Holding SE^ 596 0.21EUR 1,919 Volkswagen AG 332 0.12EUR 10,459 Volkswagen AG (Preference) 1,863 0.67
Auto parts & equipment EUR 6,372 Continental AG 1,469 0.52EUR 9,307 Schaeffler AG 127 0.05

iSHARES VII PLC
Schedule of Investments (continued) iSHARES MSCI EMU USD HEDGED UCITS ETF (Acc) (continued) As at 31 July 2018
i S H A R E S V I I P L C A N N U A L R E P O R T [ 1 9 9 ]
Ccy Holding Investment Fair value
$'000
% of netassetvalue
Equities (31 July 2017: 100.09%) (cont) Germany (31 July 2017: 28.77%) (cont)
Banks EUR 58,635 Commerzbank AG 634 0.22EUR 110,655 Deutsche Bank AG^ 1,448 0.52
Building materials and fixtures EUR 8,558 HeidelbergCement AG 727 0.26
Chemicals EUR 51,719 BASF SE 4,972 1.77EUR 8,893 Brenntag AG 534 0.19EUR 11,092 Covestro AG 1,065 0.38EUR 9,421 Evonik Industries AG 349 0.12EUR 3,994 Fuchs Petrolub SE 226 0.08EUR 11,207 K+S AG 296 0.11EUR 5,073 Lanxess AG 417 0.15EUR 10,836 Linde AG 2,676 0.95EUR 7,095 Symrise AG 642 0.23
Commercial services EUR 6,785 Wirecard AG 1,268 0.45
Cosmetics & personal care EUR 5,797 Beiersdorf AG 676 0.24
Diversified financial services EUR 11,325 Deutsche Boerse AG 1,493 0.53
Electrical components & equipment EUR 5,959 OSRAM Licht AG^ 266 0.09
Electricity EUR 124,161 E.ON SE 1,401 0.50EUR 8,207 Innogy SE 354 0.12EUR 29,771 RWE AG 781 0.28EUR 11,847 Uniper SE 370 0.13
Electronics EUR 2,089 Sartorius AG 340 0.12
Engineering & construction EUR 2,525 Fraport AG Frankfurt Airport
Services Worldwide 252 0.09EUR 1,128 Hochtief AG 203 0.07
Food EUR 10,752 Metro AG^ 133 0.05
Healthcare products EUR 8,621 Siemens Healthineers AG 384 0.14
Healthcare services EUR 12,675 Fresenius Medical Care AG & Co
KGaA 1,239 0.44EUR 23,429 Fresenius SE & Co KGaA^ 1,810 0.65
Household goods & home construction EUR 5,971 Henkel AG & Co KGaA 641 0.23EUR 10,299 Henkel AG & Co KGaA
(Preference) 1,292 0.46Insurance
EUR 24,795 Allianz SE 5,487 1.95EUR 3,488 Hannover Rueck SE 465 0.17
Ccy Holding Investment Fair value
$'000
% of netassetvalue
Germany (31 July 2017: 28.77%) (cont) Insurance (cont)
EUR 8,737 Muenchener Rueckversicherungs-Gesellschaft AG 1,940 0.69Internet
EUR 5,299 Delivery Hero SE 301 0.11EUR 7,077 United Internet AG 381 0.13
Iron & steel EUR 25,028 ThyssenKrupp AG 668 0.24
Machinery - diversified EUR 10,081 GEA Group AG^ 394 0.14EUR 4,233 Kion Group AG 291 0.10EUR 2,030 MAN SE 228 0.08
Media EUR 2,915 Axel Springer SE 218 0.08EUR 13,443 ProSiebenSat.1 Media SE 364 0.13
Miscellaneous manufacturers EUR 42,909 Siemens AG 6,063 2.16
Pharmaceuticals EUR 50,547 Bayer AG 5,634 2.01EUR 7,428 Merck KGaA^ 764 0.27
Real estate investment & services EUR 20,438 Deutsche Wohnen SE 996 0.36EUR 28,517 Vonovia SE 1,382 0.49
Retail EUR 3,760 Hugo Boss AG 339 0.12EUR 6,402 Zalando SE 368 0.13
Semiconductors EUR 66,605 Infineon Technologies AG 1,766 0.63
Software EUR 55,151 SAP SE 6,443 2.29
Telecommunications EUR 2,943 1&1 Drillisch AG^ 175 0.06EUR 187,814 Deutsche Telekom AG 3,109 1.11EUR 43,008 Telefonica Deutschland Holding
AG^ 189 0.07Transportation
EUR 55,333 Deutsche Post AG 1,955 0.70Total Germany 80,486 28.66
Ireland (31 July 2017: 1.37%) Airlines
EUR 7,410 Ryanair Holdings Plc 122 0.04Banks
EUR 48,825 AIB Group Plc 280 0.10EUR 56,354 Bank of Ireland Group Plc 484 0.17
Building materials and fixtures EUR 47,229 CRH Plc 1,618 0.58
Entertainment EUR 4,873 Paddy Power Betfair Plc 532 0.19

iSHARES VII PLC
Schedule of Investments (continued) iSHARES MSCI EMU USD HEDGED UCITS ETF (Acc) (continued) As at 31 July 2018
[ 2 0 0 ] i S H A R E S V I I P L C A N N U A L R E P O R T
Ccy Holding Investment Fair value
$'000
% of netassetvalue
Equities (31 July 2017: 100.09%) (cont) Ireland (31 July 2017: 1.37%) (cont)
Food EUR 9,137 Kerry Group Plc 970 0.35
Forest products & paper EUR 13,113 Smurfit Kappa Group Plc 538 0.19
Total Ireland 4,544 1.62
Italy (31 July 2017: 6.27%) Aerospace & defence
EUR 14,028 Leonardo SpA 168 0.06Apparel retailers
EUR 10,219 Moncler SpA^ 451 0.16Auto parts & equipment
EUR 22,789 Pirelli & C SpA 199 0.07Banks
EUR 748,725 Intesa Sanpaolo SpA 2,308 0.82EUR 51,630 Intesa Sanpaolo SpA (non-
voting) 165 0.06EUR 36,599 Mediobanca Banca di Credito
Finanziario SpA 380 0.13EUR 115,101 UniCredit SpA 2,042 0.73
Beverages EUR 34,799 Davide Campari-Milano SpA 294 0.11
Commercial services EUR 28,228 Atlantia SpA 838 0.30
Electrical components & equipment EUR 13,948 Prysmian SpA 358 0.13
Electricity EUR 453,891 Enel SpA 2,534 0.90EUR 80,681 Terna Rete Elettrica Nazionale
SpA^ 452 0.16Gas
EUR 130,539 Snam SpA 561 0.20Insurance
EUR 67,535 Assicurazioni Generali SpA 1,201 0.43EUR 31,341 Poste Italiane SpA^ 292 0.10
Oil & gas EUR 141,704 Eni SpA 2,730 0.97
Pharmaceuticals EUR 5,854 Recordati SpA 219 0.08
Retail EUR 9,679 Luxottica Group SpA 656 0.23
Telecommunications EUR 648,649 Telecom Italia SpA 500 0.18EUR 363,663 Telecom Italia SpA (non-voting) 243 0.09
Total Italy 16,591 5.91
Luxembourg (31 July 2017: 0.92%) Healthcare services
EUR 673 Eurofins Scientific SE 367 0.13
Ccy Holding Investment Fair value
$'000
% of netassetvalue
Luxembourg (31 July 2017: 0.92%) (cont) Iron & steel
EUR 39,009 ArcelorMittal 1,256 0.45Media
EUR 2,165 RTL Group SA 162 0.06Metal fabricate/ hardware
EUR 26,889 Tenaris SA 492 0.17Telecommunications
EUR 20,908 SES SA^ 418 0.15Total Luxembourg 2,695 0.96
Netherlands (31 July 2017: 13.62%) Aerospace & defence
EUR 32,728 Airbus SE 4,059 1.44Auto manufacturers
EUR 7,033 Ferrari NV 936 0.33EUR 61,694 Fiat Chrysler Automobiles NV^ 1,054 0.38
Banks EUR 24,283 ABN Amro Group NV 674 0.24EUR 218,745 ING Groep NV 3,353 1.19
Beverages EUR 6,626 Heineken Holding NV^ 641 0.23EUR 15,204 Heineken NV 1,539 0.55
Chemicals EUR 14,595 Akzo Nobel NV 1,351 0.48EUR 10,474 Koninklijke DSM NV 1,117 0.40
Commercial services EUR 6,917 Randstad NV 439 0.16EUR 56,780 Relx NV 1,235 0.44
Cosmetics & personal care EUR 86,960 Unilever NV^ 5,010 1.78
Diversified financial services USD 7,814 AerCap Holdings NV 439 0.15
Food EUR 70,164 Koninklijke Ahold Delhaize NV 1,786 0.64
Healthcare products EUR 52,962 Koninklijke Philips NV 2,326 0.83EUR 13,100 Qiagen NV^ 475 0.17
Insurance EUR 102,251 Aegon NV 675 0.24EUR 17,625 NN Group NV 780 0.28
Investment services EUR 6,221 Exor NV 410 0.15
Machinery - diversified EUR 58,240 CNH Industrial NV 684 0.24
Media EUR 16,721 Wolters Kluwer NV^ 1,009 0.36
Pipelines EUR 4,047 Koninklijke Vopak NV 191 0.07
Semiconductors EUR 23,041 ASML Holding NV 4,947 1.76USD 20,038 NXP Semiconductors NV 1,911 0.68

iSHARES VII PLC
Schedule of Investments (continued) iSHARES MSCI EMU USD HEDGED UCITS ETF (Acc) (continued) As at 31 July 2018
i S H A R E S V I I P L C A N N U A L R E P O R T [ 2 0 1 ]
Ccy Holding Investment Fair value
$'000
% of netassetvalue
Equities (31 July 2017: 100.09%) (cont) Netherlands (31 July 2017: 13.62%) (cont) Semiconductors (cont)
EUR 39,011 STMicroelectronics NV 849 0.30Telecommunications
EUR 192,910 Koninklijke KPN NV 558 0.20Total Netherlands 38,448 13.69
Portugal (31 July 2017: 0.44%) Electricity
EUR 146,882 EDP - Energias de Portugal SA 600 0.21Food
EUR 14,850 Jeronimo Martins SGPS SA 221 0.08Oil & gas
EUR 28,781 Galp Energia SGPS SA 592 0.21Total Portugal 1,413 0.50
Spain (31 July 2017: 10.65%) Airlines
EUR 35,912 International Consolidated Airlines Group SA 334 0.12Banks
EUR 373,518 Banco Bilbao Vizcaya Argentaria SA 2,747 0.98
EUR 321,164 Banco de Sabadell SA 537 0.19EUR 902,718 Banco Santander SA 5,090 1.81EUR 69,439 Bankia SA^ 274 0.10EUR 38,685 Bankinter SA 374 0.13EUR 206,406 CaixaBank SA 956 0.34
Electricity EUR 18,503 Endesa SA 428 0.15EUR 324,249 Iberdrola SA 2,523 0.90EUR 9,875 Iberdrola SA (RFD) 77 0.03EUR 26,647 Red Electrica Corp SA 566 0.20
Ccy Holding Investment Fair value
$'000
% of netassetvalue
Spain (31 July 2017: 10.65%) (cont) Engineering & construction
EUR 14,800 ACS Actividades de Construccion y Servicios SA 650 0.23
EUR 3,861 Aena SME SA 702 0.25EUR 28,119 Ferrovial SA 581 0.21
Energy - alternate sources EUR 14,720 Siemens Gamesa Renewable
Energy SA^ 208 0.08Gas
EUR 7,611 Enagas SA 213 0.08EUR 20,228 Naturgy Energy Group SA 549 0.19
Insurance EUR 65,149 Mapfre SA 205 0.07
Oil & gas EUR 79,398 Repsol SA 1,577 0.56
Pharmaceuticals EUR 17,532 Grifols SA 510 0.18
Retail EUR 60,943 Industria de Diseno Textil SA 2,000 0.71
Software EUR 25,288 Amadeus IT Group SA 2,160 0.77
Telecommunications EUR 262,057 Telefonica SA 2,358 0.84
Total Spain 25,619 9.12
United Kingdom (31 July 2017: 0.21%) Beverages
USD 12,683 Coca-Cola European Partners Plc 523 0.19Total United Kingdom 523 0.19Total equities 275,795 98.22
Rights (31 July 2017: 0.00%) France (31 July 2017: 0.00%)
Currency Amount
Purchased Currency Amount
SoldUnderlying
Exposure ($)Maturity
date
Unrealisedgain/(loss)
$'000
% of netassetvalue
Financial derivative instruments (31 July 2017: (3.19)%) Forward currency contracts* (31 July 2017: (3.19)%)
EUR 19,373,435 USD 22,550,269 22,667,897 02/08/2018 118 0.04USD 290,974,430 EUR 248,709,912 291,003,145 02/08/2018 (29) (0.01)USD 277,818,870 EUR 236,857,905 277,817,676 05/09/2018 1 0.00
Total unrealised gains on forward currency contracts 119 0.04 Total unrealised losses on forward currency contracts (29) (0.01) Net unrealised gains on forward currency contracts 90 0.03

iSHARES VII PLC
Schedule of Investments (continued) iSHARES MSCI EMU USD HEDGED UCITS ETF (Acc) (continued) As at 31 July 2018
[ 2 0 2 ] i S H A R E S V I I P L C A N N U A L R E P O R T
CcyNo. of
contracts
Underlying exposure
$'000 Fair value
$'000
% of netassetsvalue
Financial derivative instruments (31 July 2017: (3.19)%) (cont) Futures contracts (31 July 2017: 0.00%)
EUR 106 Euro Stoxx 50 Index Futures September 2018 4,283 89 0.03
EUR 2 FTSE MIB Index Futures September 2018 248 12 0.01
EUR 2 IBEX 35 Index Futures August 2018 225 6 0.00Total unrealised gains on futures contracts 107 0.04Total financial derivative instruments 197 0.07
Fair value$'000
% of net assetvalue
Total value of investments 275,992 98.29 Cash† 4,494 1.60 Other net assets 312 0.11 Net asset value attributable to redeemable participating shareholders at the end of the financial year 280,798 100.00
† Cash holdings of $4,245,445 are held with State Street Bank and Trust Company. $248,768 is held as security for futures contracts with Morgan Stanley & Co International Plc. ^ These securities are partially or fully transferred as securities lent. * The counterparty for forward currency contracts is State Street Bank and Trust Company.
Equities are primarily classified by country of incorporation of the entity in which the Fund holds shares. Underlying exposure has been calculated according to the guideline issued by the ESMA and represents the market value of an equivalent position in the assets underlying each financial derivative instrument.
Analysis of total current assets gross of all liabilities
Fair value$'000
% of totalcurrentassets
Transferable securities admitted to an official stock exchange listing 275,795 98.18Exchange traded financial derivative instruments 107 0.04Over-the-counter financial derivative instruments 119 0.04Other assets 4,901 1.74Total current assets 280,922 100.00

iSHARES VII PLC
Schedule of Investments (continued) iSHARES MSCI JAPAN UCITS ETF USD (Acc) As at 31 July 2018
i S H A R E S V I I P L C A N N U A L R E P O R T [ 2 0 3 ]
Ccy Holding Investment Fair value
$'000
% of netassetvalue
Transferable Securities Admitted to an Official Stock Exchange Listing or traded on a Regulated Market (31 July 2017: 93.80%)
Equities (31 July 2017: 93.80%) Japan (31 July 2017: 93.80%) Advertising
JPY 32,620 Dentsu Inc^ 1,367 0.26JPY 33,600 Hakuhodo DY Holdings Inc^ 514 0.10
Aerospace & defence JPY 22,843 IHI Corp 797 0.15JPY 21,044 Kawasaki Heavy Industries Ltd 615 0.12
Agriculture JPY 164,776 Japan Tobacco Inc 4,675 0.90
Airlines JPY 17,514 ANA Holdings Inc 641 0.12JPY 17,700 Japan Airlines Co Ltd 652 0.13
Apparel retailers JPY 23,562 Asics Corp^ 382 0.07
Auto manufacturers JPY 37,355 Hino Motors Ltd 419 0.08JPY 244,130 Honda Motor Co Ltd^ 7,317 1.40JPY 82,900 Isuzu Motors Ltd 1,117 0.21JPY 85,327 Mazda Motor Corp 1,060 0.20JPY 100,210 Mitsubishi Motors Corp 761 0.15JPY 346,803 Nissan Motor Co Ltd^ 3,270 0.63JPY 91,816 Subaru Corp^ 2,669 0.51JPY 51,323 Suzuki Motor Corp^ 3,004 0.58JPY 342,101 Toyota Motor Corp 22,325 4.27
Auto parts & equipment JPY 24,236 Aisin Seiki Co Ltd 1,124 0.22JPY 91,098 Bridgestone Corp 3,576 0.68JPY 65,316 Denso Corp 3,212 0.62JPY 31,678 JTEKT Corp 456 0.09JPY 15,825 Koito Manufacturing Co Ltd 1,014 0.19JPY 39,486 NGK Insulators Ltd 690 0.13JPY 23,081 NGK Spark Plug Co Ltd^ 662 0.13JPY 13,355 NOK Corp^ 267 0.05JPY 19,724 Stanley Electric Co Ltd 690 0.13JPY 112,664 Sumitomo Electric Industries Ltd^ 1,725 0.33JPY 25,551 Sumitomo Rubber Industries Ltd 421 0.08JPY 10,513 Toyoda Gosei Co Ltd 265 0.05JPY 21,738 Toyota Industries Corp^ 1,221 0.23JPY 16,400 Yokohama Rubber Co Ltd 349 0.07
Banks JPY 16,926 Aozora Bank Ltd 631 0.12JPY 7,683 Bank of Kyoto Ltd 371 0.07JPY 90,194 Chiba Bank Ltd^ 641 0.12JPY 163,300 Concordia Financial Group Ltd 875 0.17JPY 108,399 Fukuoka Financial Group Inc 592 0.11JPY 58,400 Japan Post Bank Co Ltd 700 0.13JPY 1,768,123 Mitsubishi UFJ Financial Group
Inc 10,889 2.09
Ccy Holding InvestmentFair value
$'000
% of netassetvalue
Japan (31 July 2017: 93.80%) (cont) Banks (cont)
JPY 3,605,530 Mizuho Financial Group Inc 6,268 1.20JPY 312,438 Resona Holdings Inc^ 1,775 0.34JPY 87,002 Seven Bank Ltd^ 263 0.05JPY 25,864 Shinsei Bank Ltd^ 406 0.08JPY 67,803 Shizuoka Bank Ltd^ 625 0.12JPY 201,101 Sumitomo Mitsui Financial Group
Inc 7,985 1.53JPY 49,452 Sumitomo Mitsui Trust Holdings
Inc 1,960 0.38JPY 25,221 Suruga Bank Ltd^ 226 0.04JPY 29,328 Yamaguchi Financial Group Inc^ 332 0.06
Beverages JPY 54,535 Asahi Group Holdings Ltd 2,641 0.51JPY 20,400 Coca-Cola Bottlers Japan
Holdings Inc 734 0.14JPY 123,617 Kirin Holdings Co Ltd 3,155 0.60JPY 20,600 Suntory Beverage & Food Ltd 875 0.17
Building materials and fixtures JPY 28,246 AGC Inc 1,178 0.22JPY 36,907 Daikin Industries Ltd^ 4,392 0.84JPY 39,466 LIXIL Group Corp^ 806 0.15JPY 5,245 Rinnai Corp 453 0.09JPY 18,289 Taiheiyo Cement Corp 574 0.11JPY 20,900 TOTO Ltd^ 973 0.19
Chemicals JPY 22,950 Air Water Inc 417 0.08JPY 186,387 Asahi Kasei Corp 2,482 0.48JPY 40,786 Daicel Corp^ 447 0.09JPY 14,455 Hitachi Chemical Co Ltd^ 285 0.05JPY 28,132 JSR Corp 538 0.10JPY 38,230 Kaneka Corp 335 0.06JPY 26,463 Kansai Paint Co Ltd^ 607 0.12JPY 48,013 Kuraray Co Ltd 676 0.13JPY 190,606 Mitsubishi Chemical Holdings
Corp 1,660 0.32JPY 24,147 Mitsubishi Gas Chemical Co Inc 537 0.10JPY 26,553 Mitsui Chemicals Inc 712 0.14JPY 21,700 Nippon Paint Holdings Co Ltd^ 942 0.18JPY 19,500 Nissan Chemical Corp^ 870 0.17JPY 24,363 Nitto Denko Corp 1,759 0.34JPY 55,070 Shin-Etsu Chemical Co Ltd 5,544 1.06JPY 221,461 Sumitomo Chemical Co Ltd 1,268 0.24JPY 18,862 Taiyo Nippon Sanso Corp^ 288 0.05JPY 27,422 Teijin Ltd^ 510 0.10JPY 207,345 Toray Industries Inc 1,604 0.31JPY 38,900 Tosoh Corp 633 0.12
Commercial services JPY 9,991 Benesse Holdings Inc 363 0.07JPY 36,332 Dai Nippon Printing Co Ltd^ 791 0.15JPY 15,937 Park24 Co Ltd 447 0.09

iSHARES VII PLC
Schedule of Investments (continued) iSHARES MSCI JAPAN UCITS ETF USD (Acc) (continued) As at 31 July 2018
[ 2 0 4 ] i S H A R E S V I I P L C A N N U A L R E P O R T
Ccy Holding Investment Fair value
$'000
% of netassetvalue
Equities (31 July 2017: 93.80%) (cont) Japan (31 July 2017: 93.80%) (cont) Commercial services (cont)
JPY 28,700 Persol Holdings Co Ltd 624 0.12JPY 165,200 Recruit Holdings Co Ltd 4,508 0.86JPY 31,585 Secom Co Ltd^ 2,407 0.46JPY 10,900 Sohgo Security Services Co Ltd 497 0.10JPY 70,459 Toppan Printing Co Ltd 541 0.10
Computers JPY 295,865 Fujitsu Ltd^ 2,010 0.38JPY 38,868 NEC Corp 1,076 0.21JPY 17,010 Nomura Research Institute Ltd 814 0.16JPY 92,200 NTT Data Corp^ 1,049 0.20JPY 9,200 Obic Co Ltd 787 0.15JPY 15,700 Otsuka Corp 612 0.12JPY 19,638 TDK Corp^ 2,093 0.40
Cosmetics & personal care JPY 74,418 Kao Corp^ 5,410 1.04JPY 4,700 Kose Corp^ 898 0.17JPY 32,100 Lion Corp 580 0.11JPY 14,200 Pola Orbis Holdings Inc^ 549 0.11JPY 57,036 Shiseido Co Ltd 4,183 0.80JPY 60,700 Unicharm Corp^ 1,842 0.35
Distribution & wholesale JPY 211,418 ITOCHU Corp^ 3,739 0.72JPY 233,233 Marubeni Corp 1,773 0.34JPY 202,283 Mitsubishi Corp 5,633 1.08JPY 255,190 Mitsui & Co Ltd 4,260 0.81JPY 168,225 Sumitomo Corp^ 2,758 0.53JPY 31,938 Toyota Tsusho Corp 1,085 0.21
Diversified financial services JPY 65,020 Acom Co Ltd^ 258 0.05JPY 15,346 AEON Financial Service Co Ltd 316 0.06JPY 23,312 Credit Saison Co Ltd 362 0.07JPY 238,270 Daiwa Securities Group Inc 1,385 0.27JPY 77,800 Japan Exchange Group Inc 1,380 0.26JPY 123,411 Mebuki Financial Group Inc^ 439 0.08JPY 68,374 Mitsubishi UFJ Lease & Finance
Co Ltd^ 413 0.08JPY 517,715 Nomura Holdings Inc 2,444 0.47JPY 198,039 ORIX Corp 3,202 0.61JPY 6,700 Tokyo Century Corp 365 0.07
Electrical components & equipment JPY 33,653 Brother Industries Ltd 684 0.13JPY 28,284 Casio Computer Co Ltd^ 461 0.09JPY 7,000 Mabuchi Motor Co Ltd^ 343 0.07
Electricity JPY 90,281 Chubu Electric Power Co Inc 1,387 0.27JPY 40,503 Chugoku Electric Power Co Inc^ 532 0.10
Ccy Holding InvestmentFair value
$'000
% of netassetvalue
Japan (31 July 2017: 93.80%) (cont) Electricity (cont)
JPY 21,710 Electric Power Development Co Ltd 587 0.11
JPY 104,662 Kansai Electric Power Co Inc 1,485 0.29JPY 57,073 Kyushu Electric Power Co Inc^ 670 0.13JPY 66,786 Tohoku Electric Power Co Inc 847 0.16JPY 212,257 Tokyo Electric Power Co
Holdings Inc 1,012 0.19Electronics
JPY 29,100 Alps Electric Co Ltd^ 836 0.16JPY 5,015 Hirose Electric Co Ltd^ 609 0.12JPY 10,474 Hitachi High-Technologies Corp^ 427 0.08JPY 57,120 Hoya Corp 3,419 0.65JPY 48,010 Kyocera Corp 2,782 0.53JPY 57,700 Minebea Mitsumi Inc 1,028 0.20JPY 27,002 Murata Manufacturing Co Ltd^ 4,704 0.90JPY 33,800 Nidec Corp^ 4,885 0.94JPY 12,627 Nippon Electric Glass Co Ltd 407 0.08JPY 28,942 Omron Corp^ 1,303 0.25JPY 32,381 Yokogawa Electric Corp^ 573 0.11
Engineering & construction JPY 6,900 Japan Airport Terminal Co Ltd 327 0.06JPY 30,458 JGC Corp^ 589 0.11JPY 132,719 Kajima Corp 1,033 0.20JPY 94,250 Obayashi Corp 981 0.19JPY 81,798 Shimizu Corp^ 853 0.17JPY 32,201 Taisei Corp 1,786 0.34
Entertainment JPY 30,100 Oriental Land Co Ltd^ 3,262 0.62JPY 6,817 Sankyo Co Ltd 268 0.05JPY 27,191 Sega Sammy Holdings Inc 432 0.08JPY 16,798 Toho Co Ltd 500 0.10
Environmental control JPY 14,878 Kurita Water Industries Ltd 433 0.08
Food JPY 68,571 Ajinomoto Co Inc 1,210 0.23JPY 12,188 Calbee Inc^ 403 0.08JPY 22,243 Kikkoman Corp 1,051 0.20JPY 18,500 MEIJI Holdings Co Ltd 1,451 0.28JPY 13,274 NH Foods Ltd 526 0.10JPY 28,500 Nisshin Seifun Group Inc^ 556 0.11JPY 8,758 Nissin Foods Holdings Co Ltd 603 0.11JPY 113,048 Seven & i Holdings Co Ltd 4,600 0.88JPY 13,186 Toyo Suisan Kaisha Ltd 476 0.09JPY 16,800 Yakult Honsha Co Ltd 1,207 0.23JPY 18,578 Yamazaki Baking Co Ltd^ 461 0.09
Forest products & paper JPY 128,507 Oji Holdings Corp 760 0.15

iSHARES VII PLC
Schedule of Investments (continued) iSHARES MSCI JAPAN UCITS ETF USD (Acc) (continued) As at 31 July 2018
i S H A R E S V I I P L C A N N U A L R E P O R T [ 2 0 5 ]
Ccy Holding Investment Fair value
$'000
% of netassetvalue
Equities (31 July 2017: 93.80%) (cont) Japan (31 July 2017: 93.80%) (cont)
Gas JPY 55,790 Osaka Gas Co Ltd^ 1,069 0.21JPY 11,360 Toho Gas Co Ltd^ 386 0.07JPY 58,504 Tokyo Gas Co Ltd 1,424 0.27
Hand & machine tools JPY 4,500 Disco Corp 762 0.14JPY 83,459 Fuji Electric Co Ltd^ 613 0.12JPY 33,784 Makita Corp^ 1,512 0.29
Healthcare products JPY 14,800 Cyberdyne Inc 174 0.03JPY 43,714 Olympus Corp^ 1,767 0.34JPY 33,643 Shimadzu Corp 956 0.18JPY 24,900 Sysmex Corp^ 2,351 0.45JPY 45,700 Terumo Corp^ 2,502 0.48
Home builders JPY 84,991 Daiwa House Industry Co Ltd 3,089 0.59JPY 21,800 Iida Group Holdings Co Ltd^ 426 0.08JPY 58,572 Sekisui Chemical Co Ltd^ 1,045 0.20JPY 92,373 Sekisui House Ltd^ 1,569 0.30
Home furnishings JPY 8,400 Hoshizaki Corp^ 845 0.16JPY 330,154 Panasonic Corp 4,241 0.81JPY 26,100 Sharp Corp^ 603 0.12JPY 189,497 Sony Corp 9,866 1.89
Insurance JPY 160,700 Dai-ichi Life Holdings Inc 3,018 0.58JPY 234,900 Japan Post Holdings Co Ltd 2,585 0.49JPY 71,217 MS&AD Insurance Group
Holdings Inc 2,171 0.42JPY 49,534 Sompo Holdings Inc^ 2,006 0.38JPY 25,945 Sony Financial Holdings Inc 497 0.09JPY 83,447 T&D Holdings Inc 1,241 0.24JPY 101,015 Tokio Marine Holdings Inc 4,784 0.92
Internet JPY 15,200 CyberAgent Inc 797 0.15JPY 22,000 Kakaku.com Inc 462 0.09JPY 10,600 LINE Corp^ 462 0.09JPY 31,700 M3 Inc 1,202 0.23JPY 128,962 Rakuten Inc^ 907 0.17JPY 33,910 SBI Holdings Inc 922 0.18JPY 30,500 Start Today Co Ltd^ 1,222 0.24JPY 18,064 Trend Micro Inc 1,064 0.20JPY 210,400 Yahoo Japan Corp^ 799 0.15
Iron & steel JPY 32,327 Hitachi Metals Ltd^ 349 0.07JPY 73,849 JFE Holdings Inc 1,495 0.29JPY 45,095 Kobe Steel Ltd 442 0.08JPY 113,500 Nippon Steel & Sumitomo Metal
Corp 2,254 0.43
Ccy Holding InvestmentFair value
$'000
% of netassetvalue
Japan (31 July 2017: 93.80%) (cont) Leisure time
JPY 10,886 Shimano Inc^ 1,561 0.30JPY 20,591 Yamaha Corp 960 0.18JPY 42,026 Yamaha Motor Co Ltd 1,104 0.21
Machinery - diversified JPY 51,067 Amada Holdings Co Ltd 510 0.10JPY 14,500 Daifuku Co Ltd 633 0.12JPY 29,083 Fanuc Corp^ 5,695 1.09JPY 14,660 Keyence Corp 7,715 1.48JPY 147,151 Kubota Corp 2,457 0.47JPY 46,951 Mitsubishi Heavy Industries Ltd^ 1,756 0.34JPY 16,649 Nabtesco Corp^ 514 0.10JPY 8,324 SMC Corp^ 2,787 0.53JPY 17,086 Sumitomo Heavy Industries Ltd 591 0.11JPY 18,224 THK Co Ltd 492 0.09JPY 35,740 Yaskawa Electric Corp^ 1,172 0.23
Machinery, construction & mining JPY 15,972 Hitachi Construction Machinery
Co Ltd 509 0.10JPY 725,238 Hitachi Ltd 5,045 0.97JPY 138,414 Komatsu Ltd^ 4,052 0.77JPY 272,746 Mitsubishi Electric Corp 3,683 0.70
Metal fabricate/ hardware JPY 9,009 Maruichi Steel Tube Ltd^ 309 0.06JPY 42,500 MISUMI Group Inc^ 1,079 0.20JPY 56,269 NSK Ltd 611 0.12
Mining JPY 15,790 Mitsubishi Materials Corp 447 0.08JPY 34,729 Sumitomo Metal Mining Co Ltd^ 1,246 0.24
Miscellaneous manufacturers JPY 58,148 FUJIFILM Holdings Corp 2,390 0.46JPY 48,020 Nikon Corp^ 807 0.16JPY 977,963 Toshiba Corp 2,997 0.57
Office & business equipment JPY 149,784 Canon Inc 4,840 0.93JPY 67,475 Konica Minolta Inc^ 603 0.12JPY 104,332 Ricoh Co Ltd^ 1,014 0.19JPY 41,100 Seiko Epson Corp 739 0.14
Oil & gas JPY 20,568 Idemitsu Kosan Co Ltd 924 0.18JPY 152,800 Inpex Corp 1,680 0.32JPY 486,133 JXTG Holdings Inc 3,559 0.68JPY 27,510 Showa Shell Sekiyu KK^ 450 0.09
Packaging & containers JPY 23,472 Toyo Seikan Group Holdings Ltd 430 0.08
Pharmaceuticals JPY 27,400 Alfresa Holdings Corp 654 0.13JPY 290,600 Astellas Pharma Inc 4,718 0.90JPY 33,806 Chugai Pharmaceutical Co Ltd 1,712 0.33JPY 85,083 Daiichi Sankyo Co Ltd^ 3,513 0.67

iSHARES VII PLC
Schedule of Investments (continued) iSHARES MSCI JAPAN UCITS ETF USD (Acc) (continued) As at 31 July 2018
[ 2 0 6 ] i S H A R E S V I I P L C A N N U A L R E P O R T
Ccy Holding Investment Fair value
$'000
% of netassetvalue
Equities (31 July 2017: 93.80%) (cont) Japan (31 July 2017: 93.80%) (cont) Pharmaceuticals (cont)
JPY 37,568 Eisai Co Ltd 3,216 0.62JPY 8,827 Hisamitsu Pharmaceutical Co
Inc^ 643 0.12JPY 7,100 Kobayashi Pharmaceutical Co
Ltd 591 0.11JPY 38,307 Kyowa Hakko Kirin Co Ltd 725 0.14JPY 25,648 Medipal Holdings Corp 519 0.10JPY 37,723 Mitsubishi Tanabe Pharma Corp 705 0.13JPY 57,100 Ono Pharmaceutical Co Ltd^ 1,344 0.26JPY 58,662 Otsuka Holdings Co Ltd 2,699 0.52JPY 53,900 Santen Pharmaceutical Co Ltd 898 0.17JPY 42,055 Shionogi & Co Ltd^ 2,283 0.44JPY 23,197 Sumitomo Dainippon Pharma Co
Ltd 448 0.09JPY 10,700 Suzuken Co Ltd 467 0.09JPY 5,677 Taisho Pharmaceutical Holdings
Co Ltd^ 641 0.12JPY 106,335 Takeda Pharmaceutical Co Ltd^ 4,441 0.85
Real estate investment & services JPY 16,968 Aeon Mall Co Ltd 296 0.06JPY 10,664 Daito Trust Construction Co Ltd 1,778 0.34JPY 45,118 Hulic Co Ltd^ 441 0.08JPY 176,487 Mitsubishi Estate Co Ltd 3,059 0.58JPY 133,516 Mitsui Fudosan Co Ltd 3,180 0.61JPY 18,623 Nomura Real Estate Holdings Inc 405 0.08JPY 56,032 Sumitomo Realty & Development
Co Ltd 2,046 0.39JPY 31,100 Tokyo Tatemono Co Ltd 417 0.08JPY 73,814 Tokyu Fudosan Holdings Corp 500 0.10
Real estate investment trusts JPY 253 Daiwa House REIT Investment
Corp 624 0.12JPY 125 Japan Prime Realty Investment
Corp 449 0.09JPY 199 Japan Real Estate Investment
Corp^ 1,040 0.20JPY 385 Japan Retail Fund Investment
Corp 701 0.13JPY 204 Nippon Building Fund Inc 1,134 0.22JPY 272 Nippon Prologis REIT Inc 549 0.10JPY 583 Nomura Real Estate Master Fund
Inc 825 0.16JPY 424 United Urban Investment Corp 657 0.13
Retail JPY 5,118 ABC-Mart Inc^ 277 0.05JPY 90,995 Aeon Co Ltd^ 1,842 0.35JPY 18,000 Don Quijote Holdings Co Ltd 839 0.16JPY 11,358 FamilyMart UNY Holdings Co
Ltd^ 1,055 0.20JPY 8,554 Fast Retailing Co Ltd^ 3,725 0.71
Ccy Holding InvestmentFair value
$'000
% of netassetvalue
Japan (31 July 2017: 93.80%) (cont) Retail (cont)
JPY 51,268 Isetan Mitsukoshi Holdings Ltd 617 0.12JPY 34,300 J Front Retailing Co Ltd^ 501 0.10JPY 7,266 Lawson Inc 436 0.08JPY 30,777 Marui Group Co Ltd^ 609 0.12JPY 9,894 McDonald's Holdings Co Japan
Ltd^ 472 0.09JPY 11,800 Nitori Holdings Co Ltd^ 1,778 0.34JPY 3,700 Ryohin Keikaku Co Ltd 1,185 0.23JPY 3,501 Shimamura Co Ltd^ 327 0.06JPY 10,900 Sundrug Co Ltd 435 0.08JPY 43,164 Takashimaya Co Ltd^ 360 0.07JPY 5,700 Tsuruha Holdings Inc 700 0.14JPY 33,120 USS Co Ltd 626 0.12JPY 92,230 Yamada Denki Co Ltd^ 457 0.09
Semiconductors JPY 21,100 Hamamatsu Photonics KK 892 0.17JPY 122,500 Renesas Electronics Corp 1,090 0.21JPY 14,223 Rohm Co Ltd 1,207 0.23JPY 35,900 SUMCO Corp^ 764 0.15JPY 23,322 Tokyo Electron Ltd 3,991 0.76
Software JPY 14,600 DeNA Co Ltd 275 0.05JPY 13,739 Konami Holdings Corp^ 644 0.12JPY 65,856 Nexon Co Ltd 944 0.18JPY 6,052 Oracle Corp Japan 507 0.10
Telecommunications JPY 3,400 Hikari Tsushin Inc 569 0.11JPY 271,200 KDDI Corp 7,542 1.44JPY 103,400 Nippon Telegraph & Telephone
Corp 4,774 0.91JPY 204,400 NTT DoCoMo Inc 5,246 1.01JPY 123,660 SoftBank Group Corp 10,230 1.96
Toys JPY 30,013 Bandai Namco Holdings Inc 1,197 0.23JPY 17,110 Nintendo Co Ltd^ 5,619 1.08
Transportation JPY 21,318 Central Japan Railway Co^ 4,427 0.85JPY 46,427 East Japan Railway Co 4,330 0.83JPY 34,300 Hankyu Hanshin Holdings Inc 1,362 0.26JPY 17,411 Kamigumi Co Ltd 363 0.07JPY 15,400 Keihan Holdings Co Ltd^ 559 0.11JPY 33,330 Keikyu Corp^ 545 0.10JPY 15,508 Keio Corp^ 759 0.15JPY 19,605 Keisei Electric Railway Co Ltd 651 0.12JPY 26,331 Kintetsu Group Holdings Co Ltd 1,044 0.20JPY 23,200 Kyushu Railway Co 711 0.14JPY 16,177 Mitsui OSK Lines Ltd^ 418 0.08JPY 27,000 Nagoya Railroad Co Ltd^ 676 0.13

iSHARES VII PLC
Schedule of Investments (continued) iSHARES MSCI JAPAN UCITS ETF USD (Acc) (continued) As at 31 July 2018
i S H A R E S V I I P L C A N N U A L R E P O R T [ 2 0 7 ]
Ccy Holding Investment Fair value
$'000
% of netassetvalue
Equities (31 July 2017: 93.80%) (cont) Japan (31 July 2017: 93.80%) (cont) Transportation (cont)
JPY 11,173 Nippon Express Co Ltd 729 0.14JPY 24,510 Nippon Yusen KK 471 0.09JPY 43,161 Odakyu Electric Railway Co Ltd^ 911 0.17JPY 32,200 Seibu Holdings Inc 542 0.10JPY 14,400 SG Holdings Co Ltd^ 314 0.06JPY 28,098 Tobu Railway Co Ltd^ 826 0.16JPY 75,365 Tokyu Corp 1,294 0.25JPY 24,249 West Japan Railway Co^ 1,690 0.32JPY 46,449 Yamato Holdings Co Ltd 1,341 0.26
Total Japan 517,586 99.12Total equities 517,586 99.12
CcyNo. of
contracts
Underlying exposure
$'000 Fair value
$'000
% of netassetsvalue
Financial derivative instruments (31 July 2017: 0.00%) Futures contracts (31 July 2017: 0.00%)
JPY 29 Topix Index Futures September 2018 4,567 (39) (0.01)Total unrealised losses on futures contracts (39) (0.01)Total financial derivative instruments (39) (0.01)
Fair value$'000
% of net assetvalue
Total value of investments 517,547 99.11 Cash† 4,190 0.80 Other net assets 467 0.09 Net asset value attributable to redeemable participating shareholders at the end of the financial year 522,204 100.00
† Cash holdings of $4,081,687 are held with State Street Bank and Trust Company. $108,349 is held as security for futures contracts with Credit Suisse AG. ^ These securities are partially or fully transferred as securities lent.
Equities are primarily classified by country of incorporation of the entity in which the Fund holds shares. Underlying exposure has been calculated according to the guidelines issued by the ESMA and represents the market value of an equivalent position in the assets underlying each financial derivative instrument.
Analysis of total current assets gross of all liabilities
Fair value$'000
% of totalcurrentassets
Transferable securities admitted to an official stock exchange listing 517,586 99.07Other assets 4,873 0.93Total current assets 522,459 100.00

iSHARES VII PLC
Schedule of Investments (continued) iSHARES MSCI KOREA UCITS ETF USD (Acc) As at 31 July 2018
[ 2 0 8 ] i S H A R E S V I I P L C A N N U A L R E P O R T
Ccy Holding Investment Fair value
$'000
% of netassetvalue
Transferable Securities Admitted to an Official Stock Exchange Listing or traded on a Regulated Market (31 July 2017: 99.31%)
Equities (31 July 2017: 99.31%) Republic of South Korea (31 July 2017: 99.31%) Advertising
KRW 4,452 Cheil Worldwide Inc 80 0.17Aerospace & defence
KRW 4,677 Korea Aerospace Industries Ltd^ 147 0.30Agriculture
KRW 7,500 KT&G Corp^ 741 1.53Airlines
KRW 3,060 Korean Air Lines Co Ltd 80 0.16Auto manufacturers
KRW 9,857 Hyundai Motor Co 1,141 2.35KRW 2,420 Hyundai Motor Co (2nd
Preference) 190 0.39KRW 1,537 Hyundai Motor Co (Preference) 112 0.23KRW 16,804 Kia Motors Corp^ 476 0.98
Auto parts & equipment KRW 4,720 Hankook Tire Co Ltd 187 0.38KRW 12,062 Hanon Systems^ 116 0.24KRW 4,363 Hyundai Mobis Co Ltd^ 889 1.83
Banks KRW 16,259 Industrial Bank of Korea 227 0.47KRW 30,382 Woori Bank 459 0.94
Biotechnology KRW 267 Medy-Tox Inc 171 0.35KRW 1,062 Samsung Biologics Co Ltd^ 354 0.73
Chemicals KRW 6,916 Hanwha Chemical Corp 131 0.27KRW 375 KCC Corp^ 114 0.23KRW 1,163 Kumho Petrochemical Co Ltd 117 0.24KRW 2,940 LG Chem Ltd 985 2.03KRW 497 LG Chem Ltd (Preference) 96 0.20KRW 1,098 Lotte Chemical Corp 353 0.73
Commercial services KRW 1,097 S-1 Corp 85 0.18
Computers KRW 2,240 Samsung SDS Co Ltd 420 0.86KRW 2,021 SK Holdings Co Ltd 476 0.98
Cosmetics & personal care KRW 2,050 Amorepacific Corp^ 490 1.01KRW 586 Amorepacific Corp (Preference) 75 0.15KRW 1,848 Amorepacific Group^ 158 0.33KRW 601 LG Household & Health Care Ltd 650 1.34KRW 131 LG Household & Health Care Ltd
(Preference) 78 0.16Distribution & wholesale
KRW 2,640 Hanwha Corp 76 0.15KRW 6,028 LG Corp 406 0.84KRW 3,161 Posco Daewoo Corp 54 0.11
Ccy Holding InvestmentFair value
$'000
% of netassetvalue
Republic of South Korea (31 July 2017: 99.31%) (cont) Diversified financial services
KRW 16,823 BNK Financial Group Inc^ 135 0.28KRW 10,881 DGB Financial Group Inc 91 0.19KRW 18,948 Hana Financial Group Inc 761 1.57KRW 25,394 KB Financial Group Inc 1,217 2.51KRW 2,677 Korea Investment Holdings Co
Ltd 171 0.35KRW 25,610 Mirae Asset Daewoo Co Ltd^ 186 0.38KRW 8,967 NH Investment & Securities Co
Ltd^ 104 0.21KRW 1,868 Samsung Card Co Ltd^ 59 0.12KRW 4,003 Samsung Securities Co Ltd 116 0.24KRW 27,257 Shinhan Financial Group Co Ltd 1,061 2.18
Electrical components & equipment KRW 917 LG Innotek Co Ltd 134 0.28
Electricity KRW 16,421 Korea Electric Power Corp 489 1.01
Electronics KRW 14,863 LG Display Co Ltd^ 282 0.58KRW 3,577 Samsung Electro-Mechanics Co
Ltd 491 1.01Energy - alternate sources
KRW 1,142 OCI Co Ltd 101 0.21Engineering & construction
KRW 1,732 Daelim Industrial Co Ltd 121 0.25KRW 10,674 Daewoo Engineering &
Construction Co Ltd^ 54 0.11KRW 3,238 GS Engineering & Construction
Corp 131 0.27KRW 2,268 HDC Hyundai Development Co-
Engineering & Construction 117 0.24KRW 5,014 Hyundai Engineering &
Construction Co Ltd^ 262 0.54KRW 1,453 Kepco Plant Service &
Engineering Co Ltd^ 45 0.09KRW 10,044 Samsung Engineering Co Ltd 153 0.32
Food KRW 498 BGF retail Co Ltd 75 0.16KRW 531 CJ CheilJedang Corp^ 161 0.33KRW 2,177 Dongsuh Cos Inc 50 0.10KRW 1,900 Lotte Corp 89 0.18KRW 1,377 Orion Corp 164 0.34KRW 81 Ottogi Corp 64 0.13
Gas KRW 1,767 Korea Gas Corp 92 0.19
Healthcare services KRW 3,274 SillaJen Inc^ 153 0.32
Holding companies - diversified operations KRW 942 CJ Corp 118 0.24
Home furnishings KRW 3,114 Coway Co Ltd 261 0.54KRW 684 Hanssem Co Ltd^ 59 0.12KRW 6,800 LG Electronics Inc 455 0.94

iSHARES VII PLC
Schedule of Investments (continued) iSHARES MSCI KOREA UCITS ETF USD (Acc) (continued) As at 31 July 2018
i S H A R E S V I I P L C A N N U A L R E P O R T [ 2 0 9 ]
Ccy Holding Investment Fair value
$'000
% of netassetvalue
Equities (31 July 2017: 99.31%) (cont) Republic of South Korea (31 July 2017: 99.31%) (cont) Hotels
KRW 7,589 Kangwon Land Inc 176 0.36Insurance
KRW 3,137 DB Insurance Co Ltd 181 0.37KRW 19,215 Hanwha Life Insurance Co Ltd 89 0.18KRW 4,018 Hyundai Marine & Fire Insurance
Co Ltd 132 0.27KRW 2,129 ING Life Insurance Korea Ltd 80 0.16KRW 1,970 Samsung Fire & Marine
Insurance Co Ltd 481 0.99KRW 4,479 Samsung Life Insurance Co Ltd 385 0.80
Internet KRW 2,935 Kakao Corp^ 295 0.61KRW 1,796 NAVER Corp^ 1,150 2.37KRW 1,121 NCSoft Corp 386 0.79
Investment services KRW 614 Hyundai Heavy Industries
Holdings Co Ltd 184 0.38Iron & steel
KRW 5,167 Hyundai Steel Co 248 0.51KRW 5,026 POSCO 1,485 3.06
Machinery - diversified KRW 4,093 Doosan Heavy Industries &
Construction Co Ltd 55 0.11Machinery, construction & mining
KRW 2,278 Doosan Bobcat Inc 68 0.14Marine transportation
KRW 1,984 HLB Inc^ 121 0.25KRW 2,359 Hyundai Heavy Industries Co
Ltd^ 225 0.46KRW 24,403 Samsung Heavy Industries Co
Ltd 141 0.29Mining
KRW 538 Korea Zinc Co Ltd 198 0.41Oil & gas
KRW 3,299 GS Holdings Corp 159 0.33KRW 2,868 S-Oil Corp 301 0.62KRW 4,142 SK Innovation Co Ltd 735 1.51
Pharmaceuticals KRW 2,183 Celltrion Healthcare Co Ltd^ 178 0.37KRW 5,198 Celltrion Inc^ 1,262 2.60KRW 981 Celltrion Pharm Inc 62 0.13KRW 404 Hanmi Pharm Co Ltd^ 153 0.31KRW 818 Hanmi Science Co Ltd 51 0.10KRW 869 ViroMed Co Ltd 155 0.32KRW 553 Yuhan Corp 110 0.23
Retail KRW 693 CJ ENM Co Ltd 144 0.30KRW 1,336 E-Mart Inc 261 0.54KRW 1,679 GS Retail Co Ltd^ 50 0.10
Ccy Holding InvestmentFair value
$'000
% of netassetvalue
Republic of South Korea (31 July 2017: 99.31%) (cont) Retail (cont)
KRW 1,979 Hotel Shilla Co Ltd 176 0.36KRW 906 Hyundai Department Store Co
Ltd 80 0.16KRW 724 Lotte Shopping Co Ltd^ 133 0.28KRW 4,847 Samsung C&T Corp^ 535 1.10KRW 477 Shinsegae Inc 142 0.29
Semiconductors KRW 308,084 Samsung Electronics Co Ltd 12,738 26.23KRW 54,933 Samsung Electronics Co Ltd
(Preference) 1,878 3.87KRW 37,268 SK Hynix Inc 2,875 5.92
Software KRW 1,638 Netmarble Corp 212 0.44
Telecommunications KRW 1,576 KT Corp 40 0.08USD 661 KT Corp ADR 9 0.02KRW 3,511 Samsung SDI Co Ltd 719 1.48KRW 1,291 SK Telecom Co Ltd 289 0.60
Toys KRW 361 Pearl Abyss Corp 71 0.15
Transportation KRW 515 CJ Logistics Corp^ 69 0.14KRW 1,167 Hyundai Glovis Co Ltd 143 0.29KRW 15,418 Pan Ocean Co Ltd 71 0.15
Total Republic of South Korea 48,037 98.92Total equities 48,037 98.92
CcyNo. of
contracts
Underlying exposure
$'000 Fair value
$'000
% of netassetsvalue
Financial derivative instruments (31 July 2017: 0.01%) Futures contracts (31 July 2017: 0.01%)
KRW 6 Kospi 2 Index Futures September 2018 409 (10) (0.02)Total unrealised losses on futures contracts (10) (0.02)Total financial derivative instruments (10) (0.02)

iSHARES VII PLC
Schedule of Investments (continued) iSHARES MSCI KOREA UCITS ETF USD (Acc) (continued) As at 31 July 2018
[ 2 1 0 ] i S H A R E S V I I P L C A N N U A L R E P O R T
Fair value
$'000
% of net assetvalue
Total value of investments 48,027 98.90 Cash† 429 0.88 Other net assets 108 0.22 Net asset value attributable to redeemable participating shareholders at the end of the financial year 48,564 100.00
† Cash holdings of $130,307 are held with State Street Bank and Trust Company. $298,932 is held as security for futures contracts with Credit Suisse AG. ^ These securities are partially or fully transferred as securities lent.
Equities are primarily classified by country of incorporation of the entity in which the Fund holds shares. Underlying exposure has been calculated according to the guidelines issued by the ESMA and represents the market value of an equivalent position in the assets underlying each financial derivative instrument.
Analysis of total current assets gross of all liabilities
Fair value$'000
% of totalcurrentassets
Transferable securities admitted to an official stock exchange listing 48,037 98.84Other assets 564 1.16Total current assets 48,601 100.00

iSHARES VII PLC
Schedule of Investments (continued) iSHARES MSCI MEXICO CAPPED UCITS ETF As at 31 July 2018
i S H A R E S V I I P L C A N N U A L R E P O R T [ 2 1 1 ]
Ccy Holding Investment Fair value
$'000
% of netassetvalue
Transferable Securities Admitted to an Official Stock Exchange Listing or traded on a Regulated Market (31 July 2017: 98.55%)
Equities (31 July 2017: 98.55%) Mexico (31 July 2017: 98.55%) Banks
MXN 756,616 Banco Santander Mexico SA Institucion de Banca Multiple Grupo Financiero Santand 1,274 1.84
MXN 1,070,560 Grupo Financiero Banorte SAB de CV 7,456 10.79
MXN 957,101 Grupo Financiero Inbursa SAB de CV 1,575 2.28Beverages
MXN 182,323 Arca Continental SAB de CV 1,209 1.75MXN 217,226 Coca-Cola Femsa SAB de CV 1,359 1.97MXN 802,534 Fomento Economico Mexicano
SAB de CV 7,864 11.38Building materials and fixtures
MXN 6,012,457 Cemex SAB de CV 4,476 6.48Chemicals
MXN 433,812 Mexichem SAB de CV 1,517 2.19Electricity
MXN 221,990 Infraestructura Energetica Nova SAB de CV 1,083 1.57Engineering & construction
MXN 147,558 Grupo Aeroportuario del Pacifico SAB de CV 1,393 2.01
MXN 85,913 Grupo Aeroportuario del Sureste SAB de CV 1,527 2.21
MXN 94,205 Promotora y Operadora de Infraestructura SAB de CV 974 1.41Food
MXN 89,584 Gruma SAB de CV 1,158 1.68MXN 680,661 Grupo Bimbo SAB de CV 1,447 2.09
Holding companies - diversified operations MXN 1,253,821 Alfa SAB de CV 1,704 2.47MXN 188,598 Grupo Carso SAB de CV 783 1.13
Household goods & home construction MXN 630,795 Kimberly-Clark de Mexico SAB
de CV 1,160 1.68Media
MXN 1,009,268 Grupo Televisa SAB 4,013 5.81Mining
MXN 1,446,107 Grupo Mexico SAB de CV 4,542 6.57MXN 57,600 Industrias Penoles SAB de CV 975 1.41
Real estate investment trusts MXN 1,389,582 Fibra Uno Administracion SA de
CV 1,999 2.89Retail
MXN 208,153 Alsea SAB de CV 717 1.04MXN 76,768 El Puerto de Liverpool SAB de
CV 569 0.82MXN 2,161,936 Wal-Mart de Mexico SAB de CV 6,307 9.13
Ccy Holding InvestmentFair value
$'000
% of netassetvalue
Mexico (31 July 2017: 98.55%) (cont) Telecommunications
MXN 13,893,924 America Movil SAB de CV 11,892 17.21Total Mexico 68,973 99.81Total equities 68,973 99.81
CcyNo. of
contracts
Underlying exposure
$'000 Fair value
$'000
% of netassetsvalue
Financial derivative instruments (31 July 2017: 0.02%) Futures contracts (31 July 2017: 0.02%)
MXN 4 Mexico Bolsa Index Futures September 2018 106 1 0.00Total unrealised gains on futures contracts 1 0.00Total financial derivative instruments 1 0.00
Fair value$'000
% of net assetvalue
Total value of investments 68,974 99.81 Cash† 163 0.24 Other net liabilities (34) (0.05) Net asset value attributable to redeemable participating shareholders at the end of the financial year 69,103 100.00
† Cash holdings of $155,650 are held with State Street Bank and Trust Company. $6,990 is held as security for futures contracts with Credit Suisse AG.
Equities are primarily classified by country of incorporation of the entity in which the Fund holds shares. Underlying exposure has been calculated according to the guidelines issued by the ESMA and represents the market value of an equivalent position in the assets underlying each financial derivative instrument.
Analysis of total current assets gross of all liabilities
Fair value$'000
% of totalcurrentassets
Transferable securities admitted to an official stock exchange listing 68,973 99.76Exchange traded financial derivative instruments 1 0.00Other assets 165 0.24Total current assets 69,139 100.00

iSHARES VII PLC
Schedule of Investments (continued) iSHARES MSCI RUSSIA ADR/GDR UCITS ETF As at 31 July 2018
[ 2 1 2 ] i S H A R E S V I I P L C A N N U A L R E P O R T
Ccy Holding Investment Fair value
$'000
% of netAssetvalue
Transferable Securities Admitted to an Official Stock Exchange Listing or traded on a Regulated Market (31 July 2017: 96.62%)
Equities (31 July 2017: 96.62%) Netherlands (31 July 2017:Nil) Food
USD 214,865 X5 Retail Group NV GDR 5,758 1.84 Total Netherlands 5,758 1.84
Russian Federation (31 July 2017: 96.62%)
Banks USD 4,746,538 Sberbank of Russia PJSC ADR 66,879 21.34USD 2,848,377 VTB Bank PJSC GDR 4,443 1.42
Chemicals USD 204,906 PhosAgro PJSC GDR 2,699 0.86
Food USD 627,252 Magnit PJSC GDR 10,299 3.29
Iron & steel USD 302,237 Magnitogorsk Iron & Steel Works
PJSC GDR 2,923 0.93USD 210,760 Novolipetsk Steel PJSC GDR 5,450 1.74USD 368,249 Severstal PJSC GDR 6,010 1.92
Mining USD 1,113,187 MMC Norilsk Nickel PJSC ADR 19,258 6.15
Oil & gas USD 9,368,666 Gazprom PJSC ADR 42,000 13.41USD 748,054 Lukoil PJSC ADR 53,695 17.14USD 160,195 Novatek PJSC GDR 25,487 8.13USD 2,050,141 Rosneft Oil Co PJSC GDR 13,531 4.32USD 1,256,364 Surgutneftegas PJSC ADR 5,757 1.84USD 447,021 Tatneft PJSC ADR 30,844 9.84
Telecommunications USD 878,511 Mobile TeleSystems PJSC ADR 7,705 2.46
Total Russian Federation 296,980 94.79 Total equities 302,738 96.63
CcyNo. of
contracts
Underlying exposure
$'000 Fair value
$'000
% of netassetsvalue
Financial derivative instruments (31 July 2017: 0.14%) Futures contracts (31 July 2017: 0.14%)
USD 199 Mini MSCI Emerging Markets Index Futures September 2018 10,668 240 0.08Total unrealised gains on futures contracts 240 0.08Total financial derivative instruments 240 0.08
Fair value
$'000
% of net assetvalue
Total value of investments 302,978 96.71 Cash† 1,515 0.48 Other net assets 8,790 2.81 Net asset value attributable to redeemable participating shareholders at the end of the financial year 313,283 100.00
† Cash holdings of $1,146,708 are held with State Street Bank and Trust Company. $367,553 is held as security for futures contracts with Credit Suisse AG.
Equities are primarily classified by country of incorporation of the entity in which the Fund holds shares. Underlying exposure has been calculated according to the guidelines issued by the ESMA and represents the market value of an equivalent position in the assets underlying each financial derivative instrument.
Analysis of total current assets gross of all liabilities
Fair value$'000
% of totalcurrentassets
Transferable securities admitted to an official stock exchange listing 302,738 96.58Exchange traded financial derivative instruments 240 0.08Other assets 10,474 3.34Total current assets 313,452 100.00

iSHARES VII PLC
Schedule of Investments (continued) iSHARES MSCI UK SMALL CAP UCITS ETF As at 31 July 2018
i S H A R E S V I I P L C A N N U A L R E P O R T [ 2 1 3 ]
Ccy Holding Investment Fair value
£'000
% of netassetvalue
Transferable Securities Admitted to an Official Stock Exchange Listing or traded on a Regulated Market (31 July 2017: 98.97%)
Equities (31 July 2017: 98.97%) Bermuda (31 July 2017: 1.65%) Insurance
GBP 114,270 Hiscox Ltd 1,826 1.25GBP 77,975 Lancashire Holdings Ltd 447 0.30
Mining GBP 345,380 Petra Diamonds Ltd^ 159 0.11
Oil & gas GBP 89,797 Gulf Keystone Petroleum Ltd 231 0.16
Total Bermuda 2,663 1.82
Canada (31 July 2017: 0.25%) Distribution & wholesale
GBP 146,058 Entertainment One Ltd 523 0.36Total Canada 523 0.36
Cayman Islands (31 July 2017: 0.83%) Insurance
GBP 218,234 Phoenix Group Holdings 1,504 1.03Total Cayman Islands 1,504 1.03
Gibraltar (31 July 2017: 0.14%) Entertainment
GBP 139,979 888 Holdings Plc 349 0.24Total Gibraltar 349 0.24
Guernsey (31 July 2017: 1.09%) Diversified financial services
GBP 79,700 Burford Capital Ltd 1,465 1.00GBP 153,236 Standard Life Investment
Property Income Trust Ltd 144 0.10Internet
GBP 15,531 SafeCharge International Group Ltd 51 0.03Real estate investment & services
GBP 349,362 Sirius Real Estate Ltd^ 204 0.14Real estate investment trusts
GBP 123,987 Regional REIT Ltd 117 0.08GBP 211,159 Schroder Real Estate Investment
Trust Ltd 132 0.09Transportation
GBP 122,080 Stobart Group Ltd^ 287 0.20Total Guernsey 2,400 1.64
Ireland (31 July 2017: 1.99%) Food
GBP 276,999 Greencore Group Plc 491 0.34Healthcare services
GBP 100,041 UDG Healthcare Plc 840 0.57
Ccy Holding InvestmentFair value
£'000
% of netassetvalue
Ireland (31 July 2017: 1.99%) (cont) Retail
GBP 95,629 Grafton Group Plc 733 0.50Total Ireland 2,064 1.41
Isle of Man (31 July 2017: 2.29%) Real estate investment trusts
GBP 570,375 RDI REIT Plc 203 0.14Software
GBP 121,439 Playtech Plc 653 0.45Total Isle of Man 856 0.59
Israel (31 July 2017: 0.16%) Diversified financial services
GBP 31,353 Plus500 Ltd 582 0.40Total Israel 582 0.40
Jersey (31 July 2017: 2.59%) Apparel retailers
GBP 302,615 boohoo.com Plc^ 609 0.42Commercial services
GBP 275,093 IWG Plc 835 0.57Diversified financial services
GBP 53,284 Sanne Group Plc^ 376 0.26Mining
GBP 464,120 Centamin Plc 552 0.38Oil & gas services
GBP 105,410 Petrofac Ltd 647 0.44Total Jersey 3,019 2.07
Luxembourg (31 July 2017: 0.74%) Retail
GBP 362,786 B&M European Value Retail SA 1,497 1.02Total Luxembourg 1,497 1.02
Netherlands (31 July 2017: Nil) Building materials and fixtures
GBP 4,554 Rhi Magnesita NV 222 0.15EUR 5,973 Rhi Magnesita NV (Austria Listed) 288 0.20
Total Netherlands 510 0.35
United Kingdom (31 July 2017: 87.24%) Aerospace & defence
GBP 112,737 Chemring Group Plc 258 0.18GBP 963,260 Cobham Plc 1,204 0.83GBP 30,391 Ultra Electronics Holdings Plc^ 502 0.34
Agriculture GBP 24,930 Genus Plc 715 0.49
Airlines GBP 39,622 Dart Group Plc 365 0.25
Apparel retailers GBP 11,639 Ted Baker Plc^ 257 0.18

iSHARES VII PLC
Schedule of Investments (continued) iSHARES MSCI UK SMALL CAP UCITS ETF (continued) As at 31 July 2018
[ 2 1 4 ] i S H A R E S V I I P L C A N N U A L R E P O R T
Ccy Holding Investment Fair value
£'000
% of netassetvalue
Equities (31 July 2017: 98.97%) (cont) United Kingdom (31 July 2017: 87.24%) (cont) Banks
GBP 14,644 Bank of Georgia Group Plc 268 0.18GBP 356,561 CYBG Plc^ 1,232 0.85GBP 34,812 Metro Bank Plc^ 1,114 0.76GBP 85,772 OneSavings Bank Plc 373 0.26GBP 118,098 Virgin Money Holdings UK Plc 468 0.32
Beverages GBP 106,501 Britvic Plc 856 0.59GBP 39,507 Fevertree Drinks Plc 1,361 0.93GBP 256,665 Marston's Plc^ 243 0.16GBP 73,100 Stock Spirits Group Plc 158 0.11
Biotechnology GBP 72,787 Abcam Plc 1,076 0.74GBP 19,836 Oxford Biomedica Plc 176 0.12
Building materials and fixtures GBP 80,458 Forterra Plc 239 0.16GBP 165,259 Ibstock Plc 406 0.28GBP 81,937 Marshalls Plc^ 355 0.24GBP 80,344 Polypipe Group Plc^ 302 0.21GBP 36,713 Victoria Plc^ 303 0.21
Chemicals GBP 181,852 Elementis Plc^ 473 0.32GBP 106,657 Filtrona Plc^ 513 0.35GBP 110,562 Synthomer Plc 585 0.40GBP 34,653 Victrex Plc 1,093 0.75
Commercial services GBP 236,438 AA Plc 265 0.18GBP 103,517 Aggreko Plc^ 769 0.53GBP 154,078 Ascential Plc^ 647 0.44GBP 660,558 Capita Plc 1,070 0.73GBP 40,857 De La Rue Plc 207 0.14GBP 20,250 Dignity Plc 205 0.14GBP 141,346 Equiniti Group Plc 302 0.21GBP 555,204 Hays Plc 1,103 0.75GBP 290,287 ITE Group Plc 241 0.16GBP 20,532 Keywords Studios Plc 375 0.26GBP 128,513 Michael Page International Plc 769 0.53GBP 151,819 Mitie Group Plc^ 234 0.16GBP 52,672 Northgate Plc 230 0.16GBP 230,335 QinetiQ Group Plc 623 0.43GBP 123,358 Redde Plc 205 0.14GBP 734,431 Rentokil Initial Plc 2,492 1.71GBP 39,595 Restore Plc 198 0.13GBP 91,152 RPS Group Plc 224 0.15GBP 55,557 Savills Plc 492 0.34GBP 448,405 Serco Group Plc 453 0.31GBP 7,943 Staffline Group Plc 87 0.06
Computers GBP 29,041 Computacenter Plc 455 0.31GBP 56,560 GB Group Plc 305 0.21
Ccy Holding InvestmentFair value
£'000
% of netassetvalue
United Kingdom (31 July 2017: 87.24%) (cont) Computers (cont)
GBP 25,696 Kainos Group Plc 95 0.06GBP 111,040 NCC Group Plc 244 0.17GBP 44,609 Softcat Plc 361 0.25GBP 132,130 Sophos Group Plc 638 0.44
Cosmetics & personal care GBP 115,517 PZ Cussons Plc 269 0.18
Distribution & wholesale GBP 44,498 Diploma Plc^ 586 0.40GBP 167,194 Inchcape Plc 1,179 0.81GBP 230,654 SIG Plc^ 280 0.19
Diversified financial services GBP 82,287 Allied Minds Plc 70 0.05GBP 66,934 Arrow Global Group Plc^ 171 0.12GBP 157,917 Ashmore Group Plc 576 0.39GBP 110,570 Brewin Dolphin Holdings Plc 388 0.27GBP 46,793 Charter Court Financial Services
Group Plc 158 0.11GBP 60,999 Close Brothers Group Plc 969 0.66GBP 46,792 CMC Markets Plc 92 0.06GBP 148,215 IG Group Holdings Plc 1,364 0.93GBP 77,813 IntegraFin Holdings Plc 292 0.20GBP 116,956 Intermediate Capital Group Plc 1,242 0.85GBP 90,218 International Personal Finance
Plc 217 0.15GBP 175,167 Jupiter Fund Management Plc^ 767 0.53GBP 657,228 Man Group Plc 1,140 0.78GBP 130,034 NEX Group Plc 1,313 0.90GBP 30,625 P2P Global Investments Plc 247 0.17GBP 102,472 Paragon Group of Cos Plc 510 0.35GBP 102,611 Provident Financial Plc^ 688 0.47GBP 755,991 Quilter Plc 1,170 0.80GBP 18,074 Rathbone Brothers Plc 444 0.30GBP 223,217 Tullett Prebon Plc 625 0.43
Electronics GBP 178,210 Electrocomponents Plc 1,279 0.88GBP 151,468 Halma Plc 2,131 1.46GBP 21,567 Oxford Instruments Plc 206 0.14GBP 14,662 Renishaw Plc 802 0.55GBP 350,666 Rotork Plc 1,262 0.86GBP 39,101 Smart Metering Systems Plc^ 246 0.17GBP 48,044 Spectris Plc 1,112 0.76
Engineering & construction GBP 277,872 Balfour Beatty Plc 816 0.56GBP 415,675 BBA Aviation Plc 1,455 0.99GBP 42,847 Costain Group Plc 187 0.13GBP 119,350 HomeServe Plc 1,208 0.83GBP 29,599 Keller Group Plc 319 0.22GBP 37,804 Kier Group Plc^ 365 0.25GBP 14,880 Morgan Sindall Group Plc 210 0.14
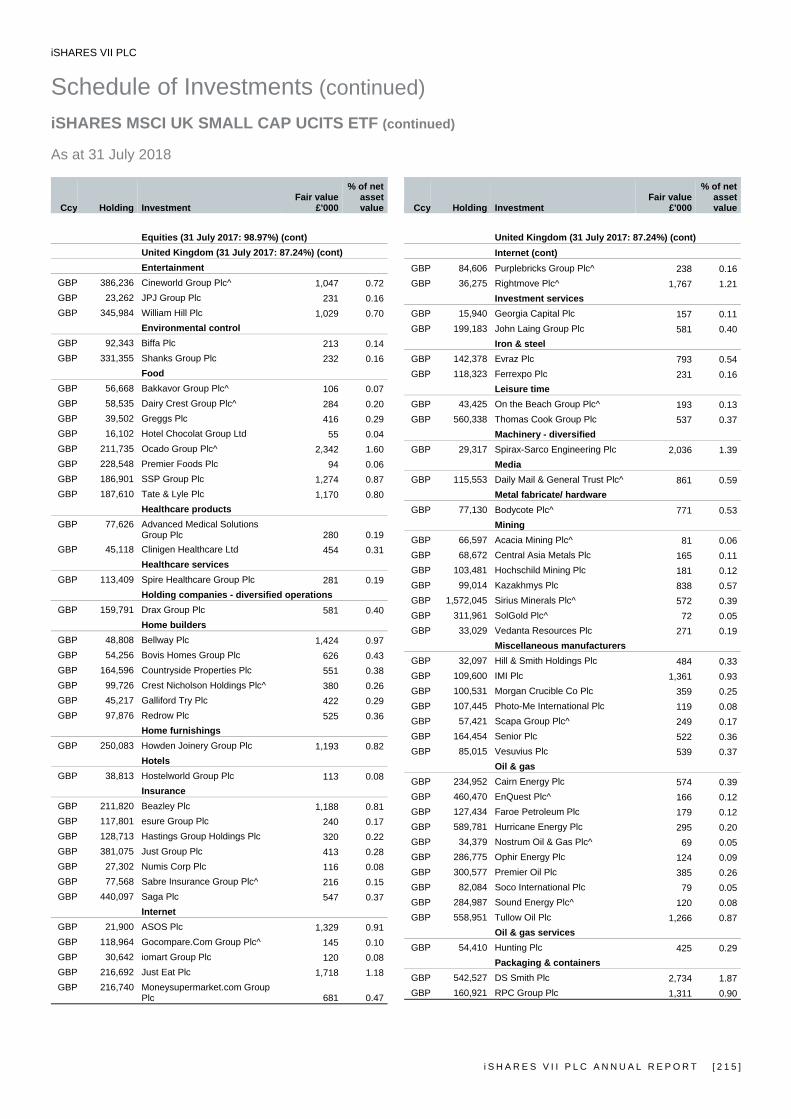
iSHARES VII PLC
Schedule of Investments (continued) iSHARES MSCI UK SMALL CAP UCITS ETF (continued) As at 31 July 2018
i S H A R E S V I I P L C A N N U A L R E P O R T [ 2 1 5 ]
Ccy Holding Investment Fair value
£'000
% of netassetvalue
Equities (31 July 2017: 98.97%) (cont) United Kingdom (31 July 2017: 87.24%) (cont) Entertainment
GBP 386,236 Cineworld Group Plc^ 1,047 0.72GBP 23,262 JPJ Group Plc 231 0.16GBP 345,984 William Hill Plc 1,029 0.70
Environmental control GBP 92,343 Biffa Plc 213 0.14GBP 331,355 Shanks Group Plc 232 0.16
Food GBP 56,668 Bakkavor Group Plc^ 106 0.07GBP 58,535 Dairy Crest Group Plc^ 284 0.20GBP 39,502 Greggs Plc 416 0.29GBP 16,102 Hotel Chocolat Group Ltd 55 0.04GBP 211,735 Ocado Group Plc^ 2,342 1.60GBP 228,548 Premier Foods Plc 94 0.06GBP 186,901 SSP Group Plc 1,274 0.87GBP 187,610 Tate & Lyle Plc 1,170 0.80
Healthcare products GBP 77,626 Advanced Medical Solutions
Group Plc 280 0.19GBP 45,118 Clinigen Healthcare Ltd 454 0.31
Healthcare services GBP 113,409 Spire Healthcare Group Plc 281 0.19
Holding companies - diversified operations GBP 159,791 Drax Group Plc 581 0.40
Home builders GBP 48,808 Bellway Plc 1,424 0.97GBP 54,256 Bovis Homes Group Plc 626 0.43GBP 164,596 Countryside Properties Plc 551 0.38GBP 99,726 Crest Nicholson Holdings Plc^ 380 0.26GBP 45,217 Galliford Try Plc 422 0.29GBP 97,876 Redrow Plc 525 0.36
Home furnishings GBP 250,083 Howden Joinery Group Plc 1,193 0.82
Hotels GBP 38,813 Hostelworld Group Plc 113 0.08
Insurance GBP 211,820 Beazley Plc 1,188 0.81GBP 117,801 esure Group Plc 240 0.17GBP 128,713 Hastings Group Holdings Plc 320 0.22GBP 381,075 Just Group Plc 413 0.28GBP 27,302 Numis Corp Plc 116 0.08GBP 77,568 Sabre Insurance Group Plc^ 216 0.15GBP 440,097 Saga Plc 547 0.37
Internet GBP 21,900 ASOS Plc 1,329 0.91GBP 118,964 Gocompare.Com Group Plc^ 145 0.10GBP 30,642 iomart Group Plc 120 0.08GBP 216,692 Just Eat Plc 1,718 1.18GBP 216,740 Moneysupermarket.com Group
Plc 681 0.47
Ccy Holding InvestmentFair value
£'000
% of netassetvalue
United Kingdom (31 July 2017: 87.24%) (cont) Internet (cont)
GBP 84,606 Purplebricks Group Plc^ 238 0.16GBP 36,275 Rightmove Plc^ 1,767 1.21
Investment services GBP 15,940 Georgia Capital Plc 157 0.11GBP 199,183 John Laing Group Plc 581 0.40
Iron & steel GBP 142,378 Evraz Plc 793 0.54GBP 118,323 Ferrexpo Plc 231 0.16
Leisure time GBP 43,425 On the Beach Group Plc^ 193 0.13GBP 560,338 Thomas Cook Group Plc 537 0.37
Machinery - diversified GBP 29,317 Spirax-Sarco Engineering Plc 2,036 1.39
Media GBP 115,553 Daily Mail & General Trust Plc^ 861 0.59
Metal fabricate/ hardware GBP 77,130 Bodycote Plc^ 771 0.53
Mining GBP 66,597 Acacia Mining Plc^ 81 0.06GBP 68,672 Central Asia Metals Plc 165 0.11GBP 103,481 Hochschild Mining Plc 181 0.12GBP 99,014 Kazakhmys Plc 838 0.57GBP 1,572,045 Sirius Minerals Plc^ 572 0.39GBP 311,961 SolGold Plc^ 72 0.05GBP 33,029 Vedanta Resources Plc 271 0.19
Miscellaneous manufacturers GBP 32,097 Hill & Smith Holdings Plc 484 0.33GBP 109,600 IMI Plc 1,361 0.93GBP 100,531 Morgan Crucible Co Plc 359 0.25GBP 107,445 Photo-Me International Plc 119 0.08GBP 57,421 Scapa Group Plc^ 249 0.17GBP 164,454 Senior Plc 522 0.36GBP 85,015 Vesuvius Plc 539 0.37
Oil & gas GBP 234,952 Cairn Energy Plc 574 0.39GBP 460,470 EnQuest Plc^ 166 0.12GBP 127,434 Faroe Petroleum Plc 179 0.12GBP 589,781 Hurricane Energy Plc 295 0.20GBP 34,379 Nostrum Oil & Gas Plc^ 69 0.05GBP 286,775 Ophir Energy Plc 124 0.09GBP 300,577 Premier Oil Plc 385 0.26GBP 82,084 Soco International Plc 79 0.05GBP 284,987 Sound Energy Plc^ 120 0.08GBP 558,951 Tullow Oil Plc 1,266 0.87
Oil & gas services GBP 54,410 Hunting Plc 425 0.29
Packaging & containers GBP 542,527 DS Smith Plc 2,734 1.87GBP 160,921 RPC Group Plc 1,311 0.90

iSHARES VII PLC
Schedule of Investments (continued) iSHARES MSCI UK SMALL CAP UCITS ETF (continued) As at 31 July 2018
[ 2 1 6 ] i S H A R E S V I I P L C A N N U A L R E P O R T
Ccy Holding Investment Fair value
£'000
% of netassetvalue
Equities (31 July 2017: 98.97%) (cont) United Kingdom (31 July 2017: 87.24%) (cont) Pharmaceuticals
GBP 139,424 Alliance Pharma Plc 130 0.09GBP 125,022 BTG Plc 664 0.46GBP 27,110 CVS Group Plc 307 0.21GBP 41,209 Dechra Pharmaceuticals Plc 1,230 0.84GBP 58,178 Hikma Pharmaceuticals Plc 955 0.65GBP 290,715 Indivior Plc 889 0.61GBP 227,052 Vectura Group Plc^ 182 0.12
Real estate investment & services GBP 290,750 Capital & Counties Properties
Plc^ 801 0.55GBP 65,747 Countrywide Plc^ 32 0.02GBP 244,721 Empiric Student Property Plc^ 233 0.16GBP 163,513 Grainger Plc 501 0.34GBP 40,607 Helical Plc^ 130 0.09GBP 178,753 McCarthy & Stone Plc^ 194 0.13GBP 77,590 St Modwen Properties Plc 314 0.21GBP 23,743 Telford Homes Plc^ 97 0.07GBP 64,829 Watkin Jones Plc 127 0.09
Real estate investment trusts GBP 968,875 Assura Plc^ 548 0.38GBP 59,152 Big Yellow Group Plc 563 0.38GBP 168,507 Capital & Regional Plc^ 80 0.05GBP 135,609 Civitas Social Housing Plc 142 0.10GBP 42,001 Derwent London Plc 1,312 0.90GBP 150,706 GCP Student Living Plc^ 225 0.15GBP 102,392 Great Portland Estates Plc 733 0.50GBP 167,727 Hansteen Holdings Plc 184 0.13GBP 356,038 Intu Properties Plc^ 622 0.43GBP 273,612 LondonMetric Property Plc 515 0.35GBP 124,487 NewRiver REIT Plc^ 341 0.23GBP 294,055 Primary Health Properties Plc^ 333 0.23GBP 68,433 Shaftesbury Plc^ 638 0.44GBP 549,322 Tritax Big Box REIT Plc 837 0.57GBP 105,973 Unite Group Plc 928 0.64GBP 48,194 Workspace Group Plc 523 0.36
Retail GBP 89,756 AO World Plc^ 128 0.09GBP 125,580 Card Factory Plc^ 265 0.18GBP 35,649 Conviviality Plc* - 0.00GBP 384,059 Debenhams Plc^ 46 0.03GBP 86,203 DFS Furniture Plc 177 0.12GBP 396,532 Dixons Carphone Plc 701 0.48GBP 194,635 Domino's Pizza Group Plc^ 614 0.42GBP 40,908 Dunelm Group Plc^ 215 0.15GBP 182,856 Enterprise Inns Plc 280 0.19GBP 124,883 Greene King Plc^ 643 0.44GBP 82,202 Halfords Group Plc 269 0.18GBP 176,804 JD Sports Fashion Plc 827 0.57
Ccy Holding InvestmentFair value
£'000
% of netassetvalue
United Kingdom (31 July 2017: 87.24%) (cont) Retail (cont)
GBP 26,841 JD Wetherspoon Plc 327 0.22GBP 127,015 Lookers Plc^ 133 0.09GBP 21,752 Majestic Wine Plc 97 0.07GBP 85,753 Mitchells & Butlers Plc^ 217 0.15GBP 63,299 N Brown Group Plc^ 92 0.06GBP 19,599 Patisserie Holdings Plc 85 0.06GBP 583,582 Pendragon Plc 136 0.09GBP 195,680 Pets at Home Group Plc^ 227 0.16GBP 77,055 Restaurant Group Plc^ 204 0.14GBP 84,787 Sports Direct International Plc 351 0.24GBP 21,508 SuperGroup Plc 268 0.18GBP 44,361 WH Smith Plc 854 0.59
Semiconductors GBP 295,937 IQE Plc^ 293 0.20
Software GBP 36,536 Alfa Financial Software Holdings
Plc^ 60 0.04GBP 26,071 Aveva Group Plc 686 0.47GBP 20,171 Blue Prism Group Plc 361 0.25GBP 21,162 EMIS Group Plc 193 0.13GBP 7,527 Frontier Developments Plc 85 0.06GBP 123,535 Learning Technologies Group Plc 125 0.08
Storage & warehousing GBP 85,703 Safestore Holdings Plc 480 0.33
Telecommunications GBP 9,945 accesso Technology Group Plc^ 269 0.18GBP 184,375 Inmarsat Plc^ 1,050 0.72GBP 181,955 KCOM Group Plc^ 170 0.12GBP 277,510 TalkTalk Telecom Group Plc^ 318 0.22GBP 25,429 Telecom Plus Plc 263 0.18
Textile GBP 554,693 Coats Group Plc^ 460 0.32
Toys GBP 12,030 Games Workshop Group Plc 360 0.25
Transportation GBP 473,374 Firstgroup Plc 418 0.29GBP 16,597 Go-Ahead Group Plc 256 0.17GBP 30,738 John Menzies Plc 199 0.14GBP 185,712 National Express Group Plc 751 0.51GBP 164,576 Stagecoach Group Plc 263 0.18
Water GBP 169,094 Pennon Group Plc 1,271 0.87
Total United Kingdom 129,397 88.61Total equities 145,364 99.54

iSHARES VII PLC
Schedule of Investments (continued) iSHARES MSCI UK SMALL CAP UCITS ETF (continued) As at 31 July 2018
i S H A R E S V I I P L C A N N U A L R E P O R T [ 2 1 7 ]
CcyNo. of
contracts
Underlying exposure
£'000 Fair value
£'000
% of netassetsvalue
Financial derivative instruments (31 July 2017: 0.01%) Futures contracts (31 July 2017: 0.01%)
GBP 16 FTSE 250 Index Futures September 2018 659 7 0.00
Total unrealised gains on futures contracts 7 0.00
Total financial derivative instruments 7 0.00
Fair value£'000
% of net assetvalue
Total value of investments 145,371 99.54 Cash† 402 0.28 Other net assets 256 0.18 Net asset value attributable to redeemable participating shareholders at the end of the financial year 146,029 100.00
† Cash holdings of £383,242 are held with State Street Bank and Trust Company. £19,096 is held as security for futures contracts with Credit Suisse AG. ^ These securities are partially or fully transferred as securities lent. * These securities were valued in consultation with the Investment Manager. These securities were delisted, suspended or priced at zero at the financial year end.
Equities are primarily classified by country of incorporation of the entity in which the Fund holds shares. Underlying exposure has been calculated according to the guidelines issued by the ESMA and represents the market value of an equivalent position in the assets underlying each financial derivative instrument.
Analysis of total current assets gross of all liabilities
Fair value£'000
% of totalcurrentassets
Transferable securities admitted to an official stock exchange listing 145,364 99.50Exchange traded financial derivative instruments 7 0.00Other assets 734 0.50Total current assets 146,105 100.00

iSHARES VII PLC
Schedule of Investments (continued) iSHARES MSCI UK UCITS ETF As at 31 July 2018
[ 2 1 8 ] i S H A R E S V I I P L C A N N U A L R E P O R T
Ccy Holding Investment Fair value
£'000
% of netassetvalue
Transferable Securities Admitted to an Official Stock Exchange Listing or traded on a Regulated Market (31 July 2017: 99.68%)
Equities (31 July 2017: 99.68%) Germany (31 July 2017: 0.28%) Leisure time
GBP 28,667 TUI AG 468 0.36Total Germany 468 0.36
Ireland (31 July 2017: 0.31%) Oil & gas
GBP 5,772 DCC Plc 407 0.31Total Ireland 407 0.31
Isle of Man (31 July 2017: Nil) Entertainment
GBP 35,475 GVC Holdings Plc 415 0.32Total Isle of Man 415 0.32
Jersey (31 July 2017: 6.95%) Advertising
GBP 82,123 WPP Plc 979 0.75Biotechnology
GBP 59,020 Shire Plc 2,568 1.97Commercial services
GBP 59,436 Experian Plc 1,114 0.85Distribution & wholesale
GBP 15,338 Ferguson Plc 922 0.71Mining
GBP 748,399 Glencore Plc 2,503 1.92GBP 6,139 Randgold Resources Ltd 348 0.27
Total Jersey 8,434 6.47
Switzerland (31 July 2017: 0.21%) Beverages
GBP 13,147 Coca-Cola HBC AG 359 0.28Total Switzerland 359 0.28
United Kingdom (31 July 2017: 91.93%) Aerospace & defence
GBP 206,676 BAE Systems Plc 1,350 1.04GBP 50,524 Meggitt Plc 288 0.22GBP 108,359 Rolls-Royce Holdings Plc 1,074 0.82
Agriculture GBP 148,751 British American Tobacco Plc^ 6,249 4.79GBP 61,853 Imperial Brands Plc 1,807 1.39
Airlines GBP 10,100 easyJet Plc 163 0.12
Apparel retailers GBP 27,218 Burberry Group Plc 573 0.44
Ccy Holding InvestmentFair value
£'000
% of netassetvalue
United Kingdom (31 July 2017: 91.93%) (cont) Banks
GBP 1,106,650 Barclays Plc 2,147 1.65GBP 1,297,795 HSBC Holdings Plc 9,480 7.27GBP 42,867 Investec Plc^ 237 0.18GBP 4,675,079 Lloyds Banking Group Plc 2,916 2.24GBP 311,422 Royal Bank of Scotland Group
Plc 795 0.61GBP 181,481 Standard Chartered Plc 1,249 0.96
Beverages GBP 159,551 Diageo Plc 4,471 3.43
Chemicals GBP 8,552 Croda International Plc 440 0.34GBP 12,594 Johnson Matthey Plc^ 473 0.36
Commercial services GBP 32,157 Ashtead Group Plc 753 0.58GBP 16,450 Babcock International Group Plc^ 118 0.09GBP 21,742 Bunzl Plc^ 492 0.38GBP 100,967 G4S Plc 279 0.22GBP 10,502 Intertek Group Plc 617 0.47GBP 68,494 Relx Plc^ 1,139 0.87
Cosmetics & personal care GBP 79,885 Unilever Plc 3,479 2.67
Diversified financial services GBP 63,309 3i Group Plc 600 0.46GBP 18,519 Hargreaves Lansdown Plc 384 0.29GBP 20,307 London Stock Exchange Group
Plc 893 0.69GBP 8,089 Schroders Plc 252 0.19GBP 34,430 St James's Place Plc 415 0.32GBP 174,471 Standard Life Aberdeen Plc 545 0.42
Electricity GBP 65,541 SSE Plc 819 0.63
Entertainment GBP 46,614 Merlin Entertainments Plc^ 184 0.14
Food GBP 22,949 Associated British Foods Plc 563 0.43GBP 114,023 J Sainsbury Plc^ 373 0.29GBP 630,525 Tesco Plc 1,641 1.26GBP 145,635 Wm Morrison Supermarkets Plc^ 381 0.29
Food Service GBP 102,694 Compass Group Plc 1,684 1.29
Forest products & paper GBP 23,897 Mondi Plc 501 0.38
Gas GBP 364,436 Centrica Plc 542 0.42GBP 218,418 National Grid Plc 1,776 1.36
Healthcare products GBP 88,909 ConvaTec Group Plc 194 0.15GBP 56,936 Smith & Nephew Plc 752 0.58

iSHARES VII PLC
Schedule of Investments (continued) iSHARES MSCI UK UCITS ETF (continued) As at 31 July 2018
i S H A R E S V I I P L C A N N U A L R E P O R T [ 2 1 9 ]
Ccy Holding Investment Fair value
£'000
% of netassetvalue
Equities (31 July 2017: 99.68%) (cont) United Kingdom (31 July 2017: 91.93%) (cont) Healthcare services
GBP 23,987 Mediclinic International Plc 123 0.09GBP 6,766 NMC Health Plc 257 0.20
Home builders GBP 65,889 Barratt Developments Plc 352 0.27GBP 8,344 Berkeley Group Holdings Plc 311 0.24GBP 20,101 Persimmon Plc 499 0.38GBP 213,188 Taylor Wimpey Plc 373 0.29
Hotels GBP 11,637 InterContinental Hotels Group Plc 548 0.42GBP 11,936 Whitbread Plc 467 0.36
Household goods & home construction GBP 43,362 Reckitt Benckiser Group Plc^ 2,947 2.26
Insurance GBP 12,981 Admiral Group Plc 257 0.20GBP 259,898 Aviva Plc 1,299 1.00GBP 88,007 Direct Line Insurance Group Plc 303 0.23GBP 385,410 Legal & General Group Plc 1,012 0.77GBP 167,793 Prudential Plc 3,029 2.32GBP 66,561 RSA Insurance Group Plc 429 0.33
Internet GBP 60,728 Auto Trader Group Plc^ 258 0.20
Investment services GBP 312,513 Melrose Industries Plc 675 0.52
Leisure time GBP 11,716 Carnival Plc 518 0.40
Machinery - diversified GBP 15,677 Weir Group Plc^ 305 0.23
Media GBP 81,095 Informa Plc 640 0.49GBP 233,125 ITV Plc 384 0.30GBP 50,799 Pearson Plc^ 470 0.36GBP 67,117 Sky Plc 1,023 0.78
Mining GBP 68,321 Anglo American Plc 1,184 0.91GBP 25,661 Antofagasta Plc 257 0.20GBP 136,976 BHP Billiton Plc 2,403 1.84GBP 14,386 Fresnillo Plc 150 0.11GBP 77,933 Rio Tinto Plc 3,271 2.51
Miscellaneous manufacturers GBP 25,753 Smiths Group Plc 416 0.32
Oil & gas GBP 1,291,797 BP Plc 7,406 5.68GBP 298,142 Royal Dutch Shell Plc 7,797 5.98GBP 242,909 Royal Dutch Shell Plc Class 'B' 6,489 4.98
Oil & gas services GBP 44,100 John Wood Group Plc^ 287 0.22
Pharmaceuticals GBP 82,131 AstraZeneca Plc 4,817 3.70GBP 321,558 GlaxoSmithKline Plc 5,086 3.90
Ccy Holding InvestmentFair value
£'000
% of netassetvalue
United Kingdom (31 July 2017: 91.93%) (cont) Real estate investment trusts
GBP 60,537 British Land Co Plc 400 0.31GBP 51,028 Hammerson Plc 266 0.20GBP 48,275 Land Securities Group Plc 455 0.35GBP 65,263 Segro Plc 434 0.33
Retail GBP 140,607 Kingfisher Plc^ 417 0.32GBP 105,727 Marks & Spencer Group Plc^ 326 0.25GBP 9,255 Next Plc 549 0.42GBP 16,088 Travis Perkins Plc^ 193 0.15
Software GBP 28,371 Micro Focus International Plc^ 355 0.27GBP 70,500 Sage Group Plc 438 0.34
Telecommunications GBP 545,723 BT Group Plc 1,274 0.97GBP 1,729,956 Vodafone Group Plc 3,218 2.47
Transportation GBP 57,589 Royal Mail Plc 270 0.21
Water GBP 15,375 Severn Trent Plc 298 0.23GBP 44,372 United Utilities Group Plc 319 0.24
Total United Kingdom 118,342 90.78Total equities 128,425 98.52
CcyNo. of
contracts
Underlying exposure
£'000 Fair value
£'000
% of net asset value
Financial derivative instruments (31 July 2017: 0.00%)
Futures contracts (31 July 2017: 0.00%) GBP 24 FTSE 100 Index
Futures September 2018 1,808 41 0.03 Total unrealised gains on futures contracts 41 0.03 Total financial derivative instruments 41 0.03
Fair value
£'000
% of netassetvalue
Total value of investments 128,466 98.55 Cash† 1,508 1.16 Other net assets 379 0.29 Net asset value attributable to
redeemable participating shareholders at the end of the financial year 130,353 100.00
† Cash holdings of £1,458,938 are held with State Street Bank and Trust Company. £48,989 is held as security for futures contracts with Credit Suisse AG. ^ These securities are partially or fully transferred as securities lent.

iSHARES VII PLC
Schedule of Investments (continued) iSHARES MSCI UK UCITS ETF (continued) As at 31 July 2018
[ 2 2 0 ] i S H A R E S V I I P L C A N N U A L R E P O R T
Equities are primarily classified by country of incorporation of the entity in which the Fund holds shares. Underlying exposure has been calculated according to the guidelines issued by the ESMA and represents the market value of an equivalent position in the assets underlying each financial derivative instrument.
Analysis of total current assets gross of all liabilities
Fair value£'000
% of totalcurrentassets
Transferable securities admitted to an official stock exchange listing 128,425 98.50Exchange traded financial derivative instruments 41 0.03Other assets 1,923 1.47Total current assets 130,389 100.00

iSHARES VII PLC
Schedule of Investments (continued) iSHARES MSCI USA SMALL CAP UCITS ETF As at 31 July 2018
i S H A R E S V I I P L C A N N U A L R E P O R T [ 2 2 1 ]
Ccy Holding Investment Fair value
$'000
% of netassetvalue
Transferable Securities Admitted to an Official Stock Exchange Listing or traded on a Regulated Market (31 July 2017: 99.61%)
Equities (31 July 2017: 99.61%) Australia (31 July 2017: 0.04%) Chemicals
USD 16,730 Tronox Ltd 309 0.04Total Australia 309 0.04
Bermuda (31 July 2017: 1.22%) Commercial services
USD 24,823 Travelport Worldwide Ltd 469 0.07Distribution & wholesale
USD 10,844 Triton International Ltd 382 0.05Diversified financial services
USD 10,225 Aircastle Ltd 212 0.03Hotels
USD 15,672 Belmond Ltd 176 0.03Household goods & home construction
USD 5,184 Helen of Troy Ltd 594 0.09Insurance
USD 5,466 Argo Group International Holdings Ltd^ 342 0.05
USD 11,347 Aspen Insurance Holdings Ltd 459 0.07USD 22,662 Assured Guaranty Ltd 882 0.13USD 1,674 Enstar Group Ltd^ 362 0.05USD 17,303 Essent Group Ltd 664 0.09USD 6,692 James River Group Holdings Ltd 277 0.04USD 7,733 Maiden Holdings Ltd 67 0.01USD 15,695 Third Point Reinsurance Ltd^ 198 0.03USD 587 White Mountains Insurance
Group Ltd 536 0.08Oil & gas
USD 46,368 Kosmos Energy Ltd 351 0.05USD 61,452 Nabors Industries Ltd 368 0.05
Pharmaceuticals USD 3,459 Myovant Sciences Ltd 70 0.01
Retail USD 10,646 Signet Jewelers Ltd 615 0.09
Semiconductors USD 3,301 Alpha & Omega Semiconductor
Ltd 44 0.01USD 1,407 Marvell Technology Group Ltd 30 0.00
Telecommunications USD 8,636 Liberty Latin America Ltd^ 165 0.02USD 21,817 Liberty Latin America Ltd Class
'C' 422 0.06Total Bermuda 7,685 1.11
British Virgin Islands (31 July 2017: Nil) Biotechnology
USD 4,248 Biohaven Pharmaceutical Holding Co Ltd 147 0.02
Ccy Holding InvestmentFair value
$'000
% of netassetvalue
British Virgin Islands (31 July 2017: Nil) (cont) Environmental control
USD 2,838 AquaVenture Holdings Ltd 47 0.01Total British Virgin Islands 194 0.03
Canada (31 July 2017: 0.41%) Advertising
USD 14,272 MDC Partners Inc 73 0.01Building materials and fixtures
USD 5,371 Masonite International Corp 366 0.05Commercial services
USD 19,077 Civeo Corp 73 0.01Electrical components & equipment
USD 5,820 Novanta Inc 363 0.05Entertainment
USD 9,971 IMAX Corp^ 220 0.03USD 9,964 Lions Gate Entertainment Corp 238 0.04USD 19,324 Lions Gate Entertainment Corp
Class 'B' 442 0.06Oil & gas
USD 36,648 Ultra Petroleum Corp 65 0.01Software
USD 22,380 Mitel Networks Corp 245 0.04Total Canada 2,085 0.30
Cayman Islands (31 July 2017: 0.39%) Biotechnology
USD 6,906 Theravance Biopharma Inc 165 0.02Food
USD 6,738 Fresh Del Monte Produce Inc 244 0.04Insurance
USD 25,923 FGL Holdings^ 234 0.03USD 1,541 Global Indemnity Ltd 63 0.01USD 5,373 Greenlight Capital Re Ltd^ 78 0.01
Machinery - diversified USD 3,744 Ichor Holdings Ltd 79 0.01
Miscellaneous manufacturers USD 6,028 Ambarella Inc 236 0.03USD 6,919 Fabrinet^ 271 0.04
Pharmaceuticals USD 20,911 Herbalife Nutrition Ltd 1,080 0.16
Semiconductors USD 1,446 SMART Global Holdings Inc 44 0.01
Software USD 6,752 Cision Ltd 102 0.01
Total Cayman Islands 2,596 0.37
Curacao (31 July 2017: 0.03%) Healthcare products
USD 4,311 Orthofix International NV 261 0.04Total Curacao 261 0.04

iSHARES VII PLC
Schedule of Investments (continued) iSHARES MSCI USA SMALL CAP UCITS ETF (continued) As at 31 July 2018
[ 2 2 2 ] i S H A R E S V I I P L C A N N U A L R E P O R T
Ccy Holding Investment Fair value
$'000
% of netassetvalue
Equities (31 July 2017: 99.61%) (cont) Ireland (31 July 2017: 0.38%) Auto parts & equipment
USD 16,130 Adient Plc 768 0.11Biotechnology
USD 6,712 Prothena Corp Plc 100 0.01Engineering & construction
USD 31,832 nVent Electric Plc 872 0.13Oil & gas services
USD 183,508 Weatherford International Plc 622 0.09Pharmaceuticals
USD 37,203 Endo International Plc 463 0.07USD 29,441 Horizon Pharma Plc 519 0.07USD 18,047 Mallinckrodt Plc 423 0.06
Total Ireland 3,767 0.54
Israel (31 July 2017: 0.06%) Semiconductors
USD 8,638 Mellanox Technologies Ltd 678 0.10Total Israel 678 0.10
Jersey (31 July 2017: 0.04%) Auto parts & equipment
USD 16,233 Delphi Technologies Plc 733 0.11Diversified financial services
USD 35,725 Janus Henderson Group Plc 1,163 0.17Healthcare products
USD 13,267 Novocure Ltd 451 0.06Total Jersey 2,347 0.34
Luxembourg (31 July 2017: 0.11%) Diversified financial services
USD 2,357 Altisource Portfolio Solutions SA 79 0.01Miscellaneous manufacturers
USD 7,938 Trinseo SA 593 0.09Total Luxembourg 672 0.10
Marshall Islands (31 July 2017: 0.01%) Transportation
USD 2,641 International Seaways Inc^ 58 0.01Total Marshall Islands 58 0.01
Netherlands (31 July 2017: 0.26%) Commercial services
USD 4,523 Cimpress NV 661 0.09Healthcare products
USD 17,852 Wright Medical Group NV^ 454 0.07Hotels
USD 11,313 Playa Hotels & Resorts NV 118 0.02Oil & gas services
USD 8,174 Core Laboratories NV 916 0.13USD 9,842 Frank's International NV 83 0.01
Ccy Holding InvestmentFair value
$'000
% of netassetvalue
Netherlands (31 July 2017: 0.26%) (cont) Pharmaceuticals
USD 4,384 uniQure NV 135 0.02Total Netherlands 2,367 0.34
Panama (31 July 2017: 0.05%) Oil & gas services
USD 33,438 McDermott International Inc 602 0.09Total Panama 602 0.09
Puerto Rico (31 July 2017: 0.22%) Banks
USD 35,097 First BanCorp 289 0.04USD 12,556 OFG Bancorp 209 0.03USD 20,762 Popular Inc 1,030 0.15
Commercial services USD 10,214 Evertec Inc 238 0.03
Healthcare services USD 3,276 Triple-S Management Corp 116 0.02
Total Puerto Rico 1,882 0.27
Singapore (31 July 2017: Nil) Biotechnology
USD 2,276 WaVe Life Sciences Ltd 92 0.01Total Singapore 92 0.01
Switzerland (31 July 2017: 0.10%) Biotechnology
USD 3,507 CRISPR Therapeutics AG 167 0.03Oil & gas
USD 81,423 Transocean Ltd^ 1,048 0.15Total Switzerland 1,215 0.18
United Kingdom (31 July 2017: 0.98%) Chemicals
USD 9,853 Venator Materials Plc 144 0.02Commercial services
USD 7,775 Cardtronics Plc^ 197 0.03Diversified financial services
USD 13,908 BrightSphere Investment Group Plc 198 0.03Healthcare products
USD 8,950 LivaNova Plc 986 0.14USD 16,096 Steris Plc 1,842 0.27
Machinery - diversified USD 10,779 Gates Industrial Corp Plc 168 0.02
Oil & gas USD 85,591 Ensco Plc 636 0.09USD 45,501 Noble Corp Plc^ 266 0.04USD 21,600 Rowan Cos Plc 313 0.05
Telecommunications USD 33,667 Arris International Plc 850 0.12
Total United Kingdom 5,600 0.81

iSHARES VII PLC
Schedule of Investments (continued) iSHARES MSCI USA SMALL CAP UCITS ETF (continued) As at 31 July 2018
i S H A R E S V I I P L C A N N U A L R E P O R T [ 2 2 3 ]
Ccy Holding Investment Fair value
$'000
% of netassetvalue
Equities (31 July 2017: 99.61%) (cont)
United States (31 July 2017: 95.31%) Advertising
USD 6,183 Clear Channel Outdoor Holdings Inc 28 0.00
USD 1,623 Forrester Research Inc 75 0.01Aerospace & defence
USD 6,063 AAR Corp 287 0.04USD 11,482 Aerojet Rocketdyne Holdings
Inc^ 387 0.05USD 4,468 Aerovironment Inc^ 329 0.05USD 3,833 Astronics Corp^ 157 0.02USD 4,873 Cubic Corp 332 0.05USD 7,759 Curtiss-Wright Corp 1,032 0.15USD 4,975 Esterline Technologies Corp 424 0.06USD 7,907 HEICO Corp^ 604 0.09USD 14,189 HEICO Corp Class 'A' 919 0.13USD 4,852 Kaman Corp 321 0.05USD 9,288 KLX Inc 679 0.10USD 15,583 Kratos Defense & Security
Solutions Inc 201 0.03USD 5,833 Moog Inc 438 0.06USD 6,543 MSA Safety Inc^ 660 0.09USD 988 National Presto Industries Inc 123 0.02USD 6,927 Teledyne Technologies Inc 1,520 0.22USD 9,388 Triumph Group Inc^ 196 0.03
Agriculture USD 5,840 Andersons Inc 206 0.03USD 3,603 Phibro Animal Health Corp 173 0.03USD 5,601 Tejon Ranch Co^ 131 0.02USD 4,465 Universal Corp^ 308 0.04USD 19,112 Vector Group Ltd^ 353 0.05
Airlines USD 711 Allegiant Travel Co^ 88 0.01USD 2,001 Hawaiian Holdings Inc 80 0.01USD 2,203 SkyWest Inc 132 0.02USD 2,777 Spirit Airlines Inc^ 121 0.02
Apparel retailers USD 9,027 Carter's Inc 946 0.14USD 6,192 Columbia Sportswear Co^ 538 0.08USD 13,479 Crocs Inc 244 0.03USD 5,291 Deckers Outdoor Corp 597 0.09USD 3,004 Oxford Industries Inc^ 277 0.04USD 24,743 Skechers U.S.A. Inc^ 686 0.10USD 10,413 Steven Madden Ltd^ 563 0.08USD 2,365 Unifi Inc^ 71 0.01USD 17,598 Wolverine World Wide Inc 623 0.09
Auto manufacturers USD 3,043 Blue Bird Corp 69 0.01USD 7,974 Navistar International Corp 343 0.05USD 5,288 REV Group Inc^ 91 0.01USD 10,781 Wabash National Corp^ 213 0.03
Ccy Holding InvestmentFair value
$'000
% of netassetvalue
United States (31 July 2017: 95.31%) (cont) Auto parts & equipment
USD 23,106 Allison Transmission Holdings Inc 1,086 0.16
USD 5,274 Altra Industrial Motion Corp 231 0.03USD 18,319 American Axle & Manufacturing
Holdings Inc 306 0.05USD 9,400 Cooper Tire & Rubber Co^ 268 0.04USD 3,195 Cooper-Standard Holdings Inc 431 0.06USD 28,324 Dana Inc 605 0.09USD 5,739 Dorman Products Inc 429 0.06USD 4,355 Douglas Dynamics Inc 214 0.03USD 6,720 Gentherm Inc^ 304 0.04USD 16,096 Meritor Inc 332 0.05USD 9,611 Modine Manufacturing Co 168 0.02USD 2,595 Motorcar Parts of America Inc 56 0.01USD 6,219 Spartan Motors Inc 92 0.01USD 3,237 Standard Motor Products Inc^ 158 0.02USD 4,414 Superior Industries International
Inc 81 0.01USD 10,711 Tenneco Inc 494 0.07USD 9,446 Titan International Inc 100 0.02USD 4,073 Tower International Inc 131 0.02USD 15,948 Veoneer Inc 834 0.12USD 5,732 Visteon Corp 671 0.10
Banks USD 3,245 1st Source Corp 184 0.03USD 2,580 Access National Corp^ 72 0.01USD 1,999 Allegiance Bancshares Inc^ 90 0.01USD 7,371 Ameris Bancorp 343 0.05USD 3,745 Arrow Financial Corp 145 0.02USD 31,728 Associated Banc-Corp 857 0.12USD 3,931 Atlantic Capital Bancshares Inc 70 0.01USD 3,439 BancFirst Corp 214 0.03USD 11,264 Bancorp Inc 109 0.02USD 14,987 BancorpSouth Bank 493 0.07USD 8,096 Bank of Hawaii Corp^ 652 0.09USD 1,164 Bank of Marin Bancorp 103 0.02USD 23,704 Bank OZK^ 969 0.14USD 20,763 BankUnited Inc 807 0.12USD 5,044 Banner Corp 318 0.05USD 2,792 Bar Harbor Bankshares 81 0.01USD 4,395 Blue Hills Bancorp Inc 96 0.01USD 3,959 BOK Financial Corp^ 385 0.06USD 16,100 Boston Private Financial
Holdings Inc 232 0.03USD 2,279 Bridge Bancorp Inc 82 0.01USD 3,321 Bryn Mawr Bank Corp 162 0.02USD 3,033 Byline Bancorp Inc 68 0.01USD 11,701 Cadence BanCorp 319 0.05USD 3,567 Camden National Corp 164 0.02USD 3,708 Carolina Financial Corp^ 155 0.02USD 2,348 Cass Information Systems Inc 158 0.02

iSHARES VII PLC
Schedule of Investments (continued) iSHARES MSCI USA SMALL CAP UCITS ETF (continued) As at 31 July 2018
[ 2 2 4 ] i S H A R E S V I I P L C A N N U A L R E P O R T
Ccy Holding Investment Fair value
$'000
% of netassetvalue
Equities (31 July 2017: 99.61%) (cont) United States (31 July 2017: 95.31%) (cont) Banks (cont)
USD 13,661 Cathay General Bancorp^ 568 0.08USD 12,038 CenterState Bank Corp^ 334 0.05USD 5,187 Central Pacific Financial Corp 143 0.02USD 13,460 Chemical Financial Corp 765 0.11USD 2,525 City Holding Co 203 0.03USD 6,810 CoBiz Financial Inc 149 0.02USD 13,293 Columbia Banking System Inc 544 0.08USD 17,617 Commerce Bancshares Inc 1,177 0.17USD 9,141 Community Bank System Inc^ 578 0.08USD 3,011 Community Trust Bancorp Inc 147 0.02USD 4,855 ConnectOne Bancorp Inc^ 120 0.02USD 11,468 Cullen/Frost Bankers Inc 1,267 0.18USD 5,341 Customers Bancorp Inc 136 0.02USD 20,093 CVB Financial Corp^ 481 0.07USD 6,067 Eagle Bancorp Inc 328 0.05USD 4,237 Enterprise Financial Services
Corp 238 0.03USD 3,127 FB Financial Corp^ 133 0.02USD 8,143 FCB Financial Holdings Inc 415 0.06USD 3,508 Fidelity Southern Corp 84 0.01USD 3,903 Financial Institutions Inc 124 0.02USD 6,245 First Bancorp 259 0.04USD 7,805 First Busey Corp 248 0.04USD 1,302 First Citizens BancShares Inc 530 0.08USD 18,033 First Commonwealth Financial
Corp 304 0.04USD 2,570 First Community Bancshares Inc 84 0.01USD 18,112 First Financial Bancorp 550 0.08USD 9,384 First Financial Bankshares Inc 531 0.08USD 2,777 First Financial Corp 143 0.02USD 5,080 First Foundation Inc^ 80 0.01USD 12,703 First Hawaiian Inc 359 0.05USD 57,645 First Horizon National Corp 1,031 0.15USD 4,810 First Interstate BancSystem Inc 208 0.03USD 9,751 First Merchants Corp 460 0.07USD 1,630 First Mid-Illinois Bancshares Inc 66 0.01USD 19,068 First Midwest Bancorp Inc 509 0.07USD 3,905 First of Long Island Corp 85 0.01USD 59,762 FNB Corp^ 767 0.11USD 2,249 Franklin Financial Network Inc^ 88 0.01USD 32,676 Fulton Financial Corp 567 0.08USD 5,327 German American Bancorp Inc^ 195 0.03USD 14,392 Glacier Bancorp Inc^ 615 0.09USD 1,717 Great Southern Bancorp Inc 101 0.02USD 11,830 Great Western Bancorp Inc 495 0.07USD 4,056 Green Bancorp Inc 99 0.01USD 4,373 Guaranty Bancorp 131 0.02USD 15,594 Hancock Whitney Corp 784 0.11USD 5,133 Hanmi Financial Corp 129 0.02
Ccy Holding InvestmentFair value
$'000
% of netassetvalue
United States (31 July 2017: 95.31%) (cont) Banks (cont)
USD 2,544 HarborOne Bancorp Inc^ 47 0.01USD 4,967 Heartland Financial USA Inc^ 292 0.04USD 6,548 Heritage Commerce Corp 100 0.01USD 6,965 Heritage Financial Corp 244 0.04USD 28,438 Home BancShares Inc^ 659 0.10USD 22,670 Hope Bancorp Inc 380 0.06USD 5,583 Horizon Bancorp Inc 117 0.02USD 10,408 Iberiabank Corp 865 0.13USD 3,894 Independent Bank Corp 95 0.01USD 5,364 Independent Bank Corp
(Rockland listed) 474 0.07USD 2,866 Independent Bank Group Inc^ 192 0.03USD 10,135 International Bancshares Corp 451 0.07USD 19,282 Kearny Financial Corp 277 0.04USD 8,714 Lakeland Bancorp Inc 169 0.02USD 3,908 Lakeland Financial Corp 189 0.03USD 7,493 LegacyTexas Financial Group
Inc^ 328 0.05USD 5,697 Live Oak Bancshares Inc^ 162 0.02USD 5,464 Luther Burbank Corp 59 0.01USD 16,464 MB Financial Inc 798 0.12USD 4,292 Mercantile Bank Corp 152 0.02USD 2,547 Merchants Bancorp^ 62 0.01USD 2,114 Midland States Bancorp Inc 71 0.01USD 4,407 National Bank Holdings Corp 174 0.03USD 2,096 National Commerce Corp 91 0.01USD 8,566 NBT Bancorp Inc 345 0.05USD 1,648 Nicolet Bankshares Inc 91 0.01USD 2,347 Old Line Bancshares Inc 80 0.01USD 26,424 Old National Bancorp^ 514 0.07USD 5,359 Opus Bank^ 152 0.02USD 23,552 PacWest Bancorp 1,183 0.17USD 2,522 Park National Corp 276 0.04USD 2,701 Peapack Gladstone Financial
Corp 89 0.01USD 2,599 People's Utah Bancorp 94 0.01USD 3,200 Peoples Bancorp Inc 116 0.02USD 13,958 Pinnacle Financial Partners Inc^ 872 0.13USD 3,569 Preferred Bank 222 0.03USD 12,039 Prosperity Bancshares Inc^ 845 0.12USD 2,188 QCR Holdings Inc 95 0.01USD 8,766 Renasant Corp 392 0.06USD 1,803 Republic Bancorp Inc 86 0.01USD 8,265 Republic First Bancorp Inc 65 0.01USD 6,150 S&T Bancorp Inc 275 0.04USD 6,223 Sandy Spring Bancorp Inc 243 0.04USD 7,894 Seacoast Banking Corp of
Florida 231 0.03USD 8,060 ServisFirst Bancshares Inc 341 0.05USD 16,241 Simmons First National Corp 484 0.07USD 6,710 South State Corp^ 562 0.08

iSHARES VII PLC
Schedule of Investments (continued) iSHARES MSCI USA SMALL CAP UCITS ETF (continued) As at 31 July 2018
i S H A R E S V I I P L C A N N U A L R E P O R T [ 2 2 5 ]
Ccy Holding Investment Fair value
$'000
% of netassetvalue
Equities (31 July 2017: 99.61%) (cont) United States (31 July 2017: 95.31%) (cont) Banks (cont)
USD 4,704 Southside Bancshares Inc 161 0.02USD 7,331 State Bank Financial Corp 231 0.03USD 4,896 Sterling Bancorp Inc 63 0.01USD 3,767 Stock Yards Bancorp Inc 144 0.02USD 22,001 Synovus Financial Corp 1,087 0.16USD 31,204 TCF Financial Corp 784 0.11USD 9,585 Texas Capital Bancshares Inc 870 0.13USD 2,699 Tompkins Financial Corp 231 0.03USD 11,408 Towne Bank 368 0.05USD 3,998 TriCo Bancshares 155 0.02USD 3,899 TriState Capital Holdings Inc 115 0.02USD 4,767 Triumph Bancorp Inc^ 183 0.03USD 17,413 TrustCo Bank Corp NY 158 0.02USD 12,523 Trustmark Corp 441 0.06USD 8,419 UMB Financial Corp 605 0.09USD 40,392 Umpqua Holdings Corp 860 0.12USD 10,908 Union Bankshares Corp^ 442 0.06USD 20,025 United Bankshares Inc^ 740 0.11USD 13,615 United Community Banks Inc 409 0.06USD 4,655 Univest Corp of Pennsylvania 127 0.02USD 57,747 Valley National Bancorp^ 673 0.10USD 3,165 Veritex Holdings Inc^ 98 0.01USD 5,291 Walker & Dunlop Inc 314 0.05USD 3,735 Washington Trust Bancorp Inc 218 0.03USD 17,801 Webster Financial Corp 1,149 0.17USD 10,169 WesBanco Inc^ 497 0.07USD 4,842 Westamerica Bancorporation^ 291 0.04USD 18,943 Western Alliance Bancorp 1,074 0.16USD 10,219 Wintrust Financial Corp 897 0.13
Beverages USD 1,683 Boston Beer Co Inc 463 0.07USD 793 Coca-Cola Bottling Co
Consolidated 115 0.02USD 1,444 Farmer Brothers Co^ 41 0.01USD 2,738 MGP Ingredients Inc 225 0.03USD 2,245 National Beverage Corp 237 0.03
Biotechnology USD 5,490 Abeona Therapeutics Inc 79 0.01USD 17,363 ACADIA Pharmaceuticals Inc 262 0.04USD 6,802 Acceleron Pharma Inc^ 296 0.04USD 15,160 Achillion Pharmaceuticals Inc^ 39 0.01USD 7,296 Acorda Therapeutics Inc 182 0.03USD 7,807 Aduro Biotech Inc 46 0.01USD 13,850 Agenus Inc 25 0.00USD 11,134 Alder Biopharmaceuticals Inc^ 211 0.03USD 9,141 AMAG Pharmaceuticals Inc 202 0.03USD 34,286 Amicus Therapeutics Inc^ 499 0.07USD 3,061 AnaptysBio Inc^ 240 0.03USD 1,158 ANI Pharmaceuticals Inc 77 0.01
Ccy Holding InvestmentFair value
$'000
% of netassetvalue
United States (31 July 2017: 95.31%) (cont) Biotechnology (cont)
USD 8,934 Arena Pharmaceuticals Inc^ 345 0.05USD 14,533 Arrowhead Pharmaceuticals Inc 212 0.03USD 3,095 Assembly Biosciences Inc 137 0.02USD 5,960 Atara Biotherapeutics Inc 224 0.03USD 5,467 Audentes Therapeutics Inc 206 0.03USD 3,349 Bellicum Pharmaceuticals Inc 21 0.00USD 3,822 Bio-Rad Laboratories Inc 1,172 0.17USD 20,027 BioCryst Pharmaceuticals Inc^ 118 0.02USD 13,352 BioTime Inc 35 0.01USD 9,953 Bluebird Bio Inc^ 1,542 0.22USD 7,128 Blueprint Medicines Corp^ 424 0.06USD 5,665 Cambrex Corp^ 354 0.05USD 4,604 Cara Therapeutics Inc 83 0.01USD 5,273 ChemoCentryx Inc 61 0.01USD 10,342 Cymabay Therapeutics Inc 116 0.02USD 9,393 CytomX Therapeutics Inc^ 247 0.04USD 2,661 Deciphera Pharmaceuticals Inc 92 0.01USD 3,514 Denali Therapeutics Inc 44 0.01USD 5,785 Dicerna Pharmaceuticals Inc 73 0.01USD 10,799 Dynavax Technologies Corp^ 146 0.02USD 7,030 Editas Medicine Inc 209 0.03USD 7,814 Emergent BioSolutions Inc 425 0.06USD 10,267 Endocyte Inc 157 0.02USD 11,775 Epizyme Inc^ 152 0.02USD 3,983 Esperion Therapeutics Inc 179 0.03USD 23,178 Exact Sciences Corp^ 1,355 0.19USD 54,699 Exelixis Inc^ 1,132 0.16USD 7,861 Fate Therapeutics Inc 70 0.01USD 14,925 FibroGen Inc^ 942 0.14USD 5,773 Five Prime Therapeutics Inc 86 0.01USD 29,697 Geron Corp 107 0.01USD 6,330 GlycoMimetics Inc 93 0.01USD 25,437 Halozyme Therapeutics Inc^ 460 0.07USD 30,979 ImmunoGen Inc^ 288 0.04USD 22,468 Immunomedics Inc 538 0.08USD 15,225 Innoviva Inc^ 215 0.03USD 16,488 Inovio Pharmaceuticals Inc 66 0.01USD 12,840 Insmed Inc^ 319 0.05USD 4,784 Intellia Therapeutics Inc 127 0.02USD 3,846 Intercept Pharmaceuticals Inc 350 0.05USD 12,512 Intrexon Corp 183 0.03USD 23,331 Ionis Pharmaceuticals Inc^ 1,019 0.15USD 13,856 Iovance Biotherapeutics Inc^ 197 0.03USD 6,627 Karyopharm Therapeutics Inc 118 0.02USD 6,587 Lexicon Pharmaceuticals Inc 79 0.01USD 3,892 Ligand Pharmaceuticals Inc 850 0.12USD 4,082 Loxo Oncology Inc^ 684 0.10USD 6,771 MacroGenics Inc^ 140 0.02USD 12,723 Medicines Co^ 505 0.07USD 12,840 Myriad Genetics Inc^ 562 0.08

iSHARES VII PLC
Schedule of Investments (continued) iSHARES MSCI USA SMALL CAP UCITS ETF (continued) As at 31 July 2018
[ 2 2 6 ] i S H A R E S V I I P L C A N N U A L R E P O R T
Ccy Holding Investment Fair value
$'000
% of netassetvalue
Equities (31 July 2017: 99.61%) (cont) United States (31 July 2017: 95.31%) (cont) Biotechnology (cont)
USD 10,771 NeoGenomics Inc 151 0.02USD 42,597 Novavax Inc 54 0.01USD 7,795 Omeros Corp 164 0.02USD 15,507 Pacific Biosciences of California
Inc 59 0.01USD 18,255 PDL BioPharma Inc^ 46 0.01USD 7,087 PTC Therapeutics Inc 270 0.04USD 5,741 Puma Biotechnology Inc 276 0.04USD 5,882 Radius Health Inc 141 0.02USD 5,133 Regenxbio Inc 361 0.05USD 7,219 Retrophin Inc^ 200 0.03USD 25,161 Rigel Pharmaceuticals Inc^ 71 0.01USD 8,409 Sage Therapeutics Inc^ 1,214 0.17USD 20,006 Sangamo Therapeutics Inc 273 0.04USD 4,887 Seres Therapeutics Inc 37 0.01USD 6,594 Spark Therapeutics Inc^ 506 0.07USD 18,603 Spectrum Pharmaceuticals Inc^ 396 0.06USD 9,112 Ultragenyx Pharmaceutical Inc^ 721 0.10USD 19,081 Ziopharm Oncology Inc 49 0.01
Building materials and fixtures USD 7,306 AAON Inc^ 276 0.04USD 2,695 American Woodmark Corp 225 0.03USD 4,769 Apogee Enterprises Inc^ 242 0.04USD 3,764 Armstrong Flooring Inc 49 0.01USD 8,834 Armstrong World Industries Inc 600 0.09USD 7,694 Boise Cascade Co 333 0.05USD 20,337 Builders FirstSource Inc 365 0.05USD 7,142 Continental Building Products Inc 228 0.03USD 17,782 Cree Inc^ 838 0.12USD 9,120 Eagle Materials Inc 906 0.13USD 6,327 Gibraltar Industries Inc 275 0.04USD 5,776 Griffon Corp 103 0.01USD 14,438 JELD-WEN Holding Inc 396 0.06USD 28,119 Louisiana-Pacific Corp 757 0.11USD 9,174 NCI Building Systems Inc 146 0.02USD 4,221 Patrick Industries Inc 258 0.04USD 9,159 PGT Innovations Inc 220 0.03USD 7,160 Quanex Building Products Corp 127 0.02USD 7,642 Simpson Manufacturing Co Inc^ 558 0.08USD 20,921 Summit Materials Inc^ 525 0.08USD 11,036 Trex Co Inc^ 858 0.12USD 11,935 Universal Forest Products Inc 440 0.06USD 2,766 US Concrete Inc 140 0.02USD 16,688 USG Corp 721 0.10
Chemicals USD 5,458 A Schulman Inc 237 0.03USD 5,224 AdvanSix Inc 211 0.03USD 4,155 American Vanguard Corp 90 0.01
Ccy Holding InvestmentFair value
$'000
% of netassetvalue
United States (31 July 2017: 95.31%) (cont) Chemicals (cont)
USD 11,739 Ashland Global Holdings Inc 964 0.14USD 5,628 Balchem Corp^ 564 0.08USD 11,248 Cabot Corp 743 0.11USD 8,826 Codexis Inc^ 127 0.02USD 3,729 CSW Industrials Inc 202 0.03USD 14,983 Ferro Corp^ 337 0.05USD 12,906 GCP Applied Technologies Inc 376 0.05USD 1,702 Hawkins Inc 63 0.01USD 9,876 HB Fuller Co^ 560 0.08USD 40,440 Huntsman Corp 1,356 0.20USD 7,963 Ingevity Corp 794 0.12USD 3,412 Innophos Holdings Inc 154 0.02USD 4,367 Innospec Inc^ 354 0.05USD 18,238 Intrepid Potash Inc 78 0.01USD 2,753 KMG Chemicals Inc 198 0.03USD 3,744 Koppers Holdings Inc 141 0.02USD 5,702 Kraton Corp 274 0.04USD 4,096 Kronos Worldwide Inc 93 0.01USD 4,201 Landec Corp 59 0.01USD 6,344 Minerals Technologies Inc 480 0.07USD 1,704 NewMarket Corp^ 698 0.10USD 30,650 Olin Corp 904 0.13USD 11,880 OMNOVA Solutions Inc 111 0.02USD 46,346 Platform Specialty Products
Corp^ 573 0.08USD 15,662 PolyOne Corp 702 0.10USD 7,548 PQ Group Holdings Inc 136 0.02USD 2,482 Quaker Chemical Corp^ 441 0.06USD 12,002 Rayonier Advanced Materials
Inc^ 217 0.03USD 25,769 RPM International Inc^ 1,659 0.24USD 8,089 Sensient Technologies Corp^ 561 0.08USD 3,572 Stepan Co 313 0.05USD 20,272 Univar Inc^ 557 0.08USD 38,386 Valvoline Inc^ 867 0.13USD 19,958 Versum Materials Inc 769 0.11USD 12,522 WR Grace & Co 925 0.13
Coal USD 4,065 Arch Coal Inc^ 344 0.05USD 4,163 Consol Energy Inc 173 0.03USD 16,861 Peabody Energy Corp 717 0.10USD 10,882 SunCoke Energy Inc 124 0.02USD 6,457 Warrior Met Coal Inc 167 0.02
Commercial services USD 13,150 Aaron's Inc 570 0.08USD 12,597 ABM Industries Inc^ 393 0.06USD 10,557 Adtalem Global Education Inc^ 576 0.08USD 3,075 American Public Education Inc 136 0.02USD 9,368 AMN Healthcare Services Inc^ 567 0.08USD 9,732 ASGN Inc 879 0.13

iSHARES VII PLC
Schedule of Investments (continued) iSHARES MSCI USA SMALL CAP UCITS ETF (continued) As at 31 July 2018
i S H A R E S V I I P L C A N N U A L R E P O R T [ 2 2 7 ]
Ccy Holding Investment Fair value
$'000
% of netassetvalue
Equities (31 July 2017: 99.61%) (cont) United States (31 July 2017: 95.31%) (cont) Commercial services (cont)
USD 13,588 Avis Budget Group Inc 474 0.07USD 1,359 Barrett Business Services Inc 125 0.02USD 26,994 Booz Allen Hamilton Holding
Corp 1,276 0.18USD 10,155 Bright Horizons Family Solutions
Inc 1,086 0.16USD 9,622 Brink's Co 768 0.11USD 2,867 CAI International Inc 66 0.01USD 2,347 Capella Education Co 244 0.04USD 12,185 Career Education Corp 224 0.03USD 2,642 Carriage Services Inc 66 0.01USD 8,191 CBIZ Inc 180 0.03USD 15,245 CoreLogic Inc^ 742 0.11USD 1,789 CorVel Corp 103 0.02USD 6,729 Cross Country Healthcare Inc 79 0.01USD 8,746 Deluxe Corp 515 0.07USD 3,362 Emerald Expositions Events Inc 65 0.01USD 4,568 Ennis Inc 99 0.01USD 9,808 Euronet Worldwide Inc 902 0.13USD 12,462 Everi Holdings Inc 92 0.01USD 7,459 FTI Consulting Inc 589 0.09USD 7,214 GATX Corp^ 594 0.09USD 831 Graham Holdings Co 465 0.07USD 9,191 Grand Canyon Education Inc 1,071 0.15USD 10,206 Great Lakes Dredge & Dock
Corp^ 55 0.01USD 9,091 Green Dot Corp 721 0.10USD 5,127 Greenbrier Cos Inc^ 290 0.04USD 6,011 Hackett Group Inc 108 0.02USD 13,379 Healthcare Services Group Inc^ 539 0.08USD 9,768 HealthEquity Inc^ 737 0.11USD 3,717 Heidrick & Struggles International
Inc 152 0.02USD 4,880 Herc Holdings Inc^ 277 0.04USD 9,104 Hertz Global Holdings Inc 139 0.02USD 17,837 HMS Holdings Corp 427 0.06USD 3,495 Huron Consulting Group Inc^ 153 0.02USD 3,594 ICF International Inc 265 0.04USD 6,557 Insperity Inc 624 0.09USD 8,606 K12 Inc 141 0.02USD 6,141 Kelly Services Inc 149 0.02USD 4,376 Kforce Inc 165 0.02USD 10,473 Korn/Ferry International 691 0.10USD 10,362 Laureate Education Inc 153 0.02USD 6,267 LSC Communications Inc 94 0.01USD 14,991 Macquarie Infrastructure Corp^ 681 0.10USD 6,938 MarketAxess Holdings Inc^ 1,344 0.19USD 5,983 Matthews International Corp 314 0.05USD 3,728 McGrath RentCorp 221 0.03
Ccy Holding InvestmentFair value
$'000
% of netassetvalue
United States (31 July 2017: 95.31%) (cont) Commercial services (cont)
USD 2,102 Medifast Inc 361 0.05USD 5,216 MoneyGram International Inc 34 0.01USD 6,014 Monro Inc^ 406 0.06USD 3,676 Morningstar Inc 485 0.07USD 1,895 National Research Corp 72 0.01USD 9,980 Navigant Consulting Inc 217 0.03USD 11,605 Net 1 UEPS Technologies Inc 108 0.02USD 5,239 Nutrisystem Inc^ 210 0.03USD 6,323 Paylocity Holding Corp 367 0.05USD 7,543 Quad/Graphics Inc 155 0.02USD 28,619 Quanta Services Inc 975 0.14USD 9,271 Rent-A-Center Inc 138 0.02USD 6,020 Resources Connection Inc 96 0.01USD 11,768 RR Donnelley & Sons Co 69 0.01USD 34,294 Service Corp International 1,349 0.20USD 26,228 ServiceMaster Global Holdings
Inc 1,495 0.22USD 24,696 ServiceSource International Inc 86 0.01USD 7,395 Sotheby's 393 0.06USD 4,075 SP Plus Corp 159 0.02USD 1,898 Strayer Education Inc^ 224 0.03USD 4,451 Team Inc 97 0.01USD 8,984 TriNet Group Inc 484 0.07USD 7,975 TrueBlue Inc 216 0.03USD 3,919 Viad Corp 225 0.03USD 7,047 Weight Watchers International
Inc^ 631 0.09USD 7,989 WEX Inc 1,516 0.22
Computers USD 18,876 3D Systems Corp 230 0.03USD 4,679 CACI International Inc 820 0.12USD 5,156 Carbonite Inc^ 177 0.03USD 34,557 Conduent Inc 621 0.09USD 17,935 Convergys Corp^ 441 0.06USD 8,742 Cray Inc^ 218 0.03USD 13,955 Diebold Nixdorf Inc^ 158 0.02USD 8,880 Electronics For Imaging Inc^ 303 0.04USD 5,026 Engility Holdings Inc 174 0.03USD 9,430 EPAM Systems Inc 1,228 0.18USD 5,897 ExlService Holdings Inc 352 0.05USD 2,219 ForeScout Technologies Inc 75 0.01USD 6,322 Insight Enterprises Inc 318 0.05USD 10,409 KeyW Holding Corp 92 0.01USD 11,984 Lumentum Holdings Inc 626 0.09USD 12,293 Maximus Inc 797 0.12USD 9,653 Mercury Systems Inc^ 403 0.06USD 3,059 MTS Systems Corp^ 167 0.02USD 22,505 NCR Corp^ 628 0.09USD 15,802 NetScout Systems Inc^ 424 0.06USD 21,185 Nutanix Inc 1,036 0.15

iSHARES VII PLC
Schedule of Investments (continued) iSHARES MSCI USA SMALL CAP UCITS ETF (continued) As at 31 July 2018
[ 2 2 8 ] i S H A R E S V I I P L C A N N U A L R E P O R T
Ccy Holding Investment Fair value
$'000
% of netassetvalue
Equities (31 July 2017: 99.61%) (cont) United States (31 July 2017: 95.31%) (cont) Computers (cont)
USD 4,106 OneSpan Inc 67 0.01USD 26,522 Perspecta Inc 576 0.08USD 2,839 PlayAGS Inc 81 0.01USD 5,961 Presidio Inc^ 83 0.01USD 15,479 Pure Storage Inc 335 0.05USD 6,603 Qualys Inc^ 575 0.08USD 8,101 Science Applications
International Corp 684 0.10USD 7,822 Super Micro Computer Inc 173 0.03USD 7,808 Sykes Enterprises Inc 232 0.03USD 7,419 Syntel Inc 301 0.04USD 22,364 Teradata Corp^ 856 0.12USD 3,089 TTEC Holdings Inc 99 0.02USD 10,680 Unisys Corp^ 137 0.02USD 5,225 Varonis Systems Inc 312 0.05USD 20,410 VeriFone Systems Inc 467 0.07USD 5,137 Virtusa Corp 271 0.04USD 6,142 Vocera Communications Inc 185 0.03
Consumer durables & apparels USD 548 Hamilton Beach BRD^ 14 0.00
Cosmetics & personal care USD 83,774 Avon Products Inc 133 0.02USD 9,856 Edgewell Personal Care Co 531 0.08USD 4,387 Elf Beauty Inc 63 0.01USD 2,582 Inter Parfums Inc 156 0.02
Distribution & wholesale USD 5,226 Anixter International Inc 381 0.05USD 8,191 Core-Mark Holding Co Inc^ 198 0.03USD 6,470 Essendant Inc 108 0.02USD 7,132 Fossil Group Inc 187 0.03USD 7,967 G-III Apparel Group Ltd 364 0.05USD 5,658 H&E Equipment Services Inc 208 0.03USD 25,717 KAR Auction Services Inc 1,529 0.22USD 5,144 Nexeo Solutions Inc 47 0.01USD 7,387 Pool Corp 1,132 0.16USD 4,630 ScanSource Inc 191 0.03USD 7,196 SiteOne Landscape Supply Inc^ 641 0.09USD 2,856 Systemax Inc 128 0.02USD 3,370 Titan Machinery Inc 51 0.01USD 1,654 Veritiv Corp 63 0.01USD 5,607 Watsco Inc^ 967 0.14USD 8,551 Wesco International Inc 522 0.07
Diversified financial services USD 17,700 Air Lease Corp^ 778 0.11USD 5,001 Arlington Asset Investment Corp 53 0.01USD 8,715 Artisan Partners Asset
Management Inc 300 0.04USD 41,367 BGC Partners Inc 444 0.06
Ccy Holding InvestmentFair value
$'000
% of netassetvalue
United States (31 July 2017: 95.31%) (cont) Diversified financial services (cont)
USD 8,204 Blucora Inc 285 0.04USD 4,317 Cohen & Steers Inc^ 181 0.03USD 4,000 Cowen Inc^ 63 0.01USD 2,152 Credit Acceptance Corp 826 0.12USD 481 Diamond Hill Investment Group
Inc 92 0.01USD 6,561 Ellie Mae Inc^ 651 0.09USD 4,119 Encore Capital Group Inc 149 0.02USD 4,850 Enova International Inc 150 0.02USD 8,091 Evercore Inc^ 914 0.13USD 1,691 Federal Agricultural Mortgage
Corp^ 159 0.02USD 15,484 Federated Investors Inc 375 0.05USD 1,300 FRP Holdings Inc 85 0.01USD 10,834 Granite Point Mortgage Trust Inc 206 0.03USD 6,192 Greenhill & Co Inc 202 0.03USD 9,366 Hannon Armstrong Sustainable
Infrastructure Capital Inc 184 0.03USD 14,262 Hilltop Holdings Inc^ 297 0.04USD 4,371 HomeStreet Inc^ 129 0.02USD 6,547 Houlihan Lokey Inc 322 0.05USD 13,141 Interactive Brokers Group Inc 787 0.11USD 3,947 INTL. FCStone Inc^ 212 0.03USD 4,711 Investment Technology Group
Inc 104 0.02USD 25,035 Kennedy-Wilson Holdings Inc 523 0.08USD 12,148 Ladder Capital Corp 194 0.03USD 17,838 Ladenburg Thalmann Financial
Services Inc 60 0.01USD 16,443 Legg Mason Inc 561 0.08USD 53,594 LendingClub Corp^ 221 0.03USD 1,380 LendingTree Inc 330 0.05USD 16,714 LPL Financial Holdings Inc 1,108 0.16USD 7,689 Moelis & Co 489 0.07USD 50,845 Navient Corp^ 672 0.10USD 4,093 Nelnet Inc^ 241 0.03USD 4,297 Newsstar Financial* 2 0.00USD 17,350 Ocwen Financial Corp^ 69 0.01USD 10,799 On Deck Capital Inc 74 0.01USD 16,878 OneMain Holdings Inc 561 0.08USD 5,912 PHH Corp^ 64 0.01USD 2,506 Piper Jaffray Cos 194 0.03USD 3,011 PJT Partners Inc 181 0.03USD 8,413 PRA Group Inc^ 330 0.05USD 79,501 SLM Corp 898 0.13USD 13,356 Stifel Financial Corp^ 736 0.11USD 6,629 TPG RE Finance Trust Inc 137 0.02USD 6,396 Virtu Financial Inc 129 0.02USD 1,329 Virtus Investment Partners Inc 177 0.03USD 18,460 Waddell & Reed Financial Inc 382 0.06

iSHARES VII PLC
Schedule of Investments (continued) iSHARES MSCI USA SMALL CAP UCITS ETF (continued) As at 31 July 2018
i S H A R E S V I I P L C A N N U A L R E P O R T [ 2 2 9 ]
Ccy Holding Investment Fair value
$'000
% of netassetvalue
Equities (31 July 2017: 99.61%) (cont) United States (31 July 2017: 95.31%) (cont) Diversified financial services (cont)
USD 7,149 WageWorks Inc^ 377 0.05USD 1,284 Westwood Holdings Group Inc 75 0.01USD 18,460 WisdomTree Investments Inc^ 161 0.02USD 1,212 World Acceptance Corp^ 121 0.02
Electrical components & equipment USD 8,036 Belden Inc^ 520 0.07USD 4,332 Encore Wire Corp 211 0.03USD 11,048 Energizer Holdings Inc 703 0.10USD 8,073 EnerSys^ 663 0.10USD 12,569 Generac Holdings Inc 676 0.10USD 10,080 Hubbell Inc 1,242 0.18USD 3,336 Insteel Industries Inc 137 0.02USD 4,580 Littelfuse Inc 993 0.14USD 2,854 Powell Industries Inc 105 0.01USD 8,104 SPX Corp 301 0.04USD 14,783 SunPower Corp 107 0.02USD 7,851 Universal Display Corp 756 0.11USD 3,104 Vicor Corp 179 0.03
Electricity USD 9,703 Allete Inc^ 752 0.11USD 12,257 Avista Corp 620 0.09USD 9,533 Black Hills Corp^ 572 0.08USD 7,168 El Paso Electric Co 446 0.06USD 20,437 Hawaiian Electric Industries Inc 719 0.10USD 9,124 Idacorp Inc 860 0.12USD 34,268 MDU Resources Group Inc 994 0.14USD 6,104 MGE Energy Inc 391 0.06USD 8,888 NorthWestern Corp^ 527 0.08USD 55,833 NRG Energy Inc 1,768 0.25USD 5,993 NRG Yield Inc 111 0.02USD 12,275 NRG Yield Inc Class 'C' 228 0.03USD 7,111 Ormat Technologies Inc 386 0.06USD 6,257 Otter Tail Corp 303 0.04USD 15,291 PNM Resources Inc 602 0.09USD 16,228 Portland General Electric Co 736 0.11USD 5,033 Spark Energy Inc 43 0.01USD 2,833 Unitil Corp 144 0.02
Electronics USD 5,704 Alarm.com Holdings Inc^ 245 0.04USD 2,969 Applied Optoelectronics Inc 114 0.02USD 8,941 AVX Corp 186 0.03USD 5,264 Badger Meter Inc 274 0.04USD 8,647 Benchmark Electronics Inc 209 0.03USD 8,422 Brady Corp 322 0.05USD 4,625 Coherent Inc^ 731 0.11USD 4,396 Control4 Corp 112 0.02USD 5,563 Electro Scientific Industries Inc 100 0.01USD 2,941 FARO Technologies Inc 191 0.03
Ccy Holding InvestmentFair value
$'000
% of netassetvalue
United States (31 July 2017: 95.31%) (cont) Electronics (cont)
USD 42,333 Fitbit Inc 251 0.04USD 52,007 Gentex Corp 1,207 0.17USD 20,862 GoPro Inc 122 0.02USD 10,969 II-VI Inc^ 430 0.06USD 6,394 Itron Inc^ 391 0.06USD 30,249 Jabil Inc 852 0.12USD 9,419 Kemet Corp 245 0.03USD 4,900 Kimball Electronics Inc 100 0.01USD 15,654 Knowles Corp^ 272 0.04USD 549 Mesa Laboratories Inc 111 0.02USD 7,002 Methode Electronics Inc 275 0.04USD 23,148 National Instruments Corp 1,014 0.15USD 843 NVE Corp 90 0.01USD 3,424 OSI Systems Inc 273 0.04USD 3,491 Park Electrochemical Corp 77 0.01USD 20,856 PerkinElmer Inc^ 1,651 0.24USD 6,254 Plexus Corp 372 0.05USD 13,694 Sanmina Corp 398 0.06USD 6,525 Stoneridge Inc 222 0.03USD 5,331 Synnex Corp 514 0.07USD 6,869 Tech Data Corp 573 0.08USD 17,204 TTM Technologies Inc^ 299 0.04USD 24,751 Vishay Intertechnology Inc^ 619 0.09USD 4,863 Watts Water Technologies Inc 416 0.06USD 10,417 Woodward Inc 867 0.12
Energy - alternate sources USD 14,256 First Solar Inc^ 746 0.11USD 3,994 FutureFuel Corp 55 0.01USD 5,702 Green Plains Inc^ 95 0.01USD 10,870 NextEra Energy Partners LP 512 0.07USD 14,994 Pattern Energy Group Inc 278 0.04USD 44,896 Plug Power Inc^ 90 0.01USD 6,513 Renewable Energy Group Inc 111 0.02USD 1,035 REX American Resources Corp 80 0.01USD 6,525 SolarEdge Technologies Inc 347 0.05USD 14,273 Sunrun Inc 202 0.03USD 12,487 TerraForm Power Inc^ 128 0.02USD 2,856 TPI Composites Inc^ 88 0.01
Engineering & construction USD 30,450 Aecom^ 1,022 0.15USD 5,779 Aegion Corp 143 0.02USD 2,691 Argan Inc 103 0.01USD 7,222 Comfort Systems USA Inc 401 0.06USD 5,584 Dycom Industries Inc^ 498 0.07USD 10,887 Emcor Group Inc 838 0.12USD 9,597 Exponent Inc 469 0.07USD 9,394 Granite Construction Inc 507 0.07USD 25,161 KBR Inc 503 0.07USD 11,974 MasTec Inc^ 557 0.08

iSHARES VII PLC
Schedule of Investments (continued) iSHARES MSCI USA SMALL CAP UCITS ETF (continued) As at 31 July 2018
[ 2 3 0 ] i S H A R E S V I I P L C A N N U A L R E P O R T
Ccy Holding Investment Fair value
$'000
% of netassetvalue
Equities (31 July 2017: 99.61%) (cont) United States (31 July 2017: 95.31%) (cont) Engineering & construction (cont)
USD 4,411 Mistras Group Inc 93 0.01USD 3,378 MYR Group Inc 125 0.02USD 1,489 NV5 Global Inc^ 112 0.02USD 7,637 Primoris Services Corp^ 206 0.03USD 6,275 TopBuild Corp 466 0.07USD 7,396 Tutor Perini Corp^ 137 0.02USD 1,429 VSE Corp 62 0.01USD 6,308 Willscot Corp 105 0.02
Entertainment USD 8,993 AMC Entertainment Holdings Inc 147 0.02USD 2,215 Churchill Downs Inc 633 0.09USD 19,644 Cinemark Holdings Inc^ 706 0.10USD 10,718 Dolby Laboratories Inc 691 0.10USD 8,937 Eldorado Resorts Inc 383 0.05USD 3,988 Golden Entertainment Inc^ 124 0.02USD 4,180 International Speedway Corp 181 0.03USD 3,502 Madison Square Garden Co 1,093 0.16USD 4,361 Marriott Vacations Worldwide
Corp^ 519 0.07USD 18,378 National CineMedia Inc 152 0.02USD 10,849 Penn National Gaming Inc^ 348 0.05USD 10,006 Pinnacle Entertainment Inc 333 0.05USD 12,211 Red Rock Resorts Inc^ 431 0.06USD 9,591 Scientific Games Corp^ 461 0.07USD 11,793 SeaWorld Entertainment Inc 251 0.04USD 13,181 Six Flags Entertainment Corp 856 0.12USD 2,174 Speedway Motorsports Inc 38 0.01
Environmental control USD 13,577 Advanced Disposal Services Inc 334 0.05USD 6,430 Casella Waste Systems Inc 177 0.03USD 9,601 Clean Harbors Inc 547 0.08USD 20,758 Covanta Holding Corp 374 0.05USD 8,760 Energy Recovery Inc 71 0.01USD 10,575 Evoqua Water Technologies
Corp^ 226 0.03USD 3,507 Heritage-Crystal Clean Inc^ 84 0.01USD 10,679 Tetra Tech Inc 649 0.09USD 4,549 US Ecology Inc^ 308 0.05
Food USD 12,476 B&G Foods Inc^ 392 0.06USD 6,018 Cal-Maine Foods Inc 271 0.04USD 2,887 Calavo Growers Inc 267 0.04USD 3,166 Chefs' Warehouse Inc 85 0.01USD 29,554 Darling Ingredients Inc 594 0.09USD 16,102 Dean Foods Co^ 158 0.02USD 34,226 Flowers Foods Inc^ 698 0.10USD 18,387 Hain Celestial Group Inc^ 523 0.08USD 17,654 Hostess Brands Inc 247 0.04
Ccy Holding InvestmentFair value
$'000
% of netassetvalue
United States (31 July 2017: 95.31%) (cont) Food (cont)
USD 1,703 Ingles Markets Inc 51 0.01USD 2,625 J&J Snack Foods Corp 381 0.05USD 1,240 John B Sanfilippo & Son Inc 95 0.01USD 28,182 Lamb Weston Holdings Inc 1,980 0.29USD 3,728 Lancaster Colony Corp^ 541 0.08USD 19,242 Performance Food Group Co 690 0.10USD 22,668 Pinnacle Foods Inc 1,506 0.22USD 12,724 Post Holdings Inc^ 1,101 0.16USD 3,669 Sanderson Farms Inc^ 370 0.05USD 63 Seaboard Corp 229 0.03USD 9,852 Simply Good Foods Co 164 0.02USD 11,138 Smart & Final Stores Inc^ 66 0.01USD 6,663 SpartanNash Co 160 0.02USD 24,520 Sprouts Farmers Market Inc^ 527 0.08USD 6,503 Supervalu Inc^ 210 0.03USD 3,391 Tootsie Roll Industries Inc 101 0.01USD 10,521 TreeHouse Foods Inc^ 500 0.07USD 10,230 United Natural Foods Inc^ 329 0.05USD 39,604 US Foods Holding Corp 1,339 0.19USD 1,293 Village Super Market Inc 35 0.01USD 1,883 Weis Markets Inc 96 0.01
Forest products & paper USD 3,098 Clearwater Paper Corp^ 70 0.01USD 11,057 Domtar Corp 533 0.08USD 7,791 Mercer International Inc 140 0.02USD 3,114 Neenah Inc 273 0.04USD 6,820 PH Glatfelter Co 112 0.02USD 16,669 Resolute Forest Products Inc 169 0.02USD 7,029 Schweitzer-Mauduit International
Inc 292 0.04USD 6,375 Verso Corp 133 0.02
Gas USD 2,893 Chesapeake Utilities Corp 243 0.04USD 14,072 National Fuel Gas Co^ 756 0.11USD 16,365 New Jersey Resources Corp^ 757 0.11USD 5,422 Northwest Natural Gas Co 353 0.05USD 10,193 ONE Gas Inc 785 0.11USD 14,429 South Jersey Industries Inc^ 489 0.07USD 8,748 Southwest Gas Holdings Inc 684 0.10USD 8,963 Spire Inc^ 642 0.09USD 16,548 Vectren Corp 1,183 0.17
Hand & machine tools USD 7,378 Franklin Electric Co Inc 365 0.05USD 15,180 Kennametal Inc^ 591 0.09USD 11,376 Lincoln Electric Holdings Inc^ 1,069 0.15USD 12,858 Milacron Holdings Corp^ 268 0.04USD 7,866 Regal Beloit Corp 676 0.10
Healthcare products USD 4,227 Abaxis Inc 351 0.05USD 5,463 Accelerate Diagnostics Inc 120 0.02

iSHARES VII PLC
Schedule of Investments (continued) iSHARES MSCI USA SMALL CAP UCITS ETF (continued) As at 31 July 2018
i S H A R E S V I I P L C A N N U A L R E P O R T [ 2 3 1 ]
Ccy Holding Investment Fair value
$'000
% of netassetvalue
Equities (31 July 2017: 99.61%) (cont) United States (31 July 2017: 95.31%) (cont) Healthcare products (cont)
USD 16,820 Accuray Inc^ 65 0.01USD 5,826 AngioDynamics Inc 123 0.02USD 5,213 AtriCure Inc^ 149 0.02USD 228 Atrion Corp 157 0.02USD 8,540 Avanos Medical Inc 471 0.07USD 5,269 AxoGen Inc^ 237 0.03USD 7,014 Bio-Techne Corp^ 1,127 0.16USD 5,953 BioTelemetry Inc 313 0.05USD 18,822 Bruker Corp 610 0.09USD 7,407 Cantel Medical Corp 687 0.10USD 6,051 Cardiovascular Systems Inc 229 0.03USD 32,617 Cerus Corp 242 0.03USD 4,297 Conmed Corp 318 0.05USD 5,112 CryoLife Inc 152 0.02USD 2,476 Cutera Inc 99 0.01USD 9,593 Endologix Inc^ 49 0.01USD 13,092 GenMark Diagnostics Inc^ 87 0.01USD 3,989 Genomic Health Inc 214 0.03USD 5,784 Glaukos Corp 241 0.03USD 14,087 Globus Medical Inc 725 0.10USD 10,273 Haemonetics Corp^ 1,003 0.14USD 12,247 Hill-Rom Holdings Inc 1,154 0.17USD 2,939 ICU Medical Inc 843 0.12USD 3,265 Inogen Inc 651 0.09USD 11,378 Insulet Corp^ 946 0.14USD 5,325 Integer Holdings Corp 380 0.06USD 12,228 Integra LifeSciences Holdings
Corp 762 0.11USD 4,673 Intersect ENT Inc 151 0.02USD 6,120 Invacare Corp^ 109 0.02USD 3,200 iRhythm Technologies Inc 242 0.03USD 8,528 K2M Group Holdings Inc 174 0.03USD 8,672 Lantheus Holdings Inc 125 0.02USD 2,704 LeMaitre Vascular Inc 97 0.01USD 7,842 Luminex Corp 266 0.04USD 9,250 Masimo Corp 920 0.13USD 8,365 Meridian Bioscience Inc 132 0.02USD 9,521 Merit Medical Systems Inc 517 0.07USD 18,480 MiMedx Group Inc^ 79 0.01USD 6,664 Natus Medical Inc 243 0.04USD 5,026 Nevro Corp^ 283 0.04USD 9,431 NuVasive Inc^ 547 0.08USD 13,121 NxStage Medical Inc 368 0.05USD 57,942 OPKO Health Inc^ 326 0.05USD 10,466 OraSure Technologies Inc 176 0.03USD 15,999 Patterson Cos Inc 392 0.06USD 5,474 Penumbra Inc^ 779 0.11USD 5,903 Quidel Corp 401 0.06
Ccy Holding InvestmentFair value
$'000
% of netassetvalue
United States (31 July 2017: 95.31%) (cont) Healthcare products (cont)
USD 6,689 Repligen Corp^ 323 0.05USD 9,665 Rockwell Medical Inc 39 0.01USD 5,183 STAAR Surgical Co 160 0.02USD 2,243 Surmodics Inc 132 0.02USD 2,614 Tactile Systems Technology Inc^ 126 0.02USD 6,420 Varex Imaging Corp 245 0.04USD 7,814 ViewRay Inc 93 0.01USD 13,929 West Pharmaceutical Services
Inc^ 1,527 0.22Healthcare services
USD 16,346 Acadia Healthcare Co Inc^ 645 0.09USD 1,515 Addus HomeCare Corp 100 0.02USD 5,758 Amedisys Inc 539 0.08USD 2,174 American Renal Associates
Holdings Inc^ 35 0.01USD 33,669 Brookdale Senior Living Inc^ 323 0.05USD 4,248 Capital Senior Living Corp 43 0.01USD 25,379 Catalent Inc 1,058 0.15USD 8,571 Charles River Laboratories
International Inc 1,065 0.15USD 3,077 Chemed Corp 972 0.14USD 4,986 Civitas Solutions Inc 82 0.01USD 18,770 Community Health Systems Inc 63 0.01USD 18,283 Encompass Health Corp 1,383 0.20USD 9,665 Ensign Group Inc 349 0.05USD 22,454 Envision Healthcare Corp 994 0.14USD 5,338 Invitae Corp 47 0.01USD 5,095 LHC Group Inc 439 0.06USD 7,942 LifePoint Health Inc 515 0.07USD 4,689 Magellan Health Inc 341 0.05USD 17,345 Mednax Inc 742 0.11USD 1,435 Medpace Holdings Inc 88 0.01USD 10,525 Molina Healthcare Inc 1,096 0.16USD 9,542 Natera Inc 219 0.03USD 1,752 National HealthCare Corp 126 0.02USD 2,170 Providence Service Corp 152 0.02USD 15,497 R1 RCM Inc 124 0.02USD 7,047 RadNet Inc 94 0.01USD 18,741 Select Medical Holdings Corp 390 0.06USD 6,118 Surgery Partners Inc 92 0.01USD 10,292 Syneos Health Inc 507 0.07USD 10,005 Teladoc Inc 599 0.09USD 20,016 Tenet Healthcare Corp 753 0.11USD 8,415 Tivity Health Inc^ 284 0.04USD 2,637 US Physical Therapy Inc 276 0.04USD 7,159 WellCare Health Plans Inc 1,915 0.28
Holding companies - diversified operations USD 7,657 Spectrum Brands Holdings Inc 669 0.10
Home builders USD 6,330 Beazer Homes USA Inc 81 0.01USD 1,622 Cavco Industries Inc 345 0.05

iSHARES VII PLC
Schedule of Investments (continued) iSHARES MSCI USA SMALL CAP UCITS ETF (continued) As at 31 July 2018
[ 2 3 2 ] i S H A R E S V I I P L C A N N U A L R E P O R T
Ccy Holding Investment Fair value
$'000
% of netassetvalue
Equities (31 July 2017: 99.61%) (cont) United States (31 July 2017: 95.31%) (cont) Home builders (cont)
USD 5,282 Century Communities Inc^ 161 0.02USD 6,911 Green Brick Partners Inc 67 0.01USD 23,315 Hovnanian Enterprises Inc^ 37 0.01USD 3,883 Installed Building Products Inc^ 212 0.03USD 15,416 KB Home 366 0.05USD 3,709 LGI Homes Inc^ 192 0.03USD 5,918 M/I Homes Inc^ 153 0.02USD 7,533 MDC Holdings Inc 219 0.03USD 7,299 Meritage Homes Corp 315 0.05USD 20,602 Taylor Morrison Home Corp 402 0.06USD 9,741 Thor Industries Inc 924 0.13USD 28,399 TRI Pointe Group Inc 402 0.06USD 4,555 William Lyon Homes 99 0.02USD 5,661 Winnebago Industries Inc 226 0.03
Home furnishings USD 5,690 Daktronics Inc 49 0.01USD 3,916 Ethan Allen Interiors Inc 88 0.01USD 627 Hamilton Beach Brands Holding
Co^ 16 0.00USD 1,977 Hooker Furniture Corp 89 0.01USD 4,924 iRobot Corp 390 0.06USD 8,700 Sleep Number Corp 248 0.04USD 8,273 Tempur Sealy International Inc 404 0.06USD 2,504 Universal Electronics Inc 88 0.01
Hotels USD 11,703 BBX Capital Corp^ 102 0.01USD 15,721 Boyd Gaming Corp^ 587 0.09USD 110,181 Caesars Entertainment Corp 1,245 0.18USD 6,988 Choice Hotels International Inc 542 0.08USD 34,820 Extended Stay America Inc 741 0.11USD 17,975 Hilton Grand Vacations Inc 622 0.09USD 21,339 ILG Inc 733 0.11USD 4,935 Marcus Corp 190 0.03USD 1,989 Monarch Casino & Resort Inc 95 0.01USD 18,476 Wyndham Destinations Inc 852 0.12USD 18,437 Wyndham Hotels & Resorts Inc 1,070 0.15
Household goods & home construction USD 17,642 ACCO Brands Corp 226 0.03USD 1,720 Central Garden & Pet Co^ 74 0.01USD 6,659 Central Garden & Pet Co (non-
voting) 267 0.04USD 2,842 WD-40 Co^ 455 0.07
Household products USD 8,269 Scotts Miracle-Gro Co^ 657 0.09USD 20,234 Toro Co^ 1,218 0.18USD 9,320 Tupperware Brands Corp 342 0.05
Insurance USD 3,979 Ambac Financial Group Inc 81 0.01USD 15,835 American Equity Investment Life
Holding Co 566 0.08
Ccy Holding InvestmentFair value
$'000
% of netassetvalue
United States (31 July 2017: 95.31%) (cont) Insurance (cont)
USD 1,713 American National Insurance Co 221 0.03USD 2,996 Amerisafe Inc^ 188 0.03USD 23,934 AmTrust Financial Services Inc 347 0.05USD 3,749 Baldwin & Lyons Inc 88 0.01USD 43,696 Brown & Brown Inc 1,279 0.18USD 6,588 Citizens Inc 52 0.01USD 33,936 CNO Financial Group Inc 691 0.10USD 6,943 Crawford & Co 59 0.01USD 2,979 Donegal Group Inc 43 0.01USD 1,530 EMC Insurance Group Inc^ 41 0.01USD 5,008 Employers Holdings Inc 233 0.03USD 4,629 Erie Indemnity Co 575 0.08USD 1,690 FBL Financial Group Inc 138 0.02USD 19,091 First American Financial Corp 1,069 0.15USD 91,126 Genworth Financial Inc 419 0.06USD 7,998 Hanover Insurance Group Inc 1,003 0.15USD 1,483 HCI Group Inc 63 0.01USD 4,162 Heritage Insurance Holdings Inc 71 0.01USD 7,404 Horace Mann Educators Corp^ 324 0.05USD 1,778 Independence Holding Co 62 0.01USD 8,968 Kemper Corp^ 716 0.10USD 3,418 Kinsale Capital Group Inc 202 0.03USD 16,193 MBIA Inc 166 0.02USD 4,873 Mercury General Corp 251 0.04USD 67,049 MGIC Investment Corp 837 0.12USD 13,897 National General Holdings Corp 383 0.06USD 464 National Western Life Group Inc 150 0.02USD 3,901 Navigators Group Inc 235 0.03USD 11,208 NMI Holdings Inc 234 0.03USD 47,102 Old Republic International Corp 1,004 0.15USD 7,201 Primerica Inc 827 0.12USD 9,835 ProAssurance Corp 406 0.06USD 40,626 Radian Group Inc 778 0.11USD 6,630 RLI Corp 496 0.07USD 3,098 Safety Insurance Group Inc 284 0.04USD 10,641 Selective Insurance Group Inc 636 0.09USD 3,163 State Auto Financial Corp^ 102 0.02USD 3,891 Stewart Information Services
Corp 177 0.03USD 4,943 Trupanion Inc 206 0.03USD 2,712 United Fire Group Inc 163 0.02USD 3,574 United Insurance Holdings Corp^ 74 0.01USD 5,877 Universal Insurance Holdings Inc 261 0.04
Internet USD 4,383 1-800-Flowers.com Inc 63 0.01USD 17,136 8x8 Inc 342 0.05USD 7,065 ANGI Homeservices Inc 111 0.02USD 6,184 Boingo Wireless Inc 143 0.02USD 12,275 Cars.com Inc^ 348 0.05USD 7,827 ChannelAdvisor Corp 109 0.02

iSHARES VII PLC
Schedule of Investments (continued) iSHARES MSCI USA SMALL CAP UCITS ETF (continued) As at 31 July 2018
i S H A R E S V I I P L C A N N U A L R E P O R T [ 2 3 3 ]
Ccy Holding Investment Fair value
$'000
% of netassetvalue
Equities (31 July 2017: 99.61%) (cont) United States (31 July 2017: 95.31%) (cont) Internet (cont)
USD 16,205 Chegg Inc^ 449 0.06USD 8,876 Cogent Communications
Holdings Inc^ 461 0.07USD 9,480 Endurance International Group
Holdings Inc 78 0.01USD 2,988 ePlus Inc^ 295 0.04USD 20,346 Etsy Inc 831 0.12USD 32,557 FireEye Inc^ 506 0.07USD 90,503 Groupon Inc 423 0.06USD 16,146 GrubHub Inc 1,968 0.28USD 3,914 HealthStream Inc 110 0.02USD 5,179 Imperva Inc 239 0.03USD 2,832 Lands' End Inc 69 0.01USD 10,060 Liberty Expedia Holdings Inc^ 485 0.07USD 14,335 Limelight Networks Inc 64 0.01USD 10,381 New Media Investment Group Inc 187 0.03USD 11,194 NIC Inc 183 0.03USD 2,912 Overstock.com Inc 104 0.01USD 54,279 Pandora Media Inc^ 366 0.05USD 5,441 Perficient Inc 143 0.02USD 9,380 Proofpoint Inc 1,070 0.15USD 7,125 Q2 Holdings Inc^ 421 0.06USD 6,889 QuinStreet Inc 91 0.01USD 12,923 Quotient Technology Inc 191 0.03USD 12,342 RingCentral Inc 910 0.13USD 5,954 Shutterfly Inc 490 0.07USD 3,013 Shutterstock Inc 139 0.02USD 3,053 Stamps.com Inc 797 0.12USD 3,834 TechTarget Inc 109 0.02USD 5,700 Trade Desk Inc 481 0.07USD 12,096 TrueCar Inc 134 0.02USD 1,408 Tucows Inc 83 0.01USD 12,196 Twilio Inc 706 0.10USD 10,719 Wayfair Inc^ 1,166 0.17USD 8,457 Web.com Group Inc 213 0.03USD 3,678 XO Group Inc 104 0.02USD 15,225 Yelp Inc 561 0.08USD 19,018 Zendesk Inc 1,036 0.15
Investment services USD 3,202 B. Riley Financial Inc^ 70 0.01
Iron & steel USD 59,459 AK Steel Holding Corp 275 0.04USD 22,973 Allegheny Technologies Inc^ 639 0.09USD 9,236 Carpenter Technology Corp^ 506 0.07USD 56,632 Cleveland-Cliffs Inc 611 0.09USD 20,956 Commercial Metals Co^ 468 0.07USD 13,425 Reliance Steel & Aluminum Co 1,211 0.17USD 5,598 Schnitzer Steel Industries Inc 184 0.03USD 32,488 United States Steel Corp^ 1,184 0.17
Ccy Holding InvestmentFair value
$'000
% of netassetvalue
United States (31 July 2017: 95.31%) (cont) Leisure time
USD 6,786 Acushnet Holdings Corp 164 0.02USD 16,763 Brunswick Corp 1,078 0.15USD 16,571 Callaway Golf Co 319 0.05USD 5,612 Camping World Holdings Inc^ 124 0.02USD 6,682 Fox Factory Holding Corp^ 332 0.05USD 4,534 LCI Industries 417 0.06USD 11,388 Liberty TripAdvisor Holdings Inc 190 0.03USD 4,923 Lindblad Expeditions Holdings
Inc 65 0.01USD 4,526 Nautilus Inc 64 0.01USD 16,460 Planet Fitness Inc 782 0.11USD 7,237 St Joe Co 128 0.02USD 10,469 Vista Outdoor Inc 170 0.02
Machinery - diversified USD 1,909 Alamo Group Inc 177 0.03USD 5,188 Albany International Corp 343 0.05USD 7,278 Applied Industrial Technologies
Inc 543 0.08USD 7,783 Briggs & Stratton Corp 138 0.02USD 8,008 Cactus Inc 262 0.04USD 5,246 Chart Industries Inc 410 0.06USD 3,177 Columbus McKinnon Corp 131 0.02USD 4,310 DXP Enterprises Inc 178 0.03USD 20,444 Gardner Denver Holdings Inc^ 585 0.08USD 2,749 Gorman-Rupp Co 104 0.01USD 30,896 Graco Inc 1,425 0.21USD 2,059 Kadant Inc 199 0.03USD 1,706 Lindsay Corp 161 0.02USD 5,649 Manitowoc Co Inc 150 0.02USD 33,324 Mueller Water Products Inc 412 0.06USD 4,731 NN Inc 102 0.01USD 9,591 Nordson Corp 1,286 0.19USD 7,644 SPX FLOW Inc 363 0.05USD 3,715 Tennant Co 302 0.04USD 25,409 Welbilt Inc^ 579 0.08
Machinery, construction & mining USD 3,250 Astec Industries Inc 160 0.02USD 18,494 BWX Technologies Inc 1,216 0.18USD 1,450 Hyster-Yale Materials Handling
Inc 95 0.01USD 14,371 Oshkosh Corp^ 1,081 0.16USD 14,839 Terex Corp 655 0.09
Media USD 9,166 AMC Networks Inc 553 0.08USD 858 Cable One Inc^ 621 0.09USD 23,290 Entercom Communications Corp 176 0.02USD 8,819 Entravision Communications
Corp 43 0.01USD 7,887 EW Scripps Co 103 0.01USD 7,196 FactSet Research Systems Inc^ 1,449 0.21USD 17,537 Gannett Co Inc^ 185 0.03

iSHARES VII PLC
Schedule of Investments (continued) iSHARES MSCI USA SMALL CAP UCITS ETF (continued) As at 31 July 2018
[ 2 3 4 ] i S H A R E S V I I P L C A N N U A L R E P O R T
Ccy Holding Investment Fair value
$'000
% of netassetvalue
Equities (31 July 2017: 99.61%) (cont) United States (31 July 2017: 95.31%) (cont) Media (cont)
USD 12,851 Gray Television Inc 199 0.03USD 4,069 Hemisphere Media Group Inc^ 49 0.01USD 19,675 Houghton Mifflin Harcourt Co 125 0.02USD 8,344 John Wiley & Sons Inc 527 0.08USD 3,478 Liberty Media Corp-Liberty
Braves 89 0.01USD 5,619 Liberty Media Corp-Liberty
Braves Class 'C' 145 0.02USD 7,399 Meredith Corp^ 393 0.06USD 11,713 MSG Networks Inc^ 276 0.04USD 23,194 New York Times Co^ 575 0.08USD 9,110 Nexstar Media Group Inc^ 678 0.10USD 5,343 Scholastic Corp 223 0.03USD 13,591 Sinclair Broadcast Group Inc^ 351 0.05USD 36,839 Tegna Inc 406 0.06USD 15,341 Tribune Media Co 519 0.07USD 3,013 Tronc Inc 47 0.01USD 5,340 WideOpenWest Inc 58 0.01USD 7,071 World Wrestling Entertainment
Inc 560 0.08Metal fabricate/ hardware
USD 7,608 Advanced Drainage Systems Inc 213 0.03USD 8,704 Atkore International Group Inc 206 0.03USD 2,681 Circor International Inc^ 119 0.02USD 3,888 Global Brass & Copper Holdings
Inc 128 0.02USD 10,326 Mueller Industries Inc 342 0.05USD 820 Omega Flex Inc^ 76 0.01USD 1,438 Park-Ohio Holdings Corp 54 0.01USD 4,636 RBC Bearings Inc 674 0.10USD 21,043 Rexnord Corp^ 636 0.09USD 5,669 Sun Hydraulics Corp^ 295 0.04USD 12,890 Timken Co 635 0.09USD 6,482 TimkenSteel Corp^ 90 0.01USD 8,752 TriMas Corp 259 0.04USD 4,005 Valmont Industries Inc 559 0.08USD 8,983 Worthington Industries Inc^ 420 0.06
Mining USD 35,002 Alcoa Corp 1,514 0.22USD 11,293 Century Aluminum Co 145 0.02USD 33,311 Coeur Mining Inc 233 0.03USD 5,951 Compass Minerals International
Inc^ 404 0.06USD 5,139 Covia Holdings Corp 93 0.01USD 70,289 Hecla Mining Co^ 225 0.03USD 3,030 Kaiser Aluminum Corp 338 0.05USD 3,974 Materion Corp 249 0.04USD 46,475 McEwen Mining Inc 104 0.01USD 11,923 Royal Gold Inc^ 1,009 0.15USD 633 United States Lime & Minerals
Inc 49 0.01USD 15,318 US Silica Holdings Inc^ 413 0.06
Ccy Holding InvestmentFair value
$'000
% of netassetvalue
United States (31 July 2017: 95.31%) (cont) Miscellaneous manufacturers
USD 12,644 Actuant Corp^ 361 0.05USD 10,219 American Outdoor Brands Corp 97 0.01USD 1,409 American Railcar Industries Inc 64 0.01USD 11,546 AptarGroup Inc^ 1,183 0.17USD 10,290 Axon Enterprise Inc^ 699 0.10USD 4,561 AZZ Inc 247 0.04USD 9,442 Barnes Group Inc 641 0.09USD 11,846 Carlisle Cos Inc 1,455 0.21USD 1,613 Chase Corp 199 0.03USD 16,878 Colfax Corp 545 0.08USD 9,034 Crane Co 818 0.12USD 24,659 Donaldson Co Inc 1,176 0.17USD 3,731 EnPro Industries Inc 285 0.04USD 4,528 Esco Technologies Inc 282 0.04USD 12,401 Federal Signal Corp 295 0.04USD 2,342 GP Strategies Corp 44 0.01USD 15,261 Harsco Corp 387 0.06USD 1,929 Haynes International Inc^ 82 0.01USD 16,311 Hexcel Corp 1,126 0.16USD 12,357 Hillenbrand Inc 620 0.09USD 16,597 ITT Inc 941 0.14USD 5,663 John Bean Technologies Corp^ 626 0.09USD 3,168 Lydall Inc 147 0.02USD 4,081 Myers Industries Inc 88 0.01USD 4,877 Proto Labs Inc 608 0.09USD 6,861 Raven Industries Inc 266 0.04USD 3,262 Rogers Corp 380 0.05USD 2,457 Standex International Corp 255 0.04USD 3,642 Sturm Ruger & Co Inc 197 0.03USD 3,769 Tredegar Corp 98 0.01USD 24,840 Trinity Industries Inc 947 0.14
Office & business equipment USD 10,564 Herman Miller Inc 400 0.06USD 7,824 HNI Corp^ 338 0.05USD 10,447 Interface Inc 234 0.03USD 6,922 Kimball International Inc 112 0.02USD 8,011 Knoll Inc 181 0.03USD 33,993 Pitney Bowes Inc 297 0.04USD 15,741 Steelcase Inc 216 0.03USD 10,075 Zebra Technologies Corp 1,390 0.20
Oil & gas USD 14,200 Alta Mesa Resources Inc 86 0.01USD 3,238 Bonanza Creek Energy Inc 120 0.02USD 6,506 California Resources Corp 237 0.03USD 41,644 Callon Petroleum Co^ 448 0.06USD 14,729 Carrizo Oil & Gas Inc^ 415 0.06USD 29,046 Centennial Resource
Development Inc^ 522 0.08USD 175,304 Chesapeake Energy Corp 827 0.12USD 33,293 CNX Resources Corp 542 0.08USD 4,708 CVR Energy Inc 185 0.03

iSHARES VII PLC
Schedule of Investments (continued) iSHARES MSCI USA SMALL CAP UCITS ETF (continued) As at 31 July 2018
i S H A R E S V I I P L C A N N U A L R E P O R T [ 2 3 5 ]
Ccy Holding Investment Fair value
$'000
% of netassetvalue
Equities (31 July 2017: 99.61%) (cont) United States (31 July 2017: 95.31%) (cont) Oil & gas (cont)
USD 15,125 Delek US Holdings Inc^ 806 0.12USD 69,130 Denbury Resources Inc^ 312 0.05USD 11,180 Diamond Offshore Drilling Inc 215 0.03USD 8,512 Eclipse Resources Corp 14 0.00USD 16,225 Energen Corp 1,204 0.17USD 5,525 Exterran Corp 153 0.02USD 18,656 Extraction Oil & Gas Inc 282 0.04USD 68,905 Gran Tierra Energy Inc^ 229 0.03USD 30,462 Gulfport Energy Corp 351 0.05USD 26,135 Halcon Resources Corp 102 0.01USD 21,329 HighPoint Resources Corp 139 0.02USD 9,919 Jagged Peak Energy Inc 142 0.02USD 27,345 Laredo Petroleum Inc^ 255 0.04USD 20,115 Matador Resources Co^ 674 0.10USD 2,653 Midstates Petroleum Co Inc 35 0.01USD 30,379 Murphy Oil Corp^ 1,010 0.15USD 5,991 Murphy USA Inc^ 475 0.07USD 49,816 Oasis Petroleum Inc^ 609 0.09USD 7,562 Par Pacific Holdings Inc^ 132 0.02USD 40,266 Patterson-UTI Energy Inc 693 0.10USD 19,559 PBF Energy Inc 913 0.13USD 12,255 PDC Energy Inc 772 0.11USD 1,813 Penn Virginia Corp 153 0.02USD 42,348 QEP Resources Inc 440 0.06USD 46,313 Range Resources Corp 715 0.10USD 3,289 Resolute Energy Corp 101 0.01USD 10,048 Ring Energy Inc^ 124 0.02USD 5,868 SandRidge Energy Inc 96 0.01USD 19,395 SM Energy Co^ 534 0.08USD 115,653 Southwestern Energy Co^ 594 0.09USD 43,130 SRC Energy Inc^ 488 0.07USD 3,726 Talos Energy Inc 138 0.02USD 9,550 Unit Corp^ 238 0.03USD 18,128 W&T Offshore Inc 126 0.02USD 16,370 Whiting Petroleum Corp^ 813 0.12USD 4,258 WildHorse Resource
Development Corp 93 0.01USD 72,552 WPX Energy Inc 1,362 0.20
Oil & gas services USD 14,606 Apergy Corp 599 0.09USD 24,358 Archrock Inc 332 0.05USD 3,953 Basic Energy Services Inc 45 0.01USD 11,752 C&J Energy Services Inc 273 0.04USD 7,381 Dril-Quip Inc 380 0.05USD 15,910 Forum Energy Technologies Inc^ 209 0.03USD 4,068 FTS International Inc 49 0.01USD 24,639 Helix Energy Solutions Group Inc 247 0.03USD 9,725 Keane Group Inc 137 0.02USD 2,656 Mammoth Energy Services Inc 99 0.01
Ccy Holding InvestmentFair value
$'000
% of netassetvalue
United States (31 July 2017: 95.31%) (cont) Oil & gas services (cont)
USD 4,167 Matrix Service Co 83 0.01USD 17,859 MRC Global Inc 404 0.06USD 1,889 Natural Gas Services Group Inc^ 42 0.01USD 3,289 NCS Multistage Holdings Inc 52 0.01USD 18,909 Newpark Resources Inc^ 209 0.03USD 1,922 Nine Energy Service Inc 56 0.01USD 18,942 NOW Inc^ 283 0.04USD 19,512 Oceaneering International Inc 534 0.08USD 11,598 Oil States International Inc^ 405 0.06USD 13,904 ProPetro Holding Corp^ 229 0.03USD 11,742 RPC Inc 174 0.02USD 3,499 Seacor Holdings Inc 185 0.03USD 9,724 Select Energy Services Inc^ 149 0.02USD 27,753 Superior Energy Services Inc 273 0.04USD 20,016 Tetra Technologies Inc 86 0.01USD 5,168 Thermon Group Holdings Inc 129 0.02
Packaging & containers USD 16,806 Bemis Co Inc 772 0.11USD 24,353 Berry Global Group Inc 1,190 0.17USD 56,706 Graphic Packaging Holding Co 824 0.12USD 4,666 Greif Inc 254 0.04USD 800 Greif Inc Class 'B' 46 0.01USD 15,742 KapStone Paper and Packaging
Corp 547 0.08USD 2,666 Multi-Color Corp^ 177 0.02USD 28,183 Owens-Illinois Inc^ 526 0.07USD 14,712 Silgan Holdings Inc 405 0.06USD 18,201 Sonoco Products Co 1,016 0.15
Pharmaceuticals USD 4,812 Achaogen Inc 34 0.00USD 4,850 Aclaris Therapeutics Inc 83 0.01USD 3,990 Adamas Pharmaceuticals Inc 95 0.01USD 6,751 Aerie Pharmaceuticals Inc 456 0.07USD 9,242 Agios Pharmaceuticals Inc^ 799 0.11USD 6,852 Aimmune Therapeutics Inc^ 198 0.03USD 3,099 Akcea Therapeutics Inc 98 0.01USD 7,030 Akebia Therapeutics Inc 72 0.01USD 17,003 Akorn Inc 315 0.04USD 13,180 Amneal Pharmaceuticals Inc 253 0.04USD 7,893 Amphastar Pharmaceuticals Inc 138 0.02USD 2,868 Anika Therapeutics Inc 115 0.02USD 3,335 Apellis Pharmaceuticals Inc 61 0.01USD 34,122 Array BioPharma Inc^ 525 0.08USD 5,914 Athenex Inc 114 0.02USD 8,283 Clovis Oncology Inc^ 366 0.05USD 8,911 Coherus Biosciences Inc^ 170 0.02USD 3,087 Collegium Pharmaceutical Inc 60 0.01USD 5,460 Concert Pharmaceuticals Inc 87 0.01USD 17,640 Contra Dyax Corp* 40 0.01USD 19,104 Corcept Therapeutics Inc^ 251 0.04

iSHARES VII PLC
Schedule of Investments (continued) iSHARES MSCI USA SMALL CAP UCITS ETF (continued) As at 31 July 2018
[ 2 3 6 ] i S H A R E S V I I P L C A N N U A L R E P O R T
Ccy Holding Investment Fair value
$'000
% of netassetvalue
Equities (31 July 2017: 99.61%) (cont) United States (31 July 2017: 95.31%) (cont) Pharmaceuticals (cont)
USD 6,276 Cytokinetics Inc^ 46 0.01USD 10,416 Depomed Inc 92 0.01USD 6,805 Dermira Inc^ 66 0.01USD 16,021 DexCom Inc^ 1,524 0.22USD 9,175 Diplomat Pharmacy Inc^ 191 0.03USD 2,705 Dova Pharmaceuticals Inc 58 0.01USD 2,250 Eagle Pharmaceuticals Inc^ 178 0.03USD 2,863 Enanta Pharmaceuticals Inc^ 279 0.04USD 5,379 Flexion Therapeutics Inc 128 0.02USD 4,629 G1 Therapeutics Inc 238 0.03USD 8,133 Global Blood Therapeutics Inc^ 340 0.05USD 10,628 Heron Therapeutics Inc^ 398 0.06USD 1,151 Heska Corp 115 0.02USD 9,100 Insys Therapeutics Inc 61 0.01USD 8,151 Intra-Cellular Therapies Inc^ 164 0.02USD 25,135 Ironwood Pharmaceuticals Inc^ 485 0.07USD 3,431 Jounce Therapeutics Inc 24 0.00USD 21,544 Keryx Biopharmaceuticals Inc 91 0.01USD 4,039 Kura Oncology Inc^ 82 0.01USD 3,649 La Jolla Pharmaceutical Co 121 0.02USD 4,158 Lannett Co Inc 53 0.01USD 1,501 Madrigal Pharmaceuticals Inc^ 386 0.05USD 4,300 Minerva Neurosciences Inc 35 0.01USD 3,240 Mirati Therapeutics Inc^ 199 0.03USD 14,597 Momenta Pharmaceuticals Inc 432 0.06USD 5,872 MyoKardia Inc 337 0.05USD 9,594 Neogen Corp 791 0.11USD 16,754 Neurocrine Biosciences Inc^ 1,684 0.24USD 2,837 Optinose Inc 58 0.01USD 10,300 Owens & Minor Inc^ 194 0.03USD 7,796 Pacira Pharmaceuticals Inc 313 0.04USD 2,808 Paratek Pharmaceuticals Inc 28 0.00USD 11,612 Portola Pharmaceuticals Inc^ 416 0.06USD 9,768 PRA Health Sciences Inc^ 1,027 0.15USD 10,385 Premier Inc 388 0.06USD 9,363 Prestige Brands Holdings Inc^ 335 0.05USD 10,530 Progenics Pharmaceuticals Inc^ 84 0.01USD 1,701 Reata Pharmaceuticals Inc 119 0.02USD 6,120 Revance Therapeutics Inc 176 0.02USD 2,232 Rhythm Pharmaceuticals Inc 69 0.01USD 4,038 Rocket Pharmaceuticals Inc 83 0.01USD 11,684 Sarepta Therapeutics Inc^ 1,358 0.20USD 12,718 Sorrento Therapeutics Inc 71 0.01USD 9,060 Supernus Pharmaceuticals Inc^ 480 0.07USD 40,573 Synergy Pharmaceuticals Inc 69 0.01USD 7,131 Tesaro Inc 248 0.04USD 8,539 TG Therapeutics Inc 100 0.01USD 34,636 TherapeuticsMD Inc^ 181 0.03USD 2,109 Usana Health Sciences Inc 279 0.04
Ccy Holding InvestmentFair value
$'000
% of netassetvalue
United States (31 July 2017: 95.31%) (cont) Pharmaceuticals (cont)
USD 9,173 Vanda Pharmaceuticals Inc^ 191 0.03USD 3,903 Voyager Therapeutics Inc 74 0.01USD 9,693 Xencor Inc^ 361 0.05USD 7,263 Zogenix Inc^ 412 0.06
Pipelines USD 13,783 Antero Midstream GP LP 265 0.04USD 14,398 Enbridge Energy Management
LLC 155 0.02USD 11,822 EnLink Midstream LLC 189 0.03USD 11,748 SemGroup Corp^ 295 0.04USD 28,510 Tallgrass Energy LP^ 665 0.10USD 10,875 Tellurian Inc 85 0.01
Real estate investment & services USD 12,645 Alexander & Baldwin Inc^ 303 0.04USD 4,937 Five Point Holdings LLC 55 0.01USD 3,293 Forestar Group Inc 75 0.01USD 8,297 HFF Inc^ 373 0.05USD 7,570 Howard Hughes Corp^ 1,026 0.15USD 4,201 Marcus & Millichap Inc 169 0.02USD 3,340 RE/MAX Holdings Inc 170 0.03USD 25,537 Realogy Holdings Corp^ 558 0.08USD 8,368 Redfin Corp 205 0.03USD 1,063 RMR Group Inc 92 0.01USD 890 Texas Pacific Land Trust 659 0.10
Real estate investment trusts USD 15,355 Acadia Realty Trust^ 416 0.06USD 4,368 AG Mortgage Investment Trust
Inc 85 0.01USD 5,291 Agree Realty Corp 282 0.04USD 384 Alexander's Inc 142 0.02USD 6,002 American Assets Trust Inc 231 0.03USD 25,597 American Campus Communities
Inc 1,056 0.15USD 47,494 American Homes 4 Rent 1,051 0.15USD 10,602 Americold Realty Trust 228 0.03USD 16,398 Anworth Mortgage Asset Corp 82 0.01USD 31,110 Apartment Investment &
Management Co 1,327 0.19USD 20,819 Apollo Commercial Real Estate
Finance Inc 397 0.06USD 42,881 Apple Hospitality REIT Inc 771 0.11USD 8,113 Arbor Realty Trust Inc 92 0.01USD 9,368 Armada Hoffler Properties Inc 141 0.02USD 5,850 Armour Residential REIT Inc 139 0.02USD 17,262 Ashford Hospitality Trust Inc^ 136 0.02USD 18,578 Blackstone Mortgage Trust Inc 616 0.09USD 6,707 Braemar Hotels & Resorts Inc 77 0.01USD 32,609 Brandywine Realty Trust 538 0.08USD 56,424 Brixmor Property Group Inc 998 0.14USD 23,388 Capstead Mortgage Corp 196 0.03USD 11,124 CareTrust REIT Inc 188 0.03

iSHARES VII PLC
Schedule of Investments (continued) iSHARES MSCI USA SMALL CAP UCITS ETF (continued) As at 31 July 2018
i S H A R E S V I I P L C A N N U A L R E P O R T [ 2 3 7 ]
Ccy Holding Investment Fair value
$'000
% of netassetvalue
Equities (31 July 2017: 99.61%) (cont) United States (31 July 2017: 95.31%) (cont) Real estate investment trusts (cont)
USD 8,377 CatchMark Timber Trust Inc^ 104 0.02USD 35,327 CBL & Associates Properties Inc 193 0.03USD 18,623 Cedar Realty Trust Inc 89 0.01USD 8,310 Chatham Lodging Trust 179 0.03USD 10,799 Chesapeake Lodging Trust 346 0.05USD 34,910 Chimera Investment Corp 667 0.10USD 90,670 Colony Capital Inc 558 0.08USD 15,522 Colony Credit Real Estate Inc 330 0.05USD 24,005 Columbia Property Trust Inc 556 0.08USD 3,355 Community Healthcare Trust Inc^ 101 0.01USD 23,046 CoreCivic Inc 591 0.09USD 7,261 CorePoint Lodging Inc 183 0.03USD 6,315 CoreSite Realty Corp^ 708 0.10USD 20,194 Corporate Office Properties Trust 601 0.09USD 75,890 Cousins Properties Inc 707 0.10USD 34,155 CubeSmart 1,037 0.15USD 17,846 CyrusOne Inc 1,105 0.16USD 31,566 CYS Investments Inc 231 0.03USD 17,369 DCT Industrial Trust Inc 1,161 0.17USD 28,217 DDR Corp 387 0.06USD 35,664 DiamondRock Hospitality Co 425 0.06USD 28,834 Douglas Emmett Inc 1,120 0.16USD 7,697 Dynex Capital Inc 51 0.01USD 13,296 Easterly Government Properties
Inc 252 0.04USD 6,300 EastGroup Properties Inc 600 0.09USD 14,303 Education Realty Trust Inc 592 0.09USD 24,587 Empire State Realty Trust Inc 410 0.06USD 14,397 EPR Properties 957 0.14USD 22,677 Equity Commonwealth 731 0.11USD 15,451 Equity LifeStyle Properties Inc 1,406 0.20USD 5,901 Exantas Capital Corp 62 0.01USD 22,249 First Industrial Realty Trust Inc 724 0.10USD 41,779 Forest City Realty Trust Inc^ 1,043 0.15USD 10,988 Four Corners Property Trust Inc 274 0.04USD 24,382 Franklin Street Properties Corp 215 0.03USD 8,703 Front Yard Residential Corp 84 0.01USD 37,560 Gaming and Leisure Properties
Inc 1,364 0.20USD 24,256 GEO Group Inc^ 628 0.09USD 5,997 Getty Realty Corp 172 0.02USD 4,166 Gladstone Commercial Corp^ 83 0.01USD 8,886 Government Properties Income
Trust^ 134 0.02USD 30,981 Gramercy Property Trust 849 0.12USD 24,710 Healthcare Realty Trust Inc 734 0.11USD 39,645 Healthcare Trust of America Inc 1,083 0.16USD 7,772 Hersha Hospitality Trust 168 0.02USD 20,342 Highwoods Properties Inc 999 0.14
Ccy Holding InvestmentFair value
$'000
% of netassetvalue
United States (31 July 2017: 95.31%) (cont) Real estate investment trusts (cont)
USD 30,592 Hospitality Properties Trust 865 0.13USD 29,522 Hudson Pacific Properties Inc 1,011 0.15USD 19,598 Independence Realty Trust Inc 199 0.03USD 4,234 Industrial Logistics Properties
Trust^ 98 0.01USD 21,676 Invesco Mortgage Capital Inc 360 0.05USD 30,967 Investors Real Estate Trust^ 170 0.02USD 11,776 iStar Inc 128 0.02USD 21,168 JBG SMITH Properties 773 0.11USD 18,304 Kilroy Realty Corp 1,335 0.19USD 19,306 Kite Realty Group Trust 326 0.05USD 2,525 KKR Real Estate Finance Trust
Inc 52 0.01USD 15,714 Lamar Advertising Co 1,157 0.17USD 22,734 LaSalle Hotel Properties 788 0.11USD 41,781 Lexington Realty Trust 367 0.05USD 8,627 Life Storage Inc^ 828 0.12USD 7,426 LTC Properties Inc 313 0.05USD 15,008 Mack-Cali Realty Corp 292 0.04USD 67,432 Medical Properties Trust Inc 972 0.14USD 76,169 MFA Financial Inc 613 0.09USD 14,687 MGM Growth Properties LLC 445 0.06USD 15,152 Monmouth Real Estate
Investment Corp 253 0.04USD 7,849 MTGE Investment Corp 157 0.02USD 7,605 National Health Investors Inc 569 0.08USD 10,359 National Storage Affiliates Trust 299 0.04USD 61,473 New Residential Investment Corp 1,100 0.16USD 11,181 New Senior Investment Group
Inc 79 0.01USD 19,074 New York Mortgage Trust Inc 118 0.02USD 2,923 New York REIT Inc 54 0.01USD 3,008 NexPoint Residential Trust Inc 90 0.01USD 9,457 NorthStar Realty Europe Corp 129 0.02USD 37,261 Omega Healthcare Investors Inc 1,106 0.16USD 2,200 One Liberty Properties Inc 59 0.01USD 26,352 Outfront Media Inc 560 0.08USD 38,737 Paramount Group Inc 598 0.09USD 37,123 Park Hotels & Resorts Inc 1,161 0.17USD 12,727 Pebblebrook Hotel Trust 491 0.07USD 16,933 Pennsylvania Real Estate
Investment Trust 180 0.03USD 10,714 PennyMac Mortgage Investment
Trust 207 0.03USD 32,224 Physicians Realty Trust^ 508 0.07USD 27,689 Piedmont Office Realty Trust Inc^ 548 0.08USD 11,246 PotlatchDeltic Corp 526 0.08USD 3,836 PS Business Parks Inc 490 0.07USD 10,420 QTS Realty Trust Inc 445 0.06USD 17,239 Ramco-Gershenson Properties
Trust 227 0.03

iSHARES VII PLC
Schedule of Investments (continued) iSHARES MSCI USA SMALL CAP UCITS ETF (continued) As at 31 July 2018
[ 2 3 8 ] i S H A R E S V I I P L C A N N U A L R E P O R T
Ccy Holding Investment Fair value
$'000
% of netassetvalue
Equities (31 July 2017: 99.61%) (cont) United States (31 July 2017: 95.31%) (cont) Real estate investment trusts (cont)
USD 23,661 Rayonier Inc 828 0.12USD 17,242 Redwood Trust Inc 290 0.04USD 22,069 Retail Opportunity Investments
Corp 417 0.06USD 42,957 Retail Properties of America Inc 539 0.08USD 15,194 Rexford Industrial Realty Inc 466 0.07USD 35,172 RLJ Lodging Trust 795 0.11USD 8,337 Ryman Hospitality Properties Inc 709 0.10USD 33,178 Sabra Health Care REIT Inc 717 0.10USD 3,147 Saul Centers Inc 168 0.02USD 12,068 Select Income REIT 252 0.04USD 44,239 Senior Housing Properties Trust 789 0.11USD 6,204 Seritage Growth Properties 262 0.04USD 9,086 Spirit MTA REIT^ 91 0.01USD 90,639 Spirit Realty Capital Inc^ 759 0.11USD 16,967 STAG Industrial Inc 464 0.07USD 51,040 Starwood Property Trust Inc^ 1,166 0.17USD 34,323 STORE Capital Corp 942 0.14USD 18,609 Summit Hotel Properties Inc 263 0.04USD 14,691 Sun Communities Inc 1,424 0.21USD 41,017 Sunstone Hotel Investors Inc 667 0.10USD 3,084 Sutherland Asset Management
Corp 51 0.01USD 18,011 Tanger Factory Outlet Centers
Inc 430 0.06USD 11,228 Taubman Centers Inc 697 0.10USD 9,755 Terreno Realty Corp 360 0.05USD 8,877 Tier REIT Inc 211 0.03USD 32,912 Two Harbors Investment Corp 510 0.07USD 4,917 UMH Properties Inc^ 76 0.01USD 30,471 Uniti Group Inc^ 539 0.08USD 2,186 Universal Health Realty Income
Trust 147 0.02USD 21,071 Urban Edge Properties^ 478 0.07USD 5,398 Urstadt Biddle Properties Inc 120 0.02USD 51,546 VICI Properties Inc 1,049 0.15USD 42,393 Washington Prime Group Inc^ 340 0.05USD 13,955 Washington Real Estate
Investment Trust 425 0.06USD 22,551 Weingarten Realty Investors 681 0.10USD 7,257 Western Asset Mortgage Capital
Corp 80 0.01USD 7,185 Whitestone REIT^ 93 0.01USD 20,171 WP Carey Inc 1,319 0.19USD 19,389 Xenia Hotels & Resorts Inc 473 0.07
Retail USD 13,096 Abercrombie & Fitch Co^ 310 0.04USD 32,457 American Eagle Outfitters Inc^ 817 0.12USD 4,146 Asbury Automotive Group Inc 291 0.04USD 28,472 Ascena Retail Group Inc 105 0.01USD 6,458 At Home Group Inc 234 0.03
Ccy Holding InvestmentFair value
$'000
% of netassetvalue
United States (31 July 2017: 95.31%) (cont) Retail (cont)
USD 11,097 AutoNation Inc 539 0.08USD 3,668 Barnes & Noble Education Inc 21 0.00USD 9,886 Barnes & Noble Inc 60 0.01USD 12,093 Beacon Roofing Supply Inc^ 509 0.07USD 26,588 Bed Bath & Beyond Inc^ 498 0.07USD 8,193 Big Lots Inc 356 0.05USD 20 Biglari Holdings Inc 20 0.00USD 240 Biglari Holdings Inc Class 'B'^ 45 0.01USD 3,060 BJ's Restaurants Inc 194 0.03USD 14,549 Bloomin' Brands Inc 281 0.04USD 12,142 BMC Stock Holdings Inc 267 0.04USD 6,425 Bojangles' Inc^ 85 0.01USD 5,143 Boot Barn Holdings Inc^ 120 0.02USD 8,303 Brinker International Inc 392 0.06USD 4,536 Buckle Inc 109 0.02USD 12,709 Burlington Stores Inc 1,942 0.28USD 8,420 Caleres Inc 282 0.04USD 12,976 Cannae Holdings Inc 237 0.03USD 6,578 Carrols Restaurant Group Inc 95 0.01USD 7,097 Casey's General Stores Inc^ 776 0.11USD 4,460 Cato Corp 111 0.02USD 8,982 Cheesecake Factory Inc^ 503 0.07USD 27,928 Chico's FAS Inc 243 0.03USD 3,320 Children's Place Inc^ 408 0.06USD 2,735 Chuy's Holdings Inc 87 0.01USD 2,623 Citi Trends Inc 75 0.01USD 3,748 Conn's Inc 127 0.02USD 3,885 Cracker Barrel Old Country Store
Inc 569 0.08USD 6,880 Dave & Buster's Entertainment
Inc 338 0.05USD 8,211 Del Taco Restaurants Inc 106 0.02USD 13,222 Denny's Corp 192 0.03USD 15,712 Dick's Sporting Goods Inc^ 536 0.08USD 2,780 Dillard's Inc 223 0.03USD 2,765 Dine Brands Global Inc^ 196 0.03USD 12,822 DSW Inc^ 352 0.05USD 4,036 Duluth Holdings Inc 93 0.01USD 15,227 Dunkin' Brands Group Inc 1,060 0.15USD 4,070 El Pollo Loco Holdings Inc^ 47 0.01USD 16,515 Express Inc^ 159 0.02USD 14,301 Ezcorp Inc 164 0.02USD 4,224 Fiesta Restaurant Group Inc 123 0.02USD 8,716 FirstCash Inc 708 0.10USD 10,666 Five Below Inc 1,036 0.15USD 8,089 Floor & Decor Holdings Inc^ 386 0.06USD 22,967 Foot Locker Inc^ 1,121 0.16USD 3,283 Foundation Building Materials Inc 48 0.01USD 3,919 Freshpet Inc 114 0.02USD 19,739 GameStop Corp 284 0.04

iSHARES VII PLC
Schedule of Investments (continued) iSHARES MSCI USA SMALL CAP UCITS ETF (continued) As at 31 July 2018
i S H A R E S V I I P L C A N N U A L R E P O R T [ 2 3 9 ]
Ccy Holding Investment Fair value
$'000
% of netassetvalue
Equities (31 July 2017: 99.61%) (cont) United States (31 July 2017: 95.31%) (cont) Retail (cont)
USD 4,053 Genesco Inc^ 165 0.02USD 5,460 GMS Inc 143 0.02USD 13,854 GNC Holdings Inc 44 0.01USD 3,580 Group 1 Automotive Inc^ 251 0.04USD 10,782 Guess? Inc 244 0.04USD 3,011 Haverty Furniture Cos Inc 60 0.01USD 5,271 Hibbett Sports Inc 121 0.02USD 6,007 Jack in the Box Inc 506 0.07USD 56,328 JC Penney Co Inc^ 138 0.02USD 8,188 La-Z-Boy Inc 250 0.04USD 4,562 Lithia Motors Inc^ 406 0.06USD 4,895 Lumber Liquidators Holdings Inc 95 0.01USD 5,007 MarineMax Inc^ 94 0.01USD 22,168 Michaels Cos Inc 452 0.07USD 2,922 Movado Group Inc 146 0.02USD 8,185 MSC Industrial Direct Co Inc 693 0.10USD 9,054 National Vision Holdings Inc 368 0.05USD 9,493 Nu Skin Enterprises Inc 692 0.10USD 95,992 Office Depot Inc^ 241 0.03USD 9,552 Ollie's Bargain Outlet Holdings
Inc 664 0.10USD 4,849 Papa John's International Inc^ 203 0.03USD 7,588 Party City Holdco Inc 120 0.02USD 2,104 PC Connection Inc 71 0.01USD 7,539 Penske Automotive Group Inc^ 394 0.06USD 3,825 PetMed Express Inc 142 0.02USD 3,997 Potbelly Corp 50 0.01USD 3,841 PriceSmart Inc^ 314 0.05USD 2,270 Red Robin Gourmet Burgers Inc 107 0.02USD 6,109 Regis Corp 107 0.02USD 3,517 RH 478 0.07USD 190,684 Rite Aid Corp^ 383 0.06USD 5,861 Rush Enterprises Inc 264 0.04USD 1,133 Rush Enterprises Inc Class 'B' 51 0.01USD 5,704 Ruth's Hospitality Group Inc 165 0.02USD 24,524 Sally Beauty Holdings Inc^ 404 0.06USD 4,899 Shake Shack Inc 305 0.04USD 2,337 Shoe Carnival Inc 73 0.01USD 4,960 Sonic Automotive Inc^ 101 0.01USD 8,196 Sonic Corp 288 0.04USD 9,321 Tailored Brands Inc^ 188 0.03USD 12,391 Texas Roadhouse Inc 779 0.11USD 6,576 Tile Shop Holdings Inc 55 0.01USD 14,505 Urban Outfitters Inc 644 0.09USD 5,574 Vera Bradley Inc 74 0.01USD 35,200 Wendy's Co^ 587 0.08USD 16,517 Williams-Sonoma Inc 966 0.14USD 5,773 Wingstop Inc^ 285 0.04
Ccy Holding InvestmentFair value
$'000
% of netassetvalue
United States (31 July 2017: 95.31%) (cont) Retail (cont)
USD 397 Winmark Corp 58 0.01USD 12,383 World Fuel Services Corp 345 0.05USD 3,505 Zumiez Inc^ 79 0.01
Savings & loans USD 7,500 Banc of California Inc^ 150 0.02USD 13,175 Beneficial Bancorp Inc 214 0.03USD 8,599 Berkshire Hills Bancorp Inc^ 349 0.05USD 11,444 BofI Holding Inc 447 0.06USD 14,285 Brookline Bancorp Inc^ 260 0.04USD 25,250 Capitol Federal Financial Inc 330 0.05USD 5,029 Dime Community Bancshares
Inc^ 87 0.01USD 3,672 First Defiance Financial Corp 118 0.02USD 7,532 Flagstar Bancorp Inc 256 0.04USD 4,120 Flushing Financial Corp 103 0.01USD 2,954 HomeTrust Bancshares Inc 86 0.01USD 47,542 Investors Bancorp Inc 595 0.09USD 9,497 Meridian Bancorp Inc 174 0.02USD 2,046 Meta Financial Group Inc^ 183 0.03USD 7,713 Northfield Bancorp Inc^ 128 0.02USD 18,423 Northwest Bancshares Inc 332 0.05USD 7,116 OceanFirst Financial Corp 208 0.03USD 6,012 Oritani Financial Corp 96 0.01USD 10,375 Pacific Premier Bancorp Inc^ 384 0.06USD 11,771 Provident Financial Services Inc 301 0.04USD 39,137 Sterling Bancorp^ 869 0.12USD 12,644 TFS Financial Corp^ 192 0.03USD 9,291 United Community Financial
Corp 97 0.01USD 12,356 United Financial Bancorp Inc 216 0.03USD 16,002 Washington Federal Inc 537 0.08USD 6,817 Waterstone Financial Inc 116 0.02USD 7,000 WSFS Financial Corp 397 0.06
Semiconductors USD 7,608 Advanced Energy Industries Inc 466 0.07USD 18,521 Amkor Technology Inc 161 0.02USD 5,355 Axcelis Technologies Inc 118 0.02USD 12,261 Brooks Automation Inc 375 0.05USD 4,634 Cabot Microelectronics Corp^ 558 0.08USD 4,452 Ceva Inc^ 134 0.02USD 11,776 Cirrus Logic Inc^ 509 0.07USD 4,473 Cohu Inc^ 113 0.02USD 6,335 CTS Corp 221 0.03USD 61,336 Cypress Semiconductor Corp^ 1,092 0.16USD 7,317 Diodes Inc 272 0.04USD 25,718 Entegris Inc 904 0.13USD 14,524 FormFactor Inc 188 0.03USD 7,033 Inphi Corp 221 0.03USD 25,685 Integrated Device Technology Inc 884 0.13USD 12,558 Kulicke & Soffa Industries Inc 331 0.05

iSHARES VII PLC
Schedule of Investments (continued) iSHARES MSCI USA SMALL CAP UCITS ETF (continued) As at 31 July 2018
[ 2 4 0 ] i S H A R E S V I I P L C A N N U A L R E P O R T
Ccy Holding Investment Fair value
$'000
% of netassetvalue
Equities (31 July 2017: 99.61%) (cont) United States (31 July 2017: 95.31%) (cont) Semiconductors (cont)
USD 18,162 Lattice Semiconductor Corp 140 0.02USD 7,935 MACOM Technology Solutions
Holdings Inc 165 0.02USD 12,897 MaxLinear Inc^ 223 0.03USD 9,935 MKS Instruments Inc 937 0.13USD 7,258 Monolithic Power Systems Inc 963 0.14USD 5,398 Nanometrics Inc 203 0.03USD 10,202 Photronics Inc 92 0.01USD 5,303 Power Integrations Inc^ 379 0.05USD 19,940 Rambus Inc 247 0.04USD 6,736 Rudolph Technologies Inc 193 0.03USD 12,932 Semtech Corp 614 0.09USD 7,856 Silicon Laboratories Inc 748 0.11USD 6,255 Synaptics Inc 314 0.05USD 37,037 Teradyne Inc 1,602 0.23USD 5,769 Ultra Clean Holdings Inc^ 77 0.01USD 8,216 Veeco Instruments Inc 120 0.02USD 10,227 Xcerra Corp 146 0.02USD 9,804 Xperi Corp^ 163 0.02
Software USD 10,008 2U Inc^ 757 0.11USD 22,883 ACI Worldwide Inc^ 591 0.09USD 15,176 Acxiom Corp 615 0.09USD 31,427 Allscripts Healthcare Solutions
Inc 385 0.06USD 13,171 Aspen Technology Inc 1,262 0.18USD 7,265 athenahealth Inc 1,095 0.16USD 20,452 Avaya Holdings Corp 421 0.06USD 3,012 Benefitfocus Inc^ 91 0.01USD 27,125 Black Knight Inc 1,401 0.20USD 9,284 Blackbaud Inc^ 927 0.13USD 6,464 Blackline Inc^ 276 0.04USD 7,492 Bottomline Technologies de Inc^ 404 0.06USD 21,689 Box Inc 520 0.07USD 12,799 Castlight Health Inc 42 0.01USD 19,209 Cloudera Inc 257 0.04USD 8,432 CommVault Systems Inc 547 0.08USD 1,549 Computer Programs & Systems
Inc 48 0.01USD 9,160 Cornerstone OnDemand Inc 452 0.07USD 7,484 Cotiviti Holdings Inc 334 0.05USD 8,188 Coupa Software Inc 502 0.07USD 6,486 CSG Systems International Inc 264 0.04USD 6,189 Donnelley Financial Solutions
Inc^ 129 0.02USD 6,662 Dun & Bradstreet Corp 839 0.12USD 4,606 Ebix Inc 365 0.05USD 7,779 Envestnet Inc 456 0.07USD 4,194 Everbridge Inc 189 0.03
Ccy Holding InvestmentFair value
$'000
% of netassetvalue
United States (31 July 2017: 95.31%) (cont) Software (cont)
USD 11,215 Evolent Health Inc^ 227 0.03USD 5,609 Fair Isaac Corp 1,130 0.16USD 8,806 Five9 Inc 281 0.04USD 16,146 Glu Mobile Inc^ 86 0.01USD 14,124 Guidewire Software Inc^ 1,217 0.18USD 7,756 Hortonworks Inc 135 0.02USD 7,183 HubSpot Inc^ 891 0.13USD 13,415 InnerWorkings Inc 119 0.02USD 11,055 Inovalon Holdings Inc 118 0.02USD 5,268 Instructure Inc 204 0.03USD 9,420 j2 Global Inc 799 0.12USD 11,726 LivePerson Inc 272 0.04USD 12,601 Manhattan Associates Inc 606 0.09USD 4,763 ManTech International Corp 285 0.04USD 10,708 Medidata Solutions Inc^ 796 0.11USD 1,639 MicroStrategy Inc 213 0.03USD 6,982 Mindbody Inc^ 261 0.04USD 8,672 MobileIron Inc 41 0.01USD 4,119 Model N Inc 77 0.01USD 7,547 Monotype Imaging Holdings Inc 156 0.02USD 7,722 New Relic Inc 754 0.11USD 53,509 Nuance Communications Inc^ 790 0.11USD 7,108 Omnicell Inc 423 0.06USD 9,340 Paycom Software Inc^ 992 0.14USD 4,066 PDF Solutions Inc 43 0.01USD 2,025 PdvWireless Inc 61 0.01USD 7,714 Pegasystems Inc 429 0.06USD 7,546 Progress Software Corp 278 0.04USD 5,693 PROS Holdings Inc 211 0.03USD 22,006 PTC Inc 2,023 0.29USD 1,805 QAD Inc 90 0.01USD 11,474 Quality Systems Inc^ 231 0.03USD 5,502 Rapid7 Inc 153 0.02USD 12,857 RealPage Inc^ 708 0.10USD 12,832 Ribbon Communications Inc 87 0.01USD 8,921 SailPoint Technologies Holding
Inc 215 0.03USD 3,231 SendGrid Inc 82 0.01USD 3,233 SPS Commerce Inc 277 0.04USD 12,882 Tableau Software Inc^ 1,328 0.19USD 2,980 Tabula Rasa HealthCare Inc^ 174 0.03USD 24,774 TiVo Corp^ 301 0.04USD 6,547 Tyler Technologies Inc 1,473 0.21USD 5,339 Ultimate Software Group Inc 1,478 0.21USD 2,903 Upland Software Inc 91 0.01USD 12,136 Verint Systems Inc 545 0.08USD 3,703 Workiva Inc 93 0.01USD 5,890 Yext Inc 125 0.02USD 142,280 Zynga Inc 539 0.08

iSHARES VII PLC
Schedule of Investments (continued) iSHARES MSCI USA SMALL CAP UCITS ETF (continued) As at 31 July 2018
i S H A R E S V I I P L C A N N U A L R E P O R T [ 2 4 1 ]
Ccy Holding Investment Fair value
$'000
% of netassetvalue
Equities (31 July 2017: 99.61%) (cont) United States (31 July 2017: 95.31%) (cont)
Storage & warehousing USD 8,265 Mobile Mini Inc 353 0.05USD 8,553 Wesco Aircraft Holdings Inc^ 102 0.02
Telecommunications USD 11,722 A10 Networks Inc 79 0.01USD 5,641 Acacia Communications Inc 181 0.03USD 8,545 Adtran Inc 139 0.02USD 1,713 ATN International Inc^ 109 0.02USD 5,289 CalAmp Corp 120 0.02USD 26,103 Ciena Corp^ 663 0.10USD 6,768 Cincinnati Bell Inc^ 90 0.01USD 5,598 Comtech Telecommunications
Corp 188 0.03USD 12,677 Consolidated Communications
Holdings Inc^ 162 0.02USD 8,697 EchoStar Corp 391 0.06USD 27,448 Extreme Networks Inc 233 0.03USD 20,293 Finisar Corp^ 342 0.05USD 14,077 Frontier Communications Corp 74 0.01USD 17,333 GCI Liberty Inc 834 0.12USD 89,195 Globalstar Inc 50 0.01USD 11,018 Gogo Inc^ 39 0.01USD 7,834 GTT Communications Inc^ 348 0.05USD 26,745 Infinera Corp 223 0.03USD 6,852 InterDigital Inc^ 565 0.08USD 13,000 Iridium Communications Inc^ 225 0.03USD 9,939 LogMeIn Inc 806 0.12USD 2,249 Loral Space & Communications
Inc 89 0.01USD 5,515 Netgear Inc 363 0.05USD 36,518 Oclaro Inc 309 0.05USD 9,965 Orbcomm Inc^ 95 0.01USD 6,411 Plantronics Inc 440 0.06USD 4,698 Quantenna Communications Inc^ 75 0.01USD 8,353 Shenandoah
Telecommunications Co^ 276 0.04USD 5,658 Spok Holdings Inc 82 0.01USD 20,117 Telephone & Data Systems Inc 508 0.07USD 4,332 Ubiquiti Networks Inc 358 0.05USD 3,648 United States Cellular Corp 125 0.02USD 10,700 ViaSat Inc 753 0.11USD 45,273 Viavi Solutions Inc 458 0.07USD 44,501 Vonage Holdings Corp 570 0.08USD 8,401 Windstream Holdings Inc 30 0.00
Textile USD 2,787 UniFirst Corp 522 0.08
Transportation USD 2,697 Air Transport Services Group Inc 61 0.01USD 4,306 ArcBest Corp 201 0.03USD 1,085 Atlas Air Worldwide Holdings Inc 73 0.01
Ccy Holding InvestmentFair value
$'000
% of netassetvalue
United States (31 July 2017: 95.31%) (cont) Transportation (cont)
USD 2,117 Covenant Transportation Group Inc 61 0.01
USD 4,959 Daseke Inc^ 43 0.01USD 4,651 Echo Global Logistics Inc^ 160 0.02USD 5,145 Forward Air Corp 329 0.05USD 11,533 Genesee & Wyoming Inc^ 992 0.14USD 8,304 Heartland Express Inc^ 159 0.02USD 6,063 Hub Group Inc 281 0.04USD 3,081 Kirby Corp^ 257 0.04USD 7,653 Landstar System Inc 851 0.12USD 6,371 Marten Transport Ltd 139 0.02USD 3,311 Matson Inc 119 0.02USD 9,682 Ryder System Inc 758 0.11USD 4,825 Saia Inc 364 0.05USD 4,196 Tidewater Inc 144 0.02USD 2,339 Universal Logistics Holdings Inc 78 0.01USD 9,164 Werner Enterprises Inc 341 0.05USD 4,870 YRC Worldwide Inc 48 0.01
Water USD 6,784 American States Water Co 408 0.06USD 32,611 Aqua America Inc 1,204 0.17USD 8,681 California Water Service Group 357 0.05USD 2,651 Connecticut Water Service Inc 171 0.03USD 2,916 Middlesex Water Co 129 0.02USD 2,364 SJW Group 153 0.02USD 4,061 York Water Co 126 0.02
Total United States 656,711 94.82Total equities 689,121 99.50
CcyNo. of
contracts
Underlying exposure
$’000 Fair value
$’000
% of net asset
value Financial derivative instruments (31 July 2017: 0.00%) Futures contracts (31 July 2017: 0.00%)
USD 36 Russell 2000 Mini Index Futures September 2018 3,043 (32) (0.01)Total unrealised losses on futures contracts (32) (0.01)Total financial derivative instruments (32) (0.01)

iSHARES VII PLC
Schedule of Investments (continued) iSHARES MSCI USA SMALL CAP UCITS ETF (continued) As at 31 July 2018
[ 2 4 2 ] i S H A R E S V I I P L C A N N U A L R E P O R T
Fair value
$'000
% of net asset value
Total value of investments 689,089 99.49 Cash† 11,132 1.61 Other net liabilities (7,629) (1.10) Net asset value attributable to redeemable participating shareholders at the end of the financial year 692,592 100.00
† Cash holdings of $10,966,479 are held with State Street Bank and Trust Company. $165,623 is held as security for futures contracts with Credit Suisse AG. ^ These securities are partially or fully transferred as securities lent. * These securities were valued in consultation with the Investment Manager. These securities were delisted, suspended or priced at zero at the financial year end.
Equities are primarily classified by country of incorporation of the entity in which the Fund holds shares. Underlying exposure has been calculated according to the guidelines issued by the ESMA and represents the market value of an equivalent position in the assets underlying each financial derivative instrument.
Analysis of total current assets gross of all liabilities
Fair value$'000
% of totalcurrentassets
Transferable securities admitted to an official stock exchange listing 687,754 97.97Other transferable securities of the type referred to in Regulation 68(1)(a), (b) and (c) 1,367 0.19Other assets 12,884 1.84Total current assets 702,005 100.00

iSHARES VII PLC
Schedule of Investments (continued) iSHARES MSCI USA UCITS ETF As at 31 July 2018
i S H A R E S V I I P L C A N N U A L R E P O R T [ 2 4 3 ]
Ccy Holding Investment Fair value
$'000
% of netassetvalue
Transferable Securities Admitted to an Official Stock Exchange Listing or traded on a Regulated Market (31 July 2017: 99.45%)
Equities (31 July 2017: 99.45%) Bermuda (31 July 2017: 0.56%) Agriculture
USD 3,153 Bunge Ltd 218 0.04Chemicals
USD 4,983 Axalta Coating Systems Ltd 151 0.03Commercial services
USD 9,794 IHS Markit Ltd 519 0.09Diversified financial services
USD 9,773 Invesco Ltd 264 0.04Insurance
USD 9,862 Arch Capital Group Ltd 301 0.05USD 3,890 Athene Holding Ltd 179 0.03USD 2,332 Axis Capital Holdings Ltd 132 0.02USD 1,040 Everest Re Group Ltd 227 0.04USD 1,085 RenaissanceRe Holdings Ltd 143 0.02USD 6,743 XL Group Ltd 379 0.06
Leisure time USD 5,094 Norwegian Cruise Line Holdings
Ltd 255 0.04Semiconductors
USD 14,860 Marvell Technology Group Ltd 316 0.05Total Bermuda 3,084 0.51
British Virgin Islands (31 July 2017: 0.03%) Apparel retailers
USD 4,092 Michael Kors Holdings Ltd 273 0.04Total British Virgin Islands 273 0.04
Canada (31 July 2017: 0.08%) Environmental control
USD 6,208 Waste Connections Inc 482 0.08Total Canada 482 0.08
Curacao (31 July 2017: 0.43%) Oil & gas services
USD 33,835 Schlumberger Ltd 2,284 0.38Total Curacao 2,284 0.38
Ireland (31 July 2017: 2.05%) Building materials and fixtures
USD 22,358 Johnson Controls International Plc 839 0.14Computers
USD 14,824 Accenture Plc 2,362 0.39USD 7,037 Seagate Technology Plc 370 0.06
Electronics USD 2,242 Allegion Plc 183 0.03
Ccy Holding InvestmentFair value
$'000
% of netassetvalue
Ireland (31 July 2017: 2.05%) (cont) Healthcare products
USD 32,534 Medtronic Plc 2,936 0.48Insurance
USD 3,384 Willis Towers Watson Plc 539 0.09Machinery - diversified
USD 3,912 Pentair Plc 175 0.03Miscellaneous manufacturers
USD 10,477 Eaton Corp Plc 871 0.14USD 6,271 Ingersoll-Rand Plc 618 0.10
Pharmaceuticals USD 3,525 Alkermes Plc 154 0.03USD 7,980 Allergan Plc 1,469 0.24USD 1,336 Jazz Pharmaceuticals Plc 231 0.04USD 3,224 Perrigo Co Plc 260 0.04
Total Ireland 11,007 1.81
Jersey (31 July 2017: 0.11%) Auto parts & equipment
USD 6,350 Aptiv Plc 623 0.10Total Jersey 623 0.10
Liberia (31 July 2017: 0.09%) Leisure time
USD 4,266 Royal Caribbean Cruises Ltd 481 0.08Total Liberia 481 0.08
Netherlands (31 July 2017: 0.26%) Chemicals
USD 7,885 LyondellBasell Industries NV 874 0.14Pharmaceuticals
USD 12,367 Mylan NV 461 0.08Total Netherlands 1,335 0.22
Panama (31 July 2017: 0.10%) Leisure time
USD 10,264 Carnival Corp 608 0.10Total Panama 608 0.10
Singapore (31 July 2017: 0.48%) Electronics
USD 12,529 Flex Ltd 175 0.03Total Singapore 175 0.03
Switzerland (31 July 2017: 0.47%) Electronics
USD 3,259 Garmin Ltd 203 0.04USD 8,440 TE Connectivity Ltd 790 0.13
Insurance USD 11,006 Chubb Ltd 1,538 0.25
Total Switzerland 2,531 0.42

iSHARES VII PLC
Schedule of Investments (continued) iSHARES MSCI USA UCITS ETF (continued) As at 31 July 2018
[ 2 4 4 ] i S H A R E S V I I P L C A N N U A L R E P O R T
Ccy Holding Investment Fair value
$'000
% of netassetvalue
Equities (31 July 2017: 99.45%) (cont) United Kingdom (31 July 2017: 0.41%) Commercial services
USD 8,260 Nielsen Holdings Plc 195 0.03Electronics
USD 3,932 Sensata Technologies Holding Plc 214 0.03Insurance
USD 5,966 Aon Plc 856 0.14Media
USD 5,186 Liberty Global Plc 146 0.02USD 14,541 Liberty Global Plc Class 'C' 395 0.07
Oil & gas services USD 10,347 TechnipFMC Plc 337 0.06
Total United Kingdom 2,143 0.35
United States (31 July 2017: 94.38%) Advertising
USD 9,133 Interpublic Group of Cos Inc 206 0.04USD 5,582 Omnicom Group Inc^ 384 0.06
Aerospace & defence USD 9,766 Arconic Inc 212 0.04USD 13,517 Boeing Co 4,816 0.79USD 6,040 General Dynamics Corp 1,207 0.20USD 2,779 Harris Corp 458 0.08USD 1,777 L3 Technologies Inc 381 0.06USD 6,132 Lockheed Martin Corp 2,000 0.33USD 3,967 Northrop Grumman Corp 1,192 0.20USD 7,130 Raytheon Co 1,412 0.23USD 4,031 Rockwell Collins Inc 560 0.09USD 2,814 Spirit AeroSystems Holdings Inc 262 0.04USD 1,191 TransDigm Group Inc^ 447 0.07USD 18,179 United Technologies Corp^ 2,468 0.41
Agriculture USD 45,977 Altria Group Inc 2,698 0.44USD 13,587 Archer-Daniels-Midland Co 656 0.11USD 37,222 Philip Morris International Inc 3,212 0.53
Airlines USD 3,059 American Airlines Group Inc 121 0.02USD 4,606 Delta Air Lines Inc 251 0.04USD 3,643 Southwest Airlines Co 212 0.03USD 2,042 United Continental Holdings Inc 164 0.03
Apparel retailers USD 8,846 Hanesbrands Inc^ 197 0.03USD 31,317 Nike Inc 2,408 0.40USD 1,841 PVH Corp 283 0.05USD 1,362 Ralph Lauren Corp 184 0.03USD 3,970 Under Armour Inc 79 0.01USD 3,995 Under Armour Inc Class 'C' 75 0.01USD 8,462 VF Corp 779 0.13
Ccy Holding InvestmentFair value
$'000
% of netassetvalue
United States (31 July 2017: 94.38%) (cont) Auto manufacturers
USD 91,174 Ford Motor Co 915 0.15USD 30,539 General Motors Co 1,158 0.19USD 8,180 Paccar Inc 538 0.09USD 3,013 Tesla Inc 898 0.15
Auto parts & equipment USD 2,037 Autoliv Inc 209 0.03USD 4,911 BorgWarner Inc 226 0.04USD 5,911 Goodyear Tire & Rubber Co 143 0.02USD 1,694 Lear Corp 305 0.05USD 1,222 Wabco Holdings Inc 154 0.03
Banks USD 234,260 Bank of America Corp 7,234 1.19USD 24,692 Bank of New York Mellon Corp^ 1,320 0.22USD 19,040 BB&T Corp 967 0.16USD 11,614 Capital One Financial Corp 1,095 0.18USD 3,403 CIT Group Inc 180 0.03USD 62,400 Citigroup Inc 4,486 0.74USD 11,953 Citizens Financial Group Inc 475 0.08USD 4,100 Comerica Inc 397 0.07USD 3,387 East West Bancorp Inc 219 0.04USD 17,931 Fifth Third Bancorp^ 531 0.09USD 3,759 First Republic Bank 372 0.06USD 8,750 Goldman Sachs Group Inc 2,077 0.34USD 28,743 Huntington Bancshares Inc^ 444 0.07USD 82,791 JPMorgan Chase & Co 9,517 1.57USD 24,982 KeyCorp 521 0.09USD 3,553 M&T Bank Corp 616 0.10USD 32,586 Morgan Stanley 1,648 0.27USD 5,280 Northern Trust Corp 577 0.09USD 11,437 PNC Financial Services Group
Inc* 1,656 0.27USD 27,326 Regions Financial Corp 509 0.08USD 1,202 Signature Bank 132 0.02USD 9,101 State Street Corp 804 0.13USD 11,573 SunTrust Banks Inc 834 0.14USD 1,222 SVB Financial Group 376 0.06USD 37,553 US Bancorp^ 1,991 0.33USD 112,824 Wells Fargo & Co 6,464 1.06USD 4,750 Zions Bancorporation^ 246 0.04
Beverages USD 6,485 Brown-Forman Corp 345 0.06USD 98,360 Coca-Cola Co 4,587 0.75USD 4,129 Constellation Brands Inc 868 0.14USD 4,678 Molson Coors Brewing Co 313 0.05USD 10,716 Monster Beverage Corp 643 0.11USD 34,492 PepsiCo Inc 3,967 0.65
Biotechnology USD 5,453 Alexion Pharmaceuticals Inc 725 0.12USD 2,103 Alnylam Pharmaceuticals Inc 200 0.03

iSHARES VII PLC
Schedule of Investments (continued) iSHARES MSCI USA UCITS ETF (continued) As at 31 July 2018
i S H A R E S V I I P L C A N N U A L R E P O R T [ 2 4 5 ]
Ccy Holding Investment Fair value
$'000
% of netassetvalue
Equities (31 July 2017: 99.45%) (cont) United States (31 July 2017: 94.38%) (cont) Biotechnology (cont)
USD 16,424 Amgen Inc 3,228 0.53USD 5,091 Biogen Inc 1,702 0.28USD 3,979 BioMarin Pharmaceutical Inc 400 0.06USD 17,996 Celgene Corp 1,621 0.27USD 31,908 Gilead Sciences Inc 2,483 0.41USD 3,554 Illumina Inc 1,153 0.19USD 4,297 Incyte Corp 286 0.05USD 1,854 Regeneron Pharmaceuticals Inc 682 0.11USD 2,309 Seattle Genetics Inc 163 0.03USD 1,029 United Therapeutics Corp 127 0.02USD 5,969 Vertex Pharmaceuticals Inc 1,045 0.17
Building materials and fixtures USD 3,497 Fortune Brands Home & Security
Inc 203 0.03USD 909 Lennox International Inc 197 0.03USD 1,574 Martin Marietta Materials Inc^ 314 0.05USD 7,586 Masco Corp 306 0.05USD 2,643 Owens Corning^ 165 0.03USD 3,236 Vulcan Materials Co 362 0.06
Chemicals USD 5,470 Air Products & Chemicals Inc 898 0.15USD 2,701 Albemarle Corp^ 254 0.04USD 3,333 Celanese Corp 394 0.06USD 5,373 CF Industries Holdings Inc 239 0.04USD 4,396 Chemours Co 201 0.03USD 56,070 DowDuPont Inc 3,856 0.63USD 3,540 Eastman Chemical Co 367 0.06USD 3,260 FMC Corp 293 0.05USD 1,885 International Flavors &
Fragrances Inc^ 250 0.04USD 10,112 Mosaic Co 305 0.05USD 6,130 PPG Industries Inc^ 678 0.11USD 6,861 Praxair Inc 1,149 0.19USD 1,997 Sherwin-Williams Co 880 0.15USD 932 Westlake Chemical Corp 100 0.02
Commercial services USD 185 Amerco 70 0.01USD 10,630 Automatic Data Processing Inc 1,435 0.24USD 2,170 Cintas Corp^ 444 0.07USD 906 CoStar Group Inc 377 0.06USD 6,082 Ecolab Inc 856 0.14USD 2,988 Equifax Inc 375 0.06USD 2,113 FleetCor Technologies Inc 459 0.08USD 2,276 Gartner Inc 308 0.05USD 3,911 Global Payments Inc 440 0.07USD 5,137 H&R Block Inc^ 129 0.02USD 1,674 ManpowerGroup Inc 156 0.03USD 4,015 Moody's Corp 687 0.11
Ccy Holding InvestmentFair value
$'000
% of netassetvalue
United States (31 July 2017: 94.38%) (cont) Commercial services (cont)
USD 27,362 PayPal Holdings Inc 2,247 0.37USD 2,932 Robert Half International Inc 222 0.04USD 2,306 Rollins Inc 127 0.02USD 6,125 S&P Global Inc 1,228 0.20USD 6,990 Sabre Corp 172 0.03USD 6,443 Square Inc 417 0.07USD 4,002 Total System Services Inc 366 0.06USD 4,368 TransUnion 316 0.05USD 2,100 United Rentals Inc^ 312 0.05USD 3,580 Verisk Analytics Inc 396 0.06USD 12,170 Western Union Co 245 0.04USD 7,056 Worldpay Inc 580 0.10
Computers USD 122,594 Apple Inc 23,329 3.84USD 14,555 Cognizant Technology Solutions
Corp 1,186 0.19USD 5,023 Dell Technologies Inc Class V 465 0.08USD 6,577 DXC Technology Co 557 0.09USD 3,424 Fortinet Inc 215 0.04USD 38,598 Hewlett Packard Enterprise Co 596 0.10USD 40,039 HP Inc 924 0.15USD 22,116 International Business Machines
Corp 3,205 0.53USD 3,358 Leidos Holdings Inc 230 0.04USD 6,675 NetApp Inc 518 0.08USD 6,884 Western Digital Corp 483 0.08
Cosmetics & personal care USD 19,857 Colgate-Palmolive Co 1,330 0.22USD 11,009 Coty Inc 148 0.02USD 5,388 Estee Lauder Cos Inc^ 727 0.12USD 60,754 Procter & Gamble Co 4,914 0.81
Distribution & wholesale USD 6,586 Fastenal Co^ 375 0.06USD 4,742 HD Supply Holdings Inc 208 0.03USD 6,767 LKQ Corp 227 0.04USD 1,148 WW Grainger Inc^ 398 0.07
Diversified financial services USD 1,222 Affiliated Managers Group Inc 196 0.03USD 1,181 Alliance Data Systems Corp^ 266 0.04USD 10,727 Ally Financial Inc^ 287 0.05USD 17,555 American Express Co 1,747 0.29USD 3,528 Ameriprise Financial Inc 514 0.09USD 2,884 BlackRock Inc* 1,450 0.24USD 2,932 Cboe Global Markets Inc 285 0.05USD 29,679 Charles Schwab Corp 1,515 0.25USD 8,139 CME Group Inc^ 1,295 0.21USD 8,678 Discover Financial Services 620 0.10USD 6,345 E*TRADE Financial Corp 379 0.06USD 2,531 Eaton Vance Corp 134 0.02

iSHARES VII PLC
Schedule of Investments (continued) iSHARES MSCI USA UCITS ETF (continued) As at 31 July 2018
[ 2 4 6 ] i S H A R E S V I I P L C A N N U A L R E P O R T
Ccy Holding Investment Fair value
$'000
% of netassetvalue
Equities (31 July 2017: 99.45%) (cont) United States (31 July 2017: 94.38%) (cont) Diversified financial services (cont)
USD 7,887 Franklin Resources Inc^ 271 0.05USD 13,837 Intercontinental Exchange Inc 1,023 0.17USD 7,322 Jefferies Financial Group Inc 178 0.03USD 22,524 Mastercard Inc 4,460 0.73USD 2,585 Nasdaq Inc 236 0.04USD 2,947 Raymond James Financial Inc 270 0.05USD 3,077 SEI Investments Co 184 0.03USD 17,347 Synchrony Financial 502 0.08USD 5,783 T Rowe Price Group Inc^ 689 0.11USD 6,431 TD Ameritrade Holding Corp^ 367 0.06USD 43,725 Visa Inc 5,979 0.98
Electrical components & equipment USD 1,000 Acuity Brands Inc^ 139 0.02USD 5,476 AMETEK Inc 426 0.07USD 15,021 Emerson Electric Co 1,086 0.18
Electricity USD 15,894 AES Corp^ 212 0.04USD 5,789 Alliant Energy Corp 249 0.04USD 5,973 Ameren Corp 371 0.06USD 11,533 American Electric Power Co Inc 820 0.14USD 9,329 CenterPoint Energy Inc 266 0.04USD 6,879 CMS Energy Corp^ 333 0.05USD 7,489 Consolidated Edison Inc 591 0.10USD 16,187 Dominion Energy Inc^ 1,161 0.19USD 4,177 DTE Energy Co 453 0.07USD 16,638 Duke Energy Corp 1,358 0.22USD 7,962 Edison International 531 0.09USD 4,182 Entergy Corp 340 0.06USD 6,522 Evergy Inc 366 0.06USD 7,649 Eversource Energy 464 0.08USD 22,849 Exelon Corp 971 0.16USD 11,101 FirstEnergy Corp 393 0.07USD 11,522 NextEra Energy Inc 1,930 0.32USD 4,558 OGE Energy Corp 165 0.03USD 12,135 PG&E Corp 523 0.09USD 2,520 Pinnacle West Capital Corp^ 203 0.03USD 16,798 PPL Corp 483 0.08USD 12,127 Public Service Enterprise Group
Inc 625 0.10USD 3,224 Scana Corp^ 129 0.02USD 5,766 Sempra Energy 667 0.11USD 24,866 Southern Co^ 1,208 0.20USD 8,552 Vistra Energy Corp^ 193 0.03USD 7,701 WEC Energy Group Inc 511 0.08USD 12,118 Xcel Energy Inc 568 0.09
Electronics USD 7,681 Agilent Technologies Inc 507 0.08USD 7,690 Amphenol Corp 719 0.12USD 2,315 Arrow Electronics Inc 176 0.03
Ccy Holding InvestmentFair value
$'000
% of netassetvalue
United States (31 July 2017: 94.38%) (cont) Electronics (cont)
USD 2,999 Avnet Inc 132 0.02USD 21,766 Corning Inc 722 0.12USD 3,179 FLIR Systems Inc 186 0.03USD 8,055 Fortive Corp^ 661 0.11USD 18,057 Honeywell International Inc 2,883 0.48USD 4,506 Keysight Technologies Inc 261 0.04USD 648 Mettler-Toledo International Inc 384 0.06USD 5,538 Trimble Inc^ 195 0.03USD 1,829 Waters Corp 361 0.06
Engineering & construction USD 3,171 Fluor Corp^ 162 0.03USD 2,807 Jacobs Engineering Group Inc 190 0.03
Entertainment USD 3,435 Live Nation Entertainment Inc^ 169 0.03USD 938 Vail Resorts Inc 260 0.04
Environmental control USD 5,451 Republic Services Inc 395 0.06USD 1,852 Stericycle Inc^ 130 0.02USD 10,534 Waste Management Inc 948 0.16
Food USD 4,608 Campbell Soup Co 188 0.03USD 9,690 Conagra Brands Inc 356 0.06USD 13,980 General Mills Inc 644 0.11USD 3,335 Hershey Co 328 0.05USD 6,655 Hormel Foods Corp 239 0.04USD 1,642 Ingredion Inc 166 0.03USD 2,731 JM Smucker Co 303 0.05USD 6,085 Kellogg Co 432 0.07USD 14,549 Kraft Heinz Co 877 0.14USD 22,533 Kroger Co 653 0.11USD 3,025 McCormick & Co Inc^ 356 0.06USD 35,815 Mondelez International Inc 1,554 0.26USD 12,240 Sysco Corp 823 0.13USD 6,990 Tyson Foods Inc 403 0.07
Food Service USD 6,176 Aramark 248 0.04
Forest products & paper USD 9,164 International Paper Co 492 0.08
Gas USD 2,625 Atmos Energy Corp 241 0.04USD 8,332 NiSource Inc^ 218 0.04USD 3,922 UGI Corp 209 0.03
Hand & machine tools USD 1,382 Snap-on Inc 234 0.04USD 3,690 Stanley Black & Decker Inc 552 0.09
Healthcare products USD 42,665 Abbott Laboratories 2,796 0.46USD 1,010 Abiomed Inc 358 0.06USD 1,829 Align Technology Inc 652 0.11USD 12,321 Baxter International Inc 893 0.15

iSHARES VII PLC
Schedule of Investments (continued) iSHARES MSCI USA UCITS ETF (continued) As at 31 July 2018
i S H A R E S V I I P L C A N N U A L R E P O R T [ 2 4 7 ]
Ccy Holding Investment Fair value
$'000
% of netassetvalue
Equities (31 July 2017: 99.45%) (cont) United States (31 July 2017: 94.38%) (cont) Healthcare products (cont)
USD 6,349 Becton Dickinson and Co 1,589 0.26USD 32,529 Boston Scientific Corp 1,093 0.18USD 1,177 Cooper Cos Inc 307 0.05USD 15,341 Danaher Corp 1,574 0.26USD 5,515 Dentsply Sirona Inc^ 265 0.04USD 4,920 Edwards Lifesciences Corp 701 0.11USD 3,754 Henry Schein Inc^ 298 0.05USD 6,656 Hologic Inc 286 0.05USD 2,040 IDEXX Laboratories Inc 500 0.08USD 2,821 Intuitive Surgical Inc 1,433 0.23USD 3,308 ResMed Inc 350 0.06USD 8,068 Stryker Corp 1,317 0.22USD 1,026 Teleflex Inc 280 0.05USD 9,610 Thermo Fisher Scientific Inc 2,254 0.37USD 2,355 Varian Medical Systems Inc 272 0.04USD 4,849 Zimmer Biomet Holdings Inc 609 0.10
Healthcare services USD 8,142 Aetna Inc 1,534 0.25USD 5,998 Anthem Inc 1,518 0.25USD 4,866 Centene Corp 634 0.11USD 5,968 Cigna Corp 1,071 0.18USD 3,816 DaVita Inc 268 0.04USD 7,030 HCA Healthcare Inc 873 0.14USD 3,466 Humana Inc 1,089 0.18USD 4,034 IQVIA Holdings Inc 492 0.08USD 2,322 Laboratory Corp of America
Holdings 407 0.07USD 3,331 Quest Diagnostics Inc 359 0.06USD 23,458 UnitedHealth Group Inc 5,940 0.98USD 2,128 Universal Health Services Inc 260 0.04
Home builders USD 8,027 DR Horton Inc 351 0.06USD 6,794 Lennar Corp 355 0.06USD 84 NVR Inc 232 0.04USD 7,340 PulteGroup Inc^ 209 0.03USD 3,746 Toll Brothers Inc^ 132 0.02
Home furnishings USD 3,020 Leggett & Platt Inc 131 0.02USD 1,752 Whirlpool Corp^ 230 0.04
Hotels USD 6,832 Hilton Worldwide Holdings Inc 537 0.09USD 9,270 Las Vegas Sands Corp 667 0.11USD 7,392 Marriott International Inc 945 0.15USD 12,926 MGM Resorts International 405 0.07USD 2,338 Wynn Resorts Ltd 390 0.06
Household goods & home construction USD 2,128 Avery Dennison Corp 244 0.04USD 5,919 Church & Dwight Co Inc 331 0.05
Ccy Holding InvestmentFair value
$'000
% of netassetvalue
United States (31 July 2017: 94.38%) (cont) Household goods & home construction (cont)
USD 2,947 Clorox Co^ 398 0.07USD 8,542 Kimberly-Clark Corp 973 0.16
Household products USD 11,314 Newell Brands Inc 296 0.05
Insurance USD 19,356 Aflac Inc^ 901 0.15USD 364 Alleghany Corp^ 229 0.04USD 8,635 Allstate Corp 821 0.14USD 1,749 American Financial Group Inc 197 0.03USD 21,505 American International Group Inc 1,187 0.20USD 4,040 Arthur J Gallagher & Co 288 0.05USD 1,477 Assurant Inc 163 0.03USD 30,742 Berkshire Hathaway Inc 6,083 1.00USD 3,075 Brighthouse Financial Inc^ 134 0.02USD 3,497 Cincinnati Financial Corp 265 0.04USD 6,539 Fidelity National Financial Inc 265 0.04USD 8,552 Hartford Financial Services
Group Inc 451 0.07USD 5,408 Lincoln National Corp 368 0.06USD 6,565 Loews Corp 333 0.05USD 366 Markel Corp 428 0.07USD 12,102 Marsh & McLennan Cos Inc 1,009 0.17USD 21,680 MetLife Inc 992 0.16USD 6,548 Principal Financial Group Inc 380 0.06USD 13,666 Progressive Corp 820 0.14USD 10,122 Prudential Financial Inc 1,021 0.17USD 1,558 Reinsurance Group of America
Inc 221 0.04USD 2,628 Torchmark Corp 232 0.04USD 6,733 Travelers Cos Inc 876 0.14USD 5,767 Unum Group 229 0.04USD 5,040 Voya Financial Inc 255 0.04USD 2,472 WR Berkley Corp 187 0.03
Internet USD 7,212 Alphabet Inc 8,851 1.46USD 7,590 Alphabet Inc Class 'C' 9,239 1.52USD 9,942 Amazon.com Inc 17,671 2.91USD 1,172 Booking Holdings Inc 2,378 0.39USD 4,098 CDW Corp 345 0.06USD 24,219 eBay Inc 810 0.13USD 2,841 Expedia Group Inc 380 0.06USD 1,674 F5 Networks Inc 287 0.05USD 57,888 Facebook Inc 9,990 1.64USD 3,584 GoDaddy Inc 264 0.04USD 1,758 IAC/InterActiveCorp 259 0.04USD 1,005 MercadoLibre Inc 345 0.06USD 10,525 Netflix Inc 3,552 0.58USD 2,278 Palo Alto Networks Inc 452 0.07USD 14,300 Symantec Corp 289 0.05USD 2,679 TripAdvisor Inc^ 155 0.03

iSHARES VII PLC
Schedule of Investments (continued) iSHARES MSCI USA UCITS ETF (continued) As at 31 July 2018
[ 2 4 8 ] i S H A R E S V I I P L C A N N U A L R E P O R T
Ccy Holding Investment Fair value
$'000
% of netassetvalue
Equities (31 July 2017: 99.45%) (cont) United States (31 July 2017: 94.38%) (cont) Internet (cont)
USD 17,015 Twitter Inc 542 0.09USD 2,310 VeriSign Inc 335 0.06USD 2,587 Zillow Group Inc^ 144 0.02
Iron & steel USD 7,728 Nucor Corp 517 0.09USD 5,697 Steel Dynamics Inc 268 0.04
Leisure time USD 4,198 Harley-Davidson Inc 180 0.03USD 1,395 Polaris Industries Inc^ 147 0.02
Machinery - diversified USD 1,495 AGCO Corp^ 94 0.02USD 4,119 Cognex Corp 217 0.04USD 3,855 Cummins Inc 551 0.09USD 7,375 Deere & Co^ 1,068 0.18USD 3,131 Flowserve Corp 139 0.02USD 1,796 IDEX Corp 276 0.04USD 1,339 Middleby Corp 137 0.02USD 3,120 Rockwell Automation Inc 585 0.10USD 2,481 Roper Technologies Inc 749 0.12USD 2,130 Wabtec Corp^ 235 0.04USD 4,358 Xylem Inc 334 0.05
Machinery, construction & mining USD 14,659 Caterpillar Inc 2,108 0.35
Marine transportation USD 1,089 Huntington Ingalls Industries Inc 254 0.04
Media USD 8,723 CBS Corp^ 459 0.08USD 3,996 Charter Communications Inc 1,217 0.20USD 112,433 Comcast Corp 4,023 0.66USD 3,149 Discovery Inc 84 0.01USD 7,260 Discovery Inc Class 'C' 178 0.03USD 5,157 DISH Network Corp 163 0.03USD 2,476 Liberty Broadband Corp^ 197 0.03USD 4,797 Liberty Media Corp-Liberty
Formula One 169 0.03USD 2,069 Liberty Media Corp-Liberty
SiriusXM 97 0.02USD 4,554 Liberty Media Corp-Liberty
SiriusXM Class 'C' 215 0.03USD 8,065 News Corp 122 0.02USD 39,742 Sirius XM Holdings Inc 279 0.05USD 26,062 Twenty-First Century Fox Inc 1,173 0.19USD 10,032 Twenty-First Century Fox Inc
Class 'B' 446 0.07USD 7,847 Viacom Inc 228 0.04USD 36,079 Walt Disney Co 4,097 0.67
Mining USD 32,334 Freeport-McMoRan Inc 533 0.09USD 12,916 Newmont Mining Corp 474 0.08
Ccy Holding InvestmentFair value
$'000
% of netassetvalue
United States (31 July 2017: 94.38%) (cont) Miscellaneous manufacturers
USD 14,296 3M Co 3,035 0.50USD 3,408 AO Smith Corp^ 203 0.03USD 3,770 Dover Corp 313 0.05USD 210,201 General Electric Co 2,865 0.47USD 7,241 Illinois Tool Works Inc 1,038 0.17USD 3,154 Parker-Hannifin Corp 533 0.09USD 6,164 Textron Inc 421 0.07
Office & business equipment USD 5,127 Xerox Corp 133 0.02
Oil & gas USD 12,842 Anadarko Petroleum Corp 939 0.15USD 3,610 Andeavor 542 0.09USD 5,436 Antero Resources Corp^ 112 0.02USD 8,854 Apache Corp^ 407 0.07USD 12,249 Cabot Oil & Gas Corp 288 0.05USD 46,379 Chevron Corp 5,856 0.96USD 2,244 Cimarex Energy Co 221 0.04USD 4,831 Concho Resources Inc 705 0.12USD 28,203 ConocoPhillips 2,035 0.33USD 2,329 Continental Resources Inc 149 0.02USD 13,454 Devon Energy Corp 605 0.10USD 2,215 Diamondback Energy Inc 292 0.05USD 14,238 EOG Resources Inc 1,836 0.30USD 5,999 EQT Corp 298 0.05USD 102,745 Exxon Mobil Corp 8,375 1.38USD 2,462 Helmerich & Payne Inc^ 151 0.02USD 6,987 Hess Corp 458 0.08USD 4,098 HollyFrontier Corp 306 0.05USD 19,724 Marathon Oil Corp 417 0.07USD 12,132 Marathon Petroleum Corp 981 0.16USD 4,524 Newfield Exploration Co^ 130 0.02USD 11,184 Noble Energy Inc^ 404 0.07USD 18,185 Occidental Petroleum Corp 1,526 0.25USD 5,096 Parsley Energy Inc 160 0.03USD 10,824 Phillips 66 1,335 0.22USD 4,252 Pioneer Natural Resources Co 805 0.13USD 10,843 Valero Energy Corp 1,283 0.21
Oil & gas services USD 9,487 Baker Hughes a GE Co 328 0.05USD 20,680 Halliburton Co 877 0.15USD 9,227 National Oilwell Varco Inc 449 0.07
Packaging & containers USD 7,626 Ball Corp 297 0.05USD 3,130 Crown Holdings Inc^ 142 0.02USD 2,158 Packaging Corp of America 244 0.04USD 4,421 Sealed Air Corp 195 0.03USD 6,022 WestRock Co 349 0.06
Pharmaceuticals USD 36,468 AbbVie Inc 3,363 0.55USD 3,820 AmerisourceBergen Corp 313 0.05

iSHARES VII PLC
Schedule of Investments (continued) iSHARES MSCI USA UCITS ETF (continued) As at 31 July 2018
i S H A R E S V I I P L C A N N U A L R E P O R T [ 2 4 9 ]
Ccy Holding Investment Fair value
$'000
% of netassetvalue
Equities (31 July 2017: 99.45%) (cont) United States (31 July 2017: 94.38%) (cont) Pharmaceuticals (cont)
USD 39,619 Bristol-Myers Squibb Co 2,328 0.38USD 7,520 Cardinal Health Inc 376 0.06USD 24,909 CVS Health Corp 1,616 0.27USD 23,588 Eli Lilly & Co 2,331 0.38USD 13,554 Express Scripts Holding Co 1,077 0.18USD 64,870 Johnson & Johnson 8,596 1.42USD 4,940 McKesson Corp 620 0.10USD 64,842 Merck & Co Inc 4,271 0.70USD 3,867 Nektar Therapeutics 203 0.03USD 144,501 Pfizer Inc 5,770 0.95USD 11,542 Zoetis Inc 998 0.17
Pipelines USD 4,572 Cheniere Energy Inc 290 0.05USD 47,135 Kinder Morgan Inc^ 838 0.14USD 9,859 ONEOK Inc^ 695 0.11USD 3,240 Plains GP Holdings LP 79 0.01USD 5,457 Targa Resources Corp^ 279 0.05USD 19,914 Williams Cos Inc 592 0.10
Real estate investment & services USD 8,246 CBRE Group Inc 411 0.07USD 984 Jones Lang LaSalle Inc^ 168 0.03
Real estate investment trusts USD 9,220 AGNC Investment Corp 179 0.03USD 2,663 Alexandria Real Estate Equities
Inc 339 0.06USD 10,704 American Tower Corp^ 1,587 0.26USD 26,146 Annaly Capital Management Inc 280 0.05USD 3,358 AvalonBay Communities Inc 594 0.10USD 3,726 Boston Properties Inc^ 468 0.08USD 2,455 Camden Property Trust 227 0.04USD 9,738 Crown Castle International Corp 1,079 0.18USD 4,871 Digital Realty Trust Inc 591 0.10USD 8,248 Duke Realty Corp 240 0.04USD 1,853 Equinix Inc 814 0.13USD 8,979 Equity Residential 587 0.10USD 1,562 Essex Property Trust Inc 376 0.06USD 2,829 Extra Space Storage Inc 266 0.04USD 1,586 Federal Realty Investment Trust 199 0.03USD 17,764 GGP Inc 379 0.06USD 10,626 HCP Inc 275 0.05USD 17,180 Host Hotels & Resorts Inc^ 360 0.06USD 7,390 Invitation Homes Inc 171 0.03USD 7,197 Iron Mountain Inc^ 253 0.04USD 10,343 Kimco Realty Corp 173 0.03USD 3,543 Liberty Property Trust 152 0.02USD 3,088 Macerich Co 182 0.03USD 2,640 Mid-America Apartment
Communities Inc 266 0.04
Ccy Holding InvestmentFair value
$'000
% of netassetvalue
United States (31 July 2017: 94.38%) (cont) Real estate investment trusts (cont)
USD 3,424 National Retail Properties Inc^ 153 0.02USD 12,758 Prologis Inc 837 0.14USD 3,728 Public Storage 812 0.13USD 6,484 Realty Income Corp^ 362 0.06USD 3,588 Regency Centers Corp 228 0.04USD 2,879 SBA Communications Corp 456 0.07USD 7,563 Simon Property Group Inc 1,333 0.22USD 2,280 SL Green Realty Corp 235 0.04USD 6,278 UDR Inc 241 0.04USD 8,867 Ventas Inc 500 0.08USD 22,360 VEREIT Inc 171 0.03USD 4,238 Vornado Realty Trust 305 0.05USD 8,584 Welltower Inc 537 0.09USD 18,018 Weyerhaeuser Co^ 616 0.10
Retail USD 1,734 Advance Auto Parts Inc^ 245 0.04USD 706 AutoZone Inc 498 0.08USD 7,026 Best Buy Co Inc 527 0.09USD 4,464 CarMax Inc^ 333 0.06USD 585 Chipotle Mexican Grill Inc 254 0.04USD 5,019 Copart Inc^ 288 0.05USD 10,700 Costco Wholesale Corp 2,340 0.39USD 2,767 Darden Restaurants Inc 296 0.05USD 6,770 Dollar General Corp^ 664 0.11USD 5,634 Dollar Tree Inc 514 0.08USD 1,151 Domino's Pizza Inc^ 302 0.05USD 6,033 Gap Inc 182 0.03USD 3,347 Genuine Parts Co 326 0.05USD 28,354 Home Depot Inc 5,600 0.92USD 4,674 Kohl's Corp 345 0.06USD 5,726 L Brands Inc^ 181 0.03USD 19,917 Lowe's Cos Inc 1,979 0.33USD 2,582 Lululemon Athletica Inc 310 0.05USD 7,082 Macy's Inc 281 0.05USD 19,046 McDonald's Corp 3,001 0.49USD 3,131 Nordstrom Inc^ 164 0.03USD 2,009 O'Reilly Automotive Inc 615 0.10USD 10,897 Qurate Retail Inc 232 0.04USD 9,108 Ross Stores Inc 796 0.13USD 34,082 Starbucks Corp 1,786 0.29USD 6,813 Tapestry Inc 321 0.05USD 12,676 Target Corp 1,023 0.17USD 2,920 Tiffany & Co 402 0.07USD 15,295 TJX Cos Inc 1,488 0.24USD 2,971 Tractor Supply Co^ 232 0.04USD 1,359 Ulta Salon Cosmetics &
Fragrance Inc 332 0.05USD 20,113 Walgreens Boots Alliance Inc 1,360 0.22USD 35,559 Walmart Inc 3,173 0.52USD 7,888 Yum! Brands Inc 625 0.10

iSHARES VII PLC
Schedule of Investments (continued) iSHARES MSCI USA UCITS ETF (continued) As at 31 July 2018
[ 2 5 0 ] i S H A R E S V I I P L C A N N U A L R E P O R T
Ccy Holding Investment Fair value
$'000
% of netassetvalue
Equities (31 July 2017: 99.45%) (cont) United States (31 July 2017: 94.38%) (cont) Savings & loans
USD 10,957 New York Community Bancorp Inc 118 0.02
USD 7,647 People's United Financial Inc^ 139 0.02Semiconductors
USD 22,827 Advanced Micro Devices Inc^ 419 0.07USD 9,144 Analog Devices Inc 879 0.15USD 25,828 Applied Materials Inc 1,256 0.21USD 9,944 Broadcom Inc 2,205 0.36USD 112,911 Intel Corp 5,431 0.89USD 898 IPG Photonics Corp 147 0.02USD 3,924 KLA-Tencor Corp 461 0.08USD 3,883 Lam Research Corp 740 0.12USD 6,535 Maxim Integrated Products Inc 400 0.07USD 5,372 Microchip Technology Inc^ 502 0.08USD 27,550 Micron Technology Inc 1,454 0.24USD 14,001 NVIDIA Corp 3,428 0.56USD 10,276 ON Semiconductor Corp 227 0.04USD 3,181 Qorvo Inc 260 0.04USD 35,328 Qualcomm Inc 2,264 0.37USD 4,372 Skyworks Solutions Inc 414 0.07USD 23,869 Texas Instruments Inc 2,657 0.44USD 6,011 Xilinx Inc 433 0.07
Software USD 17,785 Activision Blizzard Inc 1,306 0.22USD 11,989 Adobe Systems Inc 2,933 0.48USD 4,042 Akamai Technologies Inc 304 0.05USD 2,119 Ansys Inc 358 0.06USD 5,289 Autodesk Inc^ 679 0.11USD 2,714 Broadridge Financial Solutions
Inc 307 0.05USD 7,311 CA Inc 323 0.05USD 6,929 Cadence Design Systems Inc 305 0.05USD 3,005 CDK Global Inc 188 0.03USD 7,248 Cerner Corp 450 0.07USD 3,526 Citrix Systems Inc 388 0.06USD 7,445 Electronic Arts Inc 959 0.16USD 7,765 Fidelity National Information
Services Inc 801 0.13USD 12,205 First Data Corp 284 0.05USD 10,178 Fiserv Inc 768 0.13USD 5,892 Intuit Inc 1,203 0.20USD 1,825 Jack Henry & Associates Inc 246 0.04USD 176,733 Microsoft Corp 18,748 3.09USD 2,206 MSCI Inc 367 0.06USD 74,780 Oracle Corp 3,565 0.59USD 8,270 Paychex Inc 571 0.09USD 4,129 Red Hat Inc^ 583 0.10USD 16,445 Salesforce.com Inc 2,255 0.37USD 4,137 ServiceNow Inc 728 0.12
Ccy Holding InvestmentFair value
$'000
% of netassetvalue
United States (31 July 2017: 94.38%) (cont) Software (cont)
USD 3,366 Splunk Inc 323 0.05USD 5,240 SS&C Technologies Holdings Inc 278 0.05USD 3,428 Synopsys Inc 307 0.05USD 2,733 Take-Two Interactive Software
Inc 309 0.05USD 2,512 Veeva Systems Inc 190 0.03USD 1,844 VMware Inc 267 0.04USD 3,112 Workday Inc 386 0.06
Telecommunications USD 1,312 Arista Networks Inc 335 0.06USD 175,402 AT&T Inc 5,608 0.92USD 22,791 CenturyLink Inc^ 428 0.07USD 116,636 Cisco Systems Inc 4,932 0.81USD 4,580 CommScope Holding Co Inc 147 0.02USD 8,496 Juniper Networks Inc 224 0.04USD 4,038 Motorola Solutions Inc 490 0.08USD 21,312 Sprint Corp 116 0.02USD 8,209 T-Mobile US Inc 493 0.08USD 100,103 Verizon Communications Inc 5,169 0.85USD 4,975 Zayo Group Holdings Inc 184 0.03
Textile USD 1,471 Mohawk Industries Inc^ 277 0.05
Toys USD 2,673 Hasbro Inc^ 266 0.04USD 7,775 Mattel Inc^ 124 0.02
Transportation USD 3,430 CH Robinson Worldwide Inc 316 0.05USD 20,240 CSX Corp 1,431 0.23USD 4,466 Expeditors International of
Washington Inc 340 0.06USD 6,105 FedEx Corp 1,501 0.25USD 2,118 JB Hunt Transport Services Inc 254 0.04USD 2,472 Kansas City Southern^ 288 0.05USD 3,168 Knight-Swift Transportation
Holdings Inc^ 103 0.02USD 6,848 Norfolk Southern Corp 1,157 0.19USD 1,470 Old Dominion Freight Line Inc 216 0.03USD 18,900 Union Pacific Corp 2,833 0.47USD 16,456 United Parcel Service Inc 1,973 0.32USD 2,882 XPO Logistics Inc 287 0.05
Water USD 4,193 American Water Works Co Inc^ 370 0.06
Total United States 580,644 95.52Total equities 605,670 99.64

iSHARES VII PLC
Schedule of Investments (continued) iSHARES MSCI USA UCITS ETF (continued) As at 31 July 2018
i S H A R E S V I I P L C A N N U A L R E P O R T [ 2 5 1 ]
CcyNo. of
contracts
Underlying exposure
$'000 Fair value
$'000
% of netassetsvalue
Financial derivative instruments (31 July 2017: 0.00%) Futures contracts (31 July 2017: 0.00%)
USD 15 S&P 500 E Mini Futures September 2018 2,073 40 0.01
Total unrealised gains on futures contracts 40 0.01
Total financial derivative instruments 40 0.01
Fair value$'000
% of net asset value
Total value of investments 605,710 99.65 Cash† 8,538 1.40 Other net liabilities (6,359) (1.05) Net asset value attributable to redeemable participating shareholders at the end of the financial year 607,889 100.00
† Cash holdings of $8,484,146 are held with State Street Bank and Trust Company. $53,859 is held as security for futures contracts with Credit Suisse AG. * Investment in related party. ^ These securities are partially or fully transferred as securities lent.
Equities are primarily classified by country of incorporation of the entity in which the Fund holds shares. Underlying exposure has been calculated according to the guidelines issued by the ESMA and represents the market value of an equivalent position in the assets underlying each financial derivative instrument.
Analysis of total current assets gross of all liabilities
Fair value$'000
% of totalcurrentassets
Transferable securities admitted to an official stock exchange listing 605,670 98.53Exchange traded financial derivative instruments 40 0.01Other assets 8,955 1.46Total current assets 614,665 100.00

iSHARES VII PLC
Schedule of Investments (continued) iSHARES NASDAQ 100 UCITS ETF As at 31 July 2018
[ 2 5 2 ] i S H A R E S V I I P L C A N N U A L R E P O R T
Ccy Holding Investment Fair value
$'000
% of netassetvalue
Transferable Securities Admitted to an Official Stock Exchange Listing or traded on a Regulated Market (31 July 2017: 99.78%)
Equities (31 July 2017: 99.78%) Bermuda (31 July 2017: 0.18%) Cayman Islands (31 July 2017: 2.28) Internet
USD 79,834 Baidu Inc 19,733 0.83USD 132,303 Ctrip.com International Ltd^ 5,444 0.23USD 262,370 JD.com Inc^ 9,409 0.40
Software USD 21,525 NetEase Inc 5,554 0.23
Total Cayman Islands 40,140 1.69
Ireland (31 July 2017: 0.14%) Computers
USD 82,485 Seagate Technology Plc 4,340 0.18Total Ireland 4,340 0.18
Israel (31 July 2017: 0.26%) Computers
USD 45,758 Check Point Software Technologies Ltd 5,156 0.22Total Israel 5,156 0.22
Jersey (31 July 2017: 0.20%) Biotechnology
USD 19,416 Shire Plc 3,313 0.14Total Jersey 3,313 0.14
Netherlands (31 July 2017: 0.30%) Pharmaceuticals
USD 145,762 Mylan NV 5,438 0.23Semiconductors
USD 21,182 ASML Holding NV^ 4,533 0.19Total Netherlands 9,971 0.42
Singapore (31 July 2016: 1.47%) United Kingdom (31 July 2017: 0.69%) Media
USD 60,457 Liberty Global Plc 1,707 0.07USD 161,896 Liberty Global Plc Class 'C' 4,394 0.19
Telecommunications USD 137,983 Vodafone Group Plc^ 3,387 0.14
Total United Kingdom 9,488 0.40
United States (31 July 2017: 94.26%) Airlines
USD 133,123 American Airlines Group Inc^ 5,264 0.22
Ccy Holding InvestmentFair value
$'000
% of netassetvalue
United States (31 July 2017: 94.26%) (cont) Auto manufacturers
USD 100,042 Paccar Inc 6,575 0.28USD 48,287 Tesla Inc^ 14,396 0.60
Beverages USD 160,008 Monster Beverage Corp 9,604 0.41USD 403,201 PepsiCo Inc 46,368 1.95
Biotechnology USD 63,271 Alexion Pharmaceuticals Inc 8,413 0.35USD 188,171 Amgen Inc 36,985 1.56USD 60,005 Biogen Inc 20,064 0.85USD 49,967 BioMarin Pharmaceutical Inc 5,025 0.21USD 206,118 Celgene Corp 18,569 0.78USD 369,763 Gilead Sciences Inc 28,779 1.21USD 41,803 Illumina Inc^ 13,559 0.57USD 60,272 Incyte Corp 4,010 0.17USD 30,131 Regeneron Pharmaceuticals Inc 11,088 0.47USD 72,468 Vertex Pharmaceuticals Inc 12,686 0.54
Commercial services USD 125,275 Automatic Data Processing Inc 16,911 0.71USD 30,350 Cintas Corp^ 6,206 0.26USD 337,664 PayPal Holdings Inc 27,736 1.17USD 47,284 Verisk Analytics Inc^ 5,230 0.22
Computers USD 1,397,758 Apple Inc 265,979 11.21USD 166,614 Cognizant Technology Solutions
Corp 13,579 0.57USD 85,096 Western Digital Corp 5,970 0.25
Distribution & wholesale USD 82,191 Fastenal Co^ 4,679 0.20
Food USD 346,700 Kraft Heinz Co^ 20,889 0.88USD 419,467 Mondelez International Inc 18,196 0.77
Healthcare products USD 22,794 Align Technology Inc 8,129 0.34USD 65,864 Dentsply Sirona Inc^ 3,169 0.13USD 44,231 Henry Schein Inc^ 3,512 0.15USD 78,418 Hologic Inc 3,365 0.14USD 24,703 IDEXX Laboratories Inc 6,051 0.26USD 32,220 Intuitive Surgical Inc 16,374 0.69
Hotels USD 100,487 Marriott International Inc 12,846 0.54USD 31,298 Wynn Resorts Ltd^ 5,220 0.22
Internet USD 84,932 Alphabet Inc 104,230 4.39USD 99,233 Alphabet Inc Class 'C' 120,792 5.09USD 137,989 Amazon.com Inc 245,267 10.33USD 13,700 Booking Holdings Inc 27,793 1.17USD 282,654 eBay Inc 9,455 0.40USD 38,928 Expedia Group Inc^ 5,210 0.22USD 682,110 Facebook Inc 117,719 4.96

iSHARES VII PLC
Schedule of Investments (continued) iSHARES NASDAQ 100 UCITS ETF (continued) As at 31 July 2018
i S H A R E S V I I P L C A N N U A L R E P O R T [ 2 5 3 ]
Ccy Holding Investment Fair value
$'000
% of netassetvalue
Equities (31 July 2017: 99.78%) (cont) United States (31 July 2017: 94.26%) (cont) Internet (cont)
USD 12,706 MercadoLibre Inc^ 4,357 0.18USD 123,618 Netflix Inc 41,715 1.76USD 176,731 Symantec Corp 3,574 0.15
Media USD 67,529 Charter Communications Inc^ 20,568 0.87USD 1,305,912 Comcast Corp 46,725 1.97USD 1,271,537 Sirius XM Holdings Inc^ 8,926 0.37USD 299,734 Twenty-First Century Fox Inc 13,488 0.57USD 227,072 Twenty-First Century Fox Inc
Class 'B' 10,087 0.42Pharmaceuticals
USD 159,739 Express Scripts Holding Co 12,693 0.53Retail
USD 124,792 Costco Wholesale Corp 27,293 1.15USD 67,617 Dollar Tree Inc 6,172 0.26USD 23,156 O'Reilly Automotive Inc 7,086 0.30USD 127,215 Qurate Retail Inc 2,708 0.11USD 107,671 Ross Stores Inc 9,414 0.40USD 392,436 Starbucks Corp 20,560 0.87USD 17,494 Ulta Salon Cosmetics &
Fragrance Inc^ 4,275 0.18USD 282,002 Walgreens Boots Alliance Inc 19,069 0.80
Semiconductors USD 105,472 Analog Devices Inc 10,140 0.43USD 286,662 Applied Materials Inc 13,940 0.59USD 116,809 Broadcom Inc 25,905 1.09USD 1,325,192 Intel Corp 63,742 2.68USD 43,907 KLA-Tencor Corp 5,156 0.22USD 46,615 Lam Research Corp 8,887 0.37USD 80,402 Maxim Integrated Products Inc 4,916 0.21USD 66,836 Microchip Technology Inc^ 6,244 0.26USD 329,801 Micron Technology Inc^ 17,410 0.73USD 172,613 NVIDIA Corp 42,266 1.78USD 421,624 Qualcomm Inc 27,022 1.14USD 51,774 Skyworks Solutions Inc 4,897 0.21USD 278,384 Texas Instruments Inc 30,990 1.31USD 71,673 Xilinx Inc 5,165 0.22
Software USD 216,463 Activision Blizzard Inc 15,893 0.67USD 140,043 Adobe Systems Inc 34,266 1.44USD 62,209 Autodesk Inc^ 7,990 0.34USD 118,068 CA Inc 5,220 0.22USD 81,040 Cadence Design Systems Inc 3,573 0.15USD 94,265 Cerner Corp 5,852 0.25USD 38,059 Citrix Systems Inc 4,185 0.18USD 87,257 Electronic Arts Inc 11,234 0.47USD 116,428 Fiserv Inc 8,788 0.37USD 72,968 Intuit Inc 14,903 0.63
Ccy Holding InvestmentFair value
$'000
% of netassetvalue
United States (31 July 2017: 94.26%) (cont) Software (cont)
USD 2,184,932 Microsoft Corp 231,778 9.76USD 102,164 Paychex Inc 7,051 0.30USD 41,766 Synopsys Inc 3,735 0.16USD 32,704 Take-Two Interactive Software
Inc 3,696 0.16USD 41,225 Workday Inc^ 5,113 0.21
Telecommunications USD 1,337,388 Cisco Systems Inc 56,558 2.38USD 240,817 T-Mobile US Inc 14,449 0.61
Toys USD 35,190 Hasbro Inc^ 3,505 0.15
Transportation USD 248,929 CSX Corp 17,594 0.74USD 30,757 JB Hunt Transport Services Inc 3,687 0.16
Total United States 2,300,352 96.92Total equities 2,372,760 99.97
CcyNo. of
contracts
Underlying exposure
$'000 Fair value
$'000
% of netassetsvalue
Financial derivative instruments (31 July 2017: 0.01%) Futures contracts (31 July 2017: 0.01%)
USD 1 NASDAQ 100 E Mini Index Futures September 2018 142 2 0.00Total unrealised gains on futures contracts 2 0.00Total financial derivative instruments 2 0.00
Fair value
$'000
% of netassetvalue
Total value of investments 2,372,762 99.97
Cash† 837 0.04
Other net liabilities (208) (0.01)
Net asset value attributable to redeemable participating shareholders at the end of the financial year 2,373,391 100.00
† Cash holdings of $833,998 are held with State Street Bank and Trust Company. $3,039 is held as security for futures contracts with Credit Suisse AG. ^ These securities are partially or fully transferred as securities lent.
Equities are primarily classified by country of incorporation of the entity in which the Fund holds shares.
Underlying exposure has been calculated according to the guidelines issued by the ESMA and represents the market value of an equivalent position in the assets underlying each financial derivative instrument.

iSHARES VII PLC
Schedule of Investments (continued) iSHARES NASDAQ 100 UCITS ETF (continued) As at 31 July 2018
[ 2 5 4 ] i S H A R E S V I I P L C A N N U A L R E P O R T
Analysis of total current assets gross of all liabilities
Fair value$'000
% of totalcurrentassets
Transferable securities admitted to an official stock exchange listing 2,372,760 98.70Exchange traded financial derivative instruments 2 0.00Other assets 31,252 1.30Total current assets 2,404,014 100.00

iSHARES VII PLC
Schedule of Investments (continued) iSHARES NIKKEI 225 UCITS ETF As at 31 July 2018
i S H A R E S V I I P L C A N N U A L R E P O R T [ 2 5 5 ]
Ccy Holding Investment Fair value
¥'000
% of netassetvalue
Transferable Securities Admitted to an Official Stock Exchange Listing or traded on a Regulated Market (31 July 2017: 99.91%)
Equities (31 July 2017: 99.91%) Japan (31 July 2017: 99.91%) Advertising
JPY 48,693 Dentsu Inc^ 228,370 0.77Aerospace & defence
JPY 4,409 IHI Corp 17,217 0.06JPY 4,409 Kawasaki Heavy Industries Ltd 14,418 0.05
Agriculture JPY 48,493 Japan Tobacco Inc 154,014 0.52
Airlines JPY 4,409 ANA Holdings Inc 18,077 0.06
Auto manufacturers JPY 47,193 Hino Motors Ltd 59,322 0.20JPY 96,689 Honda Motor Co Ltd 324,391 1.09JPY 24,200 Isuzu Motors Ltd 36,506 0.12JPY 8,400 Mazda Motor Corp 11,676 0.04JPY 5,309 Mitsubishi Motors Corp 4,513 0.02JPY 48,693 Nissan Motor Co Ltd^ 51,395 0.17JPY 48,193 Subaru Corp 156,820 0.53JPY 48,693 Suzuki Motor Corp^ 318,988 1.07JPY 48,093 Toyota Motor Corp 351,319 1.18
Auto parts & equipment JPY 48,693 Bridgestone Corp 213,957 0.72JPY 48,393 Denso Corp 266,355 0.89JPY 48,493 JTEKT Corp 78,171 0.26JPY 48,193 NGK Insulators Ltd 94,265 0.32JPY 47,993 Sumitomo Electric Industries Ltd 82,260 0.28JPY 24,200 Yokohama Rubber Co Ltd^ 57,693 0.19
Banks JPY 4,509 Aozora Bank Ltd^ 18,825 0.06JPY 50,293 Chiba Bank Ltd^ 40,033 0.13JPY 47,100 Concordia Financial Group Ltd 28,260 0.09JPY 47,093 Fukuoka Financial Group Inc 28,774 0.10JPY 46,193 Mitsubishi UFJ Financial Group
Inc 31,845 0.11JPY 46,193 Mizuho Financial Group Inc 8,989 0.03JPY 5,309 Resona Holdings Inc 3,376 0.01JPY 5,309 Shinsei Bank Ltd 9,339 0.03JPY 50,493 Shizuoka Bank Ltd^ 52,109 0.18JPY 4,709 Sumitomo Mitsui Financial Group
Inc 20,932 0.07JPY 4,509 Sumitomo Mitsui Trust Holdings
Inc 20,002 0.07Beverages
JPY 48,493 Asahi Group Holdings Ltd 262,929 0.88JPY 48,493 Kirin Holdings Co Ltd 138,544 0.46JPY 9,500 Sapporo Holdings Ltd^ 25,631 0.09JPY 47,293 Takara Holdings Inc^ 61,623 0.21
Ccy Holding InvestmentFair value
¥'000
% of netassetvalue
Japan (31 July 2017: 99.91%) (cont) Building materials and fixtures
JPY 9,818 AGC Inc 45,850 0.15JPY 48,393 Daikin Industries Ltd^ 644,595 2.17JPY 5,309 Nippon Sheet Glass Co Ltd 6,196 0.02JPY 47,093 Sumitomo Osaka Cement Co
Ltd^ 25,053 0.09JPY 4,509 Taiheiyo Cement Corp 15,849 0.05JPY 24,700 TOTO Ltd^ 128,687 0.43
Chemicals JPY 48,293 Asahi Kasei Corp 71,981 0.24JPY 9,618 Denka Co Ltd 36,885 0.12JPY 48,193 Kuraray Co Ltd 75,904 0.25JPY 23,648 Mitsubishi Chemical Holdings
Corp 23,050 0.08JPY 9,618 Mitsui Chemicals Inc 28,854 0.10JPY 48,493 Nippon Kayaku Co Ltd^ 61,635 0.21JPY 48,693 Nissan Chemical Corp^ 243,221 0.82JPY 48,700 Nitto Denko Corp 393,593 1.32JPY 48,693 Shin-Etsu Chemical Co Ltd 548,770 1.84JPY 4,400 Showa Denko KK 23,408 0.08JPY 49,093 Sumitomo Chemical Co Ltd 31,469 0.11JPY 9,618 Teijin Ltd^ 20,005 0.07JPY 48,493 Tokai Carbon Co Ltd 99,459 0.33JPY 9,566 Tokuyama Corp 33,672 0.11JPY 47,093 Toray Industries Inc 40,778 0.14JPY 23,946 Tosoh Corp 43,582 0.15JPY 5,209 Ube Industries Ltd 15,601 0.05
Commercial services JPY 25,446 Dai Nippon Printing Co Ltd^ 62,012 0.21JPY 145,200 Recruit Holdings Co Ltd 443,586 1.49JPY 48,693 Secom Co Ltd^ 415,351 1.39JPY 45,093 Toppan Printing Co Ltd^ 38,735 0.13
Computers JPY 45,093 Fujitsu Ltd 34,289 0.11JPY 5,309 NEC Corp 16,458 0.06JPY 241,000 NTT Data Corp^ 306,793 1.03JPY 48,693 TDK Corp^ 580,907 1.95
Cosmetics & personal care JPY 48,393 Kao Corp 393,774 1.32JPY 48,693 Shiseido Co Ltd^ 399,769 1.34
Distribution & wholesale JPY 48,693 ITOCHU Corp 96,412 0.32JPY 46,193 Marubeni Corp 39,301 0.13JPY 48,493 Mitsubishi Corp 151,153 0.51JPY 48,493 Mitsui & Co Ltd 90,609 0.31JPY 5,309 Sojitz Corp 2,150 0.01JPY 48,493 Sumitomo Corp 88,985 0.30JPY 48,693 Toyota Tsusho Corp^ 185,277 0.62

iSHARES VII PLC
Schedule of Investments (continued) iSHARES NIKKEI 225 UCITS ETF (continued) As at 31 July 2018
[ 2 5 6 ] i S H A R E S V I I P L C A N N U A L R E P O R T
Ccy Holding Investment Fair value
¥'000
% of netassetvalue
Equities (31 July 2017: 99.91%) (cont) Japan (31 July 2017: 99.91%) (cont) Diversified financial services
JPY 48,193 Credit Saison Co Ltd 83,808 0.28JPY 47,893 Daiwa Securities Group Inc 31,169 0.11JPY 46,093 Matsui Securities Co Ltd^ 51,255 0.17JPY 46,093 Nomura Holdings Inc 24,360 0.08
Electrical components & equipment JPY 48,593 Casio Computer Co Ltd^ 88,682 0.30JPY 47,493 Fujikura Ltd 34,053 0.11JPY 4,509 Furukawa Electric Co Ltd 17,743 0.06JPY 45,093 GS Yuasa Corp 23,493 0.08
Electricity JPY 5,309 Chubu Electric Power Co Inc 9,134 0.03JPY 5,309 Kansai Electric Power Co Inc 8,431 0.03JPY 5,309 Tokyo Electric Power Co
Holdings Inc 2,835 0.01Electronics
JPY 48,393 Alps Electric Co Ltd^ 155,583 0.52JPY 96,586 Kyocera Corp^ 626,650 2.11JPY 48,193 Minebea Mitsumi Inc^ 96,145 0.32JPY 13,927 Nippon Electric Glass Co Ltd 50,207 0.17JPY 9,218 Screen Holdings Co Ltd^ 75,127 0.25JPY 48,593 Taiyo Yuden Co Ltd^ 161,572 0.54JPY 48,193 Yokogawa Electric Corp^ 95,470 0.32
Engineering & construction JPY 50,893 Chiyoda Corp^ 45,397 0.15JPY 48,293 Comsys Holdings Corp^ 133,916 0.45JPY 48,593 JGC Corp 105,107 0.35JPY 48,093 Kajima Corp 41,889 0.14JPY 47,393 Obayashi Corp 55,213 0.19JPY 48,793 Shimizu Corp 56,990 0.19JPY 9,418 Taisei Corp 58,486 0.20
Entertainment JPY 4,409 Toho Co Ltd 14,682 0.05
Environmental control JPY 10,618 Hitachi Zosen Corp 5,553 0.02
Food JPY 48,393 Ajinomoto Co Inc 95,600 0.32JPY 48,693 Kikkoman Corp 257,586 0.87JPY 4,400 Maruha Nichiro Corp 18,282 0.06JPY 9,800 MEIJI Holdings Co Ltd 86,044 0.29JPY 25,046 NH Foods Ltd 111,204 0.37JPY 24,346 Nichirei Corp 63,178 0.21JPY 46,093 Nippon Suisan Kaisha Ltd^ 25,305 0.09JPY 48,200 Nisshin Seifun Group Inc^ 105,317 0.35JPY 48,693 Seven & I Holdings Co Ltd 221,797 0.75
Forest products & paper JPY 3,958 Nippon Paper Industries Co Ltd^ 7,239 0.02JPY 48,093 Oji Holdings Corp 31,838 0.11
Ccy Holding InvestmentFair value
¥'000
% of netassetvalue
Japan (31 July 2017: 99.91%) (cont) Gas
JPY 9,418 Osaka Gas Co Ltd^ 20,202 0.07JPY 8,618 Tokyo Gas Co Ltd 23,471 0.08
Hand & machine tools JPY 47,093 Fuji Electric Co Ltd 38,710 0.13
Healthcare products JPY 48,093 Olympus Corp^ 217,621 0.73JPY 96,600 Terumo Corp^ 592,158 1.99
Home builders JPY 48,393 Daiwa House Industry Co Ltd 196,863 0.66JPY 10,000 Haseko Corp 14,790 0.05JPY 48,193 Sekisui House Ltd^ 91,639 0.31
Home furnishings JPY 48,593 Panasonic Corp 69,877 0.24JPY 46,093 Pioneer Corp^ 7,006 0.02JPY 48,693 Sony Corp 283,783 0.95
Insurance JPY 5,300 Dai-ichi Life Holdings Inc 11,141 0.04JPY 48,500 Japan Post Holdings Co Ltd 59,752 0.20JPY 14,229 MS&AD Insurance Group
Holdings Inc 48,549 0.16JPY 12,023 Sompo Holdings Inc^ 54,512 0.18JPY 9,618 Sony Financial Holdings Inc 20,621 0.07JPY 9,618 T&D Holdings Inc 16,014 0.06JPY 24,248 Tokio Marine Holdings Inc 128,539 0.43
Internet JPY 47,300 Rakuten Inc 37,220 0.12JPY 48,393 Trend Micro Inc 318,910 1.07JPY 18,400 Yahoo Japan Corp^ 7,820 0.03
Iron & steel JPY 9,618 Japan Steel Works Ltd 26,334 0.09JPY 3,909 JFE Holdings Inc 8,856 0.03JPY 5,309 Kobe Steel Ltd 5,824 0.02JPY 4,000 Nippon Steel & Sumitomo Metal
Corp 8,894 0.03JPY 5,083 Nisshin Steel Co Ltd 7,975 0.02
Leisure time JPY 24,300 Tokyo Dome Corp^ 22,721 0.08JPY 48,093 Yamaha Corp^ 251,045 0.84JPY 48,500 Yamaha Motor Co Ltd 142,638 0.48
Machinery - diversified JPY 48,693 Amada Holdings Co Ltd 54,439 0.18JPY 9,618 Ebara Corp 32,413 0.11JPY 48,393 Fanuc Corp^ 1,060,774 3.56JPY 48,593 Kubota Corp 90,845 0.31JPY 4,709 Mitsubishi Heavy Industries Ltd^ 19,716 0.07JPY 9,418 Okuma Corp 59,145 0.20JPY 9,618 Sumitomo Heavy Industries Ltd 37,222 0.12JPY 48,693 Yaskawa Electric Corp^ 178,703 0.60

iSHARES VII PLC
Schedule of Investments (continued) iSHARES NIKKEI 225 UCITS ETF (continued) As at 31 July 2018
i S H A R E S V I I P L C A N N U A L R E P O R T [ 2 5 7 ]
Ccy Holding Investment Fair value
¥'000
% of netassetvalue
Equities (31 July 2017: 99.91%) (cont) Japan (31 July 2017: 99.91%) (cont)
Machinery, construction & mining JPY 48,093 Hitachi Construction Machinery
Co Ltd 171,692 0.58JPY 49,093 Hitachi Ltd 38,224 0.13JPY 48,593 Komatsu Ltd 159,239 0.53JPY 47,493 Mitsubishi Electric Corp 71,786 0.24
Marine transportation JPY 5,309 Mitsui E&S Holdings Co Ltd 8,463 0.03
Media JPY 5,300 SKY Perfect JSAT Holdings Inc 2,825 0.01
Metal fabricate/ hardware JPY 47,393 NSK Ltd 57,582 0.19JPY 50,793 NTN Corp 24,838 0.08JPY 4,709 Toho Zinc Co Ltd^ 19,472 0.07
Mining JPY 9,618 Dowa Holdings Co Ltd^ 34,529 0.11JPY 5,309 Furukawa Co Ltd 9,020 0.03JPY 4,409 Mitsubishi Materials Corp 13,976 0.05JPY 4,509 Mitsui Mining & Smelting Co Ltd 19,907 0.07JPY 45,591 Nippon Light Metal Holdings Co
Ltd^ 11,489 0.04JPY 5,309 Pacific Metals Co Ltd^ 17,068 0.06JPY 24,446 Sumitomo Metal Mining Co Ltd 98,151 0.33
Miscellaneous manufacturers JPY 48,693 FUJIFILM Holdings Corp 224,036 0.75JPY 48,493 Nikon Corp^ 91,264 0.31
Office & business equipment JPY 72,038 Canon Inc 260,561 0.88JPY 48,693 Konica Minolta Inc^ 48,742 0.16JPY 46,793 Ricoh Co Ltd^ 50,911 0.17JPY 96,500 Seiko Epson Corp^ 194,254 0.65
Oil & gas JPY 21,500 Inpex Corp 26,456 0.09JPY 45,993 JXTG Holdings Inc 37,691 0.13JPY 47,493 Showa Shell Sekiyu KK^ 87,007 0.29
Packaging & containers JPY 48,393 Toyo Seikan Group Holdings
Ltd^ 99,302 0.33Pharmaceuticals
JPY 241,600 Astellas Pharma Inc^ 439,108 1.48JPY 48,693 Chugai Pharmaceutical Co Ltd 276,089 0.93JPY 48,393 Daiichi Sankyo Co Ltd 223,673 0.75JPY 48,093 Eisai Co Ltd 460,827 1.55JPY 48,493 Kyowa Hakko Kirin Co Ltd 102,660 0.34JPY 48,100 Otsuka Holdings Co Ltd 247,715 0.83JPY 48,493 Shionogi & Co Ltd 294,644 0.99JPY 48,493 Sumitomo Dainippon Pharma Co
Ltd^ 104,890 0.35JPY 48,393 Takeda Pharmaceutical Co Ltd^ 226,237 0.76
Ccy Holding InvestmentFair value
¥'000
% of netassetvalue
Japan (31 July 2017: 99.91%) (cont) Real estate investment & services
JPY 48,493 Mitsubishi Estate Co Ltd 94,077 0.32JPY 48,493 Mitsui Fudosan Co Ltd^ 129,282 0.43JPY 48,093 Sumitomo Realty & Development
Co Ltd 196,604 0.66JPY 24,000 Tokyo Tatemono Co Ltd 36,024 0.12JPY 46,100 Tokyu Fudosan Holdings Corp 34,944 0.12
Retail JPY 48,393 Aeon Co Ltd 109,683 0.37JPY 46,193 Citizen Watch Co Ltd 33,905 0.11JPY 48,400 FamilyMart UNY Holdings Co
Ltd^ 503,360 1.69JPY 48,393 Fast Retailing Co Ltd^ 2,359,159 7.93JPY 47,193 Isetan Mitsukoshi Holdings Ltd^ 63,569 0.21JPY 23,700 J Front Retailing Co Ltd^ 38,749 0.13JPY 48,393 Marui Group Co Ltd^ 107,239 0.36JPY 49,093 Takashimaya Co Ltd^ 45,853 0.16
Semiconductors JPY 94,889 Advantest Corp^ 250,887 0.84JPY 5,309 Sumco Corp 12,651 0.04JPY 48,393 Tokyo Electron Ltd 926,968 3.12
Software JPY 15,900 DeNA Co Ltd 33,470 0.11JPY 48,493 Konami Holdings Corp^ 254,588 0.86
Telecommunications JPY 290,000 KDDI Corp 902,770 3.03JPY 9,600 Nippon Telegraph & Telephone
Corp 49,613 0.17JPY 46,693 Nisshinbo Holdings Inc^ 57,246 0.19JPY 4,100 NTT DoCoMo Inc^ 11,779 0.04JPY 5,309 Oki Electric Industry Co Ltd 7,247 0.02JPY 145,183 SoftBank Group Corp 1,344,394 4.52
Textile JPY 5,309 Toyobo Co Ltd 10,023 0.03JPY 5,309 Unitika Ltd 3,552 0.01
Transportation JPY 4,783 Central Japan Railway Co 111,181 0.37JPY 4,909 East Japan Railway Co 51,250 0.17JPY 5,309 Kawasaki Kisen Kaisha Ltd 10,761 0.04JPY 9,818 Keio Corp^ 53,803 0.18JPY 24,546 Keisei Electric Railway Co Ltd 91,188 0.31JPY 25,146 Mitsubishi Logistics Corp^ 64,097 0.22JPY 4,309 Mitsui OSK Lines Ltd^ 12,453 0.04JPY 4,709 Nippon Express Co Ltd 34,376 0.12JPY 5,309 Nippon Yusen KK 11,409 0.04JPY 23,846 Odakyu Electric Railway Co Ltd^ 56,372 0.19JPY 9,418 Tobu Railway Co Ltd 30,985 0.10JPY 25,046 Tokyu Corp 48,139 0.16JPY 4,909 West Japan Railway Co 38,290 0.13JPY 48,293 Yamato Holdings Co Ltd 156,131 0.52
Total Japan 29,380,077 98.69Total equities 29,380,077 98.69

iSHARES VII PLC
Schedule of Investments (continued) iSHARES NIKKEI 225 UCITS ETF (continued) As at 31 July 2018
[ 2 5 8 ] i S H A R E S V I I P L C A N N U A L R E P O R T
CcyNo. of
contracts
Underlying exposure
¥'000 Fair value
¥'000
% of netassetsvalue
Financial derivative instruments (31 July 2017: 0.00%)
Futures contracts (31 July 2017: 0.00%) JPY 34 SGX Nikkei 225 Index
Futures September 2018 381,700 1,480 0.01Total unrealised gains on futures contracts 1,480 0.01Total financial derivative instruments 1,480 0.01
Fair value¥'000
% of net assetvalue
Total value of investments 29,381,557 98.70 Cash† 362,574 1.22 Other net assets 25,297 0.08 Net asset value attributable to redeemable participating shareholders at the end of the financial year 29,769,428 100.00
† Cash holdings of ¥351,172,930 are held with State Street Bank and Trust Company. ¥11,400,905 is held as security for futures contracts with Credit Suisse AG. ^ These securities are partially or fully transferred as securities lent.
Equities are primarily classified by country of incorporation of the entity in which the Fund holds shares. Underlying exposure has been calculated according to the guidelines issued by the ESMA and represents the market value of an equivalent position in the assets underlying each financial derivative instrument.
Analysis of total current assets gross of all liabilities
Fair value¥'000
% of totalcurrentassets
Transferable securities admitted to an official stock exchange listing 29,380,077 98.65Exchange traded financial derivative instruments 1,480 0.01Other assets 400,277 1.34Total current assets 29,781,834 100.00

iSHARES VII PLC
Schedule of Investments (continued) iSHARES FTSE ITALIA MID-SMALL CAP UCITS ETF As at 31 July 2018
i S H A R E S V I I P L C A N N U A L R E P O R T [ 2 5 9 ]
Ccy Holding Investment Fair value
€'000
% of netassetvalue
Transferable Securities Admitted to an Official Stock Exchange Listing or traded on a Regulated Market
Equities Italy Aerospace & defence
EUR 4,876 Avio SpA 69 0.48Apparel retailers
EUR 7,640 Aeffe SpA 22 0.15EUR 7,808 BasicNet SpA 32 0.22EUR 8,589 Brunello Cucinelli SpA 305 2.11EUR 4,050 CSP International Fashion Group
SpA 4 0.03EUR 19,486 Geox SpA 44 0.30EUR 3,352 Piquadro SpA 7 0.05EUR 3,363 Tod's SpA 183 1.27
Auto parts & equipment EUR 5,482 Carraro SpA 16 0.11EUR 11,565 Landi Renzo SpA 16 0.11EUR 3,244 Pininfarina SpA 9 0.07EUR 11,598 Sogefi SpA 25 0.17
Banks EUR 11,254,966 Banca Carige SpA 100 0.69EUR 22,966 Banca Finnat Euramerica SpA 9 0.06EUR 67,650 Banca Monte dei Paschi di Siena
SpA 180 1.24EUR 116,059 Banca Popolare di Sondrio SCPA 430 2.97EUR 75,872 Banca Profilo SpA 16 0.11EUR 11,166 Banca Sistema SpA 23 0.16EUR 12,147 Banco di Desio e della Brianza
SpA 27 0.19EUR 1,695 Banco di Sardegna SpA 11 0.08EUR 19,289 Credito Emiliano SpA 122 0.85EUR 1,705,349 Credito Valtellinese SpA 181 1.25
Beverages EUR 2,872 Massimo Zanetti Beverage
Group SpA 20 0.14Biotechnology
EUR 87,213 Molecular Medicine SPA 41 0.28Building materials and fixtures
EUR 11,989 Cementir Holding SpA 83 0.58EUR 6,955 Gruppo Ceramiche Ricchetti SpA 1 0.01EUR 2,860 Italmobiliare SpA 59 0.41EUR 1,781 LU-VE SpA 18 0.12EUR 3,392 Panariagroup Industrie
Ceramiche SpA 10 0.07EUR 1,527 Vianini SpA 2 0.01
Chemicals EUR 2,848 Isagro SpA 4 0.03EUR 9,358 SOL SpA 102 0.70
Commercial services EUR 8,751 ASTM SpA 204 1.41EUR 340 Autostrade Meridionali SpA 10 0.06
Ccy Holding InvestmentFair value
€'000
% of netassetvalue
Italy (cont) Commercial services (cont)
EUR 28,268 Edison SpA 27 0.19EUR 5,529 Fiera Milano SpA 26 0.18EUR 2,950 Openjobmetis Spa agenzia per il
lavoro 29 0.20EUR 17,797 Societa Iniziative Autostradali e
Servizi SpA 270 1.87Computers
EUR 7,169 Eurotech SpA 18 0.12EUR 634 Fidia SpA 4 0.03EUR 5,258 Tecnoinvestimenti Spa 30 0.21
Cosmetics & personal care EUR 4,393 Bioera SpA 1 0.01
Distribution & wholesale EUR 6,620 Esprinet SpA 26 0.18EUR 817 IT Way SpA 1 0.01EUR 8,488 MARR SpA 196 1.35EUR 7,807 Safilo Group SpA 34 0.24
Diversified financial services EUR 28,215 Aedes SIIQ SpA 9 0.06EUR 73,378 Anima Holding SpA 337 2.33EUR 22,506 Banca Farmafactoring SpA 120 0.83EUR 4,808 Banca IFIS SpA 129 0.89EUR 9,580 Banca Intermobiliare SpA 4 0.02EUR 4,593 Conafi SPA 1 0.01EUR 10,340 doBank SpA 108 0.75EUR 3,888 Fila SpA 73 0.50EUR 7,080 Mittel SpA 13 0.09EUR 25,928 Tamburi Investment Partners
SpA 163 1.13Electrical components & equipment
EUR 1,241 Cembre SpA 31 0.21EUR 3,035 Irce SpA 8 0.05EUR 2,123 Sabaf SpA 34 0.24
Electricity EUR 11,185 ACEA SpA 151 1.05EUR 14,125 ERG SpA 272 1.88EUR 206,177 Hera SpA 585 4.04EUR 130,864 Iren SpA 317 2.19
Electronics EUR 1,018 B&C Speakers SpA 12 0.08EUR 14,126 Beghelli SpA 5 0.03EUR 2,687 El.En. SpA 76 0.53EUR 7,925 Nice SpA 26 0.18
Energy - alternate sources EUR 1,750 Alerion Cleanpower SpA 5 0.04EUR 30,120 Falck Renewables SpA 68 0.47EUR 414 KR Energy SpA 1 0.01EUR 703 PLC SpA 2 0.01EUR 5,438 TerniEnergia SpA 3 0.02

iSHARES VII PLC
Schedule of Investments (continued) iSHARES FTSE ITALIA MID-SMALL CAP UCITS ETF (continued) As at 31 July 2018
[ 2 6 0 ] i S H A R E S V I I P L C A N N U A L R E P O R T
Ccy Holding Investment Fair value
€'000
% of netassetvalue
Equities (cont) Italy (cont) Engineering & construction
EUR 2,288 Aeroporto Guglielmo Marconi Di Bologna SpA 35 0.24
EUR 11,803 Astaldi SpA 23 0.16EUR 3,625 Caltagirone SpA 9 0.06EUR 65,114 Enav SpA 287 1.98EUR 41,040 Salini Impregilo SpA 93 0.64EUR 19,325 Trevi Finanziaria Industriale SpA 6 0.05
Entertainment EUR 30,334 AS Roma SpA 16 0.11EUR 2,781 Gamenet Group SpA 25 0.17EUR 95,276 Juventus Football Club SpA 83 0.58EUR 24,608 Rai Way SpA 120 0.83EUR 5,672 Societa Sportiva Lazio SpA 9 0.06
Environmental control EUR 4,819 Ambienthesis SpA 2 0.01EUR 3,148 Biancamano SpA 1 0.01EUR 353 Gruppo Waste Italia SpA - 0.00
Food EUR 1,407 Centrale del Latte d'Italia 4 0.03EUR 2,273 La Doria SpA 24 0.16EUR 49,226 Parmalat SpA 146 1.01EUR 397 Valsoia SpA 6 0.04
Food Service EUR 32,585 Autogrill SpA 305 2.11
Gas EUR 4,657 Acsm - Agam SpA 11 0.08EUR 19,195 Ascopiave SpA 61 0.42EUR 1,052 Gas Plus SpA 3 0.02
Hand & machine tools EUR 4,333 IMA Industria Macchine
Automatiche SpA 312 2.16Healthcare products
EUR 6,023 DiaSorin SpA 553 3.82EUR 2,572 Eukedos SpA 2 0.02EUR 3,189 Servizi Italia SpA 15 0.10
Holding companies - diversified operations EUR 73,952 CIR-Compagnie Industriali
Riunite SpA 77 0.53EUR 83,249 Cofide SpA 38 0.27
Home furnishings EUR 16,596 De' Longhi SpA 418 2.89EUR 5,229 Elica SpA 11 0.08EUR 464 Indel B SpA 15 0.10
Hotels EUR 5,643 I Grandi Viaggi SpA 10 0.07
Household products EUR 9,871 Bialetti Industrie SpA 4 0.02EUR 14,252 Emak SpA 17 0.12
Ccy Holding InvestmentFair value
€'000
% of netassetvalue
Italy (cont) Insurance
EUR 40,212 Societa Cattolica di Assicurazioni SC 316 2.18
EUR 6,285 Vittoria Assicurazioni SpA 88 0.61Internet
EUR 14,298 BE 13 0.09EUR 60,782 Centro HL Distribuzione SpA 1 0.01EUR 50,361 Cerved Group SpA 495 3.42EUR 5,620 ePrice SpA 8 0.05EUR 689 FULLSIX 1 0.01EUR 5,998 Gruppo MutuiOnline SpA 83 0.57EUR 3,534 Netweek SpA 1 0.01EUR 5,289 Reply SpA 306 2.12
Investment services EUR 2,791 Bastogi SpA 2 0.02EUR 19,161 DeA Capital SpA 25 0.17EUR 4,528 Lventure Group 3 0.02
Leisure time EUR 39,528 IMMSI SpA 21 0.15EUR 42,243 Piaggio & C SpA 96 0.66EUR 25,006 Technogym SpA 233 1.61
Machinery - diversified EUR 3,442 Biesse SpA 121 0.84EUR 1,420 Gefran SpA 10 0.07EUR 9,014 Gima TT SpA 120 0.83EUR 21,367 Interpump Group SpA 576 3.98EUR 1,553 Prima Industrie SpA 57 0.39EUR 2,223 SAES Getters SpA 48 0.33
Machinery, construction & mining EUR 3,011 Danieli & C Officine Meccaniche
SpA 63 0.44EUR 14,202 Tesmec SpA 8 0.05
Marine transportation EUR 118,177 Fincantieri SpA 153 1.06
Media EUR 31,267 Arnoldo Mondadori Editore SpA 46 0.32EUR 17,470 Cairo Communication SpA 57 0.39EUR 11,254 Caltagirone Editore SpA 14 0.10EUR 7,619 Class Editori SpA 2 0.01EUR 55,526 GEDI Gruppo Editoriale SpA 19 0.13EUR 1,906 Giglio Group SpA 7 0.05EUR 14,083 Il Sole 24 Ore SpA 9 0.06EUR 7,874 Italiaonline SpA 21 0.15EUR 1,575 Mediacontech SpA 1 0.01EUR 5,028 Mondo TV SpA 22 0.15EUR 4,019 Monrif SpA 1 0.01EUR 154 Poligrafica San Faustino SpA 1 0.01EUR 7,471 Poligrafici Editoriale SpA 2 0.01EUR 28,829 Rizzoli Corriere Della Sera
Mediagroup SpA 31 0.21

iSHARES VII PLC
Schedule of Investments (continued) iSHARES FTSE ITALIA MID-SMALL CAP UCITS ETF (continued) As at 31 July 2018
i S H A R E S V I I P L C A N N U A L R E P O R T [ 2 6 1 ]
Ccy Holding Investment Fair value
€'000
% of netassetvalue
Equities (cont) Italy (cont)
Metal fabricate/ hardware EUR 466 Rosss SpA - 0.00
Mining EUR 49,823 Intek Group SpA 18 0.12
Office & business equipment EUR 5,182 Datalogic SpA 149 1.03
Oil & gas EUR 117,613 Saras SpA 241 1.67
Oil & gas services EUR 37,515 Maire Tecnimont SpA 166 1.15
Packaging & containers EUR 40,706 Reno de Medici SpA 42 0.29EUR 7,819 Zignago Vetro SpA 64 0.44
Pharmaceuticals EUR 30,388 Amplifon SpA 582 4.02EUR 916 Enervit SpA 3 0.02EUR 7,806 Pierrel SpA 1 0.01
Real estate investment & services EUR 262,701 Beni Stabili SpA SIIQ 198 1.37EUR 67,206 Brioschi Sviluppo Immobiliare
SpA 5 0.03EUR 9,113 Cia Immobiliare Azionaria 1 0.01EUR 5,466 COIMA RES SpA 44 0.30EUR 6,192 Gabetti Property Solutions SpA 2 0.02EUR 12,618 Immobiliare Grande Distribuzione
SIIQ SpA 91 0.63EUR 457 Nova Re SIIQ SpA 2 0.02EUR 95,805 Risanamento SpA 3 0.02
Retail EUR 3,617 Damiani SpA 3 0.02EUR 44,967 OVS SpA 126 0.87EUR 10,363 Stefanel SpA 1 0.01EUR 3,391 Unieuro SpA 39 0.27
Software EUR 480 Acotel Group SpA 2 0.01EUR 541 CAD IT SpA 3 0.02EUR 988 Digital Bros SpA 9 0.07EUR 3,524 Exprivia SpA 4 0.03EUR 1,672 Sesa SpA 51 0.35EUR 2,614 Tas Tecnologia Avanzata dei
Sistemi SpA 5 0.03EUR 1,652 TXT e-solutions SpA 16 0.11
Telecommunications EUR 4,021 Ei Towers SpA 229 1.58EUR 61,880 Infrastrutture Wireless Italiane
SpA 433 2.99EUR 36,334 Retelit SpA 59 0.41EUR 532,572 Tiscali SpA 13 0.09
Textile EUR 5,448 Aquafil SpA 70 0.48EUR 1,879 Caleffi SpA 3 0.02
Ccy Holding InvestmentFair value
€'000
% of netassetvalue
Italy (cont) Textile (cont)
EUR 1,187 Ratti SpA 4 0.03EUR 73,105 Vincenzo Zucchi SpA 1 0.01
Transportation EUR 22,772 Ansaldo STS SpA 287 1.98EUR 30,904 FNM SpA 19 0.13
Total Italy 14,411 99.63
Luxembourg Commercial services
EUR 3,316 IVS Group SA 39 0.27Total Luxembourg 39 0.27Total equities 14,450 99.90
Rights Italy
EUR 7,806 Pierrel SpA – Rights 3 August 2018 - 0.00Total Italy - 0.00Total rights - 0.00 Total value of investments 14,450 99.90 Cash† 17 0.12 Other net liabilities (3) (0.02) Net asset value attributable to redeemable participating shareholders at the end of the financial period 14,464 100.00
† Substantially all cash positions are held with State Street Bank and Trust Company.
Equities are primarily classified by country of incorporation of the entity in which the Fund holds shares.
Analysis of total current assets gross of all liabilities
Fair value€'000
% of totalcurrentassets
Transferable securities admitted to an official stock exchange listing 14,450 99.88Other assets 18 0.12Total current assets 14,468 100.00

iSHARES VII PLC
Schedule of Material Purchases and Sales (unaudited) iSHARES $ TREASURY BOND 1-3YR UCITS ETF USD (Acc) B For the financial year ended 31 July 2018
[ 2 6 2 ] i S H A R E S V I I P L C A N N U A L R E P O R T
Holding Investments Proceeds
$’000 Holding Investments Cost
$’000
Sales Purchases
4,308,000 United States Treasury Note/Bond 0.875% 15/06/2019 4,248 7,654,000 United States Treasury Note/Bond 2.625% 15/11/2020 7,734
4,170,000 United States Treasury Note/Bond 1% 15/03/2019 4,127 7,350,000 United States Treasury Note/Bond 1.375% 30/09/2020 7,217
3,864,000 United States Treasury Note/Bond 1.625% 30/06/2019 3,840 7,056,000 United States Treasury Note/Bond 1.375% 31/08/2020 6,951
3,630,000 United States Treasury Note/Bond 0.875% 15/04/2019 3,585 6,603,000 United States Treasury Note/Bond 1.375% 31/10/2020 6,472
3,371,000 United States Treasury Note/Bond 0.75% 15/02/2019 3,332 5,578,000 United States Treasury Note/Bond 1.75% 31/12/2020 5,490
3,248,000 United States Treasury Note/Bond 1.5% 28/02/2019 3,233 5,148,000 United States Treasury Note/Bond 1.625% 31/07/2020 5,104
3,108,000 United States Treasury Note/Bond 1.125% 15/01/2019 3,087 5,103,000 United States Treasury Note/Bond 1.25% 31/03/2021 4,926
3,070,000 United States Treasury Note/Bond 0.875% 15/10/2018 3,054 4,872,000 United States Treasury Note/Bond 1.125% 28/02/2021 4,685
3,024,000 United States Treasury Note/Bond 0.875% 15/05/2019 2,985 4,816,000 United States Treasury Note/Bond 1.375% 31/01/2021 4,677
2,913,000 United States Treasury Note/Bond 1.125% 31/01/2019 2,891 4,452,000 United States Treasury Note/Bond 3.625% 15/02/2021 4,590
2,880,000 United States Treasury Note/Bond 1.25% 15/12/2018 2,868 4,022,000 United States Treasury Note/Bond 1.5% 31/10/2019 3,986
2,790,000 United States Treasury Note/Bond 1.25% 15/11/2018 2,780 3,850,000 United States Treasury Note/Bond 2.25% 15/02/2021 3,813
2,747,000 United States Treasury Note/Bond 0.75% 31/10/2018 2,728 3,811,600 United States Treasury Note/Bond 1.625% 30/06/2020 3,762
2,448,000 United States Treasury Note/Bond 1.375% 31/08/2020 2,399 3,564,000 United States Treasury Note/Bond 0.875% 15/06/2019 3,511
2,358,000 United States Treasury Note/Bond 1.375% 30/09/2020 2,305 3,468,000 United States Treasury Note/Bond 1.375% 30/04/2020 3,410
2,285,000 United States Treasury Note/Bond 1% 15/08/2018 2,279 3,038,000 United States Treasury Note/Bond 2.625% 15/08/2020 3,090
2,150,000 United States Treasury Note/Bond 2.625% 15/11/2020 2,159 3,125,000 United States Treasury Note/Bond 1.375% 31/03/2020 3,074
2,146,000 United States Treasury Note/Bond 1.25% 30/04/2019 2,127 3,116,000 United States Treasury Note/Bond 1.375% 15/01/2020 3,070
2,100,000 United States Treasury Note/Bond 1.5% 31/05/2019 2,086 2,924,000 United States Treasury Note/Bond 3.5% 15/05/2020 3,005
2,038,000 United States Treasury Note/Bond 1% 15/09/2018 2,032 3,003,000 United States Treasury Note/Bond 2% 28/02/2021 2,953
2,059,000 United States Treasury Note/Bond 1.375% 31/10/2020 2,009 2,871,000 United States Treasury Note/Bond 1.625% 30/11/2020 2,822
1,960,000 United States Treasury Note/Bond 1.625% 30/06/2020 1,936 2,832,000 United States Treasury Note/Bond 1.625% 15/03/2020 2,800
1,929,000 United States Treasury Note/Bond 1.125% 31/05/2019 1,907 2,562,000 United States Treasury Note/Bond 1.625% 30/06/2019 2,550
1,820,000 United States Treasury Note/Bond 1.625% 31/07/2020 1,797 2,555,000 United States Treasury Note/Bond 1.375% 30/04/2021 2,471
1,806,000 United States Treasury Note/Bond 1.5% 31/10/2019 1,789 2,555,000 United States Treasury Note/Bond 1.375% 31/05/2021 2,468
1,764,000 United States Treasury Note/Bond 3.125% 15/05/2019 1,783 2,380,000 United States Treasury Note/Bond 3.625% 15/02/2020 2,446
1,785,000 United States Treasury Note/Bond 1.375% 30/04/2020 1,757 2,336,000 United States Treasury Note/Bond 2.625% 15/05/2021 2,341
1,650,000 United States Treasury Note/Bond 1.625% 15/03/2020 1,631 2,312,000 United States Treasury Note/Bond 1.5% 31/05/2020 2,277
1,505,000 United States Treasury Note/Bond 3.5% 15/05/2020 1,549 2,280,000 United States Treasury Note/Bond 1.375% 30/09/2019 2,261
1,485,000 United States Treasury Note/Bond 1.375% 31/03/2020 1,462 2,244,000 United States Treasury Note/Bond 1.75% 30/09/2019 2,233
1,418,000 United States Treasury Note/Bond 1.75% 31/12/2020 1,390 2,244,000 United States Treasury Note/Bond 1.625% 31/08/2019 2,230
1,380,000 United States Treasury Note/Bond 1.25% 30/06/2019 1,366 2,244,000 United States Treasury Note/Bond 1.375% 29/02/2020 2,210
1,225,000 United States Treasury Note/Bond 3.625% 15/02/2020 1,261 2,244,000 United States Treasury Note/Bond 1.25% 31/01/2020 2,207
1,245,000 United States Treasury Note/Bond 1.625% 31/12/2019 1,237 2,176,000 United States Treasury Note/Bond 1.5% 30/11/2019 2,154
2,244,000 United States Treasury Note/Bond 1.125% 30/06/2021 2,147
2,112,000 United States Treasury Note/Bond 2.625% 15/06/2021 2,112
2,108,000 United States Treasury Note/Bond 1.625% 31/07/2019 2,096
2,040,000 United States Treasury Note/Bond 3.375% 15/11/2019 2,082
2,079,000 United States Treasury Note/Bond 1.5% 15/06/2020 2,052
2,047,000 United States Treasury Note/Bond 2% 30/11/2020 2,034
2,049,000 United States Treasury Note/Bond 0.875% 15/04/2019 2,025
2,031,000 United States Treasury Note/Bond 1% 15/03/2019 2,014
The CBI requires a Schedule of material changes in the composition of the portfolio during the financial year. These are defined as aggregate purchases of a security exceeding one per cent of the total value of purchases for the financial year and aggregate disposals greater than one per cent of the total value of sales. At a minimum the largest 20 purchases and 20 sales must be given or all purchases and sales if less than 20. A full listing of the portfolio changes for the financial year is available, upon request, at no cost from the Administrator.

iSHARES VII PLC
Schedule of Material Purchases and Sales (unaudited) (continued) iSHARES $ TREASURY BOND 3-7YR UCITS ETF For the financial year ended 31 July 2018
i S H A R E S V I I P L C A N N U A L R E P O R T [ 2 6 3 ]
Holding Investments Proceeds
$’000 Holding Investments Cost
$’000
Sales Purchases
23,673,900 United States Treasury Note 3.125% 15/05/2021 24,149 54,624,000 United States Treasury Note 2.375% 15/08/2024 54,630
21,204,000 United States Treasury Note 3.625% 15/02/2021 22,013 36,786,000 United States Treasury Note 2.25% 15/11/2024 36,048
21,033,000 United States Treasury Note 1.375% 30/04/2021 20,331 37,465,000 United States Treasury Note 2.125% 15/05/2025 35,902
20,291,600 United States Treasury Note 1.375% 31/05/2021 19,630 32,442,000 United States Treasury Note 2.75% 28/02/2025 32,366
18,968,000 United States Treasury Note 1.75% 31/10/2020 18,987 32,445,000 United States Treasury Note 1.75% 31/01/2023 31,188
19,756,000 United States Treasury Note 1.125% 30/06/2021 18,919 32,567,000 United States Treasury Note 2% 15/02/2025 30,905
17,739,000 United States Treasury Note 2.625% 15/08/2020 18,336 30,592,000 United States Treasury Note 2.125% 30/11/2024 29,732
14,418,000 United States Treasury Note 2.125% 31/01/2021 14,376 27,641,000 United States Treasury Note 2.25% 31/12/2024 26,736
13,644,000 United States Treasury Note 2.125% 30/06/2021 13,483 26,995,000 United States Treasury Note 1.5% 28/02/2023 25,596
12,060,000 United States Treasury Note 2% 30/09/2020 12,240 23,837,000 United States Treasury Note 2.5% 15/05/2024 23,637
11,547,100 United States Treasury Note 2.25% 30/04/2021 11,463 23,730,000 United States Treasury Note 2.125% 31/12/2022 23,325
11,008,000 United States Treasury Note 2.375% 31/12/2020 11,142 23,292,000 United States Treasury Note 2% 15/02/2022 22,889
11,532,000 United States Treasury Note 1.125% 28/02/2021 11,127 23,245,000 United States Treasury Note 2% 30/11/2022 22,762
10,489,000 United States Treasury Note 1.75% 31/12/2020 10,436 22,201,000 United States Treasury Note 2.75% 15/11/2023 22,364
10,521,700 United States Treasury Note 2% 31/05/2021 10,384 22,416,000 United States Treasury Note 1.75% 15/05/2022 21,767
10,253,000 United States Treasury Note 2.375% 15/08/2024 10,176 21,919,000 United States Treasury Note 2% 15/02/2023 21,365
9,672,000 United States Treasury Note 2% 28/02/2021 9,582 21,375,000 United States Treasury Note 2.75% 30/04/2023 21,349
9,436,000 United States Treasury Note 1.625% 30/11/2020 9,361 21,043,000 United States Treasury Note 2% 15/11/2021 20,720
9,099,000 United States Treasury Note 2.625% 15/11/2020 9,291 20,664,000 United States Treasury Note 2.125% 15/08/2021 20,460
8,940,000 United States Treasury Note 1.375% 31/10/2020 8,846 21,043,000 United States Treasury Note 1.625% 15/11/2022 20,212
8,496,000 United States Treasury Note 1.375% 31/01/2021 8,295 19,291,000 United States Treasury Note 2.75% 15/02/2024 19,420
8,127,000 United States Treasury Note 2.25% 31/03/2021 8,117 19,788,000 United States Treasury Note 1.75% 15/05/2023 19,009
7,830,000 United States Treasury Note 1.375% 30/09/2020 7,773 18,912,000 United States Treasury Note 2.5% 15/08/2023 18,830
7,740,000 United States Treasury Note 1.25% 31/03/2021 7,502 18,980,000 United States Treasury Note 2% 31/10/2022 18,687
7,091,000 United States Treasury Note 2.5% 15/05/2024 7,101 19,291,000 United States Treasury Note 1.625% 15/08/2022 18,585
7,066,000 United States Treasury Note 2% 15/02/2022 6,993 18,843,000 United States Treasury Note 1.875% 31/07/2022 18,544
6,800,000 United States Treasury Note 1.75% 15/05/2022 6,649 17,936,000 United States Treasury Note 1.875% 30/09/2022 17,599
6,650,000 United States Treasury Note 2% 15/02/2023 6,533 17,005,000 United States Treasury Note 2.25% 31/10/2024 16,727
6,418,000 United States Treasury Note 2.75% 15/11/2023 6,530 16,680,000 United States Treasury Note 2.125% 31/07/2024 16,364
6,384,000 United States Treasury Note 2% 15/11/2021 6,329 16,560,000 United States Treasury Note 2.125% 30/09/2024 16,201
6,268,000 United States Treasury Note 2.125% 15/08/2021 6,247 16,158,000 United States Treasury Note 1.125% 30/06/2021 15,491
6,384,000 United States Treasury Note 1.625% 15/11/2022 6,178 15,630,000 United States Treasury Note 2.5% 31/01/2025 15,388
15,787,000 United States Treasury Note 1.75% 30/09/2022 15,266
16,005,000 United States Treasury Note 1.25% 31/07/2023 14,927
15,151,600 United States Treasury Note 1.375% 31/05/2021 14,657
15,191,000 United States Treasury Note 1.125% 31/08/2021 14,521
13,982,000 United States Treasury Note 2.875% 30/04/2025 13,972
The CBI requires a Schedule of material changes in the composition of the portfolio during the financial year. These are defined as aggregate purchases of a security exceeding one per cent of the total value of purchases for the financial year and aggregate disposals greater than one per cent of the total value of sales. At a minimum the largest 20 purchases and 20 sales must be given or all purchases and sales if less than 20. A full listing of the portfolio changes for the financial year is available, upon request, at no cost from the Administrator.

iSHARES VII PLC
Schedule of Material Purchases and Sales (unaudited) (continued) iSHARES $ TREASURY BOND 7-10YR UCITS ETF USD (Acc) For the financial year ended 31 July 2018
[ 2 6 4 ] i S H A R E S V I I P L C A N N U A L R E P O R T
Holding Investments Proceeds
$’000 Holding Investments Cost
$’000
Sales Purchases
29,696,000 United States Treasury Note/Bond 2.125% 15/05/2025 28,529 30,006,000 United States Treasury Note/Bond 2.25% 15/08/2027 29,196
28,500,000 United States Treasury Note/Bond 2% 15/02/2025 27,249 29,665,700 United States Treasury Note/Bond 2% 15/08/2025 28,460
22,543,700 United States Treasury Note/Bond 2% 15/08/2025 21,440 29,484,000 United States Treasury Note/Bond 2.25% 15/11/2027 28,340
16,228,000 United States Treasury Note/Bond 2.25% 15/11/2024 16,221 27,339,000 United States Treasury Note/Bond 2.375% 15/05/2027 26,796
15,321,000 United States Treasury Note/Bond 2.375% 15/05/2027 14,854 27,045,000 United States Treasury Note/Bond 2.25% 15/11/2025 26,325
15,882,000 United States Treasury Note/Bond 1.625% 15/02/2026 14,639 26,007,000 United States Treasury Note/Bond 2.75% 15/02/2028 25,792
14,922,000 United States Treasury Note/Bond 2.25% 15/02/2027 14,350 25,720,000 United States Treasury Note/Bond 1.625% 15/02/2026 23,866
14,803,000 United States Treasury Note/Bond 2.25% 15/11/2025 14,350 23,786,000 United States Treasury Note/Bond 2.25% 15/02/2027 23,010
13,905,000 United States Treasury Note/Bond 1.625% 15/05/2026 12,788 24,075,000 United States Treasury Note/Bond 1.625% 15/05/2026 22,277
13,867,000 United States Treasury Note/Bond 1.5% 15/08/2026 12,606 23,177,000 United States Treasury Note/Bond 2% 15/11/2026 22,029
13,099,000 United States Treasury Note/Bond 2% 15/11/2026 12,337 23,613,000 United States Treasury Note/Bond 1.5% 15/08/2026 21,624
11,606,000 United States Treasury Note/Bond 2.25% 15/08/2027 11,042 20,880,000 United States Treasury Note/Bond 2.125% 15/05/2025 20,288
10,524,000 United States Treasury Note/Bond 2.25% 15/11/2027 9,940 19,380,000 United States Treasury Note/Bond 2% 15/02/2025 18,783
8,414,000 United States Treasury Note/Bond 2.375% 15/08/2024 8,645 13,777,200 United States Treasury Note/Bond 2.875% 15/05/2028 13,829
6,647,000 United States Treasury Note/Bond 2.75% 15/02/2028 6,547 7,108,000 United States Treasury Note/Bond 2.25% 15/11/2024 7,152
2,511,000 United States Treasury Note/Bond 6.75% 15/08/2026 3,279 4,284,000 United States Treasury Note/Bond 6.125% 15/11/2027 5,580
1,653,000 United States Treasury Note/Bond 6% 15/02/2026 2,042 3,251,000 United States Treasury Note/Bond 6.75% 15/08/2026 4,256
1,564,000 United States Treasury Note/Bond 6.125% 15/11/2027 1,984 2,871,000 United States Treasury Note/Bond 6% 15/02/2026 3,586
1,295,000 United States Treasury Note/Bond 7.625% 15/02/2025 1,722 1,904,000 United States Treasury Note/Bond 6.375% 15/08/2027 2,542
1,537,200 United States Treasury Note/Bond 2.875% 15/05/2028 1,540 1,881,000 United States Treasury Note/Bond 6.5% 15/11/2026 2,457
The CBI requires a Schedule of material changes in the composition of the portfolio during the financial year. These are defined as aggregate purchases of a security exceeding one per cent of the total value of purchases for the financial year and aggregate disposals greater than one per cent of the total value of sales. At a minimum the largest 20 purchases and 20 sales must be given or all purchases and sales if less than 20. A full listing of the portfolio changes for the financial year is available, upon request, at no cost from the Administrator.

iSHARES VII PLC
Schedule of Material Purchases and Sales (unaudited) (continued) iSHARES € GOVT BOND 1-3YR UCITS ETF EUR (Acc) For the financial year ended 31 July 2018
i S H A R E S V I I P L C A N N U A L R E P O R T [ 2 6 5 ]
Holding Investments Proceeds
€’000 Holding Investments Cost
$’000
Sales Purchases
59,836,000 Bundesobligation 0.5% 12/04/2019 60,510 60,638,000 Italy Buoni Poliennali Del Tesoro 0.2% 15/10/2020 60,809
50,018,000 Italy Buoni Poliennali Del Tesoro 0.1% 15/04/2019 50,255 59,836,000 Bundesobligation 0.5% 12/04/2019 60,650
48,467,000 Spain Government Bond 0.25% 31/01/2019 48,785 54,989,051 French Republic Government Bond OAT 0%
47,698,000 Italy Buoni Poliennali Del Tesoro 0.05% 15/10/2019 47,864 25/02/2020 55,501
43,653,000 Italy Buoni Poliennali Del Tesoro 0.35% 15/06/2020 44,032 47,948,000 Italy Buoni Poliennali Del Tesoro 0.35% 15/06/2020 48,295
32,958,000 Italy Buoni Poliennali Del Tesoro 0.2% 15/10/2020 33,105 42,900,000 Spain Government Bond 0.05% 31/01/2021 43,024
24,344,000 Bundesschatzanweisungen 0%14/06/2019 24,502 40,458,000 Italy Buoni Poliennali Del Tesoro 0.05% 15/10/2019 40,604
24,090,000 Spain Government Bond 0.05% 31/01/2021 24,200 37,578,000 French Republic Government Bond OAT
23,560,000 Italy Buoni Poliennali Del Tesoro 0.3% 15/10/2018 23,710 0% 25/02/2021 37,985
15,309,051 French Republic Government Bond OAT 0% 27,419,000 Italy Buoni Poliennali Del Tesoro 0.1% 15/04/2019 27,565
25/02/2020 15,447 25,845,000 Bundesschatzanweisungen 0% 13/03/2020 26,133
5,205,000 Bundesschatzanweisungen 0% 13/03/2020 5,263 25,854,000 Bundesschatzanweisungen 0%13/12/2019 26,116
5,054,000 Bundesschatzanweisungen 0% 13/12/2019 5,105 25,854,000 Bundesschatzanweisungen 0% 13/09/2019 26,082
5,054,000 Bundesschatzanweisungen 0% 13/09/2019 5,097 24,344,000 Bundesschatzanweisungen 0% 14/06/2019 24,523
4,298,000 French Republic Government Bond OAT 0% 18,364,000 Italy Buoni Poliennali Del Tesoro 0.05% 15/04/2021 18,084
25/02/2021 4,343 17,226,000 Bundesschatzanweisungen 0%
2,044,000 Italy Buoni Poliennali Del Tesoro 0.05% 15/04/2021 2,001 12/06/2020 17,459
1,386,000 Bundesschatzanweisungen 0% 12/06/2020 1,402 14,690,000 Spain Government Bond 0.25% 31/01/2019 14,795
799,000 Italy Buoni Poliennali Del Tesoro 0.3% 15/10/2018 804
The CBI requires a Schedule of material changes in the composition of the portfolio during the financial year. These are defined as aggregate purchases of a security exceeding one per cent of the total value of purchases for the financial year and aggregate disposals greater than one per cent of the total value of sales. At a minimum the largest 20 purchases and 20 sales must be given or all purchases and sales if less than 20. A full listing of the portfolio changes for the financial year is available, upon request, at no cost from the Administrator.

iSHARES VII PLC
Schedule of Material Purchases and Sales (unaudited) (continued) iSHARES € GOVT BOND 3-7YR UCITS ETF For the financial year ended 31 July 2018
[ 2 6 6 ] i S H A R E S V I I P L C A N N U A L R E P O R T
Holding Investments Proceeds
€’000 Holding Investments Cost
€’000
Sales Purchases
10,903,835 French Republic Government Bond OAT 3% 14,109,000 French Republic Government Bond OAT 1.75%
25/04/2022 12,356 25/11/2024 15,615
11,389,000 Italy Buoni Poliennali Del Tesoro 0.45% 01/06/2021 11,394 9,098,000 Italy Buoni Poliennali Del Tesoro 3.75% 01/09/2024 10,446
10,200,000 French Republic Government Bond OAT 2.5% 9,452,000 French Republic Government Bond OAT 1.75%
25/10/2020 11,134 25/05/2023 10,348
9,242,000 Spain Government Bond 5.5% 30/04/2021 10,856 8,905,835 French Republic Government Bond OAT 3%
9,114,000 Italy Buoni Poliennali Del Tesoro 3.75% 01/03/2021 10,123 25/04/2022 10,091
8,490,000 French Republic Government Bond OAT 1.75% 8,058,000 Spain Government Bond 2.75% 31/10/2024 9,103
25/05/2023 9,305 8,583,000 French Republic Government Bond OAT 0.5%
7,284,000 Italy Buoni Poliennali Del Tesoro 3.75% 01/05/2021 8,097 25/05/2025 8,746
French Republic Government Bond OAT 2.25% 8,635,000 Spain Government Bond 0.4% 30/04/2022 8,702
7,056,000 25/05/2024 7,964 7,754,000 Italy Buoni Poliennali Del Tesoro 2.5% 01/12/2024 8,359
7,594,000 Spain Government Bond 0.4% 30/04/2022 7,670 7,202,000 Netherlands Government Bond 2% 15/07/2024 8,089
6,566,000 Spain Government Bond 4.85% 31/10/2020 7,559 7,493,000 Bundesrepublik Deutschland Bundesanleihe 1%
6,760,000 Italy Buoni Poliennali Del Tesoro 4% 01/09/2020 7,535 15/08/2024 8,011
7,224,000 French Republic Government Bond OAT 0.25% 7,819,000 Bundesrepublik Deutschland Bundesanleihe 0.5%
25/11/2020 7,382 15/02/2025 7,954
6,412,000 French Republic Government Bond OAT 3.25% 6,770,000 French Republic Government Bond OAT 3.25%
25/10/2021 7,248 25/10/2021 7,643
5,994,000 Bundesrepublik Deutschland Bundesanleihe 3% 6,612,000 French Republic Government Bond OAT 2.25%
04/07/2020 6,629 25/05/2024 7,447
5,424,000 Italy Buoni Poliennali Del Tesoro 5.5% 01/11/2022 6,603 6,318,000 French Republic Government Bond OAT 2.25%
6,444,000 French Republic Government Bond OAT 0% 25/10/2022 7,010
25/05/2021 6,521 6,691,000 Italy Buoni Poliennali Del Tesoro 0.45% 01/06/2021 6,740
5,952,753 Bundesrepublik Deutschland Bundesanleihe 1.5% 6,090,000 Bundesrepublik Deutschland Bundesanleihe 1.75% 6,639
15/05/2023 6,492 04/07/2022
5,592,000 Italy Buoni Poliennali Del Tesoro 4.75% 01/09/2021 6,334 6,596,000 French Republic Government Bond OAT 0%
5,625,000 Bundesrepublik Deutschland Bundesanleihe 2.5% 25/05/2022 6,633
04/01/2021 6,119 6,444,000 French Republic Government Bond OAT 0%
5,119,000 Italy Buoni Poliennali Del Tesoro 3.75% 01/09/2024 5,916 25/05/2021 6,507
5,560,000 Italy Buoni Poliennali Del Tesoro 0.95% 15/03/2023 5,600 6,444,000 French Republic Government Bond OAT 0%
4,752,000 French Republic Government Bond OAT 2.25% 25/03/2023 6,480
25/10/2022 5,275 6,237,000 Italy Buoni Poliennali Del Tesoro 1.2% 01/04/2022 6,352
5,100,000 Bundesobligation 0.25% 16/10/2020 5,237 5,785,753 Bundesrepublik Deutschland Bundesanleihe 1.5%
4,389,000 Spain Government Bond 3.8% 30/04/2024 5,218 15/05/2023 6,309
4,520,000 Bundesrepublik Deutschland Bundesanleihe 3.25% 5,271,000 Spain Government Bond 3.8% 30/04/2024 6,273
04/07/2021 5,086 5,432,000 Spain Government Bond 1.6% 30/04/2025 5,743
4,816,000 Italy Buoni Poliennali Del Tesoro 0.65% 01/11/2020 4,907 5,626,000 Bundesobligation 0% 08/10/2021 5,697
4,166,000 Italy Buoni Poliennali Del Tesoro 4.5% 01/03/2024 4,872 5,373,000 Italy Buoni Poliennali Del Tesoro 1.85% 15/05/2024 5,510
4,728,000 Spain Government Bond 0.75% 30/07/2021 4,852 5,432,000 Bundesobligation 0% 08/04/2022 5,491
4,595,000 Italy Buoni Poliennali Del Tesoro 1.45% 15/09/2022 4,755 5,227,000 Italy Buoni Poliennali Del Tesoro 1.45% 15/09/2022 5,391
4,250,000 Bundesrepublik Deutschland Bundesanleihe 2.25% 5,212,000 Italy Buoni Poliennali Del Tesoro 1.45% 15/11/2024 5,228
04/09/2020 4,613 4,504,000 Bundesrepublik Deutschland Bundesanleihe 3.25%
04/07/2021 5,083

iSHARES VII PLC
Schedule of Material Purchases and Sales (unaudited) (continued) iSHARES € GOVT BOND 3-7YR UCITS ETF (continued) For the financial year ended 31 July 2018
i S H A R E S V I I P L C A N N U A L R E P O R T [ 2 6 7 ]
Holding Investments Proceeds
€’000 Holding Investments Cost
€’000
Sales (cont) Purchases (cont)
4,170,000 Bundesrepublik Deutschland Bundesanleihe 1.75% 5,191,000 Italy Buoni Poliennali Del Tesoro 1.5% 01/06/2025 4,886
04/07/2022 4,542 4,105,945 Netherlands Government Bond 3.25% 15/07/2021 4,638
4,050,000 Netherlands Government Bond 3.5% 15/07/2020 4,534 3,810,000 Italy Buoni Poliennali Del Tesoro 5.5% 01/11/2022 4,611
3,729,000 French Republic Government Bond OAT 1.75% 3,978,000 Italy Buoni Poliennali Del Tesoro 4.75% 01/09/2021 4,562
25/11/2024 4,085 3,697,000 Italy Buoni Poliennali Del Tesoro 4.5% 01/03/2024 4,367
3,168,000 Spain Government Bond 5.85% 31/01/2022 3,887 3,564,000 Spain Government Bond 5.85% 31/01/2022 4,362
3,080,000 Spain Government Bond 5.4% 31/01/2023 3,840 3,465,000 Spain Government Bond 5.4% 31/01/2023 4,315
3,355,945 Netherlands Government Bond 3.25% 15/07/2021 3,780 4,011,000 Italy Buoni Poliennali Del Tesoro 2.15% 15/12/2021 4,242
3,080,000 Spain Government Bond 4.4% 31/10/2023 3,744 3,465,000 Spain Government Bond 4.4% 31/10/2023 4,210
3,402,000 Spain Government Bond 1.15% 30/07/2020 3,536 4,158,000 Spain Government Bond 0.45% 31/10/2022 4,205
2,992,000 Italy Buoni Poliennali Del Tesoro 5% 01/03/2022 3,509 4,145,000 Italy Buoni Poliennali Del Tesoro 0.9% 01/08/2022 4,174
3,201,000 Bundesrepublik Deutschland Bundesanleihe 2.25% 3,366,000 Italy Buoni Poliennali Del Tesoro 5% 01/03/2022 3,931
04/09/2021 3,503 3,248,000 Spain Government Bond 5.5% 30/04/2021 3,844
2,904,000 Italy Buoni Poliennali Del Tesoro 4.5% 01/05/2023 3,412 3,267,000 Italy Buoni Poliennali Del Tesoro 4.5% 01/05/2023 3,823
2,816,000 Italy Buoni Poliennali Del Tesoro 5.5% 01/09/2022 3,401 3,168,000 Italy Buoni Poliennali Del Tesoro 5.5% 01/09/2022 3,809
3,168,000 Bundesrepublik Deutschland Bundesanleihe 1% 3,600,000 Spain Government Bond 0.75% 30/07/2021 3,692
15/08/2024 3,352 3,265,000 Bundesrepublik Deutschland Bundesanleihe 1.5%
2,877,000 Netherlands Government Bond 2% 15/07/2024 3,229 15/05/2024 3,556
3,168,000 Bundesrepublik Deutschland Bundesanleihe 2%
04/01/2022 3,452
The CBI requires a Schedule of material changes in the composition of the portfolio during the financial year. These are defined as aggregate purchases of a security exceeding one per cent of the total value of purchases for the financial year and aggregate disposals greater than one per cent of the total value of sales. At a minimum the largest 20 purchases and 20 sales must be given or all purchases and sales if less than 20. A full listing of the portfolio changes for the financial year is available, upon request, at no cost from the Administrator.

iSHARES VII PLC
Schedule of Material Purchases and Sales (unaudited) (continued) iSHARES € GOVT BOND 7-10YR UCITS ETF EUR (Acc) For the financial year ended 31 July 2018
[ 2 6 8 ] i S H A R E S V I I P L C A N N U A L R E P O R T
Holding Investments Proceeds
€’000 Holding Investments Cost
€’000
Sales Purchases
3,693,000 French Republic Government Bond OAT 0.5% 2,405,000 Bundesrepublik Deutschland Bundesanleihe 0.5%
25/05/2025 3,755 15/08/2027 2,435
3,027,000 French Republic Government Bond OAT 1.75% 2,329,000 French Republic Government Bond OAT 0.75%
25/11/2024 3,369 25/05/2028 2,350
2,480,000 Bundesrepublik Deutschland Bundesanleihe 0.5% 2,150,000 French Republic Government Bond OAT 1%
15/02/2025 2,526 25/05/2027 2,218
2,177,000 Spain Government Bond 2.75% 31/10/2024 2,459 1,987,000 Spain Government Bond 1.45% 31/10/2027 1,987
2,151,000 Spain Government Bond 1.6% 30/04/2025 2,268 1,880,000 Italy Buoni Poliennali Del Tesoro 2.05% 01/08/2027 1,898
2,044,000 Italy Buoni Poliennali Del Tesoro 2.5% 01/12/2024 2,216 1,692,000 Bundesrepublik Deutschland Bundesanleihe 0%
2,016,000 Italy Buoni Poliennali Del Tesoro 1.5% 01/06/2025 1,933 15/08/2026 1,640
1,360,000 Italy Buoni Poliennali Del Tesoro 3.75% 01/09/2024 1,563 1,456,000 Netherlands Government Bond 0.75% 15/07/2027 1,479
1,320,000 Bundesrepublik Deutschland Bundesanleihe 1% 1,445,000 Bundesrepublik Deutschland Bundesanleihe 0.5%
15/08/2024 1,422 15/02/2028 1,434
1,159,000 Netherlands Government Bond 2% 15/07/2024 1,306 1,405,000 Italy Buoni Poliennali Del Tesoro 2% 01/02/2028 1,386
1,133,000 French Republic Government Bond OAT 1% 1,377,000 Spain Government Bond 1.4% 30/04/2028 1,366
25/05/2027 1,166 1,185,000 French Republic Government Bond OAT 0.5%
1,016,000 Spain Government Bond 1.95% 30/04/2026 1,082 25/05/2025 1,208
870,000 Spain Government Bond 2.15% 31/10/2025 938 991,000 Spain Government Bond 1.95% 30/04/2026 1,049
868,000 Bundesrepublik Deutschland Bundesanleihe 0.5% 918,000 French Republic Government Bond OAT 1.75%
15/02/2026 885 25/11/2024 1,019
861,000 Italy Buoni Poliennali Del Tesoro 1.6% 01/06/2026 849 960,000 French Republic Government Bond OAT 0.5%
836,000 French Republic Government Bond OAT 0.5% 25/05/2026 967
25/05/2026 836 972,000 Bundesrepublik Deutschland Bundesanleihe 0.25%
757,000 Bundesrepublik Deutschland Bundesanleihe 1% 15/02/2027 965
15/08/2025 804 867,000 French Republic Government Bond OAT 0.25%
813,000 French Republic Government Bond OAT 0.25% 25/11/2026 844
25/11/2026 790 808,000 Bundesrepublik Deutschland Bundesanleihe 0.5%
755,000 French Republic Government Bond OAT 1% 15/02/2025 837
25/11/2025 789 764,000 Spain Government Bond 1.6% 30/04/2025 800
772,000 Bundesrepublik Deutschland Bundesanleihe 0.25% 639,000 Spain Government Bond 2.15% 31/10/2025 688
15/02/2027 761 681,000 Italy Buoni Poliennali Del Tesoro 1.6% 01/06/2026 679
740,000 Spain Government Bond 1.3% 31/10/2026 743 613,000 Bundesrepublik Deutschland Bundesanleihe 1%
712,000 Italy Buoni Poliennali Del Tesoro 2% 01/12/2025 726 15/08/2025 658
647,000 Netherlands Government Bond 0.5% 15/07/2026 650 635,000 Italy Buoni Poliennali Del Tesoro 2% 01/12/2025 657
620,000 Bundesrepublik Deutschland Bundesanleihe 0.5% 637,000 Netherlands Government Bond 0.5% 15/07/2026 647
15/08/2027 621 592,000 French Republic Government Bond OAT 1%
564,000 Netherlands Government Bond 0.25% 15/07/2025 564 25/11/2025 622
503,000 Italy Buoni Poliennali Del Tesoro 2.05% 01/08/2027 508 555,000 Bundesrepublik Deutschland Bundesanleihe 0.5%
481,000 Italy Buoni Poliennali Del Tesoro 2.2% 01/06/2027 494 15/02/2026 572
477,000 Spain Government Bond 1.5% 30/04/2027 483 542,000 Spain Government Bond 1.5% 30/04/2027 546
492,000 Italy Buoni Poliennali Del Tesoro 1.25% 01/12/2026 471 480,000 Spain Government Bond 1.3% 31/10/2026 479
423,000 Spain Government Bond 1.45% 31/10/2027 426 445,000 Italy Buoni Poliennali Del Tesoro 1.25% 01/12/2026 424
385,000 Netherlands Government Bond 0.75% 15/07/2027 391 420,000 Italy Buoni Poliennali Del Tesoro 1.5% 01/06/2025 419

iSHARES VII PLC
Schedule of Material Purchases and Sales (unaudited) (continued) iSHARES € GOVT BOND 7-10YR UCITS ETF EUR (Acc) (continued) For the financial year ended 31 July 2018
i S H A R E S V I I P L C A N N U A L R E P O R T [ 2 6 9 ]
Holding Investments Cost
€’000
Purchases (cont)
372,000 Spain Government Bond 2.75% 31/10/2024 419
398,000 Italy Buoni Poliennali Del Tesoro 2.2% 01/06/2027 408
334,000 Italy Buoni Poliennali Del Tesoro 2.5% 01/12/2024 357
The CBI requires a Schedule of material changes in the composition of the portfolio during the financial year. These are defined as aggregate purchases of a security exceeding one per cent of the total value of purchases for the financial year and aggregate disposals greater than one per cent of the total value of sales. At a minimum the largest 20 purchases and 20 sales must be given or all purchases and sales if less than 20. A full listing of the portfolio changes for the financial year is available, upon request, at no cost from the Administrator.

iSHARES VII PLC
Schedule of Material Purchases and Sales (unaudited) (continued) iSHARES CORE EURO STOXX 50 UCITS ETF For the financial year ended 31 July 2018
[ 2 7 0 ] i S H A R E S V I I P L C A N N U A L R E P O R T
Holding Investments Proceeds
€’000 Holding Investments Cost
€’000
Sales Purchases
516,296 Total SA 25,077 578,390 Total SA 28,287
340,849 Daimler AG 22,010 269,649 SAP SE 23,973
114,343 Allianz SE 21,583 142,486 ASML Holding NV 23,094
199,021 SAP SE 18,400 164,343 Bayer AG 16,691
162,521 Siemens AG 17,924 72,623 Unibail-Rodamco SE 13,957
369,595 Unilever NV 17,121 108,456 Siemens AG 12,381
3,081,526 Banco Santander SA 16,303 194,420 BNP Paribas SA 12,355
162,423 Bayer AG 16,276 2,215,169 Banco Santander SA 12,085
226,236 Sanofi 15,402 126,732 Anheuser-Busch InBev SA/NV 11,289
177,787 BASF SE 15,396 58,125 Allianz SE 10,921
161,076 Airbus SE 14,692 119,302 BASF SE 10,355
54,958 LVMH Moet Hennessy Louis Vuitton SE 14,444 126,935 Airbus SE 10,320
211,608 BNP Paribas SA 12,829 125,685 Sanofi 9,063
144,059 Anheuser-Busch InBev SA/NV 12,780 33,720 LVMH Moet Hennessy Louis Vuitton SE 8,360
75,555 ASML Holding NV 12,337 172,517 Unilever NV 8,067
743,288 ING Groep NV 10,461 118,472 Danone SA 7,974
112,944 Vinci SA 9,343 531,804 Deutsche Telekom AG 7,624
48,889 L'Oreal SA 9,294 109,441 Daimler AG 7,446
401,987 AXA SA 9,193 506,536 ING Groep NV 7,440
124,318 Schneider Electric SE 8,978 888,825 Telefonica SA 7,169
638,407 Deutsche Telekom AG 8,916 2,323,907 Intesa Sanpaolo SpA 6,724
83,259 Air Liquide SA 8,742 270,644 AXA SA 6,640
1,285,360 Banco Bilbao Vizcaya Argentaria SA 8,476 35,057 L'Oreal SA 6,582
2,815,149 Intesa Sanpaolo SpA 8,142 78,129 Vinci SA 6,464
116,602 Danone SA 7,732 132,757 Cie de Saint-Gobain 6,230
1,496,365 Enel SpA 7,549 860,543 Banco Bilbao Vizcaya Argentaria SA 6,045
489,800 Eni SpA 7,191 930,339 Iberdrola SA 5,958
400,811 Koninklijke Ahold Delhaize NV 7,162 56,017 Air Liquide SA 5,910
37,003 Muenchener Rueckversicherungs-Gesellschaft AG 6,817 405,591 Engie SA 5,734
1,460,621 Nokia Oyj 6,815 158,818 Deutsche Post AG 5,659
36,449 Adidas AG 6,795 353,927 Orange SA 5,087
1,075,249 Iberdrola SA 6,782 1,003,079 Enel SpA 5,041
842,430 Telefonica SA 6,762 263,266 Koninklijke Ahold Delhaize NV 4,986
186,776 Deutsche Post AG 6,739 327,956 Eni SpA 4,677
155,757 Societe Generale SA 6,644 104,610 Societe Generale SA 4,587
70,730 Safran SA 6,443 62,266 Schneider Electric SE 4,418
36,702 Volkswagen AG 5,895 47,903 Safran SA 4,313
214,569 Industria de Diseno Textil SA 5,827 131,949 Koninklijke Philips NV 4,313
404,870 Orange SA 5,817 143,757 Industria de Diseno Textil SA 4,212

iSHARES VII PLC
Schedule of Material Purchases and Sales (unaudited) (continued) iSHARES CORE EURO STOXX 50 UCITS ETF (continued) For the financial year ended 31 July 2018
i S H A R E S V I I P L C A N N U A L R E P O R T [ 2 7 1 ]
Holding Investments Proceeds
€’000 Holding Investments Cost
€’000
Sales (cont) Purchases (cont)
172,971 Koninklijke Philips NV 5,782 22,985 Adidas AG 4,207
64,048 Bayerische Motoren Werke AG 5,515 320,909 Deutsche Bank AG 3,968
75,643 Fresenius SE & Co KGaA 4,968 25,044 Volkswagen AG 3,964
111,357 Cie de Saint-Gobain 4,966
The CBI requires a Schedule of material changes in the composition of the portfolio during the financial year. These are defined as aggregate purchases of a security exceeding one per cent of the total value of purchases for the financial year and aggregate disposals greater than one per cent of the total value of sales. At a minimum the largest 20 purchases and 20 sales must be given or all purchases and sales if less than 20. A full listing of the portfolio changes for the financial year is available, upon request, at no cost from the Administrator.

iSHARES VII PLC
Schedule of Material Purchases and Sales (unaudited) (continued) iSHARES CORE MSCI PACIFIC EX-JAPAN UCITS ETF For the financial year ended 31 July 2018
[ 2 7 2 ] i S H A R E S V I I P L C A N N U A L R E P O R T
Holding Investments Proceeds
$’000 Holding Investments Cost
$’000
Sales Purchases
409,389 Commonwealth Bank of Australia 24,062 976,361 Commonwealth Bank of Australia 56,670
2,849,600 AIA Group Ltd 23,704 6,626,000 AIA Group Ltd 56,021
787,922 Westpac Banking Corp 18,496 1,882,798 Westpac Banking Corp 43,758
755,878 BHP Billiton Ltd 17,104 1,758,712 BHP Billiton Ltd 41,472
692,544 Australia & New Zealand Banking Group Ltd 15,326 1,595,940 Australia & New Zealand Banking Group Ltd 34,944
627,394 National Australia Bank Ltd 13,969 1,507,118 National Australia Bank Ltd 33,610
2,083,895 Westfield Corp 13,786 246,873 CSL Ltd 30,807
107,755 CSL Ltd 13,370 624,470 Wesfarmers Ltd 21,186
268,154 Wesfarmers Ltd 9,220 997,000 DBS Group Holdings Ltd 19,710
639,500 CK Hutchison Holdings Ltd 7,584 598,886 Hong Kong Exchanges & Clearing Ltd 18,976
412,500 DBS Group Holdings Ltd 7,469 1,494,500 CK Hutchison Holdings Ltd 18,185
307,077 Woolworths Group Ltd 6,609 726,293 Woolworths Group Ltd 15,488
224,600 Hong Kong Exchanges & Clearing Ltd 6,563 951,000 Sun Hung Kai Properties Ltd 15,384
76,531 Macquarie Group Ltd 6,186 1,632,000 Oversea-Chinese Banking Corp Ltd 15,077
108,171 Rio Tinto Ltd 6,176 177,673 Macquarie Group Ltd 14,560
369,000 Sun Hung Kai Properties Ltd 5,790 681,500 United Overseas Bank Ltd 13,775
215,052 Woodside Petroleum Ltd 5,345 564,678 Woodside Petroleum Ltd 13,772
601,900 Oversea-Chinese Banking Corp Ltd 5,127 229,285 Rio Tinto Ltd 13,723
1,936,600 Singapore Telecommunications Ltd 4,958 4,571,900 Singapore Telecommunications Ltd 11,843
511,125 Transurban Group 4,695 1,319,000 CK Asset Holdings Ltd 11,289
514,500 Link REIT 4,563 1,212,814 Transurban Group 11,082
1,302,000 Galaxy Entertainment Group Ltd 10,509
1,169,000 Link REIT 10,328
417,700 Hang Seng Bank Ltd 10,200
2,033,000 BOC Hong Kong Holdings Ltd 10,112
The CBI requires a Schedule of material changes in the composition of the portfolio during the financial year. These are defined as aggregate purchases of a security exceeding one per cent of the total value of purchases for the financial year and aggregate disposals greater than one per cent of the total value of sales. At a minimum the largest 20 purchases and 20 sales must be given or all purchases and sales if less than 20. A full listing of the portfolio changes for the financial year is available, upon request, at no cost from the Administrator.

iSHARES VII PLC
Schedule of Material Purchases and Sales (unaudited) (continued) iSHARES CORE S&P 500 UCITS ETF For the financial year ended 31 July 2018
i S H A R E S V I I P L C A N N U A L R E P O R T [ 2 7 3 ]
Holding Investments Proceeds
$’000 Holding Investments Cost
$’000
Sales Purchases
1,115,514 Apple Inc 193,505 1,799,596 Apple Inc 315,302
1,341,142 Microsoft Corp 118,602 2,873,851 Microsoft Corp 262,224
70,364 Amazon.com Inc 93,547 159,138 Amazon.com Inc 226,181
695,756 JPMorgan Chase & Co 73,833 934,926 Facebook Inc 171,443
407,332 Facebook Inc 73,297 748,919 Berkshire Hathaway Inc 144,246
328,423 Berkshire Hathaway Inc 64,420 1,235,134 JPMorgan Chase & Co 130,863
458,769 Johnson & Johnson 61,428 989,179 Johnson & Johnson 128,659
2,040,287 Bank of America Corp 59,070 1,586,343 Exxon Mobil Corp 127,405
723,891 Exxon Mobil Corp 58,958 119,191 Alphabet Inc Class 'C' 127,303
51,582 Alphabet Inc Class 'C' 54,907 113,041 Alphabet Inc 122,182
50,881 Alphabet Inc 54,626 3,416,207 Bank of America Corp 98,154
633,704 Citigroup Inc 46,142 728,266 Chevron Corp 87,251
801,093 Wells Fargo & Co 45,949 1,566,264 Wells Fargo & Co 86,923
1,074,194 Cisco Systems Inc 43,852 2,453,746 AT&T Inc 85,315
233,338 Home Depot Inc 42,152 1,723,325 Intel Corp 81,781
1,143,744 AT&T Inc 41,014 356,117 UnitedHealth Group Inc 81,537
346,261 Visa Inc 40,912 653,522 Visa Inc 79,542
324,822 Chevron Corp 39,441 1,588,095 Verizon Communications Inc 78,208
1,086,468 Pfizer Inc 39,371 2,158,509 Pfizer Inc 77,357
450,795 Procter & Gamble Co 38,212 424,463 Home Depot Inc 77,220
The CBI requires a Schedule of material changes in the composition of the portfolio during the financial year. These are defined as aggregate purchases of a security exceeding one per cent of the total value of purchases for the financial year and aggregate disposals greater than one per cent of the total value of sales. At a minimum the largest 20 purchases and 20 sales must be given or all purchases and sales if less than 20. A full listing of the portfolio changes for the financial year is available, upon request, at no cost from the Administrator.

iSHARES VII PLC
Schedule of Material Purchases and Sales (unaudited) (continued) iSHARES DOW JONES INDUSTRIAL AVERAGE UCITS ETF For the financial year ended 31 July 2018
[ 2 7 4 ] i S H A R E S V I I P L C A N N U A L R E P O R T
Holding Investments Proceeds
$’000 Holding Investments Cost
$’000
Sales Purchases
47,681 Boeing Co 16,112 49,872 Boeing Co 14,927
47,764 Goldman Sachs Group Inc 11,704 49,956 Goldman Sachs Group Inc 12,339
47,748 UnitedHealth Group Inc 11,044 49,989 3M Co 11,315
47,797 3M Co 10,288 49,939 UnitedHealth Group Inc 11,073
47,820 Home Depot Inc 8,787 50,011 Home Depot Inc 8,923
47,837 Apple Inc 8,266 50,026 Apple Inc 8,582
47,880 McDonald's Corp 7,682 50,070 McDonald's Corp 8,343
47,928 International Business Machines Corp 7,147 50,120 International Business Machines Corp 7,685
47,904 Caterpillar Inc 7,126 50,092 Caterpillar Inc 7,208
47,585 Travelers Cos Inc 6,414 49,776 Johnson & Johnson 6,751
47,586 Johnson & Johnson 6,108 49,775 Travelers Cos Inc 6,673
47,590 United Technologies Corp 5,995 97,300 Walgreens Boots Alliance Inc 6,543
47,963 Visa Inc 5,916 49,779 United Technologies Corp 6,156
47,590 Chevron Corp 5,664 49,779 Chevron Corp 5,906
47,598 JPMorgan Chase & Co 5,213 50,150 Visa Inc 5,821
47,621 Walt Disney Co 4,863 49,782 JPMorgan Chase & Co 5,242
47,633 American Express Co 4,591 49,810 Walt Disney Co 5,200
47,649 Microsoft Corp 4,445 49,817 American Express Co 4,761
47,698 Walmart Inc 4,282 49,884 Walmart Inc 4,549
47,756 Procter & Gamble Co 3,741 49,775 Microsoft Corp 4,309
47,711 Exxon Mobil Corp 3,733 49,820 Procter & Gamble Co 4,301
47,769 Nike Inc 3,246 49,899 Exxon Mobil Corp 4,022
45,959 DowDuPont Inc 3,116 48,265 DowDuPont Inc 3,357
47,870 Merck & Co Inc 2,758 50,218 Nike Inc 3,151
48,196 Intel Corp 2,410 50,032 Merck & Co Inc 2,885
48,315 Verizon Communications Inc 2,378 50,419 Verizon Communications Inc 2,476
48,405 Coca-Cola Co 2,119 50,621 Intel Corp 2,330
48,421 Cisco Systems Inc 2,043 51,028 Coca-Cola Co 2,308
147,861 General Electric Co 1,985 50,845 Cisco Systems Inc 1,975
22,817 Du Pont De Nemours & Co 1,910 51,144 Pfizer Inc 1,834
48,659 Pfizer Inc 1,742
The CBI requires a Schedule of material changes in the composition of the portfolio during the financial year. These are defined as aggregate purchases of a security exceeding one per cent of the total value of purchases for the financial year and aggregate disposals greater than one per cent of the total value of sales. At a minimum the largest 20 purchases and 20 sales must be given or all purchases and sales if less than 20. A full listing of the portfolio changes for the financial year is available, upon request, at no cost from the Administrator.

iSHARES VII PLC
Schedule of Material Purchases and Sales (unaudited) (continued) iSHARES FTSE 100 UCITS ETF For the financial year ended 31 July 2018
i S H A R E S V I I P L C A N N U A L R E P O R T [ 2 7 5 ]
Holding Investments Proceeds
£’000 Holding Investments Cost
£’000
Sales Purchases
422,444 Worldpay Group Ltd 1,838 126,592 Ocado Group Plc 1,323
1,111,710 Old Mutual Ltd 1,740 126,661 GVC Holdings Plc 1,273
362,077 G4S Plc 999 52,469 Royal Dutch Shell Plc 1,241
178,622 Hammerson Plc 781 53,272 Micro Focus International Plc 1,241
113,268 Babcock International Group Plc 775 229,061 DS Smith Plc 1,156
204,853 Royal Mail Plc 772 87,354 Halma Plc 1,099
295,709 ConvaTec Group Plc 609 210,023 Royal Mail Plc 1,089
158,044 Merlin Entertainments Plc 571 20,704 Rightmove Plc 1,085
370,570 Quilter Plc 564 132,474 Just Eat Plc 1,028
93,165 Mediclinic International Plc 510 29,087 Berkeley Group Holdings Plc 1,022
28,667 Anglo American Plc 404 440,448 Melrose Industries Plc 994
9,555 Unilever Plc 402 172,932 BP Plc 910
9,983 Rio Tinto Plc 379 123,495 HSBC Holdings Plc 893
17,401 Royal Dutch Shell Plc 378 101,918 Informa Plc 851
33,618 Provident Financial Plc 267 315,104 Royal Bank of Scotland Group Plc 843
98,921 Melrose Industries Plc 233 390,286 Tesco Plc 813
7,887 Diageo Plc 199 193,486 Standard Life Aberdeen Plc 787
6,510 Burberry Group Plc 110 19,825 NMC Health Plc 567
1,941 Carnival Plc 92 38,549 GlaxoSmithKline Plc 544
9,083 National Grid Plc 75 21,741 Royal Dutch Shell Plc (Class 'B') 528
11,839 British American Tobacco Plc 511
117,463 Evraz Plc 453
6,970 AstraZeneca Plc 343
158,871 Vodafone Group Plc 338
477,618 Lloyds Banking Group Plc 316
15,478 Prudential Plc 291
The CBI requires a Schedule of material changes in the composition of the portfolio during the financial year. These are defined as aggregate purchases of a security exceeding one per cent of the total value of purchases for the financial year and aggregate disposals greater than one per cent of the total value of sales. At a minimum the largest 20 purchases and 20 sales must be given or all purchases and sales if less than 20. A full listing of the portfolio changes for the financial year is available, upon request, at no cost from the Administrator.

iSHARES VII PLC
Schedule of Material Purchases and Sales (unaudited) (continued) iSHARES FTSE MIB UCITS ETF EUR (Acc) For the financial year ended 31 July 2018
[ 2 7 6 ] i S H A R E S V I I P L C A N N U A L R E P O R T
Holding Investments Proceeds
€’000 Holding Investments Cost
€’000
Sales Purchases
1,508,977 Enel SpA 7,637 1,990,537 Intesa Sanpaolo SpA 5,545
2,550,516 Intesa Sanpaolo SpA 7,256 944,401 Enel SpA 4,638
485,993 Eni SpA 7,158 304,348 Eni SpA 4,518
432,924 UniCredit SpA 7,118 272,575 UniCredit SpA 4,329
253,936 Assicurazioni Generali SpA 3,908 135,316 Fiat Chrysler Automobiles NV 2,342
212,130 STMicroelectronics NV 3,754 155,506 Assicurazioni Generali SpA 2,339
212,554 Fiat Chrysler Automobiles NV 3,451 65,151 Atlantia SpA 1,680
103,980 Atlantia SpA 2,755 15,150 Ferrari NV 1,616
24,426 Ferrari NV 2,469 75,791 STMicroelectronics NV 1,458
188,935 CNH Industrial NV 1,977 128,133 CNH Industrial NV 1,320
478,158 Snam SpA 1,876 152,923 Pirelli & C SpA 1,100
2,339,326 Telecom Italia SpA 1,686 274,409 Snam SpA 1,036
30,245 Luxottica Group SpA 1,542 19,115 Luxottica Group SpA 989
275,391 Terna Rete Elettrica Nazionale SpA 1,348 1,333,861 Telecom Italia SpA 957
91,077 Tenaris SA 1,275 57,465 Tenaris SA 824
47,204 Prysmian SpA 1,212 173,993 Terna Rete Elettrica Nazionale SpA 819
20,851 Exor NV 1,188 12,931 Exor NV 761
113,715 Mediobanca Banca di Credito Finanziario SpA 1,051 29,668 Prysmian SpA 757
33,674 Moncler SpA 1,005 21,298 Moncler SpA 669
300,257 Banco BPM SpA 829 76,725 Mediobanca Banca di Credito Finanziario SpA 667
111,800 Banca Mediolanum SpA 791 91,952 Banca Mediolanum SpA 600
193,393 Unione di Banche Italiane SpA 733 192,229 Banco BPM SpA 516
111,349 Davide Campari-Milano SpA 714 132,518 Unione di Banche Italiane SpA 484
20,238 Recordati SpA 707 69,243 Davide Campari-Milano SpA 453
The CBI requires a Schedule of material changes in the composition of the portfolio during the financial year. These are defined as aggregate purchases of a security exceeding one per cent of the total value of purchases for the financial year and aggregate disposals greater than one per cent of the total value of sales. At a minimum the largest 20 purchases and 20 sales must be given or all purchases and sales if less than 20. A full listing of the portfolio changes for the financial year is available, upon request, at no cost from the Administrator. .

iSHARES VII PLC
Schedule of Material Purchases and Sales (unaudited) (continued) iSHARES MSCI BRAZIL UCITS ETF USD (Acc) For the financial year ended 31 July 2018
i S H A R E S V I I P L C A N N U A L R E P O R T [ 2 7 7 ]
Holding Investments Proceeds
$’000 Holding Investments Cost
$’000
Sales Purchases
19,947 Qualicorp Consultoria e Corretora de Seguros SA 103 17,579 Vale SA 201
18,648 Transmissora Alianca de Energia Eletrica SA 96 6,491 Magazine Luiza SA 188
10,873 CPFL Energia SA 92 34,500 Atacadao Distribuicao Comercio e Industria Ltda 160
5,766 Itau Unibanco Holding SA 71 29,757 Petrobras Distribuidora SA 145
26,315 Duratex SA 71 9,298 IRB Brasil Resseguros 120
6,512 Vale SA (Preference) 67 26,450 Rumo SA 109
16,616 Lojas Americanas SA 62 5,826 Itau Unibanco Holding SA 84
8,640 Cia Paranaense de Energia 61 5,278 Banco Bradesco SA (Preference) 59
4,088 Vale SA 53 10,231 Klabin SA 57
5,557 Banco Bradesco SA (Preference) 49 8,148 Ambev SA 55
8,060 Ambev SA 46 7,607 BRF SA 49
2,725 Equatorial Energia SA 44 12,676 Gerdau SA 45
7,235 Petroleo Brasileiro SA (Preference) 37 8,944 WEG SA 42
5,090 Petroleo Brasileiro SA 29 6,762 Petroleo Brasileiro SA (Preference) 39
3,959 B3 SA - Brasil Bolsa Balcao 25 5,528 Petroleo Brasileiro SA 32
7,796 Itausa - Investimentos Itau SA 25 8,084 Itausa - Investimentos Itau SA 30
1,761 Porto Seguro SA 20 11,926 JBS SA 29
2,050 Banco do Brasil SA 19 4,955 Suzano Papel e Celulose SA 29
2,522 Cielo SA 15 3,017 B3 SA - Brasil Bolsa Balcao 23
1,768 Banco Bradesco SA 14 1,809 Banco do Brasil SA 21
1,420 Lojas Renner SA 14 2,929 Transmissora Alianca de Energia Eletrica SA 18
1,643 Suzano Papel e Celulose SA 13
1,266 Banco Santander Brasil SA 12
The CBI requires a Schedule of material changes in the composition of the portfolio during the financial year. These are defined as aggregate purchases of a security exceeding one per cent of the total value of purchases for the financial year and aggregate disposals greater than one per cent of the total value of sales. At a minimum the largest 20 purchases and 20 sales must be given or all purchases and sales if less than 20. A full listing of the portfolio changes for the financial year is available, upon request, at no cost from the Administrator.

iSHARES VII PLC
Schedule of Material Purchases and Sales (unaudited) (continued) iSHARES MSCI CANADA UCITS ETF For the financial year ended 31 July 2018
[ 2 7 8 ] i S H A R E S V I I P L C A N N U A L R E P O R T
Holding Investments Proceeds
$’000 Holding Investments Cost
$’000
Sales Purchases
250,750 Royal Bank of Canada 19,339 360,936 Royal Bank of Canada 28,739
304,999 Toronto-Dominion Bank 17,107 459,219 Toronto-Dominion Bank 26,463
192,649 Bank of Nova Scotia 11,886 294,663 Bank of Nova Scotia 18,446
129,647 Canadian National Railway Co 10,368 453,698 Enbridge Inc 16,939
278,121 Suncor Energy Inc 10,022 183,558 Canadian National Railway Co 14,855
262,281 Enbridge Inc 9,307 407,184 Suncor Energy Inc 14,808
105,139 Bank of Montreal 8,090 162,244 Bank of Montreal 12,760
164,457 Brookfield Asset Management Inc 6,708 363,186 Canadian Natural Resources Ltd 12,497
190,401 Canadian Natural Resources Ltd 6,442 225,703 TransCanada Corp 10,589
138,465 TransCanada Corp 6,278 114,257 Canadian Imperial Bank of Commerce 10,388
69,018 Canadian Imperial Bank of Commerce 6,141 493,236 Manulife Financial Corp 9,916
313,934 Manulife Financial Corp 6,128 211,722 Brookfield Asset Management Inc 8,847
24,387 Canadian Pacific Railway Ltd 4,314 35,978 Canadian Pacific Railway Ltd 6,422
100,001 Sun Life Financial Inc 4,048 152,845 Sun Life Financial Inc 6,273
69,164 Magna International Inc 3,867 112,883 Alimentation Couche-Tard Inc 5,430
126,145 Teck Resources Ltd 3,216 86,244 CGI Group Inc 4,980
67,667 Alimentation Couche-Tard Inc 3,163 86,738 Magna International Inc 4,971
59,829 Nutrien Ltd 2,946 92,119 Rogers Communications Inc 4,652
58,949 Rogers Communications Inc 2,902 89,896 Nutrien Ltd 4,635
51,117 Loblaw Cos Ltd 2,665 133,959 Pembina Pipeline Corp 4,598
80,138 Pembina Pipeline Corp 2,655 288,137 Barrick Gold Corp 4,239
185,379 Barrick Gold Corp 2,632 85,612 National Bank of Canada 4,212
54,215 National Bank of Canada 2,593 116,037 Fortis Inc 4,037
4,624 Fairfax Financial Holdings Ltd 2,410 73,544 WSP Global Inc 3,877
61,962 Restaurant Brands International Inc 3,871
49,530 Franco-Nevada Corp 3,816
The CBI requires a Schedule of material changes in the composition of the portfolio during the financial year. These are defined as aggregate purchases of a security exceeding one per cent of the total value of purchases for the financial year and aggregate disposals greater than one per cent of the total value of sales. At a minimum the largest 20 purchases and 20 sales must be given or all purchases and sales if less than 20. A full listing of the portfolio changes for the financial year is available, upon request, at no cost from the Administrator.

iSHARES VII PLC
Schedule of Material Purchases and Sales (unaudited) (continued) iSHARES MSCI EM ASIA UCITS ETF For the financial year ended 31 July 2018
i S H A R E S V I I P L C A N N U A L R E P O R T [ 2 7 9 ]
Holding Investments Proceeds
$’000 Holding Investments Cost
$’000
Sales Purchases
100,300 Tencent Holdings Ltd 4,995 253,800 Tencent Holdings Ltd 13,091
83,361 Samsung Electronics Co Ltd 4,303 41,496 Samsung Electronics Co Ltd 10,244
18,635 Alibaba Group Holding Ltd 3,598 51,698 Alibaba Group Holding Ltd 9,718
436,000 Taiwan Semiconductor Manufacturing Co Ltd 3,169 1,090,000 Taiwan Semiconductor Manufacturing Co Ltd 8,657
1,873,000 Industrial & Commercial Bank of China Ltd 1,476 4,913,000 China Construction Bank Corp 4,842
4,683 Baidu Inc 1,171 12,245 Baidu Inc 3,057
111,500 China Mobile Ltd 998 276,000 China Mobile Ltd 2,773
1,064,000 China Construction Bank Corp 964 3,255,000 Industrial & Commercial Bank of China Ltd 2,722
90,000 Ping An Insurance Group Co of China Ltd 844 618,159 iShares MSCI China A UCITS ETF 2,479
10,418 SK Hynix Inc 828 701,000 Hon Hai Precision Industry Co Ltd 2,313
1,419,000 Bank of China Ltd 707 230,500 Ping An Insurance Group Co of China Ltd 2,309
15,693 Samsung Electronics Co Ltd (Preference) 669 25,968 SK Hynix Inc 1,918
224,000 China Evergrande Group 661 68,640 Housing Development Finance Corp Ltd 1,914
43,910 Siam Cement PCL 612 3,563,000 Bank of China Ltd 1,910
334,000 CNOOC Ltd 536 7,343 Samsung Electronics Co Ltd (Preference) 1,479
16,740 Housing Development Finance Corp Ltd 471 33,250 JD.com Inc 1,386
165,000 Hon Hai Precision Industry Co Ltd 437 95,642 Reliance Industries Ltd 1,379
78,000 Minth Group Ltd 435 782,000 CNOOC Ltd 1,154
14,997 Tata Consultancy Services Ltd 432 3,478 POSCO 1,111
15,467 Reliance Industries Ltd 431 3,480 NetEase Inc 1,040
The CBI requires a Schedule of material changes in the composition of the portfolio during the financial year. These are defined as aggregate purchases of a security exceeding one per cent of the total value of purchases for the financial year and aggregate disposals greater than one per cent of the total value of sales. At a minimum the largest 20 purchases and 20 sales must be given or all purchases and sales if less than 20. A full listing of the portfolio changes for the financial year is available, upon request, at no cost from the Administrator.

iSHARES VII PLC
Schedule of Material Purchases and Sales (unaudited) (continued) iSHARES MSCI EMU CHF HEDGED UCITS ETF (Acc) For the financial year ended 31 July 2018
[ 2 8 0 ] i S H A R E S V I I P L C A N N U A L R E P O R T
Holding Investments Proceeds
Fr’000 Holding Investments Cost
Fr’000
Sales Purchases
2,199 Total SA 120 1,774 Total SA 106
517 Allianz SE 119 825 Wirecard AG 92
2,133 Unilever NV 118 450 ASML Holding NV 88
1,310 Sanofi 112 704 SAP SE 81
999 SAP SE 105 547 Siemens AG 73
778 Siemens AG 103 203 LVMH Moet Hennessy Louis Vuitton SE 68
15,223 Banco Santander SA 102 690 Covestro AG 68
832 Bayer AG 100 600 Bayer AG 68
923 BASF SE 97 12,390 Banco Santander SA 67
1,116 Daimler AG 89 666 BASF SE 65
1,125 BNP Paribas SA 85 363 MTU Aero Engines AG 65
765 Anheuser-Busch InBev SA/NV 82 1,150 Unilever NV 62
279 LVMH Moet Hennessy Louis Vuitton SE 81 405 Teleperformance 61
3,864 ING Groep NV 69 773 Sanofi 60
334 ASML Holding NV 60 1,427 Smurfit Kappa Group PLC 58
575 Airbus SE 59 287 Allianz SE 58
1,960 AXA SA 58 556 Anheuser-Busch InBev SA/NV 53
253 L'Oreal SA 54 236 Unibail-Dodamco SE 52
616 Schneider Electric SE 52 1,142 Moncler SpA 52
424 Air Liquide SA 52 817 BNP Paribas SA 51
6,083 Banco Bilbao Vizcaya Argentaria SA 51 422 Airbus SE 48
6,709 Iberdrola SA 51
455 NXP Semiconductors NV 51
8,277 Enel SpA 49
2,965 Deutsche Telekom AG 49
1,116 Deutsche Post AG 48
The CBI requires a Schedule of material changes in the composition of the portfolio during the financial year. These are defined as aggregate purchases of a security exceeding one per cent of the total value of purchases for the financial year and aggregate disposals greater than one per cent of the total value of sales. At a minimum the largest 20 purchases and 20 sales must be given or all purchases and sales if less than 20. A full listing of the portfolio changes for the financial year is available, upon request, at no cost from the Administrator.

iSHARES VII PLC
Schedule of Material Purchases and Sales (unaudited) (continued) iSHARES MSCI EMU SMALL CAP UCITS ETF For the financial year ended 31 July 2018
i S H A R E S V I I P L C A N N U A L R E P O R T [ 2 8 1 ]
Holding Investments Proceeds
€’000 Holding Investments Cost
€’000
Sales Purchases
230,105 Wirecard AG 20,591 262,875 Scout24 AG 9,700
575,061 Smurfit Kappa Group Plc 20,202 202,361 ASR Nederland NV 6,935
401,264 Moncler SpA 15,519 196,115 Gemalto NV 6,795
102,025 MTU Aero Engines AG 15,404 310,446 Elis SA 6,229
113,771 Teleperformance 14,143 1,497,155 Distribuidora Internacional de Alimentacion SA 5,887
86,359 Sartorius AG 10,722 244,397 Lagardere SCA 5,663
396,323 Uniper SE 9,901 182,144 Smurfit Kappa Group Plc 5,389
149,226 Faurecia SA 9,587 1,494,070 Saipem SpA 5,073
122,659 KION Group AG 9,398 57,543 Stabilus SA 4,951
135,000 Ubisoft Entertainment SA 8,703 201,932 Boskalis Westminster 4,774
1,139,006 Davide Campari-Milano SpA 7,447 52,405 LEG Immobilien AG 4,652
92,923 1&1 Drillisch AG 5,951 125,761 Kingspan Group Plc 4,471
37,992 Wacker Chemie AG 5,279 76,190 Rubis SCA 4,445
36,705 Euler Hermes Group 4,470 42,510 Orpea 4,351
73,400 Kingspan Group Plc 2,878 127,801 Signify NV 3,993
30,435 LEG Immobilien AG 2,809 113,702 Huhtamaki Oyj 3,964
46,507 Rubis SCA 2,618 93,186 BAWAG Group AG 3,771
70,832 ASR Nederland NV 2,480 35,465 Rheinmetall AG 3,700
21,630 Orpea 2,406 1,240,766 Banco BPM SpA 3,693
20,990 Rheinmetall AG 2,185 130,521 Moncler SpA 3,581
The CBI requires a Schedule of material changes in the composition of the portfolio during the financial year. These are defined as aggregate purchases of a security exceeding one per cent of the total value of purchases for the financial year and aggregate disposals greater than one per cent of the total value of sales. At a minimum the largest 20 purchases and 20 sales must be given or all purchases and sales if less than 20. A full listing of the portfolio changes for the financial year is available, upon request, at no cost from the Administrator.

iSHARES VII PLC
Schedule of Material Purchases and Sales (unaudited) (continued) iSHARES MSCI EMU UCITS ETF For the financial year ended 31 July 2018
[ 2 8 2 ] i S H A R E S V I I P L C A N N U A L R E P O R T
Holding Investments Proceeds
€’000 Holding Investments Cost
€’000
Sales Purchases
233,417 Total SA 11,824 248,368 Total SA 11,755
92,981 SAP SE 8,733 93,766 SAP SE 8,496
46,390 Allianz SE 8,709 1,545,772 Banco Santander SA 8,467
176,639 Unilever NV 8,317 73,223 Siemens AG 8,313
73,102 Siemens AG 8,104 75,313 Bayer AG 7,780
115,827 Sanofi 7,915 49,633 ASML Holding NV 7,732
1,476,746 Banco Santander SA 7,561 88,145 BASF SE 7,710
88,020 BASF SE 7,559 39,472 Allianz SE 7,467
26,452 LVMH Moet Hennessy Louis Vuitton SE 7,524 102,030 Sanofi 7,454
75,157 Bayer AG 7,465 73,581 Anheuser-Busch InBev SA/NV 6,744
105,505 Daimler AG 6,742 26,993 LVMH Moet Hennessy Louis Vuitton SE 6,684
103,864 BNP Paribas SA 6,166 104,389 BNP Paribas SA 6,642
72,076 Anheuser-Busch InBev SA/NV 6,112 142,177 Unilever NV 6,605
35,036 ASML Holding NV 5,883 84,043 Daimler AG 5,736
54,042 Airbus SE 5,190 387,683 ING Groep NV 5,718
367,729 ING Groep NV 4,967 57,537 Wirecard AG 5,309
24,203 L'Oreal SA 4,786 25,159 Unibail-Rodamco SE 4,883
60,257 Schneider Electric SE 4,434 53,946 Airbus SE 4,798
40,614 Air Liquide SA 4,328 1,633,786 Intesa Sanpaolo SpA 4,752
182,799 AXA SA 4,113 321,032 Deutsche Telekom AG 4,585
297,255 Deutsche Telekom AG 4,072 645,886 Banco Bilbao Vizcaya Argentaria SA 4,495
808,031 Enel SpA 4,022 180,990 AXA SA 4,444
624,141 Iberdrola SA 4,019
The CBI requires a Schedule of material changes in the composition of the portfolio during the financial year. These are defined as aggregate purchases of a security exceeding one per cent of the total value of purchases for the financial year and aggregate disposals greater than one per cent of the total value of sales. At a minimum the largest 20 purchases and 20 sales must be given or all purchases and sales if less than 20. A full listing of the portfolio changes for the financial year is available, upon request, at no cost from the Administrator. .

iSHARES VII PLC
Schedule of Material Purchases and Sales (unaudited) (continued) iSHARES MSCI EMU USD HEDGED UCITS ETF (Acc) For the financial year ended 31 July 2018
i S H A R E S V I I P L C A N N U A L R E P O R T [ 2 8 3 ]
Holding Investments Proceeds
$’000 Holding Investments Cost
$’000
Sales Purchases
60,552 Total SA 3,567 124,071 Total SA 6,872
24,581 SAP SE 2,846 50,215 SAP SE 5,565
47,082 Unilever NV 2,627 833,949 Banco Santander SA 5,532
19,127 Siemens AG 2,607 42,160 Bayer AG 5,476
21,713 Bayer AG 2,520 58,017 Sanofi 5,397
11,568 Allianz SE 2,477 39,060 Siemens AG 5,387
29,394 Sanofi 2,451 22,638 Allianz SE 5,137
410,419 Banco Santander SA 2,386 47,166 BASF SE 4,967
23,032 BASF SE 2,314 85,117 Unilever NV 4,920
7,051 LVMH Moet Hennessy Louis Vuitton SE 2,283 39,230 Anheuser-Busch InBev SA/NV 4,564
28,183 Daimler AG 2,036 57,698 BNP Paribas SA 4,486
19,207 Anheuser-Busch InBev SA/NV 1,978 14,401 LVMH Moet Hennessy Louis Vuitton SE 4,197
9,575 ASML Holding NV 1,935 50,496 Daimler AG 4,040
28,180 BNP Paribas SA 1,862 21,404 ASML Holding NV 3,810
14,612 Airbus SE 1,657 200,811 ING Groep NV 3,629
98,554 ING Groep NV 1,537 170,890 Deutsche Telekom AG 3,021
6,385 L'Oreal SA 1,509 100,139 AXA SA 2,970
10,839 Air Liquide SA 1,369 29,930 Airbus SE 2,931
81,401 Deutsche Telekom AG 1,316 340,875 Banco Bilbao Vizcaya Argentaria SA 2,924
49,481 AXA SA 1,300 13,018 L'Oreal SA 2,867
21,445 Air Liquide SA 2,714
The CBI requires a Schedule of material changes in the composition of the portfolio during the financial year. These are defined as aggregate purchases of a security exceeding one per cent of the total value of purchases for the financial year and aggregate disposals greater than one per cent of the total value of sales. At a minimum the largest 20 purchases and 20 sales must be given or all purchases and sales if less than 20. A full listing of the portfolio changes for the financial year is available, upon request, at no cost from the Administrator.

iSHARES VII PLC
Schedule of Material Purchases and Sales (unaudited) (continued) iSHARES MSCI JAPAN UCITS ETF USD (Acc) For the financial year ended 31 July 2018
[ 2 8 4 ] i S H A R E S V I I P L C A N N U A L R E P O R T
Holding Investments Proceeds
$’000 Holding Investments Cost
$’000
Sales Purchases
201,900 Toyota Motor Corp 13,084 195,500 Toyota Motor Corp 12,352
765,900 Mitsubishi UFJ Financial Group Inc 5,376 929,400 Mitsubishi UFJ Financial Group Inc 6,192
53,300 SoftBank Group Corp 4,393 67,100 SoftBank Group Corp 5,391
113,200 Honda Motor Co Ltd 3,768 97,700 Sony Corp 4,359
76,600 Sony Corp 3,631 104,800 Sumitomo Mitsui Financial Group Inc 4,281
82,000 Sumitomo Mitsui Financial Group Inc 3,468 7,500 Keyence Corp 4,264
5,800 Keyence Corp 3,393 127,800 Honda Motor Co Ltd 4,135
7,600 Fast Retailing Co Ltd 3,044 140,700 KDDI Corp 3,685
114,200 KDDI Corp 3,037 9,400 Fast Retailing Co Ltd 3,610
7,400 SMC Corp 3,017 1,904,100 Mizuho Financial Group Inc 3,419
111,500 Mitsubishi Corp 2,997 15,000 Fanuc Corp 3,419
11,800 Fanuc Corp 2,857 8,400 SMC Corp 3,261
19,400 Nidec Corp 2,807 8,200 Nintendo Co Ltd 3,233
1,514,400 Mizuho Financial Group Inc 2,764 271,100 Japan Post Holdings Co Ltd 3,205
70,700 Canon Inc 2,603 21,400 Nidec Corp 2,982
13,900 Central Japan Railway Co 2,601 15,900 Central Japan Railway Co 2,935
25,200 Shin-Etsu Chemical Co Ltd 2,600 113,400 Mitsubishi Corp 2,919
6,400 Nintendo Co Ltd 2,531 55,800 Takeda Pharmaceutical Co Ltd 2,881
13,000 Tokyo Electron Ltd 2,402 28,400 Shin-Etsu Chemical Co Ltd 2,809
44,300 Takeda Pharmaceutical Co Ltd 2,364 78,100 Canon Inc 2,792
The CBI requires a Schedule of material changes in the composition of the portfolio during the financial year. These are defined as aggregate purchases of a security exceeding one per cent of the total value of purchases for the financial year and aggregate disposals greater than one per cent of the total value of sales. At a minimum the largest 20 purchases and 20 sales must be given or all purchases and sales if less than 20. A full listing of the portfolio changes for the financial year is available, upon request, at no cost from the Administrator.

iSHARES VII PLC
Schedule of Material Purchases and Sales (unaudited) (continued) iSHARES MSCI KOREA UCITS ETF USD (Acc) For the financial year ended 31 July 2018
i S H A R E S V I I P L C A N N U A L R E P O R T [ 2 8 5 ]
Holding Investments Proceeds
$’000 Holding Investments Cost
$’000
Sales Purchases
4,073 Samsung Electronics Co Ltd 3,622 3,524 SillaJen Inc 354
10,132 SK Hynix Inc 587 1,984 HLB Inc 254
907 Samsung Electronics Co Ltd (Preference) 580 869 ViroMed Co Ltd 214
1,277 POSCO 366 2,218 Celltrion Healthcare Co Ltd 178
6,966 KB Financial Group Inc 349 11,095 Woori Bank 176
7,477 Shinhan Financial Group Co Ltd 349 10,044 Samsung Engineering Co Ltd 172
2,691 Hyundai Motor Co 344 265 Hyundai Heavy Industries Holdings Co Ltd 111
486 NAVER Corp 334 2,129 ING Life Insurance Korea Ltd 106
1,183 Hyundai Mobis Co Ltd 262 748 Kakao Corp 99
789 LG Chem Ltd 241 272 POSCO 86
5,166 Hana Financial Group Inc 224 981 Celltrion Pharm Inc 85
2,052 KT&G Corp 207 569 Netmarble Corp 78
1,110 SK Innovation Co Ltd 172 361 Pearl Abyss Corp 75
4,385 Korea Electric Power Corp 165 192 CJ ENM Co Ltd 45
1,315 Samsung C&T Corp 153 112 Lotte Chemical Corp 38
971 Samsung SDI Co Ltd 152 5,215 Hanwha Life Insurance Co Ltd 31
1,408 Celltrion Inc 146 1,950 Mirae Asset Daewoo Co Ltd 17
583 Amorepacific Corp 145 774 Posco Daewoo Corp 16
4,641 Kia Motors Corp 145 185 Korea Investment Holdings Co Ltd 16
161 LG Household & Health Care Ltd 138 170 BGF Co Ltd 14
The CBI requires a Schedule of material changes in the composition of the portfolio during the financial year. These are defined as aggregate purchases of a security exceeding one per cent of the total value of purchases for the financial year and aggregate disposals greater than one per cent of the total value of sales. At a minimum the largest 20 purchases and 20 sales must be given or all purchases and sales if less than 20. A full listing of the portfolio changes for the financial year is available, upon request, at no cost from the Administrator. .

iSHARES VII PLC
Schedule of Material Purchases and Sales (unaudited) (continued) iSHARES MSCI MEXICO CAPPED UCITS ETF For the financial year ended 31 July 2018
[ 2 8 6 ] i S H A R E S V I I P L C A N N U A L R E P O R T
Holding Investments Proceeds
$’000 Holding Investments Cost
$’000
Sales Purchases
5,544,625 America Movil SAB de CV 4,930 7,091,902 America Movil SAB de CV 6,332
322,185 Fomento Economico Mexicano SAB de CV 3,032 406,225 Fomento Economico Mexicano SAB de CV 3,821
414,930 Grupo Financiero Banorte SAB de CV 2,650 563,288 Grupo Financiero Banorte SAB de CV 3,527
723,143 Grupo Mexico SAB de CV 2,251 1,094,015 Wal-Mart de Mexico SAB de CV 2,819
867,230 Wal-Mart de Mexico SAB de CV 2,113 760,018 Grupo Mexico SAB de CV 2,406
2,410,869 Cemex SAB de CV 1,955 3,043,768 Cemex SAB de CV 2,306
404,695 Grupo Televisa SAB 1,750 510,692 Grupo Televisa SAB 2,089
496,694 Fibra Uno Administracion SA de CV 803 926,013 Fibra Uno Administracion SA de CV 1,431
383,500 Grupo Financiero Inbursa SAB de CV 649 482,704 Grupo Financiero Inbursa SAB de CV 790
272,300 Grupo Bimbo SAB de CV 637 43,400 Grupo Aeroportuario del Sureste SAB de CV 771
34,360 Grupo Aeroportuario del Sureste SAB de CV 636 116,243 Coca-Cola Femsa SAB de CV 770
511,396 Alfa SAB de CV 612 343,967 Grupo Bimbo SAB de CV 770
59,386 Grupo Aeroportuario del Pacifico SAB de CV 601 632,577 Alfa SAB de CV 759
83,000 Coca-Cola Femsa SAB de CV 591 74,977 Grupo Aeroportuario del Pacifico SAB de CV 755
23,005 Industrias Penoles SAB de CV 519 217,453 Alsea SAB de CV 727
72,900 Arca Continental SAB de CV 497 219,484 Mexichem SAB de CV 637
173,600 Mexichem SAB de CV 488 92,244 Arca Continental SAB de CV 620
35,780 Gruma SAB de CV 469 29,298 Industrias Penoles SAB de CV 602
252,000 Kimberly-Clark de Mexico SAB de CV 461 45,560 Gruma SAB de CV 595
89,087 Infraestructura Energetica Nova SAB de CV 456 320,222 Kimberly-Clark de Mexico SAB de CV 582
475,677 Gentera SAB de CV 419 113,101 Infraestructura Energetica Nova SAB de CV 560
37,710 Promotora y Operadora de Infraestructura SAB de CV 388 47,658 Promotora y Operadora de Infraestructura SAB de CV 472
201,300 Grupo Financiero Santander Mexico SAB de CV 378 241,905 Banco Santander Mexico SA Institucion de Banca
299,551 Grupo Lala SAB de CV 368 Multiple Grupo Financiero Santand 369
The CBI requires a Schedule of material changes in the composition of the portfolio during the financial year. These are defined as aggregate purchases of a security exceeding one per cent of the total value of purchases for the financial year and aggregate disposals greater than one per cent of the total value of sales. At a minimum the largest 20 purchases and 20 sales must be given or all purchases and sales if less than 20. A full listing of the portfolio changes for the financial year is available, upon request, at no cost from the Administrator.

iSHARES VII PLC
Schedule of Material Purchases and Sales (unaudited) (continued) iSHARES MSCI RUSSIA ADR/GDR UCITS ETF For the financial year ended 31 July 2018
i S H A R E S V I I P L C A N N U A L R E P O R T [ 2 8 7 ]
Holding Investments Proceeds
$’000 Holding Investments Cost
$’000
Sales Purchases
5,723,520 Sberbank of Russia PJSC ADR 84,675 5,314,776 Sberbank of Russia PJSC ADR 89,314
902,097 Lukoil PJSC ADR 57,389 837,643 Lukoil PJSC ADR 51,080
11,286,852 Gazprom PJSC ADR 51,140 10,479,066 Gazprom PJSC ADR 48,355
539,233 Tatneft PJSC ADR 31,461 500,637 Tatneft PJSC ADR 26,790
193,270 Novatek PJSC GDR 24,137 1,246,784 MMC Norilsk Nickel PJSC ADR 22,904
1,342,920 MMC Norilsk Nickel PJSC ADR 23,080 179,437 Novatek PJSC GDR 22,751
729,894 Magnit PJSC GDR 16,818 769,997 Magnit PJSC GDR 21,097
2,473,474 Rosneft Oil Co PJSC GDR 14,415 2,296,334 Rosneft Oil Co PJSC GDR 12,771
7,180,831 VTB Bank PJSC GDR 12,748 984,125 Mobile TeleSystems PJSC ADR 10,776
1,060,100 Mobile TeleSystems PJSC ADR 10,651 5,076,938 VTB Bank PJSC GDR 10,118
1,511,866 Surgutneftegas PJSC ADR 7,088 471,747 Severstal PJSC GDR 7,354
423,593 Severstal PJSC GDR 6,526 1,403,127 Surgutneftegas PJSC ADR 6,961
254,312 Novolipetsk Steel PJSC GDR 6,253 225,999 X5 Retail Group NV GDR 6,419
248,251 PhosAgro PJSC GDR 3,502 589,227 Magnitogorsk Iron & Steel Works PJSC GDR 5,963
286,990 Magnitogorsk Iron & Steel Works PJSC GDR 2,708 236,069 Novolipetsk Steel PJSC GDR 5,831
451,704 Sistema PJSFC GDR 1,684 230,464 PhosAgro PJSC GDR 3,427
11,134 X5 Retail Group NV GDR 301 131,546 Sistema PJSFC GDR 632
The CBI requires a Schedule of material changes in the composition of the portfolio during the financial year. These are defined as aggregate purchases of a security exceeding one per cent of the total value of purchases for the financial year and aggregate disposals greater than one per cent of the total value of sales. At a minimum the largest 20 purchases and 20 sales must be given or all purchases and sales if less than 20. A full listing of the portfolio changes for the financial year is available, upon request, at no cost from the Administrator.

iSHARES VII PLC
Schedule of Material Purchases and Sales (unaudited) (continued) iSHARES MSCI UK SMALL CAP UCITS ETF For the financial year ended 31 July 2018
[ 2 8 8 ] i S H A R E S V I I P L C A N N U A L R E P O R T
Holding Investments Proceeds
£’000 Holding Investments Cost
£’000
Sales Purchases
402,577 Informa Plc 3,283 222,062 Tate & Lyle Plc 1,394
192,350 UBM Plc 1,977 118,040 IMI Plc 1,376
845,691 Melrose Industries Plc 1,883 461,298 Rentokil Initial Plc 1,362
39,948 NMC Health Plc 1,367 270,944 DS Smith Plc 1,355
57,005 Micro Focus International Plc 1,291 183,501 Informa Plc 1,325
494,608 Booker Group Plc 1,092 1,037,462 Cobham Plc 1,300
110,001 John Wood Group Plc 803 814,231 Quilter Plc 1,240
82,739 GVC Holdings Plc 765 94,033 Halma Plc 1,146
433,811 Ladbrokes Coral Group Plc 726 722,038 Capita Plc 1,129
213,226 Rentokil Initial Plc 694 18,591 Spirax-Sarco Engineering Plc 1,085
127,009 DS Smith Plc 650 72,566 Hiscox Ltd 1,054
111,915 Amec Foster Wheeler Plc 612 22,787 Rightmove Plc 1,031
45,975 Berendsen Plc 583 264,012 B&M European Value Retail SA 1,027
43,557 Halma Plc 558 134,870 Just Eat Plc 991
433,534 Capita Plc 557 30,425 Bellway Plc 965
8,857 Spirax-Sarco Engineering Plc 532 27,392 Metro Bank Plc 951
92,051 Fenner Plc 525 218,444 Inmarsat Plc 947
11,292 Rightmove Plc 515 13,617 ASOS Plc 902
52,955 Shaftesbury Plc 503 421,856 Intu Properties Plc 845
62,759 Just Eat Plc 497 469,826 Dixons Carphone Plc 842
The CBI requires a Schedule of material changes in the composition of the portfolio during the financial year. These are defined as aggregate purchases of a security exceeding one per cent of the total value of purchases for the financial year and aggregate disposals greater than one per cent of the total value of sales. At a minimum the largest 20 purchases and 20 sales must be given or all purchases and sales if less than 20. A full listing of the portfolio changes for the financial year is available, upon request, at no cost from the Administrator.

iSHARES VII PLC
Schedule of Material Purchases and Sales (unaudited) (continued) iSHARES MSCI UK UCITS ETF For the financial year ended 31 July 2018
i S H A R E S V I I P L C A N N U A L R E P O R T [ 2 8 9 ]
Holding Investments Proceeds
£’000 Holding Investments Cost
£’000
Sales Purchases
153,912 HSBC Holdings Plc 1,140 119,936 HSBC Holdings Plc 883
39,678 Royal Dutch Shell Plc 1,005 35,836 Royal Dutch Shell Plc 850
153,146 BP Plc 847 31,461 Micro Focus International Plc 708
28,637 Royal Dutch Shell Plc Class 'B' 763 81,095 Informa Plc 680
17,407 British American Tobacco Plc 693 133,376 BP Plc 670
134,366 Worldpay Group Ltd 584 12,081 British American Tobacco Plc 531
37,891 GlaxoSmithKline Plc 571 20,411 Royal Dutch Shell Class 'B' Plc 491
18,872 Diageo Plc 506 30,194 GlaxoSmithKline Plc 412
9,617 AstraZeneca Plc 505 38,587 GVC Holdings Plc 359
318,108 Old Mutual Ltd 502 47,920 John Wood Group Plc 349
26,642 Anglo American Plc 481 6,911 AstraZeneca Plc 342
125,167 Glencore Plc 477 139,114 Melrose Industries Plc 315
10,948 Unilever Plc 457 149,601 Tesco Plc 310
10,186 Rio Tinto Plc 428 149,117 Vodafone Group Plc 308
205,443 Vodafone Group Plc 415 445,661 Lloyds Banking Group Plc 296
53,068 Standard Chartered Plc 402 98,329 Royal Bank of Scotland Group Plc 268
19,834 Prudential Plc 376 14,560 Prudential Plc 266
555,810 Lloyds Banking Group Plc 367 3,999 Reckitt Benckiser Group Plc 252
5,237 Reckitt Benckiser Group Plc 325 9,613 Diageo Plc 240
16,352 BHP Billiton Plc 278 6,766 NMC Health Plc 240
6,755 Shire Plc 277 54,959 Glencore Plc 201
128,630 Barclays Plc 265 5,047 Rio Tinto Plc 194
27,181 National Grid Plc 243 96,778 Barclays Plc 192
19,632 IMI Plc 228 4,846 Unilever Plc 191
7,760 Imperial Brands Plc 220 11,601 BHP Billiton Plc 177
31,448 Tate & Lyle Plc 212 5,067 Shire Plc 173
168,705 Cobham Plc 210 5,287 Imperial Brands Plc 146
12,924 Compass Group Plc 208 9,531 Compass Group Plc 146
The CBI requires a Schedule of material changes in the composition of the portfolio during the financial year. These are defined as aggregate purchases of a security exceeding one per cent of the total value of purchases for the financial year and aggregate disposals greater than one per cent of the total value of sales. At a minimum the largest 20 purchases and 20 sales must be given or all purchases and sales if less than 20. A full listing of the portfolio changes for the financial year is available, upon request, at no cost from the Administrator.

iSHARES VII PLC
Schedule of Material Purchases and Sales (unaudited) (continued) iSHARES MSCI USA SMALL CAP UCITS ETF For the financial year ended 31 July 2018
[ 2 9 0 ] i S H A R E S V I I P L C A N N U A L R E P O R T
Holding Investments Proceeds
$’000 Holding Investments Cost
$’000
Sales Purchases
8,926 Abiomed Inc 3,088 28,107 Black Knight Inc 1,281
25,408 XPO Logistics Inc 2,546 18,202 DexCom Inc 1,177
33,471 Nektar Therapeutics 2,503 26,096 Foot Locker Inc 1,162
44,498 Copart Inc 2,297 93,982 Caesars Entertainment Corp 1,131
39,601 Keysight Technologies Inc 2,208 18,437 Wyndham Hotels & Resorts Inc 1,128
89,812 ON Semiconductor Corp 2,175 51,546 VICI Properties Inc 1,006
15,381 Cognex Corp 2,093 34,515 Murphy Oil Corp 985
15,526 Alnylam Pharmaceuticals Inc 2,027 19,708 Mednax Inc 975
18,266 Take-Two Interactive Software Inc 2,017 9,285 Core Laboratories NV 968
28,228 GoDaddy Inc 1,921 22,454 Envision Healthcare Corp 967
21,840 Spirit AeroSystems Holdings Inc 1,822 60,798 Nuance Communications Inc 937
19,794 Owens Corning 1,719 56,424 Brixmor Property Group Inc 906
32,740 Chemours Co 1,675 12,522 WR Grace & Co 899
12,853 IAC/InterActiveCorp 1,621 18,476 Wyndham Destinations Inc 895
27,217 TransUnion 1,486 16,233 Delphi Technologies Plc 891
6,607 IPG Photonics Corp 1,482 5,319 Bluebird Bio Inc 886
38,688 Square Inc 1,478 26,918 US Foods Holding Corp 836
11,597 Old Dominion Freight Line Inc 1,466 15,551 GoDaddy Inc 824
45,486 Great Plains Energy Inc 1,445 13,286 Lamb Weston Holdings Inc 794
31,271 RSP Permian Inc 1,421 18,979 Nutanix Inc 765
The CBI requires a Schedule of material changes in the composition of the portfolio during the financial year. These are defined as aggregate purchases of a security exceeding one per cent of the total value of purchases for the financial year and aggregate disposals greater than one per cent of the total value of sales. At a minimum the largest 20 purchases and 20 sales must be given or all purchases and sales if less than 20. A full listing of the portfolio changes for the financial year is available, upon request, at no cost from the Administrator.

iSHARES VII PLC
Schedule of Material Purchases and Sales (unaudited) (continued) iSHARES MSCI USA UCITS ETF For the financial year ended 31 July 2018
i S H A R E S V I I P L C A N N U A L R E P O R T [ 2 9 1 ]
Holding Investments Proceeds
$’000 Holding Investments Cost
$’000
Sales Purchases
8,692 Apple Inc 1,537 25,286 Apple Inc 4,407
9,606 Microsoft Corp 871 38,020 Microsoft Corp 3,410
537 Amazon.com Inc 776 2,284 Amazon.com Inc 3,098
6,838 JPMorgan Chase & Co 743 13,421 Facebook Inc 2,439
4,591 Dr Pepper Snapple Group Inc 568 24,335 Exxon Mobil Corp 1,970
3,117 Facebook Inc 544 17,289 JPMorgan Chase & Co 1,818
7,367 Citigroup Inc 526 1,686 Alphabet Inc Class 'C' 1,804
16,917 Bank of America Corp 495 13,456 Johnson & Johnson 1,787
3,530 Johnson & Johnson 448 1,581 Alphabet Inc 1,722
5,519 Exxon Mobil Corp 438 7,298 Berkshire Hathaway Inc 1,411
413 Alphabet Inc Class 'C' 428 48,168 Bank of America Corp 1,371
9,825 Cisco Systems Inc 415 23,933 Wells Fargo & Co 1,323
390 Alphabet Inc 406 10,612 Chevron Corp 1,280
2,208 Amgen Inc 400 5,347 UnitedHealth Group Inc 1,205
1,307 Charter Communications Inc 395 33,100 AT&T Inc 1,154
7,096 Wells Fargo & Co 387 31,583 Pfizer Inc 1,143
2,144 Home Depot Inc 381 23,868 Intel Corp 1,127
3,723 AbbVie Inc 359 22,813 Verizon Communications Inc 1,114
2,902 Visa Inc 359 9,066 Visa Inc 1,092
3,337 Walt Disney Co 347 5,897 Home Depot Inc 1,059
The CBI requires a Schedule of material changes in the composition of the portfolio during the financial year. These are defined as aggregate purchases of a security exceeding one per cent of the total value of purchases for the financial year and aggregate disposals greater than one per cent of the total value of sales. At a minimum the largest 20 purchases and 20 sales must be given or all purchases and sales if less than 20. A full listing of the portfolio changes for the financial year is available, upon request, at no cost from the Administrator. .

iSHARES VII PLC
Schedule of Material Purchases and Sales (unaudited) (continued) iSHARES NASDAQ 100 UCITS ETF For the financial year ended 31 July 2018
[ 2 9 2 ] i S H A R E S V I I P L C A N N U A L R E P O R T
Holding Investments Proceeds
$’000 Holding Investments Cost
$’000
Sales Purchases
232,000 Apple Inc 41,247 650,421 Apple Inc 117,457
282,120 Microsoft Corp 26,340 65,801 Amazon.com Inc 100,450
17,593 Amazon.com Inc 26,235 1,016,865 Microsoft Corp 96,726
88,241 Facebook Inc 16,690 326,155 Facebook Inc 60,866
12,802 Alphabet Inc Class 'C' 13,922 46,862 Alphabet Inc Class 'C' 51,652
10,938 Alphabet Inc 12,036 403,201 PepsiCo Inc 46,767
224,893 Cisco Systems Inc 9,167 39,965 Alphabet Inc 44,537
173,121 Intel Corp 8,356 613,801 Intel Corp 30,775
39,358 Amgen Inc 7,180 623,095 Cisco Systems Inc 25,883
185,372 Comcast Corp 6,591 602,160 Comcast Corp 20,946
22,004 NVIDIA Corp 5,052 82,846 NVIDIA Corp 19,674
15,757 Netflix Inc 4,914 58,416 Netflix Inc 18,915
14,378 Charter Communications Inc 4,786 89,261 Amgen Inc 16,341
37,384 Texas Instruments Inc 3,953 65,079 Adobe Systems Inc 14,607
17,958 Adobe Systems Inc 3,896 128,624 Texas Instruments Inc 13,999
53,443 Walgreens Boots Alliance Inc 3,723 173,893 Gilead Sciences Inc 12,966
1,884 Booking Holdings Inc 3,691 6,353 Booking Holdings Inc 12,959
48,165 Gilead Sciences Inc 3,560 155,462 PayPal Holdings Inc 12,533
43,435 PayPal Holdings Inc 3,425 198,425 Qualcomm Inc 11,742
61,800 Starbucks Corp 3,357 58,402 Costco Wholesale Corp 11,377
37,632 Celgene Corp 3,342
The CBI requires a Schedule of material changes in the composition of the portfolio during the financial year. These are defined as aggregate purchases of a security exceeding one per cent of the total value of purchases for the financial year and aggregate disposals greater than one per cent of the total value of sales. At a minimum the largest 20 purchases and 20 sales must be given or all purchases and sales if less than 20. A full listing of the portfolio changes for the financial year is available, upon request, at no cost from the Administrator.

iSHARES VII PLC
Schedule of Material Purchases and Sales (unaudited) (continued) iSHARES NIKKEI 225 UCITS ETF For the financial year ended 31 July 2018
i S H A R E S V I I P L C A N N U A L R E P O R T [ 2 9 3 ]
Holding Investments Proceeds
¥’000 Holding Investments Cost
¥’000
Sales Purchases
79,400 Fast Retailing Co Ltd 3,316,851 54,600 Fast Retailing Co Ltd 2,308,647
237,100 SoftBank Group Corp 2,075,508 54,800 Fanuc Corp 1,470,655
79,600 Fanuc Corp 1,986,928 162,800 SoftBank Group Corp 1,454,346
79,700 Tokyo Electron Ltd 1,564,127 54,900 Tokyo Electron Ltd 1,099,271
473,400 KDDI Corp 1,387,191 324,400 KDDI Corp 916,028
157,400 Kyocera Corp 1,074,718 335,000 Recruit Holdings Co Ltd 844,443
78,300 Daikin Industries Ltd 974,189 107,700 Kyocera Corp 749,067
77,900 Shin-Etsu Chemical Co Ltd 852,746 53,500 Daikin Industries Ltd 668,096
157,700 Terumo Corp 839,412 53,500 Shin-Etsu Chemical Co Ltd 607,117
77,900 Nitto Denko Corp 718,802 108,000 Terumo Corp 560,733
78,300 TDK Corp 705,122 53,500 Nitto Denko Corp 511,756
77,900 Secom Co Ltd 639,927 54,000 TDK Corp 494,132
78,300 FamilyMart UNY Holdings Co Ltd 636,525 53,500 Secom Co Ltd 440,075
393,300 Astellas Pharma Inc 598,368 108,300 Honda Motor Co Ltd 401,409
77,800 Kao Corp 587,467 269,400 Astellas Pharma Inc 397,130
157,600 Honda Motor Co Ltd 565,533 53,200 Kao Corp 396,756
79,000 Toyota Motor Corp 550,909 53,200 FamilyMart UNY Holdings Co Ltd 391,930
78,700 Eisai Co Ltd 534,568 53,600 Toyota Motor Corp 382,608
189,800 Recruit Holdings Co Ltd 517,667 53,900 Eisai Co Ltd 335,676
393,800 NTT Data Corp 484,922 53,200 Denso Corp 335,393
78,900 Suzuki Motor Corp 481,293 269,500 NTT Data Corp 335,164
79,000 Shiseido Co Ltd 472,506
78,300 Trend Micro Inc 471,563
117,800 Canon Inc 469,137
The CBI requires a Schedule of material changes in the composition of the portfolio during the financial year. These are defined as aggregate purchases of a security exceeding one per cent of the total value of purchases for the financial year and aggregate disposals greater than one per cent of the total value of sales. At a minimum the largest 20 purchases and 20 sales must be given or all purchases and sales if less than 20. A full listing of the portfolio changes for the financial year is available, upon request, at no cost from the Administrator.

iSHARES VII PLC
Schedule of Material Purchases and Sales (unaudited) (continued) iSHARES FTSE ITALIA MID-SMALL CAP UCITS ETF For the financial period ended 31 July 2018
[ 2 9 4 ] i S H A R E S V I I P L C A N N U A L R E P O R T
Holding Investments Proceeds
€’000 Holding Investments Cost
€’000
Sales Purchases
145,341 Banca Mediolanum SpA 1,017 57,019 Interpump Group SpA 1,548
343,400 Hera SpA 999 549,577 Hera SpA 1,535
35,652 Interpump Group SpA 982 134,313 Cerved Group SpA 1,395
83,952 Cerved Group SpA 890 15,722 DiaSorin SpA 1,204
9,699 DiaSorin SpA 703 41,201 De' Longhi SpA 1,084
50,168 Amplifon SpA 667 145,341 Banca Mediolanum SpA 1,063
193,515 Banca Popolare di Sondrio SCPA 638 309,574 Banca Popolare di Sondrio SCPA 1,062
67,595 Societa Cattolica di Assicurazioni SC 636 80,556 Amplifon SpA 1,044
103,233 Infrastrutture Wireless Italiane SpA 614 159,371 Anima Holding SpA 1,013
102,009 Anima Holding SpA 612 165,113 Infrastrutture Wireless Italiane SpA 963
24,605 De' Longhi SpA 601 86,850 Autogrill SpA 957
54,265 Autogrill SpA 578 107,807 Societa Cattolica di Assicurazioni SC 909
217,792 Iren SpA 539 11,249 IMA Industria Macchine Automatiche SpA 866
6,916 IMA Industria Macchine Automatiche SpA 495 348,656 Iren SpA 826
38,642 Ansaldo STS SpA 471 61,414 Ansaldo STS SpA 715
107,405 Enav SpA 466 172,519 Enav SpA 709
29,720 Societa Iniziative Autostradali e Servizi SpA 434 111,949 OVS SpA 686
7,847 Reply SpA 387 313,951 Saras SpA 681
196,338 Saras SpA 368 47,517 Societa Iniziative Autostradali e Servizi SpA 669
66,982 OVS SpA 354 11,049 Ei Towers SpA 570
7,028 Ei Towers SpA 353 21,039 Brunello Cucinelli SpA 566
41,045 Technogym SpA 351 12,884 Banca IFIS SpA 561
20,527 ERG SpA 343 23,374 ASTM SpA 533
5,595 Tod's SpA 336 8,958 Tod's SpA 511
12,450 Brunello Cucinelli SpA 331 34,652 ERG SpA 510
14,623 ASTM SpA 314 66,051 Technogym SpA 508
14,120 MARR SpA 311 22,608 MARR SpA 497
8,076 Banca IFIS SpA 290 14,271 Datalogic SpA 443
18,768 ACEA SpA 279 72,710 Tamburi Investment Partners SpA 431
9,089 Datalogic SpA 277 131,657 Parmalat SpA 414
46,782 Tamburi Investment Partners SpA 274 29,953 ACEA SpA 414
5,840 Biesse SpA 262 8,636 Reply SpA 406
198,184 Fincantieri SpA 253 88,475 Maire Tecnimont SpA 396
82,431 Parmalat SpA 249 51,895 Credito Emiliano SpA 382
32,606 Credito Emiliano SpA 236
The CBI requires a Schedule of material changes in the composition of the portfolio during the financial period. These are defined as aggregate purchases of a security exceeding one per cent of the total value of purchases for the financial period and aggregate disposals greater than one per cent of the total value of sales. At a minimum the largest 20 purchases and 20 sales must be given or all purchases and sales if less than 20. A full listing of the portfolio changes for the financial period is available, upon request, at no cost from the Administrator.

iSHARES VII PLC
Calendar year performance (unaudited)
i S H A R E S V I I P L C A N N U A L R E P O R T [ 2 9 5 ]
The performance of the Funds, on a calendar year basis, is shown below:
2018 2017 2016 2015 01/01/2018 01/01/2017 01/01/2016 01/01/2015 to 31/07/2018 to 31/12/2017 to 31/12/2016 to 31/12/2015 Launch Fund Benchmark Fund Benchmark Fund Benchmark Fund BenchmarkFund Date % % % % % % % % iShares $ Treasury Bond 1-3yr UCITS ETF USD (Acc) B Jun-09 (0.06) 0.03 0.25 0.42 0.65 0.82 0.29 0.48iShares $ Treasury Bond 3-7yr UCITS ETF Jun-09 (1.32) (1.24) 1.18 1.30 1.14 1.31 1.59 1.78iShares $ Treasury Bond 7-10yr UCITS ETF USD (Acc) Jun-09 (2.60) (2.54) 2.46 2.57 0.85 0.99 1.49 1.69iShares € Govt Bond 1-3yr UCITS ETF EUR (Acc) Jun-09 (0.55) (0.42) 0.05 0.24 0.32 0.51 0.81 1.01iShares € Govt Bond 3-7yr UCITS ETF Jun-09 (0.64) (0.53) 0.20 0.39 1.71 1.90 1.47 1.67iShares € Govt Bond 7-10yr UCITS ETF EUR (Acc) Jun-09 0.14 0.25 1.04 1.18 3.71 3.89 1.65 1.85iShares Core EURO STOXX 50 UCITS ETF Jan-10 3.40 2.91 9.70 9.15 4.37 3.72 7.13 6.42iShares Core MSCI Pacific ex-Japan UCITS ETF Jan-10 (0.21) (0.12) 25.84 25.88 7.75 7.85 (8.70) (8.47)iShares Core S&P 500 UCITS ETF May-10 6.27 6.13 21.40 21.10 11.54 11.23 0.99 0.75iShares Dow Jones Industrial Average UCITS ETF Jan-10 3.67 3.69 27.27 27.19 15.65 15.56 (0.50) (0.53)iShares FTSE 100 UCITS ETF Jan-10 3.16 3.22 11.88 11.95 19.01 19.07 (1.39) (1.32)iShares FTSE MIB UCITS ETF EUR (Acc) Jan-10 4.07 3.88 16.47 16.33 (7.32) (7.47) 15.01 14.97iShares MSCI Brazil UCITS ETF USD (Acc) Aug-10 (8.03) (7.51) 23.30 24.11 64.31 66.24 (41.73) (41.37)
iShares MSCI Canada UCITS ETF Jan-10 (0.88) (0.69) 15.76 16.07 24.33 24.56 (24.28) (24.16)
iShares MSCI EM Asia UCITS ETF Aug-10 (4.75) (4.40) 41.88 42.83 5.48 6.14 (10.32) (9.79)iShares MSCI EMU CHF Hedged UCITS ETF (Acc)* Jun-15 3.00 2.77 12.37 12.13 3.93 3.68 (7.42) (7.23)
iShares MSCI EMU Small Cap UCITS ETF Jul-09 1.42 1.22 24.12 24.19 3.36 3.26 24.51 24.33
iShares MSCI EMU UCITS ETF Jan-10 3.38 3.04 12.75 12.49 4.66 4.37 10.24 9.81iShares MSCI EMU USD Hedged UCITS ETF (Acc)* Jul-15 4.91 4.69 14.86 14.69 5.88 6.00 (3.05) (2.85)
iShares MSCI Japan UCITS ETF USD (Acc) Jan-10 (1.89) (1.63) 23.44 23.99 1.95 2.38 9.06 9.57
iShares MSCI Korea UCITS ETF USD (Acc) Aug-10 (11.38) (11.00) 46.36 47.30 8.01 8.75 (7.19) (6.66)
iShares MSCI Mexico Capped UCITS ETF Aug-10 5.41 5.70 15.47 15.97 (9.60) (9.16) (14.84) (14.41)
iShares MSCI Russia ADR/GDR UCITS ETF Aug-10 4.73 5.16 7.49 7.97 54.69 55.50 (4.02) (2.97)
iShares MSCI UK Small Cap UCITS ETF Jul-09 3.29 3.70 20.33 20.98 6.28 6.81 14.16 14.78
iShares MSCI UK UCITS ETF Jan-10 2.73 2.94 11.38 11.71 18.80 19.16 (2.50) (2.21)
iShares MSCI USA Small Cap UCITS ETF Jul-09 7.83 7.91 16.49 16.75 19.13 19.15 (3.96) (4.11)
iShares MSCI USA UCITS ETF Jan-10 6.23 6.27 21.15 21.19 10.90 10.89 0.61 0.69
iShares NASDAQ 100 UCITS ETF Jan-10 13.41 13.51 32.34 32.53 6.72 6.84 9.19 9.33
iShares Nikkei 225 UCITS ETF Jan-10 (0.35) (0.12) 20.40 20.88 1.66 0.42 10.09 9.07
iShares FTSE Italia Mid-Small Cap UCITS ETF* Sep-17 0.53 0.48 3.30 3.47 N/A N/A N/A N/A
* Where a Fund's launch date is within a performance year, figures are shown from the launch date to the end of the relevant financial year.
The Fund return figures are the aggregated net monthly returns and are based on the average published pricing NAV for the financial year under review. Due to accounting policy requirements under Irish accounting standards which apply to the financial statements, there may be slight differences between the NAV per share as recorded in the financial statements and the published pricing NAV per share. The returns are net of management fees. Past performance may not necessarily be repeated and future performance may vary. Disclosed in the table above are the performance returns for the primary share class for each Fund, which has been selected as a representative share class. Performance returns for other share classes are available at www.ishares.com.

iSHARES VII PLC
Other regulatory disclosures (unaudited)
[ 2 9 6 ] i S H A R E S V I I P L C A N N U A L R E P O R T
PEA Eligibility (Plan d'Epargne en Actions)
A PEA is a French equity savings plan intended to encourage French tax resident individuals to invest in European equities. PEA eligible Funds must invest on a permanent basis at least 75% of their assets in PEA eligible securities issued by companies (i) established in a Member State of the EU or in Iceland, Liechtenstein or Norway and (ii) subject to corporate income tax, or an equivalent tax. Throughout the financial year, 1 August 2017 to 31 July 2018, the Funds listed below invested more than 75% of their total net assets in PEA eligible securities. As at 31 July 2018, the below Funds had the following percentage of their total net assets invested in eligible PEA securities:
Fund % Invested in European
PEA eligible sharesiShares Core EURO STOXX 50 UCITS ETF 87.50%
iShares MSCI EMU UCITS ETF 87.40% Transactions with connected parties In accordance with the requirements of the CBI, the Manager shall ensure that any transactions carried out between the Funds and the Manager or Depositary to the Funds, the delegates or sub-delegates of the Manager or Depositary (excluding any non-group company sub-custodians appointed by a Depositary) and any associated or group company of the Manager, Depositary, delegate or sub-delegate (“Connected Parties”) must be conducted at arm’s length and in the best interests of the shareholders. The Board of Directors of the Manager are satisfied that there are arrangements in place, as evidenced by written procedures, to ensure that the obligations set out above are applied to all transactions with Connected Parties and that transactions with Connected Parties entered into during the financial year complied with this obligation.
Global exposure
In accordance with UCITS regulations and the requirements of CBI, the Manager is required to employ a risk management process which enables it to accurately monitor and manage the global exposure of the Funds to FDI. The Investment Manager uses the methodology known as the "Commitment Approach" in order to measure the global exposure of the Funds and manage the potential loss to them due to market risk. The commitment approach is a methodology that aggregates the underlying market or notional value of FDI to determine the global exposure of the Fund. In accordance with the UCITS Regulations, global exposure for a Fund utilising the commitment approach must not exceed 100% of the Fund’s NAV. The exposures to FDI at the financial year end are marked on the relevant Fund’s schedule of investments. Leverage
The use of derivatives may expose Funds to a higher degree of risk. In particular, derivative contracts can be highly volatile, and the amount of initial margin is generally small relative to the size of the contract so that transactions may be leveraged in terms of market exposure. A relatively small market movement may have a potentially larger impact on derivatives than on non-derivative instruments. Leveraged derivative positions can therefore increase Fund volatility.

iSHARES VII PLC
Other regulatory disclosures (unaudited) (continued)
i S H A R E S V I I P L C A N N U A L R E P O R T [ 2 9 7 ]
Transaction costs In order to achieve its investment objective, a Fund will incur transaction costs in relation to trading activity on its portfolio. Disclosed in the table below are separately identifiable transaction costs incurred by the Company for the financial year ended 31 July 2018. These include all brokers’ commission, settlement fees, stamp duties and broker fees charges on equities, exchange traded futures contracts and some fixed income investments.
Transaction costs
Financial year ended
31 July 2018 ’000
iShares € Govt Bond 1-3yr UCITS ETF EUR (Acc) €1 iShares € Govt Bond 3-7yr UCITS ETF €1 iShares € Govt Bond 7-10yr UCITS ETF EUR (Acc) €1 iShares Core EURO STOXX 50 UCITS ETF €338 iShares Core MSCI Pacific ex-Japan UCITS ETF $632 iShares Core S&P 500 UCITS ETF $656 iShares Dow Jones Industrial Average UCITS ETF $22 iShares FTSE 100 UCITS ETF £132 iShares FTSE MIB UCITS ETF EUR (Acc) €12 iShares MSCI Brazil UCITS ETF USD (Acc) $2 iShares MSCI Canada UCITS ETF $51 iShares MSCI EM Asia UCITS ETF $318 iShares MSCI EMU CHF Hedged UCITS ETF (Acc) Fr8 iShares MSCI EMU Small Cap UCITS ETF €590 iShares MSCI EMU UCITS ETF €566 iShares MSCI EMU USD Hedged UCITS ETF (Acc) $333 iShares MSCI Japan UCITS ETF USD (Acc) $67 iShares MSCI Korea UCITS ETF USD (Acc) $44 iShares MSCI Mexico Capped UCITS ETF $24 iShares MSCI Russia ADR/GDR UCITS ETF $79 iShares MSCI UK Small Cap UCITS ETF £445 iShares MSCI UK UCITS ETF £66 iShares MSCI USA Small Cap UCITS ETF $45 iShares MSCI USA UCITS ETF $9 iShares NASDAQ 100 UCITS ETF $56 iShares Nikkei 225 UCITS ETF ¥4,788 iShares FTSE Italia Mid-Small Cap UCITS ETF €28 Company Total €4,044
Not all transaction costs are separately identifiable. For some fixed income investments, transaction costs will be included in the purchase and sales price of the investment and are not separately disclosed. The portfolio transaction costs are not included in the TER.

iSHARES VII PLC
Report on remuneration (unaudited)
[ 2 9 8 ] i S H A R E S V I I P L C A N N U A L R E P O R T
The below disclosures are made in respect of the remuneration policies of the BlackRock group ("BlackRock"), as they apply to BlackRock Asset Management Ireland Limited (the "Manager"). The disclosures are made in accordance with the Directive 2009/65/EC on the coordination of laws, regulations and administrative provisions relating to undertakings for collective investment in transferable securities (“UCITS”), as amended, including in particular by Directive 2014/91/EU of the European Parliament and of the council of 23 July 2014, (the “Directive”), and the "Guidelines on sound remuneration policies under the UCITS Directive and AIFMD" issued by the European Securities and Markets Authority. BlackRock’s UCITS Remuneration Policy (the “UCITS Remuneration Policy”) will apply to the EEA entities within the BlackRock group authorised as a manager of UCITS funds in accordance with the Directive, and will ensure compliance with the requirements of Article 14b of the Directive. The Manager has adopted the UCITS Remuneration Policy, a summary of which is set out below. Remuneration Governance BlackRock’s remuneration governance in EMEA operates as a tiered structure which includes: (a) the Management Development and Compensation Committee (“MDCC”) (which is the global, independent remuneration committee for BlackRock, Inc. and all of its subsidiaries, including the Manager); and (b) the Manager’s Board of Directors (the “Manager’s Board”). These bodies are responsible for the determination of BlackRock’s remuneration policies. (a) MDCC
The MDCC’s purposes include: providing oversight of:
o BlackRock’s executive compensation programmes; o BlackRock’s employee benefit plans; and o such other compensation plans as may be established by BlackRock from time to time for which the MDCC is deemed as administrator;
reviewing and discussing the compensation discussion and analysis included in the BlackRock, Inc. annual proxy statement with management and approving the MDCC’s report for inclusion in the proxy statement;
reviewing, assessing and making reports and recommendations to the BlackRock, Inc. Board of Directors (the “BlackRock, Inc. Board”) as appropriate on BlackRock’s talent development and succession planning, with the emphasis on performance and succession at the highest management levels; and
in accordance with applicable UK and European regulations and guidance, to act as the Remuneration Committee for BlackRock’s EMEA regulated entities.
The MDCC directly retains its own independent compensation consultant, Semler Brossy Consulting Group LLC, who has no relationship with BlackRock, Inc. or the BlackRock, Inc. Board that would interfere with its ability to provide independent advice to the MDCC on compensation matters. The BlackRock, Inc. Board has determined that all of the members of the MDCC are “independent” within the meaning of the listing standards of the New York Stock Exchange (“NYSE”), which requires each meet a “non-employee director” standard. The MDCC held 10 meetings during 2017. The MDCC charter is available on BlackRock, Inc.’s website (www.blackrock.com). Through its regular reviews, the MDCC continues to be satisfied with the principles of BlackRock’s compensation policy and approach. (b) The Manager’s Board
The Manager’s Board has the task of supervising and providing oversight of the UCITS Remuneration Policy as it applies to the Manager and its Identified Staff. The Manager’s Board (through independent review by the relevant control functions) remains satisfied with the implementation of the UCITS Remuneration Policy as it applies to the Manager and its Identified Staff.

iSHARES VII PLC
Report on remuneration (unaudited) (continued)
i S H A R E S V I I P L C A N N U A L R E P O R T [ 2 9 9 ]
Decision-making process Remuneration decisions for employees are made once annually in January following the end of the performance year. This timing allows full-year financial results to be considered along with other non-financial goals and objectives. Although the framework for remuneration decision-making is tied to financial performance, significant discretion is used to determine individual variable remuneration based on achievement of strategic and operating results and other considerations such as management and leadership capabilities. No set formulas are established and no fixed benchmarks are used in determining annual incentive awards. In determining specific individual remuneration amounts, a number of factors are considered including non-financial goals and objectives and overall financial and investment performance. These results are viewed in the aggregate without any specific weighting, and there is no direct correlation between any particular performance measure and the resulting annual incentive award. The variable remuneration awarded to any individual(s) for a particular performance year may also be zero. Annual incentive awards are paid from a bonus pool The size of the projected bonus pool, including cash and equity awards, is reviewed throughout the year by the MDCC and the final total bonus pool is approved after year-end. As part of this review, the MDCC receives actual and projected financial information over the course of the year as well as final year-end information. The financial information that the MDCC receives and considers includes the current year projected income statement and other financial measures compared with prior year results and the current year budget. The MDCC additionally reviews other metrics of BlackRock’s financial performance (e.g., net inflows of AUM and investment performance) as well as information regarding market conditions and competitive compensation levels. The MDCC regularly considers management’s recommendation as to the percentage of preincentive operating income that will be accrued and reflected as a compensation expense throughout the year for the cash portion of the total annual bonus pool (the “accrual rate”). The accrual rate of the cash portion of the total annual bonus pool may be modified by the MDCC during the year based on its review of the financial information described above. The MDCC does not apply any particular weighting or formula to the information it considers when determining the size of the total bonus pool or the accruals made for the cash portion of the total bonus pool. Following the end of the performance year, the MDCC approves the final bonus pool amount. As part of the year-end review process the Enterprise Risk and Regulatory Compliance departments report to the MDCC on any activities, incidents or events that warrant consideration in making compensation decisions. Individuals are not involved in setting their own remuneration. Control functions Each of the control functions (Enterprise Risk, Legal & Compliance, and Internal Audit) has its own organisational structure which is independent of the business units. The head of each control function is either a member of the Global Executive Committee (“GEC”), the global management committee, or has a reporting obligation to the Board of Directors of BlackRock Group Limited, the parent company of all of BlackRock’s EMEA regulated entities, including the Manager. Functional bonus pools are determined with reference to the performance of each individual function. The remuneration of the senior members of control functions is directly overseen by the MDCC. Link between pay and performance There is a clear and well-defined pay-for-performance philosophy and compensation programmes which are designed to meet the following key objectives as detailed below: appropriately balance BlackRock’s financial results between shareholders and employees; attract, retain and motivate employees capable of making significant contributions to the long-term success of the business; align the interests of senior employees with those of shareholders by awarding BlackRock Inc.’s stock as a significant part of both annual and
long-term incentive awards; control fixed costs by ensuring that compensation expense varies with profitability; link a significant portion of an employee’s total compensation to the financial and operational performance of the business as well as its
common stock performance; discourage excessive risk-taking; and ensure that client interests are not negatively impacted by remuneration awarded on a short-term, mid-term and/or long-term basis.

iSHARES VII PLC
Report on remuneration (unaudited) (continued)
[ 3 0 0 ] i S H A R E S V I I P L C A N N U A L R E P O R T
Link between pay and performance (continued) Driving a high-performance culture is dependent on the ability to measure performance against objectives, values and behaviours in a clear and consistent way. Managers use a 5-point rating scale to provide an overall assessment of an employee’s performance, and employees also provide a self-evaluation. The overall, final rating is reconciled during each employee’s performance appraisal. Employees are assessed on the manner in which performance is attained as well as the absolute performance itself. In keeping with the pay-for-performance philosophy, ratings are used to differentiate and reward individual performance – but don’t pre-determine compensation outcomes. Compensation decisions remain discretionary and are made as part of the year-end compensation process. When setting remuneration levels other factors are considered, as well as individual performance, which may include: the performance of the Manager, the funds managed by the Manager and/or the relevant functional department; factors relevant to an employee individually; relationships with clients and colleagues; teamwork; skills; any conduct issues; and, subject to
any applicable policy, the impact that any relevant leave of absence may have on contribution to the business; the management of risk within the risk profiles appropriate for BlackRock's clients; strategic business needs, including intentions regarding retention; market intelligence; and criticality to business. A primary product tool is risk management and, while employees are compensated for strong performance in their management of client assets, they are required to manage risk within the risk profiles appropriate for their clients. Therefore, employees are not rewarded for engaging in high-risk transactions outside of established parameters. Remuneration practices do not provide undue incentives for short-term planning or short-term financial rewards, do not reward unreasonable risk and provide a reasonable balance between the many and substantial risks inherent within the business of investment management, risk management and advisory services. BlackRock operates a total compensation model for remuneration which includes a base salary, which is contractual, and a discretionary bonus scheme. BlackRock operates an annual discretionary bonus scheme. Although all employees are eligible to be considered for a discretionary bonus, there is no contractual obligation to make any award to an employee under its discretionary bonus scheme. In exercising discretion to award a discretionary bonus, the factors listed above (under the heading “Link between pay and performance”) may be taken into account in addition to any other matters which become relevant to the exercise of discretion in the course of the performance year. Discretionary bonus awards for all employees, including executive officers, are subject to a guideline that determines the portion paid in cash and the portion paid in BlackRock, Inc. stock and subject to additional vesting/clawback conditions. Stock awards are subject to further performance adjustment through variation in BlackRock, Inc.’s share price over the vesting period. As total annual compensation increases, a greater portion is deferred into stock. The MDCC adopted this approach in 2006 to substantially increase the retention value and shareholder alignment of the compensation package for eligible employees, including the executive officers. The portion deferred into stock vests into three equal instalments over the three years following grant. Supplementary to the annual discretionary bonus as described above, equity awards from the “Partner Plan” and “Targeted Equity Award Plan” are made to select senior leaders to provide greater linkage with future business results. The long-term incentive awards have been established individually to provide meaningful incentive for continued performance over a multi-year period recognising the scope of the individual’s role, business expertise and leadership skills. Selected senior leaders are eligible to receive performance-adjusted equity-based awards from the “BlackRock Performance Incentive Plan” (“BPIP”). Awards made from the BPIP have a three-year performance period based on a measurement of As Adjusted Operating Margin1 and Organic Revenue Growth2. Determination of pay-out will be made based on the firm’s achievement relative to target financial results at the conclusion of the performance period. The maximum number of shares that can be earned is 165% of the award in those situations where both metrics achieve pre-determined financial targets. No shares will be earned where the firm’s financial performance in both of the above metrics is below a pre-determined performance threshold. These metrics have been selected as key measures of shareholder value which endure across market cycles. 1 As Adjusted Operating Margin: As reported in BlackRock’s external filings, reflects adjusted Operating Income divided by Total Revenue net of distribution and servicing expenses and amortisation of deferred sales commissions. 2 Organic Revenue Growth: Equal to net new base fees plus net new Aladdin revenue generated in the year (in dollars).

iSHARES VII PLC
Report on remuneration (unaudited) (continued)
i S H A R E S V I I P L C A N N U A L R E P O R T [ 3 0 1 ]
Link between pay and performance (continued) A limited number of investment professionals have a portion of their annual discretionary bonus (as described above) awarded as deferred cash that notionally tracks investment in selected products managed by the employee. The intention of these awards is to align investment professionals with the investment returns of the products they manage through the deferral of compensation into those products. Clients and external evaluators have increasingly viewed more favourably those products where key investors have “skin in the game” through significant personal investments. Identified Staff The UCITS Remuneration Policy sets out the process that will be applied to identify staff as Identified Staff, being categories of staff of the Manager, including senior management, risk takers, control functions and any employee receiving total remuneration that takes them into the same remuneration bracket as senior management and risk takers, whose professional activities have a material impact on the risk profiles of the Manager or of the funds it manages. The list of Identified Staff will be subject to regular review, being formally reviewed in the event of, but not limited to: organisational changes; new business initiatives; changes in significant influence function lists; changes in role responsibilities; and revised regulatory direction. Quantitative Remuneration Disclosure The Manager is required under UCITS to make quantitative disclosures of remuneration. These disclosures are made in line with BlackRock’s interpretation of currently available regulatory guidance on quantitative remuneration disclosures. As market or regulatory practice develops BlackRock may consider it appropriate to make changes to the way in which quantitative remuneration disclosures are calculated. Where such changes are made, this may result in disclosures in relation to a fund not being comparable to the disclosures made in the prior year, or in relation to other BlackRock fund disclosures in that same year. Disclosures are provided in relation to (a) the staff of the Manager; (b) staff who are senior management; and (c) staff who have the ability to materially affect the risk profile of the Fund. All individuals included in the aggregated figures disclosed are rewarded in line with BlackRock’s remuneration policy for their responsibilities across the relevant BlackRock business area. As all individuals have a number of areas of responsibilities, only the portion of remuneration for those individuals’ services attributable to the Fund is included in the aggregate figures disclosed. Members of staff and senior management of the Manager typically provide both UCITS and non-UCITS related services in respect of multiple funds, clients and functions of the Manager and across the broader BlackRock group. Therefore, the figures disclosed are a sum of each individual’s portion of remuneration attributable to the Manager according to an objective apportionment methodology which acknowledges the multiple-service nature of the Manager. Accordingly the figures are not representative of any individual’s actual remuneration or their remuneration structure. The amount of the total remuneration awarded by the Manager to its staff which has been attributed to the Fund in respect of the Manager’s financial year ending 31 December 2017 is €4.3m. This figure is comprised of fixed remuneration of €1.7m and variable remuneration of €2.6m. There were a total of 52 beneficiaries of the remuneration described above. The amount of the aggregate remuneration awarded by the Manager, which has been attributed to the Fund in respect of the Manager’s financial year ending 31 December 2017, to its senior management was €0.3m and to other members of its staff whose actions have a material impact on the risk profile of the Fund was €4.0m.

iSHARES VII PLC
Supplementary information (unaudited)
[ 3 0 2 ] i S H A R E S V I I P L C A N N U A L R E P O R T
Efficient portfolio management
The Company may, on behalf of each Fund and subject to the conditions and within the limits laid down by the CBI, employ techniques and instruments relating to transferable securities for efficient portfolio management purposes. Transactions for the purposes of efficient portfolio management may be undertaken with a view to achieving a reduction in risk, a reduction in costs or the generation of additional capital or income for the Fund with an appropriate level of risk, taking into account the risk profile of the relevant Fund and the general provisions of the Directive. These techniques and instruments may include investments in FDI such as interest rate and bond futures (which may be used to manage interest rate risk), index futures (which may be used to manage cash flows on a short term basis), options (which may be used to achieve cost efficiencies, for example where the acquisition of the option is more cost effective than purchasing of the underlying asset), swaps (which may be used to manage currency risk) and investments in money market instruments and/or money market collective investment schemes. New techniques and instruments may be developed which may be suitable for use by the Company and the Company (subject to the Central Bank’s requirements) may employ such techniques and instruments. A Fund may enter into securities lending, repurchase and/or reverse repurchase agreements for the purposes of efficient portfolio management subject to the conditions and limits set out in the Central Bank UCITS Regulations and in accordance with the requirements of the Central Bank. Securities Lending
The following table details the value of securities on loan as a proportion of the Funds’ total lendable assets and NAV as at 31 July 2018. Total lendable assets represents the aggregate value of assets forming part of the Funds’ securities lending programme. This excludes any assets held by the Funds that are not considered lendable due to any market, regulatory, investment or other restriction.
Securities on loan Fund Currency % of lendable assets % of NAViShares $ Treasury Bond 1-3yr UCITS ETF USD (Acc) B $ 24.45 22.27iShares $ Treasury Bond 3-7yr UCITS ETF $ 64.19 59.64iShares $ Treasury Bond 7-10yr UCITS ETF USD (Acc) $ 90.64 84.38iShares € Govt Bond 1-3yr UCITS ETF EUR (Acc) € 29.98 27.32iShares € Govt Bond 3-7yr UCITS ETF € 26.99 24.34iShares € Govt Bond 7-10yr UCITS ETF EUR (Acc) € 28.75 26.56iShares Core EURO STOXX 50 UCITS ETF € 8.51 8.01iShares Core MSCI Pacific ex-Japan UCITS ETF $ 23.93 20.93iShares Core S&P 500 UCITS ETF $ 4.34 4.08iShares FTSE 100 UCITS ETF £ 3.45 3.21iShares FTSE MIB UCITS ETF EUR (Acc) € 29.43 27.48iShares MSCI Canada UCITS ETF $ 10.18 9.53iShares MSCI EM Asia UCITS ETF $ 20.90 16.12iShares MSCI EMU CHF Hedged UCITS ETF (Acc) Fr 13.14 12.33iShares MSCI EMU Small Cap UCITS ETF € 32.56 30.26iShares MSCI EMU UCITS ETF € 9.59 8.53iShares MSCI EMU USD Hedged UCITS ETF (Acc) $ 8.54 7.96iShares MSCI Japan UCITS ETF USD (Acc) $ 20.13 19.17iShares MSCI Korea UCITS ETF USD (Acc) $ 9.68 9.09iShares MSCI UK Small Cap UCITS ETF £ 20.58 19.34iShares MSCI UK UCITS ETF £ 9.15 8.51iShares MSCI USA Small Cap UCITS ETF $ 20.75 18.43iShares MSCI USA UCITS ETF $ 6.12 5.70iShares NASDAQ 100 UCITS ETF $ 5.89 5.42iShares Nikkei 225 UCITS ETF ¥ 33.57 31.60

iSHARES VII PLC
Supplementary information (unaudited) (continued)
i S H A R E S V I I P L C A N N U A L R E P O R T [ 3 0 3 ]
Securities Lending (continued)
The following tables detail the value of securities on loan and associated collateral received, analysed by borrowing counterparty as at 31 July 2018.
Counterparty* Securities
on loan Collateralreceived
iShares $ Treasury Bond 1-3yr UCITS ETF USD (Acc) B $'000 $'000Barclays Capital Securities Ltd. 13,734 15,081BNP Paribas Arbitrage SNC 12,996 14,262Societe Generale SA 3,422 3,760Total 30,152 33,103
Counterparty* Securities
on loan Collateralreceived
iShares $ Treasury Bond 3-7yr UCITS ETF $'000 $'000BNP Paribas Arbitrage SNC 263,707 289,403The Bank of Nova Scotia 256,910 282,658Societe Generale SA 218,455 240,057Barclays Capital Securities Ltd. 80,315 88,187Total 819,387 900,305
Counterparty* Securities
on loan Collateralreceived
iShares $ Treasury Bond 7-10yr UCITS ETF USD (Acc) $'000 $'000Barclays Capital Securities Ltd. 97,361 106,904Societe Generale SA 50,058 55,008BNP Paribas Arbitrage SNC 34,943 38,348The Bank of Nova Scotia 1,648 1,813Macquarie Bank Limited 11 16Total 184,021 202,089
Counterparty* Securities
on loan Collateralreceived
iShares € Govt Bond 1-3yr UCITS ETF EUR (Acc) €'000 €'000Societe Generale SA 48,424 53,320Merrill Lynch International 21,027 23,170BNP Paribas Arbitrage SNC 3,016 3,240J.P. Morgan Securities Plc 690 756Total 73,157 80,486
Counterparty* Securities
on loan Collateralreceived
iShares € Govt Bond 3-7yr UCITS ETF €'000 €'000Societe Generale SA 60,917 67,073The Bank of Nova Scotia 15,986 17,639J.P. Morgan Securities Plc 6,726 7,377Total 83,629 92,089
Counterparty* Securities
on loanCollateralreceived
iShares € Govt Bond 7-10yr UCITS ETF EUR (Acc) €'000 €'000The Bank of Nova Scotia 6,478 7,147J.P. Morgan Securities Plc 2,956 3,242BNP Paribas Arbitrage SNC 983 1,057Merrill Lynch International 254 280Total 10,671 11,726
Counterparty* Securities
on loanCollateralreceived
iShares Core EURO STOXX 50 UCITS ETF €'000 €'000Goldman Sachs International 161,356 171,532J.P. Morgan Securities Plc 116,026 127,085Credit Suisse AG Dublin Branch 37,488 39,672Morgan Stanley & Co. International Plc 2,460 2,655Total 317,330 340,944
Counterparty* Securities
on loanCollateralreceived
iShares Core MSCI Pacific ex-Japan UCITS ETF $'000 $'000Barclays Capital Securities Ltd. 83,056 91,777UBS AG 75,813 84,698J.P. Morgan Securities Plc 53,873 59,009Macquarie Bank Limited 47,274 51,755Societe Generale SA 41,381 43,575The Bank of Nova Scotia 16,936 19,118Citigroup Global Markets Ltd 15,750 16,607HSBC Bank Plc 15,426 16,635Morgan Stanley & Co. International Plc 12,829 13,844Goldman Sachs International 2,427 2,580Total 364,765 399,598
Counterparty* Securities
on loanCollateralreceived
iShares Core S&P 500 UCITS ETF $'000 $'000HSBC Bank Plc 327,736 353,432Societe Generale SA 327,462 344,820The Bank of Nova Scotia 300,403 339,105J.P. Morgan Securities Plc 189,981 208,090UBS AG 85,168 95,150Goldman Sachs International 172 183Total 1,230,922 1,340,780
* The respective counterparty’s country of establishment is detailed on page 323.

iSHARES VII PLC
Supplementary information (unaudited) (continued)
[ 3 0 4 ] i S H A R E S V I I P L C A N N U A L R E P O R T
Securities Lending (continued)
Counterparty* Securities
on loan Collateralreceived
iShares FTSE 100 UCITS ETF £'000 £'000Citigroup Global Markets Ltd 7,377 7,776The Bank of Nova Scotia 5,012 5,658J.P. Morgan Securities Plc 1,851 2,028HSBC Bank Plc 501 541Goldman Sachs International 297 316Total 15,038 16,319
Counterparty* Securities
on loan Collateralreceived
iShares FTSE MIB UCITS ETF EUR (Acc) €'000 €'000J.P. Morgan Securities Plc 15,966 17,489UBS AG 4,177 4,666Citigroup Global Markets Ltd 3,718 3,921Barclays Capital Securities Ltd. 1,066 1,178Morgan Stanley & Co. International Plc 979 1,056Macquarie Bank Limited 472 516The Bank of Nova Scotia 219 247Total 26,597 29,073
Counterparty* Securities
on loan Collateralreceived
iShares MSCI Canada UCITS ETF $'000 $'000Credit Suisse AG Dublin Branch 35,807 37,894Citigroup Global Markets Ltd 20,382 21,491UBS AG 14,550 16,256Morgan Stanley & Co. International Plc 9,125 9,847BNP Paribas Arbitrage SNC 6,650 8,129Societe Generale SA 4,956 5,218Goldman Sachs International 1,315 1,398Total 92,785 100,233
Counterparty* Securities
on loan Collateralreceived
iShares MSCI EM Asia UCITS ETF $'000 $'000UBS AG 27,731 30,980Merrill Lynch International 26,535 29,505HSBC Bank Plc 14,184 15,296Barclays Capital Securities Ltd. 4,801 5,306Citigroup Global Markets Ltd 4,679 4,933J.P. Morgan Securities Plc 3,734 4,090Macquarie Bank Limited 1,481 1,622Goldman Sachs International 1,256 1,336Total 84,401 93,068
Counterparty* Securities
on loanCollateralreceived
iShares MSCI EMU CHF Hedged UCITS ETF (Acc) Fr'000 Fr'000Citigroup Global Markets Ltd 1,974 2,082UBS AG 973 1,087HSBC Bank Plc 510 550Macquarie Bank Limited 251 275Total 3,708 3,994
Counterparty* Securities
on loanCollateralreceived
iShares MSCI EMU Small Cap UCITS ETF €'000 €'000J.P. Morgan Securities Plc 124,475 136,340Barclays Capital Securities Ltd. 61,041 67,450UBS AG 38,765 43,308Citigroup Global Markets Ltd 29,311 30,907Societe Generale SA 20,714 21,812Morgan Stanley & Co. International Plc 17,894 19,310Goldman Sachs International 10,942 11,632HSBC Bank Plc 10,180 10,978The Bank of Nova Scotia 8,194 9,250Macquarie Bank Limited 325 355Total 321,841 351,342
Counterparty* Securities
on loanCollateralreceived
iShares MSCI EMU UCITS ETF €'000 €'000J.P. Morgan Securities Plc 38,585 42,264UBS AG 32,854 36,704Citigroup Global Markets Ltd 26,747 28,202Goldman Sachs International 16,592 17,638Morgan Stanley & Co. International Plc 10,011 10,804Barclays Capital Securities Ltd. 6,725 7,431Societe Generale SA 5,951 6,266HSBC Bank Plc 5,416 5,840The Bank of Nova Scotia 7 8Total 142,888 155,157
* The respective counterparty’s country of establishment is detailed on page 323.

iSHARES VII PLC
Supplementary information (unaudited) (continued)
i S H A R E S V I I P L C A N N U A L R E P O R T [ 3 0 5 ]
Securities Lending (continued)
Counterparty* Securities
on loan Collateralreceived
iShares MSCI EMU USD Hedged UCITS ETF (Acc) $'000 $'000Citigroup Global Markets Ltd 10,829 11,418HSBC Bank Plc 4,884 5,267UBS AG 3,797 4,242Credit Suisse AG Dublin Branch 1,801 1,906Barclays Capital Securities Ltd. 662 732The Bank of Nova Scotia 372 420Total 22,345 23,985
Counterparty* Securities
on loan Collateralreceived
iShares MSCI Japan UCITS ETF USD (Acc) $'000 $'000Barclays Capital Securities Ltd. 53,302 58,899UBS AG 26,041 29,093Macquarie Bank Limited 9,262 10,140J.P. Morgan Securities Plc 4,429 4,851Societe Generale SA 3,362 3,540Citigroup Global Markets Ltd 3,343 3,525HSBC Bank Plc 393 424Total 100,132 110,472
Counterparty* Securities
on loan Collateralreceived
iShares MSCI Korea UCITS ETF USD (Acc) $'000 $'000Barclays Capital Securities Ltd. 1,301 1,439Societe Generale SA 1,238 1,303Citigroup Global Markets Ltd 1,063 1,121UBS AG 363 405Goldman Sachs International 303 322HSBC Bank Plc 76 82J.P. Morgan Securities Plc 72 79Total 4,416 4,751
Counterparty* Securities
on loan Collateralreceived
iShares MSCI UK Small Cap UCITS ETF £'000 £'000Morgan Stanley & Co. International Plc 28,242 30,477Total 28,242 30,477
Counterparty* Securities
on loanCollateralreceived
iShares MSCI UK UCITS ETF £'000 £'000J.P. Morgan Securities Plc 5,256 5,758Societe Generale SA 2,175 2,291Macquarie Bank Limited 1,374 1,504The Bank of Nova Scotia 1,370 1,546Citigroup Global Markets Ltd 725 764Goldman Sachs International 109 116Morgan Stanley & Co. International Plc 81 87Total 11,090 12,066
Counterparty* Securities
on loanCollateralreceived
iShares MSCI USA Small Cap UCITS ETF $'000 $'000UBS AG 68,553 76,587Societe Generale SA 26,737 28,154HSBC Bank Plc 17,762 19,155The Bank of Nova Scotia 12,260 13,840J.P. Morgan Securities Plc 1,845 2,021Morgan Stanley & Co. International Plc 265 286Goldman Sachs International 180 191Citigroup Global Markets Ltd 21 22Barclays Capital Securities Ltd. 11 12Total 127,634 140,268
Counterparty* Securities
on loanCollateralreceived
iShares MSCI USA UCITS ETF $'000 $'000UBS AG 31,724 35,441The Bank of Nova Scotia 2,315 2,614HSBC Bank Plc 623 672Total 34,662 38,727
Counterparty* Securities
on loanCollateralreceived
iShares NASDAQ 100 UCITS ETF $'000 $'000Credit Suisse AG Dublin Branch 94,250 99,743UBS AG 10,648 11,896The Bank of Nova Scotia 8,289 9,356J.P. Morgan Securities Plc 8,096 8,868HSBC Bank Plc 3,635 3,919Goldman Sachs International 3,627 3,856Societe Generale SA 144 151Total 128,689 137,789
* The respective counterparty’s country of establishment is detailed on page 323.

iSHARES VII PLC
Supplementary information (unaudited) (continued)
[ 3 0 6 ] i S H A R E S V I I P L C A N N U A L R E P O R T
Securities Lending (continued)
Counterparty* Securities
on loan Collateralreceived
iShares Nikkei 225 UCITS ETF ¥'000 ¥'000Barclays Capital Securities Ltd. 6,326,365 6,990,618Macquarie Bank Limited 1,107,977 1,213,005UBS AG 743,822 830,996Citigroup Global Markets Ltd 719,419 758,578Societe Generale SA 411,837 433,669J.P. Morgan Securities Plc 96,620 105,829Total 9,406,040 10,332,695
* The respective counterparty’s country of establishment is detailed on page 323.
All securities on loan have an open maturity tenor as they are recallable or terminable on a daily basis.
Collateral
The Funds engage in activities which may require collateral to be provided to a counterparty (“collateral posted”) or may hold collateral received (“collateral received”) from a counterparty. The following table provides an analysis by currency of the non-cash collateral received by way of title transfer collateral arrangement by the Funds, in respect of securities lending transactions, as at 31 July 2018.
Currency
Non-cashCollateralreceived
iShares $ Treasury Bond 1-3yr UCITS ETF USD (Acc) B $’000AUD 120CAD 172CHF 1,621DKK 105EUR 11,737GBP 6,495JPY 9,130SEK 849USD 2,874 Total 33,103
Currency
Non-cashCollateralreceived
iShares $ Treasury Bond 3-7yr UCITS ETF $’000AUD 2,289CAD 37,225CHF 25,400DKK 616EUR 234,722GBP 126,334JPY 105,909SEK 12,195USD 355,615Total 900,305
Currency
Non-cashCollateralreceived
iShares $ Treasury Bond 7-10yr UCITS ETF USD (Acc) $’000AUD 996CAD 1,451CHF 8,968DKK 746EUR 64,179GBP 31,307JPY 52,108SEK 3,936USD 38,398
Total 202,089
Currency
Non-cashCollateralreceived
iShares € Govt Bond 1-3yr UCITS ETF EUR (Acc) €'000AUD 212CAD 486CHF 1,842DKK 46EUR 20,212GBP 7,030JPY 12,548SEK 1,225USD 36,885Total 80,486

iSHARES VII PLC
Supplementary information (unaudited) (continued)
i S H A R E S V I I P L C A N N U A L R E P O R T [ 3 0 7 ]
Collateral (continued)
Currency
Non-cashCollateralreceived
iShares € Govt Bond 3-7yr UCITS ETF €'000AUD 284CAD 4,677CHF 776DKK 58EUR 22,015GBP 12,914JPY 4,138SEK 1,541USD 45,686Total 92,089
Currency
Non-cashCollateralreceived
iShares € Govt Bond 7-10yr UCITS ETF EUR (Acc) €'000AUD 119CAD 1,647CHF 169EUR 2,238GBP 3,720JPY 1,769USD 2,064Total 11,726
Currency
Non-cashCollateralreceived
iShares Core EURO STOXX 50 UCITS ETF €'000AUD 1,376CAD 1,251CHF 3,429EUR 113,428GBP 53,993JPY 74,498USD 92,969
Total 340,944
Currency
Non-cashCollateralreceived
iShares Core MSCI Pacific ex-Japan UCITS ETF $’000AUD 763CAD 5,531CHF 4,016EUR 125,337GBP 43,452JPY 59,226NOK 1,192USD 160,081
Total 399,598
Currency
Non-cashCollateralreceived
iShares Core S&P 500 UCITS ETF $’000AUD 4,459CAD 51,031CHF 4,051EUR 269,922GBP 231,472JPY 90,295USD 689,550
Total 1,340,780
Currency
Non-cashCollateralreceived
iShares FTSE 100 UCITS ETF £'000AUD 59CAD 848CHF 39EUR 6,899GBP 3,743JPY 702USD 4,029Total 16,319
Currency
Non-cashCollateralreceived
iShares FTSE MIB UCITS ETF EUR (Acc) €’000AUD 191CAD 80CHF 375EUR 9,614GBP 4,784JPY 6,129NOK 15USD 7,885
Total 29,073

iSHARES VII PLC
Supplementary information (unaudited) (continued)
[ 3 0 8 ] i S H A R E S V I I P L C A N N U A L R E P O R T
Collateral (continued)
Currency
Non-cashCollateralreceived
iShares MSCI Canada UCITS ETF $’000CAD 1,234CHF 2,305EUR 32,130GBP 10,433JPY 10,793SEK 149USD 43,189
Total 100,233
Currency
Non-cashCollateralreceived
iShares MSCI EM Asia UCITS ETF $’000AUD 958CAD 682CHF 1,395EUR 20,857GBP 11,075JPY 20,722NOK 396USD 36,983
Total 93,068
Currency
Non-cashCollateralreceived
iShares MSCI EMU CHF Hedged UCITS ETF (Acc) Fr'000CAD 3EUR 1,815GBP 649JPY 289USD 1,238Total 3,994
Currency
Non-cashCollateralreceived
iShares MSCI EMU Small Cap UCITS ETF €’000AUD 1,537CAD 3,300CHF 4,733EUR 126,826GBP 49,594JPY 64,188NOK 876USD 100,288Total 351,342
Currency
Non-cashCollateralreceived
iShares MSCI EMU UCITS ETF €’000AUD 458CAD 289CHF 1,061EUR 56,576GBP 24,872JPY 27,302NOK 97USD 44,502Total 155,157
Currency
Non-cashCollateralreceived
iShares MSCI EMU USD Hedged UCITS ETF (Acc) $’000AUD 3CAD 153CHF 72EUR 10,552GBP 3,895JPY 1,390NOK 10USD 7,910
Total 23,985
Currency
Non-cashCollateralreceived
iShares MSCI Japan UCITS ETF USD (Acc) $’000AUD 53CAD 1,650CHF 1,930EUR 41,641GBP 8,571JPY 19,156NOK 765USD 36,706
Total 110,472

iSHARES VII PLC
Supplementary information (unaudited) (continued)
i S H A R E S V I I P L C A N N U A L R E P O R T [ 3 0 9 ]
Collateral (continued)
Currency
Non-cashCollateralreceived
iShares MSCI Korea UCITS ETF USD (Acc) $’000AUD 1CAD 40CHF 46EUR 2,111GBP 439JPY 457NOK 19USD 1,638
Total 4,751
Currency
Non-cashCollateralreceived
iShares MSCI UK Small Cap UCITS ETF £'000EUR 19,330GBP 5,530JPY 5,515USD 102Total 30,477
Currency
Non-cashCollateralreceived
iShares MSCI UK UCITS ETF £'000AUD 72CAD 232CHF 111EUR 3,380GBP 1,718JPY 1,689USD 4,864Total 12,066
Currency
Non-cashCollateralreceived
iShares MSCI USA Small Cap UCITS ETF $’000AUD 112CAD 2,259CHF 74EUR 19,442GBP 21,360JPY 20,602USD 76,419
Total 140,268
Currency
Non-cashCollateralreceived
iShares MSCI USA UCITS ETF $’000AUD 17CAD 477CHF 16EUR 2,964GBP 6,705JPY 8,951USD 19,597
Total 38,727
Currency
Non-cashCollateralreceived
iShares NASDAQ 100 UCITS ETF $’000AUD 157CAD 4,575CHF 2,643EUR 13,008GBP 10,524JPY 16,396USD 90,486
Total 137,789
Currency
Non-cashCollateralreceived
iShares Nikkei 225 UCITS ETF ¥’000AUD 1,146CAD 189,517CHF 218,793EUR 4,855,736GBP 565,050JPY 1,494,103NOK 90,809USD 2,917,541Total 10,332,695

iSHARES VII PLC
Supplementary information (unaudited) (continued)
[ 3 1 0 ] i S H A R E S V I I P L C A N N U A L R E P O R T
Collateral (continued)
The Funds are the legal owner of inbound collateral and can sell the assets and withhold the cash in the case of default. All cash received or posted as collateral has an open maturity tenor as it’s not subject to a contractual maturity date. Non-cash collateral received by way of title transfer collateral arrangement in relation to securities lending transactions cannot be sold, re-invested or pledged. The following table provides an analysis of the type, quality and maturity tenor of non-cash collateral received and posted by the Funds by way of title transfer collateral arrangement in respect of securities lending transactions as at 31 July 2018.
Maturity tenor
Collateral type and quality 8-30
days31-90days
91-365days
More than 365 days Open Total
iShares $ Treasury Bond 1-3yr UCITS ETF USD (Acc) B $'000 $'000 $'000 $'000 $'000 $'000 Fixed income Investment grade - - - 33 - 33 Equities Recognised equity index - - - - 33,070 33,070 Total - - - 33 33,070 33,103
Maturity tenor
Collateral type and quality 8-30
days31-90days
91-365days
More than 365 days Open Total
iShares $ Treasury Bond 3-7yr UCITS ETF $'000 $'000 $'000 $'000 $'000 $'000 Fixed income Investment grade - - - 679 - 679 Equities Recognised equity index - - - - 899,626 899,626 Total - - - 679 899,626 900,305
Maturity tenor
Collateral type and quality 8-30
days31-90days
91-365days
More than 365 days Open Total
iShares $ Treasury Bond 7-10yr UCITS ETF USD (Acc) $'000 $'000 $'000 $'000 $'000 $'000 Fixed income Investment grade - - - 90 - 90 Equities Recognised equity index - - - - 201,997 201,997 ETFs UCITS - - - - 1 1Non-UCITS - - - - 1 1 Total - - - 90 201,999 202,089

iSHARES VII PLC
Supplementary information (unaudited) (continued)
i S H A R E S V I I P L C A N N U A L R E P O R T [ 3 1 1 ]
Collateral (continued)
Maturity tenor
Collateral type and quality 8-30
days31-90days
91-365days
More than 365 days Open Total
iShares € Govt Bond 1-3yr UCITS ETF EUR (Acc) €’000 €’000 €’000 €’000 €’000 €’000 Fixed income Investment grade - 2 1 1,174 - 1,177 Equities Recognised equity index - - - - 77,792 77,792 ETFs UCITS - - - - 532 532Non-UCITS - - - - 985 985 Total - 2 1 1,174 79,309 80,486
Maturity tenor
Collateral type and quality 8-30
days31-90days
91-365days
More than 365 days Open Total
iShares € Govt Bond 3-7yr UCITS ETF €’000 €’000 €’000 €’000 €’000 €’000 Fixed income Investment grade - 24 11 269 - 304 Equities Recognised equity index - - - - 91,421 91,421 ETFs UCITS - - - - 13 13Non-UCITS - - - - 351 351 Total - 24 11 269 91,785 92,089

iSHARES VII PLC
Supplementary information (unaudited) (continued)
[ 3 1 2 ] i S H A R E S V I I P L C A N N U A L R E P O R T
Collateral (continued)
Maturity tenor
Collateral type and quality 8-30
days31-90days
91-365days
More than 365 days Open Total
iShares € Govt Bond 7-10yr UCITS ETF EUR (Acc) €’000 €’000 €’000 €’000 €’000 €’000 Fixed income Investment grade - 10 5 492 - 507
Equities Recognised equity index - - - - 11,204 11,204 ETFs UCITS - - - - 6 6Non-UCITS - - - - 9 9 Total - 10 5 492 11,219 11,726
Maturity tenor
Collateral type and quality 8-30
days31-90days
91-365days
More than 365 days Open Total
iShares Core EURO STOXX 50 UCITS ETF €’000 €’000 €’000 €’000 €’000 €’000 Fixed income Investment grade 15,944 5,196 10,507 104,739 - 136,386 Equities Recognised equity index - - - - 204,487 204,487 ETFs Non-UCITS - - - - 71 71 Total 15,944 5,196 10,507 104,739 204,558 340,944
Maturity tenor
Collateral type and quality 8-30
days31-90days
91-365days
More than 365 days Open Total
iShares Core MSCI Pacific ex-Japan UCITS ETF $’000 $’000 $’000 $’000 $’000 $’000 Fixed income Investment grade 301 945 9,717 102,837 - 113,800 Equities Recognised equity index - - - - 285,103 285,103 ETFs UCITS - - - - 5 5Non-UCITS - - - - 690 690 Total 301 945 9,717 102,837 285,798 399,598

iSHARES VII PLC
Supplementary information (unaudited) (continued)
i S H A R E S V I I P L C A N N U A L R E P O R T [ 3 1 3 ]
Collateral (continued)
Maturity tenor
Collateral type and quality 8-30
days31-90days
91-365days
More than 365 days Open Total
iShares Core S&P 500 UCITS ETF $’000 $’000 $’000 $’000 $’000 $’000 Fixed income Investment grade 239 3,131 2,009 179,138 - 184,517 Equities Recognised equity index - - - - 1,141,559 1,141,559 ETFs UCITS - - - - 38 38Non-UCITS - - - - 14,666 14,666 Total 239 3,131 2,009 179,138 1,156,263 1,340,780
Maturity tenor
Collateral type and quality 8-30
days31-90days
91-365days
More than 365 days Open Total
iShares FTSE 100 UCITS ETF £’000 £’000 £’000 £’000 £’000 £’000 Fixed income Investment grade 31 36 1,102 7,232 - 8,401 Fixed income Investment grade - - - - 7,896 7,896 ETFs Non-UCITS - - - - 22 22 Total 31 36 1,102 7,232 7,918 16,319
Maturity tenor
Collateral type and quality 8-30
days31-90days
91-365days
More than 365 days Open Total
iShares FTSE MIB UCITS ETF EUR (Acc) €’000 €’000 €’000 €’000 €’000 €’000 Fixed income Investment grade 19 262 789 7,066 - 8,136 Equities Recognised equity index - - - - 20,937 20,937 Total 19 262 789 7,066 20,937 29,073

iSHARES VII PLC
Supplementary information (unaudited) (continued)
[ 3 1 4 ] i S H A R E S V I I P L C A N N U A L R E P O R T
Collateral (continued)
Maturity tenor
Collateral type and quality 8-30
days31-90days
91-365days
More than 365 days Open Total
iShares MSCI Canada UCITS ETF $’000 $’000 $’000 $’000 $’000 $’000 Fixed income Investment grade 129 29 3,034 32,869 - 36,061 Equities Recognised equity index - - - - 64,103 64,103 ETFs UCITS - - - - 1 1Non-UCITS - - - - 68 68 Total 129 29 3,034 32,869 64,172 100,233
Maturity tenor
Collateral type and quality 8-30
days31-90days
91-365days
More than 365 days Open Total
iShares MSCI EM Asia UCITS ETF $’000 $’000 $’000 $’000 $’000 $’000 Fixed income Investment grade 127 92 1,195 20,722 - 22,136 Equities Recognised equity index - - - - 69,363 69,363 ETFs UCITS - - - - 183 183Non-UCITS - - - - 1,386 1,386 Total 127 92 1,195 20,722 70,932 93,068
Maturity tenor
Collateral type and quality 8-30
days31-90days
91-365days
More than 365 days Open Total
iShares MSCI EMU CHF Hedged UCITS ETF (Acc) Fr’000 Fr’000 Fr’000 Fr’000 Fr’000 Fr’000 Fixed income Investment grade - - 286 2,254 - 2,540 Equities Recognised equity index - - - - 1,431 1,431 ETFs Non-UCITS - - - - 23 23 Total - - 286 2,254 1,454 3,994

iSHARES VII PLC
Supplementary information (unaudited) (continued)
i S H A R E S V I I P L C A N N U A L R E P O R T [ 3 1 5 ]
Collateral (continued)
Maturity tenor
Collateral type and quality 8-30
days31-90days
91-365days
More than 365 days Open Total
iShares MSCI EMU Small Cap UCITS ETF €’000 €’000 €’000 €’000 €’000 €’000 Fixed income Investment grade 1,217 2,269 11,086 107,308 - 121,880 Equities Recognised equity index - - - - 229,004 229,004 ETFs UCITS - - - - 2 2Non-UCITS - - - - 456 456 Total 1,217 2,269 11,086 107,308 229,462 351,342
Maturity tenor
Collateral type and quality 8-30
days31-90days
91-365days
More than 365 days Open Total
iShares MSCI EMU UCITS ETF €’000 €’000 €’000 €’000 €’000 €’000 Fixed income Investment grade 1,671 977 5,785 61,198 - 69,631 Equities Recognised equity index - - - - 85,283 85,283 ETFs UCITS - - - - 1 1Non-UCITS - - - - 242 242 Total 1,671 977 5,785 61,198 85,526 155,157
Maturity tenor
Collateral type and quality 8-30
days31-90days
91-365days
More than 365 days Open Total
iShares MSCI EMU USD Hedged UCITS ETF (Acc) $’000 $’000 $’000 $’000 $’000 $’000 Fixed income Investment grade - 1 1,622 13,301 - 14,924 Equities Recognised equity index - - - - 8,839 8,839 ETFs Non-UCITS - - - - 222 222 Total - 1 1,622 13,301 9,061 23,985

iSHARES VII PLC
Supplementary information (unaudited) (continued)
[ 3 1 6 ] i S H A R E S V I I P L C A N N U A L R E P O R T
Collateral (continued)
Maturity tenor
Collateral type and quality 8-30
days31-90days
91-365days
More than 365 days Open Total
iShares MSCI Japan UCITS ETF USD (Acc) $’000 $’000 $’000 $’000 $’000 $’000 Fixed income Investment grade 5 77 4,844 38,454 - 43,380 Equities Recognised equity index - - - - 67,074 67,074 ETFs Non-UCITS - - - - 18 18 Total 5 77 4,844 38,454 67,092 110,472
Maturity tenor
Collateral type and quality 8-30
days31-90days
91-365days
More than 365 days Open Total
iShares MSCI Korea UCITS ETF USD (Acc) $’000 $’000 $’000 $’000 $’000 $’000 Fixed income Investment grade 30 7 277 1,972 - 2,286 Equities Recognised equity index - - - - 2,462 2,462 ETFs Non-UCITS - - - - 3 3 Total 30 7 277 1,972 2,465 4,751
Maturity tenor
Collateral type and quality 8-30
days31-90days
91-365days
More than 365 days Open Total
iShares MSCI UK Small Cap UCITS ETF £’000 £’000 £’000 £’000 £’000 £’000 Fixed income Investment grade - - - 30,462 - 30,462 Equities Recognised equity index - - - - 15 15 Total - - - 30,462 15 30,477

iSHARES VII PLC
Supplementary information (unaudited) (continued)
i S H A R E S V I I P L C A N N U A L R E P O R T [ 3 1 7 ]
Collateral (continued)
Maturity tenor
Collateral type and quality 8-30
days31-90days
91-365days
More than 365 days Open Total
iShares MSCI UK UCITS ETF £’000 £’000 £’000 £’000 £’000 £’000 Fixed income Investment grade 17 88 165 1,160 - 1,430 Equities Recognised equity index - - - - 10,636 10,636 Total 17 88 165 1,160 10,636 12,066
Maturity tenor
Collateral type and quality 8-30
days31-90days
91-365days
More than 365 days Open Total
iShares MSCI USA Small Cap UCITS ETF $’000 $’000 $’000 $’000 $’000 $’000 Fixed income Investment grade 20 46 85 24,688 - 24,839 Equities Recognised equity index - - - - 114,631 114,631 ETFs UCITS - - - - 3 3Non-UCITS - - - - 795 795 Total 20 46 85 24,688 115,429 140,268
Maturity tenor
Collateral type and quality 8-30
days31-90days
91-365days
More than 365 days Open Total
iShares MSCI USA UCITS ETF $’000 $’000 $’000 $’000 $’000 $’000 Fixed income Investment grade - 6 24 7,786 - 7,816 Equities Recognised equity index - - - - 30,883 30,883 ETFs Non-UCITS - - - - 28 28 Total - 6 24 7,786 30,911 38,727

iSHARES VII PLC
Supplementary information (unaudited) (continued)
[ 3 1 8 ] i S H A R E S V I I P L C A N N U A L R E P O R T
Collateral (continued)
Maturity tenor
Collateral type and quality 8-30
days31-90days
91-365days
More than 365 days Open Total
iShares NASDAQ 100 UCITS ETF $’000 $’000 $’000 $’000 $’000 $’000 Fixed income Investment grade 365 209 302 7,510 - 8,386 Equities Recognised equity index - - - - 129,062 129,062 ETFs Non-UCITS - - - - 341 341 Total 365 209 302 7,510 129,403 137,789
Maturity tenor
Collateral type and quality 8-30
days31-90days
91-365days
More than 365 days Open Total
iShares Nikkei 225 UCITS ETF ¥’000 ¥’000 ¥’000 ¥’000 ¥’000 ¥’000 Fixed income Investment grade 113 1,712 615,443 4,252,680 - 4,869,948 Equities Recognised equity index - - - - 5,462,699 5,462,699 ETFs UCITS - - - - 48 48 Total 113 1,712 615,443 4,252,680 5,462,747 10,332,695
No collateral had a maturity tenor of less than 8 days. Investment grade securities are those issued by an entity with a minimum investment grade credit rating from at least one globally recognised credit rating agency; Standard & Poor’s, Moody’s or Fitch. A recognised equity index contains at least 20 equities where no single equity represents more than 20% of the total index and no five equities combined represent more than 60% of the total index. The maturity tenor analysis for fixed income securities received or posted as collateral is based on the respective contractual maturity date, while for equity securities, ETFs and money market funds received or posted as collateral are presented as open transactions as they are not subject to a contractual maturity date. As at 31 July 2018, all non-cash collateral received by the Funds in respect of securities lending transactions is held by the Funds’ Depositary (or through its delegates).

iSHARES VII PLC
Supplementary information (unaudited) (continued)
i S H A R E S V I I P L C A N N U A L R E P O R T [ 3 1 9 ]
Collateral (continued)
The following table lists the ten largest issuers by value of non-cash collateral received by the Funds by way of title transfer collateral arrangement across securities lending transactions as at 31 July 2018. Issuer Value % of NAViShares $ Treasury Bond 1-3yr UCITS ETF USD (Acc) B $'000 Vodafone Group Plc 1,142 0.84Royal Dutch Shell Plc 1,025 0.76Repsol SA 525 0.39Daimler AG 484 0.36Hoya Corp 460 0.34Intesa Sanpaolo SpA 432 0.32Anheuser-Busch Inbev SA/NV 421 0.31Astellas Pharma Inc 401 0.30Fast Retailing Co Ltd 401 0.30Tokyo Electron Ltd 395 0.29Other issuers 27,417 20.25Total 33,103 24.46
Issuer Value % of NAViShares $ Treasury Bond 3-7yr UCITS ETF $'000 Alphabet Inc 40,751 2.97Amazon.com Inc 35,978 2.62Royal Bank Of Canada 28,709 2.09Boeing Co 27,488 2.00Home Depot Inc 24,359 1.77Apple Inc 18,575 1.35Anthem Inc 17,695 1.29Royal Dutch Shell Plc 15,525 1.13Anheuser-Busch Inbev SA/NV 14,738 1.07JD.com Inc 14,041 1.02Other issuers 662,446 48.22Total 900,305 65.53
Issuer Value % of NAViShares $ Treasury Bond 7-10yr UCITS ETF USD (Acc) $’000 Vodafone Group Plc 7,450 3.42 Royal Dutch Shell Plc 4,363 2.00Apple Inc 4,256 1.95Repsol SA 3,720 1.71JD.com Inc 3,217 1.48Anheuser-Busch Inbev SA/NV 2,830 1.30BNP Paribas SA 2,791 1.28Renesas Electronics Corp 2,773 1.27Hoya Corp 2,752 1.26Keyence Corp 2,291 1.05Other issuers 165,646 75.95Total 202,089 92.67
Issuer Value % of NAViShares € Govt Bond 1-3yr UCITS ETF EUR (Acc) €'000Apple Inc 4,846 1.81Unicredit SpA 4,606 1.72Axa SA 2,745 1.03Agilent Technologies Inc 2,538 0.95Dell Technologies Inc Class V 2,351 0.88Mcdonald's Corp 2,331 0.87Walmart Inc 2,317 0.87Opt Holding Inc 2,100 0.78Metro Bank Plc 2,100 0.78Baidu Inc 2,100 0.78Other issuers 52,452 19.58Total 80,486 30.05
Issuer Value % of NAViShares € Govt Bond 3-7yr UCITS ETF €'000Apple Inc 6,096 1.77Unicredit SpA 5,942 1.73Axa SA 4,646 1.35Agilent Technologies Inc 3,218 0.94Dell Technologies Inc Class V 2,957 0.86Mcdonald's Corp 2,933 0.85Walmart Inc 2,914 0.85Muenchener Rueckversicherungs-Gesellschaft AG 2,380 0.69Dollar Tree Inc 2,256 0.66Philip Morris International Inc 2,193 0.64Other issuers 56,554 16.46Total 92,089 26.80
Issuer Value % of NAViShares € Govt Bond 7-10yr UCITS ETF EUR (Acc) €'000Glaxosmithkline Plc 721 1.79Canadian Natural Resources Ltd 710 1.77Royal Dutch Shell Plc 537 1.34National Grid Plc 513 1.28Axa SA 484 1.20Vodafone Group Plc 441 1.10Canadian National Railway Co 435 1.08Microsoft Corp 332 0.83Centrica Plc 301 0.75Canadian Imperial Bank of Commerce 246 0.61Other issuers 7,006 17.44Total 11,726 29.19
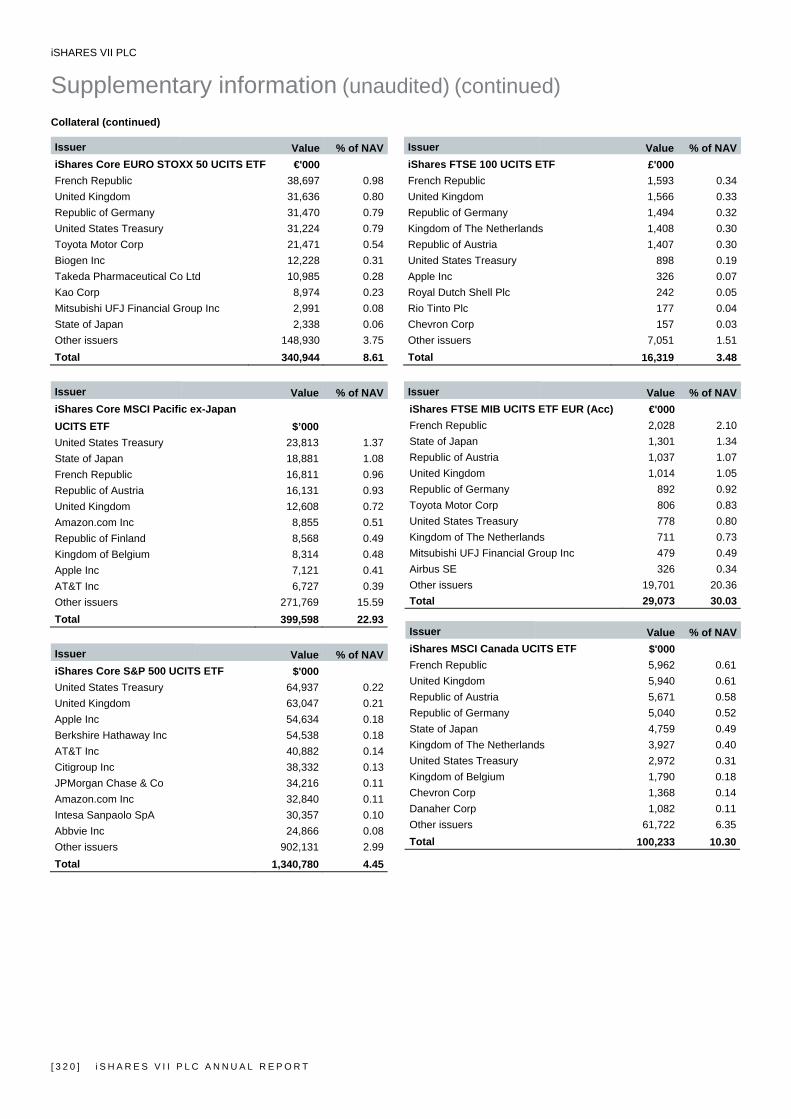
iSHARES VII PLC
Supplementary information (unaudited) (continued)
[ 3 2 0 ] i S H A R E S V I I P L C A N N U A L R E P O R T
Collateral (continued)
Issuer Value % of NAViShares Core EURO STOXX 50 UCITS ETF €'000 French Republic 38,697 0.98United Kingdom 31,636 0.80Republic of Germany 31,470 0.79United States Treasury 31,224 0.79Toyota Motor Corp 21,471 0.54Biogen Inc 12,228 0.31Takeda Pharmaceutical Co Ltd 10,985 0.28Kao Corp 8,974 0.23Mitsubishi UFJ Financial Group Inc 2,991 0.08State of Japan 2,338 0.06Other issuers 148,930 3.75Total 340,944 8.61
Issuer Value % of NAViShares Core MSCI Pacific ex-Japan UCITS ETF $’000 United States Treasury 23,813 1.37State of Japan 18,881 1.08French Republic 16,811 0.96Republic of Austria 16,131 0.93United Kingdom 12,608 0.72Amazon.com Inc 8,855 0.51Republic of Finland 8,568 0.49Kingdom of Belgium 8,314 0.48Apple Inc 7,121 0.41AT&T Inc 6,727 0.39Other issuers 271,769 15.59Total 399,598 22.93
Issuer Value % of NAViShares Core S&P 500 UCITS ETF $'000 United States Treasury 64,937 0.22United Kingdom 63,047 0.21Apple Inc 54,634 0.18Berkshire Hathaway Inc 54,538 0.18AT&T Inc 40,882 0.14Citigroup Inc 38,332 0.13JPMorgan Chase & Co 34,216 0.11Amazon.com Inc 32,840 0.11Intesa Sanpaolo SpA 30,357 0.10Abbvie Inc 24,866 0.08Other issuers 902,131 2.99Total 1,340,780 4.45
Issuer Value % of NAViShares FTSE 100 UCITS ETF £'000French Republic 1,593 0.34United Kingdom 1,566 0.33Republic of Germany 1,494 0.32Kingdom of The Netherlands 1,408 0.30Republic of Austria 1,407 0.30United States Treasury 898 0.19Apple Inc 326 0.07Royal Dutch Shell Plc 242 0.05Rio Tinto Plc 177 0.04Chevron Corp 157 0.03Other issuers 7,051 1.51Total 16,319 3.48
Issuer Value % of NAViShares FTSE MIB UCITS ETF EUR (Acc) €'000French Republic 2,028 2.10State of Japan 1,301 1.34Republic of Austria 1,037 1.07United Kingdom 1,014 1.05Republic of Germany 892 0.92Toyota Motor Corp 806 0.83United States Treasury 778 0.80Kingdom of The Netherlands 711 0.73Mitsubishi UFJ Financial Group Inc 479 0.49Airbus SE 326 0.34Other issuers 19,701 20.36Total 29,073 30.03
Issuer Value % of NAViShares MSCI Canada UCITS ETF $'000French Republic 5,962 0.61United Kingdom 5,940 0.61Republic of Austria 5,671 0.58Republic of Germany 5,040 0.52State of Japan 4,759 0.49Kingdom of The Netherlands 3,927 0.40United States Treasury 2,972 0.31Kingdom of Belgium 1,790 0.18Chevron Corp 1,368 0.14Danaher Corp 1,082 0.11Other issuers 61,722 6.35Total 100,233 10.30

iSHARES VII PLC
Supplementary information (unaudited) (continued)
i S H A R E S V I I P L C A N N U A L R E P O R T [ 3 2 1 ]
Collateral (continued)
Issuer Value % of NAViShares MSCI EM Asia UCITS ETF $'000 State of Japan 5,734 1.09United States Treasury 5,228 1.00United Kingdom 4,040 0.77Baidu Inc 2,743 0.52NXP Semiconductors NV 2,672 0.51JD.com Inc 2,377 0.45French Republic 2,051 0.39Republic of Germany 1,738 0.33Republic of Austria 1,507 0.29Microsoft Corp 1,440 0.27Other issuers 63,538 12.15Total 93,068 17.77
Issuer Value % of NAViShares MSCI EMU CHF Hedged UCITS ETF (Acc) Fr'000 United Kingdom 473 1.58Republic of Germany 398 1.32French Republic 386 1.28Kingdom of The Netherlands 377 1.25Republic of Austria 377 1.25United States Treasury 326 1.08State of Japan 199 0.66Microsoft Corp 60 0.20JPMorgan Chase & Co 51 0.17Intesa Sanpaolo SpA 46 0.15Other issuers 1,301 4.34Total 3,994 13.28
Issuer Value % of NAViShares MSCI EMU Small Cap UCITS ETF €'000 French Republic 24,623 2.32United States Treasury 20,575 1.93Republic of Austria 16,892 1.59United Kingdom 16,187 1.52State of Japan 13,419 1.26Republic of Germany 10,527 0.99Kingdom of Belgium 7,763 0.73Toyota Motor Corp 7,444 0.70Republic of Finland 6,287 0.59Mitsubishi UFJ Financial Group Inc 6,001 0.56Other issuers 221,624 20.85Total 351,342 33.04
Issuer Value % of NAViShares MSCI EMU UCITS ETF €'000French Republic 13,389 0.80United Kingdom 11,684 0.70Republic of Germany 9,670 0.58United States Treasury 9,414 0.56State of Japan 9,296 0.56Republic of Austria 7,918 0.47Kingdom of The Netherlands 5,108 0.31Toyota Motor Corp 3,860 0.23Kingdom of Belgium 2,425 0.14Microsoft Corp 1,737 0.10Other issuers 80,656 4.82Total 155,157 9.27
Issuer Value % of NAViShares MSCI EMU USD Hedged UCITS ETF (Acc) $'000United Kingdom 3,022 1.07Republic of Germany 2,268 0.81United States Treasury 2,265 0.81French Republic 2,217 0.79Republic of Austria 2,151 0.77Kingdom of The Netherlands 2,069 0.74State of Japan 777 0.28JPMorgan Chase & Co 506 0.18Intesa Sanpaolo SpA 440 0.16Berkshire Hathaway Inc 373 0.13Other issuers 7,897 2.80Total 23,985 8.54
Issuer Value % of NAViShares MSCI Japan UCITS ETF USD (Acc) $'000United States Treasury 11,644 2.23Republic of Austria 7,454 1.43French Republic 5,456 1.04Republic of Finland 5,419 1.04State of Japan 5,400 1.03Kingdom of Belgium 3,728 0.71Takeda Pharmaceutical Co Ltd 3,185 0.61Anheuser-Busch InBev SA/NV 3,001 0.57United Kingdom 2,964 0.57Mitsubishi UFJ Financial Group Inc 2,500 0.48Other issuers 59,721 11.44Total 110,472 21.15

iSHARES VII PLC
Supplementary information (unaudited) (continued)
[ 3 2 2 ] i S H A R E S V I I P L C A N N U A L R E P O R T
Collateral (continued)
Issuer Value % of NAViShares MSCI Korea UCITS ETF USD (Acc) $'000 United States Treasury 444 0.91French Republic 377 0.78Republic of Austria 369 0.76United Kingdom 330 0.68Republic of Germany 264 0.54Kingdom of The Netherlands 203 0.42AT&T Inc 135 0.28Republic of Finland 133 0.27Apple Inc 132 0.27Amazon.com Inc 124 0.26Other issuers 2,240 4.61Total 4,751 9.78
Issuer Value % of NAViShares MSCI UK Small Cap UCITS ETF £'000 French Republic 5,515 3.78Kingdom of Belgium 5,515 3.78United Kingdom 5,515 3.78State of Japan 5,515 3.78Republic of Austria 5,515 3.78Republic of Germany 2,785 1.90United States Treasury 102 0.06TI Fluid Systems Plc 15 0.01Total 30,477 20.87
Issuer Value % of NAViShares MSCI UK UCITS ETF £'000 French Republic 516 0.40Amazon.com Inc 355 0.27Apple Inc 337 0.26Toyota Motor Corp 260 0.20AT&T Inc 243 0.19Citigroup Inc 243 0.19United Kingdom 197 0.15Republic of Germany 195 0.15Berkshire Hathaway Inc 194 0.15Abbvie Inc 165 0.13Other issuers 9,361 7.17Total 12,066 9.26
Issuer Value % of NAViShares MSCI USA Small Cap UCITS ETF $'000State of Japan 14,110 2.04United States Treasury 5,635 0.81AT&T Inc 4,956 0.72Apple Inc 4,883 0.71Berkshire Hathaway Inc 3,724 0.54Microsoft Corp 3,671 0.53United Kingdom 3,469 0.50Citigroup Inc 2,905 0.42Amazon.com Inc 2,681 0.39Abbvie Inc 2,030 0.29Other issuers 92,204 13.30Total 140,268 20.25
Issuer Value % of NAViShares MSCI USA UCITS ETF $'000State of Japan 6,492 1.07Microsoft Corp 1,609 0.26United States Treasury 1,163 0.19AT&T Inc 991 0.16DXC Technology Co 880 0.14Apple Inc 803 0.13BHP Billiton Plc 782 0.13Occidental Petroleum Corp 780 0.13FMC Corp 601 0.10HCA Healthcare Inc 596 0.10Other issuers 24,030 3.96Total 38,727 6.37
Issuer Value % of NAViShares NASDAQ 100 UCITS ETF $'000Chevron Corp 3,859 0.16Entergy Corp 2,590 0.11State of Japan 2,308 0.10Danaher Corp 2,281 0.10Royal Dutch Shell Plc 2,231 0.09United States Treasury 2,179 0.09Rockwell Collins Inc 2,075 0.09Bank of America Corp 1,743 0.07Johnson & Johnson 1,689 0.07Suncor Energy Inc 1,578 0.07Other issuers 115,256 4.86Total 137,789 5.81

iSHARES VII PLC
Supplementary information (unaudited) (continued)
i S H A R E S V I I P L C A N N U A L R E P O R T [ 3 2 3 ]
Collateral (continued)
Issuer Value % of NAViShares Nikkei 225 UCITS ETF ¥'000 United States Treasury 1,326,783 4.46Republic of Austria 946,238 3.18French Republic 680,327 2.29Republic of Finland 642,740 2.16Kingdom of Belgium 442,441 1.49United Kingdom 402,598 1.35Takeda Pharmaceutical Co Ltd 378,067 1.27Anheuser-Busch InBev SA/NV 356,210 1.20Mitsubishi UFJ Financial Group Inc 273,595 0.92Enel SpA 243,176 0.82Other issuers 4,640,520 15.57Total 10,332,695 34.71
No securities collateral received from a single issuer, in relation to efficient portfolio management and OTC financial derivative instruments, has exceeded 20% of any of the respective Funds’ NAV at the financial year end date. None of the Funds have been fully collateralised in securities issued or guaranteed by an EU member state at the financial year end date.
Counterparties to securities lending transactions
Counterparty name Country of establishment Barclays Bank Plc United Kingdom
Barclays Capital Securities Ltd. United Kingdom
BNP Paribas Arbitrage SNC France
BNP Paribas SA France
Citigroup Global Markets Ltd United Kingdom
Credit Suisse AG Dublin Branch Ireland
Credit Suisse International Switzerland
Credit Suisse Securities (Europe) Limited United Kingdom
Deutsche Bank AG Germany
Goldman Sachs International United Kingdom
HSBC Bank Plc United Kingdom
J.P. Morgan Securities Plc United Kingdom
Macquarie Bank Limited Australia
Merrill Lynch International United Kingdom
Morgan Stanley & Co. International Plc United Kingdom
Nomura International Plc United Kingdom
Societe Generale SA France
The Bank of Nova Scotia Canada
UBS AG Switzerland

iSHARES VII PLC
Glossary* (unaudited)
[ 3 2 4 ] i S H A R E S V I I P L C A N N U A L R E P O R T
Futures contracts A futures contract is a contract, traded on an exchange, to buy or sell a certain underlying instrument at a certain date in the future, at a specified price. They are entered into for the purposes of gaining exposure to or hedging against changes in interest rates, changes in the value of securities or foreign currencies. Depending on the terms of a particular contract, futures can be settled either through physical delivery of the underlying instrument or by payment of a cash amount on the settlement date. Upon entering into the contract the Fund is required to deposit initial margin with the broker in the form of cash or securities in an amount that varies depending on the contracts size and risk profile. During the life of the contract the Fund agrees to pay or receive an amount of cash equal to the daily fluctuation in the value of the contract know as variation margin. When the contract is closed, the Fund records a realised gain or loss equal to the difference between the value of the contract at the time it was open and the value at the time it was closed. Forward currency contracts A forward currency contract is an agreement between two parties to buy or sell a currency at a set exchange rate at a certain date in the future. The Fund enters into forward currency contracts as an economic hedge against transactions or financial instruments and to obtain exposure to foreign currencies. The unrealised gain or loss on open forward currency contracts is calculated by reference to the difference between the contracted rate and the rate to close out the contract as at the financial year end date. Realised gains or losses are recognised on the maturity of a contract as the difference between the rate that the contract was entered into and the closing spot rate at the settlement date of the contract. Redeemable participating shares The redeemable participating shares can be redeemed for cash equal to a proportionate share of the NAV calculated in accordance with the Company's prospectus. The redeemable participating share is valued at the redemption amount that is payable at the balance sheet date if the shareholder exercised their right to put the shares back to the Company. The fair value of the financial liabilities for the redeemable participating shares is the redemption amount per share, calculated as the NAV per share less any associated duties and charges and any redemption fee which is payable on the shares redeemed. Any potential duties and charges are at the discretion of the Board of Directors. Any distributions on these shares are recognised in the income statement as finance costs. Transaction costs Transaction costs are incremental costs that are directly attributable to the acquisition, issue or disposal of a financial asset or financial liability. An incremental cost is one that would not have been incurred if the entity had not acquired, issued or disposed of the financial instrument. When a financial asset or financial liability is recognised initially, it is measured at its fair value through profit or loss, plus transaction costs that are directly attributable to the acquisition or issue of the financial asset or financial liability. Equalisation on Distributions Equalisation arrangements are applied in the case of shares in the Company. These arrangements are intended to ensure that the income distribution per share is not affected by changes in the number of shares in issue during the financial year. To ensure that each shareholder receives the same rate of distribution per share, the buying price of each share contains an amount called equalisation. This is equivalent to the net of distributable income less expenses, accrued in the Company at the time of purchase/sale. As part of the distribution payment, the average amount of this equalisation is returned to shareholders who subscribed to or redeemed from the Company during the financial year. The equalisation element of the distribution is treated as a repayment of capital. * The Glossary is an integral part of the notes to the financial statements.

iSHARES VII PLC
Disclaimers (unaudited)
i S H A R E S V I I P L C A N N U A L R E P O R T [ 3 2 5 ]
Regulatory Information BlackRock Advisors (UK) Limited, which is authorised and regulated by the FCA, registered office at 12 Throgmorton Avenue, London, EC2N 2DL, England, Tel +44 (0)20 7743 3000. For your protection, calls are usually recorded. iShares plc, iShares II plc, iShares III plc, iShares IV plc, iShares V plc, iShares VI plc and iShares VII plc (together “the Companies”) are open-ended investment companies with variable capital having segregated liability between their funds organised under the laws of Ireland and authorised by the CBI. Further information about the Fund and the Share Class, such as details of the key underlying investments of the Share Class and share prices, is available on the iShares website at www.ishares.com or by calling +44 (0)845 357 7000 or from your broker or financial adviser. The indicative intra-day NAV of the Share Class is available at http://deutsche-boerse.com and/or http://www.reuters.com. A UCITS ETF’s units / shares that have been acquired on the secondary market cannot usually be sold directly back to the UCITS ETF itself. Investors who are not Authorised Participants must buy and sell shares on a secondary market with the assistance of an intermediary (e.g. a stockbroker) and may incur fees and additional taxes in doing so. In addition, as the market price at which the Shares are traded on the secondary market may differ from the NAV per Share, investors may pay more than the then current NAV per Share when buying shares and may receive less than the current NAV per Share when selling them. For investors in the UK Most of the protections provided by the UK regulatory system do not apply to the operation of the Companies, and compensation will not be available under the UK Financial Services Compensation Scheme on its default. The Companies are recognised schemes for the purposes of the Financial Services and Markets Act 2000. Any decision to invest must be based solely on the information contained in the Company’s prospectus, KIID and the latest annual report and audited financial statements. Investors should read the fund specific risks in the KIID and the Company’s prospectus. Restricted Investors This document is not, and under no circumstances is to be construed as an advertisement or any other step in furtherance of a public offering of shares in the United States or Canada. This document is not aimed at persons who are resident in the United States, Canada or any province or territory thereof, where the companies/securities are not authorised or registered for distribution and where no prospectus has been filed with any securities commission or regulatory authority. The companies/securities may not be acquired or owned by, or acquired with the assets of, an Employee Retirement Income Security Act Plan. Risk Warnings Investment in the products mentioned in this document may not be suitable for all investors. Past performance is not a reliable indicator of current or future results and should not be the sole factor of consideration when selecting a product or strategy. Capital at risk. The value of investments and the income from them can fall as well as rise and are not guaranteed. You may not get back the amount originally invested. The value of investments involving exposure to foreign currencies can be affected by exchange rate movements. We remind you that the levels and bases of, and reliefs from, taxation can change. BlackRock has not considered the suitability of this investment against your individual needs and risk tolerance. The data displayed provides summary information. Investment should be made on the basis of the relevant prospectus which is available from the manager. In respect of the products mentioned this document is intended for information purposes only and does not constitute investment advice or an offer to sell or a solicitation of an offer to buy the securities described within. This document may not be distributed without authorisation from BlackRock Advisors (UK) Limited.

iSHA
Di
[ 3 2 6
IndeBlooand incluFundBlooGoveGoveinvesYearTerm S&PTradcertaJonepromS&Pcom 'FTSInterFTSconnvalueof th 'FTSItaliaof Boconnin FT The licen The Datasold of thDISCOR ADIREDAM or anBlac
ARES VII PLC
isclaime
6 ] i S H A R E S
ex Disclaimers omberg® is a traservice mark of
uding Barclays, od Advisors or itsomberg nor Barcernment Bond 1ernment Bond 1stors in the iShar Term Index', 'B
m Index' or any d
P® is a registeredemark Holdingsain purposes byes Indices LLC omoted by S&P DP nor their respe
panies listed ab
SE®' is a trade mrnational LimitedE International nected to the funes and constitueese products.
SE®' is a trade mana”) and both aorsa Italiana. Nenected to it and TSE. BlackRock
Markit iBoxx Eunse. The iShares
ICE Index menta”) and has been
or promoted bye fund to track t
CLAIMS ALL WANY DATA INCECT, INDIRECT
MAGES.
iSny index on whickRock and any
ers (una
S V I I P L C A N
ademark and sef Barclays Bankown all propriet
s affiliates, and nclays guarantee1-3 Year Term I10 Year Term Inares ETFs or to Bloomberg Barcdata included th
ed trademark of s LLC (“Dow Joy BlackRock Funor its affiliates, a
Dow Jones Indicective affiliates mbove. Index data
mark jointly ownd ('FTSE') undeLimited ('FTSE'nds or accepts aent list vest in F
mark of the Londare used by FTSeither FTSE nordo not accept a
k has obtained f
uro Sovereigns s ETF is not spo
tioned in this don licensed for uy Interactive Datthe applicable In
WARRANTIES OCLUDED THERET, OR CONSEQ
Shares funds ach such funds arelated funds.
audited)
N N U A L R E P O
ervice mark of Bk Plc (collectivelytary rights in theneither Bloombe
es the timelinessndex', 'Bloombe
ndex'. Neither Bother third part
clays Euro Goveherein.
Standard & Poones”) and have nd Advisors or itand has been licces LLC, Dow Jomakes any reprea source: S&P D
ned by the Londr licence. The F). None of the Eany liability in re
FTSE. BlackRoc
don Stock ExchSE Internationalr its licensors noany liability in refull licence from
Inflation-Linkedonsored, endors
ocument is a sese by BlackRocta. Interactive Dndex. INTERAC
OF MERCHANTAEIN. IN NO EV
QUENTIAL DAM
re not sponsoreare based. The
(contin
O R T
loomberg Finany with its affiliate
e Bloomberg Baerg nor Barclayss, accuratenesserg Barclays Euloomberg nor Bies in respect o
ernment Bond 3
or’s Financial Sbeen licensed f
ts affiliates (“Blacensed for use ones, S&P, theiesentation regaDow Jones Indic
on Stock ExchaFTSE 100 IndexExchange, the Felation to their isck has obtained
hange plc and th Limited ('FTSE
or Borsa Italianalation to its issu FTSE to use su
Index Nom. (Msed, or promote
rvice mark of Inck, Inc. in conneData makes no CTIVE DATA MAABILITY OR FITENT SHALL INT
MAGES (INCLU
ed, endorsed, orprospectus con
ued)
nce L.P. (collectes, “Barclays”),
arclays Indices. ys approves, ends, or completeneuro GovernmentBarclays shall beof the use or acc3-7 Year Term In
ervices LLC (“Sfor use by S&P ackRock”). The by BlackRock. Tr respective affirding the advisaces LLC.
ange plc and thex and FTSE ItaliFT nor FTSE spssue, operation full licence from
he Financial TimE') under licencea sponsor, endoue, operation anuch copyright in
Mid) referenced ed by Markit Ind
nteractive Data Pection with the furepresentationsAKES NO EXPRTNESS FOR ATERACTIVE DADING LOST PR
r promoted by Mtains a more de
tively with its affused under liceNeither Bloombdorses, reviewsess of any data t Bond 3-7 Yeare liable in any wcuracy of the 'Blndex' and 'Bloom
S&P”) and “DowDow Jones IndDow Jones IndThe iShares ETiliates, and noneability of investin
e Financial Timea Mid-Small Caonsors, endorseand trading. Al
m FTSE to use s
mes Limited, 'MIe. The FTSE MIorse or promotend trading. All con the creation of
herein is the proices Limited.
Pricing and Refeund. Neither Blas or warranties rRESS OR IMPLPARTICULAR ATA HAVE ANY
ROFITS) EVEN
MSCI, and MSCetailed descriptio
filiates, “Bloombense. Bloombergberg nor Barclay, or recommendor information rer Term Index' an
way to the Blackoomberg Barclamberg Barclays
Jones®” is a reices LLC and itsustrial Average
TF (the “Fund”) e of S&P Dow Jng in the Fund.
es Limited (the 'p PIR Index arees or promotes l copyright and dsuch copyright a
B' is a trade maB Index is calcuthe iShares ET
opyright in the inf this product.
operty of Markit
erence Data, LLackRock, Inc. noregarding BlackLIED WARRANTPURPOSE WITY LIABILITY FOIF NOTIFIED O
CI bears no liabilon of the limited
berg”). Barclaysrg or Bloombergys are affiliated ds the iShares Erelating to 'Bloomnd 'Bloomberg BkRock Fund Advays Euro Govers Euro Governm
egistered trademts affiliates and Index is a prodis not sponsore
Jones Indices LLBlackRock is no
'FT') and is usee calculated by the iShares ETdatabase rightsand database ri
ark of Borsa Italulated by FTSE TF and are not index values and
t Indices Limited
LC or its affiliateor the fund is sp
kRock, Inc. or thTIES, AND HER
TH RESPECT TOR ANY SPECIAOF THE POSSIB
lity with respectd relationship th
® is a trademarg’s licensors, with BlackRockETFs. Neither mberg BarclaysBarclays Euro visors or its affilirnment Bond 1-3
ment Bond 10 Ye
mark of Dow Jonsublicensed for
duct of S&P Dowed, endorsed, soLC, Dow Jonesot affiliated with
ed by FTSE or on behalf of Fs nor is in any
s within the indeghts in the crea
iana SpA (“Borswith the assista
n any way d constituent list
d and is used un
es (“Interactive ponsored, endore fund or the ab
REBY EXPRESTO THE ICE INDAL, PUNITIVE, BILITY OF SUC
to any such funat MSCI has wi
rk
k
Euro
ates, 3 ear
nes
w old or , the
y way ex ation
sa ance
t vest
nder
rsed, bility
SSLY DEX
CH
nds th

iSHARES VII PLC
Disclaimers (unaudited) (continued)
i S H A R E S V I I P L C A N N U A L R E P O R T [ 3 2 7 ]
Index Disclaimers (continued) Nasdaq®, Nasdaq 100 is a registered trademark of the NASDAQ, Inc. (referred to below as “corporation” jointly with its affiliates) and is licensed for use by BlackRock Asset Management Ireland Limited. The corporation bears no liability for the legality or suitability of the product. The product is not issued, subscribed, sold or promoted by the corporation. The corporation makes no warranties and bears no liability with respect to the product. Nikkei 225 is protected by a copyright and is calculated according to criteria independently developed and created by Nikkei Inc. Nikkei Inc. is the only and exclusive owner of the copyrights and other intellectual property rights on Nikkei 225 and on the relevant calculation criteria. Nikkei Digital Media Inc., upon authorisation of Nikkei Inc., licensed the use of Nikkei 225 as index for the fund to the licensee. The intellectual property and any other right related to the trademarks connected with Nikkei and Nikkei 225 are granted to Nikkei Inc. Nikkei Inc. and/or Nikkei Digital Media, Inc. do not sponsor, support, sell or advertise the fund. Nikkei Inc. and/or Nikkei Digital Media, Inc. are not connected in any way with the fund and license the use of certain trademarks and of Nikkei 225 for the fund itself to the licensee. The licence agreement between Nikkei Digital Media, Inc. and the licensee grants no right to any third party. The fund is managed at the licensee’s exclusive risk; Nikkei Inc. and/or Nikkei Digital Media, Inc. assume no obligation or liability with respect to the management and transactions of the fund. Nikkei Inc. and/or Nikkei Digital Media, Inc. bear no liability for the correctness of the fund’s calculations or relevant data. Nikkei Inc. and/or Nikkei Digital Media, Inc. have no obligation to continue to publish the Nikkei 225 and are not responsible for any errors, delays, interruptions, suspensions or termination of the relevant publication; Nikkei Inc. and Nikkei Digital Media, Inc. are authorised to change the description of securities, calculation criteria or any other detail of Nikkei 225 and have the right to interrupt or stop the announcement of Nikkei 225 with no responsibility towards the licensor or any third party. The Index is a product of S&P Dow Jones Indices LLC, a division of S&P Global, or its affiliates (“SPDJI”) and has been licensed for use by BlackRock. Standard & Poor’s® and S&P® are registered trademarks of Standard & Poor’s Financial Services LLC, a division of S&P Global (“S&P”); Dow Jones® is a registered trademark of Dow Jones Trademark Holdings LLC (“Dow Jones”); and these trademarks have been licensed for use by SPDJI and sublicensed for certain purposes by BlackRock. The iShares ETFs are not sponsored, endorsed, sold or promoted by SPDJI, Dow Jones, S&P, their respective affiliates, and none of such parties make any representation regarding the advisability of investing in such product(s) nor do they have any liability for any errors, omissions, or interruptions of the Index. EURO STOXX 50® is the intellectual property (including registered trademarks) of STOXX Limited, Zurich, Switzerland (“STOXX”), Deutsche Börse Group or their licensors, which is used under license. The iShares ETF is neither sponsored nor promoted, distributed or in any other manner supported by STOXX, Deutsche Börse Group or their licensors, research partners or data providers and STOXX, Deutsche Börse Group and their licensors, research partners or data providers do not give any warranty, and exclude any liability (whether in negligence or otherwise) with respect thereto generally or specifically in relation to any errors, omissions or interruptions in the relevant index or its data. © 2018 BlackRock, Inc. All Rights reserved. BLACKROCK, BLACKROCK SOLUTIONS, iSHARES, BUILD ON BLACKROCK, SO WHAT DO I DO WITH MY MONEY and the stylised i logo are registered and unregistered trademarks of BlackRock, Inc. or its subsidiaries in the United States and elsewhere. All other trademarks are those of their respective owners

Want to +44 © 2018 BlackRINVESTING FOsubsidiaries in
o know (0)800 917
Rock, Inc. All RigOR A NEW WO the United Stat
more? 7 1770
ghts reserved. BORLD, and BUILtes and elsewhe
iSh
BLACKROCK, BLT FOR THESEere. All other tra
hares.com
BLACKROCK SE TIMES are regademarks are th
SOLUTIONS, iSgistered and unrhose of their res
HARES, SO Wregistered tradepective owners
WHAT DO I DO Wemarks of Blacks.
WITH MY MONERock, Inc. or its
EY, s