2021 Annual Report - iShares
108
2021 Annual Report iShares Trust • iShares MSCI Intl Momentum Factor ETF | IMTM | NYSE Arca • iShares MSCI Intl Quality Factor ETF | IQLT | NYSE Arca • iShares MSCI Intl Size Factor ETF | ISZE | NYSE Arca • iShares MSCI Intl Value Factor ETF | IVLU | NYSE Arca • iShares MSCI USA Momentum Factor ETF | MTUM | Cboe BZX • iShares MSCI USA Quality Factor ETF | QUAL | Cboe BZX • iShares MSCI USA Size Factor ETF | SIZE | NYSE Arca • iShares MSCI USA Value Factor ETF | VLUE | Cboe BZX JULY 31, 2021
-
Upload
khangminh22 -
Category
Documents
-
view
0 -
download
0
Transcript of 2021 Annual Report - iShares

2021 Annual Report
iShares Trust
• iShares MSCI Intl Momentum Factor ETF | IMTM | NYSE Arca
• iShares MSCI Intl Quality Factor ETF | IQLT | NYSE Arca
• iShares MSCI Intl Size Factor ETF | ISZE | NYSE Arca
• iShares MSCI Intl Value Factor ETF | IVLU | NYSE Arca
• iShares MSCI USA Momentum Factor ETF | MTUM | Cboe BZX
• iShares MSCI USA Quality Factor ETF | QUAL | Cboe BZX
• iShares MSCI USA Size Factor ETF | SIZE | NYSE Arca
• iShares MSCI USA Value Factor ETF | VLUE | Cboe BZX
JULY 31, 2021

Dear Shareholder,
The 12-month reporting period as of July 31, 2021 was a remarkable period of adaptation and recovery,as the global economy dealt with the implications of the coronavirus (or “COVID-19”) pandemic. TheUnited States, along with most of the world, began the reporting period emerging from a severe recession,prompted by pandemic-related restrictions that disrupted many aspects of daily life. However, easingrestrictions and robust government intervention led to a strong rebound, and the economy grew at asignificant pace for the reporting period, eventually regaining the output lost from the pandemic.
Equity prices rose with the broader economy, as strong fiscal and monetary support, as well as thedevelopment of vaccines, made investors increasingly optimistic about the economic outlook. Theimplementation of mass vaccination campaigns and passage of two additional fiscal stimulus packagesfurther boosted stocks, and many equity indices neared or surpassed all-time highs late in the reportingperiod. In the United States, returns of small-capitalization stocks, which benefited the most from theresumption of in-person activities, outpaced large-capitalization stocks. International equities alsogained, as both developed and emerging markets rebounded substantially.
The 10-year U.S. Treasury yield (which is inversely related to bond prices) had fallen sharply prior to thebeginning of the reporting period, which meant bonds were priced for extreme risk avoidance andeconomic disruption. Despite expectations of doom and gloom, the economy expanded rapidly, stokinginflation concerns in early 2021, which led to higher yields and a negative overall return for mostU.S. Treasuries. In the corporate bond market, support from the U.S. Federal Reserve (the “Fed”)assuaged credit concerns and led to solid returns for high-yield corporate bonds, although investment-grade corporates declined slightly.
The Fed remained committed to accommodative monetary policy by maintaining near zero interest ratesand by reiterating that inflation could exceed its 2% target for a sustained period without triggering a rateincrease. In response to rising inflation late in the period, the Fed changed its market guidance, raising thelikelihood of less bond purchasing and the possibility of higher rates in 2023.
Looking ahead, we believe that the global expansion will continue to broaden as Europe and otherdeveloped market economies gain momentum, although the delta variant remains a threat, particularly inemerging markets. While we expect inflation to remain elevated in the medium-term as the expansioncontinues, we believe the recent uptick owes more to temporary supply disruptions than a lasting changein fundamentals. The change in Fed policy also means that moderate inflation is less likely to be followedby interest rate hikes that could threaten the economic expansion.
Overall, we favor a moderately positive stance toward risk, with an overweight in equities. Sectors that arebetter poised to manage the transition to a lower-carbon world, such as technology and healthcare, areparticularly attractive in the long-term. U.S. small-capitalization stocks and European equities are likely tobenefit from the continuing vaccine-led restart. We are underweight long-term credit, but inflation-protected U.S. Treasuries, Asian fixed income, and Chinese government bonds offer potential opportu-nities. We believe that international diversification and a focus on sustainability can help provide portfolioresilience, and the disruption created by the coronavirus appears to be accelerating the shift towardsustainable investments.
In this environment, our view is that investors need to think globally, extend their scope across a broadarray of asset classes, and be nimble as market conditions change. We encourage you to talk with yourfinancial advisor and visit iShares.com for further insight about investing in today’s markets.
Sincerely,
Rob KapitoPresident, BlackRock, Inc.
Total Returns as of July 31, 2021
6-Month 12-Month
U.S. large cap equities(S&P 500� Index)
19.19% 36.45%
U.S. small cap equities(Russell 2000� Index)
7.86 51.97
International equities(MSCI Europe, Australasia,Far East Index)
10.83 30.31
Emerging market equities(MSCI Emerging MarketsIndex)
(2.76) 20.64
3-month Treasury bills(ICE BofA 3-MonthU.S. Treasury Bill Index)
0.02 0.08
U.S. Treasury securities(ICE BofA 10-YearU.S. Treasury Index)
(0.59) (5.12)
U.S. investment grade bonds(Bloomberg BarclaysU.S. Aggregate Bond Index)
0.21 (0.70)
Tax-exempt municipal bonds(S&P Municipal Bond Index)
1.38 3.47
U.S. high yield bonds(Bloomberg BarclaysU.S. Corporate High Yield 2%Issuer Capped Index)
3.66 10.62
Past performance is not an indication of future results.Index performance is shown for illustrative purposes only.You cannot invest directly in an index.
The Markets in Review
Rob KapitoPresident, BlackRock, Inc.
2 T H I S P A G E I S N O T P A R T O F Y O U R F U N D R E P O R T

Page
The Markets in Review . . . . . . . . . . . . . . . . . . . . . . . . . . . . . . . . . . . . . . . . . . . . . . . . . . . . . . . . . . . . . . . . . . . . . . . . . . . . . . . . . . . . . . . . . . . . . . . . . . . . . . . . . . . . . . . . . . . . . . . . . . . . . . . . . . . . . . . . . . . . . . . . . . . . . . 2Market Overview . . . . . . . . . . . . . . . . . . . . . . . . . . . . . . . . . . . . . . . . . . . . . . . . . . . . . . . . . . . . . . . . . . . . . . . . . . . . . . . . . . . . . . . . . . . . . . . . . . . . . . . . . . . . . . . . . . . . . . . . . . . . . . . . . . . . . . . . . . . . . . . . . . . . . . . . . . . . 4Fund Summary . . . . . . . . . . . . . . . . . . . . . . . . . . . . . . . . . . . . . . . . . . . . . . . . . . . . . . . . . . . . . . . . . . . . . . . . . . . . . . . . . . . . . . . . . . . . . . . . . . . . . . . . . . . . . . . . . . . . . . . . . . . . . . . . . . . . . . . . . . . . . . . . . . . . . . . . . . . . . 5About Fund Performance . . . . . . . . . . . . . . . . . . . . . . . . . . . . . . . . . . . . . . . . . . . . . . . . . . . . . . . . . . . . . . . . . . . . . . . . . . . . . . . . . . . . . . . . . . . . . . . . . . . . . . . . . . . . . . . . . . . . . . . . . . . . . . . . . . . . . . . . . . . . . . . . . . . . 21Shareholder Expenses . . . . . . . . . . . . . . . . . . . . . . . . . . . . . . . . . . . . . . . . . . . . . . . . . . . . . . . . . . . . . . . . . . . . . . . . . . . . . . . . . . . . . . . . . . . . . . . . . . . . . . . . . . . . . . . . . . . . . . . . . . . . . . . . . . . . . . . . . . . . . . . . . . . . . . 21Schedules of Investments . . . . . . . . . . . . . . . . . . . . . . . . . . . . . . . . . . . . . . . . . . . . . . . . . . . . . . . . . . . . . . . . . . . . . . . . . . . . . . . . . . . . . . . . . . . . . . . . . . . . . . . . . . . . . . . . . . . . . . . . . . . . . . . . . . . . . . . . . . . . . . . . . . . 22Financial Statements:
Statements of Assets and Liabilities . . . . . . . . . . . . . . . . . . . . . . . . . . . . . . . . . . . . . . . . . . . . . . . . . . . . . . . . . . . . . . . . . . . . . . . . . . . . . . . . . . . . . . . . . . . . . . . . . . . . . . . . . . . . . . . . . . . . . . . . . . . . . . . . . . . . . . . 69Statements of Operations . . . . . . . . . . . . . . . . . . . . . . . . . . . . . . . . . . . . . . . . . . . . . . . . . . . . . . . . . . . . . . . . . . . . . . . . . . . . . . . . . . . . . . . . . . . . . . . . . . . . . . . . . . . . . . . . . . . . . . . . . . . . . . . . . . . . . . . . . . . . . . . . . 71Statements of Changes in Net Assets . . . . . . . . . . . . . . . . . . . . . . . . . . . . . . . . . . . . . . . . . . . . . . . . . . . . . . . . . . . . . . . . . . . . . . . . . . . . . . . . . . . . . . . . . . . . . . . . . . . . . . . . . . . . . . . . . . . . . . . . . . . . . . . . . . . . . 73
Financial Highlights . . . . . . . . . . . . . . . . . . . . . . . . . . . . . . . . . . . . . . . . . . . . . . . . . . . . . . . . . . . . . . . . . . . . . . . . . . . . . . . . . . . . . . . . . . . . . . . . . . . . . . . . . . . . . . . . . . . . . . . . . . . . . . . . . . . . . . . . . . . . . . . . . . . . . . . . . 77Notes to Financial Statements . . . . . . . . . . . . . . . . . . . . . . . . . . . . . . . . . . . . . . . . . . . . . . . . . . . . . . . . . . . . . . . . . . . . . . . . . . . . . . . . . . . . . . . . . . . . . . . . . . . . . . . . . . . . . . . . . . . . . . . . . . . . . . . . . . . . . . . . . . . . . . . 85Report of Independent Registered Public Accounting Firm . . . . . . . . . . . . . . . . . . . . . . . . . . . . . . . . . . . . . . . . . . . . . . . . . . . . . . . . . . . . . . . . . . . . . . . . . . . . . . . . . . . . . . . . . . . . . . . . . . . . . . . . . . . . . . . . . . . . 96Important Tax Information (Unaudited) . . . . . . . . . . . . . . . . . . . . . . . . . . . . . . . . . . . . . . . . . . . . . . . . . . . . . . . . . . . . . . . . . . . . . . . . . . . . . . . . . . . . . . . . . . . . . . . . . . . . . . . . . . . . . . . . . . . . . . . . . . . . . . . . . . . . . . . 97Board Review and Approval of Investment Advisory Contract . . . . . . . . . . . . . . . . . . . . . . . . . . . . . . . . . . . . . . . . . . . . . . . . . . . . . . . . . . . . . . . . . . . . . . . . . . . . . . . . . . . . . . . . . . . . . . . . . . . . . . . . . . . . . . . . . . 98Supplemental Information . . . . . . . . . . . . . . . . . . . . . . . . . . . . . . . . . . . . . . . . . . . . . . . . . . . . . . . . . . . . . . . . . . . . . . . . . . . . . . . . . . . . . . . . . . . . . . . . . . . . . . . . . . . . . . . . . . . . . . . . . . . . . . . . . . . . . . . . . . . . . . . . . . . 100Trustee and Officer Information . . . . . . . . . . . . . . . . . . . . . . . . . . . . . . . . . . . . . . . . . . . . . . . . . . . . . . . . . . . . . . . . . . . . . . . . . . . . . . . . . . . . . . . . . . . . . . . . . . . . . . . . . . . . . . . . . . . . . . . . . . . . . . . . . . . . . . . . . . . . . . 101General Information . . . . . . . . . . . . . . . . . . . . . . . . . . . . . . . . . . . . . . . . . . . . . . . . . . . . . . . . . . . . . . . . . . . . . . . . . . . . . . . . . . . . . . . . . . . . . . . . . . . . . . . . . . . . . . . . . . . . . . . . . . . . . . . . . . . . . . . . . . . . . . . . . . . . . . . . . 103Glossary of Terms Used in this Report . . . . . . . . . . . . . . . . . . . . . . . . . . . . . . . . . . . . . . . . . . . . . . . . . . . . . . . . . . . . . . . . . . . . . . . . . . . . . . . . . . . . . . . . . . . . . . . . . . . . . . . . . . . . . . . . . . . . . . . . . . . . . . . . . . . . . . . 104
Table of Contents
3

iShares Trust
Global Market Overview
Global equity markets advanced significantly during the 12 months ended July 31, 2021 (“reporting period”). The MSCI ACWI, a broad global equity index that includes bothdeveloped and emerging markets, returned 33.18% in U.S. dollar terms for the reporting period. Stocks continued to recover from the initial impact of the coronaviruspandemic, nearing all-time highs by the end of the reporting period. Reopening economies led to a substantial global economic expansion, and the development anddistribution of coronavirus vaccines bolstered investors’ optimism. Nonetheless, vaccination rates varied considerably across countries, and the spread of the morecontagious Delta variant led to increased cases and renewed restrictions toward the end of the reporting period.
Equity markets in the U.S. advanced strongly, helped by fiscal and monetary stimulus and an ongoing mass vaccination program. Two fiscal stimulus bills passed byTTCongress during the reporting period provided significant relief in the form of direct payments to individuals, tax credits, aid to state and local governments, and assistancefor homeowners and renters. Personal incomes rose significantly following the stimulus payments, and consumer spending recovered, surpassing pre-pandemic levels bythe end of the reporting period. Increased consumer spending and the easing of pandemic-related restrictions helped the U.S. economy grow at a record annualized paceof 33.8% in the third quarter of 2020, as activity rebounded from the pandemic-induced recession in the first half of 2020. Growth continued at a slower pace for the restof the reporting period, finally exceeding pre-pandemic output levels in the second quarter of 2021. Action by the U.S. Federal Reserve (“the Fed”) also played a notablerole in the recovery. Monetary policy remained accommodative, with short-term interest rates maintained near zero to encourage lending and stimulate economic activity.The Fed further acted to stabilize bond markets by continuing an unlimited, open-ended, bond-buying program for U.S. Treasuries and mortgage-backed securities.
Stocks in Europe also posted strong gains despite a recovery that trailed other major economies. The European Central Bank (“ECB”) provided monetary stimulus bymaintaining ultra-low interest rates and continuing a large bond-buying program. Growth resumed with a significant rebound in the third quarter of 2020 as restrictions easedand Eurozone countries approved a deal for a collective €750 billion of stimulus spending. However, a new wave of coronavirus cases beginning in October 2020 led torenewed restrictions, weakening the fragile recovery. Consequently, the Eurozone economy contracted slightly in the fourth quarter of 2020 and first quarter of 2021, evenas much of the world was returning to growth. Although the initial vaccine rollout lagged in many European countries, the pace of vaccinations accelerated late in thereporting period, and economic growth resumed in the second quarter of 2021.
Asia-Pacific regional stocks also advanced substantially amid a sharp rebound in economic activity. Strong economic growth in China helped the regional economy recover,as many Asia-Pacific countries rely on China as a major trading partner. Japanese and Australian stocks benefited from a sharp rise in exports amid resurgent global trade.Emerging market stocks advanced overall, fueled by economic recovery and a relatively weak U.S. dollar. However, investor concerns about increased governmentregulatory activity weighed on Chinese stocks late in the reporting period. Relatively slow vaccination rollouts in parts of Asia also prompted concerns, particularly as theDelta variant spread.
Market Overview
4 2 0 2 1 I S H A R E S A N N U A L R E P O R T T O S H A R E H O L D E R S

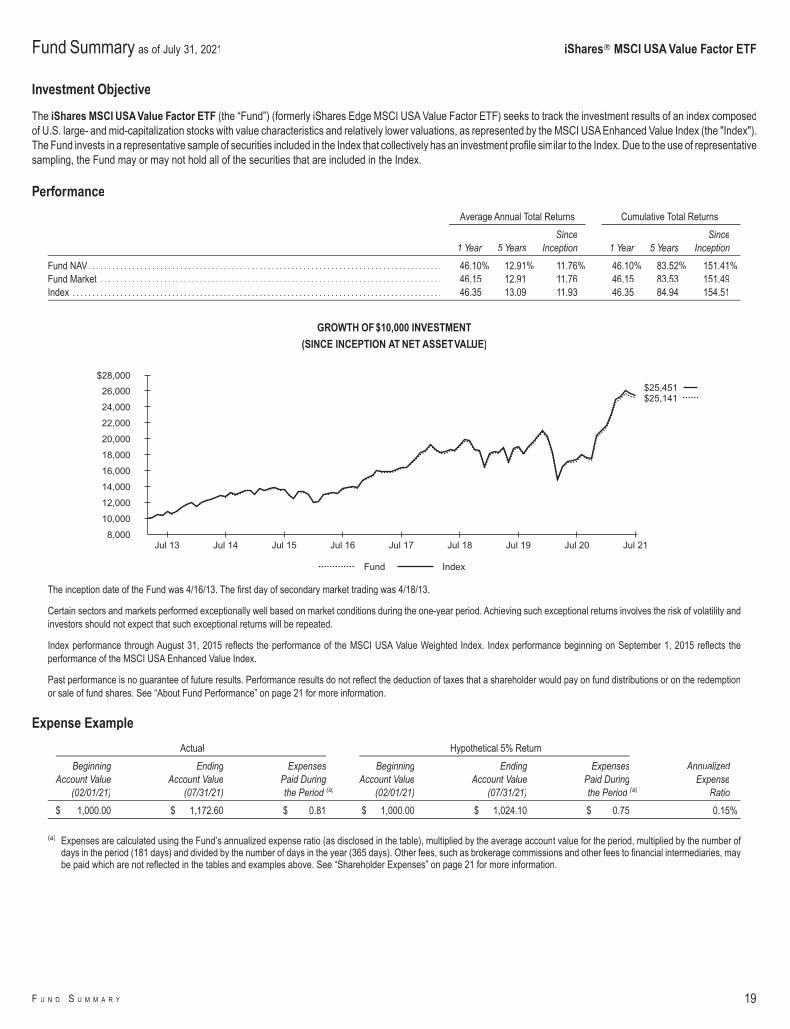
Investment Objective
The iShares MSCI Intl Momentum Factor ETF (the “Fund”) (formerly the iShares Edge MSCI Intl Momentum Factor ETF) seeks to track the investment results of an indexthat measures the performance of international developed large- and mid-capitalization stocks exhibiting relatively higher momentum characteristics, as represented by theMSCI World ex USA Momentum Index (the "Index"). The Fund invests in a representative sample of securities included in the Index that collectively has an investment profilesimilar to the Index. Due to the use of representative sampling, the Fund may or may not hold all of the securities that are included in the Index.
Performance
Average Annual Total Returns Cumulative Total Returns
1 Year 5 YearsSince
Inception 1 Year 5 YearsSince
Inception
Fund NAV. . . . . . . . . . . . . . . . . . . . . . . . . . . . . . . . . . . . . . . . . . . . . . . . . . . . . . . . . . . . . . . . . . . . . . . . . . . . . . . . . . . . . . . . . 19.80% 10.26% 8.74% 19.80% 62.98% 73.05%Fund Market . . . . . . . . . . . . . . . . . . . . . . . . . . . . . . . . . . . . . . . . . . . . . . . . . . . . . . . . . . . . . . . . . . . . . . . . . . . . . . . . . . . . . . 20.08 10.08 8.76 20.08 61.61 73.33Index . . . . . . . . . . . . . . . . . . . . . . . . . . . . . . . . . . . . . . . . . . . . . . . . . . . . . . . . . . . . . . . . . . . . . . . . . . . . . . . . . . . . . . . . . . . . . 19.83 10.49 8.98 19.83 64.66 75.66
GROWTH OF $10,000 INVESTMENT
(SINCE INCEPTION AT NET ASSET VALUE)
$17,305$17,566
9,000
10,000
11,000
12,000
13,000
14,000
15,000
16,000
17,000
$18,000
Jul 21Jul 20Jul 19Jul 18Jul 17Jul 16Jul 15
Fund Index
The inception date of the Fund was 1/13/15. The first day of secondary market trading was 1/15/15.
Past performance is no guarantee of future results. Performance results do not reflect the deduction of taxes that a shareholder would pay on fund distributions or on the redemptionor sale of fund shares. See “About Fund Performance” on page 21 for more information.
Expense Example
Actual Hypothetical 5% Return
BeginningAccount Value
(02/01/21)
EndingAccount Value
(07/31/21)
ExpensesPaid Duringthe Period (a)
BeginningAccount Value
(02/01/21)
EndingAccount Value
(07/31/21)
ExpensesPaid Duringthe Period (a)
AnnualizedExpense
Ratio
$ 1,000.00 $ 1,055.70 $ 1.53 $ 1,000.00 $ 1,023.30 $ 1.51 0.30%
(a) Expenses are calculated using the Fund’s annualized expense ratio (as disclosed in the table), multiplied by the average account value for the period, multiplied by the number ofdays in the period (181 days) and divided by the number of days in the year (365 days). Other fees, such as brokerage commissions and other fees to financial intermediaries, maybe paid which are not reflected in the tables and examples above. See “Shareholder Expenses” on page 21 for more information.
Fund Summary as of July 31, 2021 iShares� MSCI Intl Momentum Factor ETF
F U N D S U M M A R Y 5

Portfolio Management Commentary
International developed stocks with relatively higher momentum characteristics advanced for the reporting period amid economic recovery and vaccination programs in thewake of the coronavirus pandemic. Stocks in the Netherlands contributed the most to the Index’s return, driven by the semiconductor equipment industry in the informationtechnology sector. The industry’s computer chips supported the expansion of 5G networks, consumer and corporate computer usage, and cloud computing.Pandemic-related restrictions on social interaction led businesses to increase spending on infrastructure to facilitate remote working, while consumers staying at homedrove demand for computer equipment and gaming consoles. Consequently, high demand for computer chips led to a global semiconductor shortage, which further boostedsales of semiconductor manufacturing equipment.
The semiconductor equipment industry also drove contribution from Japanese stocks, which benefited from the global rise in demand for semiconductors and an optimisticsales outlook for chips used in technology products with wireless connectivity, artificial intelligence, and 5G. Technology hardware and equipment stocks also performedwell, aided by rising demand, particularly from China, for sensors used in factory automation.
French stocks also contributed notably to the Index’s return. Textiles and apparel companies in the consumer discretionary sector demonstrated resilience, benefiting frompent-up demand for luxury purchases among high-end consumers. The electrical components and equipment industry led gains among French industrials stocks,supported by increased demand from data center and building energy management clients, along with sales growth in China. Industrials stocks also advanced in Sweden.Producers of industrial tools used in chip-making benefited from higher demand as semiconductor manufacturers ramped up production amid the global semiconductorshortage.
In terms of relative performance, the Index underperformed the broader market, as represented by the MSCI World ex USA Index. Following economic reopening andvaccination program rollouts, the market shifted toward more cyclical value and small-cap stocks. The momentum factor’s focus in high-growth sectors such as informationtechnology restrained relative performance. Security selection in Japan and Canada detracted, while stock selection and an overweight position in the Netherlands addedrrmodestly to relative performance. Turning to sectors, the financials sector, particularly an underweight to banks, detracted from relative performance. Stock selection inmaterials and an underweight to pharmaceuticals in the healthcare sector also detracted. In contrast, an overweight in semiconductor equipment stocks drove relativecontribution in the information technology sector.
Portfolio Information
ALLOCATION BY SECTOR
SectorPercent of
Total Investments(a)
Financials . . . . . . . . . . . . . . . . . . . . . . . . . . . . . . . . . . . . . . . . . . . . . . . . . . 29.6%Industrials . . . . . . . . . . . . . . . . . . . . . . . . . . . . . . . . . . . . . . . . . . . . . . . . . . 19.1Consumer Discretionary . . . . . . . . . . . . . . . . . . . . . . . . . . . . . . . . . . . . 16.6Information Technology . . . . . . . . . . . . . . . . . . . . . . . . . . . . . . . . . . . . . 13.6Materials . . . . . . . . . . . . . . . . . . . . . . . . . . . . . . . . . . . . . . . . . . . . . . . . . . . 12.7Communication Services. . . . . . . . . . . . . . . . . . . . . . . . . . . . . . . . . . . . 3.1Energy . . . . . . . . . . . . . . . . . . . . . . . . . . . . . . . . . . . . . . . . . . . . . . . . . . . . . 1.6Health Care . . . . . . . . . . . . . . . . . . . . . . . . . . . . . . . . . . . . . . . . . . . . . . . . 1.6Consumer Staples . . . . . . . . . . . . . . . . . . . . . . . . . . . . . . . . . . . . . . . . . . 1.1Other (each representing less than 1%). . . . . . . . . . . . . . . . . . . . . . 1.0
TEN LARGEST GEOGRAPHIC ALLOCATION
Country/Geographic RegionPercent of
Total Investments(a)
Japan . . . . . . . . . . . . . . . . . . . . . . . . . . . . . . . . . . . . . . . . . . . . . . . . . . . . . . 14.6%France . . . . . . . . . . . . . . . . . . . . . . . . . . . . . . . . . . . . . . . . . . . . . . . . . . . . . 13.4Canada . . . . . . . . . . . . . . . . . . . . . . . . . . . . . . . . . . . . . . . . . . . . . . . . . . . . 12.8Australia . . . . . . . . . . . . . . . . . . . . . . . . . . . . . . . . . . . . . . . . . . . . . . . . . . . 11.0Netherlands . . . . . . . . . . . . . . . . . . . . . . . . . . . . . . . . . . . . . . . . . . . . . . . . 9.4Germany . . . . . . . . . . . . . . . . . . . . . . . . . . . . . . . . . . . . . . . . . . . . . . . . . . . 8.8United Kingdom . . . . . . . . . . . . . . . . . . . . . . . . . . . . . . . . . . . . . . . . . . . . 5.6Switzerland. . . . . . . . . . . . . . . . . . . . . . . . . . . . . . . . . . . . . . . . . . . . . . . . . 5.4Sweden . . . . . . . . . . . . . . . . . . . . . . . . . . . . . . . . . . . . . . . . . . . . . . . . . . . . 4.9Hong Kong . . . . . . . . . . . . . . . . . . . . . . . . . . . . . . . . . . . . . . . . . . . . . . . . . 3.7
(a) Excludes money market funds.
Fund Summary as of July 31, 2021 (continued) iShares� MSCI Intl Momentum Factor ETF
6 2 0 2 1 I S H A R E S A N N U A L R E P O R T T O S H A R E H O L D E R S

Investment Objective
The iShares MSCI Intl Quality Factor ETF (the “Fund”) (formerly the iShares Edge MSCI Intl Quality Factor ETF) seeks to track the investment results of an index thatmeasures the performance of international developed large- and mid-capitalization stocks exhibiting relatively higher quality characteristics as identified through threefundamental variables: return on equity, earnings variability and debt-to-equity, as represented by the MSCI World ex USA Sector Neutral Quality Index (the "Index"). TheFund invests in a representative sample of securities included in the Index that collectively has an investment profile similar to the Index. Due to the use of representativersampling, the Fund may or may not hold all of the securities that are included in the Index.
Performance
Average Annual Total Returns Cumulative Total Returns
1 Year 5 YearsSince
Inception 1 Year 5 YearsSince
Inception
Fund NAV. . . . . . . . . . . . . . . . . . . . . . . . . . . . . . . . . . . . . . . . . . . . . . . . . . . . . . . . . . . . . . . . . . . . . . . . . . . . . . . . . . . . . . . . . 32.03% 11.59% 9.35% 32.03% 73.00% 79.51%Fund Market . . . . . . . . . . . . . . . . . . . . . . . . . . . . . . . . . . . . . . . . . . . . . . . . . . . . . . . . . . . . . . . . . . . . . . . . . . . . . . . . . . . . . . 32.50 11.52 9.38 32.50 72.51 79.83Index . . . . . . . . . . . . . . . . . . . . . . . . . . . . . . . . . . . . . . . . . . . . . . . . . . . . . . . . . . . . . . . . . . . . . . . . . . . . . . . . . . . . . . . . . . . . . 31.91 11.73 9.54 31.91 74.08 81.57
GROWTH OF $10,000 INVESTMENT
(SINCE INCEPTION AT NET ASSET VALUE)
$17,951$18,157
9,000
10,000
11,000
12,000
13,000
14,000
15,000
16,000
17,000
18,000
$19,000
Jul 21Jul 20Jul 19Jul 18Jul 17Jul 16Jul 15
Fund Index
The inception date of the Fund was 1/13/15. The first day of secondary market trading was 1/15/15.
Past performance is no guarantee of future results. Performance results do not reflect the deduction of taxes that a shareholder would pay on fund distributions or on the redemptionor sale of fund shares. See “About Fund Performance” on page 21 for more information.
Expense Example
Actual Hypothetical 5% Return
BeginningAccount Value
(02/01/21)
EndingAccount Value
(07/31/21)
ExpensesPaid Duringthe Period (a)
BeginningAccount Value
(02/01/21)
EndingAccount Value
(07/31/21)
ExpensesPaid Duringthe Period (a)
AnnualizedExpense
Ratio
$ 1,000.00 $ 1,131.10 $ 1.59 $ 1,000.00 $ 1,023.30 $ 1.51 0.30%
(a) Expenses are calculated using the Fund’s annualized expense ratio (as disclosed in the table), multiplied by the average account value for the period, multiplied by the number ofdays in the period (181 days) and divided by the number of days in the year (365 days). Other fees, such as brokerage commissions and other fees to financial intermediaries, maybe paid which are not reflected in the tables and examples above. See “Shareholder Expenses” on page 21 for more information.
Fund Summary as of July 31, 2021 iShares� MSCI Intl Quality Factor ETF
F U N D S U M M A R Y 7

Portfolio Management Commentary
International developed equities with higher quality characteristics advanced during the reporting period amid economic recovery and vaccination programs in the wake ofthe coronavirus pandemic. Stocks in the U.K. contributed the most to the Index’s return, propelled by industrials stocks amid a record increase in manufacturing activity.Capital goods companies benefited from strong demand for plumbing and heating parts as consumers took on home improvement projects during the pandemic. The metalsand mining industry drove contribution in the U.K. materials sector. Production of iron ore, a key ingredient in steelmaking, increased amid rising demand from China. TheChinese government’s stimulus measures led to increased industrial activity and infrastructure projects, driving up demand and prices for iron ore. Financials stocks,particularly insurance companies, added to gains in the U.K as increased profitability from business in Asia bolstered performance.
French equities also contributed notably to the Index’s return. Textiles and apparel companies in the consumer discretionary sector showed resilience, benefiting frompent-up consumer demand for luxury purchases. This trend was particularly strong in Asian markets, fueling new store openings and strong sales growth. France’s energysector also advanced amid higher earnings driven by improved refining levels, preservation of dividend payments, and a gradual transition to cleaner energy sources.
Information technology companies drove contribution among equities in the Netherlands. The semiconductor equipment industry benefited from the expansion of 5Gnetworks, consumer and corporate computer usage, and cloud computing. Pandemic restrictions led businesses to increase spending on infrastructure to facilitate remoteworking, while consumers staying at home drove demand for computer equipment and gaming consoles. Consequently, high demand for computer chips led to a globalrsemiconductor shortage, which further boosted sales of semiconductor manufacturing equipment.
In terms of relative performance, the Index slightly outperformed the broader market, as represented by the MSCI World ex USA Index. The quality factor outperformed earlyin the reporting period during the market’s large-cap growth rally, and again at the end of the reporting period when investor sentiment turned defensive as COVID-19 casesrose. Stock selection in the Netherlands and France helped relative performance, while security selection in Japan detracted. Turning to sectors, the information technologysector contributed the most, due to an overweight position in semiconductor equipment stocks. A significant underweight to banks detracted from performance in thefinancials sector.
Portfolio Information
ALLOCATION BY SECTOR
SectorPercent of
Total Investments(a)
Financials . . . . . . . . . . . . . . . . . . . . . . . . . . . . . . . . . . . . . . . . . . . . . . . . . . 18.6%Industrials . . . . . . . . . . . . . . . . . . . . . . . . . . . . . . . . . . . . . . . . . . . . . . . . . . 15.3Consumer Discretionary . . . . . . . . . . . . . . . . . . . . . . . . . . . . . . . . . . . . 11.8Health Care . . . . . . . . . . . . . . . . . . . . . . . . . . . . . . . . . . . . . . . . . . . . . . . . 11.6Information Technology . . . . . . . . . . . . . . . . . . . . . . . . . . . . . . . . . . . . . 9.7Consumer Staples . . . . . . . . . . . . . . . . . . . . . . . . . . . . . . . . . . . . . . . . . . 9.4Materials . . . . . . . . . . . . . . . . . . . . . . . . . . . . . . . . . . . . . . . . . . . . . . . . . . . 8.6Communication Services. . . . . . . . . . . . . . . . . . . . . . . . . . . . . . . . . . . . 4.7Energy . . . . . . . . . . . . . . . . . . . . . . . . . . . . . . . . . . . . . . . . . . . . . . . . . . . . . 4.2Utilities . . . . . . . . . . . . . . . . . . . . . . . . . . . . . . . . . . . . . . . . . . . . . . . . . . . . . 3.2Real Estate. . . . . . . . . . . . . . . . . . . . . . . . . . . . . . . . . . . . . . . . . . . . . . . . . 2.9
TEN LARGEST GEOGRAPHIC ALLOCATION
Country/Geographic RegionPercent of
Total Investments(a)
Japan . . . . . . . . . . . . . . . . . . . . . . . . . . . . . . . . . . . . . . . . . . . . . . . . . . . . . . 14.6%United Kingdom . . . . . . . . . . . . . . . . . . . . . . . . . . . . . . . . . . . . . . . . . . . . 13.8Switzerland. . . . . . . . . . . . . . . . . . . . . . . . . . . . . . . . . . . . . . . . . . . . . . . . . 12.8Canada . . . . . . . . . . . . . . . . . . . . . . . . . . . . . . . . . . . . . . . . . . . . . . . . . . . . 8.4Australia . . . . . . . . . . . . . . . . . . . . . . . . . . . . . . . . . . . . . . . . . . . . . . . . . . . 7.8Netherlands . . . . . . . . . . . . . . . . . . . . . . . . . . . . . . . . . . . . . . . . . . . . . . . . 7.4Germany . . . . . . . . . . . . . . . . . . . . . . . . . . . . . . . . . . . . . . . . . . . . . . . . . . . 5.7France . . . . . . . . . . . . . . . . . . . . . . . . . . . . . . . . . . . . . . . . . . . . . . . . . . . . . 5.7Hong Kong . . . . . . . . . . . . . . . . . . . . . . . . . . . . . . . . . . . . . . . . . . . . . . . . . 5.6Denmark . . . . . . . . . . . . . . . . . . . . . . . . . . . . . . . . . . . . . . . . . . . . . . . . . . . 5.1
(a) Excludes money market funds.
Fund Summary as of July 31, 2021 (continued) iShares� MSCI Intl Quality Factor ETF
8 2 0 2 1 I S H A R E S A N N U A L R E P O R T T O S H A R E H O L D E R S

Investment Objective
The iShares MSCI Intl Size Factor ETF (the “Fund”) (formerly the iShares Edge MSCI Intl Size Factor ETF) seeks to track the investment results of an index composedof international developed large- and mid-capitalization stocks with relatively smaller average market capitalization, as represented by the MSCI World ex USA Low SizeIndex (the "Index"). The Fund invests in a representative sample of securities included in the Index that collectively has an investment profile similar to the Index. Due tothe use of representative sampling, the Fund may or may not hold all of the securities that are included in the Index.
Performance
Average Annual Total Returns Cumulative Total Returns
1 Year 5 YearsSince
Inception 1 Year 5 YearsSince
Inception
Fund NAV. . . . . . . . . . . . . . . . . . . . . . . . . . . . . . . . . . . . . . . . . . . . . . . . . . . . . . . . . . . . . . . . . . . . . . . . . . . . . . . . . . . . . . . . . 31.83% 8.36% 6.66% 31.83% 49.38% 48.43%Fund Market . . . . . . . . . . . . . . . . . . . . . . . . . . . . . . . . . . . . . . . . . . . . . . . . . . . . . . . . . . . . . . . . . . . . . . . . . . . . . . . . . . . . . . 32.58 8.28 6.62 32.58 48.84 48.06Index . . . . . . . . . . . . . . . . . . . . . . . . . . . . . . . . . . . . . . . . . . . . . . . . . . . . . . . . . . . . . . . . . . . . . . . . . . . . . . . . . . . . . . . . . . . . . 32.16 8.43 6.69 32.16 49.87 48.67
GROWTH OF $10,000 INVESTMENT
(SINCE INCEPTION AT NET ASSET VALUE)
$14,843$14,867
8,000
9,000
10,000
11,000
12,000
13,000
14,000
15,000
$16,000
Jul 21Jul 20Jul 19Jul 18Jul 17Jul 16Jul 15
Fund Index
The inception date of the Fund was 6/16/15. The first day of secondary market trading was 6/18/15.
Index performance through December 2, 2018 reflects the performance of the MSCI World ex USA Risk Weighted Index. Index performance beginning on December 3, 2018 reflectsthe performance of the MSCI World ex USA Low Size Index.
Past performance is no guarantee of future results. Performance results do not reflect the deduction of taxes that a shareholder would pay on fund distributions or on the redemptionor sale of fund shares. See “About Fund Performance” on page 21 for more information.
Expense Example
Actual Hypothetical 5% Return
BeginningAccount Value
(02/01/21)
EndingAccount Value
(07/31/21)
ExpensesPaid Duringthe Period (a)
BeginningAccount Value
(02/01/21)
EndingAccount Value
(07/31/21)
ExpensesPaid Duringthe Period (a)
AnnualizedExpense
Ratio
$ 1,000.00 $ 1,094.60 $ 1.56 $ 1,000.00 $ 1,023.30 $ 1.51 0.30%
(a) Expenses are calculated using the Fund’s annualized expense ratio (as disclosed in the table), multiplied by the average account value for the period, multiplied by the number ofdays in the period (181 days) and divided by the number of days in the year (365 days). Other fees, such as brokerage commissions and other fees to financial intermediaries, maybe paid which are not reflected in the tables and examples above. See “Shareholder Expenses” on page 21 for more information.
Fund Summary as of July 31, 2021 iShares� MSCI Intl Size Factor ETF
F U N D S U M M A R Y 9

Portfolio Management Commentary
Smaller-capitalization international stocks advanced during the reporting period amid widespread vaccination programs. Stocks in Japan contributed the most to the Index’sperformance, driven by the industrials sector. Rising U.S. Treasury yields put pressure on the Japanese yen, making Japanese industrials exporters attractive to investors.Additionally, economic recovery lifted these cyclical stocks as improved earnings drove profit forecasts higher. Consumer discretionary companies like automobilesmanufacturers and auto components makers benefited from both a weaker Japanese yen and improved consumer demand. Consumer durables also helped, driven byconsumer electronics companies rejoining the top blue-chip stock index, closing nonessential business units, and selling their holdings in dominant players.
Canadian and U.K. stocks also bolstered the Index’s return, led by financials stocks. Diversified banks in both countries gained as mortgages expanded and loan lossesremained low amid broad vaccination programs and economic recovery. In addition to boosting Canadian energy stocks, rising oil and gas prices also helped Canadianbanks due to their strong financial ties to the energy sector. Insurers in Canada also contributed due to improved life insurance sales and cost savings from reorganization.In the U.K., insurers made acquisition deals, sold nonessential business units, and despite lower premiums during the pandemic benefited from fewer motor vehicle claimsduring extended shutdowns.
French consumer discretionary companies contributed as luxury brand sales soared when customers in Asian markets began to recover from the pandemic. Automobilemanufacturers also gained as they invested heavily in electric vehicles.
Industrial machinery companies led Swedish contributions amid drives toward sustainability. German automobile manufacturers that combined strong cost managementwith plans to spin off a market-leading trucking division boosted the Index’s return.
In terms of relative performance, the Index outperformed the broader market, as represented by the MSCI World ex USA Index. This outperformance has occurred sinceearly November 2020, driven by the healthcare sector, as Pfizer and Moderna announced the U.S. Food and Drug Administration emergency use approval of theirCOVID-19 vaccines. Stock selection in the U.K. contributed the most to relative performance, and an underweight position and security selection in Switzerland also added.An overweight position in Japan and stock selection in the Netherlands detracted from relative return.
Portfolio Information
ALLOCATION BY SECTOR
SectorPercent of
Total Investments(a)
Industrials . . . . . . . . . . . . . . . . . . . . . . . . . . . . . . . . . . . . . . . . . . . . . . . . . . 17.7%Financials . . . . . . . . . . . . . . . . . . . . . . . . . . . . . . . . . . . . . . . . . . . . . . . . . . 14.8Consumer Discretionary . . . . . . . . . . . . . . . . . . . . . . . . . . . . . . . . . . . . 11.6Materials . . . . . . . . . . . . . . . . . . . . . . . . . . . . . . . . . . . . . . . . . . . . . . . . . . . 9.0Information Technology . . . . . . . . . . . . . . . . . . . . . . . . . . . . . . . . . . . . . 8.8Consumer Staples . . . . . . . . . . . . . . . . . . . . . . . . . . . . . . . . . . . . . . . . . . 8.6Health Care . . . . . . . . . . . . . . . . . . . . . . . . . . . . . . . . . . . . . . . . . . . . . . . . 8.1Real Estate. . . . . . . . . . . . . . . . . . . . . . . . . . . . . . . . . . . . . . . . . . . . . . . . . 6.8Communication Services. . . . . . . . . . . . . . . . . . . . . . . . . . . . . . . . . . . . 6.1Utilities . . . . . . . . . . . . . . . . . . . . . . . . . . . . . . . . . . . . . . . . . . . . . . . . . . . . . 5.3Energy . . . . . . . . . . . . . . . . . . . . . . . . . . . . . . . . . . . . . . . . . . . . . . . . . . . . . 3.2
TEN LARGEST GEOGRAPHIC ALLOCATION
Country/Geographic RegionPercent of
Total Investments(a)
Japan . . . . . . . . . . . . . . . . . . . . . . . . . . . . . . . . . . . . . . . . . . . . . . . . . . . . . . 29.9%Canada . . . . . . . . . . . . . . . . . . . . . . . . . . . . . . . . . . . . . . . . . . . . . . . . . . . . 9.9United Kingdom . . . . . . . . . . . . . . . . . . . . . . . . . . . . . . . . . . . . . . . . . . . . 8.7France . . . . . . . . . . . . . . . . . . . . . . . . . . . . . . . . . . . . . . . . . . . . . . . . . . . . . 7.4Australia . . . . . . . . . . . . . . . . . . . . . . . . . . . . . . . . . . . . . . . . . . . . . . . . . . . 6.9Germany . . . . . . . . . . . . . . . . . . . . . . . . . . . . . . . . . . . . . . . . . . . . . . . . . . . 6.2Switzerland. . . . . . . . . . . . . . . . . . . . . . . . . . . . . . . . . . . . . . . . . . . . . . . . . 4.5Sweden . . . . . . . . . . . . . . . . . . . . . . . . . . . . . . . . . . . . . . . . . . . . . . . . . . . . 4.1Hong Kong . . . . . . . . . . . . . . . . . . . . . . . . . . . . . . . . . . . . . . . . . . . . . . . . . 3.7Netherlands . . . . . . . . . . . . . . . . . . . . . . . . . . . . . . . . . . . . . . . . . . . . . . . . 3.0
(a) Excludes money market funds.
Fund Summary as of July 31, 2021 (continued) iShares� MSCI Intl Size Factor ETF
10 2 0 2 1 I S H A R E S A N N U A L R E P O R T T O S H A R E H O L D E R S

Investment Objective
The iShares MSCI Intl Value Factor ETF (the “Fund”) (formerly the iShares Edge MSCI Intl Value Factor ETF) seeks to track the investment results of an index composedof international developed large- and mid-capitalization stocks with value characteristics and relatively lower valuations, as represented by the MSCI World ex USAEnhanced Value Index (the "Index"). The Fund invests in a representative sample of securities included in the Index that collectively has an investment profile similar to theIndex. Due to the use of representative sampling, the Fund may or may not hold all of the securities that are included in the Index.
Performance
Average Annual Total Returns Cumulative Total Returns
1 Year 5 YearsSince
Inception 1 Year 5 YearsSince
Inception
Fund NAV. . . . . . . . . . . . . . . . . . . . . . . . . . . . . . . . . . . . . . . . . . . . . . . . . . . . . . . . . . . . . . . . . . . . . . . . . . . . . . . . . . . . . . . . . 37.95% 6.98% 3.40% 37.95% 40.12% 22.75%Fund Market . . . . . . . . . . . . . . . . . . . . . . . . . . . . . . . . . . . . . . . . . . . . . . . . . . . . . . . . . . . . . . . . . . . . . . . . . . . . . . . . . . . . . . 37.82 7.03 3.38 37.82 40.46 22.62Index . . . . . . . . . . . . . . . . . . . . . . . . . . . . . . . . . . . . . . . . . . . . . . . . . . . . . . . . . . . . . . . . . . . . . . . . . . . . . . . . . . . . . . . . . . . . . 38.13 7.08 3.46 38.13 40.79 23.17
GROWTH OF $10,000 INVESTMENT
(SINCE INCEPTION AT NET ASSET VALUE)
$12,275$12,317
7,5008,0008,5009,0009,500
10,00010,50011,00011,50012,00012,500
$13,000
Jul 21Jul 20Jul 19Jul 18Jul 17Jul 16Jul 15
Fund Index
The inception date of the Fund was 6/16/15. The first day of secondary market trading was 6/18/15.
Certain sectors and markets performed exceptionally well based on market conditions during the one-year period. Achieving such exceptional returns involves the risk of volatility andinvestors should not expect that such exceptional returns will be repeated.
Past performance is no guarantee of future results. Performance results do not reflect the deduction of taxes that a shareholder would pay on fund distributions or on the redemptionor sale of fund shares. See “About Fund Performance” on page 21 for more information.
Expense Example
Actual Hypothetical 5% Return
BeginningAccount Value
(02/01/21)
EndingAccount Value
(07/31/21)
ExpensesPaid Duringthe Period (a)
BeginningAccount Value
(02/01/21)
EndingAccount Value
(07/31/21)
ExpensesPaid Duringthe Period (a)
AnnualizedExpense
Ratio
$ 1,000.00 $ 1,140.00 $ 1.59 $ 1,000.00 $ 1,023.30 $ 1.51 0.30%
(a) Expenses are calculated using the Fund’s annualized expense ratio (as disclosed in the table), multiplied by the average account value for the period, multiplied by the number ofdays in the period (181 days) and divided by the number of days in the year (365 days). Other fees, such as brokerage commissions and other fees to financial intermediaries, maybe paid which are not reflected in the tables and examples above. See “Shareholder Expenses” on page 21 for more information.
Fund Summary as of July 31, 2021 iShares� MSCI Intl Value Factor ETF
F U N D S U M M A R Y 11

Portfolio Management Commentary
International developed equities with higher value characteristics advanced during the reporting period amid broad vaccination programs. Japanese stocks contributed themost to the Index’s return. Rising U.S. Treasury yields put pressure on the Japanese yen during the summer of 2020, which made Japanese industrials exporters attractiveto investors. Stimulus payments and advancing vaccination programs supported gains for capital goods trading companies and distributors. Technology hardware andequipment stocks led contribution to the information technology sector. Spinoffs to maintain competitiveness with Chinese rivals signaled a pivot from electronics hardwareto digital services, driving gains in the electronic equipment and instruments industry. Consumer discretionary stocks also contributed, led by automobile manufacturerswhose supply management systems largely sidestepped the recent semiconductor shortage crisis.
Metals and mining companies led materials sector contribution from the U.K and France. Economic reopening drove a surge in demand for metals, and soaring commoditiesprices drove profits higher. Diversified banks in the financials sector were another source of strength in both countries as investment banking and trading expanded withthe recovering economy. Loan losses remained lower, allowing banks to release some of the funds set aside to cover bad debt. Consumer staples stocks also boosted theIndex’s return in the U.K. as tobacco companies benefited from higher e-cigarette sales. In France, building products firms drove industrials sector contribution as housingrenovations revived and flourished.
In terms of relative performance, the Index outperformed the broader market, as represented by the MSCI World ex USA Index. Early in the reporting period, stocks ofcompanies with products or services that benefited from stay-at-home orders during the pandemic generally outperformed the broader market. Cyclical factors like valuethat are strongly tied to economic reopening declined. Vaccine approvals in late 2020 drove the Index to outperform as expectations of improved global economic activitysupported value stocks. Stock selection in Japan and the U.K. were the largest contributors to relative performance. Underweight positions in Sweden and the Netherlandsweighed slightly on relative return.
At the sector level, security selection in the metals and mining industry proved beneficial. Both security selection and an overweight position in the automobile industry andpositioning within diversified banks helped relative performance. On the downside, underweights in the semiconductors and healthcare equipment industries proveddetrimental to returns, as did a modest underweight to multi-utilities.
Portfolio Information
ALLOCATION BY SECTOR
SectorPercent of
Total Investments(a)
Financials . . . . . . . . . . . . . . . . . . . . . . . . . . . . . . . . . . . . . . . . . . . . . . . . . . 18.7%Industrials . . . . . . . . . . . . . . . . . . . . . . . . . . . . . . . . . . . . . . . . . . . . . . . . . . 15.2Consumer Discretionary . . . . . . . . . . . . . . . . . . . . . . . . . . . . . . . . . . . . 12.4Health Care . . . . . . . . . . . . . . . . . . . . . . . . . . . . . . . . . . . . . . . . . . . . . . . . 11.0Consumer Staples . . . . . . . . . . . . . . . . . . . . . . . . . . . . . . . . . . . . . . . . . . 9.8Information Technology . . . . . . . . . . . . . . . . . . . . . . . . . . . . . . . . . . . . . 9.4Materials . . . . . . . . . . . . . . . . . . . . . . . . . . . . . . . . . . . . . . . . . . . . . . . . . . . 8.6Communication Services. . . . . . . . . . . . . . . . . . . . . . . . . . . . . . . . . . . . 4.5Energy . . . . . . . . . . . . . . . . . . . . . . . . . . . . . . . . . . . . . . . . . . . . . . . . . . . . . 4.2Utilities . . . . . . . . . . . . . . . . . . . . . . . . . . . . . . . . . . . . . . . . . . . . . . . . . . . . . 3.4Real Estate. . . . . . . . . . . . . . . . . . . . . . . . . . . . . . . . . . . . . . . . . . . . . . . . . 2.8
TEN LARGEST GEOGRAPHIC ALLOCATION
Country/Geographic RegionPercent of
Total Investments(a)
Japan . . . . . . . . . . . . . . . . . . . . . . . . . . . . . . . . . . . . . . . . . . . . . . . . . . . . . . 36.4%United Kingdom . . . . . . . . . . . . . . . . . . . . . . . . . . . . . . . . . . . . . . . . . . . . 13.4France . . . . . . . . . . . . . . . . . . . . . . . . . . . . . . . . . . . . . . . . . . . . . . . . . . . . . 10.5Germany . . . . . . . . . . . . . . . . . . . . . . . . . . . . . . . . . . . . . . . . . . . . . . . . . . . 8.4Netherlands . . . . . . . . . . . . . . . . . . . . . . . . . . . . . . . . . . . . . . . . . . . . . . . . 5.6Switzerland. . . . . . . . . . . . . . . . . . . . . . . . . . . . . . . . . . . . . . . . . . . . . . . . . 5.0Australia . . . . . . . . . . . . . . . . . . . . . . . . . . . . . . . . . . . . . . . . . . . . . . . . . . . 4.0Canada . . . . . . . . . . . . . . . . . . . . . . . . . . . . . . . . . . . . . . . . . . . . . . . . . . . . 3.2Hong Kong . . . . . . . . . . . . . . . . . . . . . . . . . . . . . . . . . . . . . . . . . . . . . . . . . 2.8Italy . . . . . . . . . . . . . . . . . . . . . . . . . . . . . . . . . . . . . . . . . . . . . . . . . . . . . . . . 2.8
(a) Excludes money market funds.
Fund Summary as of July 31, 2021 (continued) iShares� MSCI Intl Value Factor ETF
12 2 0 2 1 I S H A R E S A N N U A L R E P O R T T O S H A R E H O L D E R S

Investment Objective
The iShares MSCI USA Momentum Factor ETF (the “Fund”) (formerly the iShares Edge MSCI USA Momentum Factor ETF) seeks to track the investment results of anindex composed of U.S. large- and mid-capitalization stocks exhibiting relatively higher price momentum, as represented by the MSCI USA Momentum SR Variant Index(the "Index"). The Fund invests in a representative sample of securities included in the Index that collectively has an investment profile similar to the Index. Due to the useof representative sampling, the Fund may or may not hold all of the securities that are included in the Index.
Performance
Average Annual Total Returns Cumulative Total Returns
1 Year 5 YearsSince
Inception 1 Year 5 YearsSince
Inception
Fund NAV. . . . . . . . . . . . . . . . . . . . . . . . . . . . . . . . . . . . . . . . . . . . . . . . . . . . . . . . . . . . . . . . . . . . . . . . . . . . . . . . . . . . . . . . . 25.57% 18.83% 17.25% 25.57% 136.95% 274.28%Fund Market . . . . . . . . . . . . . . . . . . . . . . . . . . . . . . . . . . . . . . . . . . . . . . . . . . . . . . . . . . . . . . . . . . . . . . . . . . . . . . . . . . . . . . 25.54 18.83 17.25 25.54 136.90 274.25Index(a) . . . . . . . . . . . . . . . . . . . . . . . . . . . . . . . . . . . . . . . . . . . . . . . . . . . . . . . . . . . . . . . . . . . . . . . . . . . . . . . . . . . . . . . . . . . 25.75 19.09 17.49 25.75 139.51 280.34MSCI USA Momentum Index . . . . . . . . . . . . . . . . . . . . . . . . . . . . . . . . . . . . . . . . . . . . . . . . . . . . . . . . . . . . . . . . . . . . . . . 24.79 18.91 17.38 24.79 137.70 277.46MSCI USA Momentum SR Variant Index(b) . . . . . . . . . . . . . . . . . . . . . . . . . . . . . . . . . . . . . . . . . . . . . . . . . . . . . . . . . . 25.75 N/A N/A 25.75 N/A N/A
GROWTH OF $10,000 INVESTMENT
(SINCE INCEPTION AT NET ASSET VALUE)
$37,428$37,746$38,034
5,000
10,000
15,000
20,000
25,000
30,000
35,000
$40,000
Jul 21Jul 20Jul 19Jul 18Jul 17Jul 16Jul 15Jul 14Jul 13
Fund Index MSCI USA Momentum Index
The inception date of the Fund was 4/16/13. The first day of secondary market trading was 4/18/13.
(a) Index performance through November 22, 2020 reflects the performance of the MSCI USA Momentum Index. Index performance beginning on November 23, 2020 reflects theperformance of the MSCI USA Momentum SR Variant Index, which, effective as of November 23, 2020, replaced the MSCI USA Momentum Index as the underlying index of thefund.
(b) The inception date of the MSCI USA Momentum SR Variant Index was May 19, 2020. The cumulative total return of this index for the period May 19, 2020 through July 31, 2021was 44.07%.
Past performance is no guarantee of future results. Performance results do not reflect the deduction of taxes that a shareholder would pay on fund distributions or on the redemptionor sale of fund shares. See “About Fund Performance” on page 21 for more information.
Expense Example
Actual Hypothetical 5% Return
BeginningAccount Value
(02/01/21)
EndingAccount Value
(07/31/21)
ExpensesPaid Duringthe Period (a)
BeginningAccount Value
(02/01/21)
EndingAccount Value
(07/31/21)
ExpensesPaid Duringthe Period (a)
AnnualizedExpense
Ratio
$ 1,000.00 $ 1,069.40 $ 0.77 $ 1,000.00 $ 1,024.10 $ 0.75 0.15%
(a) Expenses are calculated using the Fund’s annualized expense ratio (as disclosed in the table), multiplied by the average account value for the period, multiplied by the number ofdays in the period (181 days) and divided by the number of days in the year (365 days). Other fees, such as brokerage commissions and other fees to financial intermediaries, maybe paid which are not reflected in the tables and examples above. See “Shareholder Expenses” on page 21 for more information.
Fund Summary as of July 31, 2021 iShares� MSCI USA Momentum Factor ETF
F U N D S U M M A R Y 13

Portfolio Management Commentary
Stocks with relatively high price momentum advanced strongly for the reporting period as the economy recovered from the impact of the coronavirus pandemic amid thedistribution of effective COVID-19 vaccines. The information technology sector contributed the most to the Index’s return, benefiting from increased demand amid growinge-commerce and ongoing remote work and school. Software companies’ revenues rose due to increased demand for cloud-based software, services, and infrastructure ascorporations continued to migrate their information technology infrastructure to the cloud. Remote work increased the need for cybersecurity software subscriptions, furtherbolstering the industry’s revenues. Companies that process transactions posted solid gains as pandemic-related restrictions drove higher payment volumes amid increasede-commerce. The semiconductors industry advanced as a global shortage of chips drove semiconductor prices higher. Robust demand for chips used in data centers,computers, game consoles, and cryptocurrency mining drove increased revenues. Technology hardware and equipment companies advanced as consumers’ increasedtime at home led to strong demand for new personal computers, tablets, and mobile phones to use for work, school, and socializing.
The consumer discretionary sector was a strong contributor to the Index’s return. Electric vehicle manufacturers benefited from strong sales, and a major update to thesoftware for self-driving cars supported investor optimism. E-commerce sales rose sharply during the pandemic, benefiting retailers with strong digital shopping platformsand delivery services.
The communication services and healthcare sectors were significant contributors. The media and entertainment industry benefited from an increase in online advertisingrevenues, especially from retailers, which rebounded sharply amid a recovery in consumer spending. Biotechnology companies developed, tested, and distributed vaccinesfor COVID-19, receiving emergency use authorization. Expectations that vaccines for children would follow and agreements to increase global vaccine supply furtherbolstered the industry.
In terms of relative performance, the Index significantly underperformed the broader market, as represented by the MSCI USA Index. Amid the economic disruptions of thepandemic, the momentum factor focused on growth sectors, including information technology and consumer discretionary. Following economic reopening andcommencement of vaccination programs, the market shifted toward more cyclical value and small-capitalization stocks. The momentum factor’s focus in high-growthsectors therefore restrained relative performance. Stock selection in the information technology sector and an underweight position in financials, particularly banks, droverelative underperformance. In contrast, stock selection in the consumer discretionary sector was a modest relative contributor to performance.
Portfolio Information
ALLOCATION BY SECTOR
SectorPercent of
Total Investments(a)
Financials . . . . . . . . . . . . . . . . . . . . . . . . . . . . . . . . . . . . . . . . . . . . . . . . . . 30.5%Information Technology . . . . . . . . . . . . . . . . . . . . . . . . . . . . . . . . . . . . . 18.5Industrials . . . . . . . . . . . . . . . . . . . . . . . . . . . . . . . . . . . . . . . . . . . . . . . . . . 13.3Communication Services. . . . . . . . . . . . . . . . . . . . . . . . . . . . . . . . . . . . 12.6Consumer Discretionary . . . . . . . . . . . . . . . . . . . . . . . . . . . . . . . . . . . . 11.4Health Care . . . . . . . . . . . . . . . . . . . . . . . . . . . . . . . . . . . . . . . . . . . . . . . . 6.6Materials . . . . . . . . . . . . . . . . . . . . . . . . . . . . . . . . . . . . . . . . . . . . . . . . . . . 3.2Energy . . . . . . . . . . . . . . . . . . . . . . . . . . . . . . . . . . . . . . . . . . . . . . . . . . . . . 1.8Consumer Staples . . . . . . . . . . . . . . . . . . . . . . . . . . . . . . . . . . . . . . . . . . 1.5Other (each representing less than 1%). . . . . . . . . . . . . . . . . . . . . . 0.6
TEN LARGEST HOLDINGS
SecurityPercent of
Total Investments(a)
Tesla Inc. . . . . . . . . . . . . . . . . . . . . . . . . . . . . . . . . . . . . . . . . . . . . . . . . . . 5.6%Walt Disney Co. (The) . . . . . . . . . . . . . . . . . . . . . . . . . . . . . . . . . . . . . . 4.4JPMorgan Chase & Co. . . . . . . . . . . . . . . . . . . . . . . . . . . . . . . . . . . . . 4.4Berkshire Hathaway Inc., Class B . . . . . . . . . . . . . . . . . . . . . . . . . . . 4.3Bank of America Corp. . . . . . . . . . . . . . . . . . . . . . . . . . . . . . . . . . . . . . 3.8PayPal Holdings Inc. . . . . . . . . . . . . . . . . . . . . . . . . . . . . . . . . . . . . . . . 3.8Applied Materials Inc. . . . . . . . . . . . . . . . . . . . . . . . . . . . . . . . . . . . . . . 3.1Wells Fargo & Co. . . . . . . . . . . . . . . . . . . . . . . . . . . . . . . . . . . . . . . . . . . 3.1Moderna Inc. . . . . . . . . . . . . . . . . . . . . . . . . . . . . . . . . . . . . . . . . . . . . . . . 2.9Alphabet Inc., Class C . . . . . . . . . . . . . . . . . . . . . . . . . . . . . . . . . . . . . . 2.8
(a) Excludes money market funds.
Fund Summary as of July 31, 2021 (continued) iShares� MSCI USA Momentum Factor ETF
14 2 0 2 1 I S H A R E S A N N U A L R E P O R T T O S H A R E H O L D E R S

Investment Objective
The iShares MSCI USA Quality Factor ETF (the “Fund”) (formerly the iShares Edge MSCI USA Quality Factor ETF) seeks to track the investment results of an indexcomposed of U.S. large- and mid-capitalization stocks with quality characteristics as identified through certain fundamental metrics, as represented by the MSCI USA SectorNeutral Quality Index (the "Index"). The Fund invests in a representative sample of securities included in the Index that collectively has an investment profile similar to theIndex. Due to the use of representative sampling, the Fund may or may not hold all of the securities that are included in the Index.
Performance
Average Annual Total Returns Cumulative Total Returns
1 Year 5 YearsSince
Inception 1 Year 5 YearsSince
Inception
Fund NAV. . . . . . . . . . . . . . . . . . . . . . . . . . . . . . . . . . . . . . . . . . . . . . . . . . . . . . . . . . . . . . . . . . . . . . . . . . . . . . . . . . . . . . . . . 38.63% 17.16% 15.32% 38.63% 120.71% 214.66%Fund Market . . . . . . . . . . . . . . . . . . . . . . . . . . . . . . . . . . . . . . . . . . . . . . . . . . . . . . . . . . . . . . . . . . . . . . . . . . . . . . . . . . . . . . 38.66 17.17 15.32 38.66 120.85 214.76Index . . . . . . . . . . . . . . . . . . . . . . . . . . . . . . . . . . . . . . . . . . . . . . . . . . . . . . . . . . . . . . . . . . . . . . . . . . . . . . . . . . . . . . . . . . . . . 38.97 17.37 15.52 38.97 122.75 218.97
GROWTH OF $10,000 INVESTMENT
(SINCE INCEPTION AT NET ASSET VALUE)
$31,466$31,897
5,000
10,000
15,000
20,000
25,000
30,000
$35,000
Jul 21Jul 20Jul 19Jul 18Jul 17Jul 16Jul 15Jul 14Jul 13
Fund Index
The inception date of the Fund was 7/16/13. The first day of secondary market trading was 7/18/13.
Certain sectors and markets performed exceptionally well based on market conditions during the one-year period. Achieving such exceptional returns involves the risk of volatility andinvestors should not expect that such exceptional returns will be repeated.
Index performance through August 31, 2015 reflects the performance of the MSCI USA Quality Index. Index performance beginning on September 1, 2015 reflects the performance ofthe MSCI USA Sector Neutral Quality Index.
Past performance is no guarantee of future results. Performance results do not reflect the deduction of taxes that a shareholder would pay on fund distributions or on the redemptionor sale of fund shares. See “About Fund Performance” on page 21 for more information.
Expense Example
Actual Hypothetical 5% Return
BeginningAccount Value
(02/01/21)
EndingAccount Value
(07/31/21)
ExpensesPaid Duringthe Period (a)
BeginningAccount Value
(02/01/21)
EndingAccount Value
(07/31/21)
ExpensesPaid Duringthe Period (a)
AnnualizedExpense
Ratio
$ 1,000.00 $ 1,225.10 $ 0.83 $ 1,000.00 $ 1,024.10 $ 0.75 0.15%
(a) Expenses are calculated using the Fund’s annualized expense ratio (as disclosed in the table), multiplied by the average account value for the period, multiplied by the number ofdays in the period (181 days) and divided by the number of days in the year (365 days). Other fees, such as brokerage commissions and other fees to financial intermediaries, maybe paid which are not reflected in the tables and examples above. See “Shareholder Expenses” on page 21 for more information.
Fund Summary as of July 31, 2021 iShares� MSCI USA Quality Factor ETF
F U N D S U M M A R Y 15
Portfolio Management Commentary
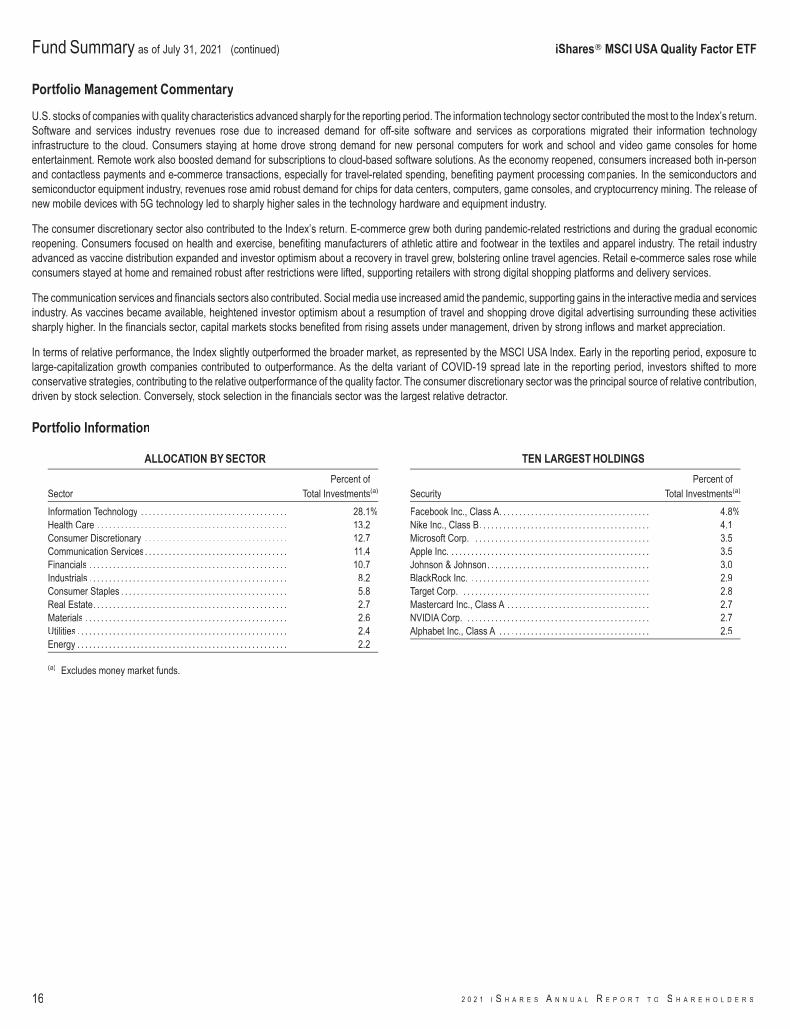
U.S. stocks of companies with quality characteristics advanced sharply for the reporting period. The information technology sector contributed the most to the Index’s return.Software and services industry revenues rose due to increased demand for off-site software and services as corporations migrated their information technologyinfrastructure to the cloud. Consumers staying at home drove strong demand for new personal computers for work and school and video game consoles for homeentertainment. Remote work also boosted demand for subscriptions to cloud-based software solutions. As the economy reopened, consumers increased both in-personand contactless payments and e-commerce transactions, especially for travel-related spending, benefiting payment processing companies. In the semiconductors andsemiconductor equipment industry, revenues rose amid robust demand for chips for data centers, computers, game consoles, and cryptocurrency mining. The release ofnew mobile devices with 5G technology led to sharply higher sales in the technology hardware and equipment industry.
The consumer discretionary sector also contributed to the Index’s return. E-commerce grew both during pandemic-related restrictions and during the gradual economicreopening. Consumers focused on health and exercise, benefiting manufacturers of athletic attire and footwear in the textiles and apparel industry. The retail industryadvanced as vaccine distribution expanded and investor optimism about a recovery in travel grew, bolstering online travel agencies. Retail e-commerce sales rose whileconsumers stayed at home and remained robust after restrictions were lifted, supporting retailers with strong digital shopping platforms and delivery services.
The communication services and financials sectors also contributed. Social media use increased amid the pandemic, supporting gains in the interactive media and servicesindustry. As vaccines became available, heightened investor optimism about a resumption of travel and shopping drove digital advertising surrounding these activitiessharply higher. In the financials sector, capital markets stocks benefited from rising assets under management, driven by strong inflows and market appreciation.
In terms of relative performance, the Index slightly outperformed the broader market, as represented by the MSCI USA Index. Early in the reporting period, exposure tolarge-capitalization growth companies contributed to outperformance. As the delta variant of COVID-19 spread late in the reporting period, investors shifted to moreconservative strategies, contributing to the relative outperformance of the quality factor. The consumer discretionary sector was the principal source of relative contribution,driven by stock selection. Conversely, stock selection in the financials sector was the largest relative detractor.
Portfolio Information
ALLOCATION BY SECTOR
SectorPercent of
Total Investments(a)
Information Technology . . . . . . . . . . . . . . . . . . . . . . . . . . . . . . . . . . . . . 28.1%Health Care . . . . . . . . . . . . . . . . . . . . . . . . . . . . . . . . . . . . . . . . . . . . . . . . 13.2Consumer Discretionary . . . . . . . . . . . . . . . . . . . . . . . . . . . . . . . . . . . . 12.7Communication Services. . . . . . . . . . . . . . . . . . . . . . . . . . . . . . . . . . . . 11.4Financials . . . . . . . . . . . . . . . . . . . . . . . . . . . . . . . . . . . . . . . . . . . . . . . . . . 10.7Industrials . . . . . . . . . . . . . . . . . . . . . . . . . . . . . . . . . . . . . . . . . . . . . . . . . . 8.2Consumer Staples . . . . . . . . . . . . . . . . . . . . . . . . . . . . . . . . . . . . . . . . . . 5.8Real Estate. . . . . . . . . . . . . . . . . . . . . . . . . . . . . . . . . . . . . . . . . . . . . . . . . 2.7Materials . . . . . . . . . . . . . . . . . . . . . . . . . . . . . . . . . . . . . . . . . . . . . . . . . . . 2.6Utilities . . . . . . . . . . . . . . . . . . . . . . . . . . . . . . . . . . . . . . . . . . . . . . . . . . . . . 2.4Energy . . . . . . . . . . . . . . . . . . . . . . . . . . . . . . . . . . . . . . . . . . . . . . . . . . . . . 2.2
TEN LARGEST HOLDINGS
SecurityPercent of
Total Investments(a)
Facebook Inc., Class A. . . . . . . . . . . . . . . . . . . . . . . . . . . . . . . . . . . . . . 4.8%Nike Inc., Class B. . . . . . . . . . . . . . . . . . . . . . . . . . . . . . . . . . . . . . . . . . . 4.1Microsoft Corp. . . . . . . . . . . . . . . . . . . . . . . . . . . . . . . . . . . . . . . . . . . . . 3.5Apple Inc. . . . . . . . . . . . . . . . . . . . . . . . . . . . . . . . . . . . . . . . . . . . . . . . . . . 3.5Johnson & Johnson. . . . . . . . . . . . . . . . . . . . . . . . . . . . . . . . . . . . . . . . . 3.0BlackRock Inc. . . . . . . . . . . . . . . . . . . . . . . . . . . . . . . . . . . . . . . . . . . . . . 2.9Target Corp. . . . . . . . . . . . . . . . . . . . . . . . . . . . . . . . . . . . . . . . . . . . . . . . 2.8Mastercard Inc., Class A . . . . . . . . . . . . . . . . . . . . . . . . . . . . . . . . . . . . 2.7NVIDIA Corp. . . . . . . . . . . . . . . . . . . . . . . . . . . . . . . . . . . . . . . . . . . . . . . 2.7Alphabet Inc., Class A . . . . . . . . . . . . . . . . . . . . . . . . . . . . . . . . . . . . . . 2.5
(a) Excludes money market funds.
Fund Summary as of July 31, 2021 (continued) iShares� MSCI USA Quality Factor ETF
16 2 0 2 1 I S H A R E S A N N U A L R E P O R T T O S H A R E H O L D E R S

Investment Objective
The iShares MSCI USA Size Factor ETF (the “Fund”) (formerly the iShares Edge MSCI USA Size Factor ETF) seeks to track the investment results of an index composedof U.S. large- and mid-capitalization stocks with relatively smaller average market capitalization, as represented by the MSCI USA Low Size Index (the "Index"). The Fundinvests in a representative sample of securities included in the Index that collectively has an investment profile similar to the Index. Due to the use of representativesampling, the Fund may or may not hold all of the securities that are included in the Index.
Performance
Average Annual Total Returns Cumulative Total Returns
1 Year 5 YearsSince
Inception 1 Year 5 YearsSince
Inception
Fund NAV. . . . . . . . . . . . . . . . . . . . . . . . . . . . . . . . . . . . . . . . . . . . . . . . . . . . . . . . . . . . . . . . . . . . . . . . . . . . . . . . . . . . . . . . . 44.28% 15.26% 14.19% 44.28% 103.41% 200.62%Fund Market . . . . . . . . . . . . . . . . . . . . . . . . . . . . . . . . . . . . . . . . . . . . . . . . . . . . . . . . . . . . . . . . . . . . . . . . . . . . . . . . . . . . . . 44.27 15.24 14.19 44.27 103.22 200.65Index . . . . . . . . . . . . . . . . . . . . . . . . . . . . . . . . . . . . . . . . . . . . . . . . . . . . . . . . . . . . . . . . . . . . . . . . . . . . . . . . . . . . . . . . . . . . . 44.54 15.43 14.36 44.54 104.93 204.18
GROWTH OF $10,000 INVESTMENT
(SINCE INCEPTION AT NET ASSET VALUE)
$30,062$30,418
5,000
10,000
15,000
20,000
25,000
30,000
$35,000
Jul 21Jul 20Jul 19Jul 18Jul 17Jul 16Jul 15Jul 14Jul 13
Fund Index
The inception date of the Fund was 4/16/13. The first day of secondary market trading was 4/18/13.
Certain sectors and markets performed exceptionally well based on market conditions during the one-year period. Achieving such exceptional returns involves the risk of volatility andinvestors should not expect that such exceptional returns will be repeated.
Index performance through December 2, 2018 reflects the performance of the MSCI USA Risk Weighted Index. Index performance beginning on December 3, 2018 reflects theperformance of the MSCI USA Low Size Index.
Past performance is no guarantee of future results. Performance results do not reflect the deduction of taxes that a shareholder would pay on fund distributions or on the redemptionor sale of fund shares. See “About Fund Performance” on page 21 for more information.
Expense Example
Actual Hypothetical 5% Return
BeginningAccount Value
(02/01/21)
EndingAccount Value
(07/31/21)
ExpensesPaid Duringthe Period (a)
BeginningAccount Value
(02/01/21)
EndingAccount Value
(07/31/21)
ExpensesPaid Duringthe Period (a)
AnnualizedExpense
Ratio
$ 1,000.00 $ 1,196.60 $ 0.82 $ 1,000.00 $ 1,024.10 $ 0.75 0.15%
(a) Expenses are calculated using the Fund’s annualized expense ratio (as disclosed in the table), multiplied by the average account value for the period, multiplied by the number ofdays in the period (181 days) and divided by the number of days in the year (365 days). Other fees, such as brokerage commissions and other fees to financial intermediaries, maybe paid which are not reflected in the tables and examples above. See “Shareholder Expenses” on page 21 for more information.
Fund Summary as of July 31, 2021 iShares� MSCI USA Size Factor ETF
F U N D S U M M A R Y 17

Portfolio Management Commentary
Stocks of U.S. large- and mid-capitalization companies with smaller average market capitalizations rose sharply for the reporting period, rebounding from the effects of thecoronavirus pandemic as the economy reopened amid the distribution of effective COVID-19 vaccines. The information technology sector contributed the most to theIndex’s return, led by the software and services industry. Companies providing digital advertising software benefited from increased streaming video viewership amidpandemic lockdowns, which drove demand for new digital advertising campaigns. As the economy reopened, online advertising sales grew, further bolstering the industry.Industry revenues rose due to an increase in subscriptions for cybersecurity software as ongoing telecommuting drove the need for software to ensure the integrity of remoteconnections. Large, high-profile attacks led to significant economic disruption, further supporting cybersecurity companies. In the semiconductors and semiconductorequipment industry, a global shortage of microchips, driven by pandemic-related plant closures and strong demand for chips for electronics and automobiles, drove revenuegrowth.
The financials sector also contributed substantially to the Index’s return, led by the diversified financials industry. Asset management companies’ revenues rose sharply,benefiting from robust inflows into exchange-traded funds. An automobile shortage drove up prices, supporting car loan companies. Pandemic-related increases ine-commerce supported digital payment processors. Insurance stocks also contributed amid investor optimism surrounding company reorganizations and acquisitions andstrong policy renewal rates.
The industrials and consumer discretionary sectors also contributed notably to the Index’s return. Increased time at home led homeowners to invest in their yards, benefitingcapital goods companies, especially in the machinery industry. Aerospace stocks advanced amid robust demand for commercial transportation and defense-relatedaerospace projects. Online car retailers posted strong revenue gains as consumers shifted away from in-person transactions to maintain social distancing. As the economyreopened, optimism grew that travel would rebound, benefiting online travel companies.
In terms of relative performance, the Index outperformed the broader market, as represented by the MSCI USA Index. As global economies rebounded from the pandemic’sdisruptions amid vaccine distribution, consumer demand grew, benefiting the size and value factors, which typically perform well during economic expansion. Stockselection in the consumer discretionary and materials sectors contributed to relative performance, along with an overweight position in the financials sector. Conversely, anoverweight in the utilities sector was a marginal detractor from relative performance.
Portfolio Information
ALLOCATION BY SECTOR
SectorPercent of
Total Investments(a)
Information Technology . . . . . . . . . . . . . . . . . . . . . . . . . . . . . . . . . . . . . 19.9%Health Care . . . . . . . . . . . . . . . . . . . . . . . . . . . . . . . . . . . . . . . . . . . . . . . . 14.4Industrials . . . . . . . . . . . . . . . . . . . . . . . . . . . . . . . . . . . . . . . . . . . . . . . . . . 13.6Financials . . . . . . . . . . . . . . . . . . . . . . . . . . . . . . . . . . . . . . . . . . . . . . . . . . 12.6Consumer Discretionary . . . . . . . . . . . . . . . . . . . . . . . . . . . . . . . . . . . . 10.6Real Estate. . . . . . . . . . . . . . . . . . . . . . . . . . . . . . . . . . . . . . . . . . . . . . . . . 6.2Communication Services. . . . . . . . . . . . . . . . . . . . . . . . . . . . . . . . . . . . 5.5Consumer Staples . . . . . . . . . . . . . . . . . . . . . . . . . . . . . . . . . . . . . . . . . . 5.1Utilities . . . . . . . . . . . . . . . . . . . . . . . . . . . . . . . . . . . . . . . . . . . . . . . . . . . . . 5.1Materials . . . . . . . . . . . . . . . . . . . . . . . . . . . . . . . . . . . . . . . . . . . . . . . . . . . 4.5Energy . . . . . . . . . . . . . . . . . . . . . . . . . . . . . . . . . . . . . . . . . . . . . . . . . . . . . 2.5
TEN LARGEST HOLDINGS
SecurityPercent of
Total Investments(a)
Moderna Inc. . . . . . . . . . . . . . . . . . . . . . . . . . . . . . . . . . . . . . . . . . . . . . . . 0.3%Cloudflare Inc., Class A . . . . . . . . . . . . . . . . . . . . . . . . . . . . . . . . . . . . . 0.3Enphase Energy Inc. . . . . . . . . . . . . . . . . . . . . . . . . . . . . . . . . . . . . . . . 0.3Trade Desk Inc. (The), Class A . . . . . . . . . . . . . . . . . . . . . . . . . . . . . . 0.3DocuSign Inc., Class A. . . . . . . . . . . . . . . . . . . . . . . . . . . . . . . . . . . . . . 0.2Dexcom Inc. . . . . . . . . . . . . . . . . . . . . . . . . . . . . . . . . . . . . . . . . . . . . . . . 0.2Carvana Co., Class A . . . . . . . . . . . . . . . . . . . . . . . . . . . . . . . . . . . . . . . 0.2salesforce.com Inc. . . . . . . . . . . . . . . . . . . . . . . . . . . . . . . . . . . . . . . . . 0.2Monolithic Power Systems Inc. . . . . . . . . . . . . . . . . . . . . . . . . . . . . . . 0.2Zscaler Inc. . . . . . . . . . . . . . . . . . . . . . . . . . . . . . . . . . . . . . . . . . . . . . . . . 0.2
(a) Excludes money market funds.
Fund Summary as of July 31, 2021 (continued) iShares� MSCI USA Size Factor ETF
18 2 0 2 1 I S H A R E S A N N U A L R E P O R T T O S H A R E H O L D E R S
Investment Objective
The iShares MSCI USA Value Factor ETF (the “Fund”) (formerly iShares Edge MSCI USA Value Factor ETF) seeks to track the investment results of an index composedof U.S. large- and mid-capitalization stocks with value characteristics and relatively lower valuations, as represented by the MSCI USA Enhanced Value Index (the "Index").The Fund invests in a representative sample of securities included in the Index that collectively has an investment profile similar to the Index. Due to the use of representativesampling, the Fund may or may not hold all of the securities that are included in the Index.
Performance
Average Annual Total Returns Cumulative Total Returns
1 Year 5 YearsSince
Inception 1 Year 5 YearsSince
Inception
Fund NAV. . . . . . . . . . . . . . . . . . . . . . . . . . . . . . . . . . . . . . . . . . . . . . . . . . . . . . . . . . . . . . . . . . . . . . . . . . . . . . . . . . . . . . . . . 46.10% 12.91% 11.76% 46.10% 83.52% 151.41%Fund Market . . . . . . . . . . . . . . . . . . . . . . . . . . . . . . . . . . . . . . . . . . . . . . . . . . . . . . . . . . . . . . . . . . . . . . . . . . . . . . . . . . . . . . 46.15 12.91 11.76 46.15 83.53 151.49Index . . . . . . . . . . . . . . . . . . . . . . . . . . . . . . . . . . . . . . . . . . . . . . . . . . . . . . . . . . . . . . . . . . . . . . . . . . . . . . . . . . . . . . . . . . . . . 46.35 13.09 11.93 46.35 84.94 154.51
GROWTH OF $10,000 INVESTMENT
(SINCE INCEPTION AT NET ASSET VALUE)
$25,141$25,451
8,000
10,000
12,000
14,000
16,000
18,000
20,000
22,000
24,000
26,000
$28,000
Jul 21Jul 20Jul 19Jul 18Jul 17Jul 16Jul 15Jul 14Jul 13
Fund Index
The inception date of the Fund was 4/16/13. The first day of secondary market trading was 4/18/13.
Certain sectors and markets performed exceptionally well based on market conditions during the one-year period. Achieving such exceptional returns involves the risk of volatility andinvestors should not expect that such exceptional returns will be repeated.
Index performance through August 31, 2015 reflects the performance of the MSCI USA Value Weighted Index. Index performance beginning on September 1, 2015 reflects theperformance of the MSCI USA Enhanced Value Index.
Past performance is no guarantee of future results. Performance results do not reflect the deduction of taxes that a shareholder would pay on fund distributions or on the redemptionor sale of fund shares. See “About Fund Performance” on page 21 for more information.
Expense Example
Actual Hypothetical 5% Return
BeginningAccount Value
(02/01/21)
EndingAccount Value
(07/31/21)
ExpensesPaid Duringthe Period (a)
BeginningAccount Value
(02/01/21)
EndingAccount Value
(07/31/21)
ExpensesPaid Duringthe Period (a)
AnnualizedExpense
Ratio
$ 1,000.00 $ 1,172.60 $ 0.81 $ 1,000.00 $ 1,024.10 $ 0.75 0.15%
(a) Expenses are calculated using the Fund’s annualized expense ratio (as disclosed in the table), multiplied by the average account value for the period, multiplied by the number ofdays in the period (181 days) and divided by the number of days in the year (365 days). Other fees, such as brokerage commissions and other fees to financial intermediaries, maybe paid which are not reflected in the tables and examples above. See “Shareholder Expenses” on page 21 for more information.
Fund Summary as of July 31, 2021 iShares� MSCI USA Value Factor ETF
F U N D S U M M A R Y 19
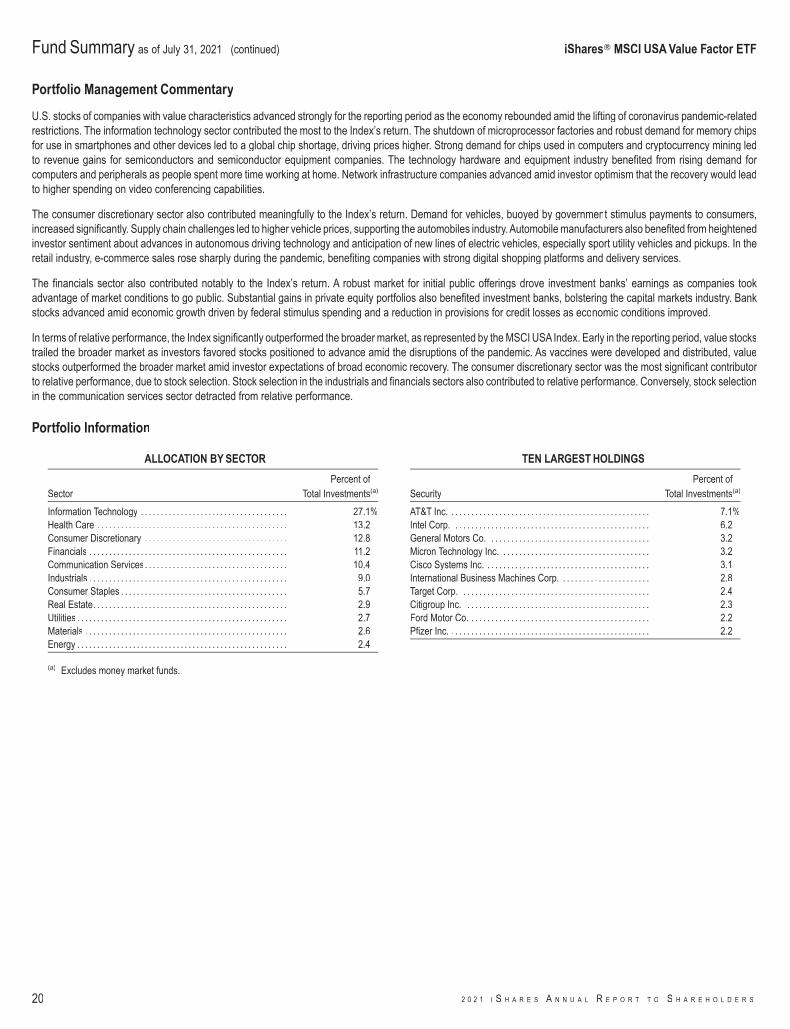
Portfolio Management Commentary
U.S. stocks of companies with value characteristics advanced strongly for the reporting period as the economy rebounded amid the lifting of coronavirus pandemic-relatedrestrictions. The information technology sector contributed the most to the Index’s return. The shutdown of microprocessor factories and robust demand for memory chipsfor use in smartphones and other devices led to a global chip shortage, driving prices higher. Strong demand for chips used in computers and cryptocurrency mining ledto revenue gains for semiconductors and semiconductor equipment companies. The technology hardware and equipment industry benefited from rising demand forcomputers and peripherals as people spent more time working at home. Network infrastructure companies advanced amid investor optimism that the recovery would leadto higher spending on video conferencing capabilities.
The consumer discretionary sector also contributed meaningfully to the Index’s return. Demand for vehicles, buoyed by government stimulus payments to consumers,increased significantly. Supply chain challenges led to higher vehicle prices, supporting the automobiles industry. Automobile manufacturers also benefited from heightenedinvestor sentiment about advances in autonomous driving technology and anticipation of new lines of electric vehicles, especially sport utility vehicles and pickups. In theretail industry, e-commerce sales rose sharply during the pandemic, benefiting companies with strong digital shopping platforms and delivery services.
The financials sector also contributed notably to the Index’s return. A robust market for initial public offerings drove investment banks’ earnings as companies tookadvantage of market conditions to go public. Substantial gains in private equity portfolios also benefited investment banks, bolstering the capital markets industry. Bankstocks advanced amid economic growth driven by federal stimulus spending and a reduction in provisions for credit losses as economic conditions improved.
In terms of relative performance, the Index significantly outperformed the broader market, as represented by the MSCI USA Index. Early in the reporting period, value stockstrailed the broader market as investors favored stocks positioned to advance amid the disruptions of the pandemic. As vaccines were developed and distributed, valuestocks outperformed the broader market amid investor expectations of broad economic recovery. The consumer discretionary sector was the most significant contributorrto relative performance, due to stock selection. Stock selection in the industrials and financials sectors also contributed to relative performance. Conversely, stock selectionin the communication services sector detracted from relative performance.
Portfolio Information
ALLOCATION BY SECTOR
SectorPercent of
Total Investments(a)
Information Technology . . . . . . . . . . . . . . . . . . . . . . . . . . . . . . . . . . . . . 27.1%Health Care . . . . . . . . . . . . . . . . . . . . . . . . . . . . . . . . . . . . . . . . . . . . . . . . 13.2Consumer Discretionary . . . . . . . . . . . . . . . . . . . . . . . . . . . . . . . . . . . . 12.8Financials . . . . . . . . . . . . . . . . . . . . . . . . . . . . . . . . . . . . . . . . . . . . . . . . . . 11.2Communication Services. . . . . . . . . . . . . . . . . . . . . . . . . . . . . . . . . . . . 10.4Industrials . . . . . . . . . . . . . . . . . . . . . . . . . . . . . . . . . . . . . . . . . . . . . . . . . . 9.0Consumer Staples . . . . . . . . . . . . . . . . . . . . . . . . . . . . . . . . . . . . . . . . . . 5.7Real Estate. . . . . . . . . . . . . . . . . . . . . . . . . . . . . . . . . . . . . . . . . . . . . . . . . 2.9Utilities . . . . . . . . . . . . . . . . . . . . . . . . . . . . . . . . . . . . . . . . . . . . . . . . . . . . . 2.7Materials . . . . . . . . . . . . . . . . . . . . . . . . . . . . . . . . . . . . . . . . . . . . . . . . . . . 2.6Energy . . . . . . . . . . . . . . . . . . . . . . . . . . . . . . . . . . . . . . . . . . . . . . . . . . . . . 2.4
TEN LARGEST HOLDINGS
SecurityPercent of
Total Investments(a)
AT&T Inc. . . . . . . . . . . . . . . . . . . . . . . . . . . . . . . . . . . . . . . . . . . . . . . . . . . 7.1%Intel Corp. . . . . . . . . . . . . . . . . . . . . . . . . . . . . . . . . . . . . . . . . . . . . . . . . . 6.2General Motors Co. . . . . . . . . . . . . . . . . . . . . . . . . . . . . . . . . . . . . . . . . 3.2Micron Technology Inc. . . . . . . . . . . . . . . . . . . . . . . . . . . . . . . . . . . . . . 3.2Cisco Systems Inc. . . . . . . . . . . . . . . . . . . . . . . . . . . . . . . . . . . . . . . . . . 3.1International Business Machines Corp. . . . . . . . . . . . . . . . . . . . . . . 2.8Target Corp. . . . . . . . . . . . . . . . . . . . . . . . . . . . . . . . . . . . . . . . . . . . . . . . 2.4Citigroup Inc. . . . . . . . . . . . . . . . . . . . . . . . . . . . . . . . . . . . . . . . . . . . . . . 2.3Ford Motor Co. . . . . . . . . . . . . . . . . . . . . . . . . . . . . . . . . . . . . . . . . . . . . . 2.2Pfizer Inc. . . . . . . . . . . . . . . . . . . . . . . . . . . . . . . . . . . . . . . . . . . . . . . . . . . 2.2
(a) Excludes money market funds.
Fund Summary as of July 31, 2021 (continued) iShares� MSCI USA Value Factor ETF
20 2 0 2 1 I S H A R E S A N N U A L R E P O R T T O S H A R E H O L D E R S

Past performance is not an indication of future results. Financial markets have experienced extreme volatility and trading in many instruments has been disrupted. Thesecircumstances may continue for an extended period of time and may continue to affect adversely the value and liquidity of the fund's investments. As a result, currentperformance may be lower or higher than the performance data quoted. Performance data current to the most recent month-end is available at iShares.com. Performanceresults assume reinvestment of all dividends and capital gain distributions and do not reflect the deduction of taxes that a shareholder would pay on fund distributions oron the redemption or sale of fund shares. The investment return and principal value of shares will vary with changes in market conditions. Shares may be worth more orless than their original cost when they are redeemed or sold in the market. Performance for certain funds may reflect a waiver of a portion of investment advisory fees.Without such a waiver, performance would have been lower.
Net asset value or “NAV” is the value of one share of a fund as calculated in accordance with the standard formula for valuing mutual fund shares. Beginning August 10,2020, the price used to calculate market return ("Market Price") is the closing price. Prior to August 10, 2020, Market Price was determined by using the midpoint betweenthe highest bid and the lowest ask on the primary stock exchange on which shares of a fund are listed for trading, as of the time that such fund’s NAV is calculated. Sinceshares of a fund may not trade in the secondary market until after the fund’s inception, for the period from inception to the first day of secondary market trading in sharesof the fund, the NAV of the fund is used as a proxy for the Market Price to calculate market returns. Market and NAV returns assume that dividends and capital gaindistributions have been reinvested at Market Price and NAV, respectively.
An index is a statistical composite that tracks a specified financial market or sector. Unlike a fund, an index does not actually hold a portfolio of securities and therefore doesnot incur the expenses incurred by a fund. These expenses negatively impact fund performance. Also, market returns do not include brokerage commissions that may bepayable on secondary market transactions. If brokerage commissions were included, market returns would be lower.
Shareholder Expenses
As a shareholder of your Fund, you incur two types of costs: (1) transaction costs, including brokerage commissions on purchases and sales of fund shares and (2) ongoingcosts, including management fees and other fund expenses. The expense example, which is based on an investment of $1,000 invested at the beginning of the period (orfrom the commencement of operations if less than 6 months) and held through the end of the period, is intended to help you understand your ongoing costs (in dollars andcents) of investing in your Fund and to compare these costs with the ongoing costs of investing in other funds.
Actual Expenses – The table provides information about actual account values and actual expenses. Annualized expense ratios reflect contractual and voluntary feewaivers, if any. To estimate the expenses that you paid on your account over the period, simply divide your account value by $1,000 (for example, an $8,600 account valuedivided by $1,000 = 8.6), then multiply the result by the number under the heading entitled “Expenses Paid During the Period.”
Hypothetical Example for Comparison Purposes – The table also provides information about hypothetical account values and hypothetical expenses based on yourFund’s actual expense ratio and an assumed rate of return of 5% per year before expenses. You may use this information to compare the ongoing costs of investing in yourFund and other funds. To do so, compare this 5% hypothetical example with the 5% hypothetical examples that appear in the shareholder reports of the other funds.
Please note that the expenses shown in the table are meant to highlight your ongoing costs only and do not reflect any transactional costs, such as brokerage commissionsand other fees paid on purchases and sales of fund shares. Therefore, the hypothetical examples are useful in comparing ongoing costs only and will not help you determinethe relative total costs of owning different funds. In addition, if these transactional costs were included, your costs would have been higher.
About Fund Performance
A B O U T F U N D P E R F O R M A N C E / S H A R E H O L D E R E X P E N S E S 21

Security s Value
Common StocksAustralia — 11.0%Afterpay Ltd.(a) . . . . . . . . . . . . . . . . . . . . . . . . . . . . . . . . . . . . . . . . . . . . 19,335 $ 1,374,377Australia & New Zealand Banking Group Ltd.. . . . . . . . . . . . . . . 379,036 7,716,633BHP Group Ltd. . . . . . . . . . . . . . . . . . . . . . . . . . . . . . . . . . . . . . . . . . . . 335,352 13,172,226BHP Group PLC . . . . . . . . . . . . . . . . . . . . . . . . . . . . . . . . . . . . . . . . . . 236,048 7,642,369BlueScope Steel Ltd. . . . . . . . . . . . . . . . . . . . . . . . . . . . . . . . . . . . . . . 67,190 1,191,502Commonwealth Bank of Australia . . . . . . . . . . . . . . . . . . . . . . . . . . 176,023 12,903,905Fortescue Metals Group Ltd. . . . . . . . . . . . . . . . . . . . . . . . . . . . . . . 153,193 2,799,235Glencore PLC . . . . . . . . . . . . . . . . . . . . . . . . . . . . . . . . . . . . . . . . . . . . 1,529,819 6,870,646James Hardie Industries PLC. . . . . . . . . . . . . . . . . . . . . . . . . . . . . . 42,713 1,441,074National Australia Bank Ltd. . . . . . . . . . . . . . . . . . . . . . . . . . . . . . . . 379,914 7,244,862REA Group Ltd. . . . . . . . . . . . . . . . . . . . . . . . . . . . . . . . . . . . . . . . . . . . 5,725 681,984Reece Ltd.. . . . . . . . . . . . . . . . . . . . . . . . . . . . . . . . . . . . . . . . . . . . . . . . 52,362 908,362Rio Tinto Ltd. . . . . . . . . . . . . . . . . . . . . . . . . . . . . . . . . . . . . . . . . . . . . . 34,319 3,363,604Rio Tinto PLC. . . . . . . . . . . . . . . . . . . . . . . . . . . . . . . . . . . . . . . . . . . . . 124,828 10,602,941Seek Ltd. . . . . . . . . . . . . . . . . . . . . . . . . . . . . . . . . . . . . . . . . . . . . . . . . . 37,644 814,313Tabcorp Holdings Ltd. . . . . . . . . . . . . . . . . . . . . . . . . . . . . . . . . . . . . . 232,231 847,668Washington H Soul Pattinson & Co. Ltd. . . . . . . . . . . . . . . . . . . . 8,572 206,379Wesfarmers Ltd. . . . . . . . . . . . . . . . . . . . . . . . . . . . . . . . . . . . . . . . . . . 96,129 4,334,134Westpac Banking Corp. . . . . . . . . . . . . . . . . . . . . . . . . . . . . . . . . . . . 388,781 6,983,457
91,099,671Austria — 0.4%Erste Group Bank AG . . . . . . . . . . . . . . . . . . . . . . . . . . . . . . . . . . . . . 29,612 1,147,482OMV AG . . . . . . . . . . . . . . . . . . . . . . . . . . . . . . . . . . . . . . . . . . . . . . . . . 21,164 1,142,724voestalpine AG . . . . . . . . . . . . . . . . . . . . . . . . . . . . . . . . . . . . . . . . . . . 13,887 612,634
2,902,840Belgium — 0.3%Ageas SA/NV. . . . . . . . . . . . . . . . . . . . . . . . . . . . . . . . . . . . . . . . . . . . . 16,168 853,762Sofina SA . . . . . . . . . . . . . . . . . . . . . . . . . . . . . . . . . . . . . . . . . . . . . . . . 1,847 866,028Solvay SA . . . . . . . . . . . . . . . . . . . . . . . . . . . . . . . . . . . . . . . . . . . . . . . . 7,471 997,801
2,717,591Canada — 12.8%Bank of Montreal. . . . . . . . . . . . . . . . . . . . . . . . . . . . . . . . . . . . . . . . . . 89,768 8,888,298Bank of Nova Scotia (The). . . . . . . . . . . . . . . . . . . . . . . . . . . . . . . . . 156,480 9,766,830Bausch Health Cos Inc.(a) . . . . . . . . . . . . . . . . . . . . . . . . . . . . . . . . . 30,312 886,813BlackBerry Ltd.(a) . . . . . . . . . . . . . . . . . . . . . . . . . . . . . . . . . . . . . . . . . 50,066 509,649CAE Inc.(a). . . . . . . . . . . . . . . . . . . . . . . . . . . . . . . . . . . . . . . . . . . . . . . . 27,624 842,935Cameco Corp. . . . . . . . . . . . . . . . . . . . . . . . . . . . . . . . . . . . . . . . . . . . . 41,336 735,208Canadian Imperial Bank of Commerce . . . . . . . . . . . . . . . . . . . . . 50,566 5,879,777Canadian Natural Resources Ltd. . . . . . . . . . . . . . . . . . . . . . . . . . . 106,866 3,526,509Canadian Pacific Railway Ltd. . . . . . . . . . . . . . . . . . . . . . . . . . . . . . 50,099 3,720,080Canadian Tire Corp. Ltd., Class A, NVS . . . . . . . . . . . . . . . . . . . . 6,681 1,027,854CCL Industries Inc., Class B, NVS . . . . . . . . . . . . . . . . . . . . . . . . . 15,976 916,225Cenovus Energy Inc. . . . . . . . . . . . . . . . . . . . . . . . . . . . . . . . . . . . . . . 150,793 1,258,220CGI Inc.(a) . . . . . . . . . . . . . . . . . . . . . . . . . . . . . . . . . . . . . . . . . . . . . . . . 20,037 1,822,699Constellation Software Inc. . . . . . . . . . . . . . . . . . . . . . . . . . . . . . . . . 1,752 2,806,388Fairfax Financial Holdings Ltd. . . . . . . . . . . . . . . . . . . . . . . . . . . . . . 3,741 1,575,862First Quantum Minerals Ltd. . . . . . . . . . . . . . . . . . . . . . . . . . . . . . . . 77,976 1,670,021FirstService Corp.. . . . . . . . . . . . . . . . . . . . . . . . . . . . . . . . . . . . . . . . . 2,616 487,260GFL Environmental Inc. . . . . . . . . . . . . . . . . . . . . . . . . . . . . . . . . . . . 18,098 630,442Gildan Activewear Inc. . . . . . . . . . . . . . . . . . . . . . . . . . . . . . . . . . . . . 21,047 725,578Great-West Lifeco Inc. . . . . . . . . . . . . . . . . . . . . . . . . . . . . . . . . . . . . 30,749 925,230iA Financial Corp. Inc. . . . . . . . . . . . . . . . . . . . . . . . . . . . . . . . . . . . . . 11,202 619,720IGM Financial Inc.. . . . . . . . . . . . . . . . . . . . . . . . . . . . . . . . . . . . . . . . . 10,276 362,658Imperial Oil Ltd. . . . . . . . . . . . . . . . . . . . . . . . . . . . . . . . . . . . . . . . . . . . 34,150 935,594Intact Financial Corp. . . . . . . . . . . . . . . . . . . . . . . . . . . . . . . . . . . . . . 9,392 1,279,769Ivanhoe Mines Ltd., Class A(a) . . . . . . . . . . . . . . . . . . . . . . . . . . . . . 83,938 623,009Lightspeed POS Inc.(a) . . . . . . . . . . . . . . . . . . . . . . . . . . . . . . . . . . . . 23,590 2,019,974Lundin Mining Corp.. . . . . . . . . . . . . . . . . . . . . . . . . . . . . . . . . . . . . . . 90,751 827,059
Security s Value
Canada (continued)Magna International Inc.. . . . . . . . . . . . . . . . . . . . . . . . . . . . . . . . . . . 40,439 $ 3,390,445Manulife Financial Corp.. . . . . . . . . . . . . . . . . . . . . . . . . . . . . . . . . . . 203,562 3,935,489National Bank of Canada . . . . . . . . . . . . . . . . . . . . . . . . . . . . . . . . . . 38,134 2,918,737Power Corp. of Canada . . . . . . . . . . . . . . . . . . . . . . . . . . . . . . . . . . . 65,657 2,095,593RioCan REIT . . . . . . . . . . . . . . . . . . . . . . . . . . . . . . . . . . . . . . . . . . . . . 14,827 268,469Royal Bank of Canada . . . . . . . . . . . . . . . . . . . . . . . . . . . . . . . . . . . . 151,461 15,318,491Shaw Communications Inc., Class B, NVS . . . . . . . . . . . . . . . . . 59,574 1,740,042Teck Resources Ltd., Class B. . . . . . . . . . . . . . . . . . . . . . . . . . . . . . 47,291 1,079,551Toromont Industries Ltd.. . . . . . . . . . . . . . . . . . . . . . . . . . . . . . . . . . . 6,875 580,980Toronto-Dominion Bank (The) . . . . . . . . . . . . . . . . . . . . . . . . . . . . . 260,092 17,292,908West Fraser Timber Co. Ltd.. . . . . . . . . . . . . . . . . . . . . . . . . . . . . . . 8,689 623,260WSP Global Inc. . . . . . . . . . . . . . . . . . . . . . . . . . . . . . . . . . . . . . . . . . . 13,434 1,594,615
106,108,241Denmark — 2.4%Ambu A/S, Class B. . . . . . . . . . . . . . . . . . . . . . . . . . . . . . . . . . . . . . . . 14,903 551,361AP Moller - Maersk A/S, Class A . . . . . . . . . . . . . . . . . . . . . . . . . . . 460 1,229,766AP Moller - Maersk A/S, Class B, NVS . . . . . . . . . . . . . . . . . . . . . 833 2,311,760Carlsberg A/S, Class B . . . . . . . . . . . . . . . . . . . . . . . . . . . . . . . . . . . . 9,996 1,847,115Demant A/S(a) . . . . . . . . . . . . . . . . . . . . . . . . . . . . . . . . . . . . . . . . . . . . 14,041 858,151DSV Panalpina A/S . . . . . . . . . . . . . . . . . . . . . . . . . . . . . . . . . . . . . . . 26,540 6,469,519GN Store Nord A/S. . . . . . . . . . . . . . . . . . . . . . . . . . . . . . . . . . . . . . . . 10,191 893,072Pandora A/S . . . . . . . . . . . . . . . . . . . . . . . . . . . . . . . . . . . . . . . . . . . . . . 11,133 1,440,131Rockwool International A/S, Class B . . . . . . . . . . . . . . . . . . . . . . . 599 317,845Vestas Wind Systems A/S . . . . . . . . . . . . . . . . . . . . . . . . . . . . . . . . . 98,445 3,630,114
19,548,834Finland — 0.2%Kesko OYJ, Class B . . . . . . . . . . . . . . . . . . . . . . . . . . . . . . . . . . . . . . 21,499 921,489Wartsila OYJ Abp . . . . . . . . . . . . . . . . . . . . . . . . . . . . . . . . . . . . . . . . . 48,626 732,526
1,654,015France — 13.4%Airbus SE(a) . . . . . . . . . . . . . . . . . . . . . . . . . . . . . . . . . . . . . . . . . . . . . . 52,320 7,176,663Alstom SA(a) . . . . . . . . . . . . . . . . . . . . . . . . . . . . . . . . . . . . . . . . . . . . . . 22,053 914,678AXA SA . . . . . . . . . . . . . . . . . . . . . . . . . . . . . . . . . . . . . . . . . . . . . . . . . . 238,911 6,187,084BNP Paribas SA . . . . . . . . . . . . . . . . . . . . . . . . . . . . . . . . . . . . . . . . . . 146,079 8,907,771Bollore SA . . . . . . . . . . . . . . . . . . . . . . . . . . . . . . . . . . . . . . . . . . . . . . . . 100,701 562,750Bureau Veritas SA . . . . . . . . . . . . . . . . . . . . . . . . . . . . . . . . . . . . . . . . 26,718 882,328Capgemini SE . . . . . . . . . . . . . . . . . . . . . . . . . . . . . . . . . . . . . . . . . . . . 18,952 4,096,525Cie. de Saint-Gobain . . . . . . . . . . . . . . . . . . . . . . . . . . . . . . . . . . . . . . 67,375 4,815,847Credit Agricole SA . . . . . . . . . . . . . . . . . . . . . . . . . . . . . . . . . . . . . . . . 164,852 2,298,616Dassault Systemes SE . . . . . . . . . . . . . . . . . . . . . . . . . . . . . . . . . . . . 62,662 3,456,574Electricite de France SA. . . . . . . . . . . . . . . . . . . . . . . . . . . . . . . . . . . 30,816 374,092Eurazeo SE . . . . . . . . . . . . . . . . . . . . . . . . . . . . . . . . . . . . . . . . . . . . . . 5,721 554,144Eurofins Scientific SE . . . . . . . . . . . . . . . . . . . . . . . . . . . . . . . . . . . . . 9,643 1,153,421Hermes International . . . . . . . . . . . . . . . . . . . . . . . . . . . . . . . . . . . . . . 3,754 5,739,025Kering SA . . . . . . . . . . . . . . . . . . . . . . . . . . . . . . . . . . . . . . . . . . . . . . . . 5,421 4,863,389La Francaise des Jeux SAEM(b) . . . . . . . . . . . . . . . . . . . . . . . . . . . 7,859 420,156LVMH Moet Hennessy Louis Vuitton SE. . . . . . . . . . . . . . . . . . . . 43,546 34,865,845Publicis Groupe SA . . . . . . . . . . . . . . . . . . . . . . . . . . . . . . . . . . . . . . . 32,898 2,076,871Remy Cointreau SA . . . . . . . . . . . . . . . . . . . . . . . . . . . . . . . . . . . . . . . 1,722 378,273Renault SA(a) . . . . . . . . . . . . . . . . . . . . . . . . . . . . . . . . . . . . . . . . . . . . . 17,947 681,638Sartorius Stedim Biotech . . . . . . . . . . . . . . . . . . . . . . . . . . . . . . . . . . 2,102 1,199,913Schneider Electric SE . . . . . . . . . . . . . . . . . . . . . . . . . . . . . . . . . . . . . 49,332 8,262,534Societe Generale SA. . . . . . . . . . . . . . . . . . . . . . . . . . . . . . . . . . . . . . 106,144 3,108,501Suez SA. . . . . . . . . . . . . . . . . . . . . . . . . . . . . . . . . . . . . . . . . . . . . . . . . . 34,999 816,408Teleperformance . . . . . . . . . . . . . . . . . . . . . . . . . . . . . . . . . . . . . . . . . . 4,814 2,030,529Thales SA . . . . . . . . . . . . . . . . . . . . . . . . . . . . . . . . . . . . . . . . . . . . . . . . 10,180 1,068,439Veolia Environnement SA . . . . . . . . . . . . . . . . . . . . . . . . . . . . . . . . . 67,925 2,227,765Vivendi SE . . . . . . . . . . . . . . . . . . . . . . . . . . . . . . . . . . . . . . . . . . . . . . . 59,003 1,993,501
Schedule of InvestmentsJuly 31, 2021
iShares� MSCI Intl Momentum Factor ETF(Percentages shown are based on Net Assets)
22 2 0 2 1 I S H A R E S A N N U A L R E P O R T T O S H A R E H O L D E R S

Security s Value
France (continued)Wendel SE . . . . . . . . . . . . . . . . . . . . . . . . . . . . . . . . . . . . . . . . . . . . . . . 2,773 $ 389,232
111,502,512Germany — 7.6%BASF SE . . . . . . . . . . . . . . . . . . . . . . . . . . . . . . . . . . . . . . . . . . . . . . . . . 83,706 6,577,485Bayerische Motoren Werke AG . . . . . . . . . . . . . . . . . . . . . . . . . . . . 32,236 3,205,266Brenntag SE. . . . . . . . . . . . . . . . . . . . . . . . . . . . . . . . . . . . . . . . . . . . . . 18,340 1,831,787Carl Zeiss Meditec AG, Bearer. . . . . . . . . . . . . . . . . . . . . . . . . . . . . 3,662 815,574Covestro AG(b) . . . . . . . . . . . . . . . . . . . . . . . . . . . . . . . . . . . . . . . . . . . . 17,475 1,125,760Daimler AG, Registered . . . . . . . . . . . . . . . . . . . . . . . . . . . . . . . . . . . 118,657 10,588,882Delivery Hero SE(a)(b) . . . . . . . . . . . . . . . . . . . . . . . . . . . . . . . . . . . . . 12,018 1,796,601Deutsche Bank AG, Registered(a) . . . . . . . . . . . . . . . . . . . . . . . . . . 173,527 2,187,526Deutsche Post AG, Registered . . . . . . . . . . . . . . . . . . . . . . . . . . . . 111,623 7,564,821Evonik Industries AG . . . . . . . . . . . . . . . . . . . . . . . . . . . . . . . . . . . . . . 18,892 656,877GEA Group AG . . . . . . . . . . . . . . . . . . . . . . . . . . . . . . . . . . . . . . . . . . . 12,944 573,941HeidelbergCement AG . . . . . . . . . . . . . . . . . . . . . . . . . . . . . . . . . . . . 16,244 1,439,506HelloFresh SE(a) . . . . . . . . . . . . . . . . . . . . . . . . . . . . . . . . . . . . . . . . . . 13,739 1,287,885Infineon Technologies AG . . . . . . . . . . . . . . . . . . . . . . . . . . . . . . . . . 119,434 4,564,066KION Group AG . . . . . . . . . . . . . . . . . . . . . . . . . . . . . . . . . . . . . . . . . . 5,521 586,297Merck KGaA. . . . . . . . . . . . . . . . . . . . . . . . . . . . . . . . . . . . . . . . . . . . . . 8,897 1,821,251Siemens AG, Registered . . . . . . . . . . . . . . . . . . . . . . . . . . . . . . . . . . 92,369 14,412,613Volkswagen AG . . . . . . . . . . . . . . . . . . . . . . . . . . . . . . . . . . . . . . . . . . . 5,513 1,829,688Zalando SE(a)(b) . . . . . . . . . . . . . . . . . . . . . . . . . . . . . . . . . . . . . . . . . . . 2,063 229,225
63,095,051Hong Kong — 3.7%AIA Group Ltd. . . . . . . . . . . . . . . . . . . . . . . . . . . . . . . . . . . . . . . . . . . . . 1,097,400 13,131,226ESR Cayman Ltd.(a)(b). . . . . . . . . . . . . . . . . . . . . . . . . . . . . . . . . . . . . 154,000 541,282Futu Holdings Ltd., ADR(a). . . . . . . . . . . . . . . . . . . . . . . . . . . . . . . . . 13,388 1,371,734Hong Kong Exchanges & Clearing Ltd.. . . . . . . . . . . . . . . . . . . . . 128,400 8,206,003Jardine Matheson Holdings Ltd. . . . . . . . . . . . . . . . . . . . . . . . . . . . 27,900 1,659,928Swire Pacific Ltd., Class A. . . . . . . . . . . . . . . . . . . . . . . . . . . . . . . . . 66,000 409,981Techtronic Industries Co. Ltd. . . . . . . . . . . . . . . . . . . . . . . . . . . . . . . 173,500 3,093,901Wharf Real Estate Investment Co. Ltd. . . . . . . . . . . . . . . . . . . . . . 162,000 914,956Xinyi Glass Holdings Ltd. . . . . . . . . . . . . . . . . . . . . . . . . . . . . . . . . . . 404,000 1,509,894
30,838,905Ireland — 0.1%Smurfit Kappa Group PLC. . . . . . . . . . . . . . . . . . . . . . . . . . . . . . . . . 20,089 1,133,300
Israel — 0.5%Bank Leumi Le-Israel BM(a). . . . . . . . . . . . . . . . . . . . . . . . . . . . . . . . 157,859 1,206,230ICL Group Ltd. . . . . . . . . . . . . . . . . . . . . . . . . . . . . . . . . . . . . . . . . . . . . 92,940 677,262Israel Discount Bank Ltd., Class A(a) . . . . . . . . . . . . . . . . . . . . . . . 129,697 607,566Mizrahi Tefahot Bank Ltd.(a) . . . . . . . . . . . . . . . . . . . . . . . . . . . . . . . 13,255 401,701Wix.com Ltd.(a) . . . . . . . . . . . . . . . . . . . . . . . . . . . . . . . . . . . . . . . . . . . 5,062 1,511,716
4,404,475Italy — 2.0%Assicurazioni Generali SpA. . . . . . . . . . . . . . . . . . . . . . . . . . . . . . . . 111,664 2,226,372CNH Industrial NV . . . . . . . . . . . . . . . . . . . . . . . . . . . . . . . . . . . . . . . . 158,435 2,645,478Eni SpA . . . . . . . . . . . . . . . . . . . . . . . . . . . . . . . . . . . . . . . . . . . . . . . . . . 241,493 2,855,803Intesa Sanpaolo SpA. . . . . . . . . . . . . . . . . . . . . . . . . . . . . . . . . . . . . . 1,973,586 5,452,122Mediobanca Banca di Credito Finanziario SpA(a) . . . . . . . . . . . 64,878 759,359Moncler SpA. . . . . . . . . . . . . . . . . . . . . . . . . . . . . . . . . . . . . . . . . . . . . . 20,159 1,384,574Poste Italiane SpA(b) . . . . . . . . . . . . . . . . . . . . . . . . . . . . . . . . . . . . . . 54,914 726,648Tenaris SA. . . . . . . . . . . . . . . . . . . . . . . . . . . . . . . . . . . . . . . . . . . . . . . . 67,999 692,838
16,743,194Japan — 14.6%Advantest Corp. . . . . . . . . . . . . . . . . . . . . . . . . . . . . . . . . . . . . . . . . . . 20,800 1,836,244AGC Inc. . . . . . . . . . . . . . . . . . . . . . . . . . . . . . . . . . . . . . . . . . . . . . . . . . 24,600 1,051,973Capcom Co. Ltd. . . . . . . . . . . . . . . . . . . . . . . . . . . . . . . . . . . . . . . . . . . 15,900 437,184CyberAgent Inc. . . . . . . . . . . . . . . . . . . . . . . . . . . . . . . . . . . . . . . . . . . 37,100 667,742
Security s Value
Japan (continued)Daikin Industries Ltd. . . . . . . . . . . . . . . . . . . . . . . . . . . . . . . . . . . . . . . 16,900 $ 3,529,272Daiwa Securities Group Inc. . . . . . . . . . . . . . . . . . . . . . . . . . . . . . . . 134,900 709,350Denso Corp. . . . . . . . . . . . . . . . . . . . . . . . . . . . . . . . . . . . . . . . . . . . . . . 50,000 3,435,057Fast Retailing Co. Ltd.. . . . . . . . . . . . . . . . . . . . . . . . . . . . . . . . . . . . . 4,600 3,119,733Fuji Electric Co. Ltd.. . . . . . . . . . . . . . . . . . . . . . . . . . . . . . . . . . . . . . . 15,300 669,579FUJIFILM Holdings Corp. . . . . . . . . . . . . . . . . . . . . . . . . . . . . . . . . . 33,800 2,425,583Fujitsu Ltd. . . . . . . . . . . . . . . . . . . . . . . . . . . . . . . . . . . . . . . . . . . . . . . . 23,000 3,912,999Hamamatsu Photonics KK. . . . . . . . . . . . . . . . . . . . . . . . . . . . . . . . . 8,500 472,605Hitachi Ltd. . . . . . . . . . . . . . . . . . . . . . . . . . . . . . . . . . . . . . . . . . . . . . . . 104,300 5,999,250Hitachi Metals Ltd.(a) . . . . . . . . . . . . . . . . . . . . . . . . . . . . . . . . . . . . . . 26,800 523,378Ibiden Co. Ltd. . . . . . . . . . . . . . . . . . . . . . . . . . . . . . . . . . . . . . . . . . . . . 7,100 376,124Iida Group Holdings Co. Ltd.. . . . . . . . . . . . . . . . . . . . . . . . . . . . . . . 16,300 393,330Itochu Corp. . . . . . . . . . . . . . . . . . . . . . . . . . . . . . . . . . . . . . . . . . . . . . . 142,600 4,220,851Japan Metropolitan Fund Invest. . . . . . . . . . . . . . . . . . . . . . . . . . . . 640 670,423JFE Holdings Inc. . . . . . . . . . . . . . . . . . . . . . . . . . . . . . . . . . . . . . . . . . 80,700 981,292JSR Corp. . . . . . . . . . . . . . . . . . . . . . . . . . . . . . . . . . . . . . . . . . . . . . . . . 21,500 720,680Koei Tecmo Holdings Co. Ltd. . . . . . . . . . . . . . . . . . . . . . . . . . . . . . 6,620 311,030Konami Holdings Corp.. . . . . . . . . . . . . . . . . . . . . . . . . . . . . . . . . . . . 11,600 642,472Kubota Corp. . . . . . . . . . . . . . . . . . . . . . . . . . . . . . . . . . . . . . . . . . . . . . 130,700 2,733,128Kurita Water Industries Ltd. . . . . . . . . . . . . . . . . . . . . . . . . . . . . . . . . 12,600 611,964Lasertec Corp. . . . . . . . . . . . . . . . . . . . . . . . . . . . . . . . . . . . . . . . . . . . . 12,500 2,346,645Lixil Corp. . . . . . . . . . . . . . . . . . . . . . . . . . . . . . . . . . . . . . . . . . . . . . . . . 25,900 706,813M3 Inc. . . . . . . . . . . . . . . . . . . . . . . . . . . . . . . . . . . . . . . . . . . . . . . . . . . . 28,900 1,890,253Marubeni Corp. . . . . . . . . . . . . . . . . . . . . . . . . . . . . . . . . . . . . . . . . . . . 223,700 1,904,002Mercari Inc.(a) . . . . . . . . . . . . . . . . . . . . . . . . . . . . . . . . . . . . . . . . . . . . . 9,000 471,067Mitsubishi Gas Chemical Co. Inc. . . . . . . . . . . . . . . . . . . . . . . . . . . 15,800 329,128Mitsubishi UFJ Financial Group Inc.. . . . . . . . . . . . . . . . . . . . . . . . 1,123,700 5,936,144Mitsui & Co. Ltd. . . . . . . . . . . . . . . . . . . . . . . . . . . . . . . . . . . . . . . . . . . 174,800 4,012,081NEC Corp.. . . . . . . . . . . . . . . . . . . . . . . . . . . . . . . . . . . . . . . . . . . . . . . . 17,100 867,261Nexon Co. Ltd.. . . . . . . . . . . . . . . . . . . . . . . . . . . . . . . . . . . . . . . . . . . . 38,700 796,295Nidec Corp.. . . . . . . . . . . . . . . . . . . . . . . . . . . . . . . . . . . . . . . . . . . . . . . 41,200 4,624,432Nippon Express Co. Ltd. . . . . . . . . . . . . . . . . . . . . . . . . . . . . . . . . . . 7,500 547,873Nippon Steel Corp.. . . . . . . . . . . . . . . . . . . . . . . . . . . . . . . . . . . . . . . . 144,900 2,513,623Nippon Yusen KK . . . . . . . . . . . . . . . . . . . . . . . . . . . . . . . . . . . . . . . . . 42,000 2,269,344Nissan Motor Co. Ltd.(a) . . . . . . . . . . . . . . . . . . . . . . . . . . . . . . . . . . . 223,200 1,295,416Nitto Denko Corp. . . . . . . . . . . . . . . . . . . . . . . . . . . . . . . . . . . . . . . . . . 13,600 1,010,459Nomura Real Estate Holdings Inc. . . . . . . . . . . . . . . . . . . . . . . . . . 11,100 275,241NTT Data Corp. . . . . . . . . . . . . . . . . . . . . . . . . . . . . . . . . . . . . . . . . . . . 62,700 971,194Oji Holdings Corp. . . . . . . . . . . . . . . . . . . . . . . . . . . . . . . . . . . . . . . . . 78,000 449,708Panasonic Corp. . . . . . . . . . . . . . . . . . . . . . . . . . . . . . . . . . . . . . . . . . . 178,700 2,157,814Pola Orbis Holdings Inc.. . . . . . . . . . . . . . . . . . . . . . . . . . . . . . . . . . . 7,500 179,283Renesas Electronics Corp.(a) . . . . . . . . . . . . . . . . . . . . . . . . . . . . . . 77,000 835,730Ricoh Co. Ltd. . . . . . . . . . . . . . . . . . . . . . . . . . . . . . . . . . . . . . . . . . . . . 80,400 878,518Seiko Epson Corp. . . . . . . . . . . . . . . . . . . . . . . . . . . . . . . . . . . . . . . . . 26,400 454,236Seven & i Holdings Co. Ltd. . . . . . . . . . . . . . . . . . . . . . . . . . . . . . . . 89,600 3,997,988Shimadzu Corp. . . . . . . . . . . . . . . . . . . . . . . . . . . . . . . . . . . . . . . . . . . 16,300 657,387Shin-Etsu Chemical Co. Ltd.. . . . . . . . . . . . . . . . . . . . . . . . . . . . . . . 28,000 4,567,616SoftBank Group Corp.. . . . . . . . . . . . . . . . . . . . . . . . . . . . . . . . . . . . . 114,100 7,175,250Sony Group Corp.. . . . . . . . . . . . . . . . . . . . . . . . . . . . . . . . . . . . . . . . . 94,400 9,861,635SUMCO Corp. . . . . . . . . . . . . . . . . . . . . . . . . . . . . . . . . . . . . . . . . . . . . 28,600 661,470Sumitomo Chemical Co. Ltd. . . . . . . . . . . . . . . . . . . . . . . . . . . . . . . 191,000 994,253Sumitomo Electric Industries Ltd. . . . . . . . . . . . . . . . . . . . . . . . . . . 71,300 1,012,939Sumitomo Metal Mining Co. Ltd. . . . . . . . . . . . . . . . . . . . . . . . . . . . 22,000 891,602Tokyo Electron Ltd.. . . . . . . . . . . . . . . . . . . . . . . . . . . . . . . . . . . . . . . . 20,800 8,578,449Toshiba Corp.. . . . . . . . . . . . . . . . . . . . . . . . . . . . . . . . . . . . . . . . . . . . . 49,200 2,117,640Toyota Tsusho Corp. . . . . . . . . . . . . . . . . . . . . . . . . . . . . . . . . . . . . . . 22,400 1,057,613Yamaha Motor Co. Ltd.. . . . . . . . . . . . . . . . . . . . . . . . . . . . . . . . . . . . 39,900 999,123ZOZO Inc. . . . . . . . . . . . . . . . . . . . . . . . . . . . . . . . . . . . . . . . . . . . . . . . . 11,500 391,675
121,138,443
Schedule of Investments (continued)
July 31, 2021
iShares� MSCI Intl Momentum Factor ETF(Percentages shown are based on Net Assets)
S C H E D U L E O F I N V E S T M E N T S 23

Security s Value
Netherlands — 9.3%Adyen NV(a)(b) . . . . . . . . . . . . . . . . . . . . . . . . . . . . . . . . . . . . . . . . . . . . 2,454 $ 6,650,460Aegon NV . . . . . . . . . . . . . . . . . . . . . . . . . . . . . . . . . . . . . . . . . . . . . . . . 177,981 757,772ArcelorMittal SA . . . . . . . . . . . . . . . . . . . . . . . . . . . . . . . . . . . . . . . . . . 111,424 3,891,530ASM International NV . . . . . . . . . . . . . . . . . . . . . . . . . . . . . . . . . . . . . 8,632 3,063,583ASML Holding NV. . . . . . . . . . . . . . . . . . . . . . . . . . . . . . . . . . . . . . . . . 64,621 49,395,243ING Groep NV . . . . . . . . . . . . . . . . . . . . . . . . . . . . . . . . . . . . . . . . . . . . 524,406 6,728,492NN Group NV. . . . . . . . . . . . . . . . . . . . . . . . . . . . . . . . . . . . . . . . . . . . . 27,662 1,375,254Randstad NV . . . . . . . . . . . . . . . . . . . . . . . . . . . . . . . . . . . . . . . . . . . . . 11,756 852,905Stellantis NV. . . . . . . . . . . . . . . . . . . . . . . . . . . . . . . . . . . . . . . . . . . . . . 255,438 4,898,410
77,613,649New Zealand — 0.0%Mercury NZ Ltd. . . . . . . . . . . . . . . . . . . . . . . . . . . . . . . . . . . . . . . . . . . 62,808 288,983
Norway — 0.5%Adevinta ASA(a) . . . . . . . . . . . . . . . . . . . . . . . . . . . . . . . . . . . . . . . . . . . 18,607 357,764DNB Bank ASA . . . . . . . . . . . . . . . . . . . . . . . . . . . . . . . . . . . . . . . . . . . 86,802 1,778,828Norsk Hydro ASA . . . . . . . . . . . . . . . . . . . . . . . . . . . . . . . . . . . . . . . . . 250,797 1,668,551Schibsted ASA, Class A . . . . . . . . . . . . . . . . . . . . . . . . . . . . . . . . . . . 5,365 284,364
4,089,507Portugal — 0.1%EDP Renovaveis SA . . . . . . . . . . . . . . . . . . . . . . . . . . . . . . . . . . . . . . 25,997 610,611
Singapore — 1.7%CapitaLand Ltd.. . . . . . . . . . . . . . . . . . . . . . . . . . . . . . . . . . . . . . . . . . . 248,500 738,285DBS Group Holdings Ltd.. . . . . . . . . . . . . . . . . . . . . . . . . . . . . . . . . . 236,300 5,287,530Oversea-Chinese Banking Corp. Ltd. . . . . . . . . . . . . . . . . . . . . . . 445,200 4,027,828Sea Ltd., ADR(a) . . . . . . . . . . . . . . . . . . . . . . . . . . . . . . . . . . . . . . . . . . 2,373 655,328Singapore Airlines Ltd.(a) . . . . . . . . . . . . . . . . . . . . . . . . . . . . . . . . . . 135,200 506,867United Overseas Bank Ltd. . . . . . . . . . . . . . . . . . . . . . . . . . . . . . . . . 131,800 2,548,166Wilmar International Ltd. . . . . . . . . . . . . . . . . . . . . . . . . . . . . . . . . . . 182,100 583,185
14,347,189Spain — 2.1%Banco Bilbao Vizcaya Argentaria SA . . . . . . . . . . . . . . . . . . . . . . . 820,616 5,253,155Banco Santander SA. . . . . . . . . . . . . . . . . . . . . . . . . . . . . . . . . . . . . . 2,252,836 8,252,482CaixaBank SA . . . . . . . . . . . . . . . . . . . . . . . . . . . . . . . . . . . . . . . . . . . . 513,759 1,525,817Repsol SA . . . . . . . . . . . . . . . . . . . . . . . . . . . . . . . . . . . . . . . . . . . . . . . . 188,643 2,066,190Siemens Gamesa Renewable Energy SA(a) . . . . . . . . . . . . . . . . 22,362 623,651
17,721,295Sweden — 4.9%Alfa Laval AB . . . . . . . . . . . . . . . . . . . . . . . . . . . . . . . . . . . . . . . . . . . . . 38,324 1,600,445Atlas Copco AB, Class A . . . . . . . . . . . . . . . . . . . . . . . . . . . . . . . . . . 60,315 4,084,834Atlas Copco AB, Class B . . . . . . . . . . . . . . . . . . . . . . . . . . . . . . . . . . 31,061 1,766,077Electrolux AB, Series B. . . . . . . . . . . . . . . . . . . . . . . . . . . . . . . . . . . . 18,358 482,143Embracer Group AB(a). . . . . . . . . . . . . . . . . . . . . . . . . . . . . . . . . . . . . 28,837 746,344Epiroc AB, Class A . . . . . . . . . . . . . . . . . . . . . . . . . . . . . . . . . . . . . . . . 78,563 1,830,096Epiroc AB, Class B . . . . . . . . . . . . . . . . . . . . . . . . . . . . . . . . . . . . . . . . 38,332 770,146EQT AB . . . . . . . . . . . . . . . . . . . . . . . . . . . . . . . . . . . . . . . . . . . . . . . . . . 45,882 2,211,610Evolution AB(b) . . . . . . . . . . . . . . . . . . . . . . . . . . . . . . . . . . . . . . . . . . . . 41,992 7,306,617Hexagon AB, Class B . . . . . . . . . . . . . . . . . . . . . . . . . . . . . . . . . . . . . 162,430 2,688,801Husqvarna AB, Class B . . . . . . . . . . . . . . . . . . . . . . . . . . . . . . . . . . . 42,181 590,265Industrivarden AB, Class A . . . . . . . . . . . . . . . . . . . . . . . . . . . . . . . . 12,332 492,045Industrivarden AB, Class C . . . . . . . . . . . . . . . . . . . . . . . . . . . . . . . . 17,733 678,819Investment AB Latour, Class B. . . . . . . . . . . . . . . . . . . . . . . . . . . . . 15,021 587,050Investor AB, Class B . . . . . . . . . . . . . . . . . . . . . . . . . . . . . . . . . . . . . . 206,783 5,120,882Kinnevik AB, Class B. . . . . . . . . . . . . . . . . . . . . . . . . . . . . . . . . . . . . . 30,281 1,320,124Nibe Industrier AB, Class B . . . . . . . . . . . . . . . . . . . . . . . . . . . . . . . . 165,468 1,977,339Sandvik AB . . . . . . . . . . . . . . . . . . . . . . . . . . . . . . . . . . . . . . . . . . . . . . . 81,637 2,128,790Sinch AB.(a)(b). . . . . . . . . . . . . . . . . . . . . . . . . . . . . . . . . . . . . . . . . . . . . 51,980 1,048,214Svenska Cellulosa AB SCA, Class B . . . . . . . . . . . . . . . . . . . . . . . 44,049 819,318
Security s Value
Sweden (continued)Volvo AB, Class B. . . . . . . . . . . . . . . . . . . . . . . . . . . . . . . . . . . . . . . . . 103,053 $ 2,430,171
40,680,130Switzerland — 5.3%ABB Ltd., Registered. . . . . . . . . . . . . . . . . . . . . . . . . . . . . . . . . . . . . . 177,699 6,496,382Adecco Group AG, Registered. . . . . . . . . . . . . . . . . . . . . . . . . . . . . 13,377 801,097Cie. Financiere Richemont SA, Class A, Registered . . . . . . . . 73,407 9,393,834Geberit AG, Registered. . . . . . . . . . . . . . . . . . . . . . . . . . . . . . . . . . . . 2,930 2,405,758Holcim Ltd. . . . . . . . . . . . . . . . . . . . . . . . . . . . . . . . . . . . . . . . . . . . . . . . 52,745 3,091,972Kuehne + Nagel International AG, Registered . . . . . . . . . . . . . . 10,284 3,469,133Logitech International SA, Registered . . . . . . . . . . . . . . . . . . . . . . 20,856 2,291,436Partners Group Holding AG. . . . . . . . . . . . . . . . . . . . . . . . . . . . . . . . 3,372 5,760,603Siemens Energy AG(a) . . . . . . . . . . . . . . . . . . . . . . . . . . . . . . . . . . . . 45,359 1,233,984Sika AG, Registered . . . . . . . . . . . . . . . . . . . . . . . . . . . . . . . . . . . . . . 13,542 4,770,446Straumann Holding AG, Registered . . . . . . . . . . . . . . . . . . . . . . . . 986 1,828,062Swatch Group AG (The), Bearer . . . . . . . . . . . . . . . . . . . . . . . . . . . 2,983 995,078Swatch Group AG (The), Registered . . . . . . . . . . . . . . . . . . . . . . . 5,486 356,281Swiss Life Holding AG, Registered . . . . . . . . . . . . . . . . . . . . . . . . . 2,979 1,536,576
44,430,642United Kingdom — 5.6%3i Group PLC . . . . . . . . . . . . . . . . . . . . . . . . . . . . . . . . . . . . . . . . . . . . . 93,519 1,662,132Admiral Group PLC . . . . . . . . . . . . . . . . . . . . . . . . . . . . . . . . . . . . . . . 14,475 683,778Anglo American PLC . . . . . . . . . . . . . . . . . . . . . . . . . . . . . . . . . . . . . . 175,974 7,798,105Antofagasta PLC. . . . . . . . . . . . . . . . . . . . . . . . . . . . . . . . . . . . . . . . . . 70,307 1,459,801Ashtead Group PLC. . . . . . . . . . . . . . . . . . . . . . . . . . . . . . . . . . . . . . . 61,083 4,570,806Aviva PLC . . . . . . . . . . . . . . . . . . . . . . . . . . . . . . . . . . . . . . . . . . . . . . . . 435,650 2,339,719Barclays PLC . . . . . . . . . . . . . . . . . . . . . . . . . . . . . . . . . . . . . . . . . . . . . 1,815,411 4,391,624BT Group PLC(a) . . . . . . . . . . . . . . . . . . . . . . . . . . . . . . . . . . . . . . . . . . 934,013 2,249,790Burberry Group PLC . . . . . . . . . . . . . . . . . . . . . . . . . . . . . . . . . . . . . . 37,874 1,086,359Coca-Cola Europacific Partners PLC. . . . . . . . . . . . . . . . . . . . . . . 21,960 1,362,838Croda International PLC. . . . . . . . . . . . . . . . . . . . . . . . . . . . . . . . . . . 10,081 1,180,094Entain PLC(a) . . . . . . . . . . . . . . . . . . . . . . . . . . . . . . . . . . . . . . . . . . . . . 64,333 1,622,239Evraz PLC. . . . . . . . . . . . . . . . . . . . . . . . . . . . . . . . . . . . . . . . . . . . . . . . 79,971 683,262Ferguson PLC . . . . . . . . . . . . . . . . . . . . . . . . . . . . . . . . . . . . . . . . . . . . 16,088 2,255,362Johnson Matthey PLC. . . . . . . . . . . . . . . . . . . . . . . . . . . . . . . . . . . . . 21,630 894,061Kingfisher PLC. . . . . . . . . . . . . . . . . . . . . . . . . . . . . . . . . . . . . . . . . . . . 228,806 1,175,245Lloyds Banking Group PLC. . . . . . . . . . . . . . . . . . . . . . . . . . . . . . . . 6,699,580 4,235,923M&G PLC . . . . . . . . . . . . . . . . . . . . . . . . . . . . . . . . . . . . . . . . . . . . . . . . 256,862 804,297Natwest Group PLC. . . . . . . . . . . . . . . . . . . . . . . . . . . . . . . . . . . . . . . 497,332 1,395,870Pearson PLC . . . . . . . . . . . . . . . . . . . . . . . . . . . . . . . . . . . . . . . . . . . . . 105,320 1,269,155Schroders PLC . . . . . . . . . . . . . . . . . . . . . . . . . . . . . . . . . . . . . . . . . . . 11,665 592,397St. James's Place PLC . . . . . . . . . . . . . . . . . . . . . . . . . . . . . . . . . . . . 65,085 1,433,952WPP PLC . . . . . . . . . . . . . . . . . . . . . . . . . . . . . . . . . . . . . . . . . . . . . . . . 129,123 1,669,952
46,816,761
Total Common Stocks — 98.5%(Cost: $725,349,217) . . . . . . . . . . . . . . . . . . . . . . . . . . . . . . . . . . . . . . . . . . . . . . 819,485,839
Preferred StocksGermany — 1.2%Bayerische Motoren Werke AG, Preference Shares, NVS . . . 6,675 572,942Porsche Automobil Holding SE, Preference Shares, NVS . . . 22,191 2,401,757Sartorius AG, Preference Shares, NVS. . . . . . . . . . . . . . . . . . . . . 2,455 1,485,060Volkswagen AG, Preference Shares, NVS. . . . . . . . . . . . . . . . . . 22,241 5,417,251
9,877,010Italy — 0.0%Telecom Italia SpA/Milano, Preference Shares, NVS . . . . . . . . 553,761 258,179
Total Preferred Stocks — 1.2%(Cost: $10,037,565) . . . . . . . . . . . . . . . . . . . . . . . . . . . . . . . . . . . . . . . . . . . . . . . 10,135,189
Schedule of Investments (continued)
July 31, 2021
iShares� MSCI Intl Momentum Factor ETF(Percentages shown are based on Net Assets)
24 2 0 2 1 I S H A R E S A N N U A L R E P O R T T O S H A R E H O L D E R S

Security s Value
Short-Term InvestmentsMoney Market Funds — 0.1%BlackRock Cash Funds: Treasury, SL Agency Shares,
0.00%(c)(d) . . . . . . . . . . . . . . . . . . . . . . . . . . . . . . . . . . . . . . . . . . . . . 300,000 $ 300,000
Total Short-Term Investments — 0.1%(Cost: $300,000) . . . . . . . . . . . . . . . . . . . . . . . . . . . . . . . . . . . . . . . . . . . . . . . . . . 300,000
Total Investments in Securities — 99.8%(Cost: $735,686,782) . . . . . . . . . . . . . . . . . . . . . . . . . . . . . . . . . . . . . . . . . . . . . . 829,921,028
Other Assets, Less Liabilities — 0.2% . . . . . . . . . . . . . . . . . . . . . . . . . . . . . . . 1,996,080
Net Assets — 100.0% . . . . . . . . . . . . . . . . . . . . . . . . . . . . . . . . . . . . . . . . . . . . . . . . $ 831,917,108
(a) Non-income producing security.(b) Security exempt from registration pursuant to Rule 144A under the Securities Act of
1933, as amended. These securities may be resold in transactions exempt fromregistration to qualified institutional investors.
(c) Affiliate of the Fund.(d) Annualized 7-day yield as of period-end.
Affiliates
Investments in issuers considered to be affiliate(s) of the Fund during the year ended July 31, 2021 for purposes of Section 2(a)(3) of the Investment Company Act of 1940,as amended, were as follows:
Affiliated IssuerValue at
07/31/20Purchases
at CostProceeds
from SalesNet Realized
Gain (Loss)
Change inUnrealized
Appreciation(Depreciation)
Value at07/31/21
SharesHeld at
07/31/21 Income
CapitalGain
Distributionsfrom
UnderlyingFunds
BlackRock Cash Funds: Institutional, SL AgencyShares(a) . . . . . . . . . . . . . . . . . . . . . . . . . . . . . . . . . . . . . . . . . . . . $ 18,573 $ — $(18,236)(b) $ (339) $ 2 $ — — $ 4,897(c) $ —
BlackRock Cash Funds: Treasury, SL Agency Shares. . . . . 231,000 69,000(b) — — — 300,000 300,000 131 —
$ (339) $ 2 $300,000 $ 5,028 $ —
(a) As of period end, the entity is no longer held.(b) Represents net amount purchased (sold).(c) All or a portion represents securities lending income earned from the reinvestment of cash collateral from loaned securities, net of fees and collateral investment expenses, and other
payments to and from borrowers of securities.
Futures Contracts
DescriptionNumber ofContracts
ExpirationDate
NotionalAmount
(000)
Value/Unrealized
Appreciation(Depreciation)
Long ContractsTOPIX Index . . . . . . . . . . . . . . . . . . . . . . . . . . . . . . . . . . . . . . . . . . . . . . . . . . . . . . . . . . . . . . . . . . . . . . . . . . . . . . . . . . . . . . . . . . . . . . . . . . . . . . . . 25 09/09/21 $ 437 $ (8,851)Euro STOXX 50 Index . . . . . . . . . . . . . . . . . . . . . . . . . . . . . . . . . . . . . . . . . . . . . . . . . . . . . . . . . . . . . . . . . . . . . . . . . . . . . . . . . . . . . . . . . . . . . . . 31 09/17/21 1,504 (7,663)FTSE 100 Index . . . . . . . . . . . . . . . . . . . . . . . . . . . . . . . . . . . . . . . . . . . . . . . . . . . . . . . . . . . . . . . . . . . . . . . . . . . . . . . . . . . . . . . . . . . . . . . . . . . . . 3 09/17/21 290 (1,351)
$ (17,865)
Derivative Financial Instruments Categorized by Risk Exposure
As of July 31, 2021, the fair values of derivative financial instruments located in the Statements of Assets and Liabilities were as follows:
EquityContracts
Liabilities — Derivative Financial InstrumentsFutures contracts
Unrealized depreciation on futures contracts(a) . . . . . . . . . . . . . . . . . . . . . . . . . . . . . . . . . . . . . . . . . . . . . . . . . . . . . . . . . . . . . . . . . . . . . . . . . . . . . . . . . . . . . . . . . . . . . . . . . . . . . . . . . . . . . . . . . $ 17,865
(a) Net cumulative appreciation (depreciation) on futures contracts are reported in the Schedule of Investments. In the Statements of Assets and Liabilities, only current day's variationmargin is reported in receivables or payables and the net cumulative unrealized appreciation (depreciation) is included in accumulated earnings (loss).
Schedule of Investments (continued)
July 31, 2021
iShares� MSCI Intl Momentum Factor ETF(Percentages shown are based on Net Assets)
S C H E D U L E O F I N V E S T M E N T S 25

For the year ended July 31, 2021, the effect of derivative financial instruments in the Statements of Operations was as follows:
EquityContracts
Net Realized Gain (Loss) from:Futures contracts . . . . . . . . . . . . . . . . . . . . . . . . . . . . . . . . . . . . . . . . . . . . . . . . . . . . . . . . . . . . . . . . . . . . . . . . . . . . . . . . . . . . . . . . . . . . . . . . . . . . . . . . . . . . . . . . . . . . . . . . . . . . . . . . . . . . . . . . . . . . . . . . $582,763
Net Change in Unrealized Appreciation (Depreciation) on:Futures contracts . . . . . . . . . . . . . . . . . . . . . . . . . . . . . . . . . . . . . . . . . . . . . . . . . . . . . . . . . . . . . . . . . . . . . . . . . . . . . . . . . . . . . . . . . . . . . . . . . . . . . . . . . . . . . . . . . . . . . . . . . . . . . . . . . . . . . . . . . . . . . . . . $ 67,739
Average Quarterly Balances of Outstanding Derivative Financial Instruments
Futures contracts:Average notional value of contracts — long . . . . . . . . . . . . . . . . . . . . . . . . . . . . . . . . . . . . . . . . . . . . . . . . . . . . . . . . . . . . . . . . . . . . . . . . . . . . . . . . . . . . . . . . . . . . . . . . . . . . . . . . . . . . . . . . $2,260,354
For more information about the Fund’s investment risks regarding derivative financial instruments, refer to the Notes to Financial Statements.
Fair Value Measurements
Various inputs are used in determining the fair value of financial instruments. For description of the input levels and information about the Fund's policy regarding valuationof financial instruments, refer to the Notes to Financial Statements.
The following table summarizes the value of the Fund's investments according to the fair value hierarchy as of July 31, 2021. The breakdown of the Fund's investments intomajor categories is disclosed in the Schedule of Investments above.
Level 1 Level 2 Level 3 Total
InvestmentsAssets
Common Stocks. . . . . . . . . . . . . . . . . . . . . . . . . . . . . . . . . . . . . . . . . . . . . . . . . . . . . . . . . . . . . . . . . . . . . . . . . . . . . . . . . . . . $116,088,097 $703,397,742 $ — $819,485,839Preferred Stocks . . . . . . . . . . . . . . . . . . . . . . . . . . . . . . . . . . . . . . . . . . . . . . . . . . . . . . . . . . . . . . . . . . . . . . . . . . . . . . . . . . . — 10,135,189 — 10,135,189Money Market Funds . . . . . . . . . . . . . . . . . . . . . . . . . . . . . . . . . . . . . . . . . . . . . . . . . . . . . . . . . . . . . . . . . . . . . . . . . . . . . . . 300,000 — — 300,000
$116,388,097 $713,532,931 $ — $829,921,028
Derivative financial instruments(a)
LiabilitiesFutures Contracts . . . . . . . . . . . . . . . . . . . . . . . . . . . . . . . . . . . . . . . . . . . . . . . . . . . . . . . . . . . . . . . . . . . . . . . . . . . . . . . . . . $ — $ (17,865) $ — $ (17,865)
(a) Shown at the unrealized appreciation (depreciation) on the contracts.
See notes to financial statements.
Schedule of Investments (continued)
July 31, 2021
iShares� MSCI Intl Momentum Factor ETF
26 2 0 2 1 I S H A R E S A N N U A L R E P O R T T O S H A R E H O L D E R S

Security s Value
Common StocksAustralia — 7.8%Ampol Ltd. . . . . . . . . . . . . . . . . . . . . . . . . . . . . . . . . . . . . . . . . . . . . . . 249,324 $ 5,190,470ASX Ltd.. . . . . . . . . . . . . . . . . . . . . . . . . . . . . . . . . . . . . . . . . . . . . . . . 141,258 8,002,206Brambles Ltd. . . . . . . . . . . . . . . . . . . . . . . . . . . . . . . . . . . . . . . . . . . . 694,024 5,942,004CSL Ltd. . . . . . . . . . . . . . . . . . . . . . . . . . . . . . . . . . . . . . . . . . . . . . . . . 218,972 46,617,077Dexus/AU . . . . . . . . . . . . . . . . . . . . . . . . . . . . . . . . . . . . . . . . . . . . . . 544,991 4,116,889Evolution Mining Ltd. . . . . . . . . . . . . . . . . . . . . . . . . . . . . . . . . . . . . 18,373 55,877Fortescue Metals Group Ltd.. . . . . . . . . . . . . . . . . . . . . . . . . . . . . 929,482 16,984,055Goodman Group . . . . . . . . . . . . . . . . . . . . . . . . . . . . . . . . . . . . . . . . 1,311,076 21,806,028James Hardie Industries PLC . . . . . . . . . . . . . . . . . . . . . . . . . . . . 154,788 5,222,321Magellan Financial Group Ltd. . . . . . . . . . . . . . . . . . . . . . . . . . . . 132,171 4,768,613Medibank Pvt Ltd. . . . . . . . . . . . . . . . . . . . . . . . . . . . . . . . . . . . . . . . 2,058,917 5,021,459Mirvac Group . . . . . . . . . . . . . . . . . . . . . . . . . . . . . . . . . . . . . . . . . . . 2,120,002 4,449,674Newcrest Mining Ltd. . . . . . . . . . . . . . . . . . . . . . . . . . . . . . . . . . . . . 465,425 8,995,522REA Group Ltd. . . . . . . . . . . . . . . . . . . . . . . . . . . . . . . . . . . . . . . . . . 44,916 5,350,566Rio Tinto Ltd. . . . . . . . . . . . . . . . . . . . . . . . . . . . . . . . . . . . . . . . . . . . 233,476 22,882,974Rio Tinto PLC. . . . . . . . . . . . . . . . . . . . . . . . . . . . . . . . . . . . . . . . . . . 665,914 56,563,004Stockland. . . . . . . . . . . . . . . . . . . . . . . . . . . . . . . . . . . . . . . . . . . . . . . 1,262,969 4,084,589Washington H Soul Pattinson & Co. Ltd.. . . . . . . . . . . . . . . . . . 144,977 3,490,450Wesfarmers Ltd. . . . . . . . . . . . . . . . . . . . . . . . . . . . . . . . . . . . . . . . . 1,375,212 62,003,691
291,547,469Austria — 0.3%OMV AG. . . . . . . . . . . . . . . . . . . . . . . . . . . . . . . . . . . . . . . . . . . . . . . . 147,688 7,974,230Verbund AG. . . . . . . . . . . . . . . . . . . . . . . . . . . . . . . . . . . . . . . . . . . . . 37,179 3,429,380
11,403,610Belgium — 0.3%Etablissements Franz Colruyt NV . . . . . . . . . . . . . . . . . . . . . . . . 25,294 1,438,156Proximus SADP. . . . . . . . . . . . . . . . . . . . . . . . . . . . . . . . . . . . . . . . . 123,308 2,534,013Sofina SA. . . . . . . . . . . . . . . . . . . . . . . . . . . . . . . . . . . . . . . . . . . . . . . 11,037 5,175,068
9,147,237Canada — 8.4%Alimentation Couche-Tard Inc., Class B . . . . . . . . . . . . . . . . . . 306,422 12,351,685B2Gold Corp. . . . . . . . . . . . . . . . . . . . . . . . . . . . . . . . . . . . . . . . . . . . 9,794 41,057Canadian National Railway Co. . . . . . . . . . . . . . . . . . . . . . . . . . . 377,590 41,027,653Canadian Pacific Railway Ltd. . . . . . . . . . . . . . . . . . . . . . . . . . . . 413,686 30,718,076CCL Industries Inc., Class B, NVS . . . . . . . . . . . . . . . . . . . . . . . 69,294 3,974,019CGI Inc.(a) . . . . . . . . . . . . . . . . . . . . . . . . . . . . . . . . . . . . . . . . . . . . . . 78,383 7,130,239Constellation Software Inc. . . . . . . . . . . . . . . . . . . . . . . . . . . . . . . 9,564 15,319,802Franco-Nevada Corp. . . . . . . . . . . . . . . . . . . . . . . . . . . . . . . . . . . . 85,727 13,711,785Great-West Lifeco Inc.. . . . . . . . . . . . . . . . . . . . . . . . . . . . . . . . . . . 171,061 5,147,187Hydro One Ltd.(b) . . . . . . . . . . . . . . . . . . . . . . . . . . . . . . . . . . . . . . . 145,472 3,591,325iA Financial Corp. Inc. . . . . . . . . . . . . . . . . . . . . . . . . . . . . . . . . . . . 68,060 3,765,230IGM Financial Inc.. . . . . . . . . . . . . . . . . . . . . . . . . . . . . . . . . . . . . . . 44,120 1,557,072Intact Financial Corp.. . . . . . . . . . . . . . . . . . . . . . . . . . . . . . . . . . . . 87,735 11,954,913Inter Pipeline Ltd. . . . . . . . . . . . . . . . . . . . . . . . . . . . . . . . . . . . . . . . 411,086 6,583,439Keyera Corp. . . . . . . . . . . . . . . . . . . . . . . . . . . . . . . . . . . . . . . . . . . . 298,374 7,987,890Kirkland Lake Gold Ltd.. . . . . . . . . . . . . . . . . . . . . . . . . . . . . . . . . . 205,148 8,772,560Manulife Financial Corp. . . . . . . . . . . . . . . . . . . . . . . . . . . . . . . . . . 1,151,523 22,262,532Pembina Pipeline Corp. . . . . . . . . . . . . . . . . . . . . . . . . . . . . . . . . . 642,722 21,245,476Power Corp. of Canada . . . . . . . . . . . . . . . . . . . . . . . . . . . . . . . . . 286,854 9,155,600Ritchie Bros Auctioneers Inc. . . . . . . . . . . . . . . . . . . . . . . . . . . . . 51,080 3,049,406Sun Life Financial Inc. . . . . . . . . . . . . . . . . . . . . . . . . . . . . . . . . . . . 344,133 17,923,824TC Energy Corp. . . . . . . . . . . . . . . . . . . . . . . . . . . . . . . . . . . . . . . . . 1,194,615 58,237,002TMX Group Ltd. . . . . . . . . . . . . . . . . . . . . . . . . . . . . . . . . . . . . . . . . . 33,868 3,719,345Toromont Industries Ltd. . . . . . . . . . . . . . . . . . . . . . . . . . . . . . . . . . 42,134 3,560,586
312,787,703Denmark — 5.1%Carlsberg A/S, Class B . . . . . . . . . . . . . . . . . . . . . . . . . . . . . . . . . . 31,117 5,749,967
Security s Value
Denmark (continued)Chr Hansen Holding A/S. . . . . . . . . . . . . . . . . . . . . . . . . . . . . . . . . 46,006 $ 4,137,679Coloplast A/S, Class B . . . . . . . . . . . . . . . . . . . . . . . . . . . . . . . . . . 64,534 11,800,917Genmab A/S(a) . . . . . . . . . . . . . . . . . . . . . . . . . . . . . . . . . . . . . . . . . . 25,388 11,474,839GN Store Nord A/S . . . . . . . . . . . . . . . . . . . . . . . . . . . . . . . . . . . . . . 45,953 4,027,016Novo Nordisk A/S, Class B . . . . . . . . . . . . . . . . . . . . . . . . . . . . . . 954,554 88,364,280Novozymes A/S, Class B . . . . . . . . . . . . . . . . . . . . . . . . . . . . . . . . 134,665 10,579,927Orsted A/S(b) . . . . . . . . . . . . . . . . . . . . . . . . . . . . . . . . . . . . . . . . . . . . 81,778 12,129,324Pandora A/S . . . . . . . . . . . . . . . . . . . . . . . . . . . . . . . . . . . . . . . . . . . . 114,208 14,773,604Rockwool International A/S, Class B . . . . . . . . . . . . . . . . . . . . . 4,255 2,257,814Tryg A/S . . . . . . . . . . . . . . . . . . . . . . . . . . . . . . . . . . . . . . . . . . . . . . . . 167,513 4,140,044Vestas Wind Systems A/S . . . . . . . . . . . . . . . . . . . . . . . . . . . . . . . 558,440 20,592,217
190,027,628Finland — 2.5%Elisa OYJ. . . . . . . . . . . . . . . . . . . . . . . . . . . . . . . . . . . . . . . . . . . . . . . 105,431 6,776,176Fortum OYJ. . . . . . . . . . . . . . . . . . . . . . . . . . . . . . . . . . . . . . . . . . . . . 183,801 5,063,767Kone OYJ, Class B. . . . . . . . . . . . . . . . . . . . . . . . . . . . . . . . . . . . . . 256,080 21,210,233Neste OYJ. . . . . . . . . . . . . . . . . . . . . . . . . . . . . . . . . . . . . . . . . . . . . . 598,907 36,815,275Orion OYJ, Class B . . . . . . . . . . . . . . . . . . . . . . . . . . . . . . . . . . . . . 76,854 3,271,326Sampo OYJ, Class A . . . . . . . . . . . . . . . . . . . . . . . . . . . . . . . . . . . . 279,570 13,455,311UPM-Kymmene OYJ . . . . . . . . . . . . . . . . . . . . . . . . . . . . . . . . . . . . 182,490 7,457,523
94,049,611France — 5.6%Air Liquide SA . . . . . . . . . . . . . . . . . . . . . . . . . . . . . . . . . . . . . . . . . . 182,695 31,772,203Amundi SA(b) . . . . . . . . . . . . . . . . . . . . . . . . . . . . . . . . . . . . . . . . . . . 31,957 2,951,337AXA SA. . . . . . . . . . . . . . . . . . . . . . . . . . . . . . . . . . . . . . . . . . . . . . . . . 889,995 23,048,222Hermes International . . . . . . . . . . . . . . . . . . . . . . . . . . . . . . . . . . . . 29,418 44,973,528Ipsen SA . . . . . . . . . . . . . . . . . . . . . . . . . . . . . . . . . . . . . . . . . . . . . . . 18,579 1,985,360Kering SA . . . . . . . . . . . . . . . . . . . . . . . . . . . . . . . . . . . . . . . . . . . . . . 59,754 53,607,628La Francaise des Jeux SAEM(b). . . . . . . . . . . . . . . . . . . . . . . . . . 103,793 5,548,956L'Oreal SA . . . . . . . . . . . . . . . . . . . . . . . . . . . . . . . . . . . . . . . . . . . . . . 83,258 38,089,995Sartorius Stedim Biotech . . . . . . . . . . . . . . . . . . . . . . . . . . . . . . . . 11,907 6,797,036SCOR SE . . . . . . . . . . . . . . . . . . . . . . . . . . . . . . . . . . . . . . . . . . . . . . 82,738 2,310,593
211,084,858Germany — 5.5%Allianz SE, Registered. . . . . . . . . . . . . . . . . . . . . . . . . . . . . . . . . . . 244,873 60,866,452Bechtle AG . . . . . . . . . . . . . . . . . . . . . . . . . . . . . . . . . . . . . . . . . . . . . 206 42,535Beiersdorf AG. . . . . . . . . . . . . . . . . . . . . . . . . . . . . . . . . . . . . . . . . . . 43,579 5,176,037Brenntag SE . . . . . . . . . . . . . . . . . . . . . . . . . . . . . . . . . . . . . . . . . . . . 70,917 7,083,141Deutsche Boerse AG . . . . . . . . . . . . . . . . . . . . . . . . . . . . . . . . . . . . 133,879 22,339,576Deutsche Post AG, Registered. . . . . . . . . . . . . . . . . . . . . . . . . . . 472,480 32,020,519Hannover Rueck SE. . . . . . . . . . . . . . . . . . . . . . . . . . . . . . . . . . . . . 35,211 5,918,384Henkel AG & Co. KGaA . . . . . . . . . . . . . . . . . . . . . . . . . . . . . . . . . 35,399 3,218,652Knorr-Bremse AG . . . . . . . . . . . . . . . . . . . . . . . . . . . . . . . . . . . . . . . 40,108 4,541,816LANXESS AG. . . . . . . . . . . . . . . . . . . . . . . . . . . . . . . . . . . . . . . . . . . 38,446 2,784,393Nemetschek SE. . . . . . . . . . . . . . . . . . . . . . . . . . . . . . . . . . . . . . . . . 23,901 2,109,211Rational AG. . . . . . . . . . . . . . . . . . . . . . . . . . . . . . . . . . . . . . . . . . . . . 2,794 3,042,449SAP SE . . . . . . . . . . . . . . . . . . . . . . . . . . . . . . . . . . . . . . . . . . . . . . . . 331,078 47,513,413Symrise AG. . . . . . . . . . . . . . . . . . . . . . . . . . . . . . . . . . . . . . . . . . . . . 51,824 7,641,391
204,297,969Hong Kong — 5.5%AIA Group Ltd. . . . . . . . . . . . . . . . . . . . . . . . . . . . . . . . . . . . . . . . . . . 6,651,800 79,593,847CK Infrastructure Holdings Ltd. . . . . . . . . . . . . . . . . . . . . . . . . . . 395,500 2,387,587CLP Holdings Ltd. . . . . . . . . . . . . . . . . . . . . . . . . . . . . . . . . . . . . . . . 917,500 9,460,728Hang Seng Bank Ltd.. . . . . . . . . . . . . . . . . . . . . . . . . . . . . . . . . . . . 462,600 8,859,461HK Electric Investments & HK Electric Investments Ltd.,
Class SS. . . . . . . . . . . . . . . . . . . . . . . . . . . . . . . . . . . . . . . . . . . . . 1,583,000 1,605,481Hong Kong & China Gas Co. Ltd. . . . . . . . . . . . . . . . . . . . . . . . . 5,671,370 9,223,563Hong Kong Exchanges & Clearing Ltd. . . . . . . . . . . . . . . . . . . . 908,800 58,081,121Power Assets Holdings Ltd.. . . . . . . . . . . . . . . . . . . . . . . . . . . . . . 803,000 5,191,548
Schedule of InvestmentsJuly 31, 2021
iShares� MSCI Intl Quality Factor ETF(Percentages shown are based on Net Assets)
S C H E D U L E O F I N V E S T M E N T S 27

Security s Value
Hong Kong (continued)Sino Land Co. Ltd. . . . . . . . . . . . . . . . . . . . . . . . . . . . . . . . . . . . . . . 2,000,000 $ 3,064,735Sun Hung Kai Properties Ltd. . . . . . . . . . . . . . . . . . . . . . . . . . . . . 757,000 10,829,159Techtronic Industries Co. Ltd. . . . . . . . . . . . . . . . . . . . . . . . . . . . . 821,500 14,649,219Xinyi Glass Holdings Ltd. . . . . . . . . . . . . . . . . . . . . . . . . . . . . . . . . 1,184,000 4,425,034
207,371,483Ireland — 0.4%Kingspan Group PLC. . . . . . . . . . . . . . . . . . . . . . . . . . . . . . . . . . . . 74,983 8,153,939Smurfit Kappa Group PLC . . . . . . . . . . . . . . . . . . . . . . . . . . . . . . . 105,302 5,940,504
14,094,443Israel — 0.3%Bank Leumi Le-Israel BM(a) . . . . . . . . . . . . . . . . . . . . . . . . . . . . . . 697,331 5,328,436Check Point Software Technologies Ltd.(a) . . . . . . . . . . . . . . . . 55,424 7,044,390
12,372,826Italy — 1.8%Assicurazioni Generali SpA . . . . . . . . . . . . . . . . . . . . . . . . . . . . . . 612,024 12,202,616DiaSorin SpA . . . . . . . . . . . . . . . . . . . . . . . . . . . . . . . . . . . . . . . . . . . 12,203 2,476,654Ferrari NV . . . . . . . . . . . . . . . . . . . . . . . . . . . . . . . . . . . . . . . . . . . . . . 124,115 27,049,374FinecoBank Banca Fineco SpA(a) . . . . . . . . . . . . . . . . . . . . . . . . 389,150 6,968,283Moncler SpA . . . . . . . . . . . . . . . . . . . . . . . . . . . . . . . . . . . . . . . . . . . . 176,450 12,119,060Recordati Industria Chimica e Farmaceutica SpA . . . . . . . . . 47,658 2,947,725Snam SpA . . . . . . . . . . . . . . . . . . . . . . . . . . . . . . . . . . . . . . . . . . . . . . 816,694 4,940,042
68,703,754Japan — 14.5%ABC-Mart Inc.. . . . . . . . . . . . . . . . . . . . . . . . . . . . . . . . . . . . . . . . . . . 44,500 2,453,568Advantest Corp.. . . . . . . . . . . . . . . . . . . . . . . . . . . . . . . . . . . . . . . . . 71,900 6,347,400Bandai Namco Holdings Inc. . . . . . . . . . . . . . . . . . . . . . . . . . . . . . 67,900 4,393,411Capcom Co. Ltd. . . . . . . . . . . . . . . . . . . . . . . . . . . . . . . . . . . . . . . . . 144,900 3,984,147Chugai Pharmaceutical Co. Ltd. . . . . . . . . . . . . . . . . . . . . . . . . . 114,500 4,219,383Cosmos Pharmaceutical Corp.. . . . . . . . . . . . . . . . . . . . . . . . . . . 13,700 2,325,609CyberAgent Inc.. . . . . . . . . . . . . . . . . . . . . . . . . . . . . . . . . . . . . . . . . 224,100 4,033,451Daifuku Co. Ltd.. . . . . . . . . . . . . . . . . . . . . . . . . . . . . . . . . . . . . . . . . 51,700 4,632,799Daito Trust Construction Co. Ltd.. . . . . . . . . . . . . . . . . . . . . . . . . 79,600 9,352,195Daiwa House Industry Co. Ltd.. . . . . . . . . . . . . . . . . . . . . . . . . . . 404,600 12,405,120Disco Corp. . . . . . . . . . . . . . . . . . . . . . . . . . . . . . . . . . . . . . . . . . . . . . 10,500 2,998,345GMO Payment Gateway Inc. . . . . . . . . . . . . . . . . . . . . . . . . . . . . 13,900 1,786,809Hakuhodo DY Holdings Inc. . . . . . . . . . . . . . . . . . . . . . . . . . . . . . 172,900 2,629,898Hoya Corp. . . . . . . . . . . . . . . . . . . . . . . . . . . . . . . . . . . . . . . . . . . . . . 137,700 19,439,041Inpex Corp. . . . . . . . . . . . . . . . . . . . . . . . . . . . . . . . . . . . . . . . . . . . . . 822,200 5,831,502Itochu Techno-Solutions Corp. . . . . . . . . . . . . . . . . . . . . . . . . . . . 100 3,068Japan Exchange Group Inc. . . . . . . . . . . . . . . . . . . . . . . . . . . . . . 412,800 9,389,139Japan Real Estate Investment Corp. . . . . . . . . . . . . . . . . . . . . . 638 4,006,925Japan Tobacco Inc. . . . . . . . . . . . . . . . . . . . . . . . . . . . . . . . . . . . . . 97,900 1,912,995Kajima Corp.. . . . . . . . . . . . . . . . . . . . . . . . . . . . . . . . . . . . . . . . . . . . 358,400 4,613,607Kakaku.com Inc. . . . . . . . . . . . . . . . . . . . . . . . . . . . . . . . . . . . . . . . . 152,000 4,147,953Kao Corp. . . . . . . . . . . . . . . . . . . . . . . . . . . . . . . . . . . . . . . . . . . . . . . 30,700 1,848,487KDDI Corp. . . . . . . . . . . . . . . . . . . . . . . . . . . . . . . . . . . . . . . . . . . . . . 1,103,500 33,749,005Kikkoman Corp. . . . . . . . . . . . . . . . . . . . . . . . . . . . . . . . . . . . . . . . . . 54,500 3,337,412Kobe Bussan Co. Ltd. . . . . . . . . . . . . . . . . . . . . . . . . . . . . . . . . . . . 59,900 2,016,855Koei Tecmo Holdings Co. Ltd.. . . . . . . . . . . . . . . . . . . . . . . . . . . . 37,190 1,747,311Koito Manufacturing Co. Ltd.. . . . . . . . . . . . . . . . . . . . . . . . . . . . . 84,100 5,146,966Lasertec Corp. . . . . . . . . . . . . . . . . . . . . . . . . . . . . . . . . . . . . . . . . . . 35,800 6,720,790Lion Corp. . . . . . . . . . . . . . . . . . . . . . . . . . . . . . . . . . . . . . . . . . . . . . . 1,100 19,040M3 Inc. . . . . . . . . . . . . . . . . . . . . . . . . . . . . . . . . . . . . . . . . . . . . . . . . . 166,200 10,870,590Makita Corp. . . . . . . . . . . . . . . . . . . . . . . . . . . . . . . . . . . . . . . . . . . . . 119,600 6,219,074MEIJI Holdings Co. Ltd. . . . . . . . . . . . . . . . . . . . . . . . . . . . . . . . . . 4,900 303,314Misumi Group Inc.. . . . . . . . . . . . . . . . . . . . . . . . . . . . . . . . . . . . . . . 133,700 4,660,133Miura Co. Ltd.. . . . . . . . . . . . . . . . . . . . . . . . . . . . . . . . . . . . . . . . . . . 700 30,911MonotaRO Co. Ltd. . . . . . . . . . . . . . . . . . . . . . . . . . . . . . . . . . . . . . 194,700 4,478,633MS&AD Insurance Group Holdings Inc. . . . . . . . . . . . . . . . . . . 289,000 8,933,293
Security s Value
Japan (continued)Nexon Co. Ltd. . . . . . . . . . . . . . . . . . . . . . . . . . . . . . . . . . . . . . . . . . . 264,400 $ 5,440,324Nihon M&A Center Inc. . . . . . . . . . . . . . . . . . . . . . . . . . . . . . . . . . . 229,400 6,388,563Nintendo Co. Ltd. . . . . . . . . . . . . . . . . . . . . . . . . . . . . . . . . . . . . . . . 81,400 41,847,978Nippon Building Fund Inc. . . . . . . . . . . . . . . . . . . . . . . . . . . . . . . . 757 4,892,225Nippon Prologis REIT Inc. . . . . . . . . . . . . . . . . . . . . . . . . . . . . . . . 1,056 3,526,578Nippon Telegraph & Telephone Corp.. . . . . . . . . . . . . . . . . . . . . 844,200 21,618,369Nissan Chemical Corp. . . . . . . . . . . . . . . . . . . . . . . . . . . . . . . . . . . 91,100 4,465,144Nitori Holdings Co. Ltd. . . . . . . . . . . . . . . . . . . . . . . . . . . . . . . . . . . 78,500 14,920,968Nitto Denko Corp. . . . . . . . . . . . . . . . . . . . . . . . . . . . . . . . . . . . . . . . 80,600 5,988,453Nomura Research Institute Ltd. . . . . . . . . . . . . . . . . . . . . . . . . . . 136,600 4,395,766Obayashi Corp. . . . . . . . . . . . . . . . . . . . . . . . . . . . . . . . . . . . . . . . . . 863,600 7,061,876Obic Co. Ltd.. . . . . . . . . . . . . . . . . . . . . . . . . . . . . . . . . . . . . . . . . . . . 25,700 4,516,862Oracle Corp. Japan . . . . . . . . . . . . . . . . . . . . . . . . . . . . . . . . . . . . . 3,700 276,390Orix JREIT Inc.. . . . . . . . . . . . . . . . . . . . . . . . . . . . . . . . . . . . . . . . . . 1,242 2,369,839Osaka Gas Co. Ltd. . . . . . . . . . . . . . . . . . . . . . . . . . . . . . . . . . . . . . 245,100 4,579,133Otsuka Corp. . . . . . . . . . . . . . . . . . . . . . . . . . . . . . . . . . . . . . . . . . . . 55,000 2,857,834Persol Holdings Co. Ltd. . . . . . . . . . . . . . . . . . . . . . . . . . . . . . . . . . 99,600 2,009,467Recruit Holdings Co. Ltd. . . . . . . . . . . . . . . . . . . . . . . . . . . . . . . . . 664,800 34,456,995Rinnai Corp. . . . . . . . . . . . . . . . . . . . . . . . . . . . . . . . . . . . . . . . . . . . . 29,600 2,749,825SCSK Corp. . . . . . . . . . . . . . . . . . . . . . . . . . . . . . . . . . . . . . . . . . . . . 17,800 1,072,805Secom Co. Ltd. . . . . . . . . . . . . . . . . . . . . . . . . . . . . . . . . . . . . . . . . . 10,600 802,320Sekisui Chemical Co. Ltd. . . . . . . . . . . . . . . . . . . . . . . . . . . . . . . . 286,100 4,936,785Sekisui House Ltd. . . . . . . . . . . . . . . . . . . . . . . . . . . . . . . . . . . . . . . 447,500 8,862,955SG Holdings Co. Ltd. . . . . . . . . . . . . . . . . . . . . . . . . . . . . . . . . . . . . 180,800 4,861,536Shimadzu Corp.. . . . . . . . . . . . . . . . . . . . . . . . . . . . . . . . . . . . . . . . . 81,800 3,299,033Shimano Inc.. . . . . . . . . . . . . . . . . . . . . . . . . . . . . . . . . . . . . . . . . . . . 66,000 16,894,614Shin-Etsu Chemical Co. Ltd. . . . . . . . . . . . . . . . . . . . . . . . . . . . . . 164,600 26,851,057Shionogi & Co. Ltd. . . . . . . . . . . . . . . . . . . . . . . . . . . . . . . . . . . . . . 135,900 7,157,131Sohgo Security Services Co. Ltd. . . . . . . . . . . . . . . . . . . . . . . . . 500 23,380Sompo Holdings Inc. . . . . . . . . . . . . . . . . . . . . . . . . . . . . . . . . . . . . 201,800 8,342,829Square Enix Holdings Co. Ltd. . . . . . . . . . . . . . . . . . . . . . . . . . . . 63,200 3,279,240T&D Holdings Inc.. . . . . . . . . . . . . . . . . . . . . . . . . . . . . . . . . . . . . . . 421,300 5,390,428Taisei Corp. . . . . . . . . . . . . . . . . . . . . . . . . . . . . . . . . . . . . . . . . . . . . . 7,100 239,280TIS Inc. . . . . . . . . . . . . . . . . . . . . . . . . . . . . . . . . . . . . . . . . . . . . . . . . . 69,500 1,802,569Toho Gas Co. Ltd.. . . . . . . . . . . . . . . . . . . . . . . . . . . . . . . . . . . . . . . 2,100 102,076Tokio Marine Holdings Inc.. . . . . . . . . . . . . . . . . . . . . . . . . . . . . . . 316,500 15,084,727Tokyo Electron Ltd.. . . . . . . . . . . . . . . . . . . . . . . . . . . . . . . . . . . . . . 65,900 27,178,835Trend Micro Inc.. . . . . . . . . . . . . . . . . . . . . . . . . . . . . . . . . . . . . . . . . 80,500 4,191,079Tsuruha Holdings Inc. . . . . . . . . . . . . . . . . . . . . . . . . . . . . . . . . . . . 34,300 4,049,625Unicharm Corp. . . . . . . . . . . . . . . . . . . . . . . . . . . . . . . . . . . . . . . . . . 174,400 6,999,950USS Co. Ltd.. . . . . . . . . . . . . . . . . . . . . . . . . . . . . . . . . . . . . . . . . . . . 257,000 4,473,839Welcia Holdings Co. Ltd. . . . . . . . . . . . . . . . . . . . . . . . . . . . . . . . . 6,000 204,238Z Holdings Corp. . . . . . . . . . . . . . . . . . . . . . . . . . . . . . . . . . . . . . . . . 1,417,000 7,092,338ZOZO Inc. . . . . . . . . . . . . . . . . . . . . . . . . . . . . . . . . . . . . . . . . . . . . . . 158,400 5,394,898
543,938,335Netherlands — 7.3%Adyen NV(a)(b) . . . . . . . . . . . . . . . . . . . . . . . . . . . . . . . . . . . . . . . . . . 7,625 20,664,124ASM International NV . . . . . . . . . . . . . . . . . . . . . . . . . . . . . . . . . . . 15,863 5,629,937ASML Holding NV. . . . . . . . . . . . . . . . . . . . . . . . . . . . . . . . . . . . . . . 214,677 164,095,612Koninklijke Vopak NV. . . . . . . . . . . . . . . . . . . . . . . . . . . . . . . . . . . . 94,295 3,992,689NN Group NV . . . . . . . . . . . . . . . . . . . . . . . . . . . . . . . . . . . . . . . . . . . 149,889 7,451,936Randstad NV . . . . . . . . . . . . . . . . . . . . . . . . . . . . . . . . . . . . . . . . . . . 54,001 3,917,804Stellantis NV . . . . . . . . . . . . . . . . . . . . . . . . . . . . . . . . . . . . . . . . . . . . 2,613,397 50,115,841Wolters Kluwer NV . . . . . . . . . . . . . . . . . . . . . . . . . . . . . . . . . . . . . . 159,975 18,237,685
274,105,628New Zealand — 0.4%a2 Milk Co. Ltd. (The)(a) . . . . . . . . . . . . . . . . . . . . . . . . . . . . . . . . . 22,354 97,192Fisher & Paykel Healthcare Corp. Ltd.. . . . . . . . . . . . . . . . . . . . 320,560 7,056,127Mercury NZ Ltd.. . . . . . . . . . . . . . . . . . . . . . . . . . . . . . . . . . . . . . . . . 321,284 1,478,243
Schedule of Investments (continued)
July 31, 2021
iShares� MSCI Intl Quality Factor ETF(Percentages shown are based on Net Assets)
28 2 0 2 1 I S H A R E S A N N U A L R E P O R T T O S H A R E H O L D E R S

Security s Value
New Zealand (continued)Meridian Energy Ltd. . . . . . . . . . . . . . . . . . . . . . . . . . . . . . . . . . . . . 638,766 $ 2,322,485Spark New Zealand Ltd. . . . . . . . . . . . . . . . . . . . . . . . . . . . . . . . . . 1,454,891 4,802,257
15,756,304Norway — 0.2%Gjensidige Forsikring ASA . . . . . . . . . . . . . . . . . . . . . . . . . . . . . . . 144,560 3,307,981Orkla ASA . . . . . . . . . . . . . . . . . . . . . . . . . . . . . . . . . . . . . . . . . . . . . . 282,722 2,567,795
5,875,776Singapore — 1.0%Ascendas REIT . . . . . . . . . . . . . . . . . . . . . . . . . . . . . . . . . . . . . . . . . 1,755,600 4,040,061Mapletree Commercial Trust . . . . . . . . . . . . . . . . . . . . . . . . . . . . . 1,485,500 2,365,014Oversea-Chinese Banking Corp. Ltd.. . . . . . . . . . . . . . . . . . . . . 1,662,900 15,044,645Singapore Exchange Ltd. . . . . . . . . . . . . . . . . . . . . . . . . . . . . . . . . 449,900 3,936,617Singapore Technologies Engineering Ltd. . . . . . . . . . . . . . . . . 1,047,300 3,092,864Singapore Telecommunications Ltd. . . . . . . . . . . . . . . . . . . . . . . 5,562,900 9,323,904
37,803,105Spain — 1.7%Enagas SA . . . . . . . . . . . . . . . . . . . . . . . . . . . . . . . . . . . . . . . . . . . . . 30,251 694,790Endesa SA . . . . . . . . . . . . . . . . . . . . . . . . . . . . . . . . . . . . . . . . . . . . . 69,646 1,691,744Iberdrola SA . . . . . . . . . . . . . . . . . . . . . . . . . . . . . . . . . . . . . . . . . . . . 2,683,346 32,294,290Industria de Diseno Textil SA . . . . . . . . . . . . . . . . . . . . . . . . . . . . 789,362 26,772,288Red Electrica Corp. SA . . . . . . . . . . . . . . . . . . . . . . . . . . . . . . . . . . 120,954 2,395,948
63,849,060Sweden — 4.3%Alfa Laval AB . . . . . . . . . . . . . . . . . . . . . . . . . . . . . . . . . . . . . . . . . . . 148,422 6,198,236Assa Abloy AB, Class B . . . . . . . . . . . . . . . . . . . . . . . . . . . . . . . . . 453,504 14,546,719Atlas Copco AB, Class A . . . . . . . . . . . . . . . . . . . . . . . . . . . . . . . . 439,877 29,790,673Atlas Copco AB, Class B . . . . . . . . . . . . . . . . . . . . . . . . . . . . . . . . 260,959 14,837,695Boliden AB. . . . . . . . . . . . . . . . . . . . . . . . . . . . . . . . . . . . . . . . . . . . . . 134,647 5,247,458Electrolux AB, Series B . . . . . . . . . . . . . . . . . . . . . . . . . . . . . . . . . . 189,807 4,984,967Epiroc AB, Class A . . . . . . . . . . . . . . . . . . . . . . . . . . . . . . . . . . . . . . 401,657 9,356,450Epiroc AB, Class B . . . . . . . . . . . . . . . . . . . . . . . . . . . . . . . . . . . . . . 231,753 4,656,257Evolution AB(b) . . . . . . . . . . . . . . . . . . . . . . . . . . . . . . . . . . . . . . . . . . 136,131 23,686,823Husqvarna AB, Class B. . . . . . . . . . . . . . . . . . . . . . . . . . . . . . . . . . 376,832 5,273,248Industrivarden AB, Class A . . . . . . . . . . . . . . . . . . . . . . . . . . . . . . 62,852 2,507,786Industrivarden AB, Class C . . . . . . . . . . . . . . . . . . . . . . . . . . . . . . 89,006 3,407,146Investment AB Latour, Class B . . . . . . . . . . . . . . . . . . . . . . . . . . . 72,829 2,846,301Nibe Industrier AB, Class B . . . . . . . . . . . . . . . . . . . . . . . . . . . . . . 727,751 8,696,610Sandvik AB . . . . . . . . . . . . . . . . . . . . . . . . . . . . . . . . . . . . . . . . . . . . . 591,723 15,429,944Skanska AB, Class B . . . . . . . . . . . . . . . . . . . . . . . . . . . . . . . . . . . . 207,600 5,860,476SKF AB, Class B . . . . . . . . . . . . . . . . . . . . . . . . . . . . . . . . . . . . . . . . 160,761 4,277,312
161,604,101Switzerland — 12.8%Baloise Holding AG, Registered. . . . . . . . . . . . . . . . . . . . . . . . . . 27,281 4,301,409EMS-Chemie Holding AG, Registered . . . . . . . . . . . . . . . . . . . . 5,274 5,846,544Geberit AG, Registered. . . . . . . . . . . . . . . . . . . . . . . . . . . . . . . . . . 27,713 22,754,526Givaudan SA, Registered. . . . . . . . . . . . . . . . . . . . . . . . . . . . . . . . 4,417 22,046,319Kuehne + Nagel International AG, Registered . . . . . . . . . . . . 38,054 12,836,870Logitech International SA, Registered . . . . . . . . . . . . . . . . . . . . 93,326 10,253,670Nestle SA, Registered . . . . . . . . . . . . . . . . . . . . . . . . . . . . . . . . . . . 1,014,006 128,403,228Partners Group Holding AG. . . . . . . . . . . . . . . . . . . . . . . . . . . . . . 20,626 35,236,712Roche Holding AG, Bearer. . . . . . . . . . . . . . . . . . . . . . . . . . . . . . . 16,638 7,141,456Roche Holding AG, NVS. . . . . . . . . . . . . . . . . . . . . . . . . . . . . . . . . 365,134 141,055,672Schindler Holding AG, Participation Certificates, NVS . . . . . 26,465 8,567,657Schindler Holding AG, Registered. . . . . . . . . . . . . . . . . . . . . . . . 13,749 4,284,211Sonova Holding AG, Registered . . . . . . . . . . . . . . . . . . . . . . . . . 23,716 9,311,729Straumann Holding AG, Registered . . . . . . . . . . . . . . . . . . . . . . 4,650 8,621,185Swiss Life Holding AG, Registered . . . . . . . . . . . . . . . . . . . . . . . 14,944 7,708,157Swisscom AG, Registered . . . . . . . . . . . . . . . . . . . . . . . . . . . . . . . 15,094 9,071,520Temenos AG, Registered . . . . . . . . . . . . . . . . . . . . . . . . . . . . . . . . 24,204 3,844,768
Security s Value
Switzerland (continued)Zurich Insurance Group AG. . . . . . . . . . . . . . . . . . . . . . . . . . . . . . 91,098 $ 36,728,410
478,014,043United Kingdom — 13.7%3i Group PLC . . . . . . . . . . . . . . . . . . . . . . . . . . . . . . . . . . . . . . . . . . . 510,049 9,065,202Abrdn PLC. . . . . . . . . . . . . . . . . . . . . . . . . . . . . . . . . . . . . . . . . . . . . . 1,191,689 4,701,134Admiral Group PLC . . . . . . . . . . . . . . . . . . . . . . . . . . . . . . . . . . . . . 169,595 8,011,418Anglo American PLC . . . . . . . . . . . . . . . . . . . . . . . . . . . . . . . . . . . . 499,451 22,132,653Ashtead Group PLC. . . . . . . . . . . . . . . . . . . . . . . . . . . . . . . . . . . . . 235,097 17,592,176Auto Trader Group PLC(a)(b) . . . . . . . . . . . . . . . . . . . . . . . . . . . . . 669,668 6,067,299Aviva PLC . . . . . . . . . . . . . . . . . . . . . . . . . . . . . . . . . . . . . . . . . . . . . . 1,956,508 10,507,696BAE Systems PLC . . . . . . . . . . . . . . . . . . . . . . . . . . . . . . . . . . . . . . 1,969,081 15,787,189Barratt Developments PLC . . . . . . . . . . . . . . . . . . . . . . . . . . . . . . 735,406 7,186,874Berkeley Group Holdings PLC . . . . . . . . . . . . . . . . . . . . . . . . . . . 94,326 6,350,778British Land Co. PLC (The) . . . . . . . . . . . . . . . . . . . . . . . . . . . . . . 462,706 3,275,928Bunzl PLC . . . . . . . . . . . . . . . . . . . . . . . . . . . . . . . . . . . . . . . . . . . . . . 194,527 7,206,687Burberry Group PLC . . . . . . . . . . . . . . . . . . . . . . . . . . . . . . . . . . . . 272,819 7,825,405Croda International PLC . . . . . . . . . . . . . . . . . . . . . . . . . . . . . . . . . 67,361 7,885,363Diageo PLC. . . . . . . . . . . . . . . . . . . . . . . . . . . . . . . . . . . . . . . . . . . . . 677,935 33,616,259Direct Line Insurance Group PLC . . . . . . . . . . . . . . . . . . . . . . . . 856,173 3,539,186Experian PLC . . . . . . . . . . . . . . . . . . . . . . . . . . . . . . . . . . . . . . . . . . . 440,153 19,378,090Ferguson PLC . . . . . . . . . . . . . . . . . . . . . . . . . . . . . . . . . . . . . . . . . . 137,321 19,250,907GlaxoSmithKline PLC . . . . . . . . . . . . . . . . . . . . . . . . . . . . . . . . . . . 1,870,736 36,935,496Halma PLC . . . . . . . . . . . . . . . . . . . . . . . . . . . . . . . . . . . . . . . . . . . . . 143,861 5,774,722Hargreaves Lansdown PLC. . . . . . . . . . . . . . . . . . . . . . . . . . . . . . 345,943 7,846,250Hikma Pharmaceuticals PLC . . . . . . . . . . . . . . . . . . . . . . . . . . . . 59,127 2,174,185Imperial Brands PLC . . . . . . . . . . . . . . . . . . . . . . . . . . . . . . . . . . . . 318,598 6,821,279Intertek Group PLC . . . . . . . . . . . . . . . . . . . . . . . . . . . . . . . . . . . . . 102,003 7,308,101Johnson Matthey PLC. . . . . . . . . . . . . . . . . . . . . . . . . . . . . . . . . . . 79,418 3,282,687London Stock Exchange Group PLC . . . . . . . . . . . . . . . . . . . . . 234,329 24,433,788M&G PLC . . . . . . . . . . . . . . . . . . . . . . . . . . . . . . . . . . . . . . . . . . . . . . 1,567,481 4,908,161Mondi PLC . . . . . . . . . . . . . . . . . . . . . . . . . . . . . . . . . . . . . . . . . . . . . 220,213 6,105,129National Grid PLC. . . . . . . . . . . . . . . . . . . . . . . . . . . . . . . . . . . . . . . 1,444,831 18,473,777Persimmon PLC . . . . . . . . . . . . . . . . . . . . . . . . . . . . . . . . . . . . . . . . 325,656 13,136,185Prudential PLC. . . . . . . . . . . . . . . . . . . . . . . . . . . . . . . . . . . . . . . . . . 1,925,600 36,160,510Reckitt Benckiser Group PLC . . . . . . . . . . . . . . . . . . . . . . . . . . . . 289,152 22,120,033Sage Group PLC (The) . . . . . . . . . . . . . . . . . . . . . . . . . . . . . . . . . . 372,812 3,633,944Schroders PLC . . . . . . . . . . . . . . . . . . . . . . . . . . . . . . . . . . . . . . . . . 86,513 4,393,488Segro PLC. . . . . . . . . . . . . . . . . . . . . . . . . . . . . . . . . . . . . . . . . . . . . . 688,757 11,642,913Smiths Group PLC . . . . . . . . . . . . . . . . . . . . . . . . . . . . . . . . . . . . . . 185,967 4,018,072Spirax-Sarco Engineering PLC. . . . . . . . . . . . . . . . . . . . . . . . . . . 41,539 8,654,597St. James's Place PLC . . . . . . . . . . . . . . . . . . . . . . . . . . . . . . . . . . 406,878 8,964,329Taylor Wimpey PLC . . . . . . . . . . . . . . . . . . . . . . . . . . . . . . . . . . . . . 2,434,833 5,566,677Unilever PLC . . . . . . . . . . . . . . . . . . . . . . . . . . . . . . . . . . . . . . . . . . . 1,073,525 61,783,052
513,517,619
Total Common Stocks — 99.4%(Cost: $3,027,660,164). . . . . . . . . . . . . . . . . . . . . . . . . . . . . . . . . . . . . . . . . . . 3,721,352,562
Preferred StocksGermany — 0.2%Fuchs Petrolub SE, Preference Shares, NVS . . . . . . . . . . . . . 37,232 1,855,215Henkel AG & Co. KGaA, Preference Shares, NVS . . . . . . . . 59,366 6,018,797
7,874,012
Total Preferred Stocks — 0.2%(Cost: $7,823,044) . . . . . . . . . . . . . . . . . . . . . . . . . . . . . . . . . . . . . . . . . . . . . . . 7,874,012
Schedule of Investments (continued)
July 31, 2021
iShares� MSCI Intl Quality Factor ETF(Percentages shown are based on Net Assets)
S C H E D U L E O F I N V E S T M E N T S 29

Security s Value
Short-Term InvestmentsMoney Market Funds — 0.0%BlackRock Cash Funds: Treasury, SL Agency Shares,
0.00%(c)(d). . . . . . . . . . . . . . . . . . . . . . . . . . . . . . . . . . . . . . . . . . . . 1,880,000 $ 1,880,000
Total Short-Term Investments — 0.0%(Cost: $1,880,000) . . . . . . . . . . . . . . . . . . . . . . . . . . . . . . . . . . . . . . . . . . . . . . . 1,880,000
Total Investments in Securities — 99.6%(Cost: $3,037,363,208). . . . . . . . . . . . . . . . . . . . . . . . . . . . . . . . . . . . . . . . . . . 3,731,106,574
Other Assets, Less Liabilities — 0.4% . . . . . . . . . . . . . . . . . . . . . . . . . . . . . 13,363,132
Net Assets — 100.0% . . . . . . . . . . . . . . . . . . . . . . . . . . . . . . . . . . . . . . . . . . . . . . $ 3,744,469,706
(a) Non-income producing security.(b) Security exempt from registration pursuant to Rule 144A under the Securities Act of
1933, as amended. These securities may be resold in transactions exempt fromregistration to qualified institutional investors.
(c) Affiliate of the Fund.(d) Annualized 7-day yield as of period-end.
Affiliates
Investments in issuers considered to be affiliate(s) of the Fund during the year ended July 31, 2021 for purposes of Section 2(a)(3) of the Investment Company Act of 1940,as amended, were as follows:
Affiliated IssuerValue at
07/31/20Purchases
at CostProceeds
from SalesNet Realized
Gain (Loss)
Change inUnrealized
Appreciation(Depreciation)
Value at07/31/21
SharesHeld at
07/31/21 Income
CapitalGain
Distributionsfrom
UnderlyingFunds
BlackRock Cash Funds: Institutional, SL AgencyShares(a) . . . . . . . . . . . . . . . . . . . . . . . . . . . . . . . . . . . . . . . . $188,858 $ — $(185,159)(b) $ (3,355) $ (344) $ — — $19,824(c) $ —
BlackRock Cash Funds: Treasury, SL AgencyShares . . . . . . . . . . . . . . . . . . . . . . . . . . . . . . . . . . . . . . . . . . 413,000 1,467,000(b) — — — 1,880,000 1,880,000 492 —
$ (3,355) $ (344) $1,880,000 $20,316 $ —
(a) As of period end, the entity is no longer held.(b) Represents net amount purchased (sold).(c) All or a portion represents securities lending income earned from the reinvestment of cash collateral from loaned securities, net of fees and collateral investment expenses, and other
payments to and from borrowers of securities.
Futures Contracts
DescriptionNumber ofContracts
ExpirationDate
NotionalAmount
(000)
Value/Unrealized
Appreciation(Depreciation)
Long ContractsTOPIX Index . . . . . . . . . . . . . . . . . . . . . . . . . . . . . . . . . . . . . . . . . . . . . . . . . . . . . . . . . . . . . . . . . . . . . . . . . . . . . . . . . . . . . . . . . . . . . . . . . . . . . . . . 20 09/09/21 $ 3,491 $ (72,098)ASX SPI 200 Index . . . . . . . . . . . . . . . . . . . . . . . . . . . . . . . . . . . . . . . . . . . . . . . . . . . . . . . . . . . . . . . . . . . . . . . . . . . . . . . . . . . . . . . . . . . . . . . . . . 19 09/16/21 2,551 20,742Euro STOXX 50 Index . . . . . . . . . . . . . . . . . . . . . . . . . . . . . . . . . . . . . . . . . . . . . . . . . . . . . . . . . . . . . . . . . . . . . . . . . . . . . . . . . . . . . . . . . . . . . . . 110 09/17/21 5,337 (35,934)FTSE 100 Index . . . . . . . . . . . . . . . . . . . . . . . . . . . . . . . . . . . . . . . . . . . . . . . . . . . . . . . . . . . . . . . . . . . . . . . . . . . . . . . . . . . . . . . . . . . . . . . . . . . . . 25 09/17/21 2,419 (36,707)
$ (123,997)
Derivative Financial Instruments Categorized by Risk Exposure
As of July 31, 2021, the fair values of derivative financial instruments located in the Statements of Assets and Liabilities were as follows:
EquityContracts
Assets — Derivative Financial InstrumentsFutures contracts
Unrealized appreciation on futures contracts(a) . . . . . . . . . . . . . . . . . . . . . . . . . . . . . . . . . . . . . . . . . . . . . . . . . . . . . . . . . . . . . . . . . . . . . . . . . . . . . . . . . . . . . . . . . . . . . . . . . . . . . . . . . . . . . . . . . $ 20,742
Schedule of Investments (continued)
July 31, 2021
iShares� MSCI Intl Quality Factor ETF(Percentages shown are based on Net Assets)
30 2 0 2 1 I S H A R E S A N N U A L R E P O R T T O S H A R E H O L D E R S

Derivative Financial Instruments Categorized by Risk Exposure (continued)
EquityContracts
Liabilities — Derivative Financial InstrumentsFutures contracts
Unrealized depreciation on futures contracts(a) . . . . . . . . . . . . . . . . . . . . . . . . . . . . . . . . . . . . . . . . . . . . . . . . . . . . . . . . . . . . . . . . . . . . . . . . . . . . . . . . . . . . . . . . . . . . . . . . . . . . . . . . . . . . . . . . . $144,739
(a) Net cumulative appreciation (depreciation) on futures contracts are reported in the Schedule of Investments. In the Statements of Assets and Liabilities, only current day's variationmargin is reported in receivables or payables and the net cumulative unrealized appreciation (depreciation) is included in accumulated earnings (loss).
For the year ended July 31, 2021, the effect of derivative financial instruments in the Statements of Operations was as follows:
EquityContracts
Net Realized Gain (Loss) from:Futures contracts . . . . . . . . . . . . . . . . . . . . . . . . . . . . . . . . . . . . . . . . . . . . . . . . . . . . . . . . . . . . . . . . . . . . . . . . . . . . . . . . . . . . . . . . . . . . . . . . . . . . . . . . . . . . . . . . . . . . . . . . . . . . . . . . . . . . . . . . . . . . . . $3,008,878
Net Change in Unrealized Appreciation (Depreciation) on:Futures contracts . . . . . . . . . . . . . . . . . . . . . . . . . . . . . . . . . . . . . . . . . . . . . . . . . . . . . . . . . . . . . . . . . . . . . . . . . . . . . . . . . . . . . . . . . . . . . . . . . . . . . . . . . . . . . . . . . . . . . . . . . . . . . . . . . . . . . . . . . . . . . . $ 94,690
Average Quarterly Balances of Outstanding Derivative Financial Instruments
Futures contracts:Average notional value of contracts — long . . . . . . . . . . . . . . . . . . . . . . . . . . . . . . . . . . . . . . . . . . . . . . . . . . . . . . . . . . . . . . . . . . . . . . . . . . . . . . . . . . . . . . . . . . . . . . . . . . . . . . . . . . . . . . . $11,062,056
For more information about the Fund’s investment risks regarding derivative financial instruments, refer to the Notes to Financial Statements.
Fair Value Measurements
Various inputs are used in determining the fair value of financial instruments. For description of the input levels and information about the Fund's policy regarding valuationof financial instruments, refer to the Notes to Financial Statements.
The following table summarizes the value of the Fund's investments according to the fair value hierarchy as of July 31, 2021. The breakdown of the Fund's investments intomajor categories is disclosed in the Schedule of Investments above.
Level 1 Level 2 Level 3 Total
InvestmentsAssets
Common Stocks . . . . . . . . . . . . . . . . . . . . . . . . . . . . . . . . . . . . . . . . . . . . . . . . . . . . . . . . . . . . . . . . . . . . . . . . . . . . $ 323,969,772 $3,397,382,790 $ — $3,721,352,562Preferred Stocks . . . . . . . . . . . . . . . . . . . . . . . . . . . . . . . . . . . . . . . . . . . . . . . . . . . . . . . . . . . . . . . . . . . . . . . . . . . . — 7,874,012 — 7,874,012Money Market Funds . . . . . . . . . . . . . . . . . . . . . . . . . . . . . . . . . . . . . . . . . . . . . . . . . . . . . . . . . . . . . . . . . . . . . . . . 1,880,000 — — 1,880,000
$ 325,849,772 $3,405,256,802 $ — $3,731,106,574
Derivative financial instruments(a)
AssetsFutures Contracts . . . . . . . . . . . . . . . . . . . . . . . . . . . . . . . . . . . . . . . . . . . . . . . . . . . . . . . . . . . . . . . . . . . . . . . . . . . $ — $ 20,742 $ — $ 20,742
LiabilitiesFutures Contracts . . . . . . . . . . . . . . . . . . . . . . . . . . . . . . . . . . . . . . . . . . . . . . . . . . . . . . . . . . . . . . . . . . . . . . . . . . . — (144,739) — (144,739)
$ — $ (123,997) $ — $ (123,997)
(a) Shown at the unrealized appreciation (depreciation) on the contracts.
See notes to financial statements.
Schedule of Investments (continued)
July 31, 2021
iShares� MSCI Intl Quality Factor ETF
S C H E D U L E O F I N V E S T M E N T S 31

Security s Value
Common StocksAustralia — 6.9%Afterpay Ltd.(a) . . . . . . . . . . . . . . . . . . . . . . . . . . . . . . . . . . . . . . . . . . . . . . . . 384 $ 27,296AGL Energy Ltd. . . . . . . . . . . . . . . . . . . . . . . . . . . . . . . . . . . . . . . . . . . . . . . 4,348 23,025Ampol Ltd. . . . . . . . . . . . . . . . . . . . . . . . . . . . . . . . . . . . . . . . . . . . . . . . . . . . . 1,180 24,565APA Group. . . . . . . . . . . . . . . . . . . . . . . . . . . . . . . . . . . . . . . . . . . . . . . . . . . . 4,572 32,082Aristocrat Leisure Ltd. . . . . . . . . . . . . . . . . . . . . . . . . . . . . . . . . . . . . . . . . . 952 29,174ASX Ltd. . . . . . . . . . . . . . . . . . . . . . . . . . . . . . . . . . . . . . . . . . . . . . . . . . . . . . . 436 24,699Aurizon Holdings Ltd.. . . . . . . . . . . . . . . . . . . . . . . . . . . . . . . . . . . . . . . . . . 11,312 32,102AusNet Services Ltd. . . . . . . . . . . . . . . . . . . . . . . . . . . . . . . . . . . . . . . . . . . 20,504 27,422Australia & New Zealand Banking Group Ltd. . . . . . . . . . . . . . . . . . . . 1,388 28,258BHP Group Ltd. . . . . . . . . . . . . . . . . . . . . . . . . . . . . . . . . . . . . . . . . . . . . . . . 548 21,525BHP Group PLC . . . . . . . . . . . . . . . . . . . . . . . . . . . . . . . . . . . . . . . . . . . . . . 932 30,175BlueScope Steel Ltd. . . . . . . . . . . . . . . . . . . . . . . . . . . . . . . . . . . . . . . . . . . 1,940 34,403Brambles Ltd. . . . . . . . . . . . . . . . . . . . . . . . . . . . . . . . . . . . . . . . . . . . . . . . . . 2,988 25,582Cochlear Ltd. . . . . . . . . . . . . . . . . . . . . . . . . . . . . . . . . . . . . . . . . . . . . . . . . . 176 31,842Coles Group Ltd. . . . . . . . . . . . . . . . . . . . . . . . . . . . . . . . . . . . . . . . . . . . . . . 1,748 22,496Commonwealth Bank of Australia . . . . . . . . . . . . . . . . . . . . . . . . . . . . . . 404 29,616Computershare Ltd. . . . . . . . . . . . . . . . . . . . . . . . . . . . . . . . . . . . . . . . . . . . 2,892 33,251Crown Resorts Ltd.(a). . . . . . . . . . . . . . . . . . . . . . . . . . . . . . . . . . . . . . . . . . 2,828 17,942CSL Ltd. . . . . . . . . . . . . . . . . . . . . . . . . . . . . . . . . . . . . . . . . . . . . . . . . . . . . . . 100 21,289Dexus/AU. . . . . . . . . . . . . . . . . . . . . . . . . . . . . . . . . . . . . . . . . . . . . . . . . . . . . 4,008 30,277Domino's Pizza Enterprises Ltd. . . . . . . . . . . . . . . . . . . . . . . . . . . . . . . . 340 29,254Endeavour Group Ltd./Australia(a) . . . . . . . . . . . . . . . . . . . . . . . . . . . . . . 816 3,970Evolution Mining Ltd. . . . . . . . . . . . . . . . . . . . . . . . . . . . . . . . . . . . . . . . . . . 7,700 23,418Fortescue Metals Group Ltd.. . . . . . . . . . . . . . . . . . . . . . . . . . . . . . . . . . . 1,392 25,435Glencore PLC. . . . . . . . . . . . . . . . . . . . . . . . . . . . . . . . . . . . . . . . . . . . . . . . . 5,272 23,677Goodman Group . . . . . . . . . . . . . . . . . . . . . . . . . . . . . . . . . . . . . . . . . . . . . . 1,708 28,408GPT Group (The) . . . . . . . . . . . . . . . . . . . . . . . . . . . . . . . . . . . . . . . . . . . . . 6,972 23,905Insurance Australia Group Ltd. . . . . . . . . . . . . . . . . . . . . . . . . . . . . . . . . . 8,432 30,070James Hardie Industries PLC . . . . . . . . . . . . . . . . . . . . . . . . . . . . . . . . . . 784 26,451Lendlease Corp. Ltd. . . . . . . . . . . . . . . . . . . . . . . . . . . . . . . . . . . . . . . . . . . 3,312 29,728Macquarie Group Ltd. . . . . . . . . . . . . . . . . . . . . . . . . . . . . . . . . . . . . . . . . . 224 25,865Magellan Financial Group Ltd. . . . . . . . . . . . . . . . . . . . . . . . . . . . . . . . . . 832 30,018Medibank Pvt Ltd. . . . . . . . . . . . . . . . . . . . . . . . . . . . . . . . . . . . . . . . . . . . . . 11,396 27,793Mirvac Group . . . . . . . . . . . . . . . . . . . . . . . . . . . . . . . . . . . . . . . . . . . . . . . . . 11,948 25,078National Australia Bank Ltd.. . . . . . . . . . . . . . . . . . . . . . . . . . . . . . . . . . . . 1,376 26,240Newcrest Mining Ltd. . . . . . . . . . . . . . . . . . . . . . . . . . . . . . . . . . . . . . . . . . . 1,124 21,724Northern Star Resources Ltd. . . . . . . . . . . . . . . . . . . . . . . . . . . . . . . . . . . 3,416 25,453Oil Search Ltd. . . . . . . . . . . . . . . . . . . . . . . . . . . . . . . . . . . . . . . . . . . . . . . . . 9,124 25,501Orica Ltd. . . . . . . . . . . . . . . . . . . . . . . . . . . . . . . . . . . . . . . . . . . . . . . . . . . . . . 2,788 25,429Origin Energy Ltd. . . . . . . . . . . . . . . . . . . . . . . . . . . . . . . . . . . . . . . . . . . . . . 7,972 24,085Qantas Airways Ltd.(a) . . . . . . . . . . . . . . . . . . . . . . . . . . . . . . . . . . . . . . . . . 8,756 29,517QBE Insurance Group Ltd.. . . . . . . . . . . . . . . . . . . . . . . . . . . . . . . . . . . . . 3,040 24,362Ramsay Health Care Ltd. . . . . . . . . . . . . . . . . . . . . . . . . . . . . . . . . . . . . . . 668 31,592REA Group Ltd. . . . . . . . . . . . . . . . . . . . . . . . . . . . . . . . . . . . . . . . . . . . . . . . 224 26,684Reece Ltd. . . . . . . . . . . . . . . . . . . . . . . . . . . . . . . . . . . . . . . . . . . . . . . . . . . . . 1,632 28,311Rio Tinto Ltd. . . . . . . . . . . . . . . . . . . . . . . . . . . . . . . . . . . . . . . . . . . . . . . . . . 264 25,875Rio Tinto PLC . . . . . . . . . . . . . . . . . . . . . . . . . . . . . . . . . . . . . . . . . . . . . . . . . 300 25,482Santos Ltd. . . . . . . . . . . . . . . . . . . . . . . . . . . . . . . . . . . . . . . . . . . . . . . . . . . . 4,896 23,104Scentre Group . . . . . . . . . . . . . . . . . . . . . . . . . . . . . . . . . . . . . . . . . . . . . . . . 13,276 25,347Seek Ltd. . . . . . . . . . . . . . . . . . . . . . . . . . . . . . . . . . . . . . . . . . . . . . . . . . . . . . 1,252 27,083Sonic Healthcare Ltd. . . . . . . . . . . . . . . . . . . . . . . . . . . . . . . . . . . . . . . . . . 908 26,828South32 Ltd. . . . . . . . . . . . . . . . . . . . . . . . . . . . . . . . . . . . . . . . . . . . . . . . . . . 10,992 24,087Stockland . . . . . . . . . . . . . . . . . . . . . . . . . . . . . . . . . . . . . . . . . . . . . . . . . . . . . 7,236 23,402Suncorp Group Ltd. . . . . . . . . . . . . . . . . . . . . . . . . . . . . . . . . . . . . . . . . . . . 3,272 27,789Sydney Airport(a) . . . . . . . . . . . . . . . . . . . . . . . . . . . . . . . . . . . . . . . . . . . . . . 7,389 42,518Tabcorp Holdings Ltd. . . . . . . . . . . . . . . . . . . . . . . . . . . . . . . . . . . . . . . . . . 8,202 29,938Telstra Corp. Ltd. . . . . . . . . . . . . . . . . . . . . . . . . . . . . . . . . . . . . . . . . . . . . . . 10,080 28,077Transurban Group. . . . . . . . . . . . . . . . . . . . . . . . . . . . . . . . . . . . . . . . . . . . . 2,036 21,475
Security s Value
Australia (continued)Treasury Wine Estates Ltd. . . . . . . . . . . . . . . . . . . . . . . . . . . . . . . . . . . . . 3,044 $ 26,701Vicinity Centres . . . . . . . . . . . . . . . . . . . . . . . . . . . . . . . . . . . . . . . . . . . . . . . 24,212 27,667Washington H Soul Pattinson & Co. Ltd.. . . . . . . . . . . . . . . . . . . . . . . . 1,192 28,698Wesfarmers Ltd. . . . . . . . . . . . . . . . . . . . . . . . . . . . . . . . . . . . . . . . . . . . . . . 680 30,659Westpac Banking Corp. . . . . . . . . . . . . . . . . . . . . . . . . . . . . . . . . . . . . . . . 1,196 21,483WiseTech Global Ltd. . . . . . . . . . . . . . . . . . . . . . . . . . . . . . . . . . . . . . . . . . . 1,448 32,844Woodside Petroleum Ltd. . . . . . . . . . . . . . . . . . . . . . . . . . . . . . . . . . . . . . . 1,528 24,546Woolworths Group Ltd. . . . . . . . . . . . . . . . . . . . . . . . . . . . . . . . . . . . . . . . . 816 23,343
1,755,935Austria — 0.5%Erste Group Bank AG . . . . . . . . . . . . . . . . . . . . . . . . . . . . . . . . . . . . . . . . . 648 25,111OMV AG. . . . . . . . . . . . . . . . . . . . . . . . . . . . . . . . . . . . . . . . . . . . . . . . . . . . . . 424 22,894Raiffeisen Bank International AG . . . . . . . . . . . . . . . . . . . . . . . . . . . . . . . 1,232 29,130Verbund AG. . . . . . . . . . . . . . . . . . . . . . . . . . . . . . . . . . . . . . . . . . . . . . . . . . . 356 32,837voestalpine AG. . . . . . . . . . . . . . . . . . . . . . . . . . . . . . . . . . . . . . . . . . . . . . . . 616 27,175
137,147Belgium — 1.3%Ageas SA/NV . . . . . . . . . . . . . . . . . . . . . . . . . . . . . . . . . . . . . . . . . . . . . . . . . 492 25,980Anheuser-Busch InBev SA/NV . . . . . . . . . . . . . . . . . . . . . . . . . . . . . . . . . 316 19,944Elia Group SA/NV . . . . . . . . . . . . . . . . . . . . . . . . . . . . . . . . . . . . . . . . . . . . . 268 31,675Etablissements Franz Colruyt NV . . . . . . . . . . . . . . . . . . . . . . . . . . . . . . 420 23,880Groupe Bruxelles Lambert SA . . . . . . . . . . . . . . . . . . . . . . . . . . . . . . . . . 240 27,924KBC Group NV. . . . . . . . . . . . . . . . . . . . . . . . . . . . . . . . . . . . . . . . . . . . . . . . 324 26,089Proximus SADP. . . . . . . . . . . . . . . . . . . . . . . . . . . . . . . . . . . . . . . . . . . . . . . 1,436 29,510Sofina SA. . . . . . . . . . . . . . . . . . . . . . . . . . . . . . . . . . . . . . . . . . . . . . . . . . . . . 80 37,511Solvay SA . . . . . . . . . . . . . . . . . . . . . . . . . . . . . . . . . . . . . . . . . . . . . . . . . . . . 212 28,314UCB SA . . . . . . . . . . . . . . . . . . . . . . . . . . . . . . . . . . . . . . . . . . . . . . . . . . . . . . 312 33,745Umicore SA. . . . . . . . . . . . . . . . . . . . . . . . . . . . . . . . . . . . . . . . . . . . . . . . . . . 548 34,013
318,585Canada — 9.8%Agnico Eagle Mines Ltd. . . . . . . . . . . . . . . . . . . . . . . . . . . . . . . . . . . . . . . . 364 23,548Air Canada(a) . . . . . . . . . . . . . . . . . . . . . . . . . . . . . . . . . . . . . . . . . . . . . . . . . 1,364 27,311Algonquin Power & Utilities Corp. . . . . . . . . . . . . . . . . . . . . . . . . . . . . . . 2,360 37,606Alimentation Couche-Tard Inc., Class B . . . . . . . . . . . . . . . . . . . . . . . . 696 28,055AltaGas Ltd. . . . . . . . . . . . . . . . . . . . . . . . . . . . . . . . . . . . . . . . . . . . . . . . . . . 1,420 30,060Atco Ltd., Class I, NVS . . . . . . . . . . . . . . . . . . . . . . . . . . . . . . . . . . . . . . . . 788 28,473B2Gold Corp. . . . . . . . . . . . . . . . . . . . . . . . . . . . . . . . . . . . . . . . . . . . . . . . . . 5,996 25,136Ballard Power Systems Inc.(a). . . . . . . . . . . . . . . . . . . . . . . . . . . . . . . . . . 1,972 31,929Bank of Montreal . . . . . . . . . . . . . . . . . . . . . . . . . . . . . . . . . . . . . . . . . . . . . . 256 25,348Bank of Nova Scotia (The) . . . . . . . . . . . . . . . . . . . . . . . . . . . . . . . . . . . . . 320 19,973Barrick Gold Corp. . . . . . . . . . . . . . . . . . . . . . . . . . . . . . . . . . . . . . . . . . . . . 936 20,377Bausch Health Cos Inc.(a). . . . . . . . . . . . . . . . . . . . . . . . . . . . . . . . . . . . . . 960 28,086BCE Inc. . . . . . . . . . . . . . . . . . . . . . . . . . . . . . . . . . . . . . . . . . . . . . . . . . . . . . . 528 26,353BlackBerry Ltd.(a). . . . . . . . . . . . . . . . . . . . . . . . . . . . . . . . . . . . . . . . . . . . . . 3,444 35,058Brookfield Asset Management Inc., Class A. . . . . . . . . . . . . . . . . . . . . 532 28,719Brookfield Renewable Corp., Class A. . . . . . . . . . . . . . . . . . . . . . . . . . . 714 30,298CAE Inc.(a) . . . . . . . . . . . . . . . . . . . . . . . . . . . . . . . . . . . . . . . . . . . . . . . . . . . . 1,060 32,345Cameco Corp. . . . . . . . . . . . . . . . . . . . . . . . . . . . . . . . . . . . . . . . . . . . . . . . . 1,372 24,403Canadian Apartment Properties REIT . . . . . . . . . . . . . . . . . . . . . . . . . . 616 30,785Canadian Imperial Bank of Commerce . . . . . . . . . . . . . . . . . . . . . . . . . 236 27,442Canadian National Railway Co. . . . . . . . . . . . . . . . . . . . . . . . . . . . . . . . . 232 25,208Canadian Natural Resources Ltd. . . . . . . . . . . . . . . . . . . . . . . . . . . . . . . 620 20,460Canadian Pacific Railway Ltd. . . . . . . . . . . . . . . . . . . . . . . . . . . . . . . . . . 340 25,247Canadian Tire Corp. Ltd., Class A, NVS . . . . . . . . . . . . . . . . . . . . . . . . 156 24,000Canadian Utilities Ltd., Class A, NVS. . . . . . . . . . . . . . . . . . . . . . . . . . . 996 29,179Canopy Growth Corp.(a) . . . . . . . . . . . . . . . . . . . . . . . . . . . . . . . . . . . . . . . 1,140 21,592CCL Industries Inc., Class B, NVS . . . . . . . . . . . . . . . . . . . . . . . . . . . . . 520 29,822Cenovus Energy Inc. . . . . . . . . . . . . . . . . . . . . . . . . . . . . . . . . . . . . . . . . . . 3,148 26,267CGI Inc.(a) . . . . . . . . . . . . . . . . . . . . . . . . . . . . . . . . . . . . . . . . . . . . . . . . . . . . 360 32,748
Schedule of InvestmentsJuly 31, 2021
iShares� MSCI Intl Size Factor ETF(Percentages shown are based on Net Assets)
32 2 0 2 1 I S H A R E S A N N U A L R E P O R T T O S H A R E H O L D E R S

Security s Value
Canada (continued)Constellation Software Inc. . . . . . . . . . . . . . . . . . . . . . . . . . . . . . . . . . . . . 20 $ 32,036Dollarama Inc. . . . . . . . . . . . . . . . . . . . . . . . . . . . . . . . . . . . . . . . . . . . . . . . . 628 29,573Emera Inc. . . . . . . . . . . . . . . . . . . . . . . . . . . . . . . . . . . . . . . . . . . . . . . . . . . . . 568 26,492Empire Co. Ltd., Class A, NVS . . . . . . . . . . . . . . . . . . . . . . . . . . . . . . . . . 868 28,504Enbridge Inc.. . . . . . . . . . . . . . . . . . . . . . . . . . . . . . . . . . . . . . . . . . . . . . . . . . 792 31,220Fairfax Financial Holdings Ltd. . . . . . . . . . . . . . . . . . . . . . . . . . . . . . . . . . 68 28,644First Quantum Minerals Ltd. . . . . . . . . . . . . . . . . . . . . . . . . . . . . . . . . . . . 1,052 22,531FirstService Corp. . . . . . . . . . . . . . . . . . . . . . . . . . . . . . . . . . . . . . . . . . . . . . 168 31,292Fortis Inc. . . . . . . . . . . . . . . . . . . . . . . . . . . . . . . . . . . . . . . . . . . . . . . . . . . . . . 608 27,573Franco-Nevada Corp. . . . . . . . . . . . . . . . . . . . . . . . . . . . . . . . . . . . . . . . . . 200 31,989George Weston Ltd. . . . . . . . . . . . . . . . . . . . . . . . . . . . . . . . . . . . . . . . . . . . 320 33,185GFL Environmental Inc. . . . . . . . . . . . . . . . . . . . . . . . . . . . . . . . . . . . . . . . 952 33,163Gildan Activewear Inc. . . . . . . . . . . . . . . . . . . . . . . . . . . . . . . . . . . . . . . . . . 784 27,028Great-West Lifeco Inc.. . . . . . . . . . . . . . . . . . . . . . . . . . . . . . . . . . . . . . . . . 960 28,886Hydro One Ltd.(b). . . . . . . . . . . . . . . . . . . . . . . . . . . . . . . . . . . . . . . . . . . . . . 1,092 26,959iA Financial Corp. Inc. . . . . . . . . . . . . . . . . . . . . . . . . . . . . . . . . . . . . . . . . . 540 29,874IGM Financial Inc. . . . . . . . . . . . . . . . . . . . . . . . . . . . . . . . . . . . . . . . . . . . . . 748 26,398Imperial Oil Ltd. . . . . . . . . . . . . . . . . . . . . . . . . . . . . . . . . . . . . . . . . . . . . . . . 784 21,479Intact Financial Corp. . . . . . . . . . . . . . . . . . . . . . . . . . . . . . . . . . . . . . . . . . . 204 27,797Inter Pipeline Ltd. . . . . . . . . . . . . . . . . . . . . . . . . . . . . . . . . . . . . . . . . . . . . . 1,734 27,770Ivanhoe Mines Ltd., Class A(a) . . . . . . . . . . . . . . . . . . . . . . . . . . . . . . . . . 3,740 27,759Keyera Corp.. . . . . . . . . . . . . . . . . . . . . . . . . . . . . . . . . . . . . . . . . . . . . . . . . . 1,124 30,091Kinross Gold Corp. . . . . . . . . . . . . . . . . . . . . . . . . . . . . . . . . . . . . . . . . . . . . 3,068 20,091Kirkland Lake Gold Ltd.. . . . . . . . . . . . . . . . . . . . . . . . . . . . . . . . . . . . . . . . 588 25,144Lightspeed POS Inc.(a) . . . . . . . . . . . . . . . . . . . . . . . . . . . . . . . . . . . . . . . . 488 41,787Loblaw Companies Ltd.. . . . . . . . . . . . . . . . . . . . . . . . . . . . . . . . . . . . . . . . 450 30,442Lundin Mining Corp. . . . . . . . . . . . . . . . . . . . . . . . . . . . . . . . . . . . . . . . . . . . 2,496 22,747Magna International Inc. . . . . . . . . . . . . . . . . . . . . . . . . . . . . . . . . . . . . . . . 268 22,469Manulife Financial Corp. . . . . . . . . . . . . . . . . . . . . . . . . . . . . . . . . . . . . . . . 1,224 23,664Metro Inc.. . . . . . . . . . . . . . . . . . . . . . . . . . . . . . . . . . . . . . . . . . . . . . . . . . . . . 540 28,004National Bank of Canada . . . . . . . . . . . . . . . . . . . . . . . . . . . . . . . . . . . . . . 304 23,268Northland Power Inc. . . . . . . . . . . . . . . . . . . . . . . . . . . . . . . . . . . . . . . . . . . 820 28,775Nutrien Ltd. . . . . . . . . . . . . . . . . . . . . . . . . . . . . . . . . . . . . . . . . . . . . . . . . . . . 412 24,497Nuvei Corp.(a)(b) . . . . . . . . . . . . . . . . . . . . . . . . . . . . . . . . . . . . . . . . . . . . . . . 424 34,832Onex Corp. . . . . . . . . . . . . . . . . . . . . . . . . . . . . . . . . . . . . . . . . . . . . . . . . . . . 460 35,064Open Text Corp.. . . . . . . . . . . . . . . . . . . . . . . . . . . . . . . . . . . . . . . . . . . . . . . 608 31,579Pan American Silver Corp. . . . . . . . . . . . . . . . . . . . . . . . . . . . . . . . . . . . . . 812 22,799Parkland Corp./Canada. . . . . . . . . . . . . . . . . . . . . . . . . . . . . . . . . . . . . . . . 792 25,209Pembina Pipeline Corp. . . . . . . . . . . . . . . . . . . . . . . . . . . . . . . . . . . . . . . . 1,004 33,188Power Corp. of Canada. . . . . . . . . . . . . . . . . . . . . . . . . . . . . . . . . . . . . . . . 684 21,831Quebecor Inc., Class B . . . . . . . . . . . . . . . . . . . . . . . . . . . . . . . . . . . . . . . . 912 23,860Restaurant Brands International Inc. . . . . . . . . . . . . . . . . . . . . . . . . . . . 396 27,018RioCan REIT. . . . . . . . . . . . . . . . . . . . . . . . . . . . . . . . . . . . . . . . . . . . . . . . . . 1,768 32,013Ritchie Bros Auctioneers Inc. . . . . . . . . . . . . . . . . . . . . . . . . . . . . . . . . . . 380 22,686Rogers Communications Inc., Class B, NVS . . . . . . . . . . . . . . . . . . . . 504 25,725Royal Bank of Canada. . . . . . . . . . . . . . . . . . . . . . . . . . . . . . . . . . . . . . . . . 192 19,419Saputo Inc. . . . . . . . . . . . . . . . . . . . . . . . . . . . . . . . . . . . . . . . . . . . . . . . . . . . 952 27,470Shaw Communications Inc., Class B, NVS . . . . . . . . . . . . . . . . . . . . . 928 27,105Shopify Inc., Class A(a) . . . . . . . . . . . . . . . . . . . . . . . . . . . . . . . . . . . . . . . . 24 36,031Sun Life Financial Inc. . . . . . . . . . . . . . . . . . . . . . . . . . . . . . . . . . . . . . . . . . 476 24,792Suncor Energy Inc. . . . . . . . . . . . . . . . . . . . . . . . . . . . . . . . . . . . . . . . . . . . . 1,120 22,048TC Energy Corp. . . . . . . . . . . . . . . . . . . . . . . . . . . . . . . . . . . . . . . . . . . . . . . 560 27,300Teck Resources Ltd., Class B . . . . . . . . . . . . . . . . . . . . . . . . . . . . . . . . . . 1,024 23,376TELUS Corp. . . . . . . . . . . . . . . . . . . . . . . . . . . . . . . . . . . . . . . . . . . . . . . . . . 1,264 28,074Thomson Reuters Corp. . . . . . . . . . . . . . . . . . . . . . . . . . . . . . . . . . . . . . . . 272 28,822TMX Group Ltd. . . . . . . . . . . . . . . . . . . . . . . . . . . . . . . . . . . . . . . . . . . . . . . . 260 28,553Toromont Industries Ltd. . . . . . . . . . . . . . . . . . . . . . . . . . . . . . . . . . . . . . . . 344 29,070Toronto-Dominion Bank (The). . . . . . . . . . . . . . . . . . . . . . . . . . . . . . . . . . 280 18,617West Fraser Timber Co. Ltd. . . . . . . . . . . . . . . . . . . . . . . . . . . . . . . . . . . . 356 25,536Wheaton Precious Metals Corp.. . . . . . . . . . . . . . . . . . . . . . . . . . . . . . . . 568 26,237
Security s Value
Canada (continued)WSP Global Inc. . . . . . . . . . . . . . . . . . . . . . . . . . . . . . . . . . . . . . . . . . . . . . . 252 $ 29,912Yamana Gold Inc. . . . . . . . . . . . . . . . . . . . . . . . . . . . . . . . . . . . . . . . . . . . . . 5,204 23,317
2,498,442Denmark — 2.0%Ambu A/S, Class B . . . . . . . . . . . . . . . . . . . . . . . . . . . . . . . . . . . . . . . . . . . . 752 27,821AP Moller - Maersk A/S, Class A . . . . . . . . . . . . . . . . . . . . . . . . . . . . . . . 4 10,694AP Moller - Maersk A/S, Class B, NVS . . . . . . . . . . . . . . . . . . . . . . . . . 8 22,202Carlsberg A/S, Class B . . . . . . . . . . . . . . . . . . . . . . . . . . . . . . . . . . . . . . . . 144 26,609Chr Hansen Holding A/S. . . . . . . . . . . . . . . . . . . . . . . . . . . . . . . . . . . . . . . 332 29,859Coloplast A/S, Class B. . . . . . . . . . . . . . . . . . . . . . . . . . . . . . . . . . . . . . . . . 160 29,258Danske Bank A/S . . . . . . . . . . . . . . . . . . . . . . . . . . . . . . . . . . . . . . . . . . . . . 1,368 23,976Demant A/S(a) . . . . . . . . . . . . . . . . . . . . . . . . . . . . . . . . . . . . . . . . . . . . . . . . . 668 40,826DSV Panalpina A/S. . . . . . . . . . . . . . . . . . . . . . . . . . . . . . . . . . . . . . . . . . . . 108 26,327Genmab A/S(a) . . . . . . . . . . . . . . . . . . . . . . . . . . . . . . . . . . . . . . . . . . . . . . . . 72 32,542GN Store Nord A/S . . . . . . . . . . . . . . . . . . . . . . . . . . . . . . . . . . . . . . . . . . . . 292 25,589Novo Nordisk A/S, Class B. . . . . . . . . . . . . . . . . . . . . . . . . . . . . . . . . . . . . 364 33,696Novozymes A/S, Class B . . . . . . . . . . . . . . . . . . . . . . . . . . . . . . . . . . . . . . 404 31,740Orsted A/S(b) . . . . . . . . . . . . . . . . . . . . . . . . . . . . . . . . . . . . . . . . . . . . . . . . . . 184 27,291Pandora A/S . . . . . . . . . . . . . . . . . . . . . . . . . . . . . . . . . . . . . . . . . . . . . . . . . . 240 31,046Rockwool International A/S, Class B. . . . . . . . . . . . . . . . . . . . . . . . . . . . 60 31,838Tryg A/S . . . . . . . . . . . . . . . . . . . . . . . . . . . . . . . . . . . . . . . . . . . . . . . . . . . . . . 1,022 25,258Vestas Wind Systems A/S . . . . . . . . . . . . . . . . . . . . . . . . . . . . . . . . . . . . . 600 22,125
498,697Finland — 1.3%Elisa OYJ . . . . . . . . . . . . . . . . . . . . . . . . . . . . . . . . . . . . . . . . . . . . . . . . . . . . . 444 28,536Fortum OYJ. . . . . . . . . . . . . . . . . . . . . . . . . . . . . . . . . . . . . . . . . . . . . . . . . . . 788 21,710Kesko OYJ, Class B. . . . . . . . . . . . . . . . . . . . . . . . . . . . . . . . . . . . . . . . . . . 900 38,576Kone OYJ, Class B. . . . . . . . . . . . . . . . . . . . . . . . . . . . . . . . . . . . . . . . . . . . 284 23,523Neste OYJ . . . . . . . . . . . . . . . . . . . . . . . . . . . . . . . . . . . . . . . . . . . . . . . . . . . . 356 21,884Nokia OYJ(a) . . . . . . . . . . . . . . . . . . . . . . . . . . . . . . . . . . . . . . . . . . . . . . . . . . 5,148 31,631Nordea Bank Abp . . . . . . . . . . . . . . . . . . . . . . . . . . . . . . . . . . . . . . . . . . . . . 2,633 30,833Orion OYJ, Class B . . . . . . . . . . . . . . . . . . . . . . . . . . . . . . . . . . . . . . . . . . . 576 24,518Sampo OYJ, Class A . . . . . . . . . . . . . . . . . . . . . . . . . . . . . . . . . . . . . . . . . . 572 27,529Stora Enso OYJ, Class R . . . . . . . . . . . . . . . . . . . . . . . . . . . . . . . . . . . . . . 1,404 27,801UPM-Kymmene OYJ . . . . . . . . . . . . . . . . . . . . . . . . . . . . . . . . . . . . . . . . . . 736 30,077Wartsila OYJ Abp . . . . . . . . . . . . . . . . . . . . . . . . . . . . . . . . . . . . . . . . . . . . . 2,260 34,046
340,664France — 7.3%Accor SA(a) . . . . . . . . . . . . . . . . . . . . . . . . . . . . . . . . . . . . . . . . . . . . . . . . . . . 696 24,631Aeroports de Paris(a) . . . . . . . . . . . . . . . . . . . . . . . . . . . . . . . . . . . . . . . . . . 188 22,789Air Liquide SA. . . . . . . . . . . . . . . . . . . . . . . . . . . . . . . . . . . . . . . . . . . . . . . . . 152 26,434Airbus SE(a). . . . . . . . . . . . . . . . . . . . . . . . . . . . . . . . . . . . . . . . . . . . . . . . . . . 204 27,982Alstom SA(a) . . . . . . . . . . . . . . . . . . . . . . . . . . . . . . . . . . . . . . . . . . . . . . . . . . 484 20,075Amundi SA(b) . . . . . . . . . . . . . . . . . . . . . . . . . . . . . . . . . . . . . . . . . . . . . . . . . 288 26,598Arkema SA . . . . . . . . . . . . . . . . . . . . . . . . . . . . . . . . . . . . . . . . . . . . . . . . . . . 208 26,475Atos SE . . . . . . . . . . . . . . . . . . . . . . . . . . . . . . . . . . . . . . . . . . . . . . . . . . . . . . 472 22,572AXA SA. . . . . . . . . . . . . . . . . . . . . . . . . . . . . . . . . . . . . . . . . . . . . . . . . . . . . . . 1,000 25,897BioMerieux . . . . . . . . . . . . . . . . . . . . . . . . . . . . . . . . . . . . . . . . . . . . . . . . . . . 248 29,571BNP Paribas SA . . . . . . . . . . . . . . . . . . . . . . . . . . . . . . . . . . . . . . . . . . . . . . 324 19,757Bollore SA . . . . . . . . . . . . . . . . . . . . . . . . . . . . . . . . . . . . . . . . . . . . . . . . . . . . 5,472 30,579Bouygues SA . . . . . . . . . . . . . . . . . . . . . . . . . . . . . . . . . . . . . . . . . . . . . . . . . 568 21,891Bureau Veritas SA. . . . . . . . . . . . . . . . . . . . . . . . . . . . . . . . . . . . . . . . . . . . . 868 28,665Capgemini SE . . . . . . . . . . . . . . . . . . . . . . . . . . . . . . . . . . . . . . . . . . . . . . . . 172 37,178Carrefour SA. . . . . . . . . . . . . . . . . . . . . . . . . . . . . . . . . . . . . . . . . . . . . . . . . . 1,344 24,964Cie. de Saint-Gobain . . . . . . . . . . . . . . . . . . . . . . . . . . . . . . . . . . . . . . . . . . 480 34,310Cie. Generale des Etablissements Michelin SCA. . . . . . . . . . . . . . . . 160 26,135CNP Assurances . . . . . . . . . . . . . . . . . . . . . . . . . . . . . . . . . . . . . . . . . . . . . . 1,572 26,721Covivio . . . . . . . . . . . . . . . . . . . . . . . . . . . . . . . . . . . . . . . . . . . . . . . . . . . . . . . 264 24,800Credit Agricole SA. . . . . . . . . . . . . . . . . . . . . . . . . . . . . . . . . . . . . . . . . . . . . 1,464 20,413
Schedule of Investments (continued)
July 31, 2021
iShares� MSCI Intl Size Factor ETF(Percentages shown are based on Net Assets)
S C H E D U L E O F I N V E S T M E N T S 33

Security s Value
France (continued)Danone SA . . . . . . . . . . . . . . . . . . . . . . . . . . . . . . . . . . . . . . . . . . . . . . . . . . . 336 $ 24,714Dassault Aviation SA . . . . . . . . . . . . . . . . . . . . . . . . . . . . . . . . . . . . . . . . . . 24 28,576Dassault Systemes SE . . . . . . . . . . . . . . . . . . . . . . . . . . . . . . . . . . . . . . . . 700 38,613Edenred . . . . . . . . . . . . . . . . . . . . . . . . . . . . . . . . . . . . . . . . . . . . . . . . . . . . . . 464 26,956Eiffage SA . . . . . . . . . . . . . . . . . . . . . . . . . . . . . . . . . . . . . . . . . . . . . . . . . . . . 240 24,467Electricite de France SA . . . . . . . . . . . . . . . . . . . . . . . . . . . . . . . . . . . . . . . 1,612 19,569Engie SA . . . . . . . . . . . . . . . . . . . . . . . . . . . . . . . . . . . . . . . . . . . . . . . . . . . . . 1,592 21,230EssilorLuxottica SA. . . . . . . . . . . . . . . . . . . . . . . . . . . . . . . . . . . . . . . . . . . . 164 30,960Eurazeo SE. . . . . . . . . . . . . . . . . . . . . . . . . . . . . . . . . . . . . . . . . . . . . . . . . . . 340 32,933Eurofins Scientific SE . . . . . . . . . . . . . . . . . . . . . . . . . . . . . . . . . . . . . . . . . 280 33,491Faurecia SE . . . . . . . . . . . . . . . . . . . . . . . . . . . . . . . . . . . . . . . . . . . . . . . . . . 556 24,816Gecina SA . . . . . . . . . . . . . . . . . . . . . . . . . . . . . . . . . . . . . . . . . . . . . . . . . . . . 204 32,353Getlink SE . . . . . . . . . . . . . . . . . . . . . . . . . . . . . . . . . . . . . . . . . . . . . . . . . . . . 1,740 27,872Hermes International . . . . . . . . . . . . . . . . . . . . . . . . . . . . . . . . . . . . . . . . . . 28 42,806Iliad SA . . . . . . . . . . . . . . . . . . . . . . . . . . . . . . . . . . . . . . . . . . . . . . . . . . . . . . . 156 33,619Ipsen SA. . . . . . . . . . . . . . . . . . . . . . . . . . . . . . . . . . . . . . . . . . . . . . . . . . . . . . 252 26,929Kering SA. . . . . . . . . . . . . . . . . . . . . . . . . . . . . . . . . . . . . . . . . . . . . . . . . . . . . 32 28,708Klepierre SA . . . . . . . . . . . . . . . . . . . . . . . . . . . . . . . . . . . . . . . . . . . . . . . . . . 1,004 24,309La Francaise des Jeux SAEM(b). . . . . . . . . . . . . . . . . . . . . . . . . . . . . . . . 596 31,863Legrand SA . . . . . . . . . . . . . . . . . . . . . . . . . . . . . . . . . . . . . . . . . . . . . . . . . . . 272 30,653L'Oreal SA . . . . . . . . . . . . . . . . . . . . . . . . . . . . . . . . . . . . . . . . . . . . . . . . . . . . 68 31,110LVMH Moet Hennessy Louis Vuitton SE . . . . . . . . . . . . . . . . . . . . . . . . 36 28,824Orange SA. . . . . . . . . . . . . . . . . . . . . . . . . . . . . . . . . . . . . . . . . . . . . . . . . . . . 1,744 19,409Orpea SA. . . . . . . . . . . . . . . . . . . . . . . . . . . . . . . . . . . . . . . . . . . . . . . . . . . . . 180 22,858Pernod Ricard SA . . . . . . . . . . . . . . . . . . . . . . . . . . . . . . . . . . . . . . . . . . . . . 120 26,485Publicis Groupe SA . . . . . . . . . . . . . . . . . . . . . . . . . . . . . . . . . . . . . . . . . . . 512 32,323Remy Cointreau SA . . . . . . . . . . . . . . . . . . . . . . . . . . . . . . . . . . . . . . . . . . . 132 28,997Renault SA(a) . . . . . . . . . . . . . . . . . . . . . . . . . . . . . . . . . . . . . . . . . . . . . . . . . 592 22,485Safran SA . . . . . . . . . . . . . . . . . . . . . . . . . . . . . . . . . . . . . . . . . . . . . . . . . . . . 152 19,893Sanofi . . . . . . . . . . . . . . . . . . . . . . . . . . . . . . . . . . . . . . . . . . . . . . . . . . . . . . . . 208 21,439Sartorius Stedim Biotech . . . . . . . . . . . . . . . . . . . . . . . . . . . . . . . . . . . . . . 64 36,534Schneider Electric SE . . . . . . . . . . . . . . . . . . . . . . . . . . . . . . . . . . . . . . . . . 160 26,798SCOR SE. . . . . . . . . . . . . . . . . . . . . . . . . . . . . . . . . . . . . . . . . . . . . . . . . . . . . 692 19,325SEB SA . . . . . . . . . . . . . . . . . . . . . . . . . . . . . . . . . . . . . . . . . . . . . . . . . . . . . . 150 24,924Societe Generale SA . . . . . . . . . . . . . . . . . . . . . . . . . . . . . . . . . . . . . . . . . . 736 21,554Sodexo SA(a) . . . . . . . . . . . . . . . . . . . . . . . . . . . . . . . . . . . . . . . . . . . . . . . . . 300 25,562Suez SA . . . . . . . . . . . . . . . . . . . . . . . . . . . . . . . . . . . . . . . . . . . . . . . . . . . . . . 1,224 28,552Teleperformance . . . . . . . . . . . . . . . . . . . . . . . . . . . . . . . . . . . . . . . . . . . . . . 72 30,369Thales SA . . . . . . . . . . . . . . . . . . . . . . . . . . . . . . . . . . . . . . . . . . . . . . . . . . . . 244 25,609TotalEnergies SE. . . . . . . . . . . . . . . . . . . . . . . . . . . . . . . . . . . . . . . . . . . . . . 524 22,850Ubisoft Entertainment SA(a) . . . . . . . . . . . . . . . . . . . . . . . . . . . . . . . . . . . . 444 28,147Unibail-Rodamco-Westfield(a) . . . . . . . . . . . . . . . . . . . . . . . . . . . . . . . . . . 312 25,970Valeo . . . . . . . . . . . . . . . . . . . . . . . . . . . . . . . . . . . . . . . . . . . . . . . . . . . . . . . . . 944 27,296Veolia Environnement SA. . . . . . . . . . . . . . . . . . . . . . . . . . . . . . . . . . . . . . 856 28,075Vinci SA . . . . . . . . . . . . . . . . . . . . . . . . . . . . . . . . . . . . . . . . . . . . . . . . . . . . . . 220 23,292Vivendi SE. . . . . . . . . . . . . . . . . . . . . . . . . . . . . . . . . . . . . . . . . . . . . . . . . . . . 752 25,407Wendel SE . . . . . . . . . . . . . . . . . . . . . . . . . . . . . . . . . . . . . . . . . . . . . . . . . . . 208 29,196Worldline SA(a)(b) . . . . . . . . . . . . . . . . . . . . . . . . . . . . . . . . . . . . . . . . . . . . . . 269 25,178
1,862,335Germany — 5.7%adidas AG . . . . . . . . . . . . . . . . . . . . . . . . . . . . . . . . . . . . . . . . . . . . . . . . . . . . 72 26,133Allianz SE, Registered. . . . . . . . . . . . . . . . . . . . . . . . . . . . . . . . . . . . . . . . . 92 22,868Aroundtown SA . . . . . . . . . . . . . . . . . . . . . . . . . . . . . . . . . . . . . . . . . . . . . . . 3,608 28,240BASF SE . . . . . . . . . . . . . . . . . . . . . . . . . . . . . . . . . . . . . . . . . . . . . . . . . . . . . 316 24,831Bayer AG, Registered . . . . . . . . . . . . . . . . . . . . . . . . . . . . . . . . . . . . . . . . . 396 23,593Bayerische Motoren Werke AG . . . . . . . . . . . . . . . . . . . . . . . . . . . . . . . . 192 19,091Bechtle AG . . . . . . . . . . . . . . . . . . . . . . . . . . . . . . . . . . . . . . . . . . . . . . . . . . . 172 35,515Beiersdorf AG. . . . . . . . . . . . . . . . . . . . . . . . . . . . . . . . . . . . . . . . . . . . . . . . . 236 28,031Brenntag SE . . . . . . . . . . . . . . . . . . . . . . . . . . . . . . . . . . . . . . . . . . . . . . . . . . 300 29,964Carl Zeiss Meditec AG, Bearer . . . . . . . . . . . . . . . . . . . . . . . . . . . . . . . . . 184 40,979
Security s Value
Germany (continued)Commerzbank AG(a). . . . . . . . . . . . . . . . . . . . . . . . . . . . . . . . . . . . . . . . . . . 3,908 $ 25,167Continental AG(a). . . . . . . . . . . . . . . . . . . . . . . . . . . . . . . . . . . . . . . . . . . . . . 164 22,279Covestro AG(b) . . . . . . . . . . . . . . . . . . . . . . . . . . . . . . . . . . . . . . . . . . . . . . . . 436 28,088Daimler AG, Registered . . . . . . . . . . . . . . . . . . . . . . . . . . . . . . . . . . . . . . . 296 26,415Delivery Hero SE(a)(b). . . . . . . . . . . . . . . . . . . . . . . . . . . . . . . . . . . . . . . . . . 204 30,496Deutsche Bank AG, Registered(a) . . . . . . . . . . . . . . . . . . . . . . . . . . . . . . 1,896 23,901Deutsche Boerse AG . . . . . . . . . . . . . . . . . . . . . . . . . . . . . . . . . . . . . . . . . . 152 25,363Deutsche Lufthansa AG, Registered(a)(c). . . . . . . . . . . . . . . . . . . . . . . . 2,120 23,944Deutsche Post AG, Registered. . . . . . . . . . . . . . . . . . . . . . . . . . . . . . . . . 384 26,024Deutsche Telekom AG, Registered . . . . . . . . . . . . . . . . . . . . . . . . . . . . . 1,232 25,569Deutsche Wohnen SE . . . . . . . . . . . . . . . . . . . . . . . . . . . . . . . . . . . . . . . . . 460 28,719E.ON SE. . . . . . . . . . . . . . . . . . . . . . . . . . . . . . . . . . . . . . . . . . . . . . . . . . . . . . 2,156 26,505Evonik Industries AG . . . . . . . . . . . . . . . . . . . . . . . . . . . . . . . . . . . . . . . . . . 816 28,372Fresenius Medical Care AG & Co. KGaA . . . . . . . . . . . . . . . . . . . . . . . 268 21,124Fresenius SE & Co. KGaA. . . . . . . . . . . . . . . . . . . . . . . . . . . . . . . . . . . . . 428 22,496GEA Group AG. . . . . . . . . . . . . . . . . . . . . . . . . . . . . . . . . . . . . . . . . . . . . . . . 712 31,570Hannover Rueck SE. . . . . . . . . . . . . . . . . . . . . . . . . . . . . . . . . . . . . . . . . . . 136 22,859HeidelbergCement AG. . . . . . . . . . . . . . . . . . . . . . . . . . . . . . . . . . . . . . . . . 316 28,003HelloFresh SE(a) . . . . . . . . . . . . . . . . . . . . . . . . . . . . . . . . . . . . . . . . . . . . . . 324 30,372Henkel AG & Co. KGaA . . . . . . . . . . . . . . . . . . . . . . . . . . . . . . . . . . . . . . . 76 6,910Infineon Technologies AG. . . . . . . . . . . . . . . . . . . . . . . . . . . . . . . . . . . . . . 708 27,056KION Group AG. . . . . . . . . . . . . . . . . . . . . . . . . . . . . . . . . . . . . . . . . . . . . . . 280 29,734Knorr-Bremse AG . . . . . . . . . . . . . . . . . . . . . . . . . . . . . . . . . . . . . . . . . . . . . 200 22,648LANXESS AG. . . . . . . . . . . . . . . . . . . . . . . . . . . . . . . . . . . . . . . . . . . . . . . . . 368 26,652LEG Immobilien SE . . . . . . . . . . . . . . . . . . . . . . . . . . . . . . . . . . . . . . . . . . . 228 36,035Merck KGaA . . . . . . . . . . . . . . . . . . . . . . . . . . . . . . . . . . . . . . . . . . . . . . . . . . 140 28,659MTU Aero Engines AG . . . . . . . . . . . . . . . . . . . . . . . . . . . . . . . . . . . . . . . . 96 24,013Muenchener Rueckversicherungs-Gesellschaft AG in
Muenchen, Registered. . . . . . . . . . . . . . . . . . . . . . . . . . . . . . . . . . . . . . 76 20,507Nemetschek SE. . . . . . . . . . . . . . . . . . . . . . . . . . . . . . . . . . . . . . . . . . . . . . . 376 33,181Puma SE . . . . . . . . . . . . . . . . . . . . . . . . . . . . . . . . . . . . . . . . . . . . . . . . . . . . . 236 28,950Rational AG. . . . . . . . . . . . . . . . . . . . . . . . . . . . . . . . . . . . . . . . . . . . . . . . . . . 28 30,490RWE AG. . . . . . . . . . . . . . . . . . . . . . . . . . . . . . . . . . . . . . . . . . . . . . . . . . . . . . 576 20,480SAP SE. . . . . . . . . . . . . . . . . . . . . . . . . . . . . . . . . . . . . . . . . . . . . . . . . . . . . . . 196 28,128Scout24 AG(b) . . . . . . . . . . . . . . . . . . . . . . . . . . . . . . . . . . . . . . . . . . . . . . . . . 372 31,856Siemens AG, Registered . . . . . . . . . . . . . . . . . . . . . . . . . . . . . . . . . . . . . . 164 25,589Siemens Healthineers AG(b) . . . . . . . . . . . . . . . . . . . . . . . . . . . . . . . . . . . 524 34,595Symrise AG . . . . . . . . . . . . . . . . . . . . . . . . . . . . . . . . . . . . . . . . . . . . . . . . . . . 192 28,310TeamViewer AG(a)(b) . . . . . . . . . . . . . . . . . . . . . . . . . . . . . . . . . . . . . . . . . . . 792 26,628Telefonica Deutschland Holding AG . . . . . . . . . . . . . . . . . . . . . . . . . . . . 8,436 22,740Uniper SE . . . . . . . . . . . . . . . . . . . . . . . . . . . . . . . . . . . . . . . . . . . . . . . . . . . . 700 27,330United Internet AG, Registered. . . . . . . . . . . . . . . . . . . . . . . . . . . . . . . . . 644 26,653Volkswagen AG . . . . . . . . . . . . . . . . . . . . . . . . . . . . . . . . . . . . . . . . . . . . . . . 8 2,655Vonovia SE . . . . . . . . . . . . . . . . . . . . . . . . . . . . . . . . . . . . . . . . . . . . . . . . . . . 492 32,757Zalando SE(a)(b) . . . . . . . . . . . . . . . . . . . . . . . . . . . . . . . . . . . . . . . . . . . . . . . 357 39,667
1,438,734Hong Kong — 3.7%AIA Group Ltd. . . . . . . . . . . . . . . . . . . . . . . . . . . . . . . . . . . . . . . . . . . . . . . . . 1,600 19,145Bank of East Asia Ltd. (The) . . . . . . . . . . . . . . . . . . . . . . . . . . . . . . . . . . . 12,800 21,090BOC Hong Kong Holdings Ltd. . . . . . . . . . . . . . . . . . . . . . . . . . . . . . . . . . 6,000 19,268Budweiser Brewing Co. APAC Ltd.(b) . . . . . . . . . . . . . . . . . . . . . . . . . . . 7,200 20,094Chow Tai Fook Jewellery Group Ltd. . . . . . . . . . . . . . . . . . . . . . . . . . . . 17,600 36,898CK Asset Holdings Ltd. . . . . . . . . . . . . . . . . . . . . . . . . . . . . . . . . . . . . . . . . 4,000 27,215CK Hutchison Holdings Ltd.. . . . . . . . . . . . . . . . . . . . . . . . . . . . . . . . . . . . 4,000 29,225CK Infrastructure Holdings Ltd.. . . . . . . . . . . . . . . . . . . . . . . . . . . . . . . . . 4,000 24,147CLP Holdings Ltd. . . . . . . . . . . . . . . . . . . . . . . . . . . . . . . . . . . . . . . . . . . . . . 2,000 20,623ESR Cayman Ltd.(a)(b) . . . . . . . . . . . . . . . . . . . . . . . . . . . . . . . . . . . . . . . . . 8,800 30,930Futu Holdings Ltd., ADR(a)(c) . . . . . . . . . . . . . . . . . . . . . . . . . . . . . . . . . . . 220 22,541Galaxy Entertainment Group Ltd.(a) . . . . . . . . . . . . . . . . . . . . . . . . . . . . 4,000 27,108Hang Lung Properties Ltd. . . . . . . . . . . . . . . . . . . . . . . . . . . . . . . . . . . . . . 12,000 31,061
Schedule of Investments (continued)
July 31, 2021
iShares� MSCI Intl Size Factor ETF(Percentages shown are based on Net Assets)
34 2 0 2 1 I S H A R E S A N N U A L R E P O R T T O S H A R E H O L D E R S

Security s Value
Hong Kong (continued)Hang Seng Bank Ltd.. . . . . . . . . . . . . . . . . . . . . . . . . . . . . . . . . . . . . . . . . . 1,600 $ 30,642Henderson Land Development Co. Ltd. . . . . . . . . . . . . . . . . . . . . . . . . 8,464 37,816HK Electric Investments & HK Electric Investments Ltd.,
Class SS. . . . . . . . . . . . . . . . . . . . . . . . . . . . . . . . . . . . . . . . . . . . . . . . . . . 26,000 26,369HKT Trust & HKT Ltd., Class SS . . . . . . . . . . . . . . . . . . . . . . . . . . . . . . . 20,000 27,186Hong Kong & China Gas Co. Ltd. . . . . . . . . . . . . . . . . . . . . . . . . . . . . . . 16,676 27,121Hong Kong Exchanges & Clearing Ltd. . . . . . . . . . . . . . . . . . . . . . . . . . 300 19,173Hongkong Land Holdings Ltd.. . . . . . . . . . . . . . . . . . . . . . . . . . . . . . . . . . 5,600 25,407Jardine Matheson Holdings Ltd.. . . . . . . . . . . . . . . . . . . . . . . . . . . . . . . . 400 23,798Link REIT . . . . . . . . . . . . . . . . . . . . . . . . . . . . . . . . . . . . . . . . . . . . . . . . . . . . . 2,800 26,758Melco Resorts & Entertainment Ltd., ADR(a) . . . . . . . . . . . . . . . . . . . . 1,444 20,100MTR Corp. Ltd. . . . . . . . . . . . . . . . . . . . . . . . . . . . . . . . . . . . . . . . . . . . . . . . 4,000 23,715New World Development Co. Ltd. . . . . . . . . . . . . . . . . . . . . . . . . . . . . . . 4,000 18,963Power Assets Holdings Ltd. . . . . . . . . . . . . . . . . . . . . . . . . . . . . . . . . . . . . 4,000 25,861Sands China Ltd.(a). . . . . . . . . . . . . . . . . . . . . . . . . . . . . . . . . . . . . . . . . . . . 6,400 21,799Sino Land Co. Ltd. . . . . . . . . . . . . . . . . . . . . . . . . . . . . . . . . . . . . . . . . . . . . 18,000 27,583SJM Holdings Ltd.(a). . . . . . . . . . . . . . . . . . . . . . . . . . . . . . . . . . . . . . . . . . . 20,000 18,038Sun Hung Kai Properties Ltd. . . . . . . . . . . . . . . . . . . . . . . . . . . . . . . . . . . 2,000 28,611Swire Pacific Ltd., Class A . . . . . . . . . . . . . . . . . . . . . . . . . . . . . . . . . . . . . 4,000 24,847Swire Properties Ltd. . . . . . . . . . . . . . . . . . . . . . . . . . . . . . . . . . . . . . . . . . . 8,800 25,029Techtronic Industries Co. Ltd. . . . . . . . . . . . . . . . . . . . . . . . . . . . . . . . . . . 2,000 35,665WH Group Ltd.(b) . . . . . . . . . . . . . . . . . . . . . . . . . . . . . . . . . . . . . . . . . . . . . . 32,000 26,514Wharf Real Estate Investment Co. Ltd. . . . . . . . . . . . . . . . . . . . . . . . . . 4,000 22,591Wynn Macau Ltd.(a) . . . . . . . . . . . . . . . . . . . . . . . . . . . . . . . . . . . . . . . . . . . 19,200 24,607Xinyi Glass Holdings Ltd. . . . . . . . . . . . . . . . . . . . . . . . . . . . . . . . . . . . . . . 8,000 29,899
947,437Ireland — 0.6%CRH PLC. . . . . . . . . . . . . . . . . . . . . . . . . . . . . . . . . . . . . . . . . . . . . . . . . . . . . 584 29,188Flutter Entertainment PLC, Class DI(a). . . . . . . . . . . . . . . . . . . . . . . . . . 140 23,866Kerry Group PLC, Class A . . . . . . . . . . . . . . . . . . . . . . . . . . . . . . . . . . . . . 172 25,504Kingspan Group PLC. . . . . . . . . . . . . . . . . . . . . . . . . . . . . . . . . . . . . . . . . . 264 28,709Smurfit Kappa Group PLC . . . . . . . . . . . . . . . . . . . . . . . . . . . . . . . . . . . . . 592 33,397
140,664Israel — 1.4%Azrieli Group Ltd. . . . . . . . . . . . . . . . . . . . . . . . . . . . . . . . . . . . . . . . . . . . . . 368 29,309Bank Hapoalim BM(a). . . . . . . . . . . . . . . . . . . . . . . . . . . . . . . . . . . . . . . . . . 2,760 21,964Bank Leumi Le-Israel BM(a) . . . . . . . . . . . . . . . . . . . . . . . . . . . . . . . . . . . . 4,260 32,551Check Point Software Technologies Ltd.(a) . . . . . . . . . . . . . . . . . . . . . . 232 29,487CyberArk Software Ltd.(a) . . . . . . . . . . . . . . . . . . . . . . . . . . . . . . . . . . . . . . 248 35,223Elbit Systems Ltd. . . . . . . . . . . . . . . . . . . . . . . . . . . . . . . . . . . . . . . . . . . . . . 192 25,284ICL Group Ltd. . . . . . . . . . . . . . . . . . . . . . . . . . . . . . . . . . . . . . . . . . . . . . . . . 3,936 28,682Isracard Ltd.(a) . . . . . . . . . . . . . . . . . . . . . . . . . . . . . . . . . . . . . . . . . . . . . . . . 1 2Israel Discount Bank Ltd., Class A(a) . . . . . . . . . . . . . . . . . . . . . . . . . . . 5,660 26,514Mizrahi Tefahot Bank Ltd.(a) . . . . . . . . . . . . . . . . . . . . . . . . . . . . . . . . . . . . 872 26,427Nice Ltd.(a) . . . . . . . . . . . . . . . . . . . . . . . . . . . . . . . . . . . . . . . . . . . . . . . . . . . . 112 31,168Teva Pharmaceutical Industries Ltd., ADR(a) . . . . . . . . . . . . . . . . . . . . 2,676 25,823Wix.com Ltd.(a) . . . . . . . . . . . . . . . . . . . . . . . . . . . . . . . . . . . . . . . . . . . . . . . . 120 35,837
348,271Italy — 2.4%Amplifon SpA . . . . . . . . . . . . . . . . . . . . . . . . . . . . . . . . . . . . . . . . . . . . . . . . . 700 34,569Assicurazioni Generali SpA . . . . . . . . . . . . . . . . . . . . . . . . . . . . . . . . . . . . 1,180 23,527Atlantia SpA(a) . . . . . . . . . . . . . . . . . . . . . . . . . . . . . . . . . . . . . . . . . . . . . . . . 1,344 24,378CNH Industrial NV. . . . . . . . . . . . . . . . . . . . . . . . . . . . . . . . . . . . . . . . . . . . . 1,464 24,445DiaSorin SpA . . . . . . . . . . . . . . . . . . . . . . . . . . . . . . . . . . . . . . . . . . . . . . . . . 168 34,096Enel SpA . . . . . . . . . . . . . . . . . . . . . . . . . . . . . . . . . . . . . . . . . . . . . . . . . . . . . 2,432 22,412Eni SpA . . . . . . . . . . . . . . . . . . . . . . . . . . . . . . . . . . . . . . . . . . . . . . . . . . . . . . 2,440 28,855Ferrari NV . . . . . . . . . . . . . . . . . . . . . . . . . . . . . . . . . . . . . . . . . . . . . . . . . . . . 104 22,666FinecoBank Banca Fineco SpA(a) . . . . . . . . . . . . . . . . . . . . . . . . . . . . . . 1,989 35,616Infrastrutture Wireless Italiane SpA(b). . . . . . . . . . . . . . . . . . . . . . . . . . . 2,004 22,638
Security s Value
Italy (continued)Intesa Sanpaolo SpA . . . . . . . . . . . . . . . . . . . . . . . . . . . . . . . . . . . . . . . . . . 10,392 $ 28,708Mediobanca Banca di Credito Finanziario SpA(a). . . . . . . . . . . . . . . . 2,640 30,900Moncler SpA . . . . . . . . . . . . . . . . . . . . . . . . . . . . . . . . . . . . . . . . . . . . . . . . . . 432 29,671Nexi SpA(a)(b) . . . . . . . . . . . . . . . . . . . . . . . . . . . . . . . . . . . . . . . . . . . . . . . . . 1,316 28,196Poste Italiane SpA(b) . . . . . . . . . . . . . . . . . . . . . . . . . . . . . . . . . . . . . . . . . . 2,188 28,953Prysmian SpA. . . . . . . . . . . . . . . . . . . . . . . . . . . . . . . . . . . . . . . . . . . . . . . . . 740 26,532Recordati Industria Chimica e Farmaceutica SpA . . . . . . . . . . . . . . . 564 34,884Snam SpA . . . . . . . . . . . . . . . . . . . . . . . . . . . . . . . . . . . . . . . . . . . . . . . . . . . . 4,368 26,421Telecom Italia SpA/Milano . . . . . . . . . . . . . . . . . . . . . . . . . . . . . . . . . . . . . 34,620 15,160Tenaris SA . . . . . . . . . . . . . . . . . . . . . . . . . . . . . . . . . . . . . . . . . . . . . . . . . . . . 2,160 22,008Terna SPA . . . . . . . . . . . . . . . . . . . . . . . . . . . . . . . . . . . . . . . . . . . . . . . . . . . . 3,360 26,666UniCredit SpA. . . . . . . . . . . . . . . . . . . . . . . . . . . . . . . . . . . . . . . . . . . . . . . . . 2,320 27,750
599,051Japan — 29.8%ABC-Mart Inc.. . . . . . . . . . . . . . . . . . . . . . . . . . . . . . . . . . . . . . . . . . . . . . . . . 400 22,055Acom Co. Ltd.. . . . . . . . . . . . . . . . . . . . . . . . . . . . . . . . . . . . . . . . . . . . . . . . . 8,000 32,836Advantest Corp.. . . . . . . . . . . . . . . . . . . . . . . . . . . . . . . . . . . . . . . . . . . . . . . 400 35,312Aeon Co. Ltd. . . . . . . . . . . . . . . . . . . . . . . . . . . . . . . . . . . . . . . . . . . . . . . . . . 800 21,892AGC Inc.. . . . . . . . . . . . . . . . . . . . . . . . . . . . . . . . . . . . . . . . . . . . . . . . . . . . . . 800 34,210Aisin Corp.. . . . . . . . . . . . . . . . . . . . . . . . . . . . . . . . . . . . . . . . . . . . . . . . . . . . 800 32,387Ajinomoto Co. Inc.. . . . . . . . . . . . . . . . . . . . . . . . . . . . . . . . . . . . . . . . . . . . . 1,200 30,572ANA Holdings Inc.(a) . . . . . . . . . . . . . . . . . . . . . . . . . . . . . . . . . . . . . . . . . . . 1,200 28,120Asahi Group Holdings Ltd. . . . . . . . . . . . . . . . . . . . . . . . . . . . . . . . . . . . . . 800 35,996Asahi Intecc Co. Ltd. . . . . . . . . . . . . . . . . . . . . . . . . . . . . . . . . . . . . . . . . . . 1,200 32,517Asahi Kasei Corp. . . . . . . . . . . . . . . . . . . . . . . . . . . . . . . . . . . . . . . . . . . . . . 2,400 26,172Astellas Pharma Inc. . . . . . . . . . . . . . . . . . . . . . . . . . . . . . . . . . . . . . . . . . . 1,600 25,484Azbil Corp.. . . . . . . . . . . . . . . . . . . . . . . . . . . . . . . . . . . . . . . . . . . . . . . . . . . . 800 31,198Bandai Namco Holdings Inc. . . . . . . . . . . . . . . . . . . . . . . . . . . . . . . . . . . . 400 25,882Bridgestone Corp. . . . . . . . . . . . . . . . . . . . . . . . . . . . . . . . . . . . . . . . . . . . . . 800 35,244Brother Industries Ltd. . . . . . . . . . . . . . . . . . . . . . . . . . . . . . . . . . . . . . . . . . 1,600 32,561Canon Inc. . . . . . . . . . . . . . . . . . . . . . . . . . . . . . . . . . . . . . . . . . . . . . . . . . . . . 1,200 27,634Capcom Co. Ltd. . . . . . . . . . . . . . . . . . . . . . . . . . . . . . . . . . . . . . . . . . . . . . . 800 21,997Casio Computer Co. Ltd. . . . . . . . . . . . . . . . . . . . . . . . . . . . . . . . . . . . . . . 1,600 26,078Central Japan Railway Co.. . . . . . . . . . . . . . . . . . . . . . . . . . . . . . . . . . . . . 200 29,093Chiba Bank Ltd. (The) . . . . . . . . . . . . . . . . . . . . . . . . . . . . . . . . . . . . . . . . . 4,400 25,030Chubu Electric Power Co. Inc. . . . . . . . . . . . . . . . . . . . . . . . . . . . . . . . . . 2,000 24,001Chugai Pharmaceutical Co. Ltd.. . . . . . . . . . . . . . . . . . . . . . . . . . . . . . . . 800 29,480Concordia Financial Group Ltd. . . . . . . . . . . . . . . . . . . . . . . . . . . . . . . . . 7,200 25,774Cosmos Pharmaceutical Corp. . . . . . . . . . . . . . . . . . . . . . . . . . . . . . . . . . 400 67,901CyberAgent Inc.. . . . . . . . . . . . . . . . . . . . . . . . . . . . . . . . . . . . . . . . . . . . . . . 1,600 28,798Dai Nippon Printing Co. Ltd. . . . . . . . . . . . . . . . . . . . . . . . . . . . . . . . . . . . 1,200 28,278Daifuku Co. Ltd.. . . . . . . . . . . . . . . . . . . . . . . . . . . . . . . . . . . . . . . . . . . . . . . 400 35,844Dai-ichi Life Holdings Inc. . . . . . . . . . . . . . . . . . . . . . . . . . . . . . . . . . . . . . . 1,200 22,086Daiichi Sankyo Co. Ltd.. . . . . . . . . . . . . . . . . . . . . . . . . . . . . . . . . . . . . . . . 1,200 23,765Daito Trust Construction Co. Ltd.. . . . . . . . . . . . . . . . . . . . . . . . . . . . . . . 400 46,996Daiwa House Industry Co. Ltd. . . . . . . . . . . . . . . . . . . . . . . . . . . . . . . . . . 800 24,528Daiwa House REIT Investment Corp.. . . . . . . . . . . . . . . . . . . . . . . . . . . 12 35,728Daiwa Securities Group Inc. . . . . . . . . . . . . . . . . . . . . . . . . . . . . . . . . . . . 5,600 29,447Denso Corp. . . . . . . . . . . . . . . . . . . . . . . . . . . . . . . . . . . . . . . . . . . . . . . . . . . 400 27,480Dentsu Group Inc.. . . . . . . . . . . . . . . . . . . . . . . . . . . . . . . . . . . . . . . . . . . . . 800 27,803Disco Corp. . . . . . . . . . . . . . . . . . . . . . . . . . . . . . . . . . . . . . . . . . . . . . . . . . . . 100 28,556East Japan Railway Co. . . . . . . . . . . . . . . . . . . . . . . . . . . . . . . . . . . . . . . . 400 26,649Eisai Co. Ltd. . . . . . . . . . . . . . . . . . . . . . . . . . . . . . . . . . . . . . . . . . . . . . . . . . 400 32,901ENEOS Holdings Inc. . . . . . . . . . . . . . . . . . . . . . . . . . . . . . . . . . . . . . . . . . 7,250 30,454Fuji Electric Co. Ltd. . . . . . . . . . . . . . . . . . . . . . . . . . . . . . . . . . . . . . . . . . . . 800 35,011FUJIFILM Holdings Corp. . . . . . . . . . . . . . . . . . . . . . . . . . . . . . . . . . . . . . . 400 28,705Fujitsu Ltd.. . . . . . . . . . . . . . . . . . . . . . . . . . . . . . . . . . . . . . . . . . . . . . . . . . . . 100 17,013GLP J-REIT. . . . . . . . . . . . . . . . . . . . . . . . . . . . . . . . . . . . . . . . . . . . . . . . . . . 16 28,659GMO Payment Gateway Inc.. . . . . . . . . . . . . . . . . . . . . . . . . . . . . . . . . . . 200 25,709Hakuhodo DY Holdings Inc.. . . . . . . . . . . . . . . . . . . . . . . . . . . . . . . . . . . . 1,600 24,337
Schedule of Investments (continued)
July 31, 2021
iShares� MSCI Intl Size Factor ETF(Percentages shown are based on Net Assets)
S C H E D U L E O F I N V E S T M E N T S 35

Security s Value
Japan (continued)Hamamatsu Photonics KK . . . . . . . . . . . . . . . . . . . . . . . . . . . . . . . . . . . . . 400 $ 22,240Hankyu Hanshin Holdings Inc. . . . . . . . . . . . . . . . . . . . . . . . . . . . . . . . . . 800 23,657Harmonic Drive Systems Inc. . . . . . . . . . . . . . . . . . . . . . . . . . . . . . . . . . . 400 22,127Hino Motors Ltd. . . . . . . . . . . . . . . . . . . . . . . . . . . . . . . . . . . . . . . . . . . . . . . 3,200 28,053Hirose Electric Co. Ltd. . . . . . . . . . . . . . . . . . . . . . . . . . . . . . . . . . . . . . . . . 200 29,961Hisamitsu Pharmaceutical Co. Inc. . . . . . . . . . . . . . . . . . . . . . . . . . . . . . 400 17,520Hitachi Construction Machinery Co. Ltd. . . . . . . . . . . . . . . . . . . . . . . . . 800 22,604Hitachi Ltd. . . . . . . . . . . . . . . . . . . . . . . . . . . . . . . . . . . . . . . . . . . . . . . . . . . . 400 23,008Hitachi Metals Ltd.(a) . . . . . . . . . . . . . . . . . . . . . . . . . . . . . . . . . . . . . . . . . . 1,600 31,246Honda Motor Co. Ltd. . . . . . . . . . . . . . . . . . . . . . . . . . . . . . . . . . . . . . . . . . 800 25,694Hoshizaki Corp. . . . . . . . . . . . . . . . . . . . . . . . . . . . . . . . . . . . . . . . . . . . . . . . 400 33,589Hoya Corp. . . . . . . . . . . . . . . . . . . . . . . . . . . . . . . . . . . . . . . . . . . . . . . . . . . . 400 56,468Hulic Co. Ltd. . . . . . . . . . . . . . . . . . . . . . . . . . . . . . . . . . . . . . . . . . . . . . . . . . 2,800 31,855Ibiden Co. Ltd. . . . . . . . . . . . . . . . . . . . . . . . . . . . . . . . . . . . . . . . . . . . . . . . . 800 42,380Idemitsu Kosan Co. Ltd. . . . . . . . . . . . . . . . . . . . . . . . . . . . . . . . . . . . . . . . 1,264 29,754Iida Group Holdings Co. Ltd. . . . . . . . . . . . . . . . . . . . . . . . . . . . . . . . . . . . 1,200 28,957Inpex Corp. . . . . . . . . . . . . . . . . . . . . . . . . . . . . . . . . . . . . . . . . . . . . . . . . . . . 4,400 31,207Isuzu Motors Ltd.. . . . . . . . . . . . . . . . . . . . . . . . . . . . . . . . . . . . . . . . . . . . . . 2,400 32,015Ito En Ltd. . . . . . . . . . . . . . . . . . . . . . . . . . . . . . . . . . . . . . . . . . . . . . . . . . . . . 400 23,602Itochu Corp. . . . . . . . . . . . . . . . . . . . . . . . . . . . . . . . . . . . . . . . . . . . . . . . . . . 800 23,679Itochu Techno-Solutions Corp. . . . . . . . . . . . . . . . . . . . . . . . . . . . . . . . . . 800 24,540Japan Airlines Co. Ltd.(a). . . . . . . . . . . . . . . . . . . . . . . . . . . . . . . . . . . . . . . 1,200 25,017Japan Exchange Group Inc. . . . . . . . . . . . . . . . . . . . . . . . . . . . . . . . . . . . 1,200 27,294Japan Metropolitan Fund Invest . . . . . . . . . . . . . . . . . . . . . . . . . . . . . . . . 32 33,521Japan Post Bank Co. Ltd.. . . . . . . . . . . . . . . . . . . . . . . . . . . . . . . . . . . . . . 2,800 23,766Japan Post Holdings Co. Ltd. . . . . . . . . . . . . . . . . . . . . . . . . . . . . . . . . . . 2,800 23,768Japan Post Insurance Co. Ltd. . . . . . . . . . . . . . . . . . . . . . . . . . . . . . . . . . 1,600 28,366Japan Real Estate Investment Corp. . . . . . . . . . . . . . . . . . . . . . . . . . . . 4 25,122Japan Tobacco Inc.. . . . . . . . . . . . . . . . . . . . . . . . . . . . . . . . . . . . . . . . . . . . 1,200 23,448JFE Holdings Inc. . . . . . . . . . . . . . . . . . . . . . . . . . . . . . . . . . . . . . . . . . . . . . 2,000 24,320JSR Corp. . . . . . . . . . . . . . . . . . . . . . . . . . . . . . . . . . . . . . . . . . . . . . . . . . . . . 800 26,816Kajima Corp. . . . . . . . . . . . . . . . . . . . . . . . . . . . . . . . . . . . . . . . . . . . . . . . . . . 2,000 25,746Kakaku.com Inc. . . . . . . . . . . . . . . . . . . . . . . . . . . . . . . . . . . . . . . . . . . . . . . 1,200 32,747Kansai Electric Power Co. Inc. (The) . . . . . . . . . . . . . . . . . . . . . . . . . . . 2,800 26,412Kansai Paint Co. Ltd. . . . . . . . . . . . . . . . . . . . . . . . . . . . . . . . . . . . . . . . . . . 1,200 29,471Kao Corp.. . . . . . . . . . . . . . . . . . . . . . . . . . . . . . . . . . . . . . . . . . . . . . . . . . . . . 400 24,085KDDI Corp. . . . . . . . . . . . . . . . . . . . . . . . . . . . . . . . . . . . . . . . . . . . . . . . . . . . 800 24,467Keio Corp. . . . . . . . . . . . . . . . . . . . . . . . . . . . . . . . . . . . . . . . . . . . . . . . . . . . . 400 22,406Keisei Electric Railway Co. Ltd. . . . . . . . . . . . . . . . . . . . . . . . . . . . . . . . . 800 23,826Kikkoman Corp. . . . . . . . . . . . . . . . . . . . . . . . . . . . . . . . . . . . . . . . . . . . . . . . 400 24,495Kintetsu Group Holdings Co. Ltd.(a) . . . . . . . . . . . . . . . . . . . . . . . . . . . . 800 27,033Kirin Holdings Co. Ltd.. . . . . . . . . . . . . . . . . . . . . . . . . . . . . . . . . . . . . . . . . 1,200 21,949Kobayashi Pharmaceutical Co. Ltd. . . . . . . . . . . . . . . . . . . . . . . . . . . . . 400 31,906Kobe Bussan Co. Ltd. . . . . . . . . . . . . . . . . . . . . . . . . . . . . . . . . . . . . . . . . . 1,200 40,404Koei Tecmo Holdings Co. Ltd.. . . . . . . . . . . . . . . . . . . . . . . . . . . . . . . . . . 550 25,841Koito Manufacturing Co. Ltd.. . . . . . . . . . . . . . . . . . . . . . . . . . . . . . . . . . . 400 24,480Komatsu Ltd. . . . . . . . . . . . . . . . . . . . . . . . . . . . . . . . . . . . . . . . . . . . . . . . . . 800 20,047Konami Holdings Corp. . . . . . . . . . . . . . . . . . . . . . . . . . . . . . . . . . . . . . . . . 400 22,154Kose Corp. . . . . . . . . . . . . . . . . . . . . . . . . . . . . . . . . . . . . . . . . . . . . . . . . . . . 100 15,801Kubota Corp.. . . . . . . . . . . . . . . . . . . . . . . . . . . . . . . . . . . . . . . . . . . . . . . . . . 1,200 25,094Kurita Water Industries Ltd. . . . . . . . . . . . . . . . . . . . . . . . . . . . . . . . . . . . . 800 38,855Kyocera Corp. . . . . . . . . . . . . . . . . . . . . . . . . . . . . . . . . . . . . . . . . . . . . . . . . 400 24,717Kyowa Kirin Co. Ltd.. . . . . . . . . . . . . . . . . . . . . . . . . . . . . . . . . . . . . . . . . . . 800 26,041Lasertec Corp. . . . . . . . . . . . . . . . . . . . . . . . . . . . . . . . . . . . . . . . . . . . . . . . . 100 18,773Lawson Inc. . . . . . . . . . . . . . . . . . . . . . . . . . . . . . . . . . . . . . . . . . . . . . . . . . . . 800 40,208Lion Corp. . . . . . . . . . . . . . . . . . . . . . . . . . . . . . . . . . . . . . . . . . . . . . . . . . . . . 1,600 27,695Lixil Corp.. . . . . . . . . . . . . . . . . . . . . . . . . . . . . . . . . . . . . . . . . . . . . . . . . . . . . 1,200 32,748M3 Inc. . . . . . . . . . . . . . . . . . . . . . . . . . . . . . . . . . . . . . . . . . . . . . . . . . . . . . . . 400 26,163Makita Corp. . . . . . . . . . . . . . . . . . . . . . . . . . . . . . . . . . . . . . . . . . . . . . . . . . . 800 41,599Marubeni Corp. . . . . . . . . . . . . . . . . . . . . . . . . . . . . . . . . . . . . . . . . . . . . . . . 3,200 27,237
Security s Value
Japan (continued)Mazda Motor Corp.(a). . . . . . . . . . . . . . . . . . . . . . . . . . . . . . . . . . . . . . . . . . 4,000 $ 39,460McDonald's Holdings Co. Japan Ltd. . . . . . . . . . . . . . . . . . . . . . . . . . . . 800 36,053Medipal Holdings Corp.. . . . . . . . . . . . . . . . . . . . . . . . . . . . . . . . . . . . . . . . 1,600 30,133MEIJI Holdings Co. Ltd. . . . . . . . . . . . . . . . . . . . . . . . . . . . . . . . . . . . . . . . 400 24,760Mercari Inc.(a) . . . . . . . . . . . . . . . . . . . . . . . . . . . . . . . . . . . . . . . . . . . . . . . . . 800 41,873Minebea Mitsumi Inc. . . . . . . . . . . . . . . . . . . . . . . . . . . . . . . . . . . . . . . . . . . 1,200 32,401Misumi Group Inc.. . . . . . . . . . . . . . . . . . . . . . . . . . . . . . . . . . . . . . . . . . . . . 800 27,884Mitsubishi Chemical Holdings Corp. . . . . . . . . . . . . . . . . . . . . . . . . . . . . 4,000 33,564Mitsubishi Corp. . . . . . . . . . . . . . . . . . . . . . . . . . . . . . . . . . . . . . . . . . . . . . . . 800 22,439Mitsubishi Electric Corp. . . . . . . . . . . . . . . . . . . . . . . . . . . . . . . . . . . . . . . . 1,600 21,708Mitsubishi Estate Co. Ltd.. . . . . . . . . . . . . . . . . . . . . . . . . . . . . . . . . . . . . . 2,000 31,374Mitsubishi Gas Chemical Co. Inc. . . . . . . . . . . . . . . . . . . . . . . . . . . . . . . 1,200 24,997Mitsubishi HC Capital Inc. . . . . . . . . . . . . . . . . . . . . . . . . . . . . . . . . . . . . . 5,200 28,362Mitsubishi Heavy Industries Ltd.. . . . . . . . . . . . . . . . . . . . . . . . . . . . . . . . 800 23,115Mitsubishi UFJ Financial Group Inc. . . . . . . . . . . . . . . . . . . . . . . . . . . . . 5,200 27,470Mitsui & Co. Ltd. . . . . . . . . . . . . . . . . . . . . . . . . . . . . . . . . . . . . . . . . . . . . . . 1,200 27,543Mitsui Chemicals Inc. . . . . . . . . . . . . . . . . . . . . . . . . . . . . . . . . . . . . . . . . . . 800 25,511Mitsui Fudosan Co. Ltd. . . . . . . . . . . . . . . . . . . . . . . . . . . . . . . . . . . . . . . . 1,200 28,065Miura Co. Ltd.. . . . . . . . . . . . . . . . . . . . . . . . . . . . . . . . . . . . . . . . . . . . . . . . . 800 35,327Mizuho Financial Group Inc. . . . . . . . . . . . . . . . . . . . . . . . . . . . . . . . . . . . 1,600 22,863MonotaRO Co. Ltd.. . . . . . . . . . . . . . . . . . . . . . . . . . . . . . . . . . . . . . . . . . . . 1,200 27,603MS&AD Insurance Group Holdings Inc. . . . . . . . . . . . . . . . . . . . . . . . . 800 24,729Murata Manufacturing Co. Ltd. . . . . . . . . . . . . . . . . . . . . . . . . . . . . . . . . . 400 33,194Nabtesco Corp. . . . . . . . . . . . . . . . . . . . . . . . . . . . . . . . . . . . . . . . . . . . . . . . 800 30,301NEC Corp. . . . . . . . . . . . . . . . . . . . . . . . . . . . . . . . . . . . . . . . . . . . . . . . . . . . . 800 40,574Nexon Co. Ltd. . . . . . . . . . . . . . . . . . . . . . . . . . . . . . . . . . . . . . . . . . . . . . . . . 1,200 24,691NGK Insulators Ltd. . . . . . . . . . . . . . . . . . . . . . . . . . . . . . . . . . . . . . . . . . . . 1,600 25,624NH Foods Ltd. . . . . . . . . . . . . . . . . . . . . . . . . . . . . . . . . . . . . . . . . . . . . . . . . 800 32,267Nidec Corp. . . . . . . . . . . . . . . . . . . . . . . . . . . . . . . . . . . . . . . . . . . . . . . . . . . . 400 44,897Nihon M&A Center Inc. . . . . . . . . . . . . . . . . . . . . . . . . . . . . . . . . . . . . . . . . 1,200 33,419Nippon Building Fund Inc. . . . . . . . . . . . . . . . . . . . . . . . . . . . . . . . . . . . . . 4 25,851Nippon Express Co. Ltd.. . . . . . . . . . . . . . . . . . . . . . . . . . . . . . . . . . . . . . . 400 29,220Nippon Paint Holdings Co. Ltd. . . . . . . . . . . . . . . . . . . . . . . . . . . . . . . . . 1,600 20,423Nippon Prologis REIT Inc. . . . . . . . . . . . . . . . . . . . . . . . . . . . . . . . . . . . . . 8 26,716Nippon Sanso Holdings Corp.. . . . . . . . . . . . . . . . . . . . . . . . . . . . . . . . . . 1,600 35,418Nippon Shinyaku Co. Ltd.. . . . . . . . . . . . . . . . . . . . . . . . . . . . . . . . . . . . . . 400 30,093Nippon Steel Corp. . . . . . . . . . . . . . . . . . . . . . . . . . . . . . . . . . . . . . . . . . . . . 1,200 20,817Nippon Telegraph & Telephone Corp.. . . . . . . . . . . . . . . . . . . . . . . . . . . 1,200 30,730Nippon Yusen KK . . . . . . . . . . . . . . . . . . . . . . . . . . . . . . . . . . . . . . . . . . . . . 800 43,226Nissan Chemical Corp. . . . . . . . . . . . . . . . . . . . . . . . . . . . . . . . . . . . . . . . . 400 19,605Nissan Motor Co. Ltd.(a) . . . . . . . . . . . . . . . . . . . . . . . . . . . . . . . . . . . . . . . 5,600 32,501Nisshin Seifun Group Inc.. . . . . . . . . . . . . . . . . . . . . . . . . . . . . . . . . . . . . . 1,600 25,796Nissin Foods Holdings Co. Ltd. . . . . . . . . . . . . . . . . . . . . . . . . . . . . . . . . 400 28,464Nitto Denko Corp. . . . . . . . . . . . . . . . . . . . . . . . . . . . . . . . . . . . . . . . . . . . . . 400 29,719Nomura Holdings Inc. . . . . . . . . . . . . . . . . . . . . . . . . . . . . . . . . . . . . . . . . . 4,800 24,036Nomura Real Estate Holdings Inc. . . . . . . . . . . . . . . . . . . . . . . . . . . . . . 1,200 29,756Nomura Real Estate Master Fund Inc.. . . . . . . . . . . . . . . . . . . . . . . . . . 20 31,779Nomura Research Institute Ltd. . . . . . . . . . . . . . . . . . . . . . . . . . . . . . . . . 860 27,675NSK Ltd.. . . . . . . . . . . . . . . . . . . . . . . . . . . . . . . . . . . . . . . . . . . . . . . . . . . . . . 2,800 23,108NTT Data Corp. . . . . . . . . . . . . . . . . . . . . . . . . . . . . . . . . . . . . . . . . . . . . . . . 2,000 30,979Obayashi Corp. . . . . . . . . . . . . . . . . . . . . . . . . . . . . . . . . . . . . . . . . . . . . . . . 3,200 26,167Odakyu Electric Railway Co. Ltd.. . . . . . . . . . . . . . . . . . . . . . . . . . . . . . . 1,200 28,639Oji Holdings Corp.. . . . . . . . . . . . . . . . . . . . . . . . . . . . . . . . . . . . . . . . . . . . . 5,200 29,981Olympus Corp. . . . . . . . . . . . . . . . . . . . . . . . . . . . . . . . . . . . . . . . . . . . . . . . . 1,200 24,695Omron Corp. . . . . . . . . . . . . . . . . . . . . . . . . . . . . . . . . . . . . . . . . . . . . . . . . . . 400 34,230Ono Pharmaceutical Co. Ltd. . . . . . . . . . . . . . . . . . . . . . . . . . . . . . . . . . . 1,200 27,394Oracle Corp. Japan . . . . . . . . . . . . . . . . . . . . . . . . . . . . . . . . . . . . . . . . . . . 400 29,880Oriental Land Co. Ltd. . . . . . . . . . . . . . . . . . . . . . . . . . . . . . . . . . . . . . . . . . 400 54,800ORIX Corp. . . . . . . . . . . . . . . . . . . . . . . . . . . . . . . . . . . . . . . . . . . . . . . . . . . . 1,600 27,993Orix JREIT Inc.. . . . . . . . . . . . . . . . . . . . . . . . . . . . . . . . . . . . . . . . . . . . . . . . 16 30,529
Schedule of Investments (continued)
July 31, 2021
iShares� MSCI Intl Size Factor ETF(Percentages shown are based on Net Assets)
36 2 0 2 1 I S H A R E S A N N U A L R E P O R T T O S H A R E H O L D E R S

Security s Value
Japan (continued)Osaka Gas Co. Ltd. . . . . . . . . . . . . . . . . . . . . . . . . . . . . . . . . . . . . . . . . . . . 1,200 $ 22,419Otsuka Corp.. . . . . . . . . . . . . . . . . . . . . . . . . . . . . . . . . . . . . . . . . . . . . . . . . . 400 20,784Otsuka Holdings Co. Ltd. . . . . . . . . . . . . . . . . . . . . . . . . . . . . . . . . . . . . . . 800 31,799Pan Pacific International Holdings Corp. . . . . . . . . . . . . . . . . . . . . . . . . 1,200 25,049Panasonic Corp. . . . . . . . . . . . . . . . . . . . . . . . . . . . . . . . . . . . . . . . . . . . . . . 2,400 28,980PeptiDream Inc.(a) . . . . . . . . . . . . . . . . . . . . . . . . . . . . . . . . . . . . . . . . . . . . . 800 33,017Persol Holdings Co. Ltd. . . . . . . . . . . . . . . . . . . . . . . . . . . . . . . . . . . . . . . . 1,600 32,281Pigeon Corp.. . . . . . . . . . . . . . . . . . . . . . . . . . . . . . . . . . . . . . . . . . . . . . . . . . 800 23,035Pola Orbis Holdings Inc. . . . . . . . . . . . . . . . . . . . . . . . . . . . . . . . . . . . . . . . 1,200 28,685Rakuten Group Inc. . . . . . . . . . . . . . . . . . . . . . . . . . . . . . . . . . . . . . . . . . . . 2,400 26,410Recruit Holdings Co. Ltd. . . . . . . . . . . . . . . . . . . . . . . . . . . . . . . . . . . . . . . 400 20,732Renesas Electronics Corp.(a). . . . . . . . . . . . . . . . . . . . . . . . . . . . . . . . . . . 2,800 30,390Resona Holdings Inc.. . . . . . . . . . . . . . . . . . . . . . . . . . . . . . . . . . . . . . . . . . 6,800 25,532Ricoh Co. Ltd.. . . . . . . . . . . . . . . . . . . . . . . . . . . . . . . . . . . . . . . . . . . . . . . . . 2,400 26,224Rinnai Corp. . . . . . . . . . . . . . . . . . . . . . . . . . . . . . . . . . . . . . . . . . . . . . . . . . . 400 37,160Rohm Co. Ltd. . . . . . . . . . . . . . . . . . . . . . . . . . . . . . . . . . . . . . . . . . . . . . . . . 400 39,023Ryohin Keikaku Co. Ltd. . . . . . . . . . . . . . . . . . . . . . . . . . . . . . . . . . . . . . . . 1,200 24,343Santen Pharmaceutical Co. Ltd.. . . . . . . . . . . . . . . . . . . . . . . . . . . . . . . . 2,400 32,520SBI Holdings Inc.. . . . . . . . . . . . . . . . . . . . . . . . . . . . . . . . . . . . . . . . . . . . . . 1,200 28,726SCSK Corp. . . . . . . . . . . . . . . . . . . . . . . . . . . . . . . . . . . . . . . . . . . . . . . . . . . 400 24,108Secom Co. Ltd. . . . . . . . . . . . . . . . . . . . . . . . . . . . . . . . . . . . . . . . . . . . . . . . 400 30,276Seiko Epson Corp. . . . . . . . . . . . . . . . . . . . . . . . . . . . . . . . . . . . . . . . . . . . . 2,000 34,412Sekisui Chemical Co. Ltd. . . . . . . . . . . . . . . . . . . . . . . . . . . . . . . . . . . . . . 1,600 27,609Sekisui House Ltd. . . . . . . . . . . . . . . . . . . . . . . . . . . . . . . . . . . . . . . . . . . . . 1,200 23,767Seven & i Holdings Co. Ltd.. . . . . . . . . . . . . . . . . . . . . . . . . . . . . . . . . . . . 400 17,848SG Holdings Co. Ltd. . . . . . . . . . . . . . . . . . . . . . . . . . . . . . . . . . . . . . . . . . . 1,200 32,267Sharp Corp.. . . . . . . . . . . . . . . . . . . . . . . . . . . . . . . . . . . . . . . . . . . . . . . . . . . 1,600 24,575Shimadzu Corp.. . . . . . . . . . . . . . . . . . . . . . . . . . . . . . . . . . . . . . . . . . . . . . . 800 32,264Shimano Inc.. . . . . . . . . . . . . . . . . . . . . . . . . . . . . . . . . . . . . . . . . . . . . . . . . . 100 25,598Shimizu Corp.. . . . . . . . . . . . . . . . . . . . . . . . . . . . . . . . . . . . . . . . . . . . . . . . . 3,600 26,512Shin-Etsu Chemical Co. Ltd. . . . . . . . . . . . . . . . . . . . . . . . . . . . . . . . . . . . 100 16,313Shionogi & Co. Ltd.. . . . . . . . . . . . . . . . . . . . . . . . . . . . . . . . . . . . . . . . . . . . 400 21,066Shiseido Co. Ltd. . . . . . . . . . . . . . . . . . . . . . . . . . . . . . . . . . . . . . . . . . . . . . . 400 26,734Shizuoka Bank Ltd. (The). . . . . . . . . . . . . . . . . . . . . . . . . . . . . . . . . . . . . . 4,000 28,887Softbank Corp. . . . . . . . . . . . . . . . . . . . . . . . . . . . . . . . . . . . . . . . . . . . . . . . . 2,000 26,122SoftBank Group Corp. . . . . . . . . . . . . . . . . . . . . . . . . . . . . . . . . . . . . . . . . . 400 25,154Sohgo Security Services Co. Ltd. . . . . . . . . . . . . . . . . . . . . . . . . . . . . . . 800 37,409Sompo Holdings Inc. . . . . . . . . . . . . . . . . . . . . . . . . . . . . . . . . . . . . . . . . . . 800 33,074Sony Group Corp. . . . . . . . . . . . . . . . . . . . . . . . . . . . . . . . . . . . . . . . . . . . . . 400 41,787Square Enix Holdings Co. Ltd. . . . . . . . . . . . . . . . . . . . . . . . . . . . . . . . . . 400 20,755Stanley Electric Co. Ltd. . . . . . . . . . . . . . . . . . . . . . . . . . . . . . . . . . . . . . . . 1,200 31,312Subaru Corp. . . . . . . . . . . . . . . . . . . . . . . . . . . . . . . . . . . . . . . . . . . . . . . . . . 1,200 23,576SUMCO Corp. . . . . . . . . . . . . . . . . . . . . . . . . . . . . . . . . . . . . . . . . . . . . . . . . 1,200 27,754Sumitomo Chemical Co. Ltd.. . . . . . . . . . . . . . . . . . . . . . . . . . . . . . . . . . . 5,200 27,069Sumitomo Corp.. . . . . . . . . . . . . . . . . . . . . . . . . . . . . . . . . . . . . . . . . . . . . . . 2,000 27,180Sumitomo Dainippon Pharma Co. Ltd.. . . . . . . . . . . . . . . . . . . . . . . . . . 1,600 27,704Sumitomo Electric Industries Ltd. . . . . . . . . . . . . . . . . . . . . . . . . . . . . . . 2,000 28,413Sumitomo Metal Mining Co. Ltd. . . . . . . . . . . . . . . . . . . . . . . . . . . . . . . . 800 32,422Sumitomo Mitsui Financial Group Inc. . . . . . . . . . . . . . . . . . . . . . . . . . . 800 26,967Sumitomo Mitsui Trust Holdings Inc.. . . . . . . . . . . . . . . . . . . . . . . . . . . . 800 26,261Sumitomo Realty & Development Co. Ltd. . . . . . . . . . . . . . . . . . . . . . . 800 26,075Suntory Beverage & Food Ltd. . . . . . . . . . . . . . . . . . . . . . . . . . . . . . . . . . 800 28,050Suzuki Motor Corp.. . . . . . . . . . . . . . . . . . . . . . . . . . . . . . . . . . . . . . . . . . . . 800 32,548Sysmex Corp.. . . . . . . . . . . . . . . . . . . . . . . . . . . . . . . . . . . . . . . . . . . . . . . . . 400 47,596T&D Holdings Inc. . . . . . . . . . . . . . . . . . . . . . . . . . . . . . . . . . . . . . . . . . . . . . 2,000 25,589Taisei Corp. . . . . . . . . . . . . . . . . . . . . . . . . . . . . . . . . . . . . . . . . . . . . . . . . . . . 800 26,961Taisho Pharmaceutical Holdings Co. Ltd. . . . . . . . . . . . . . . . . . . . . . . . 400 22,401Takeda Pharmaceutical Co. Ltd. . . . . . . . . . . . . . . . . . . . . . . . . . . . . . . . 851 28,327TDK Corp. . . . . . . . . . . . . . . . . . . . . . . . . . . . . . . . . . . . . . . . . . . . . . . . . . . . . 200 22,820Terumo Corp. . . . . . . . . . . . . . . . . . . . . . . . . . . . . . . . . . . . . . . . . . . . . . . . . . 800 31,049
Security s Value
Japan (continued)THK Co. Ltd. . . . . . . . . . . . . . . . . . . . . . . . . . . . . . . . . . . . . . . . . . . . . . . . . . . 800 $ 22,919TIS Inc. . . . . . . . . . . . . . . . . . . . . . . . . . . . . . . . . . . . . . . . . . . . . . . . . . . . . . . . 1,200 31,123Tobu Railway Co. Ltd. . . . . . . . . . . . . . . . . . . . . . . . . . . . . . . . . . . . . . . . . . 1,200 31,205Toho Co. Ltd. . . . . . . . . . . . . . . . . . . . . . . . . . . . . . . . . . . . . . . . . . . . . . . . . . 800 34,828Toho Gas Co. Ltd. . . . . . . . . . . . . . . . . . . . . . . . . . . . . . . . . . . . . . . . . . . . . . 400 19,443Tohoku Electric Power Co. Inc.. . . . . . . . . . . . . . . . . . . . . . . . . . . . . . . . . 3,200 24,244Tokio Marine Holdings Inc. . . . . . . . . . . . . . . . . . . . . . . . . . . . . . . . . . . . . . 400 19,064Tokyo Century Corp. . . . . . . . . . . . . . . . . . . . . . . . . . . . . . . . . . . . . . . . . . . 400 22,013Tokyo Electric Power Co. Holdings Inc.(a) . . . . . . . . . . . . . . . . . . . . . . . 8,800 23,454Tokyo Gas Co. Ltd. . . . . . . . . . . . . . . . . . . . . . . . . . . . . . . . . . . . . . . . . . . . . 1,600 30,286Tokyu Corp. . . . . . . . . . . . . . . . . . . . . . . . . . . . . . . . . . . . . . . . . . . . . . . . . . . . 2,000 26,805Toppan Inc. . . . . . . . . . . . . . . . . . . . . . . . . . . . . . . . . . . . . . . . . . . . . . . . . . . . 1,600 27,141Toray Industries Inc. . . . . . . . . . . . . . . . . . . . . . . . . . . . . . . . . . . . . . . . . . . . 4,400 28,970Toshiba Corp. . . . . . . . . . . . . . . . . . . . . . . . . . . . . . . . . . . . . . . . . . . . . . . . . . 800 34,433Tosoh Corp.. . . . . . . . . . . . . . . . . . . . . . . . . . . . . . . . . . . . . . . . . . . . . . . . . . . 1,600 28,078TOTO Ltd. . . . . . . . . . . . . . . . . . . . . . . . . . . . . . . . . . . . . . . . . . . . . . . . . . . . . 400 20,740Toyo Suisan Kaisha Ltd. . . . . . . . . . . . . . . . . . . . . . . . . . . . . . . . . . . . . . . . 800 30,542Toyota Industries Corp. . . . . . . . . . . . . . . . . . . . . . . . . . . . . . . . . . . . . . . . . 400 33,554Toyota Motor Corp. . . . . . . . . . . . . . . . . . . . . . . . . . . . . . . . . . . . . . . . . . . . . 400 35,910Toyota Tsusho Corp. . . . . . . . . . . . . . . . . . . . . . . . . . . . . . . . . . . . . . . . . . . 800 37,772Trend Micro Inc.. . . . . . . . . . . . . . . . . . . . . . . . . . . . . . . . . . . . . . . . . . . . . . . 800 41,650Tsuruha Holdings Inc. . . . . . . . . . . . . . . . . . . . . . . . . . . . . . . . . . . . . . . . . . 400 47,226Unicharm Corp. . . . . . . . . . . . . . . . . . . . . . . . . . . . . . . . . . . . . . . . . . . . . . . . 800 32,110United Urban Investment Corp. . . . . . . . . . . . . . . . . . . . . . . . . . . . . . . . . 20 29,420USS Co. Ltd.. . . . . . . . . . . . . . . . . . . . . . . . . . . . . . . . . . . . . . . . . . . . . . . . . . 3,200 55,705Welcia Holdings Co. Ltd. . . . . . . . . . . . . . . . . . . . . . . . . . . . . . . . . . . . . . . 800 27,232West Japan Railway Co.. . . . . . . . . . . . . . . . . . . . . . . . . . . . . . . . . . . . . . . 400 21,733Yakult Honsha Co. Ltd. . . . . . . . . . . . . . . . . . . . . . . . . . . . . . . . . . . . . . . . . 400 23,638Yamada Holdings Co. Ltd. . . . . . . . . . . . . . . . . . . . . . . . . . . . . . . . . . . . . . 5,600 26,457Yamaha Corp. . . . . . . . . . . . . . . . . . . . . . . . . . . . . . . . . . . . . . . . . . . . . . . . . 400 22,166Yamaha Motor Co. Ltd. . . . . . . . . . . . . . . . . . . . . . . . . . . . . . . . . . . . . . . . . 1,200 30,049Yamato Holdings Co. Ltd.. . . . . . . . . . . . . . . . . . . . . . . . . . . . . . . . . . . . . . 1,200 34,584Yaskawa Electric Corp. . . . . . . . . . . . . . . . . . . . . . . . . . . . . . . . . . . . . . . . . 800 39,613Yokogawa Electric Corp.. . . . . . . . . . . . . . . . . . . . . . . . . . . . . . . . . . . . . . . 1,600 24,615Z Holdings Corp. . . . . . . . . . . . . . . . . . . . . . . . . . . . . . . . . . . . . . . . . . . . . . . 6,800 34,035ZOZO Inc. . . . . . . . . . . . . . . . . . . . . . . . . . . . . . . . . . . . . . . . . . . . . . . . . . . . . 800 27,247
7,572,312Netherlands — 3.0%ABN AMRO Bank NV, CVA(a)(b) . . . . . . . . . . . . . . . . . . . . . . . . . . . . . . . . 2,324 27,090Adyen NV(a)(b). . . . . . . . . . . . . . . . . . . . . . . . . . . . . . . . . . . . . . . . . . . . . . . . . 12 32,521Aegon NV . . . . . . . . . . . . . . . . . . . . . . . . . . . . . . . . . . . . . . . . . . . . . . . . . . . . 6,544 27,862Akzo Nobel NV. . . . . . . . . . . . . . . . . . . . . . . . . . . . . . . . . . . . . . . . . . . . . . . . 224 27,670ArcelorMittal SA. . . . . . . . . . . . . . . . . . . . . . . . . . . . . . . . . . . . . . . . . . . . . . . 752 26,264Argenx SE(a) . . . . . . . . . . . . . . . . . . . . . . . . . . . . . . . . . . . . . . . . . . . . . . . . . . 92 28,095ASM International NV . . . . . . . . . . . . . . . . . . . . . . . . . . . . . . . . . . . . . . . . . 88 31,232ASML Holding NV . . . . . . . . . . . . . . . . . . . . . . . . . . . . . . . . . . . . . . . . . . . . . 33 25,225Davide Campari-Milano NV . . . . . . . . . . . . . . . . . . . . . . . . . . . . . . . . . . . . 2,092 29,410EXOR NV. . . . . . . . . . . . . . . . . . . . . . . . . . . . . . . . . . . . . . . . . . . . . . . . . . . . . 332 27,276Heineken Holding NV . . . . . . . . . . . . . . . . . . . . . . . . . . . . . . . . . . . . . . . . . 232 22,822Heineken NV. . . . . . . . . . . . . . . . . . . . . . . . . . . . . . . . . . . . . . . . . . . . . . . . . . 204 23,756ING Groep NV . . . . . . . . . . . . . . . . . . . . . . . . . . . . . . . . . . . . . . . . . . . . . . . . 2,080 26,688InPost SA(a). . . . . . . . . . . . . . . . . . . . . . . . . . . . . . . . . . . . . . . . . . . . . . . . . . . 1,788 35,059JDE Peet's NV . . . . . . . . . . . . . . . . . . . . . . . . . . . . . . . . . . . . . . . . . . . . . . . . 712 23,970Just Eat Takeaway.com NV(a)(b) . . . . . . . . . . . . . . . . . . . . . . . . . . . . . . . . 340 30,192Koninklijke Ahold Delhaize NV . . . . . . . . . . . . . . . . . . . . . . . . . . . . . . . . . 848 26,360Koninklijke DSM NV . . . . . . . . . . . . . . . . . . . . . . . . . . . . . . . . . . . . . . . . . . . 148 29,834Koninklijke KPN NV . . . . . . . . . . . . . . . . . . . . . . . . . . . . . . . . . . . . . . . . . . . 7,496 24,597Koninklijke Philips NV . . . . . . . . . . . . . . . . . . . . . . . . . . . . . . . . . . . . . . . . . 452 20,841Koninklijke Vopak NV. . . . . . . . . . . . . . . . . . . . . . . . . . . . . . . . . . . . . . . . . . 648 27,438NN Group NV . . . . . . . . . . . . . . . . . . . . . . . . . . . . . . . . . . . . . . . . . . . . . . . . . 552 27,443
Schedule of Investments (continued)
July 31, 2021
iShares� MSCI Intl Size Factor ETF(Percentages shown are based on Net Assets)
S C H E D U L E O F I N V E S T M E N T S 37

Security s Value
Netherlands (continued)Prosus NV . . . . . . . . . . . . . . . . . . . . . . . . . . . . . . . . . . . . . . . . . . . . . . . . . . . . 220 $ 19,628QIAGEN NV(a) . . . . . . . . . . . . . . . . . . . . . . . . . . . . . . . . . . . . . . . . . . . . . . . . 552 29,583Randstad NV . . . . . . . . . . . . . . . . . . . . . . . . . . . . . . . . . . . . . . . . . . . . . . . . . 392 28,440Royal Dutch Shell PLC, Class A. . . . . . . . . . . . . . . . . . . . . . . . . . . . . . . . 924 18,573Royal Dutch Shell PLC, Class B . . . . . . . . . . . . . . . . . . . . . . . . . . . . . . . 632 12,488Stellantis NV . . . . . . . . . . . . . . . . . . . . . . . . . . . . . . . . . . . . . . . . . . . . . . . . . . 1,340 25,697Wolters Kluwer NV . . . . . . . . . . . . . . . . . . . . . . . . . . . . . . . . . . . . . . . . . . . . 288 32,833
768,887New Zealand — 0.9%a2 Milk Co. Ltd. (The)(a) . . . . . . . . . . . . . . . . . . . . . . . . . . . . . . . . . . . . . . . 7,536 32,765Auckland International Airport Ltd.(a). . . . . . . . . . . . . . . . . . . . . . . . . . . . 4,688 23,653Fisher & Paykel Healthcare Corp. Ltd.. . . . . . . . . . . . . . . . . . . . . . . . . . 1,020 22,452Mercury NZ Ltd. . . . . . . . . . . . . . . . . . . . . . . . . . . . . . . . . . . . . . . . . . . . . . . . 6,076 27,956Meridian Energy Ltd. . . . . . . . . . . . . . . . . . . . . . . . . . . . . . . . . . . . . . . . . . . 7,808 28,389Ryman Healthcare Ltd. . . . . . . . . . . . . . . . . . . . . . . . . . . . . . . . . . . . . . . . . 2,352 21,603Spark New Zealand Ltd. . . . . . . . . . . . . . . . . . . . . . . . . . . . . . . . . . . . . . . . 10,696 35,305Xero Ltd.(a). . . . . . . . . . . . . . . . . . . . . . . . . . . . . . . . . . . . . . . . . . . . . . . . . . . . 280 29,051
221,174Norway — 1.1%Adevinta ASA(a) . . . . . . . . . . . . . . . . . . . . . . . . . . . . . . . . . . . . . . . . . . . . . . . 1,588 30,533DNB Bank ASA . . . . . . . . . . . . . . . . . . . . . . . . . . . . . . . . . . . . . . . . . . . . . . . 1,268 25,985Equinor ASA . . . . . . . . . . . . . . . . . . . . . . . . . . . . . . . . . . . . . . . . . . . . . . . . . . 1,210 23,570Gjensidige Forsikring ASA . . . . . . . . . . . . . . . . . . . . . . . . . . . . . . . . . . . . . 1,096 25,080Mowi ASA . . . . . . . . . . . . . . . . . . . . . . . . . . . . . . . . . . . . . . . . . . . . . . . . . . . . 1,196 30,474Norsk Hydro ASA . . . . . . . . . . . . . . . . . . . . . . . . . . . . . . . . . . . . . . . . . . . . . 4,228 28,129Orkla ASA . . . . . . . . . . . . . . . . . . . . . . . . . . . . . . . . . . . . . . . . . . . . . . . . . . . . 2,493 22,642Schibsted ASA, Class A . . . . . . . . . . . . . . . . . . . . . . . . . . . . . . . . . . . . . . . 228 12,085Schibsted ASA, Class B . . . . . . . . . . . . . . . . . . . . . . . . . . . . . . . . . . . . . . . 432 19,970Telenor ASA . . . . . . . . . . . . . . . . . . . . . . . . . . . . . . . . . . . . . . . . . . . . . . . . . . 1,336 23,196Yara International ASA . . . . . . . . . . . . . . . . . . . . . . . . . . . . . . . . . . . . . . . . 568 29,937
271,601Portugal — 0.4%EDP - Energias de Portugal SA . . . . . . . . . . . . . . . . . . . . . . . . . . . . . . . . 4,397 22,807EDP Renovaveis SA . . . . . . . . . . . . . . . . . . . . . . . . . . . . . . . . . . . . . . . . . . 1,248 29,313Galp Energia SGPS SA . . . . . . . . . . . . . . . . . . . . . . . . . . . . . . . . . . . . . . . 2,380 23,209Jeronimo Martins SGPS SA . . . . . . . . . . . . . . . . . . . . . . . . . . . . . . . . . . . 1,276 25,997
101,326Singapore — 2.2%Ascendas REIT . . . . . . . . . . . . . . . . . . . . . . . . . . . . . . . . . . . . . . . . . . . . . . . 16,007 36,836CapitaLand Integrated Commercial Trust . . . . . . . . . . . . . . . . . . . . . . . 16,403 25,992CapitaLand Ltd. . . . . . . . . . . . . . . . . . . . . . . . . . . . . . . . . . . . . . . . . . . . . . . . 10,000 29,710City Developments Ltd. . . . . . . . . . . . . . . . . . . . . . . . . . . . . . . . . . . . . . . . . 6,000 30,267DBS Group Holdings Ltd. . . . . . . . . . . . . . . . . . . . . . . . . . . . . . . . . . . . . . . 1,200 26,852Genting Singapore Ltd. . . . . . . . . . . . . . . . . . . . . . . . . . . . . . . . . . . . . . . . . 47,600 28,403Keppel Corp. Ltd. . . . . . . . . . . . . . . . . . . . . . . . . . . . . . . . . . . . . . . . . . . . . . 6,800 27,491Mapletree Commercial Trust . . . . . . . . . . . . . . . . . . . . . . . . . . . . . . . . . . . 16,800 26,747Mapletree Logistics Trust . . . . . . . . . . . . . . . . . . . . . . . . . . . . . . . . . . . . . . 21,881 34,068Oversea-Chinese Banking Corp. Ltd.. . . . . . . . . . . . . . . . . . . . . . . . . . . 2,800 25,332Sea Ltd., ADR(a). . . . . . . . . . . . . . . . . . . . . . . . . . . . . . . . . . . . . . . . . . . . . . . 104 28,721Singapore Airlines Ltd.(a). . . . . . . . . . . . . . . . . . . . . . . . . . . . . . . . . . . . . . . 8,000 29,992Singapore Exchange Ltd. . . . . . . . . . . . . . . . . . . . . . . . . . . . . . . . . . . . . . . 2,600 22,750Singapore Technologies Engineering Ltd.. . . . . . . . . . . . . . . . . . . . . . . 15,200 44,888Singapore Telecommunications Ltd. . . . . . . . . . . . . . . . . . . . . . . . . . . . . 14,800 24,806United Overseas Bank Ltd. . . . . . . . . . . . . . . . . . . . . . . . . . . . . . . . . . . . . 1,200 23,200UOL Group Ltd. . . . . . . . . . . . . . . . . . . . . . . . . . . . . . . . . . . . . . . . . . . . . . . . 5,600 30,097Venture Corp. Ltd.. . . . . . . . . . . . . . . . . . . . . . . . . . . . . . . . . . . . . . . . . . . . . 2,000 28,054Wilmar International Ltd.. . . . . . . . . . . . . . . . . . . . . . . . . . . . . . . . . . . . . . . 7,200 23,058
547,264
Security s Value
Spain — 1.7%ACS Actividades de Construccion y Servicios SA . . . . . . . . . . . . . . . 866 $ 22,779Aena SME SA(a)(b) . . . . . . . . . . . . . . . . . . . . . . . . . . . . . . . . . . . . . . . . . . . . 132 21,021Amadeus IT Group SA(a) . . . . . . . . . . . . . . . . . . . . . . . . . . . . . . . . . . . . . . 364 23,871Banco Bilbao Vizcaya Argentaria SA . . . . . . . . . . . . . . . . . . . . . . . . . . . 4,136 26,476Banco Santander SA . . . . . . . . . . . . . . . . . . . . . . . . . . . . . . . . . . . . . . . . . . 6,880 25,202CaixaBank SA . . . . . . . . . . . . . . . . . . . . . . . . . . . . . . . . . . . . . . . . . . . . . . . . 8,944 26,563Cellnex Telecom SA(b) . . . . . . . . . . . . . . . . . . . . . . . . . . . . . . . . . . . . . . . . . 549 35,804Enagas SA . . . . . . . . . . . . . . . . . . . . . . . . . . . . . . . . . . . . . . . . . . . . . . . . . . . 433 9,945Endesa SA . . . . . . . . . . . . . . . . . . . . . . . . . . . . . . . . . . . . . . . . . . . . . . . . . . . 1,156 28,080Ferrovial SA . . . . . . . . . . . . . . . . . . . . . . . . . . . . . . . . . . . . . . . . . . . . . . . . . . 890 26,411Grifols SA. . . . . . . . . . . . . . . . . . . . . . . . . . . . . . . . . . . . . . . . . . . . . . . . . . . . . 868 22,075Iberdrola SA . . . . . . . . . . . . . . . . . . . . . . . . . . . . . . . . . . . . . . . . . . . . . . . . . . 2,007 24,154Industria de Diseno Textil SA . . . . . . . . . . . . . . . . . . . . . . . . . . . . . . . . . . 760 25,776Naturgy Energy Group SA . . . . . . . . . . . . . . . . . . . . . . . . . . . . . . . . . . . . . 1,056 27,255Red Electrica Corp. SA . . . . . . . . . . . . . . . . . . . . . . . . . . . . . . . . . . . . . . . . 870 17,234Repsol SA . . . . . . . . . . . . . . . . . . . . . . . . . . . . . . . . . . . . . . . . . . . . . . . . . . . . 1,984 21,731Siemens Gamesa Renewable Energy SA(a) . . . . . . . . . . . . . . . . . . . . 896 24,988Telefonica SA . . . . . . . . . . . . . . . . . . . . . . . . . . . . . . . . . . . . . . . . . . . . . . . . . 5,801 26,539
435,904Sweden — 4.0%Alfa Laval AB . . . . . . . . . . . . . . . . . . . . . . . . . . . . . . . . . . . . . . . . . . . . . . . . . 732 30,569Assa Abloy AB, Class B . . . . . . . . . . . . . . . . . . . . . . . . . . . . . . . . . . . . . . . 936 30,023Atlas Copco AB, Class A. . . . . . . . . . . . . . . . . . . . . . . . . . . . . . . . . . . . . . . 300 20,317Atlas Copco AB, Class B . . . . . . . . . . . . . . . . . . . . . . . . . . . . . . . . . . . . . . 172 9,780Boliden AB. . . . . . . . . . . . . . . . . . . . . . . . . . . . . . . . . . . . . . . . . . . . . . . . . . . . 724 28,216Electrolux AB, Series B . . . . . . . . . . . . . . . . . . . . . . . . . . . . . . . . . . . . . . . . 968 25,423Embracer Group AB(a) . . . . . . . . . . . . . . . . . . . . . . . . . . . . . . . . . . . . . . . . . 1,016 26,296Epiroc AB, Class A . . . . . . . . . . . . . . . . . . . . . . . . . . . . . . . . . . . . . . . . . . . . 832 19,381Epiroc AB, Class B . . . . . . . . . . . . . . . . . . . . . . . . . . . . . . . . . . . . . . . . . . . . 568 11,412EQT AB. . . . . . . . . . . . . . . . . . . . . . . . . . . . . . . . . . . . . . . . . . . . . . . . . . . . . . . 916 44,153Essity AB, Class B . . . . . . . . . . . . . . . . . . . . . . . . . . . . . . . . . . . . . . . . . . . . 816 26,698Evolution AB(b) . . . . . . . . . . . . . . . . . . . . . . . . . . . . . . . . . . . . . . . . . . . . . . . . 152 26,448Fastighets AB Balder, Class B(a) . . . . . . . . . . . . . . . . . . . . . . . . . . . . . . . 392 27,051H & M Hennes & Mauritz AB, Class B(a) . . . . . . . . . . . . . . . . . . . . . . . . 1,152 24,084Hexagon AB, Class B . . . . . . . . . . . . . . . . . . . . . . . . . . . . . . . . . . . . . . . . . 2,072 34,299Husqvarna AB, Class B. . . . . . . . . . . . . . . . . . . . . . . . . . . . . . . . . . . . . . . . 2,216 31,010ICA Gruppen AB . . . . . . . . . . . . . . . . . . . . . . . . . . . . . . . . . . . . . . . . . . . . . . 504 24,912Industrivarden AB, Class A. . . . . . . . . . . . . . . . . . . . . . . . . . . . . . . . . . . . . 304 12,130Industrivarden AB, Class C . . . . . . . . . . . . . . . . . . . . . . . . . . . . . . . . . . . . 388 14,853Investment AB Latour, Class B . . . . . . . . . . . . . . . . . . . . . . . . . . . . . . . . . 840 32,829Investor AB, Class B . . . . . . . . . . . . . . . . . . . . . . . . . . . . . . . . . . . . . . . . . . 1,344 33,283Kinnevik AB, Class B . . . . . . . . . . . . . . . . . . . . . . . . . . . . . . . . . . . . . . . . . . 500 21,798L E Lundbergforetagen AB, Class B . . . . . . . . . . . . . . . . . . . . . . . . . . . . 436 31,112Lundin Energy AB . . . . . . . . . . . . . . . . . . . . . . . . . . . . . . . . . . . . . . . . . . . . . 820 25,563Nibe Industrier AB, Class B . . . . . . . . . . . . . . . . . . . . . . . . . . . . . . . . . . . . 3,392 40,534Sandvik AB . . . . . . . . . . . . . . . . . . . . . . . . . . . . . . . . . . . . . . . . . . . . . . . . . . . 1,040 27,119Securitas AB, Class B . . . . . . . . . . . . . . . . . . . . . . . . . . . . . . . . . . . . . . . . . 1,368 24,122Sinch AB.(a)(b) . . . . . . . . . . . . . . . . . . . . . . . . . . . . . . . . . . . . . . . . . . . . . . . . . 1,800 36,298Skandinaviska Enskilda Banken AB, Class A . . . . . . . . . . . . . . . . . . . 2,208 29,863Skanska AB, Class B . . . . . . . . . . . . . . . . . . . . . . . . . . . . . . . . . . . . . . . . . . 1,008 28,455SKF AB, Class B . . . . . . . . . . . . . . . . . . . . . . . . . . . . . . . . . . . . . . . . . . . . . . 984 26,181Svenska Cellulosa AB SCA, Class B . . . . . . . . . . . . . . . . . . . . . . . . . . . 1,444 26,859Svenska Handelsbanken AB, Class A . . . . . . . . . . . . . . . . . . . . . . . . . . 2,360 26,596Swedbank AB, Class A . . . . . . . . . . . . . . . . . . . . . . . . . . . . . . . . . . . . . . . . 1,264 24,615Swedish Match AB . . . . . . . . . . . . . . . . . . . . . . . . . . . . . . . . . . . . . . . . . . . . 2,800 25,074Tele2 AB, Class B . . . . . . . . . . . . . . . . . . . . . . . . . . . . . . . . . . . . . . . . . . . . . 1,872 27,498Telefonaktiebolaget LM Ericsson, Class B . . . . . . . . . . . . . . . . . . . . . . 2,048 23,622Telia Co. AB . . . . . . . . . . . . . . . . . . . . . . . . . . . . . . . . . . . . . . . . . . . . . . . . . . 6,328 27,757
Schedule of Investments (continued)
July 31, 2021
iShares� MSCI Intl Size Factor ETF(Percentages shown are based on Net Assets)
38 2 0 2 1 I S H A R E S A N N U A L R E P O R T T O S H A R E H O L D E R S

Security s Value
Sweden (continued)Volvo AB, Class B . . . . . . . . . . . . . . . . . . . . . . . . . . . . . . . . . . . . . . . . . . . . . 880 $ 20,752
1,026,985Switzerland — 4.5%ABB Ltd., Registered . . . . . . . . . . . . . . . . . . . . . . . . . . . . . . . . . . . . . . . . . . 696 25,445Adecco Group AG, Registered . . . . . . . . . . . . . . . . . . . . . . . . . . . . . . . . . 400 23,954Alcon Inc. . . . . . . . . . . . . . . . . . . . . . . . . . . . . . . . . . . . . . . . . . . . . . . . . . . . . . 340 24,752Baloise Holding AG, Registered . . . . . . . . . . . . . . . . . . . . . . . . . . . . . . . . 192 30,273Banque Cantonale Vaudoise, Registered . . . . . . . . . . . . . . . . . . . . . . . 300 26,782Barry Callebaut AG, Registered . . . . . . . . . . . . . . . . . . . . . . . . . . . . . . . . 12 30,416Chocoladefabriken Lindt & Spruengli AG, Participation
Certificates, NVS . . . . . . . . . . . . . . . . . . . . . . . . . . . . . . . . . . . . . . . . . . . 4 44,820Cie. Financiere Richemont SA, Class A, Registered. . . . . . . . . . . . . 268 34,296Clariant AG, Registered . . . . . . . . . . . . . . . . . . . . . . . . . . . . . . . . . . . . . . . 1,188 24,715Coca-Cola HBC AG, Class DI . . . . . . . . . . . . . . . . . . . . . . . . . . . . . . . . . . 792 29,908Credit Suisse Group AG, Registered . . . . . . . . . . . . . . . . . . . . . . . . . . . 2,536 25,460EMS-Chemie Holding AG, Registered . . . . . . . . . . . . . . . . . . . . . . . . . . 28 31,040Geberit AG, Registered . . . . . . . . . . . . . . . . . . . . . . . . . . . . . . . . . . . . . . . . 44 36,127Givaudan SA, Registered. . . . . . . . . . . . . . . . . . . . . . . . . . . . . . . . . . . . . . 8 39,930Holcim Ltd. . . . . . . . . . . . . . . . . . . . . . . . . . . . . . . . . . . . . . . . . . . . . . . . . . . . 428 25,090Julius Baer Group Ltd.. . . . . . . . . . . . . . . . . . . . . . . . . . . . . . . . . . . . . . . . . 468 30,889Kuehne + Nagel International AG, Registered. . . . . . . . . . . . . . . . . . . 76 25,637Logitech International SA, Registered . . . . . . . . . . . . . . . . . . . . . . . . . . 300 32,961Lonza Group AG, Registered . . . . . . . . . . . . . . . . . . . . . . . . . . . . . . . . . . 40 31,145Nestle SA, Registered . . . . . . . . . . . . . . . . . . . . . . . . . . . . . . . . . . . . . . . . . 184 23,300Novartis AG, Registered . . . . . . . . . . . . . . . . . . . . . . . . . . . . . . . . . . . . . . . 396 36,621Partners Group Holding AG. . . . . . . . . . . . . . . . . . . . . . . . . . . . . . . . . . . . 16 27,334Roche Holding AG, NVS. . . . . . . . . . . . . . . . . . . . . . . . . . . . . . . . . . . . . . . 101 39,017Schindler Holding AG, Participation Certificates, NVS . . . . . . . . . . . 56 18,129Schindler Holding AG, Registered . . . . . . . . . . . . . . . . . . . . . . . . . . . . . . 20 6,232SGS SA, Registered . . . . . . . . . . . . . . . . . . . . . . . . . . . . . . . . . . . . . . . . . . 8 25,893Siemens Energy AG(a). . . . . . . . . . . . . . . . . . . . . . . . . . . . . . . . . . . . . . . . . 822 22,362Sika AG, Registered. . . . . . . . . . . . . . . . . . . . . . . . . . . . . . . . . . . . . . . . . . . 80 28,182Sonova Holding AG, Registered. . . . . . . . . . . . . . . . . . . . . . . . . . . . . . . . 96 37,693STMicroelectronics NV . . . . . . . . . . . . . . . . . . . . . . . . . . . . . . . . . . . . . . . . 644 26,503Straumann Holding AG, Registered . . . . . . . . . . . . . . . . . . . . . . . . . . . . 20 37,080Swatch Group AG (The), Bearer . . . . . . . . . . . . . . . . . . . . . . . . . . . . . . . 76 25,352Swatch Group AG (The), Registered . . . . . . . . . . . . . . . . . . . . . . . . . . . 104 6,754Swiss Life Holding AG, Registered . . . . . . . . . . . . . . . . . . . . . . . . . . . . . 56 28,885Swiss Prime Site AG, Registered. . . . . . . . . . . . . . . . . . . . . . . . . . . . . . . 236 25,130Swiss Re AG. . . . . . . . . . . . . . . . . . . . . . . . . . . . . . . . . . . . . . . . . . . . . . . . . . 244 22,121Swisscom AG, Registered . . . . . . . . . . . . . . . . . . . . . . . . . . . . . . . . . . . . . 44 26,444Temenos AG, Registered . . . . . . . . . . . . . . . . . . . . . . . . . . . . . . . . . . . . . . 200 31,770UBS Group AG, Registered . . . . . . . . . . . . . . . . . . . . . . . . . . . . . . . . . . . . 1,540 25,373Vifor Pharma AG . . . . . . . . . . . . . . . . . . . . . . . . . . . . . . . . . . . . . . . . . . . . . . 192 26,851Zurich Insurance Group AG. . . . . . . . . . . . . . . . . . . . . . . . . . . . . . . . . . . . 52 20,965
1,141,631United Kingdom — 8.7%3i Group PLC . . . . . . . . . . . . . . . . . . . . . . . . . . . . . . . . . . . . . . . . . . . . . . . . . 1,668 29,646Abrdn PLC. . . . . . . . . . . . . . . . . . . . . . . . . . . . . . . . . . . . . . . . . . . . . . . . . . . . 6,760 26,668Admiral Group PLC . . . . . . . . . . . . . . . . . . . . . . . . . . . . . . . . . . . . . . . . . . . 676 31,933Anglo American PLC . . . . . . . . . . . . . . . . . . . . . . . . . . . . . . . . . . . . . . . . . . 520 23,043Antofagasta PLC . . . . . . . . . . . . . . . . . . . . . . . . . . . . . . . . . . . . . . . . . . . . . . 1,168 24,251Ashtead Group PLC . . . . . . . . . . . . . . . . . . . . . . . . . . . . . . . . . . . . . . . . . . . 356 26,639Associated British Foods PLC . . . . . . . . . . . . . . . . . . . . . . . . . . . . . . . . . 872 24,248AstraZeneca PLC . . . . . . . . . . . . . . . . . . . . . . . . . . . . . . . . . . . . . . . . . . . . . 188 21,603Auto Trader Group PLC(a)(b) . . . . . . . . . . . . . . . . . . . . . . . . . . . . . . . . . . . 3,356 30,406AVEVA Group PLC . . . . . . . . . . . . . . . . . . . . . . . . . . . . . . . . . . . . . . . . . . . . 640 34,920Aviva PLC . . . . . . . . . . . . . . . . . . . . . . . . . . . . . . . . . . . . . . . . . . . . . . . . . . . . 5,144 27,627BAE Systems PLC . . . . . . . . . . . . . . . . . . . . . . . . . . . . . . . . . . . . . . . . . . . . 3,404 27,292
Security s Value
United Kingdom (continued)Barclays PLC . . . . . . . . . . . . . . . . . . . . . . . . . . . . . . . . . . . . . . . . . . . . . . . . . 11,128 $ 26,920Barratt Developments PLC . . . . . . . . . . . . . . . . . . . . . . . . . . . . . . . . . . . . 2,672 26,113Berkeley Group Holdings PLC . . . . . . . . . . . . . . . . . . . . . . . . . . . . . . . . . 388 26,123BP PLC. . . . . . . . . . . . . . . . . . . . . . . . . . . . . . . . . . . . . . . . . . . . . . . . . . . . . . . 6,860 27,536British American Tobacco PLC . . . . . . . . . . . . . . . . . . . . . . . . . . . . . . . . . 556 20,679British Land Co. PLC (The) . . . . . . . . . . . . . . . . . . . . . . . . . . . . . . . . . . . . 3,696 26,167BT Group PLC(a) . . . . . . . . . . . . . . . . . . . . . . . . . . . . . . . . . . . . . . . . . . . . . . 10,788 25,985Bunzl PLC . . . . . . . . . . . . . . . . . . . . . . . . . . . . . . . . . . . . . . . . . . . . . . . . . . . . 756 28,008Burberry Group PLC . . . . . . . . . . . . . . . . . . . . . . . . . . . . . . . . . . . . . . . . . . 1,116 32,011Coca-Cola Europacific Partners PLC . . . . . . . . . . . . . . . . . . . . . . . . . . . 388 24,079Compass Group PLC(a). . . . . . . . . . . . . . . . . . . . . . . . . . . . . . . . . . . . . . . . 1,272 26,877Croda International PLC . . . . . . . . . . . . . . . . . . . . . . . . . . . . . . . . . . . . . . . 308 36,055DCC PLC. . . . . . . . . . . . . . . . . . . . . . . . . . . . . . . . . . . . . . . . . . . . . . . . . . . . . 324 27,126Diageo PLC. . . . . . . . . . . . . . . . . . . . . . . . . . . . . . . . . . . . . . . . . . . . . . . . . . . 584 28,958Direct Line Insurance Group PLC . . . . . . . . . . . . . . . . . . . . . . . . . . . . . . 6,024 24,902Entain PLC(a) . . . . . . . . . . . . . . . . . . . . . . . . . . . . . . . . . . . . . . . . . . . . . . . . . 1,268 31,974Evraz PLC . . . . . . . . . . . . . . . . . . . . . . . . . . . . . . . . . . . . . . . . . . . . . . . . . . . . 2,616 22,351Experian PLC . . . . . . . . . . . . . . . . . . . . . . . . . . . . . . . . . . . . . . . . . . . . . . . . . 604 26,592Ferguson PLC . . . . . . . . . . . . . . . . . . . . . . . . . . . . . . . . . . . . . . . . . . . . . . . . 220 30,842GlaxoSmithKline PLC . . . . . . . . . . . . . . . . . . . . . . . . . . . . . . . . . . . . . . . . . 1,156 22,824Halma PLC . . . . . . . . . . . . . . . . . . . . . . . . . . . . . . . . . . . . . . . . . . . . . . . . . . . 760 30,507Hargreaves Lansdown PLC. . . . . . . . . . . . . . . . . . . . . . . . . . . . . . . . . . . . 1,216 27,580Hikma Pharmaceuticals PLC. . . . . . . . . . . . . . . . . . . . . . . . . . . . . . . . . . . 700 25,740HSBC Holdings PLC . . . . . . . . . . . . . . . . . . . . . . . . . . . . . . . . . . . . . . . . . . 4,260 23,516Imperial Brands PLC . . . . . . . . . . . . . . . . . . . . . . . . . . . . . . . . . . . . . . . . . . 1,104 23,637Informa PLC(a) . . . . . . . . . . . . . . . . . . . . . . . . . . . . . . . . . . . . . . . . . . . . . . . . 3,052 20,971InterContinental Hotels Group PLC(a). . . . . . . . . . . . . . . . . . . . . . . . . . . 400 26,417Intertek Group PLC. . . . . . . . . . . . . . . . . . . . . . . . . . . . . . . . . . . . . . . . . . . . 372 26,652J Sainsbury PLC . . . . . . . . . . . . . . . . . . . . . . . . . . . . . . . . . . . . . . . . . . . . . . 6,060 23,863JD Sports Fashion PLC. . . . . . . . . . . . . . . . . . . . . . . . . . . . . . . . . . . . . . . . 2,256 28,110Johnson Matthey PLC . . . . . . . . . . . . . . . . . . . . . . . . . . . . . . . . . . . . . . . . . 640 26,454Kingfisher PLC . . . . . . . . . . . . . . . . . . . . . . . . . . . . . . . . . . . . . . . . . . . . . . . . 6,228 31,990Land Securities Group PLC. . . . . . . . . . . . . . . . . . . . . . . . . . . . . . . . . . . . 2,604 25,630Legal & General Group PLC . . . . . . . . . . . . . . . . . . . . . . . . . . . . . . . . . . . 6,652 24,097Lloyds Banking Group PLC . . . . . . . . . . . . . . . . . . . . . . . . . . . . . . . . . . . . 36,468 23,058London Stock Exchange Group PLC . . . . . . . . . . . . . . . . . . . . . . . . . . . 224 23,357M&G PLC. . . . . . . . . . . . . . . . . . . . . . . . . . . . . . . . . . . . . . . . . . . . . . . . . . . . . 8,084 25,313Melrose Industries PLC. . . . . . . . . . . . . . . . . . . . . . . . . . . . . . . . . . . . . . . . 10,768 23,929Mondi PLC. . . . . . . . . . . . . . . . . . . . . . . . . . . . . . . . . . . . . . . . . . . . . . . . . . . . 1,064 29,498National Grid PLC. . . . . . . . . . . . . . . . . . . . . . . . . . . . . . . . . . . . . . . . . . . . . 1,808 23,117Natwest Group PLC . . . . . . . . . . . . . . . . . . . . . . . . . . . . . . . . . . . . . . . . . . . 10,984 30,829Next PLC(a) . . . . . . . . . . . . . . . . . . . . . . . . . . . . . . . . . . . . . . . . . . . . . . . . . . . 284 31,110Ocado Group PLC(a) . . . . . . . . . . . . . . . . . . . . . . . . . . . . . . . . . . . . . . . . . . 860 22,160Pearson PLC . . . . . . . . . . . . . . . . . . . . . . . . . . . . . . . . . . . . . . . . . . . . . . . . . 2,316 27,909Persimmon PLC . . . . . . . . . . . . . . . . . . . . . . . . . . . . . . . . . . . . . . . . . . . . . . 656 26,461Phoenix Group Holdings PLC . . . . . . . . . . . . . . . . . . . . . . . . . . . . . . . . . . 2,712 25,557Prudential PLC. . . . . . . . . . . . . . . . . . . . . . . . . . . . . . . . . . . . . . . . . . . . . . . . 1,280 24,037Reckitt Benckiser Group PLC . . . . . . . . . . . . . . . . . . . . . . . . . . . . . . . . . . 252 19,278RELX PLC . . . . . . . . . . . . . . . . . . . . . . . . . . . . . . . . . . . . . . . . . . . . . . . . . . . . 964 28,336Rentokil Initial PLC . . . . . . . . . . . . . . . . . . . . . . . . . . . . . . . . . . . . . . . . . . . . 4,580 36,079Rolls-Royce Holdings PLC(a). . . . . . . . . . . . . . . . . . . . . . . . . . . . . . . . . . . 18,504 25,556Sage Group PLC (The) . . . . . . . . . . . . . . . . . . . . . . . . . . . . . . . . . . . . . . . . 2,884 28,112Schroders PLC. . . . . . . . . . . . . . . . . . . . . . . . . . . . . . . . . . . . . . . . . . . . . . . . 632 32,096Segro PLC. . . . . . . . . . . . . . . . . . . . . . . . . . . . . . . . . . . . . . . . . . . . . . . . . . . . 1,868 31,577Severn Trent PLC . . . . . . . . . . . . . . . . . . . . . . . . . . . . . . . . . . . . . . . . . . . . . 700 27,210Smith & Nephew PLC . . . . . . . . . . . . . . . . . . . . . . . . . . . . . . . . . . . . . . . . . 1,084 22,121Smiths Group PLC . . . . . . . . . . . . . . . . . . . . . . . . . . . . . . . . . . . . . . . . . . . . 1,212 26,187Spirax-Sarco Engineering PLC. . . . . . . . . . . . . . . . . . . . . . . . . . . . . . . . . 164 34,169SSE PLC . . . . . . . . . . . . . . . . . . . . . . . . . . . . . . . . . . . . . . . . . . . . . . . . . . . . . 1,224 24,541St. James's Place PLC . . . . . . . . . . . . . . . . . . . . . . . . . . . . . . . . . . . . . . . . 1,852 40,803
Schedule of Investments (continued)
July 31, 2021
iShares� MSCI Intl Size Factor ETF(Percentages shown are based on Net Assets)
S C H E D U L E O F I N V E S T M E N T S 39

Security s Value
United Kingdom (continued)Standard Chartered PLC . . . . . . . . . . . . . . . . . . . . . . . . . . . . . . . . . . . . . . 3,820 $ 22,900Taylor Wimpey PLC . . . . . . . . . . . . . . . . . . . . . . . . . . . . . . . . . . . . . . . . . . . 10,792 24,673Tesco PLC . . . . . . . . . . . . . . . . . . . . . . . . . . . . . . . . . . . . . . . . . . . . . . . . . . . . 8,964 29,020Unilever PLC. . . . . . . . . . . . . . . . . . . . . . . . . . . . . . . . . . . . . . . . . . . . . . . . . . 504 29,006United Utilities Group PLC . . . . . . . . . . . . . . . . . . . . . . . . . . . . . . . . . . . . . 1,936 28,826Vodafone Group PLC. . . . . . . . . . . . . . . . . . . . . . . . . . . . . . . . . . . . . . . . . . 13,212 21,244Whitbread PLC(a). . . . . . . . . . . . . . . . . . . . . . . . . . . . . . . . . . . . . . . . . . . . . . 608 25,698Wm Morrison Supermarkets PLC . . . . . . . . . . . . . . . . . . . . . . . . . . . . . . 10,104 37,583WPP PLC. . . . . . . . . . . . . . . . . . . . . . . . . . . . . . . . . . . . . . . . . . . . . . . . . . . . . 2,208 28,556
2,195,468
Total Common Stocks — 99.2%(Cost: $22,203,758). . . . . . . . . . . . . . . . . . . . . . . . . . . . . . . . . . . . . . . . . . . . . . . . . 25,168,514
Preferred StocksGermany — 0.5%Bayerische Motoren Werke AG, Preference Shares, NVS . . . . . . . 40 3,433Fuchs Petrolub SE, Preference Shares, NVS . . . . . . . . . . . . . . . . . . . 464 23,120Henkel AG & Co. KGaA, Preference Shares, NVS . . . . . . . . . . . . . . 188 19,060Porsche Automobil Holding SE, Preference Shares, NVS . . . . . . . 292 31,604Sartorius AG, Preference Shares, NVS . . . . . . . . . . . . . . . . . . . . . . . . . 52 31,456Volkswagen AG, Preference Shares, NVS . . . . . . . . . . . . . . . . . . . . . . 84 20,460
129,133Italy — 0.0%Telecom Italia SpA/Milano, Preference Shares, NVS . . . . . . . . . . . . 18,765 8,749
Total Preferred Stocks — 0.5%(Cost: $110,286). . . . . . . . . . . . . . . . . . . . . . . . . . . . . . . . . . . . . . . . . . . . . . . . . . . . 137,882
Security s Value
Short-Term InvestmentsMoney Market Funds — 0.1%BlackRock Cash Funds: Institutional, SL Agency Shares,
0.06%(d)(e)(f) . . . . . . . . . . . . . . . . . . . . . . . . . . . . . . . . . . . . . . . . . . . . . . . . 36,165 $ 36,183
Total Short-Term Investments — 0.1%(Cost: $36,183) . . . . . . . . . . . . . . . . . . . . . . . . . . . . . . . . . . . . . . . . . . . . . . . . . . . . . 36,183
Total Investments in Securities — 99.8%(Cost: $22,350,227). . . . . . . . . . . . . . . . . . . . . . . . . . . . . . . . . . . . . . . . . . . . . . . . . 25,342,579
Other Assets, Less Liabilities — 0.2% . . . . . . . . . . . . . . . . . . . . . . . . . . . . . . . . 41,898
Net Assets — 100.0% . . . . . . . . . . . . . . . . . . . . . . . . . . . . . . . . . . . . . . . . . . . . . . . . . $ 25,384,477
(a) Non-income producing security.(b) Security exempt from registration pursuant to Rule 144A under the Securities Act of
1933, as amended. These securities may be resold in transactions exempt fromregistration to qualified institutional investors.
(c) All or a portion of this security is on loan.(d) Affiliate of the Fund.(e) Annualized 7-day yield as of period-end.(f) All or a portion of this security was purchased with cash collateral received from loaned
securities.
Affiliates
Investments in issuers considered to be affiliate(s) of the Fund during the year ended July 31, 2021 for purposes of Section 2(a)(3) of the Investment Company Act of 1940,as amended, were as follows:
Affiliated IssuerValue at
07/31/20Purchases
at CostProceeds
from SalesNet Realized
Gain (Loss)
Change inUnrealized
Appreciation(Depreciation)
Value at07/31/21
SharesHeld at
07/31/21 Income
CapitalGain
Distributionsfrom
UnderlyingFunds
BlackRock Cash Funds: Institutional, SL Agency Shares . . $243,126 $ — $(206,835)(a) $ 13 $ (121) $ 36,183 36,165 $ 1,983(b) $ —BlackRock Cash Funds: Treasury, SL Agency Shares(c) . . . — 0(a) — — — — — 1 —
$ 13 $ (121) $ 36,183 $ 1,984 $ —
(a) Represents net amount purchased (sold).(b) All or a portion represents securities lending income earned from the reinvestment of cash collateral from loaned securities, net of fees and collateral investment expenses, and other
payments to and from borrowers of securities.(c) As of period end, the entity is no longer held.
Futures Contracts
DescriptionNumber ofContracts
ExpirationDate
NotionalAmount
(000)
Value/Unrealized
Appreciation(Depreciation)
Long ContractsTOPIX Index . . . . . . . . . . . . . . . . . . . . . . . . . . . . . . . . . . . . . . . . . . . . . . . . . . . . . . . . . . . . . . . . . . . . . . . . . . . . . . . . . . . . . . . . . . . . . . . . . . . . . . . . 1 09/09/21 $ 17 $ (348)
Schedule of Investments (continued)
July 31, 2021
iShares� MSCI Intl Size Factor ETF(Percentages shown are based on Net Assets)
40 2 0 2 1 I S H A R E S A N N U A L R E P O R T T O S H A R E H O L D E R S
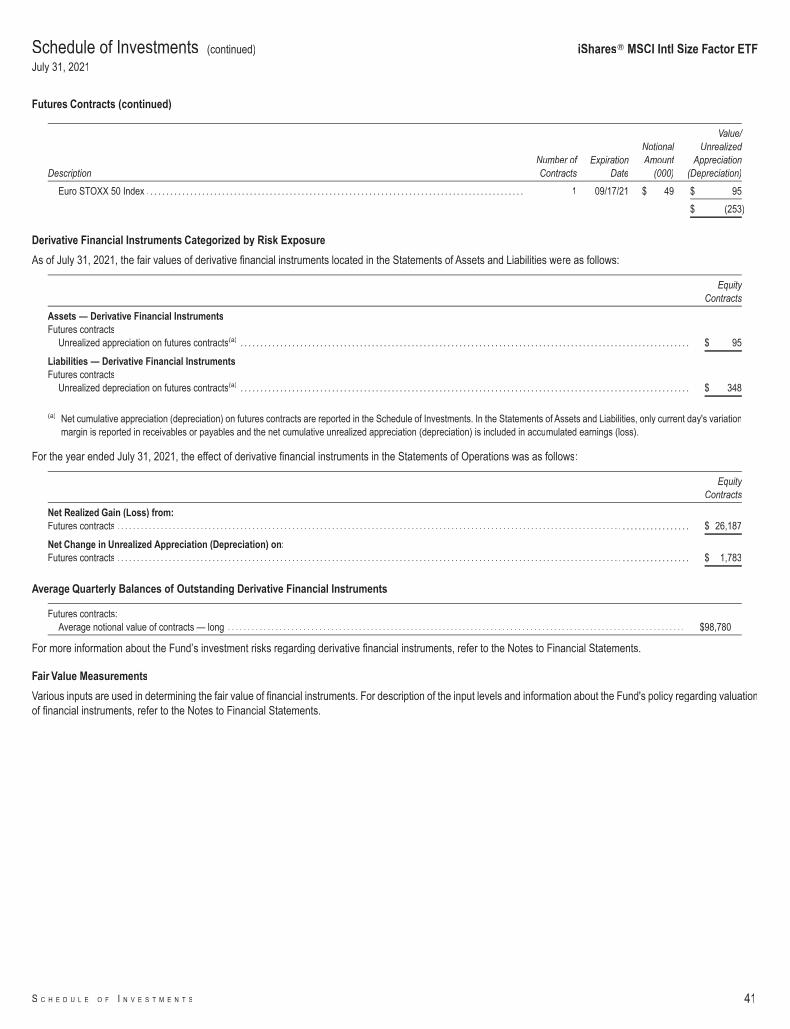
Futures Contracts (continued)
DescriptionNumber ofContracts
ExpirationDate
NotionalAmount
(000)
Value/Unrealized
Appreciation(Depreciation)
Euro STOXX 50 Index . . . . . . . . . . . . . . . . . . . . . . . . . . . . . . . . . . . . . . . . . . . . . . . . . . . . . . . . . . . . . . . . . . . . . . . . . . . . . . . . . . . . . . . . . . . . . . . 1 09/17/21 $ 49 $ 95
$ (253)
Derivative Financial Instruments Categorized by Risk Exposure
As of July 31, 2021, the fair values of derivative financial instruments located in the Statements of Assets and Liabilities were as follows:
EquityContracts
Assets — Derivative Financial InstrumentsFutures contracts
Unrealized appreciation on futures contracts(a) . . . . . . . . . . . . . . . . . . . . . . . . . . . . . . . . . . . . . . . . . . . . . . . . . . . . . . . . . . . . . . . . . . . . . . . . . . . . . . . . . . . . . . . . . . . . . . . . . . . . . . . . . . . . . . . . . $ 95
Liabilities — Derivative Financial InstrumentsFutures contracts
Unrealized depreciation on futures contracts(a) . . . . . . . . . . . . . . . . . . . . . . . . . . . . . . . . . . . . . . . . . . . . . . . . . . . . . . . . . . . . . . . . . . . . . . . . . . . . . . . . . . . . . . . . . . . . . . . . . . . . . . . . . . . . . . . . . $ 348
(a) Net cumulative appreciation (depreciation) on futures contracts are reported in the Schedule of Investments. In the Statements of Assets and Liabilities, only current day's variationmargin is reported in receivables or payables and the net cumulative unrealized appreciation (depreciation) is included in accumulated earnings (loss).
For the year ended July 31, 2021, the effect of derivative financial instruments in the Statements of Operations was as follows:
EquityContracts
Net Realized Gain (Loss) from:Futures contracts . . . . . . . . . . . . . . . . . . . . . . . . . . . . . . . . . . . . . . . . . . . . . . . . . . . . . . . . . . . . . . . . . . . . . . . . . . . . . . . . . . . . . . . . . . . . . . . . . . . . . . . . . . . . . . . . . . . . . . . . . . . . . . . . . . . . . . . . . . . . . . . . $ 26,187
Net Change in Unrealized Appreciation (Depreciation) on:Futures contracts . . . . . . . . . . . . . . . . . . . . . . . . . . . . . . . . . . . . . . . . . . . . . . . . . . . . . . . . . . . . . . . . . . . . . . . . . . . . . . . . . . . . . . . . . . . . . . . . . . . . . . . . . . . . . . . . . . . . . . . . . . . . . . . . . . . . . . . . . . . . . . . . $ 1,783
Average Quarterly Balances of Outstanding Derivative Financial Instruments
Futures contracts:Average notional value of contracts — long . . . . . . . . . . . . . . . . . . . . . . . . . . . . . . . . . . . . . . . . . . . . . . . . . . . . . . . . . . . . . . . . . . . . . . . . . . . . . . . . . . . . . . . . . . . . . . . . . . . . . . . . . . . . . . . . . . . $98,780
For more information about the Fund’s investment risks regarding derivative financial instruments, refer to the Notes to Financial Statements.
Fair Value Measurements
Various inputs are used in determining the fair value of financial instruments. For description of the input levels and information about the Fund's policy regarding valuationof financial instruments, refer to the Notes to Financial Statements.
Schedule of Investments (continued)
July 31, 2021
iShares� MSCI Intl Size Factor ETF
S C H E D U L E O F I N V E S T M E N T S 41

Fair Value Measurements (continued)
The following table summarizes the value of the Fund's investments according to the fair value hierarchy as of July 31, 2021. The breakdown of the Fund's investments intomajor categories is disclosed in the Schedule of Investments above.
Level 1 Level 2 Level 3 Total
InvestmentsAssets
Common Stocks . . . . . . . . . . . . . . . . . . . . . . . . . . . . . . . . . . . . . . . . . . . . . . . . . . . . . . . . . . . . . . . . . . . . . . . . . . . . . . . . . . . . . . . . $ 3,105,510 $22,063,004 $ — $25,168,514Preferred Stocks . . . . . . . . . . . . . . . . . . . . . . . . . . . . . . . . . . . . . . . . . . . . . . . . . . . . . . . . . . . . . . . . . . . . . . . . . . . . . . . . . . . . . . . . — 137,882 — 137,882Money Market Funds . . . . . . . . . . . . . . . . . . . . . . . . . . . . . . . . . . . . . . . . . . . . . . . . . . . . . . . . . . . . . . . . . . . . . . . . . . . . . . . . . . . . 36,183 — — 36,183
$ 3,141,693 $22,200,886 $ — $25,342,579
Derivative financial instruments(a)
AssetsFutures Contracts . . . . . . . . . . . . . . . . . . . . . . . . . . . . . . . . . . . . . . . . . . . . . . . . . . . . . . . . . . . . . . . . . . . . . . . . . . . . . . . . . . . . . . . $ — $ 95 $ — $ 95
LiabilitiesFutures Contracts . . . . . . . . . . . . . . . . . . . . . . . . . . . . . . . . . . . . . . . . . . . . . . . . . . . . . . . . . . . . . . . . . . . . . . . . . . . . . . . . . . . . . . . — (348) — (348)
$ — $ (253) $ — $ (253)
(a) Shown at the unrealized appreciation (depreciation) on the contracts.
See notes to financial statements.
Schedule of Investments (continued)
July 31, 2021
iShares� MSCI Intl Size Factor ETF
42 2 0 2 1 I S H A R E S A N N U A L R E P O R T T O S H A R E H O L D E R S
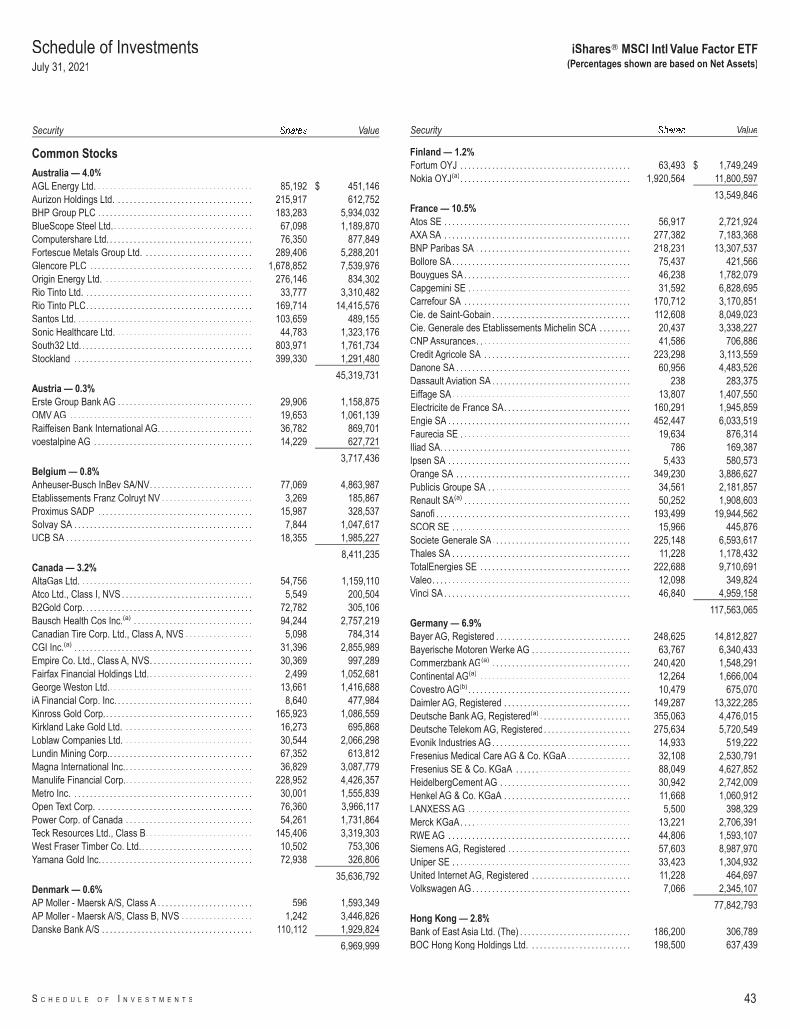
Security s Value
Common StocksAustralia — 4.0%AGL Energy Ltd. . . . . . . . . . . . . . . . . . . . . . . . . . . . . . . . . . . . . . . . 85,192 $ 451,146Aurizon Holdings Ltd. . . . . . . . . . . . . . . . . . . . . . . . . . . . . . . . . . . 215,917 612,752BHP Group PLC . . . . . . . . . . . . . . . . . . . . . . . . . . . . . . . . . . . . . . . 183,283 5,934,032BlueScope Steel Ltd.. . . . . . . . . . . . . . . . . . . . . . . . . . . . . . . . . . . 67,098 1,189,870Computershare Ltd. . . . . . . . . . . . . . . . . . . . . . . . . . . . . . . . . . . . . 76,350 877,849Fortescue Metals Group Ltd. . . . . . . . . . . . . . . . . . . . . . . . . . . . 289,406 5,288,201Glencore PLC . . . . . . . . . . . . . . . . . . . . . . . . . . . . . . . . . . . . . . . . . 1,678,852 7,539,976Origin Energy Ltd. . . . . . . . . . . . . . . . . . . . . . . . . . . . . . . . . . . . . . 276,146 834,302Rio Tinto Ltd. . . . . . . . . . . . . . . . . . . . . . . . . . . . . . . . . . . . . . . . . . . 33,777 3,310,482Rio Tinto PLC. . . . . . . . . . . . . . . . . . . . . . . . . . . . . . . . . . . . . . . . . . 169,714 14,415,576Santos Ltd. . . . . . . . . . . . . . . . . . . . . . . . . . . . . . . . . . . . . . . . . . . . . 103,659 489,155Sonic Healthcare Ltd. . . . . . . . . . . . . . . . . . . . . . . . . . . . . . . . . . . 44,783 1,323,176South32 Ltd.. . . . . . . . . . . . . . . . . . . . . . . . . . . . . . . . . . . . . . . . . . . 803,971 1,761,734Stockland . . . . . . . . . . . . . . . . . . . . . . . . . . . . . . . . . . . . . . . . . . . . . 399,330 1,291,480
45,319,731Austria — 0.3%Erste Group Bank AG . . . . . . . . . . . . . . . . . . . . . . . . . . . . . . . . . . 29,906 1,158,875OMV AG . . . . . . . . . . . . . . . . . . . . . . . . . . . . . . . . . . . . . . . . . . . . . . 19,653 1,061,139Raiffeisen Bank International AG. . . . . . . . . . . . . . . . . . . . . . . . 36,782 869,701voestalpine AG . . . . . . . . . . . . . . . . . . . . . . . . . . . . . . . . . . . . . . . . 14,229 627,721
3,717,436Belgium — 0.8%Anheuser-Busch InBev SA/NV. . . . . . . . . . . . . . . . . . . . . . . . . . 77,069 4,863,987Etablissements Franz Colruyt NV . . . . . . . . . . . . . . . . . . . . . . . 3,269 185,867Proximus SADP . . . . . . . . . . . . . . . . . . . . . . . . . . . . . . . . . . . . . . . 15,987 328,537Solvay SA . . . . . . . . . . . . . . . . . . . . . . . . . . . . . . . . . . . . . . . . . . . . . 7,844 1,047,617UCB SA . . . . . . . . . . . . . . . . . . . . . . . . . . . . . . . . . . . . . . . . . . . . . . . 18,355 1,985,227
8,411,235Canada — 3.2%AltaGas Ltd. . . . . . . . . . . . . . . . . . . . . . . . . . . . . . . . . . . . . . . . . . . . 54,756 1,159,110Atco Ltd., Class I, NVS . . . . . . . . . . . . . . . . . . . . . . . . . . . . . . . . . 5,549 200,504B2Gold Corp. . . . . . . . . . . . . . . . . . . . . . . . . . . . . . . . . . . . . . . . . . . 72,782 305,106Bausch Health Cos Inc.(a) . . . . . . . . . . . . . . . . . . . . . . . . . . . . . . 94,244 2,757,219Canadian Tire Corp. Ltd., Class A, NVS . . . . . . . . . . . . . . . . . 5,098 784,314CGI Inc.(a) . . . . . . . . . . . . . . . . . . . . . . . . . . . . . . . . . . . . . . . . . . . . . 31,396 2,855,989Empire Co. Ltd., Class A, NVS. . . . . . . . . . . . . . . . . . . . . . . . . . 30,369 997,289Fairfax Financial Holdings Ltd.. . . . . . . . . . . . . . . . . . . . . . . . . . 2,499 1,052,681George Weston Ltd.. . . . . . . . . . . . . . . . . . . . . . . . . . . . . . . . . . . . 13,661 1,416,688iA Financial Corp. Inc. . . . . . . . . . . . . . . . . . . . . . . . . . . . . . . . . . . 8,640 477,984Kinross Gold Corp.. . . . . . . . . . . . . . . . . . . . . . . . . . . . . . . . . . . . . 165,923 1,086,559Kirkland Lake Gold Ltd. . . . . . . . . . . . . . . . . . . . . . . . . . . . . . . . . 16,273 695,868Loblaw Companies Ltd. . . . . . . . . . . . . . . . . . . . . . . . . . . . . . . . . 30,544 2,066,298Lundin Mining Corp.. . . . . . . . . . . . . . . . . . . . . . . . . . . . . . . . . . . . 67,352 613,812Magna International Inc.. . . . . . . . . . . . . . . . . . . . . . . . . . . . . . . . 36,829 3,087,779Manulife Financial Corp.. . . . . . . . . . . . . . . . . . . . . . . . . . . . . . . . 228,952 4,426,357Metro Inc. . . . . . . . . . . . . . . . . . . . . . . . . . . . . . . . . . . . . . . . . . . . . . 30,001 1,555,839Open Text Corp. . . . . . . . . . . . . . . . . . . . . . . . . . . . . . . . . . . . . . . . 76,360 3,966,117Power Corp. of Canada . . . . . . . . . . . . . . . . . . . . . . . . . . . . . . . . 54,261 1,731,864Teck Resources Ltd., Class B. . . . . . . . . . . . . . . . . . . . . . . . . . . 145,406 3,319,303West Fraser Timber Co. Ltd.. . . . . . . . . . . . . . . . . . . . . . . . . . . . 10,502 753,306Yamana Gold Inc. . . . . . . . . . . . . . . . . . . . . . . . . . . . . . . . . . . . . . . 72,938 326,806
35,636,792Denmark — 0.6%AP Moller - Maersk A/S, Class A . . . . . . . . . . . . . . . . . . . . . . . . 596 1,593,349AP Moller - Maersk A/S, Class B, NVS . . . . . . . . . . . . . . . . . . 1,242 3,446,826Danske Bank A/S . . . . . . . . . . . . . . . . . . . . . . . . . . . . . . . . . . . . . . 110,112 1,929,824
6,969,999
Security s Value
Finland — 1.2%Fortum OYJ . . . . . . . . . . . . . . . . . . . . . . . . . . . . . . . . . . . . . . . . . . . 63,493 $ 1,749,249Nokia OYJ(a). . . . . . . . . . . . . . . . . . . . . . . . . . . . . . . . . . . . . . . . . . . 1,920,564 11,800,597
13,549,846France — 10.5%Atos SE . . . . . . . . . . . . . . . . . . . . . . . . . . . . . . . . . . . . . . . . . . . . . . . 56,917 2,721,924AXA SA . . . . . . . . . . . . . . . . . . . . . . . . . . . . . . . . . . . . . . . . . . . . . . . 277,382 7,183,368BNP Paribas SA . . . . . . . . . . . . . . . . . . . . . . . . . . . . . . . . . . . . . . . 218,231 13,307,537Bollore SA. . . . . . . . . . . . . . . . . . . . . . . . . . . . . . . . . . . . . . . . . . . . . 75,437 421,566Bouygues SA . . . . . . . . . . . . . . . . . . . . . . . . . . . . . . . . . . . . . . . . . . 46,238 1,782,079Capgemini SE . . . . . . . . . . . . . . . . . . . . . . . . . . . . . . . . . . . . . . . . . 31,592 6,828,695Carrefour SA . . . . . . . . . . . . . . . . . . . . . . . . . . . . . . . . . . . . . . . . . . 170,712 3,170,851Cie. de Saint-Gobain . . . . . . . . . . . . . . . . . . . . . . . . . . . . . . . . . . . 112,608 8,049,023Cie. Generale des Etablissements Michelin SCA . . . . . . . . 20,437 3,338,227CNP Assurances. . . . . . . . . . . . . . . . . . . . . . . . . . . . . . . . . . . . . . . 41,586 706,886Credit Agricole SA . . . . . . . . . . . . . . . . . . . . . . . . . . . . . . . . . . . . . 223,298 3,113,559Danone SA . . . . . . . . . . . . . . . . . . . . . . . . . . . . . . . . . . . . . . . . . . . . 60,956 4,483,526Dassault Aviation SA . . . . . . . . . . . . . . . . . . . . . . . . . . . . . . . . . . . 238 283,375Eiffage SA . . . . . . . . . . . . . . . . . . . . . . . . . . . . . . . . . . . . . . . . . . . . . 13,807 1,407,550Electricite de France SA. . . . . . . . . . . . . . . . . . . . . . . . . . . . . . . . 160,291 1,945,859Engie SA . . . . . . . . . . . . . . . . . . . . . . . . . . . . . . . . . . . . . . . . . . . . . . 452,447 6,033,519Faurecia SE . . . . . . . . . . . . . . . . . . . . . . . . . . . . . . . . . . . . . . . . . . . 19,634 876,314Iliad SA. . . . . . . . . . . . . . . . . . . . . . . . . . . . . . . . . . . . . . . . . . . . . . . . 786 169,387Ipsen SA . . . . . . . . . . . . . . . . . . . . . . . . . . . . . . . . . . . . . . . . . . . . . . 5,433 580,573Orange SA . . . . . . . . . . . . . . . . . . . . . . . . . . . . . . . . . . . . . . . . . . . . 349,230 3,886,627Publicis Groupe SA . . . . . . . . . . . . . . . . . . . . . . . . . . . . . . . . . . . . 34,561 2,181,857Renault SA(a) . . . . . . . . . . . . . . . . . . . . . . . . . . . . . . . . . . . . . . . . . . 50,252 1,908,603Sanofi . . . . . . . . . . . . . . . . . . . . . . . . . . . . . . . . . . . . . . . . . . . . . . . . . 193,499 19,944,562SCOR SE . . . . . . . . . . . . . . . . . . . . . . . . . . . . . . . . . . . . . . . . . . . . . 15,966 445,876Societe Generale SA. . . . . . . . . . . . . . . . . . . . . . . . . . . . . . . . . . . 225,148 6,593,617Thales SA . . . . . . . . . . . . . . . . . . . . . . . . . . . . . . . . . . . . . . . . . . . . . 11,228 1,178,432TotalEnergies SE . . . . . . . . . . . . . . . . . . . . . . . . . . . . . . . . . . . . . . 222,688 9,710,691Valeo. . . . . . . . . . . . . . . . . . . . . . . . . . . . . . . . . . . . . . . . . . . . . . . . . . 12,098 349,824Vinci SA . . . . . . . . . . . . . . . . . . . . . . . . . . . . . . . . . . . . . . . . . . . . . . . 46,840 4,959,158
117,563,065Germany — 6.9%Bayer AG, Registered . . . . . . . . . . . . . . . . . . . . . . . . . . . . . . . . . . 248,625 14,812,827Bayerische Motoren Werke AG . . . . . . . . . . . . . . . . . . . . . . . . . 63,767 6,340,433Commerzbank AG(a) . . . . . . . . . . . . . . . . . . . . . . . . . . . . . . . . . . . 240,420 1,548,291Continental AG(a) . . . . . . . . . . . . . . . . . . . . . . . . . . . . . . . . . . . . . . 12,264 1,666,004Covestro AG(b). . . . . . . . . . . . . . . . . . . . . . . . . . . . . . . . . . . . . . . . . 10,479 675,070Daimler AG, Registered . . . . . . . . . . . . . . . . . . . . . . . . . . . . . . . . 149,287 13,322,285Deutsche Bank AG, Registered(a) . . . . . . . . . . . . . . . . . . . . . . . 355,063 4,476,015Deutsche Telekom AG, Registered. . . . . . . . . . . . . . . . . . . . . . 275,634 5,720,549Evonik Industries AG. . . . . . . . . . . . . . . . . . . . . . . . . . . . . . . . . . . 14,933 519,222Fresenius Medical Care AG & Co. KGaA . . . . . . . . . . . . . . . . 32,108 2,530,791Fresenius SE & Co. KGaA . . . . . . . . . . . . . . . . . . . . . . . . . . . . . 88,049 4,627,852HeidelbergCement AG . . . . . . . . . . . . . . . . . . . . . . . . . . . . . . . . . 30,942 2,742,009Henkel AG & Co. KGaA . . . . . . . . . . . . . . . . . . . . . . . . . . . . . . . . 11,668 1,060,912LANXESS AG . . . . . . . . . . . . . . . . . . . . . . . . . . . . . . . . . . . . . . . . . 5,500 398,329Merck KGaA. . . . . . . . . . . . . . . . . . . . . . . . . . . . . . . . . . . . . . . . . . . 13,221 2,706,391RWE AG . . . . . . . . . . . . . . . . . . . . . . . . . . . . . . . . . . . . . . . . . . . . . . 44,806 1,593,107Siemens AG, Registered . . . . . . . . . . . . . . . . . . . . . . . . . . . . . . . 57,603 8,987,970Uniper SE . . . . . . . . . . . . . . . . . . . . . . . . . . . . . . . . . . . . . . . . . . . . . 33,423 1,304,932United Internet AG, Registered . . . . . . . . . . . . . . . . . . . . . . . . . 11,228 464,697Volkswagen AG. . . . . . . . . . . . . . . . . . . . . . . . . . . . . . . . . . . . . . . . 7,066 2,345,107
77,842,793Hong Kong — 2.8%Bank of East Asia Ltd. (The) . . . . . . . . . . . . . . . . . . . . . . . . . . . . 186,200 306,789BOC Hong Kong Holdings Ltd. . . . . . . . . . . . . . . . . . . . . . . . . . 198,500 637,439
Schedule of InvestmentsJuly 31, 2021
iShares� MSCI Intl Value Factor ETF(Percentages shown are based on Net Assets)
S C H E D U L E O F I N V E S T M E N T S 43

Security s Value
Hong Kong (continued)CK Asset Holdings Ltd. . . . . . . . . . . . . . . . . . . . . . . . . . . . . . . . . . 1,023,000 $ 6,960,180CK Hutchison Holdings Ltd. . . . . . . . . . . . . . . . . . . . . . . . . . . . . 1,140,500 8,332,836CK Infrastructure Holdings Ltd. . . . . . . . . . . . . . . . . . . . . . . . . . 96,500 582,559Hongkong Land Holdings Ltd. . . . . . . . . . . . . . . . . . . . . . . . . . . 181,600 823,915Jardine Matheson Holdings Ltd. . . . . . . . . . . . . . . . . . . . . . . . . 56,100 3,337,705Sino Land Co. Ltd. . . . . . . . . . . . . . . . . . . . . . . . . . . . . . . . . . . . . . 1,508,000 2,310,810Sun Hung Kai Properties Ltd. . . . . . . . . . . . . . . . . . . . . . . . . . . . 301,500 4,313,067Swire Pacific Ltd., Class A. . . . . . . . . . . . . . . . . . . . . . . . . . . . . . 109,500 680,195WH Group Ltd.(b). . . . . . . . . . . . . . . . . . . . . . . . . . . . . . . . . . . . . . . 2,933,500 2,430,601Xinyi Glass Holdings Ltd. . . . . . . . . . . . . . . . . . . . . . . . . . . . . . . . 138,000 515,756
31,231,852Israel — 0.7%Bank Hapoalim BM(a) . . . . . . . . . . . . . . . . . . . . . . . . . . . . . . . . . . 144,390 1,149,045Bank Leumi Le-Israel BM(a). . . . . . . . . . . . . . . . . . . . . . . . . . . . . 161,444 1,233,624Check Point Software Technologies Ltd.(a) . . . . . . . . . . . . . . 10,316 1,311,163Isracard Ltd.(a) . . . . . . . . . . . . . . . . . . . . . . . . . . . . . . . . . . . . . . . . . 1 3Israel Discount Bank Ltd., Class A(a) . . . . . . . . . . . . . . . . . . . . 104,619 490,088Teva Pharmaceutical Industries Ltd., ADR(a) . . . . . . . . . . . . . 392,403 3,786,689
7,970,612Italy — 2.7%Atlantia SpA(a) . . . . . . . . . . . . . . . . . . . . . . . . . . . . . . . . . . . . . . . . . 39,679 719,716CNH Industrial NV . . . . . . . . . . . . . . . . . . . . . . . . . . . . . . . . . . . . . 112,227 1,873,917Enel SpA . . . . . . . . . . . . . . . . . . . . . . . . . . . . . . . . . . . . . . . . . . . . . . 1,104,778 10,181,112Eni SpA . . . . . . . . . . . . . . . . . . . . . . . . . . . . . . . . . . . . . . . . . . . . . . . 224,421 2,653,916Intesa Sanpaolo SpA. . . . . . . . . . . . . . . . . . . . . . . . . . . . . . . . . . . 2,152,474 5,946,309Mediobanca Banca di Credito Finanziario SpA(a) . . . . . . . . 81,901 958,603Telecom Italia SpA/Milano . . . . . . . . . . . . . . . . . . . . . . . . . . . . . . 2,668,722 1,168,663UniCredit SpA . . . . . . . . . . . . . . . . . . . . . . . . . . . . . . . . . . . . . . . . . 578,471 6,919,302
30,421,538Japan — 36.2%AGC Inc. . . . . . . . . . . . . . . . . . . . . . . . . . . . . . . . . . . . . . . . . . . . . . . 47,200 2,018,420Aisin Corp. . . . . . . . . . . . . . . . . . . . . . . . . . . . . . . . . . . . . . . . . . . . . 30,400 1,230,711Asahi Group Holdings Ltd.. . . . . . . . . . . . . . . . . . . . . . . . . . . . . . 89,600 4,031,510Asahi Kasei Corp.. . . . . . . . . . . . . . . . . . . . . . . . . . . . . . . . . . . . . . 178,800 1,949,799Astellas Pharma Inc. . . . . . . . . . . . . . . . . . . . . . . . . . . . . . . . . . . . 268,300 4,273,314Bridgestone Corp. . . . . . . . . . . . . . . . . . . . . . . . . . . . . . . . . . . . . . 76,300 3,361,386Brother Industries Ltd.. . . . . . . . . . . . . . . . . . . . . . . . . . . . . . . . . . 115,400 2,348,497Canon Inc.. . . . . . . . . . . . . . . . . . . . . . . . . . . . . . . . . . . . . . . . . . . . . 374,000 8,612,494Central Japan Railway Co. . . . . . . . . . . . . . . . . . . . . . . . . . . . . . 30,400 4,422,126Chiba Bank Ltd. (The). . . . . . . . . . . . . . . . . . . . . . . . . . . . . . . . . . 103,300 587,641Chubu Electric Power Co. Inc. . . . . . . . . . . . . . . . . . . . . . . . . . . 240,600 2,887,337Concordia Financial Group Ltd. . . . . . . . . . . . . . . . . . . . . . . . . . 224,500 803,662Dai Nippon Printing Co. Ltd. . . . . . . . . . . . . . . . . . . . . . . . . . . . . 56,800 1,338,511Dai-ichi Life Holdings Inc. . . . . . . . . . . . . . . . . . . . . . . . . . . . . . . 99,700 1,834,982Daito Trust Construction Co. Ltd. . . . . . . . . . . . . . . . . . . . . . . . 24,900 2,925,498Daiwa House Industry Co. Ltd. . . . . . . . . . . . . . . . . . . . . . . . . . 139,300 4,270,967Daiwa House REIT Investment Corp. . . . . . . . . . . . . . . . . . . . 244 726,460Daiwa Securities Group Inc. . . . . . . . . . . . . . . . . . . . . . . . . . . . . 198,600 1,044,307Denso Corp. . . . . . . . . . . . . . . . . . . . . . . . . . . . . . . . . . . . . . . . . . . . 50,200 3,448,797Dentsu Group Inc. . . . . . . . . . . . . . . . . . . . . . . . . . . . . . . . . . . . . . 21,700 754,161ENEOS Holdings Inc. . . . . . . . . . . . . . . . . . . . . . . . . . . . . . . . . . . 577,500 2,425,843Fuji Electric Co. Ltd.. . . . . . . . . . . . . . . . . . . . . . . . . . . . . . . . . . . . 22,700 993,428FUJIFILM Holdings Corp. . . . . . . . . . . . . . . . . . . . . . . . . . . . . . . 143,200 10,276,435Fujitsu Ltd. . . . . . . . . . . . . . . . . . . . . . . . . . . . . . . . . . . . . . . . . . . . . 61,500 10,463,020Hankyu Hanshin Holdings Inc. . . . . . . . . . . . . . . . . . . . . . . . . . . 34,800 1,029,062Hino Motors Ltd. . . . . . . . . . . . . . . . . . . . . . . . . . . . . . . . . . . . . . . . 58,400 511,975Hirose Electric Co. Ltd. . . . . . . . . . . . . . . . . . . . . . . . . . . . . . . . . . 6,100 913,820Hitachi Construction Machinery Co. Ltd.. . . . . . . . . . . . . . . . . 17,700 500,122Hitachi Ltd. . . . . . . . . . . . . . . . . . . . . . . . . . . . . . . . . . . . . . . . . . . . . 324,500 18,664,974
Security s Value
Japan (continued)Honda Motor Co. Ltd. . . . . . . . . . . . . . . . . . . . . . . . . . . . . . . . . . . 358,500 $ 11,514,255Hulic Co. Ltd. . . . . . . . . . . . . . . . . . . . . . . . . . . . . . . . . . . . . . . . . . . 81,400 926,067Ibiden Co. Ltd. . . . . . . . . . . . . . . . . . . . . . . . . . . . . . . . . . . . . . . . . . 11,800 625,107Idemitsu Kosan Co. Ltd. . . . . . . . . . . . . . . . . . . . . . . . . . . . . . . . . 31,700 746,213Iida Group Holdings Co. Ltd.. . . . . . . . . . . . . . . . . . . . . . . . . . . . 29,900 721,508Inpex Corp. . . . . . . . . . . . . . . . . . . . . . . . . . . . . . . . . . . . . . . . . . . . . 233,600 1,656,822Isuzu Motors Ltd. . . . . . . . . . . . . . . . . . . . . . . . . . . . . . . . . . . . . . . 107,600 1,435,350Itochu Corp. . . . . . . . . . . . . . . . . . . . . . . . . . . . . . . . . . . . . . . . . . . . 347,200 10,276,854Japan Post Bank Co. Ltd. . . . . . . . . . . . . . . . . . . . . . . . . . . . . . . 86,500 734,187Japan Post Holdings Co. Ltd. . . . . . . . . . . . . . . . . . . . . . . . . . . . 408,400 3,466,677Japan Post Insurance Co. Ltd.. . . . . . . . . . . . . . . . . . . . . . . . . . 36,700 650,637Japan Tobacco Inc. . . . . . . . . . . . . . . . . . . . . . . . . . . . . . . . . . . . . 286,100 5,590,478JFE Holdings Inc. . . . . . . . . . . . . . . . . . . . . . . . . . . . . . . . . . . . . . . 158,000 1,921,240Kajima Corp. . . . . . . . . . . . . . . . . . . . . . . . . . . . . . . . . . . . . . . . . . . 155,100 1,996,570Kansai Electric Power Co. Inc. (The) . . . . . . . . . . . . . . . . . . . . 280,600 2,646,864KDDI Corp. . . . . . . . . . . . . . . . . . . . . . . . . . . . . . . . . . . . . . . . . . . . . 212,800 6,508,190Kirin Holdings Co. Ltd. . . . . . . . . . . . . . . . . . . . . . . . . . . . . . . . . . 108,300 1,980,893Koito Manufacturing Co. Ltd. . . . . . . . . . . . . . . . . . . . . . . . . . . . 6,600 403,924Komatsu Ltd. . . . . . . . . . . . . . . . . . . . . . . . . . . . . . . . . . . . . . . . . . . 130,800 3,277,721Kubota Corp. . . . . . . . . . . . . . . . . . . . . . . . . . . . . . . . . . . . . . . . . . . 89,300 1,867,393Kurita Water Industries Ltd.. . . . . . . . . . . . . . . . . . . . . . . . . . . . . 9,800 475,972Kyocera Corp. . . . . . . . . . . . . . . . . . . . . . . . . . . . . . . . . . . . . . . . . . 122,600 7,575,683Lawson Inc. . . . . . . . . . . . . . . . . . . . . . . . . . . . . . . . . . . . . . . . . . . . 7,900 397,055Lixil Corp. . . . . . . . . . . . . . . . . . . . . . . . . . . . . . . . . . . . . . . . . . . . . . 41,900 1,143,454Marubeni Corp. . . . . . . . . . . . . . . . . . . . . . . . . . . . . . . . . . . . . . . . . 635,400 5,408,150Mazda Motor Corp.(a) . . . . . . . . . . . . . . . . . . . . . . . . . . . . . . . . . . 108,200 1,067,382Medipal Holdings Corp. . . . . . . . . . . . . . . . . . . . . . . . . . . . . . . . . 44,300 834,311MEIJI Holdings Co. Ltd. . . . . . . . . . . . . . . . . . . . . . . . . . . . . . . . . 18,600 1,151,354Minebea Mitsumi Inc. . . . . . . . . . . . . . . . . . . . . . . . . . . . . . . . . . . 48,600 1,312,244Mitsubishi Chemical Holdings Corp.. . . . . . . . . . . . . . . . . . . . . 267,200 2,242,049Mitsubishi Corp. . . . . . . . . . . . . . . . . . . . . . . . . . . . . . . . . . . . . . . . 397,300 11,143,773Mitsubishi Electric Corp.. . . . . . . . . . . . . . . . . . . . . . . . . . . . . . . . 307,500 4,171,926Mitsubishi Estate Co. Ltd. . . . . . . . . . . . . . . . . . . . . . . . . . . . . . . 261,900 4,108,403Mitsubishi Gas Chemical Co. Inc. . . . . . . . . . . . . . . . . . . . . . . . 33,000 687,419Mitsubishi HC Capital Inc. . . . . . . . . . . . . . . . . . . . . . . . . . . . . . . 96,900 528,524Mitsubishi Heavy Industries Ltd. . . . . . . . . . . . . . . . . . . . . . . . . 80,500 2,325,904Mitsubishi UFJ Financial Group Inc.. . . . . . . . . . . . . . . . . . . . . 2,755,100 14,554,304Mitsui & Co. Ltd. . . . . . . . . . . . . . . . . . . . . . . . . . . . . . . . . . . . . . . . 512,800 11,769,994Mitsui Chemicals Inc. . . . . . . . . . . . . . . . . . . . . . . . . . . . . . . . . . . 33,100 1,055,523Mizuho Financial Group Inc. . . . . . . . . . . . . . . . . . . . . . . . . . . . . 557,870 7,971,744MS&AD Insurance Group Holdings Inc. . . . . . . . . . . . . . . . . . 24,600 760,412Murata Manufacturing Co. Ltd.. . . . . . . . . . . . . . . . . . . . . . . . . . 51,800 4,298,661Nabtesco Corp. . . . . . . . . . . . . . . . . . . . . . . . . . . . . . . . . . . . . . . . . 11,700 443,154NEC Corp.. . . . . . . . . . . . . . . . . . . . . . . . . . . . . . . . . . . . . . . . . . . . . 91,800 4,655,822NGK Insulators Ltd. . . . . . . . . . . . . . . . . . . . . . . . . . . . . . . . . . . . . 49,500 792,735NH Foods Ltd. . . . . . . . . . . . . . . . . . . . . . . . . . . . . . . . . . . . . . . . . . 20,800 838,950Nippon Express Co. Ltd. . . . . . . . . . . . . . . . . . . . . . . . . . . . . . . . 15,800 1,154,186Nippon Steel Corp.. . . . . . . . . . . . . . . . . . . . . . . . . . . . . . . . . . . . . 210,500 3,651,606Nippon Telegraph & Telephone Corp. . . . . . . . . . . . . . . . . . . . 226,100 5,789,994Nippon Yusen KK . . . . . . . . . . . . . . . . . . . . . . . . . . . . . . . . . . . . . . 45,800 2,474,666Nissan Motor Co. Ltd.(a) . . . . . . . . . . . . . . . . . . . . . . . . . . . . . . . . 230,600 1,338,365Nisshin Seifun Group Inc. . . . . . . . . . . . . . . . . . . . . . . . . . . . . . . 25,700 414,350Nitto Denko Corp. . . . . . . . . . . . . . . . . . . . . . . . . . . . . . . . . . . . . . . 11,500 854,432Nomura Holdings Inc. . . . . . . . . . . . . . . . . . . . . . . . . . . . . . . . . . . 587,400 2,941,454Nomura Real Estate Holdings Inc. . . . . . . . . . . . . . . . . . . . . . . 21,200 525,685NSK Ltd. . . . . . . . . . . . . . . . . . . . . . . . . . . . . . . . . . . . . . . . . . . . . . . 77,200 637,121NTT Data Corp.. . . . . . . . . . . . . . . . . . . . . . . . . . . . . . . . . . . . . . . . 135,400 2,097,283Obayashi Corp. . . . . . . . . . . . . . . . . . . . . . . . . . . . . . . . . . . . . . . . . 245,400 2,006,698Oji Holdings Corp. . . . . . . . . . . . . . . . . . . . . . . . . . . . . . . . . . . . . . 171,900 991,086Ono Pharmaceutical Co. Ltd. . . . . . . . . . . . . . . . . . . . . . . . . . . . 26,600 607,229
Schedule of Investments (continued)
July 31, 2021
iShares� MSCI Intl Value Factor ETF(Percentages shown are based on Net Assets)
44 2 0 2 1 I S H A R E S A N N U A L R E P O R T T O S H A R E H O L D E R S

Security s Value
Japan (continued)ORIX Corp. . . . . . . . . . . . . . . . . . . . . . . . . . . . . . . . . . . . . . . . . . . . . 226,100 $ 3,955,709Orix JREIT Inc. . . . . . . . . . . . . . . . . . . . . . . . . . . . . . . . . . . . . . . . . 148 282,396Osaka Gas Co. Ltd. . . . . . . . . . . . . . . . . . . . . . . . . . . . . . . . . . . . . 86,100 1,608,581Otsuka Holdings Co. Ltd. . . . . . . . . . . . . . . . . . . . . . . . . . . . . . . . 69,600 2,766,534Panasonic Corp. . . . . . . . . . . . . . . . . . . . . . . . . . . . . . . . . . . . . . . . 250,500 3,024,803Renesas Electronics Corp.(a) . . . . . . . . . . . . . . . . . . . . . . . . . . . 139,800 1,517,339Resona Holdings Inc. . . . . . . . . . . . . . . . . . . . . . . . . . . . . . . . . . . 524,200 1,968,202Ricoh Co. Ltd. . . . . . . . . . . . . . . . . . . . . . . . . . . . . . . . . . . . . . . . . . 340,700 3,722,776Rohm Co. Ltd. . . . . . . . . . . . . . . . . . . . . . . . . . . . . . . . . . . . . . . . . . 27,000 2,634,066Santen Pharmaceutical Co. Ltd. . . . . . . . . . . . . . . . . . . . . . . . . 26,300 356,361SCSK Corp. . . . . . . . . . . . . . . . . . . . . . . . . . . . . . . . . . . . . . . . . . . . 9,300 560,510Secom Co. Ltd. . . . . . . . . . . . . . . . . . . . . . . . . . . . . . . . . . . . . . . . . 13,700 1,036,960Seiko Epson Corp. . . . . . . . . . . . . . . . . . . . . . . . . . . . . . . . . . . . . . 117,800 2,026,857Sekisui Chemical Co. Ltd. . . . . . . . . . . . . . . . . . . . . . . . . . . . . . . 46,300 798,928Sekisui House Ltd. . . . . . . . . . . . . . . . . . . . . . . . . . . . . . . . . . . . . . 101,000 2,000,354Seven & i Holdings Co. Ltd. . . . . . . . . . . . . . . . . . . . . . . . . . . . . 171,900 7,670,246Shimizu Corp. . . . . . . . . . . . . . . . . . . . . . . . . . . . . . . . . . . . . . . . . . 176,400 1,299,105Shionogi & Co. Ltd. . . . . . . . . . . . . . . . . . . . . . . . . . . . . . . . . . . . . 30,900 1,627,339Shizuoka Bank Ltd. (The) . . . . . . . . . . . . . . . . . . . . . . . . . . . . . . 85,600 618,174Sohgo Security Services Co. Ltd. . . . . . . . . . . . . . . . . . . . . . . . 3,300 154,310Stanley Electric Co. Ltd. . . . . . . . . . . . . . . . . . . . . . . . . . . . . . . . . 19,500 508,812Subaru Corp. . . . . . . . . . . . . . . . . . . . . . . . . . . . . . . . . . . . . . . . . . . 107,400 2,110,084SUMCO Corp. . . . . . . . . . . . . . . . . . . . . . . . . . . . . . . . . . . . . . . . . . 75,000 1,734,624Sumitomo Chemical Co. Ltd. . . . . . . . . . . . . . . . . . . . . . . . . . . . 294,600 1,533,545Sumitomo Corp. . . . . . . . . . . . . . . . . . . . . . . . . . . . . . . . . . . . . . . . 375,300 5,100,292Sumitomo Dainippon Pharma Co. Ltd. . . . . . . . . . . . . . . . . . . 30,700 531,579Sumitomo Electric Industries Ltd. . . . . . . . . . . . . . . . . . . . . . . . 126,100 1,791,467Sumitomo Metal Mining Co. Ltd. . . . . . . . . . . . . . . . . . . . . . . . . 36,900 1,495,460Sumitomo Mitsui Financial Group Inc. . . . . . . . . . . . . . . . . . . . 302,500 10,196,990Sumitomo Mitsui Trust Holdings Inc. . . . . . . . . . . . . . . . . . . . . 68,300 2,242,006Suntory Beverage & Food Ltd.. . . . . . . . . . . . . . . . . . . . . . . . . . 21,500 753,842Suzuki Motor Corp. . . . . . . . . . . . . . . . . . . . . . . . . . . . . . . . . . . . . 44,300 1,802,367T&D Holdings Inc. . . . . . . . . . . . . . . . . . . . . . . . . . . . . . . . . . . . . . 53,000 678,122Taisei Corp.. . . . . . . . . . . . . . . . . . . . . . . . . . . . . . . . . . . . . . . . . . . . 55,700 1,877,166Taisho Pharmaceutical Holdings Co. Ltd. . . . . . . . . . . . . . . . . 4,900 274,415Takeda Pharmaceutical Co. Ltd. . . . . . . . . . . . . . . . . . . . . . . . . 181,700 6,048,160TDK Corp. . . . . . . . . . . . . . . . . . . . . . . . . . . . . . . . . . . . . . . . . . . . . . 43,500 4,963,350TIS Inc.. . . . . . . . . . . . . . . . . . . . . . . . . . . . . . . . . . . . . . . . . . . . . . . . 49,900 1,294,219Tohoku Electric Power Co. Inc. . . . . . . . . . . . . . . . . . . . . . . . . . 142,300 1,078,098Tokyo Electric Power Co. Holdings Inc.(a). . . . . . . . . . . . . . . . 887,100 2,364,294Tokyo Gas Co. Ltd. . . . . . . . . . . . . . . . . . . . . . . . . . . . . . . . . . . . . 54,100 1,024,043Toppan Inc. . . . . . . . . . . . . . . . . . . . . . . . . . . . . . . . . . . . . . . . . . . . . 82,000 1,390,972Toray Industries Inc.. . . . . . . . . . . . . . . . . . . . . . . . . . . . . . . . . . . . 184,500 1,214,782Toshiba Corp.. . . . . . . . . . . . . . . . . . . . . . . . . . . . . . . . . . . . . . . . . . 44,800 1,928,258Tosoh Corp. . . . . . . . . . . . . . . . . . . . . . . . . . . . . . . . . . . . . . . . . . . . 54,600 958,179Toyo Suisan Kaisha Ltd.. . . . . . . . . . . . . . . . . . . . . . . . . . . . . . . . 16,900 645,197Toyota Industries Corp.. . . . . . . . . . . . . . . . . . . . . . . . . . . . . . . . . 22,100 1,853,859Toyota Motor Corp.. . . . . . . . . . . . . . . . . . . . . . . . . . . . . . . . . . . . . 337,100 30,263,313Toyota Tsusho Corp. . . . . . . . . . . . . . . . . . . . . . . . . . . . . . . . . . . . 59,000 2,785,677Yamada Holdings Co. Ltd. . . . . . . . . . . . . . . . . . . . . . . . . . . . . . . 113,900 538,115Yamaha Motor Co. Ltd.. . . . . . . . . . . . . . . . . . . . . . . . . . . . . . . . . 42,800 1,071,741Yokogawa Electric Corp. . . . . . . . . . . . . . . . . . . . . . . . . . . . . . . . 49,300 758,440
407,236,284Netherlands — 5.5%ABN AMRO Bank NV, CVA(a)(b) . . . . . . . . . . . . . . . . . . . . . . . . . 66,969 780,632Aegon NV . . . . . . . . . . . . . . . . . . . . . . . . . . . . . . . . . . . . . . . . . . . . . 531,729 2,263,889ArcelorMittal SA . . . . . . . . . . . . . . . . . . . . . . . . . . . . . . . . . . . . . . . 202,935 7,087,590EXOR NV . . . . . . . . . . . . . . . . . . . . . . . . . . . . . . . . . . . . . . . . . . . . . 11,440 939,862ING Groep NV . . . . . . . . . . . . . . . . . . . . . . . . . . . . . . . . . . . . . . . . . 635,096 8,148,722JDE Peet's NV. . . . . . . . . . . . . . . . . . . . . . . . . . . . . . . . . . . . . . . . . 5,048 169,945
Security s Value
Netherlands (continued)Koninklijke Ahold Delhaize NV . . . . . . . . . . . . . . . . . . . . . . . . . . 263,829 $ 8,201,081NN Group NV. . . . . . . . . . . . . . . . . . . . . . . . . . . . . . . . . . . . . . . . . . 78,131 3,884,389Randstad NV . . . . . . . . . . . . . . . . . . . . . . . . . . . . . . . . . . . . . . . . . . 15,742 1,142,091Royal Dutch Shell PLC, Class A . . . . . . . . . . . . . . . . . . . . . . . . 470,196 9,451,388Royal Dutch Shell PLC, Class B . . . . . . . . . . . . . . . . . . . . . . . . 442,789 8,749,144Stellantis NV. . . . . . . . . . . . . . . . . . . . . . . . . . . . . . . . . . . . . . . . . . . 602,208 11,548,249
62,366,982Norway — 0.3%Equinor ASA. . . . . . . . . . . . . . . . . . . . . . . . . . . . . . . . . . . . . . . . . . . 57,492 1,119,897Norsk Hydro ASA . . . . . . . . . . . . . . . . . . . . . . . . . . . . . . . . . . . . . . 185,173 1,231,955Orkla ASA . . . . . . . . . . . . . . . . . . . . . . . . . . . . . . . . . . . . . . . . . . . . . 43,349 393,713Yara International ASA . . . . . . . . . . . . . . . . . . . . . . . . . . . . . . . . . 19,597 1,032,890
3,778,455Singapore — 0.5%Keppel Corp. Ltd. . . . . . . . . . . . . . . . . . . . . . . . . . . . . . . . . . . . . . . 297,100 1,201,112Singapore Telecommunications Ltd. . . . . . . . . . . . . . . . . . . . . 702,300 1,177,116UOL Group Ltd. . . . . . . . . . . . . . . . . . . . . . . . . . . . . . . . . . . . . . . . . 56,500 303,663Venture Corp. Ltd. . . . . . . . . . . . . . . . . . . . . . . . . . . . . . . . . . . . . . 75,800 1,063,235Wilmar International Ltd. . . . . . . . . . . . . . . . . . . . . . . . . . . . . . . . 445,400 1,426,417
5,171,543Spain — 2.6%ACS Actividades de Construccion y Servicios SA . . . . . . . . 51,528 1,355,356Banco Bilbao Vizcaya Argentaria SA . . . . . . . . . . . . . . . . . . . . 1,128,193 7,222,103Banco Santander SA. . . . . . . . . . . . . . . . . . . . . . . . . . . . . . . . . . . 3,099,003 11,352,121CaixaBank SA . . . . . . . . . . . . . . . . . . . . . . . . . . . . . . . . . . . . . . . . . 666,998 1,980,923Repsol SA. . . . . . . . . . . . . . . . . . . . . . . . . . . . . . . . . . . . . . . . . . . . . 240,752 2,636,935Telefonica SA. . . . . . . . . . . . . . . . . . . . . . . . . . . . . . . . . . . . . . . . . . 915,470 4,188,134
28,735,572Sweden — 1.0%Boliden AB . . . . . . . . . . . . . . . . . . . . . . . . . . . . . . . . . . . . . . . . . . . . 34,271 1,335,608ICA Gruppen AB . . . . . . . . . . . . . . . . . . . . . . . . . . . . . . . . . . . . . . . 11,258 556,466Securitas AB, Class B . . . . . . . . . . . . . . . . . . . . . . . . . . . . . . . . . . 31,660 558,274Skanska AB, Class B. . . . . . . . . . . . . . . . . . . . . . . . . . . . . . . . . . . 34,379 970,507SKF AB, Class B. . . . . . . . . . . . . . . . . . . . . . . . . . . . . . . . . . . . . . . 36,264 964,864Swedbank AB, Class A . . . . . . . . . . . . . . . . . . . . . . . . . . . . . . . . . 49,337 960,770Telefonaktiebolaget LM Ericsson, Class B . . . . . . . . . . . . . . . 259,185 2,989,485Telia Co. AB . . . . . . . . . . . . . . . . . . . . . . . . . . . . . . . . . . . . . . . . . . . 203,454 892,412Volvo AB, Class B. . . . . . . . . . . . . . . . . . . . . . . . . . . . . . . . . . . . . . 84,100 1,983,226
11,211,612Switzerland — 5.0%Adecco Group AG, Registered. . . . . . . . . . . . . . . . . . . . . . . . . . 14,377 860,983Credit Suisse Group AG, Registered . . . . . . . . . . . . . . . . . . . . 460,559 4,623,689Holcim Ltd. . . . . . . . . . . . . . . . . . . . . . . . . . . . . . . . . . . . . . . . . . . . . 54,791 3,211,911Novartis AG, Registered. . . . . . . . . . . . . . . . . . . . . . . . . . . . . . . . 294,070 27,195,118Roche Holding AG, NVS . . . . . . . . . . . . . . . . . . . . . . . . . . . . . . . 36,127 13,956,296Siemens Energy AG(a) . . . . . . . . . . . . . . . . . . . . . . . . . . . . . . . . . 37,847 1,029,621Swatch Group AG (The), Registered . . . . . . . . . . . . . . . . . . . . 5,180 336,409Swiss Life Holding AG, Registered . . . . . . . . . . . . . . . . . . . . . . 2,145 1,106,397UBS Group AG, Registered . . . . . . . . . . . . . . . . . . . . . . . . . . . . 216,434 3,565,918
55,886,342United Kingdom — 13.3%3i Group PLC . . . . . . . . . . . . . . . . . . . . . . . . . . . . . . . . . . . . . . . . . . 122,132 2,170,676Anglo American PLC . . . . . . . . . . . . . . . . . . . . . . . . . . . . . . . . . . . 230,968 10,235,107Associated British Foods PLC . . . . . . . . . . . . . . . . . . . . . . . . . . 49,751 1,383,420Aviva PLC . . . . . . . . . . . . . . . . . . . . . . . . . . . . . . . . . . . . . . . . . . . . . 746,130 4,007,194BAE Systems PLC . . . . . . . . . . . . . . . . . . . . . . . . . . . . . . . . . . . . . 406,300 3,257,527Barclays PLC . . . . . . . . . . . . . . . . . . . . . . . . . . . . . . . . . . . . . . . . . . 4,124,170 9,976,696Barratt Developments PLC . . . . . . . . . . . . . . . . . . . . . . . . . . . . . 135,644 1,325,603
Schedule of Investments (continued)
July 31, 2021
iShares� MSCI Intl Value Factor ETF(Percentages shown are based on Net Assets)
S C H E D U L E O F I N V E S T M E N T S 45

Security s Value
United Kingdom (continued)Berkeley Group Holdings PLC . . . . . . . . . . . . . . . . . . . . . . . . . . 13,837 $ 931,617BP PLC . . . . . . . . . . . . . . . . . . . . . . . . . . . . . . . . . . . . . . . . . . . . . . . 1,718,851 6,899,511British American Tobacco PLC. . . . . . . . . . . . . . . . . . . . . . . . . . 863,184 32,103,877British Land Co. PLC (The) . . . . . . . . . . . . . . . . . . . . . . . . . . . . . 128,902 912,618BT Group PLC(a) . . . . . . . . . . . . . . . . . . . . . . . . . . . . . . . . . . . . . . . 1,893,329 4,560,528Coca-Cola Europacific Partners PLC. . . . . . . . . . . . . . . . . . . . 22,202 1,377,856DCC PLC. . . . . . . . . . . . . . . . . . . . . . . . . . . . . . . . . . . . . . . . . . . . . . 9,461 792,107Evraz PLC. . . . . . . . . . . . . . . . . . . . . . . . . . . . . . . . . . . . . . . . . . . . . 77,259 660,091GlaxoSmithKline PLC . . . . . . . . . . . . . . . . . . . . . . . . . . . . . . . . . . 492,693 9,727,647HSBC Holdings PLC . . . . . . . . . . . . . . . . . . . . . . . . . . . . . . . . . . . 1,827,748 10,089,523Imperial Brands PLC . . . . . . . . . . . . . . . . . . . . . . . . . . . . . . . . . . . 364,862 7,811,805Informa PLC(a) . . . . . . . . . . . . . . . . . . . . . . . . . . . . . . . . . . . . . . . . . 121,936 837,861J Sainsbury PLC . . . . . . . . . . . . . . . . . . . . . . . . . . . . . . . . . . . . . . . 677,322 2,667,178Kingfisher PLC. . . . . . . . . . . . . . . . . . . . . . . . . . . . . . . . . . . . . . . . . 314,823 1,617,065Lloyds Banking Group PLC. . . . . . . . . . . . . . . . . . . . . . . . . . . . . 11,009,296 6,960,814M&G PLC . . . . . . . . . . . . . . . . . . . . . . . . . . . . . . . . . . . . . . . . . . . . . 353,034 1,105,435Melrose Industries PLC . . . . . . . . . . . . . . . . . . . . . . . . . . . . . . . . 812,888 1,806,457Natwest Group PLC. . . . . . . . . . . . . . . . . . . . . . . . . . . . . . . . . . . . 806,407 2,263,356Pearson PLC . . . . . . . . . . . . . . . . . . . . . . . . . . . . . . . . . . . . . . . . . . 71,106 856,860Persimmon PLC . . . . . . . . . . . . . . . . . . . . . . . . . . . . . . . . . . . . . . . 32,955 1,329,326Phoenix Group Holdings PLC. . . . . . . . . . . . . . . . . . . . . . . . . . . 37,242 350,962Standard Chartered PLC . . . . . . . . . . . . . . . . . . . . . . . . . . . . . . . 569,313 3,412,921Taylor Wimpey PLC . . . . . . . . . . . . . . . . . . . . . . . . . . . . . . . . . . . . 463,820 1,060,416Tesco PLC. . . . . . . . . . . . . . . . . . . . . . . . . . . . . . . . . . . . . . . . . . . . . 1,672,028 5,413,028Vodafone Group PLC . . . . . . . . . . . . . . . . . . . . . . . . . . . . . . . . . . 4,782,902 7,690,675Wm Morrison Supermarkets PLC . . . . . . . . . . . . . . . . . . . . . . . 693,362 2,579,059WPP PLC . . . . . . . . . . . . . . . . . . . . . . . . . . . . . . . . . . . . . . . . . . . . . 148,747 1,923,750
150,098,566
Total Common Stocks — 98.1%(Cost: $1,084,030,119). . . . . . . . . . . . . . . . . . . . . . . . . . . . . . . . . . . . . . . . . . . 1,103,120,255
Preferred StocksGermany — 1.4%Bayerische Motoren Werke AG, Preference
Shares, NVS. . . . . . . . . . . . . . . . . . . . . . . . . . . . . . . . . . . . . . . . 14,189 1,217,898
Security s Value
Germany (continued)Porsche Automobil Holding SE, Preference
Shares, NVS. . . . . . . . . . . . . . . . . . . . . . . . . . . . . . . . . . . . . . . . 44,122 $ 4,775,375Volkswagen AG, Preference Shares, NVS. . . . . . . . . . . . . . . 41,491 10,105,982
16,099,255Italy — 0.1%Telecom Italia SpA/Milano, Preference Shares, NVS . . . . . 1,694,517 790,032
Total Preferred Stocks — 1.5%(Cost: $15,563,819). . . . . . . . . . . . . . . . . . . . . . . . . . . . . . . . . . . . . . . . . . . . . . 16,889,287
Short-Term InvestmentsMoney Market Funds — 0.0%BlackRock Cash Funds: Treasury, SL Agency Shares,
0.00%(c)(d) . . . . . . . . . . . . . . . . . . . . . . . . . . . . . . . . . . . . . . . . . . 310,000 310,000
Total Short-Term Investments — 0.0%(Cost: $310,000). . . . . . . . . . . . . . . . . . . . . . . . . . . . . . . . . . . . . . . . . . . . . . . . . 310,000
Total Investments in Securities — 99.6%(Cost: $1,099,903,938). . . . . . . . . . . . . . . . . . . . . . . . . . . . . . . . . . . . . . . . . . . 1,120,319,542
Other Assets, Less Liabilities — 0.4% . . . . . . . . . . . . . . . . . . . . . . . . . . . . . 4,848,484
Net Assets — 100.0% . . . . . . . . . . . . . . . . . . . . . . . . . . . . . . . . . . . . . . . . . . . . . . $ 1,125,168,026
(a) Non-income producing security.(b) Security exempt from registration pursuant to Rule 144A under the Securities Act of
1933, as amended. These securities may be resold in transactions exempt fromregistration to qualified institutional investors.
(c) Affiliate of the Fund.(d) Annualized 7-day yield as of period-end.
Affiliates
Investments in issuers considered to be affiliate(s) of the Fund during the year ended July 31, 2021 for purposes of Section 2(a)(3) of the Investment Company Act of 1940,as amended, were as follows:
Affiliated IssuerValue at
07/31/20Purchases
at CostProceeds
from SalesNet Realized
Gain (Loss)
Change inUnrealized
Appreciation(Depreciation)
Value at07/31/21
SharesHeld at
07/31/21 Income
CapitalGain
Distributionsfrom
UnderlyingFunds
BlackRock Cash Funds: Institutional, SL AgencyShares(a) . . . . . . . . . . . . . . . . . . . . . . . . . . . . . . . . . . . . . . . . . $5,544,112 $ — $(5,542,364)(b) $ (1,564) $ (184) $ — — $25,106(c) $ —
BlackRock Cash Funds: Treasury, SL Agency Shares . 112,000 198,000(b) — — — 310,000 310,000 95 —
$ (1,564) $ (184) $310,000 $25,201 $ —
(a) As of period end, the entity is no longer held.(b) Represents net amount purchased (sold).(c) All or a portion represents securities lending income earned from the reinvestment of cash collateral from loaned securities, net of fees and collateral investment expenses, and other
payments to and from borrowers of securities.
Schedule of Investments (continued)
July 31, 2021
iShares� MSCI Intl Value Factor ETF(Percentages shown are based on Net Assets)
46 2 0 2 1 I S H A R E S A N N U A L R E P O R T T O S H A R E H O L D E R S

Futures Contracts
DescriptionNumber ofContracts
ExpirationDate
NotionalAmount
(000)
Value/Unrealized
Appreciation(Depreciation)
Long ContractsTOPIX Index . . . . . . . . . . . . . . . . . . . . . . . . . . . . . . . . . . . . . . . . . . . . . . . . . . . . . . . . . . . . . . . . . . . . . . . . . . . . . . . . . . . . . . . . . . . . . . . . . . . . . . . . 9 09/09/21 $ 1,571 $ (33,101)Euro STOXX 50 Index . . . . . . . . . . . . . . . . . . . . . . . . . . . . . . . . . . . . . . . . . . . . . . . . . . . . . . . . . . . . . . . . . . . . . . . . . . . . . . . . . . . . . . . . . . . . . . . 35 09/17/21 1,698 (385)FTSE 100 Index . . . . . . . . . . . . . . . . . . . . . . . . . . . . . . . . . . . . . . . . . . . . . . . . . . . . . . . . . . . . . . . . . . . . . . . . . . . . . . . . . . . . . . . . . . . . . . . . . . . . . 18 09/17/21 1,742 (24,030)
$ (57,516)
Derivative Financial Instruments Categorized by Risk Exposure
As of July 31, 2021, the fair values of derivative financial instruments located in the Statements of Assets and Liabilities were as follows:
EquityContracts
Liabilities — Derivative Financial InstrumentsFutures contracts
Unrealized depreciation on futures contracts(a) . . . . . . . . . . . . . . . . . . . . . . . . . . . . . . . . . . . . . . . . . . . . . . . . . . . . . . . . . . . . . . . . . . . . . . . . . . . . . . . . . . . . . . . . . . . . . . . . . . . . . . . . . . . . . . . . . $ 57,516
(a) Net cumulative appreciation (depreciation) on futures contracts are reported in the Schedule of Investments. In the Statements of Assets and Liabilities, only current day's variationmargin is reported in receivables or payables and the net cumulative unrealized appreciation (depreciation) is included in accumulated earnings (loss).
For the year ended July 31, 2021, the effect of derivative financial instruments in the Statements of Operations was as follows:
EquityContracts
Net Realized Gain (Loss) from:Futures contracts . . . . . . . . . . . . . . . . . . . . . . . . . . . . . . . . . . . . . . . . . . . . . . . . . . . . . . . . . . . . . . . . . . . . . . . . . . . . . . . . . . . . . . . . . . . . . . . . . . . . . . . . . . . . . . . . . . . . . . . . . . . . . . . . . . . . . . . . . . . . . . . . $941,856
Net Change in Unrealized Appreciation (Depreciation) on:Futures contracts . . . . . . . . . . . . . . . . . . . . . . . . . . . . . . . . . . . . . . . . . . . . . . . . . . . . . . . . . . . . . . . . . . . . . . . . . . . . . . . . . . . . . . . . . . . . . . . . . . . . . . . . . . . . . . . . . . . . . . . . . . . . . . . . . . . . . . . . . . . . . . . . $ 16,960
Average Quarterly Balances of Outstanding Derivative Financial Instruments
Futures contracts:Average notional value of contracts — long . . . . . . . . . . . . . . . . . . . . . . . . . . . . . . . . . . . . . . . . . . . . . . . . . . . . . . . . . . . . . . . . . . . . . . . . . . . . . . . . . . . . . . . . . . . . . . . . . . . . . . . . . . . . . . . . $4,179,004
For more information about the Fund’s investment risks regarding derivative financial instruments, refer to the Notes to Financial Statements.
Fair Value Measurements
Various inputs are used in determining the fair value of financial instruments. For description of the input levels and information about the Fund's policy regarding valuationof financial instruments, refer to the Notes to Financial Statements.
The following table summarizes the value of the Fund's investments according to the fair value hierarchy as of July 31, 2021. The breakdown of the Fund's investments intomajor categories is disclosed in the Schedule of Investments above.
Level 1 Level 2 Level 3 Total
InvestmentsAssets
Common Stocks . . . . . . . . . . . . . . . . . . . . . . . . . . . . . . . . . . . . . . . . . . . . . . . . . . . . . . . . . . . . . . . . . . . . . . . . . . . . $ 45,417,970 $1,057,702,285 $ — $1,103,120,255Preferred Stocks . . . . . . . . . . . . . . . . . . . . . . . . . . . . . . . . . . . . . . . . . . . . . . . . . . . . . . . . . . . . . . . . . . . . . . . . . . . . — 16,889,287 — 16,889,287Money Market Funds . . . . . . . . . . . . . . . . . . . . . . . . . . . . . . . . . . . . . . . . . . . . . . . . . . . . . . . . . . . . . . . . . . . . . . . . 310,000 — — 310,000
$ 45,727,970 $1,074,591,572 $ — $1,120,319,542
Derivative financial instruments(a)
LiabilitiesFutures Contracts . . . . . . . . . . . . . . . . . . . . . . . . . . . . . . . . . . . . . . . . . . . . . . . . . . . . . . . . . . . . . . . . . . . . . . . . . . . $ — $ (57,516) $ — $ (57,516)
(a) Shown at the unrealized appreciation (depreciation) on the contracts.
See notes to financial statements.
Schedule of Investments (continued)
July 31, 2021
iShares� MSCI Intl Value Factor ETF
S C H E D U L E O F I N V E S T M E N T S 47

Security s Value
Common StocksAerospace & Defense — 0.4%Howmet Aerospace Inc.(a). . . . . . . . . . . . . . . . . . . . . . . . . . . . 767,111 $ 25,176,583Textron Inc. . . . . . . . . . . . . . . . . . . . . . . . . . . . . . . . . . . . . . . . . . 542,792 37,458,076
62,634,659Air Freight & Logistics — 1.7%United Parcel Service Inc., Class B . . . . . . . . . . . . . . . . . . . 1,298,759 248,530,522
Automobiles — 6.7%General Motors Co.(a). . . . . . . . . . . . . . . . . . . . . . . . . . . . . . . . 2,703,504 153,667,167Tesla Inc.(a) . . . . . . . . . . . . . . . . . . . . . . . . . . . . . . . . . . . . . . . . . 1,186,349 815,259,033
968,926,200Banks — 13.4%Bank of America Corp. . . . . . . . . . . . . . . . . . . . . . . . . . . . . . . . 14,405,337 552,588,727Citizens Financial Group Inc. . . . . . . . . . . . . . . . . . . . . . . . . . 752,307 31,717,263Fifth Third Bancorp.. . . . . . . . . . . . . . . . . . . . . . . . . . . . . . . . . . 1,251,073 45,401,439JPMorgan Chase & Co.. . . . . . . . . . . . . . . . . . . . . . . . . . . . . . 4,155,666 630,746,986PNC Financial Services Group Inc. (The) . . . . . . . . . . . . . 829,477 151,304,900SVB Financial Group(a)(b) . . . . . . . . . . . . . . . . . . . . . . . . . . . . 151,526 83,333,239Wells Fargo & Co. . . . . . . . . . . . . . . . . . . . . . . . . . . . . . . . . . . . 9,632,330 442,509,240
1,937,601,794Biotechnology — 3.4%Horizon Therapeutics PLC(a) . . . . . . . . . . . . . . . . . . . . . . . . . 310,391 31,045,308Moderna Inc.(a) . . . . . . . . . . . . . . . . . . . . . . . . . . . . . . . . . . . . . . 1,182,583 418,161,349Novavax Inc.(a)(b) . . . . . . . . . . . . . . . . . . . . . . . . . . . . . . . . . . . . 262,078 46,998,447
496,205,104Building Products — 1.9%Carrier Global Corp. . . . . . . . . . . . . . . . . . . . . . . . . . . . . . . . . . 1,589,127 87,799,267Johnson Controls International PLC . . . . . . . . . . . . . . . . . . 1,607,329 114,795,437Trane Technologies PLC . . . . . . . . . . . . . . . . . . . . . . . . . . . . . 368,296 74,988,749
277,583,453Capital Markets — 9.6%Ameriprise Financial Inc. . . . . . . . . . . . . . . . . . . . . . . . . . . . . . 233,133 60,045,735BlackRock Inc.(c) . . . . . . . . . . . . . . . . . . . . . . . . . . . . . . . . . . . . 204,656 177,471,544Blackstone Group Inc. (The), NVS. . . . . . . . . . . . . . . . . . . . 1,325,439 152,783,354Carlyle Group Inc. (The) . . . . . . . . . . . . . . . . . . . . . . . . . . . . . 317,003 15,999,141Charles Schwab Corp. (The) . . . . . . . . . . . . . . . . . . . . . . . . . 2,929,357 199,049,808Goldman Sachs Group Inc. (The) . . . . . . . . . . . . . . . . . . . . 852,642 319,638,433Invesco Ltd. . . . . . . . . . . . . . . . . . . . . . . . . . . . . . . . . . . . . . . . . . 1,291,807 31,494,255KKR & Co. Inc. . . . . . . . . . . . . . . . . . . . . . . . . . . . . . . . . . . . . . . 1,212,276 77,294,718Morgan Stanley . . . . . . . . . . . . . . . . . . . . . . . . . . . . . . . . . . . . . 3,334,019 319,999,144Raymond James Financial Inc. . . . . . . . . . . . . . . . . . . . . . . . 292,305 37,847,651
1,391,623,783Chemicals — 0.7%Albemarle Corp. . . . . . . . . . . . . . . . . . . . . . . . . . . . . . . . . . . . . . 290,700 59,895,828CF Industries Holdings Inc. . . . . . . . . . . . . . . . . . . . . . . . . . . 360,995 17,057,014Mosaic Co. (The) . . . . . . . . . . . . . . . . . . . . . . . . . . . . . . . . . . . . 940,167 29,361,415
106,314,257Consumer Finance — 1.5%Ally Financial Inc.. . . . . . . . . . . . . . . . . . . . . . . . . . . . . . . . . . . . 951,953 48,892,306Capital One Financial Corp. . . . . . . . . . . . . . . . . . . . . . . . . . . 1,038,119 167,863,842
216,756,148Containers & Packaging — 0.2%Avery Dennison Corp. . . . . . . . . . . . . . . . . . . . . . . . . . . . . . . . 168,838 35,570,790
Distributors — 0.2%Pool Corp. . . . . . . . . . . . . . . . . . . . . . . . . . . . . . . . . . . . . . . . . . . 55,491 26,514,710
Security s Value
Diversified Financial Services — 4.5%Berkshire Hathaway Inc., Class B(a) . . . . . . . . . . . . . . . . . . 2,258,766 $ 628,591,990Equitable Holdings Inc. . . . . . . . . . . . . . . . . . . . . . . . . . . . . . . 696,750 21,508,673
650,100,663Electrical Equipment — 0.9%Generac Holdings Inc.(a)(b) . . . . . . . . . . . . . . . . . . . . . . . . . . . 192,567 80,754,897Plug Power Inc.(a)(b) . . . . . . . . . . . . . . . . . . . . . . . . . . . . . . . . . 1,846,461 50,371,456
131,126,353Electronic Equipment, Instruments & Components — 0.9%Arrow Electronics Inc.(a)(b). . . . . . . . . . . . . . . . . . . . . . . . . . . . 124,281 14,735,998Trimble Inc.(a)(b) . . . . . . . . . . . . . . . . . . . . . . . . . . . . . . . . . . . . . 610,725 52,216,988Zebra Technologies Corp., Class A(a) . . . . . . . . . . . . . . . . . 117,928 65,152,861
132,105,847Entertainment — 4.8%Roku Inc.(a)(b) . . . . . . . . . . . . . . . . . . . . . . . . . . . . . . . . . . . . . . . 142,114 60,868,847Walt Disney Co. (The)(a) . . . . . . . . . . . . . . . . . . . . . . . . . . . . . 3,617,276 636,712,922
697,581,769Food Products — 0.6%Archer-Daniels-Midland Co. . . . . . . . . . . . . . . . . . . . . . . . . . . 997,997 59,600,381Bunge Ltd. . . . . . . . . . . . . . . . . . . . . . . . . . . . . . . . . . . . . . . . . . . 331,152 25,707,330
85,307,711Health Care Equipment & Supplies — 1.2%Align Technology Inc.(a) . . . . . . . . . . . . . . . . . . . . . . . . . . . . . . 98,315 68,407,577IDEXX Laboratories Inc.(a) . . . . . . . . . . . . . . . . . . . . . . . . . . . 117,572 79,776,129Novocure Ltd.(a)(b) . . . . . . . . . . . . . . . . . . . . . . . . . . . . . . . . . . . 161,745 24,910,348
173,094,054Hotels, Restaurants & Leisure — 0.9%Caesars Entertainment Inc.(a) . . . . . . . . . . . . . . . . . . . . . . . . 548,027 47,875,639Expedia Group Inc.(a) . . . . . . . . . . . . . . . . . . . . . . . . . . . . . . . . 300,859 48,399,187MGM Resorts International. . . . . . . . . . . . . . . . . . . . . . . . . . . 715,123 26,838,566
123,113,392Household Durables — 0.1%Mohawk Industries Inc.(a) . . . . . . . . . . . . . . . . . . . . . . . . . . . . 107,811 21,012,364
Independent Power and Renewable Electricity Producers — 0.2%AES Corp. (The). . . . . . . . . . . . . . . . . . . . . . . . . . . . . . . . . . . . . 1,148,371 27,216,393
Industrial Conglomerates — 1.3%General Electric Co. . . . . . . . . . . . . . . . . . . . . . . . . . . . . . . . . . 14,460,453 187,262,866
Insurance — 1.5%Arthur J Gallagher & Co. . . . . . . . . . . . . . . . . . . . . . . . . . . . . . 416,143 57,972,881Cincinnati Financial Corp. . . . . . . . . . . . . . . . . . . . . . . . . . . . . 261,225 30,793,203Hartford Financial Services Group Inc. (The) . . . . . . . . . . 605,510 38,522,546Loews Corp. . . . . . . . . . . . . . . . . . . . . . . . . . . . . . . . . . . . . . . . . 417,489 22,389,935MetLife Inc. . . . . . . . . . . . . . . . . . . . . . . . . . . . . . . . . . . . . . . . . . 1,239,935 71,544,250
221,222,815Interactive Media & Services — 7.1%Alphabet Inc., Class A(a) . . . . . . . . . . . . . . . . . . . . . . . . . . . . . 144,749 390,030,523Alphabet Inc., Class C, NVS(a) . . . . . . . . . . . . . . . . . . . . . . . 152,071 411,263,854IAC/InterActiveCorp.(a) . . . . . . . . . . . . . . . . . . . . . . . . . . . . . . . 294,591 40,444,398Pinterest Inc., Class A(a) . . . . . . . . . . . . . . . . . . . . . . . . . . . . . 1,113,845 65,605,471Snap Inc., Class A, NVS(a)(b) . . . . . . . . . . . . . . . . . . . . . . . . . 1,713,615 127,527,228
1,034,871,474Internet & Direct Marketing Retail — 0.9%Etsy Inc.(a) . . . . . . . . . . . . . . . . . . . . . . . . . . . . . . . . . . . . . . . . . . 189,833 34,836,254MercadoLibre Inc.(a) . . . . . . . . . . . . . . . . . . . . . . . . . . . . . . . . . 58,259 91,390,893
126,227,147
Schedule of InvestmentsJuly 31, 2021
iShares� MSCI USA Momentum Factor ETF(Percentages shown are based on Net Assets)
48 2 0 2 1 I S H A R E S A N N U A L R E P O R T T O S H A R E H O L D E R S

Security s Value
IT Services — 6.1%EPAM Systems Inc.(a)(b). . . . . . . . . . . . . . . . . . . . . . . . . . . . . . 116,644 $ 65,297,311PayPal Holdings Inc.(a) . . . . . . . . . . . . . . . . . . . . . . . . . . . . . . 1,975,852 544,406,502Square Inc., Class A(a)(b) . . . . . . . . . . . . . . . . . . . . . . . . . . . . . 792,620 195,983,221Twilio Inc., Class A(a) . . . . . . . . . . . . . . . . . . . . . . . . . . . . . . . . 210,814 78,758,002
884,445,036Life Sciences Tools & Services — 2.0%10X Genomics Inc., Class A(a)(b). . . . . . . . . . . . . . . . . . . . . . 165,083 30,248,158Agilent Technologies Inc.. . . . . . . . . . . . . . . . . . . . . . . . . . . . . 523,827 80,266,011Avantor Inc.(a) . . . . . . . . . . . . . . . . . . . . . . . . . . . . . . . . . . . . . . . 743,397 27,936,859Bio-Techne Corp. . . . . . . . . . . . . . . . . . . . . . . . . . . . . . . . . . . . . 91,853 44,295,191Charles River Laboratories International Inc.(a) . . . . . . . . 100,528 40,906,854Mettler-Toledo International Inc.(a) . . . . . . . . . . . . . . . . . . . . 36,454 53,722,624PPD Inc.(a) . . . . . . . . . . . . . . . . . . . . . . . . . . . . . . . . . . . . . . . . . . 187,346 8,640,398
286,016,095Machinery — 3.8%Caterpillar Inc.. . . . . . . . . . . . . . . . . . . . . . . . . . . . . . . . . . . . . . . 1,028,860 212,716,805Deere & Co.. . . . . . . . . . . . . . . . . . . . . . . . . . . . . . . . . . . . . . . . . 859,195 310,676,320Snap-on Inc. . . . . . . . . . . . . . . . . . . . . . . . . . . . . . . . . . . . . . . . . 91,609 19,968,930
543,362,055Media — 0.7%Interpublic Group of Companies Inc. (The) . . . . . . . . . . . . 763,484 26,996,794News Corp., Class A, NVS . . . . . . . . . . . . . . . . . . . . . . . . . . . 1,439,941 35,465,747Omnicom Group Inc. . . . . . . . . . . . . . . . . . . . . . . . . . . . . . . . . 429,813 31,298,983
93,761,524Metals & Mining — 2.2%Freeport-McMoRan Inc.. . . . . . . . . . . . . . . . . . . . . . . . . . . . . . 5,447,932 207,566,209Nucor Corp. . . . . . . . . . . . . . . . . . . . . . . . . . . . . . . . . . . . . . . . . . 777,440 80,869,309Steel Dynamics Inc. . . . . . . . . . . . . . . . . . . . . . . . . . . . . . . . . . 504,755 32,531,460
320,966,978Multiline Retail — 1.4%Target Corp.. . . . . . . . . . . . . . . . . . . . . . . . . . . . . . . . . . . . . . . . . 776,746 202,769,543
Oil, Gas & Consumable Fuels — 1.8%Cheniere Energy Inc.(a) . . . . . . . . . . . . . . . . . . . . . . . . . . . . . . 449,686 38,191,832Devon Energy Corp. . . . . . . . . . . . . . . . . . . . . . . . . . . . . . . . . . 1,358,003 35,090,798EOG Resources Inc.. . . . . . . . . . . . . . . . . . . . . . . . . . . . . . . . . 1,089,456 79,377,764Occidental Petroleum Corp. . . . . . . . . . . . . . . . . . . . . . . . . . . 1,847,554 48,221,159Pioneer Natural Resources Co. . . . . . . . . . . . . . . . . . . . . . . 377,266 54,843,158
255,724,711Personal Products — 0.9%Estee Lauder Companies Inc. (The), Class A . . . . . . . . . 386,249 128,941,504
Professional Services — 1.0%Equifax Inc. . . . . . . . . . . . . . . . . . . . . . . . . . . . . . . . . . . . . . . . . . 209,010 54,468,006IHS Markit Ltd. . . . . . . . . . . . . . . . . . . . . . . . . . . . . . . . . . . . . . . 542,195 63,350,064Robert Half International Inc. . . . . . . . . . . . . . . . . . . . . . . . . . 244,254 23,988,185
141,806,255Real Estate Management & Development — 0.4%CBRE Group Inc., Class A(a)(b) . . . . . . . . . . . . . . . . . . . . . . . 637,938 61,535,499
Road & Rail — 1.9%AMERCO . . . . . . . . . . . . . . . . . . . . . . . . . . . . . . . . . . . . . . . . . . . 28,332 16,658,082Kansas City Southern. . . . . . . . . . . . . . . . . . . . . . . . . . . . . . . . 252,185 67,535,143Lyft Inc., Class A(a)(b) . . . . . . . . . . . . . . . . . . . . . . . . . . . . . . . . 942,865 52,159,292Old Dominion Freight Line Inc. . . . . . . . . . . . . . . . . . . . . . . . 153,534 41,323,676Uber Technologies Inc.(a) . . . . . . . . . . . . . . . . . . . . . . . . . . . . 2,333,830 101,428,252
279,104,445
Security s Value
Semiconductors & Semiconductor Equipment — 5.8%Applied Materials Inc. . . . . . . . . . . . . . . . . . . . . . . . . . . . . . . . . 3,163,210 $ 442,627,975KLA Corp.. . . . . . . . . . . . . . . . . . . . . . . . . . . . . . . . . . . . . . . . . . . 255,164 88,837,898Lam Research Corp. . . . . . . . . . . . . . . . . . . . . . . . . . . . . . . . . 311,381 198,477,363NXP Semiconductors NV . . . . . . . . . . . . . . . . . . . . . . . . . . . . 397,743 82,090,178Qorvo Inc.(a). . . . . . . . . . . . . . . . . . . . . . . . . . . . . . . . . . . . . . . . . 182,418 34,584,629
846,618,043Software — 3.6%Cloudflare Inc., Class A(a)(b) . . . . . . . . . . . . . . . . . . . . . . . . . . 837,168 99,313,240Crowdstrike Holdings Inc., Class A(a) . . . . . . . . . . . . . . . . . 584,121 148,138,927Dynatrace Inc.(a). . . . . . . . . . . . . . . . . . . . . . . . . . . . . . . . . . . . . 245,745 15,695,733Fortinet Inc.(a) . . . . . . . . . . . . . . . . . . . . . . . . . . . . . . . . . . . . . . . 295,780 80,523,147HubSpot Inc.(a)(b) . . . . . . . . . . . . . . . . . . . . . . . . . . . . . . . . . . . . 113,128 67,426,551Palantir Technologies Inc., Class A(a)(b) . . . . . . . . . . . . . . . 1,963,878 42,635,791Palo Alto Networks Inc.(a) . . . . . . . . . . . . . . . . . . . . . . . . . . . . 179,126 71,480,230
525,213,619Specialty Retail — 1.2%Burlington Stores Inc.(a)(b) . . . . . . . . . . . . . . . . . . . . . . . . . . . . 109,632 36,704,793Carvana Co., Class A(a) . . . . . . . . . . . . . . . . . . . . . . . . . . . . . . 99,541 33,601,060L Brands Inc. . . . . . . . . . . . . . . . . . . . . . . . . . . . . . . . . . . . . . . . . 833,295 66,721,931Tractor Supply Co.. . . . . . . . . . . . . . . . . . . . . . . . . . . . . . . . . . . 206,041 37,278,998
174,306,782Technology Hardware, Storage & Peripherals — 2.0%Dell Technologies Inc., Class C(a). . . . . . . . . . . . . . . . . . . . . 621,507 60,050,006Hewlett Packard Enterprise Co. . . . . . . . . . . . . . . . . . . . . . . 2,766,600 40,115,700HP Inc.. . . . . . . . . . . . . . . . . . . . . . . . . . . . . . . . . . . . . . . . . . . . . . 3,455,401 99,757,427NetApp Inc. . . . . . . . . . . . . . . . . . . . . . . . . . . . . . . . . . . . . . . . . . 405,841 32,300,885Seagate Technology Holdings PLC . . . . . . . . . . . . . . . . . . . 595,285 52,325,552
284,549,570Trading Companies & Distributors — 0.3%United Rentals Inc.(a) . . . . . . . . . . . . . . . . . . . . . . . . . . . . . . . . 149,524 49,275,634
Total Common Stocks — 99.7%(Cost: $12,703,148,843) . . . . . . . . . . . . . . . . . . . . . . . . . . . . . . . . . . . . . . . . 14,456,901,561
Short-Term InvestmentsMoney Market Funds — 1.0%BlackRock Cash Funds: Institutional, SL Agency
Shares, 0.06%(c)(d)(e) . . . . . . . . . . . . . . . . . . . . . . . . . . . . . . 116,401,961 116,460,162BlackRock Cash Funds: Treasury, SL Agency Shares,
0.00%(c)(d) . . . . . . . . . . . . . . . . . . . . . . . . . . . . . . . . . . . . . . . . 23,140,000 23,140,000
139,600,162
Total Short-Term Investments — 1.0%(Cost: $139,553,428) . . . . . . . . . . . . . . . . . . . . . . . . . . . . . . . . . . . . . . . . . . . 139,600,162
Total Investments in Securities — 100.7%(Cost: $12,842,702,271) . . . . . . . . . . . . . . . . . . . . . . . . . . . . . . . . . . . . . . . . 14,596,501,723
Other Assets, Less Liabilities — (0.7)%. . . . . . . . . . . . . . . . . . . . . . . . . . . (103,484,708)
Net Assets — 100.0% . . . . . . . . . . . . . . . . . . . . . . . . . . . . . . . . . . . . . . . . . . . . . $ 14,493,017,015
(a) Non-income producing security.(b) All or a portion of this security is on loan.(c) Affiliate of the Fund.(d) Annualized 7-day yield as of period-end.(e) All or a portion of this security was purchased with cash collateral received from loaned
securities.
Schedule of Investments (continued)
July 31, 2021
iShares� MSCI USA Momentum Factor ETF(Percentages shown are based on Net Assets)
S C H E D U L E O F I N V E S T M E N T S 49

Affiliates
Investments in issuers considered to be affiliate(s) of the Fund during the year ended July 31, 2021 for purposes of Section 2(a)(3) of the Investment Company Act of 1940,as amended, were as follows:
Affiliated IssuerValue at
07/31/20Purchases
at CostProceeds
from SalesNet Realized
Gain (Loss)
Change inUnrealized
Appreciation(Depreciation)
Value at07/31/21
SharesHeld at
07/31/21 Income
CapitalGain
Distributionsfrom
UnderlyingFunds
BlackRock Cash Funds: Institu-tional, SL Agency Shares . . . . . . . . $154,042,048 $ — $(37,463,706)(a) $ (33,391) $ (84,789) $116,460,162 116,401,961 $ 549,799(b) $ —
BlackRock Cash Funds: Treasury,SL Agency Shares . . . . . . . . . . . . . . 10,679,000 12,461,000(a) — — — 23,140,000 23,140,000 8,670 —
BlackRock Inc. . . . . . . . . . . . . . . . . . . . . 76,752,910 117,767,925 (62,114,559) 21,058,875 24,006,393 177,471,544 204,656 2,658,114 —
$ 21,025,484 $ 23,921,604 $317,071,706 $3,216,583 $ —
(a) Represents net amount purchased (sold).(b) All or a portion represents securities lending income earned from the reinvestment of cash collateral from loaned securities, net of fees and collateral investment expenses, and other
payments to and from borrowers of securities.
Futures Contracts
DescriptionNumber ofContracts
ExpirationDate
NotionalAmount
(000)
Value/Unrealized
Appreciation(Depreciation)
Long ContractsS&P 500 E-Mini Index . . . . . . . . . . . . . . . . . . . . . . . . . . . . . . . . . . . . . . . . . . . . . . . . . . . . . . . . . . . . . . . . . . . . . . . . . . . . . . . . . . . . . . . . . . . . . . . 147 09/17/21 $32,263 $ 1,012,503
Derivative Financial Instruments Categorized by Risk Exposure
As of July 31, 2021, the fair values of derivative financial instruments located in the Statements of Assets and Liabilities were as follows:
EquityContracts
Assets — Derivative Financial InstrumentsFutures contracts
Unrealized appreciation on futures contracts(a) . . . . . . . . . . . . . . . . . . . . . . . . . . . . . . . . . . . . . . . . . . . . . . . . . . . . . . . . . . . . . . . . . . . . . . . . . . . . . . . . . . . . . . . . . . . . . . . . . . . . . . . . . . . . . . . . $1,012,503
(a) Net cumulative appreciation (depreciation) on futures contracts are reported in the Schedule of Investments. In the Statements of Assets and Liabilities, only current day's variationmargin is reported in receivables or payables and the net cumulative unrealized appreciation (depreciation) is included in accumulated earnings (loss).
For the year ended July 31, 2021, the effect of derivative financial instruments in the Statements of Operations was as follows:
EquityContracts
Net Realized Gain (Loss) from:Futures contracts . . . . . . . . . . . . . . . . . . . . . . . . . . . . . . . . . . . . . . . . . . . . . . . . . . . . . . . . . . . . . . . . . . . . . . . . . . . . . . . . . . . . . . . . . . . . . . . . . . . . . . . . . . . . . . . . . . . . . . . . . . . . . . . . . . . . . . . . . . . . . . $5,025,062
Net Change in Unrealized Appreciation (Depreciation) on:Futures contracts . . . . . . . . . . . . . . . . . . . . . . . . . . . . . . . . . . . . . . . . . . . . . . . . . . . . . . . . . . . . . . . . . . . . . . . . . . . . . . . . . . . . . . . . . . . . . . . . . . . . . . . . . . . . . . . . . . . . . . . . . . . . . . . . . . . . . . . . . . . . . . $ 302,648
Average Quarterly Balances of Outstanding Derivative Financial Instruments
Futures contracts:Average notional value of contracts — long . . . . . . . . . . . . . . . . . . . . . . . . . . . . . . . . . . . . . . . . . . . . . . . . . . . . . . . . . . . . . . . . . . . . . . . . . . . . . . . . . . . . . . . . . . . . . . . . . . . . . . . . . . . . . . . $18,490,601
For more information about the Fund’s investment risks regarding derivative financial instruments, refer to the Notes to Financial Statements.
Fair Value Measurements
Various inputs are used in determining the fair value of financial instruments. For description of the input levels and information about the Fund's policy regarding valuationof financial instruments, refer to the Notes to Financial Statements.
Schedule of Investments (continued)
July 31, 2021
iShares� MSCI USA Momentum Factor ETF
50 2 0 2 1 I S H A R E S A N N U A L R E P O R T T O S H A R E H O L D E R S

Fair Value Measurements (continued)
The following table summarizes the value of the Fund's investments according to the fair value hierarchy as of July 31, 2021. The breakdown of the Fund's investments intomajor categories is disclosed in the Schedule of Investments above.
Level 1 Level 2 Level 3 Total
InvestmentsAssets
Common Stocks. . . . . . . . . . . . . . . . . . . . . . . . . . . . . . . . . . . . . . . . . . . . . . . . . . . . . . . . . . . . . . . . . . . . . . . . $14,456,901,561 $ — $ — $14,456,901,561Money Market Funds . . . . . . . . . . . . . . . . . . . . . . . . . . . . . . . . . . . . . . . . . . . . . . . . . . . . . . . . . . . . . . . . . . . 139,600,162 — — 139,600,162
$14,596,501,723 $ — $ — $14,596,501,723
Derivative financial instruments(a)
AssetsFutures Contracts . . . . . . . . . . . . . . . . . . . . . . . . . . . . . . . . . . . . . . . . . . . . . . . . . . . . . . . . . . . . . . . . . . . . . . $ 1,012,503 $ — $ — $ 1,012,503
(a) Shown at the unrealized appreciation (depreciation) on the contracts.
See notes to financial statements.
Schedule of Investments (continued)
July 31, 2021
iShares� MSCI USA Momentum Factor ETF
S C H E D U L E O F I N V E S T M E N T S 51

Security s Value
Common StocksAerospace & Defense — 2.1%Huntington Ingalls Industries Inc. . . . . . . . . . . . . . . . . . . . . . . 129,676 $ 26,600,438Lockheed Martin Corp. . . . . . . . . . . . . . . . . . . . . . . . . . . . . . . . . 1,264,680 470,043,615
496,644,053Air Freight & Logistics — 0.5%CH Robinson Worldwide Inc. . . . . . . . . . . . . . . . . . . . . . . . . . . 415,424 37,043,358Expeditors International of Washington Inc. . . . . . . . . . . . . 618,919 79,376,362
116,419,720Banks — 0.6%SVB Financial Group(a) . . . . . . . . . . . . . . . . . . . . . . . . . . . . . . . 257,374 141,545,405
Beverages — 0.7%Boston Beer Co. Inc. (The), Class A, NVS(a). . . . . . . . . . . . 21,033 14,933,430Brown-Forman Corp., Class B, NVS . . . . . . . . . . . . . . . . . . . 730,685 51,820,180Monster Beverage Corp.(a) . . . . . . . . . . . . . . . . . . . . . . . . . . . . 1,197,366 112,935,561
179,689,171Biotechnology — 1.7%Amgen Inc. . . . . . . . . . . . . . . . . . . . . . . . . . . . . . . . . . . . . . . . . . . . 901,698 217,796,135Biogen Inc.(a) . . . . . . . . . . . . . . . . . . . . . . . . . . . . . . . . . . . . . . . . . 248,170 81,084,584Regeneron Pharmaceuticals Inc.(a) . . . . . . . . . . . . . . . . . . . . 170,658 98,061,793
396,942,512Building Products — 0.3%A O Smith Corp. . . . . . . . . . . . . . . . . . . . . . . . . . . . . . . . . . . . . . . 454,535 31,967,447Allegion PLC . . . . . . . . . . . . . . . . . . . . . . . . . . . . . . . . . . . . . . . . . 292,002 39,887,473
71,854,920Capital Markets — 5.9%Ameriprise Financial Inc. . . . . . . . . . . . . . . . . . . . . . . . . . . . . . . 629,933 162,245,543BlackRock Inc.(b) . . . . . . . . . . . . . . . . . . . . . . . . . . . . . . . . . . . . . 792,403 687,148,110FactSet Research Systems Inc. . . . . . . . . . . . . . . . . . . . . . . . 225,443 80,546,275MarketAxess Holdings Inc. . . . . . . . . . . . . . . . . . . . . . . . . . . . . 250,899 119,219,678SEI Investments Co. . . . . . . . . . . . . . . . . . . . . . . . . . . . . . . . . . . 748,612 45,515,610T Rowe Price Group Inc. . . . . . . . . . . . . . . . . . . . . . . . . . . . . . . 1,507,392 307,749,151
1,402,424,367Chemicals — 2.1%Air Products & Chemicals Inc. . . . . . . . . . . . . . . . . . . . . . . . . . 526,840 153,326,245Celanese Corp., Class A . . . . . . . . . . . . . . . . . . . . . . . . . . . . . . 290,048 45,180,777PPG Industries Inc. . . . . . . . . . . . . . . . . . . . . . . . . . . . . . . . . . . . 593,342 97,023,284Sherwin-Williams Co. (The) . . . . . . . . . . . . . . . . . . . . . . . . . . . 722,351 210,225,812
505,756,118Commercial Services & Supplies — 0.6%Copart Inc.(a) . . . . . . . . . . . . . . . . . . . . . . . . . . . . . . . . . . . . . . . . . 723,579 106,366,113Rollins Inc. . . . . . . . . . . . . . . . . . . . . . . . . . . . . . . . . . . . . . . . . . . . 756,060 28,979,780
135,345,893Communications Equipment — 1.4%Cisco Systems Inc. . . . . . . . . . . . . . . . . . . . . . . . . . . . . . . . . . . . 6,081,734 336,745,612
Construction Materials — 0.2%Martin Marietta Materials Inc.. . . . . . . . . . . . . . . . . . . . . . . . . . 152,263 55,317,148
Containers & Packaging — 0.2%Avery Dennison Corp.. . . . . . . . . . . . . . . . . . . . . . . . . . . . . . . . . 237,728 50,084,535
Distributors — 0.5%Pool Corp.. . . . . . . . . . . . . . . . . . . . . . . . . . . . . . . . . . . . . . . . . . . . 257,773 123,169,095
Electric Utilities — 1.2%Alliant Energy Corp. . . . . . . . . . . . . . . . . . . . . . . . . . . . . . . . . . . 4,946,744 289,532,926
Security s Value
Electrical Equipment — 0.7%Rockwell Automation Inc. . . . . . . . . . . . . . . . . . . . . . . . . . . . . . 549,177 $ 168,827,993
Energy Equipment & Services — 0.4%Baker Hughes Co., Class A . . . . . . . . . . . . . . . . . . . . . . . . . . . 4,074,102 86,533,926
Entertainment — 1.1%Activision Blizzard Inc. . . . . . . . . . . . . . . . . . . . . . . . . . . . . . . . . 1,624,374 135,830,153Electronic Arts Inc. . . . . . . . . . . . . . . . . . . . . . . . . . . . . . . . . . . . . 667,819 96,139,223Take-Two Interactive Software Inc.(a) . . . . . . . . . . . . . . . . . . 253,646 43,987,290
275,956,666Equity Real Estate Investment Trusts (REITs) — 2.4%AvalonBay Communities Inc. . . . . . . . . . . . . . . . . . . . . . . . . . . 266,240 60,657,459Duke Realty Corp. . . . . . . . . . . . . . . . . . . . . . . . . . . . . . . . . . . . . 712,191 36,236,278Equity Residential . . . . . . . . . . . . . . . . . . . . . . . . . . . . . . . . . . . . 625,432 52,617,594Essex Property Trust Inc. . . . . . . . . . . . . . . . . . . . . . . . . . . . . . 117,266 38,474,975Prologis Inc. . . . . . . . . . . . . . . . . . . . . . . . . . . . . . . . . . . . . . . . . . . 1,455,985 186,424,319Public Storage. . . . . . . . . . . . . . . . . . . . . . . . . . . . . . . . . . . . . . . . 414,978 129,672,326Realty Income Corp. . . . . . . . . . . . . . . . . . . . . . . . . . . . . . . . . . . 677,693 47,635,041VICI Properties Inc. . . . . . . . . . . . . . . . . . . . . . . . . . . . . . . . . . . . 916,658 28,590,563
580,308,555Food & Staples Retailing — 4.1%Costco Wholesale Corp. . . . . . . . . . . . . . . . . . . . . . . . . . . . . . . 1,133,789 487,211,809Walmart Inc.. . . . . . . . . . . . . . . . . . . . . . . . . . . . . . . . . . . . . . . . . . 3,417,910 487,223,071
974,434,880Food Products — 0.4%Hershey Co. (The) . . . . . . . . . . . . . . . . . . . . . . . . . . . . . . . . . . . . 587,700 105,127,776
Gas Utilities — 1.2%Atmos Energy Corp. . . . . . . . . . . . . . . . . . . . . . . . . . . . . . . . . . . 2,894,894 285,407,599
Health Care Equipment & Supplies — 2.1%ABIOMED Inc.(a). . . . . . . . . . . . . . . . . . . . . . . . . . . . . . . . . . . . . . 60,844 19,904,506Align Technology Inc.(a) . . . . . . . . . . . . . . . . . . . . . . . . . . . . . . . 135,918 94,571,745Cooper Companies Inc. (The) . . . . . . . . . . . . . . . . . . . . . . . . . 83,619 35,267,986Edwards Lifesciences Corp.(a) . . . . . . . . . . . . . . . . . . . . . . . . . 869,449 97,613,039IDEXX Laboratories Inc.(a) . . . . . . . . . . . . . . . . . . . . . . . . . . . . 214,445 145,507,366ResMed Inc.. . . . . . . . . . . . . . . . . . . . . . . . . . . . . . . . . . . . . . . . . . 210,699 57,267,988West Pharmaceutical Services Inc. . . . . . . . . . . . . . . . . . . . . 110,458 45,478,872
495,611,502Health Care Providers & Services — 2.4%Henry Schein Inc.(a)(c) . . . . . . . . . . . . . . . . . . . . . . . . . . . . . . . . . 186,284 14,930,663UnitedHealth Group Inc. . . . . . . . . . . . . . . . . . . . . . . . . . . . . . . 1,366,505 563,300,691
578,231,354Health Care Technology — 0.3%Veeva Systems Inc., Class A(a) . . . . . . . . . . . . . . . . . . . . . . . . 190,927 63,523,322
Household Durables — 2.0%DR Horton Inc. . . . . . . . . . . . . . . . . . . . . . . . . . . . . . . . . . . . . . . . 1,800,305 171,803,106Garmin Ltd. . . . . . . . . . . . . . . . . . . . . . . . . . . . . . . . . . . . . . . . . . . 806,675 126,809,310NVR Inc.(a)(c) . . . . . . . . . . . . . . . . . . . . . . . . . . . . . . . . . . . . . . . . . 18,842 98,404,229PulteGroup Inc.. . . . . . . . . . . . . . . . . . . . . . . . . . . . . . . . . . . . . . . 1,332,972 73,140,174
470,156,819Household Products — 0.5%Church & Dwight Co. Inc. . . . . . . . . . . . . . . . . . . . . . . . . . . . . . 559,130 48,409,475Clorox Co. (The). . . . . . . . . . . . . . . . . . . . . . . . . . . . . . . . . . . . . . 386,128 69,846,694
118,256,169Industrial Conglomerates — 1.6%3M Co. . . . . . . . . . . . . . . . . . . . . . . . . . . . . . . . . . . . . . . . . . . . . . . . 1,974,693 390,870,732
Schedule of InvestmentsJuly 31, 2021
iShares� MSCI USA Quality Factor ETF(Percentages shown are based on Net Assets)
52 2 0 2 1 I S H A R E S A N N U A L R E P O R T T O S H A R E H O L D E R S

Security s Value
Insurance — 4.2%Aflac Inc. . . . . . . . . . . . . . . . . . . . . . . . . . . . . . . . . . . . . . . . . . . . . . 3,503,635 $ 192,699,925Aon PLC, Class A. . . . . . . . . . . . . . . . . . . . . . . . . . . . . . . . . . . . . 1,210,261 314,704,168Erie Indemnity Co., Class A, NVS. . . . . . . . . . . . . . . . . . . . . . 150,820 27,885,110Fidelity National Financial Inc. . . . . . . . . . . . . . . . . . . . . . . . . . 1,406,304 62,735,221Globe Life Inc. . . . . . . . . . . . . . . . . . . . . . . . . . . . . . . . . . . . . . . . . 484,220 45,085,724Progressive Corp. (The). . . . . . . . . . . . . . . . . . . . . . . . . . . . . . . 3,937,951 374,735,417
1,017,845,565Interactive Media & Services — 9.7%Alphabet Inc., Class A(a) . . . . . . . . . . . . . . . . . . . . . . . . . . . . . . 221,521 596,894,980Alphabet Inc., Class C, NVS(a). . . . . . . . . . . . . . . . . . . . . . . . . 217,216 587,443,295Facebook Inc., Class A(a). . . . . . . . . . . . . . . . . . . . . . . . . . . . . . 3,207,328 1,142,770,966
2,327,109,241Internet & Direct Marketing Retail — 1.1%eBay Inc. . . . . . . . . . . . . . . . . . . . . . . . . . . . . . . . . . . . . . . . . . . . . . 3,831,159 261,323,355
IT Services — 7.4%Accenture PLC, Class A. . . . . . . . . . . . . . . . . . . . . . . . . . . . . . . 996,143 316,454,708Automatic Data Processing Inc. . . . . . . . . . . . . . . . . . . . . . . . 747,056 156,605,350Jack Henry & Associates Inc.. . . . . . . . . . . . . . . . . . . . . . . . . . 109,391 19,043,879Mastercard Inc., Class A . . . . . . . . . . . . . . . . . . . . . . . . . . . . . . 1,689,313 651,973,459Paychex Inc. . . . . . . . . . . . . . . . . . . . . . . . . . . . . . . . . . . . . . . . . . 534,360 60,820,855Visa Inc., Class A . . . . . . . . . . . . . . . . . . . . . . . . . . . . . . . . . . . . . 2,354,399 580,100,370
1,784,998,621Life Sciences Tools & Services — 0.3%Agilent Technologies Inc. . . . . . . . . . . . . . . . . . . . . . . . . . . . . . . 401,495 61,521,079
Machinery — 1.1%Illinois Tool Works Inc. . . . . . . . . . . . . . . . . . . . . . . . . . . . . . . . . 1,152,193 261,167,587
Media — 0.5%Fox Corp., Class A, NVS . . . . . . . . . . . . . . . . . . . . . . . . . . . . . . 691,099 24,644,590Fox Corp., Class B. . . . . . . . . . . . . . . . . . . . . . . . . . . . . . . . . . . . 318,765 10,595,749Interpublic Group of Companies Inc. (The) . . . . . . . . . . . . . 737,437 26,075,772Omnicom Group Inc.. . . . . . . . . . . . . . . . . . . . . . . . . . . . . . . . . . 401,341 29,225,652ViacomCBS Inc., Class B, NVS. . . . . . . . . . . . . . . . . . . . . . . . 1,003,336 41,066,542
131,608,305Multiline Retail — 2.8%Target Corp. . . . . . . . . . . . . . . . . . . . . . . . . . . . . . . . . . . . . . . . . . . 2,574,142 671,979,769
Oil, Gas & Consumable Fuels — 1.9%Kinder Morgan Inc. . . . . . . . . . . . . . . . . . . . . . . . . . . . . . . . . . . . 12,747,731 221,555,565Marathon Petroleum Corp. . . . . . . . . . . . . . . . . . . . . . . . . . . . . 4,124,440 227,751,577
449,307,142Pharmaceuticals — 6.5%Eli Lilly & Co. . . . . . . . . . . . . . . . . . . . . . . . . . . . . . . . . . . . . . . . . . 1,534,921 373,753,263Johnson & Johnson. . . . . . . . . . . . . . . . . . . . . . . . . . . . . . . . . . . 4,158,253 716,051,166Merck & Co. Inc. . . . . . . . . . . . . . . . . . . . . . . . . . . . . . . . . . . . . . . 4,419,010 339,689,299Zoetis Inc. . . . . . . . . . . . . . . . . . . . . . . . . . . . . . . . . . . . . . . . . . . . . 667,258 135,253,197
1,564,746,925Professional Services — 0.2%Robert Half International Inc. . . . . . . . . . . . . . . . . . . . . . . . . . . 374,059 36,736,334
Real Estate Management & Development — 0.3%CBRE Group Inc., Class A(a) . . . . . . . . . . . . . . . . . . . . . . . . . . 735,880 70,982,985
Road & Rail — 0.4%Old Dominion Freight Line Inc. . . . . . . . . . . . . . . . . . . . . . . . . 321,692 86,583,402
Semiconductors & Semiconductor Equipment — 7.9%Applied Materials Inc. . . . . . . . . . . . . . . . . . . . . . . . . . . . . . . . . . 1,284,552 179,747,362Intel Corp. . . . . . . . . . . . . . . . . . . . . . . . . . . . . . . . . . . . . . . . . . . . . 5,806,870 311,945,057
Security s Value
Semiconductors & Semiconductor Equipment (continued)KLA Corp. . . . . . . . . . . . . . . . . . . . . . . . . . . . . . . . . . . . . . . . . . . . . 255,552 $ 88,972,984Lam Research Corp.. . . . . . . . . . . . . . . . . . . . . . . . . . . . . . . . . . 231,280 147,420,185Maxim Integrated Products Inc.. . . . . . . . . . . . . . . . . . . . . . . . 412,985 41,261,331Monolithic Power Systems Inc. . . . . . . . . . . . . . . . . . . . . . . . . 58,212 26,152,323NVIDIA Corp. . . . . . . . . . . . . . . . . . . . . . . . . . . . . . . . . . . . . . . . . . 3,327,482 648,825,715Skyworks Solutions Inc. . . . . . . . . . . . . . . . . . . . . . . . . . . . . . . . 246,875 45,550,906Teradyne Inc. . . . . . . . . . . . . . . . . . . . . . . . . . . . . . . . . . . . . . . . . . 263,290 33,437,830Texas Instruments Inc. . . . . . . . . . . . . . . . . . . . . . . . . . . . . . . . . 1,728,743 329,532,991Xilinx Inc.. . . . . . . . . . . . . . . . . . . . . . . . . . . . . . . . . . . . . . . . . . . . . 336,323 50,394,638
1,903,241,322Software — 7.5%Adobe Inc.(a) . . . . . . . . . . . . . . . . . . . . . . . . . . . . . . . . . . . . . . . . . 788,496 490,152,768Autodesk Inc.(a). . . . . . . . . . . . . . . . . . . . . . . . . . . . . . . . . . . . . . . 278,352 89,387,178Bentley Systems Inc., Class B(c) . . . . . . . . . . . . . . . . . . . . . . . 284,002 17,270,162Cadence Design Systems Inc.(a). . . . . . . . . . . . . . . . . . . . . . . 408,633 60,334,662Fair Isaac Corp.(a) . . . . . . . . . . . . . . . . . . . . . . . . . . . . . . . . . . . . 51,692 27,081,956Fortinet Inc.(a) . . . . . . . . . . . . . . . . . . . . . . . . . . . . . . . . . . . . . . . . 221,111 60,195,259Intuit Inc. . . . . . . . . . . . . . . . . . . . . . . . . . . . . . . . . . . . . . . . . . . . . . 349,933 185,453,992Microsoft Corp. . . . . . . . . . . . . . . . . . . . . . . . . . . . . . . . . . . . . . . . 2,978,441 848,587,625Paycom Software Inc.(a). . . . . . . . . . . . . . . . . . . . . . . . . . . . . . . 68,777 27,510,800
1,805,974,402Specialty Retail — 1.1%Best Buy Co. Inc. . . . . . . . . . . . . . . . . . . . . . . . . . . . . . . . . . . . . . 1,338,375 150,366,431Tractor Supply Co. . . . . . . . . . . . . . . . . . . . . . . . . . . . . . . . . . . . . 601,650 108,856,535
259,222,966Technology Hardware, Storage & Peripherals — 3.6%Apple Inc. . . . . . . . . . . . . . . . . . . . . . . . . . . . . . . . . . . . . . . . . . . . . 5,783,475 843,577,664Seagate Technology Holdings PLC . . . . . . . . . . . . . . . . . . . . 356,210 31,310,859
874,888,523Textiles, Apparel & Luxury Goods — 5.2%Lululemon Athletica Inc.(a) . . . . . . . . . . . . . . . . . . . . . . . . . . . . . 667,523 267,122,679Nike Inc., Class B. . . . . . . . . . . . . . . . . . . . . . . . . . . . . . . . . . . . . 5,791,333 970,106,191
1,237,228,870Trading Companies & Distributors — 0.8%Fastenal Co. . . . . . . . . . . . . . . . . . . . . . . . . . . . . . . . . . . . . . . . . . 2,242,302 122,810,881WW Grainger Inc.. . . . . . . . . . . . . . . . . . . . . . . . . . . . . . . . . . . . . 173,737 77,239,995
200,050,876
Total Common Stocks — 99.7%(Cost: $18,562,876,979) . . . . . . . . . . . . . . . . . . . . . . . . . . . . . . . . . . . . . . . . 23,901,236,037
Short-Term InvestmentsMoney Market Funds — 0.3%BlackRock Cash Funds: Institutional, SL Agency
Shares, 0.06%(b)(d)(e) . . . . . . . . . . . . . . . . . . . . . . . . . . . . . . . 14,391,430 14,398,626BlackRock Cash Funds: Treasury, SL Agency Shares,
0.00%(b)(d) . . . . . . . . . . . . . . . . . . . . . . . . . . . . . . . . . . . . . . . . . 52,210,000 52,210,000
66,608,626
Total Short-Term Investments — 0.3%(Cost: $66,606,660) . . . . . . . . . . . . . . . . . . . . . . . . . . . . . . . . . . . . . . . . . . . . 66,608,626
Total Investments in Securities — 100.0%(Cost: $18,629,483,639) . . . . . . . . . . . . . . . . . . . . . . . . . . . . . . . . . . . . . . . . 23,967,844,663
Other Assets, Less Liabilities — (0.0)%. . . . . . . . . . . . . . . . . . . . . . . . . . . (1,015,141)
Net Assets — 100.0% . . . . . . . . . . . . . . . . . . . . . . . . . . . . . . . . . . . . . . . . . . . . . $ 23,966,829,522
(a) Non-income producing security.
Schedule of Investments (continued)
July 31, 2021
iShares� MSCI USA Quality Factor ETF(Percentages shown are based on Net Assets)
S C H E D U L E O F I N V E S T M E N T S 53
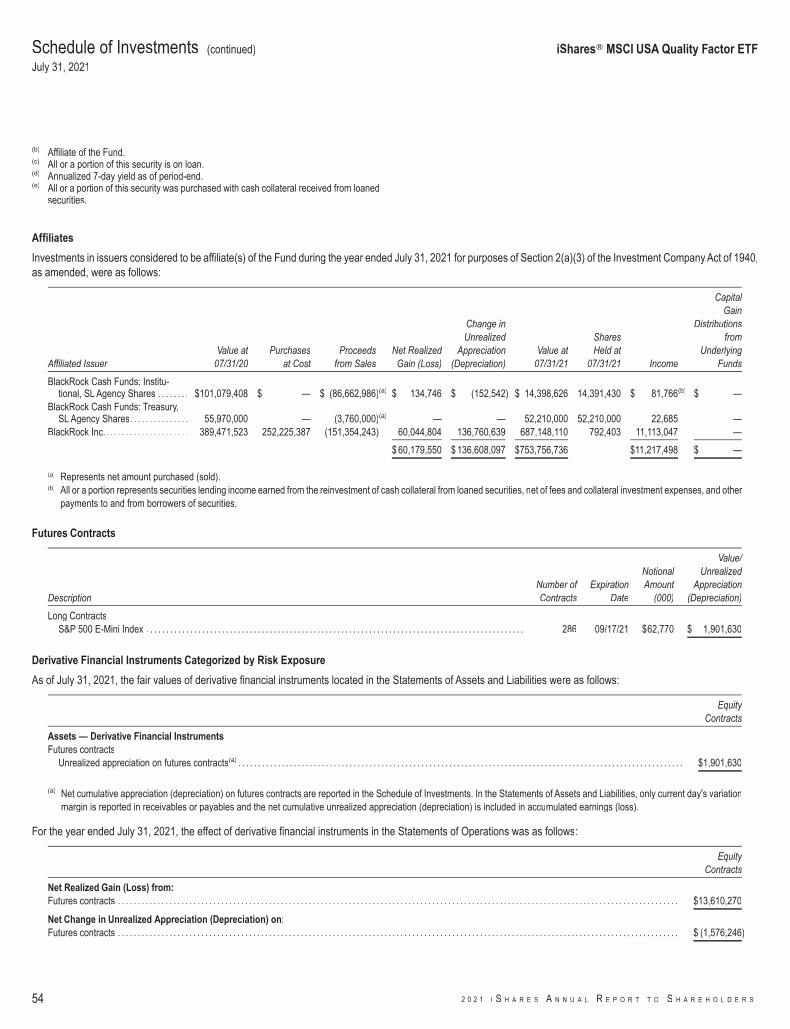
(b) Affiliate of the Fund.(c) All or a portion of this security is on loan.(d) Annualized 7-day yield as of period-end.(e) All or a portion of this security was purchased with cash collateral received from loaned
securities.
Affiliates
Investments in issuers considered to be affiliate(s) of the Fund during the year ended July 31, 2021 for purposes of Section 2(a)(3) of the Investment Company Act of 1940,as amended, were as follows:
Affiliated IssuerValue at
07/31/20Purchases
at CostProceeds
from SalesNet Realized
Gain (Loss)
Change inUnrealized
Appreciation(Depreciation)
Value at07/31/21
SharesHeld at
07/31/21 Income
CapitalGain
Distributionsfrom
UnderlyingFunds
BlackRock Cash Funds: Institu-tional, SL Agency Shares . . . . . . . . $101,079,408 $ — $ (86,662,986)(a) $ 134,746 $ (152,542) $ 14,398,626 14,391,430 $ 81,766(b) $ —
BlackRock Cash Funds: Treasury,SL Agency Shares. . . . . . . . . . . . . . . 55,970,000 — (3,760,000)(a) — — 52,210,000 52,210,000 22,685 —
BlackRock Inc.. . . . . . . . . . . . . . . . . . . . . 389,471,523 252,225,387 (151,354,243) 60,044,804 136,760,639 687,148,110 792,403 11,113,047 —
$ 60,179,550 $ 136,608,097 $753,756,736 $11,217,498 $ —
(a) Represents net amount purchased (sold).(b) All or a portion represents securities lending income earned from the reinvestment of cash collateral from loaned securities, net of fees and collateral investment expenses, and other
payments to and from borrowers of securities.
Futures Contracts
DescriptionNumber ofContracts
ExpirationDate
NotionalAmount
(000)
Value/Unrealized
Appreciation(Depreciation)
Long ContractsS&P 500 E-Mini Index . . . . . . . . . . . . . . . . . . . . . . . . . . . . . . . . . . . . . . . . . . . . . . . . . . . . . . . . . . . . . . . . . . . . . . . . . . . . . . . . . . . . . . . . . . . . . . . 286 09/17/21 $62,770 $ 1,901,630
Derivative Financial Instruments Categorized by Risk Exposure
As of July 31, 2021, the fair values of derivative financial instruments located in the Statements of Assets and Liabilities were as follows:
EquityContracts
Assets — Derivative Financial InstrumentsFutures contracts
Unrealized appreciation on futures contracts(a) . . . . . . . . . . . . . . . . . . . . . . . . . . . . . . . . . . . . . . . . . . . . . . . . . . . . . . . . . . . . . . . . . . . . . . . . . . . . . . . . . . . . . . . . . . . . . . . . . . . . . . . . . . . . . . . . $1,901,630
(a) Net cumulative appreciation (depreciation) on futures contracts are reported in the Schedule of Investments. In the Statements of Assets and Liabilities, only current day's variationmargin is reported in receivables or payables and the net cumulative unrealized appreciation (depreciation) is included in accumulated earnings (loss).
For the year ended July 31, 2021, the effect of derivative financial instruments in the Statements of Operations was as follows:
EquityContracts
Net Realized Gain (Loss) from:Futures contracts . . . . . . . . . . . . . . . . . . . . . . . . . . . . . . . . . . . . . . . . . . . . . . . . . . . . . . . . . . . . . . . . . . . . . . . . . . . . . . . . . . . . . . . . . . . . . . . . . . . . . . . . . . . . . . . . . . . . . . . . . . . . . . . . . . . . . . . . . . . . . $13,610,270
Net Change in Unrealized Appreciation (Depreciation) on:Futures contracts . . . . . . . . . . . . . . . . . . . . . . . . . . . . . . . . . . . . . . . . . . . . . . . . . . . . . . . . . . . . . . . . . . . . . . . . . . . . . . . . . . . . . . . . . . . . . . . . . . . . . . . . . . . . . . . . . . . . . . . . . . . . . . . . . . . . . . . . . . . . . $ (1,576,246)
Schedule of Investments (continued)
July 31, 2021
iShares� MSCI USA Quality Factor ETF
54 2 0 2 1 I S H A R E S A N N U A L R E P O R T T O S H A R E H O L D E R S
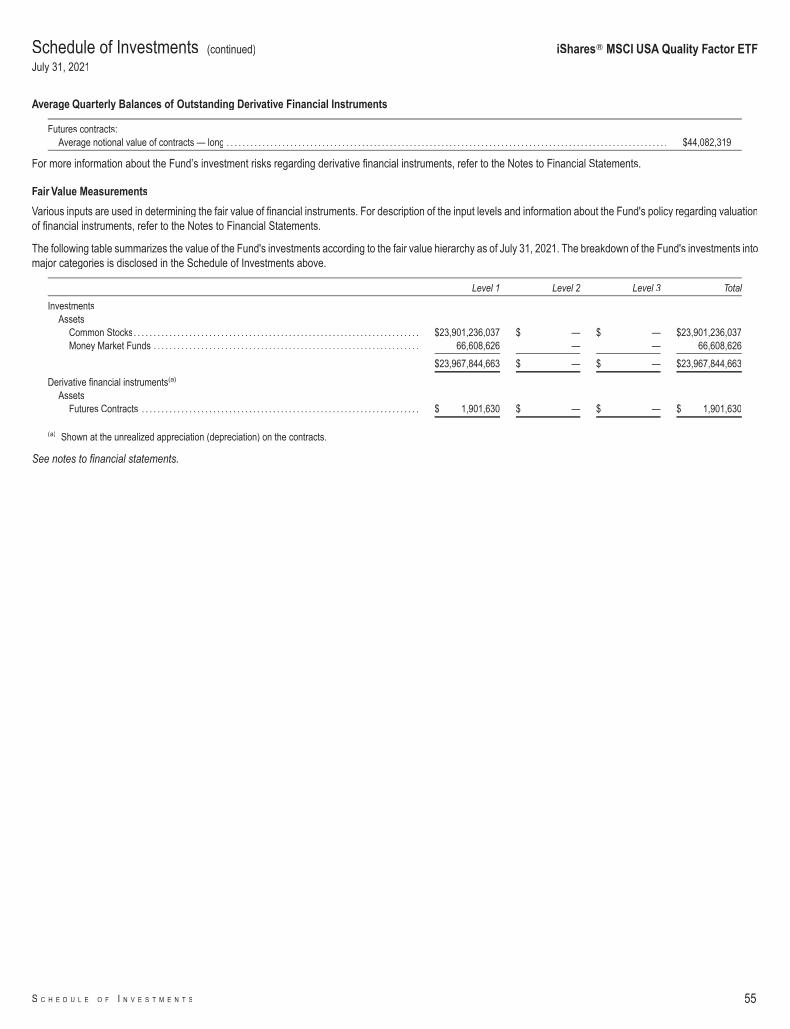
Average Quarterly Balances of Outstanding Derivative Financial Instruments
Futures contracts:Average notional value of contracts — long . . . . . . . . . . . . . . . . . . . . . . . . . . . . . . . . . . . . . . . . . . . . . . . . . . . . . . . . . . . . . . . . . . . . . . . . . . . . . . . . . . . . . . . . . . . . . . . . . . . . . . . . . . . . . . . $44,082,319
For more information about the Fund’s investment risks regarding derivative financial instruments, refer to the Notes to Financial Statements.
Fair Value Measurements
Various inputs are used in determining the fair value of financial instruments. For description of the input levels and information about the Fund's policy regarding valuationof financial instruments, refer to the Notes to Financial Statements.
The following table summarizes the value of the Fund's investments according to the fair value hierarchy as of July 31, 2021. The breakdown of the Fund's investments intomajor categories is disclosed in the Schedule of Investments above.
Level 1 Level 2 Level 3 Total
InvestmentsAssets
Common Stocks. . . . . . . . . . . . . . . . . . . . . . . . . . . . . . . . . . . . . . . . . . . . . . . . . . . . . . . . . . . . . . . . . . . . . . . . $23,901,236,037 $ — $ — $23,901,236,037Money Market Funds . . . . . . . . . . . . . . . . . . . . . . . . . . . . . . . . . . . . . . . . . . . . . . . . . . . . . . . . . . . . . . . . . . . 66,608,626 — — 66,608,626
$23,967,844,663 $ — $ — $23,967,844,663
Derivative financial instruments(a)
AssetsFutures Contracts . . . . . . . . . . . . . . . . . . . . . . . . . . . . . . . . . . . . . . . . . . . . . . . . . . . . . . . . . . . . . . . . . . . . . . $ 1,901,630 $ — $ — $ 1,901,630
(a) Shown at the unrealized appreciation (depreciation) on the contracts.
See notes to financial statements.
Schedule of Investments (continued)
July 31, 2021
iShares� MSCI USA Quality Factor ETF
S C H E D U L E O F I N V E S T M E N T S 55

Security s Value
Common StocksAerospace & Defense — 1.9%Boeing Co. (The)(a) . . . . . . . . . . . . . . . . . . . . . . . . . . . . . . . . . . . . . . 4,338 $ 982,470General Dynamics Corp. . . . . . . . . . . . . . . . . . . . . . . . . . . . . . . . . . 5,339 1,046,604HEICO Corp. . . . . . . . . . . . . . . . . . . . . . . . . . . . . . . . . . . . . . . . . . . . . 3,139 424,550HEICO Corp., Class A . . . . . . . . . . . . . . . . . . . . . . . . . . . . . . . . . . . 5,309 643,928Howmet Aerospace Inc.(a) . . . . . . . . . . . . . . . . . . . . . . . . . . . . . . . . 31,955 1,048,763Huntington Ingalls Industries Inc. . . . . . . . . . . . . . . . . . . . . . . . . . 5,084 1,042,881L3Harris Technologies Inc. . . . . . . . . . . . . . . . . . . . . . . . . . . . . . . . 4,720 1,070,213Lockheed Martin Corp. . . . . . . . . . . . . . . . . . . . . . . . . . . . . . . . . . . . 2,537 942,927Northrop Grumman Corp. . . . . . . . . . . . . . . . . . . . . . . . . . . . . . . . . 2,727 989,955Raytheon Technologies Corp. . . . . . . . . . . . . . . . . . . . . . . . . . . . . 11,381 989,578Teledyne Technologies Inc.(a) . . . . . . . . . . . . . . . . . . . . . . . . . . . . . 2,558 1,158,186Textron Inc.. . . . . . . . . . . . . . . . . . . . . . . . . . . . . . . . . . . . . . . . . . . . . . 15,806 1,090,772TransDigm Group Inc.(a) . . . . . . . . . . . . . . . . . . . . . . . . . . . . . . . . . 1,754 1,124,472
12,555,299Air Freight & Logistics — 0.7%CH Robinson Worldwide Inc. . . . . . . . . . . . . . . . . . . . . . . . . . . . . . 10,972 978,373Expeditors International of Washington Inc. . . . . . . . . . . . . . . . 8,803 1,128,985FedEx Corp.. . . . . . . . . . . . . . . . . . . . . . . . . . . . . . . . . . . . . . . . . . . . . 3,241 907,318United Parcel Service Inc., Class B . . . . . . . . . . . . . . . . . . . . . . . 4,485 858,249XPO Logistics Inc.(a) . . . . . . . . . . . . . . . . . . . . . . . . . . . . . . . . . . . . . 7,468 1,035,737
4,908,662Airlines — 0.3%Delta Air Lines Inc.(a). . . . . . . . . . . . . . . . . . . . . . . . . . . . . . . . . . . . . 22,339 891,326Southwest Airlines Co.(a) . . . . . . . . . . . . . . . . . . . . . . . . . . . . . . . . . 16,660 841,663
1,732,989Auto Components — 0.7%Aptiv PLC(a) . . . . . . . . . . . . . . . . . . . . . . . . . . . . . . . . . . . . . . . . . . . . . 7,447 1,242,532Autoliv Inc. . . . . . . . . . . . . . . . . . . . . . . . . . . . . . . . . . . . . . . . . . . . . . . 10,837 1,093,237BorgWarner Inc. . . . . . . . . . . . . . . . . . . . . . . . . . . . . . . . . . . . . . . . . . 20,975 1,027,355Lear Corp.. . . . . . . . . . . . . . . . . . . . . . . . . . . . . . . . . . . . . . . . . . . . . . . 5,889 1,030,457
4,393,581Automobiles — 0.5%Ford Motor Co.(a) . . . . . . . . . . . . . . . . . . . . . . . . . . . . . . . . . . . . . . . . 84,369 1,176,947General Motors Co.(a) . . . . . . . . . . . . . . . . . . . . . . . . . . . . . . . . . . . . 18,000 1,023,120Tesla Inc.(a). . . . . . . . . . . . . . . . . . . . . . . . . . . . . . . . . . . . . . . . . . . . . . 1,618 1,111,890
3,311,957Banks — 2.0%Bank of America Corp. . . . . . . . . . . . . . . . . . . . . . . . . . . . . . . . . . . . 22,123 848,638Citigroup Inc. . . . . . . . . . . . . . . . . . . . . . . . . . . . . . . . . . . . . . . . . . . . . 12,621 853,432Citizens Financial Group Inc. . . . . . . . . . . . . . . . . . . . . . . . . . . . . . 20,862 879,542Fifth Third Bancorp. . . . . . . . . . . . . . . . . . . . . . . . . . . . . . . . . . . . . . . 24,324 882,718First Republic Bank/CA . . . . . . . . . . . . . . . . . . . . . . . . . . . . . . . . . . 5,477 1,068,125Huntington Bancshares Inc./OH . . . . . . . . . . . . . . . . . . . . . . . . . . 67,259 947,007JPMorgan Chase & Co. . . . . . . . . . . . . . . . . . . . . . . . . . . . . . . . . . . 5,682 862,414KeyCorp . . . . . . . . . . . . . . . . . . . . . . . . . . . . . . . . . . . . . . . . . . . . . . . . 44,902 882,773M&T Bank Corp. . . . . . . . . . . . . . . . . . . . . . . . . . . . . . . . . . . . . . . . . . 6,339 848,475PNC Financial Services Group Inc. (The) . . . . . . . . . . . . . . . . . 5,058 922,630Regions Financial Corp.. . . . . . . . . . . . . . . . . . . . . . . . . . . . . . . . . . 45,163 869,388SVB Financial Group(a)(b). . . . . . . . . . . . . . . . . . . . . . . . . . . . . . . . . 1,817 999,277Truist Financial Corp. . . . . . . . . . . . . . . . . . . . . . . . . . . . . . . . . . . . . 16,140 878,500U.S. Bancorp. . . . . . . . . . . . . . . . . . . . . . . . . . . . . . . . . . . . . . . . . . . . 16,019 889,695Wells Fargo & Co. . . . . . . . . . . . . . . . . . . . . . . . . . . . . . . . . . . . . . . . 20,235 929,596
13,562,210Beverages — 1.1%Boston Beer Co. Inc. (The), Class A, NVS(a). . . . . . . . . . . . . . . 979 695,090Brown-Forman Corp., Class B, NVS . . . . . . . . . . . . . . . . . . . . . . 13,279 941,747Coca-Cola Co. (The) . . . . . . . . . . . . . . . . . . . . . . . . . . . . . . . . . . . . . 17,594 1,003,386
Security s Value
Beverages (continued)Constellation Brands Inc., Class A . . . . . . . . . . . . . . . . . . . . . . . . 4,361 $ 978,347Keurig Dr Pepper Inc. . . . . . . . . . . . . . . . . . . . . . . . . . . . . . . . . . . . . 28,572 1,006,020Molson Coors Beverage Co., Class B(a) . . . . . . . . . . . . . . . . . . . 18,693 913,901Monster Beverage Corp.(a) . . . . . . . . . . . . . . . . . . . . . . . . . . . . . . . 11,263 1,062,326PepsiCo Inc.. . . . . . . . . . . . . . . . . . . . . . . . . . . . . . . . . . . . . . . . . . . . . 6,630 1,040,578
7,641,395Biotechnology — 2.6%AbbVie Inc. . . . . . . . . . . . . . . . . . . . . . . . . . . . . . . . . . . . . . . . . . . . . . . 8,287 963,778Alnylam Pharmaceuticals Inc.(a) . . . . . . . . . . . . . . . . . . . . . . . . . . 7,919 1,417,026Amgen Inc. . . . . . . . . . . . . . . . . . . . . . . . . . . . . . . . . . . . . . . . . . . . . . . 3,895 940,798Biogen Inc.(a) . . . . . . . . . . . . . . . . . . . . . . . . . . . . . . . . . . . . . . . . . . . . 3,689 1,205,307BioMarin Pharmaceutical Inc.(a) . . . . . . . . . . . . . . . . . . . . . . . . . . 13,953 1,070,614Exact Sciences Corp.(a) . . . . . . . . . . . . . . . . . . . . . . . . . . . . . . . . . . 11,367 1,225,817Gilead Sciences Inc. . . . . . . . . . . . . . . . . . . . . . . . . . . . . . . . . . . . . . 14,565 994,644Horizon Therapeutics PLC(a) . . . . . . . . . . . . . . . . . . . . . . . . . . . . . 11,294 1,129,626Incyte Corp.(a) . . . . . . . . . . . . . . . . . . . . . . . . . . . . . . . . . . . . . . . . . . . 13,033 1,008,103Moderna Inc.(a) . . . . . . . . . . . . . . . . . . . . . . . . . . . . . . . . . . . . . . . . . . 6,319 2,234,398Neurocrine Biosciences Inc.(a) . . . . . . . . . . . . . . . . . . . . . . . . . . . . 11,876 1,106,962Novavax Inc.(a)(b) . . . . . . . . . . . . . . . . . . . . . . . . . . . . . . . . . . . . . . . . 7,843 1,406,485Regeneron Pharmaceuticals Inc.(a) . . . . . . . . . . . . . . . . . . . . . . . 1,950 1,120,489Seagen Inc.(a) . . . . . . . . . . . . . . . . . . . . . . . . . . . . . . . . . . . . . . . . . . . 7,125 1,092,904Vertex Pharmaceuticals Inc.(a) . . . . . . . . . . . . . . . . . . . . . . . . . . . . 4,719 951,256
17,868,207Building Products — 1.4%A O Smith Corp. . . . . . . . . . . . . . . . . . . . . . . . . . . . . . . . . . . . . . . . . . 15,419 1,084,418Allegion PLC . . . . . . . . . . . . . . . . . . . . . . . . . . . . . . . . . . . . . . . . . . . . 7,822 1,068,485Carrier Global Corp. . . . . . . . . . . . . . . . . . . . . . . . . . . . . . . . . . . . . . 23,416 1,293,734Fortune Brands Home & Security Inc. . . . . . . . . . . . . . . . . . . . . . 10,114 985,812Johnson Controls International PLC . . . . . . . . . . . . . . . . . . . . . . 15,542 1,110,010Lennox International Inc. . . . . . . . . . . . . . . . . . . . . . . . . . . . . . . . . . 3,107 1,023,539Masco Corp.. . . . . . . . . . . . . . . . . . . . . . . . . . . . . . . . . . . . . . . . . . . . . 16,768 1,001,217Owens Corning . . . . . . . . . . . . . . . . . . . . . . . . . . . . . . . . . . . . . . . . . . 10,250 985,640Trane Technologies PLC . . . . . . . . . . . . . . . . . . . . . . . . . . . . . . . . . 5,615 1,143,270
9,696,125Capital Markets — 4.4%Ameriprise Financial Inc. . . . . . . . . . . . . . . . . . . . . . . . . . . . . . . . . . 4,068 1,047,754Apollo Global Management Inc., Class A . . . . . . . . . . . . . . . . . . 18,931 1,114,279Bank of New York Mellon Corp. (The) . . . . . . . . . . . . . . . . . . . . . 19,711 1,011,766BlackRock Inc.(c). . . . . . . . . . . . . . . . . . . . . . . . . . . . . . . . . . . . . . . . . 1,159 1,005,050Blackstone Group Inc. (The), NVS . . . . . . . . . . . . . . . . . . . . . . . . 11,572 1,333,904Carlyle Group Inc. (The) . . . . . . . . . . . . . . . . . . . . . . . . . . . . . . . . . 25,031 1,263,315Cboe Global Markets Inc. . . . . . . . . . . . . . . . . . . . . . . . . . . . . . . . . 9,627 1,140,511Charles Schwab Corp. (The) . . . . . . . . . . . . . . . . . . . . . . . . . . . . . 13,444 913,520CME Group Inc. . . . . . . . . . . . . . . . . . . . . . . . . . . . . . . . . . . . . . . . . . 4,642 984,707FactSet Research Systems Inc. . . . . . . . . . . . . . . . . . . . . . . . . . . 3,323 1,187,241Franklin Resources Inc. . . . . . . . . . . . . . . . . . . . . . . . . . . . . . . . . . . 30,845 911,470Goldman Sachs Group Inc. (The). . . . . . . . . . . . . . . . . . . . . . . . . 2,681 1,005,053Intercontinental Exchange Inc.. . . . . . . . . . . . . . . . . . . . . . . . . . . . 9,010 1,079,668Invesco Ltd. . . . . . . . . . . . . . . . . . . . . . . . . . . . . . . . . . . . . . . . . . . . . . 38,996 950,723KKR & Co. Inc. . . . . . . . . . . . . . . . . . . . . . . . . . . . . . . . . . . . . . . . . . . 18,780 1,197,413MarketAxess Holdings Inc. . . . . . . . . . . . . . . . . . . . . . . . . . . . . . . . 2,353 1,118,075Moody's Corp. . . . . . . . . . . . . . . . . . . . . . . . . . . . . . . . . . . . . . . . . . . . 3,083 1,159,208Morgan Stanley. . . . . . . . . . . . . . . . . . . . . . . . . . . . . . . . . . . . . . . . . . 11,071 1,062,595MSCI Inc., Class A. . . . . . . . . . . . . . . . . . . . . . . . . . . . . . . . . . . . . . . 2,268 1,351,637Nasdaq Inc. . . . . . . . . . . . . . . . . . . . . . . . . . . . . . . . . . . . . . . . . . . . . . 6,409 1,196,753Northern Trust Corp. . . . . . . . . . . . . . . . . . . . . . . . . . . . . . . . . . . . . . 8,764 989,017Raymond James Financial Inc. . . . . . . . . . . . . . . . . . . . . . . . . . . . 7,965 1,031,308S&P Global Inc.. . . . . . . . . . . . . . . . . . . . . . . . . . . . . . . . . . . . . . . . . . 2,670 1,144,682SEI Investments Co. . . . . . . . . . . . . . . . . . . . . . . . . . . . . . . . . . . . . . 17,462 1,061,690
Schedule of InvestmentsJuly 31, 2021
iShares� MSCI USA Size Factor ETF(Percentages shown are based on Net Assets)
56 2 0 2 1 I S H A R E S A N N U A L R E P O R T T O S H A R E H O L D E R S

Security s Value
Capital Markets (continued)State Street Corp. . . . . . . . . . . . . . . . . . . . . . . . . . . . . . . . . . . . . . . . 12,087 $ 1,053,261T Rowe Price Group Inc. . . . . . . . . . . . . . . . . . . . . . . . . . . . . . . . . . 5,375 1,097,360Tradeweb Markets Inc., Class A . . . . . . . . . . . . . . . . . . . . . . . . . . 12,773 1,107,802
29,519,762Chemicals — 2.5%Air Products & Chemicals Inc. . . . . . . . . . . . . . . . . . . . . . . . . . . . . 3,359 977,570Albemarle Corp. . . . . . . . . . . . . . . . . . . . . . . . . . . . . . . . . . . . . . . . . . 6,748 1,390,358Celanese Corp., Class A . . . . . . . . . . . . . . . . . . . . . . . . . . . . . . . . . 6,298 981,039CF Industries Holdings Inc.. . . . . . . . . . . . . . . . . . . . . . . . . . . . . . . 19,904 940,464Corteva Inc. . . . . . . . . . . . . . . . . . . . . . . . . . . . . . . . . . . . . . . . . . . . . . 22,456 960,668Dow Inc. . . . . . . . . . . . . . . . . . . . . . . . . . . . . . . . . . . . . . . . . . . . . . . . . 14,381 893,923DuPont de Nemours Inc. . . . . . . . . . . . . . . . . . . . . . . . . . . . . . . . . . 12,032 903,002Eastman Chemical Co.. . . . . . . . . . . . . . . . . . . . . . . . . . . . . . . . . . . 8,273 932,533Ecolab Inc. . . . . . . . . . . . . . . . . . . . . . . . . . . . . . . . . . . . . . . . . . . . . . . 4,582 1,011,843FMC Corp. . . . . . . . . . . . . . . . . . . . . . . . . . . . . . . . . . . . . . . . . . . . . . . 9,070 970,037International Flavors & Fragrances Inc. . . . . . . . . . . . . . . . . . . . 7,264 1,094,249Linde PLC. . . . . . . . . . . . . . . . . . . . . . . . . . . . . . . . . . . . . . . . . . . . . . . 3,255 1,000,554LyondellBasell Industries NV, Class A. . . . . . . . . . . . . . . . . . . . . 8,946 888,606Mosaic Co. (The) . . . . . . . . . . . . . . . . . . . . . . . . . . . . . . . . . . . . . . . . 29,099 908,762PPG Industries Inc. . . . . . . . . . . . . . . . . . . . . . . . . . . . . . . . . . . . . . . 5,716 934,680RPM International Inc. . . . . . . . . . . . . . . . . . . . . . . . . . . . . . . . . . . . 11,217 971,280Sherwin-Williams Co. (The) . . . . . . . . . . . . . . . . . . . . . . . . . . . . . . 3,549 1,032,865
16,792,433Commercial Services & Supplies — 1.0%Cintas Corp. . . . . . . . . . . . . . . . . . . . . . . . . . . . . . . . . . . . . . . . . . . . . . 2,940 1,158,889Copart Inc.(a) . . . . . . . . . . . . . . . . . . . . . . . . . . . . . . . . . . . . . . . . . . . . 8,542 1,255,674Republic Services Inc., Class A. . . . . . . . . . . . . . . . . . . . . . . . . . . 9,424 1,115,425Rollins Inc. . . . . . . . . . . . . . . . . . . . . . . . . . . . . . . . . . . . . . . . . . . . . . . 29,695 1,138,210Waste Connections Inc. . . . . . . . . . . . . . . . . . . . . . . . . . . . . . . . . . . 8,586 1,087,760Waste Management Inc. . . . . . . . . . . . . . . . . . . . . . . . . . . . . . . . . . 7,208 1,068,658
6,824,616Communications Equipment — 0.9%Arista Networks Inc.(a) . . . . . . . . . . . . . . . . . . . . . . . . . . . . . . . . . . . 3,239 1,232,083Cisco Systems Inc. . . . . . . . . . . . . . . . . . . . . . . . . . . . . . . . . . . . . . . 18,313 1,013,991F5 Networks Inc.(a). . . . . . . . . . . . . . . . . . . . . . . . . . . . . . . . . . . . . . . 6,060 1,251,451Juniper Networks Inc. . . . . . . . . . . . . . . . . . . . . . . . . . . . . . . . . . . . . 41,497 1,167,725Motorola Solutions Inc.. . . . . . . . . . . . . . . . . . . . . . . . . . . . . . . . . . . 5,186 1,161,249
5,826,499Construction Materials — 0.3%Martin Marietta Materials Inc. . . . . . . . . . . . . . . . . . . . . . . . . . . . . . 2,814 1,022,326Vulcan Materials Co. . . . . . . . . . . . . . . . . . . . . . . . . . . . . . . . . . . . . . 5,475 985,445
2,007,771Consumer Finance — 0.8%Ally Financial Inc. . . . . . . . . . . . . . . . . . . . . . . . . . . . . . . . . . . . . . . . . 19,596 1,006,450American Express Co. . . . . . . . . . . . . . . . . . . . . . . . . . . . . . . . . . . . 6,279 1,070,758Capital One Financial Corp. . . . . . . . . . . . . . . . . . . . . . . . . . . . . . . 6,304 1,019,357Discover Financial Services . . . . . . . . . . . . . . . . . . . . . . . . . . . . . . 8,780 1,091,529Synchrony Financial . . . . . . . . . . . . . . . . . . . . . . . . . . . . . . . . . . . . . 22,333 1,050,098
5,238,192Containers & Packaging — 1.2%Amcor PLC. . . . . . . . . . . . . . . . . . . . . . . . . . . . . . . . . . . . . . . . . . . . . . 86,511 1,000,067Avery Dennison Corp.. . . . . . . . . . . . . . . . . . . . . . . . . . . . . . . . . . . . 4,850 1,021,798Ball Corp. . . . . . . . . . . . . . . . . . . . . . . . . . . . . . . . . . . . . . . . . . . . . . . . 11,791 953,656Crown Holdings Inc. . . . . . . . . . . . . . . . . . . . . . . . . . . . . . . . . . . . . . 9,697 967,373International Paper Co. . . . . . . . . . . . . . . . . . . . . . . . . . . . . . . . . . . 16,429 948,939Packaging Corp. of America . . . . . . . . . . . . . . . . . . . . . . . . . . . . . . 6,951 983,567Sealed Air Corp. . . . . . . . . . . . . . . . . . . . . . . . . . . . . . . . . . . . . . . . . . 19,569 1,110,541
Security s Value
Containers & Packaging (continued)Westrock Co. . . . . . . . . . . . . . . . . . . . . . . . . . . . . . . . . . . . . . . . . . . . . 17,359 $ 854,236
7,840,177Distributors — 0.5%Genuine Parts Co. . . . . . . . . . . . . . . . . . . . . . . . . . . . . . . . . . . . . . . . 8,040 1,020,437LKQ Corp.(a). . . . . . . . . . . . . . . . . . . . . . . . . . . . . . . . . . . . . . . . . . . . . 21,032 1,067,374Pool Corp.. . . . . . . . . . . . . . . . . . . . . . . . . . . . . . . . . . . . . . . . . . . . . . . 2,456 1,173,526
3,261,337Diversified Financial Services — 0.4%Berkshire Hathaway Inc., Class B(a) . . . . . . . . . . . . . . . . . . . . . . 3,196 889,415Equitable Holdings Inc.. . . . . . . . . . . . . . . . . . . . . . . . . . . . . . . . . . . 31,777 980,956Voya Financial Inc.. . . . . . . . . . . . . . . . . . . . . . . . . . . . . . . . . . . . . . . 16,066 1,034,650
2,905,021Diversified Telecommunication Services — 0.6%AT&T Inc. . . . . . . . . . . . . . . . . . . . . . . . . . . . . . . . . . . . . . . . . . . . . . . . 30,681 860,602Liberty Global PLC, Class A(a) . . . . . . . . . . . . . . . . . . . . . . . . . . . . 11,780 316,293Liberty Global PLC, Class C, NVS(a) . . . . . . . . . . . . . . . . . . . . . . 26,268 705,558Lumen Technologies Inc. . . . . . . . . . . . . . . . . . . . . . . . . . . . . . . . . . 73,699 919,027Verizon Communications Inc.. . . . . . . . . . . . . . . . . . . . . . . . . . . . . 16,577 924,665
3,726,145Electric Utilities — 2.5%Alliant Energy Corp. . . . . . . . . . . . . . . . . . . . . . . . . . . . . . . . . . . . . . 19,083 1,116,928American Electric Power Co. Inc. . . . . . . . . . . . . . . . . . . . . . . . . . 12,105 1,066,693Duke Energy Corp. . . . . . . . . . . . . . . . . . . . . . . . . . . . . . . . . . . . . . . 9,799 1,029,973Edison International. . . . . . . . . . . . . . . . . . . . . . . . . . . . . . . . . . . . . . 18,400 1,002,800Entergy Corp. . . . . . . . . . . . . . . . . . . . . . . . . . . . . . . . . . . . . . . . . . . . 10,041 1,033,420Evergy Inc. . . . . . . . . . . . . . . . . . . . . . . . . . . . . . . . . . . . . . . . . . . . . . . 17,357 1,132,023Eversource Energy . . . . . . . . . . . . . . . . . . . . . . . . . . . . . . . . . . . . . . 12,494 1,077,857Exelon Corp. . . . . . . . . . . . . . . . . . . . . . . . . . . . . . . . . . . . . . . . . . . . . 22,800 1,067,040FirstEnergy Corp. . . . . . . . . . . . . . . . . . . . . . . . . . . . . . . . . . . . . . . . . 28,134 1,078,095NextEra Energy Inc. . . . . . . . . . . . . . . . . . . . . . . . . . . . . . . . . . . . . . 13,643 1,062,790NRG Energy Inc. . . . . . . . . . . . . . . . . . . . . . . . . . . . . . . . . . . . . . . . . 32,272 1,330,897PG&E Corp.(a) . . . . . . . . . . . . . . . . . . . . . . . . . . . . . . . . . . . . . . . . . . . 97,575 857,684Pinnacle West Capital Corp.. . . . . . . . . . . . . . . . . . . . . . . . . . . . . . 12,828 1,071,779PPL Corp. . . . . . . . . . . . . . . . . . . . . . . . . . . . . . . . . . . . . . . . . . . . . . . . 36,218 1,027,505Southern Co. (The) . . . . . . . . . . . . . . . . . . . . . . . . . . . . . . . . . . . . . . 15,662 1,000,332Xcel Energy Inc. . . . . . . . . . . . . . . . . . . . . . . . . . . . . . . . . . . . . . . . . . 14,672 1,001,364
16,957,180Electrical Equipment — 1.4%AMETEK Inc. . . . . . . . . . . . . . . . . . . . . . . . . . . . . . . . . . . . . . . . . . . . . 7,821 1,087,510Eaton Corp. PLC . . . . . . . . . . . . . . . . . . . . . . . . . . . . . . . . . . . . . . . . 6,925 1,094,496Emerson Electric Co. . . . . . . . . . . . . . . . . . . . . . . . . . . . . . . . . . . . . 10,656 1,075,084Generac Holdings Inc.(a) . . . . . . . . . . . . . . . . . . . . . . . . . . . . . . . . . 3,626 1,520,599Plug Power Inc.(a)(b). . . . . . . . . . . . . . . . . . . . . . . . . . . . . . . . . . . . . . 43,469 1,185,834Rockwell Automation Inc. . . . . . . . . . . . . . . . . . . . . . . . . . . . . . . . . 3,943 1,212,157Sensata Technologies Holding PLC(a). . . . . . . . . . . . . . . . . . . . . 18,920 1,109,091Sunrun Inc.(a)(b) . . . . . . . . . . . . . . . . . . . . . . . . . . . . . . . . . . . . . . . . . . 27,686 1,466,528
9,751,299Electronic Equipment, Instruments & Components — 1.7%Amphenol Corp., Class A . . . . . . . . . . . . . . . . . . . . . . . . . . . . . . . . 15,596 1,130,554Arrow Electronics Inc.(a) . . . . . . . . . . . . . . . . . . . . . . . . . . . . . . . . . . 9,069 1,075,311CDW Corp./DE . . . . . . . . . . . . . . . . . . . . . . . . . . . . . . . . . . . . . . . . . . 6,228 1,141,904Cognex Corp. . . . . . . . . . . . . . . . . . . . . . . . . . . . . . . . . . . . . . . . . . . . 14,666 1,325,953Corning Inc. . . . . . . . . . . . . . . . . . . . . . . . . . . . . . . . . . . . . . . . . . . . . . 23,506 983,961IPG Photonics Corp.(a) . . . . . . . . . . . . . . . . . . . . . . . . . . . . . . . . . . . 5,588 1,219,078Keysight Technologies Inc.(a) . . . . . . . . . . . . . . . . . . . . . . . . . . . . . 7,530 1,239,061TE Connectivity Ltd. . . . . . . . . . . . . . . . . . . . . . . . . . . . . . . . . . . . . . 7,672 1,131,390Trimble Inc.(a). . . . . . . . . . . . . . . . . . . . . . . . . . . . . . . . . . . . . . . . . . . . 13,957 1,193,324
Schedule of Investments (continued)
July 31, 2021
iShares� MSCI USA Size Factor ETF(Percentages shown are based on Net Assets)
S C H E D U L E O F I N V E S T M E N T S 57

Security s Value
Electronic Equipment, Instruments & Components (continued)Zebra Technologies Corp., Class A(a) . . . . . . . . . . . . . . . . . . . . . 2,185 $ 1,207,169
11,647,705Energy Equipment & Services — 0.4%Baker Hughes Co., Class A . . . . . . . . . . . . . . . . . . . . . . . . . . . . . . 40,518 860,602Halliburton Co. . . . . . . . . . . . . . . . . . . . . . . . . . . . . . . . . . . . . . . . . . . 44,602 922,370Schlumberger Ltd. . . . . . . . . . . . . . . . . . . . . . . . . . . . . . . . . . . . . . . . 30,129 868,619
2,651,591Entertainment — 1.3%Activision Blizzard Inc. . . . . . . . . . . . . . . . . . . . . . . . . . . . . . . . . . . . 10,909 912,211Electronic Arts Inc. . . . . . . . . . . . . . . . . . . . . . . . . . . . . . . . . . . . . . . . 7,540 1,085,458Liberty Media Corp.-Liberty Formula One, Class C, NVS(a). 25,044 1,175,315Live Nation Entertainment Inc.(a). . . . . . . . . . . . . . . . . . . . . . . . . . 12,614 995,118Netflix Inc.(a) . . . . . . . . . . . . . . . . . . . . . . . . . . . . . . . . . . . . . . . . . . . . . 1,980 1,024,789Roku Inc.(a). . . . . . . . . . . . . . . . . . . . . . . . . . . . . . . . . . . . . . . . . . . . . . 3,305 1,415,565Take-Two Interactive Software Inc.(a). . . . . . . . . . . . . . . . . . . . . . 6,336 1,098,789Walt Disney Co. (The)(a). . . . . . . . . . . . . . . . . . . . . . . . . . . . . . . . . . 5,605 986,592
8,693,837Equity Real Estate Investment Trusts (REITs) — 6.0%Alexandria Real Estate Equities Inc. . . . . . . . . . . . . . . . . . . . . . . 6,107 1,229,583American Tower Corp. . . . . . . . . . . . . . . . . . . . . . . . . . . . . . . . . . . . 4,034 1,140,815AvalonBay Communities Inc. . . . . . . . . . . . . . . . . . . . . . . . . . . . . . 5,296 1,206,588Boston Properties Inc. . . . . . . . . . . . . . . . . . . . . . . . . . . . . . . . . . . . 9,722 1,141,168Camden Property Trust . . . . . . . . . . . . . . . . . . . . . . . . . . . . . . . . . . 8,853 1,322,550Crown Castle International Corp. . . . . . . . . . . . . . . . . . . . . . . . . . 5,548 1,071,263Digital Realty Trust Inc. . . . . . . . . . . . . . . . . . . . . . . . . . . . . . . . . . . 6,957 1,072,491Duke Realty Corp. . . . . . . . . . . . . . . . . . . . . . . . . . . . . . . . . . . . . . . . 23,846 1,213,285Equinix Inc.. . . . . . . . . . . . . . . . . . . . . . . . . . . . . . . . . . . . . . . . . . . . . . 1,419 1,164,162Equity LifeStyle Properties Inc. . . . . . . . . . . . . . . . . . . . . . . . . . . . 15,607 1,307,867Equity Residential . . . . . . . . . . . . . . . . . . . . . . . . . . . . . . . . . . . . . . . 14,163 1,191,533Essex Property Trust Inc. . . . . . . . . . . . . . . . . . . . . . . . . . . . . . . . . 3,714 1,218,563Extra Space Storage Inc.. . . . . . . . . . . . . . . . . . . . . . . . . . . . . . . . . 7,309 1,272,789Healthpeak Properties Inc. . . . . . . . . . . . . . . . . . . . . . . . . . . . . . . . 32,200 1,190,434Host Hotels & Resorts Inc.(a) . . . . . . . . . . . . . . . . . . . . . . . . . . . . . 62,367 993,506Invitation Homes Inc. . . . . . . . . . . . . . . . . . . . . . . . . . . . . . . . . . . . . 30,210 1,228,943Iron Mountain Inc. . . . . . . . . . . . . . . . . . . . . . . . . . . . . . . . . . . . . . . . 24,909 1,090,018Medical Properties Trust Inc. . . . . . . . . . . . . . . . . . . . . . . . . . . . . . 51,654 1,086,284Mid-America Apartment Communities Inc.. . . . . . . . . . . . . . . . . 6,789 1,310,956Omega Healthcare Investors Inc. . . . . . . . . . . . . . . . . . . . . . . . . . 30,647 1,111,873Prologis Inc. . . . . . . . . . . . . . . . . . . . . . . . . . . . . . . . . . . . . . . . . . . . . . 8,768 1,122,655Public Storage. . . . . . . . . . . . . . . . . . . . . . . . . . . . . . . . . . . . . . . . . . . 3,721 1,162,738Realty Income Corp. . . . . . . . . . . . . . . . . . . . . . . . . . . . . . . . . . . . . . 16,122 1,133,215Regency Centers Corp. . . . . . . . . . . . . . . . . . . . . . . . . . . . . . . . . . . 17,154 1,122,043SBA Communications Corp., Class A . . . . . . . . . . . . . . . . . . . . . 3,613 1,231,997Simon Property Group Inc. . . . . . . . . . . . . . . . . . . . . . . . . . . . . . . . 8,446 1,068,588Sun Communities Inc.. . . . . . . . . . . . . . . . . . . . . . . . . . . . . . . . . . . . 6,521 1,278,833UDR Inc. . . . . . . . . . . . . . . . . . . . . . . . . . . . . . . . . . . . . . . . . . . . . . . . . 23,372 1,285,226Ventas Inc. . . . . . . . . . . . . . . . . . . . . . . . . . . . . . . . . . . . . . . . . . . . . . . 19,646 1,174,438VEREIT Inc. . . . . . . . . . . . . . . . . . . . . . . . . . . . . . . . . . . . . . . . . . . . . . 24,223 1,186,200VICI Properties Inc. . . . . . . . . . . . . . . . . . . . . . . . . . . . . . . . . . . . . . . 34,318 1,070,379Vornado Realty Trust . . . . . . . . . . . . . . . . . . . . . . . . . . . . . . . . . . . . 23,872 1,038,432Welltower Inc. . . . . . . . . . . . . . . . . . . . . . . . . . . . . . . . . . . . . . . . . . . . 14,268 1,239,319Weyerhaeuser Co. . . . . . . . . . . . . . . . . . . . . . . . . . . . . . . . . . . . . . . . 27,459 926,192WP Carey Inc. . . . . . . . . . . . . . . . . . . . . . . . . . . . . . . . . . . . . . . . . . . . 14,658 1,182,754
40,787,680Food & Staples Retailing — 0.7%Costco Wholesale Corp. . . . . . . . . . . . . . . . . . . . . . . . . . . . . . . . . . 2,541 1,091,919Kroger Co. (The). . . . . . . . . . . . . . . . . . . . . . . . . . . . . . . . . . . . . . . . . 28,129 1,144,850Sysco Corp. . . . . . . . . . . . . . . . . . . . . . . . . . . . . . . . . . . . . . . . . . . . . . 12,305 913,031Walgreens Boots Alliance Inc. . . . . . . . . . . . . . . . . . . . . . . . . . . . . 18,521 873,265
Security s Value
Food & Staples Retailing (continued)Walmart Inc. . . . . . . . . . . . . . . . . . . . . . . . . . . . . . . . . . . . . . . . . . . . . . 6,787 $ 967,487
4,990,552Food Products — 2.0%Archer-Daniels-Midland Co. . . . . . . . . . . . . . . . . . . . . . . . . . . . . . . 15,296 913,477Bunge Ltd. . . . . . . . . . . . . . . . . . . . . . . . . . . . . . . . . . . . . . . . . . . . . . . 12,105 939,711Campbell Soup Co. . . . . . . . . . . . . . . . . . . . . . . . . . . . . . . . . . . . . . . 21,789 952,615Conagra Brands Inc. . . . . . . . . . . . . . . . . . . . . . . . . . . . . . . . . . . . . . 28,262 946,494General Mills Inc. . . . . . . . . . . . . . . . . . . . . . . . . . . . . . . . . . . . . . . . . 16,543 973,721Hershey Co. (The) . . . . . . . . . . . . . . . . . . . . . . . . . . . . . . . . . . . . . . . 6,026 1,077,931Hormel Foods Corp. . . . . . . . . . . . . . . . . . . . . . . . . . . . . . . . . . . . . . 22,604 1,048,374JM Smucker Co. (The) . . . . . . . . . . . . . . . . . . . . . . . . . . . . . . . . . . . 8,063 1,057,140Kellogg Co.. . . . . . . . . . . . . . . . . . . . . . . . . . . . . . . . . . . . . . . . . . . . . . 15,918 1,008,565Kraft Heinz Co. (The) . . . . . . . . . . . . . . . . . . . . . . . . . . . . . . . . . . . . 23,273 895,312Lamb Weston Holdings Inc. . . . . . . . . . . . . . . . . . . . . . . . . . . . . . . 13,996 934,513McCormick & Co. Inc./MD, NVS . . . . . . . . . . . . . . . . . . . . . . . . . . 11,885 1,000,361Mondelez International Inc., Class A . . . . . . . . . . . . . . . . . . . . . . 16,009 1,012,729Tyson Foods Inc., Class A. . . . . . . . . . . . . . . . . . . . . . . . . . . . . . . . 12,955 925,764
13,686,707Gas Utilities — 0.3%Atmos Energy Corp. . . . . . . . . . . . . . . . . . . . . . . . . . . . . . . . . . . . . . 11,039 1,088,335UGI Corp. . . . . . . . . . . . . . . . . . . . . . . . . . . . . . . . . . . . . . . . . . . . . . . . 25,020 1,150,670
2,239,005Health Care Equipment & Supplies — 4.3%Abbott Laboratories . . . . . . . . . . . . . . . . . . . . . . . . . . . . . . . . . . . . . . 8,291 1,003,045ABIOMED Inc.(a) . . . . . . . . . . . . . . . . . . . . . . . . . . . . . . . . . . . . . . . . . 4,057 1,327,207Align Technology Inc.(a) . . . . . . . . . . . . . . . . . . . . . . . . . . . . . . . . . . 1,842 1,281,664Baxter International Inc. . . . . . . . . . . . . . . . . . . . . . . . . . . . . . . . . . . 12,493 966,334Becton Dickinson and Co. . . . . . . . . . . . . . . . . . . . . . . . . . . . . . . . . 4,199 1,073,894Boston Scientific Corp.(a) . . . . . . . . . . . . . . . . . . . . . . . . . . . . . . . . . 24,355 1,110,588Cooper Companies Inc. (The) . . . . . . . . . . . . . . . . . . . . . . . . . . . . 2,743 1,156,915Danaher Corp.(b). . . . . . . . . . . . . . . . . . . . . . . . . . . . . . . . . . . . . . . . . 3,885 1,155,749DENTSPLY SIRONA Inc.. . . . . . . . . . . . . . . . . . . . . . . . . . . . . . . . . 15,605 1,030,554Dexcom Inc.(a) . . . . . . . . . . . . . . . . . . . . . . . . . . . . . . . . . . . . . . . . . . . 3,202 1,650,663Edwards Lifesciences Corp.(a) . . . . . . . . . . . . . . . . . . . . . . . . . . . . 11,387 1,278,419Hologic Inc.(a) . . . . . . . . . . . . . . . . . . . . . . . . . . . . . . . . . . . . . . . . . . . 17,180 1,289,187IDEXX Laboratories Inc.(a) . . . . . . . . . . . . . . . . . . . . . . . . . . . . . . . 1,961 1,330,597Insulet Corp.(a). . . . . . . . . . . . . . . . . . . . . . . . . . . . . . . . . . . . . . . . . . . 4,722 1,320,696Intuitive Surgical Inc.(a) . . . . . . . . . . . . . . . . . . . . . . . . . . . . . . . . . . . 1,220 1,209,581Masimo Corp.(a) . . . . . . . . . . . . . . . . . . . . . . . . . . . . . . . . . . . . . . . . . 5,101 1,389,461Medtronic PLC . . . . . . . . . . . . . . . . . . . . . . . . . . . . . . . . . . . . . . . . . . 7,776 1,021,067Novocure Ltd.(a)(b) . . . . . . . . . . . . . . . . . . . . . . . . . . . . . . . . . . . . . . . 6,095 938,691ResMed Inc.. . . . . . . . . . . . . . . . . . . . . . . . . . . . . . . . . . . . . . . . . . . . . 5,369 1,459,294STERIS PLC . . . . . . . . . . . . . . . . . . . . . . . . . . . . . . . . . . . . . . . . . . . . 5,464 1,190,879Stryker Corp. . . . . . . . . . . . . . . . . . . . . . . . . . . . . . . . . . . . . . . . . . . . . 3,965 1,074,277Teleflex Inc. . . . . . . . . . . . . . . . . . . . . . . . . . . . . . . . . . . . . . . . . . . . . . 2,724 1,082,599West Pharmaceutical Services Inc. . . . . . . . . . . . . . . . . . . . . . . . 3,234 1,331,535Zimmer Biomet Holdings Inc. . . . . . . . . . . . . . . . . . . . . . . . . . . . . . 6,290 1,027,912
28,700,808Health Care Providers & Services — 2.7%AmerisourceBergen Corp., Class A . . . . . . . . . . . . . . . . . . . . . . . 8,964 1,095,132Anthem Inc. . . . . . . . . . . . . . . . . . . . . . . . . . . . . . . . . . . . . . . . . . . . . . 2,528 970,777Cardinal Health Inc. . . . . . . . . . . . . . . . . . . . . . . . . . . . . . . . . . . . . . . 18,963 1,126,023Centene Corp.(a) . . . . . . . . . . . . . . . . . . . . . . . . . . . . . . . . . . . . . . . . . 14,702 1,008,704Cigna Corp. . . . . . . . . . . . . . . . . . . . . . . . . . . . . . . . . . . . . . . . . . . . . . 3,785 868,620CVS Health Corp.. . . . . . . . . . . . . . . . . . . . . . . . . . . . . . . . . . . . . . . . 11,779 970,118DaVita Inc.(a) . . . . . . . . . . . . . . . . . . . . . . . . . . . . . . . . . . . . . . . . . . . . 8,688 1,044,732HCA Healthcare Inc. . . . . . . . . . . . . . . . . . . . . . . . . . . . . . . . . . . . . . 4,824 1,197,317Henry Schein Inc.(a). . . . . . . . . . . . . . . . . . . . . . . . . . . . . . . . . . . . . . 13,509 1,082,746Humana Inc.. . . . . . . . . . . . . . . . . . . . . . . . . . . . . . . . . . . . . . . . . . . . . 2,265 964,573
Schedule of Investments (continued)
July 31, 2021
iShares� MSCI USA Size Factor ETF(Percentages shown are based on Net Assets)
58 2 0 2 1 I S H A R E S A N N U A L R E P O R T T O S H A R E H O L D E R S

Security s Value
Health Care Providers & Services (continued)Laboratory Corp. of America Holdings(a) . . . . . . . . . . . . . . . . . . 3,927 $ 1,162,981McKesson Corp. . . . . . . . . . . . . . . . . . . . . . . . . . . . . . . . . . . . . . . . . . 5,253 1,070,719Molina Healthcare Inc.(a) . . . . . . . . . . . . . . . . . . . . . . . . . . . . . . . . . 4,096 1,118,249Oak Street Health Inc.(a) . . . . . . . . . . . . . . . . . . . . . . . . . . . . . . . . . 18,789 1,184,459Quest Diagnostics Inc. . . . . . . . . . . . . . . . . . . . . . . . . . . . . . . . . . . . 8,087 1,146,737UnitedHealth Group Inc. . . . . . . . . . . . . . . . . . . . . . . . . . . . . . . . . . 2,319 955,938Universal Health Services Inc., Class B . . . . . . . . . . . . . . . . . . . 6,732 1,079,880
18,047,705Health Care Technology — 0.5%Cerner Corp. . . . . . . . . . . . . . . . . . . . . . . . . . . . . . . . . . . . . . . . . . . . . 13,861 1,114,286Teladoc Health Inc.(a)(b) . . . . . . . . . . . . . . . . . . . . . . . . . . . . . . . . . . 7,715 1,145,292Veeva Systems Inc., Class A(a) . . . . . . . . . . . . . . . . . . . . . . . . . . . 4,176 1,389,397
3,648,975Hotels, Restaurants & Leisure — 3.1%Airbnb Inc., Class A(a) . . . . . . . . . . . . . . . . . . . . . . . . . . . . . . . . . . . . 7,562 1,089,004Aramark. . . . . . . . . . . . . . . . . . . . . . . . . . . . . . . . . . . . . . . . . . . . . . . . . 28,318 994,811Booking Holdings Inc.(a) . . . . . . . . . . . . . . . . . . . . . . . . . . . . . . . . . . 460 1,002,000Caesars Entertainment Inc.(a) . . . . . . . . . . . . . . . . . . . . . . . . . . . . 10,563 922,784Carnival Corp.(a) . . . . . . . . . . . . . . . . . . . . . . . . . . . . . . . . . . . . . . . . . 38,165 826,272Chipotle Mexican Grill Inc., Class A(a) . . . . . . . . . . . . . . . . . . . . . 778 1,449,756Darden Restaurants Inc. . . . . . . . . . . . . . . . . . . . . . . . . . . . . . . . . . 7,678 1,120,067Domino's Pizza Inc. . . . . . . . . . . . . . . . . . . . . . . . . . . . . . . . . . . . . . . 2,486 1,306,368DraftKings Inc., Class A(a)(b) . . . . . . . . . . . . . . . . . . . . . . . . . . . . . . 24,556 1,190,966Expedia Group Inc.(a) . . . . . . . . . . . . . . . . . . . . . . . . . . . . . . . . . . . . 6,224 1,001,255Hilton Worldwide Holdings Inc.(a) . . . . . . . . . . . . . . . . . . . . . . . . . 8,576 1,127,315Las Vegas Sands Corp.(a) . . . . . . . . . . . . . . . . . . . . . . . . . . . . . . . . 18,087 765,984Marriott International Inc./MD, Class A(a) . . . . . . . . . . . . . . . . . . 7,338 1,071,201McDonald's Corp.. . . . . . . . . . . . . . . . . . . . . . . . . . . . . . . . . . . . . . . . 4,220 1,024,236MGM Resorts International . . . . . . . . . . . . . . . . . . . . . . . . . . . . . . . 27,452 1,030,274Royal Caribbean Cruises Ltd.(a) . . . . . . . . . . . . . . . . . . . . . . . . . . 12,519 962,335Starbucks Corp. . . . . . . . . . . . . . . . . . . . . . . . . . . . . . . . . . . . . . . . . . 8,867 1,076,720Vail Resorts Inc.(a) . . . . . . . . . . . . . . . . . . . . . . . . . . . . . . . . . . . . . . . 3,398 1,037,070Wynn Resorts Ltd.(a) . . . . . . . . . . . . . . . . . . . . . . . . . . . . . . . . . . . . . 8,675 853,013Yum! Brands Inc. . . . . . . . . . . . . . . . . . . . . . . . . . . . . . . . . . . . . . . . . 8,783 1,153,998
21,005,429Household Durables — 1.2%DR Horton Inc. . . . . . . . . . . . . . . . . . . . . . . . . . . . . . . . . . . . . . . . . . . 10,857 1,036,084Garmin Ltd. . . . . . . . . . . . . . . . . . . . . . . . . . . . . . . . . . . . . . . . . . . . . . 7,513 1,181,044Lennar Corp., Class A. . . . . . . . . . . . . . . . . . . . . . . . . . . . . . . . . . . . 10,650 1,119,847Mohawk Industries Inc.(a). . . . . . . . . . . . . . . . . . . . . . . . . . . . . . . . . 4,944 963,586Newell Brands Inc.. . . . . . . . . . . . . . . . . . . . . . . . . . . . . . . . . . . . . . . 36,930 914,017NVR Inc.(a) . . . . . . . . . . . . . . . . . . . . . . . . . . . . . . . . . . . . . . . . . . . . . . 223 1,164,640PulteGroup Inc. . . . . . . . . . . . . . . . . . . . . . . . . . . . . . . . . . . . . . . . . . . 18,617 1,021,515Whirlpool Corp. . . . . . . . . . . . . . . . . . . . . . . . . . . . . . . . . . . . . . . . . . . 4,382 970,788
8,371,521Household Products — 0.8%Church & Dwight Co. Inc. . . . . . . . . . . . . . . . . . . . . . . . . . . . . . . . . 12,000 1,038,960Clorox Co. (The) . . . . . . . . . . . . . . . . . . . . . . . . . . . . . . . . . . . . . . . . . 5,867 1,061,282Colgate-Palmolive Co. . . . . . . . . . . . . . . . . . . . . . . . . . . . . . . . . . . . 12,069 959,486Kimberly-Clark Corp.. . . . . . . . . . . . . . . . . . . . . . . . . . . . . . . . . . . . . 7,678 1,042,058Procter & Gamble Co. (The). . . . . . . . . . . . . . . . . . . . . . . . . . . . . . 6,927 985,227
5,087,013Independent Power and Renewable Electricity Producers — 0.3%AES Corp. (The) . . . . . . . . . . . . . . . . . . . . . . . . . . . . . . . . . . . . . . . . . 42,487 1,006,942Vistra Corp. . . . . . . . . . . . . . . . . . . . . . . . . . . . . . . . . . . . . . . . . . . . . . 69,380 1,328,627
2,335,569Industrial Conglomerates — 0.6%3M Co. . . . . . . . . . . . . . . . . . . . . . . . . . . . . . . . . . . . . . . . . . . . . . . . . . . 4,837 957,436
Security s Value
Industrial Conglomerates (continued)General Electric Co. . . . . . . . . . . . . . . . . . . . . . . . . . . . . . . . . . . . . . 75,147 $ 973,154Honeywell International Inc. . . . . . . . . . . . . . . . . . . . . . . . . . . . . . . 4,336 1,013,713Roper Technologies Inc. . . . . . . . . . . . . . . . . . . . . . . . . . . . . . . . . . 2,382 1,170,372
4,114,675Insurance — 4.6%Aflac Inc. . . . . . . . . . . . . . . . . . . . . . . . . . . . . . . . . . . . . . . . . . . . . . . . . 18,418 1,012,990Alleghany Corp.(a) . . . . . . . . . . . . . . . . . . . . . . . . . . . . . . . . . . . . . . . 1,535 1,017,858Allstate Corp. (The) . . . . . . . . . . . . . . . . . . . . . . . . . . . . . . . . . . . . . . 7,450 968,873American Financial Group Inc./OH. . . . . . . . . . . . . . . . . . . . . . . . 8,399 1,062,390American International Group Inc. . . . . . . . . . . . . . . . . . . . . . . . . 19,923 943,354Aon PLC, Class A. . . . . . . . . . . . . . . . . . . . . . . . . . . . . . . . . . . . . . . . 3,997 1,039,340Arch Capital Group Ltd.(a) . . . . . . . . . . . . . . . . . . . . . . . . . . . . . . . . 26,502 1,033,578Arthur J Gallagher & Co. . . . . . . . . . . . . . . . . . . . . . . . . . . . . . . . . . 7,155 996,763Assurant Inc. . . . . . . . . . . . . . . . . . . . . . . . . . . . . . . . . . . . . . . . . . . . . 6,785 1,070,741Athene Holding Ltd., Class A(a) . . . . . . . . . . . . . . . . . . . . . . . . . . . 17,460 1,128,265Brown & Brown Inc. . . . . . . . . . . . . . . . . . . . . . . . . . . . . . . . . . . . . . . 20,706 1,126,406Chubb Ltd. . . . . . . . . . . . . . . . . . . . . . . . . . . . . . . . . . . . . . . . . . . . . . . 6,000 1,012,440Cincinnati Financial Corp. . . . . . . . . . . . . . . . . . . . . . . . . . . . . . . . . 8,892 1,048,189Erie Indemnity Co., Class A, NVS. . . . . . . . . . . . . . . . . . . . . . . . . 5,363 991,565Everest Re Group Ltd. . . . . . . . . . . . . . . . . . . . . . . . . . . . . . . . . . . . 4,028 1,018,399Fidelity National Financial Inc. . . . . . . . . . . . . . . . . . . . . . . . . . . . . 23,128 1,031,740Globe Life Inc. . . . . . . . . . . . . . . . . . . . . . . . . . . . . . . . . . . . . . . . . . . . 10,294 958,474Hartford Financial Services Group Inc. (The) . . . . . . . . . . . . . . 16,032 1,019,956Lincoln National Corp. . . . . . . . . . . . . . . . . . . . . . . . . . . . . . . . . . . . 15,401 949,010Loews Corp.. . . . . . . . . . . . . . . . . . . . . . . . . . . . . . . . . . . . . . . . . . . . . 18,357 984,486Markel Corp.(a) . . . . . . . . . . . . . . . . . . . . . . . . . . . . . . . . . . . . . . . . . . 892 1,075,904Marsh & McLennan Companies Inc. . . . . . . . . . . . . . . . . . . . . . . 7,546 1,110,922MetLife Inc.. . . . . . . . . . . . . . . . . . . . . . . . . . . . . . . . . . . . . . . . . . . . . . 15,468 892,504Principal Financial Group Inc. . . . . . . . . . . . . . . . . . . . . . . . . . . . . 16,039 996,503Progressive Corp. (The). . . . . . . . . . . . . . . . . . . . . . . . . . . . . . . . . . 9,518 905,733Prudential Financial Inc.. . . . . . . . . . . . . . . . . . . . . . . . . . . . . . . . . . 9,527 955,368Reinsurance Group of America Inc. . . . . . . . . . . . . . . . . . . . . . . . 8,650 953,057RenaissanceRe Holdings Ltd. . . . . . . . . . . . . . . . . . . . . . . . . . . . . 7,136 1,089,596Travelers Companies Inc. (The) . . . . . . . . . . . . . . . . . . . . . . . . . . 6,458 961,725W R Berkley Corp. . . . . . . . . . . . . . . . . . . . . . . . . . . . . . . . . . . . . . . . 13,636 997,746Willis Towers Watson PLC. . . . . . . . . . . . . . . . . . . . . . . . . . . . . . . . 3,929 809,688
31,163,563Interactive Media & Services — 1.3%Alphabet Inc., Class A(a). . . . . . . . . . . . . . . . . . . . . . . . . . . . . . . . . . 196 528,128Alphabet Inc., Class C, NVS(a). . . . . . . . . . . . . . . . . . . . . . . . . . . . 194 524,657Facebook Inc., Class A(a). . . . . . . . . . . . . . . . . . . . . . . . . . . . . . . . . 2,907 1,035,764IAC/InterActiveCorp.(a)(b) . . . . . . . . . . . . . . . . . . . . . . . . . . . . . . . . . 4,716 647,460Match Group Inc.(a) . . . . . . . . . . . . . . . . . . . . . . . . . . . . . . . . . . . . . . 7,410 1,180,191Pinterest Inc., Class A(a). . . . . . . . . . . . . . . . . . . . . . . . . . . . . . . . . . 17,831 1,050,246Snap Inc., Class A, NVS(a) . . . . . . . . . . . . . . . . . . . . . . . . . . . . . . . 18,700 1,391,654Twitter Inc.(a) . . . . . . . . . . . . . . . . . . . . . . . . . . . . . . . . . . . . . . . . . . . . 19,599 1,367,030Zillow Group Inc., Class A(a) . . . . . . . . . . . . . . . . . . . . . . . . . . . . . . 2,665 285,501Zillow Group Inc., Class C, NVS(a) . . . . . . . . . . . . . . . . . . . . . . . . 6,819 724,587
8,735,218Internet & Direct Marketing Retail — 1.0%Amazon.com Inc.(a) . . . . . . . . . . . . . . . . . . . . . . . . . . . . . . . . . . . . . . 275 915,087Chewy Inc., Class A(a)(b) . . . . . . . . . . . . . . . . . . . . . . . . . . . . . . . . . 14,990 1,254,663eBay Inc. . . . . . . . . . . . . . . . . . . . . . . . . . . . . . . . . . . . . . . . . . . . . . . . . 16,703 1,139,312Etsy Inc.(a)(b). . . . . . . . . . . . . . . . . . . . . . . . . . . . . . . . . . . . . . . . . . . . . 6,435 1,180,887MercadoLibre Inc.(a)(b) . . . . . . . . . . . . . . . . . . . . . . . . . . . . . . . . . . . 772 1,211,036Wayfair Inc., Class A(a)(b) . . . . . . . . . . . . . . . . . . . . . . . . . . . . . . . . . 3,476 838,967
6,539,952IT Services — 4.2%Accenture PLC, Class A. . . . . . . . . . . . . . . . . . . . . . . . . . . . . . . . . . 3,398 1,079,477
Schedule of Investments (continued)
July 31, 2021
iShares� MSCI USA Size Factor ETF(Percentages shown are based on Net Assets)
S C H E D U L E O F I N V E S T M E N T S 59

Security s Value
IT Services (continued)Akamai Technologies Inc.(a) . . . . . . . . . . . . . . . . . . . . . . . . . . . . . . 9,393 $ 1,126,409Automatic Data Processing Inc. . . . . . . . . . . . . . . . . . . . . . . . . . . 5,146 1,078,756Broadridge Financial Solutions Inc. . . . . . . . . . . . . . . . . . . . . . . . 6,584 1,142,258Cognizant Technology Solutions Corp., Class A . . . . . . . . . . . 14,646 1,076,920EPAM Systems Inc.(a) . . . . . . . . . . . . . . . . . . . . . . . . . . . . . . . . . . . . 2,355 1,318,329Fidelity National Information Services Inc.. . . . . . . . . . . . . . . . . 6,693 997,592Fiserv Inc.(a) . . . . . . . . . . . . . . . . . . . . . . . . . . . . . . . . . . . . . . . . . . . . . 8,908 1,025,400FleetCor Technologies Inc.(a) . . . . . . . . . . . . . . . . . . . . . . . . . . . . . 3,893 1,005,250Gartner Inc.(a) . . . . . . . . . . . . . . . . . . . . . . . . . . . . . . . . . . . . . . . . . . . 4,639 1,228,082Global Payments Inc. . . . . . . . . . . . . . . . . . . . . . . . . . . . . . . . . . . . . 5,165 998,963GoDaddy Inc., Class A(a) . . . . . . . . . . . . . . . . . . . . . . . . . . . . . . . . . 13,286 1,114,031International Business Machines Corp. . . . . . . . . . . . . . . . . . . . 6,823 961,770Jack Henry & Associates Inc. . . . . . . . . . . . . . . . . . . . . . . . . . . . . . 6,950 1,209,926Mastercard Inc., Class A . . . . . . . . . . . . . . . . . . . . . . . . . . . . . . . . . 2,618 1,010,391MongoDB Inc., Class A(a)(b) . . . . . . . . . . . . . . . . . . . . . . . . . . . . . . 4,064 1,458,651Okta Inc.(a) . . . . . . . . . . . . . . . . . . . . . . . . . . . . . . . . . . . . . . . . . . . . . . 4,646 1,151,232Paychex Inc. . . . . . . . . . . . . . . . . . . . . . . . . . . . . . . . . . . . . . . . . . . . . 10,422 1,186,232PayPal Holdings Inc.(a) . . . . . . . . . . . . . . . . . . . . . . . . . . . . . . . . . . . 3,924 1,081,180Snowflake Inc., Class A(a) . . . . . . . . . . . . . . . . . . . . . . . . . . . . . . . . 4,831 1,283,693Square Inc., Class A(a)(b) . . . . . . . . . . . . . . . . . . . . . . . . . . . . . . . . . 4,924 1,217,508Twilio Inc., Class A(a). . . . . . . . . . . . . . . . . . . . . . . . . . . . . . . . . . . . . 3,453 1,290,006VeriSign Inc.(a). . . . . . . . . . . . . . . . . . . . . . . . . . . . . . . . . . . . . . . . . . . 4,791 1,036,629Visa Inc., Class A . . . . . . . . . . . . . . . . . . . . . . . . . . . . . . . . . . . . . . . . 4,139 1,019,808Western Union Co. (The). . . . . . . . . . . . . . . . . . . . . . . . . . . . . . . . . 43,909 1,019,128
28,117,621Leisure Products — 0.4%Hasbro Inc. . . . . . . . . . . . . . . . . . . . . . . . . . . . . . . . . . . . . . . . . . . . . . . 11,255 1,119,197Peloton Interactive Inc., Class A(a) . . . . . . . . . . . . . . . . . . . . . . . . 11,342 1,338,923
2,458,120Life Sciences Tools & Services — 2.5%10X Genomics Inc., Class A(a) . . . . . . . . . . . . . . . . . . . . . . . . . . . . 7,465 1,367,812Agilent Technologies Inc. . . . . . . . . . . . . . . . . . . . . . . . . . . . . . . . . . 7,971 1,221,396Avantor Inc.(a) . . . . . . . . . . . . . . . . . . . . . . . . . . . . . . . . . . . . . . . . . . . 34,653 1,302,260Bio-Rad Laboratories Inc., Class A(a). . . . . . . . . . . . . . . . . . . . . . 1,812 1,339,992Bio-Techne Corp. . . . . . . . . . . . . . . . . . . . . . . . . . . . . . . . . . . . . . . . . 2,780 1,340,627Charles River Laboratories International Inc.(a) . . . . . . . . . . . . 3,324 1,352,602Illumina Inc.(a) . . . . . . . . . . . . . . . . . . . . . . . . . . . . . . . . . . . . . . . . . . . 2,685 1,331,089IQVIA Holdings Inc.(a) . . . . . . . . . . . . . . . . . . . . . . . . . . . . . . . . . . . . 4,438 1,099,293Mettler-Toledo International Inc.(a) . . . . . . . . . . . . . . . . . . . . . . . . 831 1,224,653PerkinElmer Inc. . . . . . . . . . . . . . . . . . . . . . . . . . . . . . . . . . . . . . . . . . 7,507 1,368,001PPD Inc.(a) . . . . . . . . . . . . . . . . . . . . . . . . . . . . . . . . . . . . . . . . . . . . . . 23,379 1,078,239Thermo Fisher Scientific Inc. . . . . . . . . . . . . . . . . . . . . . . . . . . . . . 2,150 1,161,021Waters Corp.(a) . . . . . . . . . . . . . . . . . . . . . . . . . . . . . . . . . . . . . . . . . . 3,454 1,346,404
16,533,389Machinery — 2.6%Caterpillar Inc. . . . . . . . . . . . . . . . . . . . . . . . . . . . . . . . . . . . . . . . . . . . 4,018 830,722Cummins Inc.. . . . . . . . . . . . . . . . . . . . . . . . . . . . . . . . . . . . . . . . . . . . 3,888 902,405Deere & Co. . . . . . . . . . . . . . . . . . . . . . . . . . . . . . . . . . . . . . . . . . . . . . 2,573 930,371Dover Corp. . . . . . . . . . . . . . . . . . . . . . . . . . . . . . . . . . . . . . . . . . . . . . 7,053 1,178,697Fortive Corp. . . . . . . . . . . . . . . . . . . . . . . . . . . . . . . . . . . . . . . . . . . . . 14,930 1,084,814IDEX Corp. . . . . . . . . . . . . . . . . . . . . . . . . . . . . . . . . . . . . . . . . . . . . . . 4,792 1,086,298Illinois Tool Works Inc. . . . . . . . . . . . . . . . . . . . . . . . . . . . . . . . . . . . 4,236 960,174Ingersoll Rand Inc.(a). . . . . . . . . . . . . . . . . . . . . . . . . . . . . . . . . . . . . 21,771 1,063,949Nordson Corp.. . . . . . . . . . . . . . . . . . . . . . . . . . . . . . . . . . . . . . . . . . . 5,348 1,209,343Otis Worldwide Corp. . . . . . . . . . . . . . . . . . . . . . . . . . . . . . . . . . . . . 13,180 1,180,269PACCAR Inc. . . . . . . . . . . . . . . . . . . . . . . . . . . . . . . . . . . . . . . . . . . . . 11,145 924,924Parker-Hannifin Corp. . . . . . . . . . . . . . . . . . . . . . . . . . . . . . . . . . . . . 3,255 1,015,658Pentair PLC . . . . . . . . . . . . . . . . . . . . . . . . . . . . . . . . . . . . . . . . . . . . . 16,003 1,178,941Snap-on Inc.. . . . . . . . . . . . . . . . . . . . . . . . . . . . . . . . . . . . . . . . . . . . . 4,278 932,518
Security s Value
Machinery (continued)Stanley Black & Decker Inc. . . . . . . . . . . . . . . . . . . . . . . . . . . . . . . 4,857 $ 957,072Westinghouse Air Brake Technologies Corp. . . . . . . . . . . . . . . 13,429 1,139,719Xylem Inc./NY . . . . . . . . . . . . . . . . . . . . . . . . . . . . . . . . . . . . . . . . . . . 9,009 1,133,783
17,709,657Media — 2.2%Altice USA Inc., Class A(a) . . . . . . . . . . . . . . . . . . . . . . . . . . . . . . . . 28,858 886,806Cable One Inc. . . . . . . . . . . . . . . . . . . . . . . . . . . . . . . . . . . . . . . . . . . 644 1,215,866Charter Communications Inc., Class A(a)(b) . . . . . . . . . . . . . . . . 1,434 1,066,968Comcast Corp., Class A. . . . . . . . . . . . . . . . . . . . . . . . . . . . . . . . . . 17,253 1,014,994Discovery Inc., Class A(a)(b). . . . . . . . . . . . . . . . . . . . . . . . . . . . . . . 11,549 335,037Discovery Inc., Class C, NVS(a). . . . . . . . . . . . . . . . . . . . . . . . . . . 21,477 582,241DISH Network Corp., Class A(a). . . . . . . . . . . . . . . . . . . . . . . . . . . 23,318 976,791Fox Corp., Class A, NVS . . . . . . . . . . . . . . . . . . . . . . . . . . . . . . . . . 19,864 708,350Fox Corp., Class B. . . . . . . . . . . . . . . . . . . . . . . . . . . . . . . . . . . . . . . 9,120 303,149Interpublic Group of Companies Inc. (The) . . . . . . . . . . . . . . . . 33,428 1,182,014Liberty Broadband Corp., Class A(a) . . . . . . . . . . . . . . . . . . . . . . 879 150,898Liberty Broadband Corp., Class C, NVS(a). . . . . . . . . . . . . . . . . 5,549 984,892Liberty Media Corp.-Liberty SiriusXM, Class A(a). . . . . . . . . . . 8,676 405,082Liberty Media Corp.-Liberty SiriusXM, Class C, NVS(a). . . . . 17,456 806,467News Corp., Class A, NVS . . . . . . . . . . . . . . . . . . . . . . . . . . . . . . . 39,905 982,860Omnicom Group Inc. . . . . . . . . . . . . . . . . . . . . . . . . . . . . . . . . . . . . . 12,907 939,888Sirius XM Holdings Inc.(b) . . . . . . . . . . . . . . . . . . . . . . . . . . . . . . . . 179,428 1,160,899ViacomCBS Inc., Class B, NVS. . . . . . . . . . . . . . . . . . . . . . . . . . . 27,429 1,122,669
14,825,871Metals & Mining — 0.6%Freeport-McMoRan Inc. . . . . . . . . . . . . . . . . . . . . . . . . . . . . . . . . . . 22,930 873,633Newmont Corp. . . . . . . . . . . . . . . . . . . . . . . . . . . . . . . . . . . . . . . . . . . 13,755 864,089Nucor Corp. . . . . . . . . . . . . . . . . . . . . . . . . . . . . . . . . . . . . . . . . . . . . . 9,815 1,020,956Steel Dynamics Inc.. . . . . . . . . . . . . . . . . . . . . . . . . . . . . . . . . . . . . . 16,733 1,078,442
3,837,120Mortgage Real Estate Investment — 0.3%AGNC Investment Corp. . . . . . . . . . . . . . . . . . . . . . . . . . . . . . . . . . 60,190 955,215Annaly Capital Management Inc. . . . . . . . . . . . . . . . . . . . . . . . . . 118,002 1,001,837
1,957,052Multi-Utilities — 1.5%Ameren Corp. . . . . . . . . . . . . . . . . . . . . . . . . . . . . . . . . . . . . . . . . . . . 12,712 1,066,791CenterPoint Energy Inc.. . . . . . . . . . . . . . . . . . . . . . . . . . . . . . . . . . 43,108 1,097,530CMS Energy Corp.. . . . . . . . . . . . . . . . . . . . . . . . . . . . . . . . . . . . . . . 16,931 1,046,166Consolidated Edison Inc. . . . . . . . . . . . . . . . . . . . . . . . . . . . . . . . . . 13,329 983,280Dominion Energy Inc. . . . . . . . . . . . . . . . . . . . . . . . . . . . . . . . . . . . . 13,116 981,995DTE Energy Co. . . . . . . . . . . . . . . . . . . . . . . . . . . . . . . . . . . . . . . . . . 7,500 879,900NiSource Inc. . . . . . . . . . . . . . . . . . . . . . . . . . . . . . . . . . . . . . . . . . . . . 42,959 1,064,094Public Service Enterprise Group Inc.. . . . . . . . . . . . . . . . . . . . . . 16,737 1,041,544Sempra Energy. . . . . . . . . . . . . . . . . . . . . . . . . . . . . . . . . . . . . . . . . . 7,522 982,749WEC Energy Group Inc. . . . . . . . . . . . . . . . . . . . . . . . . . . . . . . . . . 10,955 1,031,304
10,175,353Multiline Retail — 0.5%Dollar General Corp. . . . . . . . . . . . . . . . . . . . . . . . . . . . . . . . . . . . . . 5,023 1,168,551Dollar Tree Inc.(a) . . . . . . . . . . . . . . . . . . . . . . . . . . . . . . . . . . . . . . . . 9,572 955,190Target Corp. . . . . . . . . . . . . . . . . . . . . . . . . . . . . . . . . . . . . . . . . . . . . . 4,743 1,238,160
3,361,901Oil, Gas & Consumable Fuels — 2.1%Cheniere Energy Inc.(a) . . . . . . . . . . . . . . . . . . . . . . . . . . . . . . . . . . 12,605 1,070,543Chevron Corp.. . . . . . . . . . . . . . . . . . . . . . . . . . . . . . . . . . . . . . . . . . . 8,707 886,460ConocoPhillips . . . . . . . . . . . . . . . . . . . . . . . . . . . . . . . . . . . . . . . . . . 17,250 967,035Devon Energy Corp. . . . . . . . . . . . . . . . . . . . . . . . . . . . . . . . . . . . . . 39,263 1,014,556EOG Resources Inc. . . . . . . . . . . . . . . . . . . . . . . . . . . . . . . . . . . . . . 12,020 875,777Exxon Mobil Corp. . . . . . . . . . . . . . . . . . . . . . . . . . . . . . . . . . . . . . . . 15,512 893,026
Schedule of Investments (continued)
July 31, 2021
iShares� MSCI USA Size Factor ETF(Percentages shown are based on Net Assets)
60 2 0 2 1 I S H A R E S A N N U A L R E P O R T T O S H A R E H O L D E R S

Security s Value
Oil, Gas & Consumable Fuels (continued)Hess Corp. . . . . . . . . . . . . . . . . . . . . . . . . . . . . . . . . . . . . . . . . . . . . . . 12,153 $ 928,975Kinder Morgan Inc. . . . . . . . . . . . . . . . . . . . . . . . . . . . . . . . . . . . . . . 54,779 952,059Marathon Petroleum Corp. . . . . . . . . . . . . . . . . . . . . . . . . . . . . . . . 16,781 926,647Occidental Petroleum Corp. . . . . . . . . . . . . . . . . . . . . . . . . . . . . . . 39,988 1,043,687ONEOK Inc. . . . . . . . . . . . . . . . . . . . . . . . . . . . . . . . . . . . . . . . . . . . . . 19,142 994,810Phillips 66 . . . . . . . . . . . . . . . . . . . . . . . . . . . . . . . . . . . . . . . . . . . . . . . 11,655 855,827Pioneer Natural Resources Co.. . . . . . . . . . . . . . . . . . . . . . . . . . . 6,488 943,160Valero Energy Corp. . . . . . . . . . . . . . . . . . . . . . . . . . . . . . . . . . . . . . 12,720 851,858Williams Companies Inc. (The) . . . . . . . . . . . . . . . . . . . . . . . . . . . 39,284 984,064
14,188,484Personal Products — 0.2%Estee Lauder Companies Inc. (The), Class A. . . . . . . . . . . . . . 3,346 1,116,995
Pharmaceuticals — 1.7%Bristol-Myers Squibb Co. . . . . . . . . . . . . . . . . . . . . . . . . . . . . . . . . . 14,982 1,016,828Catalent Inc.(a). . . . . . . . . . . . . . . . . . . . . . . . . . . . . . . . . . . . . . . . . . . 10,516 1,259,922Elanco Animal Health Inc.(a) . . . . . . . . . . . . . . . . . . . . . . . . . . . . . . 30,702 1,119,702Eli Lilly & Co. . . . . . . . . . . . . . . . . . . . . . . . . . . . . . . . . . . . . . . . . . . . . 4,969 1,209,952Jazz Pharmaceuticals PLC(a) . . . . . . . . . . . . . . . . . . . . . . . . . . . . . 6,194 1,050,007Johnson & Johnson. . . . . . . . . . . . . . . . . . . . . . . . . . . . . . . . . . . . . . 5,512 949,166Merck & Co. Inc. . . . . . . . . . . . . . . . . . . . . . . . . . . . . . . . . . . . . . . . . . 12,190 937,045Pfizer Inc. . . . . . . . . . . . . . . . . . . . . . . . . . . . . . . . . . . . . . . . . . . . . . . . 24,038 1,029,067Royalty Pharma PLC, Class A . . . . . . . . . . . . . . . . . . . . . . . . . . . . 25,864 988,005Viatris Inc. . . . . . . . . . . . . . . . . . . . . . . . . . . . . . . . . . . . . . . . . . . . . . . . 65,766 925,328Zoetis Inc. . . . . . . . . . . . . . . . . . . . . . . . . . . . . . . . . . . . . . . . . . . . . . . . 5,892 1,194,308
11,679,330Professional Services — 1.6%Booz Allen Hamilton Holding Corp., Class A. . . . . . . . . . . . . . . 13,132 1,126,857Clarivate PLC(a) . . . . . . . . . . . . . . . . . . . . . . . . . . . . . . . . . . . . . . . . . 37,517 855,388CoStar Group Inc.(a) . . . . . . . . . . . . . . . . . . . . . . . . . . . . . . . . . . . . . 12,764 1,134,081Equifax Inc. . . . . . . . . . . . . . . . . . . . . . . . . . . . . . . . . . . . . . . . . . . . . . 4,410 1,149,246IHS Markit Ltd. . . . . . . . . . . . . . . . . . . . . . . . . . . . . . . . . . . . . . . . . . . 9,940 1,161,389Jacobs Engineering Group Inc. . . . . . . . . . . . . . . . . . . . . . . . . . . . 7,677 1,038,314Leidos Holdings Inc. . . . . . . . . . . . . . . . . . . . . . . . . . . . . . . . . . . . . . 10,407 1,107,513Robert Half International Inc. . . . . . . . . . . . . . . . . . . . . . . . . . . . . . 12,189 1,197,082TransUnion. . . . . . . . . . . . . . . . . . . . . . . . . . . . . . . . . . . . . . . . . . . . . . 9,828 1,179,950Verisk Analytics Inc., Class A . . . . . . . . . . . . . . . . . . . . . . . . . . . . . 6,072 1,153,316
11,103,136Real Estate Management & Development — 0.2%CBRE Group Inc., Class A(a) . . . . . . . . . . . . . . . . . . . . . . . . . . . . . 12,064 1,163,693
Road & Rail — 1.5%AMERCO . . . . . . . . . . . . . . . . . . . . . . . . . . . . . . . . . . . . . . . . . . . . . . . 1,756 1,032,458CSX Corp. . . . . . . . . . . . . . . . . . . . . . . . . . . . . . . . . . . . . . . . . . . . . . . 30,027 970,473JB Hunt Transport Services Inc. . . . . . . . . . . . . . . . . . . . . . . . . . . 6,076 1,023,502Kansas City Southern . . . . . . . . . . . . . . . . . . . . . . . . . . . . . . . . . . . . 3,534 946,405Knight-Swift Transportation Holdings Inc. . . . . . . . . . . . . . . . . . 22,586 1,122,298Lyft Inc., Class A(a) . . . . . . . . . . . . . . . . . . . . . . . . . . . . . . . . . . . . . . . 21,556 1,192,478Norfolk Southern Corp.. . . . . . . . . . . . . . . . . . . . . . . . . . . . . . . . . . . 3,533 910,913Old Dominion Freight Line Inc. . . . . . . . . . . . . . . . . . . . . . . . . . . . 3,866 1,040,534Uber Technologies Inc.(a) . . . . . . . . . . . . . . . . . . . . . . . . . . . . . . . . . 21,045 914,616Union Pacific Corp. . . . . . . . . . . . . . . . . . . . . . . . . . . . . . . . . . . . . . . 4,362 954,231
10,107,908Semiconductors & Semiconductor Equipment — 4.1%Advanced Micro Devices Inc.(a) . . . . . . . . . . . . . . . . . . . . . . . . . . . 13,439 1,427,087Analog Devices Inc.. . . . . . . . . . . . . . . . . . . . . . . . . . . . . . . . . . . . . . 6,914 1,157,542Applied Materials Inc. . . . . . . . . . . . . . . . . . . . . . . . . . . . . . . . . . . . . 8,040 1,125,037Broadcom Inc. . . . . . . . . . . . . . . . . . . . . . . . . . . . . . . . . . . . . . . . . . . . 2,219 1,077,103Enphase Energy Inc.(a). . . . . . . . . . . . . . . . . . . . . . . . . . . . . . . . . . . 9,108 1,726,877Intel Corp. . . . . . . . . . . . . . . . . . . . . . . . . . . . . . . . . . . . . . . . . . . . . . . . 17,414 935,480
Security s Value
Semiconductors & Semiconductor Equipment (continued)KLA Corp. . . . . . . . . . . . . . . . . . . . . . . . . . . . . . . . . . . . . . . . . . . . . . . . 3,452 $ 1,201,848Lam Research Corp. . . . . . . . . . . . . . . . . . . . . . . . . . . . . . . . . . . . . . 1,698 1,082,322Marvell Technology Inc. . . . . . . . . . . . . . . . . . . . . . . . . . . . . . . . . . . 24,257 1,467,791Maxim Integrated Products Inc.. . . . . . . . . . . . . . . . . . . . . . . . . . . 11,571 1,156,059Microchip Technology Inc. . . . . . . . . . . . . . . . . . . . . . . . . . . . . . . . . 7,236 1,035,616Micron Technology Inc.(a). . . . . . . . . . . . . . . . . . . . . . . . . . . . . . . . . 12,494 969,284Monolithic Power Systems Inc. . . . . . . . . . . . . . . . . . . . . . . . . . . . 3,455 1,552,193NVIDIA Corp. . . . . . . . . . . . . . . . . . . . . . . . . . . . . . . . . . . . . . . . . . . . . 6,716 1,309,553NXP Semiconductors NV. . . . . . . . . . . . . . . . . . . . . . . . . . . . . . . . . 5,358 1,105,838ON Semiconductor Corp.(a). . . . . . . . . . . . . . . . . . . . . . . . . . . . . . . 29,389 1,147,934Qorvo Inc.(a) . . . . . . . . . . . . . . . . . . . . . . . . . . . . . . . . . . . . . . . . . . . . . 6,230 1,181,146QUALCOMM Inc. . . . . . . . . . . . . . . . . . . . . . . . . . . . . . . . . . . . . . . . . 7,554 1,131,589Skyworks Solutions Inc. . . . . . . . . . . . . . . . . . . . . . . . . . . . . . . . . . . 6,415 1,183,632SolarEdge Technologies Inc.(a) . . . . . . . . . . . . . . . . . . . . . . . . . . . 4,996 1,296,362Teradyne Inc. . . . . . . . . . . . . . . . . . . . . . . . . . . . . . . . . . . . . . . . . . . . . 8,901 1,130,427Texas Instruments Inc. . . . . . . . . . . . . . . . . . . . . . . . . . . . . . . . . . . . 5,401 1,029,539Xilinx Inc.. . . . . . . . . . . . . . . . . . . . . . . . . . . . . . . . . . . . . . . . . . . . . . . . 8,850 1,326,084
27,756,343Software — 7.9%Adobe Inc.(a) . . . . . . . . . . . . . . . . . . . . . . . . . . . . . . . . . . . . . . . . . . . . 2,009 1,248,855ANSYS Inc.(a) . . . . . . . . . . . . . . . . . . . . . . . . . . . . . . . . . . . . . . . . . . . 3,265 1,203,022Autodesk Inc.(a). . . . . . . . . . . . . . . . . . . . . . . . . . . . . . . . . . . . . . . . . . 3,705 1,189,787Avalara Inc.(a) . . . . . . . . . . . . . . . . . . . . . . . . . . . . . . . . . . . . . . . . . . . 9,064 1,515,229Bentley Systems Inc., Class B(b) . . . . . . . . . . . . . . . . . . . . . . . . . . 21,541 1,309,908Black Knight Inc.(a). . . . . . . . . . . . . . . . . . . . . . . . . . . . . . . . . . . . . . . 15,276 1,265,006Cadence Design Systems Inc.(a). . . . . . . . . . . . . . . . . . . . . . . . . . 8,549 1,262,260Ceridian HCM Holding Inc.(a) . . . . . . . . . . . . . . . . . . . . . . . . . . . . . 12,307 1,211,009Citrix Systems Inc. . . . . . . . . . . . . . . . . . . . . . . . . . . . . . . . . . . . . . . . 9,220 928,915Cloudflare Inc., Class A(a) . . . . . . . . . . . . . . . . . . . . . . . . . . . . . . . . 14,950 1,773,518Coupa Software Inc.(a)(b) . . . . . . . . . . . . . . . . . . . . . . . . . . . . . . . . . 4,741 1,028,797Crowdstrike Holdings Inc., Class A(a). . . . . . . . . . . . . . . . . . . . . . 5,462 1,385,218Datadog Inc., Class A(a) . . . . . . . . . . . . . . . . . . . . . . . . . . . . . . . . . . 12,980 1,436,886DocuSign Inc., Class A(a). . . . . . . . . . . . . . . . . . . . . . . . . . . . . . . . . 5,587 1,665,149Dropbox Inc., Class A(a) . . . . . . . . . . . . . . . . . . . . . . . . . . . . . . . . . . 41,885 1,318,959Dynatrace Inc.(a) . . . . . . . . . . . . . . . . . . . . . . . . . . . . . . . . . . . . . . . . . 23,179 1,480,443Fair Isaac Corp.(a) . . . . . . . . . . . . . . . . . . . . . . . . . . . . . . . . . . . . . . . 2,209 1,157,317Fortinet Inc.(a) . . . . . . . . . . . . . . . . . . . . . . . . . . . . . . . . . . . . . . . . . . . 5,101 1,388,696Guidewire Software Inc.(a) . . . . . . . . . . . . . . . . . . . . . . . . . . . . . . . . 12,062 1,389,542HubSpot Inc.(a) . . . . . . . . . . . . . . . . . . . . . . . . . . . . . . . . . . . . . . . . . . 2,195 1,308,264Intuit Inc. . . . . . . . . . . . . . . . . . . . . . . . . . . . . . . . . . . . . . . . . . . . . . . . . 2,369 1,255,499Microsoft Corp. . . . . . . . . . . . . . . . . . . . . . . . . . . . . . . . . . . . . . . . . . . 3,648 1,039,352NortonLifeLock Inc. . . . . . . . . . . . . . . . . . . . . . . . . . . . . . . . . . . . . . . 41,144 1,021,194Oracle Corp.. . . . . . . . . . . . . . . . . . . . . . . . . . . . . . . . . . . . . . . . . . . . . 12,174 1,060,842Palantir Technologies Inc., Class A(a) . . . . . . . . . . . . . . . . . . . . . 50,624 1,099,047Palo Alto Networks Inc.(a) . . . . . . . . . . . . . . . . . . . . . . . . . . . . . . . . 3,110 1,241,045Paycom Software Inc.(a). . . . . . . . . . . . . . . . . . . . . . . . . . . . . . . . . . 3,298 1,319,200PTC Inc.(a) . . . . . . . . . . . . . . . . . . . . . . . . . . . . . . . . . . . . . . . . . . . . . . 8,452 1,144,823RingCentral Inc., Class A(a). . . . . . . . . . . . . . . . . . . . . . . . . . . . . . . 4,505 1,204,051salesforce.com Inc.(a) . . . . . . . . . . . . . . . . . . . . . . . . . . . . . . . . . . . . 6,511 1,575,206ServiceNow Inc.(a) . . . . . . . . . . . . . . . . . . . . . . . . . . . . . . . . . . . . . . . 2,212 1,300,413Splunk Inc.(a) . . . . . . . . . . . . . . . . . . . . . . . . . . . . . . . . . . . . . . . . . . . . 9,324 1,323,822SS&C Technologies Holdings Inc. . . . . . . . . . . . . . . . . . . . . . . . . 14,369 1,126,386Synopsys Inc.(a) . . . . . . . . . . . . . . . . . . . . . . . . . . . . . . . . . . . . . . . . . 4,404 1,268,308Trade Desk Inc. (The), Class A(a) . . . . . . . . . . . . . . . . . . . . . . . . . 20,755 1,700,042Tyler Technologies Inc.(a) . . . . . . . . . . . . . . . . . . . . . . . . . . . . . . . . . 2,741 1,350,326Unity Software Inc.(a)(b). . . . . . . . . . . . . . . . . . . . . . . . . . . . . . . . . . . 12,172 1,303,865VMware Inc., Class A(a)(b) . . . . . . . . . . . . . . . . . . . . . . . . . . . . . . . . 6,169 948,422Workday Inc., Class A(a). . . . . . . . . . . . . . . . . . . . . . . . . . . . . . . . . . 4,443 1,041,439Zendesk Inc.(a)(b) . . . . . . . . . . . . . . . . . . . . . . . . . . . . . . . . . . . . . . . . 8,141 1,062,645Zoom Video Communications Inc., Class A(a). . . . . . . . . . . . . . 3,240 1,225,044
Schedule of Investments (continued)
July 31, 2021
iShares� MSCI USA Size Factor ETF(Percentages shown are based on Net Assets)
S C H E D U L E O F I N V E S T M E N T S 61

Security s Value
Software (continued)Zscaler Inc.(a). . . . . . . . . . . . . . . . . . . . . . . . . . . . . . . . . . . . . . . . . . . . 6,503 $ 1,534,123
53,611,874Specialty Retail — 2.3%Advance Auto Parts Inc.. . . . . . . . . . . . . . . . . . . . . . . . . . . . . . . . . . 5,293 1,122,433AutoZone Inc.(a) . . . . . . . . . . . . . . . . . . . . . . . . . . . . . . . . . . . . . . . . . 679 1,102,404Best Buy Co. Inc. . . . . . . . . . . . . . . . . . . . . . . . . . . . . . . . . . . . . . . . . 8,688 976,097Burlington Stores Inc.(a)(b) . . . . . . . . . . . . . . . . . . . . . . . . . . . . . . . . 3,151 1,054,955CarMax Inc.(a) . . . . . . . . . . . . . . . . . . . . . . . . . . . . . . . . . . . . . . . . . . . 8,568 1,147,684Carvana Co., Class A(a) . . . . . . . . . . . . . . . . . . . . . . . . . . . . . . . . . . 4,716 1,591,933Home Depot Inc. (The). . . . . . . . . . . . . . . . . . . . . . . . . . . . . . . . . . . 2,970 974,724L Brands Inc. . . . . . . . . . . . . . . . . . . . . . . . . . . . . . . . . . . . . . . . . . . . . 15,088 1,208,096Lowe's Companies Inc. . . . . . . . . . . . . . . . . . . . . . . . . . . . . . . . . . . 5,047 972,506O'Reilly Automotive Inc.(a) . . . . . . . . . . . . . . . . . . . . . . . . . . . . . . . . 1,871 1,129,785Ross Stores Inc. . . . . . . . . . . . . . . . . . . . . . . . . . . . . . . . . . . . . . . . . . 7,981 979,189TJX Companies Inc. (The) . . . . . . . . . . . . . . . . . . . . . . . . . . . . . . . 13,874 954,670Tractor Supply Co. . . . . . . . . . . . . . . . . . . . . . . . . . . . . . . . . . . . . . . . 5,679 1,027,501Ulta Beauty Inc.(a) . . . . . . . . . . . . . . . . . . . . . . . . . . . . . . . . . . . . . . . 3,246 1,090,007
15,331,984Technology Hardware, Storage & Peripherals — 1.0%Apple Inc. . . . . . . . . . . . . . . . . . . . . . . . . . . . . . . . . . . . . . . . . . . . . . . . 7,034 1,025,979Dell Technologies Inc., Class C(a) . . . . . . . . . . . . . . . . . . . . . . . . . 10,242 989,582Hewlett Packard Enterprise Co. . . . . . . . . . . . . . . . . . . . . . . . . . . 64,027 928,392HP Inc. . . . . . . . . . . . . . . . . . . . . . . . . . . . . . . . . . . . . . . . . . . . . . . . . . . 31,180 900,167NetApp Inc. . . . . . . . . . . . . . . . . . . . . . . . . . . . . . . . . . . . . . . . . . . . . . 13,617 1,083,777Seagate Technology Holdings PLC . . . . . . . . . . . . . . . . . . . . . . . 10,136 890,954Western Digital Corp.(a) . . . . . . . . . . . . . . . . . . . . . . . . . . . . . . . . . . 13,853 899,475
6,718,326Textiles, Apparel & Luxury Goods — 0.5%Lululemon Athletica Inc.(a) . . . . . . . . . . . . . . . . . . . . . . . . . . . . . . . . 3,279 1,312,157Nike Inc., Class B. . . . . . . . . . . . . . . . . . . . . . . . . . . . . . . . . . . . . . . . 7,103 1,189,824VF Corp. . . . . . . . . . . . . . . . . . . . . . . . . . . . . . . . . . . . . . . . . . . . . . . . . 12,003 962,641
3,464,622Tobacco — 0.3%Altria Group Inc. . . . . . . . . . . . . . . . . . . . . . . . . . . . . . . . . . . . . . . . . . 19,844 953,306Philip Morris International Inc. . . . . . . . . . . . . . . . . . . . . . . . . . . . . 10,042 1,005,104
1,958,410
Security s Value
Trading Companies & Distributors — 0.5%Fastenal Co.. . . . . . . . . . . . . . . . . . . . . . . . . . . . . . . . . . . . . . . . . . . . . 19,535 $ 1,069,932United Rentals Inc.(a) . . . . . . . . . . . . . . . . . . . . . . . . . . . . . . . . . . . . 3,084 1,016,332WW Grainger Inc.. . . . . . . . . . . . . . . . . . . . . . . . . . . . . . . . . . . . . . . . 2,267 1,007,863
3,094,127Water Utilities — 0.3%American Water Works Co. Inc. . . . . . . . . . . . . . . . . . . . . . . . . . . 6,952 1,182,605Essential Utilities Inc. . . . . . . . . . . . . . . . . . . . . . . . . . . . . . . . . . . . . 23,540 1,156,285
2,338,890Wireless Telecommunication Services — 0.2%T-Mobile U.S. Inc.(a). . . . . . . . . . . . . . . . . . . . . . . . . . . . . . . . . . . . . . 6,953 1,001,371
Total Common Stocks — 99.7%(Cost: $623,610,788) . . . . . . . . . . . . . . . . . . . . . . . . . . . . . . . . . . . . . . . . . . . . . . 672,379,939
Short-Term InvestmentsMoney Market Funds — 3.3%BlackRock Cash Funds: Institutional, SL Agency Shares,
0.06%(c)(d)(e) . . . . . . . . . . . . . . . . . . . . . . . . . . . . . . . . . . . . . . . . . . 20,453,230 20,463,456BlackRock Cash Funds: Treasury, SL Agency Shares,
0.00%(c)(d) . . . . . . . . . . . . . . . . . . . . . . . . . . . . . . . . . . . . . . . . . . . . 1,980,000 1,980,000
22,443,456
Total Short-Term Investments — 3.3%(Cost: $22,435,493) . . . . . . . . . . . . . . . . . . . . . . . . . . . . . . . . . . . . . . . . . . . . . . . 22,443,456
Total Investments in Securities — 103.0%(Cost: $646,046,281) . . . . . . . . . . . . . . . . . . . . . . . . . . . . . . . . . . . . . . . . . . . . . . 694,823,395
Other Assets, Less Liabilities — (3.0)%. . . . . . . . . . . . . . . . . . . . . . . . . . . . . . (19,959,508)
Net Assets — 100.0% . . . . . . . . . . . . . . . . . . . . . . . . . . . . . . . . . . . . . . . . . . . . . . . . $ 674,863,887
(a) Non-income producing security.(b) All or a portion of this security is on loan.(c) Affiliate of the Fund.(d) Annualized 7-day yield as of period-end.(e) All or a portion of this security was purchased with cash collateral received from loaned
securities.
Affiliates
Investments in issuers considered to be affiliate(s) of the Fund during the year ended July 31, 2021 for purposes of Section 2(a)(3) of the Investment Company Act of 1940,as amended, were as follows:
Affiliated IssuerValue at
07/31/20Purchases
at CostProceeds
from SalesNet Realized
Gain (Loss)
Change inUnrealized
Appreciation(Depreciation)
Value at07/31/21
SharesHeld at
07/31/21 Income
CapitalGain
Distributionsfrom
UnderlyingFunds
BlackRock Cash Funds: Institutional, SL AgencyShares . . . . . . . . . . . . . . . . . . . . . . . . . . . . . . . . . . . . . $18,884,090 $1,589,971(a) $ — $ 5,440 $ (16,045) $20,463,456 20,453,230 $57,152(b) $ —
BlackRock Cash Funds: Treasury, SL AgencyShares . . . . . . . . . . . . . . . . . . . . . . . . . . . . . . . . . . . . . 1,710,000 270,000(a) — — — 1,980,000 1,980,000 713 —
BlackRock Inc. . . . . . . . . . . . . . . . . . . . . . . . . . . . . . . . . 1,163,820 1,562,388 (2,298,978) 544,163 33,657 1,005,050 1,159 29,114 —
$ 549,603 $ 17,612 $23,448,506 $86,979 $ —
(a) Represents net amount purchased (sold).(b) All or a portion represents securities lending income earned from the reinvestment of cash collateral from loaned securities, net of fees and collateral investment expenses, and other
payments to and from borrowers of securities.
Schedule of Investments (continued)
July 31, 2021
iShares� MSCI USA Size Factor ETF(Percentages shown are based on Net Assets)
62 2 0 2 1 I S H A R E S A N N U A L R E P O R T T O S H A R E H O L D E R S

Futures Contracts
DescriptionNumber ofContracts
ExpirationDate
NotionalAmount
(000)
Value/Unrealized
Appreciation(Depreciation)
Long ContractsDow Jones U.S. Real Estate Index . . . . . . . . . . . . . . . . . . . . . . . . . . . . . . . . . . . . . . . . . . . . . . . . . . . . . . . . . . . . . . . . . . . . . . . . . . . . . . . . . . . 8 09/17/21 $ 332 $ 9,509S&P 500 E-Mini Index . . . . . . . . . . . . . . . . . . . . . . . . . . . . . . . . . . . . . . . . . . . . . . . . . . . . . . . . . . . . . . . . . . . . . . . . . . . . . . . . . . . . . . . . . . . . . . . 7 09/17/21 1,536 36,061S&P MidCap 400 E-Mini Index . . . . . . . . . . . . . . . . . . . . . . . . . . . . . . . . . . . . . . . . . . . . . . . . . . . . . . . . . . . . . . . . . . . . . . . . . . . . . . . . . . . . . . . 2 09/17/21 540 3,014
$ 48,584
Derivative Financial Instruments Categorized by Risk Exposure
As of July 31, 2021, the fair values of derivative financial instruments located in the Statements of Assets and Liabilities were as follows:
EquityContracts
Assets — Derivative Financial InstrumentsFutures contracts
Unrealized appreciation on futures contracts(a) . . . . . . . . . . . . . . . . . . . . . . . . . . . . . . . . . . . . . . . . . . . . . . . . . . . . . . . . . . . . . . . . . . . . . . . . . . . . . . . . . . . . . . . . . . . . . . . . . . . . . . . . . . . . . . . . . $ 48,584
(a) Net cumulative appreciation (depreciation) on futures contracts are reported in the Schedule of Investments. In the Statements of Assets and Liabilities, only current day's variationmargin is reported in receivables or payables and the net cumulative unrealized appreciation (depreciation) is included in accumulated earnings (loss).
For the year ended July 31, 2021, the effect of derivative financial instruments in the Statements of Operations was as follows:
EquityContracts
Net Realized Gain (Loss) from:Futures contracts . . . . . . . . . . . . . . . . . . . . . . . . . . . . . . . . . . . . . . . . . . . . . . . . . . . . . . . . . . . . . . . . . . . . . . . . . . . . . . . . . . . . . . . . . . . . . . . . . . . . . . . . . . . . . . . . . . . . . . . . . . . . . . . . . . . . . . . . . . . . . . . . $647,298
Net Change in Unrealized Appreciation (Depreciation) on:Futures contracts . . . . . . . . . . . . . . . . . . . . . . . . . . . . . . . . . . . . . . . . . . . . . . . . . . . . . . . . . . . . . . . . . . . . . . . . . . . . . . . . . . . . . . . . . . . . . . . . . . . . . . . . . . . . . . . . . . . . . . . . . . . . . . . . . . . . . . . . . . . . . . . . $ (53,514)
Average Quarterly Balances of Outstanding Derivative Financial Instruments
Futures contracts:Average notional value of contracts — long . . . . . . . . . . . . . . . . . . . . . . . . . . . . . . . . . . . . . . . . . . . . . . . . . . . . . . . . . . . . . . . . . . . . . . . . . . . . . . . . . . . . . . . . . . . . . . . . . . . . . . . . . . . . . . . . $1,912,101
For more information about the Fund’s investment risks regarding derivative financial instruments, refer to the Notes to Financial Statements.
Fair Value Measurements
Various inputs are used in determining the fair value of financial instruments. For description of the input levels and information about the Fund's policy regarding valuationof financial instruments, refer to the Notes to Financial Statements.
The following table summarizes the value of the Fund's investments according to the fair value hierarchy as of July 31, 2021. The breakdown of the Fund's investments intomajor categories is disclosed in the Schedule of Investments above.
Level 1 Level 2 Level 3 Total
InvestmentsAssets
Common Stocks . . . . . . . . . . . . . . . . . . . . . . . . . . . . . . . . . . . . . . . . . . . . . . . . . . . . . . . . . . . . . . . . . . . . . . . . . . . . . . . . . . . . $672,379,939 $ — $ — $672,379,939Money Market Funds . . . . . . . . . . . . . . . . . . . . . . . . . . . . . . . . . . . . . . . . . . . . . . . . . . . . . . . . . . . . . . . . . . . . . . . . . . . . . . . 22,443,456 — — 22,443,456
$694,823,395 $ — $ — $694,823,395
Derivative financial instruments(a)
AssetsFutures Contracts. . . . . . . . . . . . . . . . . . . . . . . . . . . . . . . . . . . . . . . . . . . . . . . . . . . . . . . . . . . . . . . . . . . . . . . . . . . . . . . . . . . $ 48,584 $ — $ — $ 48,584
(a) Shown at the unrealized appreciation (depreciation) on the contracts.
See notes to financial statements.
Schedule of Investments (continued)
July 31, 2021
iShares� MSCI USA Size Factor ETF
S C H E D U L E O F I N V E S T M E N T S 63
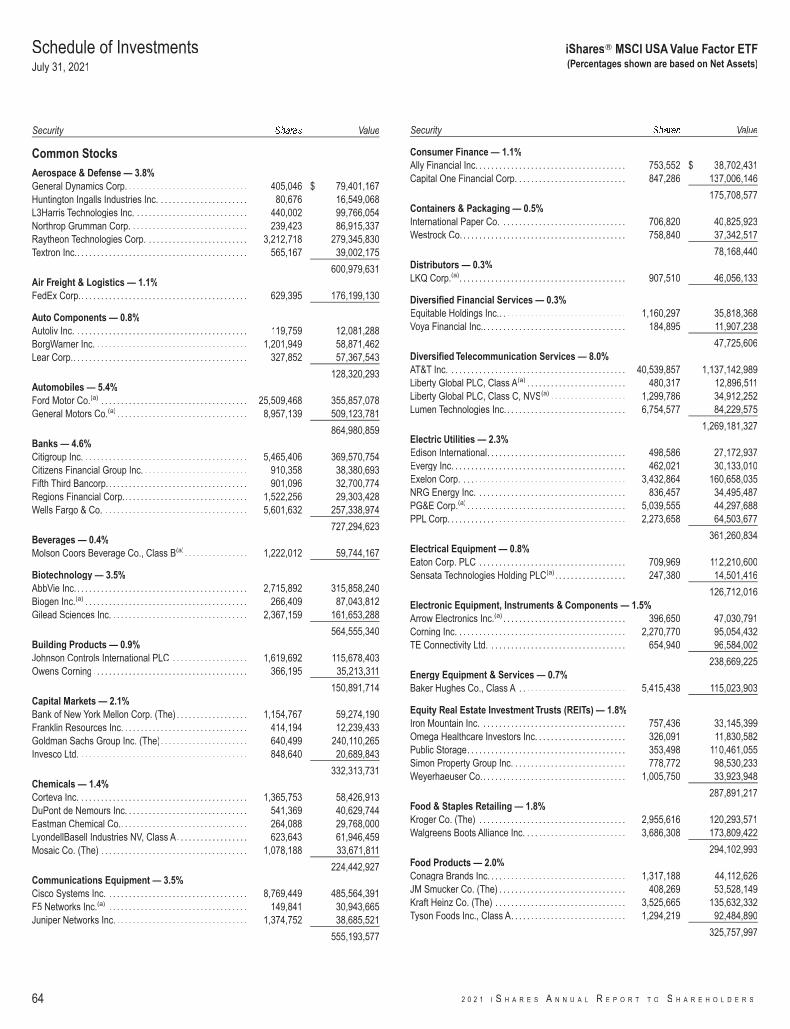
Security s Value
Common StocksAerospace & Defense — 3.8%General Dynamics Corp. . . . . . . . . . . . . . . . . . . . . . . . . . . . . . . 405,046 $ 79,401,167Huntington Ingalls Industries Inc. . . . . . . . . . . . . . . . . . . . . . . 80,676 16,549,068L3Harris Technologies Inc. . . . . . . . . . . . . . . . . . . . . . . . . . . . . 440,002 99,766,054Northrop Grumman Corp. . . . . . . . . . . . . . . . . . . . . . . . . . . . . . 239,423 86,915,337Raytheon Technologies Corp. . . . . . . . . . . . . . . . . . . . . . . . . . 3,212,718 279,345,830Textron Inc.. . . . . . . . . . . . . . . . . . . . . . . . . . . . . . . . . . . . . . . . . . . 565,167 39,002,175
600,979,631Air Freight & Logistics — 1.1%FedEx Corp.. . . . . . . . . . . . . . . . . . . . . . . . . . . . . . . . . . . . . . . . . . 629,395 176,199,130
Auto Components — 0.8%Autoliv Inc. . . . . . . . . . . . . . . . . . . . . . . . . . . . . . . . . . . . . . . . . . . . 119,759 12,081,288BorgWarner Inc. . . . . . . . . . . . . . . . . . . . . . . . . . . . . . . . . . . . . . . 1,201,949 58,871,462Lear Corp.. . . . . . . . . . . . . . . . . . . . . . . . . . . . . . . . . . . . . . . . . . . . 327,852 57,367,543
128,320,293Automobiles — 5.4%Ford Motor Co.(a) . . . . . . . . . . . . . . . . . . . . . . . . . . . . . . . . . . . . . 25,509,468 355,857,078General Motors Co.(a) . . . . . . . . . . . . . . . . . . . . . . . . . . . . . . . . . 8,957,139 509,123,781
864,980,859Banks — 4.6%Citigroup Inc. . . . . . . . . . . . . . . . . . . . . . . . . . . . . . . . . . . . . . . . . . 5,465,406 369,570,754Citizens Financial Group Inc. . . . . . . . . . . . . . . . . . . . . . . . . . . 910,358 38,380,693Fifth Third Bancorp. . . . . . . . . . . . . . . . . . . . . . . . . . . . . . . . . . . . 901,096 32,700,774Regions Financial Corp.. . . . . . . . . . . . . . . . . . . . . . . . . . . . . . . 1,522,256 29,303,428Wells Fargo & Co. . . . . . . . . . . . . . . . . . . . . . . . . . . . . . . . . . . . . 5,601,632 257,338,974
727,294,623Beverages — 0.4%Molson Coors Beverage Co., Class B(a). . . . . . . . . . . . . . . . 1,222,012 59,744,167
Biotechnology — 3.5%AbbVie Inc. . . . . . . . . . . . . . . . . . . . . . . . . . . . . . . . . . . . . . . . . . . . 2,715,892 315,858,240Biogen Inc.(a) . . . . . . . . . . . . . . . . . . . . . . . . . . . . . . . . . . . . . . . . . 266,409 87,043,812Gilead Sciences Inc. . . . . . . . . . . . . . . . . . . . . . . . . . . . . . . . . . . 2,367,159 161,653,288
564,555,340Building Products — 0.9%Johnson Controls International PLC . . . . . . . . . . . . . . . . . . . 1,619,692 115,678,403Owens Corning . . . . . . . . . . . . . . . . . . . . . . . . . . . . . . . . . . . . . . . 366,195 35,213,311
150,891,714Capital Markets — 2.1%Bank of New York Mellon Corp. (The) . . . . . . . . . . . . . . . . . . 1,154,767 59,274,190Franklin Resources Inc. . . . . . . . . . . . . . . . . . . . . . . . . . . . . . . . 414,194 12,239,433Goldman Sachs Group Inc. (The). . . . . . . . . . . . . . . . . . . . . . 640,499 240,110,265Invesco Ltd. . . . . . . . . . . . . . . . . . . . . . . . . . . . . . . . . . . . . . . . . . . 848,640 20,689,843
332,313,731Chemicals — 1.4%Corteva Inc. . . . . . . . . . . . . . . . . . . . . . . . . . . . . . . . . . . . . . . . . . . 1,365,753 58,426,913DuPont de Nemours Inc. . . . . . . . . . . . . . . . . . . . . . . . . . . . . . . 541,369 40,629,744Eastman Chemical Co.. . . . . . . . . . . . . . . . . . . . . . . . . . . . . . . . 264,088 29,768,000LyondellBasell Industries NV, Class A. . . . . . . . . . . . . . . . . . 623,643 61,946,459Mosaic Co. (The) . . . . . . . . . . . . . . . . . . . . . . . . . . . . . . . . . . . . . 1,078,188 33,671,811
224,442,927Communications Equipment — 3.5%Cisco Systems Inc. . . . . . . . . . . . . . . . . . . . . . . . . . . . . . . . . . . . 8,769,449 485,564,391F5 Networks Inc.(a) . . . . . . . . . . . . . . . . . . . . . . . . . . . . . . . . . . . 149,841 30,943,665Juniper Networks Inc. . . . . . . . . . . . . . . . . . . . . . . . . . . . . . . . . . 1,374,752 38,685,521
555,193,577
Security s Value
Consumer Finance — 1.1%Ally Financial Inc. . . . . . . . . . . . . . . . . . . . . . . . . . . . . . . . . . . . . . 753,552 $ 38,702,431Capital One Financial Corp. . . . . . . . . . . . . . . . . . . . . . . . . . . . 847,286 137,006,146
175,708,577Containers & Packaging — 0.5%International Paper Co. . . . . . . . . . . . . . . . . . . . . . . . . . . . . . . . 706,820 40,825,923Westrock Co. . . . . . . . . . . . . . . . . . . . . . . . . . . . . . . . . . . . . . . . . . 758,840 37,342,517
78,168,440Distributors — 0.3%LKQ Corp.(a). . . . . . . . . . . . . . . . . . . . . . . . . . . . . . . . . . . . . . . . . . 907,510 46,056,133
Diversified Financial Services — 0.3%Equitable Holdings Inc.. . . . . . . . . . . . . . . . . . . . . . . . . . . . . . . . 1,160,297 35,818,368Voya Financial Inc.. . . . . . . . . . . . . . . . . . . . . . . . . . . . . . . . . . . . 184,895 11,907,238
47,725,606Diversified Telecommunication Services — 8.0%AT&T Inc. . . . . . . . . . . . . . . . . . . . . . . . . . . . . . . . . . . . . . . . . . . . . 40,539,857 1,137,142,989Liberty Global PLC, Class A(a) . . . . . . . . . . . . . . . . . . . . . . . . . 480,317 12,896,511Liberty Global PLC, Class C, NVS(a) . . . . . . . . . . . . . . . . . . . 1,299,786 34,912,252Lumen Technologies Inc. . . . . . . . . . . . . . . . . . . . . . . . . . . . . . . 6,754,577 84,229,575
1,269,181,327Electric Utilities — 2.3%Edison International. . . . . . . . . . . . . . . . . . . . . . . . . . . . . . . . . . . 498,586 27,172,937Evergy Inc. . . . . . . . . . . . . . . . . . . . . . . . . . . . . . . . . . . . . . . . . . . . 462,021 30,133,010Exelon Corp. . . . . . . . . . . . . . . . . . . . . . . . . . . . . . . . . . . . . . . . . . 3,432,864 160,658,035NRG Energy Inc. . . . . . . . . . . . . . . . . . . . . . . . . . . . . . . . . . . . . . 836,457 34,495,487PG&E Corp.(a) . . . . . . . . . . . . . . . . . . . . . . . . . . . . . . . . . . . . . . . . 5,039,555 44,297,688PPL Corp. . . . . . . . . . . . . . . . . . . . . . . . . . . . . . . . . . . . . . . . . . . . . 2,273,658 64,503,677
361,260,834Electrical Equipment — 0.8%Eaton Corp. PLC . . . . . . . . . . . . . . . . . . . . . . . . . . . . . . . . . . . . . 709,969 112,210,600Sensata Technologies Holding PLC(a). . . . . . . . . . . . . . . . . . 247,380 14,501,416
126,712,016Electronic Equipment, Instruments & Components — 1.5%Arrow Electronics Inc.(a) . . . . . . . . . . . . . . . . . . . . . . . . . . . . . . . 396,650 47,030,791Corning Inc. . . . . . . . . . . . . . . . . . . . . . . . . . . . . . . . . . . . . . . . . . . 2,270,770 95,054,432TE Connectivity Ltd. . . . . . . . . . . . . . . . . . . . . . . . . . . . . . . . . . . 654,940 96,584,002
238,669,225Energy Equipment & Services — 0.7%Baker Hughes Co., Class A . . . . . . . . . . . . . . . . . . . . . . . . . . . 5,415,438 115,023,903
Equity Real Estate Investment Trusts (REITs) — 1.8%Iron Mountain Inc. . . . . . . . . . . . . . . . . . . . . . . . . . . . . . . . . . . . . 757,436 33,145,399Omega Healthcare Investors Inc. . . . . . . . . . . . . . . . . . . . . . . 326,091 11,830,582Public Storage. . . . . . . . . . . . . . . . . . . . . . . . . . . . . . . . . . . . . . . . 353,498 110,461,055Simon Property Group Inc. . . . . . . . . . . . . . . . . . . . . . . . . . . . . 778,772 98,530,233Weyerhaeuser Co.. . . . . . . . . . . . . . . . . . . . . . . . . . . . . . . . . . . . 1,005,750 33,923,948
287,891,217Food & Staples Retailing — 1.8%Kroger Co. (The) . . . . . . . . . . . . . . . . . . . . . . . . . . . . . . . . . . . . . 2,955,616 120,293,571Walgreens Boots Alliance Inc. . . . . . . . . . . . . . . . . . . . . . . . . . 3,686,308 173,809,422
294,102,993Food Products — 2.0%Conagra Brands Inc. . . . . . . . . . . . . . . . . . . . . . . . . . . . . . . . . . . 1,317,188 44,112,626JM Smucker Co. (The) . . . . . . . . . . . . . . . . . . . . . . . . . . . . . . . . 408,269 53,528,149Kraft Heinz Co. (The) . . . . . . . . . . . . . . . . . . . . . . . . . . . . . . . . . 3,525,665 135,632,332Tyson Foods Inc., Class A. . . . . . . . . . . . . . . . . . . . . . . . . . . . . 1,294,219 92,484,890
325,757,997
Schedule of InvestmentsJuly 31, 2021
iShares� MSCI USA Value Factor ETF(Percentages shown are based on Net Assets)
64 2 0 2 1 I S H A R E S A N N U A L R E P O R T T O S H A R E H O L D E R S

Security s Value
Gas Utilities — 0.1%UGI Corp. . . . . . . . . . . . . . . . . . . . . . . . . . . . . . . . . . . . . . . . . . . . . 497,583 $ 22,883,842
Health Care Providers & Services — 5.2%Anthem Inc. . . . . . . . . . . . . . . . . . . . . . . . . . . . . . . . . . . . . . . . . . . 389,148 149,436,723Cardinal Health Inc.. . . . . . . . . . . . . . . . . . . . . . . . . . . . . . . . . . . 511,832 30,392,584Centene Corp.(a). . . . . . . . . . . . . . . . . . . . . . . . . . . . . . . . . . . . . . 1,269,119 87,074,255Cigna Corp. . . . . . . . . . . . . . . . . . . . . . . . . . . . . . . . . . . . . . . . . . . 786,832 180,570,076CVS Health Corp.. . . . . . . . . . . . . . . . . . . . . . . . . . . . . . . . . . . . . 3,344,924 275,487,941DaVita Inc.(a)(b) . . . . . . . . . . . . . . . . . . . . . . . . . . . . . . . . . . . . . . . 106,050 12,752,513McKesson Corp. . . . . . . . . . . . . . . . . . . . . . . . . . . . . . . . . . . . . . . 283,980 57,883,643Quest Diagnostics Inc. . . . . . . . . . . . . . . . . . . . . . . . . . . . . . . . . 135,063 19,151,933Universal Health Services Inc., Class B . . . . . . . . . . . . . . . . 155,680 24,972,629
837,722,297Household Durables — 3.4%DR Horton Inc. . . . . . . . . . . . . . . . . . . . . . . . . . . . . . . . . . . . . . . . 1,367,156 130,467,697Lennar Corp., Class A . . . . . . . . . . . . . . . . . . . . . . . . . . . . . . . . 1,574,758 165,585,804Mohawk Industries Inc.(a). . . . . . . . . . . . . . . . . . . . . . . . . . . . . . 319,153 62,202,920Newell Brands Inc.. . . . . . . . . . . . . . . . . . . . . . . . . . . . . . . . . . . . 1,678,743 41,548,889PulteGroup Inc.. . . . . . . . . . . . . . . . . . . . . . . . . . . . . . . . . . . . . . . 1,444,968 79,285,394Whirlpool Corp. . . . . . . . . . . . . . . . . . . . . . . . . . . . . . . . . . . . . . . . 268,254 59,428,991
538,519,695Independent Power and Renewable Electricity Producers — 0.3%Vistra Corp. . . . . . . . . . . . . . . . . . . . . . . . . . . . . . . . . . . . . . . . . . . 2,198,995 42,110,754
Insurance — 2.8%American International Group Inc. . . . . . . . . . . . . . . . . . . . . . 2,150,248 101,814,243Athene Holding Ltd., Class A(a) . . . . . . . . . . . . . . . . . . . . . . . . 396,799 25,641,151Everest Re Group Ltd. . . . . . . . . . . . . . . . . . . . . . . . . . . . . . . . . 61,904 15,651,188Hartford Financial Services Group Inc. (The) . . . . . . . . . . . 401,288 25,529,943Lincoln National Corp. . . . . . . . . . . . . . . . . . . . . . . . . . . . . . . . . 548,951 33,826,361Loews Corp.. . . . . . . . . . . . . . . . . . . . . . . . . . . . . . . . . . . . . . . . . . 393,386 21,097,291MetLife Inc.. . . . . . . . . . . . . . . . . . . . . . . . . . . . . . . . . . . . . . . . . . . 1,560,868 90,062,084Principal Financial Group Inc. . . . . . . . . . . . . . . . . . . . . . . . . . 432,663 26,881,352Prudential Financial Inc.. . . . . . . . . . . . . . . . . . . . . . . . . . . . . . . 899,026 90,154,327Reinsurance Group of America Inc. . . . . . . . . . . . . . . . . . . . . 111,798 12,317,904
442,975,844IT Services — 5.7%Cognizant Technology Solutions Corp., Class A . . . . . . . . 1,174,646 86,371,720Fidelity National Information Services Inc.. . . . . . . . . . . . . . 1,326,700 197,744,635Fiserv Inc.(a) . . . . . . . . . . . . . . . . . . . . . . . . . . . . . . . . . . . . . . . . . . 791,313 91,088,039Global Payments Inc. . . . . . . . . . . . . . . . . . . . . . . . . . . . . . . . . . 356,563 68,962,850International Business Machines Corp. . . . . . . . . . . . . . . . . 3,122,955 440,211,737Western Union Co. (The). . . . . . . . . . . . . . . . . . . . . . . . . . . . . . 780,251 18,109,626
902,488,607Machinery — 1.4%Cummins Inc.. . . . . . . . . . . . . . . . . . . . . . . . . . . . . . . . . . . . . . . . . 333,155 77,325,276PACCAR Inc. . . . . . . . . . . . . . . . . . . . . . . . . . . . . . . . . . . . . . . . . . 900,984 74,772,662Snap-on Inc. . . . . . . . . . . . . . . . . . . . . . . . . . . . . . . . . . . . . . . . . . 101,242 22,068,731Westinghouse Air Brake Technologies Corp. . . . . . . . . . . . 548,797 46,576,401
220,743,070Media — 2.4%Discovery Inc., Class A(a)(b). . . . . . . . . . . . . . . . . . . . . . . . . . . . 889,519 25,804,946Discovery Inc., Class C, NVS(a). . . . . . . . . . . . . . . . . . . . . . . . 1,997,256 54,145,610DISH Network Corp., Class A(a) . . . . . . . . . . . . . . . . . . . . . . . 1,018,435 42,662,242Fox Corp., Class A, NVS . . . . . . . . . . . . . . . . . . . . . . . . . . . . . . 1,115,208 39,768,318Fox Corp., Class B. . . . . . . . . . . . . . . . . . . . . . . . . . . . . . . . . . . . 543,355 18,061,120Interpublic Group of Companies Inc. (The) . . . . . . . . . . . . . 1,086,964 38,435,047Liberty Media Corp.-Liberty SiriusXM, Class A(a)(b). . . . . . 276,922 12,929,488
Security s Value
Media (continued)Liberty Media Corp.-Liberty SiriusXM,
Class C, NVS(a)(b) . . . . . . . . . . . . . . . . . . . . . . . . . . . . . . . . . . 582,671 $ 26,919,400ViacomCBS Inc., Class B, NVS. . . . . . . . . . . . . . . . . . . . . . . . 3,077,795 125,974,150
384,700,321Metals & Mining — 0.7%Nucor Corp. . . . . . . . . . . . . . . . . . . . . . . . . . . . . . . . . . . . . . . . . . . 761,405 79,201,348Steel Dynamics Inc.. . . . . . . . . . . . . . . . . . . . . . . . . . . . . . . . . . . 580,664 37,423,795
116,625,143Mortgage Real Estate Investment — 0.3%AGNC Investment Corp. . . . . . . . . . . . . . . . . . . . . . . . . . . . . . . 1,333,616 21,164,486Annaly Capital Management Inc. . . . . . . . . . . . . . . . . . . . . . . 3,179,657 26,995,288
48,159,774Multiline Retail — 2.4%Target Corp. . . . . . . . . . . . . . . . . . . . . . . . . . . . . . . . . . . . . . . . . . . 1,454,632 379,731,684
Oil, Gas & Consumable Fuels — 1.7%Devon Energy Corp. . . . . . . . . . . . . . . . . . . . . . . . . . . . . . . . . . . 1,375,315 35,538,140EOG Resources Inc. . . . . . . . . . . . . . . . . . . . . . . . . . . . . . . . . . . 1,737,692 126,608,239Kinder Morgan Inc. . . . . . . . . . . . . . . . . . . . . . . . . . . . . . . . . . . . 6,254,058 108,695,528
270,841,907Pharmaceuticals — 4.4%Bristol-Myers Squibb Co.. . . . . . . . . . . . . . . . . . . . . . . . . . . . . . 4,095,724 277,976,788Jazz Pharmaceuticals PLC(a) . . . . . . . . . . . . . . . . . . . . . . . . . . 121,377 20,575,829Pfizer Inc. . . . . . . . . . . . . . . . . . . . . . . . . . . . . . . . . . . . . . . . . . . . . 8,097,517 346,654,703Viatris Inc.. . . . . . . . . . . . . . . . . . . . . . . . . . . . . . . . . . . . . . . . . . . . 3,943,480 55,484,763
700,692,083Professional Services — 0.2%Clarivate PLC(a)(b) . . . . . . . . . . . . . . . . . . . . . . . . . . . . . . . . . . . . 375,022 8,550,502Leidos Holdings Inc. . . . . . . . . . . . . . . . . . . . . . . . . . . . . . . . . . . 252,006 26,818,478
35,368,980Real Estate Management & Development — 1.1%CBRE Group Inc., Class A(a) . . . . . . . . . . . . . . . . . . . . . . . . . . 1,786,299 172,306,402
Road & Rail — 0.3%AMERCO . . . . . . . . . . . . . . . . . . . . . . . . . . . . . . . . . . . . . . . . . . . . 26,831 15,775,555Knight-Swift Transportation Holdings Inc. . . . . . . . . . . . . . . 632,343 31,421,123
47,196,678Semiconductors & Semiconductor Equipment — 12.8%Applied Materials Inc. . . . . . . . . . . . . . . . . . . . . . . . . . . . . . . . . . 2,009,997 281,258,880Intel Corp. . . . . . . . . . . . . . . . . . . . . . . . . . . . . . . . . . . . . . . . . . . . . 18,219,697 978,762,123Micron Technology Inc.(a). . . . . . . . . . . . . . . . . . . . . . . . . . . . . . 6,462,039 501,324,986NXP Semiconductors NV. . . . . . . . . . . . . . . . . . . . . . . . . . . . . . 519,596 107,239,418ON Semiconductor Corp.(a) . . . . . . . . . . . . . . . . . . . . . . . . . . . 1,088,991 42,535,988Qorvo Inc.(a)(b) . . . . . . . . . . . . . . . . . . . . . . . . . . . . . . . . . . . . . . . . 346,986 65,785,076Skyworks Solutions Inc. . . . . . . . . . . . . . . . . . . . . . . . . . . . . . . . 348,176 64,241,954
2,041,148,425Software — 0.2%SS&C Technologies Holdings Inc. . . . . . . . . . . . . . . . . . . . . . 473,707 37,133,892
Specialty Retail — 0.5%Best Buy Co. Inc. . . . . . . . . . . . . . . . . . . . . . . . . . . . . . . . . . . . . . 729,741 81,986,401
Technology Hardware, Storage & Peripherals — 3.4%Dell Technologies Inc., Class C(a) . . . . . . . . . . . . . . . . . . . . . . 726,657 70,209,599Hewlett Packard Enterprise Co. . . . . . . . . . . . . . . . . . . . . . . . 7,712,955 111,837,847HP Inc. . . . . . . . . . . . . . . . . . . . . . . . . . . . . . . . . . . . . . . . . . . . . . . . 5,539,502 159,925,423NetApp Inc. . . . . . . . . . . . . . . . . . . . . . . . . . . . . . . . . . . . . . . . . . . 491,795 39,141,964Seagate Technology Holdings PLC . . . . . . . . . . . . . . . . . . . . 742,163 65,236,128
Schedule of Investments (continued)
July 31, 2021
iShares� MSCI USA Value Factor ETF(Percentages shown are based on Net Assets)
S C H E D U L E O F I N V E S T M E N T S 65

Security s Value
Technology Hardware, Storage & Peripherals (continued)Western Digital Corp.(a) . . . . . . . . . . . . . . . . . . . . . . . . . . . . . . . 1,458,414 $ 94,694,821
541,045,782Tobacco — 1.4%Altria Group Inc. . . . . . . . . . . . . . . . . . . . . . . . . . . . . . . . . . . . . . . 4,602,639 221,110,778
Trading Companies & Distributors — 0.5%United Rentals Inc.(a) . . . . . . . . . . . . . . . . . . . . . . . . . . . . . . . . . 232,255 76,539,635
Total Common Stocks — 99.8%(Cost: $13,731,181,787) . . . . . . . . . . . . . . . . . . . . . . . . . . . . . . . . . . . . . . . . 15,913,206,254
Short-Term InvestmentsMoney Market Funds — 0.3%BlackRock Cash Funds: Institutional, SL Agency
Shares, 0.06%(c)(d)(e) . . . . . . . . . . . . . . . . . . . . . . . . . . . . . . . 16,313,702 16,321,859BlackRock Cash Funds: Treasury, SL Agency Shares,
0.00%(c)(d) . . . . . . . . . . . . . . . . . . . . . . . . . . . . . . . . . . . . . . . . . 25,377,000 25,377,000
41,698,859
Total Short-Term Investments — 0.3%(Cost: $41,698,218) . . . . . . . . . . . . . . . . . . . . . . . . . . . . . . . . . . . . . . . . . . . . 41,698,859
Total Investments in Securities — 100.1%(Cost: $13,772,880,005) . . . . . . . . . . . . . . . . . . . . . . . . . . . . . . . . . . . . . . . . 15,954,905,113
Other Assets, Less Liabilities — (0.1)%. . . . . . . . . . . . . . . . . . . . . . . . . . . (9,216,476)
Net Assets — 100.0% . . . . . . . . . . . . . . . . . . . . . . . . . . . . . . . . . . . . . . . . . . . . . $ 15,945,688,637
(a) Non-income producing security.(b) All or a portion of this security is on loan.(c) Affiliate of the Fund.(d) Annualized 7-day yield as of period-end.(e) All or a portion of this security was purchased with cash collateral received from loaned
securities.
Affiliates
Investments in issuers considered to be affiliate(s) of the Fund during the year ended July 31, 2021 for purposes of Section 2(a)(3) of the Investment Company Act of 1940,as amended, were as follows:
Affiliated IssuerValue at
07/31/20Purchases
at CostProceeds
from SalesNet Realized
Gain (Loss)
Change inUnrealized
Appreciation(Depreciation)
Value at07/31/21
SharesHeld at
07/31/21 Income
CapitalGain
Distributionsfrom
UnderlyingFunds
BlackRock Cash Funds: Institutional, SLAgency Shares . . . . . . . . . . . . . . . . . . . . . . . . . $54,608,499 $ — $(38,257,797)(a) $ 27,119 $ (55,962) $16,321,859 16,313,702 $131,908(b) $ —
BlackRock Cash Funds: Treasury, SLAgency Shares . . . . . . . . . . . . . . . . . . . . . . . . . 17,097,000 8,280,000(a) — — — 25,377,000 25,377,000 7,772 —
$ 27,119 $ (55,962) $41,698,859 $139,680 $ —
(a) Represents net amount purchased (sold).(b) All or a portion represents securities lending income earned from the reinvestment of cash collateral from loaned securities, net of fees and collateral investment expenses, and other
payments to and from borrowers of securities.
Futures Contracts
DescriptionNumber ofContracts
ExpirationDate
NotionalAmount
(000)
Value/Unrealized
Appreciation(Depreciation)
Long ContractsRussell 2000 E-Mini Index . . . . . . . . . . . . . . . . . . . . . . . . . . . . . . . . . . . . . . . . . . . . . . . . . . . . . . . . . . . . . . . . . . . . . . . . . . . . . . . . . . . . . . . . . . . 128 09/17/21 $14,218 $ (19,558)
Schedule of Investments (continued)
July 31, 2021
iShares� MSCI USA Value Factor ETF(Percentages shown are based on Net Assets)
66 2 0 2 1 I S H A R E S A N N U A L R E P O R T T O S H A R E H O L D E R S

Futures Contracts (continued)
DescriptionNumber ofContracts
ExpirationDate
NotionalAmount
(000)
Value/Unrealized
Appreciation(Depreciation)
S&P 500 E-Mini Index . . . . . . . . . . . . . . . . . . . . . . . . . . . . . . . . . . . . . . . . . . . . . . . . . . . . . . . . . . . . . . . . . . . . . . . . . . . . . . . . . . . . . . . . . . . . . . . 76 09/17/21 $16,680 $ 510,762
$ 491,204
Derivative Financial Instruments Categorized by Risk Exposure
As of July 31, 2021, the fair values of derivative financial instruments located in the Statements of Assets and Liabilities were as follows:
EquityContracts
Assets — Derivative Financial InstrumentsFutures contracts
Unrealized appreciation on futures contracts(a) . . . . . . . . . . . . . . . . . . . . . . . . . . . . . . . . . . . . . . . . . . . . . . . . . . . . . . . . . . . . . . . . . . . . . . . . . . . . . . . . . . . . . . . . . . . . . . . . . . . . . . . . . . . . . . . . . $510,762
Liabilities — Derivative Financial InstrumentsFutures contracts
Unrealized depreciation on futures contracts(a) . . . . . . . . . . . . . . . . . . . . . . . . . . . . . . . . . . . . . . . . . . . . . . . . . . . . . . . . . . . . . . . . . . . . . . . . . . . . . . . . . . . . . . . . . . . . . . . . . . . . . . . . . . . . . . . . . $ 19,558
(a) Net cumulative appreciation (depreciation) on futures contracts are reported in the Schedule of Investments. In the Statements of Assets and Liabilities, only current day's variationmargin is reported in receivables or payables and the net cumulative unrealized appreciation (depreciation) is included in accumulated earnings (loss).
For the year ended July 31, 2021, the effect of derivative financial instruments in the Statements of Operations was as follows:
EquityContracts
Net Realized Gain (Loss) from:Futures contracts . . . . . . . . . . . . . . . . . . . . . . . . . . . . . . . . . . . . . . . . . . . . . . . . . . . . . . . . . . . . . . . . . . . . . . . . . . . . . . . . . . . . . . . . . . . . . . . . . . . . . . . . . . . . . . . . . . . . . . . . . . . . . . . . . . . . . . . . . . . . . $10,486,534
Net Change in Unrealized Appreciation (Depreciation) on:Futures contracts . . . . . . . . . . . . . . . . . . . . . . . . . . . . . . . . . . . . . . . . . . . . . . . . . . . . . . . . . . . . . . . . . . . . . . . . . . . . . . . . . . . . . . . . . . . . . . . . . . . . . . . . . . . . . . . . . . . . . . . . . . . . . . . . . . . . . . . . . . . . . $ (146,780)
Average Quarterly Balances of Outstanding Derivative Financial Instruments
Futures contracts:Average notional value of contracts — long . . . . . . . . . . . . . . . . . . . . . . . . . . . . . . . . . . . . . . . . . . . . . . . . . . . . . . . . . . . . . . . . . . . . . . . . . . . . . . . . . . . . . . . . . . . . . . . . . . . . . . . . . . . . . . . $23,370,043
For more information about the Fund’s investment risks regarding derivative financial instruments, refer to the Notes to Financial Statements.
Fair Value Measurements
Various inputs are used in determining the fair value of financial instruments. For description of the input levels and information about the Fund's policy regarding valuationof financial instruments, refer to the Notes to Financial Statements.
Schedule of Investments (continued)
July 31, 2021
iShares� MSCI USA Value Factor ETF
S C H E D U L E O F I N V E S T M E N T S 67

Fair Value Measurements (continued)
The following table summarizes the value of the Fund's investments according to the fair value hierarchy as of July 31, 2021. The breakdown of the Fund's investments intomajor categories is disclosed in the Schedule of Investments above.
Level 1 Level 2 Level 3 Total
InvestmentsAssets
Common Stocks. . . . . . . . . . . . . . . . . . . . . . . . . . . . . . . . . . . . . . . . . . . . . . . . . . . . . . . . . . . . . . . . . . . . . . . . $15,913,206,254 $ — $ — $15,913,206,254Money Market Funds . . . . . . . . . . . . . . . . . . . . . . . . . . . . . . . . . . . . . . . . . . . . . . . . . . . . . . . . . . . . . . . . . . . 41,698,859 — — 41,698,859
$15,954,905,113 $ — $ — $15,954,905,113
Derivative financial instruments(a)
AssetsFutures Contracts . . . . . . . . . . . . . . . . . . . . . . . . . . . . . . . . . . . . . . . . . . . . . . . . . . . . . . . . . . . . . . . . . . . . . . $ 510,762 $ — $ — $ 510,762
LiabilitiesFutures Contracts . . . . . . . . . . . . . . . . . . . . . . . . . . . . . . . . . . . . . . . . . . . . . . . . . . . . . . . . . . . . . . . . . . . . . . (19,558) — — (19,558)
$ 491,204 $ — $ — $ 491,204
(a) Shown at the unrealized appreciation (depreciation) on the contracts.
See notes to financial statements.
Schedule of Investments (continued)
July 31, 2021
iShares� MSCI USA Value Factor ETF
68 2 0 2 1 I S H A R E S A N N U A L R E P O R T T O S H A R E H O L D E R S

iSharesMSCI Intl
MomentumFactor ETF
iSharesMSCI Intl Quality
Factor ETF
iSharesMSCI Intl
Size FactorETF
iSharesMSCI Intl Value
Factor ETF
ASSETSInvestments in securities, at value (including securities on loan)(a):
Unaffiliated(b) . . . . . . . . . . . . . . . . . . . . . . . . . . . . . . . . . . . . . . . . . . . . . . . . . . . . . . . . . . . . . . . . . . . . . . . . . . . . . . . . . . . . . . $829,621,028 $3,729,226,574 $25,306,396 $1,120,009,542Affiliated(c) . . . . . . . . . . . . . . . . . . . . . . . . . . . . . . . . . . . . . . . . . . . . . . . . . . . . . . . . . . . . . . . . . . . . . . . . . . . . . . . . . . . . . . . . . 300,000 1,880,000 36,183 310,000
Cash. . . . . . . . . . . . . . . . . . . . . . . . . . . . . . . . . . . . . . . . . . . . . . . . . . . . . . . . . . . . . . . . . . . . . . . . . . . . . . . . . . . . . . . . . . . . . . . . . 4,031 1,223 5,792 6,272Foreign currency, at value(d). . . . . . . . . . . . . . . . . . . . . . . . . . . . . . . . . . . . . . . . . . . . . . . . . . . . . . . . . . . . . . . . . . . . . . . . . . . 1,089,441 5,444,395 43,458 2,052,374Foreign currency collateral pledged:
Futures contracts(e) . . . . . . . . . . . . . . . . . . . . . . . . . . . . . . . . . . . . . . . . . . . . . . . . . . . . . . . . . . . . . . . . . . . . . . . . . . . . . . . . 155,182 939,822 5,438 344,758Receivables:
Securities lending income — Affiliated . . . . . . . . . . . . . . . . . . . . . . . . . . . . . . . . . . . . . . . . . . . . . . . . . . . . . . . . . . . . . . 477 8 108 413Capital shares sold . . . . . . . . . . . . . . . . . . . . . . . . . . . . . . . . . . . . . . . . . . . . . . . . . . . . . . . . . . . . . . . . . . . . . . . . . . . . . . . . 2,149,513 1,000,231 — —Dividends . . . . . . . . . . . . . . . . . . . . . . . . . . . . . . . . . . . . . . . . . . . . . . . . . . . . . . . . . . . . . . . . . . . . . . . . . . . . . . . . . . . . . . . . . 465,016 2,657,387 22,331 1,883,124Tax reclaims . . . . . . . . . . . . . . . . . . . . . . . . . . . . . . . . . . . . . . . . . . . . . . . . . . . . . . . . . . . . . . . . . . . . . . . . . . . . . . . . . . . . . . . 683,057 5,156,056 6,921 896,621
Total assets . . . . . . . . . . . . . . . . . . . . . . . . . . . . . . . . . . . . . . . . . . . . . . . . . . . . . . . . . . . . . . . . . . . . . . . . . . . . . . . . . . . . . . . . . . 834,467,745 3,746,305,696 25,426,627 1,125,503,104
LIABILITIESCollateral on securities loaned, at value. . . . . . . . . . . . . . . . . . . . . . . . . . . . . . . . . . . . . . . . . . . . . . . . . . . . . . . . . . . . . . . . — — 36,181 —Payables:
Investments purchased . . . . . . . . . . . . . . . . . . . . . . . . . . . . . . . . . . . . . . . . . . . . . . . . . . . . . . . . . . . . . . . . . . . . . . . . . . . . 2,334,511 884,314 — —Variation margin on futures contracts . . . . . . . . . . . . . . . . . . . . . . . . . . . . . . . . . . . . . . . . . . . . . . . . . . . . . . . . . . . . . . . 13,413 34,127 247 21,232Investment advisory fees . . . . . . . . . . . . . . . . . . . . . . . . . . . . . . . . . . . . . . . . . . . . . . . . . . . . . . . . . . . . . . . . . . . . . . . . . . . 202,713 917,549 5,722 313,846
Total liabilities . . . . . . . . . . . . . . . . . . . . . . . . . . . . . . . . . . . . . . . . . . . . . . . . . . . . . . . . . . . . . . . . . . . . . . . . . . . . . . . . . . . . . . . . 2,550,637 1,835,990 42,150 335,078
NET ASSETS . . . . . . . . . . . . . . . . . . . . . . . . . . . . . . . . . . . . . . . . . . . . . . . . . . . . . . . . . . . . . . . . . . . . . . . . . . . . . . . . . . . . . . . . $831,917,108 $3,744,469,706 $25,384,477 $1,125,168,026
NET ASSETS CONSIST OF:Paid-in capital . . . . . . . . . . . . . . . . . . . . . . . . . . . . . . . . . . . . . . . . . . . . . . . . . . . . . . . . . . . . . . . . . . . . . . . . . . . . . . . . . . . . . . . . $711,884,920 $3,054,681,541 $22,830,277 $1,137,941,924Accumulated earnings (loss) . . . . . . . . . . . . . . . . . . . . . . . . . . . . . . . . . . . . . . . . . . . . . . . . . . . . . . . . . . . . . . . . . . . . . . . . . . 120,032,188 689,788,165 2,554,200 (12,773,898)
NET ASSETS . . . . . . . . . . . . . . . . . . . . . . . . . . . . . . . . . . . . . . . . . . . . . . . . . . . . . . . . . . . . . . . . . . . . . . . . . . . . . . . . . . . . . . . . $831,917,108 $3,744,469,706 $25,384,477 $1,125,168,026
Shares outstanding . . . . . . . . . . . . . . . . . . . . . . . . . . . . . . . . . . . . . . . . . . . . . . . . . . . . . . . . . . . . . . . . . . . . . . . . . . . . . . . . . . . 21,300,000 95,300,000 800,000 43,800,000
Net asset value. . . . . . . . . . . . . . . . . . . . . . . . . . . . . . . . . . . . . . . . . . . . . . . . . . . . . . . . . . . . . . . . . . . . . . . . . . . . . . . . . . . . . . . $ 39.06 $ 39.29 $ 31.73 $ 25.69
Shares authorized . . . . . . . . . . . . . . . . . . . . . . . . . . . . . . . . . . . . . . . . . . . . . . . . . . . . . . . . . . . . . . . . . . . . . . . . . . . . . . . . . . . . Unlimited Unlimited Unlimited Unlimited
Par value . . . . . . . . . . . . . . . . . . . . . . . . . . . . . . . . . . . . . . . . . . . . . . . . . . . . . . . . . . . . . . . . . . . . . . . . . . . . . . . . . . . . . . . . . . . . None None None None
(a) Securities loaned, at value . . . . . . . . . . . . . . . . . . . . . . . . . . . . . . . . . . . . . . . . . . . . . . . . . . . . . . . . . . . . . . . . . . . . . . . . $ — $ — $ 33,761 $ —(b) Investments, at cost — Unaffiliated . . . . . . . . . . . . . . . . . . . . . . . . . . . . . . . . . . . . . . . . . . . . . . . . . . . . . . . . . . . . . . . . $735,386,782 $3,035,483,208 $22,314,044 $1,099,593,938(c) Investments, at cost — Affiliated. . . . . . . . . . . . . . . . . . . . . . . . . . . . . . . . . . . . . . . . . . . . . . . . . . . . . . . . . . . . . . . . . . . $ 300,000 $ 1,880,000 $ 36,183 $ 310,000(d) Foreign currency, at cost . . . . . . . . . . . . . . . . . . . . . . . . . . . . . . . . . . . . . . . . . . . . . . . . . . . . . . . . . . . . . . . . . . . . . . . . . . $ 1,087,951 $ 5,425,974 $ 43,236 $ 2,045,303(e) Foreign currency collateral pledged, at cost . . . . . . . . . . . . . . . . . . . . . . . . . . . . . . . . . . . . . . . . . . . . . . . . . . . . . . . . $ 158,632 $ 975,026 $ 5,586 $ 351,340
See notes to financial statements.
Statements of Assets and LiabilitiesJuly 31, 2021
F I N A N C I A L S T A T E M E N T S 69
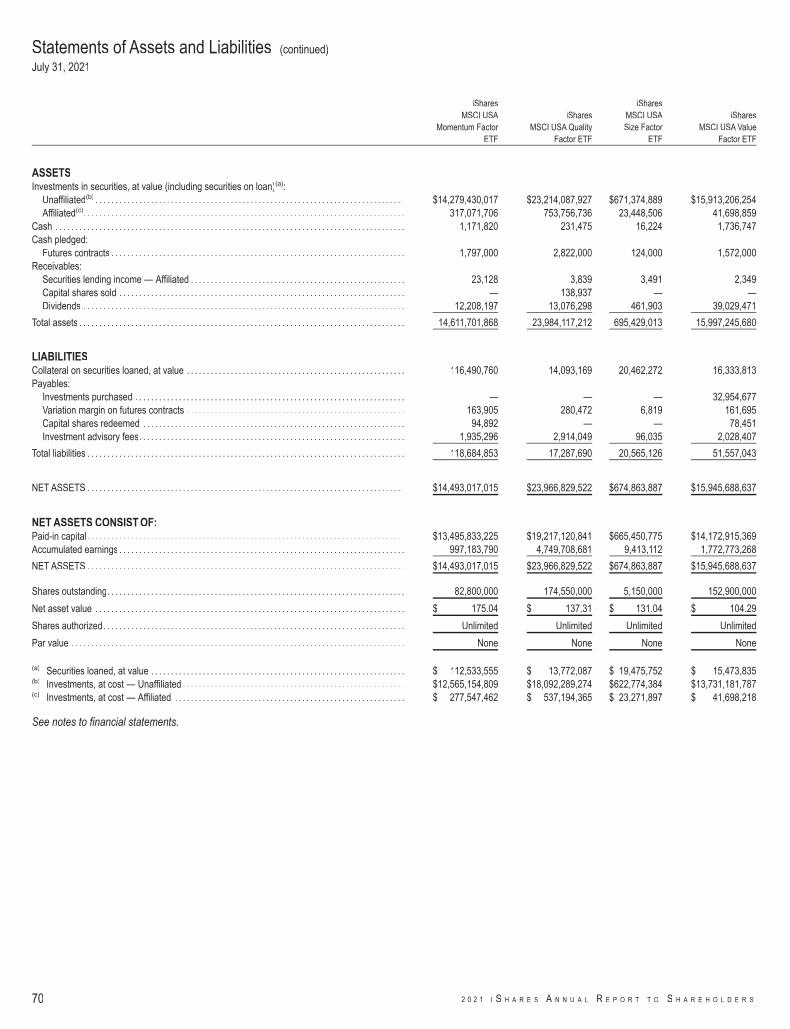
iSharesMSCI USA
Momentum FactorETF
iSharesMSCI USA Quality
Factor ETF
iSharesMSCI USASize Factor
ETF
iSharesMSCI USA Value
Factor ETF
ASSETSInvestments in securities, at value (including securities on loan)(a):
Unaffiliated(b) . . . . . . . . . . . . . . . . . . . . . . . . . . . . . . . . . . . . . . . . . . . . . . . . . . . . . . . . . . . . . . . . . . . . . . . . . . . . . . $14,279,430,017 $23,214,087,927 $671,374,889 $15,913,206,254Affiliated(c). . . . . . . . . . . . . . . . . . . . . . . . . . . . . . . . . . . . . . . . . . . . . . . . . . . . . . . . . . . . . . . . . . . . . . . . . . . . . . . . . 317,071,706 753,756,736 23,448,506 41,698,859
Cash . . . . . . . . . . . . . . . . . . . . . . . . . . . . . . . . . . . . . . . . . . . . . . . . . . . . . . . . . . . . . . . . . . . . . . . . . . . . . . . . . . . . . . . . 1,171,820 231,475 16,224 1,736,747Cash pledged:
Futures contracts . . . . . . . . . . . . . . . . . . . . . . . . . . . . . . . . . . . . . . . . . . . . . . . . . . . . . . . . . . . . . . . . . . . . . . . . . . 1,797,000 2,822,000 124,000 1,572,000Receivables:
Securities lending income — Affiliated . . . . . . . . . . . . . . . . . . . . . . . . . . . . . . . . . . . . . . . . . . . . . . . . . . . . . . 23,128 3,839 3,491 2,349Capital shares sold . . . . . . . . . . . . . . . . . . . . . . . . . . . . . . . . . . . . . . . . . . . . . . . . . . . . . . . . . . . . . . . . . . . . . . . . — 138,937 — —Dividends . . . . . . . . . . . . . . . . . . . . . . . . . . . . . . . . . . . . . . . . . . . . . . . . . . . . . . . . . . . . . . . . . . . . . . . . . . . . . . . . . 12,208,197 13,076,298 461,903 39,029,471
Total assets . . . . . . . . . . . . . . . . . . . . . . . . . . . . . . . . . . . . . . . . . . . . . . . . . . . . . . . . . . . . . . . . . . . . . . . . . . . . . . . . . . 14,611,701,868 23,984,117,212 695,429,013 15,997,245,680
LIABILITIESCollateral on securities loaned, at value . . . . . . . . . . . . . . . . . . . . . . . . . . . . . . . . . . . . . . . . . . . . . . . . . . . . . . . 116,490,760 14,093,169 20,462,272 16,333,813Payables:
Investments purchased . . . . . . . . . . . . . . . . . . . . . . . . . . . . . . . . . . . . . . . . . . . . . . . . . . . . . . . . . . . . . . . . . . . . — — — 32,954,677Variation margin on futures contracts . . . . . . . . . . . . . . . . . . . . . . . . . . . . . . . . . . . . . . . . . . . . . . . . . . . . . . . 163,905 280,472 6,819 161,695Capital shares redeemed . . . . . . . . . . . . . . . . . . . . . . . . . . . . . . . . . . . . . . . . . . . . . . . . . . . . . . . . . . . . . . . . . . 94,892 — — 78,451Investment advisory fees. . . . . . . . . . . . . . . . . . . . . . . . . . . . . . . . . . . . . . . . . . . . . . . . . . . . . . . . . . . . . . . . . . . 1,935,296 2,914,049 96,035 2,028,407
Total liabilities . . . . . . . . . . . . . . . . . . . . . . . . . . . . . . . . . . . . . . . . . . . . . . . . . . . . . . . . . . . . . . . . . . . . . . . . . . . . . . . . 118,684,853 17,287,690 20,565,126 51,557,043
NET ASSETS . . . . . . . . . . . . . . . . . . . . . . . . . . . . . . . . . . . . . . . . . . . . . . . . . . . . . . . . . . . . . . . . . . . . . . . . . . . . . . . . $14,493,017,015 $23,966,829,522 $674,863,887 $15,945,688,637
NET ASSETS CONSIST OF:Paid-in capital . . . . . . . . . . . . . . . . . . . . . . . . . . . . . . . . . . . . . . . . . . . . . . . . . . . . . . . . . . . . . . . . . . . . . . . . . . . . . . . . $13,495,833,225 $19,217,120,841 $665,450,775 $14,172,915,369Accumulated earnings . . . . . . . . . . . . . . . . . . . . . . . . . . . . . . . . . . . . . . . . . . . . . . . . . . . . . . . . . . . . . . . . . . . . . . . . 997,183,790 4,749,708,681 9,413,112 1,772,773,268
NET ASSETS . . . . . . . . . . . . . . . . . . . . . . . . . . . . . . . . . . . . . . . . . . . . . . . . . . . . . . . . . . . . . . . . . . . . . . . . . . . . . . . . $14,493,017,015 $23,966,829,522 $674,863,887 $15,945,688,637
Shares outstanding. . . . . . . . . . . . . . . . . . . . . . . . . . . . . . . . . . . . . . . . . . . . . . . . . . . . . . . . . . . . . . . . . . . . . . . . . . . 82,800,000 174,550,000 5,150,000 152,900,000
Net asset value . . . . . . . . . . . . . . . . . . . . . . . . . . . . . . . . . . . . . . . . . . . . . . . . . . . . . . . . . . . . . . . . . . . . . . . . . . . . . . $ 175.04 $ 137.31 $ 131.04 $ 104.29
Shares authorized. . . . . . . . . . . . . . . . . . . . . . . . . . . . . . . . . . . . . . . . . . . . . . . . . . . . . . . . . . . . . . . . . . . . . . . . . . . . Unlimited Unlimited Unlimited Unlimited
Par value . . . . . . . . . . . . . . . . . . . . . . . . . . . . . . . . . . . . . . . . . . . . . . . . . . . . . . . . . . . . . . . . . . . . . . . . . . . . . . . . . . . . None None None None
(a) Securities loaned, at value . . . . . . . . . . . . . . . . . . . . . . . . . . . . . . . . . . . . . . . . . . . . . . . . . . . . . . . . . . . . . . . . $ 112,533,555 $ 13,772,087 $ 19,475,752 $ 15,473,835(b) Investments, at cost — Unaffiliated . . . . . . . . . . . . . . . . . . . . . . . . . . . . . . . . . . . . . . . . . . . . . . . . . . . . . . . . $12,565,154,809 $18,092,289,274 $622,774,384 $13,731,181,787(c) Investments, at cost — Affiliated . . . . . . . . . . . . . . . . . . . . . . . . . . . . . . . . . . . . . . . . . . . . . . . . . . . . . . . . . . $ 277,547,462 $ 537,194,365 $ 23,271,897 $ 41,698,218
See notes to financial statements.
Statements of Assets and Liabilities (continued)
July 31, 2021
70 2 0 2 1 I S H A R E S A N N U A L R E P O R T T O S H A R E H O L D E R S

iSharesMSCI Intl
MomentumFactor ETF
iSharesMSCI Intl
QualityFactor ETF
iSharesMSCI Intl
Size FactorETF
iSharesMSCI Intl
Value FactorETF
INVESTMENT INCOMEDividends — Unaffiliated. . . . . . . . . . . . . . . . . . . . . . . . . . . . . . . . . . . . . . . . . . . . . . . . . . . . . . . . . . . . . . . . . . . . . . . . . . . . . . . . . . . . . . . $ 11,234,305 $ 74,297,570 $ 700,609 $ 27,562,315Dividends — Affiliated . . . . . . . . . . . . . . . . . . . . . . . . . . . . . . . . . . . . . . . . . . . . . . . . . . . . . . . . . . . . . . . . . . . . . . . . . . . . . . . . . . . . . . . . . 131 492 1 95Securities lending income — Affiliated — net . . . . . . . . . . . . . . . . . . . . . . . . . . . . . . . . . . . . . . . . . . . . . . . . . . . . . . . . . . . . . . . . . . . 4,897 19,824 1,983 25,106Foreign taxes withheld. . . . . . . . . . . . . . . . . . . . . . . . . . . . . . . . . . . . . . . . . . . . . . . . . . . . . . . . . . . . . . . . . . . . . . . . . . . . . . . . . . . . . . . . . (1,366,221) (7,075,013) (74,198) (2,279,928)
Total investment income. . . . . . . . . . . . . . . . . . . . . . . . . . . . . . . . . . . . . . . . . . . . . . . . . . . . . . . . . . . . . . . . . . . . . . . . . . . . . . . . . . . . . . . . . . 9,873,112 67,242,873 628,395 25,307,588
EXPENSESInvestment advisory fees . . . . . . . . . . . . . . . . . . . . . . . . . . . . . . . . . . . . . . . . . . . . . . . . . . . . . . . . . . . . . . . . . . . . . . . . . . . . . . . . . . . . . . 2,033,775 8,137,115 78,162 2,180,049Miscellaneous. . . . . . . . . . . . . . . . . . . . . . . . . . . . . . . . . . . . . . . . . . . . . . . . . . . . . . . . . . . . . . . . . . . . . . . . . . . . . . . . . . . . . . . . . . . . . . . . . 173 173 173 173
Total expenses. . . . . . . . . . . . . . . . . . . . . . . . . . . . . . . . . . . . . . . . . . . . . . . . . . . . . . . . . . . . . . . . . . . . . . . . . . . . . . . . . . . . . . . . . . . . . . . . . . . 2,033,948 8,137,288 78,335 2,180,222
Net investment income . . . . . . . . . . . . . . . . . . . . . . . . . . . . . . . . . . . . . . . . . . . . . . . . . . . . . . . . . . . . . . . . . . . . . . . . . . . . . . . . . . . . . . . . . . . 7,839,164 59,105,585 550,060 23,127,366
REALIZED AND UNREALIZED GAIN (LOSS)Net realized gain (loss) from:
Investments — Unaffiliated. . . . . . . . . . . . . . . . . . . . . . . . . . . . . . . . . . . . . . . . . . . . . . . . . . . . . . . . . . . . . . . . . . . . . . . . . . . . . . . . . . 59,381,410 50,652,617 173,750 (16,180,199)Investments — Affiliated . . . . . . . . . . . . . . . . . . . . . . . . . . . . . . . . . . . . . . . . . . . . . . . . . . . . . . . . . . . . . . . . . . . . . . . . . . . . . . . . . . . . (339) (3,355) 13 (1,564)In-kind redemptions — Unaffiliated . . . . . . . . . . . . . . . . . . . . . . . . . . . . . . . . . . . . . . . . . . . . . . . . . . . . . . . . . . . . . . . . . . . . . . . . . . 20,727,441 43,475,451 3,715,651 70,129,470Futures contracts . . . . . . . . . . . . . . . . . . . . . . . . . . . . . . . . . . . . . . . . . . . . . . . . . . . . . . . . . . . . . . . . . . . . . . . . . . . . . . . . . . . . . . . . . . . 582,763 3,008,878 26,187 941,856Foreign currency transactions . . . . . . . . . . . . . . . . . . . . . . . . . . . . . . . . . . . . . . . . . . . . . . . . . . . . . . . . . . . . . . . . . . . . . . . . . . . . . . . 126,552 199,416 1,360 82,833
Net realized gain . . . . . . . . . . . . . . . . . . . . . . . . . . . . . . . . . . . . . . . . . . . . . . . . . . . . . . . . . . . . . . . . . . . . . . . . . . . . . . . . . . . . . . . . . . . . . . 80,817,827 97,333,007 3,916,961 54,972,396
Net change in unrealized appreciation (depreciation) on:Investments — Unaffiliated. . . . . . . . . . . . . . . . . . . . . . . . . . . . . . . . . . . . . . . . . . . . . . . . . . . . . . . . . . . . . . . . . . . . . . . . . . . . . . . . . . 29,529,776 550,663,984 3,037,996 89,547,982Investments — Affiliated . . . . . . . . . . . . . . . . . . . . . . . . . . . . . . . . . . . . . . . . . . . . . . . . . . . . . . . . . . . . . . . . . . . . . . . . . . . . . . . . . . . . 2 (344) (121) (184)Futures contracts . . . . . . . . . . . . . . . . . . . . . . . . . . . . . . . . . . . . . . . . . . . . . . . . . . . . . . . . . . . . . . . . . . . . . . . . . . . . . . . . . . . . . . . . . . . 67,739 94,690 1,783 16,960Foreign currency translations. . . . . . . . . . . . . . . . . . . . . . . . . . . . . . . . . . . . . . . . . . . . . . . . . . . . . . . . . . . . . . . . . . . . . . . . . . . . . . . . (32,800) (138,470) (1,128) (55,932)
Net change in unrealized appreciation (depreciation) . . . . . . . . . . . . . . . . . . . . . . . . . . . . . . . . . . . . . . . . . . . . . . . . . . . . . . . . . . . . 29,564,717 550,619,860 3,038,530 89,508,826
Net realized and unrealized gain . . . . . . . . . . . . . . . . . . . . . . . . . . . . . . . . . . . . . . . . . . . . . . . . . . . . . . . . . . . . . . . . . . . . . . . . . . . . . . . . . . 110,382,544 647,952,867 6,955,491 144,481,222
NET INCREASE IN NET ASSETS RESULTING FROM OPERATIONS. . . . . . . . . . . . . . . . . . . . . . . . . . . . . . . . . . . . . . . . . . . . . . $118,221,708 $707,058,452 $7,505,551 $167,608,588
See notes to financial statements.
Statements of OperationsYear Ended July 31, 2021
F I N A N C I A L S T A T E M E N T S 71

iSharesMSCI USA
Momentum FactorETF
iSharesMSCI USA Quality
Factor ETF
iSharesMSCI USASize Factor
ETF
iSharesMSCI USA Value
Factor ETF
INVESTMENT INCOMEDividends — Unaffiliated. . . . . . . . . . . . . . . . . . . . . . . . . . . . . . . . . . . . . . . . . . . . . . . . . . . . . . . . . . . . . . . . . . . . . . . . . $ 89,415,887 $ 318,864,164 $ 12,837,383 $ 294,015,673Dividends — Affiliated . . . . . . . . . . . . . . . . . . . . . . . . . . . . . . . . . . . . . . . . . . . . . . . . . . . . . . . . . . . . . . . . . . . . . . . . . . . 2,666,784 11,135,732 29,827 7,772Securities lending income — Affiliated — net . . . . . . . . . . . . . . . . . . . . . . . . . . . . . . . . . . . . . . . . . . . . . . . . . . . . . 549,799 81,766 57,152 131,908Foreign taxes withheld. . . . . . . . . . . . . . . . . . . . . . . . . . . . . . . . . . . . . . . . . . . . . . . . . . . . . . . . . . . . . . . . . . . . . . . . . . . (88,945) — (3,850) (112,704)
Total investment income. . . . . . . . . . . . . . . . . . . . . . . . . . . . . . . . . . . . . . . . . . . . . . . . . . . . . . . . . . . . . . . . . . . . . . . . . . . . 92,543,525 330,081,662 12,920,512 294,042,649
EXPENSESInvestment advisory fees . . . . . . . . . . . . . . . . . . . . . . . . . . . . . . . . . . . . . . . . . . . . . . . . . . . . . . . . . . . . . . . . . . . . . . . . 20,388,160 30,863,547 1,304,962 16,859,088Miscellaneous. . . . . . . . . . . . . . . . . . . . . . . . . . . . . . . . . . . . . . . . . . . . . . . . . . . . . . . . . . . . . . . . . . . . . . . . . . . . . . . . . . . 173 173 173 173
Total expenses. . . . . . . . . . . . . . . . . . . . . . . . . . . . . . . . . . . . . . . . . . . . . . . . . . . . . . . . . . . . . . . . . . . . . . . . . . . . . . . . . . . . . 20,388,333 30,863,720 1,305,135 16,859,261
Net investment income . . . . . . . . . . . . . . . . . . . . . . . . . . . . . . . . . . . . . . . . . . . . . . . . . . . . . . . . . . . . . . . . . . . . . . . . . . . . . 72,155,192 299,217,942 11,615,377 277,183,388
REALIZED AND UNREALIZED GAIN (LOSS)Net realized gain (loss) from:
Investments — Unaffiliated. . . . . . . . . . . . . . . . . . . . . . . . . . . . . . . . . . . . . . . . . . . . . . . . . . . . . . . . . . . . . . . . . . . . 456,685,559 (17,223,432) (4,981,921) (31,515,361)Investments — Affiliated . . . . . . . . . . . . . . . . . . . . . . . . . . . . . . . . . . . . . . . . . . . . . . . . . . . . . . . . . . . . . . . . . . . . . . (8,306) (135,238) 20,779 27,119In-kind redemptions — Unaffiliated . . . . . . . . . . . . . . . . . . . . . . . . . . . . . . . . . . . . . . . . . . . . . . . . . . . . . . . . . . . . 2,773,445,378 2,717,697,973 242,515,851 873,463,884In-kind redemptions — Affiliated . . . . . . . . . . . . . . . . . . . . . . . . . . . . . . . . . . . . . . . . . . . . . . . . . . . . . . . . . . . . . . . 21,033,790 60,314,788 528,824 —Futures contracts . . . . . . . . . . . . . . . . . . . . . . . . . . . . . . . . . . . . . . . . . . . . . . . . . . . . . . . . . . . . . . . . . . . . . . . . . . . . . 5,025,062 13,610,270 647,298 10,486,534
Net realized gain . . . . . . . . . . . . . . . . . . . . . . . . . . . . . . . . . . . . . . . . . . . . . . . . . . . . . . . . . . . . . . . . . . . . . . . . . . . . . . . . 3,256,181,483 2,774,264,361 238,730,831 852,462,176
Net change in unrealized appreciation (depreciation) on:Investments — Unaffiliated. . . . . . . . . . . . . . . . . . . . . . . . . . . . . . . . . . . . . . . . . . . . . . . . . . . . . . . . . . . . . . . . . . . . (427,133,273) 3,504,119,538 63,346,801 2,512,259,439Investments — Affiliated . . . . . . . . . . . . . . . . . . . . . . . . . . . . . . . . . . . . . . . . . . . . . . . . . . . . . . . . . . . . . . . . . . . . . . 23,921,604 136,608,097 17,612 (55,962)Futures contracts . . . . . . . . . . . . . . . . . . . . . . . . . . . . . . . . . . . . . . . . . . . . . . . . . . . . . . . . . . . . . . . . . . . . . . . . . . . . . 302,648 (1,576,246) (53,514) (146,780)
Net change in unrealized appreciation (depreciation) . . . . . . . . . . . . . . . . . . . . . . . . . . . . . . . . . . . . . . . . . . . . . . (402,909,021) 3,639,151,389 63,310,899 2,512,056,697
Net realized and unrealized gain . . . . . . . . . . . . . . . . . . . . . . . . . . . . . . . . . . . . . . . . . . . . . . . . . . . . . . . . . . . . . . . . . . . . 2,853,272,462 6,413,415,750 302,041,730 3,364,518,873
NET INCREASE IN NET ASSETS RESULTING FROM OPERATIONS. . . . . . . . . . . . . . . . . . . . . . . . . . . . . . . . $2,925,427,654 $6,712,633,692 $313,657,107 $3,641,702,261
See notes to financial statements.
Statements of Operations (continued)
Year Ended July 31, 2021
72 2 0 2 1 I S H A R E S A N N U A L R E P O R T T O S H A R E H O L D E R S

iSharesMSCI Intl Momentum Factor ETF
iSharesMSCI Intl Quality Factor ETF
Year Ended07/31/21
Year Ended07/31/20
Year Ended07/31/21
Year Ended07/31/20
INCREASE (DECREASE) IN NET ASSETS
OPERATIONSNet investment income. . . . . . . . . . . . . . . . . . . . . . . . . . . . . . . . . . . . . . . . . . . . . . . . . . . . . . . . . . . . . . . . . . . . . . . . $ 7,839,164 $ 3,660,366 $ 59,105,585 $ 27,215,802Net realized gain (loss). . . . . . . . . . . . . . . . . . . . . . . . . . . . . . . . . . . . . . . . . . . . . . . . . . . . . . . . . . . . . . . . . . . . . . . . 80,817,827 (12,744,860) 97,333,007 (35,636,546)Net change in unrealized appreciation (depreciation) . . . . . . . . . . . . . . . . . . . . . . . . . . . . . . . . . . . . . . . . . . . 29,564,717 51,591,636 550,619,860 80,108,237
Net increase in net assets resulting from operations. . . . . . . . . . . . . . . . . . . . . . . . . . . . . . . . . . . . . . . . . . . . . . . 118,221,708 42,507,142 707,058,452 71,687,493
DISTRIBUTIONS TO SHAREHOLDERS(a)
Decrease in net assets resulting from distributions to shareholders. . . . . . . . . . . . . . . . . . . . . . . . . . . . . . . . . (8,730,181) (3,744,026) (57,477,491) (26,454,635)
CAPITAL SHARE TRANSACTIONSNet increase in net assets derived from capital share transactions . . . . . . . . . . . . . . . . . . . . . . . . . . . . . . . . . 316,672,682 202,101,345 1,439,257,212 788,158,493
NET ASSETSTotal increase in net assets . . . . . . . . . . . . . . . . . . . . . . . . . . . . . . . . . . . . . . . . . . . . . . . . . . . . . . . . . . . . . . . . . . . . . . 426,164,209 240,864,461 2,088,838,173 833,391,351Beginning of year. . . . . . . . . . . . . . . . . . . . . . . . . . . . . . . . . . . . . . . . . . . . . . . . . . . . . . . . . . . . . . . . . . . . . . . . . . . . . . . . 405,752,899 164,888,438 1,655,631,533 822,240,182
End of year . . . . . . . . . . . . . . . . . . . . . . . . . . . . . . . . . . . . . . . . . . . . . . . . . . . . . . . . . . . . . . . . . . . . . . . . . . . . . . . . . . . . . $831,917,108 $405,752,899 $3,744,469,706 $1,655,631,533
(a) Distributions for annual periods determined in accordance with U.S. federal income tax regulations.
See notes to financial statements.
Statements of Changes in Net Assets
F I N A N C I A L S T A T E M E N T S 73

iSharesMSCI Intl Size Factor ETF
iSharesMSCI Intl Value Factor ETF
Year Ended07/31/21
Year Ended07/31/20
Year Ended07/31/21
Year Ended07/31/20
INCREASE (DECREASE) IN NET ASSETS
OPERATIONSNet investment income . . . . . . . . . . . . . . . . . . . . . . . . . . . . . . . . . . . . . . . . . . . . . . . . . . . . . . . . . . . . . . . . . . . . . . . . . . . $ 550,060 $ 233,356 $ 23,127,366 $ 10,576,190Net realized gain (loss) . . . . . . . . . . . . . . . . . . . . . . . . . . . . . . . . . . . . . . . . . . . . . . . . . . . . . . . . . . . . . . . . . . . . . . . . . . . 3,916,961 254,619 54,972,396 (9,241,038)Net change in unrealized appreciation (depreciation) . . . . . . . . . . . . . . . . . . . . . . . . . . . . . . . . . . . . . . . . . . . . . . . 3,038,530 20,524 89,508,826 (49,317,625)
Net increase (decrease) in net assets resulting from operations . . . . . . . . . . . . . . . . . . . . . . . . . . . . . . . . . . . . . . . 7,505,551 508,499 167,608,588 (47,982,473)
DISTRIBUTIONS TO SHAREHOLDERS(a)
Decrease in net assets resulting from distributions to shareholders . . . . . . . . . . . . . . . . . . . . . . . . . . . . . . . . . . . . (608,671) (214,337) (21,160,486) (10,881,712)
CAPITAL SHARE TRANSACTIONSNet increase (decrease) in net assets derived from capital share transactions. . . . . . . . . . . . . . . . . . . . . . . . . . (1,198,400) 14,190,116 527,226,102 196,136,419
NET ASSETSTotal increase in net assets. . . . . . . . . . . . . . . . . . . . . . . . . . . . . . . . . . . . . . . . . . . . . . . . . . . . . . . . . . . . . . . . . . . . . . . . . . 5,698,480 14,484,278 673,674,204 137,272,234Beginning of year . . . . . . . . . . . . . . . . . . . . . . . . . . . . . . . . . . . . . . . . . . . . . . . . . . . . . . . . . . . . . . . . . . . . . . . . . . . . . . . . . . . 19,685,997 5,201,719 451,493,822 314,221,588
End of year . . . . . . . . . . . . . . . . . . . . . . . . . . . . . . . . . . . . . . . . . . . . . . . . . . . . . . . . . . . . . . . . . . . . . . . . . . . . . . . . . . . . . . . . . $25,384,477 $19,685,997 $1,125,168,026 $451,493,822
(a) Distributions for annual periods determined in accordance with U.S. federal income tax regulations.
See notes to financial statements.
Statements of Changes in Net Assets (continued)
74 2 0 2 1 I S H A R E S A N N U A L R E P O R T T O S H A R E H O L D E R S

iSharesMSCI USA Momentum Factor ETF
iSharesMSCI USA Quality Factor ETF
Year Ended07/31/21
Year Ended07/31/20
Year Ended07/31/21
Year Ended07/31/20
INCREASE (DECREASE) IN NET ASSETS
OPERATIONSNet investment income. . . . . . . . . . . . . . . . . . . . . . . . . . . . . . . . . . . . . . . . . . . . . . . . . . . . . . . . . . . . . . . . . $ 72,155,192 $ 116,670,113 $ 299,217,942 $ 280,535,666Net realized gain . . . . . . . . . . . . . . . . . . . . . . . . . . . . . . . . . . . . . . . . . . . . . . . . . . . . . . . . . . . . . . . . . . . . . . 3,256,181,483 257,670,712 2,774,264,361 793,307,627Net change in unrealized appreciation (depreciation) . . . . . . . . . . . . . . . . . . . . . . . . . . . . . . . . . . . . (402,909,021) 1,035,993,579 3,639,151,389 658,010,658
Net increase in net assets resulting from operations. . . . . . . . . . . . . . . . . . . . . . . . . . . . . . . . . . . . . . . . 2,925,427,654 1,410,334,404 6,712,633,692 1,731,853,951
DISTRIBUTIONS TO SHAREHOLDERS(a)
Decrease in net assets resulting from distributions to shareholders . . . . . . . . . . . . . . . . . . . . . . . . . (63,350,348) (134,237,347) (308,371,260) (256,875,797)
CAPITAL SHARE TRANSACTIONSNet increase (decrease) in net assets derived from capital share transactions . . . . . . . . . . . . . . . 983,484,853 (804,812,045) (1,288,575,824) 6,462,385,022
NET ASSETSTotal increase in net assets . . . . . . . . . . . . . . . . . . . . . . . . . . . . . . . . . . . . . . . . . . . . . . . . . . . . . . . . . . . . . . . 3,845,562,159 471,285,012 5,115,686,608 7,937,363,176Beginning of year . . . . . . . . . . . . . . . . . . . . . . . . . . . . . . . . . . . . . . . . . . . . . . . . . . . . . . . . . . . . . . . . . . . . . . . . 10,647,454,856 10,176,169,844 18,851,142,914 10,913,779,738
End of year . . . . . . . . . . . . . . . . . . . . . . . . . . . . . . . . . . . . . . . . . . . . . . . . . . . . . . . . . . . . . . . . . . . . . . . . . . . . . . $14,493,017,015 $10,647,454,856 $23,966,829,522 $18,851,142,914
(a) Distributions for annual periods determined in accordance with U.S. federal income tax regulations.
See notes to financial statements.
Statements of Changes in Net Assets (continued)
F I N A N C I A L S T A T E M E N T S 75

iSharesMSCI USA Size Factor ETF
iSharesMSCI USA Value Factor ETF
Year Ended07/31/21
Year Ended07/31/20
Year Ended07/31/21
Year Ended07/31/20
INCREASE (DECREASE) IN NET ASSETS
OPERATIONSNet investment income . . . . . . . . . . . . . . . . . . . . . . . . . . . . . . . . . . . . . . . . . . . . . . . . . . . . . . . . . . . . . . . . . . . . . $ 11,615,377 $ 16,006,500 $ 277,183,388 $ 129,506,374Net realized gain (loss) . . . . . . . . . . . . . . . . . . . . . . . . . . . . . . . . . . . . . . . . . . . . . . . . . . . . . . . . . . . . . . . . . . . . . 238,730,831 (70,574,060) 852,462,176 (179,985,209)Net change in unrealized appreciation (depreciation) . . . . . . . . . . . . . . . . . . . . . . . . . . . . . . . . . . . . . . . . . 63,310,899 (19,285,051) 2,512,056,697 (304,074,085)
Net increase (decrease) in net assets resulting from operations . . . . . . . . . . . . . . . . . . . . . . . . . . . . . . . . . 313,657,107 (73,852,611) 3,641,702,261 (354,552,920)
DISTRIBUTIONS TO SHAREHOLDERS(a)
Decrease in net assets resulting from distributions to shareholders . . . . . . . . . . . . . . . . . . . . . . . . . . . . . . (12,325,649) (15,316,633) (237,616,292) (118,978,842)
CAPITAL SHARE TRANSACTIONSNet increase (decrease) in net assets derived from capital share transactions . . . . . . . . . . . . . . . . . . . . (368,039,930) 453,574,540 6,930,558,612 2,599,318,079
NET ASSETSTotal increase (decrease) in net assets . . . . . . . . . . . . . . . . . . . . . . . . . . . . . . . . . . . . . . . . . . . . . . . . . . . . . . . . . (66,708,472) 364,405,296 10,334,644,581 2,125,786,317Beginning of year . . . . . . . . . . . . . . . . . . . . . . . . . . . . . . . . . . . . . . . . . . . . . . . . . . . . . . . . . . . . . . . . . . . . . . . . . . . . . 741,572,359 377,167,063 5,611,044,056 3,485,257,739
End of year . . . . . . . . . . . . . . . . . . . . . . . . . . . . . . . . . . . . . . . . . . . . . . . . . . . . . . . . . . . . . . . . . . . . . . . . . . . . . . . . . . . $ 674,863,887 $741,572,359 $15,945,688,637 $5,611,044,056
(a) Distributions for annual periods determined in accordance with U.S. federal income tax regulations.
See notes to financial statements.
Statements of Changes in Net Assets (continued)
76 2 0 2 1 I S H A R E S A N N U A L R E P O R T T O S H A R E H O L D E R S

iShares MSCI Intl Momentum Factor ETF
Year Ended07/31/21
Year Ended07/31/20
Year Ended07/31/19
Year Ended07/31/18
Year Ended07/31/17
Net asset value, beginning of year . . . . . . . . . . . . . . . . . . . . . . . . . . . . . . . . . . . . . . . . . . . . . . . . . . . . . . . . . . . . . . . . . . . . . $ 32.99 $ 29.44 $ 30.00 $ 28.78 $ 26.38
Net investment income(a) . . . . . . . . . . . . . . . . . . . . . . . . . . . . . . . . . . . . . . . . . . . . . . . . . . . . . . . . . . . . . . . . . . . . . . . . . . . . . 0.43 0.46 0.69 0.67 0.73Net realized and unrealized gain (loss)(b) . . . . . . . . . . . . . . . . . . . . . . . . . . . . . . . . . . . . . . . . . . . . . . . . . . . . . . . . . . . . . . 6.09 3.52 (0.57) 1.17 2.36
Net increase from investment operations . . . . . . . . . . . . . . . . . . . . . . . . . . . . . . . . . . . . . . . . . . . . . . . . . . . . . . . . . . . . . . . . . 6.52 3.98 0.12 1.84 3.09
Distributions(c)
From net investment income . . . . . . . . . . . . . . . . . . . . . . . . . . . . . . . . . . . . . . . . . . . . . . . . . . . . . . . . . . . . . . . . . . . . . . . . . . (0.45) (0.43) (0.68) (0.59) (0.69)From net realized gain . . . . . . . . . . . . . . . . . . . . . . . . . . . . . . . . . . . . . . . . . . . . . . . . . . . . . . . . . . . . . . . . . . . . . . . . . . . . . . . . — — — (0.03) —
Total distributions . . . . . . . . . . . . . . . . . . . . . . . . . . . . . . . . . . . . . . . . . . . . . . . . . . . . . . . . . . . . . . . . . . . . . . . . . . . . . . . . . . . . . . . (0.45) (0.43) (0.68) (0.62) (0.69)
Net asset value, end of year . . . . . . . . . . . . . . . . . . . . . . . . . . . . . . . . . . . . . . . . . . . . . . . . . . . . . . . . . . . . . . . . . . . . . . . . . . . . $ 39.06 $ 32.99 $ 29.44 $ 30.00 $ 28.78
Total ReturnBased on net asset value. . . . . . . . . . . . . . . . . . . . . . . . . . . . . . . . . . . . . . . . . . . . . . . . . . . . . . . . . . . . . . . . . . . . . . . . . . . . . . . . 19.80% 13.65% 0.55% 6.41% 12.01%
Ratios to Average Net AssetsTotal expenses. . . . . . . . . . . . . . . . . . . . . . . . . . . . . . . . . . . . . . . . . . . . . . . . . . . . . . . . . . . . . . . . . . . . . . . . . . . . . . . . . . . . . . . . . . 0.30% 0.30% 0.30% 0.30% 0.30%
Net investment income . . . . . . . . . . . . . . . . . . . . . . . . . . . . . . . . . . . . . . . . . . . . . . . . . . . . . . . . . . . . . . . . . . . . . . . . . . . . . . . . . . 1.16% 1.53% 2.44% 2.19% 2.75%
Supplemental DataNet assets, end of year (000) . . . . . . . . . . . . . . . . . . . . . . . . . . . . . . . . . . . . . . . . . . . . . . . . . . . . . . . . . . . . . . . . . . . . . . . . . . . . $831,917 $405,753 $164,888 $141,021 $34,539
Portfolio turnover rate(d) . . . . . . . . . . . . . . . . . . . . . . . . . . . . . . . . . . . . . . . . . . . . . . . . . . . . . . . . . . . . . . . . . . . . . . . . . . . . . . . . . 104% 125% 105% 131% 105%
(a) Based on average shares outstanding.(b) The amounts reported for a share outstanding may not accord with the change in aggregate gains and losses in securities for the fiscal period due to the timing of capital share
transactions in relation to the fluctuating market values of the Fund’s underlying securities.(c) Distributions for annual periods determined in accordance with U.S. federal income tax regulations.(d) Portfolio turnover rate excludes in-kind transactions.
See notes to financial statements.
Financial Highlights(For a share outstanding throughout each period)
F I N A N C I A L H I G H L I G H T S 77

iShares MSCI Intl Quality Factor ETF
Year Ended07/31/21
Year Ended07/31/20
Year Ended07/31/19
Year Ended07/31/18
Year Ended07/31/17
Net asset value, beginning of year . . . . . . . . . . . . . . . . . . . . . . . . . . . . . . . . . . . . . . . . . . . . . . . . . . . . . . . . . . . . . . . . . . . $ 30.32 $ 29.79 $ 29.62 $ 28.07 $ 25.46
Net investment income(a) . . . . . . . . . . . . . . . . . . . . . . . . . . . . . . . . . . . . . . . . . . . . . . . . . . . . . . . . . . . . . . . . . . . . . . . . . . . 0.78 0.70 0.96 0.99 0.76Net realized and unrealized gain (loss)(b) . . . . . . . . . . . . . . . . . . . . . . . . . . . . . . . . . . . . . . . . . . . . . . . . . . . . . . . . . . . . 8.90 0.44 (0.12) 1.23 2.61
Net increase from investment operations . . . . . . . . . . . . . . . . . . . . . . . . . . . . . . . . . . . . . . . . . . . . . . . . . . . . . . . . . . . . . . . 9.68 1.14 0.84 2.22 3.37
Distributions(c)
From net investment income . . . . . . . . . . . . . . . . . . . . . . . . . . . . . . . . . . . . . . . . . . . . . . . . . . . . . . . . . . . . . . . . . . . . . . . . (0.71) (0.61) (0.67) (0.67) (0.76)
Total distributions . . . . . . . . . . . . . . . . . . . . . . . . . . . . . . . . . . . . . . . . . . . . . . . . . . . . . . . . . . . . . . . . . . . . . . . . . . . . . . . . . . . . . (0.71) (0.61) (0.67) (0.67) (0.76)
Net asset value, end of year. . . . . . . . . . . . . . . . . . . . . . . . . . . . . . . . . . . . . . . . . . . . . . . . . . . . . . . . . . . . . . . . . . . . . . . . . . $ 39.29 $ 30.32 $ 29.79 $ 29.62 $ 28.07
Total ReturnBased on net asset value. . . . . . . . . . . . . . . . . . . . . . . . . . . . . . . . . . . . . . . . . . . . . . . . . . . . . . . . . . . . . . . . . . . . . . . . . . . . . . 32.03% 3.86% 2.99% 7.97% 13.46%
Ratios to Average Net AssetsTotal expenses. . . . . . . . . . . . . . . . . . . . . . . . . . . . . . . . . . . . . . . . . . . . . . . . . . . . . . . . . . . . . . . . . . . . . . . . . . . . . . . . . . . . . . . . 0.30% 0.30% 0.30% 0.30% 0.30%
Net investment income . . . . . . . . . . . . . . . . . . . . . . . . . . . . . . . . . . . . . . . . . . . . . . . . . . . . . . . . . . . . . . . . . . . . . . . . . . . . . . . . 2.18% 2.38% 3.31% 3.36% 2.95%
Supplemental DataNet assets, end of year (000) . . . . . . . . . . . . . . . . . . . . . . . . . . . . . . . . . . . . . . . . . . . . . . . . . . . . . . . . . . . . . . . . . . . . . . . . . . $3,744,470 $1,655,632 $822,240 $94,784 $19,648
Portfolio turnover rate(d) . . . . . . . . . . . . . . . . . . . . . . . . . . . . . . . . . . . . . . . . . . . . . . . . . . . . . . . . . . . . . . . . . . . . . . . . . . . . . . . 37% 26% 29% 21% 31%
(a) Based on average shares outstanding.(b) The amounts reported for a share outstanding may not accord with the change in aggregate gains and losses in securities for the fiscal period due to the timing of capital share
transactions in relation to the fluctuating market values of the Fund’s underlying securities.(c) Distributions for annual periods determined in accordance with U.S. federal income tax regulations.(d) Portfolio turnover rate excludes in-kind transactions.
See notes to financial statements.
Financial Highlights (continued)
(For a share outstanding throughout each period)
78 2 0 2 1 I S H A R E S A N N U A L R E P O R T T O S H A R E H O L D E R S

iShares MSCI Intl Size Factor ETF
Year Ended07/31/21
Year Ended07/31/20
Year Ended07/31/19
Year Ended07/31/18
Year Ended07/31/17
Net asset value, beginning of year . . . . . . . . . . . . . . . . . . . . . . . . . . . . . . . . . . . . . . . . . . . . . . . . . . . . . . . . . . . . . . . . . . . . . $ 24.61 $ 26.01 $27.58 $26.81 $24.16
Net investment income(a) . . . . . . . . . . . . . . . . . . . . . . . . . . . . . . . . . . . . . . . . . . . . . . . . . . . . . . . . . . . . . . . . . . . . . . . . . . . . . 0.62 0.48 0.72 0.76 0.74Net realized and unrealized gain (loss)(b) . . . . . . . . . . . . . . . . . . . . . . . . . . . . . . . . . . . . . . . . . . . . . . . . . . . . . . . . . . . . . . 7.19 (1.57) (1.56) 0.81 2.84
Net increase (decrease) from investment operations . . . . . . . . . . . . . . . . . . . . . . . . . . . . . . . . . . . . . . . . . . . . . . . . . . . . . . 7.81 (1.09) (0.84) 1.57 3.58
Distributions(c)
From net investment income . . . . . . . . . . . . . . . . . . . . . . . . . . . . . . . . . . . . . . . . . . . . . . . . . . . . . . . . . . . . . . . . . . . . . . . . . . (0.69) (0.31) (0.73) (0.80) (0.93)
Total distributions . . . . . . . . . . . . . . . . . . . . . . . . . . . . . . . . . . . . . . . . . . . . . . . . . . . . . . . . . . . . . . . . . . . . . . . . . . . . . . . . . . . . . . . (0.69) (0.31) (0.73) (0.80) (0.93)
Net asset value, end of year . . . . . . . . . . . . . . . . . . . . . . . . . . . . . . . . . . . . . . . . . . . . . . . . . . . . . . . . . . . . . . . . . . . . . . . . . . . . $ 31.73 $ 24.61 $26.01 $27.58 $26.81
Total ReturnBased on net asset value. . . . . . . . . . . . . . . . . . . . . . . . . . . . . . . . . . . . . . . . . . . . . . . . . . . . . . . . . . . . . . . . . . . . . . . . . . . . . . . . 31.83% (4.25)% (2.93)% 5.89% 15.14%
Ratios to Average Net AssetsTotal expenses. . . . . . . . . . . . . . . . . . . . . . . . . . . . . . . . . . . . . . . . . . . . . . . . . . . . . . . . . . . . . . . . . . . . . . . . . . . . . . . . . . . . . . . . . . 0.30% 0.30% 0.30% 0.30% 0.30%
Net investment income . . . . . . . . . . . . . . . . . . . . . . . . . . . . . . . . . . . . . . . . . . . . . . . . . . . . . . . . . . . . . . . . . . . . . . . . . . . . . . . . . . 2.11% 1.91% 2.78% 2.73% 2.95%
Supplemental DataNet assets, end of year (000) . . . . . . . . . . . . . . . . . . . . . . . . . . . . . . . . . . . . . . . . . . . . . . . . . . . . . . . . . . . . . . . . . . . . . . . . . . . . $25,384 $19,686 $5,202 $5,517 $5,361
Portfolio turnover rate(d) . . . . . . . . . . . . . . . . . . . . . . . . . . . . . . . . . . . . . . . . . . . . . . . . . . . . . . . . . . . . . . . . . . . . . . . . . . . . . . . . . 25% 42% 26% 13% 23%
(a) Based on average shares outstanding.(b) The amounts reported for a share outstanding may not accord with the change in aggregate gains and losses in securities for the fiscal period due to the timing of capital share
transactions in relation to the fluctuating market values of the Fund’s underlying securities.(c) Distributions for annual periods determined in accordance with U.S. federal income tax regulations.(d) Portfolio turnover rate excludes in-kind transactions.
See notes to financial statements.
Financial Highlights (continued)
(For a share outstanding throughout each period)
F I N A N C I A L H I G H L I G H T S 79

iShares MSCI Intl Value Factor ETF
Year Ended07/31/21
Year Ended07/31/20
Year Ended07/31/19
Year Ended07/31/18
Year Ended07/31/17
Net asset value, beginning of year . . . . . . . . . . . . . . . . . . . . . . . . . . . . . . . . . . . . . . . . . . . . . . . . . . . . . . . . . . . . . . . . . . . . $ 19.05 $ 22.61 $ 25.67 $ 24.84 $ 20.96
Net investment income(a) . . . . . . . . . . . . . . . . . . . . . . . . . . . . . . . . . . . . . . . . . . . . . . . . . . . . . . . . . . . . . . . . . . . . . . . . . . . . 0.76 0.58 0.86 0.73 0.63Net realized and unrealized gain (loss)(b) . . . . . . . . . . . . . . . . . . . . . . . . . . . . . . . . . . . . . . . . . . . . . . . . . . . . . . . . . . . . . 6.44 (3.57) (3.14) 0.88 3.75
Net increase (decrease) from investment operations . . . . . . . . . . . . . . . . . . . . . . . . . . . . . . . . . . . . . . . . . . . . . . . . . . . . . 7.20 (2.99) (2.28) 1.61 4.38
Distributions(c)
From net investment income . . . . . . . . . . . . . . . . . . . . . . . . . . . . . . . . . . . . . . . . . . . . . . . . . . . . . . . . . . . . . . . . . . . . . . . . . (0.56) (0.57) (0.78) (0.78) (0.50)
Total distributions . . . . . . . . . . . . . . . . . . . . . . . . . . . . . . . . . . . . . . . . . . . . . . . . . . . . . . . . . . . . . . . . . . . . . . . . . . . . . . . . . . . . . . (0.56) (0.57) (0.78) (0.78) (0.50)
Net asset value, end of year. . . . . . . . . . . . . . . . . . . . . . . . . . . . . . . . . . . . . . . . . . . . . . . . . . . . . . . . . . . . . . . . . . . . . . . . . . . $ 25.69 $ 19.05 $ 22.61 $ 25.67 $ 24.84
Total ReturnBased on net asset value. . . . . . . . . . . . . . . . . . . . . . . . . . . . . . . . . . . . . . . . . . . . . . . . . . . . . . . . . . . . . . . . . . . . . . . . . . . . . . . 37.95% (13.57)% (8.80)% 6.50% 21.11%
Ratios to Average Net AssetsTotal expenses. . . . . . . . . . . . . . . . . . . . . . . . . . . . . . . . . . . . . . . . . . . . . . . . . . . . . . . . . . . . . . . . . . . . . . . . . . . . . . . . . . . . . . . . . 0.30% 0.30% 0.30% 0.30% 0.30%
Net investment income . . . . . . . . . . . . . . . . . . . . . . . . . . . . . . . . . . . . . . . . . . . . . . . . . . . . . . . . . . . . . . . . . . . . . . . . . . . . . . . . . 3.18% 2.76% 3.63% 2.81% 2.73%
Supplemental DataNet assets, end of year (000) . . . . . . . . . . . . . . . . . . . . . . . . . . . . . . . . . . . . . . . . . . . . . . . . . . . . . . . . . . . . . . . . . . . . . . . . . . . $1,125,168 $451,494 $314,222 $233,633 $101,828
Portfolio turnover rate(d) . . . . . . . . . . . . . . . . . . . . . . . . . . . . . . . . . . . . . . . . . . . . . . . . . . . . . . . . . . . . . . . . . . . . . . . . . . . . . . . . 24% 18% 20% 16% 14%
(a) Based on average shares outstanding.(b) The amounts reported for a share outstanding may not accord with the change in aggregate gains and losses in securities for the fiscal period due to the timing of capital share
transactions in relation to the fluctuating market values of the Fund’s underlying securities.(c) Distributions for annual periods determined in accordance with U.S. federal income tax regulations.(d) Portfolio turnover rate excludes in-kind transactions.
See notes to financial statements.
Financial Highlights (continued)
(For a share outstanding throughout each period)
80 2 0 2 1 I S H A R E S A N N U A L R E P O R T T O S H A R E H O L D E R S

iShares MSCI USA Momentum Factor ETF
Year Ended07/31/21
Year Ended07/31/20
Year Ended07/31/19
Year Ended07/31/18
Year Ended07/31/17
Net asset value, beginning of year . . . . . . . . . . . . . . . . . . . . . . . . . . . . . . . . . . . . . . . . . . . . . . . . . . . . . . . . . . . . $ 140.10 $ 120.79 $ 111.68 $ 91.95 $ 78.43
Net investment income(a). . . . . . . . . . . . . . . . . . . . . . . . . . . . . . . . . . . . . . . . . . . . . . . . . . . . . . . . . . . . . . . . . . . . . 0.85 1.50 1.67 1.32 1.17Net realized and unrealized gain(b). . . . . . . . . . . . . . . . . . . . . . . . . . . . . . . . . . . . . . . . . . . . . . . . . . . . . . . . . . . . 34.86 19.53 9.03 19.60 13.51
Net increase from investment operations . . . . . . . . . . . . . . . . . . . . . . . . . . . . . . . . . . . . . . . . . . . . . . . . . . . . . . . . 35.71 21.03 10.70 20.92 14.68
Distributions(c)
From net investment income . . . . . . . . . . . . . . . . . . . . . . . . . . . . . . . . . . . . . . . . . . . . . . . . . . . . . . . . . . . . . . . . . (0.77) (1.72) (1.59) (1.19) (1.16)
Total distributions. . . . . . . . . . . . . . . . . . . . . . . . . . . . . . . . . . . . . . . . . . . . . . . . . . . . . . . . . . . . . . . . . . . . . . . . . . . . . . . (0.77) (1.72) (1.59) (1.19) (1.16)
Net asset value, end of year . . . . . . . . . . . . . . . . . . . . . . . . . . . . . . . . . . . . . . . . . . . . . . . . . . . . . . . . . . . . . . . . . . . $ 175.04 $ 140.10 $ 120.79 $ 111.68 $ 91.95
Total ReturnBased on net asset value . . . . . . . . . . . . . . . . . . . . . . . . . . . . . . . . . . . . . . . . . . . . . . . . . . . . . . . . . . . . . . . . . . . . . . . 25.57% 17.71% 9.71% 22.86% 18.94%
Ratios to Average Net AssetsTotal expenses . . . . . . . . . . . . . . . . . . . . . . . . . . . . . . . . . . . . . . . . . . . . . . . . . . . . . . . . . . . . . . . . . . . . . . . . . . . . . . . . . 0.15% 0.15% 0.15% 0.15% 0.15%
Net investment income . . . . . . . . . . . . . . . . . . . . . . . . . . . . . . . . . . . . . . . . . . . . . . . . . . . . . . . . . . . . . . . . . . . . . . . . . 0.53% 1.22% 1.49% 1.24% 1.44%
Supplemental DataNet assets, end of year (000) . . . . . . . . . . . . . . . . . . . . . . . . . . . . . . . . . . . . . . . . . . . . . . . . . . . . . . . . . . . . . . . . . . . $14,493,017 $10,647,455 $10,176,170 $9,196,715 $3,438,822
Portfolio turnover rate(d). . . . . . . . . . . . . . . . . . . . . . . . . . . . . . . . . . . . . . . . . . . . . . . . . . . . . . . . . . . . . . . . . . . . . . . . . 107% 160% 138% 104% 114%
(a) Based on average shares outstanding.(b) The amounts reported for a share outstanding may not accord with the change in aggregate gains and losses in securities for the fiscal period due to the timing of capital share
transactions in relation to the fluctuating market values of the Fund’s underlying securities.(c) Distributions for annual periods determined in accordance with U.S. federal income tax regulations.(d) Portfolio turnover rate excludes in-kind transactions.
See notes to financial statements.
Financial Highlights (continued)
(For a share outstanding throughout each period)
F I N A N C I A L H I G H L I G H T S 81

iShares MSCI USA Quality Factor ETF
Year Ended07/31/21
Year Ended07/31/20
Year Ended07/31/19
Year Ended07/31/18
Year Ended07/31/17
Net asset value, beginning of year . . . . . . . . . . . . . . . . . . . . . . . . . . . . . . . . . . . . . . . . . . . . . . . . . . . . . . . . . . . . $ 100.59 $ 92.73 $ 86.55 $ 75.09 $ 68.00
Net investment income(a). . . . . . . . . . . . . . . . . . . . . . . . . . . . . . . . . . . . . . . . . . . . . . . . . . . . . . . . . . . . . . . . . . . . . 1.70 1.72 1.61 1.55 1.46Net realized and unrealized gain(b). . . . . . . . . . . . . . . . . . . . . . . . . . . . . . . . . . . . . . . . . . . . . . . . . . . . . . . . . . . . 36.79 7.71 6.16 11.38 7.03
Net increase from investment operations . . . . . . . . . . . . . . . . . . . . . . . . . . . . . . . . . . . . . . . . . . . . . . . . . . . . . . . . 38.49 9.43 7.77 12.93 8.49
Distributions(c)
From net investment income . . . . . . . . . . . . . . . . . . . . . . . . . . . . . . . . . . . . . . . . . . . . . . . . . . . . . . . . . . . . . . . . . (1.77) (1.57) (1.59) (1.47) (1.40)
Total distributions. . . . . . . . . . . . . . . . . . . . . . . . . . . . . . . . . . . . . . . . . . . . . . . . . . . . . . . . . . . . . . . . . . . . . . . . . . . . . . . (1.77) (1.57) (1.59) (1.47) (1.40)
Net asset value, end of year . . . . . . . . . . . . . . . . . . . . . . . . . . . . . . . . . . . . . . . . . . . . . . . . . . . . . . . . . . . . . . . . . . . $ 137.31 $ 100.59 $ 92.73 $ 86.55 $ 75.09
Total ReturnBased on net asset value . . . . . . . . . . . . . . . . . . . . . . . . . . . . . . . . . . . . . . . . . . . . . . . . . . . . . . . . . . . . . . . . . . . . . . . 38.63% 10.38% 9.13% 17.36% 12.62%
Ratios to Average Net AssetsTotal expenses . . . . . . . . . . . . . . . . . . . . . . . . . . . . . . . . . . . . . . . . . . . . . . . . . . . . . . . . . . . . . . . . . . . . . . . . . . . . . . . . . 0.15% 0.15% 0.15% 0.15% 0.15%
Net investment income . . . . . . . . . . . . . . . . . . . . . . . . . . . . . . . . . . . . . . . . . . . . . . . . . . . . . . . . . . . . . . . . . . . . . . . . . 1.45% 1.82% 1.85% 1.88% 2.06%
Supplemental DataNet assets, end of year (000) . . . . . . . . . . . . . . . . . . . . . . . . . . . . . . . . . . . . . . . . . . . . . . . . . . . . . . . . . . . . . . . . . . . $23,966,830 $18,851,143 $10,913,780 $5,781,433 $3,465,557
Portfolio turnover rate(d). . . . . . . . . . . . . . . . . . . . . . . . . . . . . . . . . . . . . . . . . . . . . . . . . . . . . . . . . . . . . . . . . . . . . . . . . 47% 45% 41% 41% 44%
(a) Based on average shares outstanding.(b) The amounts reported for a share outstanding may not accord with the change in aggregate gains and losses in securities for the fiscal period due to the timing of capital share
transactions in relation to the fluctuating market values of the Fund’s underlying securities.(c) Distributions for annual periods determined in accordance with U.S. federal income tax regulations.(d) Portfolio turnover rate excludes in-kind transactions.
See notes to financial statements.
Financial Highlights (continued)
(For a share outstanding throughout each period)
82 2 0 2 1 I S H A R E S A N N U A L R E P O R T T O S H A R E H O L D E R S

iShares MSCI USA Size Factor ETF
Year Ended07/31/21
Year Ended07/31/20
Year Ended07/31/19
Year Ended07/31/18
Year Ended07/31/17
Net asset value, beginning of year . . . . . . . . . . . . . . . . . . . . . . . . . . . . . . . . . . . . . . . . . . . . . . . . . . . . . . . . . . . . . . . . . . . . . $ 92.12 $ 91.99 $ 86.61 $ 78.73 $ 70.36
Net investment income(a) . . . . . . . . . . . . . . . . . . . . . . . . . . . . . . . . . . . . . . . . . . . . . . . . . . . . . . . . . . . . . . . . . . . . . . . . . . . . . 1.50 1.73 1.52 1.45 1.37Net realized and unrealized gain (loss)(b) . . . . . . . . . . . . . . . . . . . . . . . . . . . . . . . . . . . . . . . . . . . . . . . . . . . . . . . . . . . . . . 38.96 (0.13) 5.49 8.02 8.33
Net increase from investment operations . . . . . . . . . . . . . . . . . . . . . . . . . . . . . . . . . . . . . . . . . . . . . . . . . . . . . . . . . . . . . . . . . 40.46 1.60 7.01 9.47 9.70
Distributions(c)
From net investment income . . . . . . . . . . . . . . . . . . . . . . . . . . . . . . . . . . . . . . . . . . . . . . . . . . . . . . . . . . . . . . . . . . . . . . . . . . (1.54) (1.47) (1.63) (1.59) (1.33)
Total distributions . . . . . . . . . . . . . . . . . . . . . . . . . . . . . . . . . . . . . . . . . . . . . . . . . . . . . . . . . . . . . . . . . . . . . . . . . . . . . . . . . . . . . . . (1.54) (1.47) (1.63) (1.59) (1.33)
Net asset value, end of year . . . . . . . . . . . . . . . . . . . . . . . . . . . . . . . . . . . . . . . . . . . . . . . . . . . . . . . . . . . . . . . . . . . . . . . . . . . . $ 131.04 $ 92.12 $ 91.99 $ 86.61 $ 78.73
Total ReturnBased on net asset value. . . . . . . . . . . . . . . . . . . . . . . . . . . . . . . . . . . . . . . . . . . . . . . . . . . . . . . . . . . . . . . . . . . . . . . . . . . . . . . . 44.28% 1.91% 8.26% 12.16% 13.93%
Ratios to Average Net AssetsTotal expenses. . . . . . . . . . . . . . . . . . . . . . . . . . . . . . . . . . . . . . . . . . . . . . . . . . . . . . . . . . . . . . . . . . . . . . . . . . . . . . . . . . . . . . . . . . 0.15% 0.15% 0.15% 0.15% 0.15%
Net investment income . . . . . . . . . . . . . . . . . . . . . . . . . . . . . . . . . . . . . . . . . . . . . . . . . . . . . . . . . . . . . . . . . . . . . . . . . . . . . . . . . . 1.34% 1.93% 1.74% 1.75% 1.86%
Supplemental DataNet assets, end of year (000) . . . . . . . . . . . . . . . . . . . . . . . . . . . . . . . . . . . . . . . . . . . . . . . . . . . . . . . . . . . . . . . . . . . . . . . . . . . . $674,864 $741,572 $377,167 $207,862 $181,087
Portfolio turnover rate(d) . . . . . . . . . . . . . . . . . . . . . . . . . . . . . . . . . . . . . . . . . . . . . . . . . . . . . . . . . . . . . . . . . . . . . . . . . . . . . . . . . 23% 29% 30% 17% 19%
(a) Based on average shares outstanding.(b) The amounts reported for a share outstanding may not accord with the change in aggregate gains and losses in securities for the fiscal period due to the timing of capital share
transactions in relation to the fluctuating market values of the Fund’s underlying securities.(c) Distributions for annual periods determined in accordance with U.S. federal income tax regulations.(d) Portfolio turnover rate excludes in-kind transactions.
See notes to financial statements.
Financial Highlights (continued)
(For a share outstanding throughout each period)
F I N A N C I A L H I G H L I G H T S 83

iShares MSCI USA Value Factor ETF
Year Ended07/31/21
Year Ended07/31/20
Year Ended07/31/19
Year Ended07/31/18
Year Ended07/31/17
Net asset value, beginning of year . . . . . . . . . . . . . . . . . . . . . . . . . . . . . . . . . . . . . . . . . . . . . . . . . . . . . . . . . . . . . . . $ 72.97 $ 82.49 $ 85.39 $ 75.00 $ 64.38
Net investment income(a) . . . . . . . . . . . . . . . . . . . . . . . . . . . . . . . . . . . . . . . . . . . . . . . . . . . . . . . . . . . . . . . . . . . . . . . 2.33 2.37 2.23 1.84 1.68Net realized and unrealized gain (loss)(b) . . . . . . . . . . . . . . . . . . . . . . . . . . . . . . . . . . . . . . . . . . . . . . . . . . . . . . . . 30.96 (9.65) (2.92) 10.40 10.50
Net increase (decrease) from investment operations . . . . . . . . . . . . . . . . . . . . . . . . . . . . . . . . . . . . . . . . . . . . . . . . 33.29 (7.28) (0.69) 12.24 12.18
Distributions(c)
From net investment income . . . . . . . . . . . . . . . . . . . . . . . . . . . . . . . . . . . . . . . . . . . . . . . . . . . . . . . . . . . . . . . . . . . . (1.97) (2.24) (2.21) (1.85) (1.56)
Total distributions . . . . . . . . . . . . . . . . . . . . . . . . . . . . . . . . . . . . . . . . . . . . . . . . . . . . . . . . . . . . . . . . . . . . . . . . . . . . . . . . . (1.97) (2.24) (2.21) (1.85) (1.56)
Net asset value, end of year. . . . . . . . . . . . . . . . . . . . . . . . . . . . . . . . . . . . . . . . . . . . . . . . . . . . . . . . . . . . . . . . . . . . . . $ 104.29 $ 72.97 $ 82.49 $ 85.39 $ 75.00
Total ReturnBased on net asset value. . . . . . . . . . . . . . . . . . . . . . . . . . . . . . . . . . . . . . . . . . . . . . . . . . . . . . . . . . . . . . . . . . . . . . . . . . 46.10% (8.83)% (0.68)% 16.47% 19.10%
Ratios to Average Net AssetsTotal expenses. . . . . . . . . . . . . . . . . . . . . . . . . . . . . . . . . . . . . . . . . . . . . . . . . . . . . . . . . . . . . . . . . . . . . . . . . . . . . . . . . . . . 0.15% 0.15% 0.15% 0.15% 0.15%
Net investment income . . . . . . . . . . . . . . . . . . . . . . . . . . . . . . . . . . . . . . . . . . . . . . . . . . . . . . . . . . . . . . . . . . . . . . . . . . . . 2.47% 3.04% 2.74% 2.24% 2.35%
Supplemental DataNet assets, end of year (000) . . . . . . . . . . . . . . . . . . . . . . . . . . . . . . . . . . . . . . . . . . . . . . . . . . . . . . . . . . . . . . . . . . . . . . $15,945,689 $5,611,044 $3,485,258 $3,786,862 $2,373,707
Portfolio turnover rate(d) . . . . . . . . . . . . . . . . . . . . . . . . . . . . . . . . . . . . . . . . . . . . . . . . . . . . . . . . . . . . . . . . . . . . . . . . . . . 28% 33% 35% 18% 26%
(a) Based on average shares outstanding.(b) The amounts reported for a share outstanding may not accord with the change in aggregate gains and losses in securities for the fiscal period due to the timing of capital share
transactions in relation to the fluctuating market values of the Fund’s underlying securities.(c) Distributions for annual periods determined in accordance with U.S. federal income tax regulations.(d) Portfolio turnover rate excludes in-kind transactions.
See notes to financial statements.
Financial Highlights (continued)
(For a share outstanding throughout each period)
84 2 0 2 1 I S H A R E S A N N U A L R E P O R T T O S H A R E H O L D E R S

1. ORGANIZATION
iShares Trust (the “Trust”) is registered under the Investment Company Act of 1940, as amended (the “1940 Act”), as an open-end management investment company. TheTrust is organized as a Delaware statutory trust and is authorized to have multiple series or portfolios.
These financial statements relate only to the following funds (each, a “Fund,” and collectively, the “Funds”):
iShares ETFDiversificationClassification
MSCI Intl Momentum Factor (a) . . . . . . . . . . . . . . . . . . . . . . . . . . . . . . . . . . . . . . . . . . . . . . . . . . . . . . . . . . . . . . . . . . . . . . . . . . . . . . . . . . . . . . . . . . . . . . . . . . . . . . . . . . . . . . . . . . . . . . . . . . . . DiversifiedMSCI Intl Quality Factor(b) . . . . . . . . . . . . . . . . . . . . . . . . . . . . . . . . . . . . . . . . . . . . . . . . . . . . . . . . . . . . . . . . . . . . . . . . . . . . . . . . . . . . . . . . . . . . . . . . . . . . . . . . . . . . . . . . . . . . . . . . . . . . . . . . DiversifiedMSCI Intl Size Factor(c) . . . . . . . . . . . . . . . . . . . . . . . . . . . . . . . . . . . . . . . . . . . . . . . . . . . . . . . . . . . . . . . . . . . . . . . . . . . . . . . . . . . . . . . . . . . . . . . . . . . . . . . . . . . . . . . . . . . . . . . . . . . . . . . . . . . DiversifiedMSCI Intl Value Factor(d) . . . . . . . . . . . . . . . . . . . . . . . . . . . . . . . . . . . . . . . . . . . . . . . . . . . . . . . . . . . . . . . . . . . . . . . . . . . . . . . . . . . . . . . . . . . . . . . . . . . . . . . . . . . . . . . . . . . . . . . . . . . . . . . . . . DiversifiedMSCI USA Momentum Factor(e) . . . . . . . . . . . . . . . . . . . . . . . . . . . . . . . . . . . . . . . . . . . . . . . . . . . . . . . . . . . . . . . . . . . . . . . . . . . . . . . . . . . . . . . . . . . . . . . . . . . . . . . . . . . . . . . . . . . . . . . . . . . DiversifiedMSCI USA Quality Factor(f) . . . . . . . . . . . . . . . . . . . . . . . . . . . . . . . . . . . . . . . . . . . . . . . . . . . . . . . . . . . . . . . . . . . . . . . . . . . . . . . . . . . . . . . . . . . . . . . . . . . . . . . . . . . . . . . . . . . . . . . . . . . . . . . DiversifiedMSCI USA Size Factor(g). . . . . . . . . . . . . . . . . . . . . . . . . . . . . . . . . . . . . . . . . . . . . . . . . . . . . . . . . . . . . . . . . . . . . . . . . . . . . . . . . . . . . . . . . . . . . . . . . . . . . . . . . . . . . . . . . . . . . . . . . . . . . . . . . . DiversifiedMSCI USA Value Factor(h) . . . . . . . . . . . . . . . . . . . . . . . . . . . . . . . . . . . . . . . . . . . . . . . . . . . . . . . . . . . . . . . . . . . . . . . . . . . . . . . . . . . . . . . . . . . . . . . . . . . . . . . . . . . . . . . . . . . . . . . . . . . . . . . . Diversified
(a) Formerly the iShares Edge MSCI Intl Momentum Factor ETF.(b) Formerly the iShares Edge MSCI Intl Quality Factor ETF.(c) Formerly the iShares Edge MSCI Intl Size Factor ETF.(d) Formerly the iShares Edge MSCI Intl Value Factor ETF.(e) Formerly the iShares Edge MSCI USA Momentum Factor ETF.(f) Formerly the iShares Edge MSCI USA Quality Factor ETF.(g) Formerly the iShares Edge MSCI USA Size Factor ETF.(h) Formerly the iShares Edge MSCI USA Value Factor ETF.
2. SIGNIFICANT ACCOUNTING POLICIES
The financial statements are prepared in conformity with accounting principles generally accepted in the United States of America (“U.S. GAAP”), which may requiremanagement to make estimates and assumptions that affect the reported amounts of assets and liabilities in the financial statements, disclosure of contingent assets andliabilities at the date of the financial statements and the reported amounts of increases and decreases in net assets from operations during the reporting period. Actualresults could differ from those estimates. Each Fund is considered an investment company under U.S. GAAP and follows the accounting and reporting guidance applicableto investment companies. Below is a summary of significant accounting policies:
Investment Transactions and Income Recognition: For financial reporting purposes, investment transactions are recorded on the dates the transactions are executed.Realized gains and losses on investment transactions are determined using the specific identification method. Dividend income and capital gain distributions, if any, arerecorded on the ex-dividend date. Non-cash dividends, if any, are recorded on the ex-dividend date at fair value. Dividends from foreign securities where the ex-dividenddate may have passed are subsequently recorded when the Funds are informed of the ex-dividend date. Under the applicable foreign tax laws, a withholding tax at variousrates may be imposed on capital gains, dividends and interest. Upon notification from issuers or as estimated by management, a portion of the dividend income receivedfrom a real estate investment trust may be redesignated as a reduction of cost of the related investment and/or realized gain.
Foreign Currency Translation: Each Fund’s books and records are maintained in U.S. dollars. Securities and other assets and liabilities denominated in foreign currenciesare translated into U.S. dollars using prevailing market rates as quoted by one or more data service providers. Purchases and sales of investments are recorded at the ratesof exchange prevailing on the respective dates of such transactions. Generally, when the U.S. dollar rises in value against a foreign currency, the investments denominatedin that currency will lose value; the opposite effect occurs if the U.S. dollar falls in relative value.
Each Fund does not isolate the effect of fluctuations in foreign exchange rates from the effect of fluctuations in the market prices of investments for financial reportingpurposes. Accordingly, the effects of changes in exchange rates on investments are not segregated in the statements of operations from the effects of changes in marketprices of those investments, but are included as a component of net realized and unrealized gain (loss) from investments. Each Fund reports realized currency gains(losses) on foreign currency related transactions as components of net realized gain (loss) for financial reporting purposes, whereas such components are generally treatedas ordinary income for U.S. federal income tax purposes.
Foreign Taxes: The Funds may be subject to foreign taxes (a portion of which may be reclaimable) on income, stock dividends, capital gains on investments, or certainforeign currency transactions. All foreign taxes are recorded in accordance with the applicable foreign tax regulations and rates that exist in the foreign jurisdictions in whicheach Fund invests. These foreign taxes, if any, are paid by each Fund and are reflected in its statements of operations as follows: foreign taxes withheld at source arepresented as a reduction of income, foreign taxes on securities lending income are presented as a reduction of securities lending income, foreign taxes on stock dividendsare presented as “Other foreign taxes”, and foreign taxes on capital gains from sales of investments and foreign taxes on foreign currency transactions are included in theirrespective net realized gain (loss) categories. Foreign taxes payable or deferred as of July 31, 2021, if any, are disclosed in the statements of assets and liabilities.
The Funds file withholding tax reclaims in certain jurisdictions to recover a portion of amounts previously withheld. The Funds may record a reclaim receivable based oncollectability, which includes factors such as the jurisdiction’s applicable laws, payment history and market convention. The statements of operations includes tax reclaimsrecorded as well as professional and other fees, if any, associated with recovery of foreign withholding taxes.
Notes to Financial Statements
N O T E S T O F I N A N C I A L S T A T E M E N T S 85

Segregation and Collateralization: In cases where a Fund enters into certain investments (e.g., futures contracts ) that would be treated as “senior securities” for 1940Act purposes, a Fund may segregate or designate on its books and record cash or liquid assets having a market value at least equal to the amount of its future obligationsunder such investments. Doing so allows the investment to be excluded from treatment as a “senior security.” Furthermore, if required by an exchange or counterpartyagreement, the Funds may be required to deliver/deposit cash and/or securities to/with an exchange, or broker-dealer or custodian as collateral for certain investments orobligations.
In-kind Redemptions: For financial reporting purposes, in-kind redemptions are treated as sales of securities resulting in realized capital gains or losses to the Funds.rBecause such gains or losses are not taxable to the Funds and are not distributed to existing Fund shareholders, the gains or losses are reclassified from accumulated netrealized gain (loss) to paid-in capital at the end of the Funds' tax year. These reclassifications have no effect on net assets or net asset value ("NAV") per share.
Distributions: Dividends and distributions paid by each Fund are recorded on the ex-dividend dates. Distributions are determined on a tax basis and may differ from netinvestment income and net realized capital gains for financial reporting purposes. Dividends and distributions are paid in U.S. dollars and cannot be automatically reinvestedin additional shares of the Funds. The character and timing of distributions are determined in accordance with U.S. federal income tax regulations, which may differ fromU.S. GAAP.
Indemnifications: In the normal course of business, each Fund enters into contracts that contain a variety of representations that provide general indemnification. TheFunds' maximum exposure under these arrangements is unknown because it involves future potential claims against the Funds, which cannot be predicted with anycertainty.
3. INVESTMENT VALUATION AND FAIR VALUE MEASUREMENTS
Investment Valuation Policies: Each Fund’s investments are valued at fair value (also referred to as “market value” within the financial statements) each day that theFund’s listing exchange is open and, for financial reporting purposes, as of the report date. U.S. GAAP defines fair value as the price a fund would receive to sell an assetor pay to transfer a liability in an orderly transaction between market participants at the measurement date. Each Fund determines the fair values of its financial instrumentsusing various independent dealers or pricing services under policies approved by the Board of Trustees of the Trust (the “Board”). If a security’s market price is not readilyavailable or does not otherwise accurately represent the fair value of the security, the security will be valued in accordance with a policy approved by the Board as reflectingfair value. The BlackRock Global Valuation Methodologies Committee (the “Global Valuation Committee”) is the committee formed by management to develop global pricingpolicies and procedures and to oversee the pricing function for all financial instruments.
Fair Value Inputs and Methodologies: The following methods and inputs are used to establish the fair value of each Fund’s assets and liabilities:• Equity investments traded on a recognized securities exchange are valued at that day’s official closing price, as applicable, on the exchange where the stock is
primarily traded. Equity investments traded on a recognized exchange for which there were no sales on that day are valued at the last traded price.• Investments in open-end U.S. mutual funds (including money market funds) are valued at that day’s published NAV.• Futures contracts are valued based on that day’s last reported settlement or trade price on the exchange where the contract is traded.
Generally, trading in foreign instruments is substantially completed each day at various times prior to the close of trading on the New York Stock Exchange (“NYSE”). Eachbusiness day, the Funds use current market factors supplied by independent pricing services to value certain foreign instruments (“Systematic Fair Value Price”). TheSystematic Fair Value Price is designed to value such foreign securities at fair value as of the close of trading on the NYSE, which follows the close of the local markets.
If events (e.g., market volatility, company announcement or a natural disaster) occur that are expected to materially affect the value of such investment, or in the event thatapplication of these methods of valuation results in a price for an investment that is deemed not to be representative of the market value of such investment, or if a priceis not available, the investment will be valued by the Global Valuation Committee, in accordance with a policy approved by the Board as reflecting fair value (“Fair ValuedInvestments”). The fair valuation approaches that may be used by the Global Valuation Committee include market approach, income approach and cost approach. Valuationtechniques such as discounted cash flow, use of market comparables and matrix pricing are types of valuation approaches and are typically used in determining fair value.When determining the price for Fair Valued Investments, the Global Valuation Committee, or its delegate, seeks to determine the price that each Fund might reasonablyexpect to receive or pay from the current sale or purchase of that asset or liability in an arm’s-length transaction. Fair value determinations shall be based upon all availablefactors that the Global Valuation Committee, or its delegate, deems relevant and consistent with the principles of fair value measurement. The pricing of all Fair ValuedInvestments is subsequently reported to the Board or a committee thereof on a quarterly basis.
Fair value pricing could result in a difference between the prices used to calculate a fund’s NAV and the prices used by the fund’s underlying index, which in turn could resultin a difference between the fund’s performance and the performance of the fund’s underlying index.
Fair Value Hierarchy: Various inputs are used in determining the fair value of financial instruments. These inputs to valuation techniques are categorized into a fair valuehierarchy consisting of three broad levels for financial reporting purposes as follows:
• Level 1 – Unadjusted price quotations in active markets/exchanges for identical assets or liabilities that each Fund has the ability to access;• Level 2 – Other observable inputs (including, but not limited to, quoted prices for similar assets or liabilities in markets that are active, quoted prices for identical or
similar assets or liabilities in markets that are not active, inputs other than quoted prices that are observable for the assets or liabilities (such as interest rates, yieldcurves, volatilities, prepayment speeds, loss severities, credit risks and default rates) or other market-corroborated inputs); and
• Level 3 – Unobservable inputs based on the best information available in the circumstances, to the extent observable inputs are not available, (including the GlobalValuation Committee’s assumptions used in determining the fair value of financial instruments).
Notes to Financial Statements (continued)
86 2 0 2 1 I S H A R E S A N N U A L R E P O R T T O S H A R E H O L D E R S

The hierarchy gives the highest priority to unadjusted quoted prices in active markets for identical assets or liabilities (Level 1 measurements) and the lowest priority tounobservable inputs (Level 3 measurements). Accordingly, the degree of judgment exercised in determining fair value is greatest for instruments categorized in Level 3. Theinputs used to measure fair value may fall into different levels of the fair value hierarchy. In such cases, for disclosure purposes, the fair value hierarchy classification isdetermined based on the lowest level input that is significant to the fair value measurement in its entirety. Investments classified within Level 3 have significant unobservableinputs used by the Global Valuation Committee in determining the price for Fair Valued Investments. Level 3 investments include equity or debt issued by privately heldcompanies or funds that may not have a secondary market and/or may have a limited number of investors. The categorization of a value determined for financial instrumentsis based on the pricing transparency of the financial instruments and is not necessarily an indication of the risks associated with investing in those securities.
4. SECURITIES AND OTHER INVESTMENTS
Securities Lending: Each Fund may lend its securities to approved borrowers, such as brokers, dealers and other financial institutions. The borrower pledges andmaintains with the Fund collateral consisting of cash, an irrevocable letter of credit issued by an approved bank, or securities issued or guaranteed by the U.S. government.The initial collateral received by each Fund is required to have a value of at least 102% of the current market value of the loaned securities for securities traded on U.S.exchanges and a value of at least 105% for all other securities. The collateral is maintained thereafter at a value equal to at least 100% of the current value of the securitieson loan. The market value of the loaned securities is determined at the close of each business day of the Fund and any additional required collateral is delivered to the Fundor excess collateral is returned by the Fund, on the next business day. During the term of the loan, each Fund is entitled to all distributions made on or in respect of the loanedsecurities but does not receive interest income on securities received as collateral. Loans of securities are terminable at any time and the borrower, after notice, is requiredto return borrowed securities within the standard time period for settlement of securities transactions.
As of period end, any securities on loan were collateralized by cash and/or U.S. Government obligations. Cash collateral invested in money market funds managed byBlackRock Fund Advisors (“BFA”), the Funds' investment adviser, or its affiliates is disclosed in the schedules of investments. Any non-cash collateral received cannot besold, re-invested or pledged by the Fund, except in the event of borrower default. The securities on loan, if any, are also disclosed in each Fund's schedule of investments.The market value of any securities on loan and the value of any related cash collateral are disclosed in the statements of assets and liabilities.
Securities lending transactions are entered into by the Funds under Master Securities Lending Agreements (each, an “MSLA”) which provide the right, in the event of default(including bankruptcy or insolvency) for the non-defaulting party to liquidate the collateral and calculate a net exposure to the defaulting party or request additional collateral.In the event that a borrower defaults, the Funds, as lender, would offset the market value of the collateral received against the market value of the securities loaned. Whenthe value of the collateral is greater than that of the market value of the securities loaned, the lender is left with a net amount payable to the defaulting party. However,bankruptcy or insolvency laws of a particular jurisdiction may impose restrictions on or prohibitions against such a right of offset in the event of an MSLA counterparty’sbankruptcy or insolvency. Under the MSLA, absent an event of default, the borrower can resell or re-pledge the loaned securities, and the Funds can reinvest cash collateralreceived in connection with loaned securities. Upon an event of default, the parties’ obligations to return the securities or collateral to the other party are extinguished, andthe parties can resell or re-pledge the loaned securities or the collateral received in connection with the loaned securities in order to satisfy the defaulting party’s net paymentobligation for all transactions under the MSLA. The defaulting party remains liable for any deficiency.
As of period end, the following table is a summary of the securities on loan by counterparty which are subject to offset under an MSLA:
iShares ETF and CounterpartyMarket Value of
Securities on LoanCash Collateral
Received(a)Non-Cash Collateral
Received Net Amount
MSCI Intl Size FactorBarclays Bank PLC . . . . . . . . . . . . . . . . . . . . . . . . . . . . . . . . . . . . . . . . . . . . . . . . . . . . . . . . . . . . . . . . . . $ 15,984 $ 15,984 $ — $ —Citigroup Global Markets Inc. . . . . . . . . . . . . . . . . . . . . . . . . . . . . . . . . . . . . . . . . . . . . . . . . . . . . . . . . . 17,777 17,777 — —
$ 33,761 $ 33,761 $ — $ —
MSCI USA Momentum FactorBNP Paribas Prime Brokerage International Ltd. . . . . . . . . . . . . . . . . . . . . . . . . . . . . . . . . . . . . . . . $ 44,451,921 $ 44,451,921 $ — $ —BNP Paribas Securities Corp.. . . . . . . . . . . . . . . . . . . . . . . . . . . . . . . . . . . . . . . . . . . . . . . . . . . . . . . . . 400,223 400,223 — —BofA Securities, Inc.. . . . . . . . . . . . . . . . . . . . . . . . . . . . . . . . . . . . . . . . . . . . . . . . . . . . . . . . . . . . . . . . . . 6,193,163 6,193,163 — —Citigroup Global Markets Inc. . . . . . . . . . . . . . . . . . . . . . . . . . . . . . . . . . . . . . . . . . . . . . . . . . . . . . . . . . 2,372,600 2,372,600 — —Goldman Sachs & Co.. . . . . . . . . . . . . . . . . . . . . . . . . . . . . . . . . . . . . . . . . . . . . . . . . . . . . . . . . . . . . . . . 11,756,603 11,756,603 — —JPMorgan Securities LLC . . . . . . . . . . . . . . . . . . . . . . . . . . . . . . . . . . . . . . . . . . . . . . . . . . . . . . . . . . . . 25,968,605 25,968,605 — —Morgan Stanley & Co. LLC . . . . . . . . . . . . . . . . . . . . . . . . . . . . . . . . . . . . . . . . . . . . . . . . . . . . . . . . . . . 18,816,898 18,816,898 — —SG Americas Securities LLC. . . . . . . . . . . . . . . . . . . . . . . . . . . . . . . . . . . . . . . . . . . . . . . . . . . . . . . . . . 94,050 94,050 — —State Street Bank & Trust Company. . . . . . . . . . . . . . . . . . . . . . . . . . . . . . . . . . . . . . . . . . . . . . . . . . . 299,003 299,003 — —Virtu Americas LLC . . . . . . . . . . . . . . . . . . . . . . . . . . . . . . . . . . . . . . . . . . . . . . . . . . . . . . . . . . . . . . . . . . 109,992 109,992 — —Wells Fargo Bank, National Association . . . . . . . . . . . . . . . . . . . . . . . . . . . . . . . . . . . . . . . . . . . . . . . 2,070,497 2,070,497 — —
$ 112,533,555 $ 112,533,555 $ — $ —
Notes to Financial Statements (continued)
N O T E S T O F I N A N C I A L S T A T E M E N T S 87

iShares ETF and CounterpartyMarket Value of
Securities on LoanCash Collateral
Received(a)Non-Cash Collateral
Received Net Amount
MSCI USA Quality FactorBNP Paribas New York Branch . . . . . . . . . . . . . . . . . . . . . . . . . . . . . . . . . . . . . . . . . . . . . . . . . . . . . . . $ 431,751 $ 431,751 $ — $ —Citigroup Global Markets Inc. . . . . . . . . . . . . . . . . . . . . . . . . . . . . . . . . . . . . . . . . . . . . . . . . . . . . . . . . . 2,148,020 2,148,020 — —Morgan Stanley & Co. LLC . . . . . . . . . . . . . . . . . . . . . . . . . . . . . . . . . . . . . . . . . . . . . . . . . . . . . . . . . . . 9,126,783 9,126,783 — —Scotia Capital (USA) Inc. . . . . . . . . . . . . . . . . . . . . . . . . . . . . . . . . . . . . . . . . . . . . . . . . . . . . . . . . . . . . . 97,296 97,296 — —TD Prime Services LLC . . . . . . . . . . . . . . . . . . . . . . . . . . . . . . . . . . . . . . . . . . . . . . . . . . . . . . . . . . . . . . 1,455,487 1,455,487 — —Wells Fargo Securities LLC. . . . . . . . . . . . . . . . . . . . . . . . . . . . . . . . . . . . . . . . . . . . . . . . . . . . . . . . . . . 512,750 512,750 — —
$ 13,772,087 $ 13,772,087 $ — $ —
MSCI USA Size FactorBarclays Bank PLC . . . . . . . . . . . . . . . . . . . . . . . . . . . . . . . . . . . . . . . . . . . . . . . . . . . . . . . . . . . . . . . . . . $ 841,573 $ 841,573 $ — $ —BNP Paribas Prime Brokerage International Ltd. . . . . . . . . . . . . . . . . . . . . . . . . . . . . . . . . . . . . . . . 2,845,245 2,845,245 — —BNP Paribas Securities Corp.. . . . . . . . . . . . . . . . . . . . . . . . . . . . . . . . . . . . . . . . . . . . . . . . . . . . . . . . . 1,265,429 1,265,429 — —Credit Suisse Securities (USA) LLC. . . . . . . . . . . . . . . . . . . . . . . . . . . . . . . . . . . . . . . . . . . . . . . . . . . 342,264 342,264 — —Goldman Sachs & Co.. . . . . . . . . . . . . . . . . . . . . . . . . . . . . . . . . . . . . . . . . . . . . . . . . . . . . . . . . . . . . . . . 4,756,055 4,756,055 — —Jefferies LLC . . . . . . . . . . . . . . . . . . . . . . . . . . . . . . . . . . . . . . . . . . . . . . . . . . . . . . . . . . . . . . . . . . . . . . . . 351,450 351,450 — —JPMorgan Securities LLC . . . . . . . . . . . . . . . . . . . . . . . . . . . . . . . . . . . . . . . . . . . . . . . . . . . . . . . . . . . . 1,432,616 1,432,616 — —Morgan Stanley & Co. LLC . . . . . . . . . . . . . . . . . . . . . . . . . . . . . . . . . . . . . . . . . . . . . . . . . . . . . . . . . . . 4,093,890 4,093,890 — —Scotia Capital (USA) Inc. . . . . . . . . . . . . . . . . . . . . . . . . . . . . . . . . . . . . . . . . . . . . . . . . . . . . . . . . . . . . . 1,235,496 1,235,496 — —SG Americas Securities LLC. . . . . . . . . . . . . . . . . . . . . . . . . . . . . . . . . . . . . . . . . . . . . . . . . . . . . . . . . . 2,192,513 2,192,513 — —Virtu Americas LLC . . . . . . . . . . . . . . . . . . . . . . . . . . . . . . . . . . . . . . . . . . . . . . . . . . . . . . . . . . . . . . . . . . 119,221 119,221 — —
$ 19,475,752 $ 19,475,752 $ — $ —
MSCI USA Value FactorBarclays Bank PLC . . . . . . . . . . . . . . . . . . . . . . . . . . . . . . . . . . . . . . . . . . . . . . . . . . . . . . . . . . . . . . . . . . $ 1,703,251 $ 1,703,251 $ — $ —BNP Paribas Prime Brokerage International Ltd. . . . . . . . . . . . . . . . . . . . . . . . . . . . . . . . . . . . . . . . 706,151 706,151 — —Deutsche Bank Securities Inc. . . . . . . . . . . . . . . . . . . . . . . . . . . . . . . . . . . . . . . . . . . . . . . . . . . . . . . . . 2,613,801 2,613,801 — —Goldman Sachs & Co.. . . . . . . . . . . . . . . . . . . . . . . . . . . . . . . . . . . . . . . . . . . . . . . . . . . . . . . . . . . . . . . . 9,877,093 9,877,093 — —HSBC Bank PLC. . . . . . . . . . . . . . . . . . . . . . . . . . . . . . . . . . . . . . . . . . . . . . . . . . . . . . . . . . . . . . . . . . . . . 115,500 115,500 — —Jefferies LLC . . . . . . . . . . . . . . . . . . . . . . . . . . . . . . . . . . . . . . . . . . . . . . . . . . . . . . . . . . . . . . . . . . . . . . . . 12,025 12,025 — —TD Prime Services LLC . . . . . . . . . . . . . . . . . . . . . . . . . . . . . . . . . . . . . . . . . . . . . . . . . . . . . . . . . . . . . . 446,014 444,710 — (1,304)(b)
$ 15,473,835 $ 15,472,531 $ — $ (1,304)
(a) Collateral received in excess of the market value of securities on loan is not presented in this table. The total cash collateral received by each Fund is disclosed in the Fund's statementof assets and liabilities.
(b) The market value of the loaned securities is determined as of July 31, 2021. Additional collateral is delivered to the Fund on the next business day in accordance with the MSLA. Thenet amount would be subject to the borrower default indemnity in the event of default by a counterparty.
The risks of securities lending include the risk that the borrower may not provide additional collateral when required or may not return the securities when due. To mitigatethese risks, each Fund benefits from a borrower default indemnity provided by BlackRock, Inc. (“BlackRock”). BlackRock’s indemnity allows for full replacement of thesecurities loaned to the extent the collateral received does not cover the value of the securities loaned in the event of borrower default. Each Fund could incur a loss if thevalue of an investment purchased with cash collateral falls below the market value of the loaned securities or if the value of an investment purchased with cash collateralfalls below the value of the original cash collateral received. Such losses are borne entirely by each Fund.
5. DERIVATIVE FINANCIAL INSTRUMENTS
Futures Contracts: Futures contracts are purchased or sold to gain exposure to, or manage exposure to, changes in interest rates (interest rate risk) and changes in thevalue of equity securities (equity risk) or foreign currencies (foreign currency exchange rate risk).
Futures contracts are exchange-traded agreements between the Funds and a counterparty to buy or sell a specific quantity of an underlying instrument at a specified priceand on a specified date. Depending on the terms of a contract, it is settled either through physical delivery of the underlying instrument on the settlement date or by paymentof a cash amount on the settlement date. Upon entering into a futures contract, the Funds are required to deposit initial margin with the broker in the form of cash or securitiesin an amount that varies depending on a contract’s size and risk profile. The initial margin deposit must then be maintained at an established level over the life of the contract.Amounts pledged, which are considered restricted, are included in cash pledged for futures contracts in the statements of assets and liabilities.
Securities deposited as initial margin are designated in the schedule of investments and cash deposited, if any, are shown as cash pledged for futures contracts in thestatements of assets and liabilities. Pursuant to the contract, the Funds agree to receive from or pay to the broker an amount of cash equal to the daily fluctuation in marketvalue of the contract (“variation margin”). Variation margin is recorded as unrealized appreciation (depreciation) and, if any, shown as variation margin receivable (orpayable) on futures contracts in the statements of assets and liabilities. When the contract is closed, a realized gain or loss is recorded in the statements of operations equalto the difference between the notional amount of the contract at the time it was opened and the notional amount at the time it was closed. The use of futures contractsinvolves the risk of an imperfect correlation in the movements in the price of futures contracts and interest rates, foreign currency exchange rates or underlying assets.
Notes to Financial Statements (continued)
88 2 0 2 1 I S H A R E S A N N U A L R E P O R T T O S H A R E H O L D E R S

6. INVESTMENT ADVISORY AGREEMENT AND OTHER TRANSACTIONS WITH AFFILIATES
Investment Advisory Fees: Pursuant to an Investment Advisory Agreement with the Trust, BFA manages the investment of each Fund’s assets. BFA is a Californiacorporation indirectly owned by BlackRock. Under the Investment Advisory Agreement, BFA is responsible for substantially all expenses of the Funds, except (i) interestand taxes; (ii) brokerage commissions and other expenses connected with the execution of portfolio transactions; (iii) distribution fees; (iv) the advisory fee payable to BFA;and (v) litigation expenses and any extraordinary expenses (in each case as determined by a majority of the independent trustees).
For its investment advisory services to each Fund, BFA is entitled to an annual investment advisory fee, accrued daily and paid monthly by the Funds, based on the averagedaily net assets of each Fund as follows:
iShares ETF Investment Advisory Fee
MSCI Intl Momentum Factor . . . . . . . . . . . . . . . . . . . . . . . . . . . . . . . . . . . . . . . . . . . . . . . . . . . . . . . . . . . . . . . . . . . . . . . . . . . . . . . . . . . . . . . . . . . . . . . . . . . . . . . . . . . . . . . . . . . . 0.30%MSCI Intl Quality Factor . . . . . . . . . . . . . . . . . . . . . . . . . . . . . . . . . . . . . . . . . . . . . . . . . . . . . . . . . . . . . . . . . . . . . . . . . . . . . . . . . . . . . . . . . . . . . . . . . . . . . . . . . . . . . . . . . . . . . . . . 0.30MSCI Intl Size Factor. . . . . . . . . . . . . . . . . . . . . . . . . . . . . . . . . . . . . . . . . . . . . . . . . . . . . . . . . . . . . . . . . . . . . . . . . . . . . . . . . . . . . . . . . . . . . . . . . . . . . . . . . . . . . . . . . . . . . . . . . . . 0.30MSCI Intl Value Factor. . . . . . . . . . . . . . . . . . . . . . . . . . . . . . . . . . . . . . . . . . . . . . . . . . . . . . . . . . . . . . . . . . . . . . . . . . . . . . . . . . . . . . . . . . . . . . . . . . . . . . . . . . . . . . . . . . . . . . . . . . 0.30MSCI USA Momentum Factor. . . . . . . . . . . . . . . . . . . . . . . . . . . . . . . . . . . . . . . . . . . . . . . . . . . . . . . . . . . . . . . . . . . . . . . . . . . . . . . . . . . . . . . . . . . . . . . . . . . . . . . . . . . . . . . . . . . 0.15MSCI USA Quality Factor. . . . . . . . . . . . . . . . . . . . . . . . . . . . . . . . . . . . . . . . . . . . . . . . . . . . . . . . . . . . . . . . . . . . . . . . . . . . . . . . . . . . . . . . . . . . . . . . . . . . . . . . . . . . . . . . . . . . . . . 0.15MSCI USA Size Factor . . . . . . . . . . . . . . . . . . . . . . . . . . . . . . . . . . . . . . . . . . . . . . . . . . . . . . . . . . . . . . . . . . . . . . . . . . . . . . . . . . . . . . . . . . . . . . . . . . . . . . . . . . . . . . . . . . . . . . . . . 0.15MSCI USA Value Factor . . . . . . . . . . . . . . . . . . . . . . . . . . . . . . . . . . . . . . . . . . . . . . . . . . . . . . . . . . . . . . . . . . . . . . . . . . . . . . . . . . . . . . . . . . . . . . . . . . . . . . . . . . . . . . . . . . . . . . . . 0.15
Distributor: BlackRock Investments, LLC, an affiliate of BFA, is the distributor for each Fund. Pursuant to the distribution agreement, BFA is responsible for any fees orexpenses for distribution services provided to the Funds.
Securities Lending: The U.S. Securities and Exchange Commission (the “SEC”) has issued an exemptive order which permits BlackRock Institutional Trust Company,N.A. (“BTC”), an affiliate of BFA, to serve as securities lending agent for the Funds, subject to applicable conditions. As securities lending agent, BTC bears all operationalcosts directly related to securities lending. Each Fund is responsible for fees in connection with the investment of cash collateral received for securities on loan (the“collateral investment fees”). The cash collateral is invested in a money market fund, BlackRock Cash Funds: Institutional or BlackRock Cash Funds: Treasury, managedby BFA, or its affiliates. However, BTC has agreed to reduce the amount of securities lending income it receives in order to effectively limit the collateral investment feesffeach Fund bears to an annual rate of 0.04%. The SL Agency Shares of such money market fund will not be subject to a sales load, distribution fee or service fee. The moneymarket fund in which the cash collateral has been invested may, under certain circumstances, impose a liquidity fee of up to 2% of the value redeemed or temporarily restrictredemptions for up to 10 business days during a 90 day period, in the event that the money market fund’s weekly liquid assets fall below certain thresholds.
Securities lending income is equal to the total of income earned from the reinvestment of cash collateral, net of fees and other payments to and from borrowers of securities,and less the collateral investment fees. Each Fund retains a portion of securities lending income and remits the remaining portion to BTC as compensation for its servicesas securities lending agent.
Pursuant to the current securities lending agreement, each of iShares MSCI USA Momentum Factor ETF, iShares MSCI USA Quality Factor ETF, iShares MSCI USA SizeFactor ETF and iShares MSCI USA Value Factor ETF (the “Group 1 Funds”), retains 77% of securities lending income (which excludes collateral investment fees) and theamount retained can never be less than 70% of the total of securities lending income plus the collateral investment fees.
Pursuant to the current securities lending agreement, each of iShares MSCI Intl Momentum Factor ETF, iShares MSCI Intl Quality Factor ETF, iShares MSCI Intl Size FactorETF and iShares MSCI Intl Value Factor ETF (the “Group 2 Funds”), retains 82% of securities lending income (which excludes collateral investment fees) and the amountretained can never be less than 70% of the total of securities lending income plus the collateral investment fees.
In addition, commencing the business day following the date that the aggregate securities lending income plus the collateral investment fees generated across all 1940 ActiShares exchange-traded funds (the “iShares ETF Complex”) in a given calendar year exceeds a specified threshold: (1) each Group 1 Fund, pursuant to the securitieslending agreement, will retain for the remainder of that calendar year 81% of securities lending income (which excludes collateral investment fees), and the amount retainedcan never be less than 70% of the total of securities lending income plus the collateral investment fees, and (2) each Group 2 Fund will retain for the remainder of thatcalendar year 85% of securities lending income (which excludes collateral investment fees), and the amount retained can never be less than 70% of the total of securitieslending income plus the collateral investment fees.
Prior to January 1, 2021, each Group 1 Fund retained 75% of securities lending income (which excludes collateral investment fees) and the amount retained was not lessthan 70% of the total of securities lending income plus the collateral investment fees. Each Group 2 Fund retained 82% of securities lending income (which excludescollateral investment fees) and the amount retained was not less than 70% of the total of securities lending income plus the collateral investment fees. In addition,commencing the business day following the date that the aggregate securities lending income plus the collateral investment fees generated across the iShares ETFComplex in a calendar year exceeded a specified threshold: (1) each Group 1 Fund, pursuant to the securities lending agreement, retained for the remainder of that calendaryear 80% of securities lending income (which excludes collateral investment fees), and the amount retained could never be less than 70% of the total of securities lendingincome plus the collateral investment fees, and (2) each Group 2 Fund, pursuant to the securities lending agreement, retained for the remainder of that calendar year 85%of securities lending income (which excludes collateral investment fees), and the amount retained could never be less than 70% of the total of securities lending income plusthe collateral investment fees.
Notes to Financial Statements (continued)
N O T E S T O F I N A N C I A L S T A T E M E N T S 89

The share of securities lending income earned by each Fund is shown as securities lending income – affiliated – net in its statements of operations. For the year endedJuly 31, 2021, the Funds paid BTC the following amounts for securities lending agent services:
iShares ETFFees Paid
to BTC
MSCI Intl Momentum Factor . . . . . . . . . . . . . . . . . . . . . . . . . . . . . . . . . . . . . . . . . . . . . . . . . . . . . . . . . . . . . . . . . . . . . . . . . . . . . . . . . . . . . . . . . . . . . . . . . . . . . . . . . . . . . . . . . . . . . . . . . . . . . . . . . . $ 1,388MSCI Intl Quality Factor . . . . . . . . . . . . . . . . . . . . . . . . . . . . . . . . . . . . . . . . . . . . . . . . . . . . . . . . . . . . . . . . . . . . . . . . . . . . . . . . . . . . . . . . . . . . . . . . . . . . . . . . . . . . . . . . . . . . . . . . . . . . . . . . . . . . . . 4,912MSCI Intl Size Factor . . . . . . . . . . . . . . . . . . . . . . . . . . . . . . . . . . . . . . . . . . . . . . . . . . . . . . . . . . . . . . . . . . . . . . . . . . . . . . . . . . . . . . . . . . . . . . . . . . . . . . . . . . . . . . . . . . . . . . . . . . . . . . . . . . . . . . . . . 482MSCI Intl Value Factor. . . . . . . . . . . . . . . . . . . . . . . . . . . . . . . . . . . . . . . . . . . . . . . . . . . . . . . . . . . . . . . . . . . . . . . . . . . . . . . . . . . . . . . . . . . . . . . . . . . . . . . . . . . . . . . . . . . . . . . . . . . . . . . . . . . . . . . . 6,243MSCI USA Momentum Factor. . . . . . . . . . . . . . . . . . . . . . . . . . . . . . . . . . . . . . . . . . . . . . . . . . . . . . . . . . . . . . . . . . . . . . . . . . . . . . . . . . . . . . . . . . . . . . . . . . . . . . . . . . . . . . . . . . . . . . . . . . . . . . . . . 235,628MSCI USA Quality Factor . . . . . . . . . . . . . . . . . . . . . . . . . . . . . . . . . . . . . . . . . . . . . . . . . . . . . . . . . . . . . . . . . . . . . . . . . . . . . . . . . . . . . . . . . . . . . . . . . . . . . . . . . . . . . . . . . . . . . . . . . . . . . . . . . . . . . 35,042MSCI USA Size Factor . . . . . . . . . . . . . . . . . . . . . . . . . . . . . . . . . . . . . . . . . . . . . . . . . . . . . . . . . . . . . . . . . . . . . . . . . . . . . . . . . . . . . . . . . . . . . . . . . . . . . . . . . . . . . . . . . . . . . . . . . . . . . . . . . . . . . . . 23,014MSCI USA Value Factor . . . . . . . . . . . . . . . . . . . . . . . . . . . . . . . . . . . . . . . . . . . . . . . . . . . . . . . . . . . . . . . . . . . . . . . . . . . . . . . . . . . . . . . . . . . . . . . . . . . . . . . . . . . . . . . . . . . . . . . . . . . . . . . . . . . . . . 55,096
Officers and Trustees: Certain officers and/or trustees of the Trust are officers and/or trustees of BlackRock or its affiliates.
Other Transactions: Cross trading is the buying or selling of portfolio securities between funds to which BFA (or an affiliate) serves as investment adviser. At its regularlyscheduled quarterly meetings, the Board reviews such transactions as of the most recent calendar quarter for compliance with the requirements and restrictions set forthby Rule 17a-7.
For the year ended July 31, 2021, transactions executed by the Funds pursuant to Rule 17a-7 under the 1940 Act were as follows:
iShares ETF Purchases SalesNet Realized
Gain (Loss)
MSCI Intl Momentum Factor . . . . . . . . . . . . . . . . . . . . . . . . . . . . . . . . . . . . . . . . . . . . . . . . . . . . . . . . . . . . . . . . . . . . . . . . . . . . . . . . . . . . $ 273,005,302 $ 247,535,212 $ 16,014,255MSCI Intl Quality Factor . . . . . . . . . . . . . . . . . . . . . . . . . . . . . . . . . . . . . . . . . . . . . . . . . . . . . . . . . . . . . . . . . . . . . . . . . . . . . . . . . . . . . . . . 320,862,355 297,538,772 564,048MSCI Intl Value Factor. . . . . . . . . . . . . . . . . . . . . . . . . . . . . . . . . . . . . . . . . . . . . . . . . . . . . . . . . . . . . . . . . . . . . . . . . . . . . . . . . . . . . . . . . . 57,584,601 69,061,715 (4,854,878)MSCI USA Momentum Factor. . . . . . . . . . . . . . . . . . . . . . . . . . . . . . . . . . . . . . . . . . . . . . . . . . . . . . . . . . . . . . . . . . . . . . . . . . . . . . . . . . . 1,346,039,679 1,724,276,149 139,081,519MSCI USA Quality Factor . . . . . . . . . . . . . . . . . . . . . . . . . . . . . . . . . . . . . . . . . . . . . . . . . . . . . . . . . . . . . . . . . . . . . . . . . . . . . . . . . . . . . . . 1,475,827,587 923,246,349 (42,091,599)MSCI USA Size Factor . . . . . . . . . . . . . . . . . . . . . . . . . . . . . . . . . . . . . . . . . . . . . . . . . . . . . . . . . . . . . . . . . . . . . . . . . . . . . . . . . . . . . . . . . 71,347,136 82,477,380 3,073,053MSCI USA Value Factor . . . . . . . . . . . . . . . . . . . . . . . . . . . . . . . . . . . . . . . . . . . . . . . . . . . . . . . . . . . . . . . . . . . . . . . . . . . . . . . . . . . . . . . . 730,211,728 793,706,880 30,941,427
Each Fund may invest its positive cash balances in certain money market funds managed by BFA or an affiliate. The income earned on these temporary cash investmentsis shown as dividends – affiliated in the statements of operations.
A fund, in order to improve its portfolio liquidity and its ability to track its underlying index, may invest in shares of other iShares funds that invest in securities in the fund’sunderlying index.
7. PURCHASES AND SALES
For the year ended July 31, 2021, purchases and sales of investments, excluding short-term investments and in-kind transactions, were as follows:
iShares ETF Purchases Sales
MSCI Intl Momentum Factor . . . . . . . . . . . . . . . . . . . . . . . . . . . . . . . . . . . . . . . . . . . . . . . . . . . . . . . . . . . . . . . . . . . . . . . . . . . . . . . . . . . . . . . . . . . . . . . . . . . . . $ 819,289,117 $ 694,270,603MSCI Intl Quality Factor . . . . . . . . . . . . . . . . . . . . . . . . . . . . . . . . . . . . . . . . . . . . . . . . . . . . . . . . . . . . . . . . . . . . . . . . . . . . . . . . . . . . . . . . . . . . . . . . . . . . . . . . . 1,275,031,667 993,146,107MSCI Intl Size Factor . . . . . . . . . . . . . . . . . . . . . . . . . . . . . . . . . . . . . . . . . . . . . . . . . . . . . . . . . . . . . . . . . . . . . . . . . . . . . . . . . . . . . . . . . . . . . . . . . . . . . . . . . . . . 6,277,763 6,553,471MSCI Intl Value Factor. . . . . . . . . . . . . . . . . . . . . . . . . . . . . . . . . . . . . . . . . . . . . . . . . . . . . . . . . . . . . . . . . . . . . . . . . . . . . . . . . . . . . . . . . . . . . . . . . . . . . . . . . . . 209,459,575 168,855,512MSCI USA Momentum Factor. . . . . . . . . . . . . . . . . . . . . . . . . . . . . . . . . . . . . . . . . . . . . . . . . . . . . . . . . . . . . . . . . . . . . . . . . . . . . . . . . . . . . . . . . . . . . . . . . . . . 14,343,416,023 14,394,667,883MSCI USA Quality Factor . . . . . . . . . . . . . . . . . . . . . . . . . . . . . . . . . . . . . . . . . . . . . . . . . . . . . . . . . . . . . . . . . . . . . . . . . . . . . . . . . . . . . . . . . . . . . . . . . . . . . . . . 9,593,953,770 9,578,334,696MSCI USA Size Factor . . . . . . . . . . . . . . . . . . . . . . . . . . . . . . . . . . . . . . . . . . . . . . . . . . . . . . . . . . . . . . . . . . . . . . . . . . . . . . . . . . . . . . . . . . . . . . . . . . . . . . . . . . 191,572,590 192,658,870MSCI USA Value Factor . . . . . . . . . . . . . . . . . . . . . . . . . . . . . . . . . . . . . . . . . . . . . . . . . . . . . . . . . . . . . . . . . . . . . . . . . . . . . . . . . . . . . . . . . . . . . . . . . . . . . . . . . 3,117,861,963 3,059,764,517
Notes to Financial Statements (continued)
90 2 0 2 1 I S H A R E S A N N U A L R E P O R T T O S H A R E H O L D E R S

For the year ended July 31, 2021, in-kind transactions were as follows:
iShares ETFIn-kind
PurchasesIn-kindSales
MSCI Intl Momentum Factor. . . . . . . . . . . . . . . . . . . . . . . . . . . . . . . . . . . . . . . . . . . . . . . . . . . . . . . . . . . . . . . . . . . . . . . . . . . . . . . . . . . . . . . . . . . . . . . . . . . . . . . . $ 298,684,995 $ 105,024,470MSCI Intl Quality Factor. . . . . . . . . . . . . . . . . . . . . . . . . . . . . . . . . . . . . . . . . . . . . . . . . . . . . . . . . . . . . . . . . . . . . . . . . . . . . . . . . . . . . . . . . . . . . . . . . . . . . . . . . . . . 1,311,939,050 154,183,145MSCI Intl Size Factor . . . . . . . . . . . . . . . . . . . . . . . . . . . . . . . . . . . . . . . . . . . . . . . . . . . . . . . . . . . . . . . . . . . . . . . . . . . . . . . . . . . . . . . . . . . . . . . . . . . . . . . . . . . . . . 11,400,755 12,347,875MSCI Intl Value Factor . . . . . . . . . . . . . . . . . . . . . . . . . . . . . . . . . . . . . . . . . . . . . . . . . . . . . . . . . . . . . . . . . . . . . . . . . . . . . . . . . . . . . . . . . . . . . . . . . . . . . . . . . . . . . 750,651,679 264,502,509MSCI USA Momentum Factor . . . . . . . . . . . . . . . . . . . . . . . . . . . . . . . . . . . . . . . . . . . . . . . . . . . . . . . . . . . . . . . . . . . . . . . . . . . . . . . . . . . . . . . . . . . . . . . . . . . . . . 9,584,329,872 8,553,334,142MSCI USA Quality Factor . . . . . . . . . . . . . . . . . . . . . . . . . . . . . . . . . . . . . . . . . . . . . . . . . . . . . . . . . . . . . . . . . . . . . . . . . . . . . . . . . . . . . . . . . . . . . . . . . . . . . . . . . . 8,509,613,562 9,800,089,908MSCI USA Size Factor . . . . . . . . . . . . . . . . . . . . . . . . . . . . . . . . . . . . . . . . . . . . . . . . . . . . . . . . . . . . . . . . . . . . . . . . . . . . . . . . . . . . . . . . . . . . . . . . . . . . . . . . . . . . . 1,005,741,954 1,371,795,071MSCI USA Value Factor. . . . . . . . . . . . . . . . . . . . . . . . . . . . . . . . . . . . . . . . . . . . . . . . . . . . . . . . . . . . . . . . . . . . . . . . . . . . . . . . . . . . . . . . . . . . . . . . . . . . . . . . . . . . 9,575,852,551 2,671,164,114
8. INCOME TAX INFORMATION
Each Fund is treated as an entity separate from the Trust's other funds for federal income tax purposes. It is each Fund’s policy to comply with the requirements of theInternal Revenue Code of 1986, as amended, applicable to regulated investment companies, and to distribute substantially all of its taxable income to its shareholders.fTherefore, no U.S. federal income tax provision is required.
Management has analyzed tax laws and regulations and their application to the Funds as of July 31, 2021, inclusive of the open tax return years, and does not believe thatthere are any uncertain tax positions that require recognition of a tax liability in the Funds' financial statements.
U.S. GAAP requires that certain components of net assets be adjusted to reflect permanent differences between financial and tax reporting. These reclassifications haveno effect on net assets or NAV per share. As of July 31, 2021, the following permanent differences attributable to realized gains (losses) from in-kind redemptions werereclassified to the following accounts:
iShares ETF Paid-in CapitalAccumulated
Earnings (Loss)
MSCI Intl Momentum Factor . . . . . . . . . . . . . . . . . . . . . . . . . . . . . . . . . . . . . . . . . . . . . . . . . . . . . . . . . . . . . . . . . . . . . . . . . . . . . . . . . . . . . . . . . . . . . . . . . . . . . . . $ 20,195,863 $ (20,195,863)MSCI Intl Quality Factor . . . . . . . . . . . . . . . . . . . . . . . . . . . . . . . . . . . . . . . . . . . . . . . . . . . . . . . . . . . . . . . . . . . . . . . . . . . . . . . . . . . . . . . . . . . . . . . . . . . . . . . . . . . 42,967,789 (42,967,789)MSCI Intl Size Factor . . . . . . . . . . . . . . . . . . . . . . . . . . . . . . . . . . . . . . . . . . . . . . . . . . . . . . . . . . . . . . . . . . . . . . . . . . . . . . . . . . . . . . . . . . . . . . . . . . . . . . . . . . . . . 3,645,521 (3,645,521)MSCI Intl Value Factor . . . . . . . . . . . . . . . . . . . . . . . . . . . . . . . . . . . . . . . . . . . . . . . . . . . . . . . . . . . . . . . . . . . . . . . . . . . . . . . . . . . . . . . . . . . . . . . . . . . . . . . . . . . . 68,700,006 (68,700,006)MSCI USA Momentum Factor . . . . . . . . . . . . . . . . . . . . . . . . . . . . . . . . . . . . . . . . . . . . . . . . . . . . . . . . . . . . . . . . . . . . . . . . . . . . . . . . . . . . . . . . . . . . . . . . . . . . . 2,781,904,498 (2,781,904,498)MSCI USA Quality Factor . . . . . . . . . . . . . . . . . . . . . . . . . . . . . . . . . . . . . . . . . . . . . . . . . . . . . . . . . . . . . . . . . . . . . . . . . . . . . . . . . . . . . . . . . . . . . . . . . . . . . . . . . 2,761,090,382 (2,761,090,382)MSCI USA Size Factor . . . . . . . . . . . . . . . . . . . . . . . . . . . . . . . . . . . . . . . . . . . . . . . . . . . . . . . . . . . . . . . . . . . . . . . . . . . . . . . . . . . . . . . . . . . . . . . . . . . . . . . . . . . . 241,070,904 (241,070,904)MSCI USA Value Factor . . . . . . . . . . . . . . . . . . . . . . . . . . . . . . . . . . . . . . . . . . . . . . . . . . . . . . . . . . . . . . . . . . . . . . . . . . . . . . . . . . . . . . . . . . . . . . . . . . . . . . . . . . . 863,475,722 (863,475,722)
The tax character of distributions was as follows:
iShares ETFYear Ended
07/31/21Year Ended
07/31/20
MSCI Intl Momentum FactorOrdinary income . . . . . . . . . . . . . . . . . . . . . . . . . . . . . . . . . . . . . . . . . . . . . . . . . . . . . . . . . . . . . . . . . . . . . . . . . . . . . . . . . . . . . . . . . . . . . . . . . . . . . . . . . . . . . . . . . . . . . . $ 8,730,181 $ 3,744,026
MSCI Intl Quality FactorOrdinary income . . . . . . . . . . . . . . . . . . . . . . . . . . . . . . . . . . . . . . . . . . . . . . . . . . . . . . . . . . . . . . . . . . . . . . . . . . . . . . . . . . . . . . . . . . . . . . . . . . . . . . . . . . . . . . . . . . . . . . $ 57,477,491 $ 26,454,635
MSCI Intl Size FactorOrdinary income . . . . . . . . . . . . . . . . . . . . . . . . . . . . . . . . . . . . . . . . . . . . . . . . . . . . . . . . . . . . . . . . . . . . . . . . . . . . . . . . . . . . . . . . . . . . . . . . . . . . . . . . . . . . . . . . . . . . . . $ 608,671 $ 214,337
MSCI Intl Value FactorOrdinary income . . . . . . . . . . . . . . . . . . . . . . . . . . . . . . . . . . . . . . . . . . . . . . . . . . . . . . . . . . . . . . . . . . . . . . . . . . . . . . . . . . . . . . . . . . . . . . . . . . . . . . . . . . . . . . . . . . . . . . $ 21,160,486 $ 10,881,712
MSCI USA Momentum FactorOrdinary income . . . . . . . . . . . . . . . . . . . . . . . . . . . . . . . . . . . . . . . . . . . . . . . . . . . . . . . . . . . . . . . . . . . . . . . . . . . . . . . . . . . . . . . . . . . . . . . . . . . . . . . . . . . . . . . . . . . . . . $ 63,350,348 $134,237,347
MSCI USA Quality FactorOrdinary income . . . . . . . . . . . . . . . . . . . . . . . . . . . . . . . . . . . . . . . . . . . . . . . . . . . . . . . . . . . . . . . . . . . . . . . . . . . . . . . . . . . . . . . . . . . . . . . . . . . . . . . . . . . . . . . . . . . . . . $308,371,260 $256,875,797
MSCI USA Size FactorOrdinary income . . . . . . . . . . . . . . . . . . . . . . . . . . . . . . . . . . . . . . . . . . . . . . . . . . . . . . . . . . . . . . . . . . . . . . . . . . . . . . . . . . . . . . . . . . . . . . . . . . . . . . . . . . . . . . . . . . . . . . $ 12,325,649 $ 15,316,633
MSCI USA Value FactorOrdinary income . . . . . . . . . . . . . . . . . . . . . . . . . . . . . . . . . . . . . . . . . . . . . . . . . . . . . . . . . . . . . . . . . . . . . . . . . . . . . . . . . . . . . . . . . . . . . . . . . . . . . . . . . . . . . . . . . . . . . . $237,616,292 $118,978,842
Notes to Financial Statements (continued)
N O T E S T O F I N A N C I A L S T A T E M E N T S 91

As of July 31, 2021, the tax components of accumulated net earnings (losses) were as follows:
iShares ETFUndistributed
Ordinary IncomeUndistributed
Long-Term Capital Gains
Non-expiringCapital Loss
Carryforwards(a)Net UnrealizedGains (Losses)(b) Total
MSCI Intl Momentum Factor . . . . . . . . . . . . . . . . . . . . . . . . . . . . . . . $ 3,051,850 $ 25,431,589 $ — $ 91,548,749 $ 120,032,188MSCI Intl Quality Factor . . . . . . . . . . . . . . . . . . . . . . . . . . . . . . . . . . . 9,723,088 81,574 — 679,983,503 689,788,165MSCI Intl Size Factor . . . . . . . . . . . . . . . . . . . . . . . . . . . . . . . . . . . . . . 160,121 — (418,572) 2,812,651 2,554,200MSCI Intl Value Factor. . . . . . . . . . . . . . . . . . . . . . . . . . . . . . . . . . . . . 6,089,063 — (33,298,935) 14,435,974 (12,773,898)MSCI USA Momentum Factor. . . . . . . . . . . . . . . . . . . . . . . . . . . . . . 10,396,964 — (764,807,988) 1,751,594,814 997,183,790MSCI USA Quality Factor . . . . . . . . . . . . . . . . . . . . . . . . . . . . . . . . . . 22,980,339 — (596,095,846) 5,322,824,188 4,749,708,681MSCI USA Size Factor . . . . . . . . . . . . . . . . . . . . . . . . . . . . . . . . . . . . 209,621 — (39,163,179) 48,366,670 9,413,112MSCI USA Value Factor . . . . . . . . . . . . . . . . . . . . . . . . . . . . . . . . . . . 57,220,168 — (426,439,229) 2,141,992,329 1,772,773,268
(a) Amounts available to offset future realized capital gains.(b) The difference between book-basis and tax-basis unrealized gains (losses) was attributable primarily to the tax deferral of losses on wash sales, the realization for tax purposes of
unrealized gains (losses) on certain futures contracts, timing and recognition of partnership income and the realization for tax purposes of unrealized gains on investments in passiveforeign investment companies.
For the year ended July 31, 2021, the Funds utilized the following amounts of their respective capital loss carryforwards:
iShares ETF Utilized
MSCI Intl Momentum Factor. . . . . . . . . . . . . . . . . . . . . . . . . . . . . . . . . . . . . . . . . . . . . . . . . . . . . . . . . . . . . . . . . . . . . . . . . . . . . . . . . . . . . . . . . . . . . . . . . . . . . . . . . . . . . . . . . . . . . . . . . . . . . . . $ 32,197,315MSCI Intl Quality Factor. . . . . . . . . . . . . . . . . . . . . . . . . . . . . . . . . . . . . . . . . . . . . . . . . . . . . . . . . . . . . . . . . . . . . . . . . . . . . . . . . . . . . . . . . . . . . . . . . . . . . . . . . . . . . . . . . . . . . . . . . . . . . . . . . . . 57,050,216MSCI Intl Size Factor . . . . . . . . . . . . . . . . . . . . . . . . . . . . . . . . . . . . . . . . . . . . . . . . . . . . . . . . . . . . . . . . . . . . . . . . . . . . . . . . . . . . . . . . . . . . . . . . . . . . . . . . . . . . . . . . . . . . . . . . . . . . . . . . . . . . . 237,208MSCI USA Momentum Factor . . . . . . . . . . . . . . . . . . . . . . . . . . . . . . . . . . . . . . . . . . . . . . . . . . . . . . . . . . . . . . . . . . . . . . . . . . . . . . . . . . . . . . . . . . . . . . . . . . . . . . . . . . . . . . . . . . . . . . . . . . . . . 449,240,902MSCI USA Quality Factor . . . . . . . . . . . . . . . . . . . . . . . . . . . . . . . . . . . . . . . . . . . . . . . . . . . . . . . . . . . . . . . . . . . . . . . . . . . . . . . . . . . . . . . . . . . . . . . . . . . . . . . . . . . . . . . . . . . . . . . . . . . . . . . . . 29,965
A fund may own shares in certain foreign investment entities, referred to, under U.S. tax law, as “passive foreign investment companies.” Such fund may elect tomark-to-market annually the shares of each passive foreign investment company and would be required to distribute to shareholders any such marked-to-market gains.
As of July 31, 2021, gross unrealized appreciation and depreciation based on cost of investments (including short positions and derivatives, if any) for U.S. federal incometax purposes were as follows:
iShares ETF Tax CostGross Unrealized
AppreciationGross Unrealized
Depreciation
Net UnrealizedAppreciation
(Depreciation)
MSCI Intl Momentum Factor. . . . . . . . . . . . . . . . . . . . . . . . . . . . . . . . . . . . . . . . . . . . . . . . . . . . . . . . . $ 738,388,312 $ 116,873,187 $ (25,349,321) $ 91,523,866MSCI Intl Quality Factor. . . . . . . . . . . . . . . . . . . . . . . . . . . . . . . . . . . . . . . . . . . . . . . . . . . . . . . . . . . . . 3,051,207,353 707,474,830 (27,626,964) 679,847,866MSCI Intl Size Factor . . . . . . . . . . . . . . . . . . . . . . . . . . . . . . . . . . . . . . . . . . . . . . . . . . . . . . . . . . . . . . . 22,529,698 3,440,178 (627,642) 2,812,536MSCI Intl Value Factor . . . . . . . . . . . . . . . . . . . . . . . . . . . . . . . . . . . . . . . . . . . . . . . . . . . . . . . . . . . . . . 1,105,864,985 63,553,960 (49,132,504) 14,421,456MSCI USA Momentum Factor . . . . . . . . . . . . . . . . . . . . . . . . . . . . . . . . . . . . . . . . . . . . . . . . . . . . . . . 12,844,906,909 2,131,868,478 (380,273,664) 1,751,594,814MSCI USA Quality Factor . . . . . . . . . . . . . . . . . . . . . . . . . . . . . . . . . . . . . . . . . . . . . . . . . . . . . . . . . . . 18,645,020,475 5,493,292,639 (170,468,451) 5,322,824,188MSCI USA Size Factor . . . . . . . . . . . . . . . . . . . . . . . . . . . . . . . . . . . . . . . . . . . . . . . . . . . . . . . . . . . . . . 646,456,725 69,724,697 (21,358,027) 48,366,670MSCI USA Value Factor. . . . . . . . . . . . . . . . . . . . . . . . . . . . . . . . . . . . . . . . . . . . . . . . . . . . . . . . . . . . . 13,812,912,784 2,359,858,366 (217,866,037) 2,141,992,329
9. PRINCIPAL RISKS
In the normal course of business, each Fund invests in securities or other instruments and may enter into certain transactions, and such activities subject the Fund to variousrisks, including, among others, fluctuations in the market (market risk) or failure of an issuer to meet all of its obligations. The value of securities or other instruments mayalso be affected by various factors, including, without limitation: (i) the general economy; (ii) the overall market as well as local, regional or global political and/or socialinstability; (iii) regulation, taxation or international tax treaties between various countries; or (iv) currency, interest rate or price fluctuations. Local, regional or global eventssuch as war, acts of terrorism, the spread of infectious illness or other public health issues, recessions, or other events could have a significant impact on the Funds andtheir investments. Each Fund’s prospectus provides details of the risks to which the Fund is subject.
BFA uses a “passive” or index approach to try to achieve each Fund’s investment objective following the securities included in its underlying index during upturns as wellas downturns. BFA does not take steps to reduce market exposure or to lessen the effects of a declining market. Divergence from the underlying index and the compositionof the portfolio is monitored by BFA.
The Funds may be exposed to additional risks when reinvesting cash collateral in money market funds that do not seek to maintain a stable NAV per share of $1.00, whichmay be subject to redemption gates or liquidity fees under certain circumstances.
Notes to Financial Statements (continued)
92 2 0 2 1 I S H A R E S A N N U A L R E P O R T T O S H A R E H O L D E R S

Market Risk: An outbreak of respiratory disease caused by a novel coronavirus has developed into a global pandemic and has resulted in closing borders, quarantines,disruptions to supply chains and customer activity, as well as general concern and uncertainty. The impact of this pandemic, and other global health crises that may arisein the future, could affect the economies of many nations, individual companies and the market in general in ways that cannot necessarily be foreseen at the present time.This pandemic may result in substantial market volatility and may adversely impact the prices and liquidity of a fund's investments. The duration of this pandemic and itseffects cannot be determined with certainty.
Valuation Risk: The market values of equities, such as common stocks and preferred securities or equity related investments, such as futures and options, may declinedue to general market conditions which are not specifically related to a particular company. They may also decline due to factors which affect a particular industry orindustries. A fund may invest in illiquid investments. An illiquid investment is any investment that a fund reasonably expects cannot be sold or disposed of in current marketconditions in seven calendar days or less without the sale or disposition significantly changing the market value of the investment. A fund may experience difficulty in sellingilliquid investments in a timely manner at the price that it believes the investments are worth. Prices may fluctuate widely over short or extended periods in response tocompany, market or economic news. Markets also tend to move in cycles, with periods of rising and falling prices. This volatility may cause a fund’s NAV to experiencesignificant increases or decreases over short periods of time. If there is a general decline in the securities and other markets, the NAV of a fund may lose value, regardlessof the individual results of the securities and other instruments in which a fund invests.
Counterparty Credit Risk: The Funds may be exposed to counterparty credit risk, or the risk that an entity may fail to or be unable to perform on its commitments relatedto unsettled or open transactions, including making timely interest and/or principal payments or otherwise honoring its obligations. The Funds manage counterparty creditrisk by entering into transactions only with counterparties that the Manager believes have the financial resources to honor their obligations and by monitoring the financialstability of those counterparties. Financial assets, which potentially expose the Funds to market, issuer and counterparty credit risks, consist principally of financialinstruments and receivables due from counterparties. The extent of the Funds' exposure to market, issuer and counterparty credit risks with respect to these financial assetsis approximately their value recorded in the statements of assets and liabilities, less any collateral held by the Funds.
A derivative contract may suffer a mark-to-market loss if the value of the contract decreases due to an unfavorable change in the market rates or values of the underlyinginstrument. Losses can also occur if the counterparty does not perform under the contract.
With exchange-traded futures, there is less counterparty credit risk to the Funds since the exchange or clearinghouse, as counterparty to such instruments, guaranteesagainst a possible default. The clearinghouse stands between the buyer and the seller of the contract; therefore, credit risk is limited to failure of the clearinghouse. Whileoffset rights may exist under applicable law, a Fund does not have a contractual right of offset against a clearing broker or clearinghouse in the event of a default (includingthe bankruptcy or insolvency). Additionally, credit risk exists in exchange-traded futures with respect to initial and variation margin that is held in a clearing broker’s customeraccounts. While clearing brokers are required to segregate customer margin from their own assets, in the event that a clearing broker becomes insolvent or goes intobankruptcy and at that time there is a shortfall in the aggregate amount of margin held by the clearing broker for all its clients, typically the shortfall would be allocated ona pro rata basis across all the clearing broker’s customers, potentially resulting in losses to the Funds.
Concentration Risk: A diversified portfolio, where this is appropriate and consistent with a fund’s objectives, minimizes the risk that a price change of a particularinvestment will have a material impact on the NAV of a fund. The investment concentrations within each Fund’s portfolio are disclosed in its schedule of investments.
Certain Funds invest a significant portion of their assets in issuers located in a single country or a limited number of countries. When a Fund concentrates its investmentsin this manner, it assumes the risk that economic, regulatory, political and social conditions in that country or those countries may have a significant impact on the fund andcould affect the income from, or the value or liquidity of, the fund’s portfolio. Foreign issuers may not be subject to the same uniform accounting, auditing and financialreporting standards and practices as used in the United States. Foreign securities markets may also be more volatile and less liquid than U.S. securities and may be lesssubject to governmental supervision not typically associated with investing in U.S. securities. Investment percentages in specific countries are presented in the scheduleof investments.
Certain Funds invest a significant portion of their assets in securities of issuers located in Europe or with significant exposure to European issuers or countries. TheEuropean financial markets have recently experienced volatility and adverse trends due to concerns about economic downturns in, or rising government debt levels of,several European countries. These events may spread to other countries in Europe and may affect the value and liquidity of certain of the Funds' investments.
Responses to the financial problems by European governments, central banks and others, including austerity measures and reforms, may not work, may result in socialunrest and may limit future growth and economic recovery or have other unintended consequences. Further defaults or restructurings by governments and others of theirdebt could have additional adverse effects on economies, financial markets and asset valuations around the world. In addition, the United Kingdom has withdrawn from theEuropean Union, and one or more other countries may withdraw from the European Union and/or abandon the Euro, the common currency of the European Union. Theimpact of these actions, especially if they occur in a disorderly fashion, is not clear but could be significant and far reaching.
Certain Funds invest a significant portion of their assets in securities of issuers located in Asia or with significant exposure to Asian issuers or countries. The Asian financialmarkets have recently experienced volatility and adverse trends due to concerns in several Asian countries regarding monetary policy, government intervention in themarkets, rising government debt levels or economic downturns. These events may spread to other countries in Asia and may affect the value and liquidity of certain of theFunds' investments.
Certain Funds invest a significant portion of their assets in securities within a single or limited number of market sectors. When a Fund concentrates its investments in thismanner, it assumes the risk that economic, regulatory, political and social conditions affecting such sectors may have a significant impact on the fund and could affect theincome from, or the value or liquidity of, the fund’s portfolio. Investment percentages in specific sectors are presented in the schedule of investments.
Notes to Financial Statements (continued)
N O T E S T O F I N A N C I A L S T A T E M E N T S 93

LIBOR Transition Risk: The United Kingdom’s Financial Conduct Authority announced a phase out of the London Interbank Offered Rate (“LIBOR”). Although many LIBORrates will be phased out by the end of 2021, a selection of widely used USD LIBOR rates will continue to be published through June 2023 in order to assist with the transition.The Funds may be exposed to financial instruments tied to LIBOR to determine payment obligations, financing terms, hedging strategies or investment value. The transitionprocess away from LIBOR might lead to increased volatility and illiquidity in markets for, and reduce the effectiveness of new hedges placed against, instruments whoseterms currently include LIBOR. The ultimate effect of the LIBOR transition process on the Funds is uncertain.
10. CAPITAL SHARE TRANSACTIONS
Capital shares are issued and redeemed by each Fund only in aggregations of a specified number of shares or multiples thereof (“Creation Units”) at NAV. Except whenaggregated in Creation Units, shares of each Fund are not redeemable.
Transactions in capital shares were as follows:
Year Ended07/31/21
Year Ended07/31/20
iShares ETF Shares Amount Shares Amount
MSCI Intl Momentum FactorShares sold. . . . . . . . . . . . . . . . . . . . . . . . . . . . . . . . . . . . . . . . . . . . . . . . . . . . . . . . . . . . . . . . . . . . . . . . . . . . . . . . . . 12,000,000 $ 424,231,139 7,100,000 $ 213,536,695Shares redeemed. . . . . . . . . . . . . . . . . . . . . . . . . . . . . . . . . . . . . . . . . . . . . . . . . . . . . . . . . . . . . . . . . . . . . . . . . . . . (3,000,000) (107,558,457) (400,000) (11,435,350)
Net increase . . . . . . . . . . . . . . . . . . . . . . . . . . . . . . . . . . . . . . . . . . . . . . . . . . . . . . . . . . . . . . . . . . . . . . . . . . . . . . 9,000,000 $ 316,672,682 6,700,000 $ 202,101,345
MSCI Intl Quality FactorShares sold. . . . . . . . . . . . . . . . . . . . . . . . . . . . . . . . . . . . . . . . . . . . . . . . . . . . . . . . . . . . . . . . . . . . . . . . . . . . . . . . . . 45,200,000 $ 1,593,430,344 29,800,000 $ 873,250,471Shares redeemed. . . . . . . . . . . . . . . . . . . . . . . . . . . . . . . . . . . . . . . . . . . . . . . . . . . . . . . . . . . . . . . . . . . . . . . . . . . . (4,500,000) (154,173,132) (2,800,000) (85,091,978)
Net increase . . . . . . . . . . . . . . . . . . . . . . . . . . . . . . . . . . . . . . . . . . . . . . . . . . . . . . . . . . . . . . . . . . . . . . . . . . . . . . 40,700,000 $ 1,439,257,212 27,000,000 $ 788,158,493
MSCI Intl Size FactorShares sold. . . . . . . . . . . . . . . . . . . . . . . . . . . . . . . . . . . . . . . . . . . . . . . . . . . . . . . . . . . . . . . . . . . . . . . . . . . . . . . . . . 400,000 $ 11,680,140 800,000 $ 19,787,095Shares redeemed. . . . . . . . . . . . . . . . . . . . . . . . . . . . . . . . . . . . . . . . . . . . . . . . . . . . . . . . . . . . . . . . . . . . . . . . . . . . (400,000) (12,878,540) (200,000) (5,596,979)
Net increase (decrease) . . . . . . . . . . . . . . . . . . . . . . . . . . . . . . . . . . . . . . . . . . . . . . . . . . . . . . . . . . . . . . . . . . . — $ (1,198,400) 600,000 $ 14,190,116
MSCI Intl Value FactorShares sold. . . . . . . . . . . . . . . . . . . . . . . . . . . . . . . . . . . . . . . . . . . . . . . . . . . . . . . . . . . . . . . . . . . . . . . . . . . . . . . . . . 30,800,000 $ 795,071,169 12,200,000 $ 248,181,481Shares redeemed. . . . . . . . . . . . . . . . . . . . . . . . . . . . . . . . . . . . . . . . . . . . . . . . . . . . . . . . . . . . . . . . . . . . . . . . . . . . (10,700,000) (267,845,067) (2,400,000) (52,045,062)
Net increase . . . . . . . . . . . . . . . . . . . . . . . . . . . . . . . . . . . . . . . . . . . . . . . . . . . . . . . . . . . . . . . . . . . . . . . . . . . . . . 20,100,000 $ 527,226,102 9,800,000 $ 196,136,419
MSCI USA Momentum FactorShares sold. . . . . . . . . . . . . . . . . . . . . . . . . . . . . . . . . . . . . . . . . . . . . . . . . . . . . . . . . . . . . . . . . . . . . . . . . . . . . . . . . . 58,900,000 $ 9,601,225,530 45,600,000 $ 5,607,981,469Shares redeemed. . . . . . . . . . . . . . . . . . . . . . . . . . . . . . . . . . . . . . . . . . . . . . . . . . . . . . . . . . . . . . . . . . . . . . . . . . . . (52,100,000) (8,617,740,677) (53,850,000) (6,412,793,514)
Net increase (decrease) . . . . . . . . . . . . . . . . . . . . . . . . . . . . . . . . . . . . . . . . . . . . . . . . . . . . . . . . . . . . . . . . . . . 6,800,000 $ 983,484,853 (8,250,000) $ (804,812,045)
MSCI USA Quality FactorShares sold. . . . . . . . . . . . . . . . . . . . . . . . . . . . . . . . . . . . . . . . . . . . . . . . . . . . . . . . . . . . . . . . . . . . . . . . . . . . . . . . . . 71,150,000 $ 8,555,373,188 118,550,000 $ 11,073,719,211Shares redeemed. . . . . . . . . . . . . . . . . . . . . . . . . . . . . . . . . . . . . . . . . . . . . . . . . . . . . . . . . . . . . . . . . . . . . . . . . . . . (84,000,000) (9,843,949,012) (48,850,000) (4,611,334,189)
Net increase (decrease) . . . . . . . . . . . . . . . . . . . . . . . . . . . . . . . . . . . . . . . . . . . . . . . . . . . . . . . . . . . . . . . . . . . (12,850,000) $ (1,288,575,824) 69,700,000 $ 6,462,385,022
MSCI USA Size FactorShares sold. . . . . . . . . . . . . . . . . . . . . . . . . . . . . . . . . . . . . . . . . . . . . . . . . . . . . . . . . . . . . . . . . . . . . . . . . . . . . . . . . . 9,200,000 $ 1,011,073,003 17,750,000 $ 1,630,851,951Shares redeemed. . . . . . . . . . . . . . . . . . . . . . . . . . . . . . . . . . . . . . . . . . . . . . . . . . . . . . . . . . . . . . . . . . . . . . . . . . . . (12,100,000) (1,379,112,933) (13,800,000) (1,177,277,411)
Net increase (decrease) . . . . . . . . . . . . . . . . . . . . . . . . . . . . . . . . . . . . . . . . . . . . . . . . . . . . . . . . . . . . . . . . . . . (2,900,000) $ (368,039,930) 3,950,000 $ 453,574,540
MSCI USA Value FactorShares sold. . . . . . . . . . . . . . . . . . . . . . . . . . . . . . . . . . . . . . . . . . . . . . . . . . . . . . . . . . . . . . . . . . . . . . . . . . . . . . . . . . 103,100,000 $ 9,614,519,631 50,600,000 $ 3,779,102,131Shares redeemed. . . . . . . . . . . . . . . . . . . . . . . . . . . . . . . . . . . . . . . . . . . . . . . . . . . . . . . . . . . . . . . . . . . . . . . . . . . . (27,100,000) (2,683,961,019) (15,950,000) (1,179,784,052)
Net increase . . . . . . . . . . . . . . . . . . . . . . . . . . . . . . . . . . . . . . . . . . . . . . . . . . . . . . . . . . . . . . . . . . . . . . . . . . . . . . 76,000,000 $ 6,930,558,612 34,650,000 $ 2,599,318,079
The consideration for the purchase of Creation Units of a fund in the Trust generally consists of the in-kind deposit of a designated portfolio of securities and a specifiedamount of cash. Certain funds in the Trust may be offered in Creation Units solely or partially for cash in U.S. dollars. Investors purchasing and redeeming Creation Unitsmay pay a purchase transaction fee and a redemption transaction fee directly to State Street Bank and Trust Company, the Trust's administrator, to offset transfer and othertransaction costs associated with the issuance and redemption of Creation Units, including Creation Units for cash. Investors transacting in Creation Units for cash may alsopay an additional variable charge to compensate the relevant fund for certain transaction costs (i.e., stamp taxes, taxes on currency or other financial transactions, andbrokerage costs) and market impact expenses relating to investing in portfolio securities. Such variable charges, if any, are included in shares sold in the table above.
From time to time, settlement of securities related to in-kind contributions or in-kind redemptions may be delayed. In such cases, securities related to in-kind transactionsare reflected as a receivable or a payable in the statements of assets and liabilities.
Notes to Financial Statements (continued)
94 2 0 2 1 I S H A R E S A N N U A L R E P O R T T O S H A R E H O L D E R S

11. SUBSEQUENT EVENTS
Management has evaluated the impact of all subsequent events on the Funds through the date the financial statements were available to be issued and has determinedthat there were no subsequent events requiring adjustment or additional disclosure in the financial statements.
Notes to Financial Statements (continued)
N O T E S T O F I N A N C I A L S T A T E M E N T S 95

To the Board of Trustees of iShares Trust and Shareholders of iShares MSCI Intl Momentum Factor ETF,iShares MSCI Intl Quality Factor ETF, iShares MSCI Intl Size Factor ETF, iShares MSCI Intl Value Factor ETF,iShares MSCI USA Momentum Factor ETF, iShares MSCI USA Quality Factor ETF, iShares MSCI USA Size Factor ETF and iShares MSCI USA Value Factor ETF
Opinions on the Financial Statements
We have audited the accompanying statements of assets and liabilities, including the schedules of investments, of iShares MSCI Intl Momentum Factor ETF, iShares MSCIIntl Quality Factor ETF, iShares MSCI Intl Size Factor ETF, iShares MSCI Intl Value Factor ETF, iShares MSCI USA Momentum Factor ETF, iShares MSCI USA QualityFactor ETF, iShares MSCI USA Size Factor ETF and iShares MSCI USA Value Factor ETF (eight of the funds constituting iShares Trust, hereafter collectively referred toas the "Funds") as of July 31, 2021, the related statements of operations for the year ended July 31, 2021, the statements of changes in net assets for each of the two yearsin the period ended July 31, 2021, including the related notes, and the financial highlights for each of the five years in the period ended July 31, 2021 (collectively referredto as the “financial statements”). In our opinion, the financial statements present fairly, in all material respects, the financial position of each of the Funds as of July 31, 2021,the results of each of their operations for the year then ended, the changes in each of their net assets for each of the two years in the period ended July 31, 2021 and eachof the financial highlights for each of the five years in the period ended July 31, 2021 in conformity with accounting principles generally accepted in the United States ofAmerica.
Basis for Opinions
These financial statements are the responsibility of the Funds' management. Our responsibility is to express an opinion on the Funds' financial statements based on ouraudits. We are a public accounting firm registered with the Public Company Accounting Oversight Board (United States) (PCAOB) and are required to be independent withrespect to the Funds in accordance with the U.S. federal securities laws and the applicable rules and regulations of the Securities and Exchange Commission and thePCAOB.
We conducted our audits of these financial statements in accordance with the standards of the PCAOB. Those standards require that we plan and perform the audit to obtainreasonable assurance about whether the financial statements are free of material misstatement, whether due to error or fraud.
Our audits included performing procedures to assess the risks of material misstatement of the financial statements, whether due to error or fraud, and performingprocedures that respond to those risks. Such procedures included examining, on a test basis, evidence regarding the amounts and disclosures in the financial statements.Our audits also included evaluating the accounting principles used and significant estimates made by management, as well as evaluating the overall presentation of thefinancial statements. Our procedures included confirmation of securities owned as of July 31, 2021 by correspondence with the custodian, transfer agent and brokers; whenreplies were not received from brokers, we performed other auditing procedures. We believe that our audits provide a reasonable basis for our opinions.
/s/PricewaterhouseCoopers LLPPhiladelphia, PennsylvaniaSeptember 21, 2021
We have served as the auditor of one or more BlackRock investment companies since 2000.
Report of Independent Registered Public Accounting Firm
96 2 0 2 1 I S H A R E S A N N U A L R E P O R T T O S H A R E H O L D E R S
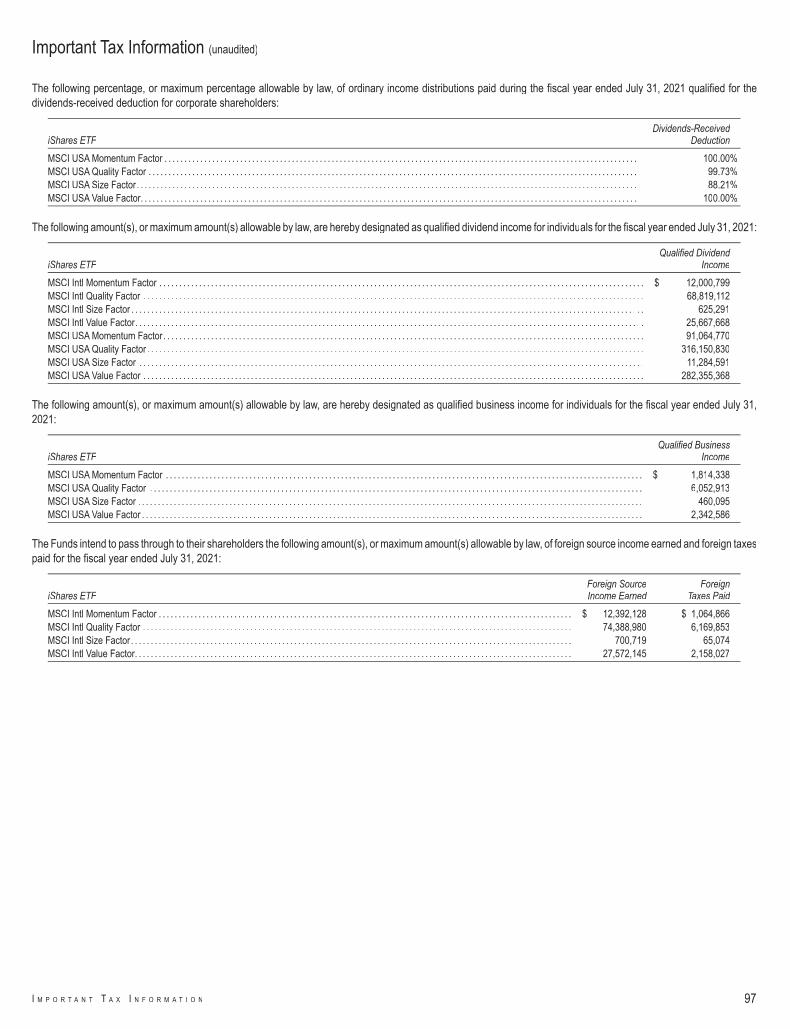
The following percentage, or maximum percentage allowable by law, of ordinary income distributions paid during the fiscal year ended July 31, 2021 qualified for thedividends-received deduction for corporate shareholders:
iShares ETFDividends-Received
Deduction
MSCI USA Momentum Factor . . . . . . . . . . . . . . . . . . . . . . . . . . . . . . . . . . . . . . . . . . . . . . . . . . . . . . . . . . . . . . . . . . . . . . . . . . . . . . . . . . . . . . . . . . . . . . . . . . . . . . . . . . . . . . . . . . . . . . . 100.00%MSCI USA Quality Factor . . . . . . . . . . . . . . . . . . . . . . . . . . . . . . . . . . . . . . . . . . . . . . . . . . . . . . . . . . . . . . . . . . . . . . . . . . . . . . . . . . . . . . . . . . . . . . . . . . . . . . . . . . . . . . . . . . . . . . . . . . . 99.73%MSCI USA Size Factor. . . . . . . . . . . . . . . . . . . . . . . . . . . . . . . . . . . . . . . . . . . . . . . . . . . . . . . . . . . . . . . . . . . . . . . . . . . . . . . . . . . . . . . . . . . . . . . . . . . . . . . . . . . . . . . . . . . . . . . . . . . . . . 88.21%MSCI USA Value Factor. . . . . . . . . . . . . . . . . . . . . . . . . . . . . . . . . . . . . . . . . . . . . . . . . . . . . . . . . . . . . . . . . . . . . . . . . . . . . . . . . . . . . . . . . . . . . . . . . . . . . . . . . . . . . . . . . . . . . . . . . . . . . 100.00%
The following amount(s), or maximum amount(s) allowable by law, are hereby designated as qualified dividend income for individuals for the fiscal year ended July 31, 2021:
iShares ETFQualified Dividend
Income
MSCI Intl Momentum Factor . . . . . . . . . . . . . . . . . . . . . . . . . . . . . . . . . . . . . . . . . . . . . . . . . . . . . . . . . . . . . . . . . . . . . . . . . . . . . . . . . . . . . . . . . . . . . . . . . . . . . . . . . . . . . . . . . . . . . . . . . . $ 12,000,799MSCI Intl Quality Factor . . . . . . . . . . . . . . . . . . . . . . . . . . . . . . . . . . . . . . . . . . . . . . . . . . . . . . . . . . . . . . . . . . . . . . . . . . . . . . . . . . . . . . . . . . . . . . . . . . . . . . . . . . . . . . . . . . . . . . . . . . . . . . 68,819,112MSCI Intl Size Factor . . . . . . . . . . . . . . . . . . . . . . . . . . . . . . . . . . . . . . . . . . . . . . . . . . . . . . . . . . . . . . . . . . . . . . . . . . . . . . . . . . . . . . . . . . . . . . . . . . . . . . . . . . . . . . . . . . . . . . . . . . . . . . . . . 625,291MSCI Intl Value Factor. . . . . . . . . . . . . . . . . . . . . . . . . . . . . . . . . . . . . . . . . . . . . . . . . . . . . . . . . . . . . . . . . . . . . . . . . . . . . . . . . . . . . . . . . . . . . . . . . . . . . . . . . . . . . . . . . . . . . . . . . . . . . . . . 25,667,668MSCI USA Momentum Factor. . . . . . . . . . . . . . . . . . . . . . . . . . . . . . . . . . . . . . . . . . . . . . . . . . . . . . . . . . . . . . . . . . . . . . . . . . . . . . . . . . . . . . . . . . . . . . . . . . . . . . . . . . . . . . . . . . . . . . . . . 91,064,770MSCI USA Quality Factor . . . . . . . . . . . . . . . . . . . . . . . . . . . . . . . . . . . . . . . . . . . . . . . . . . . . . . . . . . . . . . . . . . . . . . . . . . . . . . . . . . . . . . . . . . . . . . . . . . . . . . . . . . . . . . . . . . . . . . . . . . . . . 316,150,830MSCI USA Size Factor . . . . . . . . . . . . . . . . . . . . . . . . . . . . . . . . . . . . . . . . . . . . . . . . . . . . . . . . . . . . . . . . . . . . . . . . . . . . . . . . . . . . . . . . . . . . . . . . . . . . . . . . . . . . . . . . . . . . . . . . . . . . . . . 11,284,591MSCI USA Value Factor . . . . . . . . . . . . . . . . . . . . . . . . . . . . . . . . . . . . . . . . . . . . . . . . . . . . . . . . . . . . . . . . . . . . . . . . . . . . . . . . . . . . . . . . . . . . . . . . . . . . . . . . . . . . . . . . . . . . . . . . . . . . . . 282,355,368
The following amount(s), or maximum amount(s) allowable by law, are hereby designated as qualified business income for individuals for the fiscal year ended July 31,2021:
iShares ETFQualified Business
Income
MSCI USA Momentum Factor . . . . . . . . . . . . . . . . . . . . . . . . . . . . . . . . . . . . . . . . . . . . . . . . . . . . . . . . . . . . . . . . . . . . . . . . . . . . . . . . . . . . . . . . . . . . . . . . . . . . . . . . . . . . . . . . . . . . . . . . $ 1,814,338MSCI USA Quality Factor . . . . . . . . . . . . . . . . . . . . . . . . . . . . . . . . . . . . . . . . . . . . . . . . . . . . . . . . . . . . . . . . . . . . . . . . . . . . . . . . . . . . . . . . . . . . . . . . . . . . . . . . . . . . . . . . . . . . . . . . . . . . 6,052,913MSCI USA Size Factor . . . . . . . . . . . . . . . . . . . . . . . . . . . . . . . . . . . . . . . . . . . . . . . . . . . . . . . . . . . . . . . . . . . . . . . . . . . . . . . . . . . . . . . . . . . . . . . . . . . . . . . . . . . . . . . . . . . . . . . . . . . . . . . 460,095MSCI USA Value Factor . . . . . . . . . . . . . . . . . . . . . . . . . . . . . . . . . . . . . . . . . . . . . . . . . . . . . . . . . . . . . . . . . . . . . . . . . . . . . . . . . . . . . . . . . . . . . . . . . . . . . . . . . . . . . . . . . . . . . . . . . . . . . . 2,342,586
The Funds intend to pass through to their shareholders the following amount(s), or maximum amount(s) allowable by law, of foreign source income earned and foreign taxespaid for the fiscal year ended July 31, 2021:
iShares ETFForeign SourceIncome Earned
ForeignTaxes Paid
MSCI Intl Momentum Factor . . . . . . . . . . . . . . . . . . . . . . . . . . . . . . . . . . . . . . . . . . . . . . . . . . . . . . . . . . . . . . . . . . . . . . . . . . . . . . . . . . . . . . . . . . . . . . . . . . . . . . . . $ 12,392,128 $ 1,064,866MSCI Intl Quality Factor . . . . . . . . . . . . . . . . . . . . . . . . . . . . . . . . . . . . . . . . . . . . . . . . . . . . . . . . . . . . . . . . . . . . . . . . . . . . . . . . . . . . . . . . . . . . . . . . . . . . . . . . . . . . 74,388,980 6,169,853MSCI Intl Size Factor. . . . . . . . . . . . . . . . . . . . . . . . . . . . . . . . . . . . . . . . . . . . . . . . . . . . . . . . . . . . . . . . . . . . . . . . . . . . . . . . . . . . . . . . . . . . . . . . . . . . . . . . . . . . . . . 700,719 65,074MSCI Intl Value Factor. . . . . . . . . . . . . . . . . . . . . . . . . . . . . . . . . . . . . . . . . . . . . . . . . . . . . . . . . . . . . . . . . . . . . . . . . . . . . . . . . . . . . . . . . . . . . . . . . . . . . . . . . . . . . . 27,572,145 2,158,027
Important Tax Information (unaudited)
I M P O R T A N T T A X I N F O R M A T I O N 97

iShares MSCI Intl Momentum Factor ETF, iShares MSCI Intl Quality Factor ETF, iShares MSCI Intl Size Factor ETF, iShares MSCI Intl Value Factor ETF, iSharesMSCI USA Momentum Factor ETF, iShares MSCI USA Quality Factor ETF, iShares MSCI USA Size Factor ETF, iShares MSCI USA Value Factor ETF (each the“Fund”)
Under Section 15(c) of the Investment Company Act of 1940 (the “1940 Act”), the Trust's Board of Trustees (the “Board”), including a majority of Board Members who arenot “interested persons” of the Trust (as that term is defined in the 1940 Act) (the “Independent Board Members), is required annually to consider and approve the InvestmentAdvisory Agreement between the Trust and BFA (the “Advisory Agreement”) whereby the Board and its committees (composed solely of Independent Board Members)assess BlackRock’s services to the Fund, including investment management; fund accounting; administrative and shareholder services; oversight of the Fund’s serviceproviders; risk management and oversight; legal and compliance services; and ability to meet applicable legal and regulatory requirements. The Independent BoardMembers requested, and BFA provided, such information as the Independent Board Members, with advice from independent counsel, deemed reasonably necessary toevaluate the Advisory Agreement. At meetings on May 7, 2021 and May 14, 2021, a committee composed of all of the Independent Board Members (the “15(c) Committee”),with independent counsel, met with management and reviewed and discussed information provided in response to initial requests of the 15(c) Committee and/or itsindependent counsel, and requested certain additional information, which management agreed to provide. At a meeting held on June 15-16, 2021, the Board, including theIndependent Board Members, reviewed the additional information provided by management in response to these requests.
After extensive discussions and deliberations, the Board, including all of the Independent Board Members, approved the continuance of the Advisory Agreement for theFund, based on a review of qualitative and quantitative information provided by BFA and their cumulative experience as Board Members. The Board noted its satisfactionwith the extent and quality of information provided and its frequent interactions with management, as well as the detailed responses and other information provided by BFA.The Independent Board Members were advised by their independent counsel throughout the process, including about the legal standards applicable to their review. Inapproving the continuance of the Advisory Agreement for the Fund, the Board, including the Independent Board Members, considered various factors, including: (i) theexpenses and performance of the Fund; (ii) the nature, extent and quality of the services provided by BFA; (iii) the costs of services provided to the Fund and profits realizedby BFA and its affiliates; (iv) potential economies of scale and the sharing of related benefits; (v) the fees and services provided for other comparable funds/accountsmanaged by BFA and its affiliates; and (vi) other benefits to BFA and/or its affiliates. The material factors, none of which was controlling, and conclusions that formed thebasis for the Board, including the Independent Board Members, to approve the continuance of the Advisory Agreement are discussed below.
Expenses and Performance of the Fund: The Board reviewed statistical information prepared by Broadridge Financial Solutions Inc. (“Broadridge”), an independentprovider of investment company data, regarding the expense ratio components, including gross and net total expenses, fees and expenses of another fund in which theFund invests (if applicable), and waivers/reimbursements (if applicable) of the Fund in comparison with the same information for other ETFs (including, where applicable,funds sponsored by an “at cost” service provider), objectively selected by Broadridge as comprising the Fund’s applicable peer group pursuant to Broadridge’s proprietaryETF methodology (the “Peer Group”). The Board was provided with a detailed description of the proprietary ETF methodology used by Broadridge to determine the Fund’sPeer Group. The Board noted that, due to the limitations in providing comparable funds in the Peer Group, the statistical information provided in Broadridge’s report mayor may not provide meaningful direct comparisons to the Fund in all instances. The Board also noted that overall fund expenses (net of waivers and reimbursements) forthe Fund were lower than the median of the overall fund expenses (net of waivers and reimbursements ) of the funds in its Peer Group, excluding iShares funds.
In addition, to the extent that any of the comparison funds included in the Peer Group, excluding iShares funds, track the same index as the Fund, Broadridge also provided,and the Board reviewed, a comparison of the Fund’s performance for the one-year, three-year, five-year, ten-year, and since inception periods, as applicable, and for thequarter ended December 31, 2020, to that of relevant comparison fund(s) for the same periods. The Board noted that the Fund seeks to track its specified underlying indexand that, during the year, the Board received periodic reports on the Fund’s short- and longer-term performance in comparison with its underlying index. Such periodiccomparative performance information, including additional detailed information as requested by the Board, was also considered. The Board noted that the Fund generallyperformed in line with its underlying index over the relevant periods.
Based on this review, the other factors considered at the meeting, and their general knowledge of ETF pricing, the Board concluded that the investment advisory fee rateand expense level and the historical performance of the Fund supported the Board’s approval of the continuance of the Advisory Agreement for the coming year.
Nature, Extent and Quality of Services Provided: Based on management’s representations, including information about recent and proposed enhancements to theiShares business, including with respect to capital markets support and analysis, technology, portfolio management, product design and quality, compliance and riskmanagement, global public policy and other services, the Board expected that there would be no diminution in the scope of services required of or provided by BFA underthe Advisory Agreement for the coming year as compared with the scope of services provided by BFA during prior years. In reviewing the scope of these services, the Boardconsidered BFA’s investment philosophy and experience, noting that BFA and its affiliates have committed significant resources over time, including during the past year,to support the iShares funds and their shareholders and have made significant investments into the iShares business. The Board also considered BFA’s complianceprogram and its compliance record with respect to the Fund. In that regard, the Board noted that BFA reports to the Board about portfolio management and compliancematters on a periodic basis in connection with regularly scheduled meetings of the Board, and on other occasions as necessary and appropriate, and has providedinformation and made relevant officers and other employees of BFA (and its affiliates) available as needed to provide further assistance with these matters. The Board alsoreviewed the background and experience of the persons responsible for the day-to-day management of the Fund, as well as the resources available to them in managingthe Fund. In addition to the above considerations, the Board reviewed and considered detailed presentations regarding BFA’s investment performance, investment and riskmanagement processes and strategies, which were provided at the May 7, 2021 meeting and throughout the year.
Based on review of this information, and the performance information discussed above, the Board concluded that the nature, extent and quality of services provided to theFund under the Advisory Agreement supported the Board’s approval of the continuance of the Advisory Agreement for the coming year.
Costs of Services Provided to the Fund and Profits Realized by BFA and its Affiliates: The Board reviewed information about the estimated profitability to BlackRockin managing the Fund, based on the fees payable to BFA and its affiliates (including fees under the Advisory Agreement), and other sources of revenue and expense to BFA
Board Review and Approval of Investment Advisory Contract
98 2 0 2 1 I S H A R E S A N N U A L R E P O R T T O S H A R E H O L D E R S

and its affiliates from the Fund’s operations for the last calendar year. The Board reviewed BlackRock’s methodology for calculating estimated profitability of the iSharesfunds, noting that the 15(c) Committee and the Board had focused on the methodology and profitability presentation. The Board recognized that profitability may be affectedby numerous factors, including, among other things, fee waivers by BFA, the types of funds managed, expense allocations and business mix. The Board thus recognizedthat calculating and comparing profitability at individual fund levels is challenging. The Board discussed with management the sources of direct and ancillary revenue,including the revenues to BTC, a BlackRock affiliate, from securities lending by the Fund. The Board also discussed BFA’s estimated profit margin as reflected in the Fund’sprofitability analysis and reviewed information regarding potential economies of scale (as discussed below).
Based on this review, the Board concluded that the profits realized by BFA and its affiliates under the Advisory Agreement and from other relationships between the Fundand BFA and/or its affiliates, if any, were within a reasonable range in light of the factors and other information considered.
Economies of Scale: The Board reviewed information and considered the extent to which economies of scale might be realized as the assets of the Fund increase, notingthat the issue of potential economies of scale had been focused on by the 15(c) Committee and the Board during their meetings and addressed by management. The 15(c)Committee and the Board received information regarding BlackRock’s historical estimated profitability, including BFA’s and its affiliates’ estimated costs in providingservices. The estimated cost information distinguished, among other things, between fixed and variable costs, and showed how the level and nature of fixed and variablecosts may impact the existence or size of scale benefits, with the Board recognizing that potential economies of scale are difficult to measure. The 15(c) Committee andthe Board reviewed information provided by BFA regarding the sharing of scale benefits with the iShares funds through various means, including, as applicable, throughrelatively low fee rates established at inception, breakpoints, waivers, or other fee reductions, as well as through additional investment in the iShares business and theprovision of improved or additional infrastructure and services to the iShares funds and their shareholders. The Board noted that the Advisory Agreement for the Fund didnot provide for breakpoints in the Fund’s investment advisory fee rate as the assets of the Fund increase. However, the Board noted that it would continue to assess theappropriateness of adding breakpoints in the future.
The Board concluded that this review of potential economies of scale and the sharing of related benefits, as well as the other factors considered at the meeting, supportedthe Board’s approval of the continuance of the Advisory Agreement for the coming year.
Fees and Services Provided for Other Comparable Funds/Accounts Managed by BFA and its Affiliates: The Board considered information regarding the investmentadvisory/management fee rates for other funds/accounts in the U.S. for which BFA (or its affiliates) provides investment advisory/management services, including open-endfunds registered under the 1940 Act (including sub-advised funds), collective trust funds, and institutional separate accounts (collectively, the “Other Accounts”). The Boardacknowledged BFA’s representation that the iShares funds are fundamentally different investment vehicles from the Other Accounts.
The Board received detailed information regarding how the Other Accounts generally differ from the Fund, including in terms of the types of services and generally moreextensive services provided to the Fund, as well as other significant differences. In that regard, the Board considered that the pricing of services to institutional clients istypically based on a number of factors beyond the nature and extent of the specific services to be provided and often depends on the overall relationship between the clientand its affiliates and the adviser and its affiliates. In addition, the Board considered the relative complexity and inherent risks and challenges of managing and providing otherservices to the Fund, as a publicly traded investment vehicle, as compared to the Other Accounts, particularly those that are institutional clients, in light of differing regulatoryrequirements and client-imposed mandates. The Board noted that BFA and its affiliates do not manage Other Accounts with substantially the same investment objective andstrategy as the Fund and that track the same index as the Fund. The Board also acknowledged management’s assertion that, for certain iShares funds, and for clientsegmentation purposes, BlackRock has launched an iShares fund that may provide a similar investment exposure at a lower investment advisory fee rate.
The Board also considered the “all-inclusive” nature of the Fund’s advisory fee structure, and the Fund’s expenses borne by BFA under this arrangement. The Board notedthat the investment advisory fee rate under the Advisory Agreement for the Fund was generally higher than the investment advisory/management fee rates for certain ofthe Other Accounts (particularly institutional clients) and concluded that the differences appeared to be consistent with the factors discussed.
Other Benefits to BFA and/or its Affiliates: The Board reviewed other benefits or ancillary revenue received by BFA and/or its affiliates in connection with the servicesprovided to the Fund by BFA, both direct and indirect, including, but not limited to, payment of revenue to BTC, the Fund’s securities lending agent, for loaning portfoliosecurities (which was included in the profit margins reviewed by the Board pursuant to BFA’s estimated profitability methodology), payment of advisory fees or other feesto BFA (or its affiliates) in connection with any investments by the Fund in other funds for which BFA (or its affiliates) provides investment advisory services or other services,and BlackRock’s profile in the investment community. The Board also noted the revenue received by BFA and/or its affiliates pursuant to (i) an agreement that permits aservice provider to use certain portions of BlackRock’s technology platform to service accounts managed by BFA and/or its affiliates, including the iShares funds and (ii)other technology-related initiatives aimed to better support the iShares funds. The Board further noted that BFA generally does not use soft dollars or consider the value ofresearch or other services that may be provided to BFA (including its affiliates) in selecting brokers for portfolio transactions for the Fund. The Board concluded that any suchancillary benefits would not be disadvantageous to the Fund and thus would not alter the Board’s conclusion with respect to the appropriateness of approving thecontinuance of the Advisory Agreement for the coming year.
Conclusion: Based on a review of the factors described above, as well as such other factors as deemed appropriate by the Board, the Board, including all of theIndependent Board Members, determined that the Fund’s investment advisory fee rate under the Advisory Agreement does not constitute a fee that is so disproportionatelylarge as to bear no reasonable relationship to the services rendered and that could not have been the product of arm’s-length bargaining, and concluded to approve thecontinuance of the Advisory Agreement for the coming year.
Board Review and Approval of Investment Advisory Contract (continued)
B O A R D R E V I E W A N D A P P R O V A L O F I N V E S T M E N T A D V I S O R Y C O N T R A C T 99
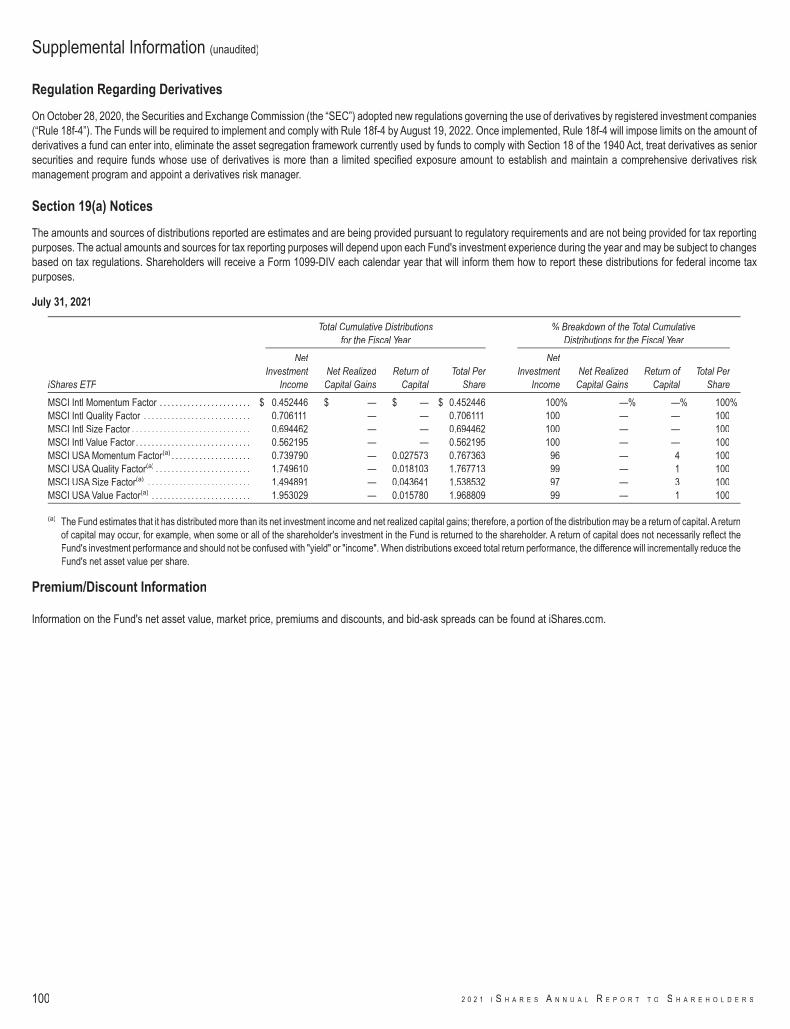
Regulation Regarding Derivatives
On October 28, 2020, the Securities and Exchange Commission (the “SEC”) adopted new regulations governing the use of derivatives by registered investment companies(“Rule 18f-4”). The Funds will be required to implement and comply with Rule 18f-4 by August 19, 2022. Once implemented, Rule 18f-4 will impose limits on the amount ofderivatives a fund can enter into, eliminate the asset segregation framework currently used by funds to comply with Section 18 of the 1940 Act, treat derivatives as seniorsecurities and require funds whose use of derivatives is more than a limited specified exposure amount to establish and maintain a comprehensive derivatives riskmanagement program and appoint a derivatives risk manager.
Section 19(a) Notices
The amounts and sources of distributions reported are estimates and are being provided pursuant to regulatory requirements and are not being provided for tax reportingpurposes. The actual amounts and sources for tax reporting purposes will depend upon each Fund's investment experience during the year and may be subject to changesbased on tax regulations. Shareholders will receive a Form 1099-DIV each calendar year that will inform them how to report these distributions for federal income taxpurposes.
July 31, 2021
Total Cumulative Distributionsfor the Fiscal Year
% Breakdown of the Total CumulativeDistributions for the Fiscal Year
iShares ETF
NetInvestment
IncomeNet Realized
Capital GainsReturn of
CapitalTotal Per
Share
NetInvestment
IncomeNet Realized
Capital GainsReturn of
CapitalTotal Per
Share
MSCI Intl Momentum Factor . . . . . . . . . . . . . . . . . . . . . . . $ 0.452446 $ — $ — $ 0.452446 100% —% —% 100%MSCI Intl Quality Factor . . . . . . . . . . . . . . . . . . . . . . . . . . . 0.706111 — — 0.706111 100 — — 100MSCI Intl Size Factor . . . . . . . . . . . . . . . . . . . . . . . . . . . . . . 0.694462 — — 0.694462 100 — — 100MSCI Intl Value Factor . . . . . . . . . . . . . . . . . . . . . . . . . . . . . 0.562195 — — 0.562195 100 — — 100MSCI USA Momentum Factor(a) . . . . . . . . . . . . . . . . . . . . 0.739790 — 0.027573 0.767363 96 — 4 100MSCI USA Quality Factor(a) . . . . . . . . . . . . . . . . . . . . . . . . 1.749610 — 0.018103 1.767713 99 — 1 100MSCI USA Size Factor(a) . . . . . . . . . . . . . . . . . . . . . . . . . . 1.494891 — 0.043641 1.538532 97 — 3 100MSCI USA Value Factor(a) . . . . . . . . . . . . . . . . . . . . . . . . . 1.953029 — 0.015780 1.968809 99 — 1 100
(a) The Fund estimates that it has distributed more than its net investment income and net realized capital gains; therefore, a portion of the distribution may be a return of capital. A returnof capital may occur, for example, when some or all of the shareholder's investment in the Fund is returned to the shareholder. A return of capital does not necessarily reflect theFund's investment performance and should not be confused with "yield" or "income". When distributions exceed total return performance, the difference will incrementally reduce theFund's net asset value per share.
Premium/Discount Information
Information on the Fund's net asset value, market price, premiums and discounts, and bid-ask spreads can be found at iShares.com.
Supplemental Information (unaudited)
100 2 0 2 1 I S H A R E S A N N U A L R E P O R T T O S H A R E H O L D E R S

The Board of Trustees has responsibility for the overall management and operations of the Funds, including general supervision of the duties performed by BFA and otherservice providers. Each Trustee serves until he or she resigns, is removed, dies, retires or becomes incapacitated. Each officer shall hold office until his or her successoris elected and qualifies or until his or her death, resignation or removal. Trustees who are not “interested persons” (as defined in the 1940 Act) of the Trust are referred toas independent trustees (“Independent Trustees”).
The registered investment companies advised by BFA or its affiliates (the “BlackRock-advised Funds”) are organized into one complex of open-end equity, multi-asset,index and money market funds and ETFs (the “BlackRock Multi-Asset Complex”), one complex of closed-end funds and open-end non-index fixed-income funds (includingETFs) (the "BlackRock Fixed-Income Complex") and one complex of ETFs (“Exchange-Traded Fund Complex”) (each, a “BlackRock Fund Complex”). Each Fund isincluded in the Exchange-Traded Fund Complex. Each Trustee also serves as a Director of iShares, Inc. and a Trustee of iShares U.S. ETF Trust and, as a result, overseesall of the funds within the Exchange-Traded Fund Complex, which consists of 381 funds as of July 31, 2021. With the exception of Robert S. Kapito, Salim Ramji and CharlesPark, the address of each Trustee and officer is c/o BlackRock, Inc., 400 Howard Street, San Francisco, CA 94105. The address of Mr. Kapito, Mr. Ramji and Mr. Park isc/o BlackRock, Inc., Park Avenue Plaza, 55 East 52nd Street, New York, NY 10055. The Board has designated Cecilia H. Herbert as its Independent Board Chair. Additionalinformation about the Funds’ Trustees and officers may be found in the Funds’ combined Statement of Additional Information, which is available without charge, uponrequest, by calling toll-free 1-800-iShares (1-800-474-2737).
Interested Trustees
Name (Age) Position(s)Principal Occupation(s)During the Past 5 Years Other Directorships Held by Trustee
Robert S.Kapito(a) (64)
Trustee (since2009).
President, BlackRock, Inc. (since 2006); Vice Chairman of BlackRock, Inc. and Headof BlackRock’s Portfolio Management Group (since its formation in 1998) andBlackRock, Inc.’s predecessor entities (since 1988); Trustee, University ofPennsylvania (since 2009); President of Board of Directors, Hope & HeroesChildren’s Cancer Fund (since 2002).
Director of BlackRock, Inc. (since 2006); Directorof iShares, Inc. (since 2009); Trustee of iSharesU.S. ETF Trust (since 2011).
Salim Ramji(b)
(51)Trustee (since2019).
Senior Managing Director, BlackRock, Inc. (since 2014); Global Head of BlackRock’sETF and Index Investments Business (since 2019); Head of BlackRock’sU.S. Wealth Advisory Business (2015-2019); Global Head of Corporate Strategy,BlackRock, Inc. (2014-2015); Senior Partner, McKinsey & Company (2010-2014).
Director of iShares, Inc. (since 2019); Trustee ofiShares U.S. ETF Trust (since 2019).
(a) Robert S. Kapito is deemed to be an “interested person” (as defined in the 1940 Act) of the Trust due to his affiliations with BlackRock, Inc. and its affiliates.(b) Salim Ramji is deemed to be an “interested person” (as defined in the 1940 Act) of the Trust due to his affiliations with BlackRock, Inc. and its affiliates.
Independent Trustees
Name (Age) Position(s)Principal Occupation(s)During the Past 5 Years Other Directorships Held by Trustee
Cecilia H.Herbert (72)
Trustee (since2005);IndependentBoard Chair(since 2016).
Chair of the Finance Committee (since 2019) and Trustee and Member of theFinance, Audit and Quality Committees of Stanford Health Care (since 2016);Trustee of WNET, New York's public media company (since 2011) and Member ofthe Audit Committee (since 2018) and Investment Committee (since 2011); Chair(1994-2005) and Member (since 1992) of the Investment Committee, Archdiocese ofSan Francisco; Trustee of Forward Funds (14 portfolios) (2009-2018); Trustee ofSalient MF Trust (4 portfolios) (2015-2018); Director (1998-2013) and President(2007-2011) of the Board of Directors, Catholic Charities CYO; Trustee (2002-2011)and Chair of the Finance and Investment Committee (2006-2010) of the ThacherSchool; Director of the Senior Center of Jackson Hole (since 2020).
Director of iShares, Inc. (since 2005); Trustee ofiShares U.S. ETF Trust (since 2011);Independent Board Chair of iShares, Inc. andiShares U.S. ETF Trust (since 2016); Trustee ofThrivent Church Loan and Income Fund (since2019).
Jane D.Carlin (65)
Trustee (since2015); RiskCommittee Chair(since 2016).
Consultant (since 2012); Member of the Audit Committee (2012-2018), Chair of theNominating and Governance Committee (2017-2018) and Director of PHHCorporation (mortgage solutions) (2012-2018); Managing Director and Global Headof Financial Holding Company Governance & Assurance and the Global Head ofOperational Risk Management of Morgan Stanley (2006-2012).
Director of iShares, Inc. (since 2015); Trustee ofiShares U.S. ETF Trust (since 2015); Member ofthe Audit Committee (since 2016), Chair of theAudit Committee (since 2020) and Director ofThe Hanover Insurance Group, Inc. (since 2016).
Richard L.Fagnani (66)
Trustee (since2017); AuditCommittee Chair(since 2019).
Partner, KPMG LLP (2002-2016). Director of iShares, Inc. (since 2017); Trustee ofiShares U.S. ETF Trust (since 2017).
Trustee and Officer Information
T R U S T E E A N D O F F I C E R I N F O R M A T I O N 101

Independent Trustees (continued)
Name (Age) Position(s)Principal Occupation(s)During the Past 5 Years Other Directorships Held by Trustee
John E.Kerrigan (66)
Trustee (since2005); Nominatingand Governanceand Equity PlusCommittee Chairs(since 2019).
Chief Investment Officer, Santa Clara University (since 2002). Director of iShares, Inc. (since 2005); Trustee ofiShares U.S. ETF Trust (since 2011).
Drew E.Lawton (62)
Trustee (since2017); 15(c)Committee Chair(since 2017).
Senior Managing Director of New York Life Insurance Company (2010-2015). Director of iShares, Inc. (since 2017); Trustee ofiShares U.S. ETF Trust (since 2017).
John E.Martinez (60)
Trustee (since2003); SecuritiesLendingCommittee Chair(since 2019).
Director of Real Estate Equity Exchange, Inc. (since 2005); Director of ClouderaFoundation (2017-2020); and Director of Reading Partners (2012-2016).
Director of iShares, Inc. (since 2003); Trustee ofiShares U.S. ETF Trust (since 2011).
Madhav V.Rajan (56)
Trustee (since2011); FixedIncome PlusCommittee Chair(since 2019).
Dean, and George Pratt Shultz Professor of Accounting, University of Chicago BoothSchool of Business (since 2017); Advisory Board Member (since 2016) and Director(since 2020) of C.M. Capital Corporation; Chair of the Board for the Center forResearch in Security Prices, LLC (since 2020); Robert K. Jaedicke Professor ofAccounting, Stanford University Graduate School of Business (2001-2017);Professor of Law (by courtesy), Stanford Law School (2005-2017); Senior AssociateDean for Academic Affairs and Head of MBA Program, Stanford University GraduateSchool of Business (2010-2016).
Director of iShares, Inc. (since 2011); Trustee ofiShares U.S. ETF Trust (since 2011).
Officers
Name (Age) Position(s)Principal Occupation(s)During the Past 5 Years
ArmandoSenra (50)
President (since2019).
Managing Director, BlackRock, Inc. (since 2007); Head of U.S., Canada and Latam iShares, BlackRock, Inc. (since 2019); Head of LatinAmerica Region, BlackRock, Inc. (2006-2019); Managing Director, Bank of America Merrill Lynch (1994-2006).
TrentWalker (47)
Treasurer andChief FinancialOfficer (since2020).
Managing Director, BlackRock, Inc. (since September 2019); Chief Financial Officer of iShares Delaware Trust Sponsor LLC, BlackRockFunds, BlackRock Funds II, BlackRock Funds IV, BlackRock Funds V and BlackRock Funds VI (since 2021); Executive Vice President ofPIMCO (2016-2019); Senior Vice President of PIMCO (2008-2015); Treasurer (2013-2019) and Assistant Treasurer (2007-2017) of PIMCOFunds, PIMCO Variable Insurance Trust, PIMCO ETF Trust, PIMCO Equity Series, PIMCO Equity Series VIT, PIMCO Managed AccountsTrust, 2 PIMCO-sponsored interval funds and 21 PIMCO-sponsored closed-end funds.
CharlesPark (53)
Chief ComplianceOfficer (since2006).
Chief Compliance Officer of BlackRock Advisors, LLC and the BlackRock-advised Funds in the BlackRock Multi-Asset Complex and theBlackRock Fixed-Income Complex (since 2014); Chief Compliance Officer of BFA (since 2006).
Deepa DamreSmith (46)
Secretary (since2019).
Managing Director, BlackRock, Inc. (since 2014); Director, BlackRock, Inc. (2009-2013).
ScottRadell (52)
Executive VicePresident (since2012).
Managing Director, BlackRock, Inc. (since 2009); Head of Portfolio Solutions, BlackRock, Inc. (since 2009).
AlanMason (60)
Executive VicePresident (since2016).
Managing Director, BlackRock, Inc. (since 2009).
MarybethLeithead (58)
Executive VicePresident (since2019).
Managing Director, BlackRock, Inc. (since 2017); Chief Operating Officer of Americas iShares (since 2017); Portfolio Manager, MunicipalInstitutional & Wealth Management (2009-2016).
Trustee and Officer Information (continued)
102 2 0 2 1 I S H A R E S A N N U A L R E P O R T T O S H A R E H O L D E R S

Electronic Delivery
Shareholders can sign up for email notifications announcing that the shareholder report or prospectus has been posted on the iShares website at iShares.com. Once youhave enrolled, you will no longer receive prospectuses and shareholder reports in the mail.
To enroll in electronic delivery:
• Go to icsdelivery.com.• If your brokerage firm is not listed, electronic delivery may not be available. Please contact your broker-dealer or financial advisor.
Householding
Householding is an option available to certain fund investors. Householding is a method of delivery, based on the preference of the individual investor, in which a single copyfof certain shareholder documents and Rule 30e-3 notices can be delivered to investors who share the same address, even if their accounts are registered under differentrnames. Please contact your broker-dealer if you are interested in enrolling in householding and receiving a single copy of prospectuses and other shareholder documents,or if you are currently enrolled in householding and wish to change your householding status.
Availability of Quarterly Schedule of Investments
The Funds file their complete schedule of portfolio holdings with the SEC for the first and third quarters of each fiscal year as an exhibit to their reports on Form N-PORT.The Funds' Forms N-PORT are available on the SEC’s website at sec.gov. Additionally, each Fund makes its portfolio holdings for the first and third quarters of each fiscalryear available at ishares.com/fundreports.
Availability of Proxy Voting Policies and Proxy Voting Records
A description of the policies and procedures that the iShares Funds use to determine how to vote proxies relating to portfolio securities and information about how theiShares Funds voted proxies relating to portfolio securities during the most recent twelve-month period ending June 30 is available without charge, upon request (1) bycalling toll-free 1-800-474-2737; (2) on the iShares website at iShares.com; and (3) on the SEC website at sec.gov.
A description of the Company’s policies and procedures with respect to the disclosure of the Fund’s portfolio securities is available in the Fund Prospectus. The Funddiscloses its portfolio holdings daily and provides information regarding its top holdings in Fund fact sheets at iShares.com.
General Information
G E N E R A L I N F O R M A T I O N 103

Portfolio Abbreviations - Equity
ADR American Depositary Receipt
NVS Non-Voting Shares
REIT Real Estate Investment Trust
Glossary of Terms Used in this Report
104 2 0 2 1 I S H A R E S A N N U A L R E P O R T T O S H A R E H O L D E R S

THIS PAGE INTENTIONALLY LEFT BLANK.

THIS PAGE INTENTIONALLY LEFT BLANK.

THIS PAGE INTENTIONALLY LEFT BLANK.

Want to know more?iShares.com | 1-800-474-2737
This report is intended for the Funds' shareholders. It may not be distributed to prospective investors unless it is
preceded or accompanied by the current prospectus.
Investing involves risk, including possible loss of principal.
The iShares Funds are distributed by BlackRock Investments, LLC (together with its affiliates, “BlackRock”).
The iShares Funds are not sponsored, endorsed, issued, sold or promoted by MSCI Inc., nor does this company make any
representation regarding the advisability of investing in the iShares Funds. BlackRock is not affiliated with the company
listed above.
©2021 BlackRock, Inc. All rights reserved. iSHARES and BLACKROCK are registered trademarks of BlackRock, Inc. or its
subsidiaries. All other marks are the property of their respective owners.
iS-AR-711-0721