ANNUAL REPORT 2021
40
ANNUAL REPORT 2021 For the Year Ended March 31, 2021 NOHMI BOSAI LTD.
-
Upload
khangminh22 -
Category
Documents
-
view
4 -
download
0
Transcript of ANNUAL REPORT 2021
ANNUAL REPORT 2021For the Year Ended March 31, 2021
NOHMI BOSAI LTD.

Profile
NOHMI BOSAI LTD., established in 1944 and listed on the First
Section of the Tokyo Stock Exchange in 1991, is a leading
Japanese manufacturer of fire alarm and fire extinguishing
systems. In the fiscal year ended March 31, 2021, the Company
realized consolidated net sales of ¥107.9 billion. NOHMI BOSAI
is responsible for the development, marketing, installation and
maintenance of a wide variety of state-of-the-art fire protection
systems. In addition to our strong domestic presence, we are also
active in China, other parts of Asia and the United States.
Cautionary Statement with Respect to Forward-Looking Statements
Statements made in this annual report with respect to NOHMI BOSAI’s plans, strategies and beliefs, and other statements that are not historical facts are forward-looking statements about the future performance of NOHMI BOSAI, which are based on management’s assumptions and beliefs in light of the information currently available to it, and involve risks and uncertainties. Potential risks and uncertainties include, without limitation, general economic conditions in NOHMI BOSAI’s markets, industrial market conditions and NOHMI BOSAI’s ability to continue to win acceptance of its products and services, which are offered in highly competitive markets characterized by continual new product introductions, rapid developments in technology and changing customer preferences.
Contents
Consolidated Financial Highlights 1
A Message from the President 2
Special Feature: Medium-Term Business Plan
“Project 2021” (FY2020 –FY2022) 4
Review of Operations 6
Corporate Governance 8
Management’s Discussion and Analysis 10
Consolidated Balance Sheets 12
Consolidated Statements of Income 14
Consolidated Statements of Comprehensive Income 15
Consolidated Statements of Changes in Net Assets 16
Consolidated Statements of Cash Flows 17
Notes to the Consolidated Financial Statements 18
Independent Auditor’s Report 34
Investor Information 37
1
Millions of YenPercentage
ChangeThousands of U.S. Dollars*4
2019 2020 2021 2021/2020 2021
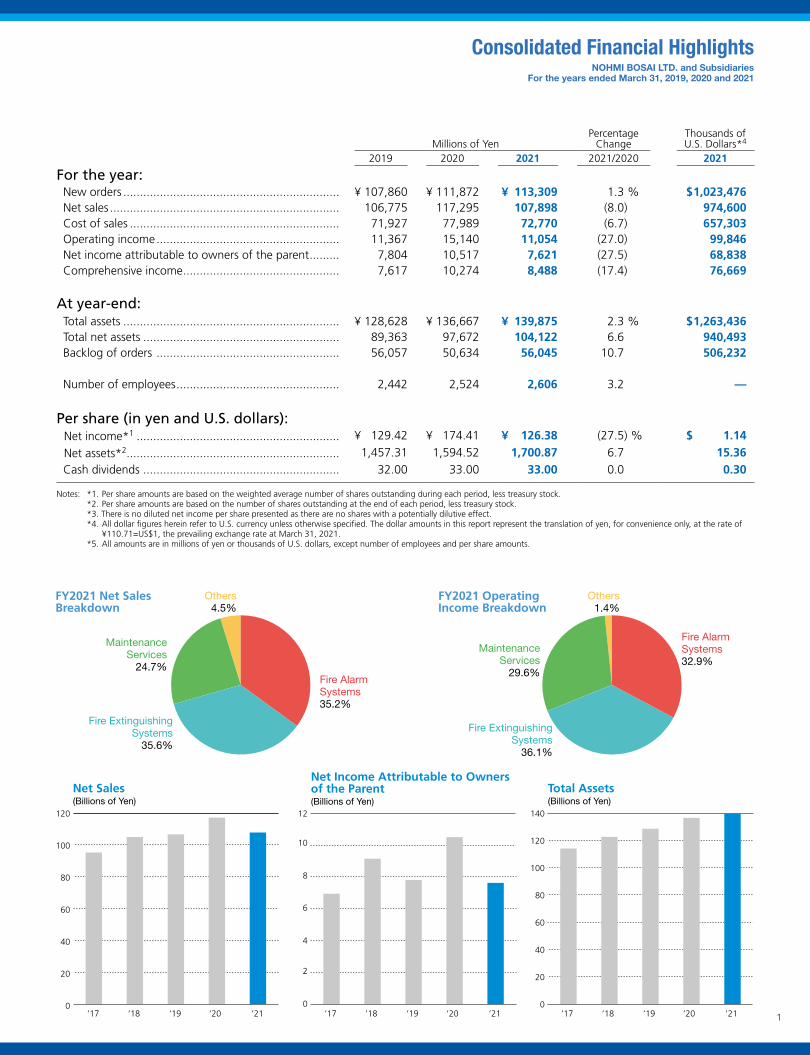
For the year: New orders ................................................................. ¥ 107,860 ¥ 111,872 ¥ 113,309 1.3 % $ 1,023,476 Net sales ..................................................................... 106,775 117,295 107,898 (8.0) 974,600 Cost of sales ............................................................... 71,927 77,989 72,770 (6.7) 657,303 Operating income ....................................................... 11,367 15,140 11,054 (27.0) 99,846 Net income attributable to owners of the parent ......... 7,804 10,517 7,621 (27.5) 68,838 Comprehensive income ............................................... 7,617 10,274 8,488 (17.4) 76,669
At year-end: Total assets ................................................................. ¥ 128,628 ¥ 136,667 ¥ 139,875 2.3 % $ 1,263,436 Total net assets ........................................................... 89,363 97,672 104,122 6.6 940,493 Backlog of orders ....................................................... 56,057 50,634 56,045 10.7 506,232 Number of employees ................................................. 2,442 2,524 2,606 3.2 —
Per share (in yen and U.S. dollars): Net income *1 ............................................................. ¥ 129.42 ¥ 174.41 ¥ 126.38 (27.5) % $ 1.14
Net assets*2................................................................ 1,457.31 1,594.52 1,700.87 6.7 15.36 Cash dividends ........................................................... 32.00 33.00 33.00 0.0 0.30
Notes: *1. Per share amounts are based on the weighted average number of shares outstanding during each period, less treasury stock. *2. Per share amounts are based on the number of shares outstanding at the end of each period, less treasury stock. *3. There is no diluted net income per share presented as there are no shares with a potentially dilutive effect. *4. All dollar figures herein refer to U.S. currency unless otherwise specified. The dollar amounts in this report represent the translation of yen, for convenience only, at the rate of
¥110.71=US$1, the prevailing exchange rate at March 31, 2021. *5. All amounts are in millions of yen or thousands of U.S. dollars, except number of employees and per share amounts.
FY2021 Net Sales Breakdown
Fire ExtinguishingSystems
35.6%
Fire Alarm Systems35.2%
MaintenanceServices
24.7%
Others4.5%
FY2021 Operating Income Breakdown
Fire ExtinguishingSystems
36.1%
Fire Alarm Systems32.9%
MaintenanceServices
29.6%
Others1.4%
Total Assets(Billions of Yen)
Net Income Attributable to Owners of the Parent(Billions of Yen)
120
100
80
60
40
20
0
Net Sales(Billions of Yen)
140
120
100
80
60
40
20
0
12
10
8
6
4
2
0’20’19 ’21’17 ’18 ’20’19 ’21’17 ’18 ’20’19 ’21’17 ’18
Consolidated Financial HighlightsNOHMI BOSAI LTD. and Subsidiaries
For the years ended March 31, 2019, 2020 and 2021
2
A Message from the President
Operating Environment and Business Results in Fiscal 2021During the fiscal year ended March 31, 2021, the spread of COVID-19 significantly restricted social and economic activities around the world, rapidly bringing the Japanese economy into a downward spiral, where it stayed amid difficult conditions.
Uncertainty persisted in the domestic fire protection industry, impacted by a cautious trend in private-sector investments due to a drastic decline in corporate profitability.
The NOHMI BOSAI Group formulated a three-year medium-term business plan starting from fiscal 2020 entitled “Project 2021—Build Strong ‘On-site Capabilities’.” Under the vision and priority policies below, we made various efforts to lay the foundation for achieving dramatic growth.
During fiscal 2021, the medium-term business plan’s second year, we engaged in business activities to ensure the safety of society while closely following COVID-19 safety protocols to prevent its spread. As a result, in fiscal 2021 new orders increased 1.3% to ¥113,309 million, while net sales decreased 8.0% to ¥107,898 million.
At the profit level, because of a concentration of contracts with relatively high profitability in the previous fiscal year, operating income decreased 27.0% to ¥11,054 million and net income attributable to owners of the parent decreased 27.5% to ¥7,621 million.
By business segment, the Fire Alarm Systems segment posted net sales of ¥37,952 million and operating income of ¥5,979 million, decreases of 7.5% and 22.1%, respectively, from the previous year. Net sales and operating income in the Fire Extinguishing Systems segment decreased 10.1% to ¥38,416 million and 17.7% to ¥6,568 million year on year,
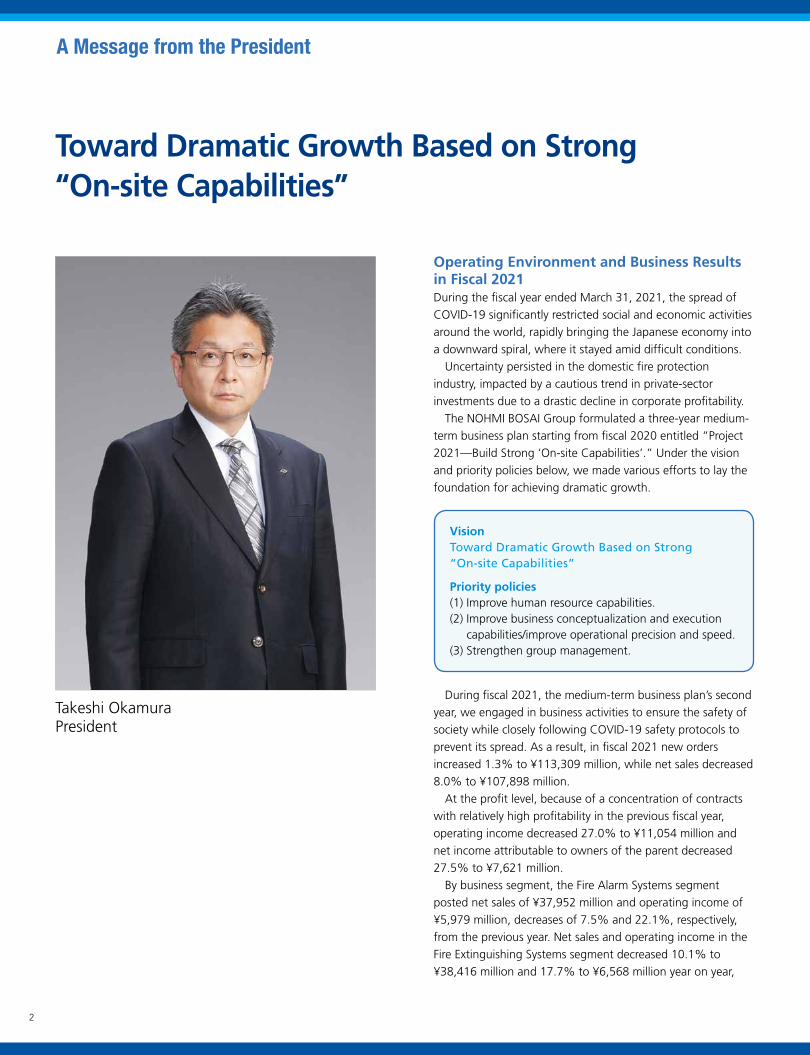
Takeshi OkamuraPresident
Toward Dramatic Growth Based on Strong “On-site Capabilities”
VisionToward Dramatic Growth Based on Strong “On-site Capabilities”
Priority policies(1) Improve human resource capabilities.(2) Improve business conceptualization and execution
capabilities/improve operational precision and speed.(3) Strengthen group management.

3
respectively. Net sales and operating income in the Maintenance Services segment decreased 2.9% to ¥26,687 million and 12.5% to ¥5,393 million year on year, respectively. Net sales and operating income in the Others segment also decreased 20.2% to ¥4,843 million and 48.2% to ¥254 million, respectively, from the previous fiscal year.
Initiatives for Transparent ManagementThe NOHMI BOSAI Group has been undertaking a variety of initiatives to strengthen our corporate governance structure with the aim of maximizing corporate value, ensuring transparency and fairness in corporate management and enabling a quick decision-making process. We emphasize accountability to such key stakeholders as our shareholders and investors by disclosing information in a timely and appropriate manner. Moreover, by building an internal control system, we are carrying out compliance-based management that ensures strict Group-wide adherence to our code of conduct and internal rules and thereby helping to prevent misconduct of any kind.
Shareholder ReturnsWith regard to the distribution of profits, in addition to placing an emphasis on returning profits to shareholders, we pay dividends based on a comprehensive evaluation of such financial indicators as our payout ratio while considering the need for internal reserves to strengthen our corporate structure in preparation for future business development.
Based on the above policy, for the fiscal year ended March 31, 2021, the Company declared a year-end dividend per share of ¥16.50. Including the interim dividend of ¥16.50 per share, annual dividends per share totaled ¥33.00.
For fiscal 2022, we plan to declare annual dividends per share of ¥36.00, which include an interim dividend per share of ¥18.00 and a year-end dividend per share of ¥18.00.
Outlook for Fiscal 2022We expect economic uncertainty to persist for fiscal 2022 as it is still unclear when the COVID-19 pandemic will subside.
In the fire protection industry, we must keep a close eye on the impact of the pandemic, such as delays in construction and a decrease in capital investments.
The NOHMI BOSAI Group formulated a three-year medium-term business plan starting from fiscal 2020 called “Project 2021—Build Strong ‘On-site Capabilities’.” During fiscal 2022, the final year of the plan, the Group will accurately identify and respond quickly to continually evolving safety and security needs. We will also make various efforts to lay the foundation that will lead to dramatic growth.
In closing, I would like to ask all our stakeholders, including shareholders, for their continued understanding and support in the coming year.
July 2021
Takeshi OkamuraPresident

4
Special Feature: Medium-Term Business Plan “Project 2021” (FY2020–FY2022)
• Collaborate with related in-house and external bodies and introduce elemental and other technologies (data, technology, AI, IoT, etc.)
• Promote in-house development of NOHMI BOSAI’s core technologies
Toward the development of next-generation new products
Experimental research expenses
(Billions of Yen)
2.2billion
yen
86.0106.7
117.3 125.0
¥170 billion or higher
2.1%As a percentage of consolidated net sales
R&D investment
2.2% 3.0%
2029/32025/32022/32020/32019/32013/3
Cons
olid
ated
Net
Sal
es
Stage Stage Stage
2.6billion
yen
5.0billion
yen
Maintain operating profit margin of 10% or higher
120.8
Review plans based on changes in the external environment
Surpassed the targeted operating profit margin!Operating profit margin of 11.2%
Quantitative targets
Consolidated net sales/Operating profit margin
As a pioneer in the fire protection industry, we continue to anticipate changes in the world and provide value to contribute to the realization of a safe society. To demonstrate our raison d’etre, it is necessary to adapt to an ever-changing external environment and elevate ourselves to the next stage. Our medium-term business plan was formulated to achieve these goals by focusing especially on “on-site capabilities.”
Toward Dramatic Growth Based on Strong “On-site Capabilities”
Toward Dramatic Growth Based on Strong “On-site Capabilities”
Continue to be pioneers in fire protection fields as a comprehensive fire protection company
1. Improve human resource capabilities.2. Improve business conceptualization and execution capabilities/
improve operational precision and speed.3. Strengthen group management.
Priority policies of Medium-Term Business Plan
Vision
Create a foundation for even higher stages of growth (investments, new initiatives)
Respond to External Environment and Elevate to a Higher Level
COVID-19
2019 2020 2021 (FY)
On-site capabilities
Under movement restrictions, we exercised:• Responsiveness to crises• Ingenuity to break out of
the status quo
Improved on-site capabilities
No impact on business performance beyond expectations
5
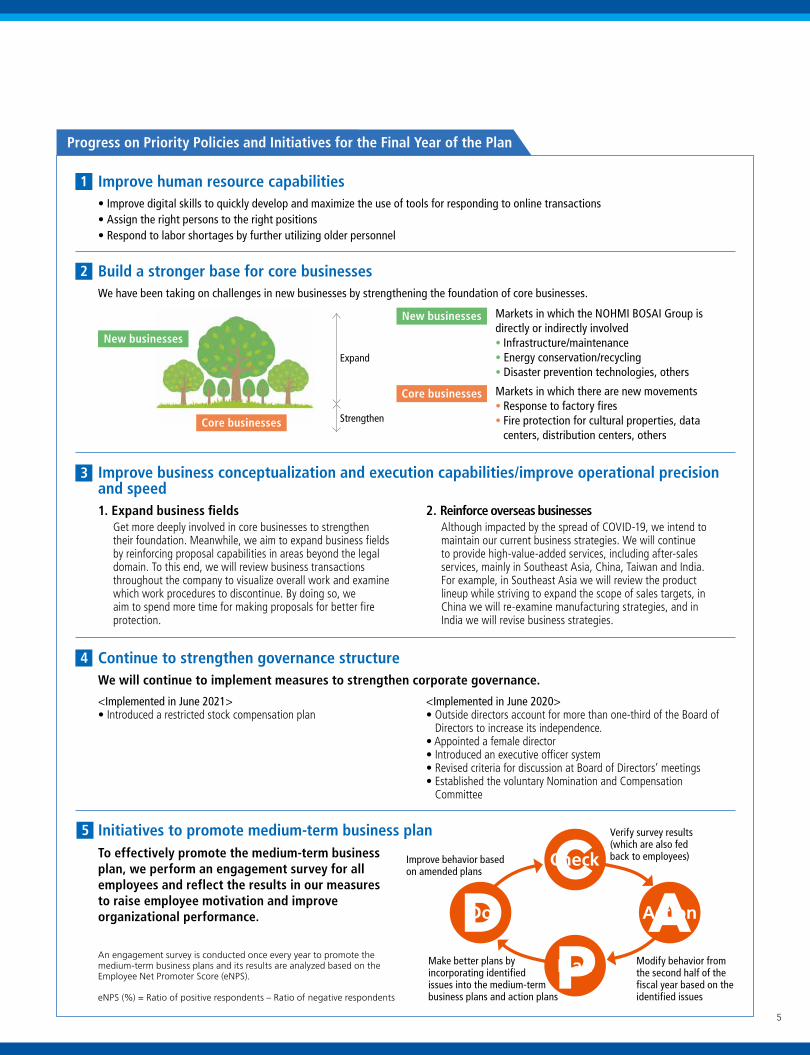
• Improve digital skills to quickly develop and maximize the use of tools for responding to online transactions• Assign the right persons to the right positions• Respond to labor shortages by further utilizing older personnel
Progress on Priority Policies and Initiatives for the Final Year of the Plan
1 Improve human resource capabilities
We have been taking on challenges in new businesses by strengthening the foundation of core businesses.
2 Build a stronger base for core businesses
Markets in which the NOHMI BOSAI Group is directly or indirectly involved• Infrastructure/maintenance• Energy conservation/recycling• Disaster prevention technologies, others
New businesses
Markets in which there are new movements• Response to factory fires• Fire protection for cultural properties, data
centers, distribution centers, others
Core businesses
Core businesses
New businesses
Expand
Strengthen
Plan
Check
Do Action
Verify survey results (which are also fed back to employees)
Modify behavior from the second half of the fiscal year based on the identified issues
Make better plans by incorporating identified issues into the medium-term business plans and action plans
An engagement survey is conducted once every year to promote the medium-term business plans and its results are analyzed based on the Employee Net Promoter Score (eNPS).
eNPS (%) = Ratio of positive respondents – Ratio of negative respondents
Improve behavior based on amended plans
1. Expand business fieldsGet more deeply involved in core businesses to strengthen their foundation. Meanwhile, we aim to expand business fields by reinforcing proposal capabilities in areas beyond the legal domain. To this end, we will review business transactions throughout the company to visualize overall work and examine which work procedures to discontinue. By doing so, we aim to spend more time for making proposals for better fire protection.
2. Reinforce overseas businessesAlthough impacted by the spread of COVID-19, we intend to maintain our current business strategies. We will continue to provide high-value-added services, including after-sales services, mainly in Southeast Asia, China, Taiwan and India. For example, in Southeast Asia we will review the product lineup while striving to expand the scope of sales targets, in China we will re-examine manufacturing strategies, and in India we will revise business strategies.
3 Improve business conceptualization and execution capabilities/improve operational precision and speed
To effectively promote the medium-term business plan, we perform an engagement survey for all employees and reflect the results in our measures to raise employee motivation and improve organizational performance.
5 Initiatives to promote medium-term business plan
We will continue to implement measures to strengthen corporate governance.
4 Continue to strengthen governance structure
<Implemented in June 2021>• Introduced a restricted stock compensation plan
<Implemented in June 2020>• Outside directors account for more than one-third of the Board of
Directors to increase its independence.• Appointed a female director• Introduced an executive officer system• Revised criteria for discussion at Board of Directors’ meetings• Established the voluntary Nomination and Compensation
Committee
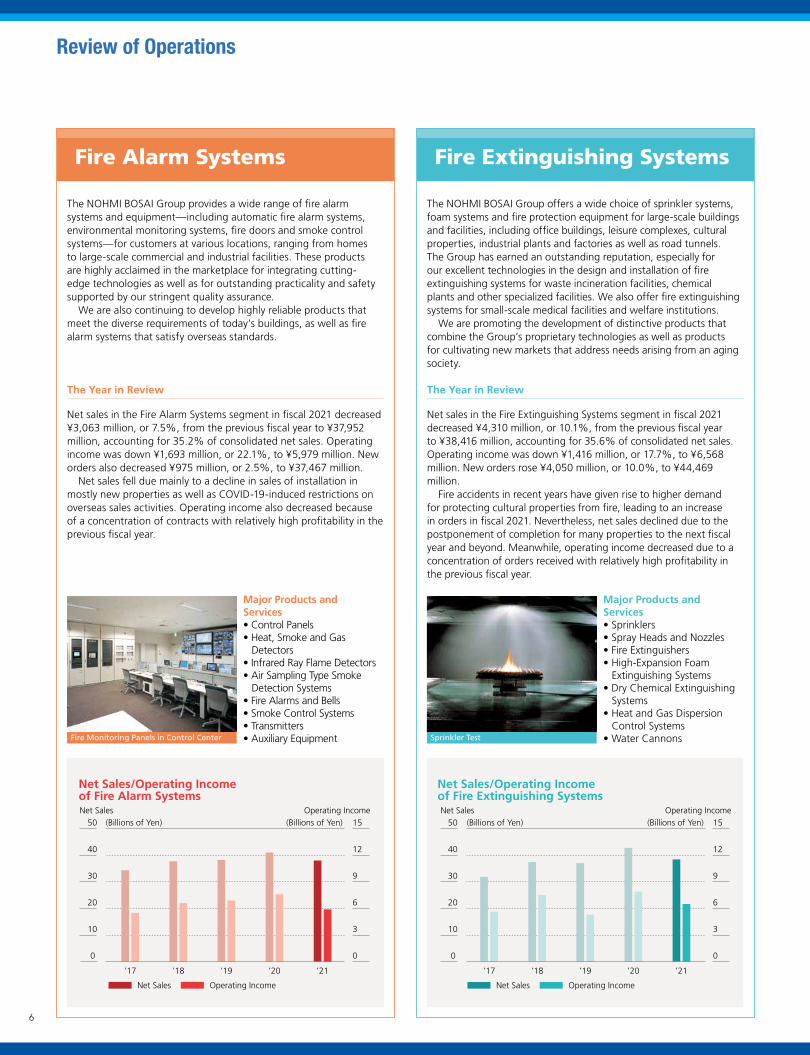
Net Sales/Operating Income of Fire Alarm Systems
Net Sales Operating Income
50
40
30
20
10
0
15
9
6
3
0
12
Net Sales Operating Income(Billions of Yen) (Billions of Yen)
’21’20’17 ’18 ’19
50
40
30
20
10
0
15
9
6
3
0
12
Net Sales/Operating Income of Fire Extinguishing Systems
Net Sales Operating Income
Net Sales Operating Income(Billions of Yen) (Billions of Yen)
’21’20’17 ’18 ’19
6
Review of Operations
Major Products and Services• Control Panels• Heat, Smoke and Gas
Detectors• Infrared Ray Flame Detectors• Air Sampling Type Smoke
Detection Systems• Fire Alarms and Bells• Smoke Control Systems• Transmitters• Auxiliary EquipmentFire Monitoring Panels in Control Center
Major Products andServices• Sprinklers• Spray Heads and Nozzles• Fire Extinguishers• High-Expansion Foam
Extinguishing Systems• Dry Chemical Extinguishing
Systems• Heat and Gas Dispersion
Control Systems• Water CannonsSprinkler Test
Fire Extinguishing SystemsFire Alarm Systems
The NOHMI BOSAI Group offers a wide choice of sprinkler systems, foam systems and fire protection equipment for large-scale buildings and facilities, including office buildings, leisure complexes, cultural properties, industrial plants and factories as well as road tunnels. The Group has earned an outstanding reputation, especially for our excellent technologies in the design and installation of fire extinguishing systems for waste incineration facilities, chemical plants and other specialized facilities. We also offer fire extinguishing systems for small-scale medical facilities and welfare institutions.
We are promoting the development of distinctive products that combine the Group’s proprietary technologies as well as products for cultivating new markets that address needs arising from an aging society.
The Year in Review
Net sales in the Fire Extinguishing Systems segment in fiscal 2021 decreased ¥4,310 million, or 10.1%, from the previous fiscal year to ¥38,416 million, accounting for 35.6% of consolidated net sales. Operating income was down ¥1,416 million, or 17.7%, to ¥6,568 million. New orders rose ¥4,050 million, or 10.0%, to ¥44,469 million.
Fire accidents in recent years have given rise to higher demand for protecting cultural properties from fire, leading to an increase in orders in fiscal 2021. Nevertheless, net sales declined due to the postponement of completion for many properties to the next fiscal year and beyond. Meanwhile, operating income decreased due to a concentration of orders received with relatively high profitability in the previous fiscal year.
The NOHMI BOSAI Group provides a wide range of fire alarm systems and equipment—including automatic fire alarm systems, environmental monitoring systems, fire doors and smoke control systems—for customers at various locations, ranging from homes to large-scale commercial and industrial facilities. These products are highly acclaimed in the marketplace for integrating cutting-edge technologies as well as for outstanding practicality and safety supported by our stringent quality assurance.
We are also continuing to develop highly reliable products that meet the diverse requirements of today’s buildings, as well as fire alarm systems that satisfy overseas standards.
The Year in Review
Net sales in the Fire Alarm Systems segment in fiscal 2021 decreased ¥3,063 million, or 7.5%, from the previous fiscal year to ¥37,952 million, accounting for 35.2% of consolidated net sales. Operating income was down ¥1,693 million, or 22.1%, to ¥5,979 million. New orders also decreased ¥975 million, or 2.5%, to ¥37,467 million.
Net sales fell due mainly to a decline in sales of installation in mostly new properties as well as COVID-19-induced restrictions on overseas sales activities. Operating income also decreased because of a concentration of contracts with relatively high profitability in the previous fiscal year.
50
40
30
20
10
0
15
9
6
3
0
12
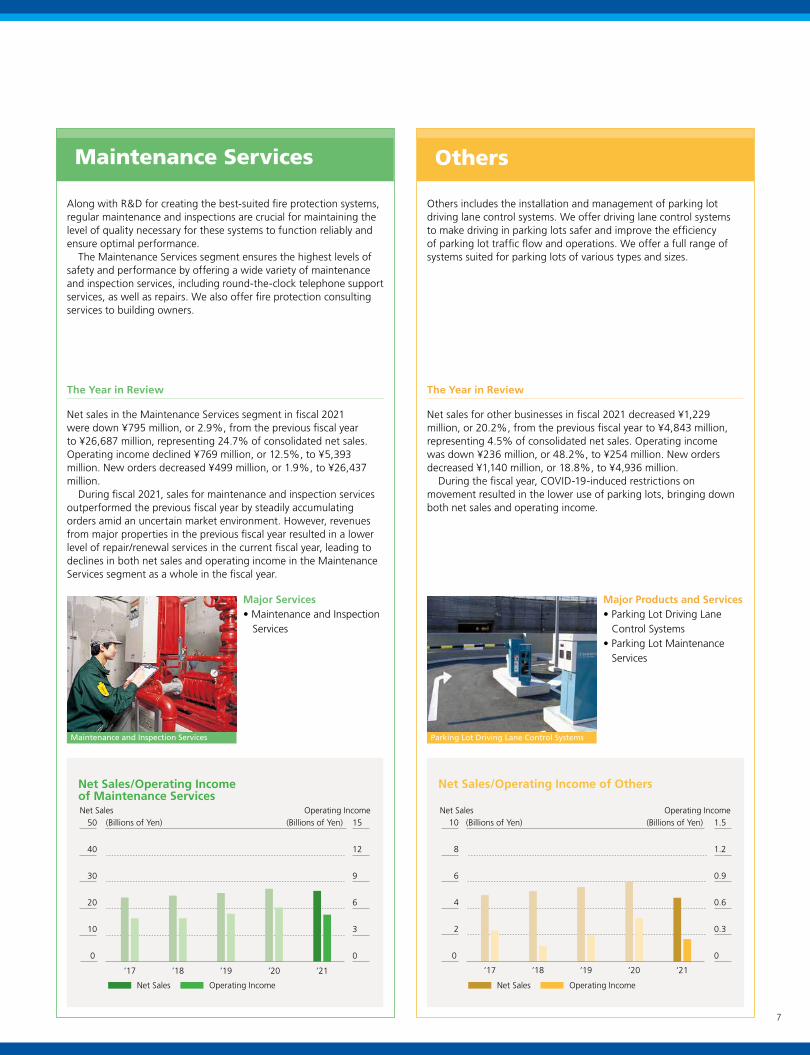
Net Sales/Operating Income of Maintenance Services
Net Sales Operating Income
Net Sales Operating Income(Billions of Yen) (Billions of Yen)
’21’20’17 ’18 ’19
10
8
6
4
2
0
1.5
0.9
0.6
0.3
0
1.2
Net Sales/Operating Income of Others
Net Sales Operating Income
Net Sales Operating Income(Billions of Yen) (Billions of Yen)
’21’20’17 ’18 ’19
7
Major Services• Maintenance and Inspection
Services
Maintenance and Inspection Services
Major Products and Services• Parking Lot Driving Lane
Control Systems• Parking Lot Maintenance
Services
Parking Lot Driving Lane Control Systems
Maintenance Services Others
Along with R&D for creating the best-suited fire protection systems, regular maintenance and inspections are crucial for maintaining the level of quality necessary for these systems to function reliably and ensure optimal performance.
The Maintenance Services segment ensures the highest levels of safety and performance by offering a wide variety of maintenance and inspection services, including round-the-clock telephone support services, as well as repairs. We also offer fire protection consulting services to building owners.
The Year in Review
Net sales in the Maintenance Services segment in fiscal 2021 were down ¥795 million, or 2.9%, from the previous fiscal year to ¥26,687 million, representing 24.7% of consolidated net sales. Operating income declined ¥769 million, or 12.5%, to ¥5,393 million. New orders decreased ¥499 million, or 1.9%, to ¥26,437 million.
During fiscal 2021, sales for maintenance and inspection services outperformed the previous fiscal year by steadily accumulating orders amid an uncertain market environment. However, revenues from major properties in the previous fiscal year resulted in a lower level of repair/renewal services in the current fiscal year, leading to declines in both net sales and operating income in the Maintenance Services segment as a whole in the fiscal year.
Others includes the installation and management of parking lot driving lane control systems. We offer driving lane control systems to make driving in parking lots safer and improve the efficiency of parking lot traffic flow and operations. We offer a full range of systems suited for parking lots of various types and sizes.
The Year in Review
Net sales for other businesses in fiscal 2021 decreased ¥1,229 million, or 20.2%, from the previous fiscal year to ¥4,843 million, representing 4.5% of consolidated net sales. Operating income was down ¥236 million, or 48.2%, to ¥254 million. New orders decreased ¥1,140 million, or 18.8%, to ¥4,936 million.
During the fiscal year, COVID-19-induced restrictions on movement resulted in the lower use of parking lots, bringing down both net sales and operating income.
8
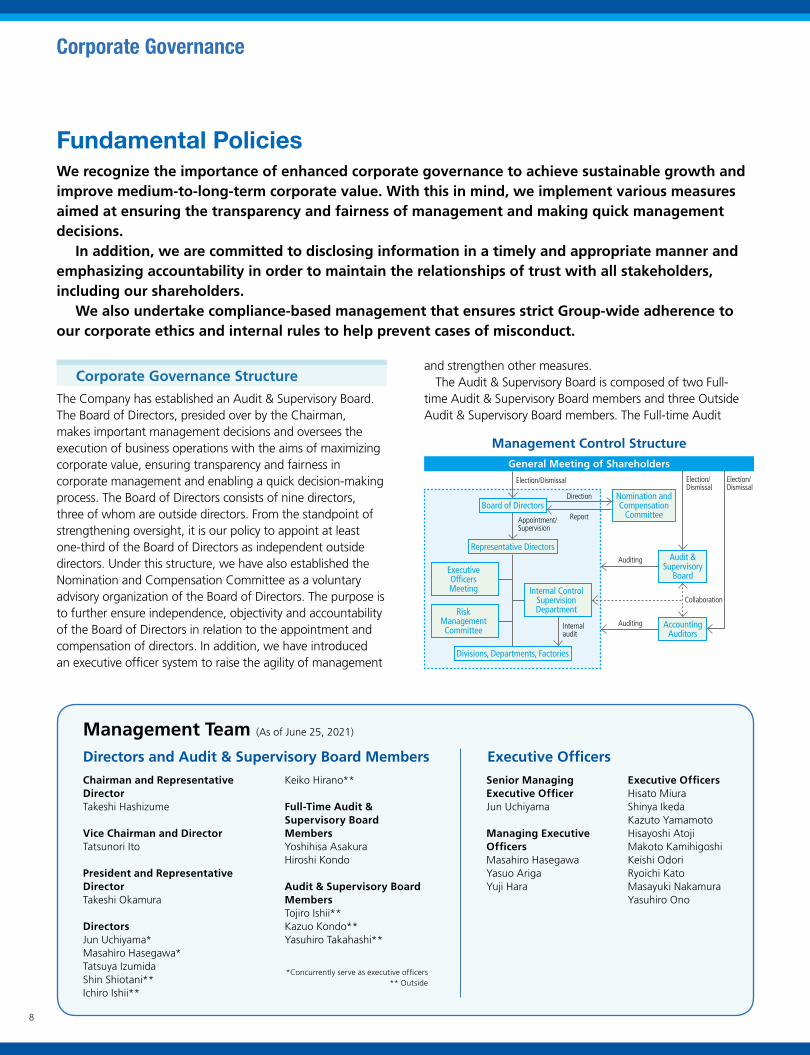
We recognize the importance of enhanced corporate governance to achieve sustainable growth and improve medium-to-long-term corporate value. With this in mind, we implement various measures aimed at ensuring the transparency and fairness of management and making quick management decisions.
In addition, we are committed to disclosing information in a timely and appropriate manner and emphasizing accountability in order to maintain the relationships of trust with all stakeholders, including our shareholders.
We also undertake compliance-based management that ensures strict Group-wide adherence to our corporate ethics and internal rules to help prevent cases of misconduct.
Fundamental Policies
Corporate Governance
The Company has established an Audit & Supervisory Board. The Board of Directors, presided over by the Chairman, makes important management decisions and oversees the execution of business operations with the aims of maximizing corporate value, ensuring transparency and fairness in corporate management and enabling a quick decision-making process. The Board of Directors consists of nine directors, three of whom are outside directors. From the standpoint of strengthening oversight, it is our policy to appoint at least one-third of the Board of Directors as independent outside directors. Under this structure, we have also established the Nomination and Compensation Committee as a voluntary advisory organization of the Board of Directors. The purpose is to further ensure independence, objectivity and accountability of the Board of Directors in relation to the appointment and compensation of directors. In addition, we have introduced an executive officer system to raise the agility of management
and strengthen other measures.The Audit & Supervisory Board is composed of two Full-
time Audit & Supervisory Board members and three Outside Audit & Supervisory Board members. The Full-time Audit
Corporate Governance Structure
Chairman and Representative DirectorTakeshi Hashizume
Vice Chairman and DirectorTatsunori Ito
President and Representative DirectorTakeshi Okamura
DirectorsJun Uchiyama*Masahiro Hasegawa*Tatsuya IzumidaShin Shiotani**Ichiro Ishii**
Senior Managing Executive OfficerJun Uchiyama
Managing Executive OfficersMasahiro HasegawaYasuo ArigaYuji Hara
Keiko Hirano**
Full-Time Audit & Supervisory Board MembersYoshihisa AsakuraHiroshi Kondo
Audit & Supervisory Board MembersTojiro Ishii**Kazuo Kondo**Yasuhiro Takahashi**
*Concurrently serve as executive officers** Outside
Executive OfficersHisato MiuraShinya IkedaKazuto YamamotoHisayoshi AtojiMakoto KamihigoshiKeishi OdoriRyoichi KatoMasayuki NakamuraYasuhiro Ono
Directors and Audit & Supervisory Board Members Executive Officers
Management Team (As of June 25, 2021)
Management Control Structure
Election/Dismissal Election/Dismissal
Appointment/Supervision
Internal audit
Direction
ReportBoard of Directors
Nomination and Compensation
Committee
Representative Directors
Divisions, Departments, Factories
Executive Officers Meeting
Risk Management Committee
Internal Control Supervision Department
Election/Dismissal
Collaboration
Auditing Audit & Supervisory
Board
Auditing Accounting Auditors
General Meeting of Shareholders
9
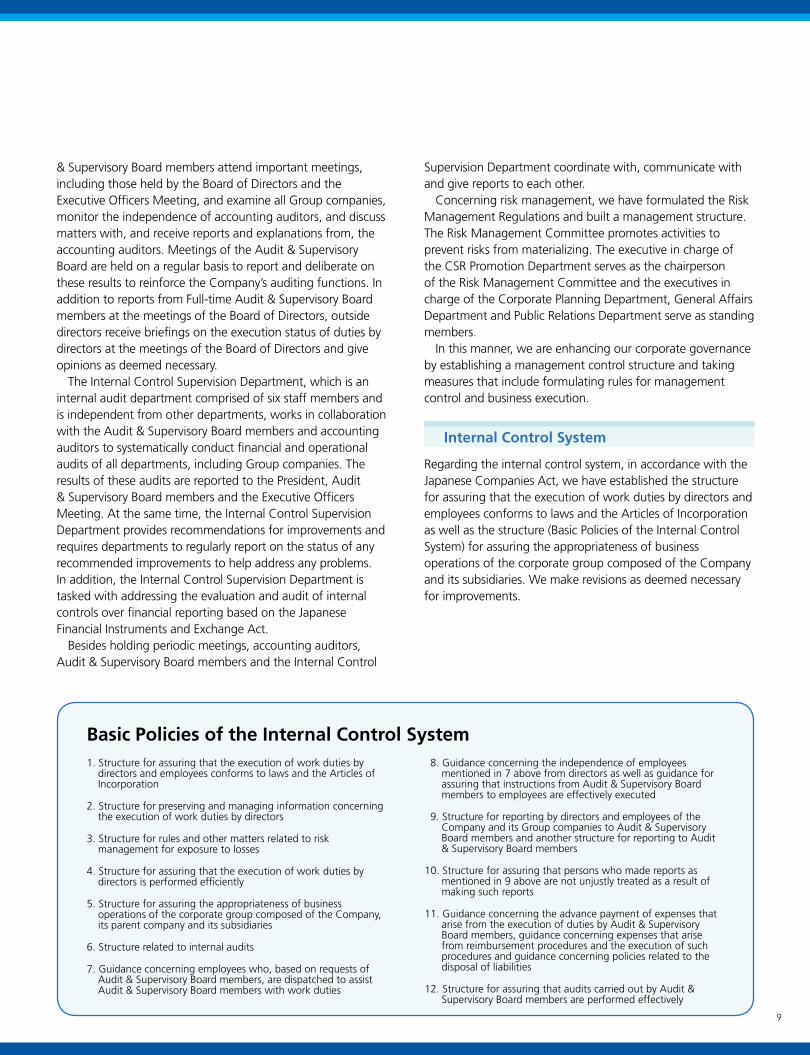
1. Structure for assuring that the execution of work duties by directors and employees conforms to laws and the Articles of Incorporation
2. Structure for preserving and managing information concerning the execution of work duties by directors
3. Structure for rules and other matters related to risk management for exposure to losses
4. Structure for assuring that the execution of work duties by directors is performed efficiently
5. Structure for assuring the appropriateness of business operations of the corporate group composed of the Company, its parent company and its subsidiaries
6. Structure related to internal audits
7. Guidance concerning employees who, based on requests of Audit & Supervisory Board members, are dispatched to assist Audit & Supervisory Board members with work duties
8. Guidance concerning the independence of employees mentioned in 7 above from directors as well as guidance for assuring that instructions from Audit & Supervisory Board members to employees are effectively executed
9. Structure for reporting by directors and employees of the Company and its Group companies to Audit & Supervisory Board members and another structure for reporting to Audit & Supervisory Board members
10. Structure for assuring that persons who made reports as mentioned in 9 above are not unjustly treated as a result of making such reports
11. Guidance concerning the advance payment of expenses that arise from the execution of duties by Audit & Supervisory Board members, guidance concerning expenses that arise from reimbursement procedures and the execution of such procedures and guidance concerning policies related to the disposal of liabilities
12. Structure for assuring that audits carried out by Audit & Supervisory Board members are performed effectively
Basic Policies of the Internal Control System
& Supervisory Board members attend important meetings, including those held by the Board of Directors and the Executive Officers Meeting, and examine all Group companies, monitor the independence of accounting auditors, and discuss matters with, and receive reports and explanations from, the accounting auditors. Meetings of the Audit & Supervisory Board are held on a regular basis to report and deliberate on these results to reinforce the Company’s auditing functions. In addition to reports from Full-time Audit & Supervisory Board members at the meetings of the Board of Directors, outside directors receive briefings on the execution status of duties by directors at the meetings of the Board of Directors and give opinions as deemed necessary.
The Internal Control Supervision Department, which is an internal audit department comprised of six staff members and is independent from other departments, works in collaboration with the Audit & Supervisory Board members and accounting auditors to systematically conduct financial and operational audits of all departments, including Group companies. The results of these audits are reported to the President, Audit & Supervisory Board members and the Executive Officers Meeting. At the same time, the Internal Control Supervision Department provides recommendations for improvements and requires departments to regularly report on the status of any recommended improvements to help address any problems. In addition, the Internal Control Supervision Department is tasked with addressing the evaluation and audit of internal controls over financial reporting based on the Japanese Financial Instruments and Exchange Act.
Besides holding periodic meetings, accounting auditors, Audit & Supervisory Board members and the Internal Control
Supervision Department coordinate with, communicate with and give reports to each other.
Concerning risk management, we have formulated the Risk Management Regulations and built a management structure. The Risk Management Committee promotes activities to prevent risks from materializing. The executive in charge of the CSR Promotion Department serves as the chairperson of the Risk Management Committee and the executives in charge of the Corporate Planning Department, General Affairs Department and Public Relations Department serve as standing members.
In this manner, we are enhancing our corporate governance by establishing a management control structure and taking measures that include formulating rules for management control and business execution.
Internal Control System
Regarding the internal control system, in accordance with the Japanese Companies Act, we have established the structure for assuring that the execution of work duties by directors and employees conforms to laws and the Articles of Incorporation as well as the structure (Basic Policies of the Internal Control System) for assuring the appropriateness of business operations of the corporate group composed of the Company and its subsidiaries. We make revisions as deemed necessary for improvements.
10
The NOHMI BOSAI Group’s consolidated financial statements are prepared in accordance with generally accepted accounting principles in Japan (Japanese GAAP). An analysis of our financial condition, business results and cash flows for fiscal 2021 is shown below.
Performance AnalysisDuring fiscal 2021, the economic conditions worsened rapidly because of significant restrictions on social and economic activities that were imposed to prevent the spread of COVID-19. Amid this environment, we continued to engage in business activities in the medium-term business plan’s second year to ensure the safety of society while closely following COVID-19 safety protocols. As a result, net sales and operating income both declined. A summary of business results by segment is as follows.
In the Fire Alarm Systems segment, despite proactive sales activities, sales of both installation work and products decreased. Net sales decreased ¥3,063 million, or 7.5%, from the previous fiscal year to ¥37,592 million. Operating income fell ¥1,693 million, or 22.1%, from the previous year to ¥5,979 million due to a concentration of orders received with relatively high profitability in the previous fiscal year.
In the Fire Extinguishing Systems segment, net sales decreased ¥4,310 million, or 10.1%, from the previous fiscal year to ¥38,416 million, due primarily to decreases in revenues both from fire extinguishing systems for general properties, such as high-rises, as well as from systems used in special facilities, such as industrial plants and road tunnels, despite robust orders for new projects. Operating income was ¥6,568 million, down ¥1,416 million, or 17.7%, from the previous year due to a higher number of orders received with relatively low profitability compared with the previous fiscal year.
Net sales in the Maintenance Services segment were down ¥795 million, or 2.9%, from the previous fiscal year to ¥26,687 million. An increase in sales for maintenance and inspection services that resulted from steady sales activities was offset by a decrease in sales for repair/renewal services. Operating income decreased ¥769 million, or 12.5%, from the previous year to ¥5,393 million due to a concentration of orders received with relatively high profitability in the previous fiscal year.
For other businesses, net sales decreased ¥1,229 million, or 20.2%, from the previous year to ¥4,843 million due to a decrease in revenue from parking lot driving lane control systems and security-related facilities. Despite efforts to control costs amid a harsh business environment, operating income was down ¥236 million, or 48.2%, to ¥254 million.
Consequently, consolidated net sales decreased ¥9,397 million, or 8.0%, from the previous year to ¥107,898 million.
The cost-of-sales ratio increased 0.9 percentage point from the previous year to 67.4%. Despite efforts to streamline business operations and reduce costs amid a harsh business
environment, the ratio worsened as a result of a concentration of orders received with relatively high profitability in the previous fiscal year.
Gross profit was down ¥4,178 million, or 10.6%, from the previous year to ¥35,128 million, and the gross profit margin fell 0.9 percentage point from the previous year to 32.6%.
Selling, general and administrative (SG&A) expenses decreased ¥92 million, or 0.4%, but the SG&A expenses-to-net-sales ratio worsened by 1.7 percentage points from the previous year to 22.3%.
As a result, operating income decreased 27.0% from the previous year to ¥11,054 million. Net income attributable to owners of the parent decreased 27.5% year on year to ¥7,621 million. Net income per share was ¥126.38.
Assets, Liabilities and Net AssetsTotal assets at the end of fiscal 2021 amounted to ¥139,875 million, an increase of ¥3,208 million from the previous fiscal year-end. This was mainly attributable to an increase of ¥9,343 million in cash and bank deposits as well as an increase of ¥2,455 million in construction in progress, which together offset decreases of ¥6,582 million in trade receivables and ¥2,109 million in inventories.
Total liabilities decreased ¥3,242 million from the end of the previous fiscal year to ¥35,753 million. This decline is due primarily to decreases of ¥1,533 million in advances received on uncompleted construction contracts and ¥1,295 million in income taxes payable.
Total net assets increased ¥6,450 million from the end of the previous fiscal year to ¥104,122 million attributable mainly to an increase in retained earnings.
Cash FlowCash and cash equivalents at the end of fiscal 2021 totaled ¥50,960 million, an increase of ¥9,265 million from the end of the previous fiscal year. Details for each category of cash flows are as follows:
Net cash provided by operating activitiesDespite such outflows as income taxes paid of ¥4,691 million and a decrease in advances received on uncompleted construction contracts of ¥1,533 million, such inflows as income before income taxes of ¥11,111 million, a decrease in trade receivables of ¥6,627 million, adjustment for depreciation and amortization of ¥2,209 million and a decrease in inventories of ¥2,126 million resulted in net cash provided by operating activities of ¥15,829 million compared with ¥9,406 million in the previous fiscal year.
Net cash used in investing activitiesNet cash used in investing activities amounted to ¥4,343 million compared with ¥1,919 million in the previous fiscal year,
Management’s Discussion and Analysis
11
consisting mainly of payments for purchase of property, plant and equipment.
Net cash used in financing activitiesNet cash used in financing activities amounted to ¥2,234 million compared with ¥2,146 million in the previous fiscal year, consisting mainly of cash dividends paid.
Outlook for Fiscal 2022We expect economic uncertainty to persist for fiscal 2022 as it is still unclear when the COVID-19 pandemic will subside.
In the fire protection industry, we must keep a close eye on the impact of the pandemic, such as delays in construction and a decrease in capital investments.
The NOHMI BOSAI Group formulated a three-year medium-term business plan starting from fiscal 2020 called “Project 2021—Build Strong ‘On-site Capabilities’.” During fiscal 2022, the final year of the plan, the Group will accurately identify and respond quickly to continually evolving safety and security needs. We will also make various efforts to lay the foundation that will lead to dramatic growth.
Regarding cash dividends, we plan to declare annual dividends per share of ¥36.00, which include an interim dividend per share of ¥18.00 and a year-end dividend per share of ¥18.00.
Risk InformationThe key risks that could have an adverse impact on the NOHMI BOSAI Group’s financial condition and business results are set out below.
Forward-looking statements are based on the NOHMI BOSAI Group’s assumptions and beliefs as of the end of the fiscal year.
(1) Business EnvironmentThe NOHMI BOSAI Group’s businesses are closely associated with the construction industry and public works projects. Although the Group engages in proactive proposal-based sales activities and cost reduction activities, the environment for receiving orders could get worse in case of decreases in private sector investment and public investment due to economic deceleration. Accordingly, business trends in these sectors could have an adverse impact on the NOHMI BOSAI Group’s financial condition and business results.
(2) Laws and RegulationsA significant portion of the NOHMI BOSAI Group’s businesses is conducted in conformance with the Japanese Fire Service Law. Accordingly, significant changes in the law may lead to a change in the competitive environment and could have an adverse impact on the NOHMI BOSAI Group’s financial condition and business results.
(3) Defects in Products and ServicesThe NOHMI BOSAI Group offers products and services that contribute to the safety of society, including fire alarm systems and equipment and fire extinguishing systems, and expends all possible means to ensure quality assurance. The occurrence of a defect in its products and services that could impair the safety of society due to an unexpected situation could lead to an erosion in social credibility of the NOHMI BOSAI Group and have an adverse impact on its financial condition and business results.
(4) Procurement of Raw MaterialsIn offering its products, the NOHMI BOSAI Group strives to procure a stable supply of raw materials. Sharp rises in prices of raw materials or supply shortages of certain raw materials, however, could have an adverse impact on the NOHMI BOSAI Group’s financial condition and business results.
(5) Effects of Natural DisastersThe NOHMI BOSAI Group has formulated a business continuity plan (BCP) assuming that a situation occurs that could have an impact on the continuity of its businesses. However, damage to the NOHMI BOSAI Group’s production and sales facilities as a result of a large-scale natural disaster, including a major earthquake, could have an adverse impact on the NOHMI BOSAI Group’s financial condition and business results.
(6) ComplianceThe NOHMI BOSAI Group strives to improve compliance awareness of its executives and employees through ongoing compliance education. However, the occurrence of a serious compliance issue could lead to an erosion in social credibility of the NOHMI BOSAI Group and have an adverse impact on its financial condition and business results.
(7) Seasonal Variation in Business ResultsBusiness results of the NOHMI BOSAI Group fluctuate significantly by season, whereby there is a tendency for sales to increase in the fourth quarter of the fiscal year.
(8) Impact of the COVID-19 PandemicThere are growing concerns about the negative impact on the business environment of the NOHMI BOSAI Group, such as a worsening of orders received arising from delays in construction and a restraint in capital investments, due to the COVID-19 pandemic, which could have an adverse impact on its financial condition and business results. The NOHMI BOSAI Group will comply with the guidelines from the governments and local authorities in each country and region where it operates in its efforts to curb the spread of infection to fulfill its mission to contribute to the safety of society.

12
Consolidated Balance SheetsNOHMI BOSAI LTD. and SubsidiariesAs of March 31, 2020 and 2021
ASSETS Millions of YenThousands of
U.S. Dollars (Note 1)
2020 2021 2021
Current Assets:Cash and bank deposits (Notes 6 and 12) .................................................................. ¥ 42,707 ¥ 52,050 $ 470,147 Trade receivables (Notes 12 and 18): Notes ................................................................................................................ 7,334 6,513 58,829 Accounts ........................................................................................................... 36,716 30,933 279,406 Unconsolidated subsidiaries and affiliates ............................................................... 66 88 795
44,116 37,534 339,030 Less: Allowance for bad debts .............................................................................. (363) (370) (3,342)
43,753 37,164 335,688 Inventories (Note 8) ................................................................................................ 14,060 11,951 107,949 Prepaid expenses and other current assets ................................................................. 789 780 7,045
Total current assets ................................................................................ 101,309 101,945 920,829
Property, Plant and Equipment:Buildings and structures ............................................................................................ 16,677 16,895 152,606 Machinery and equipment ...................................................................................... 2,711 2,771 25,029 Tools and furniture ................................................................................................. 8,897 9,233 83,398
28,285 28,899 261,033 Less: Accumulated depreciation ............................................................................... (16,199) (17,289) (156,164)
12,086 11,610 104,869
Construction in progress ......................................................................................... 338 2,793 25,228 Land ..................................................................................................................... 7,066 7,066 63,824 Other ................................................................................................................... 214 177 1,599
Net property, plant and equipment .......................................................... 19,704 21,646 195,520
Intangible Assets:Software ............................................................................................................... 1,407 1,873 16,918 Goodwill ............................................................................................................... 32 20 181 Other intangible assets ........................................................................................... 69 69 623
Total intangible assets ............................................................................ 1,508 1,962 17,722
Investments and Other Assets:Investments in securities (Notes 7 and 12) ................................................................. 2,428 3,208 28,977 Investments in unconsolidated subsidiaries and affiliates (Note 12) ............................... 3,526 3,375 30,485 Long-term loans receivable (Note 12) ........................................................................ 25 3 27 Deferred tax assets (Note 13) ................................................................................... 5,455 5,171 46,708 Other assets (Note 6) .............................................................................................. 2,809 2,634 23,791
14,243 14,391 129,988 Less: Allowance for bad debts .............................................................................. (97) (69) (623)
Total investments and other assets ........................................................... 14,146 14,322 129,365
Total assets ........................................................................................... ¥136,667 ¥139,875 $1,263,436
See accompanying notes to consolidated financial statements.

13
LIABILITIES AND NET ASSETS Millions of YenThousands of
U.S. Dollars (Note 1)
2020 2021 2021
Current Liabilities:Short-term debt (Notes 9 and 12) ................................................................................... ¥ 19 ¥ 15 $ 135 Trade payables (Notes 12 and 18): Notes .......................................................................................................................... 1,042 861 7,777 Accounts ..................................................................................................................... 2,168 2,788 25,183 Electronically recorded obligations ............................................................................... 3,063 2,838 25,635 Unconsolidated subsidiaries and affiliates .................................................................... 2,584 2,888 26,086
8,857 9,375 84,681 Non-trade accounts payable (Note 12) ............................................................................ 7,371 7,221 65,224 Advances received on uncompleted construction contracts ............................................. 3,518 1,985 17,930 Accrued bonuses to employees ....................................................................................... 3,505 3,358 30,331 Provision for product warranties ...................................................................................... 26 4 36 Provision for warranties for completed construction contracts ......................................... 57 84 759 Income taxes payable (Note 12) ...................................................................................... 2,866 1,571 14,190 Provision for losses on construction contracts .................................................................. 880 1,083 9,782 Other current liabilities .................................................................................................... 2,379 2,217 20,027
Total current liabilities ................................................................................... 29,478 26,913 243,095
Long-term Liabilities:Long-term debt (Notes 9 and 12) .................................................................................... 81 25 226 Long-term accounts payable—other ............................................................................... 334 216 1,951 Liability for retirement benefits (Note 10) ........................................................................ 7,908 7,485 67,609 Directors’ and Audit & Supervisory Board members’ retirement benefits .......................... 171 191 1,725 Provision for product warranties ...................................................................................... 172 233 2,105 Provision for loss on guarantees for construction performance (Note 14) ......................... 203 203 1,834 Other long-term liabilities ................................................................................................ 537 370 3,342 Asset retirement obligations ............................................................................................ 111 117 1,056
Total long-term liabilities ............................................................................... 9,517 8,840 79,848
Total liabilities ............................................................................................... 38,995 35,753 322,943
Contingent liabilities (Note 14)
Net Assets (Note 15)Shareholders’ Equity: Common stock: Authorized: 160,000,000 shares at March 31, 2020 and 2021 Issued: 60,832,771 shares at March 31, 2020 and 2021 .......................................... 13,302 13,302 120,152 Capital surplus ............................................................................................................ 12,869 12,906 116,575 Retained earnings ....................................................................................................... 70,279 75,876 685,358 Less: Treasury stock, at cost 533,659 shares and 533,785 shares at March 31, 2020 and 2021, respectively ......... (280) (281) (2,538)
Total shareholders’ equity .............................................................................. 96,170 101,803 919,547
Accumulated Other Comprehensive Income (Note 16):Unrealized gains on securities, net of taxes .................................................................... 669 1,077 9,728 Foreign currency translation adjustments......................................................................... 304 335 3,026 Accumulated adjustments for retirement benefits, net of taxes (Note 10) ........................ (995) (654) (5,907) Total accumulated other comprehensive income ........................................... (22) 758 6,847
Non-controlling interests............................................................................................. 1,524 1,561 14,099
Total net assets ............................................................................................. 97,672 104,122 940,493
Total liabilities and net assets ......................................................................... ¥136,667 ¥139,875 $1,263,436

14
Millions of YenThousands of
U.S. Dollars (Note 1)
2019 2020 2021 2021
Net Sales (Note 17) .................................................................................... ¥ 106,775 ¥ 117,295 ¥ 107,898 $974,600 Cost of Sales (Notes 11 and 17) ................................................................ 71,927 77,989 72,770 657,303
Gross profit ............................................................................... 34,848 39,306 35,128 317,297 Selling, General and Administrative Expenses (Note 11) ....................... 23,481 24,166 24,074 217,451
Operating income ..................................................................... 11,367 15,140 11,054 99,846 Other Income (Expenses):
Interest income ........................................................................................... 27 22 19 172 Interest expense .......................................................................................... (7) (16) (15) (135)Dividend income ......................................................................................... 58 61 61 551 Subsidy income ........................................................................................... — 45 49 443 Dividend on insurance policies .................................................................... 6 21 24 217 Insurance return .......................................................................................... 102 10 18 163 Rental revenue ............................................................................................ 47 58 59 533 Rental expense ............................................................................................ (25) (26) (25) (226)Equity in earnings of affiliates ..................................................................... 113 119 217 1,960 Foreign exchange gains ............................................................................... 33 6 8 72 Commitment fee ........................................................................................ (7) (7) (45) (406)Gain on sales of investments in securities .................................................... 21 — — —Compensation for damage ......................................................................... (19) (44) — —Gain (loss) on sales/disposals of property, plant and equipment ................... 87 (100) (16) (145)Loss on devaluation of investments in securities .......................................... (237) (61) (368) (3,324)Reversal (provision) for loss on guarantees for construction performance .... (231) 28 — —Others, net ................................................................................................. (51) 31 71 640
(83) 147 57 515 Income before income taxes ..................................................... 11,284 15,287 11,111 100,361
Income Taxes (Note 13):Current ....................................................................................................... 3,811 4,599 3,437 31,045 Deferred ..................................................................................................... (365) 69 (18) (163)
3,446 4,668 3,419 30,882 Net income ............................................................................... 7,838 10,619 7,692 69,479 Net income attributable to non-controlling interests .................. (34) (102) (71) (641) Net income attributable to owners of the parent ....................... ¥ 7,804 ¥ 10,517 ¥ 7,621 $ 68,838
Yen U.S. Dollars (Note 1)
Per Share:Net income ................................................................................................. ¥ 129.42 ¥ 174.41 ¥ 126.38 $ 1.14 Net assets ................................................................................................... 1,457.31 1,594.52 1,700.87 15.36 Cash dividends ............................................................................................ 32.00 33.00 33.00 0.30
Weighted Average Number of Shares Issued (in thousands) ................... 60,299 60,299 60,299 —
See accompanying notes to consolidated financial statements.
Consolidated Statements of IncomeNOHMI BOSAI LTD. and SubsidiariesFor the years ended March 31, 2019, 2020 and 2021
15
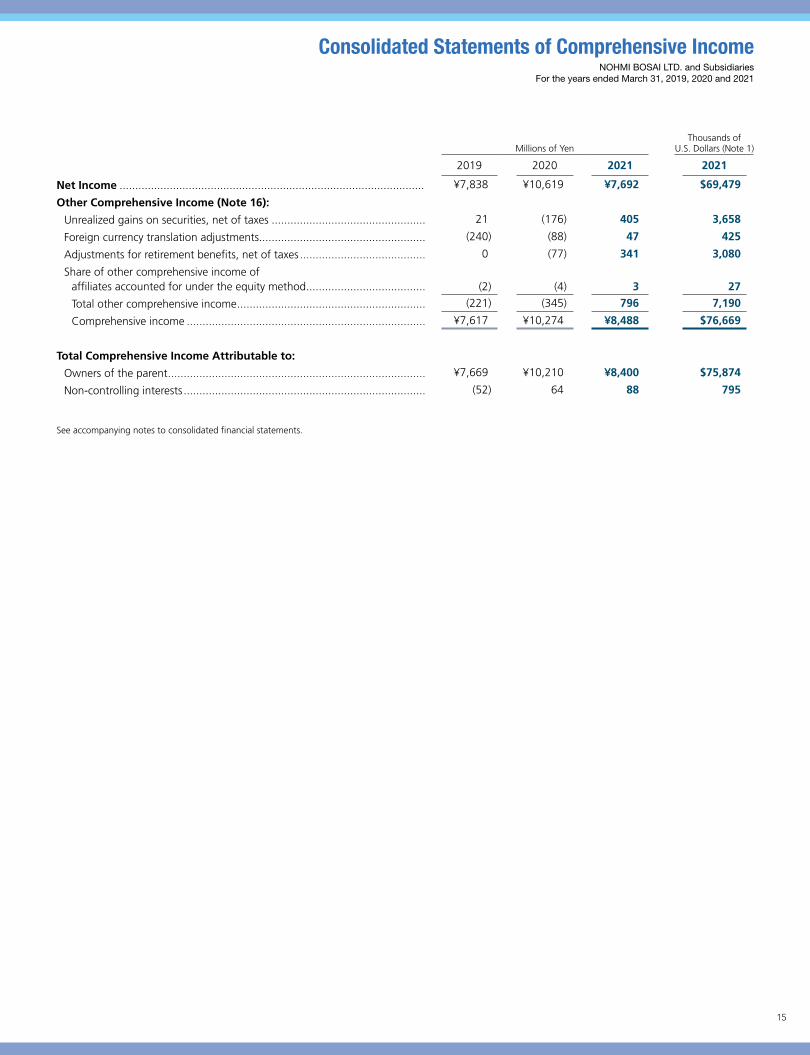
Millions of YenThousands of
U.S. Dollars (Note 1)
2019 2020 2021 2021
Net Income ................................................................................................. ¥7,838 ¥10,619 ¥7,692 $69,479
Other Comprehensive Income (Note 16):
Unrealized gains on securities, net of taxes ................................................. 21 (176) 405 3,658
Foreign currency translation adjustments..................................................... (240) (88) 47 425
Adjustments for retirement benefits, net of taxes ........................................ 0 (77) 341 3,080
Share of other comprehensive income of affiliates accounted for under the equity method ...................................... (2) (4) 3 27
Total other comprehensive income ............................................................ (221) (345) 796 7,190
Comprehensive income ............................................................................ ¥7,617 ¥10,274 ¥8,488 $76,669
Total Comprehensive Income Attributable to:
Owners of the parent .................................................................................. ¥7,669 ¥10,210 ¥8,400 $75,874
Non-controlling interests ............................................................................. (52) 64 88 795
See accompanying notes to consolidated financial statements.
Consolidated Statements of Comprehensive IncomeNOHMI BOSAI LTD. and Subsidiaries
For the years ended March 31, 2019, 2020 and 2021
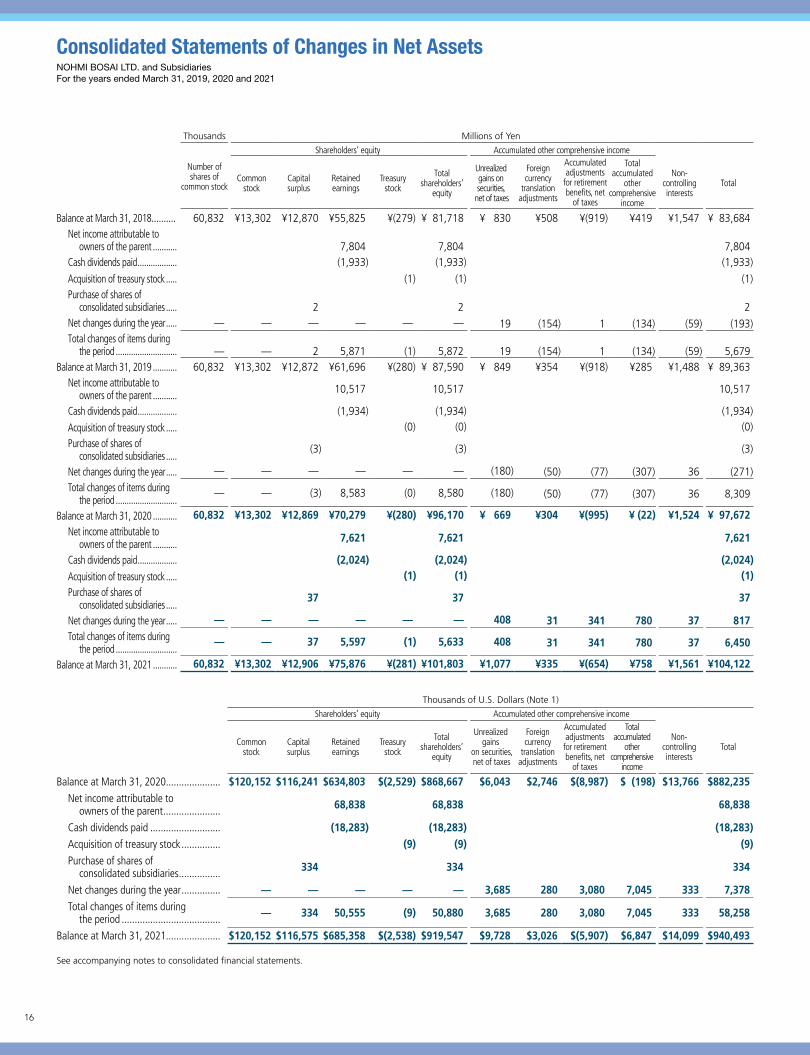
16
Thousands Millions of Yen
Number of shares of
common stock
Shareholders’ equity Accumulated other comprehensive income
Commonstock
Capitalsurplus
Retainedearnings
Treasurystock
Total shareholders’
equity
Unrealizedgains on securities,
net of taxes
Foreigncurrency
translationadjustments
Accumulated adjustments
for retirement benefits, net
of taxes
Total accumulated
other comprehensive
income
Non-controlling interests
Total
Balance at March 31, 2018.......... 60,832 ¥13,302 ¥12,870 ¥55,825 ¥(279) ¥ 81,718 ¥ 830 ¥508 ¥(919) ¥419 ¥1,547 ¥ 83,684 Net income attributable to
owners of the parent ........... 7,804 7,804 7,804Cash dividends paid .................. (1,933) (1,933) (1,933)
Acquisition of treasury stock ..... (1) (1) (1)Purchase of shares of
consolidated subsidiaries ..... 2 2 2Net changes during the year ..... — — — — — — 19 (154) 1 (134) (59) (193) Total changes of items during
the period ............................ — — 2 5,871 (1) 5,872 19 (154) 1 (134) (59) 5,679Balance at March 31, 2019 ........... 60,832 ¥13,302 ¥12,872 ¥61,696 ¥(280) ¥ 87,590 ¥ 849 ¥354 ¥(918) ¥285 ¥1,488 ¥ 89,363
Net income attributable to owners of the parent ........... 10,517 10,517 10,517
Cash dividends paid .................. (1,934) (1,934) (1,934)
Acquisition of treasury stock ..... (0) (0) (0)
Purchase of shares of consolidated subsidiaries .....
(3) (3) (3)
Net changes during the year ..... — — — — — — (180) (50) (77) (307) 36 (271)Total changes of items during
the period ............................— — (3) 8,583 (0) 8,580 (180) (50) (77) (307) 36 8,309
Balance at March 31, 2020 ........... 60,832 ¥13,302 ¥12,869 ¥70,279 ¥(280) ¥96,170 ¥ 669 ¥304 ¥(995) ¥ (22) ¥1,524 ¥ 97,672 Net income attributable to
owners of the parent ........... 7,621 7,621 7,621
Cash dividends paid .................. (2,024) (2,024) (2,024)Acquisition of treasury stock ..... (1) (1) (1)Purchase of shares of
consolidated subsidiaries .....37 37 37
Net changes during the year ..... — — — — — — 408 31 341 780 37 817 Total changes of items during
the period ............................— — 37 5,597 (1) 5,633 408 31 341 780 37 6,450
Balance at March 31, 2021 ........... 60,832 ¥13,302 ¥12,906 ¥75,876 ¥(281) ¥101,803 ¥1,077 ¥335 ¥(654) ¥758 ¥1,561 ¥104,122
Thousands of U.S. Dollars (Note 1)
Shareholders’ equity Accumulated other comprehensive income
Commonstock
Capitalsurplus
Retainedearnings
Treasurystock
Total shareholders’
equity
Unrealizedgains
on securities, net of taxes
Foreigncurrency
translationadjustments
Accumulated adjustments for retirement benefits, net
of taxes
Total accumulated
other comprehensive
income
Non-controllinginterests
Total
Balance at March 31, 2020..................... $120,152 $116,241 $634,803 $(2,529) $868,667 $6,043 $2,746 $(8,987) $ (198) $13,766 $882,235 Net income attributable to
owners of the parent ...................... 68,838 68,838 68,838
Cash dividends paid ........................... (18,283) (18,283) (18,283)Acquisition of treasury stock ............... (9) (9) (9)Purchase of shares of
consolidated subsidiaries ................ 334 334 334
Net changes during the year ............... — — — — — 3,685 280 3,080 7,045 333 7,378 Total changes of items during
the period ...................................... — 334 50,555 (9) 50,880 3,685 280 3,080 7,045 333 58,258
Balance at March 31, 2021..................... $120,152 $116,575 $685,358 $(2,538) $919,547 $9,728 $3,026 $(5,907) $6,847 $14,099 $940,493
See accompanying notes to consolidated financial statements.
Consolidated Statements of Changes in Net AssetsNOHMI BOSAI LTD. and SubsidiariesFor the years ended March 31, 2019, 2020 and 2021
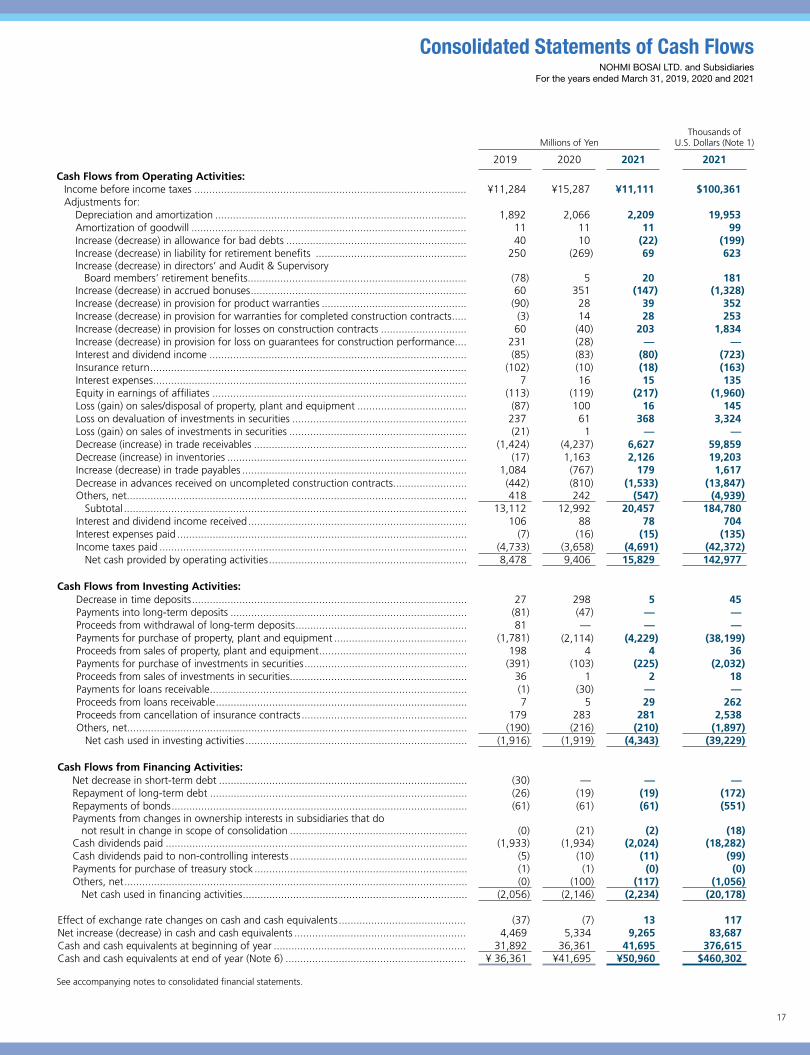
17
Millions of YenThousands of
U.S. Dollars (Note 1)
2019 2020 2021 2021
Cash Flows from Operating Activities:Income before income taxes ............................................................................................ ¥11,284 ¥15,287 ¥11,111 $100,361 Adjustments for: Depreciation and amortization ..................................................................................... 1,892 2,066 2,209 19,953 Amortization of goodwill ............................................................................................. 11 11 11 99 Increase (decrease) in allowance for bad debts ............................................................. 40 10 (22) (199) Increase (decrease) in liability for retirement benefits ................................................... 250 (269) 69 623 Increase (decrease) in directors’ and Audit & Supervisory Board members’ retirement benefits .......................................................................... (78) 5 20 181 Increase (decrease) in accrued bonuses ......................................................................... 60 351 (147) (1,328) Increase (decrease) in provision for product warranties ................................................. (90) 28 39 352 Increase (decrease) in provision for warranties for completed construction contracts ..... (3) 14 28 253 Increase (decrease) in provision for losses on construction contracts ............................. 60 (40) 203 1,834 Increase (decrease) in provision for loss on guarantees for construction performance .... 231 (28) — — Interest and dividend income ....................................................................................... (85) (83) (80) (723) Insurance return ........................................................................................................... (102) (10) (18) (163) Interest expenses .......................................................................................................... 7 16 15 135 Equity in earnings of affiliates ...................................................................................... (113) (119) (217) (1,960) Loss (gain) on sales/disposal of property, plant and equipment ..................................... (87) 100 16 145 Loss on devaluation of investments in securities ........................................................... 237 61 368 3,324 Loss (gain) on sales of investments in securities ............................................................ (21) 1 — — Decrease (increase) in trade receivables ........................................................................ (1,424) (4,237) 6,627 59,859 Decrease (increase) in inventories ................................................................................. (17) 1,163 2,126 19,203 Increase (decrease) in trade payables ............................................................................ 1,084 (767) 179 1,617 Decrease in advances received on uncompleted construction contracts......................... (442) (810) (1,533) (13,847) Others, net................................................................................................................... 418 242 (547) (4,939) Subtotal .................................................................................................................... 13,112 12,992 20,457 184,780 Interest and dividend income received .......................................................................... 106 88 78 704 Interest expenses paid .................................................................................................. (7) (16) (15) (135) Income taxes paid ........................................................................................................ (4,733) (3,658) (4,691) (42,372) Net cash provided by operating activities ................................................................... 8,478 9,406 15,829 142,977
Cash Flows from Investing Activities: Decrease in time deposits ............................................................................................. 27 298 5 45 Payments into long-term deposits ................................................................................ (81) (47) — — Proceeds from withdrawal of long-term deposits .......................................................... 81 — — — Payments for purchase of property, plant and equipment ............................................. (1,781) (2,114) (4,229) (38,199) Proceeds from sales of property, plant and equipment .................................................. 198 4 4 36 Payments for purchase of investments in securities ....................................................... (391) (103) (225) (2,032) Proceeds from sales of investments in securities............................................................ 36 1 2 18 Payments for loans receivable ....................................................................................... (1) (30) — — Proceeds from loans receivable ..................................................................................... 7 5 29 262 Proceeds from cancellation of insurance contracts ........................................................ 179 283 281 2,538 Others, net................................................................................................................... (190) (216) (210) (1,897) Net cash used in investing activities ........................................................................... (1,916) (1,919) (4,343) (39,229)
Cash Flows from Financing Activities: Net decrease in short-term debt .................................................................................... (30) — — — Repayment of long-term debt ....................................................................................... (26) (19) (19) (172) Repayments of bonds .................................................................................................... (61) (61) (61) (551) Payments from changes in ownership interests in subsidiaries that do not result in change in scope of consolidation ............................................................ (0) (21) (2) (18) Cash dividends paid ...................................................................................................... (1,933) (1,934) (2,024) (18,282) Cash dividends paid to non-controlling interests ............................................................ (5) (10) (11) (99) Payments for purchase of treasury stock ........................................................................ (1) (1) (0) (0) Others, net .................................................................................................................... (0) (100) (117) (1,056) Net cash used in financing activities ............................................................................ (2,056) (2,146) (2,234) (20,178)
Effect of exchange rate changes on cash and cash equivalents ........................................... (37) (7) 13 117 Net increase (decrease) in cash and cash equivalents .......................................................... 4,469 5,334 9,265 83,687 Cash and cash equivalents at beginning of year ................................................................. 31,892 36,361 41,695 376,615 Cash and cash equivalents at end of year (Note 6) ............................................................. ¥ 36,361 ¥41,695 ¥50,960 $460,302
See accompanying notes to consolidated financial statements.
Consolidated Statements of Cash FlowsNOHMI BOSAI LTD. and Subsidiaries
For the years ended March 31, 2019, 2020 and 2021
18
1. Basis of Presenting the Consolidated Financial Statements
The accompanying consolidated financial statements of NOHMI BOSAI
LTD. (the “Company”) and its consolidated subsidiaries have been
prepared in accordance with the provisions set forth in the Financial
Instruments and Exchange Law and its related accounting regulations,
and in conformity with accounting principles generally accepted in
Japan (“Japanese GAAP”), which are different in certain respects as to
application and disclosure requirements of International Financial
Reporting Standards.
The accompanying consolidated financial statements have been
restructured and translated into English from the consolidated financial
statements of the Company prepared in accordance with Japanese
GAAP and filed with the appropriate Local Finance Bureau of the
Ministry of Finance as required by the Financial Instruments and
Exchange Law. Certain supplementary information included in the
statutory Japanese language consolidated financial statements, but not
required for fair presentation, is not presented in the accompanying
consolidated financial statements.
The Company has made necessary adjustments in its consolidation
process regarding overseas subsidiaries in accordance with the
“Practical Solution on Unification of Accounting Policies Applied to
Foreign Subsidiaries for Consolidated Financial Statements” (Accounting
Standards Board of Japan (“ASBJ”) Practical Issues Task Force (“PITF”)
No. 18).
The translation of the Japanese yen amounts into U.S. dollars is
included solely for the convenience of readers outside Japan, using the
prevailing exchange rate at March 31, 2021, which is ¥110.71 to US$1.
The convenience translation should not be construed as representation
that the Japanese yen amounts have been, could have been, or could in
the future be, converted into U.S. dollars at this or any other rate of
exchange.
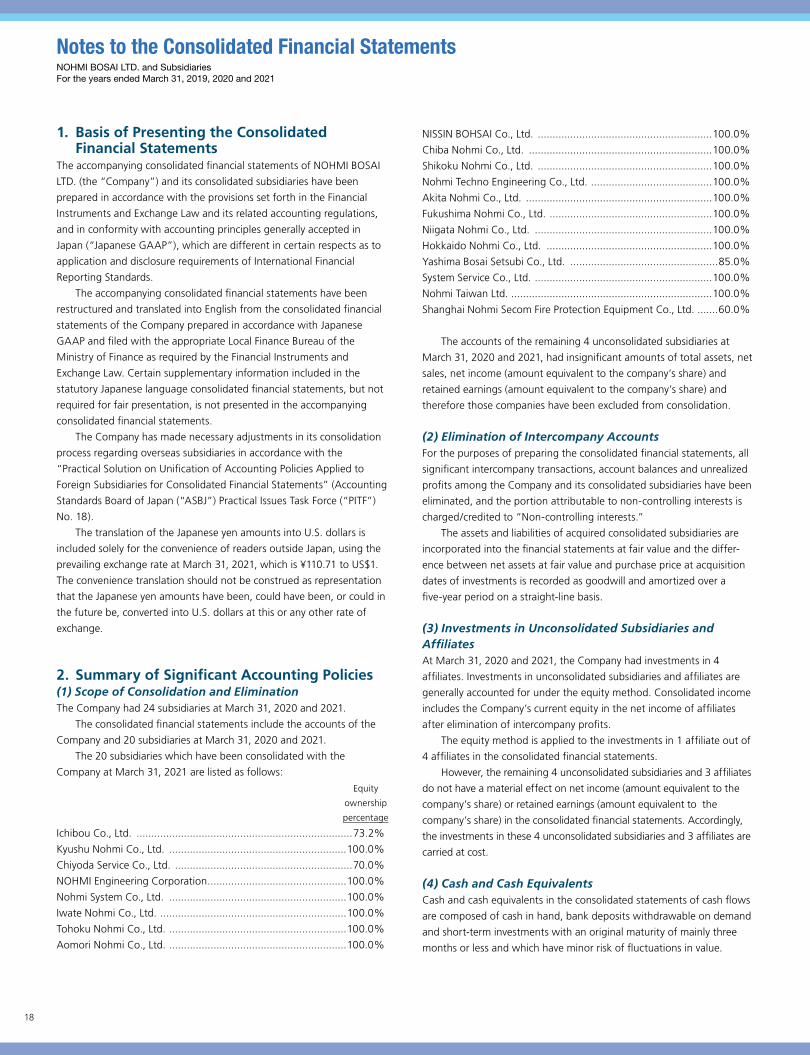
2. Summary of Significant Accounting Policies(1) Scope of Consolidation and EliminationThe Company had 24 subsidiaries at March 31, 2020 and 2021.
The consolidated financial statements include the accounts of the
Company and 20 subsidiaries at March 31, 2020 and 2021.
The 20 subsidiaries which have been consolidated with the
Company at March 31, 2021 are listed as follows:
Equity
ownership
percentage
Ichibou Co., Ltd. .........................................................................73.2%
Kyushu Nohmi Co., Ltd. ............................................................100.0%
Chiyoda Service Co., Ltd. ............................................................70.0%
NOHMI Engineering Corporation ...............................................100.0%
Nohmi System Co., Ltd. ............................................................100.0%
Iwate Nohmi Co., Ltd. ...............................................................100.0%
Tohoku Nohmi Co., Ltd. ............................................................100.0%
Aomori Nohmi Co., Ltd. ............................................................100.0%
NISSIN BOHSAI Co., Ltd. ...........................................................100.0%
Chiba Nohmi Co., Ltd. ..............................................................100.0%
Shikoku Nohmi Co., Ltd. ...........................................................100.0%
Nohmi Techno Engineering Co., Ltd. .........................................100.0%
Akita Nohmi Co., Ltd. ...............................................................100.0%
Fukushima Nohmi Co., Ltd. .......................................................100.0%
Niigata Nohmi Co., Ltd. ............................................................100.0%
Hokkaido Nohmi Co., Ltd. ........................................................100.0%
Yashima Bosai Setsubi Co., Ltd. ..................................................85.0%
System Service Co., Ltd. ............................................................100.0%
Nohmi Taiwan Ltd. ....................................................................100.0%
Shanghai Nohmi Secom Fire Protection Equipment Co., Ltd. .......60.0%
The accounts of the remaining 4 unconsolidated subsidiaries at
March 31, 2020 and 2021, had insignificant amounts of total assets, net
sales, net income (amount equivalent to the company’s share) and
retained earnings (amount equivalent to the company’s share) and
therefore those companies have been excluded from consolidation.
(2) Elimination of Intercompany AccountsFor the purposes of preparing the consolidated financial statements, all
significant intercompany transactions, account balances and unrealized
profits among the Company and its consolidated subsidiaries have been
eliminated, and the portion attributable to non-controlling interests is
charged/credited to “Non-controlling interests.”
The assets and liabilities of acquired consolidated subsidiaries are
incorporated into the financial statements at fair value and the differ-
ence between net assets at fair value and purchase price at acquisition
dates of investments is recorded as goodwill and amortized over a
five-year period on a straight-line basis.
(3) Investments in Unconsolidated Subsidiaries and AffiliatesAt March 31, 2020 and 2021, the Company had investments in 4
affiliates. Investments in unconsolidated subsidiaries and affiliates are
generally accounted for under the equity method. Consolidated income
includes the Company’s current equity in the net income of affiliates
after elimination of intercompany profits.
The equity method is applied to the investments in 1 affiliate out of
4 affiliates in the consolidated financial statements.
However, the remaining 4 unconsolidated subsidiaries and 3 affiliates
do not have a material effect on net income (amount equivalent to the
company’s share) or retained earnings (amount equivalent to the
company’s share) in the consolidated financial statements. Accordingly,
the investments in these 4 unconsolidated subsidiaries and 3 affiliates are
carried at cost.
(4) Cash and Cash EquivalentsCash and cash equivalents in the consolidated statements of cash flows
are composed of cash in hand, bank deposits withdrawable on demand
and short-term investments with an original maturity of mainly three
months or less and which have minor risk of fluctuations in value.
Notes to the Consolidated Financial StatementsNOHMI BOSAI LTD. and Subsidiaries For the years ended March 31, 2019, 2020 and 2021

19
(5) InventoriesInventories are stated at the lower of cost and net realizable value. The
cost is determined by the following methods according to inventory
item:
Products and raw materials…….Weighted-average cost method
Work in progress…….Individually identified cost method
Cost of construction contracts in progress is stated at cost deter-
mined by the individually identified cost method.
(6) SecuritiesIn accordance with Japanese GAAP, securities are classified into four categories as follows:
Trading securities, which are held for the purpose of generating profits on short-term differences in prices, are stated at fair value, with changes in fair value included in net profit or loss for the period in which they arise.
Held-to-maturity debt securities, that the Company and its subsidiaries intend to hold to maturity, are stated at cost after accounting for premium or discount on acquisition, which is amor-tized over the period to maturity.
Investments in equity securities issued by unconsolidated subsidiaries and affiliates are accounted for under the equity method unless they do not have a material effect on net income or retained earnings in the consolidated financial statements in which case they are carried at cost.
Other securities, for which market quotations are available, are stated at fair value. The differences between the book value and market prices of other securities, net of applicable income taxes, are presented in net assets as a component of accumulated other comprehensive income. If fair value is not available, other securities are stated at moving average cost.
(7) Property, Plant and EquipmentProperty, plant and equipment are stated at cost.
Depreciation is computed using the straight-line method over the
estimated useful lives of the assets.
The Company and its subsidiaries assess impairment of each group
of assets, which are grouped on the basis of managerial accounting and
investment decision-making purposes.
(8) Amortization of Intangible AssetsSoftware for internal use is amortized using the straight-line method
over the expected useful lives (5 years).
Other intangible assets are amortized by the straight-line method
over the expected useful lives of the respective assets.
Goodwill is amortized over a five-year period on a straight-line basis.
(9) Allowance for Bad Debts
In accordance with Japanese GAAP, future credit losses on receivables
are estimated by the following classification of receivables:
Receivables from debtors who are not in serious financial difficulty
are called “normal receivables.” The allowance for doubtful accounts
against normal receivables is estimated by applying the historical credit
loss rates, on an appropriate aggregated basis, or on a disaggregated
basis by category of similar receivables.
Receivables from debtors who have not gone into bankruptcy, but
who are or probably would be in serious financial difficulty if they had
to repay debts are called “doubtful receivables.” The allowance for
doubtful accounts against these doubtful receivables is estimated by
first deducting future cash inflows to be generated from foreclosure or
guarantors from the recorded receivable amount, and then considering
the debtor’s financial condition and operating results to determine the
remaining amount.
Receivables from debtors who have either gone into bankruptcy or
are substantially insolvent are called “failed receivables.” The allowance
for doubtful accounts against failed receivables and other similar
receivables is estimated as the recorded receivables amount less cash
inflows from foreclosures or guarantors.
(10) Provision for Product WarrantiesProvision for product warranties has been provided for the cost of
warranties on products sold estimated to be incurred subsequent to
year-end dates. Provision for product warranties is provided based on
past experience.
(11) Provision for Warranties for Completed Construction Contracts Provision for warranties for completed construction contracts has been
provided for the cost of warranties on completed construction contracts
estimated to be incurred subsequent to year-end dates. Provision for
warranties for completed construction contracts is provided based on
past experience.
(12) Provision for Losses on Construction Contracts
Provision for losses on construction contracts is provided at the esti-
mated amount for future losses on construction backlog if those losses
are judged to be probable at the balance sheet date and reasonable
estimation of the amounts of such losses is possible.
(13) Leases Assets leased under non-cancelable finance lease transactions, except
for those that stipulate the transfer of ownership of leased property to
the lessee, are depreciated using the straight-line method, whereby the
depreciation period is the shorter of either the lease term or the useful
life of the asset and the residual value is zero.
(14) Revenue Recognition for Construction ContractsThe percentage-of-completion method is applied to construction
contracts, whose outcomes are deemed certain at the end of the
current fiscal year, and the completed-contract method is applied to
other construction contracts. The percentage of costs incurred to the
estimated total cost is used for estimating the percentage of
completion.
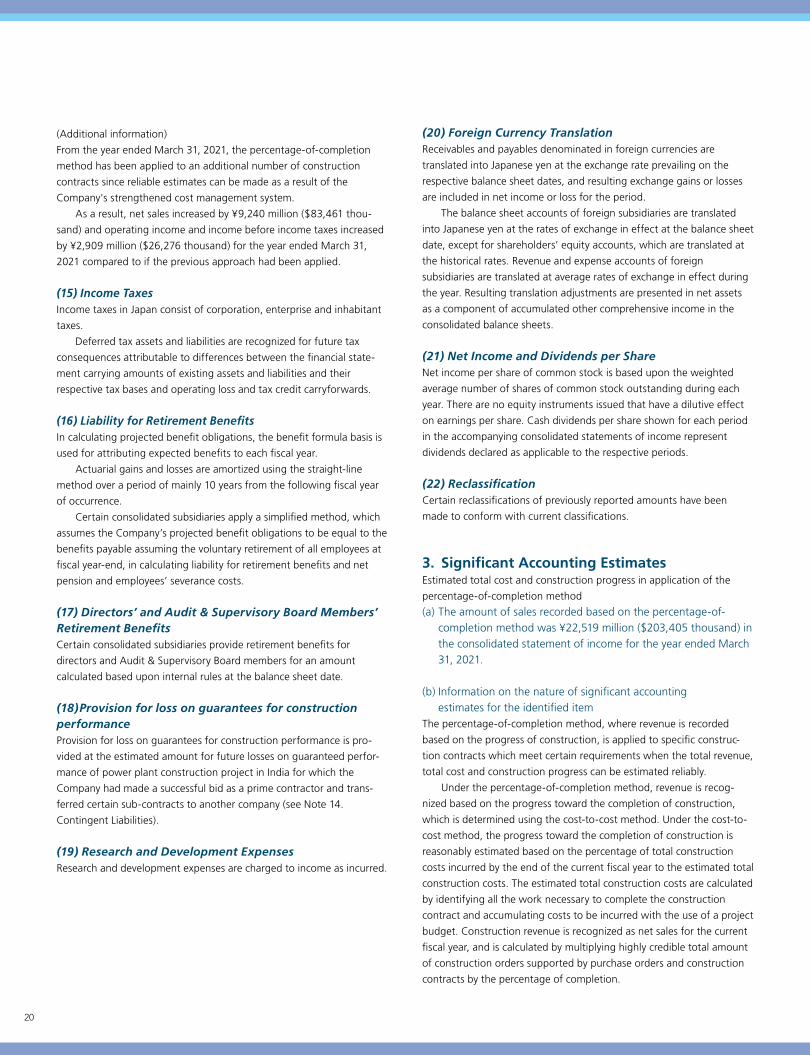
20
(20) Foreign Currency TranslationReceivables and payables denominated in foreign currencies are
translated into Japanese yen at the exchange rate prevailing on the
respective balance sheet dates, and resulting exchange gains or losses
are included in net income or loss for the period.
The balance sheet accounts of foreign subsidiaries are translated
into Japanese yen at the rates of exchange in effect at the balance sheet
date, except for shareholders’ equity accounts, which are translated at
the historical rates. Revenue and expense accounts of foreign
subsidiaries are translated at average rates of exchange in effect during
the year. Resulting translation adjustments are presented in net assets
as a component of accumulated other comprehensive income in the
consolidated balance sheets.
(21) Net Income and Dividends per ShareNet income per share of common stock is based upon the weighted
average number of shares of common stock outstanding during each
year. There are no equity instruments issued that have a dilutive effect
on earnings per share. Cash dividends per share shown for each period
in the accompanying consolidated statements of income represent
dividends declared as applicable to the respective periods.
(22) ReclassificationCertain reclassifications of previously reported amounts have been
made to conform with current classifications.
3. Significant Accounting EstimatesEstimated total cost and construction progress in application of the
percentage-of-completion method
(a) The amount of sales recorded based on the percentage-of- completion method was ¥22,519 million ($203,405 thousand) in the consolidated statement of income for the year ended March 31, 2021.
(b) Information on the nature of significant accounting estimates for the identified item
The percentage-of-completion method, where revenue is recorded
based on the progress of construction, is applied to specific construc-
tion contracts which meet certain requirements when the total revenue,
total cost and construction progress can be estimated reliably.
Under the percentage-of-completion method, revenue is recog-
nized based on the progress toward the completion of construction,
which is determined using the cost-to-cost method. Under the cost-to-
cost method, the progress toward the completion of construction is
reasonably estimated based on the percentage of total construction
costs incurred by the end of the current fiscal year to the estimated total
construction costs. The estimated total construction costs are calculated
by identifying all the work necessary to complete the construction
contract and accumulating costs to be incurred with the use of a project
budget. Construction revenue is recognized as net sales for the current
fiscal year, and is calculated by multiplying highly credible total amount
of construction orders supported by purchase orders and construction
contracts by the percentage of completion.
(Additional information)
From the year ended March 31, 2021, the percentage-of-completion
method has been applied to an additional number of construction
contracts since reliable estimates can be made as a result of the
Company's strengthened cost management system.
As a result, net sales increased by ¥9,240 million ($83,461 thou-
sand) and operating income and income before income taxes increased
by ¥2,909 million ($26,276 thousand) for the year ended March 31,
2021 compared to if the previous approach had been applied.
(15) Income TaxesIncome taxes in Japan consist of corporation, enterprise and inhabitant
taxes.
Deferred tax assets and liabilities are recognized for future tax
consequences attributable to differences between the financial state-
ment carrying amounts of existing assets and liabilities and their
respective tax bases and operating loss and tax credit carryforwards.
(16) Liability for Retirement BenefitsIn calculating projected benefit obligations, the benefit formula basis is
used for attributing expected benefits to each fiscal year.
Actuarial gains and losses are amortized using the straight-line
method over a period of mainly 10 years from the following fiscal year
of occurrence.
Certain consolidated subsidiaries apply a simplified method, which
assumes the Company’s projected benefit obligations to be equal to the
benefits payable assuming the voluntary retirement of all employees at
fiscal year-end, in calculating liability for retirement benefits and net
pension and employees’ severance costs.
(17) Directors’ and Audit & Supervisory Board Members’ Retirement BenefitsCertain consolidated subsidiaries provide retirement benefits for
directors and Audit & Supervisory Board members for an amount
calculated based upon internal rules at the balance sheet date.
(18)Provision for loss on guarantees for construction performanceProvision for loss on guarantees for construction performance is pro-
vided at the estimated amount for future losses on guaranteed perfor-
mance of power plant construction project in India for which the
Company had made a successful bid as a prime contractor and trans-
ferred certain sub-contracts to another company (see Note 14.
Contingent Liabilities).
(19) Research and Development ExpensesResearch and development expenses are charged to income as incurred.
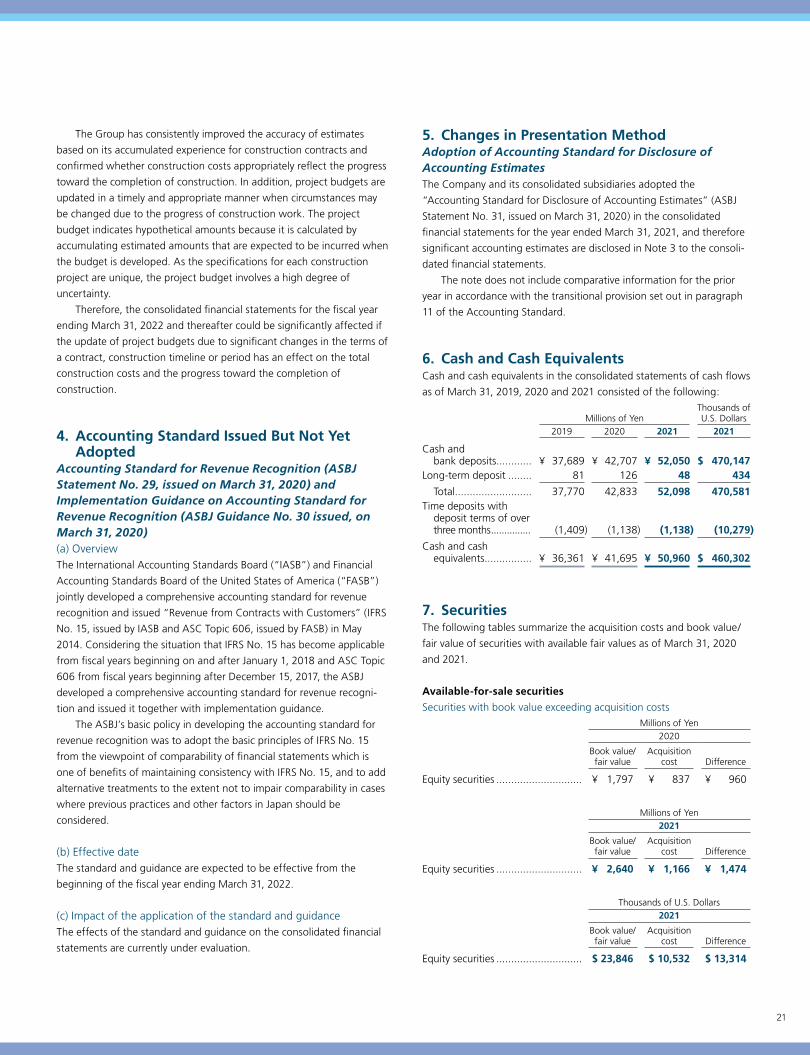
21
The Group has consistently improved the accuracy of estimates
based on its accumulated experience for construction contracts and
confirmed whether construction costs appropriately reflect the progress
toward the completion of construction. In addition, project budgets are
updated in a timely and appropriate manner when circumstances may
be changed due to the progress of construction work. The project
budget indicates hypothetical amounts because it is calculated by
accumulating estimated amounts that are expected to be incurred when
the budget is developed. As the specifications for each construction
project are unique, the project budget involves a high degree of
uncertainty.
Therefore, the consolidated financial statements for the fiscal year
ending March 31, 2022 and thereafter could be significantly affected if
the update of project budgets due to significant changes in the terms of
a contract, construction timeline or period has an effect on the total
construction costs and the progress toward the completion of
construction.
4. Accounting Standard Issued But Not Yet Adopted
Accounting Standard for Revenue Recognition (ASBJ Statement No. 29, issued on March 31, 2020) and Implementation Guidance on Accounting Standard for Revenue Recognition (ASBJ Guidance No. 30 issued, on March 31, 2020)(a) Overview The International Accounting Standards Board (“IASB”) and Financial
Accounting Standards Board of the United States of America (“FASB”)
jointly developed a comprehensive accounting standard for revenue
recognition and issued “Revenue from Contracts with Customers” (IFRS
No. 15, issued by IASB and ASC Topic 606, issued by FASB) in May
2014. Considering the situation that IFRS No. 15 has become applicable
from fiscal years beginning on and after January 1, 2018 and ASC Topic
606 from fiscal years beginning after December 15, 2017, the ASBJ
developed a comprehensive accounting standard for revenue recogni-
tion and issued it together with implementation guidance.
The ASBJ’s basic policy in developing the accounting standard for
revenue recognition was to adopt the basic principles of IFRS No. 15
from the viewpoint of comparability of financial statements which is
one of benefits of maintaining consistency with IFRS No. 15, and to add
alternative treatments to the extent not to impair comparability in cases
where previous practices and other factors in Japan should be
considered.
(b) Effective dateThe standard and guidance are expected to be effective from the
beginning of the fiscal year ending March 31, 2022.
(c) Impact of the application of the standard and guidanceThe effects of the standard and guidance on the consolidated financial
statements are currently under evaluation.
5. Changes in Presentation MethodAdoption of Accounting Standard for Disclosure of Accounting EstimatesThe Company and its consolidated subsidiaries adopted the
“Accounting Standard for Disclosure of Accounting Estimates” (ASBJ
Statement No. 31, issued on March 31, 2020) in the consolidated
financial statements for the year ended March 31, 2021, and therefore
significant accounting estimates are disclosed in Note 3 to the consoli-
dated financial statements.
The note does not include comparative information for the prior
year in accordance with the transitional provision set out in paragraph
11 of the Accounting Standard.
6. Cash and Cash EquivalentsCash and cash equivalents in the consolidated statements of cash flows
as of March 31, 2019, 2020 and 2021 consisted of the following:
Millions of Yen
Thousands of U.S. Dollars
2019 2020 2021 2021
Cash and bank deposits............ ¥ 37,689 ¥ 42,707 ¥ 52,050 $ 470,147Long-term deposit ........ 81 126 48 434
Total.......................... 37,770 42,833 52,098 470,581Time deposits with deposit terms of over three months ............... (1,409) (1,138) (1,138) (10,279)
Cash and cash equivalents................ ¥ 36,361 ¥ 41,695 ¥ 50,960 $ 460,302
7. SecuritiesThe following tables summarize the acquisition costs and book value/
fair value of securities with available fair values as of March 31, 2020
and 2021.
Available-for-sale securities
Securities with book value exceeding acquisition costs
Millions of Yen 2020
Book value/ fair value
Acquisition cost Difference
Equity securities ............................. ¥ 1,797 ¥ 837 ¥ 960
Millions of Yen 2021
Book value/ fair value
Acquisition cost Difference
Equity securities ............................. ¥ 2,640 ¥ 1,166 ¥ 1,474
Thousands of U.S. Dollars 2021
Book value/ fair value
Acquisition cost Difference
Equity securities ............................. $ 23,846 $ 10,532 $ 13,314
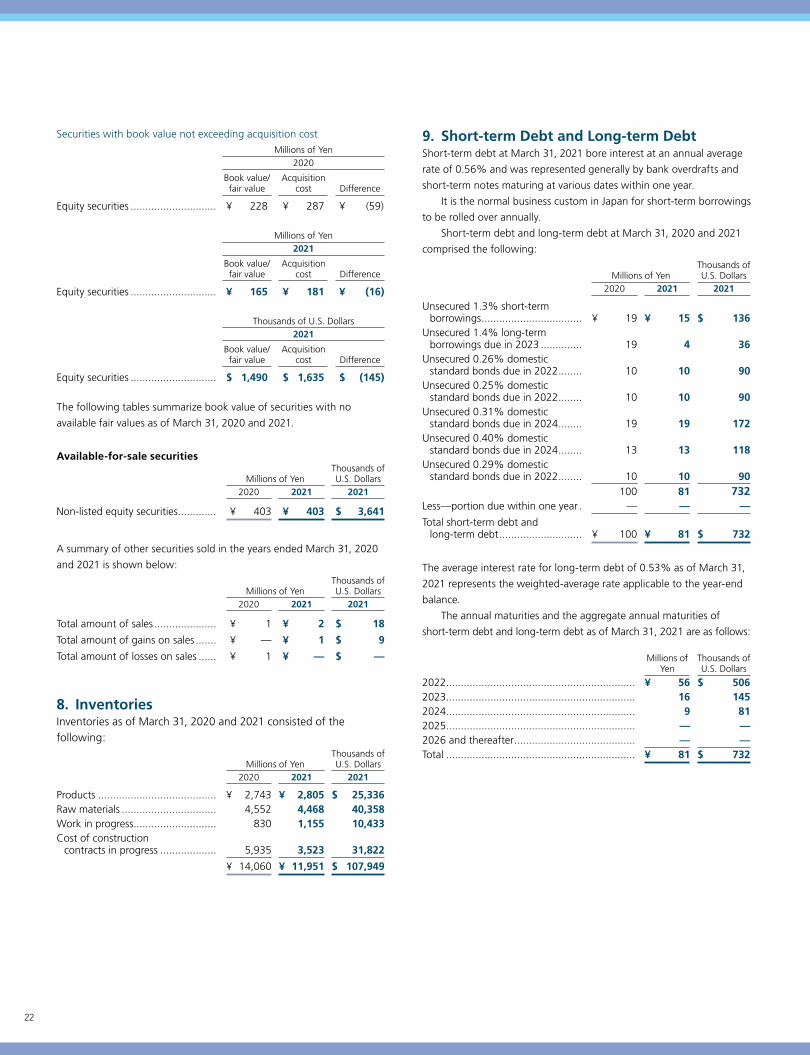
22
Securities with book value not exceeding acquisition cost
Millions of Yen 2020
Book value/ fair value
Acquisition cost Difference
Equity securities ............................. ¥ 228 ¥ 287 ¥ (59)
Millions of Yen 2021
Book value/ fair value
Acquisition cost Difference
Equity securities ............................. ¥ 165 ¥ 181 ¥ (16)
Thousands of U.S. Dollars 2021
Book value/ fair value
Acquisition cost Difference
Equity securities ............................. $ 1,490 $ 1,635 $ (145)
The following tables summarize book value of securities with no
available fair values as of March 31, 2020 and 2021.
Available-for-sale securities
Millions of YenThousands of U.S. Dollars
2020 2021 2021
Non-listed equity securities ............. ¥ 403 ¥ 403 $ 3,641
A summary of other securities sold in the years ended March 31, 2020
and 2021 is shown below:
Millions of Yen
Thousands of U.S. Dollars
2020 2021 2021
Total amount of sales ..................... ¥ 1 ¥ 2 $ 18
Total amount of gains on sales ....... ¥ — ¥ 1 $ 9
Total amount of losses on sales ...... ¥ 1 ¥ — $ —
8. InventoriesInventories as of March 31, 2020 and 2021 consisted of the following:
Millions of Yen
Thousands of U.S. Dollars
2020 2021 2021
Products ........................................ ¥ 2,743 ¥ 2,805 $ 25,336 Raw materials ................................ 4,552 4,468 40,358Work in progress ............................ 830 1,155 10,433Cost of construction
contracts in progress ................... 5,935 3,523 31,822
¥ 14,060 ¥ 11,951 $ 107,949
9. Short-term Debt and Long-term DebtShort-term debt at March 31, 2021 bore interest at an annual average
rate of 0.56% and was represented generally by bank overdrafts and
short-term notes maturing at various dates within one year.
It is the normal business custom in Japan for short-term borrowings
to be rolled over annually.
Short-term debt and long-term debt at March 31, 2020 and 2021
comprised the following:
Millions of Yen
Thousands of U.S. Dollars
2020 2021 2021
Unsecured 1.3% short-term borrowings .................................. ¥ 19 ¥ 15 $ 136
Unsecured 1.4% long-term borrowings due in 2023 .............. 19 4 36
Unsecured 0.26% domestic standard bonds due in 2022 ........ 10 10 90
Unsecured 0.25% domestic standard bonds due in 2022 ........ 10 10 90
Unsecured 0.31% domestic standard bonds due in 2024 ........ 19 19 172
Unsecured 0.40% domestic standard bonds due in 2024 ........ 13 13 118
Unsecured 0.29% domestic standard bonds due in 2022 ........ 10 10 90
100 81 732Less—portion due within one year . — — —
Total short-term debt and long-term debt ............................ ¥ 100 ¥ 81 $ 732
The average interest rate for long-term debt of 0.53% as of March 31,
2021 represents the weighted-average rate applicable to the year-end
balance.
The annual maturities and the aggregate annual maturities of
short-term debt and long-term debt as of March 31, 2021 are as follows:
Millions of
YenThousands of U.S. Dollars
2022................................................................ ¥ 56 $ 5062023................................................................ 16 1452024................................................................ 9 812025................................................................ — —2026 and thereafter ......................................... — —Total ................................................................ ¥ 81 $ 732
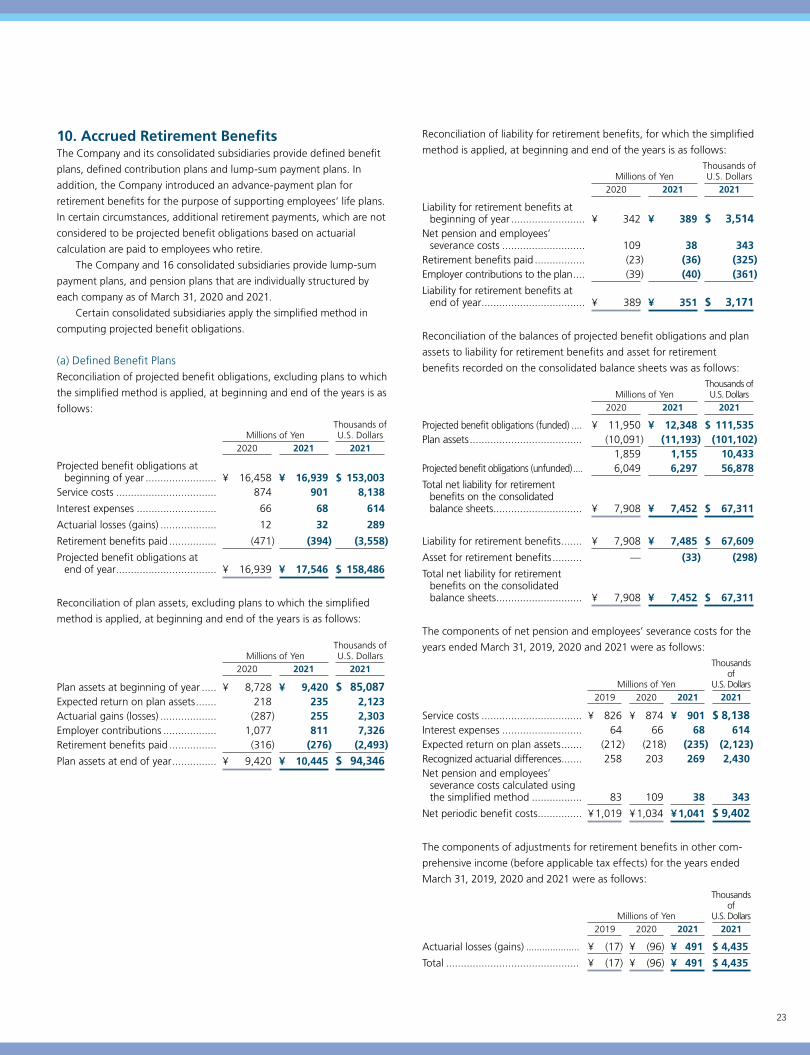
23
10. Accrued Retirement BenefitsThe Company and its consolidated subsidiaries provide defined benefit
plans, defined contribution plans and lump-sum payment plans. In
addition, the Company introduced an advance-payment plan for
retirement benefits for the purpose of supporting employees’ life plans.
In certain circumstances, additional retirement payments, which are not
considered to be projected benefit obligations based on actuarial
calculation are paid to employees who retire.
The Company and 16 consolidated subsidiaries provide lump-sum
payment plans, and pension plans that are individually structured by
each company as of March 31, 2020 and 2021.
Certain consolidated subsidiaries apply the simplified method in
computing projected benefit obligations.
(a) Defined Benefit PlansReconciliation of projected benefit obligations, excluding plans to which
the simplified method is applied, at beginning and end of the years is as
follows:
Millions of Yen
Thousands of U.S. Dollars
2020 2021 2021
Projected benefit obligations at beginning of year ........................ ¥ 16,458 ¥ 16,939 $ 153,003
Service costs .................................. 874 901 8,138
Interest expenses ........................... 66 68 614
Actuarial losses (gains) ................... 12 32 289
Retirement benefits paid ................ (471) (394) (3,558)
Projected benefit obligations at end of year .................................. ¥ 16,939 ¥ 17,546 $ 158,486
Reconciliation of plan assets, excluding plans to which the simplified
method is applied, at beginning and end of the years is as follows:
Millions of Yen
Thousands of U.S. Dollars
2020 2021 2021
Plan assets at beginning of year ..... ¥ 8,728 ¥ 9,420 $ 85,087Expected return on plan assets ....... 218 235 2,123Actuarial gains (losses) ................... (287) 255 2,303Employer contributions .................. 1,077 811 7,326Retirement benefits paid ................ (316) (276) (2,493)
Plan assets at end of year ............... ¥ 9,420 ¥ 10,445 $ 94,346
Reconciliation of liability for retirement benefits, for which the simplified
method is applied, at beginning and end of the years is as follows:
Millions of YenThousands of U.S. Dollars
2020 2021 2021
Liability for retirement benefits at beginning of year ......................... ¥ 342 ¥ 389 $ 3,514
Net pension and employees’ severance costs ............................ 109 38 343
Retirement benefits paid ................. (23) (36) (325)Employer contributions to the plan .... (39) (40) (361)
Liability for retirement benefits at end of year ................................... ¥ 389 ¥ 351 $ 3,171
Reconciliation of the balances of projected benefit obligations and plan
assets to liability for retirement benefits and asset for retirement
benefits recorded on the consolidated balance sheets was as follows:
Millions of YenThousands of U.S. Dollars
2020 2021 2021
Projected benefit obligations (funded) .... ¥ 11,950 ¥ 12,348 $ 111,535Plan assets ...................................... (10,091) (11,193) (101,102)
1,859 1,155 10,433Projected benefit obligations (unfunded) .... 6,049 6,297 56,878
Total net liability for retirement benefits on the consolidated balance sheets.............................. ¥ 7,908 ¥ 7,452 $ 67,311
Liability for retirement benefits ....... ¥ 7,908 ¥ 7,485 $ 67,609
Asset for retirement benefits .......... — (33) (298)
Total net liability for retirement benefits on the consolidated balance sheets ............................. ¥ 7,908 ¥ 7,452 $ 67,311
The components of net pension and employees’ severance costs for the
years ended March 31, 2019, 2020 and 2021 were as follows:
Millions of Yen
Thousands of
U.S. Dollars2019 2020 2021 2021
Service costs .................................. ¥ 826 ¥ 874 ¥ 901 $ 8,138Interest expenses ........................... 64 66 68 614Expected return on plan assets ....... (212) (218) (235) (2,123)Recognized actuarial differences ....... 258 203 269 2,430Net pension and employees’
severance costs calculated using the simplified method ................. 83 109 38 343
Net periodic benefit costs ............... ¥ 1,019 ¥ 1,034 ¥ 1,041 $ 9,402
The components of adjustments for retirement benefits in other com-
prehensive income (before applicable tax effects) for the years ended
March 31, 2019, 2020 and 2021 were as follows:
Millions of Yen
Thousands of
U.S. Dollars2019 2020 2021 2021
Actuarial losses (gains) .................... ¥ (17) ¥ (96) ¥ 491 $ 4,435
Total ............................................. ¥ (17) ¥ (96) ¥ 491 $ 4,435
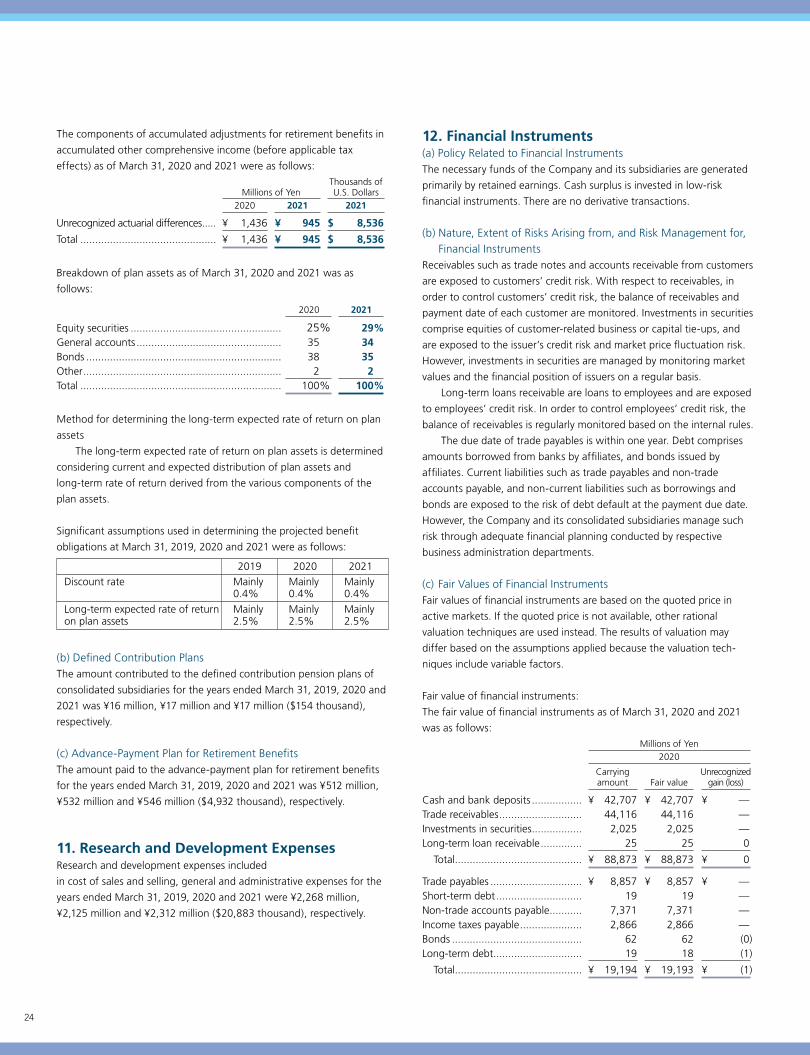
24
The components of accumulated adjustments for retirement benefits in
accumulated other comprehensive income (before applicable tax
effects) as of March 31, 2020 and 2021 were as follows:
Millions of YenThousands of U.S. Dollars
2020 2021 2021
Unrecognized actuarial differences ..... ¥ 1,436 ¥ 945 $ 8,536
Total .............................................. ¥ 1,436 ¥ 945 $ 8,536
Breakdown of plan assets as of March 31, 2020 and 2021 was as
follows:
2020 2021
Equity securities ................................................... 25% 29%General accounts ................................................. 35 34Bonds .................................................................. 38 35Other ................................................................... 2 2Total .................................................................... 100% 100%
Method for determining the long-term expected rate of return on plan
assets
The long-term expected rate of return on plan assets is determined
considering current and expected distribution of plan assets and
long-term rate of return derived from the various components of the
plan assets.
Significant assumptions used in determining the projected benefit
obligations at March 31, 2019, 2020 and 2021 were as follows:
2019 2020 2021Discount rate Mainly
0.4%Mainly 0.4%
Mainly 0.4%
Long-term expected rate of return on plan assets
Mainly 2.5%
Mainly 2.5%
Mainly 2.5%
(b) Defined Contribution PlansThe amount contributed to the defined contribution pension plans of
consolidated subsidiaries for the years ended March 31, 2019, 2020 and
2021 was ¥16 million, ¥17 million and ¥17 million ($154 thousand),
respectively.
(c) Advance-Payment Plan for Retirement BenefitsThe amount paid to the advance-payment plan for retirement benefits
for the years ended March 31, 2019, 2020 and 2021 was ¥512 million,
¥532 million and ¥546 million ($4,932 thousand), respectively.
11. Research and Development ExpensesResearch and development expenses included
in cost of sales and selling, general and administrative expenses for the
years ended March 31, 2019, 2020 and 2021 were ¥2,268 million,
¥2,125 million and ¥2,312 million ($20,883 thousand), respectively.
12. Financial Instruments(a) Policy Related to Financial InstrumentsThe necessary funds of the Company and its subsidiaries are generated
primarily by retained earnings. Cash surplus is invested in low-risk
financial instruments. There are no derivative transactions.
(b) Nature, Extent of Risks Arising from, and Risk Management for, Financial Instruments
Receivables such as trade notes and accounts receivable from customers
are exposed to customers’ credit risk. With respect to receivables, in
order to control customers’ credit risk, the balance of receivables and
payment date of each customer are monitored. Investments in securities
comprise equities of customer-related business or capital tie-ups, and
are exposed to the issuer’s credit risk and market price fluctuation risk.
However, investments in securities are managed by monitoring market
values and the financial position of issuers on a regular basis.
Long-term loans receivable are loans to employees and are exposed
to employees’ credit risk. In order to control employees’ credit risk, the
balance of receivables is regularly monitored based on the internal rules.
The due date of trade payables is within one year. Debt comprises
amounts borrowed from banks by affiliates, and bonds issued by
affiliates. Current liabilities such as trade payables and non-trade
accounts payable, and non-current liabilities such as borrowings and
bonds are exposed to the risk of debt default at the payment due date.
However, the Company and its consolidated subsidiaries manage such
risk through adequate financial planning conducted by respective
business administration departments.
(c) Fair Values of Financial InstrumentsFair values of financial instruments are based on the quoted price in
active markets. If the quoted price is not available, other rational
valuation techniques are used instead. The results of valuation may
differ based on the assumptions applied because the valuation tech-
niques include variable factors.
Fair value of financial instruments:
The fair value of financial instruments as of March 31, 2020 and 2021
was as follows:
Millions of Yen2020
Carrying amount Fair value
Unrecognized gain (loss)
Cash and bank deposits ................. ¥ 42,707 ¥ 42,707 ¥ — Trade receivables ............................ 44,116 44,116 —Investments in securities ................. 2,025 2,025 —Long-term loan receivable .............. 25 25 0
Total........................................... ¥ 88,873 ¥ 88,873 ¥ 0
Trade payables ............................... ¥ 8,857 ¥ 8,857 ¥ —Short-term debt ............................. 19 19 —Non-trade accounts payable ........... 7,371 7,371 —Income taxes payable ..................... 2,866 2,866 —Bonds ............................................ 62 62 (0)Long-term debt .............................. 19 18 (1)
Total........................................... ¥ 19,194 ¥ 19,193 ¥ (1)

25
Millions of Yen2021
Carrying amount Fair value
Unrecognized gain (loss)
Cash and bank deposits ................. ¥ 52,050 ¥ 52,050 ¥ — Trade receivables ............................ 37,534 37,534 —Investments in securities ................. 2,804 2,804 —Long-term loan receivable .............. 3 3 —
Total........................................... ¥ 92,391 ¥ 92,391 ¥ —
Trade payables ............................... ¥ 9,375 ¥ 9,375 ¥ —Short-term debt ............................. 15 15 —Non-trade accounts payable ........... 7,221 7,221 —Income taxes payable ..................... 1,571 1,571 —Bonds ............................................ 21 20 (1)Long-term debt .............................. 4 4 (0)
Total........................................... ¥ 18,207 ¥ 18,206 ¥ (1)
Thousands of U.S. Dollars2021
Carrying amount Fair value
Unrecognized gain (loss)
Cash and bank deposits ................. $ 470,147 $ 470,147 $ — Trade receivables ............................ 339,030 339,030 —Investments in securities ................. 25,328 25,328 —Long-term loan receivable .............. 27 27 —
Total........................................... $ 834,532 $ 834,532 $ —
Trade payables ............................... $ 84,681 $ 84,681 $ —Short-term debt ............................. 135 135 —Non-trade accounts payable ........... 65,224 65,224 —Income taxes payable ..................... 14,190 14,190 —Bonds ............................................ 190 181 (9)Long-term debt .............................. 36 36 (0)
Total........................................... $ 164,456 $ 164,447 $ (9)
1. Calculation methods of fair value of financial instruments:
Cash and bank deposits and trade receivables
The carrying values of cash and bank deposits and trade receivables
approximate fair value because of their short maturities.
Investments in securities
The fair value of investments in securities is measured at the quoted
market price. Information of the fair value for the investments in
securities by classification is included in Note 8.
Long-term loans receivable
Long-term loans receivable are loans to employees. The amount is
immaterial and the fair value is included as the carrying value.
Trade payables, short-term debt, non-trade accounts payable
and income taxes payable
The carrying values of these liabilities approximate fair value because of
their short maturities.
Bonds
The fair value of bonds is determined by discounting the amount of the
total principal and interest at the interest rate assumed when new,
similar bonds are issued.
Long-term debt
The fair value of long-term debt is determined by discounting the
amount of the total principal and interest at the interest rate assumed
when new, similar borrowings are made.
2. Financial instruments whose fair value is deemed extremely difficult
to determine:
The carrying amount of investments in unconsolidated subsidiaries and
affiliates, and other cost method investments that do not have a quoted
market price in an active market as of March 31, 2020 and 2021 were
¥3,929 million and ¥3,779 million ($34,134 thousand), respectively.
These investments do not have any market values and a reasonable
estimation of fair value is not readily determinable. Therefore, they are
excluded from investments in securities in the fair value of financial
instruments above.
3. Maturity analysis for financial assets and securities with contractual
maturities as of March 31, 2021:
Millions of Yen2021
Within 1 year
Over 1 year but within 5 years
Over 5 years but within 10 years
Over 10 years
Cash and bank deposits ............. ¥ 52,050 ¥ — ¥ — ¥ —
Trade receivables ... 37,534 — — —Long-term
loans receivable ... — 3 0 —
Total.................. ¥ 89,584 ¥ 3 ¥ 0 ¥ —
Thousands of U.S. Dollars2021
Within 1 year
Over 1 year but within 5 years
Over 5 years but within 10 years
Over 10 years
Cash and bank deposits ............. $ 470,147 $ — $ — $ —
Trade receivables ... 339,030 — — —Long-term loans
receivable ........... — 27 0 —
Total.................. $ 809,177 $ 27 $ 0 $ —

26
13. Income TaxesAt March 31, 2020 and 2021, significant components of deferred tax assets and liabilities were as follows:
Millions of Yen
Thousands of U.S. Dollars
2020 2021 2021
Deferred tax assets:Liability for retirement benefits ................................................................................................................................ ¥ 2,435 ¥ 2,294 $ 20,721Accrued bonuses .................................................................................................................................................... 1,078 1,032 9,322Directors’ and Audit & Supervisory Board members’ retirement benefits .................................................................. 62 66 596Loss on write-off of fixed assets .............................................................................................................................. 165 165 1,490Accrued legal welfare expenses ............................................................................................................................... 144 150 1,355Accrued enterprise taxes ......................................................................................................................................... 196 145 1,310Allowance for bad debts ......................................................................................................................................... 89 93 840Impairment loss on fixed assets ............................................................................................................................... 110 109 984Devaluation of inventories ....................................................................................................................................... 363 418 3,775Provision for losses on construction contracts .......................................................................................................... 271 333 3,008Provision for product warranties .............................................................................................................................. 61 73 659Loss on valuation of shares of subsidiaries and affiliates .......................................................................................... 215 328 2,963Provision for loss on guarantee for construction performance ................................................................................. 62 62 560Others .................................................................................................................................................................... 982 940 8,491 Subtotal .............................................................................................................................................................. 6,233 6,208 56,074Valuation allowance ................................................................................................................................................ (490) (598) (5,401)
Total.................................................................................................................................................................... ¥ 5,743 ¥ 5,610 $ 50,673
Deferred tax liabilities:Special depreciation of acquired assets .................................................................................................................... ¥ (51) ¥ (51) $ (461)Unrealized gains on securities ................................................................................................................................. (237) (388) (3,504)
Total.................................................................................................................................................................... ¥ (288) ¥ (439) $ (3,965)
Net deferred tax assets ............................................................................................................................................ ¥ 5,455 ¥ 5,171 $ 46,708
Income taxes applicable to the Company and its consolidated domestic subsidiaries consist of corporation, inhabitants’ and enterprise taxes. The
statutory income tax rate of the Company is approximately 30.6% for the year ended March 31, 2019, 2020 and 2021.
Since the differences between the statutory tax rate and effective tax rate for the fiscal years ended March 31, 2020 and 2021 is less than 5% of the
effective tax rate, reconciliations of these two rates are not presented.
14. Contingent LiabilitiesThe Company and its consolidated subsidiaries were contingently liable for borrowings from financial institutions in the amount of ¥29 and ¥30 million
($271 thousand), trade notes endorsed for payment to third parties in the ordinary course of business in the amount of ¥66 million and ¥93 million
($840 thousand) and performance guarantees made for unconsolidated subsidiaries of ¥70 million and ¥60 million ($542 thousand) at March 31, 2020
and 2021, respectively.
The Company made a successful bid as a prime contractor for seven contracts of a power plant construction project from National Thermal Power
Construction (hereinafter, “NTPC”) in India. Among these contracts, local procurement supply contract and construction, and material handling con-
tract were transferred to Unitech Machines Limited (hereinafter, “UML”) and five contracts are in progress.
Based on the terms of the contracts, the Company owes performance obligations to NTPC as a prime contractor, including contracts transferred to
UML. With the financial deterioration of UML, a bank requested reorganization procedures to a court in August 2018 and they were accepted.
There is a possibility that the Company will be obliged to complete the construction because the Company owes performance obligations for the
contracts transferred to UML.
A part of the estimated amount for future losses relating to these contracts is provided as provision for loss on guarantees for construction perfor-
mance. However, currently it is difficult to reasonably estimate the total amount of loss.

27
15. Net AssetsNet assets comprise three subsections, which are shareholders’ equity, accumulated other comprehensive income and non-controlling interests.
Under Japanese laws and regulations, the entire amount paid for new shares is required to be designated as common stock. However, a company
may, by a resolution of the board of directors, designate an amount not exceeding one-half of the price of the new shares as additional paid-in capital
which is included in capital surplus.
In cases where dividend distribution of surplus is made, the lesser of an amount equal to 10% of the dividend or the excess, if any, of 25% of
common stock over the total of additional paid-in capital and legal reserve must be set aside as additional paid-in capital or legal reserve. Legal reserve
is included in retained earnings in the accompanying consolidated balance sheets.
Both appropriations of legal reserve and additional paid-in capital used to eliminate or reduce a deficit generally require a resolution of the share-
holders’ meeting.
Additional paid-in capital and legal reserve may not be distributed as dividends. All additional paid-in capital and legal reserve may be transferred
to other capital surplus and retained earnings, respectively, which are potentially available for dividends.
The maximum amount that the Company can distribute as dividends is calculated based on the non-consolidated financial statements of the
Company in accordance with Japanese laws and regulations.
At the annual shareholders’ meeting held on June 25, 2021, the distribution of cash dividends amounting to ¥997 million ($9,006 thousand) was
approved. Such appropriations have not been accrued in the consolidated financial statements as of March 31, 2021 since they are recognized in the
period in which they are resolved at the annual shareholders’ meeting.
a) Dividends paid during the year ended March 31, 2021The following was approved by the annual shareholders’ meeting held on June 25, 2020:
(a) Total dividends ......................................................................................................................................................... ¥1,027 million ($9,276 thousand)
(b) Cash dividends per common share ........................................................................................................................... ¥17.00 ($0.15)
(c) Record date .............................................................................................................................................................. March 31, 2020
(d) Effective date ........................................................................................................................................................... June 26, 2020
The following was approved by the Board of Directors on November 6, 2020:
(a) Total dividends ......................................................................................................................................................... ¥997 million ($9,006 thousand)
(b) Cash dividends per common share ........................................................................................................................... ¥16.50 ($0.15)
(c) Record date .............................................................................................................................................................. September 30, 2020
(d) Effective date ........................................................................................................................................................... December 4, 2020
b) Dividends to be paid after March 31, 2021 but the record date for the payment belongs to the year ended March 31, 2021The following was approved by the annual shareholders’ meeting held on June 25, 2021:
(a) Total dividends ......................................................................................................................................................... ¥997 million ($9,006 thousand)
(b) Cash dividends per common share ........................................................................................................................... ¥16.50 ($0.15)
(c) Record date .............................................................................................................................................................. March 31, 2021
(d) Effective date ........................................................................................................................................................... June 28, 2021
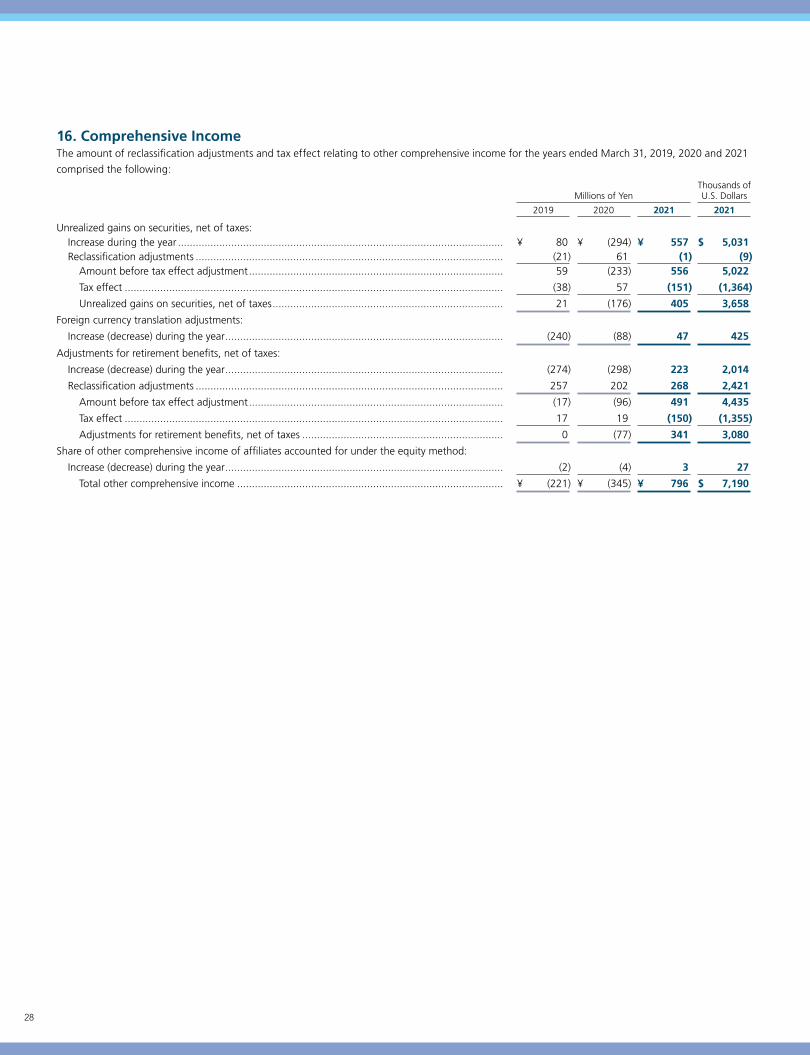
28
16. Comprehensive IncomeThe amount of reclassification adjustments and tax effect relating to other comprehensive income for the years ended March 31, 2019, 2020 and 2021
comprised the following:
Millions of YenThousands of U.S. Dollars
2019 2020 2021 2021
Unrealized gains on securities, net of taxes: Increase during the year .............................................................................................................. ¥ 80 ¥ (294) ¥ 557 $ 5,031 Reclassification adjustments ........................................................................................................ (21) 61 (1) (9) Amount before tax effect adjustment ...................................................................................... 59 (233) 556 5,022
Tax effect ................................................................................................................................ (38) 57 (151) (1,364)
Unrealized gains on securities, net of taxes .............................................................................. 21 (176) 405 3,658
Foreign currency translation adjustments:
Increase (decrease) during the year .............................................................................................. (240) (88) 47 425
Adjustments for retirement benefits, net of taxes:
Increase (decrease) during the year .............................................................................................. (274) (298) 223 2,014
Reclassification adjustments ........................................................................................................ 257 202 268 2,421
Amount before tax effect adjustment ...................................................................................... (17) (96) 491 4,435
Tax effect ................................................................................................................................ 17 19 (150) (1,355)
Adjustments for retirement benefits, net of taxes .................................................................... 0 (77) 341 3,080
Share of other comprehensive income of affiliates accounted for under the equity method:
Increase (decrease) during the year .............................................................................................. (2) (4) 3 27
Total other comprehensive income .......................................................................................... ¥ (221) ¥ (345) ¥ 796 $ 7,190

29
17. Segment Information(a) Summary of reportable segmentsThe reportable segments of the Company are segments, based on the Company’s components, for which separate financial information is available
which is regularly reviewed by the Board of Directors for determining resource allocation and performance evaluation.
The Company and its consolidated subsidiaries are mainly involved in fire prevention business and have three reportable segments: “Fire Alarm
Systems,” “Fire Extinguishing Systems” and “Maintenance Services.”
“Fire Alarm Systems” produces, sells and installs automatic fire alarm systems, environmental monitoring systems, hinged fire doors, smoke control
systems and other products.
“Fire Extinguishing Systems” produces, sells and installs a variety of sprinkler systems, foam systems and fire protection equipment for industrial
plants, road tunnels and other products.
“Maintenance Services” provides maintenance services and inspection services for a wide range of fire protection systems.
(b) Method of measurement for the amount of net sales, income, assets, liabilities and other items for each reportable segmentAccounting policies of each reportable segment are basically consistent with those described in Note 2 “Summary of Significant Accounting Policies.”
Inter-segment sales and transfers are determined by the current market price.
(c) Information about net sales, income, assets, liabilities and other items of reportable segments
Millions of Yen2019
Reportable segments
Fire alarm systems
Fire extinguishing
systemsMaintenance
services SubtotalOthers
(Note 1) TotalAdjustments
(Note 2)Consolidated
(Note 3)
Net sales:
Outside customers ........................ ¥ 38,298 ¥ 37,041 ¥ 25,830 ¥ 101,169 ¥ 5,606 ¥ 106,775 ¥ — ¥ 106,775
Inter-segment................................ 81 77 1 159 203 362 (362) —
Total ................................................. 38,379 37,118 25,831 101,328 5,809 107,137 (362) 106,775
Segment income ............................... ¥ 6,912 ¥ 5,349 ¥ 5,488 ¥ 17,749 ¥ 319 ¥ 18,068 ¥ (6,701) ¥ 11,367
Segment assets ................................. ¥ 41,148 ¥ 34,626 ¥ 12,650 ¥ 88,424 ¥ 4,063 ¥ 92,487 ¥ 36,141 ¥ 128,628
Other:
Depreciation ................................. ¥ 751 ¥ 183 ¥ 117 ¥ 1,051 ¥ 155 ¥ 1,206 ¥ 655 ¥ 1,861
Amortization of goodwill .............. ¥ 11 ¥ — ¥ — ¥ 11 ¥ — ¥ 11 ¥ — ¥ 11
Affiliates accounted for under the equity method........... ¥ — ¥ 2,406 ¥ — ¥ 2,406 ¥ — ¥ 2,406 ¥ — ¥ 2,406
Increase in property, plant and equipment and intangible assets .. ¥ 1,007 ¥ 202 ¥ 181 ¥ 1,390 ¥ 152 ¥ 1,542 ¥ 228 ¥ 1,770
Note 1: “Others” represents businesses such as car parking control systems, which are not included in the above reportable segments.Note 2:(1) ¥(6,701) million included in “Adjustments” for “Segment income” is for total corporate expenses. Corporate expenses are mainly general and administrative
expenses and research and development expenses, which cannot be allocated to each reportable segment. (2) ¥36,141 million included in “Adjustments” for “Segment assets” is for corporate assets. Corporate assets mainly consist of surplus operating funds such as cash,
bank deposits, long-term investment funds such as investments in securities, and assets for administrative and R&D departments, which cannot be allocated to each reportable segment.
(3) ¥655 million included in “Adjustments” for “Depreciation” is depreciation for corporate assets. (4) ¥228 million included in “Adjustments” for “Increase in property, plant and equipment and intangible assets” is the increase in corporate assets.Note 3: Segment income reconciles to operating income disclosed in the accompanying consolidated statements of income.

30
Millions of Yen2020
Reportable segments
Fire alarm systems
Fire extinguishing
systemsMaintenance
services SubtotalOthers
(Note 1) TotalAdjustments
(Note 2)Consolidated
(Note 3)
Net sales:
Outside customers ........................ ¥ 41,016 ¥ 42,726 ¥ 27,482 ¥ 111,224 ¥ 6,071 ¥ 117,295 ¥ — ¥ 117,295
Inter-segment................................ 93 79 1 173 201 374 (374) —
Total ................................................. 41,109 42,805 27,483 111,397 6,272 117,669 (374) 117,295
Segment income ............................... ¥ 7,672 ¥ 7,984 ¥ 6,162 ¥ 21,818 ¥ 490 ¥ 22,308 ¥ (7,168) ¥ 15,140
Segment assets ................................. ¥ 41,859 ¥ 35,547 ¥ 13,165 ¥ 90,571 ¥ 4,515 ¥ 95,086 ¥ 41,581 ¥ 136,667
Other:
Depreciation ................................. ¥ 854 ¥ 201 ¥ 128 ¥ 1,183 ¥ 170 ¥ 1,353 ¥ 678 ¥ 2,031
Amortization of goodwill .............. ¥ 11 ¥ — ¥ — ¥ 11 ¥ — ¥ 11 ¥ — ¥ 11
Affiliates accounted for under the equity method........... ¥ — ¥ 2,518 ¥ — ¥ 2,518 ¥ — ¥ 2,518 ¥ — ¥ 2,518
Increase in property, plant and equipment and intangible assets .. ¥ 1,161 ¥ 287 ¥ 165 ¥ 1,613 ¥ 63 ¥ 1,676 ¥ 421 ¥ 2,097
Note 1: “Others” represents businesses such as car parking control systems, which are not included in the above reportable segments.Note 2: (1) ¥(7,168) million included in “Adjustments” for “Segment income” is for total corporate expenses. Corporate expenses are mainly general and administrative
expenses and research and development expenses, which cannot be allocated to each reportable segment. (2) ¥41,581 million included in “Adjustments” for “Segment assets” is for corporate assets. Corporate assets mainly consist of surplus operating funds such as cash,
bank deposits, long-term investment funds such as investments in securities, and assets for administrative and R&D departments, which cannot be allocated to each reportable segment.
(3) ¥678 million included in “Adjustments” for “Depreciation” is depreciation for corporate assets. (4) ¥421 million included in “Adjustments” for “Increase in property, plant and equipment and intangible assets” is the increase in corporate assets.Note 3: Segment income reconciles to operating income disclosed in the accompanying consolidated statements of income.

31
Millions of Yen2021
Reportable segments
Fire alarm systems
Fire extinguishing
systemsMaintenance
services SubtotalOthers
(Note 1) TotalAdjustments
(Note 2)Consolidated
(Note 3)
Net sales:
Outside customers ........................ ¥ 37,952 ¥ 38,416 ¥ 26,687 ¥ 103,055 ¥ 4,843 ¥ 107,898 ¥ — ¥ 107,898 Inter-segment................................ 88 66 1 155 195 350 (350) —Total ................................................. 38,040 38,482 26,688 103,210 5,038 108,248 (350) 107,898Segment income ............................... ¥ 5,979 ¥ 6,568 ¥ 5,393 ¥ 17,940 ¥ 254 ¥ 18,194 ¥ (7,140) ¥ 11,054Segment assets ................................. ¥ 47,760 ¥ 32,818 ¥ 13,436 ¥ 94,014 ¥ 3,938 ¥ 97,952 ¥ 41,923 ¥ 139,875Other:
Depreciation ................................. ¥ 920 ¥ 223 ¥ 143 ¥ 1,286 ¥ 137 ¥ 1,423 ¥ 749 ¥ 2,172 Amortization of goodwill .............. ¥ 11 ¥ — ¥ — ¥ 11 ¥ — ¥ 11 ¥ — ¥ 11 Affiliates accounted for under the equity method........... ¥ — ¥ 2,735 ¥ — ¥ 2,735 ¥ — ¥ 2,735 ¥ — ¥ 2,735 Increase in property, plant and equipment and intangible assets .. ¥ 2,602 ¥ 542 ¥ 474 ¥ 3,618 ¥ 68 ¥ 3,686 ¥ 820 ¥ 4,506
Thousands of U.S. Dollars2021
Reportable segments
Fire alarm systems
Fire extinguishing
systemsMaintenance
services SubtotalOthers
(Note 1) TotalAdjustments
(Note 2)Consolidated
(Note 3)
Net sales:
Outside customers ........................ $ 342,805 $ 346,997 $ 241,053 $ 930,855 $ 43,745 $ 974,600 $ — $ 974,600 Inter-segment................................ 795 596 9 1,400 1,761 3,161 (3,161) —Total ................................................. 343,600 347,593 241,062 932,255 45,506 977,761 (3,161) 974,600Segment income ............................... $ 54,006 $ 59,326 $ 48,713 $ 162,045 $ 2,294 $ 164,339 $ (64,493) $ 99,846Segment assets ................................. $ 431,397 $ 296,432 $ 121,362 $ 849,191 $ 35,571 $ 884,762 $ 378,674 $ 1,263,436Other:
Depreciation ................................. $ 8,310 $ 2,014 $ 1,292 $ 11,616 $ 1,237 $ 12,853 $ 6,766 $ 19,619 Amortization of goodwill .............. $ 99 $ — $ — $ 99 $ — $ 99 $ — $ 99 Affiliates accounted for under the equity method........... $ — $ 24,704 $ — $ 24,704 $ — $ 24,704 $ — $ 24,704 Increase in property, plant and equipment and intangible assets .. $ 23,503 $ 4,896 $ 4,281 $ 32,680 $ 614 $ 33,294 $ 7,407 $ 40,701
Note 1: “Others” represents businesses such as car parking control systems, which are not included in the above reportable segments.Note 2: (1) ¥(7,140) million ($(64,493) thousand) included in “Adjustments” for “Segment income” is for total corporate expenses. Corporate expenses are mainly general
and administrative expenses and research and development expenses, which cannot be allocated to each reportable segment. (2) ¥41,923 million ($378,674 thousand) included in “Adjustments” for “Segment assets” is for corporate assets. Corporate assets mainly consist of surplus
operating funds such as cash, bank deposits, long-term investment funds such as investments in securities, and assets for administrative and R&D departments, which cannot be allocated to each reportable segment.
(3) ¥749 million ($6,766 thousand) included in “Adjustments” for “Depreciation” is depreciation for corporate assets. (4) ¥820 million ($7,407 thousand) included in “Adjustments” for “Increase in property, plant and equipment and intangible assets” is the increase in corporate
assets.Note 3: Segment income reconciles to operating income disclosed in the accompanying consolidated statements of income.

32
Related information(1) Information about products and services
Information about products and services has been omitted since the classification by products and services is the same as the reportable segments.
(2) Information about geographical areas
(a) Sales
Information about sales by geographical areas has been omitted since sales to outside customers in Japan constituted more than 90% of net sales on
the consolidated statements of income.
(b) Property, plant and equipment
Information about property, plant and equipment has been omitted since property, plant and equipment in Japan constituted more than 90% of
property, plant and equipment on the consolidated balance sheets.
(3) Information about major customers
Information about major customers has been omitted since there are no outside customers who constituted more than 10% of net sales on the consoli-
dated statements of income.
(4) Amortization and unamortized balances of goodwill by reportable segment as of and for the years ended March 31, 2019, 2020 and 2021 were as
follows:
Millions of Yen2019
Reportable segments
Fire alarm systems
Fire extinguishing
systemsMaintenance
services Subtotal Others Total Adjustments Consolidated
Amortization during the year ............ ¥ 11 ¥ — ¥ — ¥ 11 ¥ — ¥ 11 ¥ — ¥ 11
Unamortized balance ........................ ¥ 43 ¥ — ¥ — ¥ 43 ¥ — ¥ 43 ¥ — ¥ 43
Millions of Yen2020
Reportable segments
Fire alarm systems
Fire extinguishing
systemsMaintenance
services Subtotal Others Total Adjustments Consolidated
Amortization during the year ............ ¥ 11 ¥ — ¥ — ¥ 11 ¥ — ¥ 11 ¥ — ¥ 11
Unamortized balance ........................ ¥ 32 ¥ — ¥ — ¥ 32 ¥ — ¥ 32 ¥ — ¥ 32
Millions of Yen2021
Reportable segments
Fire alarm systems
Fire extinguishing
systemsMaintenance
services Subtotal Others Total Adjustments Consolidated
Amortization during the year ............ ¥ 11 ¥ — ¥ — ¥ 11 ¥ — ¥ 11 ¥ — ¥ 11Unamortized balance ........................ ¥ 20 ¥ — ¥ — ¥ 20 ¥ — ¥ 20 ¥ — ¥ 20
Thousands of U.S. Dollars2021
Reportable segments
Fire alarm systems
Fire extinguishing
systemsMaintenance
services Subtotal Others Total Adjustments Consolidated
Amortization during the year ............ $ 99 $ — $ — $ 99 $ — $ 99 $ — $ 99Unamortized balance ........................ $ 181 $ — $ — $ 181 $ — $ 181 $ — $ 181
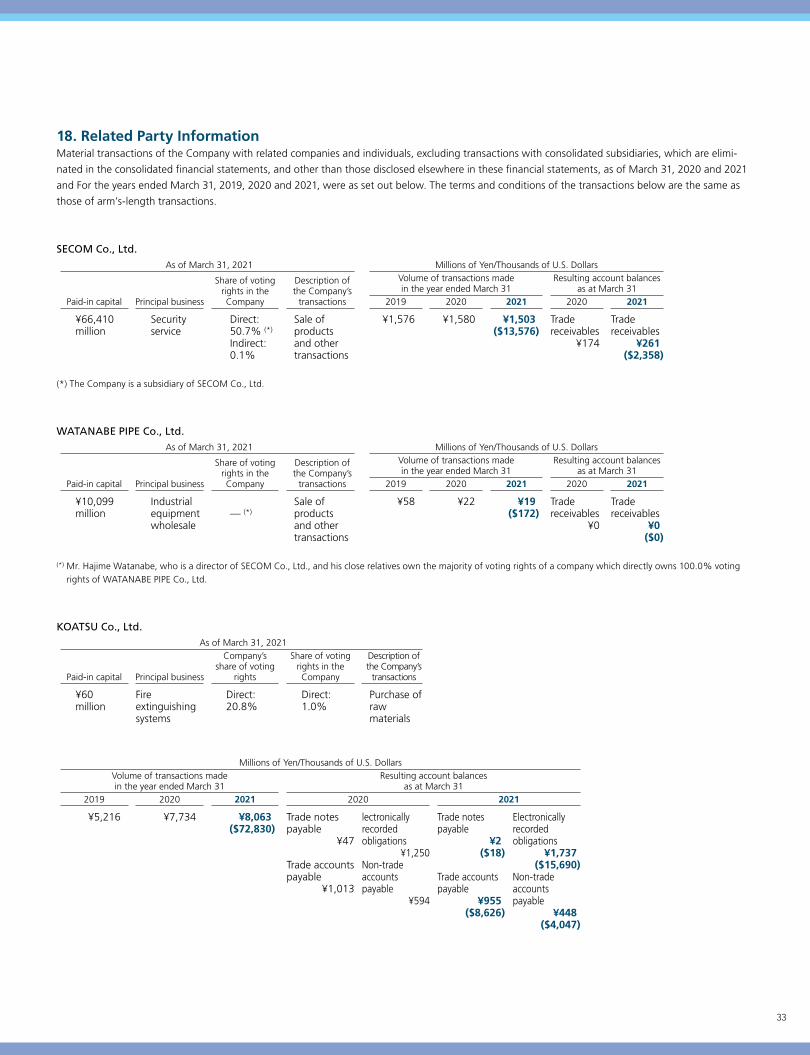
33
18. Related Party InformationMaterial transactions of the Company with related companies and individuals, excluding transactions with consolidated subsidiaries, which are elimi-
nated in the consolidated financial statements, and other than those disclosed elsewhere in these financial statements, as of March 31, 2020 and 2021
and For the years ended March 31, 2019, 2020 and 2021, were as set out below. The terms and conditions of the transactions below are the same as
those of arm’s-length transactions.
SECOM Co., Ltd.As of March 31, 2021 Millions of Yen/Thousands of U.S. Dollars
Paid-in capital Principal business
Share of voting rights in the Company
Description of the Company’s
transactions
Volume of transactions made in the year ended March 31
Resulting account balances as at March 31
2019 2020 2021 2020 2021
¥66,410 million
Security service
Direct: 50.7% (*)
Indirect: 0.1%
Sale of products and other transactions
¥1,576 ¥1,580 ¥1,503($13,576)
Trade receivables
¥174
Trade receivables
¥261($2,358)
(*) The Company is a subsidiary of SECOM Co., Ltd.
WATANABE PIPE Co., Ltd.As of March 31, 2021 Millions of Yen/Thousands of U.S. Dollars
Paid-in capital Principal business
Share of voting rights in the Company
Description of the Company’s
transactions
Volume of transactions made in the year ended March 31
Resulting account balances as at March 31
2019 2020 2021 2020 2021
¥10,099 million
Industrial equipment wholesale
— (*)Sale ofproductsand othertransactions
¥58 ¥22 ¥19($172)
Trade receivables
¥0
Trade receivables
¥0($0)
(*) Mr. Hajime Watanabe, who is a director of SECOM Co., Ltd., and his close relatives own the majority of voting rights of a company which directly owns 100.0% voting rights of WATANABE PIPE Co., Ltd.
KOATSU Co., Ltd.As of March 31, 2021
Paid-in capital Principal business
Company’s share of voting
rights
Share of voting rights in the Company
Description of the Company’s
transactions
¥60 million
Fire extinguishing systems
Direct: 20.8%
Direct: 1.0%
Purchase of raw materials
Millions of Yen/Thousands of U.S. DollarsVolume of transactions made in the year ended March 31
Resulting account balances as at March 31
2019 2020 2021 2020 2021
¥5,216 ¥7,734 ¥8,063($72,830)
Trade notes payable
¥47
Trade accounts payable
¥1,013
lectronicallyrecorded obligations
¥1,250 Non-trade accounts payable
¥594
Trade notes payable
¥2 ($18)
Trade accounts payable
¥955($8,626)
Electronicallyrecorded obligations
¥1,737($15,690)
Non-trade accounts payable
¥448 ($4,047)

Independent Auditor’s Report
To the Board of Directors of NOHMI BOSAI LTD.:
Opinion
We have audited the accompanying consolidated financial statements of NOHMI BOSAI LTD. (“the Company”) and its consolidated subsidiaries (collectively referred to as “the Group”), which comprise the consolidated balance sheets as at March 31, 2021 and 2020, the consolidated statements of income and comprehensive income, changes in net assets and cash flows for each of the years in the three-year period ended March 31,2021, and notes, comprising a summary of significant accounting policies and other explanatory information.
In our opinion, the accompanying consolidated financial statements present fairly, in all material respects, the consolidated financial position of the Group as at March 31, 2021 and 2020, and its consolidated financial performance and its consolidated cash flows for each of the years in the three-year period ended March 31, 2021 in accordance with accounting principles generally accepted in Japan.
Basis for Opinion
We conducted our audit in accordance with auditing standards generally accepted in Japan. Our responsibilities under those standards are further described in the Auditor’s Responsibilities for the Audit of the Consolidated Financial Statements section of our report. We are independent of the Group in accordance with the ethical requirements that are relevant to our audit of the consolidated financial statements in Japan, and we have fulfilled our other ethical responsibilities in accordance with these requirements. We believe that the audit evidence we have obtained is sufficient and appropriate to provide a basis for our opinion.
Key Audit Matter
Key audit matter is a matter that, in our professional judgment, was of most significance in our audit of the consolidated financial statements of the current period. This matter was addressed in the context of our audit of the consolidated financial statements as a whole, and in forming our opinion thereon, and we do not provide a separate opinion on this matter.
Reasonableness of the Company’s estimates of total construction costs and the progress toward completion of construction in applying the percentage-of-completion method
The key audit matter How the matter was addressed in our audit
As described in Note 3, “Significant Accounting Estimates” to the consolidated financial statements, NOHMI BOSAI LTD. and one of its consolidated subsidiaries applied the percentage-of-completion method of revenue recognition to the construction contracts. The construction revenue recognized using the percentage-of-completion method amounted to ¥22,519 million for the current fiscal year, representing approximately 20.8% of total revenue of ¥107,897 million in the consolidated financial statements.
The percentage-of-completion method is applied to construction contracts for which the realization of the completed portion is assured. In applying the percentage-of-completion method, it is necessary to reasonably estimate total construction revenue and costs, and the progress toward completion of construction at the end of the fiscal year.
The specifications of construction projects differ among individual properties. Therefore, the preparation of a project budget, which provided the basis for estimating total construction costs and the progress toward completion of construction, involved a high degree of uncertainty. Specifically, since the cost-to-cost method was used to estimate the progress toward completion of construction, management’s determination of the following aspects of construction had a significant effect on the estimated total construction costs and the estimated progress toward completion of construction at the end of the fiscal year:• whether all the work necessary to complete the construction contract was
identified and the estimated costs were included in the project budget;• whether any changes in work due to changes in circumstances that occurred
subsequent to the start of construction were reflected within the project budget in a timely and appropriate manner; and
The primary procedures we performed to assess whether the Company’s estimates of total construction costs and the progress toward completion of construction in applying the percentage-of-completion method were reasonable included the following:
(1) Internal control testingWe tested the design and operating effectiveness of certain of the Company’s internal controls relevant to the process of preparing a project budget for construction contracts. In this assessment, we focused our testing on the following controls:• controls to ensure compliance with the internal rules for preparing
a project budget, including how to accumulate work hours of each construction project, what information and data to be used, and how to reflect the risk of any uncertainties within the budget; and
• controls to reflect any changes in circumstances that occur after the start of construction within the project budget in a timely and appropriate manner.
(2) Assessment of the reasonableness of the estimated total construction costs and the estimated progress toward completion of constructionIn order to assess the reasonableness of key assumptions adopted in preparing the budget for each construction project, which was used as the basis for estimating total construction costs and the progress toward completion of construction, we inquired of management and the personnel responsible for construction work about the basis on which those assumptions were developed. In addition, we:• assessed whether all the activities agreed upon with the customer were
reflected in the project budget by comparing it with the construction contract, the purchase order and the specification sheet;
34
Independent Auditor’s Report

• whether the ratio of construction costs incurred to the estimated total construction costs reasonably reflected the actual progress of the construction at the end of the fiscal year.
We, therefore, determined that our assessment of the reasonableness of the Company’s estimates of total construction costs and the progress toward completion of construction in applying the percentage-of-completion method was of most significance in our audit of the consolidated financial statements for the current fiscal year, and accordingly, a key audit matter.
• agreed the estimated costs of each activity included in the project budget with the supporting worksheet that calculated the accumulated costs, and compared the occurrence of the standard costs with that of the actual costs in similar construction projects in the past to assess the reasonableness of the estimated costs;
• evaluated the accuracy of the project budget by comparing the actual costs of completed constructions with their initial project budget and analyzing variances between the two, and ensured that the causes of those variances were appropriately reflected in the project budget of uncompleted construction projects when such causes were applicable to other construction projects;
• inspected the project budget change confirmation sheet, inquired of the construction manager, the accounting staff and other relevant personnel about any changes in circumstances that occurred after the start of construction and their judgment on whether to update the project budget, assessed the consistency of their responses with each other’s, and for significant construction projects, examined the reasonableness of the updated project budget by matching it with evidence such as the revised specification sheets and quotations; and
• inquired of the construction manager and the accounting staff regarding whether there was any discrepancy between the initial schedule and the actual progress of uncompleted construction projects at the end of the fiscal year, and inspected materials such as the construction timeline and the invoice that served as the basis for their responses to our inquiries.
Responsibilities of Management and Corporate Auditors and the Board of Corporate Auditors for the Consolidated Financial Statements
Management is responsible for the preparation and fair presentation of the consolidated financial statements in accordance with accounting principles generally accepted in Japan, and for such internal control as management determines is necessary to enable the preparation of consolidated financial statements that are free from material misstatement, whether due to fraud or error.
In preparing the consolidated financial statements, management is responsible for assessing the Group’s ability to continue as a going concern, disclosing, as applicable, matters related to going concern in accordance with accounting principles generally accepted in Japan.
Corporate auditors and the board of corporate auditors are responsible for overseeing the directors’ performance of their duties with regard to the design, implementation and maintenance of the Group’s financial reporting process.
Auditor’s Responsibilities for the Audit of the Consolidated Financial Statements
Our objectives are to obtain reasonable assurance about whether the consolidated financial statements as a whole are free from material misstatement, whether due to fraud or error, and to issue an auditor’s report that includes our opinion. Reasonable assurance is a high level of assurance, but is not a guarantee that an audit conducted in accordance with auditing standards generally accepted in Japan will always detect a material misstatement when it exists. Misstatements can arise from fraud or error and are considered material if, individually or in the aggregate, they could reasonably be expected to influence the economic decisions of users taken on the basis of these consolidated financial statements.
As part of our audit in accordance with auditing standards generally accepted in Japan, we exercise professional judgment and maintain professional skepticism throughout the audit. We also:• Identify and assess the risks of material misstatement of the consolidated financial statements, whether due to fraud or error, design and perform audit procedures
responsive to those risks, and obtain audit evidence that is sufficient and appropriate to provide a basis for our opinion. The risk of not detecting a material misstatement resulting from fraud is higher than for one resulting from error, as fraud may involve collusion, forgery, intentional omissions, misrepresentations, or the override of internal control.
• Obtain an understanding of internal control relevant to the audit in order to design audit procedures that are appropriate in the circumstances, while the objective of the audit is not to express an opinion on the effectiveness of the Group’s internal control.
• Evaluate the appropriateness of accounting policies used and the reasonableness of accounting estimates and related disclosures made by management.
35

• Conclude on the appropriateness of management’s use of the going concern basis of accounting and based on the audit evidence obtained, whether a material uncertainty exists related to events or conditions that may cast significant doubt on the Group’s ability to continue as a going concern. If we conclude that a material uncertainty exists, we are required to draw attention in our auditor’s report to the related disclosures in the consolidated financial statements or, if such disclosures are inadequate, to modify our opinion. Our conclusions are based on the audit evidence obtained up to the date of our auditor’s report. However, future events or conditions may cause the Group to cease to continue as a going concern.
• Evaluate whether the presentation and disclosures in the consolidated financial statements are in accordance with accounting standards generally accepted in Japan, the overall presentation, structure and content of the consolidated financial statements, including the disclosures, and whether the consolidated financial statements represent the underlying transactions and events in a manner that achieves fair presentation.
• Obtain sufficient appropriate audit evidence regarding the financial information of the entities or business activities within the Group to express an opinion on the consolidated financial statements. We are responsible for the direction, supervision and performance of the group audit. We remain solely responsible for our audit opinion.
We communicate with corporate auditors and the board of corporate auditors regarding, among other matters, the planned scope and timing of the audit, significant audit findings, including any significant deficiencies in internal control that we identify during our audit.
We also provide corporate auditors and the board of corporate auditors with a statement that we have complied with relevant ethical requirements regarding independence, and communicate with them all relationships and other matters that may reasonably be thought to bear on our independence, and where applicable, related safeguards.
From the matters communicated with corporate auditors and the board of corporate auditors, we determine those matters that were of most significance in the audit of the consolidated financial statements of the current period and are therefore the key audit matters. We describe these matters in our auditor’s report unless law or regulation precludes public disclosure about the matter or when, in extremely rare circumstances, we determine that a matter should not be communicated in our report because the adverse consequences of doing so would reasonably be expected to outweigh the public interest benefits of such communication.
Convenience Translation
The U.S. dollar amounts in the accompanying consolidated financial statements with respect to the year ended March 31, 2021 are presented solely for convenience. Our audit also included the translation of yen amounts into U.S. dollar amounts and, in our opinion, such translation has been made on the basis described in Note 1 to the consolidated financial statements.
Interest required to be disclosed by the Certified Public Accountants Act of Japan
We do not have any interest in the Group which is required to be disclosed pursuant to the provisions of the Certified Public Accountants Act of Japan.
/S/ Kenya YakuwaDesignated Engagement Partner Certified Public Accountant
/S/ Shuji YasuzakiDesignated Engagement Partner Certified Public Accountant
KPMG AZSA LLCTokyo Office, Japan August 12, 2021
Notes to the Reader of Independent Auditor’s Report:This is a copy of the Independent Auditor’s Report and the original copies are kept separately by the Company and KPMG AZSA LLC.
36

37
Fiscal YearEnding March 31
Annual Stockholders’ MeetingThe annual meeting of the Company’s stockholders is normally held in June of each year in Tokyo, Japan.
Stock Exchange ListingFirst Section, Tokyo Stock Exchange
Transfer AgentSumitomo Mitsui Trust Bank, Limited4-1, Marunouchi 1-chome, Chiyoda-ku, Tokyo 100-8233, Japan
Paid-in Capital¥13,302,282,161
Number of Shares Issued60,832,771
Distribution of Stockholders and Shares
Japanese national and regional governmental bodies .........................Japanese financial institutions ............................................................Japanese securities companies ...........................................................Other Japanese corporations ..............................................................Japanese individuals and others .........................................................Foreign institutions and individuals .....................................................Treasury stocks ...................................................................................
Total ..................................................................................................
Major Stockholders
SECOM Co., Ltd. ..............................................................................................................Shareholding Commission of NOHMI BOSAI Distributors ..................................................The Master Trust Bank of Japan, Ltd. (Trust Account) ........................................................Shareholding Commission of NOHMI BOSAI Partners .......................................................Custody Bank of Japan, Ltd. (Trust Account) .....................................................................MUFG Bank, Ltd. ..............................................................................................................Shareholding Commission of NOHMI BOSAI Employees ...................................................Fuji Electric Co., Ltd. .........................................................................................................NORTHERN TRUST CO. (AVFC) RE HCR00 ........................................................................Sumitomo Mitsui Banking Corporation .................................................................................
Number of StockholdersNumber of Shares Held
(Hundreds)Percentage of Total Shares
in Issue (%)
— — —37 93,765 15.42 24 2,173 0.36
199 350,746 57.67 2,657 95,934 15.78
142 61,400 10.10 1 4,102 0.67
3,060 608,120 100.00
Number of Shares Held (Thousands)
Percentage of Total Shares in Issue (%)*
30,598 50.64 2,033 3.36 2,022 3.35 1,568 2.60 1,269 2.10 1,000 1.66
884 1.46 868 1.44 860 1.42 765 1.27
*The percentage of total shares in issue is calculated after deducting treasury stocks.
Investor Information (As of March 31, 2021)

• HEAD OFFICE: 7-3, Kudan-Minami 4-chome, Chiyoda-ku, Tokyo 102-8277, Japan• TEL: 81-3-3265-0211 FAX: 81-3-3263-4948• URL: https://www.nohmi.co.jp
Printed in Japan