Annual Report 2021 - CSE
394
-
Upload
khangminh22 -
Category
Documents
-
view
2 -
download
0
Transcript of Annual Report 2021 - CSE


Scan the QR Code to read this Report on https://www.ndbbank.com/investor-relations/reports
National Development Bank PLCPQ 27A+ (lka) Stable Outlook –Fitch Ratings Lanka Limited

Over our 43-year history, NDB Bank has evolved into one of the largest, most awarded commercial banks in Sri Lanka, possessing deep capital strength, sound asset quality and a range of distinctive financial products and services. We have always believed that financial institutions can and should play a major role in national development. That’s why we are proud to be a strong, broadly diversified bank offering a comprehensive range of banking and capital market products and services.
Over the years, we have learned many things about ourselves, our country and the thousands of people we serve each day. One of the most significant of these was the recognition that a moment’s insight is often worth a lifetime of experience. That’s why we have focused so strongly on deepening our knowledge of our customers, employees, partners and communities; expanding our understanding of their lives, their dreams and ambitions and crafting our digital infrastructure to serve their fast-evolving needs.
Today, our value cycle is designed around the principle that we must know and understand our stakeholders inside out. To that end, we’re listening to feedback, responding to concerns and giving back to the communities and people around who our business model is built. We’re acquiring a myriad ‘inside insights’ that are reflected in our customised digital technologies; the online platforms, apps and infrastructure that help us to help every Sri Lankan in their quest to achieve true financial security —each in their own unique way.

CONTENTS
INSIDE INSIGHT
OVERVIEW
Our Approach to Reporting 3
The Evolution of Our Report 6
Year in Review 8
Awards and Recognition 9
Performance Highlights 10
Value Creation Highlights 11
Annual Report of The Board of
Directors on the Affairs of the
National Development Bank PLC 12
LEADERSHIP
Reflections from The Chairman 13
Chief Executive Officer’s Review 15
Board of Directors 18
The Leadership Team 24
Senior Management 27
Group Subsidiary Leadership Team 30
OPERATING LANDSCAPE & STRATEGY
NDB Investment Case 31
Our Transformation 34
How We Create Value 36
Stakeholder Relationships 38
Operating Landscape 44
Our COVID-19 Response:
Adapting To Thriving 47
Material Matters 48
Our Strategy 50
ESG in Focus 55
MANAGEMENT DISCUSSION & ANALYSIS
Financial Capital 59
Performance of Business Lines 63
Our Group Companies 73
Digital Capital 76
Manufactured Capital 80
Human Capital 82
Intellectual Capital 88
Social and Relationship Capital 92
Natural Capital 97
Way Forward 102
Independent Assurance Report
on Integrated Reporting 103
Independent Assurance Report
on Sustainability Reporting 104
Material Matters 105
RISK MANAGEMENT & CORPORATE GOVERNANCE
Risk Management Overview 106
Corporate Governance 108
Compliance Disclosures 124
Directors’ Interests in contracts with the
National Development Bank PLC 128
Nominations Committee Report 130
Human Resources and
Remuneration Committee Report 131
Integrated Risk Management
Committee Report 133
Audit Committee Report 136
Related Party Transactions
Review Committee Report 139
Strategic Issues Committee Report 141
Credit Committee Report 142
Digital Transformation Committee Report 143
Statement of Directors’
Responsibilities for Financial Reporting 144
Directors’ Statement on
Internal Control over Financial Reporting 147
Responsibility Statement of the
Chief Executive Officer and
Vice President Finance 148
Independent Assurance Report 149
FINANCIAL STATEMENTS
Integrated Approach to Financial Reporting 152
Financial Calendar 2021/2022 153
Table of Contents 154
Financial Performance 155
Independent Auditors’ Report 156
Statement of Profit or Loss 159
Statement of Comprehensive Income 160
Statement of Financial Position 161
Statement of Changes in Equity 162
Statement of Cash Flows 164
Notes to the Financial Statements 166
Compliance with disclosure requirements
of the Central Bank of Sri Lanka 286
SUPPLEMENTARY INFORMATION
Awards & Accolades 2021 290
Corporate Governance 292
Risk Management 318
Investor Relations 352
Key Events 370
Branch Network of the Bank 371
Network of Group Companies 374
Correspondent Relationships 374
GRI Content Index 375
Glossary of Financial and Banking Terms 378
Notice of Meeting 384
Corporate Information 386
Form of Proxy 387
2 National Development Bank PLC Annual Report 2021

GUIDE TO OUR REPORT
This Integrated Annual Report provides our stakeholders with a comprehensive overview of our strategy and performance, dynamics in the operating landscape and our plans to position National Development Bank PLC (“NDB” or “the Bank”) for the future. The Report covers the operations of NDB and its Group companies (collectively referred to as the “Group”) for the period from 01 January 2021 to 31 December 2021.
SCOPE AND BOUNDARY
The financial information presented in this Report represents consolidated information unless otherwise stated. The non-financial information relates only to the Bank as it accounts for 99% and 94% of the Group’s assets and revenue. The boundary for the Integrated Report extends to broader aspects and relationships which are implicit in the Group’s value creation. The Report includes the Group’s operations in Sri Lanka which account for the majority of its operations, and Bangladesh and Mauritius in which the Group has limited operations.
The Bank adopts an annual reporting cycle, and this Report follows NDB’s previous Integrated Annual Report for the year ended 31 December 2020. There were no significant changes in the size, structure or supply chain of the organisation compared to 2020. During the year, the Bank concluded a Rights Issue and a Private Placement netting LKR 9.5 Bn, subsequent to which, the Norwegian Investment Fund for developing countries - Norfund became the Bank’s largest shareholder with a 9.99% ownership. There are no material restatements of information provided in the previous report, unless otherwise mentioned.
Welcome to our ninth Integrated Report
Operating context
Stakeholder considerations
Our strategic aspirations
Impacts on our resources and relationships (classified as 7 capitals)
FINANCIAL REPORTING BOUNDARY
NDB Capital Holdings Limited (Capital markets cluster)
NDB (Banking operations)
Development Holdings (Pvt) Limited (Property management entity)
INTEGRATED REPORTING BOUNDARY
OUR APPROACH TO REPORTING
INSIDE INSIGHT OVERVIEW
Page 44 Page 59Page 50Page 38
Non-Financial Reporting Boundary
The content included in this Report has been selected and prioritised based on the Bank’s material matters, that could significantly affect our ability to create value in the short (12 months), medium (12 months to 5 years) and long-term (beyond 5 years).
3National Development Bank PLC Annual Report 2021

MATERIALITY
The contents included in this Report has been selected and prioritised based on the Bank’s material matters, that could significantly affect our ability to create value in the short (12 months), medium (12 months to 5 years) and long-term (beyond 5 years). The process we adopt in determining these matters and the Group’s material matters for 2021 are listed on page 48.
PRINCIPLES OF REPORTING
Internal Assurance External Assurance
� Sri Lanka Accounting Standards issued by the Institute of Chartered Accountants of Sri Lanka
� Direction No. 4 of 2018 issued by the Central Bank of Sri Lanka on SLFRS 9
� Relevant directions/circulars issued on reporting format by the Central Bank of Sri Lanka
� Companies Act No. 7 of 2007 (as amended)
� Inland Revenue Act No. 24 of 2017 and amendments thereto Value Added Tax Act No. 14 of 2002 and amendments thereto
� Listing Rules of Colombo Stock Exchange
� Internal Audits
� Robust framework of internal controls
� Reporting to Board Audit Committee and Board of Directors
Independent Auditors’ Report by Messrs. Ernst and Young
� Integrated Reporting Framework of the International Integrated Reporting Council
� “A Preparer’s Guide to Integrated Corporate Reporting” - issued by the Institute of Chartered Accountants of Sri Lanka
� Board Review � Independent Assurance on Integrated Reporting by Messrs. Ernst and Young
� GRI Standards: This Report has been prepared in accordance with the GRI Standards - Core Option
� Sustainability Accounting Standards Board (SASB) Standards
� Sustainable Development Goals (SDGs)
� Gender Parity Reporting Framework of the Institute of Chartered Accountants of Sri Lanka
� Guide on communicating sustainability - Colombo Stock Exchange
� Assessment of non-financial information by the Corporate Sustainability function
� Environmental and Social Management System (ESMS) criteria on responsible lending
� Independent Assurance on GRI Reporting by Messrs. Ernst and Young
� Banking Act Direction No. 11 of 2007 (as amended)
� Listing Requirements of the Colombo Stock Exchange
� Code of Best Practice on Corporate Governance issued by the Institute of Chartered Accountants of Sri Lanka (2017)
� Robust governance frameworks and full alignment with regulatory guidelines
� Factual Finding Report submitted by Messrs. Ernst and Young in relation to compliance with the Banking Act Direction No. 11 of 2007 on Corporate Governance (as amended)
Fina
ncia
l Rep
ort
Nar
rati
ve R
epo
rtS
usta
inab
ility
Rep
ort
Co
rpo
rate
Go
vern
ance
INSIDE INSIGHT OVERVIEW OUR APPROACH TO REPORTING
We have consistently strived to ensure that our Report is aligned to the guiding principles, concepts and overall spirit of the International <IR> Framework. Accordingly, emphasis is placed on identifying and clearly presenting the information that is most relevant to our stakeholders in a meaningful and simplified manner. In doing so, we have avoided superfluous content, eliminated repetition and limited connecting references only to relevant information.
The key frameworks and guidelines adopted in preparing our Report and the combined assurance model used to ensure the integrity of the information are summarised below.
4 National Development Bank PLC Annual Report 2021

CapitalsStrategic Priorities under Voyage
2025 Strategy
NAVIGATING THIS REPORT
Other references
Page Reference
FORWARD-LOOKING STATEMENTS
The Group’s future orientation including strategic aspirations, opportunities, risks and potential impacts on the business model, performance and financial stability are presented in ‘Way Forward’ sections throughout the report, particularly in the sections set out below.
Section Page
Reflections from the Chairman 13
Chief Executive Officer’s Review 15
Operating Landscape 44
Our Strategy 50
Performance and Value Creation 58
Risk Management 318
Forward-looking statements and forecasts pertaining to the Group’s financial performance, position and operations involve an element of uncertainty given exposure to external conditions; this could lead to actual results differing from the stated projections. These forward-looking statements have not been reviewed by the Group’s auditors.
BOARD RESPONSIBILITY STATEMENT
NDB’s Board of Directors is ultimately responsible for ensuring the integrity of this Report. We hereby confirm that the 2021 Report addresses all relevant material matters and fairly represents the Group’s integrated performance. The Board also confirms that the Report has been prepared in accordance with the requirements of the International <IR> Framework. The Report is approved and authorised for publication.
Signed on behalf of the Board,
Ms. Shehani Ranasinghe Company Secretary
22 February 2022
INSIDE INSIGHT OVERVIEW OUR APPROACH TO REPORTING
Financial Capital
Digital Capital
Intellectual Capital
Social & Relationship Capital
Natural Capital
Human Capital
Manufactured Capital
Business Focus
Organisational Realignment
Empowered Staff
Customer Solutions
Digital and Data as Transformers
FEEDBACK
We welcome your suggestions and comments on further improving the readability and relevance of our Report. Kindly direct your feedback to Vice President - Company Secretary and/or Vice President - Finance (page 386).
5National Development Bank PLC Annual Report 2021

�
Reporting Improvements in 2021
NDB first embraced the principles of integrated reporting in its Annual Report for 2013, following the publication of the International <IR> Framework in December 2013. Since then, we have consistently enhanced the quality of our Report, seeking to fulfill the evolving information needs of our stakeholders, aligning with global best practices and widening the scope of external assurance on our reporting. The evolution of our Report over the past 5 years is summarised below:
THE EVOLUTION OF OUR REPORT
� Widened the scope of material matters beyond the topics prescribed by the GRI guidelines
� Obtained external assurance on GRI Reporting
� Increased emphasis on future orientation
� Increased connectivity through the use of navigation icons
� More concise reporting with 64 pages reduced in comparison to the previous year
� Adoption of Gender Parity Reporting Framework of CA Sri Lanka
� Quantitative disclosures on stakeholder value creation
� Improved reporting on Sustainability Development Goals (SDGs)
� Adoption of the revised Code of Best Practice on Corporate Governance issues by CA Sri Lanka (2017)
� Dedicated chapters for Economic Contribution, Resource Allocation and Way Forward
� Emphasis on demonstrating the linkages and trade-offs between the capital inputs
� Dedicated chapter on Digital Capital
� Further focus on conciseness, with 26 pages reduced in comparison to the previous year
� Adoption of new GRI Standard: GRI 207 Tax
� Clearly demonstrated implications of COVID-19 on strategy, performance and value creation
2017
2019
2018
2020
11 awards won at
� CA Sri Lanka Annual Report Awards 2021
� SAFA Best Presented Annual Report Awards 2020
� CMA Excellence in Integrated Reporting Awards 2021
� ACCA Sri Lanka Sustainability Reporting Awards 2021
Recognition for our 2020 Integrated Annual Report
INSIDE INSIGHT OVERVIEW
Improvements in Non-Financial Reporting
� Obtained External Assurance on Integrated Reporting from Messrs. Ernst and Young
� Adoption of SASB Standards- Industry Standard for Commercial Banks
� Disclosure of gender pay gap indicators
� Increased conciseness with a 30-page reduction compared to 2020
� Initial steps towards aligning with the Task Force on Climate Related Financial Disclosures (TCFD)
This year’s Annual Report features the following improvements reflecting our commitment to continuously enhance the quality of our content, quantitative and qualitative disclosures and reporting processes.
2021
Improvements in Financial Reporting
� Disclosures on applying of IFRS Inter Bank Offered Rate (IBOR) Reform and assessment
� Adoption of SLFRS Disclosures of COVID-19 impact on Expected Credit Loss of Banks
� Improvements for Credit Risk disclosures in compliance with SLFRS 7 – Financial Instruments Disclosures.
Please refer to page 291 for full list of awards received for our 2020 Annual Report
6 National Development Bank PLC Annual Report 2021


Operating Environment
Strategic Priorities
Continued support to stakeholders in addressing challenges presented by the pandemic
CUSTOMER SUPPORT
Strengthen the Bank’s capital position
FINANCIAL STABILITY
Business disruptions stemming from periodic lockdowns
PANDEMIC-LED DISRUPTIONS
Exchange Rate Volatility
EXCHANGE RATE
Credit demand supported by conducive interest rate environment
INTEREST RATE ENVIRONMENT
Increased customer sophistication and demand for convenient, seamless banking solutions
CUSTOMER SOPHISTICATION FinancialPerformance
%22Growth in NII
%13Deposit Growth
%12Asset Growth
%12PBT Growth
Sustainability and ESG focus
ESG FOCUS
Widen transactional banking footprint
BANKING FOOTPRINT
Focus on continuing banking services uninterrupted while ensuring employee safety
EMPLOYEE SAFETY
Macro-economic headwinds arising from the country’s external sector challenges and fiscal pressures
ECONOMIC HEADWINDS
Performance
LKR 22 BnTowards Renewable Energy
%
%
8
14
Reduction in Carbon Footprint
Reduction in Paper Consumption
WayForwardContinued emphasis on supporting customers through potential stress
Strengthen presence in the renewable energy sector
Complete upgrade of the core banking system
Continued focus on digitalisation led solution
Strategic focus on driving customer centricity
NDB marked a major milestone during the year, raising LKR 9.5 Bn in equity capital. The transaction saw Norfund- the Norwegian Investment Fund for development countries investing 9.99% in the Bank’s shares, representing Norfund’s first equity investment in Sri Lanka. Norfund has thereby emerged as NDB’s largest shareholder with board representation, and is expected to play an important role brining in financial and technical expertise and in driving the Group’s as well as the nation’s future growth aspirations.
Strengthening Capital
YEAR IN REVIEW
INSIDE INSIGHT OVERVIEW
Acceleration of the Bank’s digital journey with the launch of several customer-centric, ground breaking innovative solutions first time in Sri Lanka
DIGITAL JOURNEY
8 National Development Bank PLC Annual Report 2021

AWARDS AND RECOGNITION
INSIDE INSIGHT OVERVIEW
The will to winExcellence is our hallmark and our quest for distinction has led to the acquisition of over 70 awards for various aspects of performance including digital technologies, banking solutions, marketing and branding, innovation, employee satisfaction, investor relations and corporate reporting—making the Group by far the most awarded corporate in Sri Lanka.
Our commitment to maintain our position as a industry leader is reflected in the impressive local and global accolades we have won and the universal recognition we have achieved in the financial industry and beyond.
In all this, we remain aware of our greatest strength, for we know we have achieved these remarkable successes in partnership with our many loyal stakeholders, whose steadfast confidence and trust make us who we are today.
Please refer page 290 for a full set of awards and accolades won in 2021.
9National Development Bank PLC Annual Report 2021

PERFORMANCE HIGHLIGHTS
INSIDE INSIGHT OVERVIEW
BANK GROUP
For the year ended 31 December 2021 2020 Change 2021 2020 ChangeLKR Mn LKR Mn % LKR Mn LKR Mn %
Results for the YearGross income 62,111 60,676 2 64,083 61,651 4 Operating profit before tax on financial services 10,308 9,206 12 11,229 9,209 22 Taxation 3,946 3,676 7 4,166 3,992 4 Profit for the year 6,362 5,530 15 7,063 5,217 35 Profit attributable to equity holders of the parent 6,362 5,530 15 6,904 5,117 35 Gross dividends for the year * - 349 - - 349 -
Assets and LiabilitiesDeposits for customers 552,040 490,278 13 551,257 489,659 13 Gross loans and receivables 526,141 443,537 19 525,976 443,613 19 Total assets 702,903 626,837 12 708,802 632,132 12 Total equity (stated capital and reserves) 58,932 44,781 32 62,727 47,976 31
Profitability (%)Net interest margin 3.25 3.07 6 3.24 3.07 6 Return on assets (before taxes) 1.55 1.59 (2) 1.67 1.58 6 Return on equity 12.27 13.13 (7) 12.47 11.20 11Cost to income ratio 33.65 37.00 (9) 34.90 39.39 (11)
Asset Quality (%)Gross non-performing advances ratio 4.65 5.35 (13) 4.65 5.35 (13)Net non-performing advances ratio 2.29 3.23 (29) 2.29 3.23 (29)Impaired loans (stage 3) ratio 4.55 4.47 2 4.55 4.47 2 Impairment (stage 3) to stage 3 loans ratio 32.81 31.68 4 32.81 31.68 4 Total impairment allowance as a % of gross loans and receivables (%) 4.49 4.04 11 4.49 4.04 11
Investor Information (LKR)Net asset value per share 165.02 192.49 (14) 175.65 206.23 (15)Market value per share - as at 31 December 68.90 78.10 (12) N/A N/A - Earnings per share - basic/diluted 20.68 23.77 (13) 22.44 21.99 2 Dividend per share * - 1.50 - N/A N/A - Dividend cover (times) * - 15.85 - N/A N/A - Dividend yield (%) * - 1.92 - N/A N/A - Market capitalisation (LKR Mn) 24,606 18,169 35 N/A N/A - Total leverage (times) 11.93 14.00 (15) 11.30 13.18 (14)
Regulatory Ratios (%)Statutory liquid assets ratio:Domestic Banking Unit (DBU) (Minimum Requirement - 20%) 23.14 28.84 (20) N/A N/A - Offshore Banking Unit (FCBU) (Minimum Requirement - 20%) 25.31 26.88 (6) N/A N/A -
Capital Adequacy Ratios (under Basel III Standards)Common Equity Tier 1 Capital Ratio (Minimum Requirement - 6.5%) 10.01 9.17 9 10.53 9.73 8 Tier 1 Capital Ratio (Minimum Requirement - 8.0%) 10.01 9.17 9 10.53 9.73 8 Total Capital Ratio (Minimum Requirement - 12.0%) 15.42 14.32 8 15.82 14.75 7
Liquidity Ratios (under Basel III Liquidity Standards)Liquidity Coverage Ratio (%) - Rupee (Minimum Requirement - 100% (2020 - 90%)) 193.03 161.97 19 N/A N/A -Liquidity Coverage Ratio (%) - All Currency (Minimum Requirement - 100% (2020 - 90%)) 171.33 157.12 9 N/A N/A -Leverage ratio (Minimum requirement - 3%) 6.36 5.56 14 6.77 5.97 13 Net Stable Funding Ratio (%) (Minimum Requirement - 100% (2020 - 90%)) 118.27 112.52 5 N/A N/A -
* The Board of Directors will consider a declaration of dividends for the year 2021 in due course. Therefore the Dividend Cover and Dividend Yield for the year 2021 are not disclosed.
ACHIEVEMENTS
GOALS 2021 2020 2019 2018 2017
Financial Indicators - BankReturn on assets (before taxes) (%) Over 1.5% 1.55 1.59 2.01 2.22 2.10Return on equity (%) Over 12% 12.27 13.13 13.73 17.41 16.27Growth in total operating income (%) Over 20% 22.06 7.00 10.00 33.44 22.82Cost to income ratio Below 40% 33.65 37.00 39.90 39.34 45.48Growth in profit after tax (%) Over 20% 15.04 8.00 (8.00) 27.50 37.26Growth in total assets (%) Over 15% 12.13 18.00 12.00 23.45 14.51
Capital Adequacy Ratios - BankCommon Equity Tier 1 Capital Ratio - (Minimum requirement - 6.5% in 2021) Over 9% 10.01 9.17 9.18 9.17 8.85Total Tier 1 Capital Ratio - (Minimum requirement - 8.0% in 2021) Over 9% 10.01 9.17 9.18 9.17 8.85Total Capital Ratio - (Minimum requirement - 12.0% in 2021) Over 13% 15.42 14.32 13.43 12.63 13.89
10 National Development Bank PLC Annual Report 2021

VALUE CREATION HIGHLIGHTS N
AT
UR
AL
CA
PIT
AL
Lending to renewable energy in year 2021
12 projects
GHG and harmful gases avoided
24.52 Mn kgCO2e
Carbon footprint
8% reduction
2021 2020 Change %
Paper consumption (kg) 34,524 40,087 -14
Electricity consumption (kWh Mn) 5.17 5.49 -6
INSIDE INSIGHT OVERVIEW
HU
MA
N
CA
PIT
AL
Employees
2,949 (2020 : 2,892)
Employee
expenses
LKR 5.7 Bn (+10%)
Female
representation - overall
40%
Female representation-
Senior management
33%
Certified as a Great
Place To Work
Training record
2021 2020
Investment in training (LKR Mn) 19.63 18.67
Training hours 70,487 63,518
Average training hours per employee (Hours) 24.4 22.0 0 0.5 1.0 1.5 2.0
2020
2021
Value Addition per Employee
LKR Mn
1.9
1.8
0 500 1,000 1,500 2,000 2,500 3,000
2020
2021
Carbon Footprint
tCO2e
2,312
2,515
INT
EL
LE
CT
UA
L C
AP
ITA
L Brand value (+13%)
LKR 10 Bn
Listed among Sri Lanka’s top 20 brands
Awards received during the year
Over 70 awards across multiple performance aspects
SO
CIA
L &
R
EL
AT
ION
SH
IP
CA
PIT
AL
Customer satisfaction score
99%
CSR Investment
LKR 16 Mn
No. of beneficiaries
>12,000
Volunteer hours
>17,500
Correspondent banks
92
Flagship initiatives
2021
DIG
ITA
L
CA
PIT
AL
2021 2020
Growth in value of transactions through NDB NEOS platform 196% 210%
Percentage of digital transactions 83% 78%
Processes automated 81 62
MA
NU
FAC
TU
RE
D
CA
PIT
AL
Leasing
Centres
10
Branches
113
0 0.5 1.0 1.5 2.0 2.5 3.0 3.5
2020
2021
Movement in Property Plant & Equipment
LKR Bn
3.1
3.0
‘Industry first’ digital initiatives
CRIB reports and scores on NEOS
vKYC on NEOS
NEOSBIZ for SMEs
Digital signatures for both internal and external usage
11National Development Bank PLC Annual Report 2021

ANNUAL REPORT OF THE BOARD OF DIRECTORS ON THE AFFAIRS OF THE NATIONAL DEVELOPMENT BANK PLC
INSIDE INSIGHT OVERVIEW
INTRODUCTION
The Board of Directors of National Development Bank PLC (the Bank) takes pleasure in presenting to the shareholders the Annual Report 2021, comprising the Audited Financial Statements and an Integrated Report for the financial year ended 31 December 2021. The former conforms to the requirements of the Companies Act No. 7 of 2007 and amendments thereto, Banking Act No. 30 of 1988 and amendments thereto and the Directions issued thereunder, the Listing Rules of the Colombo Stock Exchange, other applicable laws and regulations and recommended good governance disclosures as ascertained by the Bank. The same also discharges the obligation of the Board of Directors, as specified in the Companies Act regarding preparing the Financial Statements of the Group and the Bank, which reflect a true and fair view of the financial position and performance of the Group and the Bank.
BEST PRACTICES IN INTEGRATED REPORTING
The Integrated Report has been prepared in line with the principles of the International <IR> Framework of the International Integrated Reporting Council (IIRC). In enhancing the credibility of its Report, the Bank obtained Independent Assurance on its 2021 Integrated Annual Report for the first time. The assurance report by Messrs. Ernst & Young is available on page 103. The Board of Directors’ acknowledgement of their ultimate responsibility towards ensuring the integrity of the Integrated Report and their affirmation that the said Report is a fair presentation of the NDB Group’s integrated performance is set out in page 5. The Bank endeavoured to make its reporting clear, concise, relevant and simple founded on the principles and guidance of the International <IR> Framework. Content presented in the Report has been selected and prioritised based on ‘Material topics’, which have been determined through a systematic process disclosed on page 44 and 45 of this Report. The value the Bank has created to its stakeholders over the years, how it has engaged key stakeholders, the Bank’s delivery of strategy and how the capital inputs have been transformed to outcomes for stakeholders are detailed in pages 36 to 37.
APPROVAL AND SUBMISSION OF THE REPORT TO RELEVANT STAKEHOLDERS
The Report was approved by the Board of Directors on 22 February 2022. The requisite number of copies of the Annual Report will be submitted to the Colombo Stock Exchange and to the Sri Lanka Accounting and Auditing Standards Monitoring Board within the statutory deadlines, together with a soft copy uploaded to
the Bank’s corporate website https://www.ndbbank.com. In complying with the good governance practices, the Annual Report is released as soon as possible after the end of the financial year and completion of the audit. In compliance with the Colombo Stock Exchange Listing Rules, the Annual Report will be distributed by way of a link shared with all shareholders and debenture holders - directing them to the soft copy of the annual report hosted on the aforementioned link, as well as in the form of a printed report as and when required.
THE BANK’S RESPONSE TO THE EVOLVING PANDEMIC AND RESULTANT IMPACT
The Board paid close attention to the evolution of the pandemic and its potential impact on the operations of the Bank. Suitable courses of action were often deliberated to ensure well-being and continued value creation to all key stakeholders. Emerging business opportunities, including the scope for digitisation were deliberated at length, in line with the Bank’s strategic imperatives. The review on strategy and performance were also considered within the context of the pandemic and its resultant effects, with recalibrations to certain growth targets where needed. A full record of these initiatives are found in pages 50 - 54.
WAY FORWARD
We are cognisant of the short-to-medium term challenges that are likely to prevail given the country’s macro economic challenges. Against this backdrop, we will build on the foundations put in place over the last two years to future-proof the Group as we continue to drive our strategic aspirations. We will continue to work closely with our customers affected by the pandemic in offering customised payment plans given the potential economic stress thereby supporting long-term commercial sustainability. Ongoing focus will be placed on export-oriented customers which is in line with the national economic drive, offering significant value addition through our ecosystem partnerships. Digitalisation and customer centricity will also remain focal priorities as we seek to sharpen our competitive edge. Please refer to page 102 for further details on our way forward and outlook.
EXTENT OF COMPLIANCE WITH APPLICABLE STATUTES AND GOOD GOVERNANCE DISCLOSURES
For a full account on the extent of compliance with the requirements of Section 168 of the Companies Act No. 07 of 2007 and amendments thereto, and other relevant statues, and good governance disclosures, please refer pages 124 to 127, which shall all be considered as part and parcel of this Annual Report.
SEVENTEENTH (17TH) ANNUAL GENERAL MEETING
Accordingly the Seventeenth (17th) Annual General Meeting of the Bank will be held virtually from the Board Room of National Development Bank PLC located at the 14th Floor, DHPL Building, No. 42, Nawam Mawatha, Colombo 02 on a date and time to be decided by the Board of Directors and convened, which will be reflected in the Notice of Meeting sent to the shareholders. The Notice of Meeting is reflected on page 384 signed in accordance with a resolution adopted by the Directors.
As required in terms of Section 168 (k) of the Companies Act No. 7 of 2007, the Board of Directors does hereby acknowledge the contents of the Annual Report.
Signed in accordance with a resolution adopted by the Directors.
Mr. Eshana de Silva Chairman
Mr. Dimantha SeneviratneDirector/Chief Executive Officer
Mr. Sriyan CoorayDirector
Mr. Bernard SinniahDirector
Mr. Sujeewa Mudalige Director
Mr. Hiran PereraDirector
Mr. Kushan D’Alwis, PCDirector
Ms. (Fay) Piyachatr ChetnakarnkulDirector
Ms. Chandima DilrukshiDirector
Ms. Shehani RanasingheCompany Secretary
Colombo22 February 2022
12 National Development Bank PLC Annual Report 2021

REFLECTIONS FROM THE CHAIRMAN
INSIDE INSIGHT LEADERSHIP
Dear stakeholders
My message to you comes at the end of what has been one of the most unusual and tumultuous years in living memory. Throughout this year, the strength and depth of NDB’s resources have been matched by the courage and resilience of its people, who have driven remarkable outcomes which previously may have appeared unattainable. We closed the year not just delivering record growth and profitability but also having fortified our brand, deepened our socio-economic relevance and having generated positive impacts across our stakeholder universe. It is therefore my pleasure to present to you the Integrated Annual Report and Financial Statements for the financial year ended 31 December 2021.
CONTEXT TO PERFORMANCE
Sri Lankan businesses demonstrated their characteristic resilience, with GDP expanding by 4.4% during the first 9 months of the year despite pandemic-led disruptions. The Government and the Central Bank of Sri Lanka (CBSL) continued to provide unprecedented support to pandemic-affected businesses, through grace periods, debt relief and moratoria. Although businesses demonstrated adaptability to operating under conditions of limited mobility, the pandemic’s impact on Government finances and the economy as a whole has been debilitating. With the collapse of international travel, the country’s tourism industry came to a standstill, and annual earnings of around USD 4 Bn generated through tourism declined drastically to USD 261 Mn in 2021. Meanwhile, worker remittances, a key source of foreign exchange income also fell by over 22% in 2021, reflecting border closures and
pandemic-induced job cuts in key markets. During the last few months of 2021, the fall in remittances have been significant at over 50%, as migrant workers have increasingly shifted towards informal channels, which offer a more attractive rate. These factors, together with significant international debt payments led to the gradual depletion of the country’s foreign reserves in 2021, inserting significant pressure on the external position and exchange rate. The CBSL imposed necessary and timely measures to curtail the outflow of foreign currency. Towards the latter part of the year, the CBSL also sought to tighten the monetary policy, increasing the Bank Rate, Standing Deposit Facility Rate, Standing Lending Facility Rate and Statutory Reserves Ratio on rupee deposit liabilities. Meanwhile, inflationary pressures have escalated, reflecting supply side disruptions and materialisation of pent-up demand.
The year 2021 provided a real opportunity to leverage the learnings of 2020 to accelerate solutions and sharpen competitive strengths aligned to the priorities of Voyage 2025 – NDB’s mid-term strategy spanning up to 2025. NDB was quick to seize this opportunity as the Group doubled down on its efforts to drive digital enablement, proactively shifting customers to secure and seamless digital platforms.
Eshana de SilvaChairman
13National Development Bank PLC Annual Report 2021

Against this backdrop, banks have been called upon to play a key role in driving the country’s economic recovery through supporting macro-economic stability and supporting the rehabilitation and revival of businesses.
LEARNING FROM THE PANDEMIC
For many organisations, including NDB, 2020 was characterised by responding and adapting to the dynamics presented by COVID-19. The year 2021, on the other hand, provided a real opportunity to leverage the learnings of 2020 to accelerate solutions and sharpen competitive strengths aligned to the priorities of Voyage 2025 – NDB’s mid-term strategy spanning up to 2025. NDB was quick to seize this opportunity as the Group doubled down on its efforts to drive digital enablement, proactively shifting customers to secure and seamless digital platforms. NDB’s strategic foresight in supporting the export sector through NDB Jayagamu Sri Lanka in 2020 placed the Group on a strong platform to drive aggressive growth in export-oriented industries - which is now considered to be the most vital sector in propelling Sri Lanka’s economy forward. These strategic initiatives and the progress made during the year are discussed in further detail in the Chief Executive Officer’s Review on page 15 of this Report. The Group also launched ‘NDB Cares’ a holistic response plan aimed at safeguarding our staff members and customers, and also the well-being of the wider community, while ensuring uninterrupted access to banking services. Through this programme, the Group implemented an array of comprehensive measures including transportation facilities, access to interim care centres and remote working arrangements. It was also extremely important to the Board of Directors that the Group did everything it could to support its customers through the dip in the economic cycle, which was driven through debt restructuring, advisory programmes and extension of additional credit.
COMPETENT LEADERSHIP
The importance of good governance is amplified during periods of volatility and uncertainty. During the year, the Board collectively sought to provide the executive team counsel and sounding board whenever it was required. We are privileged to welcome the Norwegian Investment Fund for developing countries - Norfund as the Bank’s largest shareholder, and I join my colleagues on the Board in welcoming Ms. (Fay) Piyachatr Chetnakarnkul as
Norfund’s representative on our Board. The partnership with Norfund has brought in fresh perspectives and international insights, which will be invaluable in pursuing the Group’s next phase of growth in a commercially, socially and environmentally responsible manner. I also welcome Ms. Chandima Dilrukshi who joined the Board during the year. The Board established the Digital Transformation Committee, facilitating deeper attention to this critical area of the Group’s Voyage 2025 strategy. The Board also spent significant time deliberating the potential implications of the economic conditions, pursuing avenues for raising capital and strengthening the Group’s Environment and Social Risk Management guidelines.
COMMITMENT TO STAKEHOLDERS
The Group has always adopted a multi-stakeholder approach to value creation and the conditions that prevailed during the year acted to strengthen our resolve in balancing stakeholder interests in delivering meaningful impacts. For our team, we worked towards creating an inclusive, engaged and conducive culture through ongoing engagement, opportunities for development and holistic change management programmes aligned to Voyage 2025. I am proud to note that NDB was re-certified with EDGE - Economic Dividends for Gender Equality for the ensuing two years, having been the first Sri Lankan corporate to obtain this certification in 2018. For customers, we offered holistic value propositions through unique initiatives such as NDB Jayagamu Sri Lanka and NDB Araliya while enhancing customer convenience and experience through increasing focus on digital platforms. In line with its corporate sustainability ambitions, the Group continued to direct investments towards building resilient communities and ecosystems through ongoing investments in supporting education, environmental literacy and biodiversity preservation. The Group’s strategic agility and smart execution enabled it to deliver on its shareholder commitments, with profit attributable to shareholders for the year increasing by 35%. Return on equity clocked in at 12.47%, up from 11.20% in 2020.
WAY FORWARD
Macro-economic stress is likely to remain in the short term given the country’s challenged external position, global headwinds and escalating inflation levels. Over the medium-term however, I am hopeful that 2022 will present considerable opportunities for growth, given the gradual recovery of the tourism sector, policy impetus towards driving exports, and stronger corporate earnings. I draw hope from the country’s remarkable resilience, that has time and again been demonstrated in its ability to emerge from crises as a stronger and more united nation.
APPRECIATION
Dr. Dinusha Panditaratne and Ms. Hiransa Kaluthanthri resigned from the Board during the year, and I take this opportunity to thank them for their invaluable contributions over the years. I join the Board in congratulating the CEO Mr. Dimantha Seneviratne and The Leadership Team for their tireless efforts in successfully driving the Bank’s transformation to a formidable force in the banking industry. The Bank’s success has been driven by the highly capable and committed team at NDB and I thank each and every one of them for their valuable contributions during the year. I wish to also thank my fellow Directors for their counsel during the year and look forward to working with them in the coming year. I would also like to take this opportunity to extend my gratitude and appreciation to the officials of the CBSL, our valuable customers, business partners and all other stakeholders who have been an integral part of the Bank’s success story.
Eshana de Silva Chairman
22 February 2022 Colombo
INSIDE INSIGHT LEADERSHIP REFLECTIONS FROM THE CHAIRMAN
14 National Development Bank PLC Annual Report 2021

CHIEF EXECUTIVE OFFICER’S REVIEW
Dear stakeholders
Resilient businesses not only endure threats but embrace change and transform for the better. With our operating landscape undergoing unprecedented change following the outbreak of the COVID-19 pandemic, the NDB Group responded swiftly and with empathy, harnessing the collective strength of our people, and culture to transform to a more competitive, impactful and responsive Bank. The Group’s resilience in 2021 has been testament to the soundness and insightfulness of its strategy, which has enabled us to truly support our customers and the nation while generating superior shareholder value. I am pleased to report that despite the numerous challenges that prevailed, the Group leveraged the strong foundations put in place over the past few years to deliver commendable strategic, operational and financial progress during the year.
VOYAGE 2025 - A BLUEPRINT FOR TRANSFORMATION
The Group launched the Voyage 2025 strategy in mid-2020, setting the wheels in motion to achieve its aspiration of being the “Primary Banking Group of Choice”. The foundations put in place to drive this strategic transformation enabled the Group to unlock unique opportunities presented by the external environment in 2021, offering strength in uncertainty. The Group’s strategic imperatives were aimed towards driving Customer Centricity through focusing on the five key pillars of Customer solutions, Business focus, Digital & data as transformers, Organisational realignment and Empowered staff. The progress made in each of these pillars is summarised below with further detail provided on pages 50 to 54 of this Report.
Customer Solutions: In line with the aspirations of Voyage 2025 the Group is committed to shifting from a product driven to a customer-centred approach, thereby achieving customer centricity by catering to individual requirements across the customer journey through personalised solutions. In 2021, this was actioned through the launch of family banking and tiered services, offering seamless access to Group services and solutions and strengthening customer interaction through close engagement and digital convenience. As a result, customer satisfaction levels recorded an improvement, and the Group increased its wallet share through leveraging cross-sell opportunities.
Business Focus: The Group directed targeted lending to support priority sectors of the economy, including exports, local manufacturing and agriculture. Strategic foresight in establishing a Transactional Banking Unit in 2020, enabled the Group
The Group’s resilience in 2021 has been testament to the soundness and insightfulness of its strategy, which has enabled us to truly support our customers and the nation while generating superior shareholder value. I am pleased to report that despite the numerous challenges that prevailed, the Group leveraged on the strong foundations put in place over the past few years to deliver commendable strategic, operational and financial progress during the year.
Dimantha SeneviratneDirector/Chief Executive Officer
INSIDE INSIGHT LEADERSHIP
15National Development Bank PLC Annual Report 2021
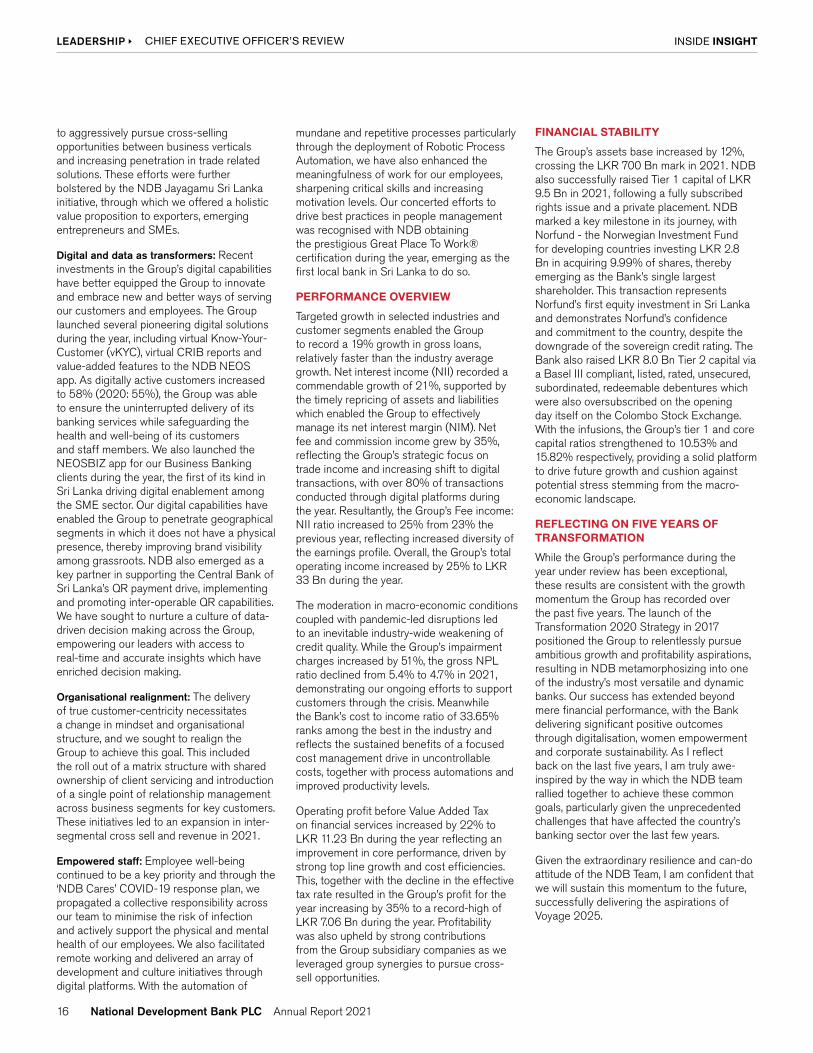
to aggressively pursue cross-selling opportunities between business verticals and increasing penetration in trade related solutions. These efforts were further bolstered by the NDB Jayagamu Sri Lanka initiative, through which we offered a holistic value proposition to exporters, emerging entrepreneurs and SMEs.
Digital and data as transformers: Recent investments in the Group’s digital capabilities have better equipped the Group to innovate and embrace new and better ways of serving our customers and employees. The Group launched several pioneering digital solutions during the year, including virtual Know-Your-Customer (vKYC), virtual CRIB reports and value-added features to the NDB NEOS app. As digitally active customers increased to 58% (2020: 55%), the Group was able to ensure the uninterrupted delivery of its banking services while safeguarding the health and well-being of its customers and staff members. We also launched the NEOSBIZ app for our Business Banking clients during the year, the first of its kind in Sri Lanka driving digital enablement among the SME sector. Our digital capabilities have enabled the Group to penetrate geographical segments in which it does not have a physical presence, thereby improving brand visibility among grassroots. NDB also emerged as a key partner in supporting the Central Bank of Sri Lanka’s QR payment drive, implementing and promoting inter-operable QR capabilities. We have sought to nurture a culture of data-driven decision making across the Group, empowering our leaders with access to real-time and accurate insights which have enriched decision making.
Organisational realignment: The delivery of true customer-centricity necessitates a change in mindset and organisational structure, and we sought to realign the Group to achieve this goal. This included the roll out of a matrix structure with shared ownership of client servicing and introduction of a single point of relationship management across business segments for key customers. These initiatives led to an expansion in inter-segmental cross sell and revenue in 2021.
Empowered staff: Employee well-being continued to be a key priority and through the ‘NDB Cares’ COVID-19 response plan, we propagated a collective responsibility across our team to minimise the risk of infection and actively support the physical and mental health of our employees. We also facilitated remote working and delivered an array of development and culture initiatives through digital platforms. With the automation of
mundane and repetitive processes particularly through the deployment of Robotic Process Automation, we have also enhanced the meaningfulness of work for our employees, sharpening critical skills and increasing motivation levels. Our concerted efforts to drive best practices in people management was recognised with NDB obtaining the prestigious Great Place To Work® certification during the year, emerging as the first local bank in Sri Lanka to do so.
PERFORMANCE OVERVIEW
Targeted growth in selected industries and customer segments enabled the Group to record a 19% growth in gross loans, relatively faster than the industry average growth. Net interest income (NII) recorded a commendable growth of 21%, supported by the timely repricing of assets and liabilities which enabled the Group to effectively manage its net interest margin (NIM). Net fee and commission income grew by 35%, reflecting the Group’s strategic focus on trade income and increasing shift to digital transactions, with over 80% of transactions conducted through digital platforms during the year. Resultantly, the Group’s Fee income: NII ratio increased to 25% from 23% the previous year, reflecting increased diversity of the earnings profile. Overall, the Group’s total operating income increased by 25% to LKR 33 Bn during the year.
The moderation in macro-economic conditions coupled with pandemic-led disruptions led to an inevitable industry-wide weakening of credit quality. While the Group’s impairment charges increased by 51%, the gross NPL ratio declined from 5.4% to 4.7% in 2021, demonstrating our ongoing efforts to support customers through the crisis. Meanwhile the Bank’s cost to income ratio of 33.65% ranks among the best in the industry and reflects the sustained benefits of a focused cost management drive in uncontrollable costs, together with process automations and improved productivity levels.
Operating profit before Value Added Tax on financial services increased by 22% to LKR 11.23 Bn during the year reflecting an improvement in core performance, driven by strong top line growth and cost efficiencies. This, together with the decline in the effective tax rate resulted in the Group’s profit for the year increasing by 35% to a record-high of LKR 7.06 Bn during the year. Profitability was also upheld by strong contributions from the Group subsidiary companies as we leveraged group synergies to pursue cross-sell opportunities.
FINANCIAL STABILITY
The Group’s assets base increased by 12%, crossing the LKR 700 Bn mark in 2021. NDB also successfully raised Tier 1 capital of LKR 9.5 Bn in 2021, following a fully subscribed rights issue and a private placement. NDB marked a key milestone in its journey, with Norfund - the Norwegian Investment Fund for developing countries investing LKR 2.8 Bn in acquiring 9.99% of shares, thereby emerging as the Bank’s single largest shareholder. This transaction represents Norfund’s first equity investment in Sri Lanka and demonstrates Norfund’s confidence and commitment to the country, despite the downgrade of the sovereign credit rating. The Bank also raised LKR 8.0 Bn Tier 2 capital via a Basel III compliant, listed, rated, unsecured, subordinated, redeemable debentures which were also oversubscribed on the opening day itself on the Colombo Stock Exchange. With the infusions, the Group’s tier 1 and core capital ratios strengthened to 10.53% and 15.82% respectively, providing a solid platform to drive future growth and cushion against potential stress stemming from the macro-economic landscape.
REFLECTING ON FIVE YEARS OF TRANSFORMATION
While the Group’s performance during the year under review has been exceptional, these results are consistent with the growth momentum the Group has recorded over the past five years. The launch of the Transformation 2020 Strategy in 2017 positioned the Group to relentlessly pursue ambitious growth and profitability aspirations, resulting in NDB metamorphosizing into one of the industry’s most versatile and dynamic banks. Our success has extended beyond mere financial performance, with the Bank delivering significant positive outcomes through digitalisation, women empowerment and corporate sustainability. As I reflect back on the last five years, I am truly awe-inspired by the way in which the NDB team rallied together to achieve these common goals, particularly given the unprecedented challenges that have affected the country’s banking sector over the last few years.
Given the extraordinary resilience and can-do attitude of the NDB Team, I am confident that we will sustain this momentum to the future, successfully delivering the aspirations of Voyage 2025.
INSIDE INSIGHT LEADERSHIP CHIEF EXECUTIVE OFFICER’S REVIEW
16 National Development Bank PLC Annual Report 2021

STRENGTHENING OUR DEFENSES
The pandemic has focused attention on how interdependent risks can insert significant pressure on businesses’ operating models, performance and stability. Against this backdrop, in line with our business growth we have sought to strengthen our control environment through robust risk management practices. The unprecedented shift to digital platforms has led to an inevitable increase in cybersecurity vulnerabilities and we placed strategic emphasis on strengthening our defenses through penetration testing, vulnerability assessments and ongoing investments in upgrading our security infrastructure. Given the challenged foreign currency reserves of the country, we prioritised the management of our foreign currency liquidity levels through effective management of net open positions, strict adherence to prudential limits and stress testing, whilst supporting client requests with limited resources through an equitable and transparent mechanism, underpinned by strong risk and governance oversight by the Board. From a business perspective, we
critical sectors of the economy. Key focus areas for 2022 will include driving our remittance inflows through partnerships offering a holistic value proposition to exporters through ecosystem partnerships, market access and advisory services and increasing focus on renewable energy, in line with the country’s aspirations to reduce dependence on fossil-fuel based power. In this regard, the engagement with the Development Finance Corporation of the USA towards a funding line of USD 75 Mn will auger well for the Bank, as these funds would be deployed towards uplifting SMEs and women-led businesses. Our economic contribution through taxes is also expected to increase following the imposition of a one-off surcharge tax of 25% for individuals and companies with a taxable income of more than LKR 2 Bn for the 2020/21 year of assessment as a proposal of the Government’s fiscal budget for 2022.
Following strong growth over the past few years, we will also seek to consolidate our portfolio, focusing on quality and profitability to ensure continued delivery of shareholder value. The Group is also keen to pursue inorganic growth opportunities in the region, as it enters its next phase of growth.
APPRECIATION
As we close another year of remarkable resilience, I would like to take this opportunity to place on record my appreciation to the Chairman and the Board of Directors for their valuable counsel in an extremely volatile year. The results set out before you are testament to the passion, commitment and professionalism of team NDB - our greatest asset, and I am deeply grateful to The Leadership Team and all our staff members for their remarkable efforts during the year. I extend my thanks to the Governor and officials of the Central Bank of Sri Lanka as well as the Sri Lanka Banks’ Association for their continued support. I also take this opportunity to thank our valued customers, shareholders, business partners and other stakeholders for their continued loyalty and look forward to their support and partnership in the coming year.
Thank you.
Dimantha Seneviratne Director/Chief Executive Officer
22 February 2022 Colombo
are also driving aggressive penetration in the export segment and widening our presence in overseas markets to enhance remittance inflows.
BUILDING RESILIENT COMMUNITIES
A range of disruptive forces including demographic trends, environmental and climate impacts, technological shifts and economic disparity are fueling the transformation of the global banking industry, which is increasingly under pressure to support the transition to a low-carbon economy and build a more equitable society. Against this backdrop, the Group is determined to leverage its unique skills and attributes in delivering broader social, environmental and economic value to stakeholders. Through unique initiatives such as Sri Lanka Vanithabhimana and NDB Jayagamu Sri Lanka, NDB is driving concerted efforts to support vulnerable segments and building resilient communities. During the year, we commenced our journey towards net zero, engaging Sri Lanka Climate Fund to verify the ‘Corporate Level GHG Emission Statement’ of the Bank. We firmly believe that our most significant sustainability impacts can be delivered through our lending portfolio and during the year we further strengthened our ESMS policy, procedures and training proposition in nurturing a culture of social and environmental consciousness. NDB also maintained its position as one of the most significant lenders to the renewable energy sector, having funded nearly 30% of such projects in Sri Lanka, over the last five years.
WAY FORWARD
Sri Lanka’s successful vaccination drive has renewed hope that we are now entering a phase with fewer restrictions, although we are cognisant that certain pandemic-led shifts in industry dynamics are likely to be permanent. Alongside the ongoing challenges of managing the risk of new variants and infections, Sri Lanka is facing considerable macro-economic challenges, stemming from the shortage of foreign currency. That said, the resumption of economic activity, together with policy thrust towards developing exporters and the gradual recovery of tourism activities provide reasons to be hopeful and we are optimistic that the country will successfully overcome the inevitable stresses that will arise in the short-term.
As a socio-economically impactful Bank, NDB is determined to support the country’s recovery through developing exporters, supporting customers following the expiry of moratoria and directing lending towards
Asset growth
16%
Loan growth
18%
Deposit growth
22%
PBT growth
14%
NIM
CASA ratio
Cost to income ratio
Loans to deposits
Consistently solid growthCAGR (2016-2021)
Transformative results
2016 2021
2.64%
22.87%
49.04%
114.62%
3.25%
27.25%
33.65%
95.31%
INSIDE INSIGHT LEADERSHIP CHIEF EXECUTIVE OFFICER’S REVIEW
17National Development Bank PLC Annual Report 2021

BOARD OF DIRECTORS
Mr. Sujeewa Mudalige Non-Executive
Independent Director
Ms. Chandima DilrukshiNon-Executive
Non-Independent Director
Mr. Eshana de SilvaChairman
Non-Executive Independent Director
Mr. Sriyan CoorayNon-Executive
Independent Director
Mr. Bernard SinniahNon-Executive
Non-Independent Director
INSIDE INSIGHT LEADERSHIP
18 National Development Bank PLC Annual Report 2021

Mr. Kushan D’Alwis, PCNon-Executive
Independent Director
Ms. Shehani RanasingheCompany Secretary
Ms. (Fay) Piyachatr ChetnakarnkulNon-Executive
Non-Independent Director
Mr. Dimantha SeneviratneChief Executive Officer
Non-Independent Director
Mr. Hiran PereraNon-Executive
Non-Independent Director
INSIDE INSIGHT LEADERSHIP BOARD OF DIRECTORS
19National Development Bank PLC Annual Report 2021

Mr. Eshana de SilvaChairman
Non-Executive Independent Director
Mr. Dimantha SeneviratneChief Executive Officer
Executive Non-Independent Director
Skills and experience
Mr. Eshana de Silva was appointed as Director and Chairman of the Bank on 14 May 2020. Having built his career in the business world, Mr. de Silva has previously played a pivotal role in Pan Asia Banking Corporation PLC (PABC) as its Director, Deputy Chairman and Chairman respectively in 2008, 2012 and 2016. He retired as Chairman of PABC in 2017 after 9 years of service. Whilst with PABC, Mr. de Silva was also Chairman of the Board Credit Committee and the Board Related Party Transaction Review Committee. Mr de Silva also bags experience from his
Skills and experience
Mr. Dimantha Seneviratne, Chief Executive officer (CEO) of the Bank, counts 32 years in the banking industry. Prior to joining the Bank he was the Director/ CEO of Pan Asia Banking Corporation PLC (PABC) and prior to that, he spent 15 years with the HSBC Group, where he held key senior management positions including the Chief Risk Officer post for Sri Lanka and Maldives, Bangladesh and Thailand where he was also responsible for business growth, strategy and governance in those respective geographies as a member of the Country Leadership Team.
Mr. Seneviratne commenced his banking career with Sampath Bank and has also served in Overseas Trust Bank, Colombo Branch and Saudi British Bank, Saudi Arabia prior to joining HSBC.
Date of appointment 14 May 2020
Date of appointment 01 January 2017
Length of Service as a Director
1 year 7 months
Length of Service as a Director
5 years
Date of Last Re-election/ Re-appointment as a Director
25 June 2020
Date of Last Re-election/ Re-appointment as a Director
N/A
services rendered as a Director of the Board of Investment (BOI) from 2007-2013 where he also served as Chairman of the BOI Audit Committee. He has also served as a Board Member of the Sri Lanka Ports Authority from 2008-2013. His experience and expertise spans over 20 years.
Mr. de Silva is professionally qualified as a Member by the Institute of Certified Professional Managers (CPM) and an Associate Member by the United Kingdom Association of Professionals. He is also certified in Diplomacy by the University of London.
Mr. Seneviratne holds a MBA from the Postgraduate Institute of Management, University of Sri Jayawardenapura, and BSc, from the same University. He is a Senior Fellow Member (SFIB) of the Institute of Bankers, Sri Lanka and a Post Graduate Diploma Holder in computer system design from NIBM. He is a CIMA passed finalist and has successfully completed the High Potential Leadership Programme at the Harvard Business School, Boston, USA, in 2016.
He was the former Chairman of Sri Lanka Banks’ Association (Guarantee) Limited and a Past President of The Association of Professional Bankers (APB) Sri Lanka, having held various positions in the Executive Council of the APB for over a decade. He was also a Director of Lanka Clear (Pvt) Ltd.
Concurrent appointments
Chairman of many companies including the Esna Group of companies, Hanjin Shipping Lanka, Shermans Logistic (Pvt) ltd, Star Leisure (Pvt) Ltd, Esna Holidays (Pvt) Ltd and Director of several other companies in the Interocean Group and the Sherman Sons Group. Mr. de Silva is also a Director of Fortress Resorts PLC, the Honorary Consul for the Republic of Kazakhstan since 2011 and a Member of the Governing Council in the University of Moratuwa.
As at 31 December 2021 Mr. de Silva held office as Director in a total number of 20 companies (including the Bank).
Concurrent appointments
Chairman, Development Holdings (Pvt) Ltd, Director Credit Information Bureau - Sri Lanka, The American Chamber of Commerce in Sri Lanka and several subsidiaries of the Bank. He was also re-appointed to serve as a Director of Sri Lanka Banks’ Association (Guarantee) Limited in 2021.
As at 31 December 2021 Mr. Seneviratne held office as Director in a total number of 12 Companies (including the Bank and Group companies).
INSIDE INSIGHT LEADERSHIP BOARD OF DIRECTORS
20 National Development Bank PLC Annual Report 2021

Mr. Sriyan Cooray
Non-Executive Independent Director
Mr. Bernard SinniahNon-Executive Non-Independent Director
Skills and experience
An accomplished banker with 28 years of experience at HSBC, Mr. Cooray has served in a wide range of areas ranging from Finance, Operations, Compliance, Administration and Retail Banking at HSBC and retired from HSBC - Sri Lanka and Maldives as the Chief Operating Officer in May 2018. He also functioned in the position of Acting CEO over the last 10 years at HSBC.
Skills and experience
A veteran banker, Mr. Sinniah retired in 2018 as Managing Director of Citibank and Global Head of FX Corporate Sales and e-FX Solutions after 38 illustrious years of service, having started his career at Citibank Colombo, then moving to Citibank Australia, and ending his career based out of London.
Date of appointment 10 August 2018
Date of appointment 28 March 2019
Length of Service as a Director
3 years 4 months
Length of Service as a Director
2 years 9 months
Date of Last Re-election/ Re-appointment as a Director
09 April 2021
Date of Last Re-election/ Re-appointment as a Director
25 June 2020
Prior to joining HSBC, Mr. Cooray was Financial Controller of Speville M & W Ltd (1987 - 1990) and prior to that engaged with KPMG Ford Rhodes Thornton & Company, Chartered Accountants.
Mr. Cooray is a fellow of the Chartered Institute of Management Accountants.
Mr. Sinniah holds a Masters in Applied Finance (Macquarie University, Australia). He has also recently added to his proficiency, knowledge on Digital Transformation Strategies, conducted by the Judge Business School – University of Cambridge – UK and further on Digital Transformation, Strategies for Success, conducted by the MIT Sloan School of Management.
Concurrent appointments
Director, Orient Finance PLC
As at 31 December 2021 Mr. Cooray held office as Director in a total number of 2 Companies (including the Bank).
Concurrent appointments
Director Transact Lanka, Codevus (Pvt) Ltd, Youcan (UK), Knightsbridge eCommerce, SenzAgro, Arogya (US) and several subsidiaries of the Bank.
As at 31 December 2021 Mr. Sinniah held office as Director in a total number of 13 Companies (including the Bank and Group companies).
Mr. Sujeewa Mudalige Non-Executive Independent Director
Skills and experience
Mr. Mudalige counts over 32 years of experience as a Chartered Accountant. His qualifications are FCA (ICA - SL), FCMA (CIMA – UK), FCCA (ACCA – UK) and FCPA (CPA – Australia).
Mr. Mudalige has vast experience as an Audit Committee Chair in both public and private sector organisations. He is a past President of ICASL and has been a member of the Council of ICASL and of the governing board of CIMA UK, Sri Lanka Division, a Commission member of the Securities and Exchange Commission of Sri Lanka and held several such other positions locally and globally during the span of his career.
Date of appointment 06 January 2020Length of Service as a Director
1 year 11 months
Date of Last Re-election/ Re-appointment as a Director
25 June 2020
Mr. Mudalige was a Non-Executive Independent Director of Hatton National Bank PLC (HNB) from 2012 to 2019 and was a Chair and member of several of its Board subcommittees during his tenure with HNB. He was also the Deputy Chairman of the Financial System Stability Consultative Committee of the CBSL.
Concurrent appointments
Managing Partner of PwC, Sri Lanka and a Director of its related companies and Non-Executive Chairman of Mercantile Services Provident Society. He is also an Independent Non-Executive Director at CIC Holdings PLC, CIC Feeds group, NSBM Green University, Link Natural Products Limited and Alethea School. He
also serves as a committee member of the Ceylon Chamber of Commerce. Mr. Mudalige’s recent appointments include his appointment as a Non-Executive Chairman to a Government appointed Committee to advice the Cabinet on possible regulations, acts and laws in crypto currency mining, digital-driven banking, adoption of crypto currencies and block chain technologies. He is also a member of the Financial System Stability Consultative Committee (FSSCC) and Advisory Committee for Revival of Failed Licensed Finance Companies.
As at 31 December 2021 Mr. Mudalige held office as Director in a total number of 9 Companies (including the Bank).
INSIDE INSIGHT LEADERSHIP BOARD OF DIRECTORS
21National Development Bank PLC Annual Report 2021

Mr. Hiran Perera Non-Executive Non-Independent Director
Skills and experience
Counting a period of 28 years as a Corporate Banker, Mr. Perera has held various senior management positions in HSBC and also gained experience in overseas banking. He was also the Acting Chief Risk Officer and Head of Wholesale Risk, Sri Lanka and Maldives. He was a member of the management committee and was identified
Date of appointment 23 April 2020Length of Service as a Director
1 year 8 months
Date of Last Re-election/ Re-appointment as a Director
09 April 2021
for HSBC’s talent pool. He was also a former corporate trainer in the Middle East for international trade and corporate lending.
Mr. Perera joined Softlogic in 2013 to head its treasury function excluding the two regulated companies of the Group. He was also a director of the board of Softlogic Finance PLC.
Concurrent appointments
Director Group Treasury, Softlogic Holdings PLC (Non-Board member).
As at 31 December 2021 Mr. Perera held office as Director in 1 company (the Bank).
Mr. Kushan D’Alwis, President’s CounselNon-Executive Independent Director
Ms. (Fay) Piyachatr Chetnakarnkul Non-Executive Non-Independent Director
Skills and experience
Mr. Kushan D’Alwis, an Attorney-at-Law, was appointed as President’s Counsel in 2012. He possesses over 36 years of experience in the legal fraternity extensively practicing in the fields of civil, corporate, commercial and administrative law before the Supreme Court, Court of Appeal, Civil Appellate High Court, Commercial High Court and District Courts within Sri Lanka. He also has experience in alternate dispute resolution mechanisms such as arbitration, advising on corporate legal matters, regulatory frameworks, compliance requirements and legal due diligence.
Skills and experience
Ms. Chetnakarnkul carries with her knowledge and experience in Economics, Information Technology and Investments. She joined the Board in 2021 to represent the interests of The Norwegian Investment Fund for Developing Countries (NORFUND). Ms. Chetnakarnkul holds a Master’s Degree in Arts – in Quantitative Methods and Economic Theory and Southeast Asia Studies, School of Advanced International Studies (SAIS), Johns Hopkins University (Washington D.C.) and a Bachelor’s Degree in Economics (International Program) from Thammasat
Date of appointment 06 July 2020
Date of appointment 25 May 2021
Length of Service as a Director
1 year 6 months
Length of Service as a Director
7 months
Date of Last Re-election/ Re-appointment as a Director
09 April 2021
Date of Last Re-election/ Re-appointment as a Director
*N/A
Mr. D’Alwis has served as a Member of the Law Commission of Sri Lanka, Member of the Public Representations Committee on Constitutional Reforms, Member of the Panel of Legal Advisors to the Tax Appeals Commission, Member of the National Council for Economic Development (NCED) of the Ministry of Finance and Planning, Vice Chairman of the Rent Board of Review, Member of the Executive Committee of the Bar Association of Sri Lanka, Representative of the Sri Lanka Bar Association to the Business Recovery and Insolvency Practitioners’ Association of Sri Lanka (BRIPASL), Vice President of the Colombo
University, Bangkok. She has also followed the Director Certification Program (DCP 184, Board Training) of the Institute of Directors of Thailand (Bangkok) and a Fintech certification course at the Massachusetts Institute of Technology (MIT).
As the Investment Director, Head of Asia Region of NORFUND, Ms. Chetnakarnkul has been responsible for founding NORFUND’s Asia office and for building, leading, and managing NORFUND’s investments in Asia. Prior to joining NORFUND, she worked at the International Finance Corporation (IFC) / The World Bank Group.
Law Society and Vice Chairman of the Civil Aviation Authority of Sri Lanka.
Concurrent appointments
Director, Lanka Hospitals Corporation PLC and Vurthiya Lanka (Pvt) Ltd. Mr. D’Alwis is also a member of the Financial System Stability Consultative Committee (FSSCC) Board of Investment of Sri Lanka and the Chairman of the Office of National Unity and Reconciliation.
As at 31 December 2021 Mr. D’Alwis held office as Director in a total number of 3 companies (including the Bank).
Concurrent appointments
Investment Director, Head of Asia Region (Bangkok, Thailand) of the Norwegian Investment Fund for Developing Countries (“NORFUND”) and a Director of Yoma Bank, Myanmar.
As at 31 December 2021 Ms. Chetnakarnkul held office as Director in a total number of 2 companies (including the Bank).
*The appointment of Ms. Chetnakarnkul was approved by the shareholders of the Bank at the EGM held on 09 April 2021.
INSIDE INSIGHT LEADERSHIP BOARD OF DIRECTORS
22 National Development Bank PLC Annual Report 2021

Ms. Chandima Dilrukshi Non-Executive Non-Independent Director
Ms Shehani Ranasinghe Company Secretary
Skills and experience
Ms. Chandima Dilrukshi is an officer of the Sri Lanka Accountants’ Service, with an experience over 19 years in the public service. She is presently working as a Director of the Department of Fiscal Policy. Prior to that, she worked as a Director at the Department of Public Enterprises and was responsible for monitoring State Owned Enterprises in the Banking, Insurance and Finance sector. Ms. Dilrukshi has also represented the General Treasury on the Boards of Sri Lanka Export Credit Insurance Corporation, Lankaputhra Development Bank Ltd, Sri Lanka Insurance Corporation Ltd and Litro Gas Lanka Ltd.
Date of appointment 21 June 2021Length of Service as a Director
6 months
Date of Last Re-election/ Re-appointment as a Director
N/A
She is a Fellow Member of the Institute of Chartered Accountants of Sri Lanka and holds a Special Degree in Accountancy and Financial Management from the University of Sri Jayawardhanapura, Master of Business Administration from the International University of Japan, a Diploma in Procurement and Contract Administration and a Diploma in Business Communication from the Institute for Government Accounts and Finance.
Concurrent appointments
Ms. Dilrukshi serves as a Director on the Board of Directors of the Urban Development Authority and Postgraduate Institute of Management and is a Director
of the Department of Fiscal Policy. Since December 2018, she has been functioning as the Finance Manager on acting basis at the Rooftop Solar Power Generation Project, which is funded by the Asian Development Bank. She also serves as a visiting lecturer at the Sri Lanka Institute of Development Administration and represents number of technical evaluation committees and project committees to assist the standing cabinet appointed procurement committees including that of Srilankan Airlines, Ceylon Electricity Board and National Water Supply & Drainage Board.
As at 31 December 2021 Ms. Dilrukshi held office as Director in a total number of 4 Companies (including the Bank)
Ms. Shehani Ranasinghe was appointed as the Company Secretary of the Bank in 2012. She was formerly attached to the Legal Department of the Bank where she gained experience in corporate banking and financial law, investment banking and legal advisory services during her career spanning over 28 years with the Bank. She has also functioned as the Company Secretary of several subsidiary companies of the Bank prior to her appointment as the Company Secretary of the Bank. She is an Attorney-at-Law (Hons) of the Supreme Court of Sri Lanka, a Notary Public, Commissioner for Oaths, Qualified Company Secretary and earned her Bachelor of Arts (Hons) degree from the University of Colombo.
Concurrent appointments
None
INSIDE INSIGHT LEADERSHIP BOARD OF DIRECTORS
23National Development Bank PLC Annual Report 2021

THE LEADERSHIP TEAM
01 Mr. Dimantha Seneviratne Director/Chief Executive Officer
02 Mr. Sanjaya Perera Senior Vice President - Personal Banking and Customer Experience
03 Mr. Deepal Akuretiyagama Chief Operating Officer
04 Mr. Niran Mahawatte Vice President - Treasury
05 Mr. Indika Ranaweera Vice President - SME, Middle Market and Business Banking
06 Ms. Ishani Palliyaguru Vice President - Project Finance & Corporate Credit Control
07 Mr. K V Vinoj Vice President - Wholesale Banking
08 Mr. Zeyan Hameed Vice President - Branch Network Management & Product Development
09 Ms. Shanti Gnanapragasam Vice President/Chief Risk Officer
10 Ms. Suvendrini Muthukumarana Vice President - Finance
02 03
05
06
07
0915
1416
12
INSIDE INSIGHT LEADERSHIP
24 National Development Bank PLC Annual Report 2021
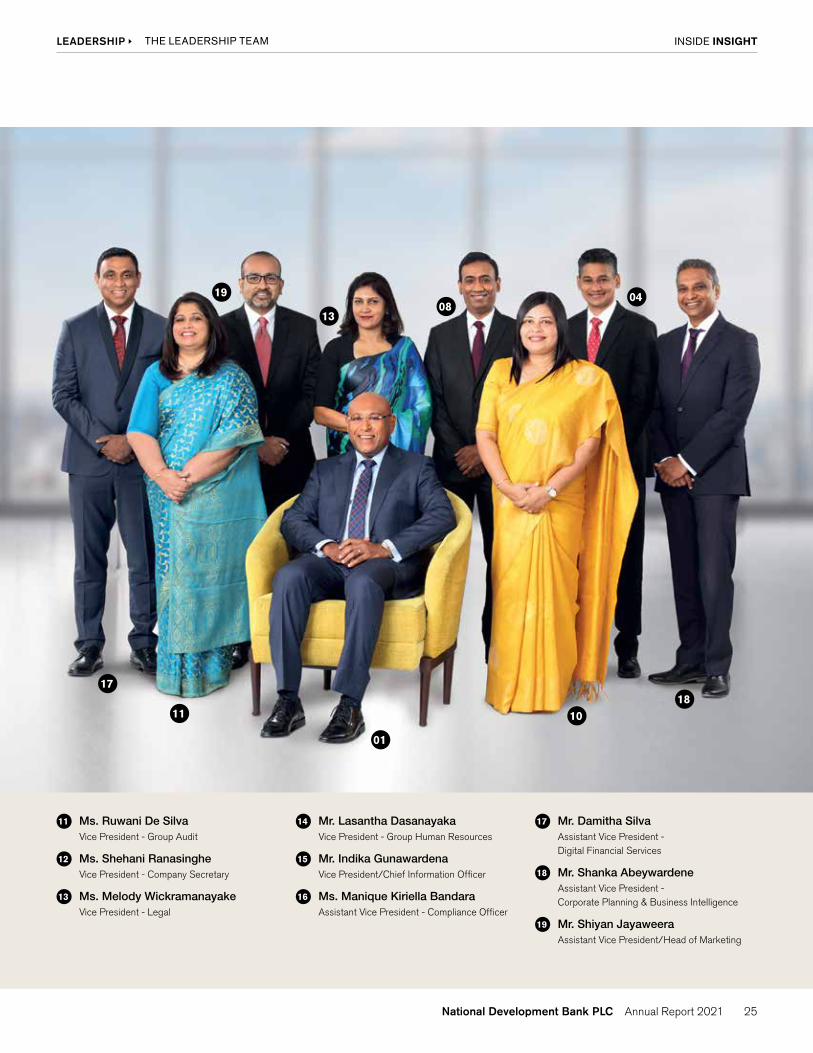
11 Ms. Ruwani De Silva Vice President - Group Audit
12 Ms. Shehani Ranasinghe Vice President - Company Secretary
13 Ms. Melody Wickramanayake Vice President - Legal
14 Mr. Lasantha Dasanayaka Vice President - Group Human Resources
15 Mr. Indika Gunawardena Vice President/Chief Information Officer
16 Ms. Manique Kiriella Bandara Assistant Vice President - Compliance Officer
17 Mr. Damitha Silva Assistant Vice President - Digital Financial Services
18 Mr. Shanka Abeywardene Assistant Vice President - Corporate Planning & Business Intelligence
19 Mr. Shiyan Jayaweera Assistant Vice President/Head of Marketing
01
04
18
08
1011
13
19
17
INSIDE INSIGHT LEADERSHIP THE LEADERSHIP TEAM
25National Development Bank PLC Annual Report 2021
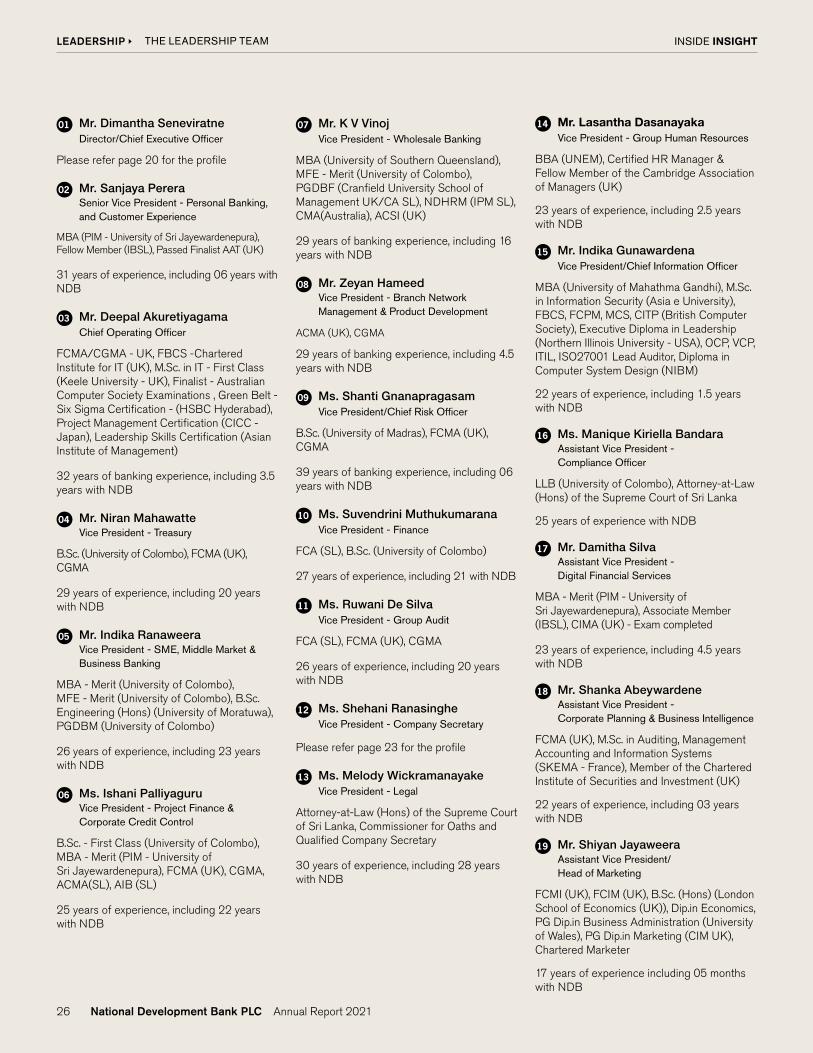
01 Mr. Dimantha Seneviratne Director/Chief Executive Officer
Please refer page 20 for the profile
02 Mr. Sanjaya Perera Senior Vice President - Personal Banking, and Customer Experience
MBA (PIM - University of Sri Jayewardenepura), Fellow Member (IBSL), Passed Finalist AAT (UK)
31 years of experience, including 06 years with NDB
03 Mr. Deepal Akuretiyagama Chief Operating Officer
FCMA/CGMA - UK, FBCS -Chartered Institute for IT (UK), M.Sc. in IT - First Class (Keele University - UK), Finalist - Australian Computer Society Examinations , Green Belt - Six Sigma Certification - (HSBC Hyderabad), Project Management Certification (CICC - Japan), Leadership Skills Certification (Asian Institute of Management)
32 years of banking experience, including 3.5 years with NDB
04 Mr. Niran Mahawatte Vice President - Treasury
B.Sc. (University of Colombo), FCMA (UK), CGMA
29 years of experience, including 20 years with NDB
05 Mr. Indika Ranaweera Vice President - SME, Middle Market & Business Banking
MBA - Merit (University of Colombo), MFE - Merit (University of Colombo), B.Sc. Engineering (Hons) (University of Moratuwa), PGDBM (University of Colombo)
26 years of experience, including 23 years with NDB
06 Ms. Ishani Palliyaguru Vice President - Project Finance & Corporate Credit Control
B.Sc. - First Class (University of Colombo), MBA - Merit (PIM - University of Sri Jayewardenepura), FCMA (UK), CGMA, ACMA(SL), AIB (SL)
25 years of experience, including 22 years with NDB
07 Mr. K V Vinoj Vice President - Wholesale Banking
MBA (University of Southern Queensland), MFE - Merit (University of Colombo), PGDBF (Cranfield University School of Management UK/CA SL), NDHRM (IPM SL), CMA(Australia), ACSI (UK)
29 years of banking experience, including 16 years with NDB
08 Mr. Zeyan Hameed Vice President - Branch Network Management & Product Development
ACMA (UK), CGMA
29 years of banking experience, including 4.5 years with NDB
09 Ms. Shanti Gnanapragasam Vice President/Chief Risk Officer
B.Sc. (University of Madras), FCMA (UK), CGMA
39 years of banking experience, including 06 years with NDB
10 Ms. Suvendrini Muthukumarana Vice President - Finance
FCA (SL), B.Sc. (University of Colombo)
27 years of experience, including 21 with NDB
11 Ms. Ruwani De Silva Vice President - Group Audit
FCA (SL), FCMA (UK), CGMA
26 years of experience, including 20 years with NDB
12 Ms. Shehani Ranasinghe Vice President - Company Secretary
Please refer page 23 for the profile
13 Ms. Melody Wickramanayake Vice President - Legal
Attorney-at-Law (Hons) of the Supreme Court of Sri Lanka, Commissioner for Oaths and Qualified Company Secretary
30 years of experience, including 28 years with NDB
14 Mr. Lasantha Dasanayaka Vice President - Group Human Resources
BBA (UNEM), Certified HR Manager & Fellow Member of the Cambridge Association of Managers (UK)
23 years of experience, including 2.5 years with NDB
15 Mr. Indika Gunawardena Vice President/Chief Information Officer
MBA (University of Mahathma Gandhi), M.Sc. in Information Security (Asia e University), FBCS, FCPM, MCS, CITP (British Computer Society), Executive Diploma in Leadership (Northern Illinois University - USA), OCP, VCP, ITIL, ISO27001 Lead Auditor, Diploma in Computer System Design (NIBM)
22 years of experience, including 1.5 years with NDB
16 Ms. Manique Kiriella Bandara Assistant Vice President - Compliance Officer
LLB (University of Colombo), Attorney-at-Law (Hons) of the Supreme Court of Sri Lanka
25 years of experience with NDB
17 Mr. Damitha Silva Assistant Vice President - Digital Financial Services
MBA - Merit (PIM - University of Sri Jayewardenepura), Associate Member (IBSL), CIMA (UK) - Exam completed
23 years of experience, including 4.5 years with NDB
18 Mr. Shanka Abeywardene Assistant Vice President - Corporate Planning & Business Intelligence
FCMA (UK), M.Sc. in Auditing, Management Accounting and Information Systems (SKEMA - France), Member of the Chartered Institute of Securities and Investment (UK)
22 years of experience, including 03 years with NDB
19 Mr. Shiyan Jayaweera Assistant Vice President/ Head of Marketing
FCMI (UK), FCIM (UK), B.Sc. (Hons) (London School of Economics (UK)), Dip.in Economics, PG Dip.in Business Administration (University of Wales), PG Dip.in Marketing (CIM UK), Chartered Marketer
17 years of experience including 05 months with NDB
INSIDE INSIGHT LEADERSHIP THE LEADERSHIP TEAM
26 National Development Bank PLC Annual Report 2021

SENIOR MANAGEMENT
Ms. Camy SomasunderamAssistant Vice President - Customer Experience & Contact CentreMBA (University of Wales - UK), CIM Dip. (UK)
27 years of experience in banking
Mr. Gihan PunchihewaAssistant Vice President - Privilege Select BankingLL.M Master of Laws (Business with Finance) (Cardiff Metropolitan University - UK), MBA (Anglia Ruskin University - UK), BA (Hons) - First Class - (University of Wales), PG Dip. in Business Strategy (ABP - UK), PQHRM (CIPM - SL), ADBM (NIBM)
16 years of experience in banking
Mr. Vijitha WettimunyAssistant Vice President - AdministrationGraduated from Military Academy as Commissioned Officer of Sri Lanka Air Force
11 years of experience with 2.5 years in banking
Mr. Amal YapaAssistant Vice President - Wholesale BankingBBA (University of Houston - Texas)
28 years of experience in banking
Mr. Sameera SenerathAssistant Vice President - SalesDip.M (CIM - UK), Dip in Banking and Finance (AIB)
21 years of experience in banking
Mr. Sunil KarunaratneAssistant Vice President - TreasuryMBA (University of Western Sydney)
36 years of experience in banking
Ms. Ronali KumarasingheAssistant Vice President - Wholesale BankingMBA (University of Colombo), B. Com (University of Colombo), MCIM (UK)
26 years of experience in banking
Ms. Ganga WanigaratneAssistant Vice President - Operations - Trade Finance, Payments and Treasury Operations36 years of experience in banking
Mr. Damitha SamaranayakeAssistant Vice President - TreasuryAssociate Member (IBSL), ACI Dealing Certificate - Paris
30 years of experience in banking
Ms. Anushca SaranapalaAssistant Vice President - Group Risk Management39 years of experience in banking
Mr. Indika TennakoonAssistant Vice President - Retail Credit and OperationsMBA - Merit (University of Colombo), MFE - Merit (University of Colombo), B.Sc. Physical Science (University of Colombo)
29 years of experience in banking
Mr. Indika KudagamageAssistant Vice President - Business Banking, SME, Micro Finance & LiabilitiesBachelor of Engineering - First Class (Birla Institute of Technology - India), MAFE - Merit (University of Colombo), MIISE (USA)
25 years of experience in banking
Ms. Shareen JayasuriyaAssistant Vice President - CreditFCMA (UK), CGMA, CIM Dip. (UK), ACSI
28 years of experience with 26 years in banking
Mr. Priyantha GamageAssistant Vice President - Branch OperationsMBA (University of Southern Queensland), PG Dip. in Business & Finance (ICASL), CISSP (ISC2-USA), CISI (UK) - Risk in Financial Services
27 years of experience in banking
Mr. Ajith SenadheeraAssistant Vice President - LeasingMBA (University of Colombo), B.Sc. Business Administration (University of Sri Jayewardenepura)
34 years of experience in banking (Retired w.e.f. 15 February 2022)
Mr. Sydney DownallAssistant Vice President - Colombo Region & Product DevelopmentMBA (University of Southern Queensland), Dip.M (CIM - UK)
28 years of experience in banking
INSIDE INSIGHT LEADERSHIP
27National Development Bank PLC Annual Report 2021

Mr. Nilanga GajabaAssistant Vice President - Centralised RecoveriesMBA (Cardiff Metropolitan University - UK), PG Dip. (IBSL), CISI (UK) - Risk in Financial Services
29 years of experience in banking
Mr. Lasantha MathupalaAssistant Vice President -Information TechnologyMBCS, PMI, ISACA, PCI Implementer, B.Sc. (Hons), PG Dip. in Computer Science (University of Sri Jayewardenepura)
31 years of experience with 21 years in banking
Mr. Sanath SusanthaChief Manager - LeasingMBA (University of Ruhuna), B.Sc. in Physical Science (University of Colombo)
32 years of experience in banking
Mr. Ruwan JayamahaChief Manager - Business BankingMBA (University of Colombo), B.Sc. - First Class (University of Colombo), Advanced Dip. in Management (CIMA)
26 years of experience with 25 years in banking
Mr. Amila WithanageAssistant Vice President - Information TechnologyMBA (University of Colombo), MSc-IT (University of Colombo), B.Sc. (University of Kelaniya), PMP, ITIL-v4, VCP, OCP
18 years of experience with 3.5 years in banking
Ms. Nadie SamarasenaChief Manager - Product DevelopmentMBA (PIM - University of Sri Jayewardenepura), ACMA (UK), CGMA, B.Sc. - First Class (University of Colombo)
23 years of experience in banking
Mr. Supun PereraChief Manager - Project FinanceB.Sc. in Engineering (Hons) (University of Moratuwa), (IESL), CFA Charterholder (CFA), ACMA (UK), CGMA, BIT (University of Colombo)
12 years of experience with 11 years in banking
Mr. Chandima AlwisRegional Manager - Greater Colombo RegionFCA (SL)
30 years of experience with 24 years in banking
Ms. Rasika DassanayakeChief Manager - Mid Corporate and Credit StructuringB.Sc. in Accountancy (Sp.) - First Class (University of Sri Jayewardenepura), ACA (SL)
21 years of experience in banking
Ms. Manik BotejuChief Manager - Project FinanceB.Sc. in Management (University of London)
19 years of experience in banking
Mr. Romesh TisseraRegional Manager - North Western Region30 years of experience in banking
Mr. Thusitha BoyagodaChief Manager - Business bankingB.Sc. (Hons.) in Agriculture, Second Class Upper (University of Peradeniya), PG Dip. in Business Administration (University of Peradeniya)
27 years of experience with 25 years in banking
Ms. Darine Fernando Chief Manager - Wholesale Banking MBA (Edith Cowen University - Australia), Dip. in Corporate Banking (IBSL)
31 years of experience in banking
Mr. Sanjeev KulendranAssistant Vice President - Internal AuditB.Sc. (University of Madras), Associate Member - Financial Services Institute of Australasia, Associate Member (IBSL)
29 years of experience in banking
Ms. Vidisha JayawardenaAssistant Vice President - LegalAttorney-at-Law (Hons) of the Supreme Court of Sri Lanka, Notary Public, Commissioner for Oaths, Qualified Company Secretary
29 years of experience in banking
Ms. Dayani AlgamaAssistant Vice President - Human ResourcesBA (Hons) (University of New Delhi), Masters in Development Studies (University of Colombo)
30 years of experience with 23 years in banking
INSIDE INSIGHT LEADERSHIP SENIOR MANAGEMENT
28 National Development Bank PLC Annual Report 2021

Mr. Malake HerathChief Manager - Wholesale BankingFCA (SL), MBA (PIM - University of SriJayewardenepura), B.Sc in Accountancy(Sp.) - Second Class Upper (University of Sri Jayewardenepura)
20 years of experience with 17 years in banking
Mr. Nishantha AmunugamaChief Manager - Centralised RecoveriesMBA (University of Southern Queensland), PG Dip. in Business & Finance (ICASL)
25 years of experience with 23 years in banking
Mr. Ranisha PereraChief Manager - Human ResourcesBBA (Business University of Costa Rica), G Dip. in Management (Cambridge Academy of Management), Adv. Dip. in Teaching, Training & Assessing (City & Guilds), Certified HR Business Partner (AON), Adv. Dip. in HRM (EIPE), Applied Lean Six Sigma Practitioner (SSMI),Executive Certificate in HR Analytics (CIPM)
17 years of experience with 15 years in banking
Mr. Thilanke WeerasingheChief Manager - Transaction BankingMBA (University of Colombo), BA (Hons) in Leadership and Management (Northumbria University- UK), PG Dip. (CIM – UK) CITF (London Institute of Banking & Finance),CSDG (London Institute of Banking & Finance),CSCF (London Institute of Banking & Finance)
17 years of experience in banking
Ms. Madara AriyaratneChief Manager - LegalAttorney-at-Law (Hons) of the Supreme Court of Sri Lanka, Notary Public, Commissioner for Oaths and Qualified Company Secretary, BA (Hons) (University of Sri Jayewardenepura)
28 years of experience in banking
Mr. Chandima KannangaraChief Manager - ComplianceMBA (University of Honolulu - USA), Dip. in Banking and Finance (IBSL), Dip. in Compliance (IBSL), PG Dip. in Bank Management (IBSL), CAMS (Association of Certified Anti Money Laundering Specialists)
29 years of experience in banking
Mr. Himansu WickramasingheChief Manager - Wholesale Banking AIB (Sri Lanka), MBA (University of Colombo)
29 years of experience in banking
Ms. Anushi VithanageChief Manager - LegalLL.M-Master of Laws (with Company Law and Banking Law) (University of Colombo), Post Attorney Diploma in Banking Law and Insurance Law - Merit (Sri Lanka Law College), Attorney-at-Law (Hons) of the Supreme Court of Sri Lanka, Notary Public, Commissioner for Oaths, Qualified Company Secretary
27 years of experience in banking
Ms. Dilhani PiyasenaChief Manager - Digital Financial ServicesMBA (PIM - University of Sri Jayewardenepura), B.Sc. - First Class (Nagarjuna University - India)
28 years of experience in banking
Ms. Aloka EkanayakeChief Manager - Corporate Planning and Business IntelligenceACA (SL), ACMA (UK), CGMA, MBA (University of Leicester)
27 years of experience in banking
Mr. Deepa EdirisooriyaChief Manager - Digital Financial Services MBA (Cardiff Metropolitan University - UK), B.Sc.(Hons) in Business Information Technology-Second Class Upper (University of Greenwich - UK)
15 years of experience in banking
Ms. Lilanthi DelgodaChief Manager - Human ResourcesM.Sc. in HRM&D (University of Salford - UK), IPMA - HR (USA), Senior Certified Professional, Attorney-at-Law of the Supreme Court of Sri Lanka, Notary Public, Commissioner for Oaths, Qualified Company Secretary
21 years of experience with 15 years in banking
Mr. Vinod SivapragasamChief Manager - Shared ServicesMBA (Anglia Ruskin University-UK)
27 years of experience in banking
Mr. Ramesh PereraChief Manager - Transaction BankingACMA (UK), CGMA
32 years of experience in banking
Ms. Medhini SenathirajasegaramChief Manager - Credit Risk ManagementB.Sc. (Hons) in Computer Science (University of Colombo), MBA (University of Colombo),ACMA (UK), CGMA
19 years of experience with 18 years in banking
Mr. Sameera WijegunawardenaChief Manager - CreditMBA (University of Wolverhampton - UK), Dip. in Credit Management (IBSL)
28 years of experience in banking
INSIDE INSIGHT LEADERSHIP SENIOR MANAGEMENT
29National Development Bank PLC Annual Report 2021

GROUP SUBSIDIARY LEADERSHIP TEAM
01 Mr. Dimantha Seneviratne Director/Chief Executive Officer
Please refer page 20 for the profile
02 Mr. Senaka Kakiriwaragodage Chief Executive Officer - NDB Capital Holdings Limited
MBA (University of Manchester - UK), B.Sc. in Computer Science and Engineering (University of Moratuwa), CFA, FCMA (UK), CGMA
19 years of experience, including 17 years with the NDB Group
03 Mr. Darshan Perera Chief Executive Officer - NDB Investment Bank Limited
MBA (University of Colombo), BSc. in Physical Science (University of Colombo), Associate Member (IBSL), Associate Member (CIM - UK), Passed Finalist (CIMA), Passed Level 2 (CFA - USA)
29 years of experience, including 20 years with the NDB Group
04 Mr. Prabodha Samarasekara Chief Executive Officer - NDB Wealth Management Limited
MBA in International Finance (University of Southern California - USA), B.S in Management Information Systems (Louisiana State University - USA)
32 years of experience, including 13 years with the NDB Group
05 Mr. Gihan R. Cooray Chief Executive Officer - NDB Securities (Pvt) Limited
MBA in Finance (Cardiff Metropolitan University (UK), High Potentials Leadership Programme, ( Harvard Business School - USA), Certificate in Capital Markets by Securities and Exchange Commission (SL)
20 years of experience, including 18 years with the NDB Group
06 Mr. Girish Patil Managing Director - NDB Zephyr Partners Lanka (Pvt) Limited
PGDM (SDM IMD - India)
19 years of experience, including 7 years with the NDB Group
07 Mr. Kazi Farhan Zahir Managing Director & CEO - NDB Capital Limited (Bangladesh)
MBA (North South University), B.Sc. in Electrical Engineering (Purdue University)
16 years of experience , including 10 months with the NDB Group
01 02
06 0305 0407
INSIDE INSIGHT LEADERSHIP
30 National Development Bank PLC Annual Report 2021

NDB INVESTMENT CASE
National Development Bank PLC is one of Sri Lanka’s leading private commercial banks, offering an array of lending, saving and transactional banking solutions across diverse market segments. The Bank’s subsidiaries are also engaged in providing capital market solutions enabling the Group to collectivity offer the entire gamut of integrated financial solutions. Established as a development bank in 1973, NDB has maintained its developmental orientation while increasing penetration in the Retail and SME segments.
WHO WE ARE
SOCIO-ECONOMIC IMPACT
LKR 119 BnLending to SMEs
15SME education forums
Proactive engagement with SME clientele to restructure/reschedule facilities
DRIVING ENTREPRENEURSHIP
LKR 3 BnShare market transactions facilitated
Right Issue, Private Placement and Debenture Issuance during the year with foreign investor participation
DRIVING CAPITAL MARKETS VIBRANCY
Sri Lanka Vanithabhimana - island-wide recognition programme for women
EDGE Certification for work place gender equality
WOMEN EMPOWERMENT
LKR 5.2 BnGovernment tax contributions
TAX CONTRIBUTIONS
LKR 23 BnLending to small businesses
>1,111 Participants for Financial literacy programmes
13 Branches in economically disadvantaged areas
FINANCIAL INCLUSION
ECONOMIC VALUE ADDITION AND DISTRIBUTION - BANK
For the year ended 31 December
LKR Mn
2021 2020 2019 2018 2017
Direct economic value generated 19,287 17,657 18,353 16,725 13,903
Economic value distributedEmployees wages and benefits 5,672 5,172 4,957 4,444 3,611 Payments to providers of capital 2,735 3,935 4,180 3,460 3,920 Payments to Government 5,008 4,682 5,245 5,180 3,146 Community investments 16 11 25 22 20Economic value retained 5,856 3,859 3,945 3,619 3,206
MARKET POSITION
Bold and ambitious strategies launched in 2017 and 2021 respectively have led to transformational growth in ensuing years. With asset and liability growth consistently surpassing industry average, the Bank is now the fourth largest listed commercial bank in the country. NDB’s competitive edge has also been sharpened by its accelerated digital journey, which has enabled it to deliver market-leading digital innovations.
Our Vision
To be the driving force for a financially empowered Sri Lanka.
Our Mission
To be the catalyst in the financial services industry by creating superior shareholder value and contributing to the national development through the empowerment of individuals with innovative financial solutions delivered by an inspired and dedicated team committed to excellence.
Values
� Integrity
� Creativity
� Excellence
� Sincerity
� Accountability
� Dependability
Multi-faceted value proposition to support exporters through NDB Jayagamu Sri Lanka including,
DRIVING EXPORTS AND FACILITATING TRADE
CUSTOMER SEGMENTS
The Bank’s services are offered across the four key business verticals of Retail, Business Banking, Wholesale Banking and Project & Infrastructure Financing (PIF). In recent years, NDB has leveraged its digital capabilities to widen its reach and deepen relationships through offering convenient, customer-centric and seamless banking solutions.
INSIDE INSIGHT OPERATING LANDSCAPE & STRATEGY
31National Development Bank PLC Annual Report 2021

1. SOLID STRATEGY FOR GROWTH
Following the successful conclusion of the Transformation 2020 Strategy, the Bank embarked on the Voyage 2025 Strategy in 2021- clearly setting out the roadmap to achieve the next phase of growth. Voyage 2025 centres on the key pillars of customer centricity, lifecycle banking and digital as a transformer; the strategy is focused on driving increased penetration across customer segments and business verticals through leveraging the Bank’s superior digital capabilities, product portfolio and combined strengths in banking and capital markets. Despite the challenges that prevailed in 2021, NDB made significant progress in its strategic agenda, achieving key deliverables in growth, digital propositions, customer acquisition and profitability.
2. PERFORMANCE TRACK RECORD
NDB’s asset growth, deposit growth and profitability have been consistently robust in the past five years, supported by a targeted growth strategy and aggressive penetration in new market segments. NDB is now positioned as the fourth largest listed commercial bank in the country, with increased penetration across business verticals, improved brand equity and a more diverse and balanced business model.
3. ROBUST CAPITALISATION
NDB strengthened its capital base during the year, with a fully subscribed Rights Issue and a Private Placement, which collectively netted LKR 9.5 Bn. With this infusion, the Bank’s Total Tier 1 Capital Ratio and Total Capital Ratio increased to 10.01% and 15.42% respectively by end-December 2021, thereby affording a strong platform for driving the Bank’s growth aspirations and mitigating against potential stresses from the external operating environment. The Bank also raised LKR 8 Bn in Basel III complaint Tier II debentures, which oversubscribed on the issue open date, affirming investor confidence in the Bank.
4. CONSISTENT SHAREHOLDER RETURNS
Despite the external turbulence and challenges, the Bank has continued to deliver on its shareholder commitments; EPS and NAVPS were LKR 22.44 and LKR 175.65 respectively. Meanwhile, the share price closed at LKR 68.90 for 2021.
5. ESG FOCUS
At NDB, success is measured not only by our financial performance, but also how we act sustainably and contribute towards addressing the critical economic, social and environmental challenges faced by society today. We therefore adopt a holistic approach towards value creation placing strategic focus on aspects such as gender equality, fair working practices, financial inclusion, capacity building, and green lending, among others. Strong governance practices are ensured through robust policy frameworks, structures which ensure judicious responsibility and balance of power and a culture which values transparency and integrity.
Asset Growth
NDB: 12%
Return on Equity
NDB Group: 12.47%
Deposit Growth
NDB: 13%
Return on Assets
NDB Group: 1.67%
Total Capital Ratio
NDB Group: 15.82%
Cost to Income Ratio
33.7%
Net Stable Funding Ratio
118.27%
INVESTMENT CASE
LKR LKR
Net Asset Value per Share Earnings per Share
Shareholder Information - NDB Group
19.66
26.33
20.5321.99 22.44
0
50
100
150
200
250
2017 2018 2019 2020 20210
5
10
15
20
25
30
192.
51
185.
49
195.
60
206.
23
175.
65
INSIDE INSIGHT OPERATING LANDSCAPE & STRATEGY NDB INVESTMENT CASE
32 National Development Bank PLC Annual Report 2021


DIVERSIFICATION
OUR TRANSFORMATION
Following the execution of the Group’s Transformation 2020 strategy from 2017 to 2020, NDB has successfully repositioned itself as an innovative, customer-centric and future-fit Bank, emerging as a formidable player in the intensely competitive banking industry. Through the Transformation 2020 strategy, NDB sought to transform its business focus, customer value proposition, processes, organisational structure and culture, which in turn has enabled it to penetrate new market segments, sharpen its competitive edge and strengthen its market position. The Group’s priorities and transformation during this period is summarised below:
DRIVERS OF GROUP TRANSFORMATION
Emphasis on automation, business process re-engineering and an organisation-wide operational efficiency and effectiveness improvement program led to the creation of a lean and agile organisation. Accordingly, the Bank has achieved consistent reduction in its cost to income ratio in recent years, while enhancing employee productivity.
OPERATIONAL EXCELLENCE
The Bank sought increased penetration in the Retail and SME segments, diversifying the portfolio from its traditional focus on Corporate Banking and Project Financing. This was achieved through the roll-out of digital innovations and customer-centric solutions and has enabled NDB to build a more diverse and resilient credit portfolio.
NDB accelerated its digitalisation journey, embracing the digital frontier in financial services to drive better customer service, reduce complexity and optimise the operating model. The Bank launched several pioneering digital solutions, emerging as a technology leader in the country’s banking sector.
DIGITAL TRANSFORMATION 1
3
2
Supported by a capable team, strong corporate governance and risk management practices and focus on sustainable value creation
30
35
40
45
50
%
2017 2018 2019 2020 2021
Cost to Income Ratio
45.48
39.34
39.90
37.00
33.65
83% of transactions carried out through digital financial services channels
On a continually increasing trend since the adoption of Digital as a key strategic pillar
Portfolio Movement from 2017 to 2021
45%Retail & Business
41%
36%Wholesale33%
23%PIF22%
20212017
INSIDE INSIGHT OPERATING LANDSCAPE & STRATEGY
34 National Development Bank PLC Annual Report 2021

DELIVERING OUR AMBITIONS
The Bank’s transformation over the past five years is underpinned by consistent and sustained growth, even amidst external turbulences. In 2021, NDB’s total assets grew at a 5-year CAGR of 16% up to 2021, surpassing the industry average of 13%. This was achieved through targeted growth in selected market segments. Accordingly, NDB elevated its position to the fourth largest listed Commercial Bank in the country.
Exceptional five-year growth rates
T
GROWTH1
Increased penetration into high-yielding segments, together with effective management of portfolio quality and considerable gains made through improving productivity and efficiency has resulted in consistent growth in profitability. This resulted in a 5-year CAGR of 14% in pre tax profitability.
Continued enhancement in key performance ratios enhancing profitability
Parallel to its loan growth, the Group has increased its capital base in recent years, and through a Rights Issue and a Private Placement in 2021. This has strengthened NDB’s Balance Sheet, improving resilience to potential macro-economic stress.
NDB has strengthened its market position in lending, deposit mobilisation and transactional banking services. The mobile banking platform, NEOS continues to break new ground, allowing the Bank to strengthen its competitive position in the digital transactions space.
PROFITABILITY
FINANCIAL STABILITY
MARKET POSITION
2
4
3Market Share
2021 2017
% of loans 5.0 4.3
% of deposits 4.4 3.7
0
200
400
600
800
2017 2018 2019 2020 2021
Asset Growth
383
473
530
627
703
Assets Asset Growth (%)
LKR Bn
15
2312
1812
Pro�tabilityLKR Bn
Bank PBT
0
2
4
6
8
10
12
2017 2018 2019 2020 2021
7.5
9.5
10.1 9.2
10.3
16.27
Bank ROE (%)
17.41 13.73 13.13 12.27
0 4 8 12 16
%
2017
2018
2019
2020
2021
Tier 1 Capital Ratio Total Capital Ratio
Group Capitalisation
15.1810.49
13.6210.39
14.2010.15
14.759.73
15.8210.53
Total assets: 16%
Customer deposits: 22% CASA deposits: 26%
Loans and receivables: 18%
KPIs (%) 2021 2017
NIM 3.25 3.00CASA Ratio 27.25 21.46Loans to deposits ratio 95.31 101.99Five year CAGR in pre-
tax profitability14%
INSIDE INSIGHT OPERATING LANDSCAPE & STRATEGY OUR TRANSFORMATION
35National Development Bank PLC Annual Report 2021

INSIDE INSIGHT OPERATING LANDSCAPE & STRATEGY
DIGITAL CAPITAL
83 % digital transactions
81 processes automated
58% digitally enabled customer
The Group’s value creation model explains how we utilise our resources and relationships in achieving our strategic aspirations and how we create, preserve or erode value for our stakeholders over time.
LENDING
Disbursement of credit across diverse customer segments
DEPOSIT MOBILISATION
Obtaining deposits through our branch network, digital propositions and Bank2U services
FACILITATING TRANSACTIONS
Offer secure, reliable and convenient platforms to facilitate transactions
BUSINESS ACTIVITIES
FINANCIAL CAPITAL
Financial capital is required to drive our growth through lending and investments.
� Shareholders’ funds: LKR 62.7 Bn
� Deposits: LKR 551.3 Bn
� Other borrowings: LKR 79.4 Bn
59
HUMAN CAPITAL
Our Directors and employees who provide the manpower and expertise to drive our strategy.
� Diverse Board of Directors
� 2,949 Employees
82
DIGITAL CAPITAL
Digital capabilities and infrastructure which enhance customer experience and internal processes.
� Integrated IT systems and digital services
� IT infrastructure: LKR 810 Mn
76
MANUFACTURED CAPITAL
Investments in physical infrastructure.
� 113 Branches including 2 Phygital branches
� 92 ATMs and 74 CRMs
80
To be the driving force for a financially empowered Sri Lanka
FINANCIAL CAPITAL
LKR 21.7 Bn Net Interest Income
LKR 7.1 Bn Profit generated
LKR 349 Mn paid as dividends
Earnings per share increased by 2%
MANUFACTURED CAPITAL
LKR 1.1 Bn capital expenditure
SHAREHOLDERS CUSTOMERS EMPLOYEES
OUR VISION
Banking Cluster (Pg. 63)
Drivers of Change Macro-economic trends
Value TransformationCapital Inputs
HOW WE CREATE VALUE
Capabilities that drive innovation, efficiencies and ethical value creation.
� Expertise in development banking and project financing, Organisational tacit knowledge, The NDB brand
INTELLECTUAL CAPITAL 88
Strengths of the relationships we have nurtured with stakeholders which provides us a social licence to operate.
� 92 Correspondent relationships
� Relationships with the communities we operate in
SOCIAL AND RELATIONSHIP CAPITAL 92
NATURAL CAPITAL
Reliable energy supply and water usage which facilitated uninterrupted operations.
� Electricity consumption: 5.17 (kWh Mn)
� Fuel consumption: 70,902 Ltr
97
Technological disruption
Customer solutions
Business focus
Strategic priorities
Stakeholders Impacted
Driven through two main business verticals
36 National Development Bank PLC Annual Report 2021

INSIDE INSIGHT OPERATING LANDSCAPE & STRATEGY
Value Transformation
Ou
t pu
t s
LKR 83 Bn (+19%)Loans disbursed
LKR 62 Bn (+13%)Deposits mobilised
Debt Moratoria granted to 14% of the Loan Book
Community empowerment through various initiatives
Initiatives supporting the women market segment
Investment in Training and Development of employees
Growth in volume of transactions through NDB NEOS platform - 113%
2,312 tCO2eCarbon footprint
WEALTH MANAGEMENT
Private fund management through investments in unit trusts and other assets
INVESTMENT MANAGEMENT
Services in investment banking, securities trading and private equity
HUMAN CAPITAL
LKR 5.6 Bn paid as salaries and benefits
LKR 19.3 Mn investment in training
53% employees enabled to work remotely
Certified as Great Place to Work
7% attrition
INTELLECTUAL CAPITAL
13% increase in brand value
Market leading digital capabilities
Attraction and retention of critical skills
SOCIAL AND RELATIONSHIP CAPITAL
Improvements in customer satisfaction indicators
LKR 5.2 Bn tax contributions
LKR 16 Mn community investments
NATURAL CAPITAL
LKR 50 Bn lending to renewable energy
Emission Intensity 0.04 tCO2e per LKR Mn
EMPLOYEES CUSTOMERS/
EMPLOYEES
CUSTOMERS/
SOCIETY
SOCIETY
Capital Market Cluster (Pg. 73)
CAPITAL AND STAKEHOLDEROUTCOMES IN
2021
Technological disruption Regulatory developments
Managing talents
Soci
al a
nd E
nviro
nmen
tal s
usta
inab
ility
Organisational realignment
Empowered staff
Digital and data as transformers
Driven through two main business verticals
Ou
t co
me
s
HOW WE CREATE VALUE
37National Development Bank PLC Annual Report 2021

STAKEHOLDER RELATIONSHIPS
Stakeholder engagement is embedded into our value creation process. With rapid changes in the operating landscape, our stakeholder needs and concerns are also evolving, and during the year we focused on deeper engagement and stronger collaboration to deliver shared value creation. In determining stakeholders to engage with, the Group prioritises stakeholders which can have the most significant influence of its ability to create value. Our approach to stakeholder engagement and value delivered is summarised in the following pages.
OUR STAKEHOLDER UNIVERSE
We have tailored our engagement mechanisms based on the level of stakeholder interest and the level of influence they have on the Group’s decision-making and strategy.
Active Consultation
Suppliers
Keep Informed
Government
Maintain Interest
Communities
Collaborate
Shareholders Employees Customers
Sta
keho
lder
Influ
ence
Stakeholder Interest
Customers
Quality of relationship: Strong
How we engage
� Periodic customer satisfaction surveys and feedback tabs deployed in branches
� Ongoing customer interaction at branches
� Ongoing online and social media interactions
� Print and electronic media publications as and when required
� Online and mobile banking portals
� Trade fairs and exhibitions (potential customers)
Strategic response
�We focused on delivering customer-centric solutions through best-in-class digital propositions while continuing to enhance customer service.
Value Delivered
Key concerns in 2021
� Convenient, seamless and safe digital channels
� Fast response times � Innovative, customer-centric solutions � Competitive and transparent pricing � Professional customer service at all contact points
� Responsible banking practices � Product knowledge and attitude of employees
Digitally Active Customers
58%
Moratoria
LKR 14% of the loan book
Customer education and financialliteracy programmes
0 5 10 15 20 25
%
2020
2021
Moratoria as a % of the loan book
14%
22%
Value to Customers
Loans granted Customer touch points
LKR Bn No.
0
100
200
300
400
500
600
2017 2021200
250
300
279
526
279
242
INSIDE INSIGHT OPERATING LANDSCAPE & STRATEGY
38 National Development Bank PLC Annual Report 2021

Strategic response
� Employee safety continued to be a key people priority in 2021 and we widened our work-from-home arrangements, while enhancing our digital engagement and continuing to develop employees through virtual training initiatives.
Employees
Quality of relationship: Strong
How we engage
� Annual employee surveys including satisfaction, HR ISO and department surveys
� Digital engagement
� Periodic staff meetings (town halls, weekly leadership team meetings, monthly regional manager and business review meetings, quarterly branch manager meetings)
� Quarterly induction programmes
� Year-round work-life balance initiatives such as Recreation and Toastmasters’ club
� Annual Retail Banking awards
� Ongoing employee volunteerism programmes
Value Delivered
Key concerns in 2021
� Ensuring health and safety at work including opportunities for remote working
� Effective performance management and attractive remuneration schemes
� Opportunities for talent, skill, and development
� Simplification of processes to drive productivity
�Work-life balance
� Maintain open and two-way communication
Certified as a Great Place To Work (GPTW) First Sri Lankan Bank to receive this certification
Promotions
290
Retention
93%
Employees facilitated with remote working
53%
Strategic response
� The Board-approved Procurement Policy ensures that we maintain a continuous and open dialogue with all suppliers and business partners. We also propagate our sustainability practices to our suppliers through regular social and environmental screening.
Suppliers and Business Partners
Quality of relationship: Good
How we engage
� Periodic supplier reviews and assessments
� Periodic meetings and written communication
� Press releases, invitation for bids and tenders and information on the website
Value Delivered
Key concerns in 2021
� Fair and transparent pricing
� Ease of transacting
� Continuity of relationship
� For correspondent banks - secure and stable platform for transacting
Payments to suppliers
LKR 8 Bn
Payments to local suppliers
92%
No. of Suppliers
>400
0
1
2
3
4
5
6
2020 2021
Value to Employees
20
21
22
23
24
25
LKR Bn Hours
5.2
5.7
22.0
24.4
Payments to employees
Average training hoursper employee
INSIDE INSIGHT OPERATING LANDSCAPE & STRATEGY STAKEHOLDER RELATIONSHIPS
39National Development Bank PLC Annual Report 2021

Strategic response
� The Group’s strategic initiatives were in line with the Voyage 2025 plan, which clearly sets out the blueprint for NDB’s next phase of growth.
Shareholders
Quality of relationship: Strong
How we engage
� Annual General Meeting
� Quarterly investor webinars on publication of quarter financial results
� Investor road shows when required
� Year-round meetings with investment analysts, stockbrokers, and media
� Numerous publications including Annual Report, Quarterly performance updates, ongoing investor presentations and announcements to the CSE.
� Dedicated investor relations page on our website www.ndbbank.com
Value Delivered
Key concerns in 2021
� Sustainable returns commensurate with the risk undertaken
� Relevance of the Group’s strategy given prevailing conditions
� Strength of the Leadership team
� Integrity and high standards of corporate conduct and governance
� Effective risk management practices
� Macroeconomic environment and potential impacts on the Group
Group Return on Equity
12.47%
Group NAVPS
LKR 175.65
Group EPS
LKR 22.44
Market Capitalisation
LKR 24.6 Bn
Strategic response
� A dedicated Compliance Department independently monitors adherence to all relevant regulatory and statutory requirements. We also maintain a transparent and ongoing dialogue with relevant regulators. The Bank contributes to the development of policy, legislation and regulation through submissions of our comments and views on proposals and discussion papers.
Government and Regulators
Quality of relationship: Good
How we engage
� Regular statutory reporting
� Ongoing engagement through industry associations
� Direct communication with the Banking Supervision Department of the CBSL
Key concerns in 2021
� Compliance to all relevant regulations, directions, and guidelines
� Contribution towards stimulating economic activity
� Maintain regular and transparent communications
� Control direct and indirect impact on stakeholders, the society and the environment.
Economic Value creation through,
1. Employment generation
2. Driving entrepreneurship
3. Supporting the Government’s drive towards a cashless economy
4. Financial inclusion
Value Delivered
4.0 4.2 4.4 4.6 4.8 5.0 5.2 5.4
2020
2021
Tax Contributions
5.0
5.2
LKR Bn
INSIDE INSIGHT OPERATING LANDSCAPE & STRATEGY STAKEHOLDER RELATIONSHIPS
40 National Development Bank PLC Annual Report 2021

Our response
� In line with our long-term approach towards sustainability we strive to create value for the communities we operate in through strategic CS projects, developing products and solutions facilitating socio-economic empowerment and deliver positive environmental impacts.
Communities
Quality of relationship: Good
How we engage
� Meetings with beneficiaries of CS initiatives and capacity building programmes as and when required
� Ongoing publications including the Bank’s Sustainability reporting and other press releases
� Ongoing CS projects, press releases and engagement on social media
Value Delivered
Key concerns in 2021
� To partner common social and environmental issues
� Employment creation within communities
� To develop products and provide guidance on achieving desired community outcomes
Investment in CS
LKR 16 Mn
Beneficiaries of CS projects
+12,000
Volunteer hours
Over 17,500 Man hours
INSIDE INSIGHT OPERATING LANDSCAPE & STRATEGY STAKEHOLDER RELATIONSHIPS
41National Development Bank PLC Annual Report 2021


This year, we have identified the following developments in the external environment as having the most significant impact on the Group’s ability to generate value. The risks and opportunities arising from these dynamics and impact on our strategy is summarised below:
OPERATING LANDSCAPE
Macro-economic environment
� The momentum of the global economic recovery weakened during the latter part of 2021, with the IMF estimating global GDP growth at a 5.9% before slowing to 4.4% in 2022 in view of the emergence of new COVID-19 variants across the world.
� Sri Lanka’s economy is expected to have grown by 4%, supported by the strong rebound in the early part of the year (9 months : 4.4%). The resurgence of infections,shortage in foreign currency and resultant import restrictions led to GDP growth slowing in the second half of the year.
� The country’s foreign exchange condition presents significant risks to the country’s economy in 2022. The repayment of international borrowings and the sharp drop in tourism earnings and workers’ remittances led to a rapid decline in foreign currency reserves. Resultantly, international rating agencies (Moodys, S&P Global Ratings and Fitch Ratings) downgraded the country’s sovereign rating during the year. As at end-December 2021, Sri Lanka’s foreign exchange reserves amounted to USD 3.1 Bn.
� The shortage in foreign currency led to the Sri Lankan Rupee depreciating by 7% against USD in 2021.
� Inflationary pressures escalated during the second half of the year, with headline inflation and core inflation increasing by 12.1% and 8.3% YoY respectively. This was fuelled by removal of price controls and supply side disruptions.
� The CBSL adopted a tightening monetary policy stance from the third quarter of 2021, in a bid to stem inflationary pressures. With SDFR, SLFR Bank Rate and SRR being increased during the year, market interest rates followed suit.
Impact on our strategy and performance
� The foreign exchange crisis has directly affected import customers, given difficulties in opening Letters of Credit. The Bank was compelled to rationalise imports and launched concerted efforts to drive export volumes across business verticals. Meanwhile rising interest rates have led to pressure on margins.
Opportunities
� Growth opportunities in local manufacturing, import substitution and export industries in line with the national agenda
� Policy stimuli towards supporting the country’s SME sector
� Increased demand for renewable energy generation as an alternate for imports dependent thermal power plants
Risks
� Exchange rate volatility
� Rising inflationary pressures and the adverse impact on investor sentiments
� Challenges in accessing foreign funding given the country’s risk profile
� Potential stress on credit quality given broad-based economic pressures
Risk Impact Risk Likelihood Direction
High High
Q1 Q2 Q3
-5
0
5
10
15
20
25
%
Agriculture Industry Services GDP Growth
6.3
8.5
1.7
5.5
-2.1
22.1
3.0
-1.6
7.5
4.3
-1.5
12.3
Economic Growth
AWDR AWPR Treasury-Bill Yields (364 day)
3
4
5
6
7
8
9
Jan
Mar
Jun
Sep
Dec
2021
%
Interest Rate Trends
5.82
5.58
4.98
5.67 5.67
7.01
8.338.24
4.94
6.39
4.75
5.23
4.87
5.11
5.20
Source : Central Bank of Sri Lanka
INSIDE INSIGHT OPERATING LANDSCAPE & STRATEGY
44 National Development Bank PLC Annual Report 2021

Regulatory developments
COVID-19 led disruptions
� The CBSL continued to extend debt relief COVID-19 affected businesses with moratoriums granted to affected individuals/businesses were extended to 31 December 2021 while the tourism sector received a further extension up to 30 June 2022.
� Meanwhile, recovery actions including repossession and parate executions were also suspended for COVID-19 affected business and individuals till 31 March 2022 and for tourism sector businesses till 30 September 2022.
� The CBSL introduced several restrictions on banks to preserve foreign currency outflows from the country. This included limitations on entering forward rate contracts, suspension on investments in ISBs, mandatory conversion of export proceeds, revocation of limits on short-term foreign currency borrowings, caps on interest paid on foreign currency deposits and requirement of 100% cash margin on selected imports.
� Restrictions on discretionary payments of licensed banks, including cash dividends and capital expenditure.
� The emergence of highly-transmissible COVID-19 variants resulted in periodic travel restrictions in Sri Lanka throughout the year. However, businesses have continued to adapt to operating in conditions of limited mobility, deploying technology to engage with customers and embracing new ways of working.
� Meanwhile, Sri Lanka’s vaccination drive has largely been successful with nearly 63% of the country vaccinated by end-2021.
�While many nations have adopted the approach of learning to live with the virus, the long-term economic costs of the pandemic are expected to be severe, resulting in reversing the gains made in poverty alleviation in recent years and widening inequalities and income disparities. This, in turn could have numerous ramifications in the form of social unrest and geopolitical tensions.
Impact on our strategy and performance
� Measures taken to preserve foreign currency has had a significant impact on import customers, cross border transactions and businesses relying on imported raw materials.
Impact on our strategy and performance
�We strengthened engagement with pandemic-affected businesses, offering opportunities for restructuring facilities and supporting effective liquidity management. The Bank accelerated its digital drive during the year rolling out innovative, customer-centric solutions.
Opportunities
� Strengthen customer relationships through continued support for COVID-19 affected businesses
Opportunities
� Driving digital enablement among customers
� Strengthen customer relationships
� Embrace new ways of working
Risks
� Implications on fee-income
� Exchange rate volatility
Risks
� Potential implications on credit quality
� Maintaining staff morale when working remotely
Risk Impact Risk Likelihood Direction
High High
Risk Impact Risk Likelihood Direction
Moderate High
INSIDE INSIGHT OPERATING LANDSCAPE & STRATEGY OPERATING LANDSCAPE
45National Development Bank PLC Annual Report 2021
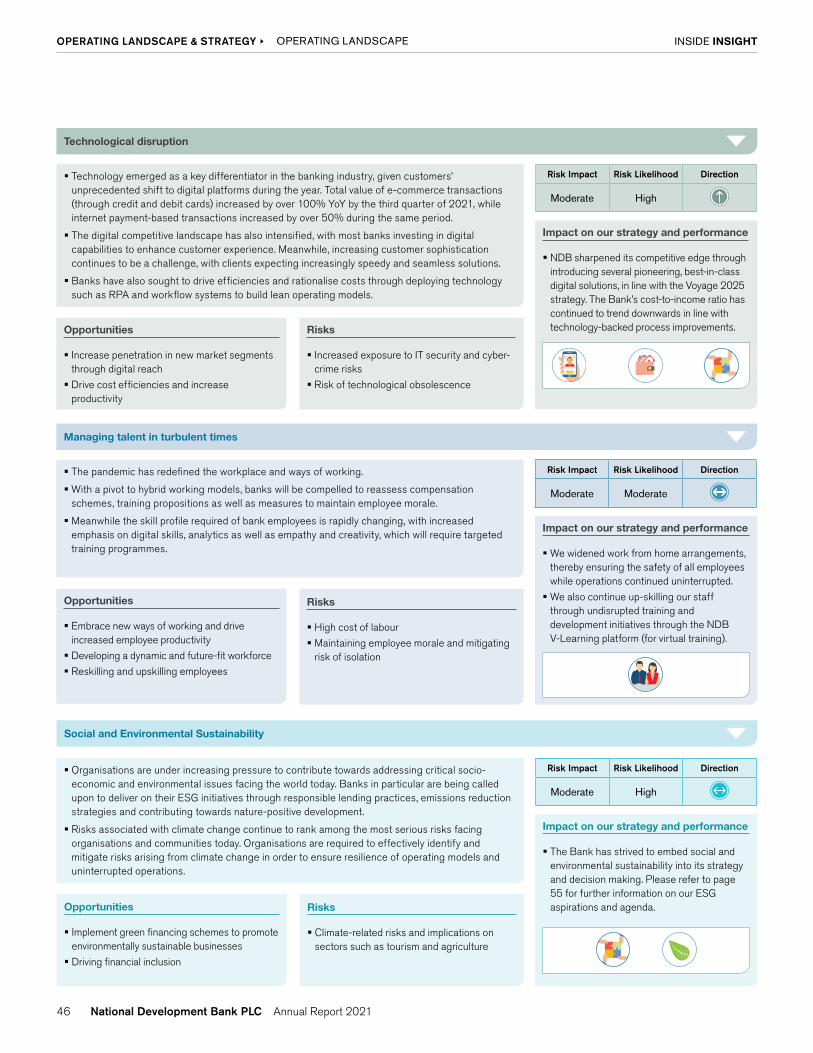
Technological disruption
� Technology emerged as a key differentiator in the banking industry, given customers’ unprecedented shift to digital platforms during the year. Total value of e-commerce transactions (through credit and debit cards) increased by over 100% YoY by the third quarter of 2021, while internet payment-based transactions increased by over 50% during the same period.
� The digital competitive landscape has also intensified, with most banks investing in digital capabilities to enhance customer experience. Meanwhile, increasing customer sophistication continues to be a challenge, with clients expecting increasingly speedy and seamless solutions.
� Banks have also sought to drive efficiencies and rationalise costs through deploying technology such as RPA and workflow systems to build lean operating models.
Impact on our strategy and performance
� NDB sharpened its competitive edge through introducing several pioneering, best-in-class digital solutions, in line with the Voyage 2025 strategy. The Bank’s cost-to-income ratio has continued to trend downwards in line with technology-backed process improvements.Opportunities
� Increase penetration in new market segments through digital reach
� Drive cost efficiencies and increase productivity
Risks
� Increased exposure to IT security and cyber-crime risks
� Risk of technological obsolescence
Risk Impact Risk Likelihood Direction
Moderate High
Managing talent in turbulent times
� The pandemic has redefined the workplace and ways of working.
�With a pivot to hybrid working models, banks will be compelled to reassess compensation schemes, training propositions as well as measures to maintain employee morale.
� Meanwhile the skill profile required of bank employees is rapidly changing, with increased emphasis on digital skills, analytics as well as empathy and creativity, which will require targeted training programmes.
Impact on our strategy and performance
�We widened work from home arrangements, thereby ensuring the safety of all employees while operations continued uninterrupted.
�We also continue up-skilling our staff through undisrupted training and development initiatives through the NDB V-Learning platform (for virtual training).
Opportunities
� Embrace new ways of working and drive increased employee productivity
� Developing a dynamic and future-fit workforce
� Reskilling and upskilling employees
Risks
� High cost of labour
� Maintaining employee morale and mitigating risk of isolation
Risk Impact Risk Likelihood Direction
Moderate Moderate
Social and Environmental Sustainability
� Organisations are under increasing pressure to contribute towards addressing critical socio-economic and environmental issues facing the world today. Banks in particular are being called upon to deliver on their ESG initiatives through responsible lending practices, emissions reduction strategies and contributing towards nature-positive development.
� Risks associated with climate change continue to rank among the most serious risks facing organisations and communities today. Organisations are required to effectively identify and mitigate risks arising from climate change in order to ensure resilience of operating models and uninterrupted operations.
Impact on our strategy and performance
� The Bank has strived to embed social and environmental sustainability into its strategy and decision making. Please refer to page 55 for further information on our ESG aspirations and agenda. Opportunities
� Implement green financing schemes to promote environmentally sustainable businesses
� Driving financial inclusion
Risks
� Climate-related risks and implications on sectors such as tourism and agriculture
Risk Impact Risk Likelihood Direction
Moderate High
INSIDE INSIGHT OPERATING LANDSCAPE & STRATEGY OPERATING LANDSCAPE
46 National Development Bank PLC Annual Report 2021

OUR COVID-19 RESPONSE: ADAPTING TO THRIVING
NDB’s approach towards the pandemic can be categorised into three main phases.
The Group’s immediate response to the pandemic, which centered on ensuring business continuity while safeguarding the health of our employees and customers was discussed in last year’s Annual Report. As we swiftly adapted to the new realities of a post-pandemic world, we understood that innovation is foundational in navigating the crisis. We realised that in effectively seizing the opportunities presented by the pandemic and moving forward, we would need to implement a blueprint that supports resilient operations, stronger customer relationships and more agile decision making. Key measures implemented as part of Reinvent include the following:
The digital opportunity
Aligning our portfolio
Hybrid Working Models
Reimagining the customer relationship
Data driven decision making
With accelerated digital adoption, the Bank focused on offering seamless and convenient solutions across its business verticals. Digital capabilities also enabled the Bank to penetrate market segments in which it does not have a physical presence, while increasing efficiencies and optimising human capital.
With pandemic-led challenges inserting pressure on macro-economic fundamentals, NDB aligned its lending to support critical sectors of the economy which are positioned to drive the country’s economic recovery. This includes exports, local manufacturing and agriculture among others.
The Bank’s work-from-home program has largely been successful, supporting better work-life-balance of employees while enabling the Bank to effectively manage its costs. The Bank has sought to address potential problems of isolation through ongoing virtual engagement. The Bank is now exploring ways in which hybrid working models could become a permanent part of our operating model.
The Bank adopted a long-term approach to maintaining customer relationships, extending support throughout the crisis to aid their survival and long-term commercial sustainability. This has strengthened customer relationships, facilitating increased retention.
Uncertainty has become part and parcel of the post-pandemic landscape, necessitating immediate responses to unanticipated challenges. At NDB, this has been supported by a data-driven approach to decision making, which is based on insightful evidence rather than subjective judgements.
RESPONSE RECOVERREINVENT
RESPONSE
RECOVER
REINVENT
ADAPTING TO
INSIDE INSIGHT OPERATING LANDSCAPE & STRATEGY
47National Development Bank PLC Annual Report 2021

MATERIALITY
Material topics are those can potentially impact the Group’s financial performance and/or position, our social license to operate and our ability to generate stakeholder value over the short, medium and long-term. Material issues are informed by the feedback received from our stakeholders, changes in the operating landscape which present opportunities and threats and the Group’s strategic priorities. The Bank’s material issues represent internal and external factors and are also guided by the topics prescribed in the GRI Standards. The topic boundaries remain unchanged from the previous year.
MATERIALITY DETERMINATION IN 2021
The process adopted for determining materiality in 2021 is presented below. During the year, we refined and improved the process through directly engaging the Group’s Leadership Team materiality determination, in addition to assessing the feedback from customers and employee engagement. The improvement in the process together with considerable changes in the operating environment led to shifts in the Group’s materiality landscape as demonstrated below:
IDENTIFICATION OF MATTERS
Issues are identified following stakeholder engagement, opportunities and risks and
represent insights from the Leadership Team
ASSESSING RELATIVE IMPORTANCE
Relative importance is assessed based on the likelihood and potential impact on the Group.
PRIORITISE MATTERS
Issues are prioritised based on the influence on decisions of stakeholders and impact on
the Group’s strategy and operations.
Profitablegrowth
Embracing & leveragingtechnology and data
Ecosystempartnerships
Ensuring safety ofemployees and
customers
Customercentricity
Operationalefficiency
Talent attraction& retention
Facilitating financial inclusion
and financial literacy
Communityengagement
Regulatorydevelopments
Impacts of sovereignrating changes
Brandpositioning
Elevated importanceof risk management
Adapting to post-pandemic realities
Digitaltransformation
Responsiblelending
Customerprivacy
Environmentalconsciousness Managing
macro-economic headwinds
Managing socio-economic
impacts
Market & LiquidityManagement
IMPACT ON ORGANIZATION
IMPACT ONSTAKEHOLDERS2 21
MATERIALITY
MAP
109876543210
INSIDE INSIGHT OPERATING LANDSCAPE & STRATEGY
48 National Development Bank PLC Annual Report 2021

Material topic Prioritisation Changes in materiality compared to last year
Stakeholder group impacted
Relevance to our Strategy
Page reference for further informationStakeholder
impactsImpact on
organisation
Profitable growth H H - Shareholders Business focusFinancial Capital (Page 59)Performance against strategy (Page 50)
Ensuring safety of employees and customers
H H
Increase in importance given evolving nature of pandemic
EmployeesCustomers
Empowered staff
Response to COVID-19 (Page 47)Human Capital (Page 82)
Customer centricity H HNew topic in line with Voyage 2025 aspirations
Customers
Business focus Social & Relationship Capital (Page 92)
Customers solutions
Performance of Business Lines (Page 63)
Operational efficiency M H -EmployeesCustomers
Digital and data as transformers
Digital Capital (Page 76)Intellectual Capital (Page 88)
Market and liquidity management
H HNew topic reflecting market conditions
CustomersBusiness partners
Business focus Performance of Business Lines (Page 63)
Talent attraction and retention
M HCombined with other people-related aspects
Employees
Empowered staff
Human Capital (Page 82)Digital and data as transformers
Facilitating financial inclusion and literacy
H M Combined with literacyGovernmentCommunities
Social & Relationship Capital (Page 92)
Digital transformation H H
Increased focus on digital channels in line with Voyage 2025 aspirations
CustomersEmployees
Digital and data as transformer
Digital Capital (Page 76)Social & Relationship Capital (Page 92)
Responsible lending H H - Customers Social & Relationship Capital (Page 92)
Customer privacy H H - CustomersCustomers solutions
Social & Relationship Capital (Page 92)
Managing macro-economic headwinds
M HNew topic given increased stress from the macro-economy
Shareholders EmployeesCustomersGovernment
Customers solutions
Operating Environment (Page 44)Performance of Business Lines (Page 63)
Managing socio-economic impacts
H H -
CustomersEmployeesCommunitiesGovernment
Business focusSocial & Relationship Capital (Page 92)
Environmental consciousness
H HBroadened to reflect climate-positive behaviour
Communities Natural Capital (Page 97)
Community engagement H H - Communities Social & Relationship Capital (Page 92)
Regulatory developments
M HNew topic given new regulations that were implemented
Government - Operating Environment (Page 44)
Adapting to post pandemic realities
M HNew topic given evolving pandemic dynamics
CustomersEmployeesGovernment
- COVID-19 Response (Page 47)
Impacts of sovereign rating changes
L HNew topic given market developments
CustomersBusiness partners
- Operating Environment (Page 44)
Brand positioningM H
New topic reflecting increased competitive intensity
Customers-
Intellectual Capital (Page 88)
Elevated importance of risk management
M HNew topic given changes in external dynamics
Shareholders-
Risk Management (Page 106)
Ecosystem partnershipsM H
New topic given strategic priorities under Voyage 2025
Business partners -
Social & Relationship Capital (Page 92)Performance of Business Lines (Page 63)
Embracing and leveraging technology and data
M HNew topic given strategic priorities under Voyage 2025
CustomersEmployeesShareholder
Digital & data as transformers
Digital Capital (Page 76)
INSIDE INSIGHT OPERATING LANDSCAPE & STRATEGY MATERIALITY
49National Development Bank PLC Annual Report 2021

OUR STRATEGY
VOYAGE 2025
Following the successful conclusion of the Transformation 2020 strategy, the Bank launched its new strategy of Voyage 2025 in mid-2020, envisioning the goal of emerging as the ‘Banking Group of Choice’ driven by ‘Customer Centricity’. Voyage 2025 centres on sharpening the Bank’s competitive edge through catering to the increasingly sophisticated needs of customers, including convenience and personalised solutions. We capitalised on the opportunity presented by the unprecedented shift to digital platforms following the outbreak of the pandemic, deploying our superior digital capabilities and group synergies to enhance the customer experience.
Operating Environment 44
Stakeholder Relationships 38
Risks and opportunities 50
Inherent strengths and capabilities
50
OUR CONTEXT
48
MATERIAL MATTERS
50
STRATEGIC PRIORITIES
38
STAKEHOLDER OUTCOMES
INTEGRATED APPROACH TO STRATEGY FORMULATION AND
VALUE CREATION
Organisational Realignment
Realign structures to deliver customer centricity across
product verticals and market segments
Customer Solutions
Customised solutions catering to individual preferences
Business Focus
Targeted expansion in selected growth sectors
Empowered Staff
Empower the NDB team to drive motivation, creativity and productivity
Digital and Data as Transformers
Leverage on digital and data capabilities to enhance the customer
experience
Underpinned by,
Short-term goals
Sharpen competitive edge and increase customers’ wallet share through, strengthening digital capabilities, multi-faceted value propositions and extending continued support to customers in navigating the present challenges.
Medium-term goals
Grow total assets to LKR 1 Tn through
� Increased diversity of revenue streams
� Repositioning the branch network as a universal customer touch point
� Harnessing Group expertise and specialisation to provide tailored solutions
Long-term goals
Becoming the “Banking Group of Choice” of all Sri Lankans with focus on improving financial inclusivity and social resilience
Operational excellence Commitment to strong ESG practices
Delivered over 3-time horizons
Generated through actively managing our resources and
relationships, categorised into 7 capitals (page 59 to 101)
INSIDE INSIGHT OPERATING LANDSCAPE & STRATEGY
50 National Development Bank PLC Annual Report 2021

CUSTOMER SOLUTIONS
Through Voyage 2025 we intend to move away from a product-centered to a customer-centered approach, catering to individual requirements across the customer journey through personalised solutions.
Strategic initiatives
In line with the Bank’s aspiration of customer centricity, we launched tiered services and curated solutions across business verticals. We also strengthened our digital services, offering seamless access to Group services and provided regular reinforcement on customer service aspects to front-line staff.
Priorities in 2022
� Support customers’ in transforming business models to capture emerging opportunities in the “New Normal”
� Launch of loyalty schemes to enhance value proposition to customers
Resource allocation/capital inputs
Risks and opportunities in delivering strategy
Macro economic headwinds and impact on customer sentiments
Potential repayment pressure
Customers’ increased thrust towards digital solutions
Hig
hlig
hts
of
2021
Key performance indicators/Link to outcomes
Increased customer retention
13% increase in brand value by Sri Lanka Top 100 by Brand Finance
Mea
suri
ng
pro
gre
ssO
utlo
ok
for
2022
Customer-service related training
Leverage Bank-wide customer relationships
Culture of customer-centricity
BUSINESS FOCUS
Identify and deepen understanding of growth segments in the economy and develop customer-centric solutions to increase penetration of these sectors.
Strategic initiatives
The Group offered holistic solutions to customers including transactional banking and supply chain financing and aligned our growth with economic areas critical for economic resilience and focused support to vulnerable customer segments. We also strengthened portfolio monitoring and follow-up to preserve portfolio quality. Targeted asset and liability expansion was pursued under NDB’s Banking on Women initiative.
Resource allocation/capital inputs
Hig
hlig
hts
of
2021
Key performance indicators /Link to outcomes
19% growth in loans and advances
13% deposit growth including an improved CASA ratio of 27% which supported a diversified, low-cost funding profile
>75 export customers supported through NDB Jayagamu Sri Lanka, facilitating the generation of critical foreign exchange to the country
Gross NPA ratio of 4.65% (2020: 5.35%)Mea
suri
ng p
rog
ress
Priorities in 2022
� Increased support for customers in priority sectors including exports and local manufacturing
� Increase lending to climate positive industry sectors and customers such as renewable energy and sustainable agriculture
Risks and opportunities in delivering strategy
Macro-economic headwinds
Policy stimulus towards strengthening exports and ‘Make in Sri Lanka’ conceptO
utlo
ok
for
2022
Dedicated team deployed in manning the Transactional Banking Unit
Leverage stakeholder partnerships under Jayagamu Sri Lanka
INSIDE INSIGHT OPERATING LANDSCAPE & STRATEGY OUR STRATEGY
Digital capabilities to drive proactive portfolio monitoring
51National Development Bank PLC Annual Report 2021

Key performance indicators/ Link to outcomes
87% of transactions conducted through digital platforms (2020: 80%)
NDB NEOS: +196% growth in transaction value
Increase reach and penetration of new market segments and CASA deposits through digital platforms
Increased customer convenience and accessibility
DIGITAL AND DATA AS TRANSFORMERS
Leverage digital infrastructure and data to derive deeper insights into customer behaviour and deliver customer-centric solutions.
Strategic initiatives
The Bank Launched several firsts to the Sri Lankan banking sector through NDB NEOS (refer to page 78) while launching a dedicated platform NEOSBIZ for SME customers. We also pursued Enterprise-wide data warehousing, providing richer data insights for decision making and leveraged machine learning to obtain insights on customer behaviour
Resource allocation/capital inputs
Hig
hlig
hts
of
2021
Mea
suri
ng
pro
gre
ss
Priorities in 2022
� Upgrade of core banking system which will include treasury front office system, risk management module and corporate online banking application
� Group digitalisation
� Transfer benefits of digitalisation to customers
� Increased use of machine learning models
Risks and opportunities in delivering strategy
Increased exposure to cyber security risks
Risks of system failures
Cost of procuring IT services given exchange rate volatility
Rapid advancements in technology enabling smarter customer solutions
Evolving customer needs/expectations opening new avenues for receptive innovation
Out
loo
k fo
r 20
22
Investments in digital infrastructure
Ongoing training in developing IT skills
Culture of data-driven decision making
Digital enablement of customers
ORGANISATIONAL REALIGNMENT
Drive cohesive changes in the organisational structure to truly deliver client-centricity.
Strategic initiatives
As the Group gradually transitioned towards a matrix structure, we appointed cross functional Single points of Contact to cater to strategically important customers and introduced shared ownership of client servicing in performance evaluation. We also offered consolidated view of Group services to corporate customers
Resource allocation/capital inputs
Hig
hlig
hts
of
2021
Key performance indicators/ Link to outcomes
+14% YoY growth in intra-Group values cross sold
Deeper customer relationships and higher wallet share
Increased diversity of earnings profileMea
suri
ng
pro
gre
ss
Priorities in 2022
� Revisions to performance management and KPI frameworks to recognise and reward client centric behaviour
� Ongoing efforts in developing deeper understanding of key business segments
Risks and opportunities in delivering strategy
Challenges in obtaining organisation wide buy in realigning structures
Nurture a cohesive, goal congruent organisational culture
Out
loo
k fo
r 20
22
Dedicated Group Relationship Managers
Customer-centricity across branch network
Inter-departmental collaboration and cohesion
INSIDE INSIGHT OPERATING LANDSCAPE & STRATEGY OUR STRATEGY
52 National Development Bank PLC Annual Report 2021

EMPOWERED STAFF
Build a motivated, creative and productive team through empowering employees and fostering a culture of innovation and customer centricity.
Strategic initiatives
As we focused on ensuring employees are equipped with the requisite competencies to drive Voyage 2025, we continued to deliver training through the NDB Learning Academy. Employees in certain functions continued to work from the safety of their homes, as we placed strategic emphasis on their physical and mental well-being. Meanwhile the Group leveraged its digital capabilities to make work more meaningful, productive and fulfilling.
Resource allocation/capital inputs
Hig
hlig
hts
of
2021
Key performance indicators
Diverse and inclusive organisational culture
Build organisational tacit knowledge
Improved employee productivity
Mea
suri
ng p
rog
ress
Priorities in 2022
� Competency based talent acquisition, learning and development and compensation strategy in aligning with Voyage 2025
� Succession planning and establish new pathways of growth and specialisation
� Conduct salary surveys and ensure compensation is market aligned
Risks and opportunities in delivering strategy
Challenges in attracting and retaining the right talent
Increased vulnerabilities to health and safety stemming from the pandemic
Employee isolation resulting from remote working arrangements
Difficulties in ensuring work-life-balance in a post-pandemic environment
Increasingly digital-savvy workforce
Competent and versatile workforce through concerted learning and development efforts
Agility of staff in responding to emerging challenges
Out
loo
k fo
r 20
22
2021 2020
Employee retention (%) 93 95
Average training hours per employee (hours) 24.4 22.0
Female representation-overall (%) 40 39Female representation-senior management (%) 33 33
Career enhancement opportunities 290 110
LKR 5.7 Bn payments to employees (+10%)
Ongoing investment in training and development
Customer-centric culture
GOVERNANCE AND REMUNERATION PRACTICES SUPPORTING OUR STRATEGY
Strategy governance: The implementation of Voyage 2025 is driven by a Steering Committee, represented by two board members and several members of the Group’s Leadership Team. Six strategy work streams have been put in place, with members of the Leadership Team assuming responsibility for each stream and supported by a pool of cross-functional employees. Each work stream has independently and collaboratively devised and executed detailed project plans to meet defined strategic objectives, which are cascaded down with action plans and corresponding timelines with meticulous follow up. Implementation of Voyage 2025 dashboards allows top Management to monitor progress at a glance.
Change management: The implementation of Voyage 2025 was supported by concerted organisational change management (OCM) initiatives to secure organisation wide buy-in and alignment to the strategy. This included structured engagement programmes, a digital platform named “Voyage 2025 Listening Wall” encouraging employee feedback, queries, concerns on the strategy and related matters and frequent communication with the CEO through a series of meetings. A “Strategy Coach” programme was also launched through which a dedicated Strategy Coach was appointed to clusters of around 25 employees facilitating regular engagement on strategy related matters.
Remuneration: Our executives’ performance appraisal is based on a Balance Scorecard approach comprising four quadrants of Financial, Customers, Processes, and Learning. The weights and key performance indicators for each of these Quadrants are unique to each top executive (the Leadership team), given their scope of work and responsibilities. A considerable number of their KPIs are directly linked to Voyage 2025 related growth targets, ensuring that they are sufficiently incentivised to achieve the outcomes set out under Voyage 2025.
INSIDE INSIGHT OPERATING LANDSCAPE & STRATEGY OUR STRATEGY
53National Development Bank PLC Annual Report 2021

MAKING TRADE-OFFS
In directing strategy, we are compelled to make trade-offs in how we allocate capital to ensure that we are optimising and putting our pool of resource and relationships to best use. Key trade-offs identified during the year are summarised below:
Balancing employee safety with the implications of working from home
Employees are likely to face increased stress and isolation as a result of remote working. While our primary concern remained the threat posed by COVID-19 on physical health, working from home for extended periods could have implications on mental health.
Strategic objectives
Capitals impacted
Empowered Staff
Human Capital
Achieving the right balance between technology and human interaction
As the Bank drives increased digital enablement among its employees, we are cognisant of the need to balance this with sufficient face to face interaction, ensuring customers’ feel they are heard and understood.
Strategic objectives
Capitals impacted
Digital and data as transformers
Social and Relationship Capital
Balancing our digital aspirations with capital investment requirements
While we pursue our ambitious digital plans, the Bank is required to direct capital investment to procure infrastructure and systems, which is challenging during times of economic stress.
Strategic objectives
Capitals impacted
Digital and data as transformers
Digital Capital
Financial Capital
Shifts in portfolio in line with our ESG priorities
Banks have to face a conscious trade-off between business opportunities that create shareholder value, but low economic profit with those that offer lower profit margins but drive wider economic, social and environmental benefits.
Strategic objectives
Capitals impacted
Business Focus
Social and Relationship Capital
Financial Capital
INSIDE INSIGHT OPERATING LANDSCAPE & STRATEGY OUR STRATEGY
54 National Development Bank PLC Annual Report 2021
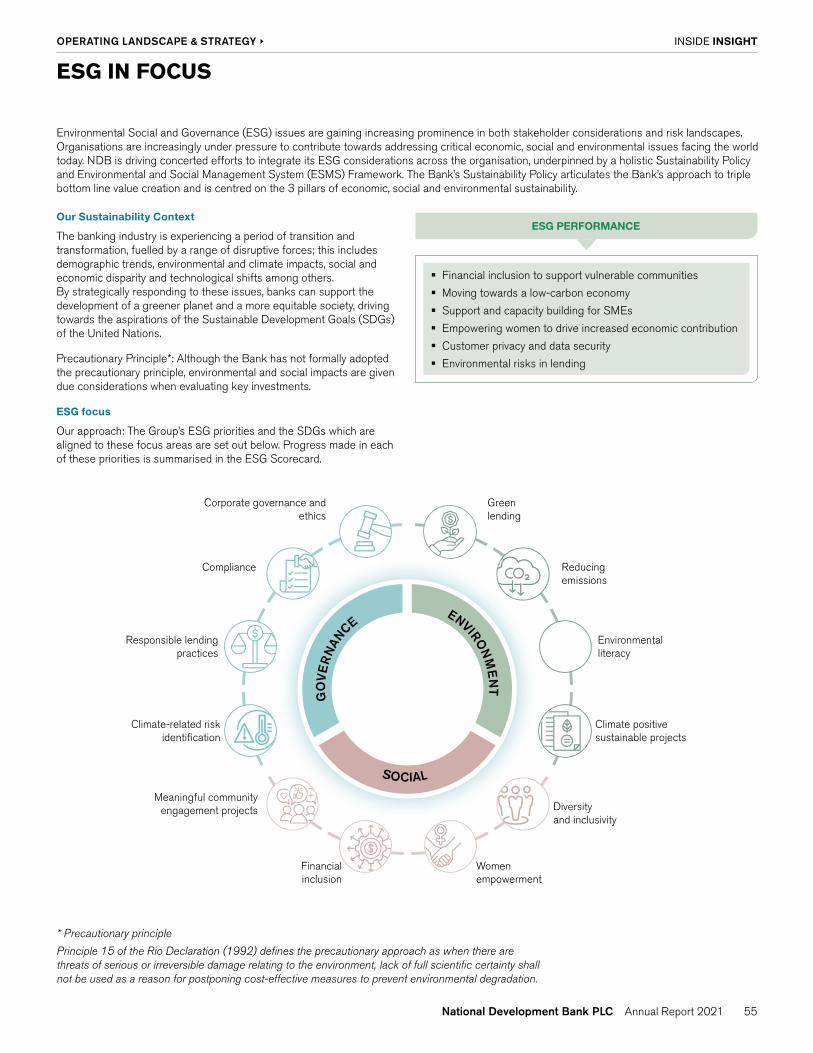
ESG IN FOCUS
Environmental Social and Governance (ESG) issues are gaining increasing prominence in both stakeholder considerations and risk landscapes. Organisations are increasingly under pressure to contribute towards addressing critical economic, social and environmental issues facing the world today. NDB is driving concerted efforts to integrate its ESG considerations across the organisation, underpinned by a holistic Sustainability Policy and Environmental and Social Management System (ESMS) Framework. The Bank’s Sustainability Policy articulates the Bank’s approach to triple bottom line value creation and is centred on the 3 pillars of economic, social and environmental sustainability.
Our Sustainability Context
The banking industry is experiencing a period of transition and transformation, fuelled by a range of disruptive forces; this includes demographic trends, environmental and climate impacts, social and economic disparity and technological shifts among others. By strategically responding to these issues, banks can support the development of a greener planet and a more equitable society, driving towards the aspirations of the Sustainable Development Goals (SDGs) of the United Nations.
Precautionary Principle*: Although the Bank has not formally adopted the precautionary principle, environmental and social impacts are given due considerations when evaluating key investments.
ESG focus
Our approach: The Group’s ESG priorities and the SDGs which are aligned to these focus areas are set out below. Progress made in each of these priorities is summarised in the ESG Scorecard.
� Financial inclusion to support vulnerable communities
� Moving towards a low-carbon economy
� Support and capacity building for SMEs
� Empowering women to drive increased economic contribution
� Customer privacy and data security
� Environmental risks in lending
ESG PERFORMANCE
ENVIRON
ME
NT
GO
VE
RN
ANCE
SOCIAL
Green lending
Corporate governance and ethics
Reducing emissions
Compliance
Environmental literacy
Responsible lending practices
Climate positive sustainable projects
Climate-related risk identification
Diversity and inclusivity
Women empowerment
Financial inclusion
Meaningful community engagement projects
* Precautionary principle
Principle 15 of the Rio Declaration (1992) defines the precautionary approach as when there are threats of serious or irreversible damage relating to the environment, lack of full scientific certainty shall not be used as a reason for postponing cost-effective measures to prevent environmental degradation.
INSIDE INSIGHT OPERATING LANDSCAPE & STRATEGY
55National Development Bank PLC Annual Report 2021

2021
Green lending
Renewable energy: NDB is a key lender to renewable energy projects in Sri Lanka.
97
� Disbursements for renewable energy projects (to date) LKR Bn 50
� Number of projects (to date) Number of 98
� GHG and harmful gases avoided kgCO2e 555,924,807
Hybrid/electrical vehicle lending
� Number of vehicles financed Number of 2,065
� Amount extended LKR Mn 5,480
Reducing carbon emissions
The Bank initiated an engagement with the Sri Lanka Climate Fund to verify its ‘Corporate Level GHG Emission Statement’ as a first step to formulating its action plan for achieving net zero.
97
� Carbon footprint tCO2e 2,312
� Carbon intensity tCO2e/ LKR Mn 0.04
Environmental literacy programs
The Bank conducts awareness sessions for students to address contemporary environmental issues.
97
� Number of sessions Number 38
� Beneficiaries Number >8,000
Climate positive projects
� Employee families engaged through Home Agri project Number 33
� Trees planted through initiative at Marine Drive Number of trees
50
� Reforestation project at Hibiliyakada Forest (Planted in 2020 and maintained for healthy growth through 2021)
Number of trees
3,000
ENVIRONMENT
97
INSIDE INSIGHT OPERATING LANDSCAPE & STRATEGY ESG IN FOCUS
56 National Development Bank PLC Annual Report 2021

2021
Diversity
The Bank has obtained and continues to comply with the EDGE Certification for gender equality at the workplace .
82
� Female representation at Senior Management levels % 33
Women empowerment
Through the Banking on Women initiative and Sri Lanka Vanithabhimana initiative the Bank drives women’s socioeconomic empowerment.
92
� Sri Lanka Vanithabhimana - participants from across the country. Number of >3,000
Financial inclusion
The Bank drives socio-economic empowerment through lending to unbanked/underprivileged sections.
67
First time mortgages
� First time mortgage customers Number of 487
� Lending for first time mortgages LKR Mn 4,345
Lending for SME start-ups LKR Mn 216
Lending to small business owners LKR Mn 2,761
Community engagement
� Assistance for COVID-19 crisis LKR Mn 6.17
2021
Responsible lending practices
The Bank has implemented a comprehensive ESMS system to embed social and environmental consciousness to lending decisions.
107
� Number of loans screened % 100
� Employees trained on ESMS Number 756
� Total employee training hours Number 6,796
Risk Management
With our aspiration of embedding climate-related risks to the Bank’s overall risk management framework, we have identified the following implications of climate change on our risk profile.
Type of Risk Implications
Credit risks Arising from lending exposure to industries which have relatively high vulnerabilities to climate change. This includes agriculture, tourism and energy among others.
Funding risks Arises from counterparts withdrawing funding lines from potentially climate-negative businesses
Operational risks Erratic weather patterns and natural disasters can direct or indirectly disrupt the Group’s operations
Regulatory risks More stringent scrutiny and regulations relating to mitigating climate change may impact our business model and key lending decisions.
SOCIAL
GOVERNANCE
INSIDE INSIGHT OPERATING LANDSCAPE & STRATEGY ESG IN FOCUS
57National Development Bank PLC Annual Report 2021


FINANCIAL CAPITAL
The role of Financial Capital in our Value Creation
How we define Financial Capital
Shareholders’ funds and borrowings which are used to fund the Group’s growth and day to day operations.
Continued access to low cost funding is vital to our sustainable growth, as it funds our expansions, offers liquidity buffers and ensures the smooth continuity of day to day operations.
SHAREHOLDER VALUE CREATION IN 2021
Please refer to page 36 for detailed information on the Group’s shareholder value creation during the year.
2021 2020 2019
PAS (LKR Bn) 6.90 5.12 4.78
Earnings per share (LKR) 22.44 21.99 20.53
Net asset value per share (LKR) 175.65* 206.23 195.60
Return on equity (%) 12.47 11.20 11.59
Dividend per share (LKR) -** 1.50 7.00
Earnings per share Net asset value per share Return on equity
* Reflects the change in the number of shares issued.
** The Board of Directors will consider a declaration of dividends for the year 2021 in due course. The Bank paid an interim cash dividend of LKR 1.50 per share for the year 2020.
The Group has continued to deliver on its shareholder commitments despite the extremely challenging operating conditions that have prevailed over the last few years. In 2021, EPS increased by 2% to LKR 22.44, upheld by the Group’s record profitability levels. Meanwhile, the Bank’s EPS stood at LKR 20.68, compared to LKR 23.77 of the previous year.
The Group’s net asset value per share amounted to LKR 175.65, compared to LKR 206.23 the previous year. The decline is primarily owing to the rights issue which resulted in the number of shares in issue increasing by 124.5 Mn during the year. The Group’s total net assets have continued to increase in line with consistent asset growth. At Bank level, net asset value per share clocked in at LKR 165.02 (2020: LKR 192.49).
The Group’s ROE widened to 12.47% from 11.20% of the previous year. ROE was upheld by 35% growth in profitability despite a 31% increase in the Group’s equity base following the Rights Issue and Private Placement during the year.
INSIDE INSIGHT MANAGEMENT DISCUSSION & ANALYSIS
59National Development Bank PLC Annual Report 2021

Net Interest Income
FINANCIAL PERFORMANCE
Impairment costs
Cost Management Non-fund based Income
Bank’s NII increased by 22% to LKR 21.6 Bn driven by a 12% drop in interest expenses, reflecting the Group’s timely asset and liability repricing decisions. Interest income recorded a marginal drop despite an 19% expansion in the gross loan portfolio, reflecting the low interest rate scenario that prevailed for most part of 2021. Consolidate NII increased by 21%. NIM widened to 3.25% from 3.07% last year, reflecting interest rate movements, improved CASA deposits and the increased equity contribution in the funding profile.
The Bank witnessed a considerable increase of 51% in impairment costs to LKR 10.3 Bn, reflecting stresses in the macro economic landscape and the Bank’s prudency in impairment provisioning. Accordingly, the Impaired loan (stage 3) ratio and Impairment (stage 3) to stage 3 loan ratio increased to 4.55% and 32.81%. The Bank also increased provisioning on foreign currency denominated government securities to LKR 2 Bn, due to the downgrade of the sovereign rating.
The Bank has continued to achieve improvements in cost management and the cost to income ratio declined further to 33.7%, from 37.0% the previous year to one of the best cost to income ratios in the industry. This has been driven by process automation, shift to digital channels and optimisation of human capital. During the year, operating expenses increased by 11%, driven by personnel expenses (+10%) and other expenses (+15%) as inflationary pressures increased.
Non-fund based Income grew by 23% to LKR 9.4 Bn during the year, led by 32% increase in net fee and commission income; this growth was driven by strategic focus on export related trade services and increased thrust towards digital transactions. Other non-fund based income increased by 11% to LKR 3.8 Bn, supported by forex gains in the interbank market and valuation gains on foreign currency held as retained profits. As evident in the above graph, the fee and commission component within total non-fund-based income enhanced, propelled by the non-fund based income drivers. Overall contribution of non-fund based income to total operation income broadly stabilised at 30% during the year, amidst challenging conditions. Bank’s total operating income increased by 22% to LKR 31.0 Bn during the year.
Drivers: Credit demand, Interest rates, Competition, Reach, Funding composition, Attractiveness of products
Drivers: Underlying portfolio quality, Macro-economic conditions, Strength of customer relationships
Drivers: Inflation, efficiencies achieved through technology-led automation, digitised banking solution
Drivers: Fee and commission income, Trade services, Investment portfolio, Trading decisions, Interest rates, Exchange rates, Growth in digital transactions
Taxation
The Bank’s tax contribution to the Government increased by 7% to LKR 3.9 Bn during the year; VAT on Financial Services increased by 11% while Income Tax expense increased by a relatively slower 4% reflecting the reduction in the effective tax rate.
Tax management: The Bank’s tax strategy is formulated and implemented by a dedicated Tax Management Unit, driven by a team of highly skilled finance professionals. A tax consultant has been engaged to compute the income tax liability and handle the administrative functions relating to filing of income tax returns. Tax compliance is consistently monitored by Internal Audit, Compliance Unit, and the external auditors. The Senior Manager in charge of the Tax Management Unit liaises with the tax authorities on a regular basis, while engagement is also supported by the tax consultant. The Bank was fully compliant with all tax related regulations during the year.
LKR Bn
0
2
4
6
8
10
2017 20182.
5
3.1
2.9
33
3.6
31
25
30
3.4
3.8
30
3.9
2.0
4.3
5.6
2019 2020 2021
%
Non-fund based Income
Net Fee and comission incomeOther non-fund based incomeContribution of non-fund based income to total operating income
0
10
20
30
40
%
Personnelexpenses
Depreciation and amortisation
Other expenses
Cost to income ratio
%
0
20
40
60
80
100
2017 2018
496
525
394545
.5
39.3
39.9
37.0
33.7
2019 2020 2021
538
559
36 3854
8
43
0
10
20
30
40
50
Cost Management
LKR Bn
0
2
4
6
8
10
2017 2018
Impairment charge Impairment coverage ratio
1.2
3.6
1.72
2.593.07
4.044.49
3.8
6.2
8.2
2019 2020 2021
%
Impairment Charges
0
1
2
3
4
5
Profitability
The Bank’s pre tax profit increased by 12% to LKR 10.3 Bn upheld by strong growth at operating income level and cost efficiencies. Profit for the year also increased by 15% to a record high of LKR 6.4 Bn. At Consolidated level, the Group’s profit for the year surged by 35% to LKR 7.1 Bn supported by the strong performance of the Group’s capital market subsidiaries, which generated a profit of LKR 683 Mn. Consolidated profit attributable to shareholders (PAS) also increased by 35% to LKR 7.1 Bn thereby delivering the highest profits in the Group’s operating history.
LKR Bn
0
2
4
6
8
10
12
2017 2018
Bank-PBT Group-PAS Group-ROE
7.5
3.5
9.5
5.1
11.09
14.26
11.59 11.20 12.4710
.1 4.8
9.2
5.1
10.3 6.9
2019 2020 2021
%
Pro�tability
0
5
10
15
20
0
5
10
15
20
25
LKR Bn %
2017 2018
10.8
14.8
17.7
17.7
21.6
3.00
3.46
2019 2020 2021
NIM (%)NII
NII Trends
3.53 3.07 3.25
0
1
2
3
4
5
INSIDE INSIGHT MANAGEMENT DISCUSSION & ANALYSIS FINANCIAL CAPITAL
60 National Development Bank PLC Annual Report 2021

FINANCIAL POSITION
Total Assets Funding composition
The Bank’s total assets grew by 12% to LKR 702.9 Bn, as NDB pursues its aspirations of achieving LKR 1 Tn in assets by 2025. Asset growth was driven by 19% expansion in the gross loan portfolio, reflecting the Bank’s efforts to direct lending towards critical sectors of the economy. Resultantly, credit assets accounted for 71% of total assets, compared to 68% last year. The Bank’s liquidity position was also healthy with cash and cash equivalents increasing by 28% during the year and the Statutory liquid asset ratio - Domestic Banking Unit and Offshore Banking Unit were 23.14% and 25.31% respectively. Consolidated assets also grew by 12% to LKR 708.8 Bn during the year. Effective Balance Sheet management was reflected in a Return on Assets (before taxes) ratio for the year of 1.55% (2020: 1.59%).
The Bank’s deposit base grew by 13% to LKR 552.0 Bn, crossing the LKR 500 Bn mark. Deposits dominated the funding profile with a share of 80%. CASA grew by 22%, in view of the interest rate dynamics and the Bank’s strengthening deposit franchise.
The Bank’s funding position strengthened during the year, following a Rights Issue of LKR 8 Bn and a private placement by Norfund amounting to LKR 1.5 Bn, which resulted in the Bank’s equity increasing by 32% to LKR 58.9 Bn. The Bank also raised LKR 8 Bn Tier II capital through a listed debenture, which was oversubscribed on the opening day. With these measures, the Bank is well capitalised to drive its future growth aspirations and withstand any potential stress that could arise from macro-economic vulnerabilities. The Bank’s Tier 1 and Total capital ratio clocked in at 10.01%% and 15.42% during the year (2020: 9.17% and 14.32%).
Loans and Receivables
The Bank pursued lending opportunities across its business segments, which enabled broad-based growth during the year. Accordingly, loans and receivables crossed the LKR 500 Bn mark to close at LKR 526 Bn, which was a 19% growth. All business segments of Retail Banking, Business Banking, Wholesale Banking and PIF contributed, with 24%, 16%, 27% and 10% growth in their respective loan portfolios. In terms of products, growth drivers during the year were medium and short term loans, overdrafts, trade finance facilities, personal loan financing and pawning advances.
Portfolio quality: Quality of the loan book, as measured through the non performing loans ratio improved to 4.65% from 5.35% last year. The net NPL ratio amounted to 2.29%. The Bank maintained proactive engagement with customers, offering flexible repayment solutions and facility restructuring to preserve portfolio quality.
LKR Bn
0
200
400
600
800
2017 2018 2019 2020 2021
%
Deposits Equity Borrowings CASA
273
348
405
490
552
68
75
72
80
79
29
21.5
22.120.0
25.227.3
35 39
45
59
Funding Composition
0
5
10
15
20
25
30
LKR Bn
2020 2021
96
48
4839
19
3427
46
140
Loan portfolio by product
OthersHousing
Leasing
Trade finance loans
Consumer loans
OverdraftsMedium and short
term loansLong term loans
0 20 40 60 80 100 120 140 160
17
2829
55
73
117
151
%
Liquid assets
Investments Group ROA-BT %
Loans & advances
Other assets
%
0
20
40
60
80
100
2017 2018 2019 2020 2021
0.0
0.5
1.0
1.5
2.0
2.5
1.972.17
1.97
1.58 1.67
Asset Growth
6 8
2171
3
1772
3
519
742
525
673
521
713
WAY FORWARD
Despite macro economic stress in the short term, the Group remains optimistic regarding recovery over the medium to long term horizon, driven by the gradual recovery of the tourism industry, resumption of economic activities and a strengthening export sector. Strategic focus will be placed on increasing penetration in the export-oriented segment, which in turn will support growth in fee and commission income. The Group’s continued focus on digitalisation is anticipated to drive further operating efficiencies, both in back-end and customer facing processes. Following strong growth over the past few years, we will seek to consolidate our portfolio, placing priority on quality and profitability. The equity infusion in 2021 has positioned the Bank on a strong platform to drive future growth, as the Bank drives towards achieving the ambitious aspirations set out by Voyage 2025.
The following sections of this Annual Report (pages 63 to 72) provides an overview of the performance of the Bank’s key business segments during the year and should be read in conjunction with the chapter on Financial Capital. Pages 73 to 75 summarise the performance of the Group’s subsidiaries, which include its capital market and property management clusters.
Financial Value Added
For the year ended 31 December (LKR Mn) 2021 2020
Invested Equity
Total equity 58,932 44,781
Add : Allowance for impairment charges for loans and receivables and other losses 26,804 18,965
Total 85,736 63,746
Earnings
Profit after tax and dividend on preference shares 6,362 5,530
Add: Impairment for loans and receivables and other losses 10,265 6,796
Less: Loan losses written off - -
Total 16,627 12,327
Cost of equity (Based on 12 months weighted average T-Bond rate plus 2% for risk premium) 10.24% 7.05%
Cost of average equity 7,081 4,100
Economic value added 9,546 8,227
INSIDE INSIGHT MANAGEMENT DISCUSSION & ANALYSIS FINANCIAL CAPITAL
61National Development Bank PLC Annual Report 2021


RETAIL BANKING
INSIDE INSIGHT MANAGEMENT DISCUSSION & ANALYSIS PERFORMANCE OF BUSINESS LINES
Targeted penetration of the Retail Segment in recent years has allowed NDB to expand its presence beyond its traditional market segments and build a more diverse and stable portfolio. Despite its relatively recent foray into Retail Banking, NDB has successfully developed a competitive edge centering superior digital capabilities, relevant and customer centric solutions and strong customer service.
Value Creation/ Non-Financial Performance
24% growth in loans contributing to fund and fee based income
Deepened customer relationships
Customer centric organisational culture
Increased digital enablement both in customer and back end processes
Financial Performance
Operating Environment
� Pandemic led disruptions and lockdowns affected overall economic activity and credit demand in the second half of the year
� Impact of rising interest rates on net interest margins
� Leasing industry affected by restrictions on vehicle imports
Growth in Operating Income
19%
Growth in Loans and Receivables
24%
Growth in Deposits
18%Ongoing opportunities for training, flexible working and career progression
STRATEGY AND PERFORMANCE
Strategy and Performance Review
The Segment marked enhanced performance in both operational and financial aspects during the year, driven by continued loan growth, effective cost management and a timely product strategy. Loans and receivables increased by 24%, led by good growth in personal, housing, credit cards and pawning advances. The expansion in operating income was 19%, amidst the low interest rate scenario which prevailed for most part of 2021. Relentless focus on efficiencies through automation and productivity improvements have led to consistent improvements in the cost to income ratio. On the other hand, moderating economic conditions had an inevitable impact on credit quality. Amidst such conditions, the Segment’s concerted efforts in managing portfolio quality enabled it to preserve its NPL ratio at the same level of 2020. Meanwhile, deposits grew by 18% during the year, reflecting the Bank’s strengthening deposit franchise and investments made in strengthening the Privilege Banking proposition in recent years.
Delivering Voyage 2025 through our Segments
Customer solutions
� Enhancing customer experience across omni channels
� Revamped the Privileged Banking proposition offering personalisation, curated solutions and family banking
Digital and data as transformers
� Launch of several industry first features through NDB NEOS including onboarding, vKYC and real time billers
� Personalised promotions through leveraging on data analytics
Empowered staff
� Facilitated work from home, ensuring safety of employees, uninterrupted operations and improved work life balance
� Implementation of e-learning modules to refresh Standard Operating Procedures
Embedding Customer Centricity
The year under review presented unique challenges in maintaining the Bank’s service standards, owing to pandemic led shifts in work arrangements and disruptions to branch operations. Despite these challenges, the Bank leveraged on the service oriented culture propagated through ‘We Go Beyond’, to deliver a superior customer experience, as attested by higher satisfaction levels and net promoter scores. With customer engagement shifting primarily to digital platforms, NDB also focused on delivering its service proposition through maintaining Contact Centre service standards, enhancing engagement on social media platforms and continued engagement with employees through refresher and teaser emails.
92 - Social and Relationship Capital
LKR Bn LKR Bn
Retail Banking Performance
Loans & Recievables Deposits
0
50
100
150
200
250
300
5.0
5.5
6.0
6.5
7.0
90 237
278
111
2020 2021
5.5
6.6
Operating Income
Selective Product Strategy
The Bank strengthened its competitive position in the Pawning Segment, with the product being offered across 80 branches and advances increasing by 132% in 2021. Understandably, the Leasing Segment continued to be impacted by restrictions on the importation of motor vehicles and the Bank focused on the second hand vehicle
PERFORMANCE OF BUSINESS LINES
63National Development Bank PLC Annual Report 2021

PRIVILEGE BANKING
NDB Privilege Banking is the market leader in Sri Lanka’s private banking space, accounting for the largest deposit portfolio. The Unit’s competitive edge stems from two predominant aspects one - the exceptional and personalised services to customers. The other is the wide plethora of solutions comprising both banking and capital market products, the curation of which is enabled by NDB’s unique financial services conglomerate set-up.
Performance Overview
The Segment delivered a year of strong expansion, achieving record asset and liability growth of 70% and 19% respectively. All sub-segments of Privilege Select, Privilege and Elevate catering to tiered segments of the high net worth customer bases propelled this growth. With increased customer acquisition during the year, NDB Privilege further fortified its position as the market leader in private banking.
Banking on Women
During 2021, the Bank continued to make progress in its Banking on Women initiative. Loans granted and deposits mobilised in the women’s market segment exceeded set targets for the year. This is supported by the Bank’s unique proposition for women, NDB
Araliya and the continuation of the Sri Lanka Vanithabhimana programme an island-wide women’s award programme dedicated to recognising excelling females across eight categories of awards.
92 - Social and Relationship Capital
market by offering convenient, doorstep services through its 10 dedicated leasing centres. In credit cards, NDB recorded a moderate portfolio growth, focusing instead on managing credit quality. The credit card system was also upgraded during the year, thereby providing a solid platform to pursue acquisition in 2022. With the launch of the NDB Zee Digital Youth Account targeting the Gen Zers the Bank now offers the complete range of deposit propositions to suite customers’ lifestyle.
Digital Delivery
NDB continued to make inroads in its digital propositions, delivered mainly through the NDB NEOS platform, which comprises NDB NEOS Mobile Banking and NDB NEOS Online Banking channels. NDB NEOS Mobile Banking has cemented its position among the leading apps in the banking sector as the only app which combines the features of mobile banking and e-wallet. The NDB NEOS platform recorded a 70% increase in active users and 113% growth in transaction volume (Mobile App+Online). The Bank emerged as the first bank to launch digital KYC based online account opening, through usage of Artificial Intelligence technology, and direct connectivity to the Department of Registration of Persons, thereby enabling fully digital onboarding through NDB NEOS.
76 - Digital Capital
Drive towards Operational Excellence
The Bank’s thrust towards digitalising both its customer related and back end processes have led to consistent improvements in operating efficiencies. With an increasing number of transactions conducted through digital channels, branch footfall has reduced significantly, thereby facilitating improved efficiencies within branches. During the year, a number of processes were also automated, as a result of a work study rolled out, to identify branch processes that could be further streamlined for efficiency enhancement.
generations. In line with Voyage 2025, we also expanded our service offering to include Group services such as wealth and investment management.
Segmentation Strategy
We also sought increased segmentation of our customers, adding a premium tier named Privilege Select Plus, catering to the upper end of the high net worth segment. The Bank offers a range of exclusive benefits to this Segment (presented alongside), leveraging on its group capabilities, industry partnerships and specially trained team of dedicated Relationship Managers.
Customer Engagement and Reach
Privilege Banking services are offered across the Bank’s branch network through the appointment of dedicated Relationship Managers. The Bank also opened a new Privilege Banking Centre in Moratuwa during the year, thereby bringing the total network to 16 centres. During the year, we also strengthened customer engagement through the publication of a quarterly newsletter “Select’” specially curated for the lifestyle and financial needs of high net worth clients. Meanwhile, we continued to leverage on the Bank’s superior digital capabilities to cater to the increasing sophistication and customer need for convenience and accessibility. A Revamped Proposition
The Bank sought to renew and enhance its proposition through going beyond the traditional operating models and launching several firsts to Sri Lanka’s private banking space. During the year, strategic focus was placed on curating an array of personalised solutions for our discerning clientele. We also extended our Privilege Banking services to immediate family members of our customers through the launch of NDB Family Banking. Over the long term this is expected to build brand loyalty and increase retention across
INSIDE INSIGHT MANAGEMENT DISCUSSION & ANALYSIS PERFORMANCE OF BUSINESS LINES
64 National Development Bank PLC Annual Report 2021

Future outlook of Retail Banking
� Deliver customer centricity through personalised solutions, digital delivery and superior service
� Strengthen the balance sheet through driving expansion of the asset/liability profile
� Increased focus on pursuing cross sell opportunities, leveraging on Group capabilities
Risks
� Macro economic headwinds including the challenged foreign exchange position
Opportunities
� Increased customer sophistication
� Thrust towards digital capabilities
BUSINESS BANKING
The Bank’s foray to the SME sector since its inceptions has enabled it to build a more diversified portfolio while directly supporting the country’s national development agenda. NDB has leveraged its inherent capabilities in development banking to support the country’s SME segment, offering a holistic value proposition which also includes advisory and non financial value addition.
Value Creation/ Non-Financial Performance
57% CASA growth contributing to optimised cost of funds
Fora conducted for exporters, SMEs and women led entrepreneurs
Strengthened capabilities in driving exports and trade income
Financial Performance
Operating Environment
� Pandemic-led disruptions during the second and third waves
� Challenged foreign currency position and its implications on importers and manufacturers relying on imported material
Growth in Operating Income
12%
Growth in Loans and Receivables
16%
Growth in Deposits
7%
Deepened customer relationships through proactive engagement and supporting long-term viability
MOU entered into with Green Building Council of Sri Lanka for climate smart lending90
95
100
105
110
115
120
125
3.5
3.8
4.1
4.4
4.7
5.0
103
102
110
119
2020 2021
4.0
4.5
Business Banking Performance
Loans & Recievables Deposits
Operating Income
LKR Bn LKR Bn
The Introduction of Privilege Banking Select Plus
The existing Privilege arm will reach a step higher - extending the Bank’s services league beyond the standard industry offering
Additional Services
Estate Planning Advisory, Loyalty Programmes, Philanthropy Services, Family Banking and Digital Services
Enhanced Lending Facilities
Designed to meet complex borrowing requirements
Financial Advisory Services
A one-stop solution for all investment advice done in partnership with the Bank’s group companies - NDBW, NDBS and NDBIB
Priority Service
Enjoyed across the NDB Group network
Exclusive Life and Health Benefits
Provided in partnership with international service providers
Curated Quarterly Newsletter
Containing macroeconomic, investment coverage and emerging themes in banking and finance
Exclusive Concierge Services
Designed to meet global and local lifestyle requirements
New offerings of NDB
Privilege Banking
INSIDE INSIGHT MANAGEMENT DISCUSSION & ANALYSIS PERFORMANCE OF BUSINESS LINES
65National Development Bank PLC Annual Report 2021
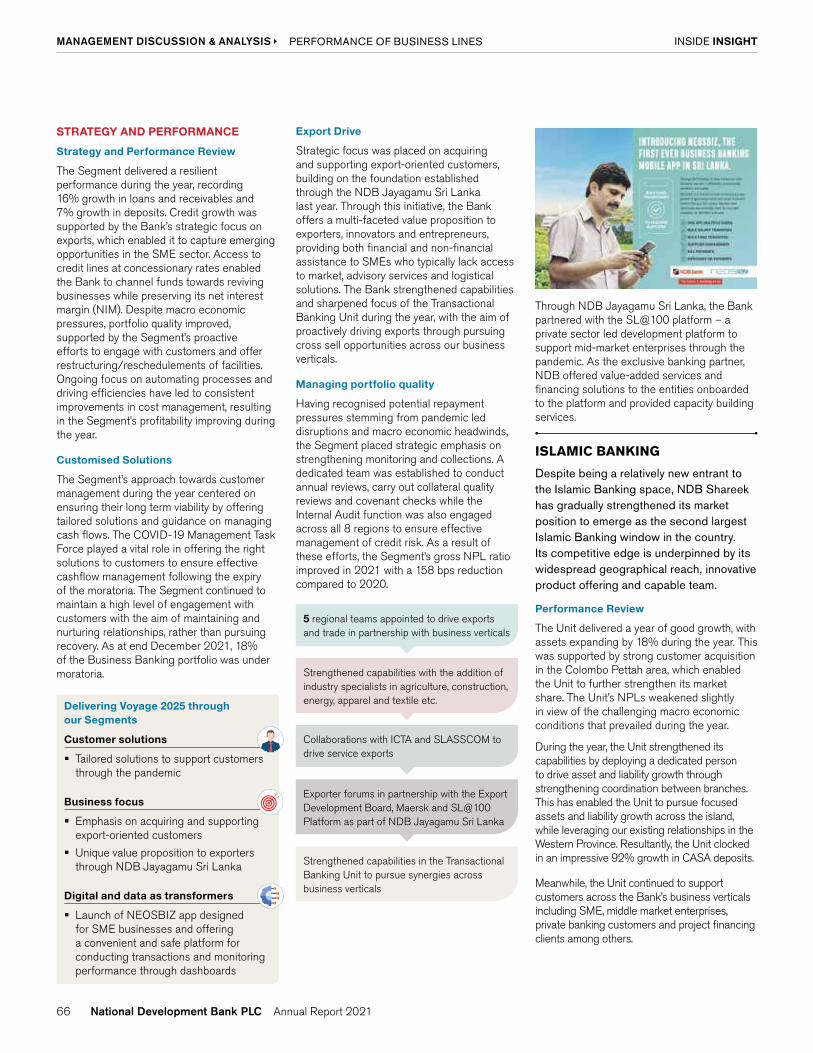
STRATEGY AND PERFORMANCE
Strategy and Performance Review
The Segment delivered a resilient performance during the year, recording 16% growth in loans and receivables and 7% growth in deposits. Credit growth was supported by the Bank’s strategic focus on exports, which enabled it to capture emerging opportunities in the SME sector. Access to credit lines at concessionary rates enabled the Bank to channel funds towards reviving businesses while preserving its net interest margin (NIM). Despite macro economic pressures, portfolio quality improved, supported by the Segment’s proactive efforts to engage with customers and offer restructuring/reschedulements of facilities. Ongoing focus on automating processes and driving efficiencies have led to consistent improvements in cost management, resulting in the Segment’s profitability improving during the year.
Customised Solutions
The Segment’s approach towards customer management during the year centered on ensuring their long term viability by offering tailored solutions and guidance on managing cash flows. The COVID-19 Management Task Force played a vital role in offering the right solutions to customers to ensure effective cashflow management following the expiry of the moratoria. The Segment continued to maintain a high level of engagement with customers with the aim of maintaining and nurturing relationships, rather than pursuing recovery. As at end December 2021, 18% of the Business Banking portfolio was under moratoria.
Delivering Voyage 2025 through our Segments
Customer solutions
� Tailored solutions to support customers through the pandemic
Business focus
� Emphasis on acquiring and supporting export-oriented customers
� Unique value proposition to exporters through NDB Jayagamu Sri Lanka
Digital and data as transformers
� Launch of NEOSBIZ app designed for SME businesses and offering a convenient and safe platform for conducting transactions and monitoring performance through dashboards
Export Drive
Strategic focus was placed on acquiring and supporting export-oriented customers, building on the foundation established through the NDB Jayagamu Sri Lanka last year. Through this initiative, the Bank offers a multi-faceted value proposition to exporters, innovators and entrepreneurs, providing both financial and non-financial assistance to SMEs who typically lack access to market, advisory services and logistical solutions. The Bank strengthened capabilities and sharpened focus of the Transactional Banking Unit during the year, with the aim of proactively driving exports through pursuing cross sell opportunities across our business verticals.
Managing portfolio quality
Having recognised potential repayment pressures stemming from pandemic led disruptions and macro economic headwinds, the Segment placed strategic emphasis on strengthening monitoring and collections. A dedicated team was established to conduct annual reviews, carry out collateral quality reviews and covenant checks while the Internal Audit function was also engaged across all 8 regions to ensure effective management of credit risk. As a result of these efforts, the Segment’s gross NPL ratio improved in 2021 with a 158 bps reduction compared to 2020.
5 regional teams appointed to drive exports and trade in partnership with business verticals
Collaborations with ICTA and SLASSCOM to drive service exports
Strengthened capabilities with the addition of industry specialists in agriculture, construction, energy, apparel and textile etc.
Exporter forums in partnership with the Export Development Board, Maersk and SL@100 Platform as part of NDB Jayagamu Sri Lanka
Strengthened capabilities in the Transactional Banking Unit to pursue synergies across business verticals
Through NDB Jayagamu Sri Lanka, the Bank partnered with the SL@100 platform – a private sector led development platform to support mid-market enterprises through the pandemic. As the exclusive banking partner, NDB offered value-added services and financing solutions to the entities onboarded to the platform and provided capacity building services.
ISLAMIC BANKING
Despite being a relatively new entrant to the Islamic Banking space, NDB Shareek has gradually strengthened its market position to emerge as the second largest Islamic Banking window in the country. Its competitive edge is underpinned by its widespread geographical reach, innovative product offering and capable team.
Performance Review
The Unit delivered a year of good growth, with assets expanding by 18% during the year. This was supported by strong customer acquisition in the Colombo Pettah area, which enabled the Unit to further strengthen its market share. The Unit’s NPLs weakened slightly in view of the challenging macro economic conditions that prevailed during the year.
During the year, the Unit strengthened its capabilities by deploying a dedicated person to drive asset and liability growth through strengthening coordination between branches. This has enabled the Unit to pursue focused assets and liability growth across the island, while leveraging our existing relationships in the Western Province. Resultantly, the Unit clocked in an impressive 92% growth in CASA deposits.
Meanwhile, the Unit continued to support customers across the Bank’s business verticals including SME, middle market enterprises, private banking customers and project financing clients among others.
INSIDE INSIGHT MANAGEMENT DISCUSSION & ANALYSIS PERFORMANCE OF BUSINESS LINES
66 National Development Bank PLC Annual Report 2021

MICRO FINANCING
Through its micro financing arm, NDB directly contributes to the socio-economic empowerment and financial inclusion of the country’s most vulnerable segments by providing access to affordable finance.
As a segment which is highly vulnerable to external pressures, the micro financing customer base was sharply impacted by pandemic led disruptions and the moderation in macro economic conditions. Against this backdrop, we placed emphasis on consolidating and managing our portfolio through offering relief packaging, restructuring and rescheduling facilities and providing concessions such as interest waivers. The Bank continued to generate value for this Segment, through extending guidance on managing cash flow constraints and leveraging our digital capabilities to offer door-step banking services through the Bank2U proposition. The Bank2U proposition has been instrumental in introducing banking services to many who were hitherto unbanked. REFINANCE OPERATIONS
NDB’s Refinancing Unit has nurtured strong partnerships with the Government of Sri Lanka and global multilateral funding agencies, thereby channeling funding at concessionary rates to selected industry sectors.
The Unit disbursed concessionary funding of over LKR 3.3 Bn translating to 471 projects during the year, supporting the beneficiaries overcome the challenges of the pandemic. Emphasis was placed on supporting the working capital requirements and contributing to the revival of businesses, following pandemic-led disruptions. The Bank also actively supported customers through lending under the Saubhagya COVID-19 Renaissance Facility, offering grace periods and extended credit periods in line with the CBSL guidelines. As one of the top
Small business and community development
1,991 Number of outstanding loans
LKR 335 Mn Outstanding loan amount
380 Number of past due loans
LKR 69 Mn Past due loan amount
of which,
AgricultureCommunity Based OrganisationsRetailServices
TextilesTradingOther
19%
10%
8%
6%
44%
5%
8%
Sector wise Composition of the Micro Financing Loan Portfolio - 2021
Province wise Composition of the Micro Financing Loan Portfolio - 2021
9%
4%
23%
4% 20%
4%
11%
16%
9%
Central ProvinceEastern ProvinceNorth Central ProvinceNorth Western Province
Nothern ProvinceSabaragamuwa ProvinceSouthern ProvinceUva ProvinceWestern Province
A success story
We remain optimistic on the growing demand for alternative financial services in Sri Lanka and will continue to leverage our reach and reputation to capture opportunities in Islamic Banking. We are also keen to further widen our product portfolio and hope to launch several innovative and unique products over the short to medium term.
Eminent Shariah scholars
Regional footprint
Excellent services scholars
Array of attractive products
“I returned to Sri Lanka after I lost my job in Dubai following the COVID-19 pandemic. I was keen to develop the family business of cane products, which I inherited from my father. Since I did not have the necessary skills and knowledge, I participated in the workshops organised by Shilpa Sabhawa through which I was introduced to NDB. The Bank was extremely supportive in developing my business, arranging a concessional Diviaruna loan of LKR 300,000 under the Jayagamu Sri Lanka programme. I gradually developed my business and now even export my products to foreign countries. NDB supported with all the financial support I needed including an additional facility of LKR 750,000 and provided advisory services required to develop the business. I am proud to be one of the top entrepreneurs in the cane industry in Sri Lanka today and am grateful for the confidence and support given to me by NDB”
Mr. Sumal PereraColombo District
INSIDE INSIGHT MANAGEMENT DISCUSSION & ANALYSIS PERFORMANCE OF BUSINESS LINES
67National Development Bank PLC Annual Report 2021

Future outlook of Business Banking
� Deliver customer centricity through personalised solutions, digital delivery and superior service
� Automation in Refinance Operations which will result in significant improvements in turnaround time
� Development of new solutions in the Islamic Banking Unit
Opportunities
� Policy stimulus towards supporting the country’s SME sector
� Potential for growth through NEOSBIZ
� Formation of a National Credit Guarantee Institution, which will support wider accessibility
Risks
� Potential repayment pressure following the conclusion of moratoria
� Macro economic headwinds including the challenged foreign exchange position
financial and advisory solutions to SMEs and directly supporting SMEs expand their business capacities.
The Bank’s role as a PFI also allows it to fulfill its social and environmental aspirations through propagating sustainable business practices. Most lending schemes require strict adherence to eligibility standards and responsible business practices. Meanwhile funding lines aimed at empowering women, generating renewable energy and mitigating environmental pollution has enabled the Bank to drive towards fulfilling its sustainability agenda and contribute towards achieving the UN Sustainable Development Goals.
performers among the Participating Financial Institutions for loan schemes, the Bank continued to lend actively under the schemes such as SMELoC, SMILE 111 Revolving and E Friends 11 Revolving Fund and the Roof Top Solar scheme.
The Bank benefits from its established track record and core competencies in developing banking. In further sharpening these skills, the Bank entered into a Memorandum of Understanding (MOU) with the Palladium International LLC, an agency appointed by USAID. NDB will partner them towards the dual purposes of enhancing the capabilities of the Bank’s SME Officers in curating precise
WHOLESALE BANKING
The Segment offers an array of solutions to Sri Lanka’s Corporate Sector including Commercial, Transactional and Cash Management services. A robust business model and mutually value adding relationships nurtured over the years, has enabled the Segment to remain resilient in challenging conditions, maintaining its position as the key contributor to NDB’s loans and receivables and deposits.
Value Creation/ Non-Financial Performance
Enhanced trade volumes generating fee-based income
Culture of data-driven decision making
Cross functional collaboration between business verticals
Increased digital enablement of customers
Financial Performance
Operating Environment
� Broad-based implications of the challenged foreign currency position
� Frequent changes in the regulatory landscape, mainly with regards to foreign exchange
� Pandemic-led disruptions
Growth in Operating Income
23%
Growth in Loans and Receivables
27%
Growth in Deposits
9%
Deeper customer relationships through offering holistic value propositions
LKR Bn
0
50
100
150
200
5
6
7
8
131
140
153
166
2020 2021
5.9
7.2
Wholesale Banking Performance
Loans & Recievables Deposits
Operating Income
LKR Bn
Re�nance Loans granted 2021
3%
17%
2%
6%
64%
8%
Saubhagya - COVID-19 FundSmall & Medium Enterprises Line of Credit (SMELoc)SMILE III Revolving Fund Roof Top Solar Loan SchemeE Friend III Revolving FundOther
INSIDE INSIGHT MANAGEMENT DISCUSSION & ANALYSIS PERFORMANCE OF BUSINESS LINES
68 National Development Bank PLC Annual Report 2021

STRATEGY AND PERFORMANCE
Strategy and Performance Review
The Segment recorded a commendable 27% growth in loans and receivables during the year, underpinned by strategic focus on driving export and trade through realignment of the organisational structure and strengthening capabilities within the Transactional Banking Unit. Operating income also increased by 23% despite the relatively low interest rates, attributable to proactive management of tariffs. Portfolio quality remained resilient, with the gross NPL ratio improving by over 100 bps. The Segment continued to make inroads in operating efficiencies, supported by ongoing digitalisation and automation efforts, which led to the cost to income ratio improving in 2021, in step with the Bank’s overall cost to income ratio. Meanwhile, deposits also grew, at a rate of 9% during the year.
Managing Economic Headwinds
The prevalent foreign currency shortage inevitably impacted the Segment’s import clientele and strategic emphasis was placed on proactively managing our dollar inflows and outflows. Concerted efforts were driven towards strengthening exports while, priority was placed on importation of essential items and medical equipment. We continued to work closely with other importers in rationalising their requirements and adapting their procurement policies to current conditions such as obtaining longer credit periods of customers and deferment of payments among others.
Delivering Voyage 2025 through our Segments
Organisational realignment
� Efforts to drive synergies and pursue cross sell opportunities across business verticals, led by the Transactional Banking Unit
Business focus
� Proactively seek acquisition and growth of export-oriented customers in apparel and other manufacturing sectors
� Offer a holistic value proposition to export-oriented customers
Digital and data as transformers
� Leverage digital and data capabilities to offer an enhanced customer experience and obtain better insights for decision making
Export drive through Trade and Transactional Banking
The Segment sought increased penetration of the export sector, supported by the cross-functional insights and expertise of the Bank’s Transactional Banking Unit (TBU). Established as a Voyage 2025 initiative, the TBU played a vital role in facilitating new client acquisition, monitoring portfolio utilisation and driving increased penetration. Clients were categorised based on a tiering system with Group Relationship Managers appointed for the top tiers, to ensure the delivery of strong customer service and tailored solutions. The Unit also partnered the NDB Jayagamu Sri Lanka initiative, actively participating in exporter forums to position NDB as a provider of holistic solutions, including funding for capex, working capital requirements and trade solutions.
Furthermore, the TBU also delivered a year of strong growth supported by customers’ increased digital enablement and healthy inflows from investment banking partners. The Unit has emerged as a preferred partner in capital market transactions and enhanced its market share during the year under review.
Leveraging Digital and Data Capabilities
In line with the aspiration of Voyage 2025, the Segment placed strategic focus on enhancing the customer experience, deepening insights and strengthening monitoring through its digital and data capabilities. The Bank is currently in the process of developing a new electronic banking platform for corporate customers, which is expected to offer significant opportunities for customer acquisition and growth. NDB also increased reliance on its data analytics to improve monitoring of dollar inflows and outflows through auto generated dashboards and access to high quality, real time information.
Opportunities
� Policy stimulus towards supporting the export segment
Risks
� Increasingly stringent regulations governing trade and dollar inflows
� Downgrade of sovereign rating
� Exchange rate volatility
Future outlook of Wholesale Banking
� Continued focus on driving export earnings through customer acquisition, tailored solutions, digital delivery and excellence in customer service
� Driving cross functional synergies to optimise opportunities across business verticals
� Launch of a new online banking platform for Wholesale Banking customers
� Further strengthen customer relationships through implementing an integrated CRM system
� Continued Growth through GRM strategy, Industry specialisation and Account planning
� Leveraging on Transaction Banking
Product and Service Propositions
Aligned to the Voyage 2025 strategy, the Segment launched the Group Relationship Management concept during the year, through which corporate customers were offered a fully-fledged package of financial solutions across the NDB Group. This facilitated deeper relationships and increased wallet share, and was implemented by leveraging the Group’s big data and analytical capabilities. During the year, the Segment also increased penetration of Distributor Finance/Supplier Finance facilities, thereby offering a solution for corporates to enhance business through these channel partners and enhance their liquidity.
Powering exporters through diverse Wholesale Banking solutions
INSIDE INSIGHT MANAGEMENT DISCUSSION & ANALYSIS PERFORMANCE OF BUSINESS LINES
69National Development Bank PLC Annual Report 2021

PROJECT AND INFRASTRUCTURE FINANCING (PIF)
The Bank’s PIF Segment has built a strong reputation for formulating and offering holistic value propositions in the project financing segment, underpinned by its established track record of over four decades and domain specific knowledge.
Value Creation/ Non-Financial Performance
Continually low NPLs preserving profitability
Process automation to drive increased efficiencies
Strong organisational capabilities in project financing
30% of country’s renewable energy capacity funded
33 New customer acquisition
Financial Performance
Operating Environment
� Broad-based implications of the foreign currency crisis
� Delay in investments arising from import restrictions
� Pandemic-led disruptions and resultant pressure on repayment capability
Operating Income
LKR 2.4 Bn
Growth in Loans and Receivables and
Investments
16%
Growth in Deposits
16%
Performance Highlights
The PIF Segment delivered a year of commendable growth, with the loan portfolio including investments increasing by 16% supported by customer acquisition in the renewable energy sector and new opportunities in export-oriented sectors. The growth in operating income, however, was affected by the relatively low interest rates, which led to a contraction in net interest margins. Given potential portfolio stress, the Segment proactively sought to manage portfolio quality sustaining its NPL levels at very low levels and unchanged in 2021. Increased focus on operational efficiencies, digitalisation and automation have enhanced our reach via increased channels.
Capturing Growth Opportunities
The Segment continued to support the revival of businesses, following the second and third outbreak of the pandemic; accordingly, moratoria were offered to 80 customers affected by the COVID-19 pandemic, translating to a portfolio of LKR 25.7 Bn. The Segment also offered advisory on managing cash flows to ensure commercial viability following the conclusion of the moratoria. We placed strategic emphasis on pursuing opportunities in the export-oriented manufacturing and agriculture sectors and continued to enhance our market share in financing renewable energy projects. While
overseas opportunities were limited given the prevalent conditions, the Segment capitalised on the upturn in the Maldivian tourism sector, which recorded a strong recovery post pandemic.
Renewable Energy
The Segment is one of the leading banks in financing renewable energy projects and is estimated to have funded nearly 30% of such private sector ventures in terms of capacity. During the year, we further strengthened our competitive position in this space through driving proactive customer acquisition from the project initiation stage. Given our capabilities, project management skills and established track record in this segment, we are aptly positioned to capitalise on the Government’s thrust towards increasing the country’s reliance on renewable energy. Our unique capabilities in this sector have led to the creation of a unique base of tacit knowledge, which has allowed our employees to be recognised as experts in this field.
Increasing lending towards renewable energy is a key aspect of the Bank’s ESG agenda as power generation through mini-hydro, solar and wind power projects allow the avoidance of harmful emission of gases such as Carbon Dioxide (CO2), Sulphur Dioxide (SO2) and Nitrogen Oxide (NOx) thereby contributing towards addressing the escalating impacts of climate change.
Number of Renewable Energy Projects
13
67
3
10
41
Ground Mounted Solar Power Projects Rooftop Solar Power Projects
Mini Hydro Projects Wind Power Projects Bio Mass Power Projects
LKR Bn
PIF Performance
Loans & Recievables & Investments Deposits
0
20
40
60
80
100
120
102
11 12119
2020 2021
LKR Bn
321 MW contribution to the NationalGrid via Renewable Energy
Growth in CASA
The Segment achieved a 26% growth in its CASA base, leveraging its digital capabilities to drive partnerships across the ecosystem, thereby offering cash management solutions to finance institutions. Through digital and traditional cash collecting methods we facilitated customers of finance and leasing establishments to perform their loan/lease settlements through our branch network, CRM/ATM and the NEOS platform thereby strengthening our CASA base and driving increased customer acquisition.
INSIDE INSIGHT MANAGEMENT DISCUSSION & ANALYSIS PERFORMANCE OF BUSINESS LINES
70 National Development Bank PLC Annual Report 2021

Delivering Voyage 2025 through our Segments
Customer solutions
� Used a customer-centric approach through providing customised solutions to our customers
Business focus
� Proactively pursued opportunities in renewable energy, export-oriented manufacturing, import substitution businesses and mixed development and real estates
Empowered staff
� Adapted processes to allow employees to work from home, including, virtual operational review meetings and other digital engagements
Future outlook of PIF
� Align with the national agenda in increasing reliance on renewable energy and aggressively pursue opportunities in this sector
� Targeted marketing, with focus on leveraging the Bank’s industry relationships to enhance customer acquisition
� Promote cross sell opportunities within the Group among the Segment’s customer base
� Targeting fee-based activities such as
� IPO Underwriting
� Arranger role as lead banker for syndicate facilities
Opportunities
� Government thrust towards renewable energy
� Leverage Group relationships to drive cross sell
� Economy’s focus towards import substitutions and export oriented industries
Risks
� Attraction and retention of skilled employees
� Challenged foreign currency position and its impact on local manufacturers and infrastructure projects
TREASURY
The Treasury Unit is a market maker in the foreign exchange and debt market and plays a vital role in managing the Bank’s market risks such as interest rate and liquidity risk through the Asset Liability Management (ALM) desk. The Unit’s competitive edge stems from its highly skilled and experienced Treasury team and wide array of products which have allowed the Unit to cater to the evolving needs of a dynamic market.
Financial Performance
Operating Environment
� Broad-based implications of the challenged foreign currency position
� Frequent changes in the regulatory landscape, mainly with regards to foreign exchange
� Pandemic led disruptions
Trading Gains on Government Securities
LKR 186 Mn
Net Interest Income from ALM operations
LKR 5.5 Bn
FX Gains
LKR 2.1 Bn
LKR Bn
0
1
2
3
4
5
6
3.6
5.5
1.0
2.1
2.3
0.9
2020 2021
Net Interest Income Forex Income
Other Operating Income
Treasury Performance
Among the many renewable energy generation projects financed by PIF are these ground mounted solar projects in Nachchaduwa, Anuradhapura, contributing 2Mw to the national grid
INSIDE INSIGHT MANAGEMENT DISCUSSION & ANALYSIS PERFORMANCE OF BUSINESS LINES
71National Development Bank PLC Annual Report 2021

Risks
� Challenged foreign currency position and resultant impact on macroeconomic conditions
� Balance of payment crisis and resultant impact on macro economic conditions
� Prolonged volatility and illiquid market conditions
� Changes in market liquidity with tightening monetary policy
Future outlook of Treasury Unit
� Current market conditions are expected to remain in the first half of 2022 with the Rupee remaining under pressure
� Interest rates are expected to increase in the medium as the long term Treasury Bond yield curve edges higher.
Opportunities
� Position to capture post pandemic/ economic growth in fixed income and foreign exchange markets
� Anticipated recovery of foreign exchange inflows to capture new Trade Finance business
� Trading opportunities with normalisation of foreign exchange markets
Operating Environment
The broad-based economic and social implications of COVID-19 since the latter part of 2019, has prompted governments around the world to continue sustained stimulus packages and maintain high government spending during 2021. Similarly, in Sri Lanka, the CBSL continued its accommodative monetary policy stance for most part of 2021 with the aim of reviving pandemic affected businesses and the challenged economy. However, towards the latter part of the third quarter, the CBSL sought to tighten monetary policy, by raising the Statutory Reserve Ratio (SRR) by 2% to 4% and increasing the policy rates by 50 basis points. Resultantly, market interest rates recorded a gradual increase, with the benchmark Treasury Bill yields moving up by approximately 340 basis points across all maturities in 2021; meanwhile, the AWPLR also increased by 235 basis points, by end of 2021.
The Government is faced with the challenge of stemming escalating inflationary pressures, given rising energy, food and other related costs, together with a widening Balance of Payment deficits which started in the late 2019. Despite higher export earnings, the country’s trade deficit has widened, mainly attributed to the global increase in energy prices. With access to capital markets hindered by the downgrade of Sri Lanka’s sovereign rating by global rating agencies and the sharp decline in foreign currency inflows stemming from the fall in tourism earnings and worker remittances, Sri Lanka’s Balance of Payments and its foreign currency reserve position are challenged. As at end December 2021, the country’s reserves amounted to USD 3.14 Bn, down from USD 5.66 Bn the previous year.
Strategy and Performance
ALM Desk: The Unit’s performance was driven mainly by interest income, with revenue increasing by 6% and effective management of balance sheet margins and positions yielding a net interest income of LKR 5.5 Bn (+51% YoY). Conscious efforts were made to reduce the duration and reposition the portfolio to capture future opportunities in the fixed income segment. Meanwhile, with Rupee yields increasing, the Bank’s ability to realise capital gains reduced significantly compared to 2020.
Foreign Exchange (FX) Desk: Despite the overall market decline in foreign trade volumes and foreign currency remittances in 2021, revenue from FX gains increased by 117% YoY. Effective and proactive management of the USD/LKR swap book through capturing market opportunities that prevailed during the year, enabled the Unit to increase its FX revenue to LKR 2.1 Bn during the year.
In line with the Bank’s Voyage 2025 strategy, Treasury in partnership with the Transaction Banking Unit engaged in proactive client acquisition from early 2021. This involved a matrix reporting structure, providing efficient client services across all business segments, through tiered segmentation of the client portfolio.
In line with the Bank’s transformative Digital Banking strategy, the Treasury Unit is also focused on offering its products and services through the NEOS platform, ensuring superior delivery and execution while reaching a wider segment of the market. Treasury is also actively engaged in client advisory services and focused on supporting the Bank’s digital aspirations with real time information updates.
LKR/USD trend in 2021Exchange Rate Movement
170
180
190
200
210
Jan
20
21
Feb
20
21
Mar
20
21
Apr
20
21
May
20
21
Jun
20
21
Jul 2
021
Aug
20
21
Sep
20
21
Oct
20
21
Nov
20
21
Dec
20
21
INSIDE INSIGHT MANAGEMENT DISCUSSION & ANALYSIS PERFORMANCE OF BUSINESS LINES
72 National Development Bank PLC Annual Report 2021

OUR GROUP COMPANIES
Despite the macro-economic uncertainties (which were aggravated by COVID-19) in 2021, the equity market experienced a resurgence during the year reflecting increased interest by companies to go public (due to tax concessions on offer), an uptick in retail participation due to the relatively low interest rate environment and strong earnings recorded by companies in the Transportation sector, Manufacturing and Diversified Financial Sector. The All Share Price Index (ASPI) gained by 80.5% to reach record highs while the S&P SL20 index also increased by 60.5%. Although foreign participation was limited due to the elevated equity risk premia, average daily market turnover increased by 2.6 times to LKR 4.9 Bn during the year. The debt markets were relatively stable in the first half of 2021, before seeing some volatility in the second half due to rate revisions.
NDB Capital Holdings Limited NDB Investment Bank Limited
Pro
file
and
Bus
ines
s A
ctiv
ities
� NDB Capital Holdings Limited (NCAP) is the fund-based investment banking arm of the NDB Group and the parent entity of the Capital Market Cluster
� Directly engages in fund-based activities including investing in listed equities, private equity, fixed income securities, Government bonds, structured debt, acquisition financing and other Balance Sheet based activities
� NDB Investment Bank Limited (NDBIB) is the market leader in the Sri Lankan Investment Banking arena, being crowned as ‘Best Investment Bank in Sri Lanka’ by Euromoney Magazine for the tenth consecutive year
� NDBIB consists of a Corporate Advisory team managing and advising on equity transactions and M&As, and a Debt Capital Markets team which manages and advises on debt transactions
� NDBIB’s competitive edge is underpinned by innovative, market-leading solutions, a highly skilled and diverse team, and deep-rooted stakeholder relationships
Str
ateg
ic P
rior
ities
� NDBIB concluded several landmark transactions (refer alongside)
� NDBWM maintained market leadership reaching highest ever assets under management
� NDBS recorded strong customer acquisition and record-high profitability
� NDBZ achieved two exits from its PE portfolio
� Ongoing investment in NDB Capital Scholarship Trust which aids deserving undergraduates across disciplines
Completed several landmark transactions raising nearly LKR 75.0 Bn in funds (+103% YoY)
1. Managed the IPOs of JAT Holdings PLC (LKR 2.2 Bn), Lanka Credit and Business Finance PLC (LKR 0.5 Bn), Sarvodaya Development Finance PLC (LKR 1.0 Bn) and hSenid Business Solutions PLC (LKR 0.7 Bn), the first Enterprise Software Company to be listed and witnessed record levels of oversubscription
2. Managed the Secondary Public Offering of Sanasa Development Bank PLC (LKR 3.7 Bn) and the NDB Bank Rights Issue and Private Placement (LKR 9.5 Bn)
3. Financial Advisors to; (1) Shareholders of Panasian Power PLC on the divestiture of their stake (2) RIL Property PLC on the divestiture of Foodbuzz (Private) Limited, and (3) Sunshine Energy Limited on the divestiture of Waltrim Energy Limited
4. Managed the Listed Rated Unsecured Senior Redeemable Debenture Issue for LOLC Holdings PLC worth LKR 10.0 Bn
5. Managed a USD Term Loan Facility worth USD 35.0 Mn for National Savings Bank6. Managed BASEL III Compliant Tier II listed debentures worth LKR 14.0 Bn
Per
form
ance
Hig
hlig
hts
� Operating Income - LKR 1,785 Mn (+54%)
� Pre-Tax Profit - LKR 736 Mn (2020: LKR 277 Mn)
� Net Profit of LKR 539 Mn (+1307%)
Opp
ortu
nitie
s/R
isks
Bullish investor sentiments on stock market
Depressed asset prices leading to investment opportunities
Macro-economic uncertainty and volatility
The gradual resumption of economic and capital market activities following the reduced severity of the pandemic
Macro-economic uncertainty due to shortages in foreign currency
Way
For
war
d The buoyancy in the CSE has offered significant potential for growth and we will drive increased penetration targeting domestic customers, through a superior client proposition
With the revived interest among companies to go public, the expected stabilisation of bond rates in the short-term, and the gradual recovery of economic conditions by mid-2022, NDBIB will look to leverage its strong capabilities, market position and partnerships to pursue emerging opportunities
LKR Bn
0
10
20
30
40
50
60
70
80
2019 2020 2021
62 37 75
Funds Raised
INSIDE INSIGHT MANAGEMENT DISCUSSION & ANALYSIS
73National Development Bank PLC Annual Report 2021

NDB Wealth Management Limited NDB Securities (Pvt) Limited
Pro
file
and
Bus
ines
s A
ctiv
ities
� NDB Wealth Management Limited (NDBWM) is the largest private sector wealth management company in Sri Lanka, with LKR 144.9 Bn in funds under management, catering to over 17,460 clients
� The company caters to a range of investor segments through discretionary portfolio services and eight different risk rated mutual funds in both equity and fixed income and holds a market share of over 28% in the Unit Trust industry
� With a time-tested team of investment, operations and marketing professional, NDB Wealth has an established track record of over 29 years in asset management
� NDB Securities (Pvt) Limited (NDBS) is a leading stockbroker with a strong retail and institutional client base
� Its competitive edge is underpinned by superior customer proposition centring on strong relationship management, a state-of- the-art online trading facility, and market-leading research capabilities
� NDBS has contributed towards enhancing the vibrancy of the stock market by introducing both foreign and local institutions and individuals to the Sri Lankan capital market
Str
ateg
ic P
rior
ities
� In line with changes in market conditions, both discretionary and retail clients were actively recommended asset reallocation strategies
� With Central Bank of Sri Lanka tightening monetary policy towards the latter part of the year, NDB Wealth sought to capitalise on increased investor interest in government securities by offering retail investors accessible alternatives to invest in these instruments via mutual funds dedicated to investing in high quality banks and government securities
� Investors hoping to capitalise on the bull run witnessed in the equity market were offered dedicated equity mutual funds
� With increasing macro-economic weakness, focus was maintained on portfolio risk management with attention to credit risk and market risk
� NDBS pursued active client acquisition, which together with improved domestic sentiments led to nearly 100% expansion in the active client base and a significant increase in account openings
� NDBS continued to adopt robust risk management and compliance strategies strengthening the Company’s resilience and long-term sustenance
� In line with NDB’s strategic focus on leveraging Group synergies for incremental value creation, NDBS introduced its clients to NDBIB for M&A transactions, which in turn strengthened NDBS’s non-core revenue streams, while confirming the strength of Group collaborations
Per
form
ance
H
ighl
ight
s
� The Company demonstrated strong resilience during the year to deliver record revenue of LKR 657 Mn (+29%) and Profit After Tax of LKR 2,38.7 Mn (+47%)
� Return on Equity was over 74%
� NDBS recorded the best performance in its history, generating a brokerage income of LKR 593.5 Mn (+193%)
� Maintained market share of 4.2% during the year
Opp
ortu
nitie
s/R
isks
Although the pandemic is expected to subside in 2022, increased macroeconomic vulnerability stemming from a weak external position, rise in global commodity prices, and widening budget deficit will impact interest rates and exchange rates
With expected tightening of monetary policy, increase in interest rates will yield opportunities for investors to capitalise on attractive fixed income returns
NDB Wealth will continue to capitalise on stock market opportunities, albeit cautiously monitoring changes to the macro-economic environment
Successful roll-out of the vaccination programme
Gradual recovery of the tourism sector and its positive externalities to the economy
Macroeconomic uncertainty due to the country’s weak external position and high debt servicing burden
Rising interest rates and its impact on equities
Industry-wide technological developments such as Delivery versus Payment (DVP) and improved risk management provide opportunities for market transformation
Way
For
war
d NDB Wealth will continue to adapt to market dynamics to offer its clients timely and relevant solutions to cater to changing market/ economic conditions via both equity and fixed income products, which in turn is expected to drive asset expansion
Strategic focus will be placed on expanding the high-net-worth client base by leveraging the Bank’s captive clients. We will continue to have increased focus on digital driven expansion. We will continue to seek collaborations with Group companies leveraging our position and unique capabilities as a total financial provider (on the back of the Group’s strengths)
INSIDE INSIGHT MANAGEMENT DISCUSSION & ANALYSIS OUR GROUP COMPANIES
74 National Development Bank PLC Annual Report 2021

NDB Capital Limited (Bangladesh) NDB Zephyr Partners Limited (Mauritius) Development Holdings (Pvt) Limited
Pro
file
and
Bus
ines
s A
ctiv
ities
� NDB Capital Limited (Bangladesh) offers a wide array of investment banking services in Bangladesh including M&A, Advisory, IPO, Portfolio management, Fund raising, Bonds, Preference Shares, Project Finance, Working capital arrangement, among others
� NDB Zephyr Partners Limited (Mauritius) (NDB Zephyr) is the Fund Manager of Emerald Sri Lanka Fund, a pioneering private equity fund dedicated to investing in small and mid-sized businesses seeking expansion capital in Sri Lanka. NDB Zephyr is jointly owned by NDB Capital Holdings Limited (NCAP) (60%) and Zephyr Management, LP (Zephyr) (40%), a New York-based global emerging markets investment firm
� DHPL owns and maintains the DHPL building (also known as NDB-EDB Tower), the 16-storeyed commercial property located at No. 42, Nawam Mawatha, Colombo 02. The building houses Sri Lanka Export Development Board (EDB), several departments of NDB Bank, International Finance Corporation (IFC), Sri Lanka Export Credit Insurance Corporation (SLECIC) and many other reputed global and local corporate and multi-lateral agencies
Str
ateg
ic P
rior
ities
� Pursued opportunities in equity investments and IPO participation
� Engaged in debt transactions with reputed organisations, thereby maintaining market leadership
� New opportunities under corporate advisory, agency and trusteeship and M&A
� The Company aimed to exit at least one investment during the year and by mid-2021, had achieved two exits - Panasian Power PLC and JAT Holdings Limited
� In response to the challenging macroeconomic environment, NDB Zephyr supported its remaining four portfolio companies - Arimac Lanka (Pvt) Limited, Consolidated Business Systems Limited, Idea Group Limited, and Cleanline Linen Management (Pvt) Limited - in expanding export markets, implementing business diversification strategies, improving access to working capital, and rationalising costs
The property continued to leverage its’ strategic location, state-of-the-art facilities and reputation as a premier business space to pursue further opportunities
Per
form
ance
H
ighl
ight
s
� Loss after tax of BDT 16.85 Mn
� Conclusion of several major transactions including,
1. BDT 1,220 Mn preference share issue for BSRM Group
2. BDT 3,250 Mn term loan for Summit Group
� Several large ongoing transactions
� Revenue declined by 36.1% in USD terms reflecting the expiry of the investment period of Emerald Fund and the resultant reduction in management fees
� Loss After Tax of USD 8,518 (-109%)
� Return on Equity -1.2% (2020: 12%)
� Profit After Tax of LKR 397 Mn supported by revaluation gains of LKR 184 Mn
� The continuous increase in value reflects the Management’s ongoing efforts to develop the property
Opp
ortu
nitie
s/R
isks
Bullish capital market index with good regulatory frameworks
Expansionary monetary policy stance to stimulate economic activity
Potential disruptions from the pandemic
Banks’ investment capacity affected by increase in commodity prices and escalation in freight charges
Government thrust towards the SME, export, and domestic manufacturing sectors
Exit opportunities, given positive market sentiments
Leverage on the strategic location and state-of-the-art facilities to attract prospective investors
Ongoing investments in upgrading facilities and amenities offered
Increased competition from emerging large-scale mixed market developments in the city
Way
For
war
d We will seek to strengthen collaborations with industry partners including corporate houses and financial services providers to enhance our brand name. Focus will be placed on arranging and participation in equity transactions
The company will continue to focus on improving the performance and governance in portfolio companies. NDB Zephyr has also commenced exploring exit opportunities for two of its portfolio companies
The entire building façade of ground floor lobby and the auditorium at the third floor are currently under renovation
INSIDE INSIGHT MANAGEMENT DISCUSSION & ANALYSIS OUR GROUP COMPANIES
75National Development Bank PLC Annual Report 2021

DIGITAL CAPITAL
The role of Digital Capital in our Value Creation
How we define Digital Capital
The Group’s digital capital is represented by its technology infrastructure which includes hardware, software applications, hosting networks, enterprise tools and data centres among others.
“Digital and data as transformers” is a vital pillar of the Group’s Voyage 2025 agenda, providing opportunities for driving customer centricity, operational efficiencies, ecosystem partnerships and resource optimisation.
Digital sales and enablement
Shift towards digital platforms83% of the Bank’s total transactions were conducted through digital platforms (2020: 78%)
Digital enablement of customers58% of customers digitally enabled through our multiple platforms
Increased exposure to IT and cyber-security risks
Operational efficiencies and more meaningful work
33.7% Cost to Income Ratio Continued focus on digitisation, automation and enhancing employee productivity
81 new processes automated Automation of mundane and repetitive processes through RPAs and workflow solutions
Employee value additionThrough developing a multi-skilled, digitally savvy and agile work force
Environmental impacts
14% reduction in paper consumption Elimination of paper in selected processes which have been automated
EFFECTS OF OUR ACTIVITIES ON DIGITAL CAPITAL
IT GOVERNANCE
The digital strategy is formulated by the Board approved Digital Transformation Committee that drives the Group’s digital aspirations. In addition, a framework of robust IT policies, clear demarcation of responsibilities through the three lines of defense governance model and a highly skilled IT team ensures that IT risks are identified and managed in a systematic manner. With digital investments increasing in both priority and value, the Bank has placed parallel importance on strengthening its IT governance frameworks.
DIGITAL STRATEGY
Through the Group’s Voyage 2025 strategy, the importance of digital has been elevated from an enabling role to a transformational one and is now a critical pillar in driving the group’s long-term aspirations. NDB’s industry-leading digital capabilities are expected to enhance value creation to both internal and external customers while strengthening the Group’s competitive position, agility and resilience.
Transforming the customer experience
A mobile-first strategy centred on delivering innovative solutions through seamless channels
Transforming our decision-making
Through a data-centric culture
Transforming the way we work
Through making work more meaningful and fulfilling for our employees
Transforming our ecosystem partnerships
Leveraging digital capabilities to drive mutually-beneficial partnerships across our eco system
Our Digital Transformation Strategy
INSIDE INSIGHT MANAGEMENT DISCUSSION & ANALYSIS
76 National Development Bank PLC Annual Report 2021

TRANSFORMING THE CUSTOMER EXPERIENCE
The Group has capitalised on Sri Lanka’s high level of mobile phone penetration through adopting a mobile-first approach towards transforming the customer experience across business verticals. This approach has enabled us to optimise our infrastructure while enabling customers to access the requisite products and services through a channel of their preference.
Business verticals
Platforms
Features and services
Innovations in 2021
Retail Banking
NDB NEOS
Seamless mobile banking app and online banking platform combining banking and payment features
� Self-on boarding � Portfolio management of deposits,
loans, credit cards, leasing, share market transactions
� Scheduled payments � Real-time fund transfers � Mobile payments � Message inbox/outbox � Credit card payments � QR payments � Bill settlements
� Opening fixed deposits online
� CRIB integration
� vKYC-based account opening
� Launch of a fully-fledged Contact Centre management system
Business Banking
NEOSBIZ
First-of-its kind mobile banking platform for SME customers
� On the go authorisation of day-to-day transactions
� Salary payments
� Bulk and individual fund transfers
� Bulk and individual bill payments
� Authorisation matrices and transaction limits
� Launch of NEOSBIZ during the year
Wholesale Banking
Online Banking Platform
� Cash management platform
� Online account view
� Electronic payments
� Online trade services
� Utility bills
� Cheque books
� Development of a Corporate Internet Banking System
Enables customers to avail essential banking services through door step services
Bank2U Digital branchless banking proposition
Transforming the way we work
The Group has leveraged its digital capabilities to improve the meaningfulness of work for employees through automating mundane and monotonous tasks. This in turn has enhanced employee fulfillment, contributing towards the creation of a multi-skilled and dynamic team. Key developments during the year included the following:
� Provision of secure remote working facilities and split operating capabilities to ensure safety of our team while offering uninterrupted services to customers
� Improve device portability through bulk replacement of obsolete PCs with new laptops
� Enablement of digital signatures for both internal and external documents, leveraging the LankaSign platform of LankaClear
� Improvements to the lending system to increase efficiency in the approval process
� Automation of reminder outbound voice calls for the Bank’s current account excess customers with nearly 1,500 calls (which were previously done manually) being fully automated
� Launch of a new credit card system
� Automation of regulatory reporting on Central Integrator Market Monitor
� Enabling Robotic Processing Automation (RPA) to eliminate processing time delays and avoid manual key in errors for repetitive tasks
INSIDE INSIGHT MANAGEMENT DISCUSSION & ANALYSIS DIGITAL CAPITAL
77National Development Bank PLC Annual Report 2021
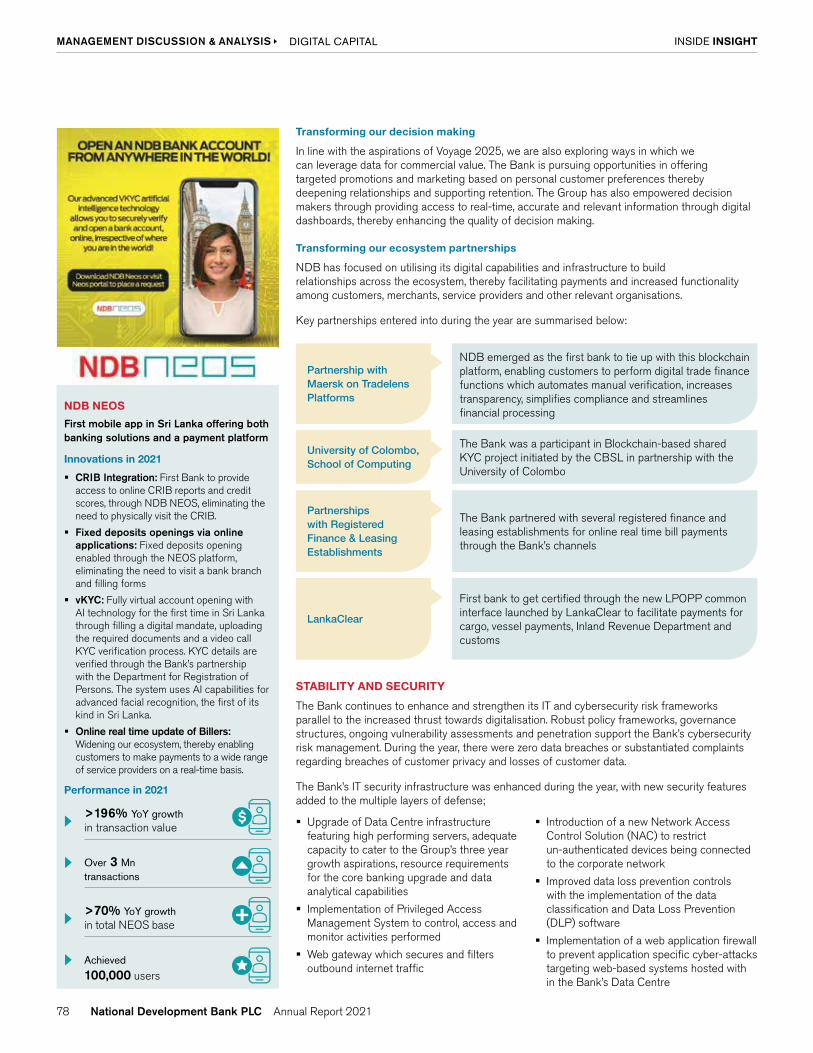
NDB NEOS
First mobile app in Sri Lanka offering both banking solutions and a payment platform
Innovations in 2021
� CRIB Integration: First Bank to provide access to online CRIB reports and credit scores, through NDB NEOS, eliminating the need to physically visit the CRIB.
� Fixed deposits openings via online applications: Fixed deposits opening enabled through the NEOS platform, eliminating the need to visit a bank branch and filling forms
� vKYC: Fully virtual account opening with AI technology for the first time in Sri Lanka through filling a digital mandate, uploading the required documents and a video call KYC verification process. KYC details are verified through the Bank’s partnership with the Department for Registration of Persons. The system uses AI capabilities for advanced facial recognition, the first of its kind in Sri Lanka.
� Online real time update of Billers: Widening our ecosystem, thereby enabling customers to make payments to a wide range of service providers on a real-time basis.
Performance in 2021
>196% YoY growthin transaction value
Over 3 Mn transactions
>70% YoY growthin total NEOS base
Achieved 100,000 users
Transforming our decision making
In line with the aspirations of Voyage 2025, we are also exploring ways in which we can leverage data for commercial value. The Bank is pursuing opportunities in offering targeted promotions and marketing based on personal customer preferences thereby deepening relationships and supporting retention. The Group has also empowered decision makers through providing access to real-time, accurate and relevant information through digital dashboards, thereby enhancing the quality of decision making.
Transforming our ecosystem partnerships
NDB has focused on utilising its digital capabilities and infrastructure to build relationships across the ecosystem, thereby facilitating payments and increased functionality among customers, merchants, service providers and other relevant organisations.
Key partnerships entered into during the year are summarised below:
Partnership with Maersk on Tradelens Platforms
NDB emerged as the first bank to tie up with this blockchain platform, enabling customers to perform digital trade finance functions which automates manual verification, increases transparency, simplifies compliance and streamlines financial processing
Partnerships with Registered Finance & Leasing Establishments
The Bank partnered with several registered finance and leasing establishments for online real time bill payments through the Bank’s channels
LankaClear
First bank to get certified through the new LPOPP common interface launched by LankaClear to facilitate payments for cargo, vessel payments, Inland Revenue Department and customs
University of Colombo, School of Computing
The Bank was a participant in Blockchain-based shared KYC project initiated by the CBSL in partnership with the University of Colombo
STABILITY AND SECURITY
The Bank continues to enhance and strengthen its IT and cybersecurity risk frameworks parallel to the increased thrust towards digitalisation. Robust policy frameworks, governance structures, ongoing vulnerability assessments and penetration support the Bank’s cybersecurity risk management. During the year, there were zero data breaches or substantiated complaints regarding breaches of customer privacy and losses of customer data.
The Bank’s IT security infrastructure was enhanced during the year, with new security features added to the multiple layers of defense;
� Upgrade of Data Centre infrastructure featuring high performing servers, adequate capacity to cater to the Group’s three year growth aspirations, resource requirements for the core banking upgrade and data analytical capabilities
� Implementation of Privileged Access Management System to control, access and monitor activities performed
� Web gateway which secures and filters outbound internet traffic
� Introduction of a new Network Access Control Solution (NAC) to restrict un-authenticated devices being connected to the corporate network
� Improved data loss prevention controls with the implementation of the data classification and Data Loss Prevention (DLP) software
� Implementation of a web application firewall to prevent application specific cyber-attacks targeting web-based systems hosted with in the Bank’s Data Centre
INSIDE INSIGHT MANAGEMENT DISCUSSION & ANALYSIS DIGITAL CAPITAL
78 National Development Bank PLC Annual Report 2021

WAY FORWARD
The key digital investment for 2022 will be the upgrade of the core banking system which is expected to aptly position the Bank for its next phase of growth. With digital platforms anticipated to gain increasing prominence among our delivery channels, we will continue to add value to existing solutions. Together with the core, the Bank has also invested in a digital layer which will enable the introduction of customer-centric user journeys. We will also seek to drive further progress on our Group digitalisation agenda, facilitating a holistic customer experience on both our banking and capital market offerings.
Supporting Sri Lanka’s QR drive
NDB is an active partner of the CBSL’s national QR drive, “Rata Purama QR” which aspires to drive towards a cashless society. The Bank has played a significant role in encouraging customers and merchants to engage in QR-based payments and conducted several engagement initiatives to drive this agenda. This is also aligned to the National Digital Roadmap which was launched by the National Payments Council of Sri Lanka.
DIGITAL CAPITAL
Future requirement
Digital capital is expected to play an increasingly important role in the Group’s growth agenda as it seeks to provide customer-centric solutions penetrate new markets and collaborate with ecosystem partners over the short-to-medium term
Adequacy to meet future requirements
With considerable investments over the past 3 years and the expected completion of the Bank’s core banking upgrade, the Group is well-positioned to achieve its digital aspirations
The Bank’s strategy has centred on increasing penetration across market segments through leveraging digital capabilities, particularly through mobile platforms, offering innovative and customer-centric solutions.
CBSL launched the Rata Puraama QR initiative in October 2020, reflecting its aspirations to move towards a cashless economy. NDB has continued to support these aspirations through actively promoting QR-based payments among to customers, non-customers and merchants.
SUPPORTING THE DRIVE TOWARDS A ‘SMART’ SRI LANKA
Planned capital commitments
Capital commitments for Core Banking upgrade over the next 12 months: LKR 347 Mn
INSIDE INSIGHT MANAGEMENT DISCUSSION & ANALYSIS DIGITAL CAPITAL
79National Development Bank PLC Annual Report 2021

MANUFACTURED CAPITAL
The role of Manufactured Capital in our Value Creation
How we define Manufactured Capital
The Group’s Manufactured Capital is represented by its physical infrastructure including its island-wide network of branches, ATMs, CRMs, plant and equipment and other built assets which are utilised in its value creation process.
The Bank’s branch network plays a vital role in driving business growth through enabling customer reach, enhancing brand visibility and affording an effective platform to deliver products and services.
EFFECTS OF OUR ACTIVITIES ON MANUFACTURED CAPITAL
Facilitating Growth
Supports the Bank’s deposit franchiseGrowth in Bank’s deposit base during the year
Loan expansionGrowth in Bank’s loans and receivables granted
Customer acquisitionSupports the acquisition of customers in relatively underbanked segments/geographies
Customer Connectivity and Reach
Facilitating reachPotential to reach 100% of the population through at least one touch points (on a province basis)
Measure customer satisfaction99% satisfaction rate measured through QR code system
Driving financial inclusion13 branches in economically disadvantaged areas
1. Jaffna District 6 5 1
2. Vavuniya District 1 0 1
3. Kilinochchi - 1 -
6. Kurunegala District 6 7 2
7. Puttalam District 5 3 3
11. Galle District 5 4 2
12. Hambantota District 4 4 2
13. Matara District 2 1 1
14. Kandy District 7 6 3
15. Matale District 2 3 -
16. Nuwara Eliya District 1 1 2
4. Anuradhapura District 3 3 1
5. Polonnaruwa District 2 2 -
8. Colombo District 33 19 37
9. Gampaha District 14 9 10
10. Kalutara District 5 4 4
2
5
5 5
1
51
6
10
9 10
5
32
7
11
11 10
Northern Province
North Western Province
Southern Province Central Province
North Central Province
Western Province
5
52
7
6 15
18
4
5
19
2
3
1
21
1213
11
20
1714
16
229
2310
8
Our Physical Touch Points
INSIDE INSIGHT MANAGEMENT DISCUSSION & ANALYSIS
80 National Development Bank PLC Annual Report 2021

BRANCH OPERATIONS IN 2021
The Bank’s branch network remained fully operational in 2021, ensuring uninterrupted services to customers during lockdown periods. The Bank did not seek geographical expansion during the year, as digital delivery channels took priority given the operating conditions that prevailed. Meanwhile, facilities such as digital onboarding have reduced footfall to the branches, freeing up employee time to focus on more value adding activities. Initiatives rolled out across the branch network during the year were as follows:
� Strengthened performance monitoring and feedback mechanisms to branches, with data on customer complaints, turnaround times and customer service shared monthly with branches
� Enhanced evaluation of service standards at branches
� Launch of a QR-code based customer satisfaction monitoring system across all branches
� Continued investments in ensuring the health and safety of customers and employees through comprehensive precautionary measures in branches
� Ongoing focus on driving process efficiencies and cost optimisation across the branch network
� Expansion of the Islamic Banking and Privilege Banking propositions through the Bank’s branch reach
WAY FORWARD
While the Bank’s digital drive will take precedence in line with the aspirations of Voyage 2025, we will continue to leverage our strategically located network of branches to increase penetration of the Retail and SME segments. Geographical expansion is expected to be rationalised over the next few years, while priority will be placed on strengthening the product and service proposition through digital initiations offered by the branches.
17. Ampara District 3 4 -
18. Batticaloa District 2 2 1
19. Trincomalee District 1 1 -
176Eastern Province
20. Badulla District 3 3 -
21. Monaragala District 1 1 -
044Uva Province
22. Kegalle District 2 2 1
23. Ratnapura District 5 5 3
47Sabaragamuwa Province 7
Vintage
Vintage Branches
< 5 years 155 - 10 years 5010-20 yeas 48Grand Total 113
Branches Offering 365 Days Banking
Vintage Branches
Colombo 3
Kandy 1
Grand Total 4
Number of Branches in Economically Disadvantaged Areas
Vintage Branches
Ampara 3Batticaloa 2Trincomalee 1Jaffna 6Vavuniya 1Grand Total 13
Total Number of Branches
113Automated
Teller Machines
66 Onsite 26 Offsite
Cash Recycle Machines
47 Onsite 27 Offsite
CRMATM
Our Physical Touch Points
INSIDE INSIGHT MANAGEMENT DISCUSSION & ANALYSIS MANUFACTURED CAPITAL
81National Development Bank PLC Annual Report 2021

HUMAN CAPITAL
The role of Human Capital in our Value Creation
How we define Human Capital
The combined skills, expertise and experience of our team of 2,949 high-performing professionals.
Our employees are our most significant differentiator. The connections they make, their innovative thinking and responsiveness to rapidly changing market dynamics have been a key factor in transforming the Group.
EFFECTS OF OUR ACTIVITIES ON HUMAN CAPITAL
A satisfied team
Certified as a Great Place to WorkRanked among Sri Lanka’s top 40 workplaces and the first and only local bank to gain this recognition
Good retention levelsRetention levels remained healthy at around 92.8% during the year.
High level of engagement Maintained engagement through virtual platforms ensuring employees remained motivated and connected
Lean operating model
Increased efficiency and productivity of our team20% increase in revenue generated per employee
13% increase in profit per employee
Gradual reduction in new recruitments As the Group relies increasingly on digitalisation and automation to gain process efficiency
Talent development and career progression
Opportunities for competency-based development LKR 19.36 Mn investment in training and development translating to 70,487 training hours
Upward mobility 290 promotions and 439 lateral moves during the year
220 Job upgrades during the year
17% Overall career progressions during the year
MANAGEMENT APPROACH
The Group’s comprehensive HR policy framework together with the Employee Code of Conduct provides guidance on all people related aspects and sets the tone for professional and ethical conduct of all employees. This is reinforced by compliance to the ISO 9001:2015 standard, which sets out guidelines for HR operations including recruitment, customer related processes, and staff awareness.
Policy Changes in 2021
STRATEGIC FOCUS IN 2021
The Group’s HR strategy for 2021 was aligned to the “Empowered People” pillar of the Voyage 2025 corporate strategy and centered on ensuring that our team was equipped with the requisite competencies, behaviors and mindset to drive the Group’s strategic ambitions.
� Revisions to disciplinary process
� Amendments to policy on personal and family relationships
� Medical benefits related to surgical and hospitalisation cover
� Introduction of “NDB Ombudsman” to report any and all irregularities at the Bank
Key Priorities
� Driving the behavioural changes required to achieve customer centricity
� Competency gap analysis in driving strategy
� Manpower planning to support matrix structures
To Become a Strategic Business Partner
VOYAGE 2025
� Customer solutions
� Business focus
� Organisational realignment
� Digital and data as transformers
� Empowered people
INSIDE INSIGHT MANAGEMENT DISCUSSION & ANALYSIS
82 National Development Bank PLC Annual Report 2021

ADAPTING TO THE ‘NEW NORMAL’
The Bank’s foresight in formulating a pandemic response plan in place prior to the outbreak of the COVID-19, served NDB well in swiftly adapting to conditions of limited mobility following the resurgence of infections in 2021. During the year, we refined the existing plan in view of the prevalent conditions underpinned by the launch of “NDB Cares” - a holistic response plan which enabled the Group to adapt and thrive in the new normal. Key aspects of this initiative are set out below:
� Oversight at the highest level through establishment of The Command Centre (TCC) to monitor all pandemic related developments, ensure adherence to all health guidelines and introduction of remote working and flexi hour/shift-based work arrangements.
� Preventing the spread through implementing an array of precautionary measures (refer to page 47 for full list)
� Ongoing psychological support through continued engagement, access to counselling and support and enhancing digital engagement
� Adapting to the new normal through deploying digital learning solutions and facilitating the shift to remote working.
TEAM NDB
Our talent pool comprises of 2,949 dynamic individuals who are diverse in their age and skill representation. 78.84% of staff are employed on a permanent basis while the remaining are engaged on contract basis for sales and non-critical functions. Nearly 10% of the Bank’s senior management personnel are recruited from the local communities in which operations are located, thereby promoting regional economic empowerment.
Staff alerts on precautionary steps to be taken for the prevention of the spread are sent on a daily basis
Gender Representation
By Contract
Male - 1,780 Female - 1,169
2,325 558 56 10
Permanent Trainee
Contract Intern
By Contract Male Female Total
Permanent 1,394 931 2,325
Contract 362 196 558
Trainee 21 35 56
Intern 3 7 10
1,780 1,169 2,949
By Region/ Type Permanent Contract Trainee Intern Total
Western 1,540 477 43 5 2,065
Southern 134 12 5 1 152
North Western 180 16 5 1 202
North Central 126 14 2 142
Central 151 16 1 168
Uva Sabaragamuwa 89 11 3 103
North East 105 12 117
2,325 558 56 10 2,949
By Designation Male Female Total
Senior Management & above 29 14 43
Executive 554 28 835
Non-Executive 1,197 874 2,071
1,780 1,169 2,949
The total staff base of the Bank is employed on a full-time basis.
INSIDE INSIGHT MANAGEMENT DISCUSSION & ANALYSIS HUMAN CAPITAL
83National Development Bank PLC Annual Report 2021

STAFF MOBILITY IN 2021
Recruitment during the year was thought through and strictly needs driven given the uncertain operating conditions that prevailed. A total of 476 new employees were recruited for a combination of replacements and new positions formulated in line with the areas of business focus such as digitalisation, customer centricity and organisational realignment.
Rewards and Benefits
Guaranteed Pay and Allowances
� Fuel/traveling allowance � Leave pay / holiday allowance � Job specific allowance � Accommodation assistance � Weekend/holiday banking allowance
Variable Pay
� Performance bonus � Sales incentives and overtime � Employee share ownership plans
Reimbursable Expenses
� Professional and club subscriptions � Education assistance for MBAs
Other Prerequisites
� Holiday bungalow/annual trip � Medical insurance scheme � Parental leave � Toastmasters club � Recreational club
Subsidised Loan Schemes
� Housing, vehicle, sundry loans
Retirement Benefits
� EPF/ETF, Gratuity (higher contribution to EPF than what is stipulated by statute)
Of the above, holiday allowances, accommodation assistance, weekday/holiday banking allowance, performance bonus, subscriptions and educational assistance are not provided to contract employees whilst different schemes/conditions are applicable for medical insurance.
REWARDS AND RECOGNITION
The Group has nurtured a performance driven culture by maintaining transparent, unbiased and consistent reward schemes. The reward schemes are a combination of guaranteed pay, variable pay and statutory benefits along with other attractive rewards.
Despite continued pandemic led disruptions and challenging external conditions, all employees received full remuneration along with annual increments and bonuses for eligible members. The Bank even took initiatives to provide full remuneration covering the period of deferment to employees whose contracts were not active due to lockdowns.
Performance Management and Succession Planning
The Bank strives to align organisational goals with employee competencies and their personal aspirations. Performance appraisals are carried out annually to reward and to identify training needs.
A total of 439 staff lateral moves took place during the year with the aim of providing new opportunities for employees. Further, 290 employees were promoted during the year maintaining Group’s stance towards facilitating career progression.
Percentage of staff receiving regular performance appraisals based on eligibility criteria
Designation Female Male
Senior Management 13 24
Management 54 123
Executive 197 379
Non-Executive 590 724
Specialised sales force 4 24
ENGAGEMENT
With a significant number of employees working remotely throughout the year, the Bank strengthened engagement via virtual platforms to ensure employees remained motivated and connected. Illustrated below are such initiatives taken to enhance engagement and employee morale.
Recruitement and Turnover - by Region
407(85%)
9(2%) 0(0%)
1(0%)
3(1%)
14(3%)
18(4%) 6(4%)
127(75%)
8(5%)
5(3%)3(2%)
2(1%)13(8%)
2(1%)
2(1%)
Turnover
Western provinceCentral provinceSouthern provinceNorthern provinceEastern province
North Central provinceNorth Western provinceSabaragamuwa provinceUva province
14(3%)
10(2%)
Recruitments
New Recruites
Turnover
New Recruites and Turnover - by Gender
94(56%)
299(63%) 177(37%)
74(44%)
Male Female
New Recruites and Turnover - by Age
18 - 30 30 -55 Above 55
New Recruites
Turnover
85
426(90%)
44(9%)
6 (1%)
85(51%)
83(49%)
0(0%)
‘I win my Goals’ career guidance forum for all female staff
Virtual Avurudu Festival
Awareness Programmes � Balance of Life � Cultivating a positive work environment � A stress-free life
INSIDE INSIGHT MANAGEMENT DISCUSSION & ANALYSIS HUMAN CAPITAL
84 National Development Bank PLC Annual Report 2021

Certified as a Great Place To Work
The Bank marked a major milestone during the year, obtaining the Great Place to Work® certification, a global standard which assesses employee perception and organisational culture. This recognition is awarded based on an independent survey and culture audit conducted on HR practices. This certification is testament to the Bank’s efforts to create a comprehensive value proposition to its employees.
NDB Bank is the first and only local bank in Sri Lanka to be named as a “Great Place to Work”. It was also placed among Sri Lanka’s best 40 workplaces.
The Bank also maintains an open-door culture encouraging all employees to come forward with their grievances, concerns and suggestions. During the year “Talk to HR” feature was launched on the HCM mobile app to encourage better connectivity to the HR team. NDB is committed to the highest standards of integrity, excellence and accountability. To help uphold these standards, NDB launched an Ombudsman policy. All employees are given adequate notice of any significant operational changes depending on the circumstances. The Bank does not have any collective agreements in place and during the year under review there were no material issues relating to employees and industrial relations which warrant disclosure.
LEARNING AND DEVELOPMENT
The development proposition for the year centred on a competency-based learning approach with the aim of upskilling/reskilling employees to adapt to the new normal business conditions while driving the aspirations of Voyage 2025. Role-based competency mapping was carried out for all critical business functions, enabling the identification of the required skills and formulation of suitable training programmes.
Competency Approach to Development
� 3 competency types identified - Strategic, Functional/Technical and Leadership
� 28 competencies identified for frontline staff
� 190 job essential skills/behavioural factors identified
� 350 sales staff, 70 credit staff assessed
� 360 staff gone through assessment development centres
� 60 internal assessors trained
COMPETENCY MAPPING
COMPETENCY BASED DEVELOPMENT
DESIGN AND DEFINE COMPETENCIES
ASSESSMENT OF COMPETENCIES
1
4
2
3
Mapping of,
� 30% of the frontline staff
� 10 frontline roles
� 1,200 staff
� Deployed Sales Competency Development programme
� Launch of Credit Level 1 and 2 Competency Building programme
� Launch of Compliance Level 1 Competency Development programme
Competency Development Programmes carried out during the year,
Programme Description Target Employees
Compliance Competency Mapping
Implementation of a compliance building framework by the Learning Academy in collaboration with the Compliance Department
20 compliance master trainers and 114 departmental trainers trained during the year
Leadership Competency Building
6 different leadership competencies together with 30 behavioural factors delivered through module-based learning
All Managers
Sales Profiling and Competency Building
Strengthening of the structured sales development programme by introducing analytical tools to identify high performing behaviours. The process was restructured to align with the identified competencies of the core sales staff.
Sales staff
Credit Coaching and Competency Building
Corporate Relationship Managers’ competencies were mapped to align with the Bank’s strategic objectives and expected industry standards.
Senior and junior relationship managers
People Analytics, Job Profiling and Psychometric Assessments
Introduction of globally-recognised psychometric instruments to use in job analysis and people profiling
Middle Management
INSIDE INSIGHT MANAGEMENT DISCUSSION & ANALYSIS HUMAN CAPITAL
85National Development Bank PLC Annual Report 2021

Training Details 2021 2020
Total investment in training - LKR Mn 19.36 18.67
Total number of training hours 70,487 63,518
Number of employees received training 2,486 2,252
NDB V-Learning and Blended Learning
V-learn Studio is a digital learning platform that was initiated in 2020 and further developed in 2021 to facilitate increased collaboration during learning. With the easing of restrictions in 2021, the Bank adopted a blended approach to learning and skill development where programmes were conducted in simulation workshops whilst 60% of learning content was delivered via V-learning. Further, employees were given the opportunity to learn at their own pace through options such as session playback, bite size learning and module-based programmes. The Bank also grants duty leave for staff members to participate in virtual training programmes.
Health and Safety
Health and safety of staff continued to be a top HR priority with the emergence of highly transmissible variants of COVID-19 during the year. In addition to strict adherence to guidelines issued by the authorities, the following initiatives were taken by the Bank to ensure the safety of staff with the minimal risk of infection.
� Implementation of work rosters, split locations, work from home arrangements and flexi hours to minimise the risk of contagion.
� Special transportation services � Bank sponsored RAT and PCR testing for
employees � Reservation of hospital beds (based on
availability) for staff members who require medical attention
� Comprehensive sanitisation of office premises
� Encouraging pre and post maternity mothers to work from home
The Bank also took action to ensure the psychological well being of staff members through initiatives such as,
� Launch of “Talk to HR” feature on the HCM mobile app to provide prompt connectivity with the HR team
� Providing counselling and support to team members under self quarantine
� Virtual staff engagement and welfare events conducted to maintain morale
Distribution of Learning Hours based on the type of programme
6%
5%
2%
4%
9%
Soft Skills Compliance TradeStrategic DevelopmentService Structured DevelopmentSales
RegulatoryCreditBranch Operations Products Other Technical SkillsInductions & OrientationsLeadership & Coaching
7%
3%
15%
9%
11%
7%
6%
5%
11%
0
10
20
30
40
Senior Management and above Executive staff Non-Executive staff
Hours
26.6
8
34.
11
19.7
3
Average Traning Hours per Category
0
5
10
15
20
25
Male Female
24.0
0
23.9
6
Average Traning Hours per GenderHours
Learning Platforms Used
26%
9%
E-learning Physical Virtual
65%
76%
13%11%
Number of Staff
Number Hours
INSIDE INSIGHT MANAGEMENT DISCUSSION & ANALYSIS HUMAN CAPITAL
86 National Development Bank PLC Annual Report 2021

Future requirement
Given the Group’s increased focus on digitalisation and productivity gains in recent years, recruitments are likely to be limited and focused on specific skills and competencies aligned with the Voyage 2025 Strategy.
In doing so, staff capabilities will be enhanced to deliver on the key strategic deliverables centred on customer-centricity. Staff agility will also be enhanced, in future-readying them for evolving external conditions. The amalgam of this will power the Bank’s human capital in propelling NDB towards its aspirations set under Voyage 2025.
.
Diversity and Inclusion
Creating a diverse and inclusive culture is a key long-term priority for the Group and is reflected in our policy framework, culture and values. The Bank continues its commitment to encourage women to achieve their career aspirations while maintaining a healthy work life balance.
As an equal opportunity employer, the Bank adopts a gender inclusive recruitment policy. We also do not engage in any form of gender- based discrimination when determining reward structures, providing opportunities for training or offering promotions. The ratio of basic salary between women and men was 1:1. This year, we have improved our diversity reporting through disclosing gender pay gaps, as recommended by the Gender Parity Reporting Framework of CA Sri Lanka.
The Bank was re-certified under the EDGE© certification (Economic Dividends for Gender Equality) for work place gender equality. NDB was the first corporate in Sri Lanka to obtain this certification and remains committed to its action plan in furthering the Bank’s efforts on these lines.
Diversity and NDB
Policy Framework
� Equal Opportunity Recruitment Policy
� Equal Opportunity Promotion Policy
� No discrimination in remuneration between genders
� Strict of framework covering all forms harassment at workplace
Global Standards
� The first organisation to obtain the prestigious EDGE certification. This certification was renewed during the year
Partnerships
� Women in Management
HR Practices
� Flexi hours and work from home arrangements
� ‘Dignity at Work’ mailbox
Recognition
� Honourable Mention at CIMA Sri Lanka’s Women Friendly Workplace Awards
WAY FORWARD
From a human capital perspective, the Group’s key priority will be enabling the Voyage 2025 strategy through competency based talent acquisition, learning and development and alignment of compensation schemes with the aspirations of the corporate strategy. Over the short term we hope to conduct a salary survey, ensuring that compensation schemes are aligned to market dynamics. Other priorities include revamping talent management plans, succession planning and fulfilling the commitments of the EDGE certification.
With the Minimum Retirement Age of Workers Bill passed in Parliament in 2021, the Bank too has revised the minimum retirement age of NDB staff as 60 years of age. This move is expected to widen inter-generational diversity within the Bank, while retaining valuable intellectual capital and insights of our senior employees for a longer period of time.
Return to work after parental leave
Service indicator Male Female
Employees entitled to parental leave
59 77
Employees on parental leave
59 77
Employees who returned after parental leave
59 77
Employees still in employment 12 months after returning on parental leave
54 46
HUMAN CAPITAL
Gender Representation - by Grade
Male Female67%71%65%58%
33%29%35%42%
Executive
Non-executive
Seniormanagement
Management
Male Female
%
Lower
Middle
Upper
Proportion of Males and Females in each pay quartile
0.0 0.5 1.0 1.5 2.0 2.5
1.00 0.92
1.00 0.99
1.00 1.05
Raw mean gender pay gap
10%
Raw median gender pay gap
4%
The Group is an equal opportunity employer and practices a strict policy of zero-gender base discrimination when determining remuneration. The disclosures on gender pay gaps have been made in line with the best practice recommendations of the Gender Parity Reporting Framework of CA Sri Lanka.
INSIDE INSIGHT MANAGEMENT DISCUSSION & ANALYSIS HUMAN CAPITAL
87National Development Bank PLC Annual Report 2021

INTELLECTUAL CAPITAL
The role of Intellectual Capital in our Value Creation
How we define Intellectual Capital
Our Intellectual Capital refers to the intrinsic capabilities, knowledge and ways of working that define who we are and the way we do business.
The Group’s Intellectual Capital is a key source of competitive edge, and underpins our capacity for innovation, responsiveness and our commercial and social viability over the long-term.
EFFECTS OF OUR ACTIVITIES ON INTELLECTUAL CAPITAL
A Stronger brand
Consistent improvements in brand value13% increase in brand value and selected among the country’s top 20 brands
Increased visibility on social media platforms49% increase in impressions
Successful launch of new manifesto“The Future is Banking on Us” positioning the Bank to capture opportunities arising from customers’
Organisational culture and tacit knowledge
Data-driven decision makingThrough empowering decision makers with access to high-quality, real time information
Efficient and lean operating modelSteady improvement in Cost-to-Income ratio to reach 33.7%
OUR BRAND
NDB’s journey in transforming from a conservative, development financing institution to one of the fastest growing financial conglomerates in the country, together with the Bank’s customer-centric approach has allowed NDB to increase its visibility and reinforce its brand value. Despite the challenging conditions of the year, the Bank’s ability to proactively respond to emerging dynamics enabled it to strengthen its brand position during the year, as attested by the Bank emerging as the highest gainer within the Top 20 of Sri Lanka’s Most Valuable Brands, published by Brand Finance.
Key brand building initiatives during the year included:
� Launch of the Bank’s new brand manifesto “The Future is Banking On Us” with the ambition of becoming the most digitalised bank in the country, through reimagining banking
� Maintained an average rank of third position among Banking and Finance industry counterparts in print media
� Sri Lanka Vanithabhimana Awards (refer to page 94)
� Launch of several new digital propositions (refer to page 76)
� Sponsorships for several events such as Splash KCC, Cloud 9 Music Festival at Port City, Cyber Security Summit 2021
� Multiple campaigns including Family Banking Campaign, NEOS campaigns, Zee savings account launch campaign on electronic, digital and print media
� Continuation of ‘NDB Jayagamu Sri Lanka’ featuring several awareness programs, webinars and training programs
INSIDE INSIGHT MANAGEMENT DISCUSSION & ANALYSIS
88 National Development Bank PLC Annual Report 2021

#16Sri Lanka’s most valuable brands by Brand Finance Sri Lanka 100
121 MnImpressions
470,293Followers on Facebook
7.6 MnReach
7,352Followers on Instagram
1.46 MnSocial media engagement
43,152Followers on LinkedIn
525,032Fans on social media
2,135Followers on Twitter
Highest gainer in the Rankings
Brand Value of LKR 10,287 Mn(LKR 8,913 Mn in 2020)Brand Finance Sri Lanka 100
Top 10 Most AdmiredCompanies in Sri LankaAwards by ICCSL and CIMA
Brand Visibility
Social media footprint
DATA-DRIVEN DECISION MAKING
As the Bank increases emphasis on data analytics, it has gradually nurtured a culture of data-driven decision making. A dedicated Data Analytics team is responsible for deriving insights to business operations through data mining, data analysis and predictive analysis and decision makers are empowered through access to high-quality, real-time data insights, thereby enriching the effectiveness of their decisions.
CROSS FUNCTIONAL CAPABILITIES
The Bank has combined its diverse capabilities and organisation-wide tacit knowledge through the implementation of several cross-functional committees with oversight responsibility on specific functions. This has served as an effective tool in pooling and sharing diverse views and knowledge. The Bank also maintains a strong learning-culture and encouraging mentoring and knowledge sharing.
ENTRENCHING INNOVATION
The COVID-19 pandemic has focused attention on the critical importance of innovation in differentiating our offering and remaining competitive. Aligned to the Voyage 2025 strategy, the Bank’s innovation is primarily being driven through its digital offerings. We encourage experimentation, agility and flexibility that promote innovation-led thinking, with employees empowered to drive meaningful change within our given risk appetite.
WAY FORWARD
Our brand building initiatives for 2022 and beyond will be aligned to Voyage 2025 and attributes of customer centricity, digital journeys and holistic solutions. We will also seek to further enhance the technology and data capabilities of our team, which in turn will contribute towards nurturing a data and innovation-driven organisational culture.
MANCO supports the Executive Leadership in implementing strategic initiatives of the Bank. The Committee is chaired by the Chief Operating Officer and is
responsible for developing second tier staff management and leadership skills
Management Committee
IT Steering Committee
Provides guidance and direction on IT strategy to ensure business objectives are
met.
Asset and Liability Management Committee
Defining strategies for Balance Sheet planning in optimising risk return dynamics.
Procurement Committee
Facilitates the procurement of all goods and services obtained by the
Bank to ensure fairness, transparency and consistency are maintained when
assessing suppliers, whilst an acceptable equilibrium is maintained in the costs
incurred and quality.
INSIDE INSIGHT MANAGEMENT DISCUSSION & ANALYSIS INTELLECTUAL CAPITAL
89National Development Bank PLC Annual Report 2021


SOCIAL AND RELATIONSHIP CAPITAL
The role of Social & Relationship Capital in our Value Creation
How we define Social & Relationship Capital
Our Social & Relationship Capital represents the relationships we have nurtured across our value chain, communities and with other stakeholders, which provides us our social license to operate.
Meaningful and informed engagement that creates mutual value for the Group and its stakeholders, is critical in ensuring the long-term sustainability of our operations while supporting the achievement of our social aspirations.
Strengthen customer relationships
Enhancing the customer experience99% customer satisfaction score measured through branch QR system
Access to funding for SME exporters, entrepreneurs and womenThrough holistic value propositions offered through NDB Jayagamu Sri Lanka and NDB Araliya
Customer convenience and accessibilityThrough seamless and secure delivery channels and increased digital enablement of customers
Building resilient communities
Empowering womenThrough recognising and rewarding deserving women across the island
Support national effort to combat COVID-19 LKR 6.17 Mn investment in COVID-19 support to the government, health sector and affected communities
Leveraging ecosystem partnerships
Provide better solutions to customersMarket access, capacity building, IT solutions support and networking through our partnerships
Industry collaborations Active contribution through industry forums in creating a sustainable and conducive industry environment
EFFECTS OF OUR ACTIVITIES ON SOCIAL & RELATIONSHIP CAPITAL
CUSTOMER RELATIONSHIPS
The Bank caters to individuals, SMEs and corporate customers through its island-wide network of branches and seamless digital channels. In recent years, the Bank has sought to increase penetration in untapped geographical regions and customer segments through leveraging its digital capabilities. Our approach to customer value creation during the year centred on addressing their specific concerns (set out alongside) given pandemic-related disruptions that continued. During the year, there were no instances of non-compliance on product and service information and labeling or marketing communications.
Customer experience
Given the unprecedented shift to digital transactions, focus was placed on enhancing the customer experience on digital channels. In addition to the innovations conducted on the NDB NEOS platform (refer to page 76), we focused on improving the service standards of the Bank’s 24x7 Customer Service Centre. Key initiatives rolled out during the year include the following:
Customer concerns in 2021
� Access to uninterrupted banking in the lockdown periods
� Faster response times
� Convenience and safety
� Empathy of customer service staff
� Debt relief
Dig
ital
chan
nels
� Appointment of call quality officer to focus and improve quality of calls received to the Contact Centre
� Internal telephone etiquette standards monitored via call surveys
� Implemented an e-learning module for all employees to ensure service leaders are certified.
� Initiated all day Western Union remittance though Contact Centre
� Enhanced customer interactions on social media
Phy
sica
l ch
anne
ls � Launch off interactive e-learning module to refresh and further improve SOPs
� Year-round SOP refresher trainings
How we strengthened monitoring mechanisms
Implementation of a QR-code based platform across the branch network to measure customer satisfaction.
INSIDE INSIGHT MANAGEMENT DISCUSSION & ANALYSIS
92 National Development Bank PLC Annual Report 2021

Service indicator Goals
Service levels of the incoming calls To maintain 80% or more
Abandon Rate To maintain below 5%
Call quality effectiveness To maintain at 80%
Online Banking (NBO) and contact@ndb mail box response time (TAT)
80% or more to be responded within 3 working days
Requests turnaround time 80% to be resolved within 3 working days
Concerns turnaround time 80% to be resolved within 8 working days
% of calls answered within 3 rings (Average YTD) 80%
% Good and Very Good responses received 80%
Measuring our Service levelsAs our Contact Centre is one of the prime points of connectivity to our customers, we strive to maintain the following goals in Contact Centre service levels.
OUR PRODUCT OFFERING
The Bank offers a complete range of investment, lending and transactional banking solutions across customer segments, as listed in the table below:
Inve
stm
ent
pro
duc
tsLe
ndin
g p
rod
ucts
Cus
tom
er
valu
e p
rop
osi
tions
Oth
er
� Savings accounts (women’s, minor)
� Certificate of deposit
� Current accounts
� Fixed deposits
� Foreign currency deposits
� Personal
� Housing
� Education
� Leasing
� NDB Good Life Credit Card
� Salary advances
� Solar
� Pawning
� Vismitha loans
� NDB Debit cards
� NDB Travel Pal
� Privilege banking
� Safe deposit lockers
� Remittances
� Bancassurance
� NDB Araliya for the women’s market segment � NDB Aachara for senior citizens � NDB Jayagamu Sri Lanka for exporters, innovators and SMEs
� Current accounts
� Foreign currency deposits
� Fixed deposits
� Savings and call deposits
� Term loans
� Working capital finance
� Trade services
� Leasing
� Cash management
� Trade card system - GT Nexus
� Distributor/Supplier financing
� Digital financial solutions
� Savings
� Time deposits
� Current accounts
� Foreign currency deposits
� CAPEX funding
� Leasing
� Trade Services
� Cash management
� Revolving and structured working capital funding
� Channel finance for distributors
� Industry specific working capital solutions
� Credit cards
� Debit cards
� Bancassurance
� Savings
� Fixed deposits
� Foreign currency deposits
� Term loans
� Islamic banking for long-term financing
� Financing or leveraged buy outs
� Lease facilities
� Securitisation
� Trade services
� Investment in listed securities
� Services on debt syndications such as lead arranger function, facility agent function and escrow agent function
� Custodian services � Trustee services
Retail Wholesale Business Banking PIFOUR PRODUCT MAP
Product innovations/ value additions during the year are summarised below:
� New features added to the NDB NEOS app including CRIB integration and vKYC (refer to page 76)
� Launch of NEOSBIZ catering to the SME segment (refer to page 65)
� Launch of NDB Zee digital youth account featuring digital onboarding, debit card capabilities, rewards for high performers in GCE Advanced Level, special card offers and advisory services on higher education, business start-ups and career guidance
INSIDE INSIGHT MANAGEMENT DISCUSSION & ANALYSIS SOCIAL AND RELATIONSHIP CAPITAL
93National Development Bank PLC Annual Report 2021

Advisory and capacity building
� Access to Araliya knowledge sharing forums
� Araliya mentoring and networking sessions
� Third-party advisory services (such as business registration, book keeping, etc.)
� Knowledge-sharing sessions on business aspects and work-life balance
Creating Opportunities
NDB Jayagamu Sri Lanka was launched in 2020 and offers a holistic value proposition to the country’s SME exporters, entrepreneurs and innovators through a unique platform. We continued to drive penetration through this offering and the progress made is summarised below:
Value through ecosystem partnerships
Partnerships with EDB, Chamber of Commerce, Daraz, Maersk, CodeVus, ICTA, ThinkCube Solutions, Cord 360, etc. to provide access to markets, networking opportunities and a range of other services
Financial Support
� Loan schemes with approval granted in 7 days including,
� Working capital facilities
� Pre and post export finance
� Trade related facilities � Capital expenditure facilities
� 25% waiver on all bank charges � Buyer ratings from internationally
recognised organisations � Free first shipment with Cargo
Insurance Cover up to USD 30,000 (with conditions applied)
Networking and awareness
� Awareness program for members of Shilpa Sabawa and Women’s International Foundation
� Training programmes for Entrepreneur Centre at University of Colombo
� Contributor at SME forums, road shows and events conducted by ICTA and exporter forums
Capacity building and support
� Webinars on “Book-keeping, Project proposals writing and overcome challenger”, “Business Digitalisation” and “Mental Health and best practices of banking”
� Assistance for business registration, patent registration, advisory services on accounting and legal matters
� ERP and IT support
Powering the Sri Lankan women through “Banking on Women”
NDB’s multi-pronged female empowerment agenda aims to create a more conducive work environment for its female employees and drive socio-economic progress among its female customers and broader communities. Through its multi-faceted ‘Banking on Women’ platform, NDB seeks to equip female entrepreneurs with the skills required to expand their businesses, thereby ensuring continued commercial sustainability.
Key elements of our proposition to women are as follows: NDB Sri Lanka Vanithabhimana
First of its kind programme to recognise the contribution of women across different spheres, representing all segments of society.
� First edition (2020/2021) recognising women across all nine provinces across eight categories
� National level winners crowned at grand finale on International Women’s Day 2021
� Second edition (2021/2022) launched in October 2021
� Additional category of Professional/Career women introduced covering 10 sectors
� Women’s day festival in each province
NDB Araliya
Banking facilities catering specially to female entrepreneurs.
� Araliya Business Loan
� Araliya Credit/Debit cards
� Working capital facilities
� Preferential interest rates
� Insurance schemes
� Non-financial advisory services
Leveraging partnerships
� NDB partnered with Daraz to provide a dedicated landing page for its female business owners, thereby providing better visibility and greater selling potential.
� NDB is also a member of the Financial Alliance for Women (FAW), a leading global members’ network of financial organisations dedicated to championing the female economy that remains untapped.
Winners - Grand Finale of Sri Lanka Vanithabhimana 2020/2021 held on International Women’s Day 2021
INSIDE INSIGHT MANAGEMENT DISCUSSION & ANALYSIS SOCIAL AND RELATIONSHIP CAPITAL
94 National Development Bank PLC Annual Report 2021

“I used to do textile designing as a hobby and always had the dream of pursuing it as a business venture, by experimenting in new products and developing new techniques. In 2015, I started ‘Ceylon Natural Batik’ at my residence in Galewela, hand-making garments such as sarees, sarongs, shirts and baby items from natural colour fabrics extracted from trees and flowers. Demand for my products increased gradually and I employee 10 women including disabled persons and widows. I also purchased raw materials from around 35 suppliers in the area, providing them a continued source of income.
In 2020, I participated in the Sri Lanka Vanithabhimana programme organised by NDB and Sirasa News 1st and won the All-Island First Place in the Small Entrepreneur category. In addition to a cash prize of LKR 250,000 and other valuable gifts, this program offered me a great platform to access a wider audience of buyers, including international markets. I started exporting products to New Zealand, Italy, UK, USA, Dubai and France on personal orders and obtained facilities under NDB Jayagamu Sri Lanka to expand my exports. I am amazed at how much my potential expanded under the unique initiative of Sri Lanka Vanithabhimana. I am so grateful to NDB for convincing me that I can do better and go beyond!
I have always been interested in experimenting with different recipes and ingredients and started my business in Dambadeniya with the aim of promoting healthy, natural, local food. My restaurant in Dambadeniya named, ‘Thun Hele Rasa Hala’ offers food that is prepared using chemical-free and locally procured ingredients and provides wholesome food to health conscious customers. I attribute a big part of my success to NDB, which had the confidence in me to support my business expansion through several loan facilities. I have expanded my venture under their support and guidance, and currently employ up to 20 persons from my locality. In 2020, I participated in the Sri Lanka Vanithabhimana programme, winning the first place in the Wayamba Province. This programme provided me access to new knowledge in expanding my business and has given increased visibility to my business. I am thankful to, and applaud the efforts of NDB, in supporting women entrepreneurs like me. Their support truly makes a difference!
I commenced my business manufacturing incense sticks nearly 15 years ago and gradually expanded my product range to include slippers and herbal preparations. I have provided employment to 7 persons from my community. NDB has been a key strength behind my success and supported me right from the very beginning through facilities for working capital and expansion. I participated in Sri Lanka Vanithabhimana programme in 2020 and was awarded Merit at the provincial competition in the Entrepreneur - Small category for a remarkable performance. Through this programme, I obtained access to capacity building programmes and workshops, which helped me immensely in developing my business further. I am thankful to the kind service, guidance and support the bank staff extends to me. They are an integral part of my business and its success. I hope many more aspiring and courageous women will thrive under the guidance of NDB, and capitalise on the unique opportunities that their initiative - Sri Lanka Vanithabhimana offers.
Ms. Thushari GeethikaDambadeniya
Ms. Iresha DilaniHingurakgoda
Ms. Shiromi PathiranaGalewela
INSIDE INSIGHT MANAGEMENT DISCUSSION & ANALYSIS SOCIAL AND RELATIONSHIP CAPITAL
FACETS OF SUCCESS
Through NDB Vanithaabhimana, we identified and recognised inspiring women from across the country, providing a unique platform for showcasing their success and increasing visibility. A few of these success stories are set out below:
95National Development Bank PLC Annual Report 2021

BUSINESS PARTNERS
Our business partners comprise over 400 suppliers and correspondent banks who support our value creation, widen our access and ensure the smooth continuity of operations. The Bank procures a range of IT, office equipment and consumables from a network of suppliers with the bulk of these being local corporates and SMEs. A Sustainable Procurement and Supplier Policy sets out the economic, social and environmental criteria to be considered when screening suppliers, thereby, enabling NDB to propagate its sustainability agenda across the supply chain.
Membership in Associations
� Institute of Bankers of Sri Lanka � Sri Lanka FOREX Association � The Association of Professional
Bankers - Sri Lanka (APB) � Payment Cards Industry Association
of Sri Lanka (PCIASL) � Association of Banking Sector Risk
Professionals � Biodiversity Sri Lanka
Progress made in the Bank’s CS agenda during 2021 is summarised below. Given the conditions that prevailed during the year, emphasis was placed on supporting communities impacted by the pandemic and contributing towards Sri Lanka’s national effort to combat the spread of COVID-19.
COMMUNITIES
NDB’s Corporate Sustainability initiatives are aligned to the Bank’s sustainability vision of ‘creating sustainable shared value by delivering economic, environmental, and social benefits’ The chosen projects are of national priority and delivers stakeholder expectations while meeting Bank’s own social, environmental and economic ambitions.
WAY FORWARD
The Group’s approach towards further enriching its customer relationships will be aligned to the overarching goal of delivering customer centricity, in line with Voyage 2025 aspirations. Focus will be placed on implementing customer satisfaction mechanisms across key touch points, enhancing social media engagement and further enhancing SOPs, call quality standards and call centre infrastructure.
� Donation of 35 adjustable Beds to COVID-19 high dependency units of hospitals, in partnership with World Vision Lanka
� Donation of an Optiflow Nasal Oxygen Delivering System to National Institute of Infectious Diseases (IDH)
� Donation of 30 Pulse Oximeters (Finger Type) to MOH
� Donation of Medicine & Filing Cabinets and other miscellaneous items to Madurankuliya COVID-19 Intermediate Treatment Centre
� Donation of an intensive care unit (ICU) bed to National Hospital Kandy
NDB Cares for the Community
� Donation of a washing machine to the COVID-19 Maternity Ward at the District General Hospital Nuwaraeliya
� Donation of 1,000 Dry Ration Packs to over 1,000 disadvantaged families in Kundasale who were affected by the COVID-19 pandemic
CORPORATE SUSTAINABILITY GOVERNANCE
The Bank’s Corporate Sustainability (CS) Committee provides oversight on the Bank’s Corporate Sustainability initiatives. In nurturing a community-conscious culture, the Bank has in recent years sought to widen representation by inviting enthusiastic and passionate employees to contribute their efforts. Initiatives are selected based on community needs, resource availability and accessibility to relevant expertise. The objectives of the Bank’s CS agenda are as follows,
Supporting national
sustainable development
1
Protection and conservation of the
environment
2
Employee volunteerism
3
Special projects carried out to serve specific community
needs
4
In addition to the above, the Bank continued its environmental and education pillars. Please refer to page 97 for further information.
INSIDE INSIGHT MANAGEMENT DISCUSSION & ANALYSIS SOCIAL AND RELATIONSHIP CAPITAL
96 National Development Bank PLC Annual Report 2021
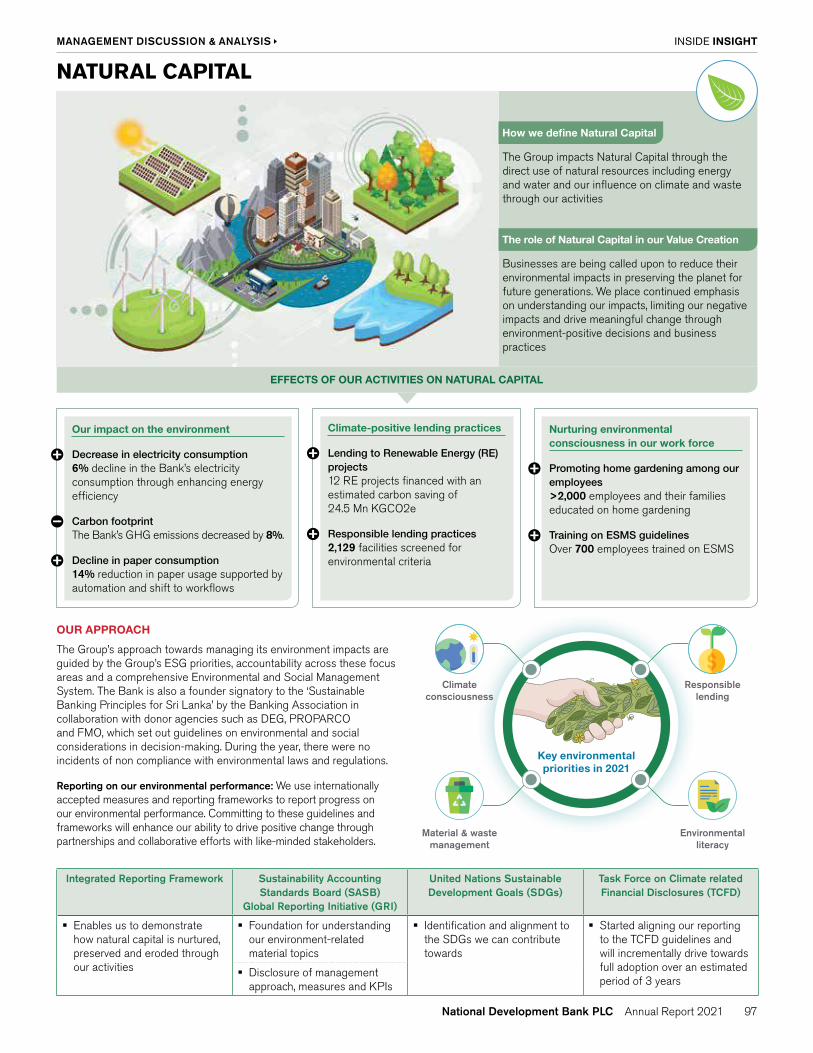
NATURAL CAPITAL
How we define Natural Capital
The role of Natural Capital in our Value Creation
The Group impacts Natural Capital through the direct use of natural resources including energy and water and our influence on climate and waste through our activities
Businesses are being called upon to reduce their environmental impacts in preserving the planet for future generations. We place continued emphasis on understanding our impacts, limiting our negative impacts and drive meaningful change through environment-positive decisions and business practices
Our impact on the environment
Decrease in electricity consumption6% decline in the Bank’s electricity consumption through enhancing energy efficiency
Carbon footprintThe Bank’s GHG emissions decreased by 8%.
Decline in paper consumption14% reduction in paper usage supported by automation and shift to workflows
Climate-positive lending practices
Lending to Renewable Energy (RE)projects12 RE projects financed with an estimated carbon saving of 24.5 Mn KGCO2e
Responsible lending practices 2,129 facilities screened for environmental criteria
Nurturing environmental consciousness in our work force
Promoting home gardening among our employees>2,000 employees and their families educated on home gardening
Training on ESMS guidelines Over 700 employees trained on ESMS
EFFECTS OF OUR ACTIVITIES ON NATURAL CAPITAL
OUR APPROACH
The Group’s approach towards managing its environment impacts are guided by the Group’s ESG priorities, accountability across these focus areas and a comprehensive Environmental and Social Management System. The Bank is also a founder signatory to the ‘Sustainable Banking Principles for Sri Lanka’ by the Banking Association in collaboration with donor agencies such as DEG, PROPARCO and FMO, which set out guidelines on environmental and social considerations in decision-making. During the year, there were no incidents of non compliance with environmental laws and regulations.
Reporting on our environmental performance: We use internationally accepted measures and reporting frameworks to report progress on our environmental performance. Committing to these guidelines and frameworks will enhance our ability to drive positive change through partnerships and collaborative efforts with like-minded stakeholders.
Integrated Reporting Framework Sustainability Accounting Standards Board (SASB)
Global Reporting Initiative (GRI)
United Nations Sustainable Development Goals (SDGs)
Task Force on Climate related Financial Disclosures (TCFD)
� Enables us to demonstrate how natural capital is nurtured, preserved and eroded through our activities
� Foundation for understanding our environment-related material topics
� Identification and alignment to the SDGs we can contribute towards
� Started aligning our reporting to the TCFD guidelines and will incrementally drive towards full adoption over an estimated period of 3 years
� Disclosure of management approach, measures and KPIs
Key environmental priorities in 2021
Climate consciousness
Material & waste management
Responsible lending
Environmental literacy
INSIDE INSIGHT MANAGEMENT DISCUSSION & ANALYSIS
97National Development Bank PLC Annual Report 2021

CLIMATE RELATED OPPORTUNITIES
� Lending opportunities in renewable energy and organic agriculture when transitioning to a low-carbon economy
� Reduced cost through energy efficiency
� Improved resilient to business disruptions
� Improved reputation and access to global capital markets
CLIMATE RELATED RISKS
� Credit risk from lending exposure to industries which are highly vulnerable to climate change (such as agriculture and tourism)
� Erratic weather patterns and natural disasters can direct or indirectly disrupt the Group’s operations
� More stringent scrutiny and regulations relating to mitigating climate change may impact our business model and key lending decisions.
Climate consciousness
Risks stemming from climate change continue to rank among the most significant threats faced by the world, both in terms of likelihood and impacts. We are increasingly aware that our business activities contribute to climate change and are committed to reducing these impacts, both to support sustainable development and safeguard our assets and investments from climate-related risks.
Our Approach
1 Green lending
2Reducing carbon footprint of our
operations3 Climate
positive projects
Green Lending
NDB is a key lender to Sri Lanka’s renewable energy sector, having funded around 30% of the country’s renewable energy projects since 2017. Renewable energy is a key contributor in driving reductions in the carbon footprint, through avoidance of harmful emissions of gases such as Carbon Dioxide (CO2), Sulphur Dioxide (SO2) and Nitrogen Oxide (NOx).
Investment from NDB Capacity GHG emissions and other harmful gases avoided
LKR Mn MW KG CO2e
Solar - ground mounted 1,391 12 13,481,904 Solar - roof mounted 4,756 47 52,759,186 Mini hydro 5,354 103.4 293,849,099 Wind 8,400 84.6 195,834,618 Biomass 1,992 10.3 - Total 21,892 257.3 555,924,807
The Bank also engages in the financing/leasing of hybrid/electric vehicles and by end December 2021 had financed over 2,000 such facilities at a total portfolio value of nearly LKR 5.4 Bn.
Journey to net zero
During the year, the Bank initiated an engagement with the Sri Lanka Climate Fund to verify its ‘Corporate Level GHG Emission Statement’ as a first step to formulating its action plan for achieving net zero.
Reducing the carbon footprint of our operations
The Group continues to explore avenues of reducing its carbon footprint, primarily through increasing the efficiency of its energy consumption. This is driven through, comprehensive energy audits, identification of areas of high energy consumption and implementation of energy efficient cooling and lighting solutions. In addition, the roll out of virtual engagement and development programs and increased automation and digitalisation have contributed towards reducing the carbon footprint of our operations
INSIDE INSIGHT MANAGEMENT DISCUSSION & ANALYSIS NATURAL CAPITAL
98 National Development Bank PLC Annual Report 2021

Climate positive projects
Project impact
Let’s Grow campaignThe Bank’s reforestation drive which aims to contribute towards the national goal of increasing Sri Lanka’s forest cover to 40%, from the current 16.5%. NDB’s contribution included,
� 3,000 trees planted in Himbiliyakada Matale in 2020 with a five year engagement with the Department of Forest Conservation
� Modilla tree planting drive on Marine Drive in partnership with the Road Development Authority
3,000 trees planted
NDB Haritha Viplavaya Planting of 40,000 mangroves in Puttalam and Mannar
Project impact - Over 12,000 mangroves planted as of end 2021
Home agriculture project for employees and their family members
Initiative implemented by the Bank to promote home gardening among employees, with input from agriculture experts on the cultivation of vegetables, fruits and flowers. The programme was expanded during the year to include a competition, encouraging employees to cultivate organically.
Participation of 33 employees and their families
Energy and emission results in 2021
Unit 2021 2020 Change%
Purchased Electricity kWh 5,167,879 5,490,407 -5.87Fuel consumption
- Petrol litres 31,243 31,071 0.55- Diesel litres 12,694 35,031 -63.76
Diesel consumption in generators litres 26,964 29,847 -9.66
Computation method
In measuring the carbon impact of our operations, the Bank continues to use the most recent version of the World Business Council for Sustainable Development (WBCSD)/World Resources Institute (WRI) Greenhouse Gas Protocol Accounting and Reporting Standard (2004) and calculation tools (2015) to compute its carbon footprint. The boundary of the computation is limited to the Bank and its core operations. Reporting under Scope 3 (which is optional) is limited to sources that are material and measurable.
tCO2e Scope 1 emissions Scope 2 emissions
Scope 3 emissions
Total
Mobile combustion
Stationary combustion
2019 174.34 124.81 2,295.06 56.24 2,594.26
2020 179.08 85.29 2,251.07 0.33 2,515.44
2021 115.69 77.05 2,118.83 - 2,311.58
INSIDE INSIGHT MANAGEMENT DISCUSSION & ANALYSIS NATURAL CAPITAL
99National Development Bank PLC Annual Report 2021

Responsible lending
The Bank has implemented a robust Environmental and Social Management System (ESMS) consisting of a set of policies, procedures, tools and capabilities to identify and manage exposure to the E&S risk of its portfolio. Through this system, sustainability is integrated to the Bank’s core business, thereby contributing towards the creation of sustainable value while building a more resilient organisation.
Key aspects of the framework are as follows:
Exclusion list of specified activities/industries
Mandates compliance to all relevant environmental regulations/guidelines
Identification of potential environmental risks and/or adverse environmental impacts
Advise on the mitigation/avoidance of such risks impacts
During the year, the Bank sought to strengthen its ESMS framework through the following measures:
� Revision of the ESMS Framework and Policy in line with the standards of Norfund-the Bank’s largest shareholder
� Appointed of a dedicated ESMS coordinator to oversee the implementation of the policy and deployment of coordinators across key business lines and several subsidiaries
� Communication with external stakeholders
� Strengthening of customer grievance mechanism to identify and escalate specific complaints/issues relating to environmental and social requirements
Business Unit No. of loans assessed for E&S criteria in 2021
Wholesale Banking 534
Project and Infrastructure Financing 54
Business Banking ( SME) 1,541
Material and Waste Management
As the Bank has sought to digitise and automate both customer-driven and internal processes across the organisation, it has achieved a gradual reduction in its paper consumption. Meanwhile, NDB has partnered with an approved third party to recycle its waste-paper.
Cus
tom
er p
roce
sses
Paper recycling in 2021
Cus
tom
er p
roce
sses
+70% NEOS registrations
+196% NEOS transaction value
+113% Papers saved through NEOS
43,217.44 kg Paper recycled
253 Trees saved
25,459 hours Electricity saved
9,126.6 litres Oil saved
288,758.7 litres Water saved
81 processes automation
Organisation-wide OEE initiative
kg’000
0
10
20
30
40
50
60
2019 2020 2021
57 40 35
Annual Paper Consumption
Nurturing environmental and social risk consciousness
During the year, the Bank also placed emphasis on inculcating a culture of environmental and social risk consciousness among its credit officers. This included development of a comprehensive training and development curriculum, numerous workshops and webinars for internal trainers, addition of a dedicated module for ESMS in the orientation program and training on the SLBA Sustainable Banking Principles.
INSIDE INSIGHT MANAGEMENT DISCUSSION & ANALYSIS NATURAL CAPITAL
100 National Development Bank PLC Annual Report 2021

PROGRESS IN 2021NATURAL CAPITAL
9 sessions 7,699 interactions Online sessions/workshops
13 schools 24 sessions 1,008 students School sessions
5 schools 5 sessions Deep dive sessions
Environmental literacy
Conservation through Education
Through this ongoing program, NDB aims to nurture “Green Champions” among the next generation, driving attitudinal changes and inspiring students to contribute towards preserving the planet for future generations. This initiative is conducted through a partnership with the Wildlife & Nature Protection Society of Sri Lanka and comprises of awareness sessions, field trips and initiation of sustainability projects within schools. Given the prevalent conditions in 2021, sessions were shifted to virtual channels. During the year, we also added new ‘deep dive’ sessions focusing on equipping students with the skills required to produce research-based scientific reports.
Training on ESMS criteria and implementation
756 employees trained through 6,796 training hours
WAY FORWARD
The Bank made the first step in its journey to net zero, by engaging Sri Lanka Climate Fund to verify its Corporate Level GHG Emission Statement. We hope to formulate and communicate our plan to achieve this aspiration within the next 2 to 3 years, while fully aligning with the TCFD disclosures in parallel. Ongoing efforts will also be placed on propagating good environmental practices across our lending portfolio through widening the coverage of our ESMS Framework.
Future requirement
As we grow, the Bank will inevitably see an increase in the consumption of its energy, while reliance on paper is expected to fall further with our increased shift towards digitalisation
Adequacy and quality of Natural Capital to meet future requirements
The escalating implications of climate change will result in increased vulnerabilities, stemming from both physical risks and transition risks.
Planned investments for 2022
Formulate commitment and action plan to net zero: LKR 2 Mn
INSIDE INSIGHT MANAGEMENT DISCUSSION & ANALYSIS NATURAL CAPITAL
101National Development Bank PLC Annual Report 2021

Forward Plansway our
Macro-economic challenges remain inevitable in the short-term, given the country’s foreign exchange position. However, economic growth is expected to post gradual recovery over the medium to long-term, supported by the successful vaccination drive, revival of tourism and policy push towards exports.
Against this backdrop, NDB’s strategic interventions for 2022 will be in line with the plans laid out by Voyage 2025.
Key Priorities
Following several years of strong growth, the Group will seek to consolidate its portfolio in 2022, prioritising quality and profitability over volume growth
Emphasis on supporting customers through potential stress following the ending of debt relief and moratoria
Drive customer centricity through realigning the organisational structure and revising performance management systems
Complete upgrade of the core banking system
Strengthen presence in the renewable energy sector
Embedding ESG considerations into lending decisions and increase lending towards climate-positive sectors
Sharpen competitive edge and increase customers’ wallet share through,
Ongoing investments in digital solutions
Multi faceted value propositions which extend beyond financial support
Support customers in navigating the pandemic related disruptions and macro-economic headwinds
Grow total assets to LKR 1 Tn
Increased diversity of revenue streams with higher contributions from non fund-based income
Reposition the branch network as a universal customer touch point
Harnessing Group expertise and specialisation to provide tailored
solutions to deliver a superior customer value proposition
Strengthen ESG integration across the Bank’s operations, processes and value chain
Becoming the “Banking Group of choice” of all Sri Lankans with focus on improving financial inclusivity and social resilience
Short-Term
Medium-Term
Long-Term
WAY FORWARD
INSIDE INSIGHT MANAGEMENT DISCUSSION & ANALYSIS
102 National Development Bank PLC Annual Report 2021

INSIDE INSIGHT INDEPENDENT ASSURANCE REPORT
INDEPENDENT ASSURANCE REPORT TO THE BOARD OF DIRECTORS OF NATIONAL DEVELOPMENT BANK PLC IN THE INTEGRATED ANNUAL REPORT - 2021Scope We have been engaged by the management of National Development Bank PLC (“the Bank”) to perform an independent assurance engagement, as defined by the Sri Lankan Standard on Assurance Engagements, on the following elements of its Integrated Annual Report for the year ended 31 December 2021 (the “Integrated Report”). � Reasonable assurance engagement on the information
on financial capital management as specified on pages 59 to 75 of the Integrated Report.
� Limited assurance engagement on other information on management of the capitals (other than financial capital), stakeholder engagement, business model, strategy, organisational overview & external environment and outlook presented in the Integrated Report.
Criteria applied by National Development Bank PLCThe Integrated Report is prepared based on the Guiding Principles and Content Elements of the International Integrated Reporting Council (IIRC)’s Integrated Reporting Framework (<IR> Framework) (the “criteria”) publicly available at IIRC’s website at “www.integratedreporting.org” National Development Bank PLC’s responsibilitiesNational Development Bank PLC’s management is responsible for selecting the criteria, and for presenting the Integrated Report in accordance with the said criteria, in all material respects. This responsibility includes establishing and maintaining internal controls, maintaining adequate records and making estimates that are relevant to the preparation of the Integrated Report, such that it is free from material misstatement, whether due to fraud or error. Ernst & Young’s responsibilitiesOur responsibility is to express a conclusion on the presentation of the Integrated Report in accordance with the Guiding Principles and Content Elements of the International Integrated Reporting Council (IIRC)’s Integrated Reporting Framework (<IR> Framework) based on the evidence we have obtained.We conducted our engagement in accordance with the Sri Lanka Standard on Assurance Engagements SLSAE 3000: Assurance Engagements other than Audits or Reviews of Historical Financial Information (SLSAE 3000) issued by the Institute of Chartered Accountants of Sri Lanka and the terms of reference for this engagement as agreed with National Development Bank PLC in the engagement letter dated 01 February 2022The standards require that we plan and perform our engagement to express a conclusion on whether we are aware of any material modifications that need to be made to the Integrated Report in order for it to be in accordance with the criteria, and to issue a report. The nature, timing, and extent of the procedures selected depend on our judgment, including an assessment of the risk of material misstatement, whether due to fraud or error.
We believe that the evidence obtained is sufficient and appropriate to provide a basis for our independent assurance conclusion.Our Independence and Quality ControlWe have maintained our independence and confirm that we have met the requirements of the Code of Ethics for Professional Accountants issued by the Institute of Chartered Accountants of Sri Lanka and have the required competencies and experience to conduct this assurance engagement.EY also applies Sri Lanka Standard on Quality Control (SLSQC 1), Quality Control for Firms that Perform Audits and Reviews of Historical Financial Information, and Other Assurance and Related Services Engagements, and accordingly maintains a comprehensive system of quality control including documented policies and procedures regarding compliance with ethical requirements, professional standards and applicable legal and regulatory requirements.Description of procedures performed We performed our procedures to provide reasonable and limited assurance engagement in accordance with SLSAE 3000.Procedures performed in the reasonable assurance engagement depend on our judgement, including the assessment of the risks of material misstatement whether due to fraud or error. In making those risk assessments, we have considered internal control relevant to the preparation and presentation of the reasonable assurance indicators in order to design the assurance procedures that are appropriate in the circumstances. Our procedures also included assessing the appropriateness of the reasonable assurance indicators, the suitability of the criteria in preparing and presenting the reasonable assurance indicators within the Integrated Report and obtaining an understanding of the compilation of the financial information to the sources from which it was obtained.Procedures performed in the limited assurance engagement consisted of making inquiries, primarily of persons responsible for preparing the Integrated Report and related information and applying analytical and other appropriate procedures. These procedures vary in nature and timing from and are less in extent than for a reasonable assurance engagement. Consequently, the level of assurance obtained in a limited assurance engagement is substantially lower than the assurance that would have been obtained had a reasonable assurance engagement been performed. Although we considered the effectiveness of management’s internal controls when determining the nature and extent of our procedures, our assurance engagement was not designed to provide assurance on internal controls. Our procedures did not include testing controls or performing procedures relating to checking aggregation or calculation of data within IT systems.We also performed the below procedures as we considered necessary in the circumstances: � Perform a comparison of the content of the Integrated
Annual Report against the Guiding Principles and Content Elements given in the International Integrated Reporting Council (IIRC)’s Integrated Reporting Framework (<IR> Framework).
� Perusing the Integrated Annual Report – Financial Capital element information to understand whether the information contained are properly derived from the audited financial statements.
� Interviewing the selected key management personnel and relevant staff to understand the internal controls, governance structure and reporting process relevant to the Integrated Report.
� Obtaining an understanding of the relevant internal policies and procedures developed by the Bank, including those relevant to determining what matters most to the stakeholders, how the Bank creates value, the external environment, strategy, approaches to putting members first, governance and reporting.
� Obtaining an understanding of the description of the Bank’s strategy and how the Bank creates value, what matters most to the stakeholders and enquiring the management as to whether the description in the Integrated Report accurately reflects their understanding.
� Perusing the Board of Directors meeting minutes during the financial year to ensure consistency with the content of the Integrated Report.
� Perusing the relevant supporting evidence related to qualitative & quantitative disclosures within the Integrated Report against identified material aspects.
� Perusing the Integrated Report in its entirety to ensure it is consistent with our overall knowledge obtained during the assurance engagement.
Emphasis of matterSocial, natural and intellectual capital management data/information are subjected to inherent limitations given their nature and the methods used for determining, calculating and estimating such data.We also do not provide any assurance on the assumptions and achievability of prospective information presented in the Integrated Report.Restricted use This report is intended solely for the information and use of National Development Bank PLC and is not intended to be and should not be used by anyone other than the specified party.ConclusionBased on our procedures and the evidence obtained, we conclude that: � The information on financial capital management as
specified on pages 59 to 75 of the Integrated Report are properly derived from the audited financial statements of the Bank for the year ended 31 December 2021.
� Nothing has come to our attention that causes us to believe that other information presented in the Integrated Report are not fairly presented, in all material respects, in accordance with the Guiding Principles and Content Elements of the International Integrated Reporting Council (IIRC)’s Integrated Reporting Framework (<IR> Framework).
Ernst & YoungChartered Accountants
22 February 2022Colombo
103National Development Bank PLC Annual Report 2021

INSIDE INSIGHT INDEPENDENT ASSURANCE REPORT
INDEPENDENT ASSURANCE REPORT TO THE BOARD OF DIRECTORS OF NATIONAL DEVELOPMENT BANK PLC ON THE SUSTAINABILITY REPORTING CRITERIA PRESENTED IN THE INTEGRATED ANNUAL REPORT- 2021
Scope
We have been engaged by the management of National Development Bank PLC (“the Bank”) to perform an independent assurance engagement, as defined by the Sri Lankan Standard on Assurance Engagements, on the sustainability reporting criteria presented in the Integrated Annual Report for the year ended 31 December 2021 (the “Report”).
� Reasonable assurance on the information on financial performance as specified on page 31 of the Report.
� Limited assurance on other information presented in the Report, prepared in accordance with the GRI Standards: Core option.
Criteria applied by National Development Bank PLC
The sustainability reporting criteria presented in the Report has been prepared in accordance with The Global Reporting Initiative’s (GRI) Sustainability Reporting Guidelines, publicly available at GRI’s global website www.globalreporting.org.
This Report has been prepared in accordance with the GRI Standards: Core option (the “criteria”).
National Development Bank PLC’s responsibilities
National Development Bank PLC’s management is responsible for selecting the criteria, and for presenting the Report in accordance with the said criteria, in all material respects. This responsibility includes establishing and maintaining internal controls, maintaining adequate records and making estimates that are relevant to support the sustainability reporting process of the Report, such that it is free from material misstatement, whether due to fraud or error.
Ernst & Young’s responsibilities
Our responsibility is to express a conclusion on the presentation of the Report in accordance with the GRI Standards: Core option based on the evidence we have obtained.
We conducted our engagement in accordance with the Sri Lanka Standard on Assurance Engagements SLSAE 3000: Assurance Engagements other than Audits or Reviews of Historical Financial Information (SLSAE 3000) issued by the Institute of Chartered Accountants of Sri Lanka and the terms of reference for this engagement as agreed with National Development Bank PLC in the engagement letter dated 01 February 2022.
The standards require that we plan and perform our engagement to express a conclusion on whether we are aware of any material modifications that need to be made to the Report in order for it to be in accordance
with the criteria, and to issue a report. The nature, timing, and extent of the procedures selected depend on our judgment, including an assessment of the risk of material misstatement, whether due to fraud or error.
We believe that the evidence obtained is sufficient and appropriate to provide a basis for our independent assurance conclusion.
Our Independence and Quality Control
We have maintained our independence and confirm that we have met the requirements of the Code of Ethics for Professional Accountants issued by the Institute of Chartered Accountants of Sri Lanka and have the required competencies and experience to conduct this assurance engagement.
EY also applies Sri Lanka Standard on Quality Control (SLSQC 1), Quality Control for Firms that Perform Audits and Reviews of Historical Financial Information, and Other Assurance and Related Services Engagements, and accordingly maintains a comprehensive system of quality control including documented policies and procedures regarding compliance with ethical requirements, professional standards and applicable legal and regulatory requirements.
Description of procedures performed
We performed our procedures to provide an independent assurance engagement in accordance with SLSAE 3000.
Procedures performed in the reasonable assurance engagement depend on our judgement, including the assessment of the risks of material misstatement whether due to fraud or error. In making those risk assessments, we have considered internal control relevant to the preparation and presentation of the reasonable assurance Indicators in order to design the assurance procedures that are appropriate in the circumstances. Our procedures also included assessing the appropriateness of the reasonable assurance indicators, the suitability of the criteria in preparing and presenting the reasonable assurance indicators within the Report and obtaining an understanding of the compilation of the financial information to the sources from which it was obtained.
Procedures performed in the limited assurance engagement consisted of making inquiries, primarily of persons responsible for preparing the Report and related information and applying analytical and other appropriate procedures. These procedures vary in nature and timing from and are less in extent than for a reasonable assurance engagement. Consequently, the level of assurance obtained in a limited assurance engagement is substantially lower than the assurance that would have been obtained had a reasonable assurance engagement been performed.
Although we considered the effectiveness of management’s internal controls when determining the nature and extent of our procedures, our assurance engagement was not designed to provide assurance on
internal controls. Our procedures did not include testing controls or performing procedures relating to checking aggregation or calculation of data within IT systems.
We also performed the below procedures as we considered necessary in the circumstances:
� Perform a comparison of the content of the Report against the Global Reporting Initiative (GRI) - GRI Standards guideline.
� Interviewing relevant organisation’s personnel to understand the process for collection, analysis, aggregation and presentation of data.
� Review and validation of the information contained in the Report.
� Check the calculations performed by the organisation on a sample basis through recalculation.
� Advice, make recommendations and suggestions on the Sustainability Reporting indicators to improve the presentation standard.
� Independently review the content of the Report and request changes if required.
� Express an independent assurance conclusion on the performance indicators presented in the Sustainability Reporting criteria.
Emphasis of matter
Social, natural, and intellectual capital management data/information are subjected to inherent limitations given their nature and the methods used for determining, calculating, and estimating such data.
We also do not provide any assurance on the assumptions and achievability of prospective information presented in the Report.
Restricted use
This report is intended solely for the information and use of National Development Bank PLC and is not intended to be and should not be used by anyone other than the specified party.
Conclusion
Based on our procedures and the evidence obtained, we conclude that:
� The information on financial performance as specified on page 31 of the Report is properly derived from the audited financial statements of the Bank for the year ended 31 December 2021.
� Nothing has come to our attention that causes us to believe that other information presented in the Report are not fairly presented, in all material respects, in accordance with the Bank’s sustainability practices and policies some of which are derived from the GRI Standards: Core option.
Ernst & YoungChartered Accountants
22 February 2022Colombo
104 National Development Bank PLC Annual Report 2021

Material topic and why it is material to us Correspondent GRI topic and SASB topicProfitable growthSustainable and profitable growth is essential in driving shareholder value and serving the Bank’s purposeEnsuring safety of employees and customersHealth and safety gained centre stage in the outbreak of the COVID-19 pandemic with strategic importance being placed on minimising the risk of infectionCustomer centricityThis is key to the Group’s Voyage 2025 strategy in sharpening its competitive edge and emerging as the preferred Banking Group in Sri Lanka Market and liquidity management Given the operating conditions that prevailed during the year, managing market risks and liquidity emerged as a key priorityOperational efficiencyDriving efficiencies and increased productivity through automation leads to effective cost management, transforming the experience of both internal and external customers.Talent attraction and retention Attracting employees with the right skills and attitudes and retaining them through a unique value proposition is critical to the continued creation of shared value
� Employment (GRI: 401) � Labour management relations (GRI 402) � Training and education (GRI 404) � Diversity and equal opportunity (GRI 405)
Facilitating financial inclusion and literacyProviding access to affordable financing and literacy programs across the country enables the Bank to meet both its financial and sustainability objective
� FN-CB-230: Financial Inclusion and Capacity Building
Digital transformationDigital transformation to drive better customer experience and internal efficiencies is a key priority
� FN-CB-230: Data Security
Responsible lendingWe are committed to preserving the rights of our customers and ensuring compliance to all relevant product and marketing regulations.
� Marketing and labelling (GRI 417)
Customer privacyAs risks related to cybersecurity and information systems intensify, preserving confidential customer data is a key priority for most Banks.
� Customer Privacy (GRI 418)
Managing macro-economic headwindsThe foreign exchange crisis together with slowdown in economic activity is likely to have broad-based implications on the entire industryManaging socio-economic impactsWe are committed to contributing positively to the socio-economic progress of our customers and communities while mitigating any negative impacts
� Economic Performance (GRI 201) � Market Presence (GRI 202) � Tax (GRI 207)
Environmental consciousness Although the Bank’s negative environmental impacts are limited, we are committed to contributing positively to the environment through our lending portfolio and screening criteria.
� Materials (GRI 301) � Energy (GRI 302) � Emissions (GRI 305) � Environmental Compliance (GRI 307) � FN-CB-410: Incorporation of Environment,
Social and Governance Factors in Credit Analysis
Community engagementThe Bank’s CSR initiatives are targeted towards driving meaningful change in the communities we operate. This facilitates our social license to operate while achieving the Bank’s social objectives.
� Local Communities (GRI 413)
Regulatory developmentsThe increased frequency and complexity of regulations have necessitated more emphasis on ensuring compliance to regulations.Adapting to post pandemic realitiesThe pandemic has given rise to permanent changes in the way we work and interact with our customers and adapting to these changes is critical in ensuring long-term sustainability.Impacts of sovereign rating changesThe downgrade of Sri Lanka’s sovereign credit rating has implications to the Bank through limiting access to foreign funding, impairments on foreign currency denominated government securities etc. Brand positioningWe have continued to focus on strengthening our brand visibility, in driving increased penetration across segmentsElevated importance of risk managementPandemic-led disruptions and macro-economic stress have necessitated strengthening of our risk management frameworksEcosystem partnershipsThe Bank is leveraging relationships across the ecosystem to deliver more holistic solutions for customersEmbracing and leveraging technology and dataNurturing a data-driven culture to enable more effective decision making is a key priority over the short-to-medium term.
MATERIAL MATTERS
INSIDE INSIGHT MANAGEMENT DISCUSSION & ANALYSIS
105National Development Bank PLC Annual Report 2021

RISK MANAGEMENT OVERVIEW
During the past three years, external challenges to our business including the April 2019 terror attacks, the COVID-19 pandemic and volatile macro-economic conditions have underscored the importance of strategic agility and responsive decision-making, informed by a holistic view of the Group’s risk profile.
APPROACH TO RISK MANAGEMENT
The Group adopts an enterprise-wide approach to risk management and has implemented an Integrated Risk Management (IRM) Framework, clearly setting out the governance structures, policies, processes, and procedures for managing risks in a manner that balances profitability and financial stability. This framework has continued to serve the Group well amidst the unprecedented challenges of recent years, supporting strategic foresight and agility.
The Bank’s Board of Directors holds apex responsibility for risk management and is supported by the Integrated Risk Management Committee (IRMC) and the Board Audit Committee (BAC) in discharging its risk-related duties, Risk management is underpinned by the Three Lines of Defense Governance model, which drives accountability and ownership while facilitating an appropriate level of independence and segregation of duties.
RISK LANDSCAPE IN 2021
The Banking Sector’s risk landscape in 2021 was characterised by pandemic-led disruptions to operations and volatile macro-economic conditions stemming from the country’s foreign exchange crisis, weakening fiscal position and escalating inflation levels. The Central Bank of Sri Lanka extended moratoriums granted to pandemic affected businesses while borrowers faced repayment pressure in view of challenging market dynamics. The regulator also sought to tighten monetary policy towards the second half of the year, leading to a gradual uptick in interest rates. Despite these challenges, the year presented considerable opportunities to drive further digital enablement, deepen customer relationships and direct lending to sectors earmarked to drive the country’s economic recovery.
Principles of our IRM
Risk Appetite and Strategy
Formulated in line with the nature, type and level of risk the Board is willing to take in achieving its strategic aspirations.
� Reviewed and updated key risk-related policies
� Effective management of foreign currency liquidity position
� Strengthened Environmental and Social Risk Management (ESRM) system
� Enhanced IT and cyber-security risk management frameworks
� All key risk parameters maintained within limits defined in the risk appetite
Capital Management
Driven by the Group’s strategic agenda, regulatory requirements and stresses in the operating landscape.
Governance & Oversight
Clear and effective governance structures promoting judicious empowerment.
Risk Culture
Risk conscious culture that nurtures professional, responsible and ethical behaviour.
Risk Policies & Processes
Effective, robust and stringent framework of policies.
Infrastructure
Adequate resources and systems infrastructure
PRINCIPLES OF OUR IRM FRAMEWORK
KEY ACHIEVEMENTS/DEVELOPMENTS IN 2021
INSIDE INSIGHT RISK MANAGEMENT & CORPORATE GOVERNANCE
106 National Development Bank PLC Annual Report 2021

TOP RISKS
Key risks Developments and metrics Response and mitigating action in 2021
Macro-economic risk � Economic outlook moderated by severe shortage in foreign currency, escalating inflation and a volatile exchange rate
� Revival to be driven by recovering tourism sector, policy impetus towards exports and businesses’ high level of adaptability to post-pandemic realities
� Continuous monitoring of the landscape to capitalise on emerging opportunities such as exports and local manufacturing
� Proactive assessment of impacted portfolios and comprehensive stress testing analysis
Credit risk � Diversified portfolio across customer and industry segments
� Reduction in gross NPL ratio to 4.65% (2020: 5.35%)
� 76% of rated portfolio in investment grade
� Segregation of the portfolio into 4 stressed segments and strengthened review and monitoring
� Continued monitoring of moratorium facilities with quarterly reporting to the Board IRMC
� Enhanced the management of collaterals through regular value updates
� Proactive action on facilities exiting moratoriums in December 2021
Market risk � High volatility in interest rates experienced in debt securities market
� Net interest margin maintained at 3.25%
� Exchange rate volatility created stresses on positions, however, consolidated Foreign Exchange position and the exposure held against the Bank’s capital base was managed well within the regulatory limit of 30%
� Limited exposure to Equity risk
� Proactive real-time monitoring of foreign currency position including internal limits, daily cash flows and regulatory developments
� Strengthened stress tests and scenario analysis
� Cautious management of debt instrument positions
� Timely re-pricing strategies
Liquidity risk � Foreign currency liquidity was under pressure with country down grading
� Statutory Liquid Asset Ratio DBU: 23%
� Statutory Liquid Asset Ratio FCBU: 25%
� Liquidity Coverage Ratio: 171%
� Regular cashflow forecasting to optimise liquidity
� Strengthened engagement with ALCO
� Structural balance sheet management with close monitoring of maturity mismatches
� Negotiations with Foreign Direct Investors for possible funding
Operational risk � Total operational losses were only 0.1% of the Capital charge allocated for Operational Risk
� Majority of losses during the year categorised as high frequency/low impact risks
� Business Continuity Plan for employees and comprehensive safety measures
� Revisiting vulnerable processes and areas of risk due to minimal staff
IT and cyber security risk � Zero instances of significant data breaches and disruptions to the system
� Vulnerability assessments and penetration testing
� Security solutions for prevention of data leakage and privileged account monitoring
� Strengthened technical controls such as firewalls, network separation, intrusion prevention, anti-malware solutions, etc.
Climate related risks � Exposure to the agriculture sector is vulnerable to climate change
� Possible disruptions to operations stemming from natural disasters and erratic weather patterns
� Strengthened the management of Environmental and Social Risks through a new Environmental and Social Risk Management (ESRM) System Policy and revised ESRM Manual
� Appointment of a dedicated Environmental and Social Management System (ESMS) co-ordinator within the Group Risk Management function and for the business verticals
� Capacity development in ESMS through training and addition of a module to the induction programme
INSIDE INSIGHT RISK MANAGEMENT & CORPORATE GOVERNANCE RISK MANAGEMENT OVERVIEW
107National Development Bank PLC Annual Report 2021

Dear Shareholders,
The Group’s resilience and agility amidst unprecedented external challenges in 2021 has been underpinned by its robust and value-creating approach to corporate governance,
which continued to provide a solid foundation in driving effective leadership, ensuring accountability, and setting the right tone at the top. This has enabled NDB to emerge as a faster, leaner and more responsive organisation, aptly positioning it to capture emerging opportunities.
Key areas of focus
The Board placed continued emphasis on monitoring the Group’s progress against Voyage 2025 ambitions through active deliberation and engagement with the management team. We also focused on the Group’s digital transformation strategy, as the Group introduced several unique and innovative digital offerings to drive increased digital enablement for both internal and external customers. The Board also spent significant time deliberating avenues for raising capital, assessing the implications of the macro-economic conditions, reviewing and revising the policy frameworks and strengthening the Group’s Environment and Social Risk Management guidelines.
Board and Committee changes
The Board was refreshed in 2021, with the appointment of 2 new Directors. I join the Board in welcoming Ms. (Fay) Piyachatr Chetnakarnkul, representing our new shareholder Norfund, which invested 9.99% in the Bank’s shareholding during the year. I also welcome Ms. Chandima Dilrukshi who joined the Board during the year. These new appointments have enhanced diversity within the Board, bringing in fresh perspectives and new capabilities, which will be vital in driving the Group’s future transformation. During the year the Board established a new sub-committee, The Digital Transformation Committee, devoting additional time and resources to this key area of the Group’s future aspirations. Mr. Bernard Sinniah, Mr. Sujeewa Mudalige, Mr. Hiran Perera, Ms. Piyachatr Chetnakarnkul and Mr. Dimantha Seneviratne were appointed as members of this Sub-Committee. I also take this opportunity to extend my appreciation to
Dr. Dinusha Panditaratne and Ms. Hiransa Kaluthanthri who resigned from the Board during the year, for their invaluable contributions.
Culture and Values
Shaping organisational culture to reflect the Group’s values of Integrity, Creativity, Excellence, Sincerity, Accountability and Dependability is an important prerequisite in driving the creation of shared value. The Bank’s internal Code of Corporate Governance which is applicable to Directors and Key Management Personnel and the Compliance Policy and Code of Conduct, which is applicable to all employees, clearly set out the Group’s expectations on personal conduct when interacting with internal and external stakeholders. The Bank has a zero tolerance policy for bribery and corruption and regular engagement sessions are held to ensure employees are aware of the importance of mitigating bribery and corruption related risks. The Board continued to provide direction and oversight in shaping the Group’s culture through regular updates on employee welfare and initiatives and close engagement with the Leadership Team.
Compliance
This Report details the “Factual Finding Report” submitted by the External Auditors in relation to the compliance with the Banking Act Direction No 11 of 2007 (as amended) on Corporate Governance issued by the Central Bank of Sri Lanka. Further as stipulated by the revised Code of Best Practices on Corporate Governance issued by the Institute of Chartered Accountants of Sri Lanka (CA Sri Lanka) in 2017, I affirm that I am not aware of any material violations of any provisions of the internal Code of Corporate Governance for Directors and Key Management Personnel and the Bank’s Compliance Policy and Code of Conduct for employees. I also hereby confirm that the Bank’s current state of affairs are not harmful to the business of the Bank in any form.
Mr. Eshana de SilvaChairman
CORPORATE GOVERNANCE
Norfund, Norwegian Investment Fund for Developing Countries invested 9.99% in NDB in 2021, marking the Fund’s first equity investment in Sri Lanka.
With this investment, Norfund emerges as the single largest foreign shareholder of NDB.
SHAREHOLDING STRUCTURE
� Monitoring progress against VOYAGE 2025 ambitions
� Raised LKR 9 Bn via a rights issue and private placement
� Raised LKR 8 Bn via Tier 2 listed debentures
� Reviewed and updated of policies
� Strengthened risk management frameworks in view of external conditions
� Sharpened focus on ESG integration
BOARD CHANGES
PRESERVING VALUE
2 NEW APPOINTMENTS
Ms. (Fay) Piyachatr Chetnakarnkul (representing Norfund)
Ms. Chandima Dilrukshi
2 RESIGNATIONS
Dr. Dinusha Panditaratne
Ms. Hiransa Kaluthantri
� Internal Code of Corporate Governance applicable to Board and Key Management Personnel
� Complemented the Whistle Blowing Policy by establishing an external information mechanism, known as the “NDB Ombudsperson”
� Unique organisational culture centering on sincerity, integrity and transparency
� 8 out of 9 Directors are Non-Executives
� Self-assessments of Board and Sub-Committees
� Proactive year-round stakeholder engagement programmes
� Equal voting rights for all shareholders
� Evolved corporate reporting practice
GOVERNANCE STANDARDS WHICH SET US APART
CORPORATE GOVERNANCE HIGHLIGHTS 2021CHAIRMAN’S MESSAGE ON CORPORATE GOVERNANCE
Corporate Governance reporting: The subsequent discussion provides a high-level overview of how the Board created value to the Organisation during the year, including its key area of focus, operations and deliverables during the year. Detailed information regarding the Bank’s compliance to the disclosure requirements of the CBSL and Code of Best Practice on Corporate Governance are available from page 292 to 317 of this Report.
INSIDE INSIGHT RISK MANAGEMENT & CORPORATE GOVERNANCE
108 National Development Bank PLC Annual Report 2021

HOW THE BOARD SPENT
ITS TIME IN 2021
Mr. Eshana de SilvaChairman-Independent/ Non-Executive Director
Value added to Board: Business, Management and Administration
Appointed in May 2020
Mr. Kushan D’Alwis, PCIndependent/Non-Executive Director
Value added to Board: Law (Litigation/Banking, Corporate, Commercial and Administrative Law)
Appointed in July 2020
Ms. Chandima DilrukshiNon-Independent/Non-Executive Director
Value added to Board: Accounting and Financial Management
Appointed in June 2021
Mr. Sriyan CoorayIndependent/ Non-Executive Director
Value added to Board: Expertise in Banking, Finance and Management
Appointed in August 2018
Mr. Dimantha SeneviratneCEO - Non-Independent Executive Director
Value added to Board: Strategic Leadership in Banking, Finance and Management
Appointed in January 2017
Ms. (Fay) Piyachatr ChetnakarnkulNon-Independent/Non-Executive Director
Value added to Board: Economics, Information technology and Investments
Appointed in May 2021
Mr. Bernard SinniahNon-Independent/ Non-Executive Director
Value added to Board: Banking, Sales, Management and IT
Appointed in March 2019
BOARD OF DIRECTORS 2021
New skills/expertise added to the Board
Mr. Sujeewa MudaligeIndependent/Non-Executive Director
Value added to Board: Accounting, Auditing, Financial Analysis and Management
Appointed in January 2020
Mr. Hiran PereraNon-Independent/Non-Executive Director
Value added to Board: Banking, Credit and Risk Management, Treasury and Corporate Finance
Appointed in April 2020
International Investments/Global and Emerging Market Insights
IT/Digital Transformation
Economics Socially and Environmentally Conscious Investments
30% 10%40%
Strategy, IT/Digital & Capital Planning
Risk Management
Internal & External reporting & Stakeholder Interest & employee welfare
10%
Financial Performance review of the Bank and Group/credit
evaluations
Governance, Compliance, Senior executive review & Succession
Planning
10%
Digital Transformation Committee
Board Audit Committee
Board Credit Committee
Integrated Risk Management Committee
Strategic Issues Committee Related Party Transactions Review Committee
Nominations Committee Human Resources and Remuneration Committee
INSIDE INSIGHT RISK MANAGEMENT & CORPORATE GOVERNANCE CORPORATE GOVERNANCE
109National Development Bank PLC Annual Report 2021

APPROACH TO CORPORATE GOVERNANCE
NDB has embraced Corporate Governance as a business enabler which supports the Group’s overall value creation process. Accordingly, in addition to regulatory requirements and governance best practices, the Group’s Governance Framework has been designed in consideration of our stakeholder expectations, organisational structure and operating model, thereby leading to governance outcomes which enhance the Group’s value creation.
GOVERNANCE FRAMEWORK
Underpinned by the following steering instruments
Regulations
� Companies Act No. 7 of 2007 � Banking Act No. 30 of 1988
(as amended) and all Directions, Guidelines issued thereunder
� Corporate Governance Direction No.11 of 2007 (as amended) issued by the Central Bank of Sri Lanka
� Listing Rules of the Colombo Stock Exchange (CSE)
� Related Party Transactions Section 9 of the Listing Rules of CSE
� Securities and Exchange Commission of Sri Lanka Act. No 19 of 2021
Board Governance
� Board structure � Rotation � Committee
charters
� Policies � Board
evaluation � Culture & ethics
Financial Governance
� Budgeting and financial control � Capital allocation � Performance management � Taxation
Risk Governance
� Risk management � Internal controls � Internal audit
Sustainability Governance
� Sustainability Policy � Environment and Social
Management System
Voluntary Standards
� Code of Best Practice on Corporate Governance issued by CA Sri Lanka (2017)
� Gender Parity Reporting Framework (2019) of CA Sri Lanka
� Integrated Reporting Framework published by the IIRC
� Global Reporting Standards of the Global Reporting Initiative
� Standards issued by the Sustainability Accounting Standards Board
Internal Mechanisms
� Strategic planning � Budgeting and finance � Risk management � People management � IT governance � Stakeholder engagement � Investor relations
Internal Frameworks/Standards
� Articles of Association � Internal Code of Corporate
Governance for Board and Key Management Personnel
� Charters/Terms of Reference of Sub Committees and Management Committees
� Compliance Policy and Code of Conduct
� Comprehensive suite of internal policies (refer page 115)
Governance Principles
Outcomes and Value Creation through Governance
Founded on our Corporate Values
Founded on our Governance Framework
Structure and effective functioning of the Board
Delivery of strategic ambitions of Voyage 2025 Stakeholder value creation
Integrity Creativity Excellence Sincerity Accountability Dependability
Robust control environment
111 115
Disclosure & Transparency Good corporate citizenship
116 116
INSIDE INSIGHT RISK MANAGEMENT & CORPORATE GOVERNANCE CORPORATE GOVERNANCE
110 National Development Bank PLC Annual Report 2021

OU
R G
OV
ER
NA
NC
E P
RIN
CIP
LE
S
Str
uc
ture
an
d e
ffec
tive
fu
nc
tio
nin
g o
f th
e B
oa
rd
ND
B’s
gov
erna
nce
stru
ctur
es a
re d
esig
ned
to e
nsur
e an
app
ropr
iate
bal
ance
of a
utho
rity
and
deci
sion
-mak
ing
pow
er, d
rivin
g ac
coun
tabi
lity,
tran
spar
ency
, and
in
tegr
ity a
cros
s th
e or
gani
satio
n. T
he B
oard
of D
irect
ors
serv
e as
the
cust
odia
n of
the
Ban
k’s
corp
orat
e go
vern
ance
and
is e
mpo
wer
ed to
del
egat
e au
thor
ity
and
resp
onsi
bilit
ies
pert
aini
ng to
spe
cific
func
tions
to a
ny c
omm
ittee
or c
omm
ittee
s as
it th
inks
fit.
The
Gro
up’s
gov
erna
nce
stru
ctur
e is
set
out
bel
ow:
The
Boa
rd is
col
lect
ivel
y re
spon
sibl
e fo
r cre
atin
g an
d de
liver
ing
sust
aina
ble
shar
ehol
der v
alue
. The
Boa
rd d
eter
min
es th
e st
rate
gic
obje
ctiv
es a
nd p
olic
ies
of th
e N
DB
gro
up to
de
liver
suc
h lo
ng-t
erm
val
ue b
y pr
ovid
ing
over
all s
trat
egic
dire
ctio
n w
ithin
a fr
amew
ork
of re
war
d in
cent
ives
and
con
trol
s.
Ext
ern
al A
ud
ito
rsS
ha
reh
old
ers
Reg
ula
tors
Gro
up
Inte
rna
l Au
dit
C
hie
f E
xecu
tive
Offi
ce
r/E
xecu
tive
Dir
ecto
r
Th
e L
ead
ers
hip
Tea
m
Gro
up
Ris
k M
an
agem
en
t a
nd
Co
mp
lian
ce
Boa
rd o
f D
irect
ors
Ass
et a
nd
Liab
ility
C
omm
ittee
Hum
an R
esou
rce
Com
mitt
eeC
redi
t C
omm
ittee
Out
sour
cing
C
omm
ittee
Pro
cure
men
t C
omm
ittee
Ope
ratio
nal
Ris
k P
olic
y C
omm
ittee
IT S
teer
ing
Com
mitt
eeC
redi
t & M
arke
t R
isk
Pol
icy
Com
mitt
ee
Env
ironm
enta
l & S
ocia
l Sys
tem
M
anag
emen
t Int
egra
ted
Com
mitt
ee
Man
agem
ent
Com
mitt
ee
Defi
ning
st
rate
gies
fo
r bal
ance
sh
eet
plan
ning
in
optim
isin
g ris
k-re
turn
dy
nam
ics.
Det
erm
ine
Hum
an
Res
ourc
es (
HR
) st
rate
gies
and
pol
icie
s an
d re
com
men
d so
lutio
ns to
impr
ove
effe
ctiv
enes
s of
the
HR
fu
nctio
n at
the
Ban
k.
Cor
pora
te &
B
ranc
h C
redi
t C
omm
ittee
s
Rev
iew
and
ap
prov
e fa
cilit
ies
with
in
dele
gate
d lim
its
and
mon
itor
port
folio
s.
Ass
ess,
ap
prov
e,
mon
itor a
nd
revi
ew a
ll th
e ou
tsou
rcin
g ar
rang
emen
ts.
Faci
litat
e pr
ocur
emen
t of
good
s an
d se
rvic
es
ensu
ring
fairn
ess,
tr
ansp
aren
cy a
nd
cons
iste
ncy
whe
n as
sess
ing
supp
liers
.
Ass
ess
effe
ctiv
enes
s of
ope
ratio
nal
risk
polic
ies
and
revi
ew
the
Ban
k’s
oper
atio
nal
risk
profi
le.
Pro
vide
gu
idan
ce a
nd
dire
ctio
n on
IT
str
ateg
y to
ens
ure
busi
ness
ob
ject
ives
are
ac
hiev
ed.
Reg
ular
ly
asse
ss th
e C
redi
t/M
arke
t/Li
quid
ity ri
sk
polic
ies
of th
e B
ank.
To im
plem
ent e
nviro
nmen
tal a
nd
soci
al g
over
nanc
e ris
k as
pect
s in
re
latio
n to
resp
onsi
ble
lend
ing
as
per t
he e
nviro
nmen
tal a
nd s
ocia
l ris
k m
anag
emen
t fra
mew
ork
and
the
envi
ronm
enta
l and
soc
ial
man
agem
ent s
yste
m.
Iden
tify
new
mar
ket
oppo
rtun
ities
and
are
as
to im
prov
e op
erat
iona
l ef
ficie
ncie
s, c
ost
savi
ngs
and
cust
omer
se
rvic
e. O
wn
and
driv
e th
e im
plem
enta
tion
of
thes
e pr
ojec
ts.
Man
agem
ent
Com
mitt
ees
Boa
rd S
ub C
omm
ittee
s
Boa
rd A
udit
Com
mitt
eeN
omin
atio
ns
Com
mitt
eeH
uman
Res
ourc
es a
nd
Rem
uner
atio
n C
omm
ittee
Str
ateg
ic Is
sues
C
omm
ittee
Rel
ated
Par
ty T
rans
actio
ns
Rev
iew
Com
mitt
eeIn
tegr
ated
Ris
k M
anag
emen
t Com
mitt
eeB
oard
Cre
dit
Com
mitt
eeD
igita
l Tra
nsfo
rmat
ion
Com
mitt
ee
Gen
eral
ove
rsig
ht
of fi
nanc
ial
repo
rtin
g, in
tern
al
cont
rols
and
fu
nctio
ns re
latin
g to
inte
rnal
and
ex
tern
al a
udit.
Iden
tify
indi
vidu
als
qual
ified
to b
ecom
e B
oard
mem
bers
an
d ap
poin
t Key
M
anag
emen
t P
erso
nnel
(KM
Ps)
.
Det
erm
ine
and
revi
ew th
e H
uman
Res
ourc
es a
nd
Rem
uner
atio
n po
licie
s an
d se
t goa
ls a
nd ta
rget
s re
latin
g to
Dire
ctor
s, C
hief
E
xecu
tive
Offi
cer (
CE
O)
and
Key
Man
agem
ent
Per
sonn
el (K
MP
s) o
f the
B
ank.
Exa
min
e an
d ev
alua
te
stra
tegi
c is
sues
of
a re
gula
r as
wel
l as
of a
n ad
hoc
nat
ure
and
reco
mm
end
any
actio
n to
the
Boa
rd.
Eva
luat
e al
l tra
nsac
tions
w
ith re
late
d pa
rtie
s of
th
e B
ank
in o
rder
to
ensu
re th
at re
late
d pa
rtie
s ar
e tr
eate
d on
par
with
ot
her s
hare
hold
ers
and
cons
titue
nts
of th
e B
ank
in te
rms
of th
e C
orpo
rate
G
over
nanc
e D
irect
ions
, LK
AS
24
and
Lis
ting
Rul
es o
f the
CS
E.
Ass
ess
all r
isks
and
sp
ecify
risk
app
etite
fa
ced
by th
e B
ank,
its
subs
idia
ries
and
asso
ciat
e co
mpa
nies
, thr
ough
ap
prop
riate
risk
indi
cato
rs,
dash
boa
rds
and
man
agem
ent i
nfor
mat
ion.
Rev
iew
the
Cre
dit
Pro
posa
ls s
ubm
itted
by
the
Bus
ines
s Li
ne, i
ts ri
sks
and
adeq
uacy
of p
ricin
g or
co
vena
nts
to m
itiga
te
the
iden
tified
risk
s..
Driv
e th
e B
ank’
s in
itiat
ives
tow
ards
de
liver
ing
bett
er c
lient
ex
perie
nce
and
brin
g op
erat
iona
l effi
cien
cy
acro
ss a
ll bu
sine
ss
lines
of t
he b
ank.
Rep
ortin
g/E
ngag
eE
lect
ed/A
ppoi
nted
by
INSIDE INSIGHT RISK MANAGEMENT & CORPORATE GOVERNANCE CORPORATE GOVERNANCE
111National Development Bank PLC Annual Report 2021

Gender Diversity
Board skill profile and alignment to our strategy
DIVERSE AND EFFECTIVE BOARD
Our Board combines an appropriate and diverse balance of skills, industry experience and perspectives to objectively and effectively discharge its responsibilities. Directors’ competencies and skills are also aligned to the Group’s strategic aspirations which have enabled a deeper understanding of the business and our long-term objectives. With the appointment of two professional females to the Board during the year, Board diversity in terms of skill and gender representation improved further.
Independence
The Board comprises a majority of Non-Executive Directors, of whom 50% are Independent
Diversity of tenure
Periodic refreshment to ensure the addition of new skills and expertise while retaining valuable experience and maintaining continuity
Board Size
The Board is sizeable enough to promote constructive debate and participation.
Intergenerational Diversity
7 Male
2 Female Board composition
4
1
4
Independent Non-Executive Directors
(Including Chairman) Non-Independent & Non-Executive Director
Executive Director/CEO
3
1
5
Below 50 years
Between 50-60 years
Above 60 years
Average age
53 years
Less than 50 years
33%
Director Representation
Held Directorships
100%
Consulting
56%
CEO/COO
44%
Corporate Executives
67%
9 Directors
Board Tenure
3-5 Years
1-2 Years
<1 Year
2
2
5
Business focus
Customer solutions
Digital & data as transformers
Empowered staff
Strategic pillar of Voyage 2025 Specific skills
Banking 4/9
Finance, Accounting & Management 5/9
IT 2/9
General skills
Law: 1/9
HR & Operations 1/9
Marketing & Sales
Investments
Economics
1/9
1/9
1/9
INSIDE INSIGHT RISK MANAGEMENT & CORPORATE GOVERNANCE CORPORATE GOVERNANCE
112 National Development Bank PLC Annual Report 2021

Board Responsibilities
The Board is ultimately responsible for creating and delivering sustainable stakeholder value. The key responsibilities of the Board are set out in the Board Charter:
� Determining the strategic objectives and policies of the NDB group to deliver long-term value and providing overall strategic direction within a framework of reward incentives and controls.
� Making decisions on matters that have a significant strategic, financial, or reputational implication to the NDB Group as a whole.
� Providing effective leadership within a framework of prudent and effective controls for the operations of the Bank which demonstrates and nurtures the collective vision of NDB’s purpose, values, culture, and behaviour.
� Ensuring that management strikes an appropriate balance between promoting long term growth and delivering short term objectives.
� Ensuring that accurate, timely, clear and pertinent information is obtained, and clarification is sought where necessary.
� Presenting a balanced and understandable assessment of the Bank’s position and satisfying itself on the integrity of the Bank’s Financial Statements.
� Engaging with and considering the opinions of shareholders and other stakeholders.
� Assessing the Board’s effectiveness through a comprehensive self-assessment as detailed on page 115.
Formulating strategic direction
Approving policy
Compliance
Embedding sustainability
Effective management of risks
Financial reporting and shareholder communication
KEY AREAS OF BOARD OVERSIGHT
Balance of Power
Composition of the Board and clear segregation of responsibilities facilitate an appropriate balance of power, which is essential for good performance and effective control. We have therefore established clear distinction between the role of Directors and the executive management.
Board refreshment
The periodic refreshment of the Board is vital for its effective functioning. As per the Articles of Association, 1/3rd of the Directors (except the CEO, any Director appointed to fill a casual vacancy and any Nominee Director of the Ministry of Finance) should retire at each AGM and be subject to re-election. As Non-Executive Directors retire, the Nominations Committee identifies and recommends candidates who have the requisite skills, experience and values in line with the Group’s strategic aspirations and future needs.
Chairman (Independent, Non-Executive Director)Provides leadership to the Board and ensures its’ integrity and effective functioning
Retirement age
Board tenure
Board self-assessment
CEO (Executive Director)Leads the Bank towards the achievement of its strategic objectives and ensures the Board receives timely, accurate and clear information on the Group’s performance and position.
Independent DirectorProvides independent judgement through objectively and constructively challenging the Board and management
Sub-Committees of the Board
The Board has established 8 sub-committees to provide additional focus on specific areas; these include five mandatory sub-committees and three additional committees, aligned to the Group’s strategic aspirations. During the year, the Digital Transformation Committee was established to drive NDB’s digital agenda a core pillar of Voyage 2025. These sub-committees ensure that members dedicate additional time and resources in understanding and addressing relevant topics. Sub-committee Terms of Reference (TOR) define the responsibilities and scope of each Committee. Please refer to the Reports of the sub-committees from page 130 to page 143 of this Report for further information.
� Nominations Committee
� Human Resources and Remuneration Committee
� Integrated Risk Management Committee
� Board Audit Committee
� Related Party Transactions Review Committee
Mandatory Sub-Committees
� Strategic Issues Committee
� Board Credit Committee
� Digital Transformation Committee
Discretionary Committees
Rotation guidelines as per the Articles
INSIDE INSIGHT RISK MANAGEMENT & CORPORATE GOVERNANCE CORPORATE GOVERNANCE
113National Development Bank PLC Annual Report 2021

Criteria
Independence is determined against the criteria set out in the Corporate Governance Directions. Further on a voluntary basis the independence criteria in relation to the Code of Best Practice on Corporate Governance (2017) are also assessed. The Director should be independent in character and judgement and be free of any relationships or circumstances which could affect independent judgment.
Assessment
Assessments of independence are carried out annually. Directors submit annual declarations and circumstances are assessed by the Board collectively with focus on directors’ interests, position, association or relatives, which are likely to influence or cause bias in decision making
Results
4 out of 9 Directors based on the Corporate Governance Direction were deemed independent by the Board.
6 out of 9 Directors based on CA Sri Lanka Code were deemed independent by the Board.
Digital transformation Anti-money laundering
Director Induction and Training
Board members participate in an induction process when they join the Board, which serves to provide an overview on the Bank’s operations. The Company Secretary in consultation with the Chairman and Directors will arrange the programme, ensuring that new directors are adequately briefed. The new Board members are provided with a Board Pac which contains comprehensive information on Board meetings of the last three and a half years, ensuring they have access to all information required to carry out their duties effectively. Circulars, directions, and guidelines issued by the regulators are circulated to the Directors on a quarterly basis for their information.
Directors also receive opportunities for upgrading their professional skills throughout their tenure, assisting them to keep abreast of economic, regulatory and industry trends. These training sessions are typically facilitated by the Company Secretary, with the cost borne by the Bank. During the year, Directors engaged in training relevant to the Group’s strategy and emerging risks as listed below.
Ethical leadership
Managing conflicts of interest: Directors have an obligation to disclose situations in which conflicts of interest could arise in accordance with the Articles of Association of the Bank and the Corporate Governance Direction No 11 of 2007 (as amended). The internal Code of Corporate Governance adopted by the Board requires each Board member to determine whether he/she has a potential or actual conflict of interest. Multiple channels are in place to disclose potential conflicts of interest during onboarding, annual update of the disclosures, during the quarterly update of the Bank’s related parties and/or as and when such conflicts arise.
FOCUS OF DIRECTOR TRAINING IN 2021
� 3 Directors attended a virtual conference on Anti-Money Laundering and Countering the Financing of Terrorism Obligations
� 1 Director attended a programme on ‘Digital Transformation: Platform Strategies for Success” conducted by the MIT Sloan School of Management
� 1 Director attended a programme on “Digital Transformation Strategies” conducted by the Judge Business School of the University of Cambridge, UK
Board access to information: Directors have unrestricted access to the management team, information of the Group as well as other resources required to effectively execute their responsibilities. Access to external professional advice is available to Directors at the Bank’s expense. During the year, Directors sought independent professional advice.
The Company Secretary maintains a record of such details and when such matters are discussed, the relevant director refrains from participating in the discussion and abstains from voting.
When initiating new business, Directors maintain strict arm’s length basis and ensure that they do not exert duress or undue influence which circumvents normal procedures when introducing new business to the Bank. Due consideration is given to assessing whether directors’ interests, position, association, or relatives, were likely to influence unduly or cause bias in decision making when judged from the perspective of a reasonable and informed third-party.
Independence: All Directors submit annual declarations of independence or non-independence in accordance with the Corporate Governance Directions, stipulations of the Listing Rules of the CSE and the guidelines of the Code of Best Practice.
INSIDE INSIGHT RISK MANAGEMENT & CORPORATE GOVERNANCE CORPORATE GOVERNANCE
114 National Development Bank PLC Annual Report 2021
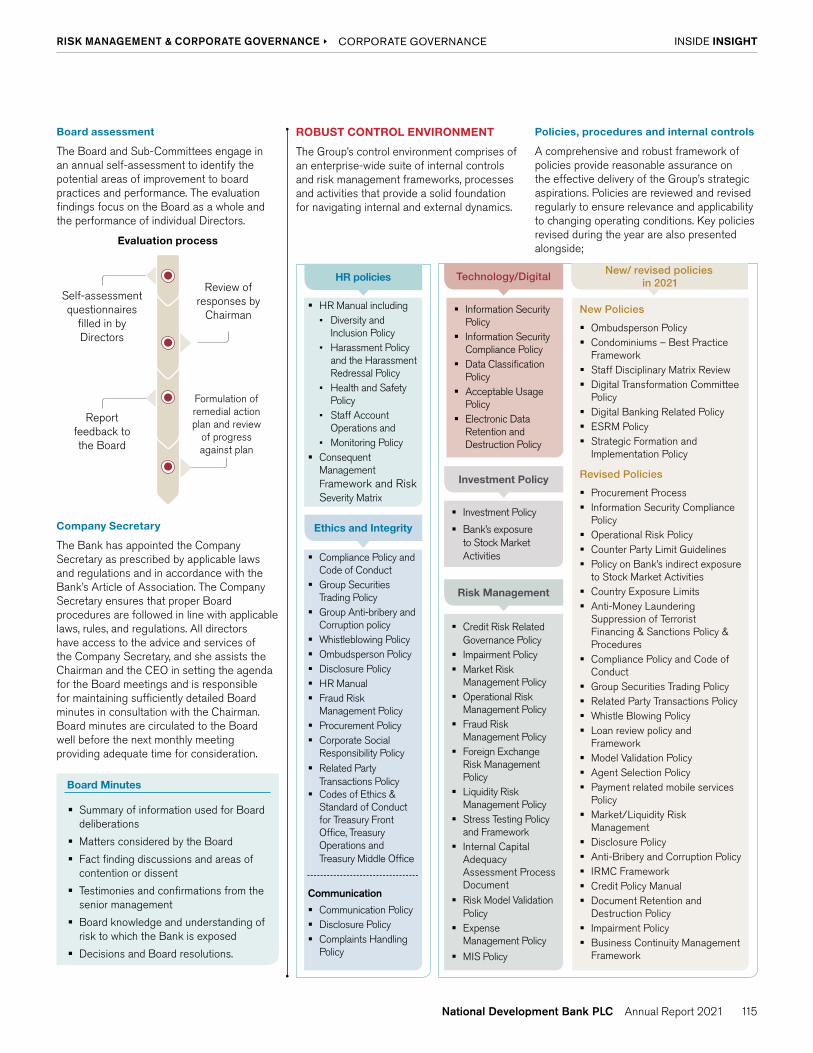
Board assessment
The Board and Sub-Committees engage in an annual self-assessment to identify the potential areas of improvement to board practices and performance. The evaluation findings focus on the Board as a whole and the performance of individual Directors.
Company Secretary
The Bank has appointed the Company Secretary as prescribed by applicable laws and regulations and in accordance with the Bank’s Article of Association. The Company Secretary ensures that proper Board procedures are followed in line with applicable laws, rules, and regulations. All directors have access to the advice and services of the Company Secretary, and she assists the Chairman and the CEO in setting the agenda for the Board meetings and is responsible for maintaining sufficiently detailed Board minutes in consultation with the Chairman. Board minutes are circulated to the Board well before the next monthly meeting providing adequate time for consideration.
Board Minutes
� Summary of information used for Board deliberations
� Matters considered by the Board
� Fact finding discussions and areas of contention or dissent
� Testimonies and confirmations from the senior management
� Board knowledge and understanding of risk to which the Bank is exposed
� Decisions and Board resolutions.
� HR Manual including� Diversity and
Inclusion Policy� Harassment Policy
and the Harassment Redressal Policy
� Health and Safety Policy
� Staff Account Operations and
� Monitoring Policy � Consequent
Management Framework and Risk Severity Matrix
� Compliance Policy and Code of Conduct
� Group Securities Trading Policy
� Group Anti-bribery and Corruption policy
� Whistleblowing Policy � Ombudsperson Policy � Disclosure Policy � HR Manual � Fraud Risk
Management Policy � Procurement Policy � Corporate Social
Responsibility Policy � Related Party
Transactions Policy � Codes of Ethics &
Standard of Conduct for Treasury Front Office, Treasury Operations and Treasury Middle Office
Communication
� Communication Policy � Disclosure Policy � Complaints Handling
Policy
� Information Security Policy
� Information Security Compliance Policy
� Data Classification Policy
� Acceptable Usage Policy
� Electronic Data Retention and Destruction Policy
� Investment Policy
� Bank’s exposure to Stock Market Activities
� Credit Risk Related Governance Policy
� Impairment Policy � Market Risk
Management Policy � Operational Risk
Management Policy � Fraud Risk
Management Policy � Foreign Exchange
Risk Management Policy
� Liquidity Risk Management Policy
� Stress Testing Policy and Framework
� Internal Capital Adequacy Assessment Process Document
� Risk Model Validation Policy
� Expense Management Policy
� MIS Policy
New Policies
� Ombudsperson Policy � Condominiums – Best Practice
Framework � Staff Disciplinary Matrix Review � Digital Transformation Committee
Policy � Digital Banking Related Policy � ESRM Policy � Strategic Formation and
Implementation Policy
Revised Policies
� Procurement Process � Information Security Compliance
Policy � Operational Risk Policy � Counter Party Limit Guidelines � Policy on Bank’s indirect exposure
to Stock Market Activities � Country Exposure Limits � Anti-Money Laundering
Suppression of Terrorist Financing & Sanctions Policy & Procedures
� Compliance Policy and Code of Conduct
� Group Securities Trading Policy � Related Party Transactions Policy � Whistle Blowing Policy � Loan review policy and
Framework � Model Validation Policy � Agent Selection Policy � Payment related mobile services
Policy � Market/Liquidity Risk
Management � Disclosure Policy � Anti-Bribery and Corruption Policy � IRMC Framework � Credit Policy Manual � Document Retention and
Destruction Policy � Impairment Policy � Business Continuity Management
Framework
ROBUST CONTROL ENVIRONMENT
The Group’s control environment comprises of an enterprise-wide suite of internal controls and risk management frameworks, processes and activities that provide a solid foundation for navigating internal and external dynamics.
Policies, procedures and internal controls
A comprehensive and robust framework of policies provide reasonable assurance on the effective delivery of the Group’s strategic aspirations. Policies are reviewed and revised regularly to ensure relevance and applicability to changing operating conditions. Key policies revised during the year are also presented alongside;
Evaluation process
Review of responses by
Chairman
Self-assessment questionnaires
filled in by Directors
Formulation of remedial action plan and review
of progress against plan
Report feedback to the Board
HR policies Technology/DigitalNew/ revised policies
in 2021
Ethics and Integrity
Investment Policy
Risk Management
INSIDE INSIGHT RISK MANAGEMENT & CORPORATE GOVERNANCE CORPORATE GOVERNANCE
115National Development Bank PLC Annual Report 2021

DISCLOSURE & TRANSPARENCY
The Group has an evolved corporate reporting process, which is aligned to global best practice in financial and non-financial reporting. Our key publication to stakeholders is the Group’s Integrated Annual Report, which adheres to several voluntary reporting frameworks such as the Global Reporting Initiative and the SASB guidelines (refer to page 4 for full list). The financial and non-financial information included in the Report as well as the Integrated Reporting process, has been externally assured. The content included in the Annual Report is determined through a comprehensive materiality assessment and all relevant developments pertaining to these material topics are disclosed in a full and transparent manner.
� Internal Code of Corporate Governance
� Compliance Policy & Code of Conduct
� Codes of Ethics & Standard of Conduct for Treasury Front Office, Treasury Operations and Treasury Middle Office
� Group Securities and Trading Policy
� Group Anti-Bribery and Corruption Policy
� Related Party Transactions Policy
� Whistleblowing Policy
� Ombudsperson Policy
Tools supporting our ethical foundation
Risk Management
The Bank’s risk management structure is based on the three lines of defense model, which facilitates the effective segregation of duties to efficiently identify and manage risks across the Bank. The Board’s risk related duties are discharged through the Board Audit Committee and Board Integrated Risk Management Committee and comprises a robust framework including policies, risk strategies, procedures, limits, and exposures, among others. Meanwhile, several executive level committees including the Asset and Liability Committee, Credit and Market Risk Policy Committee and Operational Risk Policy Committee also engages in risk management related responsibilities.
(Please refer to pages 318 to 351- Risk Management Review and pages 133 to 135 - IRMC Report for further information)
Accountability and Audit
Internal Audit: The Group’s Internal Audit operates as an independent and objective assurance function which serves as the third line of defense in the Group’s risk management structure. The Head of Internal Audit reports directly to the Board Audit Committee, which is responsible for ensuring its’ independence and effectiveness.
Audit Committee: The Board Audit Committee is responsible for ensuring the integrity of the Company’s financial statements as well as internal controls and compliance. Chaired by an Independent Non-Executive Director and comprising solely of Non-Executive Directors, the Board Audit Committee represents extensive experience in finance, accounting and auditing. The Terms of Reference of the Audit Committee complies with the recommendations of the Code of Best Practice on Board Audit Committees issued by ICASL and guidelines stipulated by the CSE (Please refer to the Report of the Board Audit Committee on pages 136 to 138 of this Report for further information)
External Auditors and Auditor Independence Policy: The Group’s external auditors are Messrs. Ernst and Young and the principal/consolidator auditor has not engaged in any services which are in the restricted category as stipulated by the CSE for external auditors. Measures in place to ensure the independence and objectivity of the external auditors as discussed furthermore in the Board Audit Committee Report on pages 136 to 138.
GOOD CORPORATE CITIZENSHIP
Ethics and Conduct
A suite of internal standards and policies (set out below), coupled with ongoing efforts to create awareness, training on ethics and conduct and proactive measures to detect and resolve ethical violations underpin the Group’s ethical foundation. The Board of Directors also play a vital role in setting the right tone at the top, contributing towards the nurturing of an organisational culture which is aligned to our core values of Integrity, Excellence, Creativity, Accountability and Sincerity.
� Personal Conduct: For Directors and Key Management personnel, this is guided by the internal Code of Corporate Governance, which ensures the highest standards of corporate conduct. All other employees are bound by the Compliance Policy and Code of Conduct which sets out how organisational values should be put into practice providing a roadmap aligning the values to behavioural, ethical, and practical compliance aspects of our business. The Whistleblowing Policy and the Ombudsperson Policy encourages employees to speak up and voice their concerns anonymously, thereby nurturing a culture of transparency. This is supported by an effective and secure process in place to facilitate communication between the Bank and the whistleblower.
The Gifts and Entertainment Policy which is part of the Compliance Policy and Code of Conduct clearly articulates the Bank’s stance on accepting and giving gifts. Further it provides a threshold for seasonal gifts and the disclosure requirements applicable.
5 yearsRotation of the
partner
3Non-audit services
� Market Conduct: The Group Anti-bribery and Corruption Policy sets out the minimum standards expected by all Directors, employees and third-party service providers engaged by the NDB Group. It clearly articulates the Group’s zero tolerance for bribery and corruption and its firm commitment to act with integrity, professionalism, and fairness in all its business dealings and relationships. This Policy also explicitly prohibits facilitation payments. It provides examples of relationships and events that could lead to a higher risk of Bribery and Corruption and covers prohibitions on political contributions. This policy also makes cross reference to all policies which cover principles relating to provisions of corruption and bribery. The policy also documents the ways in which the Bank assesses the bribery and corruption risks.
Codes of Ethics & Standard of Conduct for
Treasury Front Office, Treasury Operations
and Treasury Middle Office are in place in accordance with the prevailing regulations to strengthen market conduct and practices for treasury operations and to strengthen market risk management systems.
� Societal Conduct: The Group’s Environmental and Social Sustainability framework provides guidance on contributing to the wider community through meaningful and impactful engagements. Meanwhile the Board-approved Disclosure Policy provides guidance and promotes good governance, transparency, and accountability by ensuring access to information, safeguarding the deliberative process, and providing clear guidelines on providing information to the public.
These policies are reviewed regularly to ensure that they stay relevant with the regulatory changes and best practices.
INSIDE INSIGHT RISK MANAGEMENT & CORPORATE GOVERNANCE CORPORATE GOVERNANCE
116 National Development Bank PLC Annual Report 2021
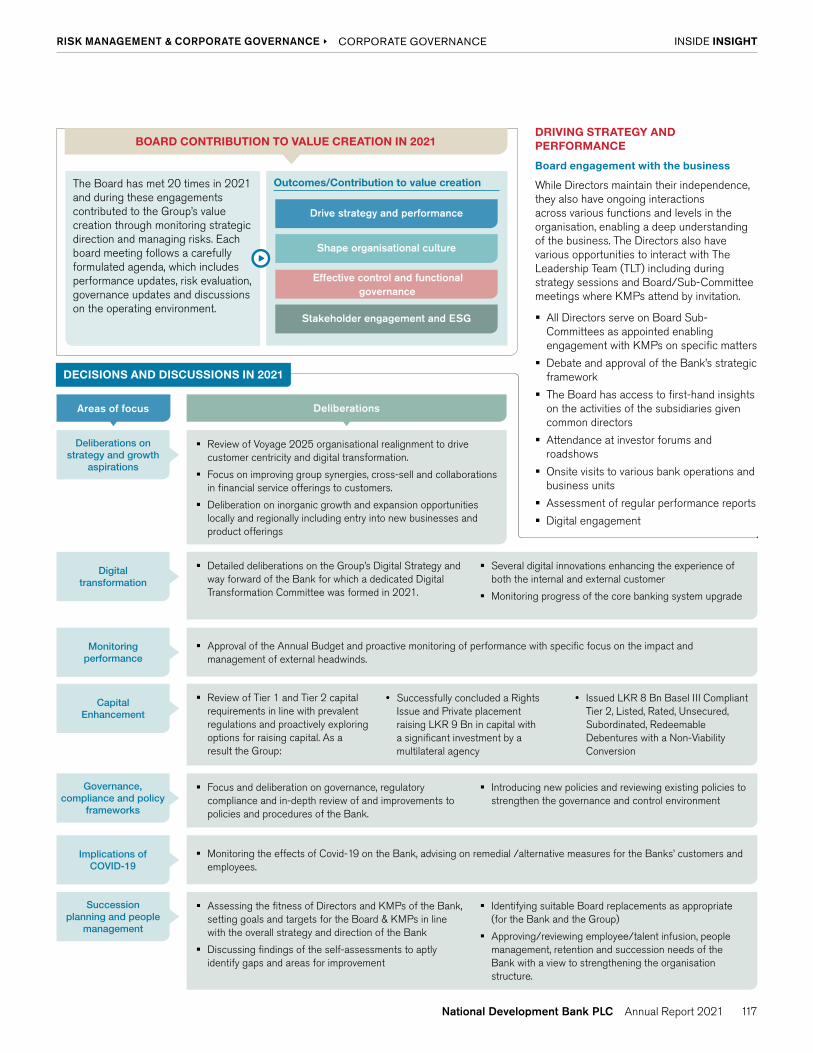
DRIVING STRATEGY AND PERFORMANCE
Board engagement with the business
While Directors maintain their independence, they also have ongoing interactions across various functions and levels in the organisation, enabling a deep understanding of the business. The Directors also have various opportunities to interact with The Leadership Team (TLT) including during strategy sessions and Board/Sub-Committee meetings where KMPs attend by invitation.
� All Directors serve on Board Sub-Committees as appointed enabling engagement with KMPs on specific matters
� Debate and approval of the Bank’s strategic framework
� The Board has access to first-hand insights on the activities of the subsidiaries given common directors
� Attendance at investor forums and roadshows
� Onsite visits to various bank operations and business units
� Assessment of regular performance reports
� Digital engagement
BOARD CONTRIBUTION TO VALUE CREATION IN 2021
The Board has met 20 times in 2021 and during these engagements contributed to the Group’s value creation through monitoring strategic direction and managing risks. Each board meeting follows a carefully formulated agenda, which includes performance updates, risk evaluation, governance updates and discussions on the operating environment.
Outcomes/Contribution to value creation
Drive strategy and performance
Shape organisational culture
Effective control and functional governance
Stakeholder engagement and ESG
Deliberations on strategy and growth
aspirations
Digital transformation
Monitoring performance
Governance, compliance and policy
frameworks
Implications of COVID-19
Capital Enhancement
Succession planning and people
management
� Review of Voyage 2025 organisational realignment to drive customer centricity and digital transformation.
� Focus on improving group synergies, cross-sell and collaborations in financial service offerings to customers.
� Deliberation on inorganic growth and expansion opportunities locally and regionally including entry into new businesses and product offerings
� Detailed deliberations on the Group’s Digital Strategy and way forward of the Bank for which a dedicated Digital Transformation Committee was formed in 2021.
� Several digital innovations enhancing the experience of both the internal and external customer
� Monitoring progress of the core banking system upgrade
� Approval of the Annual Budget and proactive monitoring of performance with specific focus on the impact and management of external headwinds.
� Focus and deliberation on governance, regulatory compliance and in-depth review of and improvements to policies and procedures of the Bank.
� Introducing new policies and reviewing existing policies to strengthen the governance and control environment
� Monitoring the effects of Covid-19 on the Bank, advising on remedial /alternative measures for the Banks’ customers and employees.
� Review of Tier 1 and Tier 2 capital requirements in line with prevalent regulations and proactively exploring options for raising capital. As a result the Group:
Successfully concluded a Rights Issue and Private placement raising LKR 9 Bn in capital with a significant investment by a multilateral agency
Issued LKR 8 Bn Basel III Compliant Tier 2, Listed, Rated, Unsecured, Subordinated, Redeemable Debentures with a Non-Viability Conversion
� Assessing the fitness of Directors and KMPs of the Bank, setting goals and targets for the Board & KMPs in line with the overall strategy and direction of the Bank
� Discussing findings of the self-assessments to aptly identify gaps and areas for improvement
� Identifying suitable Board replacements as appropriate (for the Bank and the Group)
� Approving/reviewing employee/talent infusion, people management, retention and succession needs of the Bank with a view to strengthening the organisation structure.
Areas of focus Deliberations
DECISIONS AND DISCUSSIONS IN 2021
INSIDE INSIGHT RISK MANAGEMENT & CORPORATE GOVERNANCE CORPORATE GOVERNANCE
117National Development Bank PLC Annual Report 2021

Sub-Committees
Nominations Committee 7
Human Resources and Remuneration Committee 6
Integrated Risk Management Committee 5
Board Audit Committee 6
Related Party Transactions Review Committee 4
Strategic Issues Committee 2
Board Credit Committee 13
Digital Transformation Committee 5
Management Committee meetings
Asset and Liability Committee 12
Credit and Market Risk Policy Committee 4
Operational Risk Policy Committee 4
Credit Committees 114
Procurement Committee 67
IT Steering Committee 4
Human Resources Committee 4
Outsourcing Committee 4
Management Committee (MANCO) 19
Environmental & Social Management System 2 Integrated Committee
Board Meetings
Board activities continued despite pandemic-led disruptions to operations. Accordingly, the Board convened 20 times in 2021 as it continued to leverage on technology and digital capabilities. All the meetings during the year were enabled digitally, allowing Directors to attend in person whenever possible. Clearly defined guidelines and processes ensure the effectiveness of Board meetings.
� Board meetings are scheduled and duly informed to the Board at the beginning of each calendar year
� Meeting venues are agreed upon
� Formal notice of meetings, the agenda and Board papers related to each Board meeting are circulated at least 7 days in advance of the Board meeting
� Documents are uploaded through a secure connection to the tablets of all directors in order to ensure that Board members have access to complete information prior to Board meetings
� Board members prepare in advance to ensure effective and robust discussions on key matters
� Board minutes are prepared by the Company Secretary and circulated among Directors after the Board meeting
� The Board minutes contain adequate details appropriate to the matters dealt with during the Board meetings including dissenting views
� The Chairman encourages and facilitates constructive dialogue during Board meetings
� If a Director has a conflict of interest in a matter to be considered by the Board, such matters are disclosed and discussed at the Board meetings, where independent non-executive directors who have no material interest in the transaction, are present. The relevant Director excuses himself from the meeting during such discussions
� Directors are also given the opportunity to participate by telephone or video conference
� Directors are entitled to include matters and proposals in the agenda for discussion
� Chairman draws up the agenda with the assistance of the Company Secretary
Beginning of the year
Circulation of Board papers
After the Board
meeting
During the Board meeting
Setting the agenda
MEETINGS HELD
INSIDE INSIGHT RISK MANAGEMENT & CORPORATE GOVERNANCE CORPORATE GOVERNANCE
118 National Development Bank PLC Annual Report 2021

THE STRUCTURE, COMPOSITION AND ATTENDANCE OF THE BOARD AS AT 31 DECEMBER 2021
Name of Director Areas of Expertise Independent/Non Independent under CBSL Direction
Independent/Non Independent under ICASL
Date of Appointment
Number of Board Meetings Eligible to
Attend
Number of Meetings Attended
Mr. Eshana de Silva (Chairman)
Business, Management and Administration
Independent Independent 14.05.2020 20 20
Mr. Dimantha Seneviratne (CEO)
Banking, Finance and Management
Non-Independent Non-Independent 01.01.2017 15 15
Mr. Sriyan Cooray Banking, Finance and Management
Independent Independent 10.08.2018 20 20
Mr. Bernard Sinniah Banking, Sales, Management and IT
Non-Independent Independent 28.03.2019 20 20
Mr. Sujeewa Mudalige Accounting, Auditing, Financial Analysis and Management
Independent Independent 06.01.2020 20 20
Mr. Hiran Perera Banking, Credit and Risk Management, Treasury and Corporate Finance
Non-Independent Non-Independent 23.04.2020 20 20
Mr. Kushan D'Alwis, PC Law (Litigation/Banking , Corporate, Commercial and Administrative Law)
Independent Independent 06.07.2020 20 20
Ms. (Fay) Piyachatr Chetnakarnkul (Appointed w.e.f. 25.05.2021)
Economics, Information Technology and Investments
Non-Independent Non-Independent 25. 05.2021 11 11
Ms. Chandima Dilrukshi (Appointed w.e.f. 21.06.2021)
Accounting and Financial Management Non-Independent Independent 21.06.2021 11 11
Dr. Dinusha Panditaratne (Resigned w.e.f. 20.08.2021)
Law (International and Business Law) Independent Independent 24.07.2019 14 13
Ms. Hiransa Kaluthantri (Resigned w.e.f. 29.04.2021)
Economics, Management and Policy Non-Independent Independent 24.02.2020 7 7
INSIDE INSIGHT RISK MANAGEMENT & CORPORATE GOVERNANCE CORPORATE GOVERNANCE
119National Development Bank PLC Annual Report 2021

DETAILS OF MEMBERS OF THE BOARD SUBCOMMITTEES AS AT 31 DECEMBER 2021
Name of Committee Board Nominations Committee
Board Human Resources and Remuneration
Committee
Board Integrated Risk
Management Committee
Board Audit Committee
Board Related Party
Transactions Review
Committee
Board Strategic Issues
Committee
Board Credit Committee
Digital Transformation
Committee
Name of Director Status DOA Status DOA Status DOA Status DOA Status DOA Status DOA Status DOA Status DOA
Mr. Eshana de Silva C 20.05.2020 M 20.05.2020 C 14.05.2020 C 14.05.2020 C 20.05.2020
Mr. Dimantha Seneviratne M 01.07.2017 M 23.07.2019 M 01.06.2017 M 30.04.2021
Mr. Sriyan Cooray M 20.08.2021 C 20.08.2021 C 01.09.2018 M 01.09.2018 M* 01.05.2019 M 01.05.2019
Mr. Bernard Sinniah M 19.02.2020 M 19.02.2020 M 19.02.2020 M 01.05.2019 C 30.04.2021
Mr. Sujeewa Mudalige M 19.02.2020 C 18.02.2020 M 19.02.2020 M 19.02.2020 M 30.04.2021
Mr. Hiran Perera M 20.05.2020 M 23.04.2020 M 30.04.2021
Mr. Kushan D'Alwis, PC M 22.07.2020 M 22.07.2020
Ms. (Fay) Piyachatr
Chetnakarnkul
(Appointed w.e.f. 25.05.2021)
M 22.06.2021 M 22.06.2021 M 29.10.2021
Ms. Chandima Dilrukshi
(Appointed w.e.f. 21.06.2021)M 22.06.2021 M 22.06.2021 M 20.08.2021
Dr. Dinusha Panditaratne
(Resigned w.e.f. 20.08.2021)M 24.07.2019 C 24.07.2019 M 20.05.2020 M 19.02.2020
Ms. Hiransa Kaluthantri
(Resigned w.e.f. 29.04.2021)M 24.02.2020 M 24.02.2020
DOA - Date of Appointment Status - C - Chairman/M - Member
* Mr. Sriyan Cooray resigned from RPTR w.e.f. 20.08.2021
NUMBER OF MEETINGS HELD AND ATTENDANCE OF THE BOARD SUBCOMMITTEES AS AT 31 DECEMBER 2021
Name of Committee Board Nominations Committee
Board Human Resources and Remuneration
Committee
Board Integrated Risk Management Committee
Board Audit Committee
Board Related Party Transactions
Review Committee
Board Strategic Issues
Committee
Board Credit Committee
Digital Transformation
Committee
Name of Director Eligible to Attend
Attended Eligible to Attend
Attended Eligible to Attend
Attended Eligible to Attend
Attended Eligible to Attend
Attended Eligible to Attend
Attended Eligible to Attend
Attended Eligible to Attend
Attended
Mr. Eshana de Silva 7 7 6 6 4 4 2 1 13 13
Mr. Dimantha Seneviratne 5 5 2 2 13 13 5 5
Mr. Sriyan Cooray 1 1 1 1 5 5 6 6 2 2 2 2
Mr. Bernard Sinniah 7 7 6 6 2 2 13 13 5 5
Mr. Sujeewa Mudalige 5 4 6 6 4 4 2 2 5 4
Mr. Hiran Perera 5 5 13 13 5 5
Mr. Kushan D'Alwis, PC 4 4 13 13
Ms. (Fay) Piyachatr
Chetnakarnkul
(Appointed
w.e.f. 25.05.2021)
2 2 1 1 2 1
Ms. Chandima Dilrukshi
(Appointed w.e.f.
21.06.2021)
2 2 3 3 2 2
Dr. Dinusha Panditaratne
(Resigned w.e.f.
20.08.2021)
6 6 5 5 4 4 2 2
Ms. Hiransa Kaluthantri
(Resigned w.e.f.
29.04.2021)
1 1 2 2
INSIDE INSIGHT RISK MANAGEMENT & CORPORATE GOVERNANCE CORPORATE GOVERNANCE
120 National Development Bank PLC Annual Report 2021

� Credit risk management enhanced through identifying and segregating 4 stressed segments and tailoring risk review and monitoring mechanisms Cautious management of foreign exchange risk through real-time monitoring of inflows, outflows, and net open positions
� Structured balance sheet management to mitigate liquidity risk
� Continued vulnerability and penetration tests to manage cybersecurity risk
� Strengthened the Bank’s ESRM policy and framework to mitigate exposure to environmental and social risk
Refer to pages 38 to 41 for further information on our stakeholder relationships during the year.
STAKEHOLDER ENGAGEMENT AND ESG
The Board is cognisant of the vital importance in understanding and responding to stakeholders’ legitimate concerns. As described on pages 38 to 41, the Group maps its material stakeholders based on their level of influence, tailors the engagement strategy and delivers it through formal and informal platforms. The prioritised stakeholder universe extends to suppliers and other business partners. Communication with stakeholders is governed through the following frameworks and processes:
� Supports the dissemination of timely, accurate and balanced regulatory disclosures based on applicable laws and regulations.
� Ensures the effective and consistent communication of internal and external communication of corporate information
� Customer complaints handling: Outlines the complaints handling policy of the Bank and governs the procedure through which complaints are tracked, monitored and resolved.
� Employee grievance handling: Transparent mechanism encouraging employees to bring forward any grievances
Disclosure Policy Communication Policy
Grievance Mechanisms
Managing IT and cybersecurity risks
SHAPING ORGANISATIONAL CULTURE
The Board shapes and supports the Group’s culture, setting the right tone at the top in line with NDB’s corporate values. This has played a key role in guiding behaviour across the organisation, enabling a company that is resilient, sustainable and fit-for-future. The Group’s remarkable resilience and agility following the unprecedented challenges posed by COVID-19 is a testament to the strength of our organisational culture.
During 2021, Board oversight and monitoring of culture was supported by the following engagements:
Employee safety, engagement, and wellnessGiven elevated health and safety risks of the pandemic, the Board continued to emphasise the physical and mental well-being of employees across the Group, reviewing measures for securing a safe environment for employees.
Workplace of the future Emphasis on how the Group’s digital transformation can enhance the meaningfulness of work, by automating mundane and repetitive process, thereby driving increased employee fulfillment.
Organisational Change ManagementThe implementation of V25 was supported by concerted organisational OCM initiatives to secure organisation wide buy-in.
Talent ReviewDetailed review of the Group’s talent strategy and competency gaps for accelerating the Group’s transformation under Voyage 2025.
Tools supporting our ethical foundation
EFFECTIVE CONTROL AND FUNCTIONAL GOVERNANCE
The increasing complexities of external headwinds including pandemic-led disruptions and macro-economic stress necessitated increased focus on identifying and mitigating emerging risks. The Board Audit Committee and the Board Integrated Risk Management Committee played a vital role in monitoring changes to the Group’s risk landscape. Key areas of focus are summarised below while further details are provided in the Risk Management Review from pages 318 to 351 of this Annual Report.
With the Group’s increasing thrust towards digitalisation and higher quantum of IT related investment projects, exposure to IT and Cybersecurity risks have increased. A framework of robust IT policies, clear demarcation of responsibilities through the three lines of defense governance model and a highly skilled IT team ensures that IT risks and vulnerabilities are managed in a holistic and consistent manner. The Bank’s comprehensive IT and Cyber Security policy complies with the Baseline Security Guidelines issued by the Central Bank of Sri Lanka (refer to pages 335 for further information).
Customers:
Value proposition centered on customer-centric solutions and superior service and innovation
Suppliers:
Opportunities for capacity expansion and ease of transaction
Communities:
Drive socio-economic empowerment through meaningful and strategic CSI initiatives
Employees:
Attractive rewards and opportunities for skill and career development in a dynamic and agile work environment
Regulators:
Compliant with relevant regulations and guidelines while collaborating with industry peers to ensure a conducive industry landscape
Stakeholder goals
INSIDE INSIGHT RISK MANAGEMENT & CORPORATE GOVERNANCE CORPORATE GOVERNANCE
121National Development Bank PLC Annual Report 2021

Governance Pillar
Shareholder Engagement
We are committed to preserving the rights of our shareholders and ensure that all ordinary shareholders of the same class of shares issued by the Bank are treated equitably. The Group confirms to the principle of one share, one vote and one dividend and currently there are no non-voting shares in issue. We also adopt an array of measures to ensure that shareholder views are heard and fully considered.
45% shareholding representation
at 16th AGM
� Annual General Meeting: The AGM provides shareholders the opportunity to contribute their views and engage with the Board of Directors, including the Chairpersons of certain sub-committees and members of senior management. The Bank’s AGMs are generally well attended, and we encourage shareholders to participate in fostering a constructive dialog. Resolutions requiring shareholder approval are tabled separately for adoption at the AGM. Given restrictions on physical gathering during the year, the Bank held its AGM virtually on the 9th April 2021 with nearly 45% of ordinary shareholding in attendance.
� Dissemination of information: The Bank provides shareholders with timely information on performance and any other material developments. Numerous platforms are in place to disseminate information amongst shareholders and analysts; these include investor presentations, press releases, email notifications, online investor webinar, road shows and the investor relations webpage within the Bank’s corporate website.
� Investor Relations: A dedicated Investor Relations function ensures that shareholders are kept aware of emerging developments
Treatment of minority shareholders
The rights of the Group’s minority shareholders are preserved through the following mechanisms:
� All shareholders have equal voting and transfer rights
� Efficient voting mechanisms to protect minority shareholders
� Process for engaging with minority shareholders- All shareholders have direct access to the Company Secretary
� All avenues available to minority shareholders in line with the laws and regulations are facilitated
Integrating ESG
The Group is accountable for the outcomes of its activities on social systems and the natural environment and is driving concerted efforts to integrate ESG considerations across the organisation. As a responsible corporate citizen, the Board is also conscious of its role in contributing towards the achievement of the Sustainable Development Goals and the goals that are most relevant to the Group’s business are set out below (refer to pages 56 to 57 for further information).
� Increased focus on renewable energy lending, with nearly LKR 22 Mn lending directed to the sector (refer to page 98)
� Commenced the Group’s journey to net zero with the engagement of Sri Lanka Climate Fund to assess and verify NDB’s GHG emissions inventory (refer to page 98)
� Promoting affordable financing to vulnerable sectors of the economy, including rural communities and women (refer to page 57)
� Continued investment in community projects focused on education, environmental literacy and disaster relief
REMUNERATION REVIEW
Our Approach to Remuneration
NDB Bank’s rewards are designed based on the role performed to attract, motivate, engage and retain employees to support the bank strategy and be competitive against market.
In designing the rewards policy and framework the Bank has ensured market competitive rewards schemes are in place looking at the guaranteed cash and total cash. The Bank shall periodically determine the desired market positioning against which the employee rewards will be benchmarked in line with the Banks strategic direction and rewards strategy.
The Bank participates/facilitates industry-wide surveys from time to time, to determine its market positioning and salary levels. The Bank takes appropriate corrective action based on the findings of the surveys where deemed necessary to be competitive in the market by looking at the total compensation.
� Sustainable financial performance and business results
� Individual performance
� Market positioning and market variables
� As an equal opportunity employer we do not discriminate based on ethnicity, gender, disability or other form of diversity
Role of the HRRC
The Board Human Resources and Remuneration Committee plays a pivotal role in determining the Human Resource and Remuneration policies (salaries, allowances and other financial payments) relating to Directors, Chief Executive Officer and Key Management Personnel of the Bank. The committee comprises exclusively of
A holistic Sustainability Policy and ESMS Framework sets the foundation for identifying and managing exposure to the E&S risk of its portfolio. Implementation is driven by a dedicated ESMS officer, who is part of the Group’s Risk Management Unit, reporting to the CRO. Through this system, sustainability is integrated to the Bank’s core business, thereby contributing towards the creation of sustainable value while building a more resilient organisation (refer to page 55 for further information)
The Board sharpened focus on integrating ESG to the Group’s strategy, decision-making and operations in 2021. A clear articulation of the Group’s ESG priorities (refer to page 55), has enabled a more focused, targeted approach to driving NDB’s economic, social and environmental aspirations. Key highlights during the year are listed below and detailed in other sections of the Report (page reference provided).
� Strengthened the ESRM Policy and Manual to align with the global best practices recommended by Norfund and other Development Financial Institutions (refer to page 100)
E
S
G
Environment Pillar
Social Pillar
INSIDE INSIGHT RISK MANAGEMENT & CORPORATE GOVERNANCE CORPORATE GOVERNANCE
122 National Development Bank PLC Annual Report 2021

non-executive directors who also meet independent criteria, and the processes in place ensure that no Director is involved in determining his or her own remuneration.
The Committee’s responsibilities include,
� Recommending to the Board the apportionment of the remuneration perquisites and benefits of the Non-Executive Directors including the Chairman out of the total sum determined for the purpose by the shareholders in terms of the Bank’s articles.
� Evaluating the performance of the CEO and KMPs against the set goals and targets periodically and determining the basis for revising remuneration, benefits and other payments of performance-based incentives.
� Discussing and assessing with the Management the overall remuneration expenditure on all staff and their distribution among different categories and obtaining information on the remuneration and benefits paid/given to consultants engaged by the Bank.
(Please refer to pages 131 to 132 for HRRC Report).
Summary of compensation schemes
Total employee remuneration includes salaries and bonus, allowances, incentives, terminal benefit charges, share-based payments, and other related expenses. Despite the conditions that prevailed during the year, the Group maintained full remuneration for all employees, even paying bonus rewards earlier. Further details on each of these elements are available on pages 185 to 186 - Note Nos. 12 and 14 to the Financial Statements.
A summary of the Group’s remuneration/personnel expenses during the year are given below;
2021LKR’ 000
Director’s emoluments 32,048
Personnel expenses
Salary and bonus 4,592,791
Contribution to EPF and ETF
486,143
Contribution to defined benefit plan
156,566
Others 436,507
INSIDE INSIGHT RISK MANAGEMENT & CORPORATE GOVERNANCE CORPORATE GOVERNANCE
123National Development Bank PLC Annual Report 2021

COMPLIANCE DISCLOSURES
Further to the Annual Report of Board of Directors presented on page 12, and as required by Section 168 of the Companies Act No. 7 of 2007, the following information is disclosed in this Annual Report prepared for the year ended 31 December 2021.
Information required to be mandatorily disclosed as per Section 168 of the Companies Act No. 07 of 2007
Reference to the Companies Act
Disclosure reference for compliance Pages
1 The nature of the business of the Bank and the Group together with any change thereof during the accounting period.
Section 168 (1) (a) Note 01 to the Financial Statements –Corporate Information 166
Confirmation that the state of affairs of the Bank will not be harmful to the business of the Bank
108
2 Signed Financial Statements of the Bank and the Group for the accounting period completed.
Section 168 (1) (b) The Financial Statements of the Bank and the Group for the year ended 31 December 2021
159 to 165
3 Auditor’s Report on Financial Statements of the Bank and the Group.
Section 168 (1) (c) Independent Auditor’s Report 156 to 158
4 Accounting Policies and any changes therein (Group also included).
Section 168 (1) (d) Notes to the Financial Statements: Significant Accounting Policies adopted in the preparation of the Financial Statements of the Bank and the Group.
166 to 285
5 Particulars of the entries made in the Interest Registers of the Bank and its Subsidiaries during the accounting period.
Section 168 (1) (e) All Directors have made declarations as required by Section 192 (1) and (2) of the Companies Act aforesaid and all related entries were made in the Interest Register during the year under review. Director’s Dealing in shares and Debentures 396 and
361The Interest Register is available for inspection by shareholders or their authorised representatives as required by Section 119 (1) (d) of the Companies Act No. 07 of 2007.
Note 52 to the Financial Statements - Related Party Disclosures 246 to 250
6 Remuneration and other benefits paid to Directors of the Bank and its Subsidiaries during the accounting period.
Section 168 (1) (f) Note 14 to the Financial Statements –Other Expenses 186
Corporate Governance report - Director’s and Executive remuneration
311
7 Total amount of donations made by the Bank and its Subsidiaries during the accounting period.
Section 168 (1) (g) Note 14 to the Financial Statements –Other Expenses 186
8 Names of persons holding office as directors as at the end of accounting period and names of persons who ceased to hold office.
Section 168 (1) (h) List of Board of Directors of the Bank 20 to 23 and 119
New Appointments and Resignations 119
List of Directors of Subsidiaries of the Bank 386
9 Separate disclosure on amounts payable to the Auditors as Audit Fees and Fees for other services rendered during the accounting period by the Bank and its Subsidiaries.
Section 168 (1) (i) Note 14 to the Financial Statements – Other Expenses 186
10 Auditor’s relationship or any interest with the Bank and its Subsidiaries.
Section 168 (1) (j) The Financial Statements of the Bank for the year ended 31 December 2021 have been audited by Messrs Ernst & Young, Chartered Accountants. They also function as the auditors of the Bank’s subsidiary companies namely, NDB Capital Holdings Limited, NDB Wealth Management Limited, NDB Securities (Private) Limited, NDB Investment Bank Limited, Development Holdings (Private) Limited, and NDB Zephyr Lanka (Private) Limited.
Based on the declaration provided by Messrs Ernst & Young, Chartered Accountants, and as far as the Directors are aware, the Auditors do not have any relationship with or interest in the Bank that in our judgement may reasonably be thought to have a bearing on their independence within the meaning of the Code of Professional Conduct and Ethics issued by the Institute of Chartered Accountants of Sri Lanka, applicable on the date of this report.
138
INSIDE INSIGHT RISK MANAGEMENT & CORPORATE GOVERNANCE
124 National Development Bank PLC Annual Report 2021

Other Disclosures Reference to the relevant statute/ rule
Disclosure reference for compliance Pages
Central Bank of Sri Lanka Directions (CBSL Direction)
12 Disclosures required to be made by the Board in terms of the Corporate Governance Directions
CBSL Direction No 11 of 2007 (as amended)
The Board has ensured that the required disclosures have been made 292 to 317
The classification of Directors as Executive, Non-Executive, Independent and Non-Independent as at 31 December 2021 is provided
119
13 Annual Corporate Governance Reports
3 (1) (xvi) An annual corporate governance report setting out the compliance with Direction 3 of these Directions
292 to 317
14 Audited Financial Statements 3 (8) (ii) (a) A statement to the effect that the annual audited financial statements have been prepared in line with applicable accounting standards and regulatory requirements, inclusive of specific disclosures.
144 and 145
15 Internal Control Mechanisms 3 (8) (ii) (b) A report by the Board on the Bank’s internal control mechanism that confirms that the financial reporting system has been designed to provide reasonable assurance regarding the reliability of financial reporting and that the preparation of financial statements for external purposes has been done in accordance with relevant accounting principles and regulatory requirements.
146 and 147
16 Factual Findings Report 3 (8) (ii) (g) A confirmation that all the findings of the ‘Factual Findings Reports’ of Auditors issued under ‘Sri Lanka Related Services Practice Statement 4750’ have been incorporated in the Annual Corporate Governance Report.
108
17 Compliance with Laws 3 (8) (ii) (h) A report setting out the details of compliance with prudential requirements, regulations, laws and internal controls that affected the Bank.
305
18 Regulatory Supervisory Process 3 (8) (ii) (i) A statement of the regulatory and supervisory concerns on lapses in the Bank’s risk management, or non-compliance with these Directions that have been pointed out by the Director of Bank Supervision of the CBSL.
305
Listing Rules (LR) of the Colombo Stock Exchange
19 Contents of the Annual Report as required under the Listing Rules of the Colombo Stock Exchange
LR 7.5 Disclosed as required in the Annual Report 144 and 145
LR 7.6 368 and 369
20 Statement confirming compliance with Corporate Governance Rules in terms of the Listing Rules of the Colombo Stock Exchange
LR 7.10a The Board has ensured that the required Corporate Governance disclosures have been made.
In terms of an approval received from the Board of Directors of the Colombo Stock Exchange on 30 March 2010, Licensed Commercial Banks have been granted a total exemption from the requirement to comply with Section 7.10 (Corporate Governance) of the Continuing Listing Requirements under the CSE Listing Rules with effect from 1 January 2010.
21 Disclosure on Related Party Transactions in terms of the Listing Rules of the Colombo Stock Exchange
LR 9.32 Required disclosures have been made by the Related Party Transaction Review Committee.
Also see Note 52 to the Financial Statements : Related Party Disclosures
139 and 140
246 to 255
Information required to be mandatorily disclosed as per Section 168 of the Companies Act No. 07 of 2007
Reference to the Companies Act
Disclosure reference for compliance Pages
10 Auditor’s relationship or any interest with the Bank and its Subsidiaries. (Contd.)
The Auditors have indicated their willingness to offer themselves for reappointment. The Board Audit Committee and the Board of Directors have recommended the reappointment of the Auditors.
A resolution appointing Messrs Ernst & Young as Auditors and authorising the Directors to fix their remuneration will be proposed at the Annual General Meeting.
384
11 Acknowledgement of the Contents of this Report / Signatures on behalf of the Board
Section 168 (1) (k) Complied as stipulated in the Annual Report of the Board of Directors.
12
Other Disclosures as required by the Central Bank of Sri Lanka Directions, Listing Rules of the Colombo Stock Exchange, Code of Best Practice on Corporate Governance 2017 (ICASL Code) issued by the Institute of Chartered Accountants of Sri Lanka, Other Laws and Regulations and Good Governance Disclosures as followed by the Bank.
INSIDE INSIGHT RISK MANAGEMENT & CORPORATE GOVERNANCE COMPLIANCE DISCLOSURES
125National Development Bank PLC Annual Report 2021

Other Disclosures Reference to the relevant statute/ rule
Disclosure reference for compliance Pages
Code of Best Practice on Corporate Governance 2017 ( ICASL Code)
22 Statement of Compliance with the Code of best Practise on Corporate Governance 2017
ICASL Code All required disclosures have been made and status of compliance has been detailed. 292 to 317The classification of Directors as Executive, Non-Executive, Independent and Non-Independent as at 31 December 2021 is provided for purposes of good governance, however, the Bank mandatorily adheres to Direction No. 11 of 2007on Corporate Governance in this regard.
119
23 Compliance with Laws ICASL Code D.1.4
Statement of compliance with all applicable laws and regulations in conducting its business and has not engaged in any activity contravening the relevant laws and regulations.
146 and 147
24 Material Interests in contracts ICASL Code D.1.4
Declaration of all material interests by Directors in contracts involving the Bank and refrained from voting on matters in which they were materially interested.
128 and 129
25 Internal Controls ICASL Code D.1.4
A confirmation that the Board has conducted a review of internal controls covering financial, operational and compliance controls, risk management and have obtained a reasonable assurance of their effectiveness and proper adherence.
146 and 147
26 Financial Statements ICASL Code D.1.5
A statement of responsibility for the preparation and presentation of financial statement have been made together with the external auditors confirmation on their reporting responsibility.
128 and 129
27 Plant and Property ICASL Code D.1.4
The Bank has reported Property Plant and Equipment at fair value, and where it differs from fair value, adequate disclosures are made.
213
28 Related Party Transactions ICASL Code D.1.8
The Board should disclose the related parties and related party transactions as specified by SEC/ Sri Lanka Accounting Standards/Sri Lanka Auditing Standards and similar regulations
246 to 250
139 and 140
29 Cyber Security ICASL Code G. 5
The Board should disclose in the Annual Report the process to identify and manage cyber security risks
317
30 Equitable treatment to shareholders
ICASL Code D.1.4
Statement of Directors’ Responsibility 128 and 129
31 Going Concern ICASL Code D.1.4
The Board of Directors is satisfied that the Bank has adequate resources to continue the business activities in the foreseeable future. Therefore, the Bank has adopted a ‘going concern’ basis in preparing these Financial Statements.
128 and 129
Other Laws and Regulations
32 Duty of the Board of Directors to prepare the Financial Statements of the Bank and the Group
S 150 - 153 of the Companies Act (CA) No. 7 of 2007
Board of Directors acknowledges its responsibility to prepare the Financial Statements of the Bank and the Group, which reflect a true and fair view of the financial position and performance of the Bank and the Group. In this regard, the Board of Directors wishes to confirm that the Income Statement, Statement of Comprehensive Income, Statement of Financial Position, Statement of Changes in Equity, Statement of Cash Flows, and Significant Accounting Policies and Notes thereto have been prepared and presented in conformity with the requirements of the Sri Lanka Accounting Standards as mandated by the Sri Lanka Accounting and Auditing Standards Act No. 15 of 1995 and the Companies Act No. 07 of 2007 and amendments thereto.
128 and 129
33 Dividends on Ordinary Shares S 56 of the CA No. 7 of 2007
Note 19 to the Financial Statements – Dividends per share
Item 8 of the Section on “Investor Relations”
190
359
34 Appointment of Auditor, Auditor’s fees, duty to avoid conflict of interest etc
S 154, 155, 162 & 163 of the CA No. 7 of 2007
The Bank’s External Auditors, Messrs Ernst & Young, who were appointed in accordance with a resolution passed at the 16th Annual General Meeting held on 9th April 2021have expressed their opinion in this Annual Report. The details on the remuneration of External Auditors have been disclosed in this Annual Report. As far as the Directors are aware, the Auditors do not have any other relationship with the Bank, or any of its subsidiaries and its associate. The External Auditors do not have any interest in contracts with the Bank, or any of its subsidiaries and its associates.
156 to 158
186
136 to 138
35 Insurance and Indemnity S 218 of the CA No. 7 of 2007
Pursuant to a decision of the Board, the Bank obtained an Insurance Policy to cover Directors’ liability.
The Bank has accordingly paid an insurance premium in respect of the said insurance policy for the benefit of the Bank and the Directors and certain employees of the Bank and related body corporates as defined in the insurance policy.
308
36 Own share purchases CA s.64 The Bank has not purchased its own shares 316
INSIDE INSIGHT RISK MANAGEMENT & CORPORATE GOVERNANCE COMPLIANCE DISCLOSURES
126 National Development Bank PLC Annual Report 2021

Other Disclosures Reference to the relevant statute/ rule
Disclosure reference for compliance Pages
37 Taxation Laws related to taxation
Note 15 and 17 to the Financial Statements 187 to 189
38 Statutory payments Laws and regulations related to all statutory payments
The Directors, to the best of their knowledge and belief, are satisfied that all statutory payments in relation to the Government of Sri Lanka and the employees have been made up to date.
144 and 145
Good Governance Disclosures as followed by the Bank (GGD) 39 Vision, Mission and Corporate
Conduct GGD The Bank and the Group practices high ethical standards in carrying out their
business activities in line with the vision of the Bank.
All employees of the Bank abide by the Bank’s Code of Conduct and the Directors and the Key Management Personnel of the Bank additionally abide by the Code of Corporate Governance of the Bank.
36
40 Review on Operations of the Group and the Bank and future developments
GGD A review of the operations of the Bank and the Group are discussed in the Chairman’s Message, Chief Executive Officer’s Review and the Management Discussion and Analysis.
13 to 17 and 58 to 75
Note 51 to the Financial Statements: Segmental Analysis - Group 244 and 245
41 Changes to the Group structure GGD There were no changes to the group structure during the year.
42 Gross Income GGD Note 4 to the Financial Statements – Gross Income 174
43 Performance of the Bank and the Group
GGD Statement of Profit and Loss 159
44 Reserves & appropriations GGD Statement of Changes in Equity 162 and 163
Note 44 to 46 of the Financial Statements –Statutory Reserves, Retained Earnings and Other reserves
235 to 237
45 Investment Property GGD Note 31 to the Financial Statements - Investment Property 211 and 212
46 Capital commitments GGD The Bank has a Capital commitment totalling approximately LKR 347 Mn over the next 12 months consisting principally of an upgrade to the Banks Core Banking system. Note 48.2 to the Financial Statements - Capital Commitments.
240
47 Issue of Shares and Debentures by the Subsidiaries and Associates during the year
GGD Note 29 and 30 to the Financial Statements 209 to 211
48 Disclosure of Director’s Dealing in shares and Debentures
GGD Number 6 and Number 13 of the Section on “Investor Relations” 235 and 361
49 Environmental Protection GGD The Bank and the Group have not engaged in any activity that is detrimental to the environment, and have complied with the environmental laws and regulations at all times. Specific activities carried out during the year to protect the environment are detailed in the Management Discussion and Analysis.
55 to 57 and 97 to 101
50 Events Occurring after the Date of the Statement of Financial Position
GGD There have been no events that require adjustment to the Financial Statements or disclosure in the Financial Statements that has occurred subsequent to the date of the Statement of the Financial Position of the Bank.
Note 53 to the Financial Statements
250
51 Human Resources GGD The Human Resources activities carried out during the year to focus on the strategic objectives are detailed in the Human Resources and Remuneration Committee report and Management Discussion and Analysis.
82 to 87
52 Operational Excellence GGD Operational Excellence is also a key Strategic Objective of the Bank and focusses on increasing efficiency and managing operational costs. The Bank has on going initiatives to drive policy and process standardisation and to optimise the use of existing technology platforms.
34 and 88 to 89
53 Outstanding Litigations GGD In the opinion of the Directors and the Bank’s lawyers, pending litigations against the Bank disclosed in the Financial Statements will not have a material impact on the financial position of the Bank or its future operations.
Note 48 to the Financial Statements
240
54 Corporate Social Responsibility (CSR)
GGD CSR Initiatives 2021 92 to 101
55 Sustainability GGD All Business strategies are formulated considering the sustainability aspects of the Bank including Sustainability practices and reporting.
8, 38 to 40 and 55 to 57
56 Technology GGD All processes of the Bank are improved focusing superior customer services through embedding state-of-the-art technology to all its processes and products.
76 to 79
INSIDE INSIGHT RISK MANAGEMENT & CORPORATE GOVERNANCE COMPLIANCE DISCLOSURES
127National Development Bank PLC Annual Report 2021

DIRECTORS’ INTERESTS IN CONTRACTS WITH THE NATIONAL DEVELOPMENT BANK PLC
The Bank in its ordinary course of business, conducts transactions on an arm’s length basis with entities, where the Chairman or any Director of the Bank maintain a relationship with such entities as listed below.
Relationship Company Accommodation Granted, Deposits & Investments
Balance Outstanding
as at 31 December 2021 LKR ‘000
Balance Outstanding
as at 31 December 2020 LKR ‘000
Mr. Eshana de Silva
Director Interocean Energy (Pvt) LimitedDeposits & Investments 61,252 2,539
Loans & Receivables 201,000 692,900
Director Esna Allied Enterprises (Pvt) LimitedDeposits & Investments - 1,053
Off - Balance Sheet Accommodations - 926
Substantial Shareholding
L B Finance PLCDeposits & Investments 2,905,292 2,246,146
Loans & Receivables 3,000,000 4,732,800
Mr. Dimantha Seneviratne
Director NDB Capital Holdings Limited Deposits & Investments 170,030 2,808
Off - Balance Sheet Accommodations 45,951 45,951
Director NDB Wealth Management Limited Deposits & Investments 162 478
Director NDB Investment Bank Limited Deposits & Investments 5,429 7,814
Loans & Receivables 2 1
Chairman Development Holdings (Pvt) LimitedDeposits & Investments 331,990 373,531
Loans & Receivables 1 1
Director NDB Securities (Pvt) Limited
Deposits & Investments 247,262 174,811
Loans & Receivables 234,300 53,197
Off - Balance Sheet Accommodations 100,000 -
DirectorNDB Zephyr Partners Lanka (Pvt) Limited Deposits & Investments 28,324 13,853
Director NDB Zephyr Partners Limited, Mauritius Deposits & Investments 43,745 1,119
Director The American Chamber of Commerce in Sri Lanka Deposits & Investments 20,433 16,153
Director Credit Information Bureau of Sri Lanka Deposits & Investments 820,648 800,007
Mr. Sriyan Cooray
Director Orient Finance PLCDeposits & Investments 22,488 -
Loans & Receivables 400,000 301,980
INSIDE INSIGHT RISK MANAGEMENT & CORPORATE GOVERNANCE
128 National Development Bank PLC Annual Report 2021

Relationship Company Accommodation Granted, Deposits & Investments
Balance Outstanding
as at 31 December 2021 LKR ‘000
Balance Outstanding
as at 31 December 2020 LKR ‘000
Mr. Bernard Sinniah
Director Codevus, Sri Lanka Deposits & Investments 5,293 -
Off - Balance Sheet Accommodations 30 -
Director NDB Capital Holdings LimitedDeposits & Investments 170,030 2,808
Off - Balance Sheet Accommodations 45,951 45,951
Director NDB Securities (Pvt) Limited
Deposits & Investments 247,262 174,811
Loans & Receivables 234,300 53,197
Off - Balance Sheet Accommodations 100,000 -
Director NDB Wealth Management Limited Deposits & Investments 162 478
Director NDB Investment Bank LimitedDeposits & Investments 5,429 7,814
Loans & Receivables 2 1
DirectorNDB Zephyr Partners Lanka (Pvt) Limited Deposits & Investments 28,324 13,853
Mr. Sujeewa Mudalige
Director PwC (Pvt) Limited Deposits & Investments 65 366
Managing Partner PwC Partnership Deposits & Investments 121 124
Committee Member The Ceylon Chamber of Commerce Deposits & Investments 2,405,364 2,443,088
Non-Executive Chairman
Mercantile Services Provident Society (MSPS) Deposits & Investments 979,605 979,605
Non-Executive Independent Director Link Natural Products Limited Deposits & Investments 10 356,241
Non-Executive Independent Director CIC Holdings PLC Deposits & Investments 68,557 43,307
Mr. Hiran Perera
Director (Non-Board) Softlogic Holdings PLC Deposits & Investments 7,698 4,629
Ms. Chandima Dilrukshi
Director Urban Development Authority Deposits & Investments 76,564 2,268,851
For Related Party Disclosures as per the Sri Lanka Accounting Standard – LKAS 24: Related Party Disclosures, please refer Note 52 to the Financial Statements on page 246 of this Annual Report.
INSIDE INSIGHT RISK MANAGEMENT & CORPORATE GOVERNANCE DIRECTORS’ INTERESTS IN CONTRACTS WITH THE NATIONAL DEVELOPMENT BANK PLC
129National Development Bank PLC Annual Report 2021

NOMINATIONS COMMITTEE REPORT
COMPOSITION OF THE NOMINATIONS COMMITTEE
The Board appointed Nominations Committee comprised three Non-Executive Directors inclusive of the Chairman who is an Independent Director as set out below. The Chief Executive Officer (CEO) and other Directors have been present at meetings only if invited by the Committee.
As at 31 December 2021 the Committee comprised the following;
Name of the Board Subcommittee Member Directorship Status Membership Status
Mr. Eshana de Silva Independent Chairman
Mr. Sriyan Cooray Independent Member
Mr. Bernard Sinniah Non-Independent Member
Mr. Dimantha Seneviratne Non-Independent By Invitation
Secretary to the Committee Ms. Shehani Ranasinghe - Company Secretary
Mr. Eshana de Silva Chairman
CHARTER OF THE NOMINATIONS COMMITTEE
The Nominations Committee was formed in compliance with the Section 3 (6) of Direction No. 11 of 2007 (as amended), “Corporate Governance for Licensed Commercial Banks in Sri Lanka”, issued by the Monetary Board of the Central Bank of Sri Lanka under the powers vested in the Monetary Board, in terms of the Banking Act No 30 of 1988. The composition and the scope of work of the Committee are in conformity with the provisions of the said Direction. The Charter of the Nominations Committee was approved by the Board of Directors and is reviewed annually. As part of the annual review process, the Committee reviewed the Charter in September 2021. The Committee carries out the following duties and responsibilities:
� Implements procedures to select/appoint new Directors, CEO and Key Management Personnel (KMPs).
� Considers and recommends the reelection of current Directors, taking into account the performance and contribution made by the Director/s concerned towards the overall discharge of the Board’s responsibilities.
� Sets out the criteria such as qualifications, experience and key attributes required for eligibility to be considered for appointment or promotion to the post of CEO and KMPs.
� Ensures that Directors, CEO and KMPs are fit and proper persons to hold office as specified in the criteria given in Direction 3(3) and as
set out in the Banking Act Direction No. 11 of 2007 on Corporate Governance for Licensed Commercial Banks.
� Sets the criteria such as qualifications, experience and key attributes required for eligibility to be considered for appointment to select/appoint fit and proper persons as the Nominee Directors to the Boards of the Bank’s Group Companies.
� Considers and recommends from time to time, the requirements of additional/new expertise and the succession arrangements for retiring Directors and KMPs.
COMMITTEE MEETINGS
The Committee held seven (07) meetings during the year under review. The attendance of committee members at meetings is stated in the table on page 120. The quorum for a meeting is three (03) members.
The proceedings of the Committee meetings have been regularly reported to the Board of Directors.
METHODOLOGY USED BY THE COMMITTEE
The Committee meets as and when necessary in order to assess the suitability of individuals for appointment as Directors and KMPs in the manner aforementioned as well as to conduct such other affairs which the Charter of the Committee mandates the Committee to carry out.
SUMMARY OF ACTIVITIES IN 2021
During the year, the Committee considered the suitability of several candidates and recommended the appointment of two Directors to the Board of Directors of the Bank and further reviewed and recommended the appointment and continuation of Directors to the boards of subsidiary companies of the Bank. In the process, the Committee assessed the qualifications, experience, skills and competencies of the Directors vis à vis the gaps and needs of the boards in line with any applicable regulatory requirements. The Committee was conscious of the overall composition of the boards and striking the ideal balance in terms of expertise and experience on the boards.
The Committee also assessed the fitness and propriety of the continuing Directors of the Bank and affidavits and declarations submitted by Directors were forwarded to the Regulator for approval as required by the regulations. The Committee further recommended to the Board the re-election of Directors retiring by rotation and offering themselves for re-election at the Annual General Meeting in line with the Articles of Association of the Bank and applicable regulations, having reviewed the fitness and propriety of the Directors.
The Committee, with a view to strengthening the organisational structure of the Bank, also reviewed the expertise, skills and talents of potential candidates both internally and externally in line with internal policies and applicable rules and regulations, in order to fill existing as well as new senior managerial positions of the Bank in line with the strategic vision and direction of the Bank. The Committee further deliberated and recommended regarding appointments/extensions and role/designation changes of several key management personnel of the Bank during the year.
The Committee conveys its appreciation to Dr. Dinusha Panditaratne for her valuable contribution until her resignation in the year 2021.
Mr. Eshana de Silva Chairman Nominations Committee
22 February 2022 Colombo
INSIDE INSIGHT RISK MANAGEMENT & CORPORATE GOVERNANCE
130 National Development Bank PLC Annual Report 2021

HUMAN RESOURCES AND REMUNERATION COMMITTEE REPORT
COMPOSITION OF THE HUMAN RESOURCES & REMUNERATION COMMITTEE
The Board appointed Human Resources & Remuneration Committee comprised three Non-Executive Directors inclusive of the Chairman who is an Independent Director as set out below. The Chief Executive Officer (CEO) has been present at meetings subsequent to being invited by the Committee, other than in instances where matters relating to the CEO have been discussed.
As at 31 December 2021 the Committee comprised the following;
Name of the Board Subcommittee Member Directorship Status Membership Status
Mr Sriyan Cooray Independent Chairman
Mr. Eshana de Silva Independent Member
Mr. Bernard Sinniah Non-Independent Member
Mr. Dimantha Seneviratne Non-Independent By Invitation
Secretary to the Committee Ms. Shehani Ranasinghe - Company Secretary
CHARTER OF THE HUMAN RESOURCES & REMUNERATION COMMITTEE
The Human Resources & Remuneration Committee was formed in compliance with Section 3 (6) of Direction No. 11 of 2007 (as amended), on the subject “Corporate Governance for Licensed Commercial Banks in Sri Lanka”, issued by the Monetary Board of the Central Bank of Sri Lanka under the powers vested in the Monetary Board, in terms of the Banking Act No 30. of 1988. The composition and the scope of work of the Committee are in conformity with the provisions of the said Direction. The Charter of the Human Resources & Remuneration Committee was approved by the Board of Directors and is reviewed annually. As part of the annual review process, the Committee reviewed the Charter in December 2021. As per the Charter, the scope of work includes the following;
1. Determining and periodically reviewing the Remuneration Policy (salaries, allowances and other financial payments and perquisites) and remuneration payable relating to executive and/or Non-Executive Directors, the CEO and Key Management Personnel (KMP/s) of the Bank in terms of the Remuneration Policy/Bank’s Articles etc.
2. Recommending to the Board the apportionment of the remuneration perquisites and benefits of the Non-Executive Directors including the Chairman out of the total sum determined for the purpose by the shareholders in terms of the Bank’s Articles.
3. Reviewing and recommending to the Board in consultation with the Nomination Committee, personnel considered fit and proper for appointment to KMP positions of the Bank.
4. Responsibility of setting and reviewing goals and targets for Directors, CEO and KMPs and determining their periodic revision.
5. Evaluating the performance of the CEO and KMPs against the set goals and targets periodically and determining the basis for revising remuneration, benefits and other payments of performance based incentives.
6. Considering the succession plans and proposals recommended by the Senior Management of the Bank for all existing KMP positions of the Bank and making necessary recommendations for the approval of the Board.
7. Discussing and assessing with the Management the overall remuneration expenditure on all staff and their distribution among different categories and obtaining information on the remuneration and benefits paid/given to consultants engaged by the Bank.
8. Receiving information on the role and activities of the Human Resources Department and making recommendations for the strengthening of the role of the said department if necessary.
9. Reviewing the recommendations made by the Senior Management on appropriate incentives/awards to achieve objectives such as rewarding performance and retaining KMPs, including the review/recommendation of share option schemes for employees of the Bank.
10. Reviewing and recommending to the Board any termination payments that are proposed to be paid to Directors, the CEO and/or KMPs in the event the same are deemed necessary and ensuring that such payments are in terms of the remuneration policy of the Bank and are approved in accordance with applicable statutes, rules and regulations.
Mr. Sriyan Cooray Chairman
INSIDE INSIGHT RISK MANAGEMENT & CORPORATE GOVERNANCE
131National Development Bank PLC Annual Report 2021

COMMITTEE MEETINGS
Despite the pandemic situation in the country, the Committee held six (06) meetings during the year under review. The attendance of committee members at meetings is stated in the table on page 120. The quorum for a meeting is three (03) members.
The proceedings of the Committee meetings have been regularly reported to the Board of Directors.
METHODOLOGY USED BY THE COMMITTEE
The Committee acknowledges rewards as one of the essential components in influencing employee behaviour, thus impacting business results. Therefore, the reward programmes are designed to attract, retain and to motivate employees to deliver results by linking performance to demonstrable performance based criteria. In this regard, the Committee evaluates the performance of the CEO and KMPs against the pre-agreed targets and goals that balance short and long-term financial and strategic objectives.
The Bank’s variable (bonus) pay plan is determined according to the overall achievements of the Bank and pre-agreed individual targets, which are based on various performance parameters. The level of variable pay is set to ensure that individual rewards reflect the overall performance of the Bank, the particular business unit and individual performance. The Committee makes appropriate adjustments to the bonus pool in the event of over or under achievement against pre-determined targets. In this regard and as and when needed, the Committee can seek external independent professional advice on matters falling within its purview.
The Committee has as a practice ensured that the Bank organises and takes part in compensation surveys every 2-3 years and has utilised such feedback to ascertain that compensation practices are benchmarked to the “best practices” and are relevant and current as far as possible.
SUMMARY OF ACTIVITIES IN 2021
The Committee was apprised of and duly followed up on the impact of the Coronavirus pandemic to the staff, workplaces and customers of the Bank, advising the management on timely action as and when needed.
During the year, the Committee comprehensively reviewed the performance of the KMPs of the Bank for the year 2020 against the set goals and targets, using the Balanced Scorecard methodology and recommended to the Board of Directors of the Bank, the increments, bonuses and promotions for the staff members in general and individually, for the KMPs in 2021 in line with current strategy and direction of the Bank. Staff benefits and schemes were also reviewed during the year with a view of improving staff satisfaction in line with market standards with focus on the Bank’s strategic journey and the prevailing environment, whilst ensuring compliance with applicable rules and regulations.
The Committee also advised and set goals and targets for the KMPs for 2021 in line with the strategic vision and direction of the Bank, whilst also noting and agreeing upon goals and targets of the Board of Directors for the year 2021.
The Committee was further called upon to consider the qualifications, experience and suitability of several persons to fill some KMP positions that fell vacant during the year and recommended regarding appointments, extensions and role/designation changes of several KMPs of the Bank in line with and to support the Bank’s strategic direction. The Committee also reviewed and recommended a candidate for the appointment as the Ombudsperson of NDB.
The Committee reviewed and recommended amendments to the Code of Conduct of the Bank in 2021 to ensure its relevance to the current environment. The impact of certain Directions issued by the Regulator were also evaluated by the Committee to ensure adherence to applicable laws, rules and regulations.
The Committee also reviewed the Risk Severity Matrix and consequence Management Framework which was introduced across the Bank in 2021 to manage consequences of disciplinary cases and related matters of the Bank.
The Committee also received information on the role and activities of the Human Resources Department and made recommendations to strengthen governance and management practices.
The Committee records its appreciation for the contribution made by its former Chairperson, Dr. Dinusha Panditaratne who led and guided the Committee till her resignation from the Board in August 2021.
Mr. Sriyan Cooray Chairman Human Resources & Remuneration Committee
22 February 2022 Colombo
INSIDE INSIGHT RISK MANAGEMENT & CORPORATE GOVERNANCE HUMAN RESOURCES AND REMUNERATION COMMITTEE REPORT
132 National Development Bank PLC Annual Report 2021

INTEGRATED RISK MANAGEMENT COMMITTEE REPORT
COMPOSITION OF THE INTEGRATED RISK MANAGEMENT COMMITTEE
The Board appointed Integrated Risk Management Committee comprised five Non-Executive Directors of which two are independent Directors which includes the Chairman of the Committee.
As at 31December 2021 the Committee comprised the following;
Name of the Board Subcommittee Member Directorship Status Membership Status
Mr. Sriyan Cooray Independent Chairman
Mr. Sujeewa Mudalige Independent Member
Mr. Hiran Perera Non-Independent Member
Ms. Chandima Dilrukshi (appointed w.e.f. 22.06.2021) Non-Independent Member
Ms. (Fay) Piyachatr Chetnakarnkul (appointed w.e.f. 22.06.2021) Non-Independent Member
Mr. Dimantha Seneviratne (Chief Executive Officer) Non-Independent Member
Ms. Melody Wikramanayake (Vice President - Legal) Non-Director Member
Ms. Manique Kiriella Bandara (Compliance Officer) Non-Director Member
Secretary to the Committee Ms. Shanti Gnanapragasam (Vice President - Chief Risk Officer) Non-Director Member
Mr. Sriyan Cooray Chairman
CHARTER OF THE COMMITTEE
The Integrated Risk Management Committee was formed in June 2008 replacing the Risk & Credit Committee of the Board, in compliance with the Section 3 (6) of Direction No. 11 of 2007 (as amended), on the subject “Corporate Governance for Licensed Commercial Banks in Sri Lanka”, issued by the Monetary Board of the Central Bank of Sri Lanka under the powers vested in the Monetary Board, in terms of the Banking Act No 30 of 1988. The composition and the scope of work of the Committee are in conformity with the provisions of the said Direction.
The Charter of the IRMC was approved by the Board of Directors and is reviewed annually. As part of the annual review process, the Committee last reviewed the charter in February 2021. As per the Charter, the scope of work includes the following:
� Work closely with Key Management Personnel (as defined by the Management from time to time) and make decisions on behalf of the Board within the framework of the authority and responsibility assigned to the Committee
� Assess all risks of the Bank and Group on a monthly basis through appropriate risk indicators and management information
� Submit a risk assessment report within a week of each meeting to the Board seeking the Board’s views, concurrence and/or specific directions
� Review the adequacy and effectiveness of all management level committees such as the Credit Committees, Credit and Market Risk Policy Committee, Operational Risk Policy Committee and the Asset-Liability Committee to address specific risks and to manage those risks within quantitative and qualitative risk limits as specified by the Committee/Board
� Take prompt corrective action to mitigate the effects of specific risks in the case such risks are at levels beyond the prudent levels decided by the Committee/Board on the basis of the Bank’s policies and regulatory and supervisory requirements
� Inform the Human Resources Department to take appropriate action against the officers who fail to identify specific risks, and/or take prompt corrective actions as recommended by the Committee, and/ or as directed by the Director of Bank Supervision. The course of action to be taken against staff would be governed by the HR disciplinary action procedure in force
� Review and discuss the scope of work of the Group Risk Management Department
� Receive copies of regulatory examination reports pertaining to matters that are within the purview of the Committee and Management’s responses thereto
� Ensured staffs are trained adequately on compliance related laws, regulations, policies and procedures as a tool in mitigating the Bank's compliance risk by educating employees and maintaining their ongoing awareness. The programmes include both formal training courses and ongoing communications
COMMITTEE MEETINGS
The Committee held four meetings, during the year under review to discuss the normal scope of work and one special IRMC meeting which was held in May 2021, to review the ICAAP & Stress Testing Framework of the Bank. The attendance of committee members at meetings is stated in the table on page 120. Key members of the staff participate at the meetings as appropriate. The quorum for a meeting is four members of which two shall be non-executive Directors.
The proceedings of the Committee meetings have been regularly reported to the Board of Directors.
INSIDE INSIGHT RISK MANAGEMENT & CORPORATE GOVERNANCE
133National Development Bank PLC Annual Report 2021

SUMMARY OF ACTIVITIES IN 2021
The country and the world collectively faced another year of extraordinary and unprecedented challenges in the midst of the COVID-19 pandemic in 2021. The Committee, thus, in addition to carrying out its duties under the normal scope of work devoted special attention to reviewing the risks and mitigants associated with the impact of COVID-19 on various activities of the Bank. The key areas of focus in this regard are detailed under each category below:
Credit Risk
� Reviewed and approved policies and operating guidelines related to Credit Policy Manual, Impairment Policy, Policy on Bank’s Indirect Exposure to Stock Market Activities, Cross Border Exposure Limits and Policy on Loan Review Mechanism and Delegated Lending Authority for credit related approvals for the Wholesale Banking, Project Finance, Correspondent Banking and Branch Network
� Reviewed the portfolio quality of the Bank
� Reviewed the key implications of COVID-19, key areas of impact, assessment of categorising industries/ sectors based on the severity of impact
� Reviewed detailed analysis on the impact of regulatory relief measures such as loan moratoriums under the COVID-19 Relief scheme and proactive measures taken by the Bank to mitigate risk of future defaults
� Reviewed the update on Collections & Recoveries
� Reviewed the update on the Loan Review Mechanism
� Reviewed work carried out by the Credit Committees, Credit and Market Risk Policy Committee by reviewing the decisions taken by each committee
Operational Risk
� Reviewed and approved the Operational Risk Policy
� Reviewed Operational Risk reports, including but not limited to:
� Significant Operational Risks, Incidents and Losses
� Key Risk Indicator breaches related to Human Resources, Information Technology, Finance, Compliance and Business lines
� Process changes initiated by Operational Risk as fraud prevention measures
� Impact of COVID-19 Timely actions taken against the major concerns identified due to COVID-19 by implementing initiatives to safeguard health and safety of staff and customers, tightening measures against potential cyber risk/ threats and arranging shift, split, roster and work from home options for critical and non-critical functions ensuring the business continuity
� Reviewed the proceedings of the Operational Risk Policy Committee including the decisions taken by the Committee
Market and Liquidity Risk
� Reviewed and approved the Bank’s policy framework, procedure guidelines, terms of references (TOR’s) for the management of Market and Liquidity Risk, to ensure the same is designed to facilitate the identification and assessment of the above risks and adequacy of controls
� Reviewed and approved the Market and Liquidity Risk limit framework based on the Strategic Initiatives, Balance sheet structure and the risk profile of the Bank to optimise business potential, particularly focusing on liquidity risk forecasts in view of the pandemic
� Reviewed exposures/information and monitored the effectiveness of the management of Market and Asset Liability Risk Management, including
� Strategies and other relevant issues related to financial market activities and business environment
� Financial position, forecasts and business performance
� Market/Liquidity risk analysis and stress testing
� Analysis of Asset Liability Committee (ALCO) reports and decisions taken by each committee and assessment of the effectiveness of the committees in line with TOR
� Review of Treasury Dealing Room, Market and Liquidity exposures/ compliance and exceptions
� Reviewed and forecasted the Bank’s liquidity position taking in to account the Central Bank of Sri Lanka tight monetary policy stance and its effects under different scenarios
� Reviewed the foreign currency Net Open Position and the impact of exchange rate movement under stress scenarios. Discussed in detail on the management of foreign currency position of the Bank
� Reviewed the impact of sovereign downgrading on managing foreign currency liquidity position with regard to contraction of money market lines with foreign counterparts, funding lines and the impact on International Sovereign Bond (ISB) portfolio of the Bank
Compliance
� Compliance function ensures that the compliance framework, policies and processes are designed to identify, manage, monitor and report non-compliances and to minimise potential for breaches, fines or penalties and to ensure that appropriate remedial action is taken to address instances of non-compliance
� Keeps abreast of any emerging regulatory developments and assessed the implications of the new regulations
� Assessed the Bank’s compliance with laws, regulations and regulatory obligations based on the Quarterly Compliance Report submitted to the Committee
� Reviewed and approved the Compliance Risk Management Policy and Framework which enables the Bank to identify, prioritise, and assign accountability for managing existing or potential compliance risks that could lead to fines, penalties or reputational damage
� Ensured effective implementation of governance-related policies at the Bank. Reviewed and approved the three governance related policies namely, Compliance Policy and Code of Conduct, Group Securities Trading Policy and the Group Anti-Bribery and Corruption Policy
� Reviewed and approved the Annual Compliance Programme work carried out
� Tracked the progress of action to be taken for supervisory concerns identified by CBSL and ensure timely completion of same
� Support the compliance and governance framework of the NDB subsidiaries by ensuring that policies, processes and procedures of the subsidiaries are aligned to that of the Bank and that compliance risks of the subsidiaries are effectively being managed
� A Quarterly Report on the compliance status is submitted to Board through the Committee
� Ensured adequate training programmes are conducted on regulatory requirements and the staff are well conversant with the regulations
INSIDE INSIGHT RISK MANAGEMENT & CORPORATE GOVERNANCE INTEGRATED RISK MANAGEMENT COMMITTEE REPORT
134 National Development Bank PLC Annual Report 2021

� Bank is aware of the new risks that emerged amidst the global pandemic. The Regulatory Compliance programme of the Bank has aligned itself to staying on top of key regulatory changes that have taken place during these unprecedented times. In the area of anti-money laundering compliance the Bank has intensified vigilance against new risks that emerged with the increase in non face-to-face activity and the use of digital banking channels
Legal Affairs (Litigation)
� Reviewed and monitored in detail the cases filed against the Bank in order to assess the risk. A detailed update of the cases filed against the Bank and other cases were discussed with the IRMC committee whilst updating the Committee on the probable outcome of such cases
� Reviewed and monitored the court cases filed by the Bank
� Reviewed and monitored other cases where the Bank is made a party such as partition, testamentary and winding up etc.
� Reviewed and monitored the progress on court cases below Rs. 5 Mn outsourced to two instructing law firms namely Shiranthi Gunawardene Associates and Sudath Perera Associates. It may be noted that the outsourced cases do not include the cases handled by the Recoveries and Collection Department which are cases on Personal Loans, Credit Cards, Pawning and Housing
� Reviewed and monitored the progress on parate actions and any issues faced
� Reviewed and monitored any other matters pertaining to the Legal Policy such as the Title Policy of the Bank
� Reviewed, discussed and updated on the latest laws relevant to litigation including the Coronavirus Act No 17 of 2021
� Appraised the IRMC of the latest cases in the industry which may have an adverse effect on Bank’s recovery process
Environment & Social Risk Management (ESRM)
� ESRM Policy was approved to be in line with the international best ESG practices including ESG requirements of Norfund and DFC USA. The ESRM Policy covers group companies as well
� The ESRM Manual and ESMS Framework was revised and improved in line with said ESRM policy
� Reviewed overall Environment & Social assessments carried out by Project Finance, Wholesale Banking and Business Banking - Middle Market at portfolio level and submitted quarterly updates to the IRMC
Others
� A Risk Heat Map was introduced and IRMC agenda was linked to same to further streamline Committee meetings
� The Committee reviewed the Key Risk Indicators of the Bank and Group Companies on a monthly basis through the monthly KRI statements and quarterly Risk Assessment Reports
� Reviewed and approved Annual Review of Internal Capital Adequacy Assessment Process (ICAAP) Document for 2021 considering the long-term strategy of the Bank and the impact of COVID-19 on the operating environment of the Bank. The Risk Appetite framework and Risk Tolerance limits were reviewed and adjusted by Committee considering the challenges in the operating environment. The risk levels of each material risk of the Bank and the mitigants in place were critically reviewed as part of the ICAAP review
� Reviewed/approved the Stress Testing Policy and Framework. Considering the changes in operating environment, a comprehensive review of its stress testing policy and framework was carried out where the adequacy of stress tests, frequency, shock levels and assumptions were critically reviewed and changes were incorporated to policy and framework as required. Reverse stress testing was also carried out to overcome a false sense of security that might arise from regular stress testing in which Bank may identify manageable impacts
� Reviewed and approved the Integrated Risk Management Framework, Risk Model Validation Policy and the Authorised Signatories for and on Behalf of the Bank
� Reviewed update on Technology Risk Resilience and Cyber Risk/IT Security
� Reviewed and recommended IT Security Policy Revision for 2021 and Strategic Risk Management Policy
� Reviewed and recommended the Revision to the Agent Selection Policy & Risk Management Framework and Revision to the Policy on Payment Related Mobile Applications relating to Digital Financial Services Unit
Mr. Sriyan Cooray Chairman Integrated Risk Management Committee
22 February 2022 Colombo
INSIDE INSIGHT RISK MANAGEMENT & CORPORATE GOVERNANCE INTEGRATED RISK MANAGEMENT COMMITTEE REPORT
135National Development Bank PLC Annual Report 2021

AUDIT COMMITTEE REPORT
COMPOSITION OF THE AUDIT COMMITTEE
The Board appointed Audit Committee comprised three Non-Executive Directors inclusive of the Chairman who is an Independent Director as set out below. As at 31 December 2021 the Committee comprised of the following;
Name of the Board Subcommittee Member Directorship Status Membership Status
Mr. Sujeewa Mudalige Independent Chairman
Mr. Sriyan Cooray Independent Member
Ms. Chandima Dilrukshi Non-Independent Member
Secretary to the Committee Ms. Ruwani de Silva – Vice President - Group Audit
Mr. Sujeewa Mudalige Chairman
CHARTER OF THE AUDIT COMMITTEE
The Charter of the Committee approved by the Board, clearly defines the Terms of Reference of the Committee and is periodically reviewed and revised with the concurrence of the Board of Directors. This process ensures that new developments relating to the Committee’s functions and concerns are adequately addressed. The Audit Committee Charter is reviewed and approved by the Board of Directors every two years or within this period where necessary.
Audit Committee assists the Board in the discharge of its responsibilities by exercising oversight over the Bank's financial reporting, internal controls, internal audit and external audit practices.
COMMITTEE MEETINGS
The Committee held six (06) meetings during the year under review. The attendance of committee members at meetings is stated in the table on page 120. The quorum for a meeting is three (03) members.
The proceedings of the Committee meetings have been regularly reported to the Board of Directors.
Vice President Group Audit, Chief Executive Officer (CEO), Vice President Finance and the Bank’s External Auditors attended all meetings on invitation. The Committee also invited members of the Senior Management of the Bank to participate in the meetings from time to time on a need basis.
METHODOLOGY USED BY THE COMMITTEE
The Committee functions are structured and regulated in accordance with the guidelines issued in the Banking Act Direction No.11 of 2007 on “Corporate Governance for Licensed Commercial Banks in Sri Lanka” and its subsequent amendments (hereinafter referred to as the Direction), “Rules on Corporate Governance under Listing Rules of the Colombo Stock Exchange” and “Code of Best Practice on Corporate Governance” issued jointly by The Institute of Chartered Accountants of Sri Lanka (CASL) and the Securities and Exchange Commission of Sri Lanka (SEC).
The committee is empowered by the Board to:
� Review the Interim Financial Statements and the Bank’s Annual Financial Statements in order to monitor the integrity of such statements prepared for disclosure, prior to submission to the Board of Directors.
� Examine any matter relating to the financial and other connected affairs of the Bank.
� Ensure that efficient and sound financial reporting systems are in place and are well managed in order to provide accurate, appropriate and timely information to the Board of Directors, Regulatory Authorities, the Management and Other Stakeholders.
� Ensure the Bank has adopted and adhere to policies which firmly commits the Bank to achieve the highest standards of good corporate governance practice.
� Review the quality and the appropriateness of Accounting policies and their adherence to statutory and regulatory compliance requirements and applicable Accounting Standards.
� Review the outcome of the annual Risk Assessment Process and Internal Audit plan assessing independence and performance of the Internal Audit function.
� Review internal audit reports and liaising with Management in taking precautionary measures to minimise control weaknesses, procedure violations, frauds and errors.
� Review External Audit Management Letter and Statutory inspection reports in relation to matters under Audit Committee purview and follow up on their findings and recommendations.
SUMMARY OF ACTIVITIES IN 2021
Response to COVID-19
In its role overseeing financial reporting risk, audit committee had discussions with senior management to understand how the Bank is evaluating the effects of COVID-19 on the business operations including the impact due to moratoriums and concessions granted to lenders and the way people work including working from home, and whether those effects trigger an event-driven reassessment of business risk, control risk and the effectiveness of the related controls. BAC also looked at the appropriateness of the disclosure made in the Financial statements relating to same.
INSIDE INSIGHT RISK MANAGEMENT & CORPORATE GOVERNANCE
136 National Development Bank PLC Annual Report 2021

The audit committee made it a priority to understand if the impact of the disruptions caused by the pandemic were discussed with management, the changes required to their internal audit annual plan and determined if it is still fit for purpose. The committee also focussed on ways to optimise internal audit’s contributions during the pandemic.
While the current environment has changed the way in which the external auditor is conducting its planning, interim reviews and audit procedures, as well as the way in which they engage with management, the audit committee’s responsibility for oversight of the external auditor has not changed. The committee had discussions to understand the external auditor’s perspective regarding potential changes in audit risk, management’s process for developing significant estimates related to the impact of COVID-19 and the related impacts on internal control over financial reporting.
Reporting of Financial Position and Performance
The Committee assists the Board to discharge their responsibility in the preparation of Financial Statements that evidence a true and fair view on the financial position and performance in accordance with the Bank’s accounting records and as per the stipulated requirements of the Sri Lanka Accounting Standards and other regulatory requirements. In fulfilling its oversight responsibilities, the Committee reviews;
� The adequacy and effectiveness of the Internal Controls, Systems and Procedures over Financial Reporting.
� The effectiveness of the Financial Reporting Systems in place to ensure reliability of the information provided to the stakeholders.
� The Bank’s Financial Statements, Accounting Policies and practices and reasonableness of the underlying assumptions for estimates and judgments made in preparing the Financial Statements.
� The Tax Assessments outstanding and action initiated for resolution through regular reports submitted by Vice President - Finance.
� The processes by which compliance with Sri Lanka Accounting Standards (SLFRS/LKAS) and other regulatory provisions relating to financial reporting and disclosures are ensured.
� The Annual Report and Accounts, and the Interim Financial Statements prepared for publication together with the press releases prior to submission to the Board.
Compliance with the Revised Sri Lanka Accounting Standards
During the year the Audit Committee placed additional focus on the assessment of adequacy of provision for Expected Credit Loss (ECL) recognised in the Financial statements based on the internal models, management overlay computed based on stress testing, the exposures to risk elevated sectors, to address the potential implications of the COVID-19 Pandemic and the moratorium schemes introduced to support the recovery of the economy.
Further a separate team from our External Audit Firm conducted an awareness session in the fourth quarter on the important industry updates in accounting standards and regulations to keep the Committee members abreast of the new developments.
Mechanism of Internal Controls
During the year, the Committee reviewed the effectiveness of the Bank’s Internal Control System and the CEO’s quarterly confirmation on the internal control environment, derived through the Operational Risk process which supports strengthening the Second Line of Defence of the Bank.
Additionally, the Committee assessed the effectiveness of the Bank’s internal controls over financial reporting as of 31 December 2021, as required by the Banking Act Direction No.11 of 2007 (as amended), Corporate Governance for Licensed Commercial Banks in Sri Lanka, Subsection 3(8) (ii) (b), based on the “Guidance for Directors of Banks on the Directors’ Statement on Internal Control” issued by The Institute of Chartered Accountants of Sri Lanka. The result of the assessment is given on page 146 to 147, in the “Directors’ Statement on Internal Control over Financial Reporting in the Annual Report. The External Auditors have also issued an Assurance Report on the Directors’ Statement on Internal Controls. The report is given on page 149 of the Annual Report.
The Committee also regularly reviews the Internal Control Procedures in place to ensure that necessary control and mitigating measures are available in respect of newly identified risks.
Group Audit
The Committee ensures that the Internal Audit Function is independent of the activities it audits and that the audits are performed with impartiality, proficiency and due professional care.
The Vice President Group Audit reports directly to the Board Audit Committee.
The Bank has adopted a risk-based audit methodology and audit approach. The Audit universe consists of all Auditable Areas/processes of the banking group, which are audited annually based on a risk based audit plan approved by the BAC.
A risk grading matrix has been adopted for assessing and measuring the risks identified during audit assignments carried out by the Group Audit.
The Audit Committee reviewed the findings along with the management action plans of the audits completed and their evaluation of the Bank’s internal control systems. The Committee also reviewed the coverage including the action plans given to address the issues and the implementation status.
Due to the COVID-19 global pandemic situation, time to time disruptions on continuous operations were experienced. Despite the pandemic situation the Group Audit managed to complete the audit plan for the year with minimal changes as agreed with the Audit Committee. During the lockdown period Group Audit concentrated on high risk areas through offsite audits to ensure the Bank’s internal controls, Policies and procedures are adhered to and the findings were discussed with the Audit Committee.
Major findings of internal investigations with recommendations of the Management were discussed by the Committee in detail.
The Committee also met with the Vice President Group Audit in the absence of the Management to ensure independence of the Group Audits operations.
The Audit Committee reviewed the independence, objectivity & performance of the Group Audit function and the adequacy of its resources. The Audit Committee also evaluated the performance of Vice President Group Audit and reviewed the performance of the senior staff members of the Group Audit function.
Group Audit Charter and Audit Manual
The Group Audit function is governed by the Group Audit Charter which defines the mission, authority, responsibility, independence, reporting, commitment and access in order to assist Group Audit to discharge its function independently. The Group Audit Charter and the Audit Manual were revised and approved in May 2021, by the Board.
INSIDE INSIGHT RISK MANAGEMENT & CORPORATE GOVERNANCE AUDIT COMMITTEE REPORT
137National Development Bank PLC Annual Report 2021

External Audit
The Audit Committee undertook the annual evaluation of the independence and objectivity of the External Auditor and the effectiveness of the audit process.
During the audit, the External Auditor presented to the Committee their audit approach and procedures, including matters relating to the scope of the audit and Auditor’s independence.
The Committee reviewed the audited Financial Statements with the External Auditor responsible for expressing an opinion on its conformity with the Sri Lanka Accounting Standards and discussed in detail the action taken by the Management with regard to the Key Audit Matters raised by the Auditors.
The Committee also reviewed the Management Letter issued by the External Auditor and the management responses thereto.
The Audit Committee met the External Auditors twice (2) during the year, without the presence of CEO and the Corporate Management, to ensure that the Auditors had the independence to discuss any concerns and express their opinions on any matter and also for the Committee to have the assurance that the Management provided all information and explanations requested by the Auditors.
The Audit Committee was of the view that the Non-Audit Services provided by the External Auditor were not within the category of services identified as prohibited under:
1. The guidelines issued by the Central Bank of Sri Lanka for External Auditors, relating to their statutory duties in terms of Section 39 of Banking Act No.30 of 1988 and amendments thereto.
2. The guidelines for Listed Companies on Audit and Audit Committees issued by the Securities and Exchange Commission of Sri Lanka.
In carrying out the overseeing responsibilities, the Committee adopted the overview principles of the Basel Committee on Banking Supervision on External Audits of the Banks, issued in March 2014.
Re-appointment of External Auditor
The Audit Committee performed an evaluation of the External Auditor based on certain defined criteria and recommended to the Board of Directors that Messrs. Ernst and Young, Chartered Accountants, to be re-appointed for the financial year ending 31 December 2022 subject to the approval of the shareholders at the next Annual General Meeting.
Oversight on Regulatory Compliance
The Group Audit performed verifications covering mandatory banking and other statutory requirements during their process audits ensuring that systems and procedures are in place to ensure compliance with such requirements.
Good Governance and Whistle Blowing
The Bank’s Whistle blowing Policy was reviewed and amended in November 2021 in order to further strengthen the policy. The Policy is intended to serve as a channel of corporate fraud risk management. The policy will educate and encourage any team member who has a legitimate concern on an existing or potential “wrong doing”, done by any person within the Bank, to come forward voluntarily, and bring such concern to the notice of an independent designated authority. All appropriate procedures were in place to conduct independent investigations into incidents reported through whistle-blowing. The Whistle blowing Policy guarantees the maintenance of strict confidentiality of the identity of the whistle- blowers.
During the year the Bank established an external informational mechanism, known as the “NDB Ombudsman” to further strengthen the whistle blowing mechanism. Further to encourage employees to communicate information in a convenient and a secure way, Bank also introduced a feature in the staff Intranet.
EVALUATION OF THE AUDIT COMMITTEE
The Audit Committee carried out a formal self-evaluation/appraisal on the effectiveness of the Committee and reported the results of the same to the other members of the Board. The Board concurred that the Committee had carried out its responsibilities in an effective and satisfactory manner.
APPRECIATION
The Committee wishes to convey its gratitude to former members; Dr. Dinusha Panditaratne and Ms. Hiransa Kaluthantri, who resigned during the year 2021, for their valuable contributions.
Mr. Sujeewa Mudalige Chairman Audit Committee
22 February 2022 Colombo
INSIDE INSIGHT RISK MANAGEMENT & CORPORATE GOVERNANCE AUDIT COMMITTEE REPORT
138 National Development Bank PLC Annual Report 2021

RELATED PARTY TRANSACTIONS REVIEW COMMITTEE REPORT
COMPOSITION OF THE RELATED PARTY TRANSACTION REVIEW COMMITTEE
The Board appointed Related Party Transaction Review Committee comprised four Non-Executive Directors inclusive of the Chairman who is an Independent Director as set out below. The Chief Executive Officer (CEO) has been present at meetings only if invited by the Committee.
As at 31 December 2021 the Committee comprised of the following;
Name of the Board Subcommittee Member Directorship Status Membership Status
Mr. Eshana de Silva Independent Chairman
Mr. Sujeewa Mudalige Independent Member
Mr. Kushan D’Alwis, PC Independent Member
Ms. Chandima Dilrukshi Non-Independent Member
Mr. Dimantha Seneviratne Non-Independent By Invitation
Secretary to the Committee Ms. Shehani Ranasinghe - Company Secretary
Mr. Eshana de Silva Chairman
CHARTER OF THE RELATED PARTY TRANSACTION REVIEW COMMITTEE
The Board of Directors of the Bank constituted a Related Party Transactions Review Committee voluntarily in December 2014 further to the provisions contained in Section 9 of the Listing Rules of the Colombo Stock Exchange (CSE) so as to ensure compliance with the Rules pertaining to Related Party Transactions as set out in the Listing Rules of the CSE, which required mandatory compliance from 01 January 2016. The composition and the scope of work of the Committee are in conformity with the said Rules.
The Terms of Reference (TOR) of the Related Party Transactions Review Committee was approved by the Board of Directors and is reviewed annually. As part of the annual review process, the Committee reviewed the TOR in June 2021 recommending certain changes to better align the TOR with the relevant provisions of the Listing Rules of the CSE and to clear ambiguities in same.
The primary objective of the Committee is to assess and consider all transactions with related parties of the Bank in line with the Listing Rules on Related Party Transactions of the CSE, in order to ensure that related parties are treated on par with other shareholders and constituents of the Bank.
The Committee carries out the following duties and responsibilities:
� Reviewing to evaluate and to determine the advisability of any Related Party Transaction except for transactions set out in Rule 9.5 of the CSE Listing Rules, that require consideration by the Committee under the Related Party Policy of the Bank.
� Approving or rejecting Related Party Transactions upon the required internal approvals being obtained.
� Determining whether the relevant Related Party Transaction is fair to, and in the best interests of, the Bank and its stakeholders; and
� Recommending to the full Board what action, if any, should be taken by the Board with respect to any Related Party Transaction.
� Recommending to the full Board where necessary that the approval of the shareholders of the Bank be obtained by way of a Special Resolution prior to the concerned transaction being entered into as specified in Section 9.1 and 9.4 of the Listing Rules, where necessary.
COMMITTEE MEETINGS
Despite the pandemic situation in the Country, the Committee held four (04) meetings during the year under review. The attendance of committee members at meetings is stated in the table on page 120. The quorum for a meeting is three (03) members.
The proceedings of the Committee meetings have been regularly reported to the Board of Directors. The Board of Directors take due consideration of the comments/observations made by the Committee and the approvals granted by the Committee for Related Party Transactions.
METHODOLOGY USED BY THE COMMITTEE
The Committee is guided by the Listing Rules of the CSE pertaining to Related Party Transactions and by/as reflected in the TOR of the Committee. It also takes into consideration the Board approved Related Party Transaction Policy when reviewing the transactions and takes into consideration the Related Party’s relationship to the Bank and interest in the transaction, the material facts of the proposed transaction including the aggregate value of the same, the benefits to the Bank of the proposed transaction, the availability of other sources of comparable products or services and further carries out an assessment of whether the proposed Related Party Transaction is on terms generally available to an unaffiliated third party under the same or similar circumstances.
In carrying out the duties of the Committee, the Committee avoids ‘conflicts of interest’ which may arise from any transaction of the Bank with any person, particularly with related parties and ensures arm’s length dealings with related parties whilst also ensuring adherence to the Corporate Governance Directions of
INSIDE INSIGHT RISK MANAGEMENT & CORPORATE GOVERNANCE
139National Development Bank PLC Annual Report 2021

the Banking Act which requires the Bank to avoid engaging in transactions with related parties in a manner that would grant such parties ‘more favourable treatment’ than accorded to other constituents of the Bank carrying on the same business, in line with the security requirements as stated in the Banking Act Directions and in compliance with the approval procedure set out in the Banking Act.
SUMMARY OF ACTIVITIES IN 2021
During the year the Committee approved/ratified transactions relating to the procurement of services carried out by the Bank with various related parties on an ‘arms-length’ basis. This included in depth deliberations to ensure that where transactions with related parties were approved, same did not take place on more favourable terms. Some of the transactions reviewed included obtaining expert services from group companies and other related parties of the Bank on an arm’s length basis. Recommendations were also made to improve/strengthen processes when transactions with related parties are contemplated.
The Committee reviewed the Related Party Transactions Policy of the Bank recommending changes thereto including the strengthening of the identification process of related parties and transactions at the Bank with a view to ensuring due arms’ length process.
The Committee reviewed Related Party Transactions of the Bank during the period of 01 January 2021 to 31 December 2021 and has thus complied with the rules pertaining to Related Party Transactions as set out in Section 9 of the Listing Rules of the CSE. The Bank has not entered into any transactions as contemplated in Section 9.1.1 and 9.1.2 of the Listing Rules of the CSE and accordingly there are no disclosures to be made in this regard in accordance with Section 9.3.2 (a) and 9.3.2 (b) of the Listing Rules of the CSE.
The Committee records its appreciation to Dr. Dinusha Panditaratne for all her contribution during her tenure on the Committee until her resignation during the year 2021.
Mr. Eshana de Silva Chairman Related Party Transactions Review Committee
22 February 2022 Colombo
INSIDE INSIGHT RISK MANAGEMENT & CORPORATE GOVERNANCE RELATED PARTY TRANSACTIONS REVIEW COMMITTEE REPORT
140 National Development Bank PLC Annual Report 2021

STRATEGIC ISSUES COMMITTEE REPORT
COMPOSITION OF THE STRATEGIC ISSUES COMMITTEE
The Board appointed Strategic Issues Committee comprised five Non-Executive Directors inclusive of the Chairman who is an Independent Director and also includes the Chief Executive Officer (CEO). Other Directors and Members of the Management Team attend meetings upon invitation by the Committee.
As at 31 December 2021 the Committee comprised the following;
Name of the Board Subcommittee Member Directorship Status Membership Status
Mr. Eshana de Silva Independent Chairman
Mr. Bernard Sinniah Non-Independent Member
Mr. Sriyan Cooray Independent Member
Mr. Sujeewa Mudalige Independent Member
Ms. (Fay) Piyachatr Chetnakarnkul Non-Independent Member
Mr. Dimantha Seneviratne Non-Independent Member
Secretary to the Committee Ms. Shehani Ranasinghe - Company Secretary
CHARTER OF THE STRATEGIC ISSUES COMMITTEE REPORT
With the formation of the Strategic Issues Committee as a Board sub-committee, its Charter has been approved by the Board and is reviewed annually. Accordingly, the Committee reviewed the Charter in December 2021 with amendments being made with regard to strategic processes and duties and responsibilities of the Committee.
The Committee carries out the following duties and responsibilities:
� Providing the strategic direction and strategic thinking of the Board to the management in the development and implementation of the Bank’s strategic plan.
� Developing the Bank’s strategy and its implementation together with the management.
� Reviewing and assessing the formulation and implementation of strategic plans developed by the management and approved by the Board.
� Guiding and assisting the management in implementing strategic decisions taken by the Board.
� Making recommendations regarding strategic capital allocation and reviewing proposals for raising of funds as submitted by the management and making recommendations/suggestions in that respect to the Board
� Reviewing and evaluating strategic issues and plans of subsidiary companies of the NDB Group to ensure that the same are in line with the strategic initiatives and strategic direction of the Bank with a view to optimising the NDB Group’s operational effectiveness.
� The Committee is responsible for determining the following decisions:
� Approving of all strategic investments and divestments and recommending the same to the Board (i.e. - assess new business proposals including acquisitions/joint ventures and make appropriate recommendations).
� Approving the periodical Strategic Plan (covering 3-5 years or more) and recommending the same to the Board.
� Approving any significant amendments to the existing Strategic Plan and recommending the same to the Board.
� Reviewing and recommending the annual business plan, budget and capital structure of the Bank before onward submission to the Board for approval.
� Reviewing of NDB Bank’s strategic investments including its investments in subsidiaries in relation to performance and returns on such investments, at least on an annual basis with a view to recommending to the Board any necessary action related to such investments.
COMMITTEE MEETINGS
Despite the pandemic situation in the Country, the Committee held two (02) meetings during the year under review. The attendance of committee members at meetings is stated in the table on page 120. The quorum for a meeting is three (03) members.
A further subcommittee formed by the Board, primarily consisting of members of the Committee, has been empowered to evaluate and recommend identified inorganic as well as alternate investment avenues to the Board. In carrying out its task, this subcommittee has met six (06) times in 2021.
The proceedings of the Committee meetings and of the subcommittee meetings have been regularly reported to the Board of Directors.
METHODOLOGY USED BY THE COMMITTEE
The Committee meets as and when necessary in order to, inter alia; deliberate in detail on matters of strategic importance to the Bank and the NDB Group so as to advise the Board in a timely manner. The Committee meets to examine and evaluate any strategic issues that may arise and further to evaluate any changes to strategic plans/decisions already in place, as well as to conduct such other affairs which the Charter of the Committee mandates the Committee to carry out.
SUMMARY OF ACTIVITIES IN 2021
The Committee (as well as the focused subcommittee formed in 2021) engaged in in-depth evaluation of inorganic as well as alternate investment avenues for the Bank as recommended by the management. In these deliberations, independent opinions and views and guidance of experts have also been sought and obtained with a view to ensuring that sound recommendations are and can be made to the Board.
The Committee also considered the Budget for the year 2022 in line with the revised Strategic plan of the Bank for the period 2022-2025, the current economic landscape including the unprecedented challenges posed by the continuing pandemic situation, the capital requirements for the Bank in line with current regulations etc and recommended the Budget 2022 to the Board for approval.
Mr. Eshana de Silva Chairman Strategic Issues Committee
22 February 2022 Colombo
INSIDE INSIGHT RISK MANAGEMENT & CORPORATE GOVERNANCE
Mr. Eshana de Silva Chairman
141National Development Bank PLC Annual Report 2021
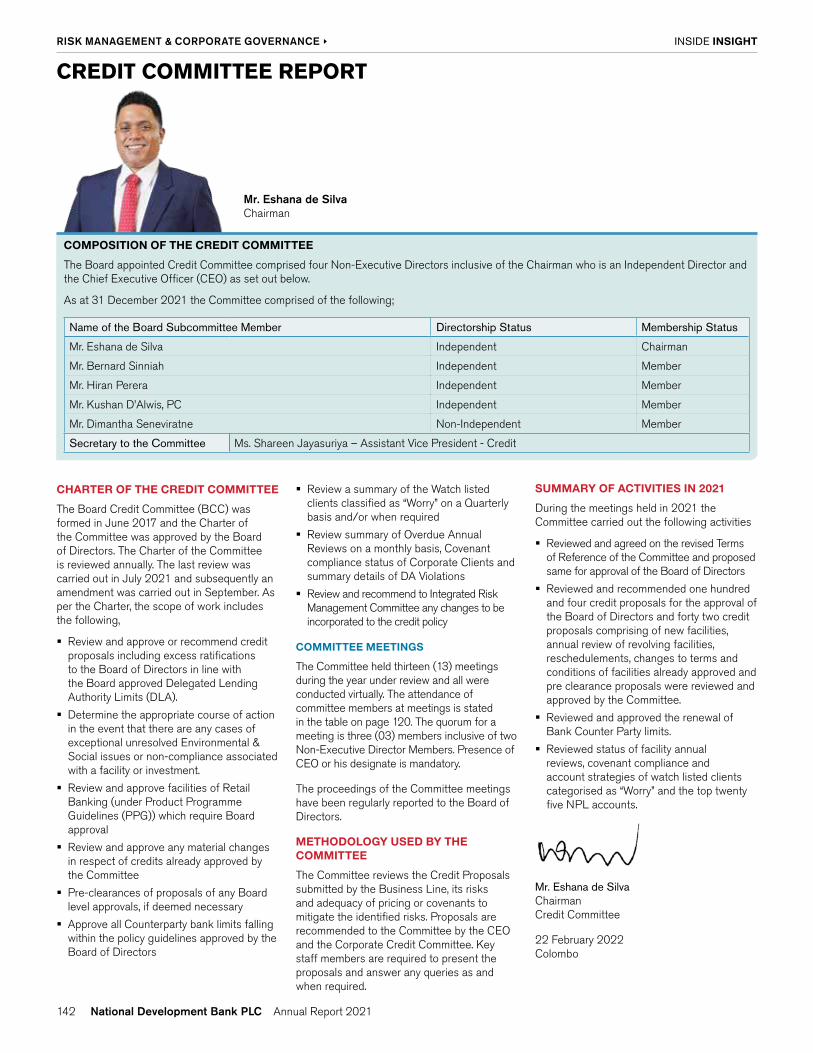
CREDIT COMMITTEE REPORT
COMPOSITION OF THE CREDIT COMMITTEE
The Board appointed Credit Committee comprised four Non-Executive Directors inclusive of the Chairman who is an Independent Director and the Chief Executive Officer (CEO) as set out below.
As at 31 December 2021 the Committee comprised of the following;
Name of the Board Subcommittee Member Directorship Status Membership Status
Mr. Eshana de Silva Independent Chairman
Mr. Bernard Sinniah Independent Member
Mr. Hiran Perera Independent Member
Mr. Kushan D’Alwis, PC Independent Member
Mr. Dimantha Seneviratne Non-Independent Member
Secretary to the Committee Ms. Shareen Jayasuriya – Assistant Vice President - Credit
CHARTER OF THE CREDIT COMMITTEE
The Board Credit Committee (BCC) was formed in June 2017 and the Charter of the Committee was approved by the Board of Directors. The Charter of the Committee is reviewed annually. The last review was carried out in July 2021 and subsequently an amendment was carried out in September. As per the Charter, the scope of work includes the following,
� Review and approve or recommend credit proposals including excess ratifications to the Board of Directors in line with the Board approved Delegated Lending Authority Limits (DLA).
� Determine the appropriate course of action in the event that there are any cases of exceptional unresolved Environmental & Social issues or non-compliance associated with a facility or investment.
� Review and approve facilities of Retail Banking (under Product Programme Guidelines (PPG)) which require Board approval
� Review and approve any material changes in respect of credits already approved by the Committee
� Pre-clearances of proposals of any Board level approvals, if deemed necessary
� Approve all Counterparty bank limits falling within the policy guidelines approved by the Board of Directors
� Review a summary of the Watch listed clients classified as “Worry” on a Quarterly basis and/or when required
� Review summary of Overdue Annual Reviews on a monthly basis, Covenant compliance status of Corporate Clients and summary details of DA Violations
� Review and recommend to Integrated Risk Management Committee any changes to be incorporated to the credit policy
COMMITTEE MEETINGS
The Committee held thirteen (13) meetings during the year under review and all were conducted virtually. The attendance of committee members at meetings is stated in the table on page 120. The quorum for a meeting is three (03) members inclusive of two Non-Executive Director Members. Presence of CEO or his designate is mandatory.
The proceedings of the Committee meetings have been regularly reported to the Board of Directors.
METHODOLOGY USED BY THE COMMITTEE
The Committee reviews the Credit Proposals submitted by the Business Line, its risks and adequacy of pricing or covenants to mitigate the identified risks. Proposals are recommended to the Committee by the CEO and the Corporate Credit Committee. Key staff members are required to present the proposals and answer any queries as and when required.
SUMMARY OF ACTIVITIES IN 2021
During the meetings held in 2021 the Committee carried out the following activities
� Reviewed and agreed on the revised Terms of Reference of the Committee and proposed same for approval of the Board of Directors
� Reviewed and recommended one hundred and four credit proposals for the approval of the Board of Directors and forty two credit proposals comprising of new facilities, annual review of revolving facilities, reschedulements, changes to terms and conditions of facilities already approved and pre clearance proposals were reviewed and approved by the Committee.
� Reviewed and approved the renewal of Bank Counter Party limits.
� Reviewed status of facility annual reviews, covenant compliance and account strategies of watch listed clients categorised as “Worry” and the top twenty five NPL accounts.
Mr. Eshana de Silva Chairman Credit Committee
22 February 2022 Colombo
Mr. Eshana de Silva Chairman
INSIDE INSIGHT RISK MANAGEMENT & CORPORATE GOVERNANCE
142 National Development Bank PLC Annual Report 2021

DIGITAL TRANSFORMATION COMMITTEE REPORT
COMPOSITION OF THE DIGITAL TRANSFORMATION COMMITTEE
The Board appointed Digital Transformation Committee (DTC) was formed in 2021 comprised four Non-Executive Directors inclusive of the Chairman who is an Independent Director, the Chief Executive Officer (CEO) and members of the senior management as set out below.
As at 31 December 2021 the Committee comprised the following;
Name of the Board Subcommittee Member Directorship Status
Membership Status
Mr. Bernard Sinniah Non-Independent Chairman
Mr. Sujeewa Mudalige Independent Member
Mr. Hiran Perera Non-Independent Member
Ms. (Fay) Piyachatr Chetnakarnkul Non-Independent Member
Mr. Dimantha Seneviratne (Chief Executive Officer) Non-Independent Member
Mr. Deepal Akuretiyagama (Chief Operating Officer) Non-Director Member
Mr. Sanjaya Perera (Senior Vice President - Personal Banking, and Customer Experience)
Non-Director Member
Mr. Niran Mahawatte (Vice President – Treasury) Non-Director Member
Mr. Indika Ranaweera (Vice President - SME, Middle Market & Business Banking)
Non-Director Member
Mr. K. V. Vinoj (Vice President - Wholesale Banking) Non-Director Member
Mr. Indika Gunawardena (Vice President/Chief Information Officer)
Non-Director Member
Mr. Damitha Silva (Assistant Vice President – Digital Financial Services)
Non-Director Member
Mr. Deepa Edirisooriya (Chief Manager – Digital Financial Services)
Non-Director Member
Secretary to the Committee Mr. Deepa Edirisooriya (Chief Manager – Digital Financial Services)
Mr. Bernard Sinniah Chairman
CHARTER OF THE DIGITAL TRANSFORMATION COMMITTEE
The objective of the DTC is to formulate and provide oversight on the Bank’s digitalisation strategy, ensuring its alignment to Bank’s overall business strategy – Voyage 2025, in driving customer centricity, enhancing the customer experience and generating operational efficiencies across all business verticals.
COMMITTEE MEETINGS
The Committee held five (05) meetings during the year under review. The attendance of committee members at meetings is stated in the table on page 120.
The proceedings of the Committee meetings have been regularly reported to the Board of Directors.
Vice President Branch Network Management & Product Development and the Chief Executive Officer of NDB Capital Holdings Limited participate in the meetings from time to time on a needs basis.
SUMMARY OF ACTIVITIES IN 2021
A Digital Roadmap was formulated in 2021 to achieve the Bank’s aspirations, taking into consideration customer expectations, emerging technologies, gaps in the current offerings and investments required to build a future-fit business model.
A member of the management was appointed as the Digital Czar, tasked with the responsibility of coordinating between the business lines of the Bank and the DTC in implementing the digitalisation strategy which
centres on providing lifestyle banking solutions through a single seamless delivery channel. This includes mobile and online banking, stock trading, news alerts, appointment management, personal finance management, financial advice, relationship management and portfolio management.
A panel discussion-based webinar titled ‘ Dialect’ was conducted in June 2021 with the objectives of creating employee awareness on the Bank’s digitalisation drive, providing a platform for employees to raise queries on the Bank’s digitalisation roadmap and proposing new ideas and suggestions to further enhance the road map planned.
In addition to creating a digital mind-set among staff, in depth discussions were conducted with the main business lines, Corporate Banking, Treasury, Retail, Business Banking, Wealth Management, Securities, Project Finance, Data Analytics and Legal to identify their requirements and aspirations. Through this engagement process over 100 requirements were identified and these were presented to the DTC by the business heads. The DTC also identified the vital need of empowering decision makers with access to real time data analytics, which in turn would enrich decision making and lead to improved outcomes.
WAY FORWARD
With a strong foundation to drive the Bank’s digitalisation road map, 2022 and beyond will out of witness the rolling out efforts to create a tech-friendly culture across the Bank and the execution of this roadmap, with cross-functional participation and collective responsibility. Active participation from all units of the Bank will be encouraged and the Bank’s KPIs will be formulated to capture the achievement of digitalisation targets, focusing on the following key objectives linked to the Bank’s Voyage 2025 strategey:
� Better client experience aligned to customer-centricity
� Better operational efficiency
� Better data analytics and intelligence
Mr. Bernard Sinniah Chairman Digital Transformation Committee
22 February 2022 Colombo
INSIDE INSIGHT RISK MANAGEMENT & CORPORATE GOVERNANCE
143National Development Bank PLC Annual Report 2021

STATEMENT OF DIRECTORS’ RESPONSIBILITIES FOR FINANCIAL REPORTING
This statement sets out the responsibility of the Directors in relation to the Financial Statements of National Development Bank PLC (the Bank) and the Consolidated Financial Statements of the Bank and its subsidiaries (the Group). The Directors are required by relevant statutory provisions to prepare and table at a General Meeting of the Bank, such Financial Statements as may be necessary, which give a true and fair view of the state of affairs of the Bank and the Group.
It is also the responsibility of the Directors to ensure that the Bank maintains proper accounting records and to take reasonable steps as far as practical to ensure the accuracy and reliability of accounting records and to prepare Financial Statements using appropriate Accounting Policies applied consistently and supported by reasonable and prudent judgment and estimates in compliance with the Sri Lanka Accounting Standards (SLFRS/LKAS), the Banking Act No. 30 of 1988 (as amended), the Companies Act No. 7 of 2007 and the Listing Rules of the Colombo Stock Exchange. Changes in the Accounting Policies where applicable and the rationale for the changes have been disclosed in the ‘Notes to the Financial Statements’.
Accordingly the Directors confirm that the Financial Statements of the Bank and the Group give a true and fair view of:
a) the financial position of the Bank and the Group as at the reporting date; and
(b) the financial performance of the Bank and the Group for the financial year ended on the reporting date.
The Financial Statements of the Bank and the Group have been certified by the Vice President - Finance of the Bank, the officer responsible for their preparation, as required by the Companies Act. In addition, the Financial Statements of the Bank and the Group have been signed by two Directors and the Company Secretary of the Bank on 22 February 2022 as required by the Companies Act and other regulatory requirements. The Directors are also responsible for ensuring that proper accounting records which correctly record and explain the Bank’s transactions are maintained and that the Bank’s financial position, with reasonable accuracy, at any point of time is determined by the Bank, enabling preparation of the Financial Statements, in accordance with the Companies Act to facilitate proper audit of the Financial Statements.
The Financial Statements for the year 2021, prepared and presented in this Annual Report have been prepared in compliance with the requirements of the Sri Lanka Accounting Standards (SLFRS/LKAS), Companies Act No. 7 of 2007 (as amended), Sri Lanka Accounting and Auditing Standards Act No. 15 of 1995, Banking Act No. 30 of 1988 and amendments thereto, the Listing Rules of the Colombo Stock Exchange and the Code of Best Practice on Corporate Governance issued jointly by the Institute of Chartered Accountants of Sri Lanka (CA Sri Lanka) and the Securities and Exchange Commission of Sri Lanka (SEC). The Bank and Group has also complied with the Directions/Guidelines issued by the Central Bank of Sri Lanka in the preparation of the Financial Statements.
The significant accounting policies and estimates that involved a high degree of judgment and complexity were discussed with the Board Audit Committee and external auditors.
In addition, these Financial Statements comply with the prescribed format issued by the Central Bank of Sri Lanka on 18 January 2019 for publication of annual and quarterly Financial Statements and other disclosures by the licensed banks.
The Directors have been responsible for taking reasonable measures and care to safeguard the assets of the Bank and the Group and to prevent and detect frauds and other irregularities. The Directors have instituted an effective and comprehensive system of internal controls and an effective system of monitoring its effectiveness, internal audit being one of them. The Directors’ Statement on Internal Control over Financial Reporting is given on pages 146 and 147 of this Annual Report. The Board has been provided additional assurance on the reliability of the Financial Statements through a process of independent and objective review performed by the Board Audit Committee. Please refer the Board Audit Committee Report on pages 136 to 138 of this Report.
Messrs Ernst & Young, Chartered Accountants, who were appointed in terms of the Companies Act No. 7 of 2007 and in accordance with a resolution passed at the last Annual General Meeting, have been made available with all records of the Bank including the Financial Statements by the Board of Directors and provided every opportunity to
undertake the inspections they considered appropriate, all of which they have examined and have expressed their opinion which appears as reported by them on page 156 of this Report.
The Board of Directors accepts responsibility for the integrity and objectivity of the Financial Statements presented in this Annual Report. The Directors confirm that in preparing the Financial Statements exhibited on pages 150 to 288 including, appropriate Accounting policies have been applied on a consistent basis, and where necessary changes to accounting policies have been made with adequate disclosures while reasonable and prudent judgments have been made so that the form and substance of transactions are properly reflected.
The Board of Directors wishes to confirm that, as required by the Section 56 (2) of the Companies Act No. 7 of 2007 (as amended), they have authorised distribution of the dividends paid upon being satisfied that the Bank would satisfy the solvency test after such distributions are made in accordance with the Section 57 of the Companies Act No. 7 of 2007 and have obtained in respect of dividends paid, necessary certificates of solvency from the External Auditors.
The Board of Directors also wishes to confirm that, as required by Sections 166 (1) and 167 (1) of the Companies Act, they have prepared this Annual Report in time and ensured that a copy thereof is sent to every Shareholder and Debenture holder of the Bank, who have expressed desire to receive a printed copy or to other Shareholders and Debenture holders a soft copy each shared by way of a link containing the Annual Report within the stipulated period of time as required by the Rule No. 7.5 (a) and (b) of Continuing Listing Requirements of the Listing Rules of the Colombo Stock Exchange. The Directors also wish to confirm that all Shareholders have been treated equitably in accordance with the original terms of issue.
Further, the Board of Directors wishes to confirm that the Bank has met all the requirements under the Section 07 on Continuing Listing Requirements of the Listing Rules of the Colombo Stock Exchange and other regulations, laws and internal controls and there were no material non-compliances.
INSIDE INSIGHT RISK MANAGEMENT & CORPORATE GOVERNANCE
144 National Development Bank PLC Annual Report 2021

COMPLIANCE REPORT
The Directors confirm that to the best of their knowledge, all taxes, duties and levies payable by the Bank and the Group, all contributions, levies and taxes payable on behalf of and in respect of the employees of the Bank and the Group, and all other known statutory dues as were due and payable by the Bank and the Group as at the reporting date have been paid or, where relevant, provided for, except as specified in Note 48.3 to the Financial Statements on ‘Litigation Against the Bank’ on page 240. The Directors further confirm that after considering the financial position, operating conditions, regulatory and other factors and such matters required to be addressed in the ‘Code on Corporate Governance’ issued jointly by the Institute of Chartered Accountants of Sri Lanka (CA Sri Lanka) and the Securities and Exchange Commission of Sri Lanka (SEC), the Directors have a reasonable expectation that the Bank and the Group possess adequate resources to continue in operation for the foreseeable future. For this reason, we continue to adopt the going concern basis in preparing the Financial Statements. The Directors are of the view that they have discharged their responsibilities as set out in this Statement.
By Order of the Board
Ms. Shehani Ranasinghe Company Secretary
22 February 2022 Colombo
INSIDE INSIGHT RISK MANAGEMENT & CORPORATE GOVERNANCE STATEMENT OF DIRECTORS’ RESPONSIBILITIES FOR FINANCIAL REPORTING
145National Development Bank PLC Annual Report 2021

DIRECTORS’ STATEMENT ON INTERNAL CONTROL OVER FINANCIAL REPORTING
RESPONSIBILITY
In line with the Banking Act Direction No. 11 of 2007(as amended), Section 3 (8) (ii) (b), the Board of Directors present this report on Internal Control over Financial Reporting.
The Board of Directors (‘Board’) is responsible for the adequacy and effectiveness of the internal control mechanism in place at National Development Bank PLC (‘the Bank’). In considering such adequacy and effectiveness, the Board recognises that the business of banking requires reward to be balanced with risk on a managed basis and as such the internal control systems are primarily designed with a view to highlighting any deviations from the limits and indicators which comprise the risk appetite of the Bank. In this light, the system of internal controls can only provide reasonable, but not absolute assurance, against material misstatement of financial information and records or against financial losses or fraud.
The Board has established an ongoing process for identifying, evaluating and managing the significant risks faced by the Bank and the Group and this process includes enhancing the system of internal controls over financial reporting as and when there are changes to business environment or regulatory guidelines. The process is regularly reviewed by the Board in line with the ‘Guidance for Directors of Banks on the Directors’ Statement on Internal Control’ issued by the Institute of Chartered Accountants of Sri Lanka. The Board has assessed the internal control over financial reporting taking in to account principles for the assessment of the internal control system as given in that guidance.
The Board is of the view that the system of internal controls over financial reporting in place is sound and adequate to provide reasonable assurance regarding the reliability of financial reporting, and that the preparation of Financial Statements for external purposes is in accordance with relevant accounting principles and regulatory requirements.
The management assists the Board in the implementation of the Board’s policies and procedures on risk and control by identifying and assessing the risks faced and in the design, operation and monitoring of suitable internal controls to mitigate and control these risks.
KEY FEATURES OF THE PROCESS ADOPTED IN APPLYING AND REVIEWING THE DESIGN AND EFFECTIVENESS OF THE INTERNAL CONTROL SYSTEM OVER FINANCIAL REPORTING
The key processes that have been established in reviewing the adequacy and integrity of the system of internal controls with respect to financial reporting include the following:
� Various Committees are established by the Board to assist the Board in ensuring the effectiveness of the Bank’s daily operations and that the Bank’s operations are in accordance with the corporate objectives, strategies and the annual budget as well as the policies and business directions that have been approved.
� Policies/Procedures are developed covering all areas, which are approved by the relevant Board Sub Committees and the Board. These Policies/Procedures are reviewed periodically and the Compliance department follows up on the review of Policies to ensure that they are reviewed timely.
� Internal Audit department checks compliance with policies and procedures and the effectiveness of internal control systems on an ongoing basis during their process audits. The Internal Audit department uses a top down risk based auditing approach enhancing the Risk Based Auditing Process. The entire audit universe is audited annually, at determined intensities based on the risk assessment covering the entire group. The Audit Committee reviews the findings of the internal audits completed and their evaluation of the Bank’s internal control systems. The Committee also reviews updates on audit activities and the scope and adequacy of coverage of the approved audit plan and any improvements thereto, and has detailed discussions on any audits that are rated below Satisfactory, reviewing the action plans to address these areas and the implementation status.
� The Board Audit Committee of the Bank also reviews internal control issues identified by the External Auditor, regulatory authorities and the management, and evaluates the adequacy and effectiveness of the risk management and internal control systems. The Committee also reviews the internal audit functions with particular emphasis on risk assessment, scope of audits and quality of internal audit. The minutes of the Board Audit Committee meetings are tabled at the
meetings of the Board of Directors of the Bank on a periodic basis. Further details of the activities undertaken by the Audit Committee of the Bank are set out in the ‘Board Audit Committee Report’ on pages 136 to 138.
� In assessing the internal control system over financial reporting, identified officers of the Bank collated all procedures and controls that are connected with significant accounts and disclosures of the Financial Statements of the Bank. These in turn were observed and checked by the Internal Audit department for suitability of design and effectiveness on an ongoing basis. The comments/recommendations made by the External Auditors in connection with the internal control system over financial reporting during the year was taken into consideration to further strengthen the internal control system over financial reporting process.
� The Integrated Risk Management Committee (IRMC) is established to assist the Board to oversee the overall management of principal areas of risk of the Bank. The committee reviews the adequacy and effectiveness of all management level committees such as the Credit Committees, Credit and Market Risk Policy Committee etc. Further IRMC works closely with Key Management Personnel (as defined by the Management from time to time) and make decisions on behalf of the Board within the framework of the authority and responsibility assigned to the Committee.
� Due to the COVID-19 pandemic, time to time disruption on continuous operations were experienced. The Bank implemented a staff roster process to safe guard the staff from the pandemic and remote system access was provided to ensure continuous operations of the Bank.
� Internal Audit department conducted verifications on high risk areas through offsite audits using Management Information Systems to ensure that Bank’s internal controls, Policies and procedures are adhered to, during the pandemic situation and the findings were discussed with the Board Audit Committee.
� The Bank took necessary steps to further improve the models used for Impairment computations under the Sri Lanka Accounting Standard – SLFRS 9 on ‘Financial Instruments’ in consultation with the External Auditors. The required processes and controls have been designed to be in line with SLFRS - 9 and regulatory requirements. Also adequate training and
INSIDE INSIGHT RISK MANAGEMENT & CORPORATE GOVERNANCE
146 National Development Bank PLC Annual Report 2021

awareness sessions have been conducted for all stakeholders. The Board will continuously strengthen the processes and controls around management information systems and reports required for validation and compliance in line with SLFRS 9; and financial statement disclosures related to risk management.
� During the year, the existing models were further refined to incorporate the potential implications of COVID-19 pandemic and the moratorium schemes introduced to support the recovery of the economy, based on stress testing the exposures to risk elevated sectors and adjustments made to economic factors.
� The Bank also engaged an External Consultant to support the automation of the Impairment Model in line with SLFRS 9 - Financial Instruments, with the upgrade of the Core Banking system which is in the process of being implemented currently.
CONFIRMATION
The effect of COVID-19 has created an unprecedented level of business interruption around the world. The Bank as in the case of many organisations has shifted to working remotely and adjusting operations to ensure the safety of its employees, customers and other key stakeholders.
The Board of Directors and the Management re-evaluated Financial and other operational risks and assessed the impact of any noted changes on internal controls.
Based on the above processes, the Board confirms that the financial reporting system of the Bank has been designed to provide reasonable assurance regarding the reliability of financial reporting and the preparation of Financial Statements for external purposes and has been done in accordance with Sri Lanka Accounting Standards and regulatory requirements of the Central Bank of Sri Lanka.
REVIEW OF THE STATEMENT BY EXTERNAL AUDITORS
The External Auditors, Messrs.’ Ernst & Young have reviewed the above Directors’ Statement on internal control over financial reporting included in the Annual Report of the Bank for the year ended 31 December 2021 and reported to the Board that nothing has come to their attention that causes them to believe that the statement is inconsistent with their understanding of the process adopted by the Board in the review of the design and effectiveness of the internal control over financial reporting of the Bank.
Their independent assurance report on the Directors’ Statement on Internal Control is given on the page 149 of this Annual Report.
By order of the Board,
Mr. Eshana de Silva Chairman
Mr. Sujeewa Mudalige Chairman Audit Committee
Mr. Dimantha Seneviratne Chief Executive Officer
22 February 2022 Colombo
INSIDE INSIGHT RISK MANAGEMENT & CORPORATE GOVERNANCE DIRECTORS’ STATEMENT ON INTERNAL CONTROL OVER FINANCIAL REPORTING
147National Development Bank PLC Annual Report 2021

RESPONSIBILITY STATEMENT OF THE CHIEF EXECUTIVE OFFICER AND VICE PRESIDENT FINANCE
The Financial Statements of the National Development Bank PLC (the Bank) and the Consolidated Financial Statements of the Bank and its Group Companies (the Group) as at 31 December 2021 are prepared and presented in compliance with the following regulatory requirements:
i. Sri Lanka Accounting Standards (SLFRS/LKAS) issued by The Institute of Chartered Accountants of Sri Lanka
ii. Sri Lanka Accounting and Auditing Standards Act No. 15 of 1995
iii. Companies Act No. 7 of 2007
iv. Banking Act No. 30 of 1988 and amendments thereto
v. Directions, circulars and guidelines issued to licensed commercial banks by the Central Bank of Sri Lanka including but not limited to Banking Act Direction No. 11 of 2007 (as amended) issued by the Monetary Board of the Central Bank of Sri Lanka on corporate governance
vi. Directions/Guidelines issued by the Central Bank of Sri Lanka for COVID-19 impact
vii. Listing Rules of the Colombo Stock Exchange
viii. The Code of Best Practice on Corporate Governance issued jointly by The Institute of Chartered Accountants of Sri Lanka and the Securities and Exchange Commission of Sri Lanka (2017)
These Financial Statements comply with the prescribed format issued by the Central Bank of Sri Lanka on 18 January 2019 for the publication of annual and quarterly Financial Statements and other disclosures by the licensed banks.
The Accounting Policies of the Bank and the Group are in compliance with Sri Lanka Accounting Standards (SLFRS/LKAS) issued by The Institute of Chartered Accountants of Sri Lanka.
Significant Accounting Policies and estimates that involve a high degree of judgment and complexity were discussed with the Board Audit Committee and the External Auditors. Comparative information has been reclassified wherever necessary to comply with the current year’s presentation. All significant items have been disclosed and explained by way of Notes to the Financial Statements. We confirm to the best of our knowledge, that the Financial Statements presented herewith give a true and fair view of the financial position, Statement of Profit or Loss and the cash flows of the Bank and the Group for the
year. We also believe that the Bank and the Group have adequate resources to continue its operations in the foreseeable future and accordingly adopt the going concern basis for the preparation of the Financial Statements.
The Board of Directors and the Management of the Bank and the Group accept responsibility for the integrity and the objectivity of the Financial Statements. The estimates and judgments relating to the Financial Statements were made on a reasonable and prudent basis; in order that the Financial Statements reflect a true and fair view; the form and the substance of transactions and that the state of affairs of the Bank and the Group is reasonably presented. To ensure this, the Bank and the Group have taken proper and sufficient care in implementing internal control systems, with the use of a comprehensive core banking system, for safeguarding assets and for preventing and detecting fraud as well as other irregularities, which is reviewed, evaluated and updated on an ongoing basis. The Internal Auditor of the Bank and the Group has conducted periodic audits to provide reasonable assurance that the established policies and procedures of the Bank and the Group are consistently followed. However, there are inherent limitations that should be recognised in weighing the assurance provided by any system of internal control and accounting.
The Financial Statements of the Bank and the Consolidated Financial Statements of the Bank and its Group Companies were audited by Messrs Ernst & Young, Chartered Accountants. The Report issued by them is available on page 156 of Annual Report. The audit and non-audit services provided by Messrs Ernst & Young are approved by the Board Audit Committee in line with the relevant audit policy, to ensure that the provision of such services does not contravene with the guidelines issued by the Central Bank of Sri Lanka or impair Messrs Ernst & Young’s independence.
The Board Audit Committee reviews the adequacy and the effectiveness of the Internal Control Systems including the effectiveness of the internal controls over financial reporting to provide reasonable assurance that all transactions are accurately and completely recorded in the books of account and the processes by which compliance with Sri Lanka Accounting Standards (SLFRS/LKAS) and other regulatory provisions relating to financial reporting and disclosures are ensured. The Board Audit Committee
Report is available on pages 136 to 137. To ensure complete independence, the External Auditors and the Internal Auditors have full and free access to the members of the Board Audit Committee to discuss any matter of substance.
We confirm to the best of our knowledge that
� The Bank and the Group have complied with all applicable laws, rules, regulations and guidelines;
� There is no material non-compliance;
� There is no material litigation against the Bank and the Group other than those disclosed in Note 48.3 on page 240 of the Financial Statements section of Annual Report;
� All taxes, duties, levies and all statutory payments by the Bank and the Group and all contributions, levies and taxes payable on behalf of and in respect of the employees of the Bank and the Group as at the reporting date have been paid, or where relevant provided for.
Mr. Dimantha Seneviratne Chief Executive Officer
Ms. Suvendrini Muthukumarana Vice President – Finance
22 February 2022 Colombo
INSIDE INSIGHT RISK MANAGEMENT & CORPORATE GOVERNANCE
148 National Development Bank PLC Annual Report 2021

INDEPENDENT ASSURANCE REPORT
INDEPENDENT ASSURANCE REPORT TO THE BOARD OF DIRECTORS OF NATIONAL DEVELOPMENT BANK PLC
Report on the Director’s Statement on Internal Control
We were engaged by the Board of Directors of National Development Bank PLC (“Bank”) to provide assurance on the Directors’ Statement on Internal Control over Financial Reporting (“Statement”) included in the annual report for the year ended 31 December 2021.
Management’s responsibility
Management is responsible for the preparation and presentation of the Statement in accordance with the “Guidance for Directors of Banks on the Directors’ Statement on Internal Control” issued in compliance with section 3(8)(ii)(b) of the Banking Act Direction No. 11 of 2007, by the Institute of Chartered Accountants of Sri Lanka.
Our Independence and Quality Control
We have complied with the independence and other ethical requirement of the Code of Ethics for Professional Accountants issued by the Institute of Chartered Accountants of Sri Lanka, which is founded on fundamental principles of integrity, objectivity, professional competence and due care, confidentiality and professional behaviour.
The firm applies Sri Lanka Standard on Quality Control 1 and accordingly maintains a comprehensive system of quality control including documented policies and procedures regarding compliance with ethical requirements, professional standards and applicable legal and regulatory requirements.
Our responsibilities and compliance with SLSAE 3050 (Revised)
Our responsibility is to assess whether the Statement is both supported by the documentation prepared by or for directors and appropriately reflects the process the directors have adopted in reviewing the design and effectiveness of the internal control of the Bank.
We conducted our engagement in accordance with Sri Lanka Standard on Assurance Engagements (SLSAE) 3050 (Revised), Assurance Report for Banks on Directors’ Statement on Internal Control, issued by the institute of Charted Accountants of Sri Lanka.
This Standard required that we plan and perform procedures to obtain limited assurance about whether Management has prepared, in all material respects, the Statement on Internal Control.
For purpose of this engagement, we are not responsible for updating or reissuing any reports, nor have we, in the course of this engagement, performed an audit or review of the financial information.
Summary of work performed
We conducted our engagement to assess whether the Statement is supported by the documentation prepared by or for directors; and appropriately reflected the process the directors have adopted in reviewing the system of internal control over financial reporting of the Bank.
The procedures performed were limited primarily to inquiries of bank personnel and the existence of documentation on a sample basis that supported the process adopted by the Board of Directors.
SLSAE 3050 (Revised) does not require us to consider whether the Statement covers all risks and controls or to form an opinion on the effectiveness of the Bank’s risk and control procedures. SLSAE 3050 (Revised) also does not require us to consider whether the processes described to deal with material internal control aspects of any significant problems disclosed in the annual report will, in fact, remedy the problems.
The procedures selected depend on our judgement, having regard to our understanding of the nature of the Bank, the event or transaction in respect of which the Statement has been prepared.
We believe that the evidence we have obtained is sufficient and appropriate to provide a basis for our conclusion.
Our conclusion
Based on the procedures performed, nothing has come to our attention that causes us to believe that the Statement included in the annual report is inconsistent with our understanding of the process the Board of Directors has adopted in the review of the design and effectiveness of internal control over financial reporting of the Bank.
22 February 2022Colombo
INSIDE INSIGHT
149National Development Bank PLC Annual Report 2021


ANational Development Bank PLC Annual Report 2021
Integrated Approach to Financial Reporting – Financial Year 2021
In our commitment to enhance the quality of financial reporting within the overall annual reporting framework, we have continued to adopt the integrated reporting concepts in the presentation of Financial Statements for 2021.
Accordingly, we have presented the Financial Statements and relevant Notes to the Financial Statements on a comprehensive and integrated manner. This approach serves as reader-friendly and effective in referencing and analysis.
The presentation of the 2021 Financial Statements are in accordance with the Sri Lanka Financial Reporting Standards and all other applicable guidelines as detailed in page 4 of this Report.
For the purpose of reporting financial performance, the Bank represents National Development Bank PLC, separate Financial Statements and the Group represents the Bank and its subsidiary companies.
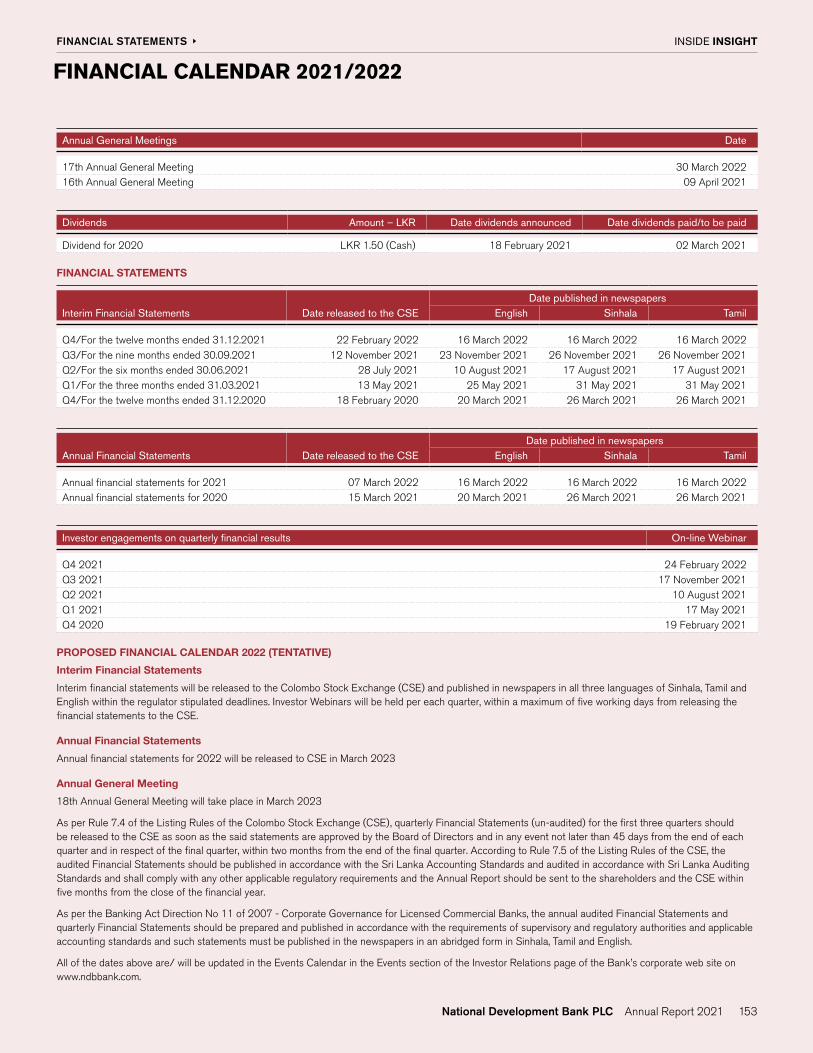
INSIDE INSIGHT FINANCIAL STATEMENTS
153
FINANCIAL CALENDAR 2021/2022
Annual General Meetings Date
17th Annual General Meeting 30 March 202216th Annual General Meeting 09 April 2021
Dividends Amount – LKR Date dividends announced Date dividends paid/to be paid
Dividend for 2020 LKR 1.50 (Cash) 18 February 2021 02 March 2021
FINANCIAL STATEMENTS
Date published in newspapersInterim Financial Statements Date released to the CSE English Sinhala Tamil
Q4/For the twelve months ended 31.12.2021 22 February 2022 16 March 2022 16 March 2022 16 March 2022Q3/For the nine months ended 30.09.2021 12 November 2021 23 November 2021 26 November 2021 26 November 2021Q2/For the six months ended 30.06.2021 28 July 2021 10 August 2021 17 August 2021 17 August 2021Q1/For the three months ended 31.03.2021 13 May 2021 25 May 2021 31 May 2021 31 May 2021Q4/For the twelve months ended 31.12.2020 18 February 2020 20 March 2021 26 March 2021 26 March 2021
Date published in newspapersAnnual Financial Statements Date released to the CSE English Sinhala Tamil
Annual financial statements for 2021 07 March 2022 16 March 2022 16 March 2022 16 March 2022Annual financial statements for 2020 15 March 2021 20 March 2021 26 March 2021 26 March 2021
Investor engagements on quarterly financial results On-line Webinar
Q4 2021 24 February 2022Q3 2021 17 November 2021Q2 2021 10 August 2021Q1 2021 17 May 2021Q4 2020 19 February 2021
PROPOSED FINANCIAL CALENDAR 2022 (TENTATIVE)
Interim Financial Statements
Interim financial statements will be released to the Colombo Stock Exchange (CSE) and published in newspapers in all three languages of Sinhala, Tamil and English within the regulator stipulated deadlines. Investor Webinars will be held per each quarter, within a maximum of five working days from releasing the financial statements to the CSE.
Annual Financial Statements
Annual financial statements for 2022 will be released to CSE in March 2023
Annual General Meeting
18th Annual General Meeting will take place in March 2023
As per Rule 7.4 of the Listing Rules of the Colombo Stock Exchange (CSE), quarterly Financial Statements (un-audited) for the first three quarters should be released to the CSE as soon as the said statements are approved by the Board of Directors and in any event not later than 45 days from the end of each quarter and in respect of the final quarter, within two months from the end of the final quarter. According to Rule 7.5 of the Listing Rules of the CSE, the audited Financial Statements should be published in accordance with the Sri Lanka Accounting Standards and audited in accordance with Sri Lanka Auditing Standards and shall comply with any other applicable regulatory requirements and the Annual Report should be sent to the shareholders and the CSE within five months from the close of the financial year.
As per the Banking Act Direction No 11 of 2007 - Corporate Governance for Licensed Commercial Banks, the annual audited Financial Statements and quarterly Financial Statements should be prepared and published in accordance with the requirements of supervisory and regulatory authorities and applicable accounting standards and such statements must be published in the newspapers in an abridged form in Sinhala, Tamil and English.
All of the dates above are/ will be updated in the Events Calendar in the Events section of the Investor Relations page of the Bank’s corporate web site on www.ndbbank.com.

INSIDE INSIGHT FINANCIAL STATEMENTS
154
TABLE OF CONTENTS
Page No.
Financial Performance
Independent Auditors’ Report
FINANCIAL STATEMENTS
Statement of Profit or Loss 159
Statement of Comprehensive Income 160
Statement of Financial Position 161
Statement of Changes in Equity 162
Statement of Cash Flows 164
NOTES TO THE FINANCIAL STATEMENTS
1 Corporate Information 166
2 Basis of Preparation of Financial Statements 167
3 Accounting Policies 169
Statement of Profit or Loss
4 Gross Income 174
5 Net Interest Income 174
6 Net Fee and Commission Income 176
7 Net Gains/(Losses) from Trading 177
8 Net Gains/(Losses) from Financial Assets at Fair Value through Profit or Loss
178
9 Net Gains/(Losses) from Derecognition of Financial Assets
178
10 Other Operating Income 178
11 Impairment Charges 179
12 Personnel Expenses 185
13 Depreciation and Amortisation Expenses 185
14 Other Expenses 186
15 Value Added Tax on Financial Services 187
16 Share of Associate Companies’ Profits/(Losses) 187
17 Income Tax Expenses 187
18 Basic/Diluted Earning Per Share 189
19 Dividend Per Share 190
Statement of Financial Position : Assets
20 Analysis of Financial Instruments by Measurement Basis
190
21 Cash and Cash Equivalents 193
22 Balances with the Central Bank of Sri Lanka 194
23 Placements with Banks 195
24 Derivative Financial Instruments 195
25 Financial Assets Recognised through Profit or Loss - Measured at Fair Value
196
Page No.
26 Financial Assets at Amortised Cost - Loans and Receivables to Other Customers
197
27 Financial Assets at Amortised Cost - Debt and Other Instruments
204
28 Financial Assets Measured at Fair Value through Other Comprehensive Income
206
29 Investments in Subsidiary Companies 209
30 Investments in Associate Companies 211
31 Investment Property 211
32 Property, Plant & Equipment 213
33 Right of Use Assets 217
34 Intangible Assets 219
35 Other Assets 220
Statement of Financial Position : Liabilities
36 Due to Banks 221
37 Financial Liabilities at Amortised Cost 222
38 Debt Securities Issued 225
39 Current Tax (Receivables)/Liabilities 226
40 Deferred Tax (Assets)/Liabilities 226
41 Retirement Benefit Obligations 228
42 Other Liabilities 232
Statement of Financial Position : Equity
43 Stated Capital 234
44 Statutory Reserve Fund 235
45 Retained Earnings 235
46 Other Reserves 236
47 Non-Controlling Interests 238
Other Financial Disclosures
48 Contingent Liabilities and Commitments 238
49 Net Asset Value Per Ordinary Share 240
50 Maturity Analysis 241
51 Segmental Analysis - Group 244
52 Related Party Disclosures 246
53 Events Occurring after the Date of the Statement of Financial Position
250
54 Comparative Information 251
55 Fair Value of Financial Instruments and Non-Financial Instruments
251
56 Risk Management 262
COMPLIANCE WITH DISCLOSURE REQUIREMENTS OF THE CENTRAL BANK OF SRI LANKA
286

INSIDE INSIGHT FINANCIAL STATEMENTS
155
FINANCIAL PERFORMANCE
For the purpose of reporting financial performance, the Bank represents National Development Bank PLC, separate financial statements and the Group represents the Bank and the subsidiary companies.
LKR Mn
LKR Mn
LKR
LKR Mn
LKR Mn LKR Mn
LKR Mn
LKR Mn LKR Mn
GROSS INCOME NET INTEREST INCOME NET OPERATING INCOME
OPERATING PROFIT BEFORE TAX ON FINANCIAL SERVICES
PROFIT FOR THE YEAR LOANS AND RECEIVABLES TO OTHER CUSTOMERS
EARNING PER SHARE - GROUP
DUE TO DEPOSITORS EQUITY
CASA RATIOCOST TO INCOME RATIO
59,500
60,000
60,500
61,000
61,500
62,000
62,500
2020 20210
5,000
10,000
15,000
20,000
25,000
2020 2021
21,6232021
LKR Mn
17,7482020
LKR Mn
22%
17,000
18,000
19,000
20,000
21,000
2020 2021
20,7432021
LKR Mn
18,6062020
LKR Mn
11%
8,500
9,000
9,500
10,000
10,500
2020 2021
10,3082021
LKR Mn
9,2062020
LKR Mn
12%
5,000
5,250
5,500
5,750
6,000
6,250
6,500
2020 2021
6,3622021
LKR Mn
5,5302020
LKR Mn
15%
400,000
420,000
440,000
460,000
480,000
500,000
520,000
540,000
2020 2021
10.0
12.5
15.0
17.5
20.0
22.5
25.0
2020 2021
22.442021
LKR
21.992020
LKR
2%
LKR
20.00
22.00
24.00
26.00
28.00
2020 2021
27.252021
LKR
25.192020
LKR
8%
526,1412021
LKR Mn
443,5372020
LKR Mn
19%
NET INTEREST MARGIN LKR
2.00
2.25
2.50
2.75
3.00
3.25
3.50
2020 2021
3.252021
LKR
3.072020
LKR
6%
LKR
20.00
25.00
30.00
35.00
40.00
2020 2021
33.652021
LKR
37.002020
LKR
9%
440,000
460,000
480,000
500,000
520,000
540,000
560,000
2020 2021
552,0402021
LKR Mn
490,2782020
LKR Mn
21%
0
10,000
20,000
30,000
40,000
50,000
60,000
70,000
2020 2021
58,9322021
LKR Mn
44,781LKR Mn
32%
62,1112021
LKR Mn
60,676LKR Mn
2%
2020
2020

INSIDE INSIGHT FINANCIAL STATEMENTS
156
INDEPENDENT AUDITORS’ REPORT
INDEPENDENT AUDITOR’S REPORTTO THE SHAREHOLDERS OF NATIONAL DEVELOPMENT BANK PLC
Report on the audit of the consolidated financial statements
Opinion
We have audited the financial statements of National Development Bank PLC (“the Bank”) and the consolidated financial statements of the Bank and its subsidiaries (“the Group”), which comprise the Statement of Financial Position as at 31 December 2021, Statement of Profit or Loss and the statement of comprehensive income, statement of changes in equity and statement of cash flows for the year then ended, and notes to the financial statements, including a summary of significant accounting policies.
In our opinion, the accompanying financial statements of the Bank and the Group give a true and fair view of the financial position of the Bank and the Group as at 31 December 2021, and of their financial performance and cash flows for the year then ended in accordance with Sri Lanka Accounting Standards.
Basis for opinion
We conducted our audit in accordance with Sri Lanka Auditing Standards (SLAuSs). Our responsibilities under those standards are further described in the Auditor’s responsibilities for the audit of the financial statements section of our report. We are independent of the Group in accordance with the Code of Ethics issued by CA Sri Lanka (Code of Ethics) and we have fulfilled our other ethical responsibilities in accordance with the Code of Ethics. We believe that the audit evidence we have obtained is sufficient and appropriate to provide a basis for our opinion.
Key audit matters
Key audit matters are those matters that, in our professional judgment, were of most significance in our audit of the financial statements of the current period. These matters were addressed in the context of our audit of the financial statements as a whole, and in forming our opinion thereon, and we do not provide a separate opinion on these matters. For each matter below, our description of how our audit addressed the matter is provided in that context.
We have fulfilled the responsibilities described in the Auditor’s responsibilities for the audit of the financial statements section of our report, including in relation to these matters. Accordingly, our audit included the performance of procedures designed to respond to our assessment of the risks of material misstatement of the financial statements. The results of our audit procedures, including the procedures performed to address the matters below, provide the basis for our audit opinion on the accompanying financial statements.
Key Audit Matter How our Audit Addressed the Key Audit Matter
Provision for credit impairment on financial assets carried at amortised cost and debt instruments carried at fair value through other comprehensive income
Provision for credit impairment on financial assets carried at amortised cost and debt instruments carried at fair value through other comprehensive income as stated in Notes 26, 27 & 28 respectively is determined by management in accordance with the accounting policies described in Note 11.
We assessed the alignment of the Bank’s provision for credit impairment computations and underlying methodology including consideration of impacts of current economic conditions and pandemic, related industry responses with its accounting policies, based on the best available information up to the date of our report. Our audit procedures included amongst others the following:
� We evaluated the design, implementation and operating effectiveness of controls over estimation of impairment, which included assessing the level of oversight, review and approval of provision for credit impairment policies and procedures by the Board and management.
� We checked the completeness and accuracy of the underlying data used in the impairment computation by agreeing details to relevant source documents and accounting records of the Bank. We also checked the underlying calculations.

INSIDE INSIGHT FINANCIAL STATEMENTS
157
Key Audit Matter How our Audit Addressed the Key Audit Matter
This was a key audit matter due to:
� degree of management judgement, significance of assumptions and level of estimation uncertainty associated with its measurement ; and
� materiality of the reported provision for credit impairment which involved complex calculations.
Key areas of significant judgements, estimates and assumptions used by management in the assessment of the provision for credit impairment included the following.
- management overlays to incorporate the probable ongoing impacts of current economic conditions and pandemic, related industry responses such as government stimulus packages and debt moratorium relief measures granted by the Bank.
- the incorporation of forward-looking information to reflect current and anticipated future external factors, including judgments related to the ongoing impact of current economic conditions and pandemic, both in the multiple economic scenarios and the probability weighting determined to each such scenario.
� In addition to the above, the following procedures were performed:
� For loans and advances assessed on an individual basis for impairment:
- We assessed the reasonableness and timeliness of Management’s internal assessments of credit quality based on the borrower’s particular circumstances.
- We evaluated the reasonableness of key inputs used in the provision for credit impairment made with particular focus on the ongoing impact of current economic conditions and pandemic. Such evaluations were carried out considering value and timing of cash flow forecasts, elevated risk industries, status of recovery action and collateral values.
� For financial assets assessed on a collective basis for impairment:
- We tested the key calculations used in the provision for credit impairment.
- We assessed whether judgements, estimates and assumptions used by the Management in the underlying methodology including the management overlays were reasonable. Our testing included evaluating the reasonableness of forward-looking information used, economic scenarios considered, and probability weighting assigned to each such scenario.
� We assessed the adequacy of the related financial statement disclosures set out in Notes 11, 26, 27, 28 & 56.3.
Information Technology (IT) systems and controls over financial reporting
A significant part of the Bank’s financial reporting process is primarily reliant on multiple IT systems with automated processes and internal controls. Further, key financial statement disclosures are prepared using data and reports generated by IT systems, that are compiled and formulated with the use of spreadsheets.
Accordingly, IT systems and related internal controls over financial reporting was considered a key audit matter.
Our audit procedures included the following:
- We obtained an understanding of the internal control environment of the processes relating to financial reporting and related disclosures.
- We identified and test checked relevant controls of key IT systems related to the Bank’s financial reporting process.
- We involved our internal specialised resources to evaluate the design and operating effectiveness of IT controls, including those related to user access and change management.
- We checked key source data of the reports used to generate key disclosures for accuracy and completeness, including review of the general ledger reconciliations.
- We also obtained an understanding, primarily through inquiry, of the cybersecurity risks affecting the Bank and the actions taken to address these risks. Further, we checked changes if any have been made to security monitoring procedures, given the increase use of remote working access including the Bank’s monitoring on remote working activities.
Other information included in the Group’s 2021 Annual Report
Other information consists of the information included in the Annual Report, other than the financial statements and our auditor’s report thereon. Management is responsible for the other information.
Our opinion on the financial statements does not cover the other information and we do not express any form of assurance conclusion thereon.
In connection with our audit of the financial statements, our responsibility is to read the other information and, in doing so, consider whether the other information is materially inconsistent with the financial statements or our knowledge obtained in the audit or otherwise appears to be materially misstated. If, based on the work we have performed, we conclude that there is a material misstatement of this other information, we are required to report that fact. We have nothing to report in this regard.
Responsibilities of management and those charged with governance for the financial statements
Management is responsible for the preparation of financial statements that give a true and fair view in accordance with Sri Lanka Accounting Standards, and for such internal control as management determines is necessary to enable the preparation of financial statements that are free from material misstatement, whether due to fraud or error.
INDEPENDENT AUDITORS’ REPORT

INSIDE INSIGHT FINANCIAL STATEMENTS
158
In preparing the financial statements, management is responsible for assessing the Group’s ability to continue as a going concern, disclosing, as applicable, matters related to going concern and using the going concern basis of accounting unless management either intends to liquidate the Group or to cease operations, or has no realistic alternative but to do so.
Those charged with governance are responsible for overseeing the Group’s and the Group’s financial reporting process.
Auditor’s responsibilities for the audit of the financial statements
Our objectives are to obtain reasonable assurance about whether the financial statements as a whole are free from material misstatement, whether due to fraud or error, and to issue an auditor’s report that includes our opinion. Reasonable assurance is a high level of assurance, but is not a guarantee that an audit conducted in accordance with SLAuSs will always detect a material misstatement when it exists. Misstatements can arise from fraud or error and are considered material if, individually or in the aggregate, they could reasonably be expected to influence the economic decisions of users taken on the basis of these financial statements.
As part of an audit in accordance with SLAuSs, we exercise professional judgment and maintain professional skepticism throughout the audit. We also:
� Identify and assess the risks of material misstatement of the financial statements, whether due to fraud or error, design and perform audit procedures responsive to those risks, and obtain audit evidence that is sufficient and appropriate to provide a basis for our opinion. The risk of not detecting a material misstatement resulting from fraud is higher than for one resulting from error, as fraud may involve collusion, forgery, intentional omissions, misrepresentations, or the override of internal control.
� Obtain an understanding of internal control relevant to the audit in order to design audit procedures that are appropriate in the circumstances, but not for the purpose of expressing an opinion on the effectiveness of the internal controls of the Bank and the Group.
� Evaluate the appropriateness of accounting policies used and the reasonableness of accounting estimates and related disclosures made by management.
� Conclude on the appropriateness of management’s use of the going concern basis of accounting and, based on the audit evidence obtained, whether a material uncertainty exists related to events or conditions that may cast significant doubt on the Group’s ability to continue as a going concern. If we conclude that a material uncertainty exists, we are required to draw attention in our auditor’s report to the related disclosures in the financial statements or, if such disclosures are inadequate, to modify our opinion. Our conclusions are based on the audit evidence obtained up to the date of our auditor’s report. However, future events or conditions may cause the Group to cease to continue as a going concern.
� Evaluate the overall presentation, structure and content of the financial statements, including the disclosures, and whether the financial statements represent the underlying transactions and events in a manner that achieves fair presentation.
� Obtain sufficient appropriate audit evidence regarding the financial information of the entities or business activities within the Group to express an opinion on the consolidated financial statements. We are responsible for the direction, supervision and performance of the Group audit. We remain solely responsible for our audit opinion.
We communicate with those charged with governance regarding, among other matters, the planned scope and timing of the audit and significant audit findings, including any significant deficiencies in internal control that we identify during our audit.
We also provide those charged with governance with a statement that we have complied with ethical requirements in accordance with the Code of Ethics regarding independence, and to communicate with them all relationships and other matters that may reasonably be thought to bear on our independence, and where applicable, related safeguards.
From the matters communicated with those charged with governance, we determine those matters that were of most significance in the audit of the financial statements of the current period and are therefore the key audit matters. We describe these matters in our auditor’s report unless law or regulation precludes public disclosure about the matter or when, in extremely rare circumstances, we determine that a matter should not be communicated in our report because the adverse consequences of doing so would reasonably be expected to outweigh the public interest benefits of such communication.
Report on Other Legal and Regulatory Requirements
As required by section 163 (2) of the Companies Act No. 7 of 2007, we have obtained all the information and explanations that were required for the audit and, as far as appears from our examination, proper accounting records have been kept by the Bank.
CA Sri Lanka membership number of the engagement partner responsible for signing this independent auditor’s report is 2097.
22 February 2022
Colombo
INDEPENDENT AUDITORS’ REPORT

INSIDE INSIGHT FINANCIAL STATEMENTS
159
STATEMENT OF PROFIT OR LOSS
BANK GROUP
For the year ended 31 December Note Page 2021 2020 2021 2020No. LKR ’000 LKR ’000 % LKR ’000 LKR ’000 %
Gross income 4 174 62,110,531 60,676,366 2 64,082,873 61,650,731 4
Interest income 5.1 174 52,692,866 53,003,875 (1) 52,794,763 53,153,100 (1)Less: Interest expenses 5.2 175 31,070,098 35,255,426 (12) 31,053,468 35,228,223 (12)Net interest income 5 174 21,622,768 17,748,449 22 21,741,295 17,924,877 21
Fee and commission income 6.1 177 5,634,797 4,268,945 32 7,384,660 5,452,706 35 Less: Fee and commission expenses 6.2 177 33,260 18,661 78 33,260 18,661 78 Net Fee and commission income 6 176 5,601,537 4,250,284 32 7,351,400 5,434,045 35
Net gains/(losses) from trading 7 177 2,096,455 967,284 117 2,096,455 967,284 117 Net gains/(losses) from financial assets at fair
value through profit or loss 8 178 433,106 96,353 349 560,482 113,683 393 Net gains/(losses) from derecognition of
financial assets 9 178 186,248 1,486,023 (87) 186,248 1,486,300 (87)Other operating income 10 178 1,067,059 853,886 25 1,060,265 477,658 122 Total operating income 31,007,173 25,402,279 22 32,996,145 26,403,847 25
Less: Impairment charges 11 179 10,264,662 6,796,336 51 10,252,695 6,793,647 51 Net operating income 20,742,511 18,605,943 11 22,743,450 19,610,200 16
Less: Operating expensesPersonnel expenses 12 185 5,672,007 5,171,547 10 6,322,751 5,748,453 10 Depreciation and amortisation expenses 13 185 831,643 818,582 2 914,111 931,599 (2)Other expenses 14 186 3,930,728 3,409,324 15 4,277,910 3,720,998 15 Total operating expenses 10,434,378 9,399,453 11 11,514,772 10,401,050 11
Operating profit before Value Added Tax on financial services 10,308,133 9,206,490 12 11,228,678 9,209,150 22
Less: Value Added Tax on financial services 15 187 2,014,671 1,818,832 11 2,014,671 1,818,832 11 Operating profit after Value Added Tax on
financial services 8,293,462 7,387,658 12 9,214,007 7,390,318 25 Share of associate companies’ profits/(losses) 16 187 - - - - - -
Profit before taxation 8,293,462 7,387,658 12 9,214,007 7,390,318 25 Less: Income tax expenses 17 187 1,930,986 1,857,182 4 2,151,277 2,172,970 (1)Profit for the year 6,362,476 5,530,476 15 7,062,730 5,217,348 35
Profit attributable to equity holders of the parent 6,362,476 5,530,476 15 6,904,263 5,116,806 35 Non-controlling interests - - - 158,467 100,542 58Profit for the year 6,362,476 5,530,476 15 7,062,730 5,217,348 35
Basic/Diluted Earnings per share (LKR) 18 189 20.68 23.77 (13) 22.44 21.99 2 Dividend per share (LKR) 19 190 - 1.50
The Notes to the Financial Statements disclosed on pages 166 to 285 form an integral part of these Financial Statements.

INSIDE INSIGHT FINANCIAL STATEMENTS
160
STATEMENT OF COMPREHENSIVE INCOME
BANK GROUP
For the year ended 31 December Note Page 2021 2020 2021 2020No. LKR ’000 LKR ’000 % LKR ’000 LKR ’000 %
Profit for the year 6,362,476 5,530,476 15 7,062,730 5,217,348 35 Other comprehensive income Items that will be
reclassified to the Statement of Profit or LossExchange differences on translation of foreign
operations - - - 22,916 10,880 111 Gains/(losses) on investments in debt instruments
- fair value through other comprehensive incomeNet change in fair value during the year (2,353,240) 8,188 (28,840) (2,367,024) 5,866 (40,452)Changes in allowance for expected credit losses 28.1 (c) 208 135,574 (4,193) 3,333 135,574 (311,450) 144 Deferred tax effect including the effect of rate
change on the opening balance on gains/(losses) in above financial instruments 593,038 340,178 74 589,819 332,575 77
Net gains/(losses) on investments (1,624,628) 344,173 (572) (1,641,631) 26,991 (6,182)Gains/(losses) on cash flow hedges - 1,613 (100) - 1,613 (100)Net other comprehensive income that
will be reclassified to the Statement of Profit or Loss (a) (1,624,628) 345,786 (570) (1,618,715) 39,484 (4,200)
Items that will not be reclassified to the Statement of Profit or Loss
Net gains/(losses) on investments in equity instruments - fair value through other comprehensive income 28.2 208 (49,407) (143,533) 66 (49,407) (143,533) 66
Revaluation of freehold land and buildings 46.1 236 22,794 68,804 (67) 54,102 90,499 (40)Deferred tax effect including the effect of rate
change on the opening balance on revaluation gains/(losses) 67,409 (19,265) 450 66,614 (25,339) 363
Net gains/(losses) on revaluation of freehold land and buildings 90,203 49,539 82 120,716 65,160 85
Actuarial gains/(losses) on defined benefit plans 41.2 (g) 232 316,361 (58,565) 640 350,150 (53,822) 751 Deferred tax effect including the effect of rate
change on the opening balance on actuarial gains/(losses) (25,547) 8,245 (410) (33,833) 5,935 (670)
Net actuarial gains/(losses) on defined benefit plans 290,814 (50,320) 678 316,317 (47,887) 761
Deferred tax effect on tax rate change on day one adjustment of impairment allowance (93,536) - (100) (93,536) - (100)
Net other comprehensive income that will not be reclassified to the Statement of Profit or Loss (b) 238,074 (144,314) 265 294,090 (126,260) 333
Total other comprehensive income for the year, net of taxes (a+b) (1,386,554) 201,472 (788) (1,324,625) (86,776) (1,426)
Total comprehensive income for the year 4,975,922 5,731,948 (13) 5,738,105 5,130,572 12
Attributable to:Equity holders of the parent 4,975,922 5,731,948 (13) 5,575,671 5,027,648 11 Non-controlling interests - - - 162,434 102,924 58 Total comprehensive income for the year 4,975,922 5,731,948 (13) 5,738,105 5,130,572 12
The Notes to the Financial Statements disclosed on pages 166 to 285 form an integral part of these Financial Statements.

INSIDE INSIGHT FINANCIAL STATEMENTS
161
BANK GROUP
As at 31 December Note Page 2021 2020 2021 2020No. LKR ’000 LKR ’000 % LKR ’000 LKR ’000 %
AssetsCash and cash equivalents 21 193 13,411,819 10,487,608 28 13,765,270 10,778,947 28 Balances with the Central Bank of Sri Lanka 22 194 16,403,362 6,812,099 141 16,403,362 6,812,099 141 Placements with banks 23 195 8,299,403 12,401,533 (33) 8,299,403 12,401,533 (33)Derivative financial instruments 24 195 1,338,204 1,429,470 (6) 1,338,204 1,429,470 (6)Financial assets recognised through profit or loss
- measured at fair value 25 196 2,441,833 5,574,175 (56) 4,784,124 7,713,222 (38)Financial assets at amortised cost
- loans and receivables to other customers 26 197 502,509,458 425,605,508 18 502,344,786 425,681,832 18 Financial assets at amortised cost
- debt and other instruments 27 204 54,262,976 44,711,640 21 54,262,976 44,711,640 21 Financial assets measured at fair value through
other comprehensive income 28 206 89,552,196 108,593,183 (18) 89,696,611 108,762,972 (18)Investments in subsidiary companies 29 209 1,130,916 1,142,884 (1) - - - Investments in associate companies 30 211 - - - - - - Investment property 31 211 - - - 2,528,228 2,361,535 7 Property, plant & equipment 32 213 3,143,829 2,968,993 6 3,735,298 3,541,018 5 Right of use assets 33 217 1,094,607 1,060,843 3 1,285,385 1,289,749 -Intangible assets 34 219 1,203,940 1,048,326 15 1,217,111 1,061,673 15 Current tax receivables 39 226 - - - 27,701 45,098 (39)Deferred tax assets 40 226 3,417,315 1,875,720 82 3,443,207 1,945,730 77 Other assets 35 220 4,693,249 3,124,716 50 5,670,716 3,595,100 58 Total assets 702,903,107 626,836,698 12 708,802,382 632,131,618 12
LiabilitiesDue to banks 36 221 24,770,644 24,173,318 2 24,821,158 24,173,318 3 Derivative financial instruments 24 195 1,048,644 1,016,787 3 1,048,644 1,016,787 3 Financial liabilities at amortised cost Due to depositors 37.1 222 552,039,792 490,278,126 13 551,256,595 489,658,746 13 Due to debt securities holders 37.2 223 1,341,060 1,500,007 (11) 1,341,060 1,500,007 (11) Due to other borrowers 37.3 224 25,228,865 34,284,109 (26) 25,228,865 34,284,109 (26)Debt securities issued 38 225 27,960,731 19,880,891 41 27,960,731 19,880,891 41 Current tax liabilities 39 226 2,407,243 2,297,296 5 2,585,975 2,563,345 1 Deferred tax liabilities 40 226 - - - 569,213 596,112 (5)Retirement benefit obligations 41.1 228 735,666 709,294 4 829,873 820,109 1 Other liabilities 42 232 8,438,257 7,915,847 7 9,093,727 8,434,802 8 Total liabilities 643,970,902 582,055,675 11 644,735,840 582,928,226 11
EquityStated capital 43 234 18,263,609 8,794,333 108 18,263,609 8,794,333 108 Statutory reserve fund 44 235 2,571,479 2,196,479 17 2,571,479 2,196,479 17 Retained earnings 45 235 39,134,382 33,126,579 18 42,730,952 36,143,348 18 Other reserves 46 236 (1,037,264) 663,632 (256) (838,871) 842,077 (200)Total equity to equity holders of the Bank 58,932,206 44,781,023 32 62,727,169 47,976,237 31 Non-controlling interests 47 238 - - - 1,339,373 1,227,155 9 Total equity 58,932,206 44,781,023 32 64,066,542 49,203,392 30 Total liabilities and equity 702,903,107 626,836,698 12 708,802,382 632,131,618 12 Contingent liabilities and commitments 48 238 312,072,435 343,949,526 (9) 311,978,390 344,053,658 (9)Net asset value per share (LKR) 49 240 165.02 192.49 (14) 175.65 206.23 (15)
The Notes to the Financial Statements disclosed on pages 166 to 285 form an integral part of these Financial Statements.
We certify that these Financial Statements are in compliance with the requirements of the Companies Act No. 7 of 2007.
Mrs. Suvendrini MuthukumaranaVice President - Finance
The Board of Directors is responsible for the preparation and presentation of these Financial Statements. Approved and signed for and on behalf of the Board.
Mr. Eshana de Silva Mr. Dimantha Seneviratne Mrs. Shehani RanasingheDirector/Chairman Director/Chief Executive Officer Company Secretary
22 February 2022Colombo
STATEMENT OF FINANCIAL POSITION

INSIDE INSIGHT FINANCIAL STATEMENTS
162
STATEMENT OF CHANGES IN EQUITYB
AN
K
For t
he y
ear e
nded
31
Dec
embe
r
Sta
ted
Cap
ital
Sta
tuto
ry
Res
erve
Fu
nd
Sha
re B
ased
P
aym
ent
Res
erve
Fair
Valu
e th
roug
h O
ther
C
ompr
ehen
sive
In
com
e R
eser
ve
Rev
alua
tion
Res
erve
Gen
eral
R
eser
veC
ash
Flow
H
edge
R
eser
ve
Ret
aine
d E
arni
ngs
Tota
l Equ
ity
LKR
’000
LKR
’000
LKR
’000
LKR
’000
LKR
’000
LKR
’000
LKR
’000
LKR
’000
LKR
’000
BA
NK
Bal
ance
as
at 0
1 Ja
nuar
y 20
20 7
,685
,334
1
,896
,479
-
(8
54,3
67)
1,2
62,4
53
5,8
05,7
07
(1,6
13)
23,
689,
843
39,
483,
836
Tota
l com
preh
ensi
ve in
com
e fo
r the
yea
r
Pro
fit fo
r the
yea
r -
-
-
-
-
-
-
5
,530
,476
5
,530
,476
Oth
er c
ompr
ehen
sive
inco
me
befo
re ta
x -
-
-
(1
35,3
45)
68,
804
-
1,6
13
(62,
758)
(127
,686
)
Tax
on o
ther
com
preh
ensi
ve in
com
e -
-
-
3
41,3
52
(19,
265)
-
-
7,0
71
329
,158
Tota
l com
preh
ensi
ve in
com
e fo
r the
yea
r -
-
-
2
06,0
07
49,
539
-
1,6
13
5,4
74,7
89
5,7
31,9
48
Tran
sact
ions
with
equ
ity h
olde
rs, r
ecog
nise
d di
rect
ly in
equ
ity
Tran
sfer
to th
e st
atut
ory
rese
rve
fund
(N
ote
44
) -
3
00,0
00
-
-
-
-
-
(300
,000
) -
Tran
sfer
to re
tain
ed e
arni
ngs
(Not
e 4
5)
-
-
-
-
-
(5,8
05,7
07)
-
5,8
05,7
07
-
Fina
l div
iden
d fo
r 20
19
: Scr
ip (N
ote
19
) 1
,108
,999
-
-
-
-
-
-
(1
,108
,999
) -
Fina
l div
iden
d fo
r 20
19
: Cas
h (N
ote
19
) -
-
-
-
-
-
-
(4
34,7
61)
(434
,761
)
Bal
ance
as
at 3
1 D
ecem
ber 2
020
8,7
94,3
33
2,1
96,4
79
-
(648
,360
) 1
,311
,992
-
-
3
3,12
6,57
9 4
4,78
1,02
3
Bal
ance
as
at 0
1 Ja
nuar
y 20
21 8
,794
,333
2
,196
,479
-
(6
48,3
60)
1,3
11,9
92
-
-
33,
126,
579
44,
781,
023
Tota
l com
preh
ensi
ve in
com
e fo
r the
yea
r
Pro
fit fo
r the
yea
r -
-
-
-
-
-
-
6
,362
,476
6
,362
,476
Oth
er c
ompr
ehen
sive
inco
me
befo
re ta
x -
-
-
(2
,402
,647
) 2
2,79
4 -
-
4
51,9
35
(1,9
27,9
18)
Tax
on o
ther
com
preh
ensi
ve in
com
e -
-
-
5
67,0
69
67,
409
-
-
(93,
114)
541
,364
Tota
l com
preh
ensi
ve in
com
e fo
r the
yea
r -
-
-
(1
,835
,578
) 9
0,20
3 -
-
6
,721
,297
4
,975
,922
Tran
sact
ions
with
equ
ity h
olde
rs, r
ecog
nise
d di
rect
ly in
equ
ity
Issu
e of
Sha
res
9,4
69,2
76
-
-
-
-
-
-
-
9,4
69,2
76
Add
ition
s to
sha
re b
ased
pay
men
t res
erve
s -
-
4
4,47
9 -
-
-
-
-
4
4,47
9
Tran
sfer
to th
e st
atut
ory
rese
rve
fund
(N
ote
44
) -
3
75,0
00
-
-
-
-
-
(375
,000
) -
Inte
rim d
ivid
end
for 2
02
0: C
ash
(Not
e 1
9)
-
-
-
-
-
-
-
(338
,494
) (3
38,4
94)
Bal
ance
as
at 3
1 D
ecem
ber 2
021
18,
263,
609
2,5
71,4
79
44,
479
(2,4
83,9
38)
1,4
02,1
95
-
-
39,
134,
382
58,
932,
206

INSIDE INSIGHT FINANCIAL STATEMENTS
163
GR
OU
P
For t
he y
ear e
nded
31
Dec
embe
r
Sta
ted
Cap
ital
Sta
tuto
ry
Res
erve
Fu
nd
Sha
re B
ased
P
aym
ent
Res
erve
Fai
r Val
ue
thro
ugh
Oth
er
Com
preh
ensi
ve
Inco
me
Res
erve
Rev
alua
tion
Res
erve
G
ener
al
Res
erve
C
ash
Flow
H
edge
R
eser
ve
Ret
aine
d E
arni
ngs
T
otal
N
on-
Con
trolli
ng
Inte
rest
s
Tot
al
Equ
ity
LKR
’000
LKR
’000
LKR
’000
LKR
’000
LKR
’000
LKR
’000
LKR
’000
LKR
’000
LKR
’000
LKR
’000
LKR
’000
GR
OU
P
Bal
ance
as
at 0
1 Ja
nuar
y 20
20 7
,685
,334
1
,896
,479
-
(8
25,2
09)
1,3
97,9
55
5,8
05,7
07
(1,6
13)
27,
424,
697
43,
383,
350
1,1
55,2
80
44,
538,
630
Tota
l com
preh
ensi
ve in
com
e fo
r the
yea
r -
Pro
fit fo
r the
yea
r -
-
-
-
-
-
-
5
,116
,806
5
,116
,806
1
00,5
42
5,2
17,3
48
Oth
er c
ompr
ehen
sive
inco
me
befo
re ta
x -
-
-
(1
37,6
67)
90,
499
-
1,6
13
(356
,774
) (4
02,3
29)
2,3
82
(399
,947
)
Tax
on o
ther
com
preh
ensi
ve in
com
e -
-
-
3
41,8
38
(25,
339)
-
-
(3,3
28)
313
,171
-
3
13,1
71
Tota
l com
preh
ensi
ve in
com
e fo
r the
yea
r -
-
-
2
04,1
71
65,
160
-
1,6
13
4,7
56,7
04
5,0
27,6
48
102
,924
5
,130
,572
Tran
sact
ions
with
equ
ity h
olde
rs,
reco
gnis
ed d
irect
ly in
equ
ity
Tran
sfer
to th
e st
atut
ory
rese
rve
fund
(N
ote
44
) -
3
00,0
00
-
-
-
-
-
(300
,000
) -
-
-
Tran
sfer
to re
tain
ed e
arni
ngs
(Not
e 4
5)
-
-
-
-
-
(5,8
05,7
07)
-
5,8
05,7
07
-
-
-
Div
iden
d at
trib
utab
le to
non
con
trol
ling
inte
rest
s -
-
-
-
-
-
-
-
-
(2
8,66
7) (2
8,66
7)
Adj
ustm
ents
to n
on c
ontr
ollin
g in
tere
sts
-
-
-
-
-
-
-
-
-
(2,3
82)
(2,3
82)
Fina
l div
iden
d fo
r 20
19
: Scr
ip (N
ote
19
) 1
,108
,999
-
-
-
-
-
-
(1
,108
,999
) -
-
-
Fina
l div
iden
d fo
r 20
19
: Cas
h (N
ote
19
) -
-
-
-
-
-
-
(4
34,7
61)
(434
,761
) -
(4
34,7
61)
Bal
ance
as
at 3
1 D
ecem
ber 2
020
8,7
94,3
33
2,1
96,4
79
-
(621
,038
) 1
,463
,115
-
-
3
6,14
3,34
8 4
7,97
6,23
7 1
,227
,155
4
9,20
3,39
2
Bal
ance
as
at 0
1 Ja
nuar
y 20
21 8
,794
,333
2
,196
,479
-
(6
21,0
38)
1,4
63,1
15
-
-
36,
143,
348
47,
976,
237
1,2
27,1
55
49,
203,
392
Tota
l com
preh
ensi
ve in
com
e fo
r the
yea
r
Pro
fit fo
r the
yea
r -
-
-
-
-
-
-
6
,904
,263
6
,904
,263
1
58,4
67
7,0
62,7
30
Oth
er c
ompr
ehen
sive
inco
me
befo
re ta
x -
-
-
(2
,416
,431
) 5
4,10
2 -
-
5
04,6
73
(1,8
57,6
56)
3,9
67
(1,8
53,6
89)
Tax
on o
ther
com
preh
ensi
ve in
com
e -
-
-
5
70,2
88
66,
614
-
-
(107
,838
) 5
29,0
64
-
529
,064
Tota
l com
preh
ensi
ve in
com
e fo
r the
yea
r -
-
-
(1
,846
,143
) 1
20,7
16
-
-
7,3
01,0
98
5,5
75,6
71
162
,434
5
,738
,105
Tran
sact
ions
with
equ
ity h
olde
rs,
reco
gnis
ed d
irect
ly in
equ
ity
Issu
e of
Sha
res
9,4
69,2
76
-
-
-
-
-
-
-
9,4
69,2
76
-
9,4
69,2
76
Add
ition
s to
sha
re b
ased
pay
men
t res
erve
s -
-
4
4,47
9 -
-
-
-
-
4
4,47
9 -
4
4,47
9
Tran
sfer
to th
e st
atut
ory
rese
rve
fund
(N
ote
44
) -
3
75,0
00
-
-
-
-
-
(375
,000
) -
-
-
Div
iden
d at
trib
utab
le to
non
con
trol
ling
inte
rest
s -
-
-
-
-
-
-
-
-
(5
0,21
6) (5
0,21
6)
Inte
rim d
ivid
end
for 2
02
0: C
ash
(Not
e 1
9)
-
-
-
-
-
-
-
(338
,494
) (3
38,4
94)
-
(338
,494
)
Bal
ance
as
at 3
1 D
ecem
ber 2
021
18,
263,
609
2,5
71,4
79
44,
479
(2,4
67,1
81)
1,5
83,8
31
-
-
42,
730,
952
62,
727,
169
1,3
39,3
73
64,
066,
542
STATEMENT OF CHANGES IN EQUITY

INSIDE INSIGHT FINANCIAL STATEMENTS
164
ACCOUNTING POLICY
The Statement of Cash Flows has been prepared by using ‘The Direct Method’ in accordance with Sri Lanka accounting standard LKAS 7 on “Statement of Cash Flows”, whereby gross cash receipts and gross cash payments of operating, investing and financing activities have been recognised. For the purpose of the preparation of the Statement of Cash Flows, cash and cash equivalents include cash in hand, balances with banks and placements with banks, as presented in the Statement of Financial Position.
BANK GROUP
For the year ended 31 December Note Page 2021 2020 2021 2020No. LKR ’000 LKR ’000 LKR ’000 LKR ’000
Cash flows from operating activitiesInterest received 53,092,776 50,953,861 53,119,744 51,107,977 Fee and commission income received 5,619,088 4,257,929 7,239,763 5,443,759 Dividend income received 279,634 572,267 88,036 97,941 Other operating income received 2,859,551 2,738,510 3,340,113 2,761,515 Interest paid (30,571,312) (35,090,639) (30,587,546) (35,092,828)Personnel costs paid (5,515,441) (5,016,210) (5,938,969) (5,591,500)Other expenses paid (3,686,369) (3,659,444) (4,281,674) (4,022,492)Operating profit before changes in operating assets and liabilities (a) 22,077,927 14,756,274 22,979,467 14,704,372
Increase/decrease in operating assetsDeposits held for regulatory or monitory control purposes (9,591,263) 7,074,476 (9,591,263) 7,074,476 Financial assets at amortised cost
- loans and receivables to other customers (85,091,814) (33,757,683) (85,319,264) (33,757,688)Net (increase)/decrease in operating assets (998,290) (286,208) (1,936,083) (155,786)
Increase/decrease in operating liabilitiesFinancial liabilities at amortised cost - due to depositors 61,744,822 84,678,922 61,744,822 84,678,922 Financial liabilities at amortised cost - due to debt securities holders (158,947) 49,383 (158,947) 49,383 Financial liabilities at amortised cost - due to banks/other borrowers (6,463,987) 11,746,713 (6,463,987) 11,746,713 Repayment of principal portion of lease liabilities 42.1.2 233 (417,479) (366,601) (478,738) (427,069)Net increase/(decrease) in other liabilities 547,569 (646,463) 1,360,858 (152,338)Net cash (outflow)/inflow from operating activities before taxation (18,351,462) 83,248,813 (17,863,135) 83,760,985
Value Added Tax on financial services paid (2,220,632) (1,618,514) (2,220,632) (1,618,516)Income taxes paid 39.2 226 (2,821,270) (2,755,230) (3,106,562) (2,929,685)Net cash (used in)/from operating activities (23,393,364) 78,875,069 (23,190,329) 79,212,784
Cash flows from investing activitiesNet changes in financial investments 8,510,963 (62,102,595) 8,476,433 (62,439,208)Purchase of intangible assets (432,197) (525,167) (437,758) (525,437)Purchase of property, plant and equipment (610,610) (426,776) (669,403) (485,320)Proceeds from disposal of property, plant and equipment 8,503 2,762 16,338 2,921 Net cash from/(used in) investing activities 7,476,659 (63,051,776) 7,385,610 (63,447,044)
Cash flows from financing activitiesProceeds from debt securities issued 8,000,000 6,500,000 8,000,000 6,500,000 Repayment of debt securities issued - (10,000,000) - (10,000,000)Proceeds from issue of ordinary shares 43 234 9,469,276 9,469,276 Interest paid on debt securities issued (2,396,033) (1,004,127) (2,396,033) (1,004,127)Dividends paid to non-controlling interests - - (49,875) (28,999)Dividends paid to shareholders of the Bank 42.1.1 233 (333,024) (423,212) (333,024) (423,212)Net cash from/(used in) financing activities 14,740,218 (4,927,339) 14,690,344 (4,956,338)
STATEMENT OF CASH FLOWS

INSIDE INSIGHT FINANCIAL STATEMENTS
165
BANK GROUP
For the year ended 31 December Note Page 2021 2020 2021 2020No. LKR ’000 LKR ’000 LKR ’000 LKR ’000
Net (decrease)/increase in cash and cash equivalents (1,176,487) 10,895,954 (1,114,375) 10,809,402 Cash and cash equivalents at the beginning of the year 22,890,469 11,994,515 23,181,808 12,372,406Cash and cash equivalents at the end of the year 21,713,982 22,890,469 22,067,433 23,181,808
Reconciliation of cash and cash equivalentsCash and cash equivalents 21 193 13,412,488 10,488,607 13,765,939 10,779,946Placements with banks 23 195 8,301,494 12,401,862 8,301,494 12,401,862Cash and cash equivalents at the end of the year (Gross) 21,713,982 22,890,469 22,067,433 23,181,808Less : Impairment allowance 2,760 1,328 2,760 1,328Cash and cash equivalents at the end of the year (Net) 21,711,222 22,889,141 22,064,673 23,180,480
(a) Reconciliation of Operating Profit before Changes in Operating Assets and Liabilities
BANK GROUP
For the year ended 31 December Note Page 2021 2020 2021 2020No. LKR ’000 LKR ’000 LKR ’000 LKR ’000
Operating profit before tax on financial services 10,308,133 9,206,490 11,228,678 9,209,150 Gains on sale of property, plant & equipment (6,778) (1,758) (14,213) (1,864)Accruals for interest/other income 399,910 (2,050,015) 383,044 (2,165,877)Accruals for interest expenses 498,786 164,788 498,786 164,788 Accruals for general expenses 341,813 (111,409) 515,089 (196,163)Unrealised revaluation gains/(losses) from investments (619,354) (61,424) (704,831) 82,521 Contribution made to the pension fund 14,633 16,625 14,633 16,625 Depreciation of property, plant & equipment 13 185 408,247 407,741 446,850 481,941 Amortisation of intangible assets 13 185 114,270 133,075 120,007 133,956 Depreciation of Right of use assets 13 185 309,126 277,766 347,254 315,702 Impairment charges for financial assets and investments in
subsidiaries 11.1 182 10,264,662 6,796,336 10,252,695 6,793,647 Scrip dividend received from investments - (21,941) - (21,941)Fair value adjustments on investment property - - (153,004) (108,113)Share based payments 44,479 - 44,479 - Operating profit before changes in operating assets and liabilities 22,077,927 14,756,274 22,979,467 14,704,372
STATEMENT OF CASH FLOWS

INSIDE INSIGHT FINANCIAL STATEMENTS
166
NOTES TO THE FINANCIAL STATEMENTS
1. CORPORATE INFORMATION
1.1 Reporting Entity
The National Development Bank of Sri Lanka was incorporated under the National Development Bank of Sri Lanka Act No. 2 of 1979. In 2005, pursuant to the provisions of the National Development Bank of Sri Lanka (consequential provisions) Act No. 1 of 2005, a company by the name of ‘National Development Bank Limited’ was incorporated for the purposes of taking over the business of National Development Bank of Sri Lanka. Accordingly, on 15 June 2005, the National Development Bank Limited was incorporated and with effect from that date, the National Development Bank of Sri Lanka Act No. 2 of 1979 was repealed except for certain provisions contained therein.
In terms of the new Companies Act No. 7 of 2007, the name of the Bank was changed as ‘National Development Bank PLC’ (‘The Bank’). The Bank was re-registered in terms of the new Companies Act, on 04 July 2007 and was assigned with PQ 27 as the new Registration Number. The Bank is listed on the Colombo Stock Exchange. The Registered Office of the Bank and its principle place of business are situated at No. 40, Nawam Mawatha, Colombo 02. The number of branches of the Bank as at 31 December 2021 was 113 (2020 - 113) and the number of staff employed as at 31 December 2021 was 2,949 (2020 - 2,892).
1.2 Principle Activities of the Bank and the Group
The principal activities of the Bank and its Group companies are summarised below:
Entity NDB Capital Holdings Limited
NDB Investment Bank Limited
NDB Wealth Management Limited
NDB Securities (Pvt) Limited
Development Holdings (Pvt) Limited
NDB Capital Limited
NDB Zephyr Partners Limited
NDB Zephyr Partners Lanka (Pvt) Limited (Fully owned subsidiary of NDB Zephyr Partners Limited)
Holding % - 2021 / 2020
99.9 % 99.9 % 99.9 % 99.9 % 58.7 %
Direct - 41.8%
Indirect 84.2
60.0 % 60.0 %
Direct Holding
Indirect Holding
Indirect Holding
Indirect Holding
Direct Holding
Direct/Indirect Holding
Indirect Holding
Indirect Holding
Principal Activity
Full service investment banking
Investment banking
Wealth management
Investment advisory and securities
Property management
Investment banking
Management of private equity funds
Management of private equity funds
Principal place of business
Level 1, 135, Bauddhaloka Mawatha, Colombo 04
Level 1, 135, Bauddhaloka Mawatha, Colombo 04
Level G, 135, Bauddhaloka Mawatha, Colombo 04
Level 2, 135, Bauddhaloka Mawatha, Colombo 04
42, NDB EDB Tower (2nd Floor), Nawam Mawatha, Colombo 02
Bilquis Tower (5th Floor), Plot 6, Gulshan 2, Dhaka 1212, Bangladesh
IFS Court, Bank Street, Twenty-Einght Cybercity, Ebene 72201, Republic of Mauritius
48/5/1 (West Wing), Parkway Building, Park Street, Colombo 02
Country of Incorporation
Sri Lanka Sri Lanka Sri Lanka Sri Lanka Sri Lanka Bangladesh Mauritius Sri Lanka
The Bank also holds 50% shareholding in Ayojana Fund (Pvt) Limited (an Investment in Associate) which is under liquidation.
National Development Bank PLC
PARENT COMPANY
40, Nawam Mawatha, Colombo 02, Sri Lanka
Retail banking, small and medium enterprise (SME) banking, corporate banking, project and infrastructure financing, trade finance, investment banking, leasing, housing finance, credit cards, cash management, correspondent banking, remittance
services, margin trading, pawning, treasury, underwriting, custodian, investment services and bancassurance.
Subsidiaries

INSIDE INSIGHT FINANCIAL STATEMENTS
167
NOTES TO THE FINANCIAL STATEMENTS
1.3 Consolidated Financial Statements
The Consolidated Financial Statements for the year ended 31 December 2021 comprise of the Bank (parent company) and the subsidiaries and associate companies, together referred as the Group.
The Bank does not have an identifiable parent company and is the ultimate parent of the NDB Group.
2. BASIS OF PREPARATION OF FINANCIAL STATEMENTS
2.1 Statement of Compliance
The Consolidated Financial Statements of the Group and the separate Financial Statements of the Bank as at 31 December 2021 comprises of –
� The Statement of Profit or Loss and Statement of Comprehensive Income providing information on the performance for the year under review (Refer pages 159 and 160).
� Statement of Financial Position providing the information on the financial position of the Bank and the Group as at the year end (Refer page 161).
� Statement of Changes in Equity providing the movement in the shareholders’ funds during the year ended under review for the Bank and the Group (Refer pages 162 and 163).
� Statement of Cash Flow providing the information to the users, on the ability of the Bank and the Group to generate cash and cash equivalents and the needs for entities to utilise those cash flows (Refer pages 164 and 165);
2.5 Basis of measurement
The Financial Statements of the Group have been prepared on a historical cost basis, except for the following material items in the Statement of Financial Position:
Item Basis of Measurement Note Number Pages
Derivative financial instruments Fair value 24 195Financial assets recognised through profit
or loss - measured at fair value Fair value 25 196Financial assets measured at fair value
through other comprehensive income Fair value 28 206Investment property Fair value 31 211Freehold land and buildings Measured at cost at the time of acquisition and subsequently
measured at revalued amounts, which represented the fair value at the date of revaluation. 32 213
Retirement benefit obligations Recognised at the present value of the defined benefit obligations less the fair value of the assets of the plan. 41 228
Employee Share Option Scheme Fair value 46.3 236
� Notes to the Financial Statements, which comprise of the Accounting Policies and other explanatory notes and information (Refer pages 166 to 285).
The Consolidated Financial Statements of the Group and the separate Financial Statements of the Bank, have been prepared and presented in accordance with the Sri Lanka Accounting Standards (SLFRS and LKAS), laid down by The Institute of Chartered Accountants of Sri Lanka (CA Sri Lanka) and in compliance with the requirements of the Companies Act No. 7 of 2007 and the Banking Act No. 30 of 1988 and amendments thereto. These Financial Statements also provide appropriate disclosures as required by the listing rules of the Colombo Stock Exchange and the guidelines for the presentation of annual reports 2021 issued by the Institute of Chartered Accountants of Sri Lanka. The Group has also complied with directions/guidelines issued by the Central Bank of Sri Lanka, including the directions and guidelines issued for COVID-19 impact.
These Financial Statements, except for information on cash flows, have been prepared following the accrual basis of accounting. The Group did not adopt any inappropriate accounting treatment, which are not in compliance with the requirements of the SLFRSs and LKASs and regulations governing the preparation and presentation of the Financial Statements.
The formats used in the preparation and presentation of the Financial Statements and the disclosures made therein also comply with the specified formats prescribed by the Central Bank
of Sri Lanka (CBSL) in the Circular No. 02 of 2019 dated 18 January 2019, on “Publication of Annual and Quarterly Financial Statements and Other Disclosures by Licensed Banks”.
2.2 Functional and Presentation Currency
The Financial Statements of the Bank and the Group are presented in Sri Lanka Rupees (LKR) which is the currency of the primary economic environment in which the Bank and the Group operates. Financial information presented in Sri Lanka Rupees (LKR) has been rounded to the nearest thousand unless indicated otherwise.
2.3 Responsibility for the Financial Statements
The Board of Directors is responsible for these Financial Statements of the Group, in compliance with the Sri Lanka Accounting Standards (SLFRS and LKAS) and provisions of the Companies Act No. 7 of 2007 and listing rules of the Colombo Stock Exchange. The Board of Directors acknowledge their responsibility as set out in the ‘Annual Report of the Board of Directors’ on the affairs of the Bank, ‘Statement of Directors Responsibilities on Financial Reporting’ and the certification given on the ‘Statement of Financial Position’ on pages 12, 144 and 161 respectively.
2.4 Approval of the Financial Statements
The Financial Statements of the Bank and the Group for the year ended 31 December 2021 (including the comparative figures) have been approved and authorised for issue by the Board of Directors in accordance with the resolution of the Directors on 22 February 2022.

INSIDE INSIGHT FINANCIAL STATEMENTS
168
NOTES TO THE FINANCIAL STATEMENTS
2.6 Presentation of Financial Statements
The Group presents its Statement of Financial Position broadly in order of liquidity. An analysis regarding the recoveries and settlements within 12 months after the reporting date (current) and more than 12 months after the reporting date (non-current) is presented in Note 50 to the Financial Statements.
2.6.1 Rounding
The amounts in the Financial Statements have been rounded off to the nearest Rupees thousand, except where otherwise indicated as permitted by the Sri Lanka Accounting Standard - LKAS 1 on “Presentation of Financial Statements”.
2.6.2 Offsetting of Financial Assets and Liabilities
Financial assets and financial liabilities are offset and the net amount is reported in the Statement of Financial Position if, and only if, there is a enforceable legal right to offset the recognised amounts and there is an intention to settle on a net basis, or to realise the assets and settle the liabilities simultaneously.
Income and expenses are presented on a net basis only when it is permitted under SLFRSs, or for gains and losses arising from a group or similar transactions such as in the Group’s trading activity.
2.7 Materiality and Aggregation
In compliance with Sri Lanka Accounting Standards - LKAS 01 on ‘Presentation of Financial Statements’, each material class of similar items is presented separately in the Financial Statements. Items of dissimilar nature or functions are presented separately, unless they are immaterial.
2.8 Comparative Information
The comparative information is reclassified wherever necessary to conform to the current year’s presentation and the details of which are given in Note 54 to the Financial Statements.
2.9 Basis of Consolidation
The Consolidated Financial Statements comprise the Financial Statements of the Bank and its subsidiaries for the year ended 31 December 2021. The Financial Statements of the Bank’s subsidiaries are prepared for the same reporting year as the Bank, using consistent Accounting Policies.
All intra-group balances, income and expenses and unrealised gains and losses resulting from intra-group transactions
are eliminated in full in preparing the Consolidated Financial Statements.
Subsidiaries are fully-consolidated from the date on which, control is transferred to the Bank. Non- controlling interests represent the portion of profit or loss and net assets of subsidiaries not owned, directly or indirectly, by the Bank.
Non-controlling interests are presented separately in the Consolidated Statement of Profit or Loss and within equity in the Consolidated Statement of Financial Position, but separate from the Parent shareholders’ equity.
2.10 Foreign Currency Translation
(a) All foreign currency transactions are translated into the functional currency, which is Sri Lankan Rupees (LKR), using the exchange rates prevailing at the dates, the transactions were affected. Monetary assets and liabilities denominated in foreign currencies are retranslated at the middle exchange rate of the functional currency ruling, at the date of the Statement of Financial Position. The resulting gains and losses are accounted for in the Statement of Profit or Loss.
(b) Accordingly, transactions of the Foreign Currency Banking Unit have been recorded in accordance with Note (a) above. Net gains and losses are dealt within the Statement of Profit or Loss.
(c) Non-monetary assets and liabilities that are measured on a historical cost basis in foreign currency are translated using the exchange rates prevailing at that date. Non-monetary assets and liabilities measured at fair value in a foreign currency are translated using the exchange rates at the date when the fair value was determined.
(d) Forward exchange contracts are valued at the forward market rates prevailing at the date of the Statement of Financial Position. Profits or losses on such transactions are dealt within the Statement of Profit or Loss.
(e) As at the reporting date, the assets and liabilities of overseas subsidiaries/ associates are translated into the Bank’s presentation currency at the rate of exchange ruling at the date of the Statement of Financial Position and their profits and losses are translated at the weighted average exchange rates for the year. Exchange differences arising on translation are taken directly to a separate component of equity.
(f) On disposal of a foreign subsidiary/ associate, the deferred cumulative amount recognised in equity relating to that
particular foreign subsidiary/associate is recognised in the Statement of Profit or Loss in ‘other operating expenses’ or ‘other operating income’, respectively.
2.11 Significant Accounting Judgments, Estimates and Assumptions
In the process of applying the accounting policies of the Group, the Management is required to make judgments, which may have significant effects on the amounts recognised in the Financial Statements. Further, the Management is also required to consider key assumptions concerning the future and other key sources of estimation of uncertainty at the date of the Statement of the Financial Position that have a significant risk of causing a material adjustment to the carrying amounts of assets and liabilities within the next financial year. Actual results may differ from these estimates.
The key significant accounting judgments, estimates and assumptions for each type of assets, liabilities, income and expenses along with the respective carrying amounts of such items are presented along with the notes to the financial statements.
The following table includes the items that involve significant accounting judgements, estimates and assumptions in the preparations of the financial statements of the Group.
Notes to the Financial Statements
Note Page
Impairment charges 11 179Income tax expense 17 187Derivative financial instruments 24 195Financial assets recognised through profit or loss - measured at fair value 25 196Financial assets at amortised cost - debt and other instruments 27 204Financial assets measured at fair value through other comprehensive income 28 206Investment property 31 211Property, plant & equipment 32 213Right of use assets 33 217Intangible assets 34 219Retirement benefit obligations Provision for retirement
gratuity 41.1 228 Pension fund 41.2 230Fair value of financial instruments and non financial instruments 55 251

INSIDE INSIGHT FINANCIAL STATEMENTS
169
NOTES TO THE FINANCIAL STATEMENTS
2.11.1 Going Concern-basis of accounting
The Board of Directors of the Bank and its group companies have made an assessment of its ability to continue as a going concern and is satisfied that it has the resources to continue in business for the foreseeable future.
Furthermore, the Board of Directors is not aware of any material uncertainties that may cast significant doubt upon the ability of the Group to continue as a going concern. The Management has assessed the existing and anticipated effects of COVID-19 on the Bank and the Group companies and the appropriateness of the use of the going concern basis. During the year 2021, the Bank and its Group companies evaluated each customer segment of its businesses considering a wide range of factors under multiple stress tested scenarios, such as expected losses on moratoriums including the impact on Non-Performing Loans (NPL), which indicates increase stresses compared to 2020 and expected revenue streams, cost management, profitability, the ability to defer non-essential capital expenditure and the ability to continue providing services to ensure business is continued as least impacted as possible.
In determining the above significant management judgements, estimates and assumptions, the impact of the COVID-19 pandemic has been considered as of the reporting date and specific considerations have been disclosed under the relevant Notes. Therefore, the Financial Statements of the Group continue to be prepared on a going concern basis.
3. ACCOUNTING POLICIES
The Group has consistently applied the accounting policies for all periods presented in the financial statements. The Group has not early adopted any other standard, interpretation or amendment that has been issued but not yet effective. Apart from the general accounting policies set out below, the specific accounting policies pertaining to each item in the financial statements have been presented within the respective notes to the financial statements. These significant accounting policies have been applied consistently to all periods presented within the respective notes to the Financial Statements of the Group. The accounting policies have been consistently applied by the Group entities where applicable and deviations if any have been disclosed accordingly.
Accounting policy Note Page
Significant accounting policies - GeneralFinancial instruments 3.1 170
Significant accounting policies -Recognition of income and expensesGross income 4 174Net interest income 5 174Net fee and commission income 6 176Net gains/(losses) from trading 7 177Net gains/(losses) from financial assets at fair value through profit or loss 8 178Net gains/(losses) from derecognition of financial assets 9 178Other operating income 10 179Impairment charges 11 179Personnel expenses 12 185Depreciation and amortisation expenses 13 185Other expenses 14 186Income tax expenses 17 187
Significant accounting policies -Recognition of assets and liabilitiesBasic/Diluted EPS 18 189Dividend Per Share 19 190Cash and cash equivalents 21 193Placement with Bank 23 195Derivative financial instruments 24 195Financial assets recognised through profit or loss - measured at fair value 25 196Financial assets at amortised cost - loans and receivables to other customers 26 197Financial assets at amortised cost - debt and other instruments 27 204Financial assets measured at fair value through other comprehensive income 28 206Investments in subsidiary companies 29 209Investments in associate companies 30 211Investment property 31 211Property, plant & equipment 32 213Right of use assets 33 217Intangible assets 34 219Current tax receivables/liabilities 39 226Deferred tax assets/liabilities 40 226Other assets 35 220Due to banks 36 221Financial liabilities at amortised cost - Due to depositors 37.1 222Financial liabilities at amortised cost - Due to debt securities holders 37.2 223Financial liabilities at amortised cost - Due to other borrowers 37.3 224Debt securities issued 38 225Retirement benefit obligations 41 228

INSIDE INSIGHT FINANCIAL STATEMENTS
170
NOTES TO THE FINANCIAL STATEMENTS
3.1 Financial Instruments - SLFRS 9
The Group applies the requirements under SLFRS 9 - Financial Instruments in classifying, measuring, re-classifying and de-recognition of financial instruments.
3.1.1 Date of recognition
Financial assets and liabilities, with the exception of loans and receivables to other customers and balances due to depositors, are initially recognised on the trade date,
The trade date means the date that the Bank becomes a party to the contractual provisions of the instruments. This includes regular way trades: purchases or sales of financial assets that require delivery of assets within the time frame generally established by regulation or convention in the market place. Loans and receivables to other customers are recognised when funds are transferred to the customers’ accounts. The Bank recognises balances due to depositors when funds are transferred to the Bank.
3.1.2 Initial measurement of financial instruments
The classification of financial instruments at initial recognition depends on their contractual terms and the business model for managing the instruments, as described in Notes 3.1.4.(a) and (b). Financial instruments are initially measured at their fair value (as defined in Note 55), except in the case of financial assets and financial liabilities recorded at FVPL, transaction costs are added to, or subtracted from, this amount. Trade receivables of subsidiaries are measured at the transaction price. When the fair value of financial instruments at initial recognition differs from the transaction price, the Group accounts for the Day 1 profit or loss, as described below Note 3.1.3.
3.1.3 Day 1 profit or loss
When the transaction price of the instrument differs from the fair value at origination and the fair value is based on a valuation technique using only inputs observable in market transactions, the Group recognises the difference between the transaction price and fair value in the Statement of Profit or Loss over the tenor of the financial instrument using Effective Interest Rate method. In cases where fair value is based on models for which some of the inputs are not observable, the difference between the transaction price
and the fair value is deferred and is only recognised in the Statement of Profit or Loss when the inputs become observable, or when the instrument is derecognised.
3.1.4 Classification and subsequent measurement of financial assets and liabilities
The Group classifies all of its financial assets based on the business model for managing the assets and the asset’s contractual terms, measures at either:
� Fair Value through profit or loss (FVPL) as explained in Note 25.
� Amortised cost, as explained in Note 3.1.4.1.
� Fair Value through Other Comprehensive Income (FVOCI), as explained in Note 28.
The Bank measures its derivative portfolio at FVPL as explained in Notes 24.
Financial liabilities, other than loan commitments and financial guarantees, are measured at amortised cost or at FVPL when they are held for trading and financial liabilities designated upon initial recognition as at FVPL.
The subsequent measurement of financial assets/liabilities depends on their classification.
3.1.4 (a) Business model assessment
The Group determines its business model at the level that best reflects how it manages groups of financial assets to achieve its business objective.
The business model of the Group is not assessed on an instrument-by-instrument basis, but at a higher level of aggregated portfolios and is based on observable factors such as:
� How the performance of the business model and the financial assets held within that business model are evaluated and reported to the entity’s key management personnel.
� The risks that affect the performance of the business model (and the financial assets held within that business model) and, in particular, the way those risks are managed.
� How managers of the business are compensated (for example, whether the compensation is based on the fair value of the assets managed or on the contractual cash flows collected).
� The expected frequency, value and timing of sales are also important aspects of the assessment.
The business model assessment is based on reasonably expected scenarios without taking ‘worst case’ or ‘stress case’ scenarios into account.
If cash flows after initial recognition are realised in a way that is different from the original expectations, the Group does not change the classification of the remaining financial assets held in that business model, but incorporates such information when assessing newly originated or newly purchased financial assets going forward.
3.1.4. (b) Assessment of whether contractual cash flows are Solely Payments of Principle and Interests (SPPI test)
As a second step of its classification process the Group assesses the contractual terms of financial assets to identify whether they meet the SPPI test.
An entity has a business model to hold the financial asset to collect the contractual cash flows. The characteristics of the contractual cash flows are that of solely payments of the principal amount and interest (referred to as “SPPI”).
For the purpose of this assessment, principle is defined as the fair value of the financial asset at initial recognition and may change over the life of the financial asset (for example, if there are repayments of principal or amortisation of the premium/ discount).
The most significant elements of interest within a lending arrangement are typically the consideration for the time value of money and credit risk. To make the SPPI assessment, the Group applies judgement and considers relevant factors such as the currency in which the financial asset is denominated, and the period for which the interest rate is set.
3.1.4.1 Measurement of financial assets at amortised cost
Cash and cash equivalents, balances with the Central Bank of Sri Lanka, placements with banks, loans and receivables to other customers, financial assets at amortised cost debts and other instruments are measured at amortised cost by the Group.
The Group only measures financial assets at amortised cost if both of the following conditions are met and is not designated as at FVPL:

INSIDE INSIGHT FINANCIAL STATEMENTS
171
NOTES TO THE FINANCIAL STATEMENTS
� The financial asset is held within a business model with the objective to hold financial assets in order to collect contractual cash flows.
� The contractual terms of the financial asset give rise on specified dates to cash flows that are solely payments of principal and interest (SPPI) on the principal amount outstanding.
3.1.5 Reclassification of financial assets and liabilities
As per SLFRS 9, financial assets are not reclassified subsequent to their initial recognition, except and only in those rare circumstances when the Group changes its objective of the business model for managing such financial assets which may include the acquisition, disposal or termination of a business line.
Financial liabilities are not reclassified as such reclassifications are not permitted by SLFRS 9.
3.1.6 Derecognition of financial assets and financial liabilities other than for substantial modification
3.1.6 (a) Financial assets
A financial asset (or, where applicable, a part of a financial asset or part of a group of similar financial assets) is derecognised when the rights to receive cash flows from the financial asset have expired.
3.1.6 (b) Financial Liabilities
A financial liability is derecognised when the obligation under the liability is discharged, cancelled or expires.
3.2 Borrowing costs
As per the Sri Lanka Accounting Standard –LKAS 23 on “Borrowing Costs”, the Group capitalises borrowing costs that are directly attributable to the acquisition, construction or production of a qualifying asset as part of the cost of the asset. A qualifying asset is an asset which takes a substantial period of time to get ready for its intended use or sale. Other borrowing costs are recognised in the profit or loss in the period in which they occur.
3.3 Taxation
3.3.1 Current Tax and Deferred Tax
Details of “Income tax expense” and “Deferred tax assets and liabilities” are given in Note 17.
3.3.2 Value Added Tax (VAT) on Financial Services
Details of “Value Added Tax (VAT) on financial services”, are given in Note 15.
3.3.3 Crop Insurance Levy (CIL)
As per the provisions of the Section 14 of the Finance Act No. 12 of 2013, the CIL was introduced with effect from 01 April 2013 and is payable to the National Insurance Trust Fund. Currently, the CIL is payable at 1% of the profit after tax.
3.4 Bank’s Risk management framework
The Board of Directors of the Bank has the overall responsibility for the establishment and oversight of the Bank’s Risk Management Framework. The Risk Management Policy of the Bank translates overall risk appetite on business activities in a holistic approach to provide the guidance required for convergence
of strategic and risk perspectives of the Bank. The Board Integrated Risk Management Committee (IRMC) meets quarterly to review and assess the Bank’s overall risks and to focus on policy recommendations and strategies in an integrated manner and the Board of Directors are duly updated of its activities.
A detailed disclosure on how the risk management is carried out within the Bank’s Risk Management Framework with due consideration given to Credit risk, Market risk and Liquidity risk are given in the Notes to the Financial Statements Section on “Risk Management disclosures” on pages 262 to 285.
Credit Risk
Operational Risk
Market Risk
Liquidity Risk
Retail
Banking
Credit Risk
Operational Risk
Market Risk
Credit Risk
Operational Risk
Market Risk
Credit Risk
Operational Risk
Market Risk
Credit Risk
Operational Risk
Market Risk
Business
Banking
Wholesale
Banking
� Islamic Banking
� Micro Financing
� Refinance Operations
� Privilege Banking
Project and
Infrastructure
Financing (PIF)
Treasury
BANK
3.5 Changes in Accounting Policies
3.5.1 New and Amended accounting standards and interpretations
The Group applied for the first-time certain standards and amendments, which are effective for annual periods beginning on or after 1 January 2021 (unless otherwise stated). The Bank has not early adopted any other standard, interpretation or amendment that has been issued but is not yet effective.
Certain prior year figures and phrases have been rearranged in order to compatible with the presentation requirements of the Central Bank of Sri Lanka.
The other accounting policies adopted by the Group are consistent with those of the previous financial year.
3.5.2 Amendments to SLFRS 16 Leases: Covid-19-Related Rent Concessions beyond 30 June 2021
In December 2020, the Institute of Chartered Accountants of Sri Lanka (CA Sri Lanka) issued Covid-19-Related Rent Concessions - amendment to SLFRS -16 Leases. The amendments provide relief to lessees from applying SLFRS -16 guidance on lease modification accounting for rent concessions arising as a direct consequence of the Covid-19 pandemic. As a practical expedient, a lessee may elect not to assess whether

INSIDE INSIGHT FINANCIAL STATEMENTS
172
NOTES TO THE FINANCIAL STATEMENTS
a Covid-19 related rent concession from a lessor is a lease modification. A lessee that makes this election accounts for any change in lease payments resulting from the Covid-19 related rent concession the same way it would account for the change under SLFRS 16, if the change were not a lease modification.
The amendment was intended to apply until 30 June 2021, but as the impact of the Covid-19 pandemic is continuing, on 28 June 2021, CA Sri Lanka extended the period of application of the practical expedient to 30 June 2022. The amendment applies to annual reporting periods beginning on or after 1 April 2021.
3.5.3 Amendments to SLFRS 9, LKAS 39, SLFRS 7, SLFRS 4 and SLFRS 16 - Interest Rate Benchmark Reform Phase 1 and 2
IBOR reform Phase 1
On 15 January 2021, the Institute of Chartered Accountants of Sri Lanka (CA Sri Lanka) issued amendments to SLFRS 9, LKAS 39 and SLFRS 7 due to Interest Rate Benchmark Reform (Phase 1). A summary of Phase 1 amendments are as follows:
� Highly Probable Requirement: According to SLFRS 9 and LKAS 39, when a forecast transaction is designated as a hedged item, that transaction must be highly probable to occur. By the Phase 1 amendments, when determining whether a forecast transaction is highly probable, an entity shall assume that the interest rate benchmark on which the hedged cashflows are based is not altered as a result of the reform.
� Prospective assessments: A hedging relationship qualifies for hedge accounting only if there is an economic relationship between the hedged item and the hedging instrument (described in SLFRS 9) or the hedge is expected to be highly effective in achieving off-setting (described in LKAS 39). An entity must demonstrate such prospective assessments on a regular basis. By the Phase 1 amendments, when performing prospective assessments, an entity shall assume that the interest rate benchmark on which the hedged item, hedged risk and/or
hedging instrument are based is not altered as a result of the interest rate benchmark reform.
� LKAS 39 retrospective assessment: To apply hedge accounting under LKAS 39, an entity must demonstrate that the actual results of the hedge are within a range of 80% - 125%. This requirement is commonly known as the ‘LKAS 39 retrospective assessment’. By the Phase 1 amendments, an entity is not required to undertake the LKAS 39 retrospective assessment for hedging relationships directly affected by the reform. However, the entity must comply with all other LKAS 39 hedge accounting requirements, including the prospective assessment.
� Separately identifiable risk components: While there are some differences between SLFRS 9 and LKAS 39 regarding designation of risk components, both Standards require a risk component (or a portion) to be separately identifiable to be eligible for hedge accounting. An entity may designate an item in its entirety or a component of an item as a hedged item in a hedging relationship. SLFRS 9 and LKAS 39 require the component to be separately identifiable to qualify as a hedged item. By the Phase 1 amendments, for hedges of non-contractually specified benchmark component of interest rate risk, an entity shall apply the separately identifiable requirement only at the inception of such hedging relationships.
IBOR reform Phase 2
In addition to Phase 1 amendments, CA Sri Lanka also issued amendments to SLFRS 9, LKAS 39, SLFRS 7, SLFRS 4 and SLFRS 16 due to Interest Rate Benchmark Reform. The Phase 2 amendments provide temporary reliefs which address the financial reporting effects when an interbank offered rate (IBOR) is replaced with an alternative nearly risk-free interest rate (RFR). The amendments include the following practical expedients.
� A practical expedient require, contractual changes, or changes to cash flows that are directly required
by the reform, to be treated as changes to a floating interest rate, equivalent to a movement in a market rate of interest.
� Permit changes required by IBOR reform to be made to hedge designations and hedge documentation without the hedging relationship being discontinued.
� Provide temporary relief to entities from having to meet the separately identifiable requirement when an RFR instrument is designated as a hedge of a risk component.
The effective date of both IBOR reform Phase 1 and Phase 2 amendments is for annual reporting periods beginning on or after 1 January 2021 in the Sri Lankan context.
The requirements under phase 1 amendments have to be applied retrospectively. However, the reliefs only apply to hedging relationships that existed at the beginning of the reporting period in which an entity first applies those requirements or were designated thereafter, and to the amount accumulated in the cash flow hedge reserve that existed at the beginning of the reporting period in which an entity first applies those requirements. It follows that it is not possible to apply the reliefs retrospectively to hedge relationships that were not previously designated as such.
The requirements under phase 2 amendments have to be applied retrospectively. Hedge relationships are not designated retrospectively. However, discontinued hedging relationships must be reinstated if, and only if,
� The hedging relationship was discontinued solely due to changes required by the Reform, and, therefore, the entity would not have been required to discontinue that hedging relationship if the Phase 2 Amendments had been applied at that time and
� At the date of initial application of the Phase 2 Amendments, that discontinued hedge relationship continues to meet all the qualifying criteria for hedge accounting, after taking account of the Phase 2 Amendment.

INSIDE INSIGHT FINANCIAL STATEMENTS
173
As of 31 December 2021, the Group does not have any material impact from the IBOR Reform.
3.6 Standards issued but not yet effective
The new and amended standards and interpretations that are issued up to the date of issuance of the Group’s financial statements but are not effective for the current annual reporting period, are disclosed below. The Group intends to adopt these new and amended standards and interpretations, if applicable, when they become effective.
SLFRS 17 Insurance Contracts
Insurance Contracts : SLFRS 17 - Insurance Contracts effective for periods beginning on or after 01 January 2023. This standard is not applicable to the Group.
Amendments to LKAS 37 Provisions, Contingent Liabilities and Contingent Assets : Onerous Contracts – Costs of Fulfilling a Contract
On 25 March 2021, the Institute of Chartered Accountants of Sri Lanka (CA Sri Lanka) issued amendments to LKAS 37 Provisions, Contingent Liabilities and Contingent Assets (LKAS 37) to specify which costs an entity needs to include when assessing whether a contract is onerous or loss-making.
The amendments apply a “directly related cost approach”. The costs that relate directly to a contract to provide goods or services include both incremental costs and an allocation of costs directly related to contract activities. General and administrative costs do not relate directly to a contract and are excluded unless they are explicitly chargeable to the counterparty under the contract. The amendments are effective for annual reporting periods beginning on or after 1 January 2022. Earlier application is permitted.
Amendments to LKAS 16 Property, Plant & Equipment: Proceeds before Intended Use
On 25 March 2021, the Institute of Chartered Accountants of Sri Lanka (CA Sri Lanka) issued LKAS 16, Property, Plant and Equipment. - Proceeds before Intended Use, which prohibits entities deducting from the cost of an item
of property, plant and equipment, any proceeds from selling items produced while bringing that asset to the location and condition necessary for it to be capable of operating in the manner intended by management. Instead, an entity recognises the proceeds from selling such items, and the costs of producing those items, in profit or loss.
The amendment is effective for annual reporting periods beginning on or after 1 January 2022 and must be applied retrospectively to items of property, plant and equipment made available for use on or after the beginning of the earliest period presented when the entity first applies the amendment. The Group has not received Covid-19 related rent concessions.
Amendments to SLFRS 3 Business Combinations: Updating a reference to conceptual framework
On 23 March 2021, the Institute of Chartered Accountants of Sri Lanka (CA Sri Lanka) issued amendments to SLFRS 3 Business Combinations - Updating a Reference to the Conceptual Framework. The amendments are intended to replace a reference to the Framework for the Preparation and Presentation of Financial Statements, issued in 1989, with a reference to the Conceptual Framework for Financial Reporting issued in March 2018 without significantly changing its requirements.
An exception was also added to the recognition principle of SLFRS 3 to avoid the issue of potential ‘day 2’ gains or losses arising for liabilities and contingent liabilities that would be within the scope of LKAS 37 or IFRIC 21 Levies, if incurred separately. At the same time, it was decided to clarify existing guidance in SLFRS 3 for contingent assets that would not be affected by replacing the reference to the Framework for the Preparation and Presentation of Financial Statements. The amendments are effective for annual reporting periods beginning on or after 1 January 2022 and apply prospectively.
The Group is currently assessing the impact of the amendments to determine the impact they will have on the Group’s accounting policies. The amendments are not expected to have a materials impact on the Group.
NOTES TO THE FINANCIAL STATEMENTS

INSIDE INSIGHT FINANCIAL STATEMENTS
174
4 GROSS INCOME
ACCOUNTING POLICY
The Gross Income represents the Interest Income and the Non-Interest Income earned by the Group during the year.
Gross Income is recognised to the extent that it is probable that the economic benefits will flow to the Group and the revenue can be reliably measured. The specific recognition criteria, for each type of Gross Income are given under the respective notes.
BANK GROUP
For the year ended 31 December Note 2021 2020 2021 2020LKR ’000 LKR ’000 LKR ’000 LKR ’000
Interest income 5.1 52,692,866 53,003,875 52,794,763 53,153,100 Fee and commission income 6.1 5,634,797 4,268,945 7,384,660 5,452,706 Net gains/(losses) from trading 7 2,096,455 967,284 2,096,455 967,284 Net gains/(losses) from financial assets at fair value through profit or loss 8 433,106 96,353 560,482 113,683 Net gains/(losses) from derecognition of financial assets 9 186,248 1,486,023 186,248 1,486,300 Other operating income 10 1,067,059 853,886 1,060,265 477,658 Total 62,110,531 60,676,366 64,082,873 61,650,731
5 NET INTEREST INCOME
ACCOUNTING POLICY
Recognition of Interest Income and Interest Expenses
The Group uses the Effective Interest Rate (EIR) method for recognising the interest income and interest expenses of Financial Assets and Financial Liabilities that are measured at amortised cost, fair value through profit or loss or fair value through other comprehensive income under SLFRS 9 - Financial Instruments. EIR is the rate that exactly discounts estimated future cash payments or receipts through the expected life of the financial instrument or a shorter period, where appropriate, to the net carrying amount of the financial asset or the financial liability.
The carrying amount of financial assets or financial liabilities is adjusted if the Group revises their estimates of payments or receipts. The adjusted carrying amount is calculated based on the original EIR. The amortised cost is calculated by taking into account any discount or premium on an acquisition, fees and costs that are an integral part of the EIR. The change in the carrying amount is recorded as ‘interest income’ for financial assets and ‘Interest expenses’ for financial liabilities.
Interest income from the loans and receivables to other customers for the year ended 31 December 2020 includes the impact of the modification loss (Day 1 impact) for the Equated Monthly Instalment (EMI) loans considered for the moratoriums phase 1 as per the guidance notes issued by the CA Sri Lanka and in line with the requirement of SLFRS 09.
5.1 Interest Income
BANK GROUP
2021 2020 2021 2020LKR ’000 LKR ’000 LKR ’000 LKR ’000
Placements with banks 864,524 316,857 882,685 335,885 Financial assets recognised through profit or loss measured at fair value 65,435 127,824 75,783 127,824 Financial assets measured at fair value through other comprehensive income 5,737,646 6,107,654 5,755,331 6,207,247 Financial assets at amortised cost - loans and receivables to other customers 41,760,746 43,910,508 41,760,746 43,810,916 Financial assets at amortised cost - debt and other instruments 4,264,204 2,539,672 4,264,204 2,639,265 Other interest income 311 1,360 56,014 31,963 Total interest income (a) 52,692,866 53,003,875 52,794,763 53,153,100
NOTES TO THE FINANCIAL STATEMENTS

INSIDE INSIGHT FINANCIAL STATEMENTS
175
NOTES TO THE FINANCIAL STATEMENTS
5.2 Interest Expenses
BANK GROUP
2021 2020 2021 2020LKR ’000 LKR ’000 LKR ’000 LKR ’000
Due to banks 2,209,637 1,735,859 2,193,007 1,708,656 Financial liabilities at amortised cost Due to depositors 24,762,938 29,029,302 24,762,938 29,029,302 Due to debt securities holders 108,621 115,220 108,621 115,220 Due to other borrowers 1,478,860 1,982,964 1,478,860 1,982,964 Debt securities issued 2,510,042 2,392,081 2,510,042 2,392,081 Total interest expenses (b) 31,070,098 35,255,426 31,053,468 35,228,223
Net interest income (a)-(b) 21,622,768 17,748,449 21,741,295 17,924,877
5.3 Net Interest Income from Sri Lanka Government Securities
Interest income and interest expenses on Government Securities have been extracted from interest income and interest expenses given in Notes 5.1 and 5.2 respectively and disclosed separately, as required by the Guidelines issued by the Central Bank of Sri Lanka.
BANK & GROUP
2021 2020LKR ’000 LKR ’000
Interest incomeFinancial assets recognised through profit or loss measured at fair value 65,435 127,824 Financial assets measured at fair value through other comprehensive income 5,737,646 6,107,654 Financial assets measured at amortised cost - debt and other instruments 3,878,909 2,262,509
9,681,990 8,497,987
Less : Interest expensesFinancial liabilities at amortised cost - Due to debt securities holders 108,621 114,838 Net interest income from Sri Lanka Government Securities 9,573,369 8,383,149
5.4 Interest Income on Impaired Financial Assets
BANK & GROUP
2021 2020LKR ’000 LKR ’000
Interest income on impaired loans and receivables to other customers 918,112 775,663

INSIDE INSIGHT FINANCIAL STATEMENTS
176
NOTES TO THE FINANCIAL STATEMENTS
6 NET FEE AND COMMISSION INCOME
ACCOUNTING POLICY
Income from Fee-based Activities
Fee and Commission Income
The Group recognises the fee and commission earned from depositors and the loans and receivables to other customers as per the requirements of SLFRS 9 : Financial Instruments and all other fee and commission income are recognised based on the SLFRS 15: Revenue from contracts with customers.
The fee and commission income are recognised by the Group within the scope of SLFRS 15 (Revenue from contracts with customers) only when all of the following criteria are met:
(i) The parties to the contract have approved the contract (in writing, orally or in accordance with other customary business practices) obligations; and are committed to perform their respective obligations;
(ii) The entity can identify each party’s rights regarding the services to be transferred;
(iii) The entity can identify the payment terms for the services to be transferred;
(iv) The contract has commercial substance (ie the risk, timing or amount of the entity’s future cash flows is expected to change as a result of the contract); and
(v) It is probable that the entity will collect the consideration to which it will be entitled in exchange for the goods or services that will be transferred to the customer. In evaluating whether collectability of an amount of consideration is probable, an entity shall consider only the customer’s ability and intention to pay that amount of consideration when it is due. The amount of consideration to which the entity will be entitled may be less than the price stated in the contract if the consideration is variable because the entity may offer the customer a price concession.
Fees and commission income that are earned from financial assets and financial liabilities, are recognised at the Effective Interest Rate (EIR) and is accounted in the Statement of Profit or Loss over the life of the instrument. Other fees and commission income on account servicing fees, investment management, fees for underwriting, advisory work, loan syndication and all other fees and commissions earned during the normal course of the business of the Group, and are recognised as related services that are performed on an accrual basis. If a loan commitment is not expected to result in the draw-down of a loan, then the related loan commitment fees are recognised on a straight-line basis over the commitment period.
Income from Financial Guarantees
The Bank issues financial guarantees, consisting of letters of credit, guarantees and acceptances, in the normal course of its business activities. Financial guarantees are initially recognised in the Statement of Financial Position as a contingent liability at the guarantee value. The premium received is recognised in the Statement of Profit or Loss on a straight-line basis over the life time of the guarantee and the balance amount to be amortised to the Statement of Profit or Loss after the reporting date, is recognised in the Statement of Financial Position, as Other Liabilities.
Rental Income
The Group recognises the rental income arising from operating leases including the investment property on an accrual basis by equalising the rental income over the tenure of the rent agreement in line with the requirement of SLFRS 16-Leases.
Fee and Commission Expenses
Fee and commission expenses mainly relates to transactions of Loans and receivables to other customers and service fees, which are paid when the services are received. Fee and commission expenses are recognised on an accrual basis.
BANK GROUP
2021 2020 2021 2020LKR ’000 LKR ’000 LKR ’000 LKR ’000
Fee and commission income (Note 6.1) 5,634,797 4,268,945 7,384,660 5,452,706 Less: Fee and commission expenses (Note 6.2) 33,260 18,661 33,260 18,661 Net Fee and commission income 5,601,537 4,250,284 7,351,400 5,434,045

INSIDE INSIGHT FINANCIAL STATEMENTS
177
NOTES TO THE FINANCIAL STATEMENTS
BANK GROUP
2021 2020 2021 2020LKR ’000 LKR ’000 LKR ’000 LKR ’000
6.1 Fee and commission income onCards 1,200,547 893,379 1,200,547 893,379 Due to depositors 289,528 300,419 289,528 300,419 Guarantees 902,881 602,117 902,881 602,117 Loans and receivables to other customers 1,292,043 1,336,597 1,292,043 1,336,597 Remittances 353,872 264,066 353,872 264,066 Trade finance 1,170,491 592,413 1,170,491 592,413 Other financial services 292,528 162,757 364,612 316,649 Bancassuarance 129,743 113,884 129,743 113,884 Investment banking and wealth management - - 1,051,889 615,893 Brokerage - - 416,664 214,054 Rental income 3,164 3,313 212,390 203,235 Total (a) 5,634,797 4,268,945 7,384,660 5,452,706
BANK GROUP
2021 2020 2021 2020LKR ’000 LKR ’000 LKR ’000 LKR ’000
6.2 Fee and commission expenses onLoans and receivables to other customers 5,665 11,522 5,665 11,522 Other financial services 27,595 7,139 27,595 7,139 Total (b) 33,260 18,661 33,260 18,661
Net Fee and commission income (a)-(b) 5,601,537 4,250,284 7,351,400 5,434,045
7 NET GAINS/(LOSSES) FROM TRADING
ACCOUNTING POLICY
Net gains/(losses) from trading includes the unrealised gains/(losses) derived from revaluation of the foreign exchange contracts and other derivative financial instruments. All derivative financial instruments are fair valued at each reporting date as per the SLFRS 09 - Financial Instruments.
BANK GROUP
2021 2020 2021 2020LKR ’000 LKR ’000 LKR ’000 LKR ’000
Income from foreign exchange contractsWith banks 1,485,014 551,190 1,485,014 551,190 With other customers 611,441 416,094 611,441 416,094 Total 2,096,455 967,284 2,096,455 967,284

INSIDE INSIGHT FINANCIAL STATEMENTS
178
NOTES TO THE FINANCIAL STATEMENTS
8 NET GAINS/(LOSSES) FROM FINANCIAL ASSETS AT FAIR VALUE THROUGH PROFIT OR LOSS
ACCOUNTING POLICY
Net gains/ (losses) from financial assets at fair value through Profit or Loss comprises all realised and unrealised fair value changes, related capital gains and losses derived from the financial assets classified as financial assets recognised through profit or loss measured at fair value.
BANK GROUP
2021 2020 2021 2020LKR ’000 LKR ’000 LKR ’000 LKR ’000
Financial assets recognised through profit or loss measured at fair valueRealised/ unrealised revaluation gains/(losses); Investment in unit trusts 432,458 61,424 474,991 171,629 Sri Lanka Government Securities - treasury bills/bonds 648 34,929 648 34,929 Equity securities - - 84,843 (92,875)Total 433,106 96,353 560,482 113,683
9 NET GAINS/(LOSSES) FROM DERECOGNITION OF FINANCIAL ASSETS
ACCOUNTING POLICY
All realised gains and losses from derecognition of financial assets classified as financial assets measured at amortised cost and financial assets measured at fair value through other comprehensive income are given below.
BANK GROUP
2021 2020 2021 2020LKR ’000 LKR ’000 LKR ’000 LKR ’000
Financial assets - Measured at Fair Value through Other Comprehensive IncomeDebt securities 186,248 1,486,023 186,248 1,486,023
Financial assets - Measured at Amortised CostDebt securities - - - 277 Total 186,248 1,486,023 186,248 1,486,300
10 OTHER OPERATING INCOME
ACCOUNTING POLICY
Other operating income includes capital gains/(losses), dividend income, foreign exchange gains, disposal gains/(losses) from property, plant & equipment and gains from investment properties.
Dividend Income
Dividend income from group investments in subsidiary companies and associate companies and other investments in quoted and non quoted shares are recognised when the Group’s right to receive the payment is established.
Foreign Exchange Gains
The change in exchange rate differences arising from the valuation of the retained profits held in foreign currency is included under ‘foreign exchange gains’.

INSIDE INSIGHT FINANCIAL STATEMENTS
179
NOTES TO THE FINANCIAL STATEMENTS
ACCOUNTING POLICY
Gains/(Losses) on disposal of Property, Plant & Equipment
Gains/(losses) on disposal of property, plant & equipment represent the difference between the sales proceeds and the net book value of property, plant & equipment that are disposed during the year.
Gains/(Losses) on Investment Properties
Gains/(losses) from investment properties arise from the changes in the fair values of investment properties and are included in the Statement of Profit or Loss, in the year in which they arise. The valuation methodology and the basis of valuation adopted by the Group is explained in detail in Note 31 on page 211.
BANK GROUP
2021 2020 2021 2020LKR ’000 LKR ’000 LKR ’000 LKR ’000
Dividend income from securities - Quoted investments 33,597 43,882 48,124 52,882 - Non-quoted investments 39,119 49,584 39,119 66,703 Dividend income from group investments - Non-quoted investments 206,918 500,742 - - Foreign exchange gains/(losses) 769,874 252,033 774,030 251,394 Gains/(losses) on disposal of property, plant & equipment 6,778 1,758 14,213 1,864 Gains/(losses) on investment properties (Note 31) - - 153,004 108,113 Others 10,773 5,887 31,775 (3,298)Total 1,067,059 853,886 1,060,265 477,658
11 IMPAIRMENT CHARGES
ACCOUNTING POLICY
The Group recognises the impairment (Expected Credit Loss) on financial instruments assessed as per SLFRS 9 - “Financial Instruments”. Further, the Group also recognises an impairment loss when the carrying amount of a non-financial asset exceeds the estimated recoverable amount from that asset.
Overview of the Expected Credit Loss (ECL)
The Group records the allowance for expected credit loss for all loans and receivable and other financial assets not held at Fair Value through Profit or Loss (FVPL), together with loan commitments, financial guarantee contracts and letters of credit which are referred to as ‘financial instruments’. Equity instruments are not subject to impairment under SLFRS 9.
The Expected Credit Loss (ECL) allowance is based on the credit losses expected to arise over the life of the asset [The Life Time
Expected Credit Loss (LTECL)], unless there has been no significant increase in credit risk since origination, in which case, the allowance is based on the 12 months’ Expected Credit Loss (12 m ECL). The Group’s policies for determining if there has been a significant increase in credit risk are set out in Note 56.3.4.5.
The 12 months ECL is the portion of life time ECLs that represent the ECLs that result from default events on a financial instruments that are possible within the 12 months after the reporting date.
Both Life time ECLs and 12 months ECLs are calculated either on an individual basis or a collective basis, based on a predetermined threshold of customer exposures. If a particular loan is credit impaired under individual impairment the amount of loss is measured as the difference between the carrying amount of the asset and the present value of estimated future cash flows. If the individually assessed asset is determined that it is not credit impaired under individual
impairment, such financial assets are then collectively assessed for any impairment along with other portfolios having similar risk characteristics under collective impairment. The Group’s policy for grouping financial assets measured on a collective basis is explained in Note 56.3.4.6.
The Group has established a policy to perform an assessment, at the end of each reporting period, of whether a financial instrument’s credit risk has increased significantly since initial recognition, by considering the change in the risk of default occurring over the remaining life of the financial instrument. This is further explained in Note 56.3.4.5.
As per SLFRS 9, the Group adopts a three stage model for impairment based on changes in credit quality since initial recognition.

INSIDE INSIGHT FINANCIAL STATEMENTS
180
NOTES TO THE FINANCIAL STATEMENTS
11 IMPAIRMENT CHARGES (CONTD.)
ACCOUNTING POLICY
STAGE 1
A financial asset that is not originally credit-impaired on initial recognition is classified in Stage 1. Financial instruments in Stage 1 have their ECL measured at an amount equal to the proportion of LTECL that result from default events possible within the next 12 months (12M ECL).
STAGE 2
Financial asset is moved to Stage 2 if a significant increase in credit risk (SICR) since origination is identified and the Group records an allowance for LTECL.
STAGE 3
If a financial asset is credit impaired (as outlined in Note 56.3.4.1), it is moved to Stage 3 and the Group recognises an allowance for LTECL, with probability of default at 100%.
Purchased or Originated Credit Impaired (POCI) Financial Assets:
Financial assets which are credit impaired on initial recognition are categorised within Stage 3 with a carrying value already reflecting the LTECL. The Group does not have Purchased or Originated Credit Impaired (POCI) loans as at the reporting date.
The calculation of Expected Credit Loss (ECL)
The Group calculates ECLs under the three staging approach to measure the expected cash shortfalls, discounted at an approximation to the Effective Interest Rate (EIR). A cash shortfall is the difference between the cash flows that are due to an entity in accordance with the contract and the cash flows that the entity expects to receive.
The calculation of ECLs, including the estimation of the expected period of exposure and discount rate is made on an individual basis or on a collective basis as per the Group’s impairment policy. The collective assessments are made separately for portfolio of facilities with similar credit risk characteristics.
The mechanics of the ECL calculations are outlined below and the key elements, Probability of Default (PD), Exposure at Default (EAD) and Loss Given Default (LGD) under collective impairment assessment are as follows:
PD
The Probability of Default (PD) is an estimate of the likelihood of default over a given time horizon. A default may only happen at a certain time over the assessed period, if the facility has not been previously derecognised and is still in the portfolio. The concept of PDs is further explained in Note 56.3.4.2.
EAD
The Exposure at Default (EAD) is an estimate of the exposure at a future default date, taking into account expected changes in the exposure after the reporting date, including repayments of principal and interest, whether scheduled by contract or otherwise, expected drawdowns on committed facilities. To calculate EAD for a stage 1 loan, the Group assesses the possible default events within 12 months. For all other loans, the EAD is considered for defaualt events over the life time of the financial instruments. The EAD is further explained in Note 56.3.4.3.
LGD
The Loss Given Default (LGD) is an estimate of the loss arising in the case where a default occurs at a given time. It is based on the difference between the contractual cash flows due and those that the lender would expect to receive, including from the realisation of any collateral. It is usually expressed as a percentage of the EAD. The LGD is further explained in Note 56.3.4.3.
The above parameters are generally derived from internally developed statistical models and historical data and then adjusted to reflect forward looking information.
When estimating the ECLs, the Group considers three scenarios (a base case, best case and worse case) of EFA. When relevant, the assessment of multiple scenarios are also incorporated to assess how defaulted loans are expected to be recovered, including the probability that the loans will cure and the value of collateral or the amount that might be received for selling the asset.
With the exception of Credit cards and other revolving facilities, for which the treatment is separately set out below under “Credit cards and other revolving facilities”, the maximum period for which the credit losses are determined is the contractual life of a financial instrument unless the Group has the legal right to call it earlier.
Provisions for ECLs for undrawn loan commitments are assessed as set out below under “Loan commitments and letters of
credit”. The calculation of ECLs (including the ECLs related to the undrawn element) of revolving facilities such as credit cards is explained below under “Credit cards and other revolving facilities”.
Forward looking information
The Group incorporates forward looking information into both its assessment as to whether the credit risk of an instrument has increased significantly since its initial recognition and its measurement of ECL. When estimating the ECLs, the Group considers three economic scenarios (base case, best case and worse case). Quantitative economic factors are based on economic data and forecasts published by CBSL and other reliable sources.
In its ECL models, the Group relies on a broad range of forward looking information as economic inputs, such as:
� Quantitative factors - GDP growth, Unemployment, Inflation, Interest rate and Exchange rate
� Qualitative factors - Government policies and management outlook on delinquencies etc.
The inputs and models used for calculating ECLs may not always capture all characteristics of the market at the date of the Financial Statements.
Detailed information about these inputs and sensitivity analysis are provided in Note 56.3.4.7.
Credit cards and other revolving facilities
The Bank’s product offering includes a variety of corporate and retail overdraft and credit cards facilities, in which the Bank has the right to cancel and/or reduce the facilities within a short period of time. The Bank does not limit its exposure to credit losses to the contractual notice period, but, instead calculates ECL over a period that reflects the Bank’s expectations of the customer behaviour, its likelihood of default and the Bank’s future risk mitigation procedures, which could include reducing or cancelling the facilities. Based on past experience and the Bank’s expectations, the period over which the Bank calculates ECLs for these products, is one year for corporate and one year for retail products. For credit cards and revolving facilities that include both a loan and an undrawn commitment, ECLs are calculated and presented together with the loan.

INSIDE INSIGHT FINANCIAL STATEMENTS
181
NOTES TO THE FINANCIAL STATEMENTS
ACCOUNTING POLICY
The ongoing assessment of whether a significant increase in credit risk has occurred for revolving facilities is similar to other lending products. This is based on shifts in the customer’s number of days past due, as explained in Note 56.3.4.5, but greater emphasis is also given to qualitative factors also.
The interest rate used to discount the ECLs for credit cards is based on the average effective interest rate that is expected to be charged over the expected period of exposure to the facilities. This estimation takes into account that many facilities are repaid in full each month and are consequently charged no interest.
Loan commitments and letters of credit:
When estimating LTECLs for undrawn loan commitments, the Group estimates the expected portion of the loan commitment that will be drawn down over its expected life. The ECL is then based on the present value of the expected shortfalls in cash flows if the loan is drawn down. The expected cash shortfalls are discounted at an approximation to the expected EIR of the loan. For loan commitments and letters of credit, the ECL is recognised within provisions.
Financial guarantee contracts
The Bank’s liability under each guarantee is measured at the higher of the amount initially recognised less cumulative amortisation recognised in the Statement of Profit or Loss and the ECL provision. For this purpose, the Bank estimates ECLs based on the present value of the expected payments to reimburse the holders for a credit loss that it incurs. The shortfalls are discounted by the risk- adjusted interest rate relevant to the exposure. The calculation is made using a probability weighting of the three scenarios. The ECLs related to financial guarantee contracts are recognised within provisions.
Impairment of Debt Instruments
The Group does not have historical loss experience on debt instruments at amortised cost and debt instruments at FVOCI. Thus the Group considers PDs based on the rating scales of external rating agencies as at 31 December 2021.
LGD for all debt instruments are based on the guideline issued by the Central Bank of Sri Lanka. Further, the Group applied the Economic Factor Adjustment based on the
macro economic factor model. EAD of a debt instrument is its gross carrying amount.
Recognition of impairment on Financial Assets measured at Fair Value through Other Comprehensive Income (FVOCI)
The ECLs for debt instruments measured at FVOCI do not reduce the carrying amount of these financial assets in the Statement of Financial Position, which remains at fair value. Instead, an amount equal to the allowance that would arise if the assets were measured at amortised cost is recognised in OCI as an accumulated impairment amount, with a corresponding charge to the Statement of Profit or Loss. The accumulated loss recognised in OCI is recycled to the Statement of Profit or Loss upon derecognition of the assets.
Collateral valuation
To mitigate its credit risks on financial assets, the Bank seeks to use collateral, where possible. The collateral comes in various forms, such as cash, securities, letters of credit/guarantees, real estate, receivables, inventories, other non-financial assets.
However, the fair value of collateral affects the calculation of ECLs. It is generally assessed, at inception and re-assessed on a regular basis. Details of the impact of the Bank’s various credit enhancements are disclosed in Note 56.3.4.11.
To the extent possible, the Bank uses active market data for valuing financial assets held as collateral. Other financial assets which do not have readily determinable market values are valued using models. Non-financial collateral, such as real estate, is valued based on data provided by third parties such as independent valuation specialists.
Collateral repossessed
In its normal course of business, the Bank does not physically repossess properties or other assets in its retail portfolio, but engages external agents to recover funds, generally at auction, to settle outstanding debt. Any surplus funds are returned to the customers/obligors. As a result of this practice, assets under legal repossession processes are not recorded on the Statement of Financial Position.
The Bank’s policy is to sell the repossessed assets at the earliest possible opportunity. Such collaterals repossessed are held on a memorandum basis without derecognising the underlying receivable.
Write-offs
Financial assets are written off either partially or in their entirety only when the Bank has stopped pursuing the recovery. If the amount to be written off is greater than the accumulated loss allowance, the difference is first treated as an addition to the impairment that is then applied against the gross carrying amount. Any subsequent recoveries are credited to the Statement of Profit or Loss.
Forborne and modified loans (restructured/rescheduled loans)
The Group sometimes makes concessions or modifications to the original terms of loans as a response to the borrower’s financial difficulties, rather than taking possession or to otherwise enforce collection of collateral. The Group considers a loan forborne when such concessions or modifications are provided as a result of the borrower’s present or expected financial difficulties and the Group would not have agreed to them if the borrower had been financially healthy. Indicators of financial difficulties include defaults on covenants. Forbearance may involve extending the payment arrangements and the agreement of new loan conditions. Once the terms have been renegotiated, any impairment is measured using the original EIR as calculated before the modification of terms. It is the Group’s policy to monitor forborne loans to help ensure that future payments continue to be likely to occur. Derecognition decisions and classification between Stage 2 and Stage 3 are determined on a case-by-case basis.
When the loan has been renegotiated or modified but not derecognised, the Group also reassesses whether there has been a significant increase in credit risk. Accordingly, all rescheduled loans are classified as Stage 3 unless upgraded due to satisfactory performing period as specified in the Direction on ‘Guidelines to Licensed Banks on the Adoption of Sri Lanka Accounting Standard - SLFRS 9: Financial Instruments’ issued by the Central Bank of Sri Lanka. Further loans which have been restructured are classified as stage 2 or 3 based on the number of times restructured unless upgraded due to satisfactory performing period as specified in the said Guidelines.

INSIDE INSIGHT FINANCIAL STATEMENTS
182
NOTES TO THE FINANCIAL STATEMENTS
11 IMPAIRMENT CHARGES (CONTD.)
ACCOUNTING POLICY
Significant Accounting Judgements, Estimates and Assumptions on Impairment losses on financial assets
The measurement of impairment losses under SLFRS 9 across all categories of financial assets requires judgement, in particular, the estimation of the amount and timing of future cash flows and collateral values when determining impairment losses and the assessment of a significant increase in credit risk. These estimates are driven by a number of factors, changes in which can result in different levels of impairment allowances. Accounting judgements, estimates and assumptions are reviewed regularly and revisions to the same are recognised prospectively.
The Group’s ECL calculations are outputs of complex models with a number of underlying assumptions regarding the choice of variable inputs and their interdependencies. Elements of the ECL models that are considered accounting judgements and estimates include;
� The Group’s criteria for assessing if there has been a significant increase in credit risk and so allowances for financial assets should be measured on a LTECL basis and the qualitative assessment.
� The segmentation of financial assets when their ECL is assessed on a collective basis.
� Development of ECL models, including the various formulas and the choice of inputs.
� Determination of associations between macroeconomic scenarios and economic inputs such as unemployment levels and collateral values, and the effect on PDs, EADs and LGDs.
� Selection of forward-looking macroeconomic scenarios and their probability weightings to derive the economic inputs into the ECL models.
Management overlays on impairment provisions due to COVID-19 pandemic
Given the high degree of uncertainty surrounding the short-term economic outlook the management exercised judgements in the assessment of the impact of the COVID 19 outbreak on the loans and receivables of the Group relying more on the long term economic outlook and considering various relief measures. The impact of the pandemic was reassessed and adjusted in the financial statements based on the information available as at the reporting date.
The Group considered the following management overlays to the model in computing expected credit loss provisions
at the end of the period to mitigate any unforeseen increased credit risk in addition to the expected credit loss resulted from the modelled computation.
� The economic assumptions applied in respect of forward-looking information were adjusted significantly to reflect the development of the pandemic by increasing the weightage given to worst case scenario and adjusting the other factors as required.
� Staging of the facilities included in the identified risk elevated industries were moved to a higher stage where necessary to capture the significant increase in credit risk due to COVID-19.
� Staging of the facilities of the customers who availed the CBSL moratorium schemes continuously were moved to a higher stage where necessary to capture increased credit risk due to the pandemic.
11.1 Impairment Charges During the Year
BANK GROUP
For the year ended 31 December Note 2021 2020 2021 2020LKR ’000 LKR ’000 LKR ’000 LKR ’000
Charges/(reversals) to the Statement of Profit or Loss;Loans and receivables to other customers - Impairment on individually significant loans 11.2 4,545,698 3,840,595 4,545,698 3,840,595 - Impairment on collective loan portfolio 11.2 2,767,668 1,999,847 2,767,668 1,999,847 Impairment on contingent liabilities and commitments 11.2 863,553 390,699 863,553 390,699 Total impairment charges for loan and receivables to other customers
and contingent liabilities and commitments26.6
(a) 8,176,919 6,231,141 8,176,919 6,231,141 Total impairment charges on financial assets 11.2 2,075,775 562,506 2,075,775 562,506 Impairment charges on investments in subsidiaries 11.2 11,968 2,689 - - Total 10,264,662 6,796,336 10,252,695 6,793,647

INSIDE INSIGHT FINANCIAL STATEMENTS
183
NOTES TO THE FINANCIAL STATEMENTS
11.2 Analysis of Impairment Charges - Stagewise Impairment
A further analysis of the impairment charges on financial instruments for the year are given below.
BANK GROUP
Current Year 2021 Stage 1 Stage 2 Stage 3 Total Stage 1 Stage 2 Stage 3 TotalLKR ’000 LKR ’000 LKR ’000 LKR ’000 LKR ’000 LKR ’000 LKR ’000 LKR ’000
Impairment on loans and receivables
Financial assets at amortised cost - loans and receivables to other customers 785,846 1,517,408 5,010,112 7,313,366 785,846 1,517,408 5,010,112 7,313,366
Individual impairment - 330,412 4,215,286 4,545,698 - 330,412 4,215,286 4,545,698 Collective impairment 785,846 1,186,996 794,826 2,767,668 785,846 1,186,996 794,826 2,767,668 Contingent liabilities and
commitments [Note 48.1 (b)] 573,389 66,084 224,080 863,553 573,389 66,084 224,080 863,553 Total impairment charges on
loans and receivables to other customers and contingent liabilities and commitments [Note 26.6 (a)] 1,359,235 1,583,492 5,234,192 8,176,919 1,359,235 1,583,492 5,234,192 8,176,919
Impairment on financial assetsCash and cash equivalents (330) - - (330) (330) - - (330)Placements with banks (Note
23.1) 1,762 - - 1,762 1,762 - - 1,762 Financial assets at amortised cost
- debt and other instruments [Note 27.1 (d)] 1,938,768 - - 1,938,768 1,938,768 - - 1,938,768
Financial assets measured at fair value through other comprehensive income 135,574 - - 135,574 135,574 - - 135,574
Total impairment charges on financial assets 2,075,775 - - 2,075,776 2,075,775 - - 2,075,775
Impairment charges on investments in subsidiaries (Note 29.1) 11,968 - - 11,968 - - - -
Total impairment charges 3,446,978 1,583,492 5,234,192 10,264,662 3,435,010 1,583,492 5,234,192 10,252,695

INSIDE INSIGHT FINANCIAL STATEMENTS
184
NOTES TO THE FINANCIAL STATEMENTS
11.2 Analysis of Impairment Charges - Stagewise Impairment (Contd.)
BANK GROUP
Previous Year 2020 Stage 1 Stage 2 Stage 3 Total Stage 1 Stage 2 Stage 3 TotalLKR ’000 LKR ’000 LKR ’000 LKR ’000 LKR ’000 LKR ’000 LKR ’000 LKR ’000
Impairment on loans and receivables
Financial assets at amortised cost - loans and receivables to other customers 502,913 961,147 4,376,382 5,840,442 502,913 961,147 4,376,382 5,840,442
Individual impairment - 731,419 3,109,176 3,840,595 - 731,419 3,109,176 3,840,595 Collective impairment 502,913 229,728 1,267,206 1,999,847 502,913 229,728 1,267,206 1,999,847 Contingent liabilities and
commitments [Note 48.1 (b)] 287,237 108,391 (4,929) 390,699 287,237 108,391 (4,929) 390,699 Total impairment charges on
loans and receivables to other customers and contingent liabilities and commitments [Note 26.6 (a)] 790,150 1,069,538 4,371,453 6,231,141 790,150 1,069,538 4,371,453 6,231,141
Impairment on financial assetsCash and cash equivalents 682 - - 682 682 - - 682 Placements with banks (Note
23.1) (1,206) - - (1,206) (1,206) - - (1,206)Financial assets at amortised cost
- debt and other instruments [Note 27.1 (d)] 547,905 - 19,318 567,223 547,905 - 19,318 567,223
Financial assets measured at fair value through other comprehensive income (4,193) - - (4,193) (4,193) - - (4,193)
Total impairment charges on financial assets 543,188 - 19,318 562,506 543,188 - 19,318 562,506
Impairment charges on investments in subsidiaries (Note 29.1) 2,689 - - 2,689 - - - -
Total impairment charges 1,336,027 1,069,538 4,390,771 6,796,336 1,333,338 1,069,538 4,390,771 6,793,647
12 PERSONNEL EXPENSES
ACCOUNTING POLICY
Personnel expenses include salaries and bonus, terminal benefit charges, share-based payments and other related expenses. The provisions for bonus is recognised when it is probable that an outflow of resources, embodying economic benefits will be required to settle the obligation and a reliable estimate can be made on the amount of the obligation.
Defined Contribution Plans
A defined contribution plan is a post employment benefit plan under which an entity pays fixed contributions into a separate entity (a fund) and will have no legal or constructive obligation to pay further contributions if the fund does not hold sufficient assets to pay all employee benefits relating to employee services in the current and prior periods, as defined in the Sri Lanka Accounting Standard - LKAS 19 (Employee Benefits).
Employees’ Provident Fund and Employees’ Trust Fund
Employees are eligible for Employees’ Provident Fund contributions and Employees’ Trust Fund contributions, in accordance with the respective statutes and regulations. The Bank contributes 15% and 3% of gross salaries of employees to the Bank’s Employees’ Provident Fund and the Employees’ Trust Fund respectively. Group companies contribute 12% and 3% of gross salaries of employees to the Employees’ Provident Fund of Central Bank of Sri Lanka and Employees’ Trust Fund respectively.
The above expenses are identified as contributions to ‘Defined Contribution Plans’ as defined in the Sri Lanka Accounting Standard - LKAS 19.

INSIDE INSIGHT FINANCIAL STATEMENTS
185
NOTES TO THE FINANCIAL STATEMENTS
ACCOUNTING POLICY
Defined Benefit Plans
A defined benefit plan is a post-employment benefit plan other than a defined contribution plan. Accordingly, the pension fund and staff gratuity were considered as defined benefit plans as per Sri Lanka Accounting Standard - LKAS 19, Employee Benefits. The contributions to the defined benefit plans are recognised in the Statement of Profit or Loss, based on an actuarial valuation carried out for the gratuity liability and the pension fund of the Group in accordance with LKAS 19.
The basis of measurement, assumptions used in actuarial valuations are given in detail in Note 41 to these Financial Statements.
BANK GROUP
2021 2020 2021 2020LKR ’000 LKR ’000 LKR ’000 LKR ’000
Salary and bonus 4,592,791 4,190,779 5,161,532 4,672,452 Contribution to Employees’ Provident Fund 405,119 377,473 439,044 414,502 Contribution to Employees’ Trust Fund 81,024 75,495 89,202 86,075
Contribution to defined benefit plan - Pension Fund [Note 41.2 (a)] 14,633 16,625 14,633 16,625 - Gratuity [Note 41.1 (a)] 141,933 138,712 162,972 163,965 Others 436,507 372,463 455,368 394,834 Total 5,672,007 5,171,547 6,322,751 5,748,453
Remuneration paid to Executive Directors are included under salary and bonus as they are not entitled to emoluments as Non-Executive Directors.
13 DEPRECIATION AND AMORTISATION EXPENSES
ACCOUNTING POLICY
Useful Life Time of Property, Plant & Equipment and Depreciation
Depreciation is calculated on a straight-line basis over the useful life of the assets, commencing from the date when the assets are available for use, since this method closely reflects the expected pattern of consumption of the future economic benefits embodied in the assets. No depreciation is charged in the month of disposal of the asset and the Group do not charge depreciation on freehold land. The depreciation rates are determined separately for each significant part of the assets.
The Group reviews the residual values, useful lives and methods of depreciation of property, plant & equipment at each reporting date. Judgment of the management is exercised in the estimation of these values, rates, methods and hence they are subject to uncertainty.
The estimated useful lives of the assets for the year ended 31 December 2021 and 2020, are as follows:
Period (Years) % per Annum
Freehold buildings 50 2.00Leasehold buildings 5 20.00Motor vehicles 4 25.00Office equipment and furniture 5 20.00Computer equipment - ATMs 8 12.50Computer equipment - Servers 6 16.67Computer equipment - iPads * 4 25.00Computer equipment - Others 5 20.00Mobile Phones * 3 33.33Sundry fittings 4 25.00
* With effect from 01 September 2021, Mobile phones & iPads were segregated according to their useful life based on technical assessment & above rates are compatible with the rates used by the Group Companies.

INSIDE INSIGHT FINANCIAL STATEMENTS
186
13 DEPRECIATION AND AMORTISATION EXPENSES (CONTD.)
Amortisation of Intangible Assets
Intangible assets are amortised using the straight-line method to write down the cost over its estimated useful economic lives and the useful life for the years ended 31 December 2021 and 2020 are given as follows:
Class of Assets Period (Years) % per Annum
Computer software - Application software 6 16.67Computer software - Data Base Software 8 12.50Computer software - Operating System software 8 12.50Computer software - Utility Software 6 16.67Computer software - Others 5-10 20.00-10.00
Above rates are compatible with the rates used by the Group Companies.
Depreciation of Right of Use Assets
Depreciation is calculated using the straight-line method over the tenor of the lease agreements and it is recognised in the Statement of Profit or Loss.
An analysis of depreciation and amortisation expenses are given below.
BANK GROUP
2021 2020 2021 2020LKR ’000 LKR ’000 LKR ’000 LKR ’000
Own assetsDepreciation of property, plant & equipment (Note 32.1 & 32.4) 408,247 407,741 446,850 481,941Amortisation of intangible assets (Note 34.1) 114,270 133,075 120,007 133,956Assets under operating leasesDepreciation of right of use assets (Note 33) 309,126 277,766 347,254 315,702Total 831,643 818,582 914,111 931,599
14 OTHER EXPENSES
ACCOUNTING POLICY
Other expenses include operating expenses of the Group which are recognised in the Statement of Profit or Loss on the basis of a direct association between the cost incurred and the earning of specific items of income and are recognised on an accrual basis.
BANK GROUP
2021 2020 2021 2020LKR ’000 LKR ’000 LKR ’000 LKR ’000
Directors’ emoluments 32,048 31,560 42,953 38,580Auditors’ remuneration Audit fees and expenses 10,225 9,714 16,116 15,325 Audit related fees and expenses 6,014 8,023 6,110 8,711 Non-audit fees and expenses* 1,598 3,333 2,592 6,673Professional and legal expenses 38,574 37,622 51,184 62,957Donations 15,994 11,370 20,209 15,370Office administration and establishment expenses 1,598,247 1,443,447 1,716,994 1,695,115Deposit insurance expenses 469,209 456,288 469,209 456,288Others 1,758,819 1,407,967 1,952,543 1,421,979Total 3,930,728 3,409,324 4,277,910 3,720,998
Directors’ emoluments consists of fees paid to Non-Executive Directors. Remunerations paid to Executive Directors are included under salary and bonus in Note 12.
* In addition to the above, an amount of LKR 1.4 Mn (2020-0.3 Mn) in relation to the on going core banking project which is included under software under development in Note 34.2, had been paid to the auditors during the year.
NOTES TO THE FINANCIAL STATEMENTS

INSIDE INSIGHT FINANCIAL STATEMENTS
187
NOTES TO THE FINANCIAL STATEMENTS
15 VALUE ADDED TAX ON FINANCIAL SERVICES
ACCOUNTING POLICY
Value Added Tax (VAT) on financial services is calculated in accordance with Value Added Tax Act, No. 14 of 2002 and subsequent amendments thereto. The base for the computation of Value Added Tax on
financial services is the accounting profit before income tax and emoluments payable to employees, which is adjusted for the depreciation of property, plant & equipment computed at the prescribed rates. The emoluments payable include aggregate of
both benefits in money and benefits not in money payable to the employees and any contribution or provision in relating to terminal benefits. The regulatory tax rate applicable for the current year was 15%. (2020 - 15%).
BANK & GROUP
2021 2020LKR ’000 LKR ’000
Value Added Tax on financial services 2,014,671 1,818,832 Total 2,014,671 1,818,832
16 SHARE OF ASSOCIATE COMPANIES’ PROFITS/(LOSSES)
The Group’s share of profits/(losses) of an investment in an associate company which is recognised as per the equity method, is shown on the face of the Statement of Profit or Loss outside operating profits. The Bank has not recognised profits/(losses) from its associate company, Ayojana Fund (Pvt) Limited, as the company is under liquidation. Please refer Note 30 to these Financial Statements.
17 INCOME TAX EXPENSES
ACCOUNTING POLICY
As per Sri Lanka Accounting Standard - LKAS 12, Income Taxes, income tax expense is the aggregate amount included in determination of profit or loss for the period in respect of current and deferred taxation. Income tax expense is recognised in the Statement of Profit or Loss, except to the extent it relates to items recognised directly in equity or other comprehensive income in which case it is recognised in equity or in other comprehensive income.
Current tax
Current tax consists of the expected tax payable to or receivable from the taxation authorities for the year and any adjustment to the tax payable or receivable in respect of previous years. The tax rates and tax laws used to compute the amount are those that are enacted or substantively enacted on the reporting date. Current tax also includes any tax arising from dividends. Accordingly, provision for taxation is based on the profit for the year adjusted for taxation purposes in accordance with the provisions of the Inland Revenue Act, No. 24 of 2017 (w.e.f. 01 April 2018) and amendments there to, at the rates specified in Note 17.2 of these Financial Statements.
Provision for taxation of the foreign subsidiaries is made on the basis of the accounting profit for the year, as adjusted for taxation purposes, in accordance with the provisions of the relevant statutes in those countries, using the tax rates enacted or substantively enacted as at the reporting date.
Deferred Tax
Deferred tax is recognised for temporary differences between the tax bases of assets and liabilities and their carrying amounts for financial reporting purposes. Deferred tax liabilities are recognised for all taxable temporary differences, except:
� Where the deferred tax liability arises from the initial recognition of goodwill or of an asset or liability in a transaction that is not a business combination and, at the time of the transaction, affects neither the accounting profit nor taxable profit or loss.
� In respect of taxable temporary differences associated with investments in subsidiaries and associates, where the timing of the reversal of the temporary differences can be controlled and it is probable that the temporary differences will not reverse in the foreseeable future.
Deferred tax assets are recognised for all deductible temporary differences, carried forward unused tax credits and unused tax losses (if any), to the extent that it is probable that taxable profit will be available against which the deductible temporary differences, carried forward unused tax credits and unused tax losses can be utilised except:
� Where the deferred tax asset relating to the deductible temporary differences arising from the initial recognition of an asset or liability in a transaction that is not a business combination and, at the time of the transaction, affects neither the accounting profit nor taxable profit or loss.
� In respect of deductible temporary differences associated with investments in subsidiaries and associates, deferred tax assets are recognised only to the extent that it is probable that the temporary differences will reverse in the foreseeable future and taxable profit will be available against which the temporary differences can be utilised.
The carrying amount of deferred tax assets is reviewed at each reporting date and reduced to the extent that it is probable that sufficient taxable profit will be available to allow the deferred tax asset to be utilised. Unrecognised deferred tax assets are reassessed at each reporting date and are recognised to the extent that it has become probable that future taxable profit will allow the deferred tax asset to be recovered. Deferred tax assets and liabilities are measured at the tax rates that are expected to apply in the year when the asset is realised or the liability is settled, based on tax rates (and tax laws) that have been enacted or substantively enacted at the reporting date. Current and deferred tax assets and liabilities are offset only to the extent that they relate to income taxes imposed by the same taxation authority, there is a legal right and intentions to settle on a net basis and it is allowed under the tax laws of the relevant jurisdiction. Details of deferred tax liabilities/(assets) are given in Note 40 to the Financial Statements.

INSIDE INSIGHT FINANCIAL STATEMENTS
188
17 INCOME TAX EXPENSES (CONTD.)
ACCOUNTING POLICY
IFRIC Interpretation 23 “Uncertainty over Income Tax Treatment”
The Interpretation addresses the accounting for income taxes when tax treatments involve uncertainty that affects the application of LKAS 12, Income Taxes. It does not apply to taxes or levies outside the scope of LKAS 12, nor does it specifically include requirements relating to interest and penalties associated with uncertain tax treatments. The Interpretation specifically addresses the following:
� Whether an entity considers uncertain tax treatments separately
� The assumptions an entity makes about the examination of tax treatments by taxation authorities
� How an entity determines taxable profit (tax loss), tax bases, unused tax losses, unused tax credits and tax rates
� How an entity considers changes in facts and circumstances
The Group applies IFRIC Interpretation 23, “Uncertainty Over Income Tax Treatment” in determination of taxable profit, tax bases, unused tax losses, unused tax credits and tax rates, when there is uncertainty over the income tax treatment. The Group determines whether to consider each uncertain tax
treatment separately or together with one or more other uncertain tax treatments and uses the approach that better predicts the resolution of the uncertainty. The Group applies significant judgement in identifying uncertainties over income tax treatments. It assessed whether the Interpretation had an impact on its consolidated Financial Statements. Upon adoption of the Interpretation, the Group considered whether it has any uncertain tax positions. Accordingly the Group has already estimated and recorded the probable effect of uncertainty over income tax treatment in its consolidated Financial Statements.
Significant Accounting Estimates & Assumptions
The amount of current tax receivable or payable is the best estimate of the tax amount expected to be received or paid that reflects uncertainty related to income taxes, if any.
Management periodically evaluates the positions taken in the tax returns, with respect to situations in which applicable tax regulations are subject to interpretation and establishes provisions where appropriate. Significant management judgment is required to determine the amount of deferred tax assets that can be recognised, based upon the likely timing and level of future taxable profits together with future tax planning strategies.
The components of the income tax expenses for the years ended 31 December 2021 and 2020 are:
BANK GROUP
2021 2020 2021 2020LKR ’000 LKR ’000 LKR ’000 LKR ’000
Current tax expenseTaxation based on the profit for the year 3,247,443 3,059,137 3,484,244 3,373,775 Under/(over) provision in respect of previous years (316,226) (254,608) (337,655) (244,820)Total current tax expense 2,931,217 2,804,529 3,146,589 3,128,955
Deferred tax expenseDeferred tax reversal (Note 40.2) (1,000,231) (947,347) (995,312) (955,985)Total income tax charged to the Statement of Profit or Loss (Note 17.1) 1,930,986 1,857,182 2,151,277 2,172,970 Effective tax rate (including deferred tax) (%) 23 25 23 29Effective tax rate (excluding deferred tax) (%) 35 38 34 42
17.1 Reconciliation of the Accounting Profit to Income Tax Expenses
BANK GROUP
2021 2020 2021 2020LKR ’000 LKR ’000 LKR ’000 LKR ’000
Profit before taxation 8,293,462 7,387,658 9,214,007 7,390,318 Income tax expenses for the year (accounting profit @ applicable tax rate) 1,959,290 1,902,166 2,231,100 2,184,007 Income tax expenses for the year (dividend @ applicable tax rate) 18,166 83,189 42,748 246,289 Tax effect on Disallowable expenses 3,622,454 3,328,149 3,654,105 3,426,519 Tax deductible expenses (1,828,543) (1,844,992) (1,919,785) (2,073,665) Exempt income (523,924) (409,375) (523,924) (409,375)Taxation based on the profits for the year 3,247,443 3,059,137 3,484,244 3,373,775 Under/(over) provision in respect of previous years (316,226) (254,608) (337,655) (244,820)Total current tax expense 2,931,217 2,804,529 3,146,589 3,128,955 Deferred tax reversal (Note 40.2) (1,000,231) (947,347) (995,312) (955,985)Total income tax charged to the Statement of Profit or Loss 1,930,986 1,857,182 2,151,277 2,172,970
NOTES TO THE FINANCIAL STATEMENTS

INSIDE INSIGHT FINANCIAL STATEMENTS
189
NOTES TO THE FINANCIAL STATEMENTS
17.2 Applicable Income Tax Rates
The applicable income tax rates of the Bank and the subsidiary companies for the years 2021 and 2020 are as follows:
Dividend received out of taxable profits are liable to income tax at 14%.
2021 2020% %
National Development Bank PLC 24 28NDB Capital Holdings Limited 24 28Development Holdings (Pvt) Limited 24 28NDB Investment Bank Limited 24 28NDB Securities (Pvt) Limited 24 28NDB Wealth Management Limited 24 28NDB Zephyr Partners Lanka (Pvt) Limited Exempt 14NDB Zephyr Partners Limited (Mauritius)* 15 15NDB Capital Limited (Bangladesh)** 0.6 0.6
*The Company is, however, entitled to a tax credit equivalent to the higher of actual foreign tax suffered or 80% of the Mauritius tax chargeable on its foreign source income.
**The applicable tax rate for the company is 37.5%. However, a minimum tax provision of 0.6% on gross receipts is applicable for loss making companies.
The income tax rate of 28% was reduced to 24% retrospectively with effect from 01 January 2020 with the legalisation of the Inland Revenue (Amendment) Act, No. 10 of 2021 during the current period. However, current and deferred tax provisions for the year ended 31 December 2020 were calculated at the rate of 28% on the basis that the said amendment was not considered to be “substantially enacted” as per LKAS 12 - Income Taxes as at end of the previous reporting period. The Group reassessed the current and deferred tax liabilities/ assets as at the end of the previous reporting period in compliance with the said amendment during the current period.
17.3 The Deferred Tax (Credit)/Charge in the Statement of Profit or Loss Comprise the Following:
BANK GROUP
2021 2020 2021 2020LKR ’000 LKR ’000 LKR ’000 LKR ’000
(Reversal)/origination of deferred tax liabilities (213,897) 10,301 (260,369) 29,009 Origination of deferred tax assets (786,334) (957,648) (734,943) (984,994)Deferred tax (credit)/charge to the Statement of Profit or Loss (1,000,231) (947,347) (995,312) (955,985)
18 BASIC/DILUTED EARNINGS PER SHARE
ACCOUNTING POLICY
The Group presents basic and diluted Earning per Share (EPS) data for its ordinary shares. Basic EPS is calculated by dividing the profit or loss attributable to ordinary equity shareholders of the Bank by the weighted average number of ordinary shares outstanding during the period. Diluted EPS is determined by adjusting both the profit attributable to the ordinary equity shareholders and the weighted average number of ordinary shares outstanding, for the effects of all dilutive potential ordinary shares, if any.
Earnings per Share: Basic/Diluted
BANK GROUP
2021 2020 2021 2020
Amount used as the numeratorProfit attributable to equity holders of the parent (LKR ’000) 6,362,476 5,530,476 6,904,263 5,116,806Amount used as the denominatorWeighted average number of ordinary shares [Note 18.1] 307,670,139 232,637,231 307,670,139 232,637,231Basic/diluted earnings per share (LKR) 20.68 23.77 22.44 21.99
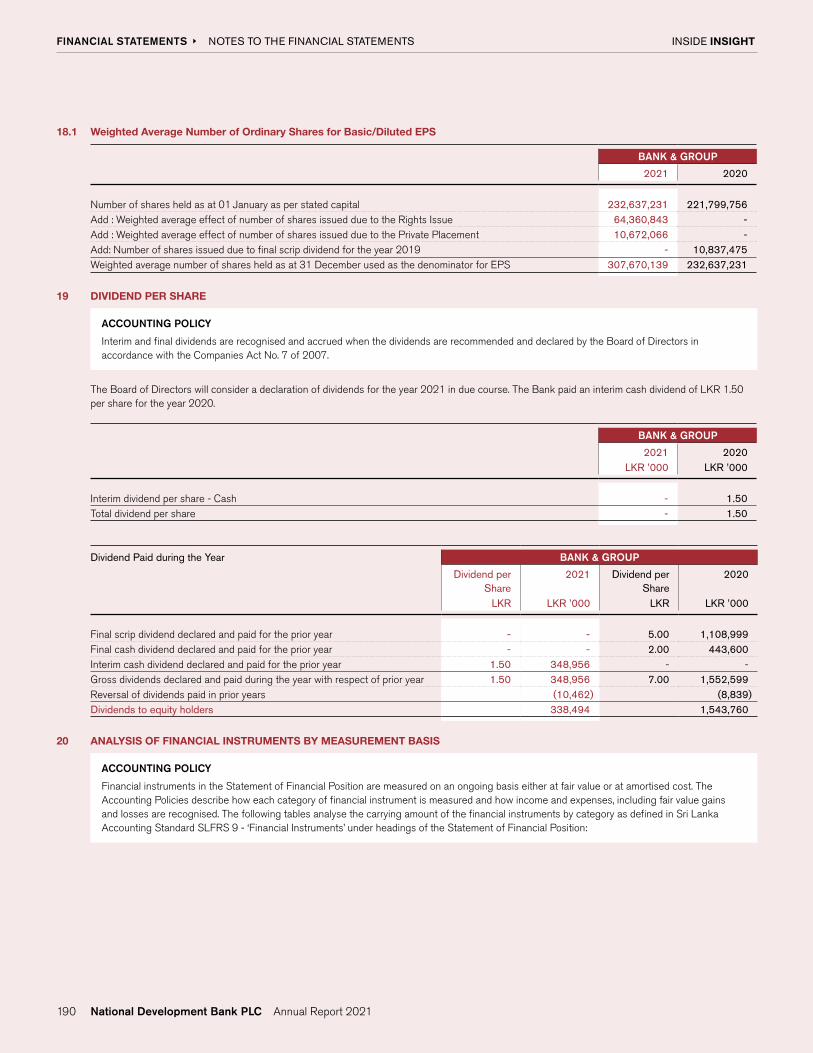
INSIDE INSIGHT FINANCIAL STATEMENTS
190
18.1 Weighted Average Number of Ordinary Shares for Basic/Diluted EPS
BANK & GROUP
2021 2020
Number of shares held as at 01 January as per stated capital 232,637,231 221,799,756 Add : Weighted average effect of number of shares issued due to the Rights Issue 64,360,843 - Add : Weighted average effect of number of shares issued due to the Private Placement 10,672,066 - Add: Number of shares issued due to final scrip dividend for the year 2019 - 10,837,475 Weighted average number of shares held as at 31 December used as the denominator for EPS 307,670,139 232,637,231
19 DIVIDEND PER SHARE
ACCOUNTING POLICY
Interim and final dividends are recognised and accrued when the dividends are recommended and declared by the Board of Directors in accordance with the Companies Act No. 7 of 2007.
The Board of Directors will consider a declaration of dividends for the year 2021 in due course. The Bank paid an interim cash dividend of LKR 1.50 per share for the year 2020.
BANK & GROUP
2021 2020LKR ’000 LKR ’000
Interim dividend per share - Cash - 1.50 Total dividend per share - 1.50
Dividend Paid during the Year BANK & GROUP
Dividend per Share
2021 Dividend per Share
2020
LKR LKR ’000 LKR LKR ’000
Final scrip dividend declared and paid for the prior year - - 5.00 1,108,999 Final cash dividend declared and paid for the prior year - - 2.00 443,600 Interim cash dividend declared and paid for the prior year 1.50 348,956 - -Gross dividends declared and paid during the year with respect of prior year 1.50 348,956 7.00 1,552,599 Reversal of dividends paid in prior years (10,462) (8,839)Dividends to equity holders 338,494 1,543,760
20 ANALYSIS OF FINANCIAL INSTRUMENTS BY MEASUREMENT BASIS
ACCOUNTING POLICY
Financial instruments in the Statement of Financial Position are measured on an ongoing basis either at fair value or at amortised cost. The Accounting Policies describe how each category of financial instrument is measured and how income and expenses, including fair value gains and losses are recognised. The following tables analyse the carrying amount of the financial instruments by category as defined in Sri Lanka Accounting Standard SLFRS 9 - ‘Financial Instruments’ under headings of the Statement of Financial Position:
NOTES TO THE FINANCIAL STATEMENTS

INSIDE INSIGHT FINANCIAL STATEMENTS
191
BANK
Fair value through
profit or loss
Amortised cost
Fair value through other
comprehensive income
Total
As at 31 December 2021 LKR ’000 LKR ’000 LKR ’000 LKR ’000
AssetsCash and cash equivalents - 13,411,819 - 13,411,819 Balances with the Central Bank of Sri Lanka - 16,403,362 - 16,403,362 Placements with banks - 8,299,403 - 8,299,403Derivative financial instruments 1,338,204 - - 1,338,204 Financial assets recognised through profit or loss - measured at fair value 2,441,833 - - 2,441,833 Financial assets at amortised cost - loans and receivables to other customers - 502,509,458 - 502,509,458 Financial assets at amortised cost - debt and other instruments - 54,262,976 - 54,262,976 Financial assets measured at fair value through other comprehensive income - - 89,552,196 89,552,196 Other financial assets - 1,446,327 - 1,446,327 Total financial assets 3,780,037 596,333,345 89,552,196 689,665,578
BANK
Fair value through
profit or loss
Amortised cost
Total
As at 31 December 2021 LKR ’000 LKR ’000 LKR ’000
LiabilitiesDue to banks - 24,770,644 24,770,644 Derivative financial instruments 1,048,644 - 1,048,644 Financial liabilities at amortised cost - due to depositors - 552,039,792 552,039,792 Financial liabilities at amortised cost - due to debt securities holders - 1,341,060 1,341,060 Financial liabilities at amortised cost - due to other borrowers - 25,228,865 25,228,865 Debt securities issued - 27,960,731 27,960,731 Other financial liabilities - 2,911,821 2,911,821 Total financial liabilities 1,048,644 634,252,913 635,301,557
GROUP
Fair value through
profit or loss
Amortised cost
Fair value through other
comprehensive income
Total
As at 31 December 2021 LKR ’000 LKR ’000 LKR ’000 LKR ’000
AssetsCash and cash equivalents - 13,765,270 - 13,765,270 Balances with the Central Bank of Sri Lanka - 16,403,362 - 16,403,362 Placements with banks - 8,299,403 - 8,299,403 Derivative financial instruments 1,338,204 - - 1,338,204 Financial assets recognised through profit or loss - measured at fair value 4,784,124 - - 4,784,124 Financial assets at amortised cost - loans and receivables to other customers - 502,344,786 - 502,344,786 Financial assets at amortised cost - debt and other instruments - 54,262,976 - 54,262,976 Financial assets measured at fair value through other comprehensive income - - 89,696,611 89,696,611 Other financial assets - 2,218,351 - 2,218,351 Total financial assets 6,122,328 597,294,148 89,696,611 693,113,087
NOTES TO THE FINANCIAL STATEMENTS

INSIDE INSIGHT FINANCIAL STATEMENTS
192
20 ANALYSIS OF FINANCIAL INSTRUMENTS BY MEASUREMENT BASIS (CONTD.)
GROUP
Fair value through
profit or loss
Amortised cost
Total
As at 31 December 2021 LKR ’000 LKR ’000 LKR ’000
LiabilitiesDue to banks - 24,821,158 24,821,158 Derivative financial instruments 1,048,644 - 1,048,644 Financial liabilities at amortised cost - due to depositors - 551,256,595 551,256,595 Financial liabilities at amortised cost - due to debt securities holders - 1,341,060 1,341,060 Financial liabilities amortised cost - due to other borrowers - 25,228,865 25,228,865 Debt securities issued - 27,960,731 27,960,731 Other financial liabilities - 3,252,900 3,252,900 Total financial liabilities 1,048,644 633,861,309 634,909,953
BANK
Fair value through
profit or loss
Amortised cost
Fair value through other
comprehensive income
Total
As at 31 December 2020 LKR ’000 LKR ’000 LKR ’000 LKR ’000
AssetsCash and cash equivalents - 10,487,608 - 10,487,608 Balances with the Central Bank of Sri Lanka - 6,812,099 - 6,812,099 Placements with banks - 12,401,533 - 12,401,533 Derivative financial instruments 1,429,470 - - 1,429,470 Financial assets recognised through profit or loss - measured at fair value 5,574,175 - - 5,574,175 Financial assets at amortised cost - loans and receivables to other customers - 425,605,508 - 425,605,508 Financial assets at amortised cost - debt and other instruments - 44,711,640 - 44,711,640 Financial assets measured at fair value through other comprehensive income - - 108,593,183 108,593,183 Other financial assets - 931,137 - 931,137 Total financial assets 7,003,645 500,949,525 108,593,183 616,546,353
BANK
Fair value through
profit or loss
Amortised cost
Total
As at 31 December 2020 LKR ’000 LKR ’000 LKR ’000
LiabilitiesDue to banks - 24,173,318 24,173,318 Derivative financial instruments 1,016,787 - 1,016,787 Financial liabilities at amortised cost - due to depositors - 490,278,126 490,278,126 Financial liabilities at amortised cost - due to debt securities holders - 1,500,007 1,500,007 Financial liabilities at amortised cost - due to other borrowers - 34,284,109 34,284,109 Debt securities issued - 19,880,891 19,880,891 Other financial liabilities - 3,117,943 3,117,943 Total financial liabilities 1,016,787 573,234,394 574,251,181
NOTES TO THE FINANCIAL STATEMENTS

INSIDE INSIGHT FINANCIAL STATEMENTS
193
GROUP
Fair value through
profit or loss
Amortised cost
Fair value through other
comprehensive income
Total
As at 31 December 2020 LKR ’000 LKR ’000 LKR ’000 LKR ’000
AssetsCash and cash equivalents - 10,778,947 - 10,778,947 Balances with the Central Bank of Sri Lanka - 6,812,099 - 6,812,099 Placements with banks - 12,401,533 - 12,401,533 Derivative financial instruments 1,429,470 - - 1,429,470 Financial assets recognised through profit or loss - measured at fair value 7,713,222 - - 7,713,222 Financial assets at amortised cost - loans and receivables to other customers - 425,681,832 - 425,681,832 Financial assets at amortised cost - debt and other instruments - 44,711,640 - 44,711,640 Financial assets measured at fair value through other comprehensive income - - 108,762,972 108,762,972 Other financial assets - 1,243,156 - 1,243,156 Total financial assets 9,142,692 501,629,207 108,762,972 619,534,871
GROUP
Fair value through
profit or loss
Amortised cost
Total
As at 31 December 2020 LKR ’000 LKR ’000 LKR ’000
LiabilitiesDue to banks - 24,173,318 24,173,318 Derivative financial instruments 1,016,787 - 1,016,787 Financial liabilities at amortised cost - due to depositors - 489,658,746 489,658,746 Financial liabilities at amortised cost - due to debt securities holders - 1,500,007 1,500,007 Financial liabilities amortised cost - due to other borrowers - 34,284,109 34,284,109 Debt securities issued - 19,880,891 19,880,891 Other financial liabilities - 3,458,397 3,458,397 Total financial liabilities 1,016,787 572,955,468 573,972,255
21 CASH AND CASH EQUIVALENTS
ACCOUNTING POLICY
For the purpose of reporting in the Statement of Financial Position, cash and cash equivalents comprise of cash in hand and balances with banks. The cash in hand comprises of both local currency and foreign currency. Balances with banks represent local and foreign Nostro accounts. The balances of cash in hand are recorded at book value and the balances with banks are carried at amortised cost in the Statement of Financial Position.
BANK GROUP
2021 2020 2021 2020LKR ’000 LKR ’000 LKR ’000 LKR ’000
Cash in hand Local currency 6,913,746 5,556,795 6,913,838 5,556,938 Foreign currency 32,678 106,375 32,686 106,375Balances with banks Local currency 349,810 196,425 491,337 238,962 Foreign currency 6,116,254 4,629,012 6,328,078 4,877,671Sub Total 13,412,488 10,488,607 13,765,939 10,779,946Less : Impairment allowance (Note 21.1) 669 999 669 999Total 13,411,819 10,487,608 13,765,270 10,778,947
NOTES TO THE FINANCIAL STATEMENTS

INSIDE INSIGHT FINANCIAL STATEMENTS
194
NOTES TO THE FINANCIAL STATEMENTS
21.1 Movement in impairment allowance during the year
BANK GROUP
2021 2020 2021 2020LKR ’000 LKR ’000 LKR ’000 LKR ’000
Stage 1Balance as at 01 January 999 317 999 317 Charges/(reversals) for the year (330) 682 (330) 682 Balance as at 31 December 669 999 669 999
22 BALANCES WITH THE CENTRAL BANK OF SRI LANKA
ACCOUNTING POLICY
Balances with the Central Bank of Sri Lanka include the cash balance that is required to be maintained with the Central Bank of Sri Lanka as per the provisions of the Monetary Law Act. The Monetary Law Act requires that all commercial banks operating in Sri Lanka to maintain a statutory reserve on all deposit liabilities denominated in Sri Lankan Rupees. There is no reserve requirement for foreign currency deposits liabilities of the Domestic Banking Unit (DBU) and the deposit liabilities of the Offshore Banking Unit (OBU) in Sri Lanka. Balances with the Central Bank of Sri lanka is carried at amortised cost in the Statement of Financial Position.
The minimum cash reserve requirement to be maintained by the Bank during the year was as follows.
Deposit type Period Reserve Requirement
(SRR)
Period Reserve Requirement
(SRR)2021 2020
All Rupee deposit liabilities01.01.2021 - 31.08.2021 2.0% 01.01.2020 - 15.03.2020 5.0%01.09.2021 - 31.12.2021 4.0% 16.03.2020 - 15.06.2020 4.0%
16.06.2020 - 31.12.2020 2.0%
BANK GROUP
2021 2020 2021 2020LKR ’000 LKR ’000 LKR ’000 LKR ’000
Statutory balances with the Central Bank of Sri Lanka 16,403,362 6,812,099 16,403,362 6,812,099Total 16,403,362 6,812,099 16,403,362 6,812,099

INSIDE INSIGHT FINANCIAL STATEMENTS
195
NOTES TO THE FINANCIAL STATEMENTS
23 PLACEMENTS WITH BANKS
ACCOUNTING POLICY
Placements with Banks include short-term deposits placed in banks and are subjected to insignificant risk of changes in fair value, and are used by the Group in the management of its short-term commitments. These are recorded in the Financial Statements at the face values or the gross values, where appropriate, net of impairment charges.
BANK GROUP
2021 2020 2021 2020LKR ’000 LKR ’000 LKR ’000 LKR ’000
Placements - in local banks 8,301,494 12,401,862 8,301,494 12,401,862 Less : Impairment allowance (Note 23.1) 2,091 329 2,091 329Total 8,299,403 12,401,533 8,299,403 12,401,533
23.1 Movement in impairment allowance during the year
BANK GROUP
2021 2020 2021 2020LKR ’000 LKR ’000 LKR ’000 LKR ’000
Stage 1Balance as at 01 January 329 1,535 329 1,535 Charges/(reversals) for the year 1,762 (1,206) 1,762 (1,206)Balance as at 31 December 2,091 329 2,091 329
24 DERIVATIVE FINANCIAL INSTRUMENTS
ACCOUNTING POLICY
A derivative is a financial instrument or other contract with all three of the following characteristics:
� Its value changes in response to the change in a specified interest rate, financial instrument price, commodity price, foreign exchange rate, index of prices or rates, credit rating or credit index, or other variable, provided that, in the case of a non-financial variable, it is not specific to a party to the contract.
� It requires no initial net investment or an initial net investment that is smaller than would be required for other types of contracts expected to have a similar response to changes in market factors.
� It is settled at a future date.
The Bank uses derivatives such as forward foreign exchange contracts and currency swaps/options. Bank has not designated any derivatives as hedging instruments and has not followed hedge accounting as at the reporting date. All derivatives are initially recognised and subsequently measured at fair value, with all revaluation gains or losses recognised in the income statement under “Net gain/(loss) from trading”, (Note 7). Derivatives are recorded at fair value and carried as assets when their fair value is positive and as liabilities when their fair value is negative. Fair value is determined using the forward market rates ruling on the reporting date.
Accounting Judgments, Estimates and Assumptions
Judgment is required when the Group selects the valuation techniques used to determine the fair value of derivatives, particularly the selection of valuation inputs that are not readily observable, and the application of valuation adjustments to certain derivatives.

INSIDE INSIGHT FINANCIAL STATEMENTS
196
NOTES TO THE FINANCIAL STATEMENTS
24 DERIVATIVE FINANCIAL INSTRUMENTS (CONTD.)
BANK & GROUP
Financial Assets
2021
Financial Liabilities
2021
Financial Assets
2020
Financial Liabilities
2020LKR ’000 LKR ’000 LKR ’000 LKR ’000
Forward foreign exchange contracts 1,338,204 1,048,644 1,429,470 1,016,787 Total 1,338,204 1,048,644 1,429,470 1,016,787
Given below are the fair values of derivative financial instruments, recorded as assets or liabilities, together with their notional amounts. The notional amounts indicate the volume of transactions outstanding as at 31 December 2021 and are indicative of neither the market risk nor the credit risk.
BANK & GROUP
Assets2021
Liabilities2021
Notional Amount
2021
Assets2020
Liabilities2020
Notional Amount
2020LKR ’000 LKR ’000 LKR ’000 LKR ’000 LKR ’000 LKR ’000
Forward foreign exchange contracts - Sales 1,213,720 63,441 50,402,578 312,929 679,997 127,080,925- Purchases 124,484 985,203 50,638,120 1,116,541 336,790 127,620,251 Total 1,338,204 1,048,644 101,040,698 1,429,470 1,016,787 254,701,176
25 FINANCIAL ASSETS RECOGNISED THROUGH PROFIT OR LOSS - MEASURED AT FAIR VALUE
ACCOUNTING POLICY
The Group classifies financial assets as financial assets recognised through profit or loss when they have been purchased or issued primarily for short-term profit making through trading activities or form part of a portfolio of financial instruments that are managed together, for which there is evidence of a recent pattern of short-term profit taking. Financial assets recognised through profit or loss are recorded and measured in the Statement of Financial Position at fair value. The changes in fair value are recognised in the Statement of Profit or Loss under Net gains/(losses) from financial assets at fair value through profit or loss.
Financial assets recognised through profit or loss consist of quoted equity securities, Unit Trust Investments and Sri Lanka Government Debt Securities, that have been acquired principally for the purpose of selling or repurchasing in the near term, and are recorded at fair values using assumptions that a market participant would make, when valuing such instruments. The quoted equity securities are valued using the market prices published by the Colombo Stock Exchange. Sri Lanka Government Securities are valued based on the market rates publish by the money brokers. Investment in private equity funds are measured at fair value based on the change in the net asset value of the funds and is recognised through profit or loss. The unit trust investments are valued at unit prices available in the market.
Accounting Judgements, Estimates and Assumptions
Judgement is required when applying the valuation techniques used to determine the fair value of trading securities not valued using quoted market prices.
BANK GROUP
2021 2020 2021 2020LKR ’000 LKR ’000 LKR ’000 LKR ’000
Sri Lanka Government Securities - treasury bonds - 316,865 - 316,865 Sri Lanka Government Securities - treasury bills - 2,195,886 - 2,195,886 Quoted ordinary shares - - 400,165 164,449 Non-quoted ordinary shares - - 126,200 150,000 Investment in private equity fund - - 847,239 907,833 Investment in unit trusts 2,441,833 3,061,424 3,410,520 3,978,189 Total 2,441,833 5,574,175 4,784,124 7,713,222

INSIDE INSIGHT FINANCIAL STATEMENTS
197
NOTES TO THE FINANCIAL STATEMENTS
25.1 Analysis of financial assets recognised through profit or loss measured at fair value
BANK GROUP
2021 2020 2021 2020LKR ’000 LKR ’000 LKR ’000 LKR ’000
By collateralisationUnencumbered 2,441,833 5,574,175 4,784,124 7,713,222Gross total 2,441,833 5,574,175 4,784,124 7,713,222
By currencySri Lanka Rupee 2,441,833 5,574,175 3,936,885 6,805,389 United States Dollar - - 847,239 907,833 Gross total 2,441,833 5,574,175 4,784,124 7,713,222
26 FINANCIAL ASSETS AT AMORTISED COST - LOANS AND RECEIVABLES TO OTHER CUSTOMERS
ACCOUNTING POLICY
The accounting policy applied by the Group for Financial assets at amortised cost – Loans and receivables to other customers, impairment, collateral valuations, write-off of loans and receivables to other customers and restructured/rescheduled loan facilities are described in Note 3.1, Financial instruments – SLFRS 9 and Note 11, impairment charges.
Financial assets at amortised cost – Loans and receivables to other customers includes, loans and receivables and lease receivables of the Group. As per SLFRS 9, “Loans and receivables to other customers” are assets that are held within a business model with the objective of holding the assets in order to collect contractual cash flows and the contractual terms of the assets give rise on specific dates to cash flows that are solely payment of principal and interest on the principal outstanding.
When the Group is the lessor in a lease agreement that transfers substantially all risks and rewards incidental to ownership of the asset to the lessee, the arrangement is classified as a finance lease. Amounts receivable under finance leases, net of initial rentals received, unearned lease income and impairment allowance are classified as leasing and are presented within “Loans and receivables to other customers” in the Statement of Financial Position.
After initial measurement, “Loans and receivables to other customers” are subsequently measured at amortised cost using the Effective Interest Rate (EIR), less impairment allowance, except when the Group designates loans and receivables at fair value through profit or loss. Amortised cost is calculated by considering any discount or premium on acquisition and fees and costs. The amortisation is included in “Interest Income” in the Statement of Profit or Loss. The losses arising from impairment are recognised in the Statement of Profit or Loss as “Impairment charges for loans and receivables to other customers”.
BANK GROUP
2021 2020 2021 2020LKR ’000 LKR ’000 LKR ’000 LKR ’000
Gross loans and receivables to other customers 526,141,042 443,536,977 525,976,370 443,613,301Less: Impairment allowance for loans and receivables to other customers
(Note 26.1) 23,631,584 17,931,469 23,631,584 17,931,469Net loans and receivables to other customers 502,509,458 425,605,508 502,344,786 425,681,832

INSIDE INSIGHT FINANCIAL STATEMENTS
198
26.1 Loans and Receivables to Other Customers - Stage wise analysis
BANK
2021 2020
Stage 1 Stage 2 Stage 3 Total Stage 1 Stage 2 Stage 3 TotalLKR ’000 LKR ’000 LKR ’000 LKR ’000 LKR ’000 LKR ’000 LKR ’000 LKR ’000
Individually impaired loans - 17,868,689 28,530,336 46,399,025 - 19,141,523 23,678,808 42,820,331
Collectively impaired loans 371,274,982 93,716,951 14,750,084 479,742,017 352,542,313 35,097,522 13,076,811 400,716,646
Gross loans and receivables to other customers (a) 371,274,982 111,585,640 43,280,420 526,141,042 352,542,313 54,239,045 36,755,619 443,536,977
Individual impairment [Note 26.6.(a)] - 1,514,732 9,869,596 11,384,328 - 1,184,320 7,773,991 8,958,311
Collective impairment [Note 26.6.(a)] 4,831,892 2,812,749 4,602,615 12,247,256 3,472,657 1,559,669 3,940,832 8,973,158
Total impairment allowance (b) 4,831,892 4,327,481 14,472,211 23,631,584 3,472,657 2,743,989 11,714,823 17,931,469
Net loans and receivables to other customers (a)-(b) 366,443,090 107,258,159 28,808,209 502,509,458 349,069,656 51,495,056 25,040,796 425,605,508
GROUP
2021 2020
Stage 1 Stage 2 Stage 3 Total Stage 1 Stage 2 Stage 3 TotalLKR ’000 LKR ’000 LKR ’000 LKR ’000 LKR ’000 LKR ’000 LKR ’000 LKR ’000
Individually impaired loans - 17,868,689 28,530,336 46,399,025 - 19,141,523 23,678,808 42,820,331
Collectively impaired loans 371,110,310 93,716,951 14,750,084 479,577,345 352,618,637 35,097,522 13,076,811 400,792,970
Gross loans and receivables to other customers (a) 371,110,310 111,585,640 43,280,420 525,976,370 352,618,637 54,239,045 36,755,619 443,613,301
Individual impairment - 1,514,732 9,869,596 11,384,328 - 1,184,320 7,773,991 8,958,311
Collective impairment 4,831,892 2,812,749 4,602,615 12,247,256 3,472,657 1,559,669 3,940,832 8,973,158
Total impairment allowance (b) 4,831,892 4,327,481 14,472,211 23,631,584 3,472,657 2,743,989 11,714,823 17,931,469
Net loans and receivables to other customers (a)-(b) 366,278,418 107,258,159 28,808,209 502,344,786 349,145,980 51,495,056 25,040,796 425,681,832
26.2 Loans and Receivables to Other Customers - By Product
BANK GROUP
2021 2020 2021 2020LKR ’000 LKR ’000 LKR ’000 LKR ’000
Long-term loans 150,509,586 140,369,507 150,509,586 140,369,507 Medium and short-term loans 117,464,363 95,726,639 117,464,363 95,726,639 Overdrafts 73,098,306 48,460,128 72,863,853 48,453,127 Consumer loans 55,080,118 46,455,852 55,080,118 46,455,852 Trade finance loans 48,322,435 39,102,450 48,322,435 39,102,450 Leasing and hire purchases (Note 26.7) 28,080,778 28,866,243 28,080,778 28,866,243 Housing loans 19,230,619 17,333,010 19,230,619 17,333,010 Islamic loans 13,914,119 11,833,360 13,914,119 11,833,360 Credit Cards 7,948,654 6,834,834 7,948,654 6,834,834 Auto finance loans 3,423,346 3,470,062 3,423,346 3,470,062 Pawning 6,598,837 2,848,203 6,598,837 2,848,203 Staff loans 2,469,881 2,236,689 2,539,662 2,320,014 Total 526,141,042 443,536,977 525,976,370 443,613,301
NOTES TO THE FINANCIAL STATEMENTS

INSIDE INSIGHT FINANCIAL STATEMENTS
199
26.3 Loans and Receivables to Other Customers - By Currency
BANK GROUP
2021 2020 2021 2020LKR ’000 LKR ’000 LKR ’000 LKR ’000
Sri Lanka Rupee 436,653,742 366,063,792 436,489,070 366,140,116United States Dollar 86,984,766 74,851,903 86,984,766 74,851,903Euro 2,392,588 2,453,071 2,392,588 2,453,071Great Britain Pound 7,824 107,919 7,824 107,919Others 102,122 60,292 102,122 60,292Total 526,141,042 443,536,977 525,976,370 443,613,301
26.4 Loans and Receivables to Other Customers - By Industry
BANK
2021 2020LKR ’000 % LKR ’000 %
Services 109,365,160 21 96,160,579 22Agriculture, agro-business and fisheries 62,241,443 12 50,888,424 11Consumer 61,239,369 11 60,770,894 14Trading 50,102,939 10 44,347,759 10Constructions and housing finance 50,088,834 10 40,748,178 10Metals, chemicals and engineering 47,350,279 9 36,802,851 8Utilities 43,315,302 8 37,362,891 8Textiles and garments 32,660,483 6 25,778,549 6Hotels and tourism 26,657,992 5 19,381,844 4Food, beverages and tobacco 20,910,193 4 15,753,827 4Transport 15,052,082 3 9,132,624 2Wood and paper products 5,332,216 1 4,544,971 1Leather and plastic products 1,808,734 - 1,825,065 - Others 16,016 - 38,521 - Total 526,141,042 100 443,536,977 100
26.5 Loans and Receivables to Other Customers - By Province
BANK GROUP
2021 2020 2021 2020LKR ’000 LKR ’000 LKR ’000 LKR ’000
Western Province 445,714,855 374,401,143 445,550,183 374,477,467Southern Province 16,599,493 14,719,125 16,599,493 14,719,125North-Western Province 15,220,658 13,883,261 15,220,658 13,883,261Central Province 14,140,225 12,347,965 14,140,225 12,347,965Sabaragamuwa Province 9,653,284 8,930,423 9,653,284 8,930,423North-Central Province 9,763,189 5,408,716 9,763,189 5,408,716Eastern Province 5,373,744 4,955,997 5,373,744 4,955,997Northern Province 5,290,131 4,671,020 5,290,131 4,671,020Uva Province 4,385,463 4,219,327 4,385,463 4,219,327Total 526,141,042 443,536,977 525,976,370 443,613,301
The province-wise disclosure is made based on the location of the branch from which the facilities have been disbursed.
NOTES TO THE FINANCIAL STATEMENTS

INSIDE INSIGHT FINANCIAL STATEMENTS
200
26.6 Impairment Allowance for Loans and Receivables to Other Customers
26.6 (a) Movement in impairment allowance during the year
BANK & GROUP Total
COLLECTIVE INDIVIDUAL
Stage 1 Stage 2 Stage 3 Sub total Stage 2 Stage 3 Sub totalLKR ’000 LKR ’000 LKR ’000 LKR ’000 LKR ’000 LKR ’000 LKR ’000 LKR ’000
Balance as at 01 January 2021 3,472,657 1,559,669 3,940,832 8,973,158 1,184,320 7,773,991 8,958,311 17,931,469
Charges/(reversals) for the year 1,359,235 1,253,080 1,018,906 3,631,221 330,412 4,215,286 4,545,698 8,176,919
Amount written off - - (357,123) (357,123) - (2,144,593) (2,144,593) (2,501,716)
Other Movement - - - - - 24,912 24,912 24,912
Balance as at 31 December 2021 4,831,892 2,812,749 4,602,615 12,247,256 1,514,732 9,869,596 11,384,328 23,631,584
BANK & GROUP Total
COLLECTIVE INDIVIDUAL
Stage 1 Stage 2 Stage 3 Sub total Stage 2 Stage 3 Sub totalLKR ’000 LKR ’000 LKR ’000 LKR ’000 LKR ’000 LKR ’000 LKR ’000 LKR ’000
Balance as at 01 January 2020 2,682,507 1,221,550 3,151,096 7,055,153 452,901 5,064,567 5,517,468 12,572,621
Charges/(reversals) for the year 790,150 338,119 1,262,277 2,390,546 731,419 3,109,176 3,840,595 6,231,141
Amount written off - - (472,541) (472,541) - (399,752) (399,752) (872,293)
Balance as at 31 December 2020 3,472,657 1,559,669 3,940,832 8,973,158 1,184,320 7,773,991 8,958,311 17,931,469
26.6 (b) Sensitivity analysis of impairment allowance for loans and receivables to other customers
BANK & GROUP
Sensitivity effect on impairment
allowance increase
Sensitivity effect on impairment
allowance increase
2021 2020Changed criteria Changed factor LKR ’000 LKR ’000
Loss given default (LGD) Increase by 2% 234,073 179,447Credit conversion factor (CCF) Increase by 5% (where applicable) 69,074 41,814Probability of default (PD) in each stage Increase by 1% 72,320 50,320Economic Factor Adjustment Worst case degrades by 5% 24,671 38,734Property realisation timing Delay by 1 year 715,116 711,154
NOTES TO THE FINANCIAL STATEMENTS

INSIDE INSIGHT FINANCIAL STATEMENTS
201
NOTES TO THE FINANCIAL STATEMENTS
26.6
(c
) Im
pair
men
t al
low
ance
for
Loa
ns a
nd R
ecei
vabl
es t
o ot
her
cust
omer
s -
By
Pro
duct
BA
NK
& G
RO
UP
Long
-ter
m
Loan
s
Med
ium
and
Sho
rt-t
erm
Loan
s
Ove
rdra
ftsTr
ade
Fina
nce
Loan
s
Con
sum
er
Loan
s
Leas
ing
&
Hire
Pur
chas
e
Ren
tal
Rec
eiva
bles
Hou
sing
Loa
ns
Cre
dit C
ards
Paw
ning
Isla
mic
Ban
king
Sta
ff Lo
ans
Tota
l
LKR
’000
LKR
’000
LKR
’000
LKR
’000
LKR
’000
LKR
’000
LKR
’000
LKR
’000
LKR
’000
LKR
’000
LKR
’000
LKR
’000
As
at 0
1 J
anua
ry 2
02
1 3
,903
,039
4
,752
,837
3
,400
,796
9
50,9
33
2,2
52,6
87
1,2
67,7
27
563
,761
5
68,3
03
7,6
05
262
,963
8
18
17,
931,
469
Cha
rges
/(re
vers
als)
for t
he y
ear
878
,144
2
,812
,260
1
,414
,941
8
36,6
32
713
,608
3
88,9
06
152
,619
7
38,8
31
(249
) 2
41,2
27
-
8,1
76,9
19
Am
ount
writ
ten
off
(255
,384
) (1
,217
,430
) (3
40,6
24)
(107
,571
) (1
19,7
64)
(205
,939
) (7
,260
) (2
47,7
44)
-
-
-
(2,5
01,7
16)
Oth
er m
ovem
ent
-
-
-
-
-
-
-
-
-
24,
912
-
24,
912
As
at 3
1 D
ecem
ber 2
02
1 4
,525
,799
6
,347
,667
4
,475
,113
1
,679
,994
2
,846
,531
1
,450
,694
7
09,1
20
1,0
59,3
90
7,3
56
529
,102
8
18
23,
631,
584
Indi
vidu
al im
pairm
ent
3,4
57,9
31
5,5
14,8
45
1,2
41,5
21
552
,022
2
3,33
8 3
27,9
39
38,
190
13,
116
-
215
,426
-
1
1,38
4,32
8
Col
lect
ive
impa
irmen
t 1
,067
,868
8
32,8
22
3,2
33,5
92
1,1
27,9
72
2,8
23,1
93
1,1
22,7
55
670
,930
1
,046
,274
7
,356
3
13,6
76
818
1
2,24
7,25
6
As
at 3
1 D
ecem
ber 2
021
4,5
25,7
99
6,3
47,6
67
4,4
75,1
13
1,6
79,9
94
2,8
46,5
31
1,4
50,6
94
709
,120
1
,059
,390
7
,356
5
29,1
02
818
2
3,63
1,58
4
Gro
ss a
mou
nt o
f loa
ns in
divi
dual
ly
dete
rmin
ed to
be
impa
ired,
befo
re d
educ
tion
of in
divi
dual
ly
asse
ssed
impa
irmen
t
allo
wan
ces
32,
489,
284
29,
491,
993
8,1
82,6
40
4,8
02,1
68
108
,320
2
,895
,874
8
10,8
77
23,
956
4,0
65
1,0
19,7
39
818
7
9,82
9,73
4
Gro
ss a
mou
nt o
f loa
ns in
divi
dual
ly
impa
ired,
bef
ore
dedu
ctio
n
of in
divi
dual
ly a
sses
sed
impa
irmen
t allo
wan
ces.
17,
729,
097
19,
592,
093
4,9
17,8
68
1,8
50,4
66
72,
861
642
,354
7
04,8
89
22,
975
-
863
,449
8
18
46,
396,
870
Gro
ss a
mou
nt o
f loa
ns in
divi
dual
ly
impa
ired,
aft
er d
educ
tion
of in
divi
dual
ly a
sses
sed
impa
irmen
t allo
wan
ces
14,
271,
166
14,
077,
248
3,6
76,3
47
1,2
98,4
44
49,
523
314
,415
6
66,6
99
9,8
59
-
648
,023
8
18
35,
012,
542

INSIDE INSIGHT FINANCIAL STATEMENTS
202
26.6
(d
) Im
pair
men
t al
low
ance
for
Loa
ns a
nd R
ecei
vabl
es t
o O
ther
Cus
tom
ers
- B
y P
rodu
ct
BA
NK
& G
RO
UP
Long
-ter
m
Loan
s
Med
ium
and
Sho
rt-t
erm
Loan
s
Ove
rdra
ftsTr
ade
Fina
nce
Loan
s
Con
sum
er
Loan
s
Leas
ing
&
Hire
Pur
chas
e
Ren
tal
Rec
eiva
bles
Hou
sing
Loa
ns
Cre
dit C
ards
Paw
ning
Isla
mic
Ban
king
Sta
ff Lo
ans
Tota
l
LKR
’000
LKR
’000
LKR
’000
LKR
’000
LKR
’000
LKR
’000
LKR
’000
LKR
’000
LKR
’000
LKR
’000
LKR
’000
LKR
’000
As
at 0
1 J
anua
ry 2
02
0 2
,959
,655
2
,672
,174
3
,053
,884
9
87,1
70
1,2
85,9
65
755
,999
3
08,8
25
295
,173
1
,625
2
51,3
33
818
1
2,57
2,62
1
Cha
rges
/(re
vers
als)
for t
he y
ear
948
,745
2
,128
,373
3
47,0
12
(36,
237)
1,2
17,7
85
651
,063
2
54,9
36
701
,854
5
,980
1
1,63
0 -
6
,231
,141
Am
ount
writ
ten
off
(5,3
61)
(47,
710)
(100
) -
(2
51,0
63)
(139
,335
) -
(4
28,7
24)
-
-
-
(872
,293
)
As
at 3
1 D
ecem
ber 2
020
3,9
03,0
39
4,7
52,8
37
3,4
00,7
96
950
,933
2
,252
,687
1
,267
,727
5
63,7
61
568
,303
7
,605
2
62,9
63
818
1
7,93
1,46
9
Indi
vidu
al im
pairm
ent
2,6
23,1
15
4,2
24,4
20
1,0
90,6
97
547
,121
5
,004
2
65,4
64
27,
502
4,2
73
2,2
59
168
,456
-
8
,958
,311
Col
lect
ive
impa
irmen
t 1
,279
,924
5
28,4
17
2,3
10,0
99
403
,812
2
,247
,683
1
,002
,263
5
36,2
59
564
,030
5
,346
9
4,50
7 8
18
8,9
73,1
58
As
at 3
1 D
ecem
ber 2
020
3,9
03,0
39
4,7
52,8
37
3,4
00,7
96
950
,933
2
,252
,687
1
,267
,727
5
63,7
61
568
,303
7
,605
2
62,9
63
818
1
7,93
1,46
9
Gro
ss a
mou
nt o
f loa
ns in
divi
dual
ly
dete
rmin
ed to
be
impa
ired,
befo
re d
educ
tion
of in
divi
dual
ly
asse
ssed
impa
irmen
t
allo
wan
ces
42,
688,
189
25,
494,
540
5,8
33,1
11
5,9
73,5
02
59,
885
1,6
50,8
23
322
,511
7
,537
1
0,33
5 6
47,3
83
818
8
2,68
8,63
4
Gro
ss a
mou
nt o
f loa
ns in
divi
dual
ly
impa
ired,
bef
ore
dedu
ctio
n
of in
divi
dual
ly a
sses
sed
impa
irmen
t allo
wan
ces.
14,
537,
896
18,
743,
475
3,9
14,3
34
3,7
24,2
14
15,
067
927
,541
2
92,8
98
7,1
88
10,
335
647
,383
8
18
42,
821,
149
Gro
ss a
mou
nt o
f loa
ns in
divi
dual
ly
impa
ired,
aft
er d
educ
tion
of in
divi
dual
ly a
sses
sed
impa
irmen
t allo
wan
ces
11,
914,
782
14,
519,
055
2,8
23,6
37
3,1
77,0
93
10,
062
662
,077
2
65,3
96
2,9
15
8,0
76
478
,927
8
18
33,
862,
838
NOTES TO THE FINANCIAL STATEMENTS

INSIDE INSIGHT FINANCIAL STATEMENTS
203
NOTES TO THE FINANCIAL STATEMENTS
26.7 Leasing and Hire Purchases
BANK & GROUP
2021 2020LKR ’000 LKR ’000
Gross lease and hire purchase rental receivables 33,063,657 35,360,393Less: Unearned income 4,982,879 6,494,150Total lease and hire purchase rental receivables (Note 26.2) 28,080,778 28,866,243Less: Impairment allowance [Note 26.7.(a)] 1,450,694 1,267,727Total 26,630,084 27,598,516
26.7 (a) Impairment allowance
BANK & GROUP Total
COLLECTIVE INDIVIDUAL
Stage 1 Stage 2 Stage 3 Sub total Stage 2 Stage 3 Sub totalLKR ’000 LKR ’000 LKR ’000 LKR ’000 LKR ’000 LKR ’000 LKR ’000 LKR ’000
Balance as at 01 January 2021 192,682 114,208 695,372 1,002,262 11,461 254,004 265,465 1,267,727 Charges/(reversals) for the year 2,099 312,561 (178,405) 136,255 (11,130) 263,781 252,651 388,906 Amount written off - - (15,762) (15,762) - (190,177) (190,177) (205,939)Balance as at 31 December 2021 194,781 426,769 501,205 1,122,755 331 327,608 327,939 1,450,694
Gross amount of loans individually determined to be impaired, before deduction of the individually assessed impairment allowance 2,895,874Gross amount of loans individually impaired, before deduction of the individually assessed impairment allowance 642,354Gross amount of loans individually impaired, after deduction of the individually assessed impairment allowance 314,415
BANK & GROUP Total
COLLECTIVE INDIVIDUAL
Stage 1 Stage 2 Stage 3 Sub total Stage 2 Stage 3 Sub totalLKR ’000 LKR ’000 LKR ’000 LKR ’000 LKR ’000 LKR ’000 LKR ’000 LKR ’000
Balance as at 01 January 2020 105,527 103,431 375,276 584,234 7,576 164,189 171,765 755,999 Charges/(reversals) for the year 87,155 10,777 410,877 508,809 3,885 138,369 142,254 651,063 Amount written off - - (90,781) (90,781) - (48,554) (48,554) (139,335)Balance as at 31 December 2020 192,682 114,208 695,372 1,002,262 11,461 254,004 265,465 1,267,727
Gross amount of loans individually determined to be impaired, before deduction of the individually assessed impairment allowance 1,650,823Gross amount of loans individually impaired, before deduction of the individually assessed impairment allowance 927,541Gross amount of loans individually impaired, after deduction of the individually assessed impairment allowance 662,077
26.8 Maturity of Leasing and Hire Purchases
BANK & GROUP
2021
Less than 1 Year
1-5 Years More than 5 Years
Total
LKR ’000 LKR ’000 LKR ’000 LKR ’000
Gross lease and hire purchase rentals receivablesTotal rental receivables 1,539,219 31,358,975 165,463 33,063,657Less : Impairment allowance 234,322 1,214,153 2,219 1,450,694Unearned income 53,521 4,882,739 46,619 4,982,879Net rentals receivables 1,251,376 25,262,083 116,625 26,630,084

INSIDE INSIGHT FINANCIAL STATEMENTS
204
NOTES TO THE FINANCIAL STATEMENTS
26.8 Maturity of Leasing and Hire Purchases (Contd.)
BANK & GROUP
2020
Less than 1 Year
1-5 Years More than 5 Years
Total
LKR ’000 LKR ’000 LKR ’000 LKR ’000
Gross lease and hire purchase rentals receivablesTotal rental receivables 682,842 34,493,287 184,264 35,360,393Less : Impairment allowance 125,740 1,139,108 2,879 1,267,727Unearned income 40,677 6,395,634 57,839 6,494,150Net rentals receivables 516,425 26,958,545 123,546 27,598,516
27 FINANCIAL ASSETS AT AMORTISED COST - DEBT AND OTHER INSTRUMENTS
ACCOUNTING POLICY
In line with the requirements of SLFRS 9, the Group applies the amortised cost method to measure Financial instruments for which an entity has a business model to hold the financial asset to collect the contractual cash flows. The characteristics of the contractual cash flows are that of solely payments of the principal amount and interest (referred to as “SPPI”).
� Principle is the fair value of the instrument at initial recognition.
� Interest is the return within a basic lending arrangement and typically consists of consideration for the time value of money, and credit risk. It may also include consideration for other basic lending risks such as liquidity risk as well as a profit margin.
The Group determines its business model at the level that best reflect how it manages a Group financial assets to achieve its business objective. The details of the accounting policy on financial assets at amortised cost - debt and other instruments and impairment are described in Notes 3.1 and 11.
Accounting Judgements Estimates and Assumptions
The Group assesses impairment of financial assets measured at amortised cost - debt and other instruments in line with the same principles used for assessment of impairment of loans and receivables as described in Note 11. The impairment loss on financial assets measured at amortised cost - debt and other instruments is disclosed in Note 27.1 (d)) to the financial statements.
BANK GROUP
2021 2020 2021 2020LKR ’000 LKR ’000 LKR ’000 LKR ’000
Sri Lanka Government Securities - treasury bonds 2,362,552 3,989,470 2,362,552 3,989,470 Sri Lanka Development Bonds 18,356,345 16,584,386 18,356,345 16,584,386 Sovereign Bonds 26,576,257 24,174,240 26,576,257 24,174,240 Quoted debentures 6,642,202 861,487 6,642,202 861,487 Securities purchased under resale agreements 3,223,111 60,779 3,223,111 60,779 Sub Total 57,160,467 45,670,362 57,160,467 45,670,362 Less: Impairment allowance for investments [Note 27.1 (d)] 2,897,491 958,722 2,897,491 958,722Total 54,262,976 44,711,640 54,262,976 44,711,640

INSIDE INSIGHT FINANCIAL STATEMENTS
205
NOTES TO THE FINANCIAL STATEMENTS
27.1 (a) Analysis of financial assets at amortised cost - Debt and other instruments
BANK GROUP
2021 2020 2021 2020LKR ’000 LKR ’000 LKR ’000 LKR ’000
By collateralisationPledged as collateral - 1,349,876 - 1,349,876Unencumbered 57,160,467 44,320,486 57,160,467 44,320,486Gross total 57,160,467 45,670,362 57,160,467 45,670,362
By currencySri Lanka Rupee 12,227,865 4,911,736 12,227,865 4,911,736United States Dollar 44,932,602 40,758,626 44,932,602 40,758,626Gross total 57,160,467 45,670,362 57,160,467 45,670,362
27.1 (b) Financial assets at amortised cost - Debt and other instruments - stage wise analysis
BANK & GROUP
2021 2020
Stage 1 Stage 2 Stage 3 Total Stage 1 Stage 2 Stage 3 TotalLKR ’000 LKR ’000 LKR ’000 LKR ’000 LKR ’000 LKR ’000 LKR ’000 LKR ’000
Sri Lanka Government securities - treasury bonds 2,362,552 - - 2,362,552 3,989,470 - - 3,989,470
Sri Lanka Development Bonds 18,356,345 - - 18,356,345 16,584,386 - - 16,584,386 Sovereign Bonds 26,576,257 - - 26,576,257 24,174,240 - - 24,174,240 Quoted debentures 6,397,202 - 245,000 6,642,202 616,487 - 245,000 861,487 Securities purchased under resale
agreements (Note 27.1 (c)) 3,223,111 - - 3,223,111 60,779 - - 60,779 Sub Total 56,915,467 - 245,000 57,160,467 45,425,362 - 245,000 45,670,362 Less: Impairment allowance for
investments [Note 27.1 (d)] 2,652,491 - 245,000 2,897,491 713,722 - 245,000 958,722Total 54,262,976 - - 54,262,976 44,711,640 - - 44,711,640
27.1 (c) Disclosure as per the Direction No. 01 of 2019 dated 20.12.2019 on Repurchase and Reverse Repurchase transactions of dealer direct participants in Scripless Treasury Bonds and Scripless Treasury Bills.
BANK
Carrying Value of Securities
purchased under resale agreements
Market Value of Securities received
for Securities purchased under
resale agreements
Carrying Value of Securities
purchased under resale agreements
Market Value of Securities received
for Securities purchased under
resale agreements
2021 2021 2020 2020LKR ’000 LKR ’000 LKR ’000 LKR ’000
Securities purchased under resale agreements 3,223,111 3,487,989 60,779 75,163Total 3,223,111 3,487,989 60,779 75,163
Bank’s policy on haircuts for repurchase and reverse repo transactions are explained below.
The Bank’s Board approved Policy Guideline outlines the allocation of securities and haircut rules for Repurchase and Reverse Re-purchase agreements and valuation process. The Policy has been formulated in line with Central Bank Direction No. 01 of 2019 and considering the market practice. Securities are allocated/obtained as per the set guidelines and the Bank was not exposed to any penalties due to non-compliance.
The Bank was not liable to any penalties imposed for the non compliance with the Direction No. 01 of 2019 on Registered Stock and Securities Ordinance and Local Treasury Bills Ordinance dated 20 December 2019 issued by the Monetary Board of the Central Bank of Sri Lanka.

INSIDE INSIGHT FINANCIAL STATEMENTS
206
27.1 (d) Movements in impairment allowance during the year
BANK GROUP
2021 2020 2021 2020LKR ’000 LKR ’000 LKR ’000 LKR ’000
Stage 1Balance as at 01 January 713,722 165,817 713,722 165,817Charges/(reversals) to Statement of Profit or Loss 1,938,769 547,905 1,938,769 547,905Balance as at 31 December 2,652,491 713,722 2,652,491 713,722
Stage 3Balance as at 01 January 245,000 225,682 245,000 225,682 Charges/(reversals) to Statement of Profit or Loss - 19,318 - 19,318 Balance as at 31 December 245,000 245,000 245,000 245,000
Total 2,897,491 958,722 2,897,491 958,722
28 FINANCIAL ASSETS MEASURED AT FAIR VALUE THROUGH OTHER COMPREHENSIVE INCOME
ACCOUNTING POLICY
Debt Instruments at Fair Value through Other Comprehensive Income (FVOCI)
The Group categorised debt instruments measured at FVOCI under SLFRS 9 when both of the following conditions are met:
� The instrument is held within a business model, the objective of which is achieved by both collecting contractual cash flows and selling financial assets.
� The contractual terms of the financial assets are solely payments of the principle amount and the interest (SPPI).
FVOCI debt instruments are subsequently measured at fair value with gains and losses arising due to changes in fair value recognised in OCI. Interest income and foreign exchange gains and losses are recognised in the Statement of Profit or Loss in the same manner as for financial assets measured at amortised cost as explained in Note 27. The ECL calculation for debt instruments at FVOCI is explained in Note 11, impairment charges. Where the Bank holds more than one investment in the same security, they are deemed to be disposed of on a first-in first-out basis. On derecognition, cumulative gains or losses previously recognised in OCI are reclassified from OCI to Statement of Profit or Loss.
The accounting policy applied by the Group for the Debt Instruments at Fair Value through Other Comprehensive Income (FVOCI) and impairment is described in Notes 3.1 and 11.
Reclassification of investment in Sovereign Bonds previously measured at Fair Value Through Other Comprehensive Income to measured at Amortised cost category
The Bank re-classified its Sovereign Bonds Portfolio consequent to the changes in the business model of managing the assets with effect from 30 September 2020 as per the Guidance Notes issued by CA Sri Lanka on Accounting Consideration of the COVID-19 Outbreak (updated on 11 May 2020). Accordingly, Sovereign Bond investments amounting to LKR 9 Bn which were previously classified as Financial Assets Measured at Fair Value through Other Comprehensive Income (FVOCI) were re-classified as Amortised Cost in line with paragraph 5.6.6 of SLFRS 9-Financial Instruments. There was no change to the effective interest rate used and interest income recognised for the reclassified assets for the year ended 31 December 2021.
Equity Instruments at Fair Value through Other Comprehensive Income (FVOCI)
Upon initial recognition, the Bank occasionally elects to classify irrevocably some of its equity investments as equity instruments at FVOCI when they meet the definition of Equity under SLFRS 9, Financial Instruments: and are not held for trading. Such classification is determined on an instrument-by-instrument basis.
Gains and losses on these equity instruments are never recycled to profit. Dividends are recognised in the Statement of Profit or Loss as other operating income when the right of the payment has been established, except when the Group benefits from such proceeds as a recovery of part of the cost of the instrument, in which case, such gains are recorded in OCI. Equity instruments at FVOCI are not subject to an impairment assessment.
NOTES TO THE FINANCIAL STATEMENTS

INSIDE INSIGHT FINANCIAL STATEMENTS
207
BANK GROUP
2021 2020 2021 2020LKR ’000 LKR ’000 LKR ’000 LKR ’000
Sri Lanka Government Securities - treasury bonds 33,893,508 47,815,829 33,893,508 47,815,829 Sri Lanka Government Securities - treasury bills 53,030,077 58,022,081 53,030,077 58,022,081 Sovereign Bonds 1,607,879 1,718,732 1,607,879 1,718,732 Quoted ordinary shares (Note 28.2) 1,014,508 1,030,317 1,014,508 1,030,317 Non-quoted ordinary shares (Note 28.3) 16,568 16,568 16,568 16,568 Quoted debentures - - 144,415 169,789 Sub total 89,562,540 108,603,527 89,706,955 108,773,316 Less: Impairment allowance 10,344 10,344 10,344 10,344Total 89,552,196 108,593,183 89,696,611 108,762,972
28.1 (a) Analysis of financial assets measured at Fair Value through Other Comprehensive Income (FVOCI)
BANK GROUP
2021 2020 2021 2020LKR ’000 LKR ’000 LKR ’000 LKR ’000
By collateralisationPledged as collateral 1,438,000 1,079,163 1,438,000 1,079,163Unencumbered 88,124,540 107,524,364 88,268,955 107,694,153Gross total 89,562,540 108,603,527 89,706,955 108,773,316
By currencySri Lanka Rupee 87,954,661 106,884,795 88,099,076 107,054,584United States Dollar 1,607,879 1,718,732 1,607,879 1,718,732Gross total 89,562,540 108,603,527 89,706,955 108,773,316
28.1 (b) Financial assets measured at Fair Value through Other Comprehensive Income (FVOCI) - stage wise analysis
BANK
2021 2020
Stage 1 Stage 2 Stage 3 Total Stage 1 Stage 2 Stage 3 TotalLKR ’000 LKR ’000 LKR ’000 LKR ’000 LKR ’000 LKR ’000 LKR ’000 LKR ’000
Sri Lanka Government Securities - treasury bonds 33,893,508 - - 33,893,508 47,815,829 - - 47,815,829
Sri Lanka Government Securities - treasury bills 53,030,077 - - 53,030,077 58,022,081 - - 58,022,081
Sovereign Bonds 1,607,879 - - 1,607,879 1,718,732 - - 1,718,732
Quoted ordinary shares (Note 28.2) 1,014,508 - - 1,014,508 1,030,317 - - 1,030,317
Non-quoted ordinary shares (Note 28.3) 6,224 - 10,344 16,568 6,224 - 10,344 16,568
Sub Total 89,552,196 - 10,344 89,562,540 108,593,183 - 10,344 108,603,527
Less: Impairment allowance for investments - - 10,344 10,344 - - 10,344 10,344
Total 89,552,196 - - 89,552,196 108,593,183 - - 108,593,183
NOTES TO THE FINANCIAL STATEMENTS

INSIDE INSIGHT FINANCIAL STATEMENTS
208
28.1 (b) Financial assets measured at Fair Value through Other Comprehensive Income (FVOCI) - stage wise analysis
GROUP
2021 2020
Stage 1 Stage 2 Stage 3 Total Stage 1 Stage 2 Stage 3 TotalLKR ’000 LKR ’000 LKR ’000 LKR ’000 LKR ’000 LKR ’000 LKR ’000 LKR ’000
Sri Lanka Government Securities - treasury bonds 33,893,508 - - 33,893,508 47,815,829 - - 47,815,829
Sri Lanka Government Securities - treasury bills 53,030,077 - - 53,030,077 58,022,081 - - 58,022,081
Sovereign Bonds 1,607,879 - - 1,607,879 1,718,732 - - 1,718,732
Quoted ordinary shares (Note 28.2) 1,014,508 - - 1,014,508 1,030,317 - - 1,030,317
Non-quoted ordinary shares (Note 28.3) 6,224 - 10,344 16,568 6,224 - 10,344 16,568
Quoted debentures 144,415 - - 144,415 169,789 - - 169,789
Sub Total 89,696,611 - 10,344 89,706,955 108,762,972 - 10,344 108,773,316
Less: Impairment allowance for investments - - 10,344 10,344 - - 10,344 10,344
Total 89,696,611 - - 89,696,611 108,762,972 - - 108,762,972
28.1 (c) Movement in impairment allowance during the year
BANK GROUP
2021 2020 2021 2020LKR ’000 LKR ’000 LKR ’000 LKR ’000
Stage 1Balance as at 01 January 45,583 49,776 56,095 367,545 Impairment charges (debited)/credited to other comprehensive income 135,574 (4,193) 135,574 (311,450)Balance as at 31 December 181,157 45,583 191,669 56,095
Stage 3Balance as at 01 January 10,344 10,344 10,344 10,344 Impairment charges - - - - Balance as at 31 December 10,344 10,344 10,344 10,344
28.2 Quoted ordinary shares
BANK & GROUP
2021 2020No of
OrdinaryShares LKR ’000
No of Ordinary
Shares LKR ’000
Cost of Investments as at 01 January 22,398,200 1,977,598 21,941,094 1,955,656 Scrip dividend received during the year 658,771 33,598 457,106 21,942 Cost of the Investments as at 31 December 23,056,971 2,011,196 22,398,200 1,977,598
Gains/(losses) from fair valuations as at 01 January (947,281) (803,748)Unrealised gains/(losses) during the year (49,407) (143,533)Gains/(losses) from fair valuations as at 31 December (996,688) (947,281)Market Value 1,014,508 1,030,317
NOTES TO THE FINANCIAL STATEMENTS

INSIDE INSIGHT FINANCIAL STATEMENTS
209
28.2 (a) Details of quoted ordinary shares - 31 December 2021
BANK & GROUP
Name of the Company
No of Shares Market price
LKR
Cost of Investments
LKR ’000
Market value
LKR ’000
Seylan Bank PLC 23,056,970 44.00 2,011,196 1,014,508
Details of quoted ordinary shares - 31 December 2020
BANK & GROUP
Name of the Company
No of Shares Market price
LKR
Cost of Investments
LKR ’000
Market value
LKR ’000
Seylan Bank PLC 22,398,200 46.00 1,977,598 1,030,317
28.3 Non-quoted ordinary shares
The majority of non-quoted ordinary shares held by the Bank include share investments that have been made primarily for regulatory purposes. Such investments are recorded at cost due to unavailability of information to value such investments at fair value.
29 INVESTMENTS IN SUBSIDIARY COMPANIES
ACCOUNTING POLICY
Investments in subsidiary companies are accounted at cost less impairment allowance in the Financial Statements of the Bank. The net assets of each subsidiary company are reviewed at each reporting date to determine whether there is any indication of impairment. If any such indication exists, then the recoverable amount of the investment is estimated and the impairment loss is recognised to the extent of its loss in net assets.
Corporate Status 2021 2020Percentage Holding (%)
CostLKR ’000
Percentage Holding (%)
CostLKR ’000
NDB Capital Holdings Limited Non-quoted 99.9 802,888 99.9 802,888Development Holdings (Pvt) Limited Non-quoted 58.7 228,150 58.7 228,150NDB Capital Limited (Bangladesh) Non-quoted 41.8 180,552 41.8 180,552Sub total 1,211,590 1,211,590Less: Impairment allowance for investments (Note 29.1) 80,674 68,706Total 1,130,916 1,142,884
NOTES TO THE FINANCIAL STATEMENTS

INSIDE INSIGHT FINANCIAL STATEMENTS
210
29.1 Movement in impairment allowance for investments in subsidiary companies
2021 2020LKR ’000 LKR ’000
As at 01 January 68,706 66,017Charges/(reversals) to the Statement of Profit or Loss (Note 29.2) 11,968 2,689As at 31 December 80,674 68,706
29.2 During the annual review of impairment allowance of investment in subsidiary companies, it was noted that the net assets position of NDB Capital Limited as at 31 December 2021 had decreased from LKR 260.2 Mn to LKR 241.4 Mn as disclosed in Note 29.3 summarised Financial Information of the Group’s Investments in Subsidiaries. Accordingly, an impairment allowance of LKR 12 Mn was charged during the year to reflect the Bank’s share of the net assets position of the Company as at 31 December 2021. The Bank assumed that the net book value of the company is the best approximate to the fair value less cost to sale.
29.3 Summarised Financial Information of the NDB Group’s Investments in Subsidiaries
Total Development
Holdings (Pvt)
Limited
NDB Capital
Limited
(Bangladesh)
NDB Capital
Holdings
Limited
(NCAP)
NDB
Investment
Bank Limited
(Held through
NCAP)
NDB Wealth
Management
Limited
(Held through
NCAP)
NDB
Securities (Pvt)
Limited
(Held through
NCAP)
NDB Zephyr
Partners
Limited
(Group)
(Held through
NCAP)
LKR ’000 LKR ’000 LKR ’000 LKR ’000 LKR ’000 LKR ’000 LKR ’000 LKR ’000
2021Total assets 9,646,961 3,639,349 301,204 2,443,918 587,576 625,619 1,908,734 140,561
Total liabilities 2,731,203 623,757 59,854 167,467 166,749 256,103 1,443,209 14,064
Net assets 6,915,758 3,015,592 241,350 2,276,451 420,827 369,516 465,525 126,497
Gross income 2,424,628 450,438 29,295 347,047 393,811 661,847 479,169 63,021
Profits/(losses) 1,061,869 396,771 (38,849) 124,285 109,514 238,689 237,405 (5,945)
Cash FlowCash flows from operating activities 208,001 224,151 (2,121) (213,468) 183,436 288,947 (136,472) (136,472)
Cash flows from investing activities 28,580 (167,670) - 535,834 (194,923) (139,342) (5,319) -
Cash flows from financing activities (397,376) (97,310) - (150,046) - (150,020) - -
Total Development
Holdings (Pvt)
Limited
NDB Capital
Limited
(Bangladesh)
NDB Capital
Holdings
Limited
(NCAP)
NDB
Investment
Bank Limited
(Held through
NCAP)
NDB Wealth
Management
Limited
(Held through
NCAP)
NDB
Securities (Pvt)
Limited
(Held through
NCAP)
NDB Zephyr
Partners
Limited
(Group)
(Held through
NCAP)
LKR ’000 LKR ’000 LKR ’000 LKR ’000 LKR ’000 LKR ’000 LKR ’000 LKR ’000
2020Total assets 8,257,526 3,400,626 270,917 2,572,529 416,905 543,829 893,231 159,489
Total liabilities 2,030,080 684,148 10,697 268,630 111,654 267,891 675,554 11,506
Net assets 6,227,446 2,716,478 260,220 2,303,899 305,251 275,938 217,677 147,983
Gross income 1,997,184 384,935 60,528 680,119 9,007 579,482 189,172 93,941
Profits/(losses) 871,123 237,769 (12,805) 416,908 (1,046) 161,082 52,081 17,134
Cash FlowCash flows from operating activities 287,597 125,264 (13,622) (177,010) (80,454) 204,349 253,596 (24,526)
Cash flows from investing activities 1,451,779 (62,899) - 473,695 646,084 395,139 (240) -
Cash flows from financing activities (1,529,753) (68,117) - (296,638) (564,999) (599,999) - -
NOTES TO THE FINANCIAL STATEMENTS

INSIDE INSIGHT FINANCIAL STATEMENTS
211
NOTES TO THE FINANCIAL STATEMENTS
30 INVESTMENTS IN ASSOCIATE COMPANIES
ACCOUNTING POLICY
An associate is an entity in which the Group has significant influence, but not control, over the variable returns through its power over the investee. An associate is an entity, including an unincorporated entity such as a partnership, over which the investor has significant influence and that is neither a subsidiary nor an interest in a joint venture. The Group’s investments in its associate companies are accounted for by using the equity method. Under the equity method, the investment in the associate is carried in the Statement of Financial Position at cost plus post-acquisition changes in the Group’s share of net assets of the associate. The carrying value of the investment in associates is reviewed for impairment at each reporting period.
The Bank’s investments in Associate companies represent Ayojana Fund (Pvt) Limited (a 50% share holding) at a cost of LKR 100,000 for which full impairment allowance has been made.
31 INVESTMENT PROPERTY
ACCOUNTING POLICY
Basis of Recognition
An investment property is recognised, if it is probable that future economic benefits that are associated with the investment property will flow to the Group and cost of the investment property is reliably measured.
Distinction Between Investment Properties and Owner-Occupied Properties
The Group determines whether a property qualifies as an investment property by considering whether the property generates cash flows largely independently of the other assets held by the entity. Some properties comprise a portion that is held to earn rentals or for capital appreciation and another portion that is held for use in the production or supply of goods or services or for administrative purposes. If these portions can be sold separately (or leased out separately under a finance lease), the Group accounts for the portions separately. If the portions cannot be sold separately, the property is accounted for as an investment property only if an insignificant portion is held for use in the production or supply of goods or services or for administrative purposes. The Group considers each property separately in making its judgment.
Measurement
The Land and Building of Development Holdings (Pvt) Limited, which is held to earn rental income and for capital appreciation has been classified as an ‘investment property’, and is reflected at fair value in accordance with LKAS 40, Investment Property. Investment properties are initially recognised at cost. Subsequent to the initial recognition, the investment properties are stated at fair values. In estimating the fair values, the Independent Valuer considers current market prices of similar assets, so as to reflect market conditions at the reporting date. Gains or losses arising from changes in the fair values are included in the Statement of Profit or Loss, in the year in which they arise. Cost includes expenditure that is directly attributable to the acquisition of the investment property. The cost of self-constructed investment property includes the cost of materials, direct labour and any other costs directly attributable to bringing the investment property to a working condition for their intended use. Owner-occupied portion of an investment property is recognised and measured in line with the accounting policy used for property, plant & equipment of the Group and are presented under property, plant & equipment in the Financial Statements.
De-Recognition
Investment properties are derecognised when disposed or permanently withdrawn from use because no future economic benefits are expected. Any gains or losses on retirement or disposal are recognised in the Statement of Profit or Loss in the year of retirement or disposal.

INSIDE INSIGHT FINANCIAL STATEMENTS
212
31 INVESTMENT PROPERTY (CONTD.)
ACCOUNTING POLICY
Basis of Valuation
As at 31 December 2021, the fair value of the property was based on the valuation performed by an Independent Professional Valuer, A A M Fathihu, B.Sc. (Hons.) EMV, FIV Sri Lanka who is having appropriate recognised professional qualifications and recent experience in the location and category of property being valued, to determine the fair value of land and buildings. The income approach using the current market rent including passing rents has been used as the methodology by the valuer to value the investment property as recommended by SLFRS 13 - ‘Fair Value Measurements’.
Significant Assumptions Used for the Valuation
� Outgoing at 40% of estimated rent (2020 - 40%)
� Capitalise YP at 16% (2020 - 16%)
GROUP
2021 2020LKR ’000 LKR ’000
As at 01 January 2,361,535 2,272,881 Additions during the year 13,689 2,192 Change in the fair value during the year 184,312 129,808 Less: Fair value of the owner-occupied portion 31,308 21,695 Net change in the fair value during the year (Note 10) 153,004 108,113 Less: Change in the owner occupied portion - 21,651 As at 31 December 2,528,228 2,361,535
31.1 Statement of Income and Expenditure of the Investment Property
GROUP
2021 2020LKR ’000 LKR ’000
Rental income derived from investment properties 246,348 228,582 Direct operating expenses (including repair and maintenance) generating rental income (31,025) (30,059)Direct operating expenses (including repair and maintenance) that did not generate rental income (21,918) (21,166)Profit arising from investment properties carried at fair value 193,405 177,357
31.2 Information on investment properties of the Group - Extent and Locations
As required by Rule No 7.6 (viii) of the “Continuing Listing Requirements” of the Colombo Stock Exchange
Business location of the
premises
Number of Buildings
Land Extent Building Fair Value as at 31
December 2021
Fair Value as at 31
December 2020
(Perches) Sq ft. LKR ’000 LKR ’000
Through the subsidiary company of Development Holding (Pvt) Limited (DHPL)
No:42, Nawam Mawatha,
Colombo 02 1 71.27 175,190 3,012,000 2,814,000
Valuation amount includes fair value of owner occupied portion of LKR 484 Mn (2020 - 452 Mn)
The Group has no restrictions on the realisability of its investment properties and no contractual obligations to purchase, construct or develop investment properties or for repairs, maintenance and enhancement.
Fair value hierarchy disclosures for investment properties are given in Note 55 (a), to these Financial Statements.
NOTES TO THE FINANCIAL STATEMENTS

INSIDE INSIGHT FINANCIAL STATEMENTS
213
32 PROPERTY, PLANT & EQUIPMENT
ACCOUNTING POLICY
Basis of Recognition
Property, plant & equipment are recognised, if it is probable that future economic benefits associated with the asset will flow to the Group and the cost or the fair value of the asset can be reliably measured.
Basis of Measurement
An item of property, plant & equipment that qualifies for recognition as an asset is initially measured at its cost. Cost includes expenditure that is directly attributable to the acquisition of the assets and subsequent cost as explained below. The cost of self- constructed assets includes the cost of the materials and direct labour, any other cost directly attributable to bringing the assets to a working condition for its intended use and cost of dismantling and removing the old items and restoring the site on which they are located. Purchased software which is integral to the functionality of the related equipment is capitalised as part of computer equipment.
Cost Model
The Group applies the ‘Cost Model’ to all property, plant & equipment other than freehold land and buildings and record at cost of purchase together with any incidental expenses thereon, less accumulated depreciation and any accumulated impairment losses.
Revaluation Model
The Group applies the revaluation model for the entire class of freehold land and buildings. Such properties are carried at revalued amounts, being their fair value at the reporting date, less any subsequent accumulated depreciation on land and buildings and any accumulated impairment losses charged subsequent to the date of the valuation.
Freehold land and buildings of the Group are revalued every three years or more frequently if the fair values are substantially different from their carrying amounts to ensure that the carrying amounts do not differ from the fair values at the reporting date.
A letter of confirmation is obtained from the Independent Professional Valuer annually, except the year in which full valuation is carried out by the Group, to ensure that the fair values of the freehold land and building at the reporting date do not significantly vary from their carrying amounts.
Subsequent Cost
These are costs that are recognised in the carrying amount of an item if it is probable that the future economic benefits embodied within that part will flow to the Group and it can be reliably measured. Ongoing repairs and maintenance are expensed as incurred.
Capital Work-in-Progress
These are expenses of a capital nature directly incurred in the construction of buildings, major plant and machinery and system development, which will be capitalised with the completion of the project and when the asset is ready to be used. These are stated in the Statement of Financial Position at cost. Capital work-in-progress is transferred to the relevant asset when it is completed and converted into a usable condition as expected by the Management of the Group.
Derecognition
An item of property, plant & equipment is derecognised upon disposal or when no future economic benefits are expected. Any gain or loss arising on derecognition of the asset (calculated as the difference between
the net disposal proceeds and the carrying amount of the asset) is included in the Statement of Profit or Loss in the year, in which the asset is derecognised.
Depreciation and amortisation
The accounting policy and the judgement and estimates used in the computation of depreciation and amortisation of property, plant & equipment are explained in detail in Note 13 on page 185.
Accounting Judgements, Estimates and Assumptions
Fair value of freehold land and buildings
The freehold land and buildings of the Group are reflected at fair value. The Group engaged an Independent Professional Valuer, A A M Fathihu, B.Sc. (Hons.) EMV, FIV Sri Lanka to determine the fair value of freehold land and buildings in terms of Sri Lanka Accounting Standard - SLFRS 13 on “Fair Value Measurement”. In estimating the fair values, the Independent Valuer considered current market prices of similar assets.
The methods used to determine the fair value of the freehold land and buildings are further explained in Note 55 & 55 C to the financial statements.
Useful Life Time of Property, Plant & Equipment
The Group reviews the residual values, useful lives and methods of depreciation of property, plant and equipment at each reporting date. Management exercises judgement in the estimation of these values, rates, methods and hence those are subject to uncertainty.
NOTES TO THE FINANCIAL STATEMENTS

INSIDE INSIGHT FINANCIAL STATEMENTS
214
32.1 The Movement in Property, Plant & Equipment - Bank
Freehold
Land
Freehold
Buildings
Leasehold
Buildings
Computer
Equipment
Motor
Vehicles
Office
Equipment &
Furniture
Capital
Work- in-
Progress
Total
LKR ’000 LKR ’000 LKR ’000 LKR ’000 LKR ’000 LKR ’000 LKR ’000 LKR ’000
(a) Cost or ValuationAs at 1 January 2020 919,305 1,231,446 505,989 1,587,826 127,694 1,089,695 57,152 5,519,107 Additions during the year - 28,696 59,062 93,610 3,100 112,656 129,652 426,776 Disposals during the year - (877) (7,652) (41,872) - (37,577) - (87,978)Revaluation adjustment during
the year - 68,804 - - - - - 68,804 Transfers/adjustments - - - (1,673) - (14) (128,456) (130,143)As at 31 December 2020 919,305 1,328,069 557,399 1,637,891 130,794 1,164,760 58,348 5,796,566 Additions during the year - 29,556 31,897 378,447 - 81,535 120,829 642,264 Disposals during the year - (5,740) (22,374) (27,208) (61,174) (24,074) - (140,570)Revaluation adjustment during
the year - 22,794 - - - - - 22,794 Transfers/adjustments - - - - - (604) (79,646) (80,250)As at 31 December 2021 919,305 1,374,679 566,922 1,989,130 69,620 1,221,617 99,531 6,240,804
(b) Depreciation/AmortisationAs at 1 January 2020 - 235,762 357,720 969,462 113,847 830,103 - 2,506,894 Charge for the year (Note 13) - 58,184 54,408 175,598 9,433 110,118 - 407,741 On disposals - (561) (7,504) (41,867) - (37,041) - (86,973)Transfers/Adjustments - (11) - (346) - 268 - (89)As at 31 December 2020 - 293,374 404,624 1,102,847 123,280 903,448 - 2,827,573 Charge for the year (Note 13) - 51,411 54,457 190,918 5,640 105,821 - 408,247 On disposals - (5,473) (21,897) (27,053) (61,174) (23,249) - (138,846)Transfers/Adjustments - 673 (1,843) 1 - 1,170 - 1 As at 31 December 2021 - 339,985 435,341 1,266,713 67,746 987,190 - 3,096,975
Net book value as at 31 December 2021 919,305 1,034,694 131,581 722,417 1,874 234,427 99,531 3,143,829
Net book value as at 31 December 2020 919,305 1,034,695 152,775 535,044 7,514 261,312 58,348 2,968,993
32.2 Details of Revalued Freehold Land and Buildings - Bank
As at 31 December 2021
The Bank obtained a certificate from the independent professional Valuer A A M Fathihu, B.Sc (Hons) EMV, FIV Sri Lanka, affirming the fair value reflected in these Financial Statements. Accordingly gains/(losses) on revaluation of land and building has been recognised during the year.
Date of valuation - 31 December 2021
Freehold Land Extent(Perches)
Revaluation of Land
Book Value before
Revaluation
Revaluation Gains/(Losses)
Recognised on Land
Location LKR ’000 LKR ’000 LKR ’000
Head Office No. 103A, Dharmapala Mawatha, Colombo 07 20.00 900,000 900,000 - Head Office No. 40, Nawam Mawatha, Colombo 02 1.43 19,305 19,305 - Sub Total (a) 21.43 919,305 919,305 -
NOTES TO THE FINANCIAL STATEMENTS

INSIDE INSIGHT FINANCIAL STATEMENTS
215
32.2 Details of Revalued Freehold Land and Buildings - Bank
Freehold building Extent Revaluation of Building
Book Value before
Revaluation
Revaluation Gains/(Losses)
Recognised on Building
Location (Square Feet) LKR ’000 LKR ’000 LKR ’000
Head Office No. 103A, Dharmapala Mawatha, Colombo 07 41,143 328,000 276,141 51,859 Head Office No. 40, Nawam Mawatha, Colombo 02 95,343 706,695 735,760 (29,065)Sub Total (b) 136,486 1,034,695 1,011,901 22,794
Total (a)+(b) 1,954,000 1,931,206 22,794
32.3 Freehold Land and Buildings on Cost Basis - Bank
The carrying amount of the Bank’s revalued freehold land and buildings that would have been included in the Financial Statements at cost less accumulated depreciation is as follows:
2021 2020
Cost Accumulated Depreciation
Net Book Value
Cost Accumulated Depreciation
Net Book Value
LKR ’000 LKR ’000 LKR ’000 LKR ’000 LKR ’000 LKR ’000
Class of assetsFreehold land 165,016 - 165,016 165,016 - 165,016 Freehold buildings 588,468 482,608 105,860 558,912 470,839 88,073 Total 753,484 482,608 270,876 723,928 470,839 253,089
32.4 The Movement in Property, Plant & Equipment - Group
Freehold
Land
Freehold
Buildings
Leasehold
Buildings
Computer
Equipment
Motor
Vehicles
Office
Equipment &
Furniture
Capital
Work- in-
Progress
Total
LKR ’000 LKR ’000 LKR ’000 LKR ’000 LKR ’000 LKR ’000 LKR ’000 LKR ’000
(a) Cost or ValuationAs at 1 January 2020 919,305 1,712,210 536,415 1,652,747 171,116 1,367,998 59,855 6,419,646 Additions during the year - 28,696 59,062 109,707 3,836 154,367 129,652 485,320 Disposals during the year - (877) (7,652) (42,012) (334) (37,580) - (88,455)Revaluation adjustment during the year - 90,499 - - - - - 90,499 Transfers/adjustments - - - (1,633) - 11,973 (128,454) (118,114)As at 31 December 2020 919,305 1,830,528 587,825 1,718,809 174,618 1,496,758 61,053 6,788,896 Additions during the year - 6,995 22,553 386,510 - 135,222 118,124 669,404 Disposals during the year - (5,743) (22,374) (29,312) (86,538) (25,074) - (169,041)Revaluation adjustment during the year - 54,102 - - - - - 54,102 Transfers/adjustments - - - - - (604) (79,647) (80,251)As at 31 December 2021 919,305 1,885,882 588,004 2,076,007 88,080 1,606,302 99,530 7,263,110
(b) Depreciation/AmortisationAs at 1 January 2020 - 261,762 364,480 1,021,189 158,223 1,048,826 - 2,854,480 Charge for the year (Note 13) - 58,184 55,191 182,533 14,749 171,284 - 481,941 On disposals - (877) (7,652) (42,012) (334) (37,579) - (88,454)Transfers/adjustments - (11) - (346) - 268 - (89)As at 31 December 2020 - 319,058 412,019 1,161,364 172,638 1,182,799 - 3,247,878 Charge for the year (Note 13) - 51,411 56,580 198,995 1,837 138,027 - 446,850 On disposals - (5,473) (21,897) (29,312) (86,538) (23,697) - (166,917)Transfers/adjustments - 673 (1,843) 1 - 1,170 - 1 As at 31 December 2021 - 365,669 444,859 1,331,048 87,937 1,298,299 - 3,527,812
Net book value as at 31 December 2021 919,305 1,520,213 143,145 744,959 143 308,003 99,530 3,735,298
Net book value as at 31 December 2020 919,305 1,511,470 175,806 557,445 1,980 313,959 61,053 3,541,018
NOTES TO THE FINANCIAL STATEMENTS

INSIDE INSIGHT FINANCIAL STATEMENTS
216
NOTES TO THE FINANCIAL STATEMENTS
32.5 Cost of Fully Depreciated Property, Plant & Equipment and Intangible Assets
The initial cost of fully depreciated property, plant & equipment and intangible assets which are still in use are as follows:
BANK GROUP
2021 2020 2021 2020LKR ’000 LKR ’000 LKR ’000 LKR ’000
Freehold buildings 29,321 26,307 29,321 26,307Leasehold building 307,426 283,127 307,426 283,127Motor vehicles 66,519 94,124 67,352 115,489Office equipment and furniture 736,686 666,459 830,425 732,587Computer equipment 855,702 702,552 908,948 750,250Computer software 690,453 607,716 784,395 698,726Total 2,686,107 2,380,285 2,927,867 2,606,486
32.6 Information on freehold land and buildings of the Bank - Extent and locations
As required by the Rule No.7.6 (viii) of the “Continuing Listing Requirements” of the Colombo Stock Exchange.
Location No of buildings
Extent Buildings Revalued land
Revalued buildings
Total revalued amount
Net Book Value
before Revaluation
Revaluation Gains/
(Losses) Recognised
on Land(Perches) (Square) LKR ’000 LKR ’000 LKR ’000 LKR ’000 LKR ’000
Head Office No. 103A, Dharmapala Mawatha, Colombo 07 1 20 41,143 900,000 328,000 1,228,000 1,176,141 51,859
Head Office No. 40, Nawam Mawatha, Colombo 02 1 1.43 95,343 19,305 706,695 726,000 755,065 (29,065)
Total 919,305 1,034,695 1,954,000 1,931,206 22,794
Title restriction on property, plant and equipment
There were no restrictions on the title of the property, plant and equipment of the Group as at the reporting date (2020 - Nil).
Property, plant and equipment pledged as security for liabilities
There were no items of property, plant and equipment of the Group that have been pledged as securities for liabilities as at the reporting date (2020 - Nil).
Borrowing costs
There were no capitalised borrowing costs related to the acquisition of property, plant and equipment during the year 2021 (2020 - Nil).

INSIDE INSIGHT FINANCIAL STATEMENTS
217
NOTES TO THE FINANCIAL STATEMENTS
33 RIGHT OF USE ASSETS
ACCOUNTING POLICY
Basis of Recognition
The Group applies Sri Lanka Accounting Standard SLFRS 16 “Leases” in accounting for all lease hold rights except for short term leases, which are held for use in the provision of services.
Basis of Measurement
The Group recognises right-of-use assets at the date of commencement of the lease, which is the present value of lease payments to be made over the lease term. Right-of-use assets are measured at cost less any accumulated amortisation and impairment losses and adjusted for any re- measurement of lease liabilities. The cost of the right-of-use assets includes the amount of lease liabilities recognised, initial direct cost incurred, and lease payments made at or before the commencement date less any lease incentives received. Right of use assets are amortised on a straight line basis over the term of the lease.
Lease Liability
At the commencement date of the lease, the Group recognises lease liabilities, measured at present value of lease payments to be made over the lease term. The Group applied modified retrospective approach in accordance with SLFRS 16 when accounting for right-of-use assets and operating lease liabilities.
The interest expense on the lease liabilities and the depreciation expense on the right-of-use asset are recognised separately in the Statement of Profit or Loss in line with the requirements of SLFRS 16-Leases.
Further the lease liabilities will be remeasured upon the occurrence of certain events (e.g., a change in the lease term, a change in future lease payments resulting from a change in an index or rate used to determine those payments). The Group will generally recognise the amount of the remeasurement of the lease liability as an adjustment to the right-of-use asset.
Significant Accounting Judgments, Estimates and Assumptions
The Group use its judgment to determine whether an operating lease agreement qualifies as recognition of right-of-use assets. In estimating the borrowing cost of lease liabilities, the Group uses the interest rate applicable to loans given for housing purposes, based on a similar tenor, collateral and economic environment. The present value of operating lease commitments has been calculated using weighted average incremental borrowing rates at which the Group opts to borrow such assets.
Impact of COVID-19 pandemic on right of use assets
The Group reassessed the terms of the operating lease agreements and have concluded that, there is no requirement to change the terms and conditions of the lease agreements due to the impact of the COVID-19 pandemic. Therefore, no changes were made to the carrying amount of the Right of use assets and the lease liabilities as at the reporting date and accordingly, there was no impact on the amount of depreciation and the interest expense recognised during the year and going forward.
The incremental borrowing rates used for the year ended 31 December 2021 and 2020, are as follows:
BANK & GROUP
2021 2020Class of Assets % %
Buildings 9.50-12 10-12Land 14 14Vehicles 15 15
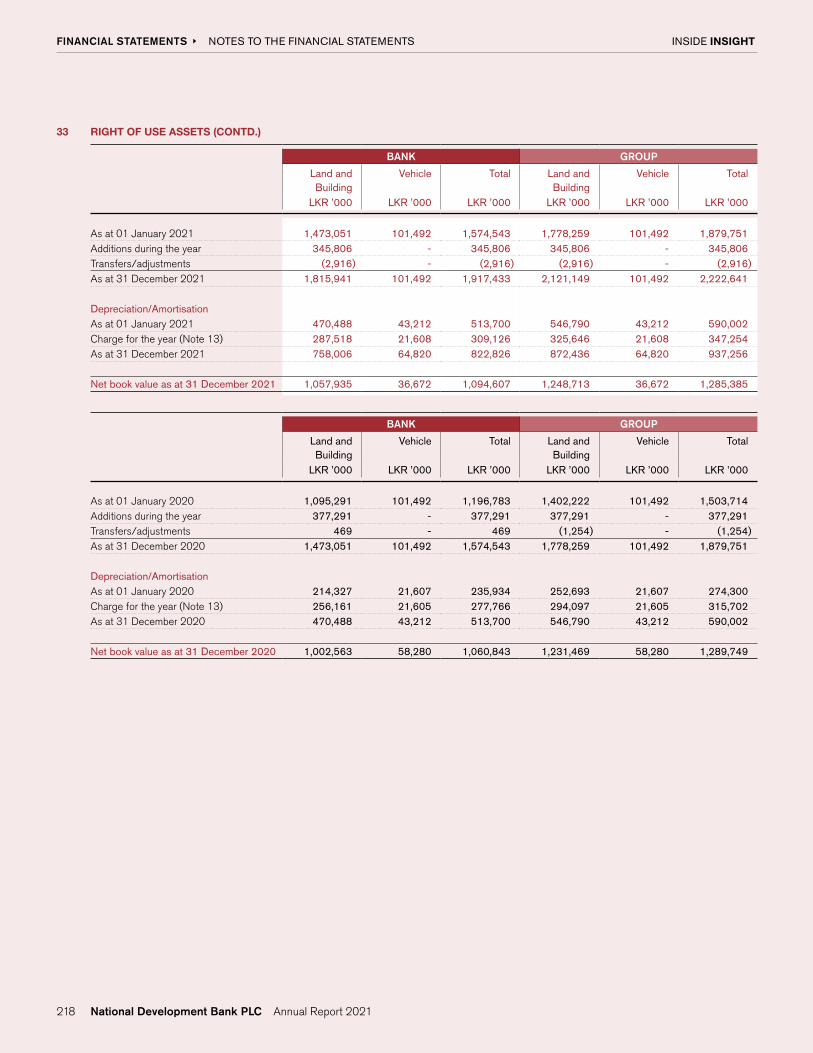
INSIDE INSIGHT FINANCIAL STATEMENTS
218
33 RIGHT OF USE ASSETS (CONTD.)
BANK GROUP
Land and Building
Vehicle Total Land and Building
Vehicle Total
LKR ’000 LKR ’000 LKR ’000 LKR ’000 LKR ’000 LKR ’000
As at 01 January 2021 1,473,051 101,492 1,574,543 1,778,259 101,492 1,879,751 Additions during the year 345,806 - 345,806 345,806 - 345,806 Transfers/adjustments (2,916) - (2,916) (2,916) - (2,916)As at 31 December 2021 1,815,941 101,492 1,917,433 2,121,149 101,492 2,222,641
Depreciation/AmortisationAs at 01 January 2021 470,488 43,212 513,700 546,790 43,212 590,002 Charge for the year (Note 13) 287,518 21,608 309,126 325,646 21,608 347,254 As at 31 December 2021 758,006 64,820 822,826 872,436 64,820 937,256
Net book value as at 31 December 2021 1,057,935 36,672 1,094,607 1,248,713 36,672 1,285,385
BANK GROUP
Land and Building
Vehicle Total Land and Building
Vehicle Total
LKR ’000 LKR ’000 LKR ’000 LKR ’000 LKR ’000 LKR ’000
As at 01 January 2020 1,095,291 101,492 1,196,783 1,402,222 101,492 1,503,714 Additions during the year 377,291 - 377,291 377,291 - 377,291 Transfers/adjustments 469 - 469 (1,254) - (1,254)As at 31 December 2020 1,473,051 101,492 1,574,543 1,778,259 101,492 1,879,751
Depreciation/AmortisationAs at 01 January 2020 214,327 21,607 235,934 252,693 21,607 274,300 Charge for the year (Note 13) 256,161 21,605 277,766 294,097 21,605 315,702 As at 31 December 2020 470,488 43,212 513,700 546,790 43,212 590,002
Net book value as at 31 December 2020 1,002,563 58,280 1,060,843 1,231,469 58,280 1,289,749
NOTES TO THE FINANCIAL STATEMENTS

INSIDE INSIGHT FINANCIAL STATEMENTS
219
NOTES TO THE FINANCIAL STATEMENTS
34 INTANGIBLE ASSETS
ACCOUNTING POLICY
Intangible assets of the Group include the value of computer software and software under development.
Basis of Recognition
An intangible asset is recognised only when its cost can be measured reliably and it is probable that the expected future economic benefits that are attributable to it will flow to the Group. Intangible assets acquired separately are measured on initial recognition at cost. Following the initial recognition, intangible assets are carried at cost less any accumulated amortisation and any accumulated impairment losses. Subsequent expenditure on intangible assets is capitalised only when it increases the future economic benefits embodied in the specific asset to which it relate. All other expenditure is expensed as incurred.
Computer Software and Software under development
Software acquired by the Group is measured at cost less accumulated amortisation and any accumulated impairment losses. Software under development mainly includes the cost incurred for the core banking upgrade.
Derecognition
Intangible assets are derecognised on disposal or when no future economic benefits are expected. Any gain or loss arising on derecognition of an intangible asset is measured as the difference between the net disposal proceeds and the carrying amount of the asset and is included in the Statement of Profit or Loss in the year in which the asset is derecognised.
Research and Development Costs
Research costs are expensed as incurred. Development expenditure on an individual project are recognised as an intangible asset when the Group can demonstrate:
� Its intention to complete and its ability to use or sell the asset.
� The asset will generate future economic benefits.
� The availability of resources to complete the asset.
� The ability to measure reliably the expenditure during development.
� The ability to use the intangible asset generated.
Following initial recognition of the development expenditure as an asset, the asset is carried at cost less any accumulated amortisation and accumulated impairment losses.
As at the reporting date, the Group did not have development costs that were capitalised as an internally-generated intangible asset.
Accounting Judgements, Estimates and Assumptions
Useful Life Time of Intangible Assets
The Group reviews the residual values, useful lives and methods of depreciation of intangible assets at each reporting date. Management exercises judgement in the estimation of these values, rates, methods and hence those are subject to uncertainty.
Assessment for impairment
Irrespective of whether there is any indication of impairment, the Bank assesses an intangible asset with an indefinite useful life or an intangible asset not yet available for use for impairment annually by comparing its carrying amount with its recoverable amounts. However, if such an intangible asset was initially recognised during the current annual period, that intangible asset shall be tested for impairment before the end of the current annual period and recognised in the Statement of Profit or Loss if there is any impairment allowance.
BANK GROUP
2021 2020 2021 2020LKR ’000 LKR ’000 LKR ’000 LKR ’000
Computer Software [Note 34.1] 367,141 389,926 380,312 403,273Software Under Development [Note 34.2] 836,799 658,400 836,799 658,400
1,203,940 1,048,326 1,217,111 1,061,673

INSIDE INSIGHT FINANCIAL STATEMENTS
220
34.1 Computer Software
BANK GROUP
2021 2020 2021 2020LKR ’000 LKR ’000 LKR ’000 LKR ’000
CostAs at 01 January 1,407,912 1,291,525 1,522,143 1,405,488 Additions during the year 92,029 117,711 97,590 117,979 Transfers/adjustments (544) (1,324) (544) (1,324)As at 31 December 1,499,397 1,407,912 1,619,189 1,522,143
Depreciation/AmortisationAs at 01 January 1,017,986 886,005 1,118,870 986,844 Charge for the year (Note 13) 114,270 133,075 120,007 133,956 Transfers/adjustments - (1,094) - (1,930)As at 31 December 1,132,256 1,017,986 1,238,877 1,118,870
Net book value as at 31 December (a) 367,141 389,926 380,312 403,273
34.2 Software Under Development
BANK GROUP
2021 2020 2021 2020LKR ’000 LKR ’000 LKR ’000 LKR ’000
CostAs at 01 January 658,400 282,264 658,400 282,264 Additions during the year 340,168 407,458 340,168 407,458 Transfer to computer software during the year (161,769) (31,322) (161,769) (31,322)As at 31 December (b) 836,799 658,400 836,799 658,400
Net book value of total intangible assets (a) + (b) 1,203,940 1,048,326 1,217,111 1,061,673
Additions during the year includes the consultancy fees paid to Ernst & Young LLP for the core banking project, amounting to LKR 31 Mn (2020 - LKR 9 Mn).
35 OTHER ASSETS
ACCOUNTING POLICY
The Group classifies other assets as ‘other financial assets’ and ‘other non-financial assets’. Other assets mainly comprise of deposits and prepayments, unamortised staff costs and sundry receivables. Deposits are carried at historical cost less impairment allowance. Prepayments are amortised during the period in which they are utilised and are carried at historical cost less impairment allowance.
As all staff loans granted at below market interest rates are recognised at fair value, the difference between the fair value and the amount disbursed was treated as a Day 1 difference. The Day 1 difference is classified as ‘unamortised staff cost’ and is amortised over the loan period by using the Effective Interest Rate (EIR). The staff loans are subsequently measured at amortised costs.
Other financial assets and other non-financial assets included under other assets are summarised below:
BANK GROUP
2021 2020 2021 2020LKR ’000 LKR ’000 LKR ’000 LKR ’000
Other financial assets 1,446,327 931,137 2,218,351 1,243,156Other non-financial assets (Note 35.1) 3,246,922 2,193,579 3,452,365 2,351,944Total 4,693,249 3,124,716 5,670,716 3,595,100
NOTES TO THE FINANCIAL STATEMENTS
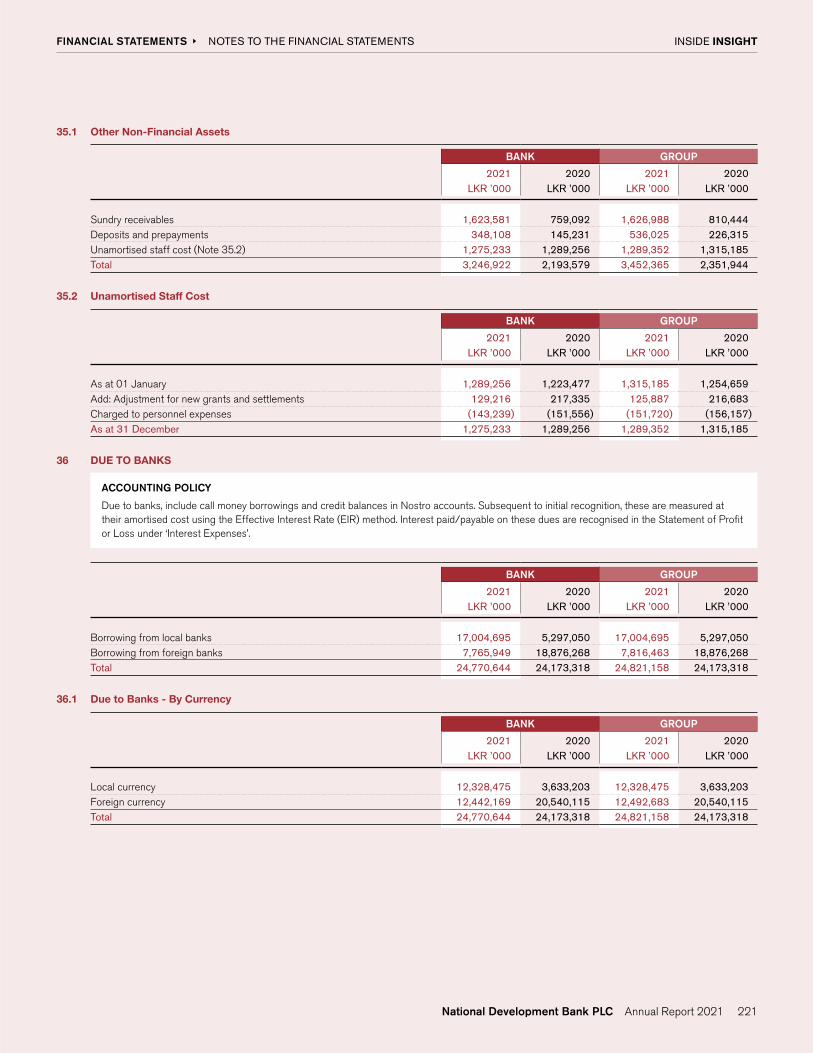
INSIDE INSIGHT FINANCIAL STATEMENTS
221
35.1 Other Non-Financial Assets
BANK GROUP
2021 2020 2021 2020LKR ’000 LKR ’000 LKR ’000 LKR ’000
Sundry receivables 1,623,581 759,092 1,626,988 810,444Deposits and prepayments 348,108 145,231 536,025 226,315Unamortised staff cost (Note 35.2) 1,275,233 1,289,256 1,289,352 1,315,185Total 3,246,922 2,193,579 3,452,365 2,351,944
35.2 Unamortised Staff Cost
BANK GROUP
2021 2020 2021 2020LKR ’000 LKR ’000 LKR ’000 LKR ’000
As at 01 January 1,289,256 1,223,477 1,315,185 1,254,659 Add: Adjustment for new grants and settlements 129,216 217,335 125,887 216,683 Charged to personnel expenses (143,239) (151,556) (151,720) (156,157)As at 31 December 1,275,233 1,289,256 1,289,352 1,315,185
36 DUE TO BANKS
ACCOUNTING POLICY
Due to banks, include call money borrowings and credit balances in Nostro accounts. Subsequent to initial recognition, these are measured at their amortised cost using the Effective Interest Rate (EIR) method. Interest paid/payable on these dues are recognised in the Statement of Profit or Loss under ‘Interest Expenses’.
BANK GROUP
2021 2020 2021 2020LKR ’000 LKR ’000 LKR ’000 LKR ’000
Borrowing from local banks 17,004,695 5,297,050 17,004,695 5,297,050 Borrowing from foreign banks 7,765,949 18,876,268 7,816,463 18,876,268 Total 24,770,644 24,173,318 24,821,158 24,173,318
36.1 Due to Banks - By Currency
BANK GROUP
2021 2020 2021 2020LKR ’000 LKR ’000 LKR ’000 LKR ’000
Local currency 12,328,475 3,633,203 12,328,475 3,633,203 Foreign currency 12,442,169 20,540,115 12,492,683 20,540,115 Total 24,770,644 24,173,318 24,821,158 24,173,318
NOTES TO THE FINANCIAL STATEMENTS

INSIDE INSIGHT FINANCIAL STATEMENTS
222
37 FINANCIAL LIABILITIES AT AMORTISED COST
BANK GROUP
2021 2020 2021 2020LKR ’000 LKR ’000 LKR ’000 LKR ’000
Due to depositors (Note 37.1) 552,039,792 490,278,126 551,256,595 489,658,746Due to debt securities holders (Note 37.2) 1,341,060 1,500,007 1,341,060 1,500,007Due to other borrowers (Note 37.3) 25,228,865 34,284,109 25,228,865 34,284,109Total 578,609,717 526,062,242 577,826,520 525,442,862
37.1 Due to Depositors
ACCOUNTING POLICY
Due to depositors include non-interest bearing deposits, savings deposits, term deposits, margins and other deposits. Subsequent to initial recognition, deposits are measured at their amortised cost using the Effective Interest Rate (EIR) method. Interest paid/payable on deposits are recognised in the Statement of Profit or Loss under ‘Interest Expenses’.
37.1 (a) Due to Depositors - By Product
BANK GROUP
2021 2020 2021 2020LKR ’000 LKR ’000 LKR ’000 LKR ’000
Savings deposits 111,114,173 96,026,821 110,557,791 96,026,821Time deposits 401,240,670 366,465,138 401,023,149 365,845,758Demand deposits 36,709,312 26,892,064 36,700,018 26,892,064Margin deposits 2,634,636 583,518 2,634,636 583,518Other deposits 341,001 310,585 341,001 310,585Total 552,039,792 490,278,126 551,256,595 489,658,746
37.1 (b) Due to Depositors - By Deposit Composition
BANK GROUP
2021 2020 2021 2020LKR ’000 % LKR ’000 % LKR ’000 % LKR ’000 %
Local currency depositsSavings deposits 86,686,437 17 70,850,478 15 86,313,340 16 70,850,478 14 Time deposits 313,670,167 57 290,082,237 59 313,452,646 57 289,462,857 59 Demand deposits 30,337,930 5 21,522,345 4 30,341,536 6 21,522,345 5 Margin deposits 2,504,837 - 542,210 - 2,504,837 - 542,210 - Other deposits 177,494 - 129,955 - 177,494 - 129,955 - Sub total 433,376,865 79 383,127,225 78 432,789,853 79 382,507,845 78
Foreign currency depositsSavings deposits 24,427,736 4 25,176,343 5 24,244,451 4 25,176,343 5 Time deposits 87,570,503 16 76,382,901 16 87,570,503 16 76,382,901 16 Demand deposits 6,371,382 1 5,369,719 1 6,358,482 1 5,369,719 1 Margin deposits 129,799 - 41,308 - 129,799 - 41,308 - Other deposits 163,507 - 180,630 - 163,507 - 180,630 - Sub total 118,662,927 21 107,150,901 22 118,466,742 21 107,150,901 22 Total 552,039,792 100 490,278,126 100 551,256,595 100 489,658,746 100
NOTES TO THE FINANCIAL STATEMENTS

INSIDE INSIGHT FINANCIAL STATEMENTS
223
37.1 (c) Due to Depositors - By Currency
BANK GROUP
2021 2020 2021 2020LKR ’000 LKR ’000 LKR ’000 LKR ’000
Sri Lanka Rupee 433,376,864 383,127,224 432,593,667 382,507,844United States Dollar 101,439,711 91,446,946 101,439,711 91,446,946Australian Dollar 5,340,207 5,117,144 5,340,207 5,117,144Euro 3,943,048 4,734,582 3,943,048 4,734,582Great Britain Pound 6,519,704 4,622,147 6,519,704 4,622,147Other currencies 1,420,258 1,230,083 1,420,258 1,230,083Total 552,039,792 490,278,126 551,256,595 489,658,746
37.1 (d) Due to Depositors - By Institutions/Customers
BANK GROUP
2021 2020 2021 2020LKR ’000 LKR ’000 LKR ’000 LKR ’000
Deposits from banks 11,268,260 28,518,457 11,268,260 28,518,457Deposits from finance companies 12,374,022 13,453,679 12,374,022 13,453,679Deposits from other customers 528,397,510 448,305,990 527,614,313 447,686,610Total 552,039,792 490,278,126 551,256,595 489,658,746
37.1 (e) Due to Depositors - By Province
BANK GROUP
2021 2020 2021 2020LKR ’000 LKR ’000 LKR ’000 LKR ’000
Western Province 490,113,963 441,888,999 489,330,766 441,269,619Central Province 12,329,445 9,541,522 12,329,445 9,541,522North-Western Province 11,931,047 9,286,968 11,931,047 9,286,968Southern Province 11,758,801 8,889,935 11,758,801 8,889,935Sabaragamuwa Province 8,423,808 7,327,569 8,423,808 7,327,569Northern Province 8,014,012 5,611,873 8,014,012 5,611,873Eastern Province 3,752,819 3,049,288 3,752,819 3,049,288North-Central Province 3,162,947 2,461,584 3,162,947 2,461,584Uva Province 2,552,950 2,220,388 2,552,950 2,220,388Total 552,039,792 490,278,126 551,256,595 489,658,746
37.2 Due to Debt Securities Holders
ACCOUNTING POLICY
Due to Debt Securities Holders consists of securities sold under repurchase agreements. The Group sells financial assets and simultaneously enter into an agreement to repurchase the asset (or similar asset) at a fixed price at a future date. Such an arrangement is accounted for as a financial liability and the underlying asset continues to be recognised in the Financial Statements of the Group, as the Group retain substantially all risks and rewards of ownership. Subsequent to initial recognition, these are measured at their amortised cost using the Effective Interest Rate (EIR) method with the corresponding interest paid/payable being recognised in the Statement of Profit or Loss, under ‘Interest Expenses’.
NOTES TO THE FINANCIAL STATEMENTS

INSIDE INSIGHT FINANCIAL STATEMENTS
224
37.2 Due to Debt Securities Holder (Contd.)
BANK GROUP
2021 2020 2021 2020LKR ’000 LKR ’000 LKR ’000 LKR ’000
Securities sold under repurchase agreements 1,341,060 1,500,007 1,341,060 1,500,0071,341,060 1,500,007 1,341,060 1,500,007
37.3 Due to Other Borrowers
ACCOUNTING POLICY
Due to other borrowers represents the funds borrowed by the Group for long-term and short-term liquidity funding requirements and include borrowings from concessionary credit lines, institutional borrowings and funds received from the Central Bank of Sri Lanka including the funds received under the Saubagya COVID-19 Renaissance facilities. Subsequent to initial recognition, these are measured at their amortised cost using the Effective Interest Rate (EIR) method. Interest paid/payable on “Due to Other Borrowers” are recognised in the Statement of Profit or Loss, under ‘Interest Expenses’.
BANK GROUP
2021 2020 2021 2020LKR ’000 LKR ’000 LKR ’000 LKR ’000
Concessionary credit lines 7,205,810 6,927,223 7,205,810 6,927,223Saubagya COVID-19 borrowings 9,195,235 10,296,977 9,195,235 10,296,977Refinance borrowings 3,805,544 4,017,992 3,805,544 4,017,992Foreign borrowings 5,022,276 13,041,917 5,022,276 13,041,917Total 25,228,865 34,284,109 25,228,865 34,284,109
37.4 Maturity Analysis of Due to Debt Securities holders and due to other borrowers - Based on the contractual maturity
BANK GROUP
2021 2020 2021 2020LKR ’000 LKR ’000 LKR ’000 LKR ’000
Payable within 12 MonthsConcessionary credit lines 665,150 1,104,884 665,150 1,104,884 Saubagya COVID-19 borrowings 8,491,217 9,869,215 8,491,217 9,869,215 Refinance borrowings 638,297 588,969 638,297 588,969 Foreign borrowings 4,331,085 8,259,461 4,331,085 8,259,461 Securities sold under repurchase agreements 1,341,060 1,500,007 1,341,060 1,500,007 Sub total 15,466,809 21,322,536 15,466,809 21,322,536
Payable after 12 MonthsConcessionary credit lines 6,540,660 5,822,339 6,540,660 5,822,339 Saubagya COVID-19 borrowings 704,018 427,762 704,018 427,762 Refinance borrowings 3,167,247 3,429,023 3,167,247 3,429,023 Foreign borrowings 691,191 4,782,456 691,191 4,782,456 Sub total 11,103,116 14,461,580 11,103,116 14,461,580 Total (Note 37.2 & Note 37.3) 26,569,925 35,784,116 26,569,925 35,784,116
NOTES TO THE FINANCIAL STATEMENTS

INSIDE INSIGHT FINANCIAL STATEMENTS
225
38 DEBT SECURITIES ISSUED
ACCOUNTING POLICY
Debt securities issued includes the funds borrowed by the Group for long-term and short-term funding requirements by way of quoted debentures. Subsequent to initial recognition, these are measured at their amortised cost using the Effective Interest Rate (EIR) method. Interest paid/payable on debt securities issued are recognised in the Statement of Profit or Loss. The direct costs attributable to these term debts are amortised over the term of the debt and are offset, in the presentation of debt securities issued, in the Statement of Financial Position.
BANK & GROUP
2021 2020LKR ’000 LKR ’000
As at 01 January 19,880,891 23,108,734 Additions during the year 8,000,000 6,500,000 Redemptions - (10,316,415)Net effect on amortised interest payable 79,840 588,572 As at 31 December (Note 38.1) 27,960,731 19,880,891
38.1 Debentures
Interest Payable Frequency
Issued Date Maturity Date Effective Annual
Yield %
BANK & GROUP
2021 2020LKR ’000 LKR ’000
Fixed Rate Debenture Issuance - December 2013Type C - 13.90% - (120 Months) Annually 19-Dec-2013 19-Dec-2023 13.17 3,632,293 3,629,961Type D - 14.00% - (144 Months) Annually 19-Dec-2013 19-Dec-2025 13.26 3,580,672 3,578,937Total (a) 7,212,965 7,208,898
Fixed Rate Debenture Issuance - March 2019Type A - 13.50% - (60 Months) Semi-annually 30-Mar-2019 30-Mar-2024 13.16 1,281,931 1,280,970Type B - 13.95% - (60 Months) Annually 30-Mar-2019 30-Mar-2024 13.15 4,756,946 4,753,628Total (b) 6,038,877 6,034,598
Fixed Rate Debenture Issuance - September 20209.50% - (60 Months) Annually 24-Sep-2020 24-Sep-2025 9.16 6,641,503 6,637,395Total (c) 6,641,503 6,637,395
Fixed Rate Debenture Issuance - November 2021Type A - 11.90% - (60 Months) Semi-annually 23-Nov-2021 23-Nov-2026 11.66 7,950,424 - Type B - 12.00% - (84 Months) Semi-annually 23-Nov-2021 23-Nov-2028 11.73 116,962 - Total (d) 8,067,386 -
Debt securities issued (a)+(b)+(c)+(d) 27,960,731 19,880,891
The contractual maturity of the debt securities issued are given below:Due within one year 671,121 591,281Due after one year 27,289,610 19,289,610
27,960,731 19,880,891
NOTES TO THE FINANCIAL STATEMENTS

INSIDE INSIGHT FINANCIAL STATEMENTS
226
39 CURRENT TAX (RECEIVABLES)/LIABILITIES
ACCOUNTING POLICY
The accounting policy on current tax (receivables)/liabilities for the Group is included in Note 17 on page 187.
BANK GROUP
As at 31 December 2021 2020 2021 2020LKR ’000 LKR ’000 LKR ’000 LKR ’000
39.1 Summary of net current tax liabilitiesCurrent tax liabilities 2,407,243 2,297,296 2,585,975 2,563,345 Current tax receivables - - (27,701) (45,098)Net current tax liability 2,407,243 2,297,296 2,558,274 2,518,247
39.2 Movement in net current tax liabilitiesAs at 01 January 2,297,296 2,247,997 2,518,247 2,318,977 Current tax based on profit for the year 3,247,443 3,059,137 3,484,244 3,373,775 Under/(over) provision in respect of previous years (316,226) (254,608) (337,655) (244,820)Payment of tax (2,821,270) (2,755,230) (3,106,562) (2,929,685)As at 31 December 2,407,243 2,297,296 2,558,274 2,518,247
40 DEFERRED TAX (ASSETS)/LIABILITIES
ACCOUNTING POLICY
The accounting policy on deferred tax (assets)/liabilities for the Group is included in Note 17 on page 187.
40.1 Summary of Net Deferred Tax (Assets)/Liabilities
BANK GROUP
As at 31 December 2021 2020 2021 2020LKR ’000 LKR ’000 LKR ’000 LKR ’000
Recognised under assets (3,417,315) (1,875,720) (3,443,207) (1,945,730)Recognised under liabilities - - 569,213 596,112 Net deffered tax assets (Note 40.3 and 40.4) (3,417,315) (1,875,720) (2,873,994) (1,349,618)
40.2 Movement in Net Deferred Tax (Assets)/Liabilities
BANK GROUP
2021 2020 2021 2020
Temporary difference
Tax effect
Temporary difference
Tax effect
Temporary difference
Tax effect
Temporary difference
Tax effect
LKR ’000 LKR ’000 LKR ’000 LKR ’000 LKR ’000 LKR ’000 LKR ’000 LKR ’000
As at 01 January (6,698,999) (1,875,720) (2,140,053) (599,215) (4,820,059) (1,349,618) (287,356) (80,461)
Amount originating/(reversing) to Statement of Profit or Loss (5,130,922) (1,000,231) (3,383,382) (947,347) (5,042,634) (995,312) (3,414,232) (955,985)
Amount originating/(reversing) to Other Comprehensive Income (2,408,892) (541,364) (1,175,564) (329,158) (2,112,281) (529,064) (1,118,471) (313,172)
As at 31 December (14,238,813) (3,417,315) (6,698,999) (1,875,720) (11,974,974) (2,873,994) (4,820,059) (1,349,618)
Deferred tax effect on Statement of Profit or Loss and Other Comprehensive Income for the current year includes the impact of tax rate change on deferred tax assets/liabilities as at 31 December 2020 amounting to tax charge of LKR 231 Mn and LKR 37 Mn recorded to the Statement of Profit or Loss and Other Comprehensive Income of the Bank respectively. The charge recorded to the Statement of Profit or Loss and Other Comprehensive Income of the Group is LKR 160 Mn and LKR 33 Mn respectively.
NOTES TO THE FINANCIAL STATEMENTS

INSIDE INSIGHT FINANCIAL STATEMENTS
227
40.3 Reconciliation of Net Deferred Tax (Assets)/Liabilities
BANK
Statement of Financial Position Statement of Profit or Loss Other Comprehensive Income
2021 2020 2021 2020 2021 2020LKR ’000 LKR ’000 LKR ’000 LKR ’000 LKR ’000 LKR ’000
Deferred tax liabilitiesAccelerated depreciation for tax purposes 35,379 56,439 (21,060) (28,365) - - Revaluation gains on freehold land and buildings 442,748 510,157 - - (67,409) 19,265 Finance leases 341,848 534,685 (192,837) 38,666 - - Gains on fair value adjustment of financial assets measured
at fair value through other comprehensive income - 2,293 - - (2,293) (341,352)Total 819,975 1,103,574 (213,897) 10,301 (69,702) (322,087)
Deferred tax assetsDefined benefit plans 176,562 198,602 (3,506) (26,857) 25,547 (8,245)Losses on fair value adjustment of financial assets measured
at fair value through other comprehensive income 564,776 - - - (564,776) - Operating leases 61,902 80,055 18,153 (80,055) - - Impairment allowances On loans and receivables to other customers 2,694,512 2,419,058 (368,991) (692,060) 93,536 - On other financial assets 739,538 281,579 (431,990) (158,676) (25,969) 1,174 Total 4,237,290 2,979,294 (786,334) (957,648) (471,662) (7,071)Deferred tax effect on Statement of Profit or Loss and
Other Comprehensive Income for the year - - (1,000,231) (947,347) (541,364) (329,158)Net deferred tax (assets)/liabilities as at 31 December
(Note 40.1) (3,417,315) (1,875,720) - - - -
40.4 Reconciliation of Net Deferred Tax (Assets)/Liabilities
GROUP
Statement of Financial Position Statement of Profit or Loss Other Comprehensive Income
2021 2020 2021 2020 2021 2020LKR ’000 LKR ’000 LKR ’000 LKR ’000 LKR ’000 LKR ’000
Deferred tax liabilitiesAccelerated depreciation for tax purposes 45,829 70,487 (24,657) (30,902) - - Revaluation gains on freehold land and buildings 490,573 557,186 - - (66,614) 25,339 Revaluation gains on investment property 514,297 557,172 (42,875) 38,725 - - Finance leases 341,848 534,685 (192,837) 38,666 - - Gains on fair value adjustment of financial assets measured
at fair value through other comprehensive income - - - (17,480) - (341,988)Total 1,392,547 1,719,530 (260,369) 29,009 (66,614) (316,649)
Deferred tax assetsDefined benefit plans 197,168 224,726 (6,275) (24,976) 33,833 (5,935)Losses on other operations - 16,895 16,895 (16,895) - - Losses on fair value adjustment of financial assets measured
at fair value through other comprehensive income 558,914 24,135 35,510 (6,136) (570,288) 150 Operating leases 77,043 97,820 20,777 (97,820) - - Impairment allowances On loans and receivables to other customers 2,694,512 2,419,058 (368,991) (692,060) 93,536 - On other financial assets 738,904 286,514 (432,859) (147,107) (19,531) 9,262 Total 4,266,541 3,069,148 (734,943) (984,994) (462,450) 3,477 Deferred tax effect on Statement of Profit or Loss and
Other Comprehensive Income for the year - - (995,312) (955,985) (529,064) (313,172)Net deferred tax (assets)/liabilities as at 31 December
(Note 40.1) (2,873,994) (1,349,618) - - - -
NOTES TO THE FINANCIAL STATEMENTS

INSIDE INSIGHT FINANCIAL STATEMENTS
228
41 RETIREMENT BENEFIT OBLIGATIONS
ACCOUNTING POLICY
Retirement benefit obligations include the provisions made for retirement gratuity and the pension fund.
Retirement Gratuity
In compliance with the Gratuity Act, No.12 of 1983, provisions are made on behalf of the employees from the first year of service for employees who joined the Bank on or after 1999, as they are not in pensionable service of the Bank and for employees of the Group companies. The costs of retirement gratuities are determined by a qualified Actuary using the projected unit credit method. Actuarial gains and losses are recognised as income or expense in the Statement of Comprehensive Income, during the financial year in which it arose.
Pension Fund
The Bank operates an approved employee non-contributory pension fund for the payment of pensions to members of its permanent staff, who qualify for such payments when retiring. Employees who joined after 1999, are not covered under the said pension scheme. These employees are entitled to retirement gratuity. Up to 31 December 2002, annual contributions to the pension fund was payable by the Bank, based on a percentage of gross salaries, as stipulated in the pension deed. However, following the formulation of a revised pension deed, which has been approved by the Department of Inland Revenue, the contributions in subsequent years are determined on the basis of an actuarial valuation carried out each year.
Basis of Measurement
The cost of the defined benefit plans (retirement gratuity and the pension fund) is determined using an actuarial valuation. The actuarial valuation involves making various assumptions, which may differ from actual developments in the future. These include the determination of discount rates, expected rates of return on assets, future salary increases, mortality rates and future pension increases. Due to the Long-term nature of these plans, such estimates are subject to significant uncertainties. All assumptions are reviewed at each reporting date. The assumptions used to arrive at the value of defined benefit obligation is given in Note 41.1 (b) and 41.2 (d).
In determining the appropriate discount rate, the Management considers the interest rates of Sri Lanka Government Bonds with extrapolated maturities, corresponding to the expected duration of the defined benefit obligation. The mortality rate is based on publicly available mortality tables. Estimated future salary increases are based on expected future inflation rates and the policy on salary revisions of the Group.
41.1 Provision for Retirement Gratuity
BANK GROUP
2021 2020 2021 2020LKR ’000 LKR ’000 LKR ’000 LKR ’000
As at 01 January 709,294 583,933 820,109 718,983 Provision made during the year Statement of Profit or Loss [Note 41.1 (a)] 141,933 138,712 162,972 163,965 Other Comprehensive Income [Note 41.1 (a)] (65,314) 29,445 (99,103) 24,702 Contribution made for retirement gratuity 76,619 168,157 63,869 188,667 Benefits paid by the plan (50,247) (42,796) (54,105) (87,541)As at 31 December 735,666 709,294 829,873 820,109
41.1 (a) Contribution made for Retirement Gratuity
BANK GROUP
2021 2020 2021 2020LKR ’000 LKR ’000 LKR ’000 LKR ’000
Current service cost 85,686 79,735 98,573 94,213 Interest cost 56,247 58,977 64,399 69,752 Amount recognised in the Statement of Profit or Loss 141,933 138,712 162,972 163,965 Liability experience loss/(gain) 6,863 33,810 9,275 24,231 Liability loss/(gain) due to changes in; Financial assumptions (72,177) 22,047 (108,378) 26,883 Demographic assumptions - (26,412) - (26,412)Amount recognised in Other Comprehensive Income (65,314) 29,445 (99,103) 24,702
NOTES TO THE FINANCIAL STATEMENTS

INSIDE INSIGHT FINANCIAL STATEMENTS
229
41.1 (b) Assumptions and the Sensitivity of the Assumptions used for the Provision of Retirement Gratuity - Bank
The actuarial valuations of the retirement gratuity liability were carried out as at 31 December 2021 and 31 December 2020 by Messrs. Piyal S Goonetilleke and Associates, a professional Actuary.
The valuation method used by the Actuary to value the liability is the ‘Projected Unit Credit Actuarial Cost Method’, recommended by LKAS 19 - ‘Employee Benefits’.
Assumptions and the sensitivity of the assumptions used for the Gratuity plan
Type of assumption Criteria Description
Demographic Mortality UP 1984 Mortality TableRetirement age Normal retirement age or age on valuation date, if greater*
FinancialRate of discount
The estimated yield rate of a Sri Lanka Government Bond with a term equalling to gratuity benefit is the rate of 12.06% p.a. (2020 - 7.93% p.a.) has been used to discount future liabilities.
Salary increasesEstimated long term salary increment of 9.75% p.a. (2020 - 6.5% p.a.) has been used in respect of the active employees
*The increase in retirement age of the employees was enacted by the Minimum Retirement Age of Workers Act No. 28 of 2021.
As on 17 Nov 2021, employees who have attained the age of; Retirement age
Less than 52 years 60 years53 years 59 years54 years 58 years55 years 57 years
The Bank had accounted for this impact in the previous year based on the Government budget proposals for the year 2021.
The above assumptions except salary increment rate have been used by the group companies, in arriving at the provision for retirement gratuity. The group companies used the salary increment rates at the range of 8% - 10% p.a (2020 - 8% - 10% p.a).
Sensitivity of Assumptions used in the Actuarial Valuation
Reasonably possible changes at the reporting date to one of the significant actuarial assumptions, holding other assumptions constant, would have affected the provision for retirement gratuity and Other Comprehensive Income by the amounts shown below.
BANK
2021 2020
Increase|(Decrease)
in Discount Rate
Increase/ (Decrease)
in Salary Increment
Rate
Sensitivity Effect on the Other
Comprehensive Income Increase/(Decrease)
in Comprehensive Income for the Year
Sensitivity Effect on Provision for
Retirement Gratuity Increase/(Decrease)
in Liability
Sensitivity Effect on the Other
Comprehensive Income Increase/(Decrease)
in Comprehensive Income for the Year
Sensitivity Effect on Provision for
Retirement Gratuity Increase/(Decrease)
in Liability
% % LKR Mn LKR Mn LKR Mn LKR Mn
1 68.11 (68.11) 71.65 (71.65)(-1) (79.83) 79.83 (85.06) 85.06
1 (78.95) 78.95 (83.36) 83.36 (-1) 68.53 (68.53) 71.59 (71.59)
NOTES TO THE FINANCIAL STATEMENTS

INSIDE INSIGHT FINANCIAL STATEMENTS
230
41.1 (b) Assumptions and the Sensitivity of the Assumptions used for the Provision of Retirement Gratuity - Bank (Contd.)
GROUP
2021 2020
Increase|(Decrease)
in Discount Rate
Increase/ (Decrease)
in Salary Increment
Rate
Sensitivity Effect on the Other
Comprehensive Income Increase/(Decrease)
in Comprehensive Income for the Year
Sensitivity Effect on Provision for
Retirement Gratuity Increase/(Decrease)
in Liability
Sensitivity Effect on the Other
Comprehensive Income Increase/(Decrease)
in Comprehensive Income for the Year
Sensitivity Effect on Provision for
Retirement Gratuity Increase/(Decrease)
in Liability
% % LKR Mn LKR Mn LKR Mn LKR Mn
1 75.16 (75.16) 82.50 (82.50)(-1) (88.18) 88.18 (97.95) 97.95
1 (87.29) 87.29 (95.91) 95.91 (-1) 75.70 (75.70) 82.38 (82.38)
41.1 (c) The expected Benefit Payout in the future years for Retirement Gratuity
BANK
2021 2020LKR ’000 LKR ’000
Within next 12 months 42,407 29,248Between 2 and 5 years 286,396 227,133Beyond 5 years 1,112,257 731,861
The expected benefits are estimated, based on the same assumptions used to measure the retirement benefit obligation of the Bank at the end of the year and include benefits attributable to estimated future employee service.
The average duration of the defined benefit obligation is 11.5 years (2020 - 12.2 years).
41.2 Pension Fund
The amount recognised in the Statement of Financial Position is as follows:
BANK & GROUP
2021 2020LKR ’000 LKR ’000
Present value of the funded obligation as at 31 December 790,708 1,052,450 Fair value of plan assets as at 31 December (1,170,253) (1,195,582)Retirement Benefit (Asset)/Liability* (379,545) (143,132)
*The over payment is recognised as prepaid expenses in Other Assets.
41.2 (a) Contribution made to the Pension Fund
BANK & GROUP
2021 2020LKR ’000 LKR ’000
Current service cost 22,144 27,875 Interest cost (7,511) (11,250)Amount recognised in the Statement of Profit or Loss 14,633 16,625 Assets loss/(gain) arising during the year 34,596 27,412 Liability experience loss/(gain) 11,801 23,129 Actuarial (gain)/loss due to changes in; Financial assumptions (297,444) 192,229 Demographic assumptions - (213,650)Amount recognised in the Other Comprehensive Income (251,047) 29,120
NOTES TO THE FINANCIAL STATEMENTS

INSIDE INSIGHT FINANCIAL STATEMENTS
231
41.2 (b) Defined Benefit Obligation Reconciliation
BANK & GROUP
2021 2020LKR ’000 LKR ’000
Defined Benefit Obligation as at 01 January 1,052,450 992,746 Current service cost 22,144 27,875 Interest cost 83,249 102,748 Actual benefits paid from plan (81,492) (72,627)Actuarial (gain)/loss due to changes in assumptions (297,444) (21,421)Actuarial (gain)/loss due to experience adjustments 11,801 23,129 Defined Benefit Obligation as at 31 December 790,708 1,052,450
41.2 (c) Fair Value of Plan Assets Reconciliation
BANK & GROUP
2021 2020LKR ’000 LKR ’000
Fair value of plan assets as at 01 January 1,195,582 1,177,587 Expected return on assets 90,759 113,999 Actual employer contributions - 4,035 Actual benefit paid from plan (81,492) (72,627)Actuarial (loss)/gain from plan assets (34,596) (27,412)Fair Value of plan assets as at 31 December 1,170,253 1,195,582
41.2 (d) Assumptions and the sensitivity of the assumptions used for the Pension Fund
An actuarial valuation of the Pension Fund was carried out as at 31 December 2021 and 31 December 2020 by Messrs Piyal S Goonetilleke Associates, a professional Actuary.
The valuation method used by the Actuary to value the Fund is the ‘Projected Unit Credit Actuarial Cost Method’, recommended by LKAS 19 - ‘Employee Benefits’.
Assumptions and the sensitivity of the assumptions used for the Pension Fund
Type of assumption Criteria Description
DemographicMortality UP 1984 Mortality TableRetirement age Normal retirement age [Note 41.1 (b)]
FinancialRate of discount The estimated yield rate of a Sri Lanka Government Bond with a term equalling to Pension benefits is
the rate of 12.5% p.a. (2020 - 7.91% p.a.) has been used to discount future liabilities.Salary increases Estimated long term salary increment of 9.75% p.a. (2020 - 6.5% p.a.) has been used.
Sensitivity of Assumptions used in the Actuarial Valuation
Reasonably possible changes at the reporting date to one of the significant actuarial assumptions, holding other assumptions constant, would have affected the pension liability and Other Comprehensive Income by the amounts shown below:
BANK & GROUP
2021 2020
Increase/(Decrease)
in Discount Rate
Increase/ (Decrease)
in Salary Increment
Rate
Sensitivity Effect on the Other
Comprehensive Income Increase/(Decrease)
in Comprehensive Income for the Year
Sensitivity Effect on Provision for
Retirement Obligation Increase/(Decrease)
in Liability
Sensitivity Effect on the Other
Comprehensive Income Increase/(Decrease)
in Comprehensive Income for the Year
Sensitivity Effect on Provision for
Retirement Obligation Increase/(Decrease)
in Liability
% % LKR Mn LKR Mn LKR Mn LKR Mn
1 59.95 (59.95) 103.34 (103.34)(-1) (68.61) 68.61 (122.17) 122.17
1 (23.22) 23.22 (39.75) 39.75 (-1) 21.77 (21.77) 36.96 (36.96)
NOTES TO THE FINANCIAL STATEMENTS

INSIDE INSIGHT FINANCIAL STATEMENTS
232
41.2 (d) Assumptions and the sensitivity of the assumptions used for the Pension Fund (Contd.)
BANK & GROUP
2021 2020
Increase/ (Decrease) in Life
expectancy
Sensitivity Effect on the Other
Comprehensive Income Increase/(Decrease)
in Comprehensive Income for the Year
Sensitivity Effect onProvision for
Retirement Obligation Increase/(Decrease)
in Liability
Sensitivity Effect on the Other
Comprehensive Income Increase/(Decrease)
in Comprehensive Income for the Year
Sensitivity Effect onProvision for
Retirement Obligation Increase/(Decrease)
in Liability
% LKR Mn LKR Mn LKR Mn LKR Mn
+1 Year (10.28) 10.28 (19.26) 19.26 - 1 Year 10.68 (10.68) 19.71 (19.71)
41.2 (e) Fair value of total plan assets consists of the following.
BANK
2021 2020LKR ’000 LKR ’000
Investments in Sri Lanka Government Securities 619,293 606,976Investments in Time Deposits 534,355 508,439Others 16,605 80,167Total 1,170,253 1,195,582
41.2 (f) The Expected Benefit Payout from the Pension Fund in Future Years
BANK
2021 2020LKR ’000 LKR ’000
Within next 12 months 71,877 80,549Between 2 and 5 years 486,159 452,249Beyond 5 years 659,075 641,616
The expected benefits are based on the same assumptions used to measure the Bank’s retirement benefit obligation at the end of the year and include benefits attributable to estimated future employee service.
The average duration of the defined benefit obligation is 9.3 years as at 31 December 2021 (2020 -11.8 years).
41.2 (g) The total amount recognised in Other Comprehensive Income relating to retirement benefit obligations
BANK GROUP
2021 2020 2021 2020LKR ’000 LKR ’000 LKR ’000 LKR ’000
Retirement Gratuity [Note 41.1 (a)] (65,314) 29,445 (99,103) 24,702 Pension Fund [Note 41.2 (a)] (251,047) 29,120 (251,047) 29,120 Total (316,361) 58,565 (350,150) 53,822
42 OTHER LIABILITIES
Other liabilities include other financial liabilities and other non-financial liabilities. Other non-financial liabilities include fees, expenses and amounts payable for deposit insurance, dividend payable and other provisions. These liabilities are recorded at amounts expected to be payable at the reporting date.
Provisions are recognised when the Group have a present obligation (legal or constructive) as a result of a past event, it is probable that an outflow of resources embodying economic benefits will be required to settle the obligation and a reliable estimate can be made of the amount of the obligation.
Dividends on ordinary shares are recognised as a liability and deducted from equity, when they are approved by the Board of Directors.
Other financial liabilities and other non-financial liabilities included under other liabilities are summarised below:
NOTES TO THE FINANCIAL STATEMENTS

INSIDE INSIGHT FINANCIAL STATEMENTS
233
BANK GROUP
2021 2020 2021 2020LKR ’000 LKR ’000 LKR ’000 LKR ’000
Other financial liabilities (Note 42.1) 2,911,821 3,117,943 3,252,900 3,458,397 Other non-financial liabilities (Note 42.2) 5,526,436 4,797,904 5,840,827 4,976,405 Total 8,438,257 7,915,847 9,093,727 8,434,802
42.1 Other Financial Liabilities
BANK GROUP
2021 2020 2021 2020LKR ’000 LKR ’000 LKR ’000 LKR ’000
Unpresented cheques/pay orders 1,600,430 1,814,431 1,609,769 1,814,431 Unpresented cheques - Dividend Payable (Note 42.1.1) 91,823 86,354 91,823 86,354 Lease liabilities (Note 42.1.2) 1,207,930 1,204,896 1,490,757 1,525,282 Others 11,638 12,262 60,551 32,330 Total 2,911,821 3,117,943 3,252,900 3,458,397
42.1.1 Unpresented cheques - Dividend Payable
BANK & GROUP
2021 2020LKR ’000 LKR ’000
Balance as at 01 January 86,354 74,804 Cash dividend declared for the prior year 348,956 443,600 Reversal of dividends declared in prior years [Note 42.1.1 (a)] (10,462) (8,838)Dividend paid (333,025) (423,212)Balance as at 31 December 91,823 86,354
42.1.1 (a) Reversal of Dividends declared in Prior Years
Reversal of dividends declared in previous years represents unclaimed dividends which are written back to equity after six years.
42.1.2 Lease liabilities
Set out below are the carrying amount of lease liabilities recognised on adoption of SLFRS 16 - Leases.
BANK GROUP
2021 2020 2021 2020LKR ’000 LKR ’000 LKR ’000 LKR ’000
Balance as at 01 January 1,204,896 1,123,255 1,525,282 1,467,005 Additions 295,699 322,317 295,699 321,696 Accretion of interest 124,814 125,925 148,514 163,650 Payments (417,479) (366,601) (478,738) (427,069)Balance as at 31 December 1,207,930 1,204,896 1,490,757 1,525,282
42.1.2 (a) Maturity Analysis of Lease Liabilities
BANK GROUP
2021 2020 2021 2020LKR ’000 LKR ’000 LKR ’000 LKR ’000
Less than 1 year 249,094 257,155 282,132 291,401 1 to 5 years 705,773 705,708 955,562 966,799 More than 5 years 253,063 242,033 253,063 267,082
1,207,930 1,204,896 1,490,757 1,525,282
NOTES TO THE FINANCIAL STATEMENTS
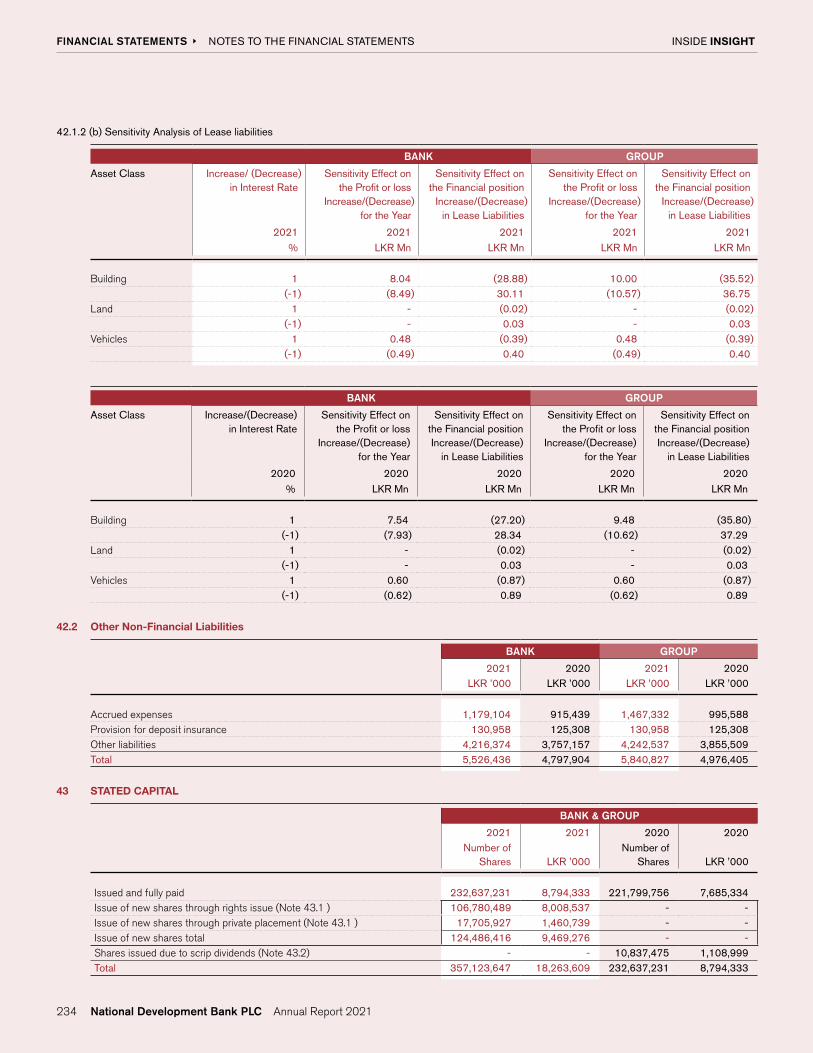
INSIDE INSIGHT FINANCIAL STATEMENTS
234
42.1.2 (b) Sensitivity Analysis of Lease liabilities
BANK GROUP
Asset Class Increase/ (Decrease) in Interest Rate
Sensitivity Effect on the Profit or loss
Increase/(Decrease) for the Year
Sensitivity Effect on the Financial position
Increase/(Decrease) in Lease Liabilities
Sensitivity Effect on the Profit or loss
Increase/(Decrease) for the Year
Sensitivity Effect on the Financial position
Increase/(Decrease) in Lease Liabilities
2021 2021 2021 2021 2021% LKR Mn LKR Mn LKR Mn LKR Mn
Building 1 8.04 (28.88) 10.00 (35.52)(-1) (8.49) 30.11 (10.57) 36.75
Land 1 - (0.02) - (0.02)(-1) - 0.03 - 0.03
Vehicles 1 0.48 (0.39) 0.48 (0.39)(-1) (0.49) 0.40 (0.49) 0.40
BANK GROUP
Asset Class Increase/(Decrease) in Interest Rate
Sensitivity Effect on the Profit or loss
Increase/(Decrease) for the Year
Sensitivity Effect on the Financial position Increase/(Decrease)
in Lease Liabilities
Sensitivity Effect on the Profit or loss
Increase/(Decrease) for the Year
Sensitivity Effect on the Financial position Increase/(Decrease)
in Lease Liabilities
2020 2020 2020 2020 2020% LKR Mn LKR Mn LKR Mn LKR Mn
Building 1 7.54 (27.20) 9.48 (35.80) (-1) (7.93) 28.34 (10.62) 37.29
Land 1 - (0.02) - (0.02) (-1) - 0.03 - 0.03
Vehicles 1 0.60 (0.87) 0.60 (0.87) (-1) (0.62) 0.89 (0.62) 0.89
42.2 Other Non-Financial Liabilities
BANK GROUP
2021 2020 2021 2020LKR ’000 LKR ’000 LKR ’000 LKR ’000
Accrued expenses 1,179,104 915,439 1,467,332 995,588 Provision for deposit insurance 130,958 125,308 130,958 125,308 Other liabilities 4,216,374 3,757,157 4,242,537 3,855,509 Total 5,526,436 4,797,904 5,840,827 4,976,405
43 STATED CAPITAL
BANK & GROUP
2021 2021 2020 2020Number of
Shares LKR ’000Number of
Shares LKR ’000
Issued and fully paid 232,637,231 8,794,333 221,799,756 7,685,334Issue of new shares through rights issue (Note 43.1 ) 106,780,489 8,008,537 - - Issue of new shares through private placement (Note 43.1 ) 17,705,927 1,460,739 - - Issue of new shares total 124,486,416 9,469,276 - - Shares issued due to scrip dividends (Note 43.2) - - 10,837,475 1,108,999Total 357,123,647 18,263,609 232,637,231 8,794,333
NOTES TO THE FINANCIAL STATEMENTS

INSIDE INSIGHT FINANCIAL STATEMENTS
235
43.1 Issue of new shares
The Bank successfully concluded the Rights Issue announced in October 2020, where a total of 106,780,489 were offered at a ratio of 28 new ordinary voting shares for every 61 ordinary voting shares held, 83.2% of these shares were allotted to existing shareholders with the balance 16.8% offered to Norfund - the Norwegian Investment Fund for developing countries as per the Share Subscription Agreement and Investment Agreement entered in to with them, and as approved by the shareholders of the Bank at the EGM held on 09 April 2021. Accordingly, LKR 8 Bn was raised through the Rights Issue.
A further 17,705,927 shares was issued to Norfund through a Private Placement. This resulted in a further LKR 1.46 Bn, totaling to LKR 9.5 Bn raised by the Bank as issue of new shares during the year.
The proceeds from the issue of new shares was for the following objectives.
Objective Number
Objective as per Circular Amount Allocated as per Circular
(LKR Mn)
Proposed Date of Utilisation as per Circular
Amount Allocated from
Proceeds (LKR Mn) (A)
% of Total Proceeds
Amounts Utilised
(LKR Mn) (B)
% of Utilisation against
Allocation (B/A)
Clarification if not fully utilised
including where the funds are invested
1 Further strengthen the equity base of the Bank and thereby Improve Capital Adequacy Ratios in line with Basel III guidelines of the CBSL
9,469 Upon the allotment of shares through the fund raising
9,469 100 9,469 100 -
2 Finance the growth in the loan portfolio of the Bank
9,469 Before the end of FY 2021
9,469 100 9469 100 -
43.2 Scrip Issue
In 2020, the Bank paid a first and final dividend of LKR 7.00 per share comprising of a cash dividend of LKR 2.00 per share and a scrip dividend of LKR 5.00 per share, for the financial year 2019. As per the Notice dated 18 February 2020, published by the Department of Inland Revenue, the above dividend payment was not subject to withholding tax. Accordingly, the stated capital of the Bank as at 31 December 2020 increased to LKR 8,794 Mn.
44 STATUTORY RESERVE FUND
The Statutory Reserve Fund is maintained as per the requirements under Section 20 (1) of the Banking Act No. 30 of 1988. Accordingly, the fund is built up by allocating a sum equivalent to not less than 5% of the profit after tax, but before declaring any dividend or any profits that are transferred to elsewhere until the reserve is equal to 50% of the Bank’s stated capital and thereafter a further sum equivalent to 2% of such profit until the amount of the said reserve fund is equal to the stated capital of the Bank.
The balance in the Statutory Reserve Fund will be used only for the purposes specified in the Section 20 (2) of the Banking Act No. 30 of 1988.
BANK GROUP
2021 2020 2021 2020LKR ’000 LKR ’000 LKR ’000 LKR ’000
As at 01 January 2,196,479 1,896,479 2,196,479 1,896,479 Transferred from retained earnings (Note 45) 375,000 300,000 375,000 300,000 As at 31 December 2,571,479 2,196,479 2,571,479 2,196,479
45 RETAINED EARNINGS
BANK
2021 2020
Retained Earnings
Total General Reserve
Retained Earnings
Total
LKR ’000 LKR ’000 LKR ’000 LKR ’000 LKR ’000
As at 01 January 33,126,579 33,126,579 5,805,707 23,689,843 29,495,550 Transfer to retained earnings - - (5,805,707) 5,805,707 - Total comprehensive income for the year 6,721,297 6,721,297 - 5,474,789 5,474,789 Transferred to the statutory reserve fund (Note 44) (375,000) (375,000) - (300,000) (300,000)Dividends paid to equity holders (338,494) (338,494) - (1,543,760) (1,543,760)As at 31 December 39,134,382 39,134,382 - 33,126,579 33,126,579
NOTES TO THE FINANCIAL STATEMENTS
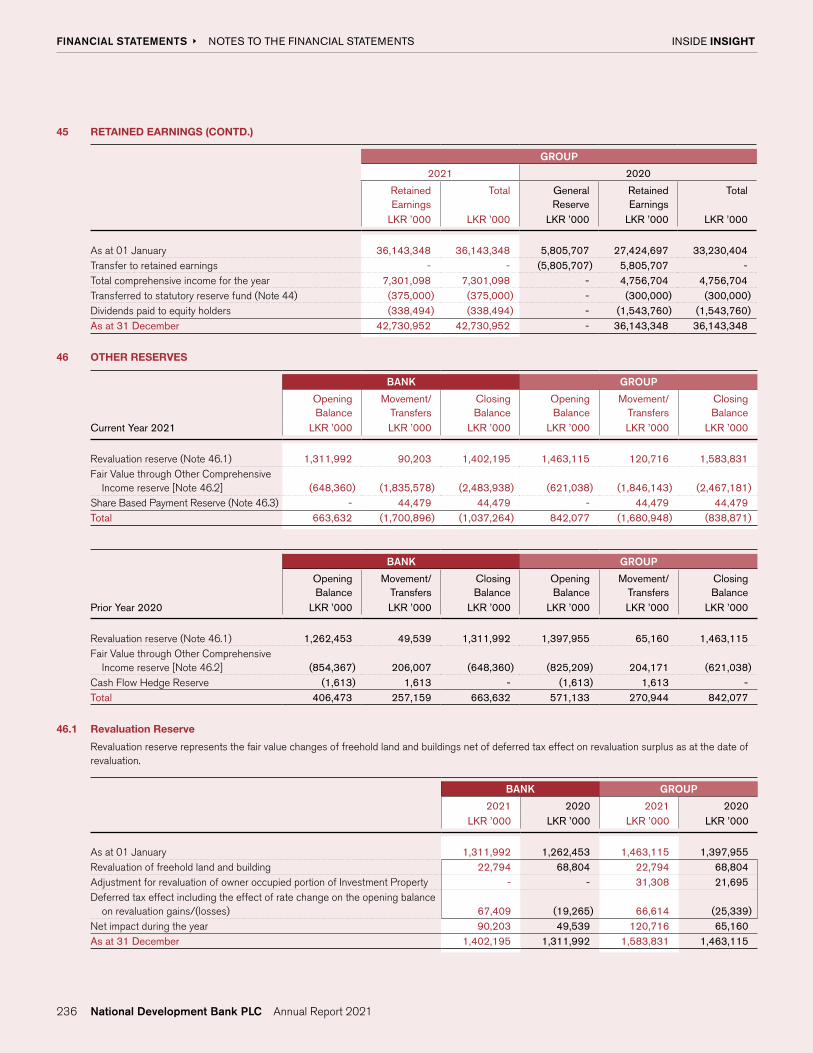
INSIDE INSIGHT FINANCIAL STATEMENTS
236
NOTES TO THE FINANCIAL STATEMENTS
45 RETAINED EARNINGS (CONTD.)
GROUP
2021 2020
Retained Earnings
Total General Reserve
Retained Earnings
Total
LKR ’000 LKR ’000 LKR ’000 LKR ’000 LKR ’000
As at 01 January 36,143,348 36,143,348 5,805,707 27,424,697 33,230,404 Transfer to retained earnings - - (5,805,707) 5,805,707 - Total comprehensive income for the year 7,301,098 7,301,098 - 4,756,704 4,756,704 Transferred to statutory reserve fund (Note 44) (375,000) (375,000) - (300,000) (300,000)Dividends paid to equity holders (338,494) (338,494) - (1,543,760) (1,543,760)As at 31 December 42,730,952 42,730,952 - 36,143,348 36,143,348
46 OTHER RESERVES
BANK GROUP
Opening Balance
Movement/ Transfers
Closing Balance
Opening Balance
Movement/ Transfers
Closing Balance
Current Year 2021 LKR ’000 LKR ’000 LKR ’000 LKR ’000 LKR ’000 LKR ’000
Revaluation reserve (Note 46.1) 1,311,992 90,203 1,402,195 1,463,115 120,716 1,583,831 Fair Value through Other Comprehensive
Income reserve [Note 46.2] (648,360) (1,835,578) (2,483,938) (621,038) (1,846,143) (2,467,181)Share Based Payment Reserve (Note 46.3) - 44,479 44,479 - 44,479 44,479 Total 663,632 (1,700,896) (1,037,264) 842,077 (1,680,948) (838,871)
BANK GROUP
Opening Balance
Movement/ Transfers
Closing Balance
Opening Balance
Movement/ Transfers
Closing Balance
Prior Year 2020 LKR ’000 LKR ’000 LKR ’000 LKR ’000 LKR ’000 LKR ’000
Revaluation reserve (Note 46.1) 1,262,453 49,539 1,311,992 1,397,955 65,160 1,463,115 Fair Value through Other Comprehensive
Income reserve [Note 46.2] (854,367) 206,007 (648,360) (825,209) 204,171 (621,038)Cash Flow Hedge Reserve (1,613) 1,613 - (1,613) 1,613 - Total 406,473 257,159 663,632 571,133 270,944 842,077
46.1 Revaluation Reserve
Revaluation reserve represents the fair value changes of freehold land and buildings net of deferred tax effect on revaluation surplus as at the date of revaluation.
BANK GROUP
2021 2020 2021 2020LKR ’000 LKR ’000 LKR ’000 LKR ’000
As at 01 January 1,311,992 1,262,453 1,463,115 1,397,955 Revaluation of freehold land and building 22,794 68,804 22,794 68,804 Adjustment for revaluation of owner occupied portion of Investment Property - - 31,308 21,695 Deferred tax effect including the effect of rate change on the opening balance
on revaluation gains/(losses) 67,409 (19,265) 66,614 (25,339)Net impact during the year 90,203 49,539 120,716 65,160 As at 31 December 1,402,195 1,311,992 1,583,831 1,463,115

INSIDE INSIGHT FINANCIAL STATEMENTS
237
NOTES TO THE FINANCIAL STATEMENTS
46.2 Fair Value through Other Comprehensive Income Reserve
The fair value through Other Comprehensive Income reserve comprises the cumulative net change in the fair value of financial assets measured at fair value through Other Comprehensive Income until they are derecognised or impaired.
BANK GROUP
2021 2020 2021 2020LKR ’000 LKR ’000 LKR ’000 LKR ’000
As at 01 January (648,360) (854,367) (621,038) (825,209)Net change in fair value during the year in debt instruments (2,353,240) 8,188 (2,367,024) 5,866 Net change in fair value during the year in equity instruments (49,407) (143,533) (49,407) (143,533)Deferred tax effect including the effect of rate change on the opening
balance of fair value through Other Comprehensive Income reserve 567,069 341,352 570,288 341,838 Net impact during the year (1,835,578) 206,007 (1,846,143) 204,171 As at 31 December (2,483,938) (648,360) (2,467,181) (621,038)
46.3 Share Based Payment Reserve
Employee Share Option Scheme (ESOS)
An Employee Share Option Scheme (ESOS 2016) was approved by the shareholders of the Bank at an Extraordinary General Meeting (EGM) held in March 2016 in order to, enable the management staff in the rank of Senior Manager and above of the Bank and the respective Chief Executive Officers of NDB Capital Holdings Limited, NDB Wealth Management Limited, NDB Investment Bank Limited and NDB Securities (Pvt) Limited to take part in the voting ordinary share capital of the Bank, subject to certain limits, terms and conditions.
As per the ESOS 2016, the Bank will offer share options relating to voting shares to the eligible employees up to a maximum of 5% of the total number of shares issued by the Bank. The shares under the said scheme shall be issued during a period of five years from the year 2017 (performance year 2016) subject to the performance criteria set out in the Circular to Shareholders dated 01 March 2016, and each year the share options will be limited to 1.25% of the total number of shares then issued by the Bank. The details of the currently applicable scheme (Tranche 5) is as given below.
Although the scheme commenced in the year 2017, the Bank did not meet the ‘Qualifying Performance Criteria’ set out in the Circular to Shareholders dated 01 March 2016 for the performance years 2016, 2017 and 2019.
ESOS tranch 3 (performance year 2018)
The Bank was able to meet the performance criteria for the performance year 2018 and the approved management staff are eligible to exercise their share options during the period from 01 July 2020 to 30 June 2023. However, no share options were exercised by any approved management staff up to 31 December 2021.
Furthermore, as required by SLFRS 2 on “Share-based Payment”, the fair value of the ESOS Tranche 3 was estimated at the grant date using the Binomial Valuation Model taking into consideration various terms and conditions upon which the share options are granted. Accordingly, the inputs used in the measurement of fair value of the share option were : Exercise price of the share options, Market price of a share, Risk-free rate, Exercise period, Volatility of the share price. However, the fair value of the said option plan was not material to be accounted for in the Financial Statements given the historical trend of the share price movements and the volatility in the expected share price movements.
ESOS tranch 5 (performance year 2020)
In additions to the Tranch 3, the Bank was able to achieve the performance criteria under Tranche 5 for the performance year 2020 and the approved management staff are eligible to exercise their share options as per the ESOS. The details of the Tranche 5 is as given below.
TranchePeriod of Performance
EvaluationOption grant date Vesting Period
(From -To)Exercise Period
(From -To)
5 2020 01 July 202101 July 2021 -30 June 2022
01 July 2022 -30 June 2025
The Group recognised a Share Based Payment Reserve for the value of the share options under Trache 5 based on a valuation carried out by an independent valuer as required by SLFRS 2, “Share-based Payment”using the Binomial Valuation Model. The inputs used in measurement of fair value of the share option were : Exercise price of the share options, Market price of a share, Risk-free rate, Exercise period, Volatility of the share price. The share based payment reserve was LKR 44.5 Mn and corresponding charge of the same represents in the Statement of Profit or Loss under Note 12-Personnel Expenses.

INSIDE INSIGHT FINANCIAL STATEMENTS
238
NOTES TO THE FINANCIAL STATEMENTS
47 NON-CONTROLLING INTERESTS
ACCOUNTING POLICY
Non-controlling interests represent the portion of profit or loss and net assets of subsidiaries not owned directly or indirectly by the Bank. Any losses applicable to the non-controlling interests are allocated against the interests of the non-controlling interests even if it is a deficit balance. Acquisitions of non-controlling interests are accounted for using the parent entity extension method, whereby the difference between the consideration and the fair value of the share of net assets acquired is recognised as equity. Therefore no goodwill is recognised as a result of such transactions.
GROUP
2021 2020LKR ’000 LKR ’000
Balance as at 01 January 1,227,155 1,155,280 Profit for the year 158,467 100,542 Other comprehensive income, net of tax 3,967 2,382 Adjustments to non controlling interests - (2,382)Dividends paid to equity holders (50,216) (28,667)Balance as at 31 December 1,339,373 1,227,155
48 CONTINGENT LIABILITIES AND COMMITMENTS
ACCOUNTING POLICY
All discernible risks are accounted for in determining the amount of all known liabilities. Commitments and contingencies represent possible obligations whose existence will be confirmed only by uncertain future events or present obligations where the transfer of economic benefit is not probable or cannot be reliably measured, as defined in the Sri Lanka Accounting Standard - LKAS 37 on ‘Provisions, Contingent Liabilities and Contingent Assets’.
To meet the financial needs of customers, the Group enter into various irrevocable commitments and contingent liabilities. These consist of the financial guarantees, letters of credit and forward foreign exchange contracts and other undrawn commitments to lend. The letters of credit and guarantees commit the Group to make payments on behalf of customers in the event of a specific act, generally related to import or export of goods. The guarantees and standby letters of credit carry a similar credit risk of that loans/contingent liabilities and are not recognised in the Statement of Financial Position but are disclosed unless they are remote.
48.1 Business Commitments and contingencies
BANK GROUP
2021 2020 2021 2020LKR ’000 LKR ’000 LKR ’000 LKR ’000
ContingenciesGuarantees 61,705,580 45,095,689 61,559,629 45,049,738 Performance Bonds 22,399,692 16,893,389 22,399,692 16,893,389 Documentary Credits 24,253,102 18,316,091 24,253,102 18,316,091 Other Contingencies [Note 48 .1 (a)] 78,343,624 141,851,870 78,343,624 141,851,870
CommitmentsUndrawn commitments 125,370,437 121,792,487 125,422,343 121,942,570 Total 312,072,435 343,949,526 311,978,390 344,053,658 Less: Impairment allowance [Note 48 .1 (b)] 2,029,511 1,165,958 2,029,511 1,165,958 Net of impairment 310,042,924 342,783,568 309,948,879 342,887,700
The maturity analysis of the commitments and contingencies is disclosed in Note 56.4.(f)

INSIDE INSIGHT FINANCIAL STATEMENTS
239
NOTES TO THE FINANCIAL STATEMENTS
48.1 (a) Other Contingencies
BANK GROUP
2021 2020 2021 2020LKR ’000 LKR ’000 LKR ’000 LKR ’000
Forward Exchange Contracts 50,402,579 127,080,925 50,402,579 127,080,925 Acceptances 27,941,045 14,770,945 27,941,045 14,770,945 Total 78,343,624 141,851,870 78,343,624 141,851,870
48.1 (b) Impairment allowance for commitments and contingencies
BANK & GROUP
Stage 1 Stage 2 Stage 3 TotalLKR ’000 LKR ’000 LKR ’000 LKR ’000
Balance as at 01 January 2021 904,659 222,408 38,891 1,165,958 Charges/(reversals) during the year 573,389 66,084 224,080 863,553 Balance as at 31 December 2021 1,478,048 288,492 262,971 2,029,511
Balance as at 01 January 2020 617,422 114,017 43,820 775,259 Charges/(reversals) during the year 287,237 108,391 (4,929) 390,699 Balance as at 31 December 2020 904,659 222,408 38,891 1,165,958
48.1 (c) Analysis of Commitments and Contingencies (before impairment allowance)
BANK GROUP
2021 2020 2021 2020LKR ’000 LKR ’000 LKR ’000 LKR ’000
Domestic CurrencyGuarantees 45,401,543 31,618,678 45,255,592 31,572,727 Performance Bonds 15,046,076 10,748,931 15,046,076 10,748,931 Documentary Credits 1,298,545 1,106,267 1,298,545 1,106,267 Forward Exchange Contracts 14,685,260 64,294,126 14,685,260 64,294,126 Acceptances 150,687 76,573 150,687 76,573 Undrawn commitments 124,328,803 120,787,881 124,380,709 120,937,965 Sub Total 200,910,914 228,632,456 200,816,869 228,736,589
Foreign CurrencyGuarantees 16,304,037 13,477,010 16,304,037 13,477,010 Performance Bonds 7,353,616 6,144,458 7,353,616 6,144,458 Documentary Credits 22,954,557 17,209,824 22,954,557 17,209,824 Forward Exchange Contracts 35,717,319 62,786,800 35,717,319 62,786,800 Acceptances 27,790,358 14,694,372 27,790,358 14,694,372 Undrawn commitments 1,041,634 1,004,606 1,041,634 1,004,606 Sub Total 111,161,521 115,317,070 111,161,521 115,317,070 Total 312,072,435 343,949,526 311,978,390 344,053,659

INSIDE INSIGHT FINANCIAL STATEMENTS
240
NOTES TO THE FINANCIAL STATEMENTS
48.2 Capital Commitments
The capital expenditure approved by the Board of Directors for which provision has not been made in the Financial Statements is as follows:
BANK GROUP
2021 2020 2021 2020LKR ’000 LKR ’000 LKR ’000 LKR ’000
Approved and contracted for 347,088 683,237 395,752 804,465Total 347,088 683,237 395,752 804,465
The Bank has a capital commitments totalling approximately LKR 347 Mn over the next 12 months in relation to the upgrade of the Core Banking system.
48.3 Litigation Against the Bank
In the normal course of business, the bank is a party to various types of litigation, including litigation with borrowers who are in default in terms of their facility agreements. Based on the assessment carried out, the Bank is of the view that the legal cases filed against the Bank will not have a material impact on the reported financial results or the future operations of the Bank.
48.4 Tax Assessments Against the Bank and Group Companies
The following tax assessments are outstanding, against which the Bank and Group companies have duly appealed.
1. The VAT on financial services assessments received by the Bank for the years 2012 and 2013 amounting to LKR 302.6 Mn, which were determined by the Commissioner General of Inland Revenue as payable have been forwarded to the Tax Appeals Commission for their determinations.
2. The VAT assessments received by the Bank for the year 2016 amounting to LKR 33 Mn are pending hearings by the Appeal Branch of the Department of Inland Revenue.
3. The assessments on VAT on financial services received by NDB Capital Holdings Limited for the years 2012 and 2013 amounting to LKR 183.8 Mn which were determined by the Commissioner General of Inland Revenue as payable have been forwarded to the Tax Appeals Commission for their determinations. The Company has taken up the position that the company does not carry on the business of provision of loans, as charged in the assessments/ determinations. Further the assessment on VAT on financial services for the year 2018 received by the Company amounting to LKR 79Mn is pending hearing at the Appeal Branch of the Department of Inland Revenue.
4. The income tax assessments received by NDB Capital Holdings Limited for the Years of Assessment 2015/2016 and 2017/2018 amounting to LKR 62.5 Mn are pending hearing by the Appeal Branch of the Department of Inland Revenue.
The Group is of the view that the above assessments will not have any material adverse impact on the Financial Statements.
49 NET ASSETS VALUE PER ORDINARY SHARE
BANK GROUP
2021 2020 2021 2020
Amount used as the Numerator:Total equity attributable to equity holders of the Bank (LKR ’000) 58,932,205 44,781,023 62,727,164 47,976,237
Number of Ordinary Shares used as the Denominator:Total number of shares 357,123,647 232,637,231 357,123,647 232,637,231 Net Assets value per share (LKR) 165.02 192.49 175.65 206.23
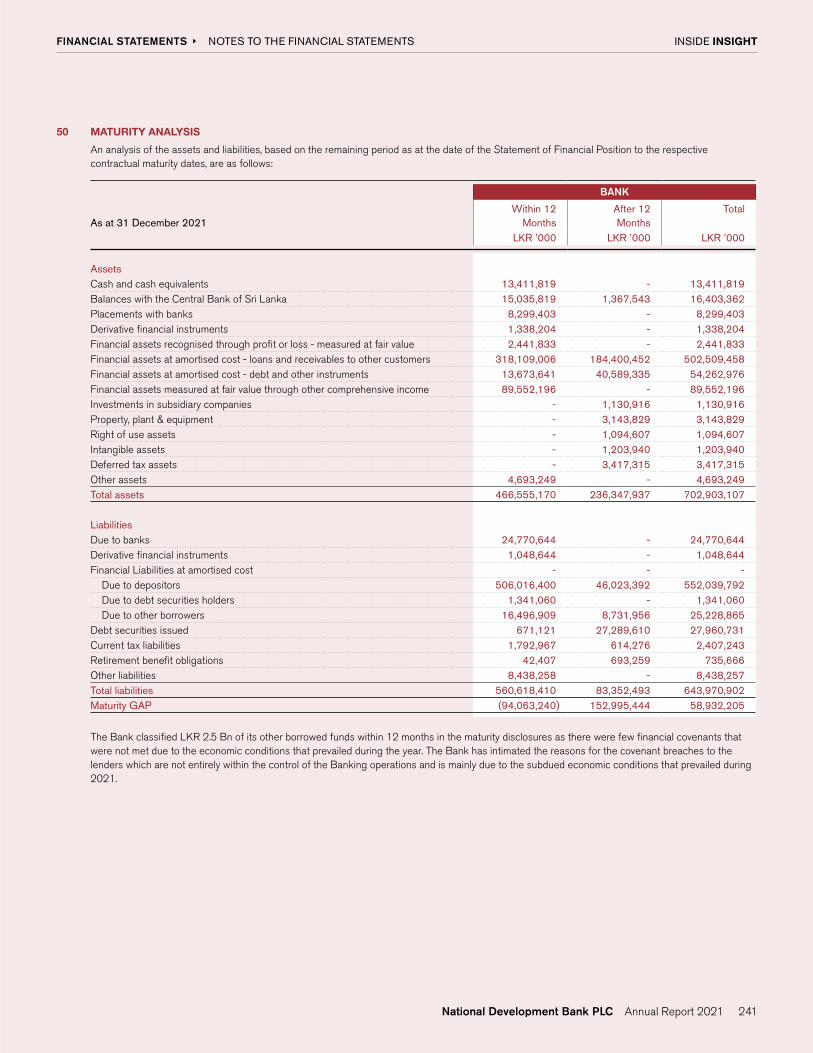
INSIDE INSIGHT FINANCIAL STATEMENTS
241
NOTES TO THE FINANCIAL STATEMENTS
50 MATURITY ANALYSIS
An analysis of the assets and liabilities, based on the remaining period as at the date of the Statement of Financial Position to the respective contractual maturity dates, are as follows:
BANK
As at 31 December 2021Within 12
MonthsAfter 12 Months
Total
LKR ’000 LKR ’000 LKR ’000
AssetsCash and cash equivalents 13,411,819 - 13,411,819Balances with the Central Bank of Sri Lanka 15,035,819 1,367,543 16,403,362Placements with banks 8,299,403 - 8,299,403Derivative financial instruments 1,338,204 - 1,338,204Financial assets recognised through profit or loss - measured at fair value 2,441,833 - 2,441,833Financial assets at amortised cost - loans and receivables to other customers 318,109,006 184,400,452 502,509,458Financial assets at amortised cost - debt and other instruments 13,673,641 40,589,335 54,262,976Financial assets measured at fair value through other comprehensive income 89,552,196 - 89,552,196Investments in subsidiary companies - 1,130,916 1,130,916Property, plant & equipment - 3,143,829 3,143,829Right of use assets - 1,094,607 1,094,607Intangible assets - 1,203,940 1,203,940Deferred tax assets - 3,417,315 3,417,315Other assets 4,693,249 - 4,693,249Total assets 466,555,170 236,347,937 702,903,107
LiabilitiesDue to banks 24,770,644 - 24,770,644Derivative financial instruments 1,048,644 - 1,048,644Financial Liabilities at amortised cost - - - Due to depositors 506,016,400 46,023,392 552,039,792 Due to debt securities holders 1,341,060 - 1,341,060 Due to other borrowers 16,496,909 8,731,956 25,228,865Debt securities issued 671,121 27,289,610 27,960,731 Current tax liabilities 1,792,967 614,276 2,407,243Retirement benefit obligations 42,407 693,259 735,666Other liabilities 8,438,258 - 8,438,257Total liabilities 560,618,410 83,352,493 643,970,902Maturity GAP (94,063,240) 152,995,444 58,932,205
The Bank classified LKR 2.5 Bn of its other borrowed funds within 12 months in the maturity disclosures as there were few financial covenants that were not met due to the economic conditions that prevailed during the year. The Bank has intimated the reasons for the covenant breaches to the lenders which are not entirely within the control of the Banking operations and is mainly due to the subdued economic conditions that prevailed during 2021.

INSIDE INSIGHT FINANCIAL STATEMENTS
242
NOTES TO THE FINANCIAL STATEMENTS
50 MATURITY ANALYSIS (CONTD.)
BANK
As at 31 December 2020Within 12
MonthsAfter 12 Months
Total
LKR ’000 LKR ’000 LKR ’000
AssetsCash and cash equivalents 10,487,608 - 10,487,608Balances with the Central Bank of Sri Lanka 6,400,395 411,704 6,812,099Placements with banks 12,401,533 - 12,401,533Derivative financial instruments 1,429,470 - 1,429,470Financial assets recognised through profit or loss - measured at fair value 5,574,175 - 5,574,175Financial assets at amortised cost - loans and receivables to other customers 251,686,766 173,918,742 425,605,508Financial assets at amortised cost - debt and other instruments 2,151,542 42,560,098 44,711,640Financial assets measured at fair value through other comprehensive income 108,593,183 - 108,593,183Investments in subsidiary companies - 1,142,884 1,142,884Property, plant & equipment - 2,968,993 2,968,993Right of use assets - 1,060,843 1,060,843Intangible assets - 1,048,326 1,048,326Deferred tax assets - 1,875,720 1,875,720Other assets 2,204,288 920,428 3,124,716Total assets 400,928,960 225,907,738 626,836,698
LiabilitiesDue to banks 24,173,318 - 24,173,318Derivative financial instruments 1,016,787 - 1,016,787Financial liabilities at amortised cost Due to depositors 460,647,096 29,631,030 490,278,126 Due to debt securities holders 1,500,007 - 1,500,007 Due to other borrowers 27,200,204 7,083,905 34,284,109Debt securities issued 591,281 19,289,610 19,880,891Current tax liabilities 2,059,365 237,931 2,297,296Retirement benefit obligations 29,248 680,046 709,294Other liabilities 7,915,847 - 7,915,847Total liabilities 525,133,153 56,922,522 582,055,675Maturity GAP (124,204,193) 168,985,216 44,781,023
The Bank classified LKR 11.4 Bn of its total debt securities and other borrowed funds within 12 months in the maturity disclosures as there were few financial covenants that were not met due to the economic conditions that prevailed with the emergence of the pandemic crisis during the year. The Bank has intimated the reasons for the covenant breaches to the lenders which are not entirely within the control of the Banking operations and is mainly due to the subdued economic conditions that prevailed during 2020.

INSIDE INSIGHT FINANCIAL STATEMENTS
243
NOTES TO THE FINANCIAL STATEMENTS
GROUP
As at 31 December 2021Within 12
MonthsAfter 12 Months
Total
LKR ’000 LKR ’000 LKR ’000
AssetsCash and cash equivalents 13,765,270 - 13,765,270Balances with the Central Bank of Sri Lanka 15,035,819 1,367,543 16,403,362Placements with banks 8,299,403 - 8,299,403Derivative financial instruments 1,338,204 - 1,338,204Financial assets recognised through profit or loss- measured at fair value 4,784,124 - 4,784,124Financial assets at amortised cost - loans and receivables to other customers 317,887,598 184,457,188 502,344,786Financial assets at amortised cost - debt and other instruments 13,673,641 40,589,335 54,262,976Financial assets measured at fair value through other comprehensive income 89,696,611 - 89,696,611Investment property - 2,528,228 2,528,228Property, plant & equipment - 3,735,298 3,735,298Right of use assets - 1,285,385 1,285,385Intangible assets - 1,217,111 1,217,111Current tax receivables 27,701 - 27,701Deferred tax assets - 3,443,207 3,443,207Other assets 5,670,716 - 5,670,716Total assets 470,179,087 238,623,295 708,802,382
LiabilitiesDue to banks 24,821,158 - 24,821,158Derivative financial instruments 1,048,644 - 1,048,644Financial liabilities at amortised cost Due to depositors 505,233,203 46,023,392 551,256,595 Due to debt securities holders 1,341,060 - 1,341,060 Due to other borrowers 16,496,909 8,731,956 25,228,865Debt securities issued 671,121 27,289,610 27,960,731Current tax liabilities 1,892,141 693,834 2,585,975Deferred tax liabilities - 569,213 569,213Retirement benefit obligations 42,407 787,466 829,873Other liabilities 9,093,726 - 9,093,727Total liabilities 560,640,369 84,095,470 644,735,839Maturity GAP (90,461,283) 154,527,825 64,066,541
The Group classified LKR 2.5 Bn of its other borrowed funds within 12 months in the maturity disclosures as there were few financial covenants that were not met due to the economic conditions that prevailed during the year. The Bank has intimated the reasons for the covenant breaches to the lenders which are not entirely within the control of the Banking operations and is mainly due to the subdued economic conditions that prevailed during 2021.

INSIDE INSIGHT FINANCIAL STATEMENTS
244
NOTES TO THE FINANCIAL STATEMENTS
50 MATURITY ANALYSIS (CONTD.)
GROUP
As at 31 December 2020Within 12
MonthsAfter 12 Months
Total
LKR ’000 LKR ’000 LKR ’000
AssetsCash and cash equivalents 10,778,947 - 10,778,947Balances with the Central Bank of Sri Lanka 6,400,395 411,704 6,812,099Placements with banks 12,401,533 - 12,401,533Derivative financial instruments 1,429,470 - 1,429,470Financial assets recognised through profit or loss - measured at fair value 7,713,222 - 7,713,222Financial assets at amortised cost - loans and receivables to other customers 251,690,580 173,991,252 425,681,832Financial assets at amortised cost - debt and other instruments 2,151,542 42,560,098 44,711,640Financial assets measured at fair value through other comprehensive income 108,762,972 - 108,762,972Investment property - 2,361,535 2,361,535Property, plant & equipment - 3,541,018 3,541,018Right of use assets - 1,289,749 1,289,749Intangible assets - 1,061,673 1,061,673Current tax receivables 45,098 - 45,098Deferred tax assets - 1,945,730 1,945,730Other assets 2,674,672 920,428 3,595,100Total assets 404,048,431 228,083,187 632,131,618
LiabilitiesDue to banks 24,173,318 - 24,173,318Derivative financial instruments 1,016,787 - 1,016,787Financial liabilities at amortised cost Due to depositors 460,027,716 29,631,030 489,658,746 Due to debt securities holders 1,500,007 - 1,500,007 Due to other borrowers 27,200,205 7,083,904 34,284,109Debt securities issued 591,281 19,289,610 19,880,891Current tax liabilities 2,343,884 219,461 2,563,345Deferred tax liabilities - 596,112 596,112Retirement benefit obligations 29,248 790,861 820,109Other liabilities 8,434,802 - 8,434,802Total liabilities 525,317,248 57,610,978 582,928,226Maturity GAP (121,268,817) 170,472,209 49,203,392
The Group classified LKR 11.4 Bn of its total debt securities and other borrowed funds within 12 months in the maturity disclosures as there were few financial covenants that were not met due to the economic conditions that prevailed with the emergence of the pandemic crisis during the year. The Bank has intimated the reasons for the covenant breaches to the lenders which are not entirely within the control of the Banking operations and is mainly due to the subdued economic conditions that prevailed during 2020.
51 SEGMENTAL ANALYSIS - GROUP
ACCOUNTING POLICY
An operating segment is a component of the Group that engages in business activities from which it may earn revenues and incur expenses, including revenues and expenses that relate to transactions with any of the Group’s other components, whose operating results are reviewed regularly by the Senior Management to make decisions about resources allocated to each segment and assess its performance, and for which discrete financial information is available.
For management purposes, the Group has identified four operating segments based on products and services, as follows:
� Banking � Capital Markets � Property Investment � Others
Income taxes are managed on a Group basis and are not allocated to operating segments. Interest income is reported net, as management primarily relies on net interest income as a performance measure, not the gross interest income and interest expense. Transfer prices between operating segments are on an arm’s length basis in a manner similar to transactions with third parties. No revenue from transactions with a single external customer or counterparty amounted to 10% or more of the Bank’s total revenue in 2021 or 2020.

INSIDE INSIGHT FINANCIAL STATEMENTS
245
NOTES TO THE FINANCIAL STATEMENTS
51
SE
GM
EN
TAL
AN
ALY
SIS
- G
RO
UP
(CO
NT
D.)
Ban
king
Cap
ital M
arke
tsP
rope
rty
Inve
stm
ent
Oth
ers
Con
solid
ated
For t
he y
ear e
nded
31
Dec
embe
r20
2120
2020
2120
2020
2120
2020
2120
2020
2120
20LK
R ’0
00LK
R ’0
00LK
R ’0
00LK
R ’0
00LK
R ’0
00LK
R ’0
00LK
R ’0
00LK
R ’0
00LK
R ’0
00LK
R ’0
00
Rev
enue
Inte
rest
inco
me
52,
692,
866
53,
003,
875
85,
151
122
,022
-
-
-
-
5
2,77
8,01
7 5
3,12
5,89
7 N
et fe
e an
d co
mm
issi
on in
com
e 5
,634
,797
4
,268
,945
1
,381
,560
8
38,0
43
209
,341
2
12,7
35
62,
928
93,
609
7,2
88,6
26
5,4
13,3
32
Net
gai
ns/(
loss
es) f
rom
trad
ing
2,0
96,4
55
967
,284
-
-
-
-
-
-
2
,096
,455
9
67,2
84
Net
gai
n/(lo
ss) f
rom
fina
ncia
l in
vest
men
ts a
t fai
r val
ue th
roug
h P
rofit
or L
oss
433
,106
9
6,35
3 1
27,3
76
17,
330
-
-
-
-
560
,482
1
13,6
83
Net
gai
ns/(
loss
es) f
rom
de
reco
gniti
on o
f fin
anci
al a
sset
s m
easu
red
at fa
ir va
lue
thro
ugh
othe
r com
preh
ensi
ve in
com
e 1
86,2
48
1,4
86,0
23
-
277
-
-
-
-
1
86,2
48
1,4
86,3
00
Oth
er o
pera
ting
inco
me
860
,141
3
53,1
44
47,
120
16,
401
153
,004
1
08,1
13
-
-
1,0
60,2
65
477
,658
To
tal r
even
ue fr
om e
xter
nal
cust
omer
s 6
1,90
3,61
3 6
0,17
5,62
4 1
,641
,207
9
94,0
73
362
,345
3
20,8
48
62,
928
93,
609
63,
970,
093
61,
584,
154
Inte
r-se
gmen
t rev
enue
-
-
55,
993
2,4
74
56,
787
64,
103
-
-
112
,780
6
6,57
7 To
tal R
even
ue 6
1,90
3,61
3 6
0,17
5,62
4 1
,697
,200
9
96,5
47
419
,132
3
84,9
51
62,
928
93,
609
64,
082,
873
61,
650,
731
Impa
irmen
t (ch
arge
)/re
vers
al (1
0,25
2,69
5) (6
,793
,647
) -
-
-
-
-
-
(1
0,25
2,69
5) (6
,793
,647
)S
egm
ent e
xpen
ses
(41,
507,
797)
(44,
670,
722)
(1,0
14,5
04)
(884
,061
) (1
1,21
3) (1
1,36
3) (6
7,98
5) (8
1,78
8) (4
2,60
1,49
9) (4
5,64
7,93
4)To
tal s
egm
ent e
xpen
ses
(51,
760,
492)
(51,
464,
369)
(1,0
14,5
04)
(884
,061
) (1
1,21
3) (1
1,36
3) (6
7,98
5) (8
1,78
8) (5
2,85
4,19
4) (5
2,44
1,58
1)
Seg
men
t res
ults
10,
143,
121
8,7
11,2
55
682
,696
1
12,4
86
407
,919
3
73,5
88
(5,0
57)
11,
821
11,
228,
678
9,2
09,1
50
Inco
me
tax
expe
nse
-
-
-
-
-
-
-
-
2,1
51,2
77
2,1
72,9
70
Valu
e ad
ded
tax
on fi
nanc
ial s
ervi
ces
-
-
-
-
-
-
-
-
2,0
14,6
71
1,8
18,8
32
Pro
fit a
fter t
axat
ion
-
-
-
-
-
-
-
-
7,0
62,7
30
5,2
17,3
48
Oth
er in
form
atio
nS
egm
ent a
sset
s 7
02,7
33,0
76
626
,834
,254
2
,906
,491
2
,372
,457
3
,073
,346
2
,803
,497
8
9,46
9 1
21,4
10
708
,802
,382
6
32,1
31,6
18
Seg
men
t lia
bilit
ies
643
,148
,405
5
81,3
95,0
80
965
,118
8
48,1
77
608
,253
6
73,5
97
14,
064
11,
372
644
,735
,840
5
82,9
28,2
26
Seg
men
tal c
ash
flow
sC
ash
flow
s fr
om o
pera
ting
activ
ities
(23,
393,
364)
78,
875,
069
(111
,853
) 3
14,4
70
223
,848
7
0,47
5 9
1,04
0 (4
7,23
0) (2
3,19
0,32
9) 7
9,21
2,78
4 C
ash
flow
s fr
om in
vest
ing
activ
ities
7,4
76,6
59
(63,
051,
776)
76,
621
(386
,354
) (1
67,6
70)
(8,1
10)
-
(804
) 7
,385
,610
(6
3,44
7,04
4)C
ash
flow
s fr
om fi
nanc
ing
activ
ities
14,
740,
218
(4,9
27,3
39)
71,
555
39,
117
(97,
309)
(68,
117)
(24,
120)
-
14,
690,
344
(4,9
56,3
39)

INSIDE INSIGHT FINANCIAL STATEMENTS
246
NOTES TO THE FINANCIAL STATEMENTS
52 RELATED PARTY DISCLOSURES
52.1 Parent and Ultimate Controlling Party
The Bank does not have an identifiable Parent of its own.
52.2 Terms and Conditions
The Bank carries out transactions with Key Management Personnel and their related concerns and other related entities in the ordinary course of its business on an arms length basis at commercial rates as per the Sri Lanka Accounting Standard LKAS 24 - ‘Related Party Disclosures’ except, loans that the key management have availed under the loan schemes which are uniformly applicable to all the staff.
There are no preferential treatments given by the Group to related parties during the year.
52.3 Key Management Personnel (KMP) of the Group
KMP of the Bank
Related parties include Key Management Personnel defined as persons having authority and responsibility for planning, directing and controlling the activities of the Bank. Key Management Personnel include the members of the Board of Directors of the Bank (including Executive and Non-Executive) and the Chief Operating Officer.
KMP of the Group
The Bank is the ultimate parent of the subsidiaries listed out on page 209. The KMP of the Bank has the authority and responsibility for planning directing and controlling the activities of the Group directly or indirectly. Accordingly, the Board of Directors of the Bank (including the Executive and Non-Executive) and the Chief Operating Officer represent the KMP of the Group.
52.3 (a) Compensation to KMP
BANK GROUP2021 2020 2021 2020
LKR ’000 LKR ’000 LKR ’000 LKR ’000
Short-term employment benefits 104,753 123,461 107,461 124,626Post-employment benefits 11,672 9,889 11,672 9,889
116,425 133,350 119,133 134,515
The amounts disclosed above are the amounts recognised as expenses during the reporting period relating to KMP.
In addition to the remuneration, the Bank has also provided non cash benefits to eligible KMP in line with the approved benefit plans of the Bank.
52.3 (b) KMP and their close family members had the following related party transactions during the year
Limit Outstanding Balance Average Balance
2021 2020 2021 2020 2021 2020LKR ’000 LKR ’000 LKR ’000 LKR ’000 LKR ’000 LKR ’000
Items in the Statement of Financial Position - Bank
AssetsFinancial assets at amortised cost - loansand receivables to other customers 59,759 78,296 34,872 60,058 60,058 40,162
59,759 78,296 34,872 60,058 60,058 40,162
LiabilitiesFinancial liabilities at amortised costDue to depositors 307,666 200,128 227,423 217,166
307,666 200,128 227,423 217,166

INSIDE INSIGHT FINANCIAL STATEMENTS
247
NOTES TO THE FINANCIAL STATEMENTS
52.3 (b) KMP and their close family members had the following related party transactions during the year (Contd.)
During the year
2021 2020LKR ’000 LKR ’000
Items in the Statement of Profit or Loss excluding compensation to KMP - BankInterest income 3,631 4,616Interest expenses 13,085 14,787
Fee and commission income 173 172Impairment charge* 129 267
* Impairment charge does not include any specific impairment.
Share investments in the Bank and dividends paid to the KMPs and their Close Family Members are given below.
2021 2020
Investments in ordinary shares as at 31 December (Number of shares) 86,268 18,408Scrip dividends paid during the year (Number of shares) - 282,546Cash dividends paid during the year (LKR ‘000) 28 11,565
52.3 (c) Transactions involving entities which are controlled/ jointly controlled by the KMP and their close family members
Limit Outstanding Balance Average Balance
2021 2020 2021 2020 2021 2020LKR ’000 LKR ’000 LKR ’000 LKR ’000 LKR ’000 LKR ’000
Items in the Statement of Financial Position -Bank
AssetsFinancial assets at amortised cost - loans and
receivables to other customers 3,221,100 1,546,226 3,200,597 707,258 4,031,169 1,050,2033,221,100 1,546,226 3,200,597 707,258 4,031,169 1,050,203
LiabilitiesFinancial liabilities at amortised cost Due to depositors - - 2,974,082 4,083 2,401,746 139,690
- - 2,974,082 4,083 2,401,746 139,690
Commitment & Contingencies Guarantees - 926 30 926 278 1,564
- 926 30 926 278 1,564

INSIDE INSIGHT FINANCIAL STATEMENTS
248
52.3 (c) Transactions involving entities which are controlled/ jointly controlled by the KMP and their close family members (Contd.)
During the year
2021 2020LKR ’000 LKR ’000
Items in the Statement of Profit or Loss - BankInterest income 382,713 31,990Interest expenses 139,287 239Fee and commission income 6,099 1,956Impairment charge/ (reversal)* (2,299) 1,537Other expenses - 2,266
* Impairment charge does not include any specific impairment.
Share investments in the Bank and dividends paid to the entities which are controlled/ jointly controlled by the KMP and their Close Family Members are given below.
2021 2020
Investments in ordinary shares as at 31 December (Number of shares) - -Scrip dividends paid during the year (Number of shares) - 802,086Cash dividends paid during the year (LKR ‘000) - 32,831
52.4 Transactions with the Government of Sri Lanka and its Related Entities
The Group enter into transactions, arrangements and agreements with the Government of Sri Lanka and its related entities.
52.4 (a) The transactions entered with the Government of Sri Lanka and its related entities on a collective basis is as follows
Outstanding Balance Average Balance
2021 2020 2021 2020LKR ’000 LKR ’000 LKR ’000 LKR ’000
Items in the Statement of Financial Position - BankAssetsFinancial assets at amortised cost - loans and receivables to other customers 27,291,868 26,172,597 24,551,763 21,881,158Financial assets at amortised cost - debt and other instruments 4,681,377 - 2,842,872 -Financial assets measured at fair value through other comprehensive income 6,224 6,224 6,224 5,468
31,979,469 26,178,821 27,400,859 21,886,626
LiabilitiesFinancial liabilities at amortised cost Due to depositors 14,777,038 29,311,504 17,137,330 29,298,246 Due to debt securities holders 8,538 - 786,748 1,303,644 Due to other borrowers 20,206,588 21,242,192 20,576,835 12,649,967Debt securities issued 7,428,300 7,325,000 7,347,825 10,933,800
42,420,464 57,878,696 45,848,738 54,185,657
Contingent liabilities and commitmentsForward exchange contracts 6,633,495 24,842,910 11,847,404 13,600,980Other contingencies 16,738 15,738 38,415 11,577Undrawn commitments 3,485,380 5,952,361 5,407,214 7,360,147
10,135,613 30,811,009 17,293,033 20,972,704
NOTES TO THE FINANCIAL STATEMENTS

INSIDE INSIGHT FINANCIAL STATEMENTS
249
NOTES TO THE FINANCIAL STATEMENTS
52.4 (a) The transactions entered with the Government of Sri Lanka and its related entities on a collective basis is as follows (Contd.)
During the year
2021 2020LKR ’000 LKR ’000
Items in the Statement of Profit or Loss - BankInterest income 2,521,574 2,794,127Interest expenses 2,502,160 3,726,215Fee and commission income 9,431 3,691Net gains/(losses) from trading 5,865 15,427Other operating income 39,119 49,584Impairment charge/(reversal)* (156) 661
Scrip dividends paid during the year (Number of shares) - 3,686,848Cash dividends paid during the year (LKR ‘000) 119,479 150,910
* Impairment charge does not include any specific impairment.
52.4 (b) Further transactions detailed below, relating to the ordinary course of business, are entered into with the Government of Sri Lanka and its related entities;
� Statutory balances with the Central Bank of Sri Lanka
� Investments in Treasury Bills, Treasury, Sovereign and Development Bonds and money market placements. Sovereign and Development Bonds are recorded net of provisions.
� Payment of statutory rates, taxes and deposit insurance premium
� Payment for utilities mainly comprising of telephone, electricity and water
� Payment for employment retirement benefits - ETF
52.4 (c) Individually significant transactions
The Bank uses an internal assessment methodology in order to identify significant transactions with the Government of Sri Lanka and Government related entities in accordance with the disclosure requirements of LKAS 24. Accordingly, there are no individually significant transactions that require disclosure during the year.
52.5 Transactions with Related Entities
52.5 (a) The transactions entered by the Bank with its Subsidiaries
Limit Outstanding Balance Average Balance
2021 2020 2021 2020 2021 2020LKR ’000 LKR ’000 LKR ’000 LKR ’000 LKR ’000 LKR ’000
Items in the Statement of Financial Position - BankAssetsFinancial assets at amortised cost - loans and receivables to other customers 600,000 250,000 226,578 112,187 166,907 38,226Other assets 693 1,423 133,524 602,024Investments in subsidiary companies - - 1,130,916 1,142,884 1,139,211 1,805,160
LiabilitiesFinancial liabilities at amortised cost
Due to depositors - - 828,577 576,276 627,191 473,156 Due to debt securities holders - - - - 1,619 15,960Other liabilities - - - - 80 1
Contingent liabilities and commitmentsGuarantees 250,000 300,000 145,951 45,951 84,581 45,951
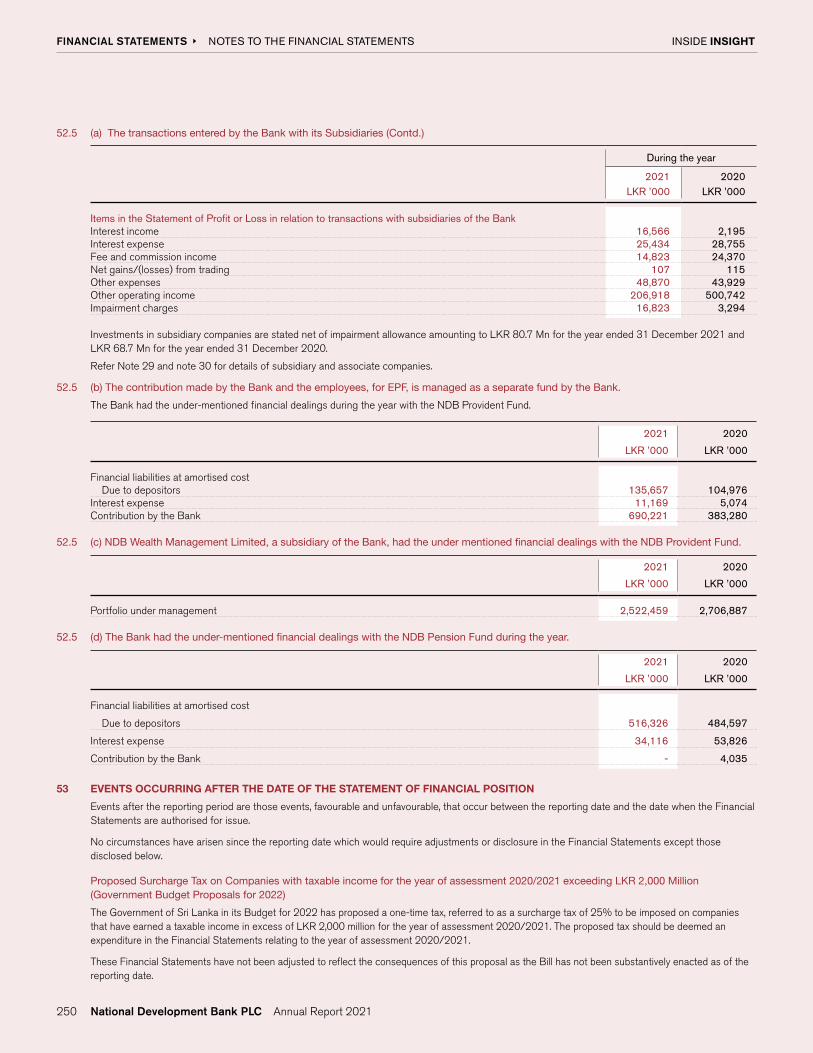
INSIDE INSIGHT FINANCIAL STATEMENTS
250
52.5 (a) The transactions entered by the Bank with its Subsidiaries (Contd.)
During the year
2021 2020LKR ’000 LKR ’000
Items in the Statement of Profit or Loss in relation to transactions with subsidiaries of the BankInterest income 16,566 2,195Interest expense 25,434 28,755Fee and commission income 14,823 24,370Net gains/(losses) from trading 107 115Other expenses 48,870 43,929Other operating income 206,918 500,742Impairment charges 16,823 3,294
Investments in subsidiary companies are stated net of impairment allowance amounting to LKR 80.7 Mn for the year ended 31 December 2021 and LKR 68.7 Mn for the year ended 31 December 2020.
Refer Note 29 and note 30 for details of subsidiary and associate companies.
52.5 (b) The contribution made by the Bank and the employees, for EPF, is managed as a separate fund by the Bank.
The Bank had the under-mentioned financial dealings during the year with the NDB Provident Fund.
2021 2020
LKR ’000 LKR ’000
Financial liabilities at amortised cost Due to depositors 135,657 104,976Interest expense 11,169 5,074Contribution by the Bank 690,221 383,280
52.5 (c) NDB Wealth Management Limited, a subsidiary of the Bank, had the under mentioned financial dealings with the NDB Provident Fund.
2021 2020
LKR ’000 LKR ’000
Portfolio under management 2,522,459 2,706,887
52.5 (d) The Bank had the under-mentioned financial dealings with the NDB Pension Fund during the year.
2021 2020
LKR ’000 LKR ’000
Financial liabilities at amortised cost
Due to depositors 516,326 484,597
Interest expense 34,116 53,826
Contribution by the Bank - 4,035
53 EVENTS OCCURRING AFTER THE DATE OF THE STATEMENT OF FINANCIAL POSITION
Events after the reporting period are those events, favourable and unfavourable, that occur between the reporting date and the date when the Financial Statements are authorised for issue.
No circumstances have arisen since the reporting date which would require adjustments or disclosure in the Financial Statements except those disclosed below.
Proposed Surcharge Tax on Companies with taxable income for the year of assessment 2020/2021 exceeding LKR 2,000 Million (Government Budget Proposals for 2022)
The Government of Sri Lanka in its Budget for 2022 has proposed a one-time tax, referred to as a surcharge tax of 25% to be imposed on companies that have earned a taxable income in excess of LKR 2,000 million for the year of assessment 2020/2021. The proposed tax should be deemed an expenditure in the Financial Statements relating to the year of assessment 2020/2021.
These Financial Statements have not been adjusted to reflect the consequences of this proposal as the Bill has not been substantively enacted as of the reporting date.
NOTES TO THE FINANCIAL STATEMENTS

INSIDE INSIGHT FINANCIAL STATEMENTS
251
NOTES TO THE FINANCIAL STATEMENTS
54 COMPARATIVE INFORMATION
No changes have been made to the information/balances published in the Annual Report for the year 2020 which have been given as comparatives in the Annual Report for the year 2021, other than the items mentioned below.
BANK GROUP
NotePrevious
PresentationCurrent
PresentationAdjustment Previous
PresentationCurrent
PresentationAdjustment
LKR 000 LKR 000 LKR 000 LKR 000 LKR 000 LKR 000
Statement of Profit or LossNet gains/(losses) from
derecognition of financial assets measured at fair value through other comprehensive income 9.1 1,486,023 - (1,486,023) 1,486,023 - (1,486,023)
Net gains/(losses) from derecognition of financial assets measured at amortised cost 9.2 - - - 277 - (277)
Net gains/(losses) from derecognition of financial assets 9 - 1,486,023 1,486,023 - 1,486,300 1,486,300
55 FAIR VALUE OF FINANCIAL INSTRUMENTS AND NON FINANCIAL INSTRUMENTS
ACCOUNTING POLICY
The following is a description of how fair values are determined for financial instruments and non-financial instruments which are recorded at fair value using valuation techniques. These incorporate the Group’s estimate of assumptions that a market participant would make when valuing such instruments.
Significant Accounting Judgments, Estimates and Assumptions
Where the fair values of financial assets and financial liabilities recorded in the Statement of Financial Position cannot be derived from an active market, they are determined using a variety of valuation techniques that include the use of mathematical models. The inputs to these models are derived from observable market data where possible, but if this is not available, judgment is required to establish fair values.
FINANCIAL INSTRUMENTS
Derivative Financial Instruments
Derivative products are foreign exchange contracts and foreign exchange options which are valued using market observable inputs.
Financial Assets Recognised through Profit or Loss - Measured at Fair Value
The quoted equity securities are valued using the market prices published by the Colombo Stock Exchange. Sri Lanka Government Securities are valued based on the market rates published by the money brokers. Investment in private equity funds are measured at fair value based on the change in the net asset value of the funds and is recognised through the Statement of Profit or Loss. Unit trust investments are valued at unit prices available in the market.
Financial Assets Measured at Fair Value through Other Comprehensive Income
Financial assets measured at fair value through other comprehensive income, consist of quoted debentures, non-quoted ordinary shares, quoted ordinary shares and Sri Lanka Government Securities. The quoted equity securities are valued using the market prices published by the Colombo Stock Exchange. The Sri Lanka Government Securities are valued based on the market rates published by the money brokers as at the reporting date and quoted debentures and non-quoted ordinary shares are valued using Internal valuation techniques.
NON-FINANCIAL INSTRUMENTS
Property, Plant & Equipment/ Investment Property
Valuation Model
The fair value of the freehold land and buildings presented in the Financial Statements are provided by an independent valuer based on the valuations carried out at the reporting date.
Freehold land - valuations performed by the valuer are based on the market approach (direct comparison method), for similar properties in the same location and conditions (Note 32).
Freehold buildings - valuations are performed by an independent valuer based on the cost approach (current replacement cost - Note 32).
Investment Property - valuations are performed based on the income approach using the current market rent by an independent valuer to value the Investment Property (Income approach - Note 31).

INSIDE INSIGHT FINANCIAL STATEMENTS
252
NOTES TO THE FINANCIAL STATEMENTS
55 FAIR VALUE OF FINANCIAL INSTRUMENTS AND NON FINANCIAL INSTRUMENTS (CONTD.)
ACCOUNTING POLICY
Valuation Framework
Fair values of financial instruments and non-financial instruments are determined according to the following hierarchy:
Level 1 - quoted market price (unadjusted): financial instruments with quoted prices in active markets
Level 2 - valuation techniques using observable inputs: financial instruments with quoted prices for similar instruments in active markets or quoted prices for identical or similar instruments in inactive markets are valued using models where all significant inputs are observable.
Level 3 - valuation techniques with significant unobservable inputs: This category includes all instruments valued using valuation techniques where one or more significant inputs are unobservable.
The free hold land and buildings of the Group are valued every three years or more frequently if the fair values are substantially different from their carrying amounts to ensure that the carrying amounts do not differ from fair values at the reporting date.
Also a letter of confirmation is obtained from the Independent Professional Valuer annually except the year in which full valuation is carried out by the Group, to ensure that the fair values of the freehold land and buildings, does not significantly vary from their carrying amounts, at the reporting date.
55 (a) Determination of fair value of financial instruments and non financial instruments by hierarchy
The following table shows the analysis of financial instruments and non financial instruments recorded at fair value in the Statement of Financial Position by the level of the fair value hierarchy in accordance with disclosure requirements as per LKAS 13, Fair Value Measurements.
BANK
Fair Value Measurement Using
31 December 2021
Quoted Prices in Active Markets
Significant Observable
Inputs
Significant Unobservable
Inputs
Total
Level 1 Level 2 Level 3LKR ’000 LKR ’000 LKR ’000 LKR ’000
Financial AssetsDerivative Financial InstrumentsForward foreign exchange contracts - 1,338,204 - 1,338,204
Financial Assets Recognised Through Profit or Loss - Measured at Fair Value -
Investment in unit trusts 2,441,833 - - 2,441,833
Financial Assets measured at Fair Value Through Other Comprehensive Income
Sri Lanka Government Securities - treasury bills 53,030,077 - - 53,030,077Sri Lanka Government Securities - treasury bonds 33,893,508 - - 33,893,508Sovereign Bonds 1,607,879 - - 1,607,879Quoted ordinary shares 1,014,508 - - 1,014,508Non quoted ordinary shares - 16,568 16,568Total Financial Assets 91,987,805 1,338,204 16,568 93,342,577
Non-Financial AssetsFreehold land - - 919,305 919,305Freehold buildings - - 1,374,679 1,374,679Total Non-Financial Assets - - 1,954,000 1,954,000
Financial LiabilitiesDerivative Financial InstrumentsForward foreign exchange contracts - 1,048,644 - 1,048,644Total Financial Liabilities - 1,048,644 - 1,048,644

INSIDE INSIGHT FINANCIAL STATEMENTS
253
NOTES TO THE FINANCIAL STATEMENTS
BANK
Fair Value Measurement Using
31 December 2020
Quoted Prices in Active Markets
Significant Observable
Inputs
Significant Unobservable
Inputs
Total
Level 1 Level 2 Level 3LKR ’000 LKR ’000 LKR ’000 LKR ’000
Financial AssetsDerivative Financial InstrumentsForward foreign exchange contracts - 1,429,470 - 1,429,470
Financial Assets Recognised Through Profit or Loss - Measured at Fair Value
Sri Lanka Government Securities - treasury bonds 316,865 - - 316,865Sri Lanka Government Securities - treasury bills 2,195,886 - - 2,195,886Investment in Unit Trusts 3,061,424 - - 3,061,424
Financial Assets measured at Fair Value Through Other Comprehensive Income
Sri Lanka Government Securities - treasury bills 58,022,081 - - 58,022,081Sri Lanka Government Securities - treasury bonds 47,815,829 - - 47,815,829Sovereign Bonds 1,718,732 - - 1,718,732Quoted ordinary shares 1,030,317 - - 1,030,317Non quoted ordinary shares - - 16,568 16,568Total Financial Assets 114,161,134 1,429,470 16,568 115,607,172
Non-Financial AssetsFreehold land - - 919,305 919,305Freehold buildings - - 1,328,069 1,328,069Total Non-Financial Assets - - 2,247,374 2,247,374
Financial LiabilitiesDerivative Financial InstrumentsForward foreign exchange contracts - 1,016,787 - 1,016,787Total Financial Liabilities - 1,016,787 - 1,016,787

INSIDE INSIGHT FINANCIAL STATEMENTS
254
55 (a) Determination of fair value of financial instruments and non financial instruments by hierarchy (Contd.)
GROUP
Fair Value Measurement Using
31 December 2021
Quoted Prices in Active Markets
Significant Observable
Inputs
Significant Unobservable
Inputs
Total
Level 1 Level 2 Level 3LKR ’000 LKR ’000 LKR ’000 LKR ’000
Financial AssetsDerivative Financial InstrumentsForward foreign exchange contracts - 1,338,204 - 1,338,204
Financial Assets Recognised Through Profit or Loss - Measured at Fair Value -
Quoted ordinary shares 400,165 - - 400,165Investment in private equity fund - - 847,239 847,239Non-quoted ordinary shares - - 126,200 126,200Investment in unit trusts 3,410,520 - - 3,410,520
Financial Assets measured at Fair Value Through Other Comprehensive Income -
Sri Lanka Government Securities - treasury bills 53,030,077 - - 53,030,077Sri Lanka Government Securities - treasury bonds 33,893,508 - - 33,893,508Sovereign Bonds 1,607,879 - - 1,607,879Quoted ordinary shares 1,014,508 - - 1,014,508Non quoted ordinary shares - - 16,568 16,568Quoted debentures - 144,415 - 144,415Total Financial Assets 93,356,658 1,482,619 990,007 95,829,283
Non-Financial AssetsFreehold land - - 919,305 919,305Freehold buildings - - 1,885,882 1,885,882Investment property - - 2,528,228 2,528,228Total Non-Financial Assets - - 5,333,415 5,333,415
Financial LiabilitiesDerivative Financial InstrumentsForward foreign exchange contracts - 1,048,644 - 1,048,644Total Financial Liabilities - 1,048,644 - 1,048,644
NOTES TO THE FINANCIAL STATEMENTS

INSIDE INSIGHT FINANCIAL STATEMENTS
255
NOTES TO THE FINANCIAL STATEMENTS
GROUP
Fair Value Measurement Using
31 December 2020
Quoted Prices in Active Markets
Significant Observable
Inputs
Significant Unobservable
Inputs
Total
Level 1 Level 2 Level 3LKR ’000 LKR ’000 LKR ’000 LKR ’000
Financial AssetsDerivative Financial InstrumentsForward foreign exchange contracts - 1,429,470 - 1,429,470
Financial Assets Recognised Through Profit or Loss - Measured at Fair Value
Sri Lanka Government Securities - treasury bonds 316,864 - - 316,864Sri Lanka Government Securities - treasury bills 2,195,886 - - 2,195,886Quoted ordinary shares 164,449 - - 164,449Investment in private equity fund - - 907,834 907,834Non-quoted ordinary shares - - 150,000 150,000Investment in unit trusts 3,978,189 - - 3,978,189
Financial Assets measured at Fair Value Through Other Comprehensive Income
Sri Lanka Government Securities - treasury bills 58,022,081 - - 58,022,081Sri Lanka Government Securities - treasury bonds 47,815,830 - - 47,815,830Sovereign Bonds 1,718,732 - - 1,718,732Quoted ordinary shares 1,030,317 - - 1,030,317Non-quoted ordinary shares - - 16,568 16,568Quoted debentures - 169,789 - 169,789Total Financial Assets 115,242,348 1,599,259 1,074,402 117,916,009
Non-Financial AssetsFreehold land - - 919,305 919,305Freehold buildings - - 1,830,528 1,830,528Investment property - - 2,361,535 2,361,535Total Non-Financial Assets - - 5,111,368 5,111,368
Financial LiabilitiesDerivative Financial InstrumentsForward foreign exchange contracts - 1,016,787 - 1,016,787Total Financial Liabilities - 1,016,787 - 1,016,787

INSIDE INSIGHT FINANCIAL STATEMENTS
256
55 (b) Movements in level 3 financial instruments and non-financial instruments measured at fair value
The level of the fair value hierarchy of financial instruments and non-financial instruments is determined at the beginning of each reporting period. The following table shows the reconciliation of the opening and closing amounts of Level 3 financial instruments and non-financial instruments which are recorded at fair value.
BANK
Included in
As at 01 January 2021
Additions/ Disposals
during the year
Total gains/ (losses)
and charges recorded in
Statement of Profit or Loss
Total gains/ (losses)
recorded in Other
Comprehensive Income
As at 31 December
2021
LKR ’000 LKR ’000 LKR ’000 LKR ’000 LKR ’000
Non-Financial AssetsFreehold land [Note 32.1] Property, plant & equipment 919,305 - - - 919,305Freehold buildings [Note 32.1] Property, plant & equipment 1,328,069 23,816 - 22,794 1,374,679
GROUP
Included in
As at 01 January 2021
Additions/ Disposals
during the year
Total gains/ (losses)
and charges recorded in
Statement of Profit or Loss
Total gains/ (losses)
recorded in Other
Comprehensive Income
As at 31 December
2021
LKR ’000 LKR ’000 LKR ’000 LKR ’000 LKR ’000
Financial AssetsNon-quoted ordinary shares Financial assets measured
at Fair Value through Other Comprehensive Income 150,000 - (23,800) - 126,200
Private equity fund Financial assets recognised through Statement of Profit or Loss measured at fair value 907,834 (178,482) 117,887 - 847,239
Non-Financial AssetsFreehold land (Note 32.4) Property, plant & equipment 919,305 - - - 919,305Freehold buildings (Note 32.4) Property, plant & equipment 1,830,528 1,252 - 54,102 1,885,882Investment property (Note 31) Investment property 2,361,535 13,689 153,004 - 2,528,228
NOTES TO THE FINANCIAL STATEMENTS

INSIDE INSIGHT FINANCIAL STATEMENTS
257
NOTES TO THE FINANCIAL STATEMENTS
BANK
Included in
As at 01 January 2020
Additions/ Disposals
during the year
Total Gains/ (Losses)
and Charges Recorded in Statement of Profit or Loss
Total Gains/ (losses)
Recorded in Other
Comprehensive Income
As at 31 December
2020
LKR ’000 LKR ’000 LKR ’000 LKR ’000 LKR ’000
Financial AssetsCurrency SWAP Derivative financial
instruments 241,552 (323,460) - 81,908 -
Non-Financial AssetsFreehold land (Note 32.1) Property, plant & equipment 919,305 - - - 919,305Freehold buildings (Note 32.1) Property, plant & equipment 1,231,446 27,819 - 68,804 1,328,069
GROUP
Included in
As at 01 January 2020
Additions/ Disposals
during the year
Total Gains/ (Losses)
and Charges Recorded in Statement of Profit or Loss
Total Gains/ (losses)
Recorded in Other
Comprehensive Income
As at 31 December
2020
LKR ’000 LKR ’000 LKR ’000 LKR ’000 LKR ’000
Financial AssetsCurrency SWAP Derivative financial
instruments 241,552 (323,460) - 81,908 -Non-quoted ordinary shares Financial assets measured
at fair value through Other Comprehensive Income 150,000 - - - 150,000
Private equity fund Financial assets recognised through Statement of Profit or Loss measured at fair value 966,780 - (58,946) - 907,834
Non-Financial AssetsFreehold land (Note 32.4) Property, plant & equipment 919,305 - - - 919,305Freehold buildings (Note 32.4) Property, plant & equipment 1,712,210 27,819 - 90,499 1,830,528Investment property (Note 31) Investment property 2,272,881 (19,459) 108,113 - 2,361,535

INSIDE INSIGHT FINANCIAL STATEMENTS
258
NOTES TO THE FINANCIAL STATEMENTS
55 (c) Unobservable inputs used in measuring the fair value of financial and non financial instruments
The tables below sets out information about significant unobservable inputs used as at 31 December 2021 and as at 31 December 2020 in measuring financial and non-financial instruments categorised as Level 2 and Level 3 in the fair value hierarchy:
As at 31 December 2021
Financial Assets/Liabilities
BANK
Type of Instrument Fair Values as at 31 December2021
Valuation Technique
Significant Unobservable Inputs
Range of Estimates (Weighted Average)for Unobservable Inputs
Fair Value Measurement Sensitivity to Unobservable Inputs
Derivative Financial InstrumentsDerivative financial assets - Forward Exchange Contracts
LKR 1,338 Mn Forecasted cashflow valuation method
Forward Exchange Rate
One year market premium USD/LKR
Negative impact to the fair value
Derivative financial liabilities - Forward Exchange Contracts
LKR 1,049 Mn Forecasted cashflow valuation method
Forward Exchange Rate
One year market premium USD/LKR
Negative impact to the fair value
Non Financial Assets
BANK
Type of Instrument Fair Values as at 31 December2021
Valuation Technique
Significant Unobservable Inputs
Range of Estimates (Weighted Average)for Unobservable Inputs
Fair Value Measurement Sensitivity to Unobservable Inputs
Nawam MawathaLand LKR 19 Mn Direct comparison
methodPer perch value Per perch - LKR 13.5 Mn Positive impact to the fair
valueBuilding LKR 707 Mn Current replacement
costReplacement cost/ depreciation factor rate
LKR 17,250 per square feet and discount factor- 0.425
Positive impact to the fair value from both factors
Dharmapala Mawatha
Land LKR 900 Mn Direct comparison method
Per perch value Per perch - LKR 15 Mn Positive impact to the fair value
Building LKR 328 Mn Current replacement cost
Replacement cost/ depreciation factor rate
LKR 15,600 per square feet and discount factor- 0.5
Positive impact to the fair value from both factors
Financial Assets/Liabilities
GROUP
Type of Instrument Fair Values as at 31 December2021
Valuation Technique
Significant Unobservable Inputs
Range of Estimates (Weighted Average)for Unobservable Inputs
Fair Value Measurement Sensitivity to Unobservable Inputs
Derivative Financial InstrumentsDerivative financial assets - Forward Exchange Contracts
LKR 1,338 Mn Forecasted cash flow valuation method
Forward Exchange Rate
One year market premium USD/LKR
Negative impact to the fair value
Derivative financial liabilities - Forward Exchange Contracts
LKR 1,049 Mn Forecasted cash flow valuation method
Forward Exchange Rate
One year market premium USD/LKR
Negative impact to the fair value
Financial Assets Recognised Through Profit or Loss - Measured at Fair ValuePrivate equity fund LKR 847 Mn Net Assets Basis Net Assets Value
of the Fund- Positive impact to the
fair valueFinancial Assets measured at Fair Value Through Other Comprehensive IncomeQuoted debentures LKR 144 Mn Forecasted cash flow
valuation methodAverage yields of the debt market
Yields applicable for the bonds with same tenure
Negative impact to the fair value

INSIDE INSIGHT FINANCIAL STATEMENTS
259
NOTES TO THE FINANCIAL STATEMENTS
As at 31 December 2021
Non Financial Assets
GROUP
Type of Instrument Fair Values as at 31 December 2021
Valuation Technique
Significant Unobservable Inputs
Range of Estimates (Weighted Average)for Unobservable Inputs
Fair Value Measurement Sensitivity to Unobservable Inputs
Nawam MawathaLand LKR 19 Mn Direct comparison
methodPer perch value Per perch - LKR 13.5 Mn Positive impact to the fair
valueBuilding LKR 707 Mn Current
replacement costReplacement cost/ depreciation factor rate
LKR 17,250 per square feet and discount factor- 0.425
Positive impact to the fair value from both factors
Dharmapala Mawatha
Land LKR 900 Mn Direct comparison method
Per perch value Per perch - LKR 15 Mn Positive impact to the fair value
Building LKR 328 Mn Current replacement cost
Replacement cost/ depreciation factor rate
LKR 15,600 per square feet and discount factor- 0.5
Positive impact to the fair value from both factors
Nawam Mawatha
Investment property LKR 3,012 Mn (Including the fair value of owner occupied portion of LKR 484 Mn)
Income Approach Rent per square feet
Average Rate of LKR 240 Positive impact to the fair value from both factors
As at 31 December 2020
Financial Assets/Liabilities
BANK
Type of Instrument Fair Values as at 31 December 2020
Valuation Technique
Significant Unobservable Inputs
Range of Estimates (Weighted Average)for Unobservable Inputs
Fair Value Measurement Sensitivity to Unobservable Inputs
Derivative Financial InstrumentsDerivative financial assets -
Forward Exchange ContractsLKR 1,429 Mn Forecasted cash
flow valuation method
Forward Exchange Rate
One year market premium USD/LKR
Negative impact to the fair value
Derivative financial Liabilities - Forward Exchange Contracts
LKR 1,017 Mn Forecasted cash flow valuation method
Forward Exchange Rate
One year market premium USD/LKR
Negative impact to the fair value
Non Financial Assets
BANK
Type of Instrument Fair Values as at 31 December 2020
Valuation Technique
Significant Unobservable Inputs
Range of Estimates (Weighted Average)for Unobservable Inputs
Fair Value Measurement Sensitivity to Unobservable Inputs
Nawam MawathaLand LKR 19 Mn Direct comparison
methodPer perch value Per perch - LKR 13.5 Mn Positive impact to the fair
value
Building LKR 707 Mn Current replacement cost
Replacement cost/ depreciation factor rate
LKR 17,250 per square feet and discount factor- 0.425
Positive impact to the fair value from both factors
Dharmapala MawathaLand LKR 900 Mn Direct comparison
methodPer perch value Per perch - LKR 15 Mn Positive impact to the fair
value
Building LKR 328 Mn Current replacement cost
Replacement cost/ depreciation factor rate
LKR 15,600 per square feet and discount factor- 0.5
Positive impact to the fair value from both factors

INSIDE INSIGHT FINANCIAL STATEMENTS
260
NOTES TO THE FINANCIAL STATEMENTS
55 (c) Unobservable inputs used in measuring the fair value of financial and non financial instruments (Contd.)
As at 31 December 2020
Financial Assets/ Liabilities
GROUP
Type of Instrument Fair Values as at 31 December 2020
Valuation Technique
Significant Unobservable Inputs
Range of Estimates (Weighted Average)for Unobservable Inputs
Fair Value Measurement Sensitivity to Unobservable Inputs
Derivative Financial InstrumentsDerivative financial assets
- Forward Exchange ContractsLKR 1,429 Mn Forecasted cash
flow valuation method
Forward Exchange Rate
One year market premium USD/LKR
Negative impact to the fair value
Derivative financial liabilities - Forward Exchange Contracts
LKR 1,017 Mn Forecasted cash flow valuation method
Forward Exchange Rate
One year market premium USD/LKR
Negative impact to the fair value
Financial Assets Recognised Through Profit or Loss - Measured at Fair Value
Private equity fund LKR 908 Mn Net assets basis Net assets value of the fund
- Positive impact to the fair value
Financial Assets measured at Fair Value Through Other Comprehensive Income
Quoted Debentures LKR 169 Mn Forecasted cash flow valuation method
Average yields of the debt market
Yields applicable for the bonds with same tenure
Negative impact to the fair value
Non Financial Assets
GROUP
Type of Instrument Fair Values as at 31 December 2020
Valuation Technique
Significant Unobservable Inputs
Range of Estimates (Weighted Average)for Unobservable Inputs
Fair Value Measurement Sensitivity to Unobservable Inputs
Nawam MawathaLand LKR 19 Mn Direct comparison
methodPer perch value Per perch - LKR 13.5 Mn Positive impact to the
fair value
Building LKR 707 Mn Current replacement cost
Replacement cost/ depreciation factor rate
LKR 17,250 per square feet and discount factor- 0.425
Positive impact to the fair value from both factors
Dharmapala MawathaLand LKR 900 Mn Direct comparison
methodPer perch value Per perch - LKR 15 Mn Positive impact to the
fair value
Building LKR 328 Mn Current replacement cost
Replacement cost/ depreciation factor rate
LKR 15,600 per square feet and discount factor- 0.5
Positive impact to the fair value from both factors
Nawam Mawatha
Investment property LKR 2,814 Mn (Including the fair value of owner occupied portion of LKR 452 Mn)
Income Approach Rent per square feet
Average Rate of LKR 215 Positive impact to the fair value from both factors
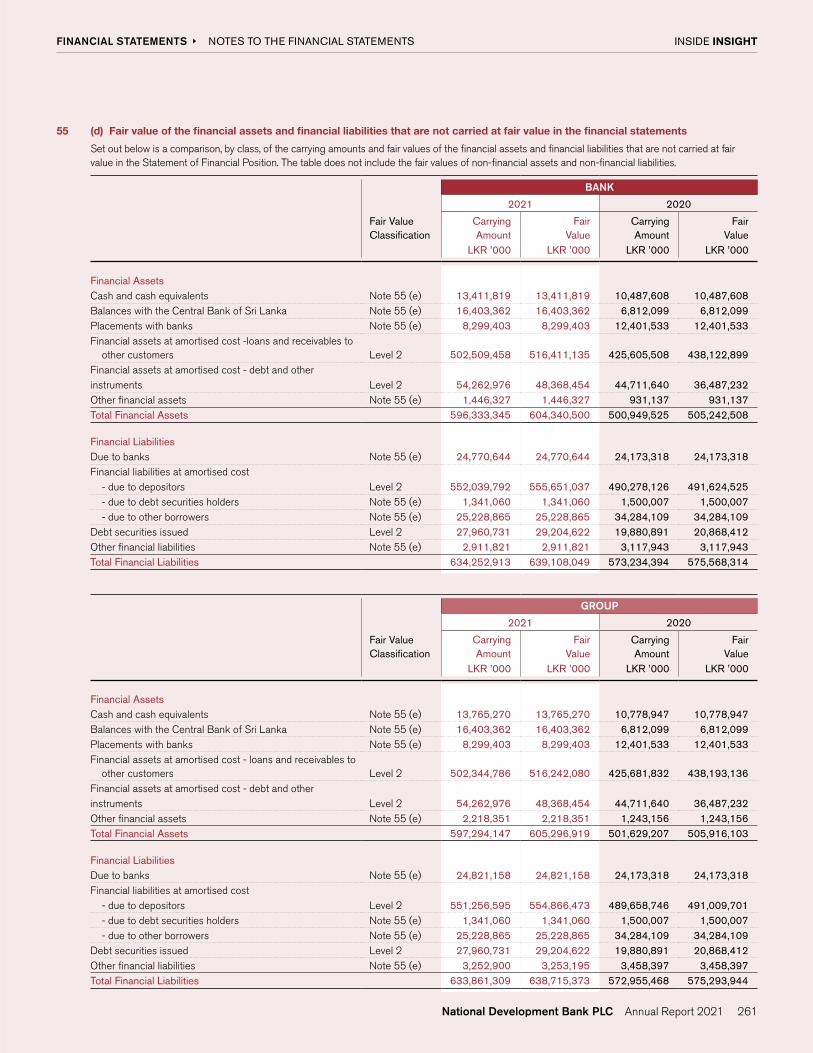
INSIDE INSIGHT FINANCIAL STATEMENTS
261
NOTES TO THE FINANCIAL STATEMENTS
55 (d) Fair value of the financial assets and financial liabilities that are not carried at fair value in the financial statements
Set out below is a comparison, by class, of the carrying amounts and fair values of the financial assets and financial liabilities that are not carried at fair value in the Statement of Financial Position. The table does not include the fair values of non-financial assets and non-financial liabilities.
BANK
2021 2020
Fair Value Classification
Carrying Amount
Fair Value
Carrying Amount
Fair Value
LKR ’000 LKR ’000 LKR ’000 LKR ’000
Financial AssetsCash and cash equivalents Note 55 (e) 13,411,819 13,411,819 10,487,608 10,487,608Balances with the Central Bank of Sri Lanka Note 55 (e) 16,403,362 16,403,362 6,812,099 6,812,099Placements with banks Note 55 (e) 8,299,403 8,299,403 12,401,533 12,401,533Financial assets at amortised cost -loans and receivables to
other customers Level 2 502,509,458 516,411,135 425,605,508 438,122,899Financial assets at amortised cost - debt and otherinstruments Level 2 54,262,976 48,368,454 44,711,640 36,487,232Other financial assets Note 55 (e) 1,446,327 1,446,327 931,137 931,137Total Financial Assets 596,333,345 604,340,500 500,949,525 505,242,508
Financial LiabilitiesDue to banks Note 55 (e) 24,770,644 24,770,644 24,173,318 24,173,318Financial liabilities at amortised cost - due to depositors Level 2 552,039,792 555,651,037 490,278,126 491,624,525 - due to debt securities holders Note 55 (e) 1,341,060 1,341,060 1,500,007 1,500,007 - due to other borrowers Note 55 (e) 25,228,865 25,228,865 34,284,109 34,284,109Debt securities issued Level 2 27,960,731 29,204,622 19,880,891 20,868,412Other financial liabilities Note 55 (e) 2,911,821 2,911,821 3,117,943 3,117,943Total Financial Liabilities 634,252,913 639,108,049 573,234,394 575,568,314
GROUP
2021 2020
Fair Value Classification
Carrying Amount
Fair Value
Carrying Amount
Fair Value
LKR ’000 LKR ’000 LKR ’000 LKR ’000
Financial AssetsCash and cash equivalents Note 55 (e) 13,765,270 13,765,270 10,778,947 10,778,947Balances with the Central Bank of Sri Lanka Note 55 (e) 16,403,362 16,403,362 6,812,099 6,812,099Placements with banks Note 55 (e) 8,299,403 8,299,403 12,401,533 12,401,533Financial assets at amortised cost - loans and receivables to
other customers Level 2 502,344,786 516,242,080 425,681,832 438,193,136Financial assets at amortised cost - debt and otherinstruments Level 2 54,262,976 48,368,454 44,711,640 36,487,232Other financial assets Note 55 (e) 2,218,351 2,218,351 1,243,156 1,243,156Total Financial Assets 597,294,147 605,296,919 501,629,207 505,916,103
Financial LiabilitiesDue to banks Note 55 (e) 24,821,158 24,821,158 24,173,318 24,173,318Financial liabilities at amortised cost - due to depositors Level 2 551,256,595 554,866,473 489,658,746 491,009,701 - due to debt securities holders Note 55 (e) 1,341,060 1,341,060 1,500,007 1,500,007 - due to other borrowers Note 55 (e) 25,228,865 25,228,865 34,284,109 34,284,109Debt securities issued Level 2 27,960,731 29,204,622 19,880,891 20,868,412Other financial liabilities Note 55 (e) 3,252,900 3,253,195 3,458,397 3,458,397Total Financial Liabilities 633,861,309 638,715,373 572,955,468 575,293,944

INSIDE INSIGHT FINANCIAL STATEMENTS
262
NOTES TO THE FINANCIAL STATEMENTS
55 (e) Basis of measurement for the fair value of Financial Assets and Financial Liabilities Not Carried at Fair Value
Given below are the methodologies and assumptions used to determine the fair values for financial instruments which are not already recorded at fair value in the Financial Statements:
Assets for which Fair Value Approximates Carrying Value
For financial assets and financial liabilities that have a short-term maturity (less than three months) it is assumed that the carrying amounts approximate their fair value. This assumption is also applied to demand deposits and savings accounts without a specific maturity.
Fixed Rate Financial Instruments
The fixed rate financial instruments include financial assets at amortised cost - loans and receivable to other customers, financial assets at amortised cost - debt and other instruments, financial liabilities at amortised cost - due to depositors, due to other borrowers and debt securities issued.
The fair value of fixed rate financial assets and liabilities carried at amortised cost are estimated by comparing market interest rates when they were first recognised with current market rates for similar financial instruments. The estimated fair value of fixed interest-bearing deposits is based on discounted cash flows using prevailing money-market interest rates for debts with similar credit risk and maturity. For quoted debt instruments issued, the fair values are determined based on quoted market prices. For instruments issued where quoted market prices are not available, a discounted cash flow model is used based on a current interest rate yield curve appropriate for the remaining term to maturity and credit spreads. For other variable rate instruments, an adjustment is also made to reflect the change in the required credit spread since the instrument was first recognised.
56. RISK MANAGEMENT
56.1. Introduction
Taking risks is inherent in any bank’s strategic plan but it is managed through a process of ongoing identification, measurement and monitoring, subject to risk limits and other controls. Bank’s risk strategy focuses on managing principal risks faced by the Bank while striking a
fair balance between the risk return trade-off and the efficient capital allocation across the risk exposures.
The Bank is mainly exposed to credit risk, liquidity risk, market risk and operational risk. Market risk could be further subdivided into trading and non-trading risks. Exposure to country risk and any risks due to changes in environment, technology and industry is managed through the Bank’s strategic planning process.
Given the changes in the operating environment resulting from the unprecedented impact on economy and financial services sector due to COVID-19, a robust and forward looking approach in management of risk is considered as of paramount importance by the Bank.
56.2. Risk Management Framework
The Board of Directors has overall responsibility for the establishment and oversight of the Bank’s Risk Management Framework. The Board has delegated its authority to the Integrated Risk Management Committee (IRMC) for the overall Risk Management approach and for approving the Risk Management strategies and principles. IRMC meets quarterly to review and assess the Bank’s overall risks and to focus on policy recommendations and strategies in an integrated manner and the Board of Directors are duly updated of its activities.
The Bank’s Risk Management policies are established to identify and analyse the risks faced by the Bank/ Group to set appropriate risk limits and controls and to monitor adherence to established limits.
The Bank’s Assets and Liabilities Committee (ALCO) reviews all market and liquidity related exposures, excesses on a monthly basis and decisions are made to facilitate the business requirements. These decisions are further reviewed at IRMC and by the Board.
The Credit and Market Risk Policy Committee and Operational Risk Policy Committee are in operation to formulate policies and to focus more clearly on defined risk areas. The membership of these committees comprises the CEO, the Heads of Business Units, Finance, Treasury and representatives of the Group Risk Management.
The Committees meet regularly to review the Bank’s risk policy framework, overall performance and the potential risks faced by specific lines of business and support functions.
The Bank’s Treasury is responsible for managing the Bank’s assets and liabilities and the overall financial structure. It is also primarily responsible for the funding and liquidity risks of the Bank.
56.2.1. Risk Measurement and Reporting
Monitoring and controlling risks is primarily performed based on limits established by the Bank which reflects the business strategy and market environment of the Bank as well as the Bank’s risk appetite.
Information compiled is examined and processed in order to analyse, control and identify risks on a timely basis. The compiled information is presented to the Credit and Market Risk Policy Committee, IRMC and the Board of Directors receives a risk report once a quarter which covers all necessary information to assess and conclude on the risks of the Bank.
56.2.2. Risk Mitigation
The Bank obtains various types of collateral and establishes maximum prudential limits as part of its overall risk management/ mitigation.
56.3. Credit Risk
Credit Risk is the risk that the Bank will expect a loss because its customers or counterparties fail to discharge their contractual obligations. The Bank manages and controls credit risk by setting limits on the amount of risk it is willing to accept for individual/ group counterparties and for geographical and industry concentrations, and by monitoring exposures in relation to such limits.
The Bank has established a credit quality review process to provide early identification of possible changes in the creditworthiness of counterparties. Counterparty limits are established by the use of an internally designed Credit Risk classification system, which assigns each counterparty a risk rating. Risk ratings are subject to regular revision. The credit quality review process aims to allow the Bank to assess the potential loss as a result of the risks to which it is exposed and take corrective action.
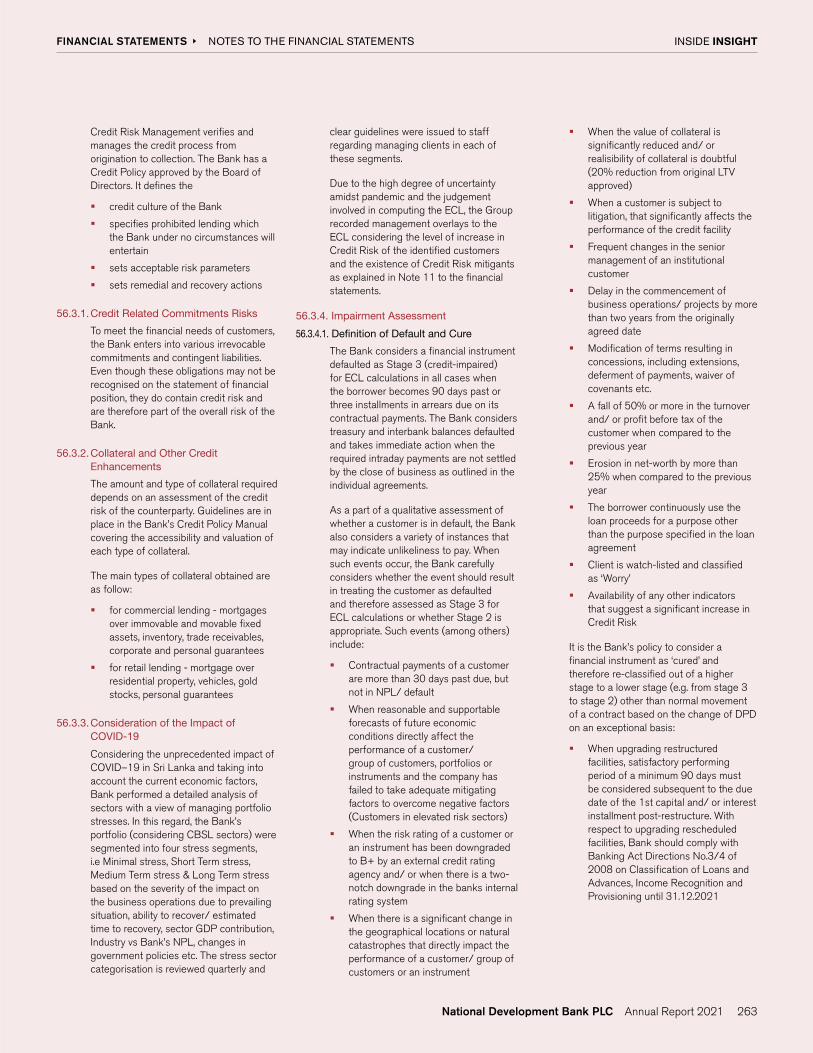
INSIDE INSIGHT FINANCIAL STATEMENTS
263
NOTES TO THE FINANCIAL STATEMENTS
Credit Risk Management verifies and manages the credit process from origination to collection. The Bank has a Credit Policy approved by the Board of Directors. It defines the
� credit culture of the Bank
� specifies prohibited lending which the Bank under no circumstances will entertain
� sets acceptable risk parameters
� sets remedial and recovery actions
56.3.1. Credit Related Commitments Risks
To meet the financial needs of customers, the Bank enters into various irrevocable commitments and contingent liabilities. Even though these obligations may not be recognised on the statement of financial position, they do contain credit risk and are therefore part of the overall risk of the Bank.
56.3.2. Collateral and Other Credit Enhancements
The amount and type of collateral required depends on an assessment of the credit risk of the counterparty. Guidelines are in place in the Bank’s Credit Policy Manual covering the accessibility and valuation of each type of collateral.
The main types of collateral obtained are as follow:
� for commercial lending - mortgages over immovable and movable fixed assets, inventory, trade receivables, corporate and personal guarantees
� for retail lending - mortgage over residential property, vehicles, gold stocks, personal guarantees
56.3.3. Consideration of the Impact of COVID-19
Considering the unprecedented impact of COVID–19 in Sri Lanka and taking into account the current economic factors, Bank performed a detailed analysis of sectors with a view of managing portfolio stresses. In this regard, the Bank’s portfolio (considering CBSL sectors) were segmented into four stress segments, i.e Minimal stress, Short Term stress, Medium Term stress & Long Term stress based on the severity of the impact on the business operations due to prevailing situation, ability to recover/ estimated time to recovery, sector GDP contribution, Industry vs Bank’s NPL, changes in government policies etc. The stress sector categorisation is reviewed quarterly and
clear guidelines were issued to staff regarding managing clients in each of these segments.
Due to the high degree of uncertainty amidst pandemic and the judgement involved in computing the ECL, the Group recorded management overlays to the ECL considering the level of increase in Credit Risk of the identified customers and the existence of Credit Risk mitigants as explained in Note 11 to the financial statements.
56.3.4. Impairment Assessment
56.3.4.1. Definition of Default and Cure
The Bank considers a financial instrument defaulted as Stage 3 (credit-impaired) for ECL calculations in all cases when the borrower becomes 90 days past or three installments in arrears due on its contractual payments. The Bank considers treasury and interbank balances defaulted and takes immediate action when the required intraday payments are not settled by the close of business as outlined in the individual agreements.
As a part of a qualitative assessment of whether a customer is in default, the Bank also considers a variety of instances that may indicate unlikeliness to pay. When such events occur, the Bank carefully considers whether the event should result in treating the customer as defaulted and therefore assessed as Stage 3 for ECL calculations or whether Stage 2 is appropriate. Such events (among others) include:
� Contractual payments of a customer are more than 30 days past due, but not in NPL/ default
� When reasonable and supportable forecasts of future economic conditions directly affect the performance of a customer/group of customers, portfolios or instruments and the company has failed to take adequate mitigating factors to overcome negative factors (Customers in elevated risk sectors)
� When the risk rating of a customer or an instrument has been downgraded to B+ by an external credit rating agency and/ or when there is a two-notch downgrade in the banks internal rating system
� When there is a significant change in the geographical locations or natural catastrophes that directly impact the performance of a customer/ group of customers or an instrument
� When the value of collateral is significantly reduced and/ or realisibility of collateral is doubtful (20% reduction from original LTV approved)
� When a customer is subject to litigation, that significantly affects the performance of the credit facility
� Frequent changes in the senior management of an institutional customer
� Delay in the commencement of business operations/ projects by more than two years from the originally agreed date
� Modification of terms resulting in concessions, including extensions, deferment of payments, waiver of covenants etc.
� A fall of 50% or more in the turnover and/ or profit before tax of the customer when compared to the previous year
� Erosion in net-worth by more than 25% when compared to the previous year
� The borrower continuously use the loan proceeds for a purpose other than the purpose specified in the loan agreement
� Client is watch-listed and classified as ‘Worry’
� Availability of any other indicators that suggest a significant increase in Credit Risk
It is the Bank’s policy to consider a financial instrument as ‘cured’ and therefore re-classified out of a higher stage to a lower stage (e.g. from stage 3 to stage 2) other than normal movement of a contract based on the change of DPD on an exceptional basis:
� When upgrading restructured facilities, satisfactory performing period of a minimum 90 days must be considered subsequent to the due date of the 1st capital and/ or interest installment post-restructure. With respect to upgrading rescheduled facilities, Bank should comply with Banking Act Directions No.3/4 of 2008 on Classification of Loans and Advances, Income Recognition and Provisioning until 31.12.2021

INSIDE INSIGHT FINANCIAL STATEMENTS
264
NOTES TO THE FINANCIAL STATEMENTS
� The upgrading of credit facilities in instances other than above scenario shall only be approved by the Credit Review Division under Group Risk Management Department and be independent from the Loan Review Mechanism. Such upgrading need to be supported with rationale and adequate documentation
56.3.4.2. PD estimation process
Probability of Default (PD) is the estimate of the likelihood of default over a given time horizon. A default may only happen at a time horizon if the facility has not been previously derecognised and is still in the portfolio.
An Early Exit (EE) may occur in case of default unless the facility reverts to performing without significant modification of the contractual terms. The marginal probability of default for the period ti-1 to ti is then adjusted from the probability that an early exit occurred during the previous periods.
12 Months PD
This is the estimated probability of default occurring within the next 12 months.
The 12 month PD is applied for the “Current” and “1-30 days” buckets since there is no significant deterioration in Credit Risk.
Ageing Bucket Probability of Default
Current 12 Months PD1- 30 Days 12 Months PD
Lifetime PD
This is the estimated probability of default occurring over the remaining life of the financial instrument.
The lifetime PD is applied for the 31-60 days and 61-90 days buckets since there is a significant deterioration in credit risk.
Ageing Bucket Probability of Default
31 – 60 Days Lifetime PD61 – 90 Days Lifetime PD
The PD for the above 90 days category is 100% since there is objective evidence of impairment as the default has occurred.
Ageing Bucket Probability of Default
Above 90 Days 100% PD
56.3.4.3. Exposure at Default
The Exposure At Default (EAD) represents the gross carrying amount of the financial instruments subject to the impairment calculation, addressing both the client’s ability to increase its exposure while approaching default and potential early repayments too. EAD for credit cards and other revolving facilities is set out in Note 11.
To measure ECLs on revolving facilities, such as credit cards, it will be necessary to estimate several components that make up the EAD
� The contracts which have exceeded 90 days past due
� The Credit Utilisation Rate or Credit Conversion Factor
These components are estimated based on past experience, for sections of the portfolio that are segmented so that they have similar credit characteristics.
56.3.4.4. Loss Given Default
Loss Given Default (LGD) is the magnitude of likely loss on exposure, and is expressed as a percentage of exposure. These LGD rates take into account the expected EAD in comparison to the amount expected to be recovered or realised from any collateral held.
The Bank segments its retail lending products into smaller homogeneous portfolios, based on key characteristics that are relevant to the estimation of future cash flows. The applied data is based on historically collected loss data and involves a wider set of transaction characteristics (e.g. product type, wider range of collateral types) as well as borrower characteristics.
For each year, closed contracts which have crossed the Above 90 days at least once in their lifetime are considered. LGD will factor in all cash flows subsequent to the point of default until the full settlement of the loan.
Virtually closed contracts are also be added to this data set. Virtually closed contracts are active loans which have been long outstanding. A contract is determined to be virtually closed at the point the Bank determines that the cash flows have dried up.
56.3.4.5. Significant increase in Credit Risk
The Bank continuously monitors all assets subject to Expected Credit Losses
(ECL). In order to determine whether an instrument or a portfolio of instruments is subject to 12m ECL or LTECL, the Bank assesses whether there has been a significant increase in credit risk since initial recognition.
The Bank also applies a secondary qualitative method for triggering a significant increase in credit risk for an asset, such as moving a customer/ facility to the watch list, or the account having been restructured. In certain cases, the Bank may also consider that events explained in Note 56.3.4.1 are a significant increase in credit risk as opposed to a default.
When estimating ECLs on a collective basis for a group of similar assets, the Bank also applies the following in the categorisation of credit facilities/ exposures into stages for computation of expected credit losses.
Stage 1
� All credit facilities, which are not categorised under Stages 2 or 3 below
Stage 2
� Credit facilities, where contractual payments of a customer are more than 30 days past due, other than the credit facilities categorised under Stage 3 below, subject to the rebuttable presumption as stated in SLFRS 9 and circular number 6 and 7 of 2019 issued by the Central Bank of Sri Lanka
� All restructured loans, which are restructured up to two times (other than upgraded restructured facilities, satisfactory performing period of a minimum 90 days considered subsequent to the due date of the 1st capital and/ or interest installment post-restructure) and subject to circular number 6 and 7 of 2019 issued by the Central Bank of Sri Lanka
� Restructured facilities are where the original repayment terms have been amended due to deterioration in credit quality, while the respective credit facility remained as Performing loans and advances as per CBSL Directions
� Under this guideline, a credit facility will be considered as restructured only if, original repayment terms have been
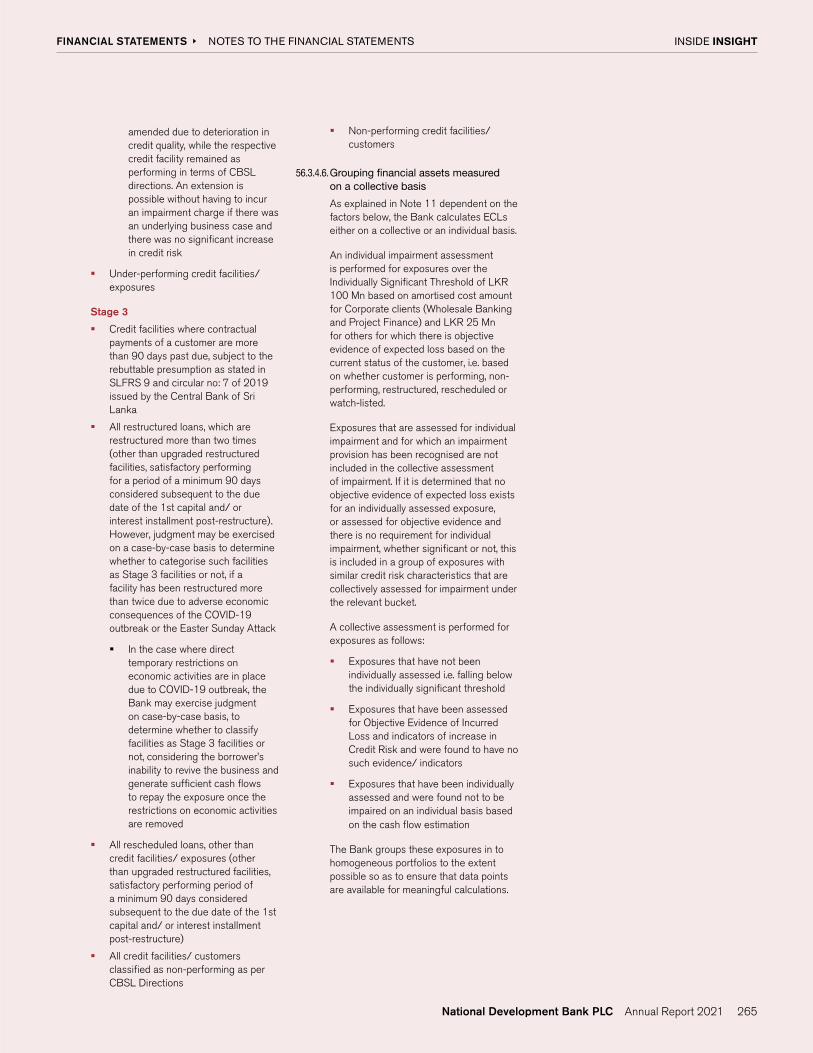
INSIDE INSIGHT FINANCIAL STATEMENTS
265
NOTES TO THE FINANCIAL STATEMENTS
amended due to deterioration in credit quality, while the respective credit facility remained as performing in terms of CBSL directions. An extension is possible without having to incur an impairment charge if there was an underlying business case and there was no significant increase in credit risk
� Under-performing credit facilities/ exposures
Stage 3
� Credit facilities where contractual payments of a customer are more than 90 days past due, subject to the rebuttable presumption as stated in SLFRS 9 and circular no: 7 of 2019 issued by the Central Bank of Sri Lanka
� All restructured loans, which are restructured more than two times (other than upgraded restructured facilities, satisfactory performing for a period of a minimum 90 days considered subsequent to the due date of the 1st capital and/ or interest installment post-restructure). However, judgment may be exercised on a case-by-case basis to determine whether to categorise such facilities as Stage 3 facilities or not, if a facility has been restructured more than twice due to adverse economic consequences of the COVID-19 outbreak or the Easter Sunday Attack
� In the case where direct temporary restrictions on economic activities are in place due to COVID-19 outbreak, the Bank may exercise judgment on case-by-case basis, to determine whether to classify facilities as Stage 3 facilities or not, considering the borrower’s inability to revive the business and generate sufficient cash flows to repay the exposure once the restrictions on economic activities are removed
� All rescheduled loans, other than credit facilities/ exposures (other than upgraded restructured facilities, satisfactory performing period of a minimum 90 days considered subsequent to the due date of the 1st capital and/ or interest installment post-restructure)
� All credit facilities/ customers classified as non-performing as per CBSL Directions
� Non-performing credit facilities/ customers
56.3.4.6. Grouping financial assets measured on a collective basis
As explained in Note 11 dependent on the factors below, the Bank calculates ECLs either on a collective or an individual basis.
An individual impairment assessment is performed for exposures over the Individually Significant Threshold of LKR 100 Mn based on amortised cost amount for Corporate clients (Wholesale Banking and Project Finance) and LKR 25 Mn for others for which there is objective evidence of expected loss based on the current status of the customer, i.e. based on whether customer is performing, non-performing, restructured, rescheduled or watch-listed.
Exposures that are assessed for individual impairment and for which an impairment provision has been recognised are not included in the collective assessment of impairment. If it is determined that no objective evidence of expected loss exists for an individually assessed exposure, or assessed for objective evidence and there is no requirement for individual impairment, whether significant or not, this is included in a group of exposures with similar credit risk characteristics that are collectively assessed for impairment under the relevant bucket.
A collective assessment is performed for exposures as follows:
� Exposures that have not been individually assessed i.e. falling below the individually significant threshold
� Exposures that have been assessed for Objective Evidence of Incurred Loss and indicators of increase in Credit Risk and were found to have no such evidence/ indicators
� Exposures that have been individually assessed and were found not to be impaired on an individual basis based on the cash flow estimation
The Bank groups these exposures in to homogeneous portfolios to the extent possible so as to ensure that data points are available for meaningful calculations.

INSIDE INSIGHT FINANCIAL STATEMENTS
266
NOTES TO THE FINANCIAL STATEMENTS
56.3.4.7 Analysis of inputs to the ECL model under multiple economic scenarios
The Bank obtains the data used from Central Bank of Sri Lanka/ Department of Census & Statistics. The following tables set out the key drivers of expected loss and the assumptions used for the Bank’s base case estimate, ECLs based on the base case, plus the effect of the use of multiple economic scenarios (best case and worst case) as at 31 December 2021 and 31 December 2020.
The tables show the values of the key forward looking economic variables/ assumptions used in each of the economic scenarios for the ECL calculations.
31 December 2021 ECL Scenarios
Assigned Probabilities
2022 2023 2024 2025 2026 2027 2028
Key Drivers % % % % % % % %
GDP GrowthBest Case 10 5.26 6.06 6.79 7.19 7.34 7.34 7.34 Base Case 35 3.81 4.63 5.15 5.57 5.54 5.54 5.54 Worst Case 55 3.28 3.17 3.07 2.97 2.87 2.87 2.87
Inflation (YoY) (CCPI)Best Case 10 5.77 5.65 5.54 5.42 5.35 5.35 5.35 Base Case 35 5.79 5.68 5.80 5.89 5.87 5.87 5.87 Worst Case 55 6.06 6.21 6.36 6.52 6.58 6.58 6.58
Interest Rate (AWPLR)Best Case 10 7.88 7.76 7.56 7.30 7.13 7.13 7.13 Base Case 35 8.30 8.39 8.39 8.31 8.23 8.23 8.23 Worst Case 55 8.76 9.10 9.37 9.54 9.59 9.59 9.59
Exchange Rate (USD:LKR)Best Case 10 203.66 205.95 208.26 210.60 212.97 215.36 217.78 Base Case 35 211.96 223.07 234.76 247.06 260.01 273.64 287.98 Worst Case 55 221.52 243.65 267.99 294.76 324.20 350.00 350.00
UnemploymentBest Case 10 5.34 5.33 5.30 5.27 5.24 5.24 5.24 Base Case 35 5.40 5.41 5.41 5.40 5.38 5.38 5.38 Worst Case 55 5.45 5.49 5.52 5.54 5.55 5.55 5.55
31 December 2020 ECL Scenarios
Assigned Probabilities
2021 2022 2023 2024 2025 2026 2027
Key Drivers % % % % % % % %
GDP GrowthBest Case 25 4.72 5.16 6.28 6.93 7.12 7.12 7.12 Base Case 30 2.98 3.92 4.42 4.91 4.92 4.92 4.92 Worst Case 45 0.66 1.06 1.42 1.76 1.31 1.31 1.31
Inflation (YoY) (CCPI)Best Case 25 4.53 4.55 4.58 4.60 4.42 4.42 4.42 Base Case 30 5.44 5.90 6.27 6.09 6.11 6.11 6.11 Worst Case 45 6.74 6.91 7.08 7.26 7.34 7.34 7.34
Interest Rate (AWPLR)Best Case 25 5.57 5.48 5.33 5.13 4.94 4.94 4.94 Base Case 30 5.88 5.94 5.94 5.88 5.82 5.82 5.82 Worst Case 45 6.21 6.46 6.66 6.79 6.82 6.82 6.82
Exchange Rate (USD:LKR)Best Case 25 187.61 189.72 191.85 194.00 196.18 198.39 200.62 Base Case 30 196.66 208.47 220.98 234.25 248.31 263.21 279.01 Worst Case 45 214.11 247.11 285.19 329.13 350.00 350.00 350.00
UnemploymentBest Case 25 5.60 5.59 5.56 5.53 5.49 5.49 5.49 Base Case 30 5.66 5.67 5.67 5.66 5.64 5.64 5.64 Worst Case 45 5.71 5.75 5.78 5.80 5.80 5.80 5.80
56.3.4.8 Analysis of net exposure on credit risk and impairment
The table below shows the credit quality by class of assets for all financial assets exposed to credit risk, based on the Bank’s classification of assets.
BANK
Stage 1 Stage 2 Stage 3 Total31 December 2021 LKR ’000 LKR ’000 LKR ’000 LKR ’000
Cash and cash equivalents 13,411,819 - - 13,411,819Balances with the Central Bank of Sri Lanka 16,403,362 - - 16,403,362Placements with banks 8,299,403 - - 8,299,403Derivative Financial Instruments 1,338,204 - - 1,338,204Financial assets recognised through profit or loss - measured at fair value 2,441,833 - - 2,441,833Financial assets at amortised cost - loans and receivables to other customers 366,443,090 107,258,159 28,808,209 502,509,458Financial assets at amortised cost - debt and other instruments 54,017,976 - 245,000 54,262,976Financial assets measured at fair value through other comprehensive income 89,552,196 - - 89,552,196

INSIDE INSIGHT FINANCIAL STATEMENTS
267
NOTES TO THE FINANCIAL STATEMENTS
BANK
Stage 1 Stage 2 Stage 3 Total31 December 2020 LKR ’000 LKR ’000 LKR ’000 LKR ’000
Cash and cash equivalents 10,487,608 - - 10,487,608Balances with the Central Bank of Sri Lanka 6,812,099 - - 6,812,099Placements with banks 12,401,533 - - 12,401,533Derivative financial instruments 1,429,470 - - 1,429,470Financial assets recognised through profit or loss - measured at fair value 5,574,175 - - 5,574,175Financial assets at amortised cost - loans and receivables to other customers 349,069,656 51,495,056 25,040,796 425,605,508Financial assets at amortised cost - debt and other instruments 44,466,640 - 245,000 44,711,640Financial assets measured at fair value through other comprehensive income 108,593,183 - - 108,593,183
GROUP
Stage 1 Stage 2 Stage 3 Total31 December 2021 LKR ’000 LKR ’000 LKR ’000 LKR ’000
Cash and cash equivalents 13,765,270 - - 13,765,270Balances with the Central Bank of Sri Lanka 16,403,362 - - 16,403,362Placements with banks 8,299,403 - - 8,299,403Derivative financial instruments 1,338,204 - - 1,338,204Financial assets recognised through profit or loss - measured at fair value 4,784,124 - - 4,784,124Financial assets at amortised cost - loans and receivables to other customers 366,278,418 107,258,159 28,808,209 502,344,786Financial assets at amortised cost - debt and other instruments 54,017,976 - 245,000 54,262,976Financial assets measured at fair value through other comprehensive income 89,696,611 - - 89,696,611
GROUP
Stage 1 Stage 2 Stage 3 Total31 December 2020 LKR ’000 LKR ’000 LKR ’000 LKR ’000
Cash and cash equivalents 10,778,947 - - 10,778,947Balances with the Central Bank of Sri Lanka 6,812,099 - - 6,812,099Placements with banks 12,401,533 - - 12,401,533Derivative financial instruments 1,429,470 - - 1,429,470Financial assets recognised through profit or loss - measured at fair value 7,713,222 - - 7,713,222Financial assets at amortised cost - loans and receivables to other customers 349,145,980 51,495,056 25,040,796 425,681,832Financial assets at amortised cost - debt and other instruments 44,466,640 - 245,000 44,711,640Financial assets measured at fair value through other comprehensive income 108,762,972 - - 108,762,972
56.3.4.9 Analysis of risk concentration
The Bank’s concentrations of risk are managed by customer/ counterparty and industry sector.
The following table shows the risk concentration by industry for the components of the Statement of Financial Position.

INSIDE INSIGHT FINANCIAL STATEMENTS
268
NOTES TO THE FINANCIAL STATEMENTS
56.3
.4.9
.1 I
ndus
try
anal
ysis
BA
NK
Agr
icul
ture
&
Fish
ing
Food
&
Bev
erag
e Tr
adin
g
Met
als,
C
hem
ical
s &
E
ngin
eerin
g
Ret
ails
S
ervi
ces
Te
xtile
s &
G
arm
ents
G
over
nmen
ts
Oth
ers
To
tal
31 D
ecem
ber 2
021
LKR
’000
LKR
’000
LKR
’000
LKR
’000
LKR
’000
LKR
’000
LKR
’000
LK
R ’0
00
LK
R ’0
00
LKR
’000
Cas
h an
d ca
sh e
quiv
alen
ts
-
-
-
-
-
13,
411,
819
-
-
-
13,4
11,8
19B
alan
ces
with
the
Cen
tral
Ban
k of
Sri
Lank
a
-
-
-
-
-
-
1
6,40
3,36
2 -
16
,403
,362
Pla
cem
ents
with
ban
ks
-
-
-
-
-
8,2
99,4
03
-
-
-
8,29
9,40
3D
eriv
ativ
e fin
anci
al in
stru
men
ts
-
-
-
-
-
1,3
38,2
04
-
-
-
1,33
8,20
4Fi
nanc
ial a
sset
s re
cogn
ised
thro
ugh
prof
it or
loss
- m
easu
red
at fa
ir va
lue
-
-
-
-
-
2
,441
,833
-
-
-
2,44
1,83
3Fi
nanc
ial a
sset
s at
am
ortis
ed c
ost -
loan
s an
d re
ceiv
able
s to
oth
er c
usto
mer
s -
- C
orpo
rate
Len
ding
41,
635,
400
8,5
94,6
47
19,
206,
174
28,
531,
719
1,3
46,5
81
59,
330,
477
23,
289,
463
27,
289,
059
72,
111,
025
281,
334,
545
-
Sm
all B
usin
ess
Lend
ing
14,
885,
657
8,8
57,6
57
22,
467,
633
11,
552,
715
9,5
36,4
35
18,
666,
626
2,7
42,3
38
1,7
49
20,
001,
098
108,
711,
908
-
Con
sum
er L
endi
ng 2
,486
,830
1
,226
,831
2
,908
,656
3
,184
,782
4
1,75
8,23
7 3
1,05
8,93
2 4
,146
,910
-
4
,496
,541
91
,267
,719
-
Res
iden
tial M
ortg
ages
433
,875
6
27,0
47
2,5
52,2
77
952
,886
6
,083
,144
6
,528
,135
1
,115
,789
-
2
,074
,048
20
,367
,201
-
Oth
ers
31,
102
184
4
,894
5
1,73
6 6
92,0
94
15,
091
18,
185
-
14,
799
828,
085
Net
loan
s an
d re
ceiv
able
s to
oth
er c
usto
mer
s59
,472
,864
19,3
06,3
6647
,139
,634
44,2
73,8
3859
,416
,491
115,
599,
261
31,3
12,6
8527
,290
,808
98,6
97,5
1150
2,50
9,45
8Fi
nanc
ial a
sset
s at
am
ortis
ed c
ost -
deb
t and
ot
her i
nstr
umen
ts-
--
--
4,89
6,52
7-
47,
866,
449
1,5
00,0
00
54,2
62,9
76Fi
nanc
ial a
sset
s m
easu
red
at fa
ir va
lue
thro
ugh
Oth
er c
ompr
ehen
sive
inco
me
--
--
-1,
020,
732
- 8
8,53
1,46
4 -
89,5
52,1
96
BA
NK
Agr
icul
ture
&
Fish
ing
Food
&
Bev
erag
e Tr
adin
g
Met
als,
C
hem
ical
s &
E
ngin
eerin
g
Ret
ails
S
ervi
ces
Te
xtile
s &
G
arm
ents
G
over
nmen
ts
Oth
ers
To
tal
31 D
ecem
ber 2
020
LKR
’000
LKR
’000
LKR
’000
LKR
’000
LKR
’000
LKR
’000
LKR
’000
LK
R ’0
00
LK
R ’0
00
LKR
’000
Cas
h an
d ca
sh e
quiv
alen
ts-
--
--
10,4
87,6
08-
-
-
10,4
87,6
08B
alan
ces
with
the
Cen
tral
Ban
k of
Sri
Lank
a-
--
--
--
6,8
12,0
99
-
6,81
2,09
9P
lace
men
ts w
ith b
anks
--
--
-12
,401
,533
- -
-
12
,401
,533
Der
ivat
ive
finan
cial
inst
rum
ents
--
--
-1,
429,
470
- -
-
1,
429,
470
Fina
ncia
l ass
ets
reco
gnis
ed th
roug
h pr
ofit
or lo
ss-
mea
sure
d at
fair
valu
e-
--
--
3,0
61,4
25
- 2
,512
,750
-
5,57
4,17
5Fi
nanc
ial a
sset
s at
am
ortis
ed c
ost -
loan
s an
d re
ceiv
able
s to
oth
er c
usto
mer
s
- C
orpo
rate
Len
ding
37,9
46,9
189,
015,
114
15,2
42,2
2919
,735
,554
2,47
3,76
854
,534
,006
17,4
65,1
06 2
6,15
5,34
1 5
6,59
8,08
0 23
9,16
6,11
6
- S
mal
l Bus
ines
s Le
ndin
g10
,164
,125
4,52
6,93
921
,249
,235
11,0
63,4
6411
,695
,560
14,5
20,9
982,
574,
757
11,
727
17,
730,
904
93,5
37,7
09
- C
onsu
mer
Len
ding
633,
028
793,
806
2,76
3,24
42,
502,
185
38,7
49,0
9322
,945
,646
3,43
2,58
1 -
3
,010
,682
74
,830
,265
-
Res
iden
tial M
ortg
ages
391,
464
674,
567
2,21
4,35
01,
045,
636
5,81
9,99
35,
215,
326
992,
794
-
1,5
93,5
71
17,9
47,7
01
- O
ther
s14
3-
391
212
116,
304
165
3,11
5 -
3
,387
12
3,71
7N
et lo
ans
and
rece
ivab
les
to o
ther
cus
tom
ers
49,1
35,6
7815
,010
,426
41,4
69,4
4934
,347
,051
58,8
54,7
1897
,216
,141
24,4
68,3
53 2
6,16
7,06
8 7
8,93
6,62
4 42
5,60
5,50
8Fi
nanc
ial a
sset
s at
am
ortis
ed c
ost -
deb
t and
ot
her i
nstr
umen
ts-
--
--
616,
314
- 4
4,09
5,32
6 -
44
,711
,640
Fina
ncia
l ass
ets
mea
sure
d at
fair
valu
e th
roug
h O
ther
com
preh
ensi
ve in
com
e-
--
--
1,03
6,54
1-
107
,556
,642
-
10
8,59
3,18
3
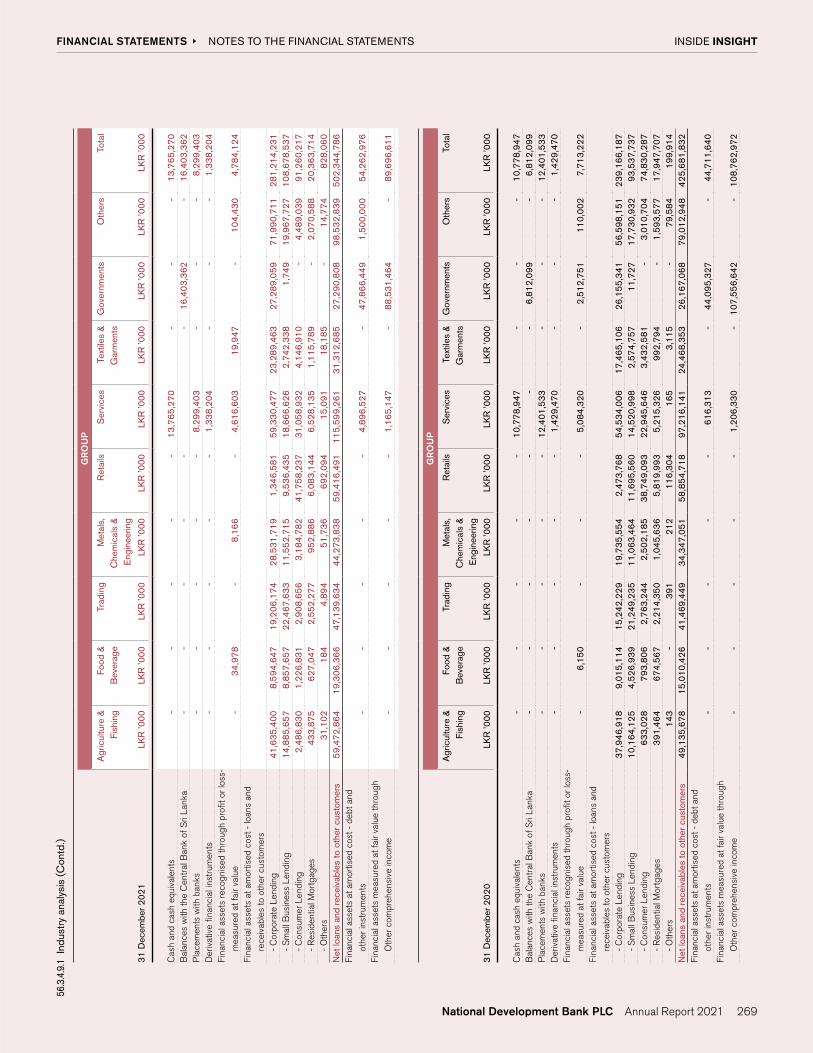
INSIDE INSIGHT FINANCIAL STATEMENTS
269
NOTES TO THE FINANCIAL STATEMENTS
56.3
.4.9
.1 I
ndus
try
anal
ysis
(Con
td.)
GR
OU
P
Agr
icul
ture
&
Fish
ing
Food
&
Bev
erag
e Tr
adin
g
Met
als,
C
hem
ical
s &
E
ngin
eerin
g
Ret
ails
S
ervi
ces
Te
xtile
s &
G
arm
ents
G
over
nmen
ts
Oth
ers
To
tal
31 D
ecem
ber 2
021
LKR
’000
LKR
’000
LKR
’000
LKR
’000
LKR
’000
LKR
’000
LKR
’000
LK
R ’0
00
LK
R ’0
00
LKR
’000
Cas
h an
d ca
sh e
quiv
alen
ts -
-
-
-
-
13
,765
,270
-
-
-
13,7
65,2
70B
alan
ces
with
the
Cen
tral
Ban
k of
Sri
Lank
a -
-
-
-
-
-
1
6,40
3,36
2 -
16
,403
,362
Pla
cem
ents
with
ban
ks -
-
-
-
-
8,
299,
403
-
-
-
8,29
9,40
3D
eriv
ativ
e fin
anci
al in
stru
men
ts -
-
-
-
-
1,
338,
204
-
-
-
1,33
8,20
4Fi
nanc
ial a
sset
s re
cogn
ised
thro
ugh
prof
it or
loss
- m
easu
red
at fa
ir va
lue
-34
,978
-8,
166
-4,
616,
603
19,9
47 -
104
,430
4,
784,
124
Fina
ncia
l ass
ets
at a
mor
tised
cos
t - lo
ans
and
rece
ivab
les
to o
ther
cus
tom
ers
-
Cor
pora
te L
endi
ng41
,635
,400
8,59
4,64
719
,206
,174
28,5
31,7
191,
346,
581
59,3
30,4
7723
,289
,463
27,
289,
059
71,
990,
711
281,
214,
231
-
Sm
all B
usin
ess
Lend
ing
14,8
85,6
578,
857,
657
22,4
67,6
3311
,552
,715
9,53
6,43
518
,666
,626
2,74
2,33
8 1
,749
1
9,96
7,72
7 10
8,67
8,53
7
- C
onsu
mer
Len
ding
2,48
6,83
01,
226,
831
2,90
8,65
63,
184,
782
41,7
58,2
3731
,058
,932
4,14
6,91
0-
4
,489
,039
91
,260
,217
-
Res
iden
tial M
ortg
ages
433,
875
627,
047
2,55
2,27
795
2,88
66,
083,
144
6,52
8,13
51,
115,
789
-
2,0
70,5
88
20,3
63,7
14
- O
ther
s31
,102
184
4,89
451
,736
692,
094
15,0
9118
,185
-
14,
774
828,
060
Net
loan
s an
d re
ceiv
able
s to
oth
er c
usto
mer
s59
,472
,864
19,3
06,3
6647
,139
,634
44,2
73,8
3859
,416
,491
115,
599,
261
31,3
12,6
8527
,290
,808
98,5
32,8
3950
2,34
4,78
6Fi
nanc
ial a
sset
s at
am
ortis
ed c
ost -
deb
t and
ot
her i
nstr
umen
ts-
--
--
4,89
6,52
7 -
4
7,86
6,44
9 1
,500
,000
54
,262
,976
Fina
ncia
l ass
ets
mea
sure
d at
fair
valu
e th
roug
h O
ther
com
preh
ensi
ve in
com
e-
--
--
1,16
5,14
7 -
8
8,53
1,46
4 -
89
,696
,611
GR
OU
P
Agr
icul
ture
&
Fish
ing
Food
&
Bev
erag
e Tr
adin
g
Met
als,
C
hem
ical
s &
E
ngin
eerin
g
Ret
ails
S
ervi
ces
Te
xtile
s &
G
arm
ents
G
over
nmen
ts
Oth
ers
To
tal
31 D
ecem
ber 2
020
LKR
’000
LKR
’000
LKR
’000
LKR
’000
LKR
’000
LKR
’000
LKR
’000
LK
R ’0
00
LK
R ’0
00
LKR
’000
Cas
h an
d ca
sh e
quiv
alen
ts-
--
--
10,7
78,9
47-
-
-
10,7
78,9
47B
alan
ces
with
the
Cen
tral
Ban
k of
Sri
Lank
a-
--
--
--
6,8
12,0
99
-
6,81
2,09
9P
lace
men
ts w
ith b
anks
--
--
-12
,401
,533
- -
-
12
,401
,533
Der
ivat
ive
finan
cial
inst
rum
ents
--
--
-1,
429,
470
- -
-
1,
429,
470
Fina
ncia
l ass
ets
reco
gnis
ed th
roug
h pr
ofit
or lo
ss-
mea
sure
d at
fair
valu
e-
6,15
0-
--
5,08
4,32
0-
2,5
12,7
51
110
,002
7,
713,
222
Fina
ncia
l ass
ets
at a
mor
tised
cos
t - lo
ans
and
rece
ivab
les
to o
ther
cus
tom
ers
-
Cor
pora
te L
endi
ng37
,946
,918
9,01
5,11
415
,242
,229
19,7
35,5
542,
473,
768
54,5
34,0
0617
,465
,106
26,
155,
341
56,
598,
151
239,
166,
187
-
Sm
all B
usin
ess
Lend
ing
10,1
64,1
254,
526,
939
21,2
49,2
3511
,063
,464
11,6
95,5
6014
,520
,998
2,57
4,75
7 1
1,72
7 1
7,73
0,93
2 93
,537
,737
-
Con
sum
er L
endi
ng63
3,02
879
3,80
62,
763,
244
2,50
2,18
538
,749
,093
22,9
45,6
463,
432,
581
-
3,0
10,7
04
74,8
30,2
87
- R
esid
entia
l Mor
tgag
es39
1,46
467
4,56
72,
214,
350
1,04
5,63
65,
819,
993
5,21
5,32
699
2,79
4 -
1
,593
,577
17
,947
,707
-
Oth
ers
143
-39
121
211
6,30
416
53,
115
-
79,
584
199,
914
Net
loan
s an
d re
ceiv
able
s to
oth
er c
usto
mer
s49
,135
,678
15,0
10,4
2641
,469
,449
34,3
47,0
5158
,854
,718
97,2
16,1
4124
,468
,353
26,
167,
068
79,
012,
948
425,
681,
832
Fina
ncia
l ass
ets
at a
mor
tised
cos
t - d
ebt a
nd
othe
r ins
trum
ents
--
--
-61
6,31
3-
44,
095,
327
-
44,7
11,6
40Fi
nanc
ial a
sset
s m
easu
red
at fa
ir va
lue
thro
ugh
Oth
er c
ompr
ehen
sive
inco
me
--
--
-1,
206,
330
- 1
07,5
56,6
42
-
108,
762,
972

INSIDE INSIGHT FINANCIAL STATEMENTS
270
NOTES TO THE FINANCIAL STATEMENTS
56.3
.4.1
0 C
ount
ry r
isk
C
ount
ry ri
sk is
the
risk
that
an
occu
rren
ce w
ithin
a c
ount
ry c
ould
hav
e an
adv
erse
eff
ect o
n th
e B
ank
dire
ctly
by
impa
iring
the
valu
e of
the
Ban
k or
indi
rect
ly th
roug
h an
obl
igor
’s a
bilit
y to
m
eet i
ts o
blig
atio
ns to
the
Ban
k. G
ener
ally
thes
e oc
curr
ence
s re
late
but
are
not
lim
ited
to: s
over
eign
eve
nts
such
as
defa
ults
or r
estr
uctu
ring,
pol
itica
l eve
nts
such
as
cont
este
d el
ectio
ns,
rest
rictio
ns o
n cu
rren
cy m
ovem
ents
, non
-mar
ket c
urre
ncy
conv
ertib
ility
, reg
iona
l con
flict
s, e
cono
mic
con
tagi
on fr
om o
ther
eve
nts
such
as
sove
reig
n de
faul
t iss
ues
or re
gion
al tu
rmoi
l, ba
nkin
g an
d cu
rren
cy c
risis
, and
nat
ural
dis
aste
rs.
BA
NK
Sri
Lank
aE
urop
eA
mer
ica
Asi
aM
iddl
e E
ast
Aus
tral
ia-
New
Zea
land
Afri
ca T
otal
31 D
ecem
ber 2
021
LKR
'000
LKR
'000
LKR
'000
LKR
'000
LKR
'000
LKR
'000
LKR
'000
LK
R '0
00
Cas
h an
d ca
sh e
quiv
alen
ts 7
,305
,647
4
49,7
58
3,9
54,4
00
1,3
86,0
89
9,9
19
306
,006
-
1
3,41
1,81
9 B
alan
ces
with
the
Cen
tral
Ban
k of
Sri
Lank
a 1
6,40
3,36
2 -
-
-
-
-
-
1
6,40
3,36
2 P
lace
men
ts w
ith b
anks
8,2
99,4
03
-
-
-
-
-
-
8,2
99,4
03
Der
ivat
ive
finan
cial
inst
rum
ents
1,3
38,2
04
-
-
-
-
-
-
1,3
38,2
04
Fina
ncia
l ass
ets
reco
gnis
ed th
roug
h pr
ofit
or lo
ss -
mea
sure
d at
fair
valu
e 2
,441
,833
-
-
-
-
-
-
2
,441
,833
Fi
nanc
ial a
sset
s at
am
ortis
ed c
ost -
loan
s an
d re
ceiv
able
s to
oth
er c
usto
mer
s 4
78,0
41,7
56
-
-
17,
995,
785
2,0
47,7
49
-
4,4
24,1
67
502,
509,
457
Fina
ncia
l ass
ets
at a
mor
tised
cos
t - d
ebt a
nd o
ther
inst
rum
ents
54,
262,
976
-
-
-
-
-
-
54,
262,
976
Fina
ncia
l ass
ets
mea
sure
d at
fair
valu
e th
roug
h ot
her c
ompr
ehen
sive
inco
me
89,
552,
196
-
-
-
-
-
-
89,
552,
196
Oth
er fi
nanc
ial a
sset
s 1
,446
,327
-
-
-
-
-
-
1
,446
,327
To
tal F
inan
cial
Ass
ets
659,
091,
704
449,
758
3,95
4,40
019
,381
,874
2,05
7,66
830
6,00
64,
424,
167
689,
665,
577
BA
NK
Sri
Lank
aE
urop
eA
mer
ica
Asi
aM
iddl
e E
ast
Aus
tral
ia-
New
Zea
land
Afri
ca T
otal
31 D
ecem
ber 2
020
LKR
'000
LKR
'000
LKR
'000
LKR
'000
LKR
'000
LKR
'000
LKR
'000
LK
R '0
00
Cas
h an
d ca
sh e
quiv
alen
ts5,
877,
472
699,
166
2,65
2,80
41,
077,
743
16,2
9216
4,13
1-
10,
487,
608
Bal
ance
s w
ith th
e C
entr
al B
ank
of S
ri La
nka
6,81
2,09
9-
--
--
- 6
,812
,099
P
lace
men
ts w
ith b
anks
12,4
01,5
33-
--
--
- 1
2,40
1,53
3 D
eriv
ativ
e fin
anci
al in
stru
men
ts1,
429,
470
--
--
--
1,4
29,4
70
Fina
ncia
l ass
ets
reco
gnis
ed th
roug
h pr
ofit
or lo
ss -
mea
sure
d at
fair
valu
e5,
574,
175
--
--
--
5,5
74,1
75
Fina
ncia
l ass
ets
at a
mor
tised
cos
t - lo
ans
and
rece
ivab
les
to o
ther
cus
tom
ers
408,
368,
599
--
11,1
81,5
791,
250,
302
-4,
805,
028
425
,605
,508
Fi
nanc
ial a
sset
s at
am
ortis
ed c
ost -
deb
t and
oth
er in
stru
men
ts44
,711
,640
--
--
--
44,
711,
640
Fina
ncia
l ass
ets
mea
sure
d at
fair
valu
e th
roug
h ot
her c
ompr
ehen
sive
inco
me
108,
593,
183
--
--
--
108
,593
,183
O
ther
fina
ncia
l ass
ets
129,
469
--
--
--
129
,469
To
tal F
inan
cial
Ass
ets
593,
897,
640
699,
166
2,65
2,80
412
,259
,322
1,26
6,59
416
4,13
14,
805,
028
615
,744
,685

INSIDE INSIGHT FINANCIAL STATEMENTS
271
NOTES TO THE FINANCIAL STATEMENTS
56.3
.4.1
0 C
ount
ry r
isk
C
ount
ry ri
sk is
the
risk
that
an
occu
rren
ce w
ithin
a c
ount
ry c
ould
hav
e an
adv
erse
eff
ect o
n th
e B
ank
dire
ctly
by
impa
iring
the
valu
e of
the
Ban
k or
indi
rect
ly th
roug
h an
obl
igor
’s a
bilit
y to
m
eet i
ts o
blig
atio
ns to
the
Ban
k. G
ener
ally
thes
e oc
curr
ence
s re
late
but
are
not
lim
ited
to: s
over
eign
eve
nts
such
as
defa
ults
or r
estr
uctu
ring,
pol
itica
l eve
nts
such
as
cont
este
d el
ectio
ns,
rest
rictio
ns o
n cu
rren
cy m
ovem
ents
, non
-mar
ket c
urre
ncy
conv
ertib
ility
, reg
iona
l con
flict
s, e
cono
mic
con
tagi
on fr
om o
ther
eve
nts
such
as
sove
reig
n de
faul
t iss
ues
or re
gion
al tu
rmoi
l, ba
nkin
g an
d cu
rren
cy c
risis
, and
nat
ural
dis
aste
rs.
GR
OU
P
Sri
Lank
aE
urop
eA
mer
ica
Asi
aM
iddl
e E
ast
Aus
tral
ia-
New
Zea
land
Afri
ca T
otal
31 D
ecem
ber 2
021
LKR
'000
LKR
'000
LKR
'000
LKR
'000
LKR
'000
LKR
'000
LKR
'000
LK
R '0
00
Cas
h an
d ca
sh e
quiv
alen
ts7,
659,
098
449,
758
3,95
4,40
01,
386,
089
9,91
930
6,00
6 -
1
3,76
5,27
0 B
alan
ces
with
the
Cen
tral
Ban
k of
Sri
Lank
a16
,403
,362
-
-
-
-
-
-
16,
403,
362
Pla
cem
ents
with
ban
ks8,
299,
403
-
-
-
-
-
-
8,2
99,4
03
Der
ivat
ive
finan
cial
inst
rum
ents
1,33
8,20
4 -
-
-
-
-
-
1
,338
,204
Fi
nanc
ial a
sset
s re
cogn
ised
thro
ugh
prof
it or
loss
- m
easu
red
at fa
ir va
lue
4,78
4,12
4 -
-
-
-
-
-
4
,784
,124
Fi
nanc
ial a
sset
s at
am
ortis
ed c
ost -
loan
s an
d re
ceiv
able
s to
oth
er c
usto
mer
s47
7,87
7,08
4 -
-
17
,995
,785
2,04
7,74
9 -
4,
424,
167
502
,344
,786
Fi
nanc
ial a
sset
s at
am
ortis
ed c
ost -
deb
t and
oth
er in
stru
men
ts54
,262
,976
-
-
-
-
-
-
54,
262,
976
Fina
ncia
l ass
ets
mea
sure
d at
fair
valu
e th
roug
h ot
her c
ompr
ehen
sive
inco
me
89,6
96,6
11 -
-
-
-
-
-
8
9,69
6,61
1 O
ther
fina
ncia
l ass
ets
2,21
8,35
1 -
-
-
-
-
-
2
,218
,351
To
tal F
inan
cial
Ass
ets
662,
539,
214
449,
758
3,95
4,40
019
,381
,874
2,05
7,66
930
6,00
64,
424,
167
693
,113
,087
GR
OU
P
Sri
Lank
aE
urop
eA
mer
ica
Asi
aM
iddl
e E
ast
Aus
tral
ia-
New
Zea
land
Afri
ca T
otal
31 D
ecem
ber 2
020
LKR
'000
LKR
'000
LKR
'000
LKR
'000
LKR
'000
LKR
'000
LKR
'000
LK
R '0
00
Cas
h an
d ca
sh e
quiv
alen
ts6,
168,
811
699,
166
2,65
2,80
41,
077,
743
16,2
9216
4,13
1-
10,
778,
947
Bal
ance
s w
ith th
e C
entr
al B
ank
of S
ri La
nka
6,81
2,09
9-
--
--
- 6
,812
,099
P
lace
men
ts w
ith b
anks
12,4
01,5
33-
--
--
- 1
2,40
1,53
3 D
eriv
ativ
e fin
anci
al in
stru
men
ts1,
429,
470
--
--
--
1,4
29,4
70
Fina
ncia
l ass
ets
reco
gnis
ed th
roug
h pr
ofit
or lo
ss -
mea
sure
d at
fair
valu
e7,
713,
222
--
--
--
7,7
13,2
22
Fina
ncia
l ass
ets
at a
mor
tised
cos
t - lo
ans
and
rece
ivab
les
to o
ther
cus
tom
ers
408,
444,
923
--
11,1
81,5
791,
250,
302
-4,
805,
028
425
,681
,832
Fi
nanc
ial a
sset
s at
am
ortis
ed c
ost -
deb
t and
oth
er in
stru
men
ts44
,711
,640
--
--
--
44,7
11,6
40
Fina
ncia
l ass
ets
mea
sure
d at
fair
valu
e th
roug
h ot
her c
ompr
ehen
sive
inco
me
108,
762,
972
--
--
--
108
,762
,972
O
ther
fina
ncia
l ass
ets
441,
488
--
--
--
441
,488
To
tal F
inan
cial
Ass
ets
596,
886,
158
699,
166
2,65
2,80
412
,259
,322
1,26
6,59
416
4,13
14,
805,
028
618
,733
,203

INSIDE INSIGHT FINANCIAL STATEMENTS
272
NOTES TO THE FINANCIAL STATEMENTS
56.3.4.11 Collateral and other credit enhancements
The amount and type of collateral required depends on an assessment of the credit risk of the counterparty. Guidelines are in place covering the acceptability and valuation of each type of collateral.
The main types of collateral obtained are as follows:
� For securities lending and reverse repurchase transactions, cash or securities
� For corporate and small business lending, charges over real estate properties, inventory and trade receivables and, in special circumstances, government guarantees
� For retail lending, mortgages over residential properties
The Bank also obtains guarantees from parent companies for loans to their subsidiaries. Management monitors the market value of collateral and will request additional collateral in accordance with the underlying agreement.
In its normal course of business, the Bank does not physically repossess properties or other assets in its retail portfolio, but engages external agents to recover funds, generally at auctions, to settle outstanding debt. Any surplus funds are returned to the customers/ obligors. As a result of this practice, the residential properties under legal repossession processes are not recorded in the Statement of Financial Position and not treated as non-current assets held for sale.
The Bank’s Collateral policy is covered in the Bank’s Credit Policy Manual and is reviewed annually. There have been no significant changes to the collateral policy.
The Bank does not recognise loss allowances for financial assets secured by cash and treasury guarantees issued by Government of Sri Lanka.
For its derivative portfolio, the Bank also makes use of master netting agreements and other arrangements not eligible for netting under IAS 32 Financial Instruments: Presentation with its counterparties. Such arrangements provide for single net settlement of all financial instruments covered by the agreements in the event of default on any one contract. Although, these master netting arrangements do not normally result in an offset of balance–sheet assets and liabilities (as the conditions for offsetting under IAS 32 may not apply), they, nevertheless, reduce the Bank’s exposure to credit risk, as shown in the tables on the following pages.
Although master netting arrangements may significantly reduce credit risk, it should be noted that the credit risk is eliminated only to the extent of amounts due to the same counterparty.
The tables on the following pages show the maximum exposure to credit risk by class of financial asset. They also show the total fair value of collateral, any surplus collateral (the extent to which the fair value of collateral held is greater than the exposure to which it relates), and the net exposure to credit risk.

INSIDE INSIGHT FINANCIAL STATEMENTS
273
NOTES TO THE FINANCIAL STATEMENTS
56.3
.4.1
1 C
olla
tera
l and
oth
er c
red
it en
hanc
emen
ts (C
ontd
.)
Ty
pe o
f co
llate
ral o
r cr
edit
enha
ncem
ent
BA
NK
Fair
valu
e of
col
late
ral a
nd c
redi
t enh
ance
men
ts h
eld
Max
imum
ex
posu
re to
cr
edit
risk
Cas
h
Sec
uriti
es
3rd
part
y/
Gov
ernm
ent
guar
ante
es
Pro
pert
y
Oth
er
Sur
plus
C
olla
tera
l T
otal
C
olla
tera
l N
et
Exp
osur
e
Ass
ocia
ted
EC
Ls
31 D
ecem
ber 2
021
LKR
’000
LKR
’000
LKR
’000
LKR
’000
LKR
’000
LKR
’000
LKR
’000
LK
R ’0
00
LK
R ’0
00
LKR
’000
Fina
ncia
l Ass
ets
Cas
h an
d ca
sh e
quiv
alen
ts 1
3,41
1,81
9 -
-
-
-
-
-
-
1
3,41
1,81
9-
Bal
ance
s w
ith th
e C
entr
al B
ank
of S
ri La
nka
16,
403,
362
-
-
-
-
-
-
-
16,
403,
362
-P
lace
men
ts w
ith b
anks
8,2
99,4
03 -
-
-
-
-
-
-
8
,299
,403
-D
eriv
ativ
e fin
anci
al in
stru
men
ts 1
,338
,204
-
-
-
-
-
-
-
1
,338
,203
-
Fina
ncia
l ass
ets
reco
gnis
ed th
roug
h pr
ofit
or lo
ss-
mea
sure
d at
fair
valu
e 2
,441
,833
-
-
-
-
-
-
-
2
,441
,833
-
Fina
ncia
l ass
ets
at a
mor
tised
cos
t - lo
ans
and
rece
ivab
les
to o
ther
cus
tom
ers
-
Cor
pora
te L
endi
ng 2
81,3
34,5
45
25,
998,
811
5,6
55,5
00
185
,261
,843
6
9,27
4,24
4 1
52,4
29,0
17
(260
,424
,712
)17
8,19
4,70
1 10
3,13
9,84
49,
355,
743
-
Sm
all B
usin
ess
Lend
ing
108
,711
,908
2
6,77
7,43
9 3
80,1
22
72,
581,
016
123
,089
,933
4
2,48
4,93
5 (1
78,4
76,5
48)
86,
836,
896
21,8
75,0
128,
332,
032
-
Con
sum
er L
endi
ng 9
1,26
7,71
9 2
6,49
7,96
4 1
7,43
7 7
,936
,692
2
3,95
3,93
0 1
4,08
1,12
2 (4
7,08
1,67
8) 2
5,40
5,46
765
,862
,252
5,11
0,55
6
- R
esid
entia
l Mor
tgag
es 2
0,36
7,20
1 -
-
-
21,
076,
260
-
(709
,059
) 2
0,36
7,20
1 -
709,
059
-
Oth
ers
828
,085
-
1
00,0
00
880
,195
3
30,2
93
84,
500
(1,3
13,5
26)
81,
463
746,
622
124,
194
Net
loan
s an
d re
ceiv
able
s to
oth
er c
usto
mer
s50
2,50
9,45
879
,274
,214
6,15
3,05
926
6,65
9,74
623
7,72
4,66
020
9,07
9,57
4 (4
88,0
05,5
23)
310
,885
,728
19
1,62
3,73
023
,631
,584
Fina
ncia
l ass
ets
at a
mor
tised
cos
t - d
ebt a
nd
othe
r ins
trum
ents
54,2
62,9
76-
-
-
-
-
-
-
5
4,26
2,97
6 2,
897,
491
Fina
ncia
l ass
ets
mea
sure
d at
fair
valu
e th
roug
h ot
her c
ompr
ehen
sive
inco
me
89,
552,
196
-
-
-
-
-
-
-
89,
552,
196
-
BA
NK
Fair
valu
e of
col
late
ral a
nd c
redi
t enh
ance
men
ts h
eld
Max
imum
ex
posu
re to
cr
edit
risk
Cas
h
Sec
uriti
es
3rd
part
y/
Gov
ernm
ent
guar
ante
es
Pro
pert
y
Oth
er
Sur
plus
C
olla
tera
l T
otal
C
olla
tera
l N
et
Exp
osur
e
Ass
ocia
ted
EC
Ls
31 D
ecem
ber 2
020
LKR
’000
LKR
’000
LKR
’000
LKR
’000
LKR
’000
LKR
’000
LKR
’000
LK
R ’0
00
LK
R ’0
00
LKR
’000
Fina
ncia
l Ass
ets
Cas
h an
d ca
sh e
quiv
alen
ts10
,487
,608
--
--
--
-
10,
487,
608
-B
alan
ces
with
the
Cen
tral
Ban
k of
Sri
Lank
a6,
812,
099
--
--
--
-
6,8
12,0
99
-P
lace
men
ts w
ith b
anks
12,4
01,5
33-
--
--
- -
1
2,40
1,53
3 -
Der
ivat
ive
finan
cial
inst
rum
ents
1,42
9,47
0-
--
--
- -
1
,429
,470
-
Fina
ncia
l ass
ets
reco
gnis
ed th
roug
h pr
ofit
or lo
ss-
mea
sure
d at
fair
valu
e5,
574,
175
--
--
--
-
5,5
74,1
75
-Fi
nanc
ial a
sset
s at
am
ortis
ed c
ost -
loan
s an
d re
ceiv
able
s to
oth
er c
usto
mer
s
- C
orpo
rate
Len
ding
239,
166,
116
17,6
09,0
344,
206,
500
164,
206,
247
67,9
83,4
7014
0,97
4,74
9(2
32,8
39,0
46)
162
,140
,954
7
7,02
5,16
2 6,
845,
714
-
Sm
all B
usin
ess
Lend
ing
93,5
37,7
1020
,164
,549
409,
617
60,8
14,0
6211
3,26
4,35
636
,298
,957
(154
,714
,829
) 7
6,23
6,71
2 1
7,30
0,99
8 7,
087,
718
-
Con
sum
er L
endi
ng74
,830
,263
20,8
68,8
6580
,070
9,04
3,80
920
,419
,253
14,2
08,6
05(4
4,27
3,76
2) 2
0,34
6,84
0 5
4,48
3,42
3 3,
301,
680
-
Res
iden
tial M
ortg
ages
17,9
47,7
03-
--
18,5
40,6
16-
(592
,912
) 1
7,94
7,70
4 -
56
3,76
0
- O
ther
s12
3,71
6-
100,
000
839,
440
330,
293
84,5
00(1
,308
,467
) 4
5,76
6 7
7,95
0 13
2,59
7N
et lo
ans
and
rece
ivab
les
to o
ther
cus
tom
ers
425,
605,
508
58,6
42,4
484,
796,
187
234,
903,
558
220,
537,
988
191,
566,
811
(433
,729
,016
) 2
76,7
17,9
76
148
,887
,533
17
,931
,469
Fina
ncia
l ass
ets
at a
mor
tised
cos
t - d
ebt a
nd
othe
r ins
trum
ents
44,7
11,6
40-
--
--
- -
4
4,71
1,64
0 95
7,72
2Fi
nanc
ial a
sset
s m
easu
red
at fa
ir va
lue
thro
ugh
othe
r com
preh
ensi
ve in
com
e10
8,59
3,18
3-
--
--
- -
1
08,5
93,1
83
-
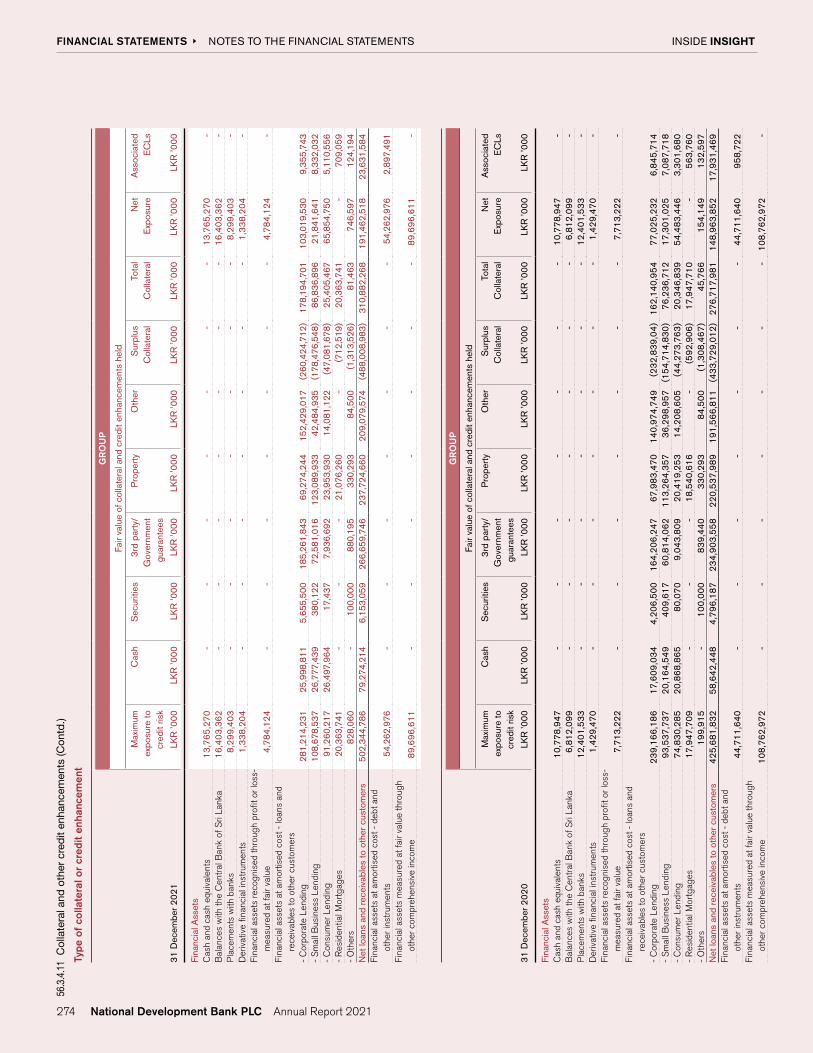
INSIDE INSIGHT FINANCIAL STATEMENTS
274
NOTES TO THE FINANCIAL STATEMENTS
56.3
.4.1
1 C
olla
tera
l and
oth
er c
red
it en
hanc
emen
ts (C
ontd
.)
Ty
pe o
f co
llate
ral o
r cr
edit
enha
ncem
ent
GR
OU
P
Fair
valu
e of
col
late
ral a
nd c
redi
t enh
ance
men
ts h
eld
Max
imum
ex
posu
re to
cr
edit
risk
Cas
h
Sec
uriti
es
3rd
part
y/
Gov
ernm
ent
guar
ante
es
Pro
pert
y
Oth
er
Sur
plus
C
olla
tera
l T
otal
C
olla
tera
l N
et
Exp
osur
e
Ass
ocia
ted
EC
Ls
31 D
ecem
ber 2
021
LKR
’000
LKR
’000
LKR
’000
LKR
’000
LKR
’000
LKR
’000
LKR
’000
LK
R ’0
00
LK
R ’0
00
LKR
’000
Fina
ncia
l Ass
ets
Cas
h an
d ca
sh e
quiv
alen
ts13
,765
,270
-
-
-
-
-
-
-
13,
765,
270
-B
alan
ces
with
the
Cen
tral
Ban
k of
Sri
Lank
a16
,403
,362
-
-
-
-
-
-
-
16,
403,
362
-P
lace
men
ts w
ith b
anks
8,29
9,40
3 -
-
-
-
-
-
-
8
,299
,403
-D
eriv
ativ
e fin
anci
al in
stru
men
ts1,
338,
204
-
-
-
-
-
-
-
1,3
38,2
04
-Fi
nanc
ial a
sset
s re
cogn
ised
thro
ugh
prof
it or
loss
- m
easu
red
at fa
ir va
lue
4,78
4,12
4 -
-
-
-
-
-
-
4
,784
,124
-
Fina
ncia
l ass
ets
at a
mor
tised
cos
t - lo
ans
and
rece
ivab
les
to o
ther
cus
tom
ers
- C
orpo
rate
Len
ding
281,
214,
231
25,9
98,8
115,
655,
500
185,
261,
843
69,2
74,2
4415
2,42
9,01
7 (2
60,4
24,7
12)
178
,194
,701
1
03,0
19,5
30
9,35
5,74
3-
Sm
all B
usin
ess
Lend
ing
108,
678,
537
26,7
77,4
3938
0,12
272
,581
,016
123,
089,
933
42,4
84,9
35 (1
78,4
76,5
48)
86,
836,
896
21,
841,
641
8,33
2,03
2-
Con
sum
er L
endi
ng91
,260
,217
26,4
97,9
6417
,437
7,93
6,69
223
,953
,930
14,0
81,1
22 (4
7,08
1,67
8) 2
5,40
5,46
7 6
5,85
4,75
0 5,
110,
556
- R
esid
entia
l Mor
tgag
es20
,363
,741
-
-
-
21,0
76,2
60-
(7
12,5
19)
20,
363,
741
-
709,
059
- O
ther
s82
8,06
0-
10
0,00
088
0,19
533
0,29
384
,500
(1,3
13,5
26)
81,
463
746
,597
12
4,19
4N
et lo
ans
and
rece
ivab
les
to o
ther
cus
tom
ers
502,
344,
786
79,2
74,2
146,
153,
059
266,
659,
746
237,
724,
660
209,
079,
574
(488
,008
,983
) 3
10,8
82,2
68
191,
462,
518
23,6
31,5
84Fi
nanc
ial a
sset
s at
am
ortis
ed c
ost -
deb
t and
ot
her i
nstr
umen
ts54
,262
,976
--
--
--
-
54,
262,
976
2,89
7,49
1Fi
nanc
ial a
sset
s m
easu
red
at fa
ir va
lue
thro
ugh
othe
r com
preh
ensi
ve in
com
e89
,696
,611
--
--
--
-
89,
696,
611
-
GR
OU
P
Fair
valu
e of
col
late
ral a
nd c
redi
t enh
ance
men
ts h
eld
Max
imum
ex
posu
re to
cr
edit
risk
Cas
h
Sec
uriti
es
3rd
part
y/
Gov
ernm
ent
guar
ante
es
Pro
pert
y
Oth
er
Sur
plus
C
olla
tera
l T
otal
C
olla
tera
l N
et
Exp
osur
e
Ass
ocia
ted
EC
Ls
31 D
ecem
ber 2
020
LKR
’000
LKR
’000
LKR
’000
LKR
’000
LKR
’000
LKR
’000
LKR
’000
LK
R ’0
00
LK
R ’0
00
LKR
’000
Fina
ncia
l Ass
ets
Cas
h an
d ca
sh e
quiv
alen
ts10
,778
,947
--
--
--
-
10,
778,
947
-B
alan
ces
with
the
Cen
tral
Ban
k of
Sri
Lank
a6,
812,
099
--
--
--
-
6,8
12,0
99
-P
lace
men
ts w
ith b
anks
12,4
01,5
33-
--
--
- -
1
2,40
1,53
3 -
Der
ivat
ive
finan
cial
inst
rum
ents
1,42
9,47
0-
--
--
- -
1
,429
,470
-
Fina
ncia
l ass
ets
reco
gnis
ed th
roug
h pr
ofit
or lo
ss-
mea
sure
d at
fair
valu
e7,
713,
222
--
--
--
-
7,7
13,2
22
-Fi
nanc
ial a
sset
s at
am
ortis
ed c
ost -
loan
s an
d re
ceiv
able
s to
oth
er c
usto
mer
s-
Cor
pora
te L
endi
ng23
9,16
6,18
617
,609
,034
4,20
6,50
016
4,20
6,24
767
,983
,470
140,
974,
749
(232
,839
,04)
162
,140
,954
7
7,02
5,23
2 6,
845,
714
- S
mal
l Bus
ines
s Le
ndin
g93
,537
,737
20,1
64,5
4940
9,61
760
,814
,062
113,
264,
357
36,2
98,9
57(1
54,7
14,8
30)
76,
236,
712
17,
301,
025
7,08
7,71
8-
Con
sum
er L
endi
ng74
,830
,285
20,8
68,8
6580
,070
9,04
3,80
920
,419
,253
14,2
08,6
05(4
4,27
3,76
3) 2
0,34
6,83
9 5
4,48
3,44
6 3,
301,
680
- R
esid
entia
l Mor
tgag
es17
,947
,709
--
-18
,540
,616
-(5
92,9
06)
17,
947,
710
-
563,
760
- O
ther
s19
9,91
5-
100,
000
839,
440
330,
293
84,5
00(1
,308
,467
) 4
5,76
6 1
54,1
49
132,
597
Net
loan
s an
d re
ceiv
able
s to
oth
er c
usto
mer
s42
5,68
1,83
258
,642
,448
4,79
6,18
723
4,90
3,55
822
0,53
7,98
919
1,56
6,81
1(4
33,7
29,0
12)
276
,717
,981
1
48,9
63,8
52
17,9
31,4
69Fi
nanc
ial a
sset
s at
am
ortis
ed c
ost -
deb
t and
ot
her i
nstr
umen
ts44
,711
,640
--
--
--
-
44,
711,
640
958,
722
Fina
ncia
l ass
ets
mea
sure
d at
fair
valu
e th
roug
h ot
her c
ompr
ehen
sive
inco
me
108,
762,
972
--
--
--
-
108
,762
,972
-

INSIDE INSIGHT FINANCIAL STATEMENTS
275
NOTES TO THE FINANCIAL STATEMENTS
56.3.4.12 Commitments and contingencies
The table below shows maximum credit risk exposure of the Group on commitments and contingencies.
The maximum exposure to credit risk relating to financial commitments and contingencies is the maximum amount the Group has to pay if the commitments and contingencies are called upon.
BANK GROUP
2021 2020 2021 2020LKR ’000 LKR ’000 LKR ’000 LKR ’000
Guarantees and bonds 64,823,371 51,715,581 64,677,420 51,669,631Shipping guarantees 14,097,117 9,054,119 14,097,117 9,054,119Advance documents endorsed 5,184,785 1,219,377 5,184,785 1,219,377Letters of credit 24,253,102 18,316,091 24,253,102 18,316,091Acceptances 27,941,045 14,770,945 27,941,045 14,770,945Undrawn overdrafts and credit cards 36,290,899 31,824,953 35,931,386 31,690,162Commitments 89,079,537 89,967,534 89,490,957 90,252,408Forward exchange contracts 50,402,578 127,080,926 50,402,578 127,080,925Total 312,072,435 343,949,526 311,978,390 344,053,658
56.3.4.13 Offsetting of financial assets & liabilities
Financial assets and financial liabilities are offset and the net amount is presented in the Statement of Financial Position when the Group have a right to set off the recognised amounts and it intends either to settle on a net basis or to realise the asset and settle the liability simultaneously.
Financial assets & liabilities that are not subject to offsetting
Amounts that do not qualify for offsetting in the Statements of Financial Position include netting arrangements that only permit outstanding transactions with the same counterparty to be offset in an event of default or occurrence of the predetermined events. Such netting arrangements include repurchase agreements and other similar secured lending and borrowing arrangements.
The amount of the financial collateral received or pledged subject to netting arrangements but not qualified for offsetting are disclosed below.
2021 2020
Gross Amounts
Amount Subject to
Netting but do not qualify for
Offsetting
Net Amount
Gross Amounts
Amount Subject to
Netting but do not qualify for
Offsetting
NetAmount
LKR ’000 LKR ’000 LKR ’000 LKR ’000 LKR ’000 LKR ’000
Financial AssetsFinancial assets at amortised cost- loans and receivables to other customers 132,658,220 79,274,214 53,384,006 95,829,989 58,642,447 37,187,542
Financial LiabilitiesDue to debt securities holders 1,341,060 1,438,595 (97,535) 1,500,007 1,476,113 23,894
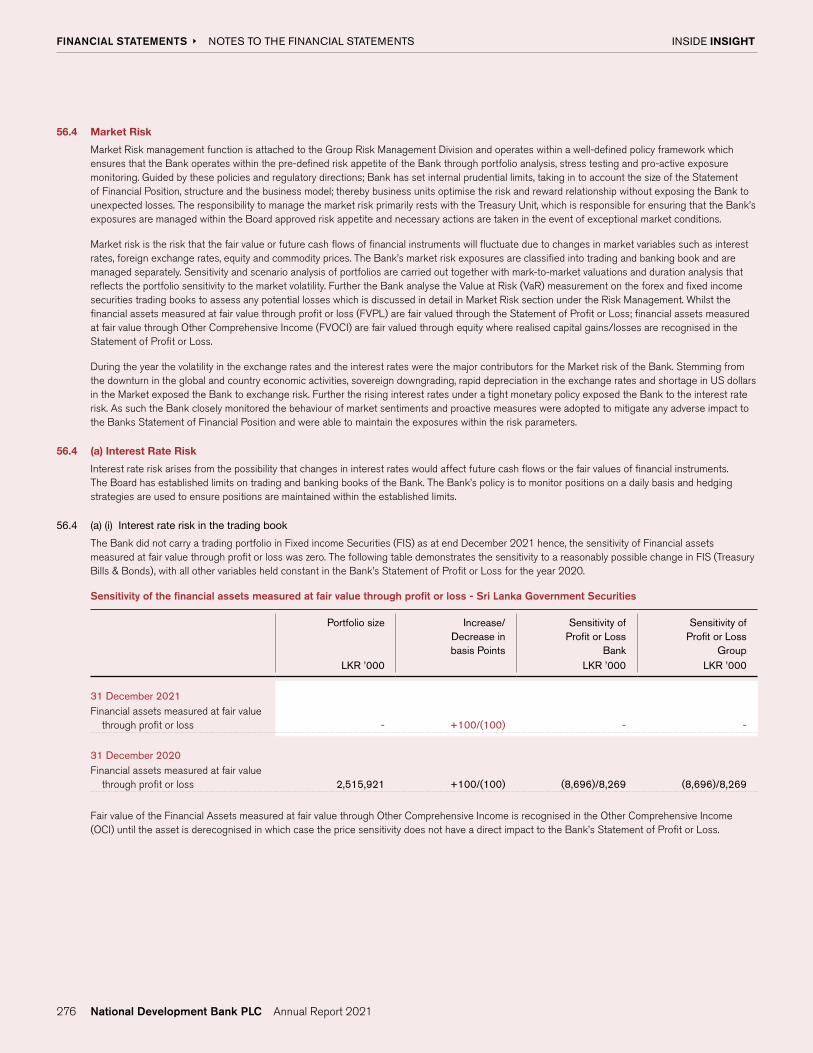
INSIDE INSIGHT FINANCIAL STATEMENTS
276
NOTES TO THE FINANCIAL STATEMENTS
56.4 Market Risk
Market Risk management function is attached to the Group Risk Management Division and operates within a well-defined policy framework which ensures that the Bank operates within the pre-defined risk appetite of the Bank through portfolio analysis, stress testing and pro-active exposure monitoring. Guided by these policies and regulatory directions; Bank has set internal prudential limits, taking in to account the size of the Statement of Financial Position, structure and the business model; thereby business units optimise the risk and reward relationship without exposing the Bank to unexpected losses. The responsibility to manage the market risk primarily rests with the Treasury Unit, which is responsible for ensuring that the Bank’s exposures are managed within the Board approved risk appetite and necessary actions are taken in the event of exceptional market conditions.
Market risk is the risk that the fair value or future cash flows of financial instruments will fluctuate due to changes in market variables such as interest rates, foreign exchange rates, equity and commodity prices. The Bank’s market risk exposures are classified into trading and banking book and are managed separately. Sensitivity and scenario analysis of portfolios are carried out together with mark-to-market valuations and duration analysis that reflects the portfolio sensitivity to the market volatility. Further the Bank analyse the Value at Risk (VaR) measurement on the forex and fixed income securities trading books to assess any potential losses which is discussed in detail in Market Risk section under the Risk Management. Whilst the financial assets measured at fair value through profit or loss (FVPL) are fair valued through the Statement of Profit or Loss; financial assets measured at fair value through Other Comprehensive Income (FVOCI) are fair valued through equity where realised capital gains/losses are recognised in the Statement of Profit or Loss.
During the year the volatility in the exchange rates and the interest rates were the major contributors for the Market risk of the Bank. Stemming from the downturn in the global and country economic activities, sovereign downgrading, rapid depreciation in the exchange rates and shortage in US dollars in the Market exposed the Bank to exchange risk. Further the rising interest rates under a tight monetary policy exposed the Bank to the interest rate risk. As such the Bank closely monitored the behaviour of market sentiments and proactive measures were adopted to mitigate any adverse impact to the Banks Statement of Financial Position and were able to maintain the exposures within the risk parameters.
56.4 (a) Interest Rate Risk
Interest rate risk arises from the possibility that changes in interest rates would affect future cash flows or the fair values of financial instruments. The Board has established limits on trading and banking books of the Bank. The Bank’s policy is to monitor positions on a daily basis and hedging strategies are used to ensure positions are maintained within the established limits.
56.4 (a) (i) Interest rate risk in the trading book
The Bank did not carry a trading portfolio in Fixed income Securities (FIS) as at end December 2021 hence, the sensitivity of Financial assets measured at fair value through profit or loss was zero. The following table demonstrates the sensitivity to a reasonably possible change in FIS (Treasury Bills & Bonds), with all other variables held constant in the Bank’s Statement of Profit or Loss for the year 2020.
Sensitivity of the financial assets measured at fair value through profit or loss - Sri Lanka Government Securities
Portfolio size Increase/ Decrease in basis Points
Sensitivity of Profit or Loss
Bank
Sensitivity of Profit or Loss
GroupLKR ’000 LKR ’000 LKR ’000
31 December 2021Financial assets measured at fair value
through profit or loss - +100/(100) - -
31 December 2020Financial assets measured at fair value
through profit or loss 2,515,921 +100/(100) (8,696)/8,269 (8,696)/8,269
Fair value of the Financial Assets measured at fair value through Other Comprehensive Income is recognised in the Other Comprehensive Income (OCI) until the asset is derecognised in which case the price sensitivity does not have a direct impact to the Bank’s Statement of Profit or Loss.

INSIDE INSIGHT FINANCIAL STATEMENTS
277
NOTES TO THE FINANCIAL STATEMENTS
Sensitivity of the financial assets measured at fair value though Other Comprehensive Income - Sri Lanka Government Securities
Portfolio size Increase/ Decrease in basis Points
Sensitivity on Bank
Sensitivity on Group
31 December 2021 LKR ’000 LKR ’000 LKR ’000
Financial assets measured at fair value though Other Comprehensive Income 89,942,368 +100/(100) (496,905)/510,652 (496,905)/510,652
Portfolio size Increase/ Decrease in basis Points
Sensitivity on Bank
Sensitivity on Group
31 December 2020 LKR ’000 LKR ’000 LKR ’000
Financial assets measured at fair value though Other Comprehensive Income 107,206,915 +100/(100) (1,237,632)/1,275,139 (1,237,632)/1,275,139
56.4 (a) (ii) Interest Rate risk in the banking book
The table below analyses the Bank’s and the Group’s interest rate risk exposure on financial assets and liabilities as at 31 December 2021.
The sensitivity of the Statement of Profit or Loss is the effect of the assumed changes in interest rates on the profit or loss for a year, based on the interest rate sensitive assets and liabilities as at 31.12.2021.
BANK
On Demand Less than 3 months
3 - 12 months
1 - 5 years
Over 5 years
Non Interest Bearing
Carrying Amount
31 December 2021 LKR '000 LKR '000 LKR '000 LKR '000 LKR '000 LKR '000 LKR '000
Financial AssetsCash and cash equivalents - - - - - 13,411,819 13,411,819 Balances with the Central Bank of Sri Lanka - - - - - 16,403,362 16,403,362
Placements with banks 1,320 8,297,884 - - - - 8,299,204
Financial assets recognised through profit or loss - measured at fair value 2,441,833 - - - - - 2,441,833
Financial assets at amortised cost - loans and receivables to other customers 114,216,828 120,637,067 83,255,110 141,290,688 43,109,765 502,509,458
Financial assets at amortised cost - Debt and other instruments 285,508 9,110,962 4,277,171 28,943,819 11,645,515 54,262,975
Financial assets measured at fair value through other comprehensive income 88,521,120 - - - - 1,031,076 89,552,196
Other financial assets 1,446,327 - - - - - 1,446,327
Total Financial Assets 206,912,936 138,045,913 87,532,281 170,234,507 54,755,280 30,846,257 688,327,373
Financial LiabilitiesDue to Banks 782,758 18,085,885 5,902,000 - - - 24,770,644
Financial Liabilities at amortised cost Due to depositors 116,370,729 176,073,996 173,886,726 43,538,843 2,484,549 39,684,949 552,039,792
Due to debt securities holders 10,931 1,269,900 60,229 - - - 1,341,060
Due to other borrowers 90,723 5,574,997 9,463,486 5,899,264 4,200,394 - 25,228,865
Debt securities issued 738,380 - - 27,123,603 98,748 - 27,960,731
Other financial liabilities 2,911,821 - - - - - 2,911,821
Total Financial Liabilities 120,905,342 201,004,778 189,312,441 76,561,710 6,783,691 39,684,949 634,252,912
Total Interest Sensitivity Gap 86,007,594 (62,958,865) (101,780,160) 93,672,797 47,971,589 (8,838,692) 54,074,460

INSIDE INSIGHT FINANCIAL STATEMENTS
278
NOTES TO THE FINANCIAL STATEMENTS
56.4 (a) (ii) Interest Rate risk in the banking book (Contd.)
BANK
On Demand Less than 3 months
3 - 12 months
1 - 5 years
Over 5 years
Non Interest Bearing
Carrying Amount
31 December 2020 LKR '000 LKR '000 LKR '000 LKR '000 LKR '000 LKR '000 LKR '000
Financial AssetsCash and cash equivalents - - - - - 10,487,608 10,487,608Balances with the Central Bank of Sri Lanka - - - - - 6,812,099 6,812,099Placements with banks 1,533 12,400,000 - - - - 12,401,533Financial assets recognised through profit or loss
- measured at fair value 5,574,175 - - - - - 5,574,175Financial assets at amortised cost
- loans and receivables to other customers 83,810,677 103,946,555 63,929,534 132,392,428 41,526,314 - 425,605,508Financial assets at amortised cost
- debt and other instruments 144,491 160,583 1,846,469 30,830,242 11,729,855 - 44,711,640Financial assets measured at fair value through
other comprehensive income 107,546,298 - - - - 1,046,885 108,593,183Other financial assets 129,469 - - - - - 129,469Total Financial Assets 197,206,643 116,507,138 65,776,003 163,222,670 53,256,169 18,346,592 614,315,215
Financial LiabilitiesDue to banks 585,471 13,435,847 10,152,000 - - - 24,173,318Financial Liabilities at amortised cost Due to depositors 102,894,655 138,990,381 190,975,893 27,799,750 1,831,280 27,786,167 490,278,126 Due to debt securities holders 16,549 1,345,148 138,310 - - - 1,500,007 Due to other borrowers 11,576,492 5,888,613 9,735,100 1,589,578 5,494,326 - 34,284,109Debt securities issued 641,887 - - 19,239,004 - - 19,880,891Other financial liabilities 3,117,943 - - - - - 3,117,943Total Financial Liabilities 118,832,997 159,659,989 211,001,303 48,628,332 7,325,606 27,786,167 573,234,394Total Interest Sensitivity Gap 78,373,646 (43,152,851) (145,225,300) 114,594,338 45,930,563 (9,439,575) 41,080,821
GROUP
On Demand Less than 3 months
3 - 12 months
1 - 5 years
Over 5 years
Non Interest Bearing
Carrying Amount
31 December 2021 LKR '000 LKR '000 LKR '000 LKR '000 LKR '000 LKR '000 LKR '000
Financial AssetsCash and cash equivalents - - - - - 13,765,270 13,765,270Balances with the Central Bank of Sri Lanka - - - - - 16,403,362 16,403,362Placements with banks 1,320 8,297,884 - - - - 8,299,403Financial assets recognised through profit or loss
- measured at fair value 4,784,124 - - - - - 4,784,124Financial assets at amortised cost
- loans and receivables to other customers 113,975,837 120,642,159 83,269,601 141,336,684 43,120,505 502,344,786Financial assets at amortised cost
- debt and other instruments 285,508 9,110,962 4,277,171 28,943,819 11,645,515 54,262,976Financial assets measured at fair value through
other comprehensive income 88,521,120 - - - - 1,175,491 89,696,611Other financial assets 2,218,351 - - - - - 2,218,351Total Financial Assets 209,786,260 138,051,005 87,546,772 170,280,503 54,766,020 31,344,123 691,774,882
Financial LiabilitiesDue to banks 782,759 18,085,885 5,952,514 - - - 24,821,158Financial liabilities at amortised cost due to depositors 115,805,054 175,856,474 173,886,726 43,538,843 2,484,549 39,684,949 551,256,595 due to debt securities holders 10,931 1,269,900 60,229 - - - 1,341,060 due to other borrowers 90,723 5,574,997 9,463,486 5,899,264 4,200,394 - 25,228,865Debt securities issued 738,380 - - 27,123,603 98748 - 27,960,731Other financial liabilities 3,252,900 - - - - - 3,252,900 Total Financial Liabilities 120,680,747 200,787,256 189,362,955 76,561,710 6,783,691 39,684,949 633,861,307Total Interest Sensitivity Gap 89,105,513 (62,736,250) (101,816,183) 93,718,792 47,982,329 (8,340,826) 57,913,575

INSIDE INSIGHT FINANCIAL STATEMENTS
279
NOTES TO THE FINANCIAL STATEMENTS
GROUP
On Demand Less than 3 months
3 - 12 months
1 - 5 years
Over 5 years
Non Interest Bearing
Carrying Amount
31 December 2020 LKR '000 LKR '000 LKR '000 LKR '000 LKR '000 LKR '000 LKR '000
Financial AssetsCash and cash equivalents - - - - - 10,778,947 10,778,947
Balances with the Central Bank of Sri Lanka - - - - - 6,812,099 6,812,099
Placements with banks 1,533 12,400,000 - - - - 12,401,533
Financial assets recognised through profit or loss- measured at fair value 7,713,222 - - - - - 7,713,222
Financial assets at amortised cost - loans and receivables to other customers 83,793,578 103,951,884 63,945,118 132,448,319 41,542,933 - 425,681,832
Financial assets at amortised cost - debt and other instruments 144,489 160,585 1,846,469 30,830,242 11,729,855 - 44,711,640
Financial assets measured at fair value through other comprehensive income 107,716,087 - - - - 1,046,885 108,762,972
Other financial assets 441,488 - - - - - 441,488
Total Financial Assets 199,810,397 116,512,469 65,791,587 163,278,561 53,272,788 18,637,931 617,303,733
Financial LiabilitiesDue to banks 585,471 13,435,847 10,152,000 - - - 24,173,318
Financial liabilities at amortised cost
due to depositors 102,532,652 138,733,004 190,975,893 27,799,750 1,831,280 27,786,167 489,658,746
due to debt securities holders 16,549 1,345,148 138,310 - - - 1,500,007
due to other borrowers 11,576,491 5,888,613 9,735,101 1,589,578 5,494,326 - 34,284,109
Debt securities issued 641,887 - - 19,239,004 - - 19,880,891
Other financial liabilities 3,458,397 - - - - - 3,458,397
Total Financial Liabilities 118,811,447 159,402,612 211,001,304 48,628,332 7,325,606 27,786,167 572,955,468
Total Interest Sensitivity Gap 80,998,950 (42,890,143) (145,209,717) 114,650,229 45,947,182 (9,148,236) 44,348,265
56.4 (b) Mark to market valuation
The Sri Lanka Government Securities portfolio classified as Financial Assets recognised at fair value through profit or loss, Financial Assets measured at fair value through Other Comprehensive Income and the foreign exchange positions are subject to mark to market valuation on a daily basis to derive the economic value of positions.
Mark to Market results are being monitored against the Board approved stop-loss limits on a daily basis and reviewed by ALCO on a monthly basis and at IRMC on a quarterly basis to assess the portfolio performance and investment decisions.
56.4 (c) Foreign exchange risk
Foreign exchange risk is the risk that the value of a financial instrument denominated in foreign currency will fluctuate due to changes in exchange rates other than the functional currency in which they are measured. Board approved limits are in place on currency positions and are monitored on a daily basis and hedging strategies are used to ensure positions are maintained within established limits.
The method of recognising the resulting fair value gain or loss depends on whether the derivative is designated as a hedging instrument and if so, the nature of the item being hedged.
The table below indicates the currencies to which the Bank had significant exposure as at 31 December 2021 and 31 December 2020 on its currency exposures. The analysis calculates the sensitivity of each currency position to the increase in the exchange rate against the Sri Lankan rupee (functional currency) with all other variables held constant in the Statement of Profit or Loss and Equity. A negative amount in the table reflects a potential net reduction in the Statement of Profit or Loss or Equity, while a positive amount reflects a net potential increase depending on the side of the currency position.

INSIDE INSIGHT FINANCIAL STATEMENTS
280
56.4 (c) Foreign exchange risk (Contd.)
An equivalent decrease in the currencies given below against the Sri Lankan rupee would have resulted in an equivalent but opposite impact.
2021 2020
CurrencySpot Rate
ShockEffect on
profitEffect on
equityEffect on
profitEffect on
equity% LKR ’000 LKR ’000 LKR ’000 LKR ’000
USD 2.50 (50,646) (50,646) (12,698) (12,698)GBP 2.50 1,916 1,916 (647) (647)EUR 2.50 53 53 (346) (346)JPY 2.50 6 6 (128) (128)AUD 2.50 (188) (188) (326) (326)
With regard to the Group companies, the investment in the Emerald Fund by NDB Capital Holdings Limited would result in a potential net reduction or increase of LKR 21Mn to a similar sensitivity depending on the movement of the future exchange rates.
56.4 (d) Price Risk
Equity price risk
Equity price risk is the risk that the fair value of Financial Assets measured at fair value through profit or loss and Financial Assets measured at fair value through other comprehensive income, decreases as a result of changes in the level of equity indices and individual stocks. The following table demonstrates the sensitivity to a reasonably possible change in quoted equity indices, with all other variables held constant on the Bank’s and the Group’s Statement of Profit or Loss.
2021
Magnitude of shock & the fall in Value of Equities - LKR ‘000
Entity Portfolio Scenario 1 Scenario 2 Scenario 3Value 5% 10% 15%
Bank 1,014,507 50,725 101,451 152,176Group 1,345,941 68,036 136,072 204,108
2020
Magnitude of shock & the fall in Value of Equities - LKR ‘000
Entity Portfolio Scenario 1 Scenario 2 Scenario 3Value 5% 10% 15%
Bank 1,030,317 51,516 103,032 154,548Group 1,194,766 59,738 119,477 179,215
Sensitivity of the unit trust investments
The Bank and the Group could have the following sensitivity due to an adverse impact in the unit trust prices. The impact is monitored under three scenarios mild, moderate and adverse conditions.
2021
Magnitude of shock & the fall in Value of Units - LKR ‘000
Entity Portfolio Scenario 1 Scenario 2 Scenario 3Value 5% 10% 15%
Bank 2,441,833 122,092 244,183 366,275Group 3,410,520 170,526 341,052 511,578
NOTES TO THE FINANCIAL STATEMENTS

INSIDE INSIGHT FINANCIAL STATEMENTS
281
2020
Magnitude of shock & the fall in Value of Equities- LKR ‘000
Entity Portfolio Scenario 1 Scenario 2 Scenario 3Value 5% 10% 15%
Bank 3,061,424 153,071 306,142 459,214 Group 3,978,189 186,468 372,936 559,405
56.4 (e) Commodity price risk
The Bank did not hold a commodity position as at 31 December 2021, hence the Bank was insensitive for commodity price risk.
56.4 (f) Liquidity risk
Liquidity risk is defined as the risk that the Bank would encounter difficulty in meeting its obligations associated with financial liabilities that are settled by delivering cash or another financial asset. Liquidity risk arises due to the Bank’s inability to meet its payment obligations as when they fall due under both normal and stressed circumstances.
The Bank has set forth policies on Liquidity Risk Management and a Liquidity Contingency Funding Plan approved by the Board for effective management of liquidity. In addition to the regulatory limits on liquidity, the Bank’s internal prudential limits framework ensures that the exposures are managed and monitored at prudent levels.
In accordance with the Bank’s risk management policy, the liquidity positions are assessed /stressed and managed under a variety of scenarios, giving due consideration to stress factors relating to both the market and the Bank. This ensures the maintenance of liquidity ratios at prudential levels. Liquid assets consist of cash, call money lending, balances with banks, short-term bank deposits and liquid debt securities available for immediate sale. The Bank is in possession of reciprocal Liquidity Contingency Funding agreements signed up with identified Licenced Commercial Banks to deal in crisis situations.
With the drop in economic activities a lower demand for credit was witnessed that created an excess liquidity position for the Bank. Hence the LKR liquidity position was maintained at a strong level. However as discussed under Market Risk section above the foreign currency liquidity position was under stress and there were many systemic triggers that gave indications of potential stresses on foreign currency liquidity which was managed cautiously. In this back drop, the Bank simulated the Liquidity Contingency Funding Plan of the Bank to assess the situation and decisions were taken on the action required to effectively manage the liquidity position of the Bank.
However, the Bank’s loan assets grew by 19% during the year to 526 Bn versus growth in industry portfolio of 15% increasing the Bank’s market share in terms of loans and advances from 4.9% to 5%. The Bank maintained a Statement of Financial Position growth of 12% as at 31.12.2021.
The table below summarises the maturity profile of the undiscounted cash flows of the Financial Assets and Financial Liabilities of the Bank and Group as at 31 December 2021 and 31 December 2020.
NOTES TO THE FINANCIAL STATEMENTS

INSIDE INSIGHT FINANCIAL STATEMENTS
282
56.4 (f) Liquidity Risk (Contd.)
Contractual maturities of undiscounted cash flows of financial assets and liabilities
The Bank managed its net funding requirements effectively with deposit rollover rates above 80% in local currency and foreign currency and overall surplus liquidity position.
BANK
On Demand
Trading Derivatives
Less than 3 months
3 - 12 months
1-5 years
Over 5 years
Total
31 December 2021 LKR '000 LKR '000 LKR '000 LKR '000 LKR '000 LKR '000 LKR '000
Financial AssetsCash and cash equivalents 13,411,819 - - - - - 13,411,819Balances with the Central Bank of Sri Lanka 16,403,362 - - - - - 16,403,362Less: Restricted balance (16,403,362) - - - - - (16,403,362)Placements with banks - - 8,299,403 - - - 8,299,403Derivative Financial Instruments - 1,338,204 - - - - 1,338,204Financial assets recognised through profit or loss
- measured at fair value 2,441,833 - - - - - 2,441,833Financial assets at amortised cost
- loans and receivables to other customers 120,715,572 - 124,224,123 91,907,746 181,992,256 64,403,271 583,242,968Financial assets at amortised cost
- debt and other instruments 3,062 - 12,307,015 6,175,045 37,713,385 14,568,898 70,767,405Financial assets measured at fair value through other
comprehensive income 89,552,196 - - - - - 89,552,196Other financial assets 1,446,327 - - - - - 1,446,327Total undiscounted financial assets 227,570,809 1,338,204 144,830,542 98,082,791 219,705,641 78,972,169 770,500,156
Financial LiabilitiesDue to Banks - - 18,745,289 6,326,733 - - 25,072,022Derivative Financial Instruments - 1,048,644 - - - - 1,048,644Financial Liabilities at amortised cost due to depositors 145,744,046 - 181,176,756 186,255,054 54,986,623 3,164,824 571,327,304 due to debt securities holders - - 1,284,100 64,557 - - 1,348,657 due to other borrowers - - 5,401,275 10,270,882 7,859,602 5,021,668 28,553,427Debt securities issued - - 685,601 2,662,547 36,307,831 143,844 39,799,825Other financial liabilities 2,911,821 - - - - - 2,911,821Total undiscounted financial liabilities 148,655,867 1,048,644 207,293,022 205,579,773 99,154,056 8,330,336 670,061,700Net undiscounted financial assets and liabilities 78,914,942 289,560 (62,451,115) (107,496,983) 120,551,585 70,641,833 100,438,456
BANK
On Demand
Trading Derivatives
Less than 3 months
3 - 12 months
1-5 years
Over 5 years
Total
31 December 2020 LKR '000 LKR '000 LKR '000 LKR '000 LKR '000 LKR '000 LKR '000
Financial AssetsCash and cash equivalents 10,487,608 - - - - - 10,487,608Balances with the Central Bank of Sri Lanka 6,812,099 - - - - - 6,812,099Less: Restricted balance (6,812,099) - - - - - (6,812,099)Placements with banks - - 12,401,533 - - - 12,401,533Derivative Financial Instruments - 1,429,470 - - - - 1,429,470Financial assets recognised through profit or loss
- measured at fair value 5,574,175 - - - - - 5,574,175Financial assets at amortised cost
- loans and receivables to other customers 88,543,708 - 107,432,091 72,229,421 175,635,242 64,399,345 508,239,807Financial assets at amortised cost
- debt and other instruments 5,564 - 1,356,271 3,673,089 39,528,109 15,483,258 60,046,291Financial assets measured at fair value through other
comprehensive income 108,593,183 - - - - - 108,593,183Other financial assets 129,469 - - - - - 129,469Total undiscounted financial assets 213,333,707 1,429,470 121,189,895 75,902,510 215,163,351 79,882,603 706,901,536
Financial LiabilitiesDue to Banks - - 13,861,632 10,540,646 - - 24,402,278Derivative Financial Instruments - 1,016,787 - - - - 1,016,787Financial liabilities at amortised cost due to depositors 120,673,825 - 144,025,640 203,172,371 36,602,148 2,412,251 506,886,235 due to debt securities holders - - 1,363,625 144,883 - - 1,508,508 due to other borrowers 11,492,886 - 7,044,269 8,901,804 3,739,501 6,191,145 37,369,605Debt securities issued - - 685,602 1,710,431 27,011,401 - 29,407,434Other financial liabilities 3,117,943 - - - - - 3,117,943Total undiscounted financial liabilities 135,284,654 1,016,787 166,980,768 224,470,135 67,353,050 8,603,396 603,708,790Net undiscounted financial assets and liabilities 78,049,053 412,683 (45,790,873) (148,567,625) 147,810,301 71,279,207 103,192,746
NOTES TO THE FINANCIAL STATEMENTS
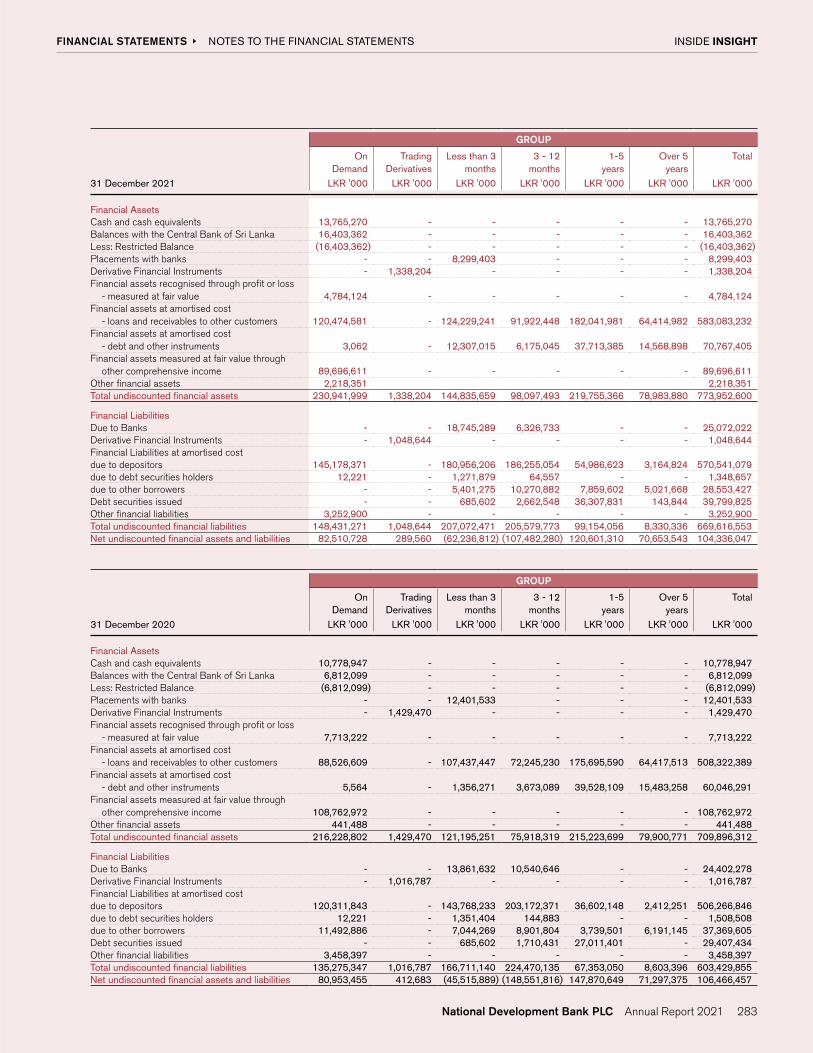
INSIDE INSIGHT FINANCIAL STATEMENTS
283
GROUP
On Demand
Trading Derivatives
Less than 3 months
3 - 12 months
1-5 years
Over 5 years
Total
31 December 2021 LKR '000 LKR '000 LKR '000 LKR '000 LKR '000 LKR '000 LKR '000
Financial AssetsCash and cash equivalents 13,765,270 - - - - - 13,765,270Balances with the Central Bank of Sri Lanka 16,403,362 - - - - - 16,403,362Less: Restricted Balance (16,403,362) - - - - - (16,403,362)Placements with banks - - 8,299,403 - - - 8,299,403Derivative Financial Instruments - 1,338,204 - - - - 1,338,204Financial assets recognised through profit or loss
- measured at fair value 4,784,124 - - - - - 4,784,124Financial assets at amortised cost
- loans and receivables to other customers 120,474,581 - 124,229,241 91,922,448 182,041,981 64,414,982 583,083,232Financial assets at amortised cost
- debt and other instruments 3,062 - 12,307,015 6,175,045 37,713,385 14,568,898 70,767,405Financial assets measured at fair value through
other comprehensive income 89,696,611 - - - - - 89,696,611Other financial assets 2,218,351 2,218,351Total undiscounted financial assets 230,941,999 1,338,204 144,835,659 98,097,493 219,755,366 78,983,880 773,952,600
Financial LiabilitiesDue to Banks - - 18,745,289 6,326,733 - - 25,072,022Derivative Financial Instruments - 1,048,644 - - - - 1,048,644Financial Liabilities at amortised costdue to depositors 145,178,371 - 180,956,206 186,255,054 54,986,623 3,164,824 570,541,079due to debt securities holders 12,221 - 1,271,879 64,557 - - 1,348,657due to other borrowers - - 5,401,275 10,270,882 7,859,602 5,021,668 28,553,427Debt securities issued - - 685,602 2,662,548 36,307,831 143,844 39,799,825Other financial liabilities 3,252,900 - - - - - 3,252,900Total undiscounted financial liabilities 148,431,271 1,048,644 207,072,471 205,579,773 99,154,056 8,330,336 669,616,553Net undiscounted financial assets and liabilities 82,510,728 289,560 (62,236,812) (107,482,280) 120,601,310 70,653,543 104,336,047
GROUP
On Demand
Trading Derivatives
Less than 3 months
3 - 12 months
1-5 years
Over 5 years
Total
31 December 2020 LKR '000 LKR '000 LKR '000 LKR '000 LKR '000 LKR '000 LKR '000
Financial AssetsCash and cash equivalents 10,778,947 - - - - - 10,778,947Balances with the Central Bank of Sri Lanka 6,812,099 - - - - - 6,812,099Less: Restricted Balance (6,812,099) - - - - - (6,812,099)Placements with banks - - 12,401,533 - - - 12,401,533Derivative Financial Instruments - 1,429,470 - - - - 1,429,470Financial assets recognised through profit or loss
- measured at fair value 7,713,222 - - - - - 7,713,222Financial assets at amortised cost
- loans and receivables to other customers 88,526,609 - 107,437,447 72,245,230 175,695,590 64,417,513 508,322,389Financial assets at amortised cost
- debt and other instruments 5,564 - 1,356,271 3,673,089 39,528,109 15,483,258 60,046,291Financial assets measured at fair value through
other comprehensive income 108,762,972 - - - - - 108,762,972Other financial assets 441,488 - - - - - 441,488Total undiscounted financial assets 216,228,802 1,429,470 121,195,251 75,918,319 215,223,699 79,900,771 709,896,312
Financial LiabilitiesDue to Banks - - 13,861,632 10,540,646 - - 24,402,278Derivative Financial Instruments - 1,016,787 - - - - 1,016,787Financial Liabilities at amortised costdue to depositors 120,311,843 - 143,768,233 203,172,371 36,602,148 2,412,251 506,266,846due to debt securities holders 12,221 - 1,351,404 144,883 - - 1,508,508due to other borrowers 11,492,886 - 7,044,269 8,901,804 3,739,501 6,191,145 37,369,605Debt securities issued - - 685,602 1,710,431 27,011,401 - 29,407,434Other financial liabilities 3,458,397 - - - - - 3,458,397Total undiscounted financial liabilities 135,275,347 1,016,787 166,711,140 224,470,135 67,353,050 8,603,396 603,429,855Net undiscounted financial assets and liabilities 80,953,455 412,683 (45,515,889) (148,551,816) 147,870,649 71,297,375 106,466,457
NOTES TO THE FINANCIAL STATEMENTS

INSIDE INSIGHT FINANCIAL STATEMENTS
284
56.4 (f) Liquidity Risk (Contd.)
Contractual maturities for commitments and contingencies
The Bank’s contingencies portfolio decreased by 9% during 2021 and stood at LKR 312 Bn as at 31 December 2021.
The table below summarises the maturity profile of the Commitments and Contingencies for the Bank and Group as at 31 December 2021 and 31 December 2020.
BANK
On Demand
Less than 3 months
3 - 12 months
1-5 years
Over 5 years
Total
31 December 2021 LKR ‘000 LKR ‘000 LKR ‘000 LKR ‘000 LKR ‘000 LKR ‘000
Undisbursed financing commitments 125,370,436 - - - - 125,370,436 Guarantees and performance bond - 16,274,536 28,999,636 19,549,198 19,281,902 84,105,273 Documentary credits - 16,835,816 7,417,286 - - 24,253,102 Forward exchange contracts - 38,281,195 12,121,383 - - 50,402,579 Acceptance - 20,319,635 7,571,334 50,076 - 27,941,045 Total 125,370,436 91,711,182 56,109,639 19,599,274 19,281,902 312,072,435
BANK
On Demand
Less than 3 months
3 - 12 months
1-5 years
Over 5 years
Total
31 December 2020 LKR ‘000 LKR ‘000 LKR ‘000 LKR ‘000 LKR ‘000 LKR ‘000
Undisbursed financing commitments 121,792,487 - - - - 121,792,487Guarantees and performance bond - 13,607,661 21,290,312 16,781,608 10,309,496 61,989,077Documentary credits - 14,366,489 3,949,602 - - 18,316,091Forward exchange contracts - 86,684,025 36,474,977 3,921,924 - 127,080,926Acceptance - 10,422,432 4,298,176 50,337 - 14,770,945Total 121,792,487 125,080,607 66,013,067 20,753,869 10,309,496 343,949,526
GROUP
On Demand
Less than 3 months
3 - 12 months
1-5 years
Over 5 years
Total
31 December 2021 LKR ‘000 LKR ‘000 LKR ‘000 LKR ‘000 LKR ‘000 LKR ‘000
Undisbursed financing commitments 125,422,344 - - - - 125,422,344 Guarantees and performance bond - 16,128,585 28,999,636 19,549,198 19,281,902 83,959,321 Documentary credits - 16,835,816 7,417,286 - - 24,253,102 Forward exchange contracts - 38,281,195 12,121,383 - - 50,402,579 Acceptance - 20,319,635 7,571,334 50,076 - 27,941,045 Total 125,422,344 91,565,231 56,109,640 19,599,274 19,281,902 311,978,390
GROUP
On Demand
Less than 3 months
3 - 12 months
1-5 years
Over 5 years
Total
31 December 2020 LKR ‘000 LKR ‘000 LKR ‘000 LKR ‘000 LKR ‘000 LKR ‘000
Undisbursed financing commitments 121,942,570 - - - - 121,942,570Guarantees and performance bond - 13,561,710 21,290,312 16,781,608 10,309,496 61,943,126Documentary credits - 14,366,489 3,949,602 - - 18,316,091Forward exchange contracts - 86,684,025 36,474,977 3,921,924 - 127,080,926Acceptance - 10,422,432 4,298,176 50,337 - 14,770,945Total 121,942,570 125,034,656 66,013,067 20,753,869 10,309,496 344,053,658
NOTES TO THE FINANCIAL STATEMENTS

INSIDE INSIGHT FINANCIAL STATEMENTS
285
56.5 Capital Management
Managing capital is a key focus area in the NDB Group’s strategic plan. All large credit proposals are evaluated with the required capital charge and lending decisions are taken on the basis of sufficient return on capital. Even the expansion projects in terms of property expansions and software purchases are evaluated against sufficient return of capital. The Group always strives to maintain a relatively higher level of capital to support the growth in business operations, by maintaining an effective balance between dividend distributions and retention of profits.
56.5.1 The Bank raised LKR 8 Bn via five and seven year, Basel III compliant – Tier 2 Listed, Rated, Unsecured, subordinated, and Redeemable Debentures with a non-viability conversion in November 2021 with the objectives of Improving and further strengthen the Capital Adequacy Ratio (CAR) in line with the Basel III guidelines of the Central Bank of Sri Lanka and facilitating the future expansion of business activities of the Bank.
56.5.2 The stated capital of the Bank increased by LKR 9.46 Bn, comprising of LKR 8 Bn raised through the Rights Issue and LKR 1.46 Bn, raised through the Private Placement with Norfund – the Norwegian Investment Fund for Developing Countries, strengthening Tier I equity capital of the Bank. Accordingly, the stated capital of the Bank increased to LKR 18.3 Bn as at 31 December 2021 (2020 - LKR 8.8 Bn).
56.5.2 Regulatory capital - BANK
Actual Required Actual Required2021 2021 2020 2020
LKR '000 LKR '000 LKR '000 LKR '000
Common Equity Tier 1 Capital 48,441,141 31,441,023 37,588,780 26,653,954Total Tier 1 Capital 48,441,141 38,696,644 37,588,780 32,804,867Tier 2 Capital Instruments 26,137,750 19,348,322 21,135,547 16,402,433Total Capital 74,578,891 58,044,966 58,724,327 49,207,300
Total Risk Weighted Assets 483,708,053 410,060,835
Common Equity Tier 1 Capital Ratio % 10% 6.5% 9.2% 6.5%Total Tier 1 Capital Ratio % 10% 8% 9.2% 8%Total Capital Ratio % 15.4% 12% 14.3% 12%
The detailed capital adequacy computations are given under Risk Management on pages 318 to 351.
NOTES TO THE FINANCIAL STATEMENTS
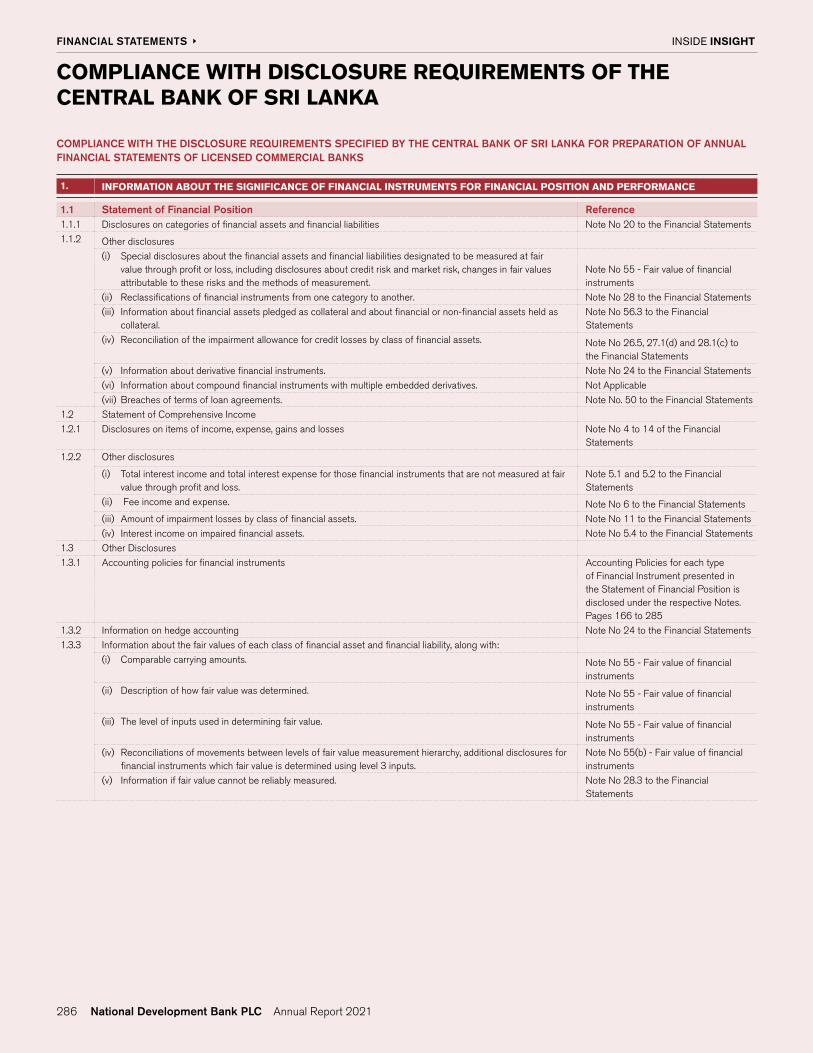
INSIDE INSIGHT FINANCIAL STATEMENTS
286
COMPLIANCE WITH DISCLOSURE REQUIREMENTS OF THE CENTRAL BANK OF SRI LANKA
COMPLIANCE WITH THE DISCLOSURE REQUIREMENTS SPECIFIED BY THE CENTRAL BANK OF SRI LANKA FOR PREPARATION OF ANNUAL FINANCIAL STATEMENTS OF LICENSED COMMERCIAL BANKS
1. INFORMATION ABOUT THE SIGNIFICANCE OF FINANCIAL INSTRUMENTS FOR FINANCIAL POSITION AND PERFORMANCE
1.1 Statement of Financial Position Reference1.1.1 Disclosures on categories of financial assets and financial liabilities Note No 20 to the Financial Statements
1.1.2 Other disclosures
(i) Special disclosures about the financial assets and financial liabilities designated to be measured at fair value through profit or loss, including disclosures about credit risk and market risk, changes in fair values attributable to these risks and the methods of measurement.
Note No 55 - Fair value of financial instruments
(ii) Reclassifications of financial instruments from one category to another. Note No 28 to the Financial Statements
(iii) Information about financial assets pledged as collateral and about financial or non-financial assets held as collateral.
Note No 56.3 to the Financial Statements
(iv) Reconciliation of the impairment allowance for credit losses by class of financial assets. Note No 26.5, 27.1(d) and 28.1(c) to the Financial Statements
(v) Information about derivative financial instruments. Note No 24 to the Financial Statements
(vi) Information about compound financial instruments with multiple embedded derivatives. Not Applicable
(vii) Breaches of terms of loan agreements. Note No. 50 to the Financial Statements
1.2 Statement of Comprehensive Income
1.2.1 Disclosures on items of income, expense, gains and losses Note No 4 to 14 of the Financial Statements
1.2.2 Other disclosures
(i) Total interest income and total interest expense for those financial instruments that are not measured at fair value through profit and loss.
Note 5.1 and 5.2 to the Financial Statements
(ii) Fee income and expense. Note No 6 to the Financial Statements
(iii) Amount of impairment losses by class of financial assets. Note No 11 to the Financial Statements
(iv) Interest income on impaired financial assets. Note No 5.4 to the Financial Statements
1.3 Other Disclosures
1.3.1 Accounting policies for financial instruments Accounting Policies for each type of Financial Instrument presented in the Statement of Financial Position is disclosed under the respective Notes. Pages 166 to 285
1.3.2 Information on hedge accounting Note No 24 to the Financial Statements
1.3.3 Information about the fair values of each class of financial asset and financial liability, along with:
(i) Comparable carrying amounts. Note No 55 - Fair value of financial instruments
(ii) Description of how fair value was determined. Note No 55 - Fair value of financial instruments
(iii) The level of inputs used in determining fair value. Note No 55 - Fair value of financial instruments
(iv) Reconciliations of movements between levels of fair value measurement hierarchy, additional disclosures for financial instruments which fair value is determined using level 3 inputs.
Note No 55(b) - Fair value of financial instruments
(v) Information if fair value cannot be reliably measured. Note No 28.3 to the Financial Statements

INSIDE INSIGHT FINANCIAL STATEMENTS
287
2. INFORMATION ABOUT THE NATURE AND EXTENT OF RISKS ARISING FROM FINANCIAL INSTRUMENTS
2.1 Qualitative Disclosures Reference2.1.1 Risk exposures for each type of financial instrument Note 56 - Risk Management of the
Financial Statements
2.1.2 Management's objectives, policies, and processes for managing those risks Note 56 - Risk Management of the Financial Statements
2.1.3 Changes from the prior period N/A
2.2 Quantitative Disclosures2.2.1
2.2.2
Summary of quantitative data about exposure to each risk at the reporting date. Note 56 - Risk Management of the Financial Statements
Disclosures about credit risk, liquidity risk, market risk, operational risk, interest rate risk and how these risks are managed.
Note 56 - Risk Management of the Financial Statements
(i) Credit Risk
(a) Maximum amount of exposure (before deducting the value of collateral), description of collateral, information about credit quality of financial assets that are neither past due nor impaired and information about credit quality of financial assets.
(b) For financial assets that are past due or impaired, disclosures on age, factors considered in determining as impaired and the description of collateral on each class of financial asset.
(c) Information about collateral or other credit enhancements obtained or called.
(d) Other disclosures, refer Basel III Minimum Disclosure Requirement under Pillar III as per the Banking Act Direction No. 1 of 2016 on Capital Requirements under Basel III for Licensed Banks.
Note 56.3 - Risk Management of the Financial Statements
(ii) Liquidity Risk
(a) A maturity analysis of financial assets and liabilities.
(b) Description of approach to risk management.
(c) Other disclosures, refer Basel III Minimum Disclosure Requirement under Pillar III as per the Banking Act Direction No. 1 of 2016 on Capital Requirements under Basel III for Licensed Banks.
Note 56.4.(f) - Liquidity Risk of the Financial Statements
(iii) Market Risk
(a) A sensitivity analysis of each type of market risk to which the entity is exposed.
(b) Additional information, if the sensitivity analysis is not representative of the entity’s risk exposure.
(c) Other disclosures, refer Basel III Minimum Disclosure Requirement under Pillar III as per the Banking Act Direction No. 1 of 2016 on Capital Requirements under Basel III for Licensed Banks.
Note 56.4 - Market Risk of the Financial Statements
(iv) Operational Risk
Refer Basel III Minimum Disclosure Requirement under Pillar III as per the Banking Act Direction No. 1 of 2016 on Capital Requirements under Basel III for Licensed Banks.
Note 56.5 - Capital Management
(v) Equity risk in the Banking Book
(a) Qualitative disclosures
� Differentiation between holdings on which capital gains are expected and those taken under other objectives including for relationship and strategic reasons.
� Discussion of important policies covering the valuation and accounting of equity holdings in the banking book.
(b) Quantitative disclosures
� Value disclosed in the Statement of Financial Position of investments, as well as the fair value of those investments; for quoted securities, a comparison to publicly quoted share values where the share price is materially different from fair value.
� The types and nature of investments
� The cumulative realised gains/ (losses) arising from sales and liquidations in the reporting period.
Note 56.4.(d) - Equity Price Risk of the Financial Statements
(vi) Interest rate risk in the Banking Book
(a) Qualitative disclosures
� Nature of interest rate risk in the banking book (IRRBB) and key assumptions
(b) Quantitative disclosures
� The increase/ (decline) in earnings or economic value (or relevant measure used by management) for upward and downward rate shocks according to management’s method for measuring IRRBB, brokendown by currency (as relevant).
Note 56.4(a) - Interest Rate Risk of the Financial Statements
2.2.3 Information on concentration of risk Note 56.3.4.9 - Risk Management of the Financial Statements
COMPLIANCE WITH DISCLOSURE REQUIREMENTS OF THE CENTRAL BANK OF SRI LANKA
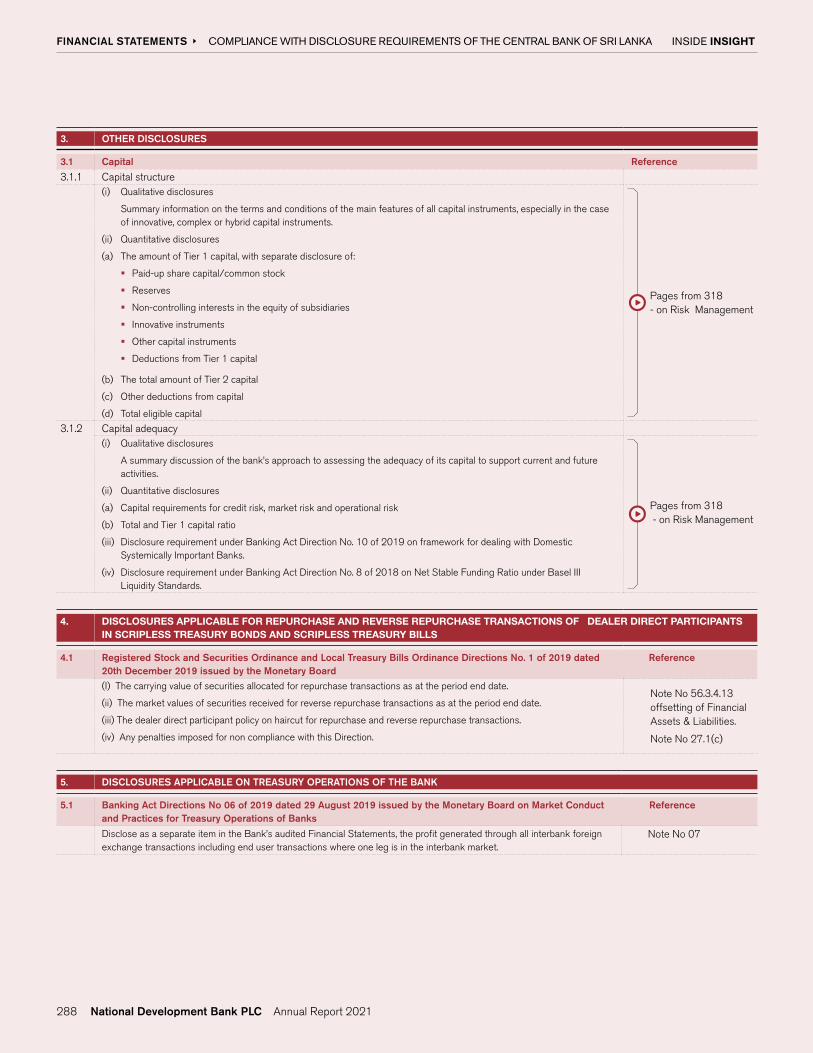
INSIDE INSIGHT FINANCIAL STATEMENTS
288
3. OTHER DISCLOSURES
3.1 Capital Reference
3.1.1 Capital structure(i) Qualitative disclosures
Summary information on the terms and conditions of the main features of all capital instruments, especially in the case of innovative, complex or hybrid capital instruments.
(ii) Quantitative disclosures
(a) The amount of Tier 1 capital, with separate disclosure of:
� Paid-up share capital/common stock
� Reserves
� Non-controlling interests in the equity of subsidiaries
� Innovative instruments
� Other capital instruments
� Deductions from Tier 1 capital
(b) The total amount of Tier 2 capital
(c) Other deductions from capital
(d) Total eligible capital
Pages from 318 - on Risk Management
3.1.2 Capital adequacy(i) Qualitative disclosures
A summary discussion of the bank’s approach to assessing the adequacy of its capital to support current and future activities.
(ii) Quantitative disclosures
(a) Capital requirements for credit risk, market risk and operational risk
(b) Total and Tier 1 capital ratio
(iii) Disclosure requirement under Banking Act Direction No. 10 of 2019 on framework for dealing with Domestic Systemically Important Banks.
(iv) Disclosure requirement under Banking Act Direction No. 8 of 2018 on Net Stable Funding Ratio under Basel III Liquidity Standards.
Pages from 318 - on Risk Management
4. DISCLOSURES APPLICABLE FOR REPURCHASE AND REVERSE REPURCHASE TRANSACTIONS OF DEALER DIRECT PARTICIPANTS IN SCRIPLESS TREASURY BONDS AND SCRIPLESS TREASURY BILLS
4.1 Registered Stock and Securities Ordinance and Local Treasury Bills Ordinance Directions No. 1 of 2019 dated 20th December 2019 issued by the Monetary Board
Reference
(I) The carrying value of securities allocated for repurchase transactions as at the period end date.
(ii) The market values of securities received for reverse repurchase transactions as at the period end date.
(iii) The dealer direct participant policy on haircut for repurchase and reverse repurchase transactions.
(iv) Any penalties imposed for non compliance with this Direction.
Note No 56.3.4.13 offsetting of Financial Assets & Liabilities.
Note No 27.1(c)
5. DISCLOSURES APPLICABLE ON TREASURY OPERATIONS OF THE BANK
5.1 Banking Act Directions No 06 of 2019 dated 29 August 2019 issued by the Monetary Board on Market Conduct and Practices for Treasury Operations of Banks
Reference
Disclose as a separate item in the Bank’s audited Financial Statements, the profit generated through all interbank foreign exchange transactions including end user transactions where one leg is in the interbank market.
Note No 07
COMPLIANCE WITH DISCLOSURE REQUIREMENTS OF THE CENTRAL BANK OF SRI LANKA

AWARDS WON BY THE BANK
Performance aspect
Award/s won
Overall
Excellence
• Global Finance World’s Best Bank Awards USA 2021 – Best Bank in
Sri Lanka [Third year]
• AsiaMoney Magazine - Country Best Bank Awards 2021 – Best
Digital Bank Sri Lanka
• ICCSL, Daily FT and CIMA Top 10 Most Admired Companies 2021 –
Winner [Third consecutive year]
• Global Banking & Finance Review UK 2021 – Best Financial
Services Group Sri Lanka [Fourth consecutive year]
• Global Business Review Magazine Award UAE 2021 – Best
Domestic Bank Sri Lanka
• World Business Outlook – Singapore 2021 – Best Domestic Bank Sri
Lanka
Excellence in
Digital Financial
Services
• Global Banking & Finance Review UK 2021 – Best Bank for Digital
Transformation Sri Lanka [Third consecutive year]
• Global Business Review Magazine Award UAE 2021 – Best Mobile
Banking App Sri Lanka
• Cosmopolitan The Daily - UK 2021 – Most Innovative Digital
Transformation Sri Lanka
• Global Business Outlook - UK 2021 – Most Innovative Digital
Banking Platform – NEOS Digital Banking Sri Lanka
• Finance Derivatives Awards - The Netherlands 2021 – Most
innovative Digital Solutions Provider Sri Lanka
Excellence in
Retail Banking
Products/
Services
• Asian Banking & Finance Magazine Singapore - Retail Banking
Awards 2021 Best Domestic Retail Bank of the Year Sri Lanka [Ninth
consecutive year]
• Global Business Review Magazine Award – UAE 2021 - Best Retail
Bank Sri Lanka
• International Business Magazine – UAE 2021 - Best Retail Bank Sri
Lanka [Second consecutive year]
• World Economic Magazine Awards – USA 2021 - Best Retail Bank
Sri Lanka
• BT Banking & Finance Award - UK 2021 - Best Consumer Financing
Product - Dream Maker Loan Sri Lanka
Excellence in
SME Banking
• Asian Banking & Finance Magazine Singapore - Retail Banking
Awards 2021 – SME Bank of the Year Sri Lanka [ Eighth year]
• Global Economics Awards - UK 2021 – Best MSME Development
Bank Sri Lanka
• World Economic Magazine Awards - USA 2021 – Best SME Bank Sri
Lanka
Excellence
in Corporate
Banking
• Asian Banking & Finance Magazine Singapore - Wholesale Banking
Awards 2021 – Best Domestic Cash Management of the Year Sri
Lanka [Fifth year]
• Global Business Review Magazine Award UAE 2021 – Best
Corporate Bank Sri Lanka
• International Business Magazine – UAE 2021 – Most Innovative
Corporate Bank Sri Lanka
• Finance Derivatives - The Netherlands 2021 – Best Commercial
Bank Sri Lanka
AWARDS & ACCOLADES 2021
Performance aspect
Award/s won
Excellence
in Project
Financing
• Asian Banking & Finance Magazine Singapore - Wholesale Banking
Awards 2021 - Best Domestic Project Finance Bank of the Year Sri
Lanka [Seventh consecutive year]
• Asian Banking & Finance Magazine Singapore – Corporate &
Investment Banking Awards 2021
• Project Infrastructure Finance Deal of the Year Sri Lanka
• Corporate Client initiative of the Year Sri Lanka [Third consecutive
year]
• Global Banking & Finance Review UK 2021 – Decade of Excellence
Project and Infrastructure Financing Sri Lanka [Fourth consecutive
year]
• Cosmopolitan The Daily - UK 2021 – Best Bank for Project
Financing Sri Lanka
• Finance Derivatives Awards - The Netherlands 2021 – Best Project
Financing Bank Sri Lanka
• International Finance Awards - UK 2021 – Best Project &
Infrastructure Finance Bank Sri Lanka
• PV Invest Tech Sri Lanka and Sri Lanka Annual Solar Awards 2021 –
Renewable Energy (RE) Financier of the Year
Excellence in
Islamic Banking
• International Finance Awards UK 2021 – Best Islamic Finance Bank
Sri Lanka
Excellence in
Empowering
the Women’s
Market Segment
• Global Banking & Finance Review - UK 2021 – Best Financial
Institution for Empowering Women in Business Sri Lanka
• Finance Derivatives - The Netherlands 2021 – Best Initiative
Empowering Women’s Market Segment “Sri Lanka Vanithabhimana”
Sri Lanka [Second consecutive year]
Excellence
in Corporate
Sustainability
• Ceylon Chamber of Commerce – Best Corporate Citizen
Sustainability Award 2021 - Ten Best Corporates [Seventh
consecutive year]
Excellence
in Best HR
Practices
• Women Friendly Workplaces Awards 2021 of CIMA Sri Lanka and
Satynmag.com – Honorable Mention
• Great Place To Work – Accreditation 2021/2022 [First local banking
institution to obtain Accreditation]
• EDGE Certification for Work-place Gender Equality – Certification
[First corporate in Sri Lanka to obtain Certification]
Excellence in Marketing & Sales
• Global Brands Awards - UK 2021
• Best Digital Banking Brand Sri Lanka
• Most Innovative Retail Banking Brand Sri Lanka
• Best Private Banking Brand Sri Lanka
• Top 50 Professional & Career Women Awards – Eleventh Edition Sri Lanka & Maldives 2021 – Positive Media Campaign on the Empowerment of Women - Sri Lanka Vanithabhimana (Joint win with & News First of Capital Maharaja Broadcasting Network)
• SLIM Digis 2.1 Awards 2021
• Grand Prix Award for Best Digital Marketing Campaign
• Gold Award for the Best Performance Marketing Campaign
• Gold Award for Best Use of Branded Content - No Money Medley - NEOS Digital Banking App
• The Economic Times Best Brands - Sri Lanka Edition 2021 - Winner
INSIDE INSIGHT INSIDE INSIGHT SUPPLEMENTARY INFORMATION
290

AWARDS WON BY GROUP COMPANIES
NDB Investment Bank Limited
• Euromoney Awards for Excellence 2021 – Sri Lanka’s Best Investment Bank [Tenth consecutive year]
• AsiaMoney Magazine – Country Best Bank Awards 2021 – Best Corporate and Investment Bank Sri Lanka [Fifth consecutive year]
• Cosmopolitan The Daily - UK – Best Investment Bank in Sri Lanka
• International Business Magazine – UAE 2021 Awards
• Best Investment Bank Sri Lanka
• Best Investment Banking Brand Sri Lanka
• Global Brands Awards 2021 – Most Trusted Investment Banking Brand Sri Lanka [Seventh consecutive year]
• Asian Banking & Finance Magazine - Singapore - Corporate & Investment Banking Awards 2021 – Corporate & Investment Bank of the Year- Sri Lanka [Third consecutive year]
Performance
aspect
Award/s won
Excellence in Investor Relations
• CFA Sri Lanka Capital Market Awards 2021 – Silver Award for Best Investor Relations
• Global Business Review Magazine Award - UAE 2021 – Best Investor Relations Bank Sri Lanka
• International Business Magazine – UAE 2021 – Best Investor Relations Bank Sri Lanka
• Global Business Magazine – UK 2021 – Best Investor Relations Bank Sri Lanka
Leadership Awards
• Global Banking & Finance Review - UK 2021 – Dimantha Seneviratne – Financial Services Group CEO of the Year Sri Lanka
• Global Economics Awards - UK 2021 – Dimantha Seneviratne – Outstanding Contribution Towards Banking Sector – Sri Lanka
• Finance Derivatives – The Netherlands 2021 – Dimantha Seneviratne – Best Banking CEO Sri Lanka
• 19th Asian HR Leadership Awards – India – 2021 – Dimantha Seneviratne – Winner – CEO of the Year (Banking Sector)
• Global Business Magazine - UK 2021 – Best Banking CEO of the Year Sri Lanka
• PV Invest Tech Sri Lanka and Sri Lanka Annual Solar Awards 2021 – Women Leadership & Business Excellence Award - Ms. Ishani Palliyaguru - Vice President - Project Finance and Corporate Credit Control
Excellence in Annual Reports Presentation
• The Institute of Chartered Accountants of Sri Lanka - 56th Annual Report Awards
• Gold Award - Integrated Reporting: Best Disclosure on Capital Management
• Silver Award - Integrated Reporting – Overall
• Bronze Award - Banking Institutions Category
• Bronze Award - Corporate Governance Disclosures
• CMA Excellence in Integrated Reporting Awards 2021
• Winner - Five Excellent Reports
• Best Integrated Report - Banking Sector [Third consecutive year]
• Bronze Award - Overall Second Runner-Up
• Winner - Best Disclosure on Materiality
• SAFA Best Presented Annual Report Awards
• Joint Winner – Integrated Reporting
• Certificate of Merit - Private Sector Banking Sector Institutions
• ACCA Sri Lanka Sustainability Reporting Awards 2021 – Joint Runner-Up - Banking Category
INSIDE INSIGHT INSIDE INSIGHT SUPPLEMENTARY INFORMATION AWARDS & ACCOLADES 2021
291

CORPORATE GOVERNANCE
STATEMENT OF COMPLIANCE - DIRECTION NO. 11 OF 2007 (AS AMENDED) ON CORPORATE GOVERNANCE ISSUED BY THE MONETARY BOARD OF THE CENTRAL BANK OF SRI LANKA (THE CORPORATE GOVERNANCE DIRECTION)
The Corporate Governance Direction provides processes and practices deemed to be the framework that facilitates the conduct of the banking business in a responsible and accountable manner so as to promote the safety and soundness of the Bank, thereby leading to the stability of the overall banking sector. The disclosures below reflect the Bank’s compliance with the Corporate Governance Direction under the following key principles:
1. The responsibilities of the Board; 5. The Chairman and Chief Executive Officer;
2. The Board’s composition; 6. Board appointed subcommittees;
3. Criteria for the assessment of the fitness and propriety of Directors; 7. Related Party Transactions; and
4. Management functions delegated by the Board; 8. Disclosures;
Rule No. Corporate Governance Principles Compliance Status
3 (1) Responsibilities of the Board
3 (1) (i) The Board has strengthened the security and the soundness of the Bank in the following manner:
a. Setting and communicating strategic objectives and corporate values
The Bank’s strategic plan for 2021-2025, Voyager 25 strategy (V 25) was reviewed and formally approved by the Board in August 2020 after detailed discussions had with the Senior Management of the Bank. In order to arrive at the strategic plan the Bank formed a cross functional team of internal staff to obtain their views. The new strategy was formally rolled out within the Bank during 2020.
During 2021 the Bank’s strategic plan was further reviewed to ensure it’s alignment to the economic conditions and challenges faced . In order to educate all staff on the V 25 strategy many proactive initiatives were implemented such as a dedicated website for all communications relating to V 25 strategy, regular email notifications to all staff on the miles stones and updates relating to V 25 and a listening wall which allows staff to provide feedback on V 25 in complete anonymity. During 2021 train the trainer programs were also launched to educate all staff on the concept, goals and objectives relating to V 25.
The Corporate values of the Bank are embedded in the Bank’s Compliance Policy and Code of Conduct which is communicated to all employees via the Bank’s intranet, through the induction programmes and refresher trainings.
b. Approving overall business strategy including risk policy and risk management
After detailed discussions held with the Leadership Team of the Bank the Bank’s overall business strategy for 2021-2025 was reviewed and approved by the Board in August 2020. In 2021 the Bank’s strategy was further reviewed.
The Bank has established an Integrated Risk Management Framework approved by the Board covering all risks. There are separate risk policies and risk management procedures with regard to credit risk, operational risk, and market and liquidity risk. The strategic risk is embedded in each of these procedures based on applicability.
Further the Bank has a Board approved risk appetite statement which is monitored by the Integrated Risk Management Committee (IRMC) and the Board on a quarterly basis. This has been further reviewed by the IRMC during the year 2021. The Bank has a Board approved Strategic Plan for 5 years with measurable Key Performance Indicators.
c Risk management
The Board is responsible for the overall risk framework of the Bank.
The IRMC appointed by the Board, reviews and recommends to the Board, the Bank’s risk policies and procedures defining the Bank’s risk appetite, identifying principal risks, setting governance structures and implementing policies and systems in line with the Integrated Risk Management Framework to measure, monitor and manage the principal risks of the Bank. The Board has approved risk management policies and procedures as reviewed and recommended by the IRMC, based on these parameters and as required by this Direction.
The following reports provide further insight in this regard:
The Risk Management Report on pages 318 to 351
The Board Integrated Risk Management Committee Report on pages 133 to 135
INSIDE INSIGHT INSIDE INSIGHT SUPPLEMENTARY INFORMATION
292

Rule No. Corporate Governance Principles Compliance Status
d. Communication with all stakeholders
The Bank has in place a Board approved Communication Policy aimed to encourage effective communication of corporate information relating to the Bank on its behalf covering all stakeholders including employees, customers, creditors, shareholders, general public and the regulators. This policy is reviewed regularly in order to reflect the best practices in communications.
Please refer page 121 of the Corporate Governance Report which illustrates the effective communication with the Bank’s stakeholders.
e. Internal control system and management information systems
The Board is assisted by the Board Audit Committee (BAC), which evaluates the adequacy and effectiveness of the internal control systems, and reviews internal control issues identified by the Bank’s Group Audit, External Auditor, regulatory authorities and the Management.
The MIS process of the Bank is continuously being improved. The Board also reviews the adequacy of the Bank’s Management Information Systems, based on the monthly MIS pack submitted to the Board each month.
f. Key Management Personnel (KMP)
Key Management Personnel (KMPs) of the Bank have been identified by the Board having considered the Banking Act Determination No. 1 of 2019 on officers performing executive functions of the Bank, and presently are the Leadership Team whose names are detailed on pages 24 to 26 of this Report.
g. Define areas of authority and key responsibilities for Directors and KMP
The Bank’s internal Code of Corporate Governance sets out a clear division of authority and responsibilities between the Directors and the KMPs. The Directors were set goals and targets for the year 2021. The duties and responsibilities of KMPs are documented in their respective job descriptions and scorecards. The Board evaluated the performance review objectives of the KMPs.
h. Oversight of affairs of the Bank by KMP
To enable the Board to discharge its stewardship and fiduciary responsibilities effectively it delegates authority to the Board committees to oversee specific responsibilities based on clearly defined terms of reference. The Board has delegated its authority in operational areas to the Senior Management led by CEO within clearly defined limits. The Board regularly interacts with the Bank’s KMPs through reports tabled at both Board and subcommittee meetings.
KMPs make presentations to the Board on matters under their purview and are also called in by the Board to explain matters relating to their areas.
Banking operations carried out in line with the Banks’ strategic objectives including any issues faced by the Bank are discussed on an ongoing basis at Board meetings.
The CEO at weekly meetings held with the Leadership Team updates them on key decision points taken by the Board.
i. Assess effectiveness of own governance practices
The Nominations Committee (NC) has been delegated the function of selection, nomination and election of Directors to the Board and KMPs.
The Bank’s internal Code of Corporate Governance clearly provides guidance on avoiding, managing and disclosing conflicts of interests. The Directors are required to provide a declaration yearly. The Directors’ interests are disclosed to the Board and Directors who have a particular interest have stepped out from discussions and abstained from voting in such a situation and he/she is not counted in the quorum.
Determination of weaknesses in the Board of Directors own governance practices and implementation of changes are addressed through the annual self-evaluation process among the Board members. Self-evaluations for the year 2021 have been collected and summarised by the Company Secretary and submitted to the Chairman for his review. The Chairman then discusses areas of weaknesses and recommends changes where necessary at a Board meeting in order to ensure that governance practices are continuously improved throughout the year.
j. Succession plan for KMP
The Succession Plan of the Bank was reviewed and approved by the Board at its meeting held in July 2020. k. Regular meetings with KMP
The KMPs make regular presentations or are called in for discussions at the meetings of the Board and its subcommittees on policy and other matters relating to their areas. Progress made towards corporate objectives is a regular agenda item for the Board and KMPs are regularly involved in Board level discussions on the same.
INSIDE INSIGHT INSIDE INSIGHT SUPPLEMENTARY INFORMATION CORPORATE GOVERNANCE
293

Rule No. Corporate Governance Principles Compliance Status
l. Regulatory environment and maintaining an effective relationship with the regulator
Circulars, directions and guidelines issued by the regulators are circulated to the Directors on a quarterly basis for their information. In 2021 all new laws and regulations that were issued and relevant to banking business were made available on the BoardPac together with an explanatory notes which detailed the key areas of impact. Further a snap shot of key regulatory changes during each quarter with status of compliance was provided to the Board.
The CEO meets with Central Bank officials at the monthly CEO’s meeting. The Chairman of the Bank and the Chairpersons of the Board subcommittees also meet with the CBSL officials.
Further, the Directors, the CEO and KMPs of the Bank maintain dialogue with the regulators on an ongoing basis and attend the Director’s forum arranged by the CBSL.
m. Hiring and oversight of External Auditors
Audit Committee Charter includes the functions of hiring and overseeing of the External Auditor. The Board Audit Committee (BAC) carries out the necessary due diligence regarding the hiring/evaluation of the External Auditor and makes recommendations to the Board. The appointment/re-appointment of the External Auditor is made at the Annual General Meeting.
Oversight of the External Auditor is carried out by the BAC and the Board is briefed of any concerns in this regard if required.
A formal evaluation of the External Auditors’ performance is completed annually by the BAC and conclusions together with any recommendations are discussed at Board level.
3 (1) (ii) Appointment of Chairman and CEO and defining and approving their functions and responsibilities
In line with the Direction, the Bank’s Board approved internal Code of Corporate Governance documents the functions and responsibilities of the Chairman and the CEO.
The Board has appointed the Chairman and CEO and has approved their functions. There is a clear division of responsibilities between the Chairman and the CEO.
3 (1) (iii) Regular Board meetings
Regular monthly Board meetings are held and special Board meetings are scheduled as and when the need arises. There have been 20 Board meetings during 2021 which included 8 special meetings. In addition, the subcommittees of the Board meet as and when necessary.
Each member of the Board brings different areas of expertise, skills and experience to the table which encourages a robust exchange of alternate views and ways of thinking.
Circulation of Board papers to obtain Board’s consent is minimised and resorted to only when absolutely necessary. These decisions are in any event later confirmed/ratified by the Board at the immediately succeeding Board meeting. 16 circular resolutions have been passed during 2021.
Please refer page 119 and 120 for Board and Board subcommittee meeting attendance respectively.
3 (1) (iv) Arrangements for Directors to include proposals in the agenda
All Directors are entitled to include matters and proposals in the agenda for Board meetings and this right has been entrenched in the Bank’s internal Code of Corporate Governance.
Monthly meetings are scheduled and informed to the Board at the beginning of each calendar year to enable submission of proposals in the agenda for regular meetings. This process supports the requirement detailed in this Direction and a Director may include a proposal (if required) in the agenda of a Board meeting.
3 (1) (v) Notice of Meetings
Monthly meetings are scheduled and informed to the Board at the beginning of each calendar year to provide Directors an opportunity to attend.
Formal notice of meetings, the agenda and Board papers related to each Board meeting are circulated at least 7 days in advance of the Board meeting. These documents are uploaded through a secure connection to the tablets of all Directors.
3 (1) (vi) Directors’ attendance
The Company Secretary monitors the attendance register to ensure compliance. All Directors have attended at least two thirds of the meetings held during the year 2021 and no Director has been absent for three consecutive meetings during 2021, if eligible to attend.
Attendance of Directors at Board meetings is detailed on page 119
INSIDE INSIGHT INSIDE INSIGHT SUPPLEMENTARY INFORMATION CORPORATE GOVERNANCE
294

Rule No. Corporate Governance Principles Compliance Status
3 (1) (vii) Appointment and setting responsibilities of the Company Secretary
The internal Code of Corporate Governance includes the responsibilities of the Company Secretary as specified in the statutes and other regulations.
The Company Secretary appointed by the Board is an Attorney at Law who satisfies the provision of Section 43 of the Banking Act. Please refer page 23 for a detailed profile and page 115 for duties and responsibilities of the Company Secretary.
3 (1) (viii) Directors’ access to advice and services of Company Secretary
The internal Code of Corporate Governance of the Bank includes a provision to enable all Directors to have access to the advice and services of the Company Secretary. For the year 2021, the Company Secretary has provided assistance to the Directors when requested.
3 (1) (ix) Maintenance of Board minutes
The Company Secretary maintains detailed Board minutes and circulates minutes to all Directors. The minutes are approved at the subsequent Board meetings. The Bank’s internal Code of Corporate Governance also provides that minutes are open for inspection at any reasonable time, upon reasonable notice given by any Director. Additionally, the Board has access to the past Board papers and Board minutes in their Board Pac.
3 (1) (x) Maintaining minutes with sufficient details to serve as a reference for regulators and supervisory authorities
A Board approved procedure is in place for recording the Board minutes by the Company Secretary.
The minutes contain adequate details appropriate to the matters dealt with. The minutes are read together with the corresponding Board papers, which supplement information in the minutes. All matters required to be minuted in terms of 3(1) (x) (a)–(f) are recorded in the minutes.
3 (1) (xi) Directors’ ability to seek independent professional advice
There is a process for Board members to obtain independent professional advice at the expense of the Bank. The Board has obtained professional advice during the year.
3 (1) (xii) Dealing with conflicts of interest
The Directors are conscious of their obligations to deal with situations where there is a conflict of interest in accordance with the Articles of Association of the Bank and the Corporate Governance Direction No 11 of 2007 (as amended).
The internal Code of Corporate Governance adopted by the Board, requires each Board member to determine whether he/she has a potential or actual conflict of interest. If a Director of the Bank has a conflict of interest in a matter to be considered by the Board, which the Board has determined to be material, such matters are disclosed and discussed at the Board meetings, where Independent Non-Executive Directors who have no material interest in the transaction, are present.
Further Directors abstain from participating in the discussion and voting on Board resolutions in relation to which such Directors or any of their close relation/s or a concern in which such Directors or any of their close relation/s have substantial interest, and/or are interested in. Further their votes are not counted in the quorum for the relevant agenda item at the Board meeting.
3 (1) (xiii) Formal schedule of matters reserved for Board decision
Board has a formal schedule of matters specifically reserved to it for decision to ensure that direction and control of the Bank is firmly under its authority.
3 (1) (xiv) Inform Central Bank on probable solvency issues
The Bank is aware of the requirement but the situation has not arisen within the year. A Solvency Statement is prepared quarterly and tabled at the IRMC and the Board.
The Bank also has an IRMC approved Liquidity Contingency Funding Plan in place.
3 (1) (xv) Capital adequacy
Monthly and quarterly compliance reports have been submitted to the Board which contains the Capital Adequacy Ratio (CAR). The Bank is fully compliant with the Capital Adequacy requirements stipulated by the Central Bank of Sri Lanka. Also the Internal Capital Adequacy Assessment Process (ICAAP) covers capital planning over the next 5 years.
3 (1) (xvi) Publish Corporate Governance Report in this Annual Report
This Report forms part of the Corporate Governance Report of the Bank which is set out on pages 108 to 123 and pages 292 to 305.
INSIDE INSIGHT INSIDE INSIGHT SUPPLEMENTARY INFORMATION CORPORATE GOVERNANCE
295

Rule No. Corporate Governance Principles Compliance Status
3 (1) (xvii) Self-assessment of Directors
In accordance with the Direction the Board annually assesses the effectiveness of the Director’s own governance practices and therefore the Board has adopted a scheme of self-assessment to be undertaken by each Director annually. The evaluation covers a range of issues including Board composition, timeliness and quality of information provided to the Board and their individual goals and responsibilities.
The Chairman reviews the responses based on the summarised responses for the previous year’s self-assessment of the Directors to the self-assessment questionnaire and report to the Board on any identified weaknesses and lapses and recommend an action plan for approval of the Board. The Board periodically reviews the progress made on the action plan.
3 (2) Board Composition
3 (2) (i) Number of Directors
The number of Board Directors during the year 2021 was in compliance with the thresholds detailed in this Direction.
As at 31 December 2021, the Board comprised nine (9) Directors.
3 (2) (ii) Period of service of a Director
None of the Directors have exceeded 9 years of service during the year 2021.
The Company Secretary monitors this requirement. Details of tenure of service is given in page 112.
3 (2) (iii) Board balance
The CEO of the Bank is the only Executive Director and thus the Bank complies with this requirement. 3 (2) (iv) Independent Non-Executive Directors
The Board through Nominations Committee assesses the independence or non-independence of each Non-Executive Director based on a declaration made by each Director to the Company Secretary each year.
As at 31 December 2021 there were 4 Independent Non-Executive Directors on the Board which is above the regulatory requirement. The Non-Executive Directors are detailed on page 109 of this report.
3 (2) (v) Alternate Independent Directors
Directors appoint alternate Directors in line with the Articles of the Bank as and when required for a particular meeting. During the year 2021, Alternate Directors appointed for a particular meeting met the criteria that apply to an Independent Director.
3 (2) (vi) Criteria for Non-Executive Directors
A Board approved procedure to select and appoint Non-Executive Directors is in place.
The Non-Executive Directors of the Bank are persons with credible track records and have necessary skills and experience to bring an independent judgment to bear on issues of strategy, performance, risks and resources.
Please refer the profiles of Non-Executive Directors on pages 18 to 23 of this Report.
3 (2) (vii) More than half the quorum to comprise of Non-Executive Directors
All Board meetings have met this requirement. 3 (2) (viii) Identify Independent Non-Executive Directors in communications and disclose categories of Directors in this
Annual Report
The Independent Non-Executive Directors are expressly identified as such in all corporate communications that disclose the names of Directors of the Bank.
The composition of the Board, by category of Directors, including the names of the Chairman, Executive Director, Non-Executive Directors and Independent Non-Executive Directors are given on page 109 of this Report.
3 (2) (ix) Formal and transparent procedure for appointments to the Board
There is in place a formal, considered and transparent procedure for the appointment of new Directors to the Board.
In practice, Directors are appointed based on recommendations made by the Nominations Committee.
INSIDE INSIGHT INSIDE INSIGHT SUPPLEMENTARY INFORMATION CORPORATE GOVERNANCE
296

Rule No. Corporate Governance Principles Compliance Status
3 (2) (x) Election of Directors filling casual vacancies
Appointment to fill a casual vacancy is made by the Board on the recommendations of the Nominations Committee. A person so appointed would stand for re-election at the next Annual General Meeting in accordance with the Articles of Association. There were no appointments to fill casual vacancies in 2021. The appointment of Ms (Fay) Piyachatr Chetnakarnkul (representing the interest of Norfund following the shareholder agreement entered into with Norfund) in 2021 was approved by the shareholders at the EGM held in 2021.
3 (2) (xi) Communication of reasons for removal or resignation of Director
There were two resignations during 2021 all of which complied with the disclosure requirements detailed in the direction. 3 (2) (xii) Prohibition of Directors or employees of a Bank becoming a Director of another bank
No Directors or employees of the Bank are a Director of another Bank.
The Nominations Committee takes into account this requirement in their deliberations when considering the appointments of Directors. The Banks “Compliance Policy and Code of Conduct” further incorporates this requirement for employees.
3 (3) Criteria to assess fitness and propriety of Directors
3 (3) (i) Age of Director should not exceed 70
There are no Directors who are over 70 years of age. 3 (3) (ii) Directors should not be Directors of more than 20 companies/entities/institutions inclusive of subsidiaries or
associate companies of the Bank.
No Director holds Directorships of more than 20 companies.
The Directorships of each of the Directors are disclosed on pages 20 to 23 of the Annual Report.
3 (3) (iii) Director or CEO of the Bank shall not be appointed before the expiry of a period of 6 months from the date of cessation of his/her office at another licensed bank
The Company Secretary monitors this requirement. 3 (4) Management functions delegated by the Board
3 (4) (i) Understand and study delegation arrangements
3 (4) (ii) Extent of delegation should not hinder the Board’s ability to discharge its functions
3 (4) (iii) Review delegation arrangements periodically to ensure relevance to operations of the Bank
The Board periodically reviews and approves the delegation arrangements in place to ensure they are relevant and addresses the needs of the Bank.
Delegation papers are prepared in detail and recommended by the IRMC to the Board.
Terms of Reference (TOR) of each of the Board subcommittees which are incorporated in the respective charters of each Board subcommittee are approved by the Board.
In addition it is to be noted that by delegating, the Board does not lose the authority to deal with matters that have been delegated when necessary.
3 (5) The Chairman and Chief Executive Officer
3 (5) (i) Separation of roles
The roles of Chairman and CEO of the Bank are held by separate individuals. In addition, there is a clear division of responsibilities between the Chairman and the CEO thereby maintaining the balance of power between the two roles.
3 (5) (ii) A Non-Executive Independent Director as the Chairman or if not independent, designation of an Independent Director as the Senior Director
The Chairman Mr. Eshana de Silva is an Independent Non-Executive Director of the Bank. Therefore, the appointment of an Independent Director as the Senior Director does not arise.
3 (5) (iii) Disclosure of identity of Chairman and CEO and any relationships with the Board members
In accordance with this Direction the Company Secretary obtains a declarations from each Director to identify the nature of any relationship [including financial, business, family or other material/relevant relationship(s)], if any, between the Chairman and the CEO and the relationships among members of the Board.
Based on the said declarations there were no material relationships between the Chairman and the CEO and among the Board members.
INSIDE INSIGHT INSIDE INSIGHT SUPPLEMENTARY INFORMATION CORPORATE GOVERNANCE
297
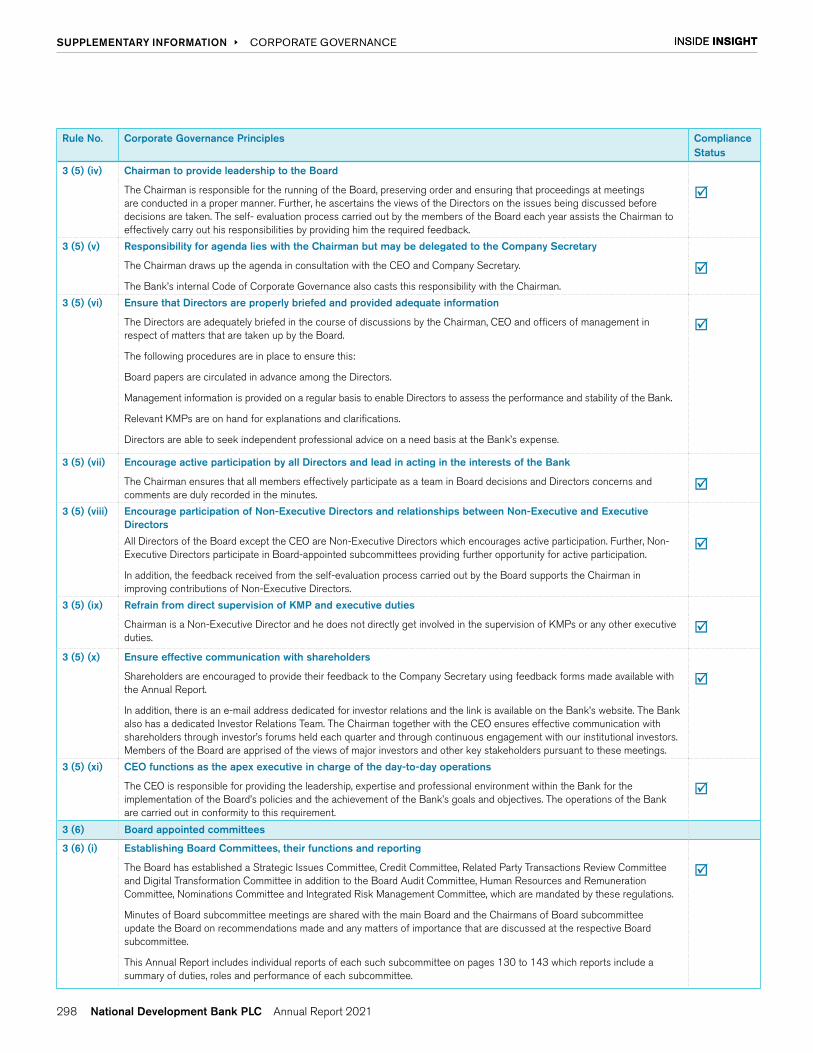
Rule No. Corporate Governance Principles Compliance Status
3 (5) (iv) Chairman to provide leadership to the Board
The Chairman is responsible for the running of the Board, preserving order and ensuring that proceedings at meetings are conducted in a proper manner. Further, he ascertains the views of the Directors on the issues being discussed before decisions are taken. The self- evaluation process carried out by the members of the Board each year assists the Chairman to effectively carry out his responsibilities by providing him the required feedback.
3 (5) (v) Responsibility for agenda lies with the Chairman but may be delegated to the Company Secretary
The Chairman draws up the agenda in consultation with the CEO and Company Secretary.
The Bank’s internal Code of Corporate Governance also casts this responsibility with the Chairman.
3 (5) (vi) Ensure that Directors are properly briefed and provided adequate information
The Directors are adequately briefed in the course of discussions by the Chairman, CEO and officers of management in respect of matters that are taken up by the Board.
The following procedures are in place to ensure this:
Board papers are circulated in advance among the Directors.
Management information is provided on a regular basis to enable Directors to assess the performance and stability of the Bank.
Relevant KMPs are on hand for explanations and clarifications.
Directors are able to seek independent professional advice on a need basis at the Bank’s expense.
3 (5) (vii) Encourage active participation by all Directors and lead in acting in the interests of the Bank
The Chairman ensures that all members effectively participate as a team in Board decisions and Directors concerns and comments are duly recorded in the minutes.
3 (5) (viii) Encourage participation of Non-Executive Directors and relationships between Non-Executive and Executive Directors
All Directors of the Board except the CEO are Non-Executive Directors which encourages active participation. Further, Non-Executive Directors participate in Board-appointed subcommittees providing further opportunity for active participation.
In addition, the feedback received from the self-evaluation process carried out by the Board supports the Chairman in improving contributions of Non-Executive Directors.
3 (5) (ix) Refrain from direct supervision of KMP and executive duties
Chairman is a Non-Executive Director and he does not directly get involved in the supervision of KMPs or any other executive duties.
3 (5) (x) Ensure effective communication with shareholders
Shareholders are encouraged to provide their feedback to the Company Secretary using feedback forms made available with the Annual Report.
In addition, there is an e-mail address dedicated for investor relations and the link is available on the Bank’s website. The Bank also has a dedicated Investor Relations Team. The Chairman together with the CEO ensures effective communication with shareholders through investor’s forums held each quarter and through continuous engagement with our institutional investors. Members of the Board are apprised of the views of major investors and other key stakeholders pursuant to these meetings.
3 (5) (xi) CEO functions as the apex executive in charge of the day-to-day operations
The CEO is responsible for providing the leadership, expertise and professional environment within the Bank for the implementation of the Board’s policies and the achievement of the Bank’s goals and objectives. The operations of the Bank are carried out in conformity to this requirement.
3 (6) Board appointed committees
3 (6) (i) Establishing Board Committees, their functions and reporting
The Board has established a Strategic Issues Committee, Credit Committee, Related Party Transactions Review Committee and Digital Transformation Committee in addition to the Board Audit Committee, Human Resources and Remuneration Committee, Nominations Committee and Integrated Risk Management Committee, which are mandated by these regulations.
Minutes of Board subcommittee meetings are shared with the main Board and the Chairmans of Board subcommittee update the Board on recommendations made and any matters of importance that are discussed at the respective Board subcommittee.
This Annual Report includes individual reports of each such subcommittee on pages 130 to 143 which reports include a summary of duties, roles and performance of each subcommittee.
INSIDE INSIGHT INSIDE INSIGHT SUPPLEMENTARY INFORMATION CORPORATE GOVERNANCE
298

Rule No. Corporate Governance Principles Compliance Status
3 (6) (ii) Board Audit Committee (BAC)
a. Chairman of the committee shall be an Independent Non-Executive Director who possesses qualifications and experience in accountancy and/or audit
Mr. Sujeewa Mudalige the Chairman of the BAC is an Independent Non-Executive Director and a Fellow Member of the Chartered Institute of Management Accountants, UK, Institute of Chartered Accountants of Sri Lanka, Association of Chartered Certified Accountants UK and CPA – Australia).
b. Committee to comprise solely of Non-Executive Directors
All members of the BAC are Non-Executive Directors. c. Board Audit Committee functions
The following matters referred to in the Direction are reviewed and appropriate recommendations are made by the BAC;
(i) Re-appointment of the External Auditor for audit services has been recommended to the Board by the BAC; The BAC has discussed the audit plan and methodology with the External Auditor.
(ii) – (iii) BAC has discussed the implementation of the Central Bank guidelines issued to Auditors from time to time and the application of the relevant accounting standards;
(iv) In order to ensure the independence of the Auditor to comply with the requirements of this Direction the External Audit Partner was rotated as per the five-year rotation requirement. The BAC evaluates and makes recommendations to the Board with regard to the audit fee.
Refer the ‘Report of the Board Audit Committee’ given on pages 136 to 138.
d. Review and monitor External Auditor’s independence and objectivity and the effectiveness of the audit processes
The BAC reviews and monitors the external auditor’s independence and objectivity and the effectiveness of the audit processes in accordance with applicable standards and best practices through the representations from the External Auditor.
e. Provision of non-audit services by External Auditor
A Policy for ‘Engaging the External Auditor for non-audit services’ is in place which covers all aspects stated in this Direction. This Policy is reviewed once in two years by the BAC and Board and was last reviewed in November 2021.
Assigning such non-audit services to External Auditor is discussed at BAC meetings and the required approval is obtained to that effect.
Further, relevant information is obtained from the External Auditor to ensure that their independence is not impaired, as a result of providing any non-audit services.
f. Determines scope of audit
The BAC Charter requires the BAC to discuss and finalise with the External Auditor the nature and scope of the audit. In order to comply, the External Auditor makes a presentation at the BAC meeting detailing the proposed audit plan and scope.
The Committee discussed and finalised the audit plan, methodology and scope with the External Auditor to ensure that it includes:
An assessment of the Bank’s compliance with the relevant Directions in relation to Corporate Governance and Internal Controls over Financial Reporting;
The preparation of Financial Statements for external purposes in accordance with relevant accounting principles and reporting obligations.
As all audits within the Group are carried out by the same External Auditor, there was no requirement to discuss arrangements for coordinating activities with other Auditors.
INSIDE INSIGHT INSIDE INSIGHT SUPPLEMENTARY INFORMATION CORPORATE GOVERNANCE
299

Rule No. Corporate Governance Principles Compliance Status
g. Review financial information of the Bank
The BAC reviews the quarterly Financial Statements as well as year-end Financial Statements.
The review focuses on the following:
(i) major judgemental areas;
(ii) any changes in accounting policies and practices;
(iii) significant adjustments arising from the audit;
(iv) the going concern assumption; and
(v) compliance with relevant Accounting Standards and other legal requirements.
The BAC makes their recommendations to the Board of Directors on the above on a quarterly basis.
h. Discussions with External Auditor on interim and final audits
The Committee met the External Auditor twice during 2021, without the presence of the Executive Management, to discuss issues, concerns and reservations arising from their audits.
i. Review of management letter and Bank’s response
BAC reviewed the External Auditor’s Management Letter for the year ended 2020 and the Management’s responses thereto. j. Review of internal audit function
The BAC has oversight of the Group Internal Audit Department (GIAD) of the Bank and carries out the following duties:
i. Reviews and discusses with the Head of Group Internal Audit (HGIA) the annual Audit Plan covering the Group, the adequacy of the scope and functions and the resources of GIAD.
ii. The Audit Plan for the year is approved by the BAC and the progress is tabled at the BAC meetings. The BAC reviews the internal audit reports and discusses the Management Action Plans to resolve the issues raised by GIAD. Further, BAC Chairman is kept informed of “Critical” and “Significant” issues arising from ongoing audits, as a “Heads up”. All audit findings are sent to Operational Risk Department to identify any process improvements required and to follow up on implementing controls.
iii. Reviews the performance of the HGIA, based on the feedback given by the CEO and BAC Chairman. Further the senior team member’s performances are discussed with the BAC.
iv. The BAC is kept informed of the senior staff member appointment/resignations.
v. Any outsourced internal audit services are done with the approval of BAC.
vi. Ensures that the internal audit function is independent of the activities it audits and that it is performed with impartiality, proficiency and due professional care. The GIAD staff reports directly to the HGIA who in turn reports directly to the BAC.
k. Internal investigations
Major findings of internal investigations and management’s responses thereto are reviewed by the BAC. Also the status of implementation of the recommendations made during investigations is discussed at Committee meetings.
l. Attendees at Board Audit Committee meetings
Head of Group Internal Audit and VP-Finance attended all meetings as a permanent invitee. The CEO attended meetings as well on invitation and other members of the Senior Management were invited to attend meetings on a need basis.
On the invitation of the Committee, the Bank’s External Auditor, Ernst & Young attended all meetings during the year.
The BAC met the External Auditor twice during the year (i.e. in February and November 2021) without the presence of KMPs.
m. Explicit authority, resources and access to information
The Charter of the BAC clearly defines the authority and terms of reference of the Committee, which is in compliance with this Direction.
n. Regular meetings
The BAC has scheduled regular quarterly meetings and additional meetings are scheduled when required. Accordingly, the Committee met six times during the year. Members of the BAC are served with due notice of issues to be discussed and the conclusions in discharging its duties and responsibilities are recorded in the minutes of the meetings maintained by HGIA who functions as the Secretary to the BAC.
INSIDE INSIGHT INSIDE INSIGHT SUPPLEMENTARY INFORMATION CORPORATE GOVERNANCE
300

Rule No. Corporate Governance Principles Compliance Status
o Disclosure in Annual Report
Please refer ‘Board Audit Committee Report’ on pages 136 to 138 for the details of the activities of the Audit Committee.
Attendance of the Committee members at each of these meetings is given in the table on page 120 of the Annual Report.
p. Maintain minutes of meetings
The Head of the Internal Audit functions as the Secretary to the BAC and maintains detailed minutes of all meetings. Copies of these approved minutes have been tabled at Board Meetings.
q. Whistle-blowing policy and relationship with External Auditor
The Bank has in place a Board approved Whistle Blowing Policy to make it easier for members of staff to be able to report irregularities in good faith, without having to fear that their actions may have adverse consequences on themselves. This Policy is reviewed and approved by the BAC and the Board of Directors.
The Employees of the Bank may, in confidence, raise concerns about possible improprieties in Financial Reporting, Internal Controls or other matters. A process has been established to track such whistle blowing and take necessary action.
The BAC is the key representative body for overseeing the Bank’s relations with the External Auditor.
3 (6) (iii) Board Human Resources and Remuneration Committee (HRRC) Composition & Responsibilities
Please refer pages 131 to 132 for the composition and responsibilities of the Human Resources and Remuneration Committee (HRRC).
a. Determine the Remuneration policy relating to Directors, CEO and KMPs
The HRRC reviews and where necessary makes recommendations on remuneration payable to Directors and KMPs of the Bank.
A Board approved Remuneration Policy and process is in place for Directors, CEO and KMPs.
b. Set goals and targets for the Directors, CEO and KMPs
The goals and targets set for the CEO and KMPs were reviewed and approved by the HRRC and noted/approved by the Board. Further the goals and targets of KMPs who head control functions were reviewed and approved by their respective subcommittee.
The goals and targets for the Directors for the year 2021 have been deliberated in detail and approved at HRRC and Board level.
c. Evaluate the performance of the CEO and KMPs against the set goals and targets and determine remuneration benefits
The performance of KMPs against set goals and targets are evaluated by the HRRC in March of every year and recommendations are then discussed and approved by the full Board. Further the performance of KMPs who head control functions goes to their respective subcommittee prior to being submitted to the Board. The CEO’s performance is evaluated by the full Board. The above process was complied within 2021 for the year 2020.
d. The CEO attendance at Committee meetings
The CEO was present at all meetings and stepped out when matters relating to the CEO were discussed. 3 (6) (iv) Board Nomination Committee (NC)
Please refer page 130 for the composition and responsibilities of the NC. a. Appointment of Directors, CEO and KMPs
The NC has in place a procedure to select new Directors.
A Board-approved procedure to select CEO and KMPs has been in place since December 2008.
b. Re-election of Directors
This is a requirement of the Nominations Committee Charter.
The NC determines the Directors who will be re-elected every year pursuant to taking into account the performance and contribution made by the Director concerned towards the overall discharge of the Board’s responsibilities. The Committee in February 2021 has considered and recommended the re-election of Mr Sriyan Cooray and Mr. Hiran Perera and re-appointment of Mr Kushan D’Alwis PC.
INSIDE INSIGHT INSIDE INSIGHT SUPPLEMENTARY INFORMATION CORPORATE GOVERNANCE
301

Rule No. Corporate Governance Principles Compliance Status
c. Eligibility criteria for appointments to key managerial positions including CEO
The NC has set a procedure to assess eligibility including criteria such as qualifications, experience and key attributes, for appointment or promotion to Key Management Positions including the position of the CEO.
The committee is guided by applicable statutes in considering the suitable criteria for each appointment/promotion.
d. Fit and proper persons
The Company Secretary obtains the declarations for the year 2021 from the Directors. The said annual declarations are submitted to the NC to ensure that they are fit and proper persons to hold office as specified in the criteria given in Direction 3(3) and as set out in the statutes. Thereafter the required affidavits of directors are submitted to CBSL. The required affidavits are obtained from KMPs at the time of appointment, promotions, extensions, lateral moves as required by the regulation.
This process has been followed for the year 2021.
e. Succession plan and new expertise
The NC considers Board vacancies based on the expertise required by the Bank and recommends suitable candidates when necessary in accordance with the Board approved procedure for selection and appointment of Directors.
The NC also recommended the Succession Plan for KMPs to the Board.
The Succession Plan for KMPs was reviewed and approved by the Board in 2020.
f. Committee to be chaired by an independent Director
The NC is chaired by the Chairman of the Bank who is an Independent Director. The CEO is present only if invited. 3 (6) (v) Board Integrated Risk Management Committee (IRMC)
Please refer pages 133 to 135 for the composition and responsibilities of the IRMC. The Terms of Reference of the IRMC was reviewed and updated in 2021.
a. Composition of IRMC
Please see detailed Report on pages 133 to 135 of this report. b. Risk assessment
The IRMC assesses all risks of the Bank and Group on a monthly basis through Key Risk Indicators, Risk Dashboards and through quarterly Risk Assessment reports done for the Bank and Group. The Bank has formed management committees to assess risks on a monthly/quarterly basis and their findings are submitted to the IRMC and a summary of the minutes of the IRMC and quarterly risk assessment reports are submitted to the main Board.
c. Review of management level committees on risk
The adequacy and effectiveness of all management level Committees against the respective TORs based on an independent assessment was reviewed at an IRMC meeting and the result was satisfactory.
Further all members carried out self-assessments for the year 2021 and the findings were at a satisfactory level.
d. Corrective action to mitigate risks exceeding prudential levels
The IRMC takes prompt corrective action to mitigate the effects of specific risks in the case such risks are at levels beyond the prudent levels decided by IRMC on the basis of the Bank’s policies and regulatory and supervisory requirements. The Risk Appetite of the Bank decided through the ICAAP was approved by the Board.
e. Frequency of meetings
The Committee has met 05 times in the year 2021. f. Actions against officers responsible for failure to identify specific risks or implement corrective action
If the need arises the IRMC shall take action appropriate to the relevance of the situation as per the Bank’s Human Resources Policy.
g. Risk Assessment Report to the Board
A detailed report is submitted to the Board subsequent to the IRMC meeting seeking the Board’s views, concurrence and/or specific directions.
INSIDE INSIGHT INSIDE INSIGHT SUPPLEMENTARY INFORMATION CORPORATE GOVERNANCE
302

Rule No. Corporate Governance Principles Compliance Status
h. Compliance function
The Bank has appointed a dedicated Compliance Officer who is a KMP to head the compliance function of the Bank.
The compliance function is an independent function of the Bank that supports the Board of Directors and Senior Management of the Bank to manage compliance risks by supporting the Bank to embed a culture of compliance within the Bank, disseminate new laws and regulations to business in a timely manner, provide guidance on the interpretation of regulatory requirements, support business with the creation and implementation of regulatory compliant policies and procedures, undertake independent compliance monitoring of business with relevant laws and regulations and all measures taken to mitigate compliance risks.
The Compliance Officer submits to the IRMC and the Board a detailed report on the Compliance status of the Bank each quarter.
3 (7) Related Party Transactions
3 (7) (i) Avoid conflict of interest
The Bank has is in place a Board approved Related Party Transactions (RPT) Policy which has set out the procedure to be followed when transacting with related parties. The RPT Policy was adopted by the Bank to identify, approve, monitor and disclose transactions with related parties of the Bank.
The Bank has in place a list of related parties which is updated as and when changes occur and reviewed on a quarterly basis to ensure all related parties are listed accurately.
The list of related parties is circulated to all relationship managers of business units and branch managers together with an internal circular which describes the regulations that would apply when dealing with related parties.
Further every quarter a sign off is obtained from the business lines confirming that they have complied with the related party policy when entering into a transaction with a related party.
These processes are in place to remind business lines of the regulatory requirements in relation to related party transactions thereby ensuring that the Bank avoids conflicts of interests with related parties of the Bank.
The Bank has obtained the annual declarations in 2021 from the individual Directors confirming that they have avoided conflicts of interests.
3 (7) (ii) Types of Related party transactions covered by the direction
The RPT Policy of the Bank covers all transactions that come within the scope of this Direction. 3 (7) (iii) No more favourable treatment to Related Parties of the Bank
A list identifying Related Parties of the Bank in line with this Direction is shared with business lines on a quarterly basis.
The regulations and process that needs to be complied with is explained in an internal circular which accompanies the related party list.
Business lines are requested to ensure compliance with the required regulation and to refrain from granting related parties of the Bank “more favourable treatment”.
Further the Compliance Department reviews transactions with related parties on an ongoing basis to determine if “more favourable treatment” have been offered to them. Any deviations are required to be reported to the Related Party Transactions Review Committee, and the Integrated Risk Management Committee.
3 (7) (iv) Granting accommodation to a Director or close relation of a Director
This requirement has been included in the Bank’s RPT Policy. The Company Secretary upon being informed of a transaction with a related party shall ensure compliance with this requirement.
3 (7) (v) Accommodations granted to persons, concerns of persons, or close relations of persons, who subsequently are appointed as Directors of the Bank
Prior to the appointment of a Director, the Bank is required to submit an affidavit disclosing all their interests with the Bank. The Company Secretary is aware of the requirement in this direction and will take necessary action to inform the relevant Director and the business unit in this regard.
3 (7) (vi) No favourable treatment or accommodation to Bank employees or their close relations
No favourable treatment/accommodation is provided to Bank employees other than staff benefits. Employees of the Bank are informed through operational circulars to refrain from granting favourable treatment to other employees or their close relations or to any concern in which an employee or close relation has a substantial interest.
INSIDE INSIGHT INSIDE INSIGHT SUPPLEMENTARY INFORMATION CORPORATE GOVERNANCE
303

Rule No. Corporate Governance Principles Compliance Status
3 (7) (vii) Remittance of accommodation subject to Monetary Board approval
Such a situation has not arisen in the Bank to date. 3 (8) Disclosures
3 (8) (i) Publish annual and quarterly financial statements
The Financial Statements for the year ended 31 December 2021 and quarterly Financial Statements are in conformity with all rules and regulations. These Statements have been published in the newspapers in all three languages.
3 (8) (ii) Disclosures in Annual Report
a. A statement to the effect that the Annual Audited Financial Statements have been prepared in line with applicable accounting standards and regulatory requirements, inclusive of specific disclosures
Compliance with applicable accounting standards and regulatory requirements have been reported under the ‘Directors’ Responsibility for Financial Reporting on pages 144 to 145, the Responsibility Statement of Chief Executive Officer and Vice President Finance on page 148 and Note 2.1 (Statement of Compliance) to the Financial Statements on page 167.
b. Report by the Board on the Bank’s internal control mechanism
The Directors’ Report on the effectiveness of the internal control system over Financial Reporting is given under the “Statement of Internal Control” on pages 146 to 147.
c. External Auditors Certification on the Effectiveness of the Internal Control Mechanism
The Assurance Report issued by the External Auditor on the internal control over Financial Reporting based on the auditing framework issued by ICASL, is detailed on page 149 of this report.
d. Details of Directors, including names, fitness and propriety, transactions with the Bank and the total of fees/remuneration paid by the Bank
Please refer “Board Directors” on pages 18 to 23 “Directors’ Interest in Contracts with the Bank” on page 128 and page 129 for Directors’ remuneration.
The Executive Director is an ex officio Director on account of being the CEO of the Bank and as such is not paid any additional remuneration or benefits by virtue of him being an Executive Director.
Details of Directors’ transactions with the Bank are given below:
Transaction type Outstanding balance as at 31 December 2021 LKR ‘000
Accommodation 2,001Deposits 239,808Investments -
e Total accommodation granted to each category of related party and as a percentage of the Bank’s regulatory capital
Total Net Accommodation granted to related parties as a percentage of the Bank’s regulatory capital are given below:
Category of Related Parties Net Accommodationas at 31 December 2021
LKR’000
% ofRegulatory
Capital
Directors/Close Family Members/Substantial Interest concerns 3,223,101 4.32
Key Management Personnel/Close Family members 166,214 0.22
The Bank’s subsidiaries and associate companies 850,000 1.14
INSIDE INSIGHT INSIDE INSIGHT SUPPLEMENTARY INFORMATION CORPORATE GOVERNANCE
304

Rule No. Corporate Governance Principles Compliance Status
f. Aggregate values of remuneration to and transactions with KMPs
Aggregate values of remuneration paid by the Bank and transactions of the Bank with its KMPs
Transaction type Aggregate values/Outstanding balances as at 31 December 2021 in LKR ‘000
Remuneration Paid 407,911Accommodation 166,214Deposits 564,358Investments -
g. External Auditors Certification of Compliance
Complied by this Report. h. Report confirming compliance with prudential requirements, regulations, laws, and internal controls
There are no material non-compliance to prudential requirements regulations, laws and internal controls affecting the Bank i. Non-compliance Report
There were no supervisory concerns on lapses in the Bank’s Risk Management System or non-compliance with this Direction, that have been pointed out by the Director of the Bank Supervision Department of the CBSL and requiring disclosure to the public.
3 (9) Transitional and other general provisions
The Bank has complied with the transitional provisions, where applicable.
INSIDE INSIGHT INSIDE INSIGHT SUPPLEMENTARY INFORMATION CORPORATE GOVERNANCE
305

STATEMENT OF COMPLIANCE - CODE OF BEST PRACTICES ON CORPORATE GOVERNANCE 2017 (THE CODE) ISSUED BY THE INSTITUTE OF CHARTERED ACCOUNTANTS OF SRI LANKA (CA SRI LANKA).
The Code is intended to provide a corporate governance framework that supports strong business ethics, sound policies and procedures and an effective monitoring system which is in line with international best practices. The Code is broadly divided into two areas, namely the Company and shareholders.
I. THE COMPANY
Key principles are detailed under the following broad areas viz. Directors, Directors’ Remuneration, Relations with shareholders, Accountability and Audit.
II SHAREHOLDERS
Key principles are detailed under the following broad areas viz. Institutional Investors, Other Investors, Internet of things and Cyber-security and Environment, Society and Governance (ESG).
The Bank’s adherence with the code is detailed below with explanatory comments as follows;
Rule No. Corporate Governance Principles Compliance Status
A. Directors
A.1 The Board
As at 31 December 2021 the Board comprised of nine Directors, eight of whom, including the Chairman, functioned in a non-executive capacity. The members of the Board consists of professionals in the fields of banking, finance, management, treasury, law, accounting, auditing, IT, economics, investments, and possess the skills, experience and leadership required to direct, lead and control the Bank. The Chief Executive Officer (CEO) is the only Executive Director. The Board has appointed several Board subcommittees to assist in the discharge of their collective responsibilities.
The Bank is mindful of the need to maintain an appropriate mix of skills and experience in the Board through a regular review of its composition in ensuring that the skill representation is in alignment with current and future needs of the Bank. Additionally, individual Directors are encouraged to seek expert opinion and/or professional advice on matters where they may not have full knowledge or expertise.
A.1.1 Regular Board meetings
The Board usually meets on monthly intervals, but meets more frequently whenever it is necessary. The Board met twenty (20) times during the year which included eight (8) special meetings. Scheduled Board and Board subcommittee meetings are arranged at the beginning of each calendar year. Attendance at Board and subcommittee meetings are provided on pages 119 to 120.
A.1.2 Role and responsibilities of the Board
Business StrategyThe Board is responsible to stakeholders for creating and delivering sustainable shareholder value through the management of the Bank and Group‘s businesses. It determines the strategic objectives and policies of the Bank and Group to deliver such long term value, providing overall strategic direction within a framework of rewards, incentives and controls. The Bank’s overall business strategy for 2021-2025 was approved by the Board in August 2020 and further reviewed in 2021 as detailed under Section 3(1)(i)(b) of the CBSL table on page 292 of this report.
Senior Independent DirectorIn terms of the Bank’s Article of Association the Bank’s Chairman is mandatorily an independent Director therefore the need to appoint a Senior Independent Director does not arise.
The CEO and the Management Team skills, experience and knowledge to implement the strategy The Human Resources and Remuneration Committee (HRRC) and the Nominations Committee (NC) ensure that the CEO and Key Management Personnel (KMP) have the required skills, experience and knowledge to implement strategy.
The CEO and the Leadership Team consist of senior bankers with an average experience of 24 years in the field of banking and finance. The profiles of the Leadership Team are available on the pages 24 to 26.
Succession strategy of CEO and Key Management Personnel (KMP)The succession plan of the Bank was reviewed and approved by the Board at its meeting held in July 2020.
Budgets and major capital expenditureAnnual budget is approved before the commencement of the year. Major capital expenditure requires the approval of the Board.
Delegation of AuthorityTo enable the Board to discharge its stewardship and fiduciary responsibilities effectively it delegates authority to the Board Subcommittees to oversee specific responsibilities based on clearly defined terms of references which are also detailed under Section 3(1)(i)(h) of the CBSL table on page 293 of this report.
INSIDE INSIGHT INSIDE INSIGHT SUPPLEMENTARY INFORMATION CORPORATE GOVERNANCE
306

Rule No. Corporate Governance Principles Compliance Status
Integrity of information, internal controls, business continuity and risk managementThe Board is responsible for the overall risk framework of the Bank.
There is in place an adequate system of internal controls. Policies relating to securing information, business continuity and risk management have been approved by the Board. These policies have been reviewed by either the Integrated Risk Management Committee (IRMC) or the Board Audit Committee (BAC).
The BAC reviews Internal Audit reports submitted by the Internal Audit Department and monitors follow up action. Further, based on the assessment of Internal Control Over Financial Reporting (ICOFR), Directors concluded that the Bank’s Internal Control Over Financial Reporting is effective.
The IRMC appointed by the Board, reviews and recommends to the Board, the Bank’s risk policies and procedures defining the Bank’s risk appetite, identifying principal risks, setting governance structures and implementing policies and systems in line with the Integrated Risk Management Framework to measure, monitor and manage the principal risks of the Bank. The Board has approved risk management policies and procedures as reviewed and recommended by the IRMC, based on these parameters and as required by Regulation.
The following reports provide further insight in this regard:
The Risk Management Report (pages 318 to 351)
The Board Integrated Risk Management Committee Report on (pages 133 to 135)
The Directors’ Statement on Internal Control (pages 146 to 147)
The Board Audit Committee Report (pages136 to 138)
Compliance with laws, regulations and ethical standardsThe compliance function is an independent function of the Bank that supports the Board of Directors and Senior Management of the Bank to manage compliance risks by supporting the Bank to embed a culture of compliance within the Bank, disseminate new laws and regulations to business in a timely manner, provide guidance on the interpretation of regulatory requirements, support business with the creation and implementation of regulatory compliant policies and procedures, undertake independent compliance monitoring of business with relevant laws and regulations and take measures to mitigate compliance risks.
The Compliance Officer submits to the IRMC and the Board a detailed report on the Compliance status of the Bank each quarter.
All stakeholder interests are considered in corporate decisionsThe Board of Directors consider the views/impact on all stakeholders of the Bank when decisions are made at Board meetings.
Sustainable business development and “integrated reporting”Sustainable business development is one of the key areas of focus considered by the Board when taking decisions. Please refer to the Bank’s Integrated narrative on pages 50 to 101 for more details.
The Bank’s Annual Report is presented in line with the integrated reporting guidelines issued by the Institute of Chartered Accountants of Sri Lanka.
Accounting Policies and fostering compliance with financial regulationsThe BAC and the Board reviews accounting policies annually to ensure that the Financial Reporting Model of the Bank is in line with such policies, financial regulations, evolving international and local accounting standards and industry best practices.
The Board ensures that the Financial Statements of the Bank are prepared in accordance with the approved accounting policies.
Monitoring and evaluation of progress on strategy implementation, budgets, plans and related risksThe Management monitors budgets on frequent intervals (daily/weekly/monthly) and is reviewed by the Board on a monthly basis. Strategy is approved by the Board Strategic Issues Committee and the Board. The Board also reviews the implementation progress regularly.
Corporate reporting relevant to the BankThe Bank is listed in the Colombo Stock Exchange and conforms to the Listing Rules issued by the Colombo Stock Exchange and also adhere to the regulations applicable to Licensed Commercial Banks. Therefore corporate reporting on an annual and quarterly basis is carried out in line with the regulations.
INSIDE INSIGHT INSIDE INSIGHT SUPPLEMENTARY INFORMATION CORPORATE GOVERNANCE
307

Rule No. Corporate Governance Principles Compliance Status
Fulfilling such other Board functions as are vital, given the scale, nature and complexity of the business concernedThe Board makes every endeavour to fullfill its stewardship obligations on behalf of all stakeholders. The Board is committed to fulfilling their functions in line with laws, regulations and good governance practices adopted by the Bank.
A.1.3 Act in accordance with laws
There is significant emphasis across the Bank to ensure compliance with applicable laws and regulations.
In order to preserve the independence of the Board and to strengthen the decision making, the Board seeks independent professional advice when deemed necessary. The Board approved internal Code of Corporate Governance contains the procedure to be followed when a Director or the Board wishes to obtain independent professional advice on any matter.
A.1.4 Access to advice and services of Company Secretary
The Company Secretary advises the Board and ensures that matters concerning the Companies Act, Board procedures and other applicable rules and regulations are followed.
All Directors have access to the Company Secretary and she possesses the required qualifications as set out in the Companies Act and the Banking Act. For the year 2021 the Company Secretary has provided assistance to the Directors when requested. Please refer page 115 for more details on the role of the Company secretary.
The Bank has in place an insurance cover for the Directors and its Officers.
A.1.5 Independent judgment
The Board combines an appropriate and diverse balance of skills, industry experience and perspective to objectively discharge it’s responsibilities. All Directors bring their independent judgment to matters discussed at Board meetings. Details of Directors deliberations are contained in the minutes maintained by the Company Secretary.
A.1.6 Dedicate adequate time and effort to matters of the Board and the Company
Every member of the Board has dedicated adequate time and effort for the affairs of the Bank by attending Board meetings, Board Subcommittee meetings and by making decisions via circular resolutions. In addition, the Board members have meetings and discussions with the Management when required.
Board papers are circulated to the Board at least seven days prior to each Board meeting. Any request for additional information is made to the Company Secretary. The relevant member of staff is informed by the Company Secretary and the requisite information is forwarded. All matters that require follow up are discussed at the immediately succeeding Board meeting under ‘Matters Arising’. Business heads regularly update the Board on the status and development in their respective fields.
The CEO on a regular basis updates the Board on business changes, operational risks and controls relevant to the Bank.
Please refer page 109 which illustrates how the Board spent its time in 2021.
A.1.7 Call for a resolution to be presented to the Board
All Directors are entitled to include matters and proposals in the agenda for Board meetings and this right has been entrenched in the Bank’s internal Code of Corporate Governance.
Monthly meetings are scheduled and informed to the Board at the beginning of each calendar year to enable submission of proposals in the agenda for regular meetings. This process supports the requirement detailed in this code and a Director may include a proposal (if required) in the agenda of a Board meeting.
A.1.8 Board induction and training
The Board policy on Directors’ training is to provide adequate opportunities for continuous development, appropriate for each Director.
The Chairman is responsible for ensuring that the Directors continually update their skills, knowledge and awareness of the Bank’s policies and procedures as required to fulfill their roles both on the Board and on sub-committees appointed by the Board.
New Directors are provided with a comprehensive induction pack on appointment to the Board. During the year several Directors engaged in training sessions relevant to the Group’s strategy and emerging risks. Please refer the section on “Induction and Training of Directors” on page 114 for more details.
A.2 Separating the business of the Board from the executive responsibilities for management of the Bank
A.2.1 Divisions of Responsibilities between the Chairman and CEO
The posts of Chairman and CEO of the Bank are held by two separate persons and there is a clear division of responsibilities between them thereby maintaining the balance of power between the two roles.
INSIDE INSIGHT INSIDE INSIGHT SUPPLEMENTARY INFORMATION CORPORATE GOVERNANCE
308

Rule No. Corporate Governance Principles Compliance Status
A.3 Chairman’s role in preserving good corporate governance
A.3.1 Conducting Board proceedings in a proper manner
The Board approved internal Code of Corporate Governance formally details the role of the Chairman. The Chairman ensures that the affairs of the Board are conducted in an effective manner. He encourages Directors to share their views on matters discussed and ensures the participation of both Executive and Non-Executive Directors thereby maintaining a balance of power between Executive and Non-Executive Directors. The Chairman approved the agenda for each meeting in consultation with the CEO and the Company Secretary and ensured that all Board proceedings were conducted in a proper manner. All Directors are encouraged to seek information considered necessary to discuss matters on the agenda of meetings. The views of Directors on issues under consideration are ascertained and records of such deliberations are reflected in the minutes.
A.4 Availability of financial acumen and knowledge to offer guidance on matters of finance
A.4.1 Financial Acumen and Knowledge
The Chairman of the BAC who is an independent non executive Director is a Fellow Member of the CA Sri Lanka ensuring a sufficiency of financial acumen within the Board on matters of finance. Further, 8 of the 9 Directors have a vast experience on matters of finance.
A.5 Board balance
A.5.1 Board to have a balance of Executive and Non-Executive Directors
8 of the 9 Directors on the Board are Non-Executive Directors. The CEO is the only Executive Director. The Chairman is a Non-Executive Independent Director.
A.5.2 –A.5.5 Board Independence
Annual declarations of independence or non-independence have been obtained from the Directors for 2021 with the criteria set out in this Code.
Based on the annual declarations, there were 8 Non-Executive Directors on the Board as at 31 December 2021. Of them 6 Non-Executive Directors are independent of management and free of business dealings that may be perceived to interfere with the exercise of their unfettered and independent judgement.
The details of Non-Executive Independent Directors are given in pages 109 and 119 of this report. Accordingly, the number of Independent Non-Executive Directors exceeds two- thirds of the total number of Directors on the Board.
A.5.6 Appointing an Alternate Director
Directors appoint Alternate Directors within the rules and Articles of the Bank and the Banking Act as and when required for a particular meeting. An Alternate Director of an Independent Director is also Independent. During the year 2021 an independent director appointed another independent director as his alternate for a meeting.
A.5.7 - A.5.8 Appointment of a Senior Independent Director (SID)
The CEO and Chairman are not one and the same person. The Chairman is a Non-Executive Independent Director.
As such there is no requirement to appoint a SID.
A.5.9 Chairman to meet only with Non- Executive Directors as necessary and at least once each year
As and when needed the Chairman discusses matters related to the Executive Director only in the presence of Non-Executive Directors.
A.5.10 Recording of a dissenting view
Dissenting views are recorded in the Board Minutes in detail.
Directors’ concerns regarding matters which are not resolved unanimously are also recorded in the minutes.
A.6 Supply of Information
A.6.1 –A.6.2 Provision of providing appropriate and timely information to the Board
The Management provides comprehensive information including both quantitative and qualitative information for the monthly Board meetings generally 7 days prior to the Board meetings.
Members of The Leadership Team make presentations to Directors on important issues relating to financial performance, strategy, risk management, investment proposals, systems and procedures, where necessary.
The Directors also have access to the Management to obtain further information or clarify any concerns they may have.
As described above, they also have the right to seek independent professional advice at the Bank’s expense.
INSIDE INSIGHT INSIDE INSIGHT SUPPLEMENTARY INFORMATION CORPORATE GOVERNANCE
309

Rule No. Corporate Governance Principles Compliance Status
A.7 Appointments to the Board
A.7.1 - A.7.2 Ensure Board appointees are fit and proper
The Board has established a Nominations Committee to make recommendations on new appointments to the Board. There is in place a Board-approved policy and process for appointments of Directors to the Board. The Nominations committee also assesses the Board composition against pre-defined criteria of skills and knowledge to ensure that Board appointees are fit and proper.
Please refer page 130 for the report of the Nominations Committee.
A.7.3 Disclosure to shareholders on new appointments to the Board
Disclosures are made to shareholders in terms of the Listing Rules issued by the Colombo Stock Exchange (CSE). A.8 Re-Election
A. 8.1- A.8.2 Re-election of Directors at regular intervals
Directors to retire at the Annual General Meeting (AGM):
As per the Articles of the Bank, 1/3rd of the Directors (except the CEO, any Director appointed to fill a casual vacancy and any Nominee Director of the Ministry of Finance) should retire at each AGM and be subject to re-election. Such Directors who retire are those who held office for the longest time period since the election/re-appointment. In accordance with this provision, The Nominations Committee in February 2022 has considered and recommended the re-election of Mr Bernard Sinniah and Mr Sujeewa Mudalige.
Prior to recommending the above re-election/re-appointments of Directors the Nominations Committee considered the fitness and proprietary of each Director and made recommendations for re-election.
A.8.3 Resignation of a Director
There were two resignations during 2021.
The Bank made the relevant disclosures as required under Section 3(2)(xi) of the CBSL table on page 297 of this report and the Listing rules.
A.9 Appraisal of Board and Committee Performance
A.9.1 - A 9.4 Self-evaluation process of Board Members & Sub Committees
The Board carried out its self-evaluation process in respect of the year 2021. The process is led by the Chairman. All Directors were required to complete a detailed questionnaire. The processes adopted is detailed on page 115 of this report
All Subcommittees also carried out a self-evaluation process in 2022 to determine the effectiveness of their performance in 2021 and to identify areas for improvement which are subsequently discussed at their respective meetings, the minutes of which are submitted to the Board.
A.10 Disclosure of Information in Respect of Directors
A.10.1 Annual Report to disclose specified information regarding Directors
Information Required Page Reference
Name, qualification and brief profile 20 - 23Nature of his/her expertise in the relevant functional areas 119Immediate family and/or material business relationships with other Directors of the Bank
297 item 3 (5) (iii)
Whether Executive, Non-Executive and/or Independent Director 109 and 119Names of listed companies in which the Director concerned serves as a Director 20 - 23Names of other companies or companies in a group in Sri Lanka 20 - 23in which the Director concerned serves as a DirectorBoard meeting attendance 119The total number of Board seats held by each Director 20 - 23 and 297 item 3 (3) (ii)Board committee served as the Chairman/member 120Committee meeting attendance 120
INSIDE INSIGHT INSIDE INSIGHT SUPPLEMENTARY INFORMATION CORPORATE GOVERNANCE
310

Rule No. Corporate Governance Principles Compliance Status
A.11 Appraisal of the CEO
A. 11.1-A.11.2 Setting annual targets and the appraisal of the CEO
The Board discussed and set financial and non-financial targets to be achieved during the year by the CEO with reference to the short, medium and long term objectives of the Bank at the beginning of 2021. The HRRC/Board will evaluate the performance of the CEO against the goals and targets set for 2021 at the Board meeting scheduled to be held in March 2022.
B Directors’ remuneration
B.1 Remuneration procedure
B.1.1 Establishment of a Remuneration Committee
The Board has established a Human Resources and Remuneration Committee (HRRC) to develop policy and determine remuneration for the Directors and KMPs. No Director is involved in deciding his/her own remuneration.
B1.2 - B1.3 Composition and disclosures of the Remuneration Committee
The HRRC consists exclusively of Non-Executive Directors. The Chairman Mr Sriyan Cooray is an Independent Non-Executive Director. Please refer pages 131 to 132 for the report of the HRRC for more details on the composition and activities carried out by the HRRC for the year 2021.
B1.4 Determination of remuneration for Non-Executive Directors
A Board-approved Remuneration Policy is in place for Directors and KMPs. Non-Executive Directors are remunerated in line with prevailing regulations and market practices and approvals obtained from the shareholders at the AGM.
B1.5 Seek professional advice
The HRRC has access to professional advice from within and external consultants. During the year, the HRRC reviewed the information provided by the Bank’s Human Resources Department to determine market and industry trends with regard to remuneration and perquisites for its Senior Management team.
B.2 Level and make-up of Remuneration
B.2.1 Remuneration for Executive Directors
The Executive Director is an ex-officio Director on account of being the CEO of the Bank and as such is not paid any additional remuneration or benefits by virtue of him being an Executive Director. The CEO’s remuneration is linked to the Bank’s performance as well as his individual performance. The Executive Director does not participate in the HRRC when matters pertaining to his remuneration are discussed.
B.2.2 Executive Directors’ remuneration
The CEO’s remuneration is linked to the Bank’s performance as well as his individual performance. B.2.3 Positioning the Bank’s remuneration levels relative to other companies in the industry
The HRRC reviews information relating to remuneration and prerequisites of CEO and Senior Management of the Bank and due care is taken to ensure that remuneration is commensurate with industry standards and both the Bank’s and individual performance. Regular salary surveys are carried out and the HRRC is informed of the results of the survey. The Bank took part in several industry and cross industry salary surveys in 2021.
B.2.4 Comparison of Remuneration levels with other Companies in the Group
Size and scale of the Bank are not comparable with Group Companies. B.2.5 Performance related remuneration of Executive Directors
The goals and targets of the CEO are set at the beginning of the year and cascaded to the rest of the Bank. Executive remuneration and performance bonuses are decided based on achievement of the goals and targets agreed upon.
B.2.6 Employee Share Options
An employee share scheme was established in 2016 which was approved by the shareholders in line with the listing rules of the CSE. However no shares were issued under this scheme in 2021. Details are given in the Financial Statements on page 359 .
B.2.7 Designing schemes of performance related remuneration
No remuneration or benefits are paid to the only Executive Director who is the CEO on account of his Executive Directorship. Please refer pages 131 to 132 for the report of the HRRC for more details on remuneration.
B.2.8 - B.2.9 Early termination of Executive Director
Termination of service of the Executive Director will be in accordance with his contract of employment.
INSIDE INSIGHT INSIDE INSIGHT SUPPLEMENTARY INFORMATION CORPORATE GOVERNANCE
311

Rule No. Corporate Governance Principles Compliance Status
B.2.10 Levels of remuneration of Non-Executive Directors
Non-Executive Directors are remunerated in line with the prevailing regulations and market practices. However they are not entitled to receive any performance-based remuneration which includes shares under the existing Share Option Scheme of the Bank.
B.3 Disclosure of remuneration
B.3.1 Disclosures related to remuneration in the Annual Report
Please refer page 124 of the Annual Report for Directors Remuneration.
Also refer Note 14 on page 186 of the Financial Statements for aggregate remuneration paid to Executive and Non-Executive Directors.
C Relations with shareholders
C.1 Constructive use of the AGM and conduct of General Meetings
C.1.1 Notice of the AGM
The AGM provides a forum for all shareholders to participate in decision making matters reserved for the shareholders. Notice of the AGM is circulated 15 working days in advance with the Annual Report and Accounts.
A summary of the procedures governing voting at General Meetings is included on page 384 of this Annual Report.
C.1.2. Separate resolutions for substantially separate issues
Separate resolutions are obtained for substantially separate matters to provide shareholders with an opportunity to deal with each significant matter separately. The Annual Report of the Board of Directors and Accounts are laid before the shareholders of the Bank for their consideration as a separate item on the agenda at the AGM.
C.1.3. Valid proxy appointments
The Bank has in place an effective mechanism to record all proxy votes to indicate to the Chairman the level of proxies lodged on each resolution and the number of votes for and against each resolution. As a matter of practice, proxy votes together with the votes of shareholders present at the AGM are considered for each resolution and duly recorded in the minutes
C.1.4. Board subcommittee Chairmans available at AGM
The Chairman of the Board functions as the Chairman of the Nominations Committee, Strategic Issues Committee and the Related Party Transactions Review Committee. He ensures that the Chairpersons of the other Board Subcommittees are also present at the AGM to answer all queries that may be raised. The Chairpersons of the Board Subcommittees were present at the AGM held in 2021.
C.1.5 Adequate notice of all meetings to shareholders
The notice of meeting and related documents are circulated to the shareholders 15 working days prior to the AGM.
Summary of the procedures governing voting at the AGM is provided in the proxy form, which is circulated to shareholders together with the notice of meeting 15 working days prior to the AGM.
The Board encourages all shareholders to actively participate in the AGM. The shareholders may raise any queries they have with the Directors.
C.2 Communication with shareholders
C.2.1 Effective communication with shareholders
The Bank has in place a Communication Policy which sets out many channels of communication to reach all shareholders of the Bank in order to disseminate timely information. The effective communication with shareholders are detailed in Section 3(1)(i)(d) of the CBSL table on page 293 of this report.
Also please refer pages 352 to 369 on “Investor Relations” for more details on communication with our shareholders.
C.2.2- C.2.3 Disclosure of the policy and methodology for communication with shareholders and implementation
There is in place a Board approved Disclosure Policy and Shareholder Communication Policy that deals with communications with shareholders. Please refer the “corporate governance report” on page 121 for details of the policy and methodology adopted for communication.
INSIDE INSIGHT INSIDE INSIGHT SUPPLEMENTARY INFORMATION CORPORATE GOVERNANCE
312

Rule No. Corporate Governance Principles Compliance Status
C.2.4 – C.2.7 Contact person for communication with shareholders matters and process for Directors awareness of major concerns/issues.
Details of the contact personnel are provided in the “Corporate Information” section on page 386 of this Report. In addition, shareholders are encouraged to provide their feedback to the Chairman and/or the Board Secretary. The Bank’s website’s Investor Relations page also carries contact details of the Board Secretary and a dedicated e-mail for investor relations is also provided.
The principal forum for shareholders is the AGM, while matters can also be raised through the Company Secretary. The Company Secretary keeps the Board apprised of issues raised by the shareholders to ensure that they are addressed in an appropriate manner keeping in line with the corporate values of the Bank. Matters raised in writing are responded to in writing by the Company Secretary. Shareholder correspondence on major issues are handled by the Chairman who will communicate to the Board of Directors as an when necessary.
C.3 Major and material transactions
C.3.1 Disclosure of major and material transactions
During 2021 there were no major transactions as defined by Section 185 of the Companies Act No. 7 of 2007 which materially affected the Bank’s net asset base.
Further all material transactions will be disclosed in the Quarterly/Annual Financial Statements as well as the disclosure made to the CSE.
Not Applicable
C.3.2 Disclosure requirements and shareholder approval by special resolution
The Bank being a public listed company complies with the disclosure requirements and shareholder approval by special resolution as required by the rules and regulation of the Securities Exchange Commission and by the Colombo Stock Exchange as well as the Companies Act and the Bank’s Articles of Association.
D Accountability and audit
D.1 Financial and business reporting
D.1.1 True, fair, balanced and understandable presentation of Annual Report including Financial Statements with the relevant laws and regulations
Declarations by the Directors as required by the Code of Best Practice on Corporate Governance are provided on pages 144 to 145 in the ‘Statement of Directors’ Responsibilities for Financial Reporting’.
D.1.2 Balanced and understandable assessment of interim and other price-sensitive public reports to regulators
The Board is aware of its responsibility to present regulatory and statutory reports in a balanced and understandable manner. A statement to this effect is provided on pages 144 to 145 of this report.
The Interim Accounts and Annual Financial Statements were published in a timely basis in 2021. Regulatory reports were filed by the Bank on or before the due dates in 2021. Price sensitive information was disclosed to the Colombo Stock Exchange on a timely basis in accordance with the Bank’s Board approved Disclosure Policy.
The Bank makes every effort to provide a detailed and transparent analysis of strategies, performance and future strategies to support investors in making an informed decision.
In addition to the information provided in the reports mentioned above, a summary of the Interim Accounts and a section on understanding our financials in Financial Capital are provided in the Annual Report. Please refer pages 365 to 366 and 59 to 61 of this Report.
D.1.3 Declarations by the CEO, CFO and the Board on Financial Statements
Please refer the Responsibility Statement of Chief Executive Officer and Vice President Finance on page 148 and the Directors’ Statement on Internal Control over Financial Reporting on pages 146 to 147.
D.1.4 Declarations by the Directors’ in the Directors’ Report
Declarations by the Directors as required by the Code of Best Practice on Corporate Governance are provided on page 12 and pages 124 to 127 in the ‘Annual Report of the Board of Directors on the affairs of the Bank’.
D.1.5 Preparation of Financial Statements and reporting responsibilities of auditors
The Statement of Directors’ Responsibility, Statement on Internal Controls and Report of the Auditors are provided on pages 146 and 149 respectively in the Annual Report.
INSIDE INSIGHT INSIDE INSIGHT SUPPLEMENTARY INFORMATION CORPORATE GOVERNANCE
313

Rule No. Corporate Governance Principles Compliance Status
D.1.6 Inclusion of a “Management Discussion and Analysis” report in the Annual Report.
Information Required Page Reference
Business Model 36 - 37
Industry structure and developments 44 - 46
Opportunities and threats 44 - 46
Risk management 318 - 351
Internal control systems and their adequacy 146 - 147
Governance 108 - 123
Stakeholder relationships 38 - 41
Social and environmental protection activities carried out by the Bank 92 - 101
Financial performance 153 - 285
Investment in physical and intellectual capital 80 - 81 and 88 - 89
Human resources/industrial relations activities carried out by the Bank 84 - 87
Prospects for the future 102
D.1.7 Notify serious loss in Net Assets
In the unlikely event of the net assets of the Company falling below 50% of shareholders’ Funds, the Board will summon an Extraordinary General Meeting (EGM) to notify the shareholders of the position and to explain the remedial action being taken.
This situation has not arisen during 2021.
Not Applicable
D.1.8 Disclosure of Related Party Transactions
A detailed Board approved documented process is available and has been circulated to all staff through the NDB Cloud for compliance.
Accordingly, each related party has submitted signed and dated quarterly declarations in 2021 mentioning whether they have related party transactions with the Bank as required under regulations applicable to the Bank to comply with the disclosure requirements;
The Company Secretary keeps a record of related party transactions and makes necessary disclosures accordingly;
A record on related party and related party transactions are maintained by the Bank to capture information to comply with the respective related party disclosure requirements imposed by CBSL/SEC/Accounting Standards/Auditing Standards and similar regulations.
Please refer section 3(7) (i) - 3(7) (vii) of the CBSL table on pages 303 to 304 for more details on the process adopted.
D.2 Risk management and internal control
D.2.1 Annual review of Risk Management and Internal Control systems
The Board is responsible for formulating and implementing appropriate and adequate internal control systems. The BAC has responsibility to the Board to ensure that the system of internal controls are sufficient and effective.
The Board’s Statement on the effectiveness of Bank’s Internal Control Mechanism as reviewed by the BAC is presented under the caption “Directors’ Statement on Internal Control” in this Annual Report on pages 146 and 147.
The Board also reviewed the External Auditor’s Assurance Report in this regard, pursuant to the independent audit conducted by them in accordance with Sri Lanka Standards on Assurance Engagement SLSAE 3050-Assurance Report for Banks on Directors’ Statement on Internal Control as given in the Annual Report on page 149.
D.2.2 Assessment of the principal risks and managing or mitigating the risks
The Board is responsible for determining the risk appetite for achieving the strategic objectives and formulates and implements appropriate processes for risk management and internal control systems to safeguard shareholder investments and assets of the Bank.
The IRMC assists the Board in the discharge of its duties with regard to risk management and the BAC assists the Board in the discharge of its duties in relation to internal controls. Their responsibilities are summarised in the respective Subcommittee Reports and have been formulated with reference to the requirements of the Code, the Banking Act Direction No. 11 of 2007 on Corporate Governance and the Bank’s business needs.
D.2.3 Internal audit function
The Bank has a fully-fledged Group Audit Department over which the BAC has oversight. The BAC reviews the Internal Audit function at regular intervals.
INSIDE INSIGHT INSIDE INSIGHT SUPPLEMENTARY INFORMATION CORPORATE GOVERNANCE
314

Rule No. Corporate Governance Principles Compliance Status
D.2.4 The Audit Committee to review the process and effectiveness of risk management and internal controls, and document to the Board
The BAC reviewed the internal controls and procedures at six meetings held during 2021.
The minutes of the BAC meetings are tabled at the meetings of the Board.
The Internal Audit Department carries out regular reviews on the internal control system including internal control over financial reporting. The BAC reviews and evaluates the effectiveness of the internal control system including the internal controls over financial reporting. The IRMC reviews processes relating to the risk management framework of the Bank. The BAC Report and the IRMC Report are detailed on pages 136 to 138 and 133 to 135 of this Annual Report.
D.2.5 Maintaining a sound system of internal control and the contents of the Statement of Internal Control.
Please refer pages 136 to 138 for the BAC Report and refer pages 146 to 147 for Directors’ Statement of Compliance on Internal Controls in the manner in which the Board complied with this requirement.
D.3 Board Audit Committee
D.3.1 Composition of Audit Committee
The Board Audit Committee consists of three Non-Executive Directors, majority of who are Independent. The Chairman is an Independent Non-Executive Director who has relevant experience in financial reporting and control. Members are selected to provide a broad set of financial, commercial and other relevant experience to meet the Committee’s objectives.
Other Members also have financial, commercial and other relevant experience to meet the Committee’s objectives.
D.3.2 Terms of reference of the Audit Committee
Terms of Reference of the BAC is clearly defined in the Charter of the Board Audit Committee approved by the Board of Directors, which was last revised and updated in January 2020. This clearly explains the purpose of the Committee, its duties and responsibilities together with the scope and functions of the Committee. The Committee mainly deals with matters pertaining to statutory and regulatory compliance in financial reporting and matters with regard to the External Auditors and Internal Audit.
D.3.3 Disclosures regarding Audit Committee.
Please refer pages 136 to 138 of the BAC report D.4 Related party transactions review committee
D.4.1 Related party and related party transactions will be as defined in LKAS 24
The Bank has in place a Board approved Related Party Policy which ensures that necessary processes are implemented by the Bank to identify, approve, monitor and disclose related party transactions as required under Corporate Governance Direction No. 11 of 2007 (as amended), Section 9 of the Listing Rules of the Colombo Stock Exchange on Related Party Transactions and identification and disclosure requirements in accordance with LKAS 24.
D.4.2 Composition of the Related Party Transactions Review Committee
In terms of Section 9 of the Listing Rules issued by Colombo Stock Exchange (CSE) the Bank has constituted a Board appointed Related Party Transactions Review (RPTR) Committee. The RPTR Committee consists exclusively of Non-Executive Directors and majority of whom are Independent.
D.4.3 Terms of Reference of the Related Party Transactions Review Committee
The Bank has a Board approved TOR and a Board approved Related Party Transactions Policy in place which addresses requirements under this Code.
D.5 Code of business conduct and ethics
D.5.1 Code of Conduct for Directors and Senior Management
The Bank has in place an internally developed Board-approved internal Code of Corporate Governance applicable to the Board and Key Management Personnel setting out best practices relating to their business conduct and ethics. In addition the Board approved Compliance Policy and Code of Conduct ensures that the Bank stays ahead of the best practices related to business conduct and ethics. Please refer page 116 of the Corporate Governance Report on this aspect.
D.5.2 Identification and reporting of material and price sensitive information
The Bank has in place a Board approved Disclosure Policy which ensures that material and price sensitive information is promptly identified and reported in accordance with the relevant regulations.
INSIDE INSIGHT INSIDE INSIGHT SUPPLEMENTARY INFORMATION CORPORATE GOVERNANCE
315

Rule No. Corporate Governance Principles Compliance Status
D.5.3 Monitoring and disclosure of shares purchased by any Director, KMP or any other employee involved in financial reporting
The Bank has in place a Board approved Group Securities Trading Policy which restricts Directors and employees from trading in the NDB share during certain specified blackout periods to ensure that they do not trade based on price sensitive information. Further this policy ensures that there is no speculative trading on the NDB share and a minimum holding requirement. All share trades carried out by the Directors and employees of the Bank are monitored to ensure compliance.
D.5.4. Affirmative declaration by the Chairman of compliance with Code of Business Conduct & Ethics
Please refer page 108 of the Bank’s Corporate Governance Report where the Chairman has affirmed that there has been no violations of the internal Code of Corporate Governance during 2021 by any of the Directors or any member of the Leadership Team and there have been no material violations of the Compliance Policy and Code of Conduct against the employees of the Bank.
D.6 Corporate governance disclosures
D.6.1 Disclosure of Corporate Governance
The Bank’s Corporate Governance practices are in accordance with the Banking Act Direction No. 11 of 2007 (as amended) issued by CBSL, the Code of Best Practice on Corporate Governance 2017 issued by the ICASL as well as the Corporate Governance Rules for Listed Companies issued by the CSE. The requirement is met with the presentation of this Corporate Governance Report from pages 108 to 123 of the Annual Report and its relevant annexures on pages 292 to 317.
Section 2 Shareholders
E Institutional investors
E.1 Shareholder voting
E.1.1 Encourage voting at AGM
All shareholders are encouraged to participate at General Meetings and cast their votes.
The AGM is used as an effective channel to create a dialogue between the shareholders and the Board of Directors. Also the Chairman and CEO have regular structured meetings with institutional shareholders. Board members are briefed about the matters discussed at such meetings. Please refer the Investor relations section on pages 352 to 369.
E.2 Evaluating the corporate governance initiatives of the Bank
Institutional investors are encouraged to give due weight to all relevant factors in Board structure and composition. F. Other investors
F.1 Independent advice for decision making when investing or divesting directly in shares of the Bank
The Annual Report contains sufficient information for a potential investor to carry out his/her own analysis. The following reports aim to provide a balanced overall assessment of the Bank’s activities, performance and prospects.
Chairman’s Message on pages 13 to 14
CEO’s Review on pages 15 to 17
Management Discussion and Analysis on page 58 onwards
Annual Financial Statements on pages 153 to 285
Further, Interim Financial Statements provided each quarter, provide sufficient information to enable the Retail Investors to make informed judgments regarding the performance of the Bank.
Additionally, there is a separate part of the Bank’s website dedicated to Investor Relations which provides this information online to all investors/shareholders.
F.2 Encourage voting by individual shareholders in General Meetings
Individual shareholders are encouraged to participate at the General meetings of the Bank and exercise their voting rights.
INSIDE INSIGHT INSIDE INSIGHT SUPPLEMENTARY INFORMATION CORPORATE GOVERNANCE
316

Rule No. Corporate Governance Principles Compliance Status
G. Internet of things and cyber security
G.1 Process to identify how in the organisation’s business model will mitigate the Cyber-security risks
As per the Bank’s IT security governance structure, the Information Security Unit defines the policies required to control the Bank’s information security. IT department is responsible in implementing and monitoring the same while escalating any anomalies to the Bank’s Senior Management which are then escalated to the IRMC.
As per the Information Security Policy in the Bank, external devices access to the Bank’s network has been restricted. Any exceptional requirement will be approved by the higher Management.
G.2 Appointment of Chief Information Security Officer (CISO) and Policies for cyber-security risk management
The Bank‘s Information Security Unit has implemented information security policies and performs periodic reviews. G.3 Allocate regular and adequate time on the Board meeting agenda for discussions about cyber-risk
management
Cyber security risks are discussed at IT Steering Committee as and when required and quarterly at IRMC as an agenda item of Information Technology Risk and Cyber Risk.
G.4 Independent periodic review and assurance on effectiveness of the cybersecurity risk management
In 2021, Vulnerability Assessment & Penetration Testing & a Security review were done by independent industry experts mainly on publicly open services & channels. This will be further expanded in 2022.
G.5 Disclosure of the process to identify and manage cyber security risks
Please refer page 126 of the Board of Directors report on the affairs of the Bank and page 121 of the Corporate Governance Report which details the process to identify and manage cyber-security risks.
H Environment, society and governance (ESG)
H.1.1 ESG reporting
Please refer pages 55 to 57 for details H.1.2 Environmental factors
Please refer pages 97 to 101 for details H.1.3 Social factors
Please refer pages 92 to 96 for details H.1.4 Governance
Please refer pages 55 to 57 for details H.1.5 Board’s role on ESG factors
Please refer page 127 for details
INSIDE INSIGHT INSIDE INSIGHT SUPPLEMENTARY INFORMATION CORPORATE GOVERNANCE
317

RISK MANAGEMENT
INSIDE INSIGHT SUPPLEMENTARY INFORMATION
THE RISK LANDSCAPE IN 2021
The risk landscape of Sri Lankan banks continued to be dominated by pandemic-led disruptions in 2021, with waves of infections and resultant lockdowns affecting operations. On the other hand, these challenges were compounded by macro-economic stress reflecting the country’s foreign currency shortage and downgrade of the sovereign rating which had broad-based implications on the Banks’ risk profile during the year. Against this backdrop, CROs, risk functions and key decision makers were required to strengthen risk management systems to successfully navigate their organisations through unchartered waters in these turbulent times.
Lockdowns for several months during the 2nd and 3rd quarter of the year inevitably impacted our operations and the Group accelerated its shift towards digital platforms. Branch operations continued uninterrupted during the year, although given limitations in staff etc, exposure to operational risks escalated during the year.
PANDEMIC-LED DISRUPTIONS REGULATORY DEVELOPMENTSMACRO-ECONOMIC CONDITIONS
The CBSL implemented several measures to prevent the outflow of foreign currency from the country, which had a significant impact on banking operations. The regulator also pursued a tightening monetary policy stance during the year.
While businesses have demonstrated adaptation to pandemic-led disruptions, Sri Lanka’s government finances and overall economic conditions deteriorated during the year reflecting shortage in foreign currency, escalating inflation and downgrade of the sovereign rating. Interest rates recorded a gradual uptick by the latter part of the year following a tighter monetary policy stance.
Key dynamics shaping the Group’s risk landscape in 2021 is summarised below; please refer to page 44 for further information.
With the pandemic accelerating the shift towards digital platforms, banks have seen an inevitable increase in technology and cyber-security related risks which could lead to loss of customer data, reputational damage, system failures and financial crimes.
UNPRECEDENTED SHIFT TOWARDS DIGITAL PLATFORMS
With a portion of employees working remotely, banks are facing elevated operational and people-related risks which will require robust risk management practices to ensure organisational resilience.
NEW WORKING ARRANGEMENTS AND HYBRID OPERATING MODELS
318

INSIDE INSIGHT INSIDE INSIGHT SUPPLEMENTARY INFORMATION RISK MANAGEMENT
Board-approved articulation of the type and level of risk the Bank is willing to assume
Strong culture that promotes responsible, ethical and professional behaviour
Driven by strategic aspirations and relevant considerations from the external environment
Sound risk management processes to actively identify, measure, control, monitor and report risks inherent in products, activities, processes, systems and exposures
Robust governance structure with clearly-defined, transparent and consistent lines of responsibility
Sufficient resources and systems infrastructure
Risk Appetite and Strategy Risk Culture
Capital Management Risk Policies & Processes
Governance & Oversight Infrastructure
BANK’S RISK PROFILE AT A GLANCE
Qu
alit
y p
ort
folio
Pru
de
nt c
ap
ita
l a
nd
liq
uid
ity
po
siti
on
Ro
bu
st r
isk
ma
nag
eme
nt
fra
mew
ork
dri
vin
g
acco
un
tab
ility
• A diversified portfolio of loans and advances and income streams across customer segments, industry sectors and products
• Stringent and proactive monitoring of large corporate exposures
• Portfolios segregated as minimal, short term, medium term and long-term stress and action taken accordingly to support customers whilst safeguarding the Bank’s interest
• Strong capitalisation levels
• Diverse funding sources
• Substantial portfolio of high-quality liquid assets that can be realised in the event of liquidity stress
• Healthy deposit roll over rates supporting strong liability base
• Well-defined risk appetite statement aligned to the Bank’s strategy and approved by the Board, which is reviewed and updated regularly
• Continuous monitoring of the risk profile to ensure it remains within the risk appetite
• Regular stress testing to assess vulnerabilities
• Review and adjust risk exposures, underwriting standards and limits in line with anticipated challenges in the external environment and expectations
• Highly-skilled, capable and experienced team
Asset quality maintained with Gross NPA ratio of
4.65%
Capital Adequacy Ratio of
15.42%
Liquidity Coverage Ratio of
171.33%
Deposit roll over rate of more than
80%
76%
of exposures in investment grades
KPIs
THE BANK’S RISK MANAGEMENT APPROACH
The Bank’s approach to risk management is underpinned by a comprehensive Integrated Risk Management (IRM) Framework, which is regularly reviewed and strengthened to remain relevant in an increasingly dynamic operating landscape. The Board-approved framework clearly defines governance structures and the process for identifying, measuring, monitoring, and controlling the Bank’s risk exposures. Permeating across all levels of the organisation, the framework has underpinned the creation of a risk-conscious culture. The framework was reviewed and revised during the year, in view of the rapid changes in the operating environment.
OTHER RIS
KS
PR
INC
IPAL
RISKS
Risk Appetite
&
Strategy
Ris
k P
olic
ies
&
Pro
cess
es
Infrastructure
Risk Culture
Governance &
Oversight
Cap
ital M
anag
emen
t
MAIN OBJECTIVES
• To establish common principles and standards for the management and control of all risks
• Provide a shared framework and language to improve awareness of risk management processes among all stakeholders
• To provide clear accountability and responsibility for risk management
• To ensure consistency throughout the Bank in risk management
The Risk Management narrative set out in the subsequent pages has been structured in accordance with the key elements of the Bank’s Integrated Risk Management Framework.
Integrated Risk Management Framework
EMERGING RISKS
319

INSIDE INSIGHT SUPPLEMENTARY INFORMATION RISK MANAGEMENT
RISK UNIVERSE
As complexities in the operating landscape intensify, it is evident that individual risks through their interconnectivity can insert significant pressure on the strategy, operating model, and performance of organisations. The Bank’s risk universe has been categorised as principal risks (such as Credit Risk, Market Risk and Operational Risk), other risks (such as Liquidity Risk, Residual Credit Risk, Legal Risk, Strategic Risk, Governance Risk, Cross-border Risk, Settlement Risk, Reputational Risk, Model Risk, Environmental and Social Responsibility Risk) and emerging risks, which represent external trends that could affect the Bank’s performance but the impact and probability of which is difficult to assess.
RISK APPETITE & STRATEGY
Risk Appetite is defined as the quantum of risk the Bank is willing to assume in achieving its strategic objectives and ensuring maintenance of the desired risk profile. It is defined by the Board, taking into consideration our vision, values, strategy and sustainability aspirations along with our risk capacity. The Risk Appetite Framework (RAF) including risk tolerance limits are defined by the Board in consultation with the management and are articulated through limits or qualitative checkpoints. It is reviewed and updated based on emerging developments thereby providing clear direction for ongoing operations. In the event of a breach of a risk appetite threshold, risk management strategies and controls are implemented to normalise the exposures to the accepted range. During the year, the risk appetite of the Bank was reviewed considering the challenges in the operating environment.
Safeguarding our reputation and brand
Engaging in client oriented businesses that we understand
Maintaining a balance between risk and return
Doing the right thing for our clients and stakeholders
Meeting regulatory expectations and/or identifying and having plans in place to address any issues in a timely manner
Maintaining a credit rating of A or better (lka Fitch Rating)
RAF OBJECTIVES
CAPITAL MANAGEMENT
Effective capital management through proactively managing the Bank’s capital position, mix and allocation is crucial in protecting the Bank against insolvency while safeguarding the financial position and reputation. The Bank’s approach to capital management is driven by strategic objectives and guided by the Basel principles.
BASEL III FRAMEWORK
Basel III capital standards strive to strengthen the quantity and quality of capital in Banks.
PILLAR I – MINIMUM CAPITAL REQUIREMENT
The objective of minimum capital requirements under Pillar I of the Basel III framework is to ensure that banks hold sufficient capital for Credit, Market, and Operational Risks.
• Currently using the Standardised Approach for Credit Risk minimum capital computation purposes
• Rolled out rating models with the assistance of CRISIL Risk and Infrastructure Solutions Ltd, India in 2014
• The internal rating models were validated by KPMG
• Use of the Standardised Measurement Approach to compute minimum capital requirement
• Rolled out its Value at Risk (VaR) models with the assistance of CRISIL Risk & Infrastructure Solutions Ltd
• Use of the Basic Indicator Approach (BIA) to compute the capital charge
• Parallel computation of capital charge using Alternative Standardised Approach (ASA)
Credit Risk Market Risk Operational Risk
PILLAR II – SUPERVISORY REVIEW PROCESS
The Pillar II - Supervisory Review Process (SRP) requires banks to implement an internal process, called the Internal Capital Adequacy Assessment Process (ICAAP), for assessing capital adequacy in relation to the risk profiles as well as a strategy for maintaining capital levels. The Pillar II also requires the supervisory authorities to subject all banks to an evaluation process/ SRP. The Bank has in place an ICAAP since January 2013 which has strengthened its’ risk management practices and capital planning process.
The Bank’s capital management objectives can be summarised as follows:
• Maintain sufficient capital to meet minimum regulatory capital requirements
• Hold sufficient capital to support the Bank’s risk appetite
• Allocate capital to businesses to support the Group’s strategic objectives
• Ensure that the Bank maintains capital in order to withstand the impact of potential stress events
The Bank identified nineteen material risks based on directions given by CBSL and self-assessment of most important risk categories which require a separate mention from an ICAAP perspective. These risks are Credit Risk, Market Risk, Operational Risk, Concentration Risk, Interest Rate Risk in Banking Book, Liquidity Risk, Under-estimation of Credit Risk, Residual Risk, Strategic Risk, Reputational Risk, Legal Risk, Compliance Risk, Governance Risk, Model Risk, Settlement Risk, Environmental and Social Responsibility Risk, Group Risk, Cross-border Risk and Risks in Off Balance Sheet exposures.
Capital Planning
The Annual Capital Planning process involves detailed planning of the strategic capital plan over a three to five year horizon. The plan highlights the capital projections, capital requirements, levels of capital and capital mix to support the Bank’s business plan and strategic objectives. The projected capital also takes into consideration the Bank’s organic growth.
Key developments in 2021 were as follows:
• Review of ICAAP in line with the Voyage 2025 strategic aspirations and priorities
• Equity infusion of LKR 9.46 Bn, comprising a LKR 8 Bn rights issue and a private placement of LKR 1.46 Bn with Norfund
• Oversubscribed issue of LKR 8 billion - Basel III compliant listed, rated, unsecured, subordinated, and redeemable debentures
320
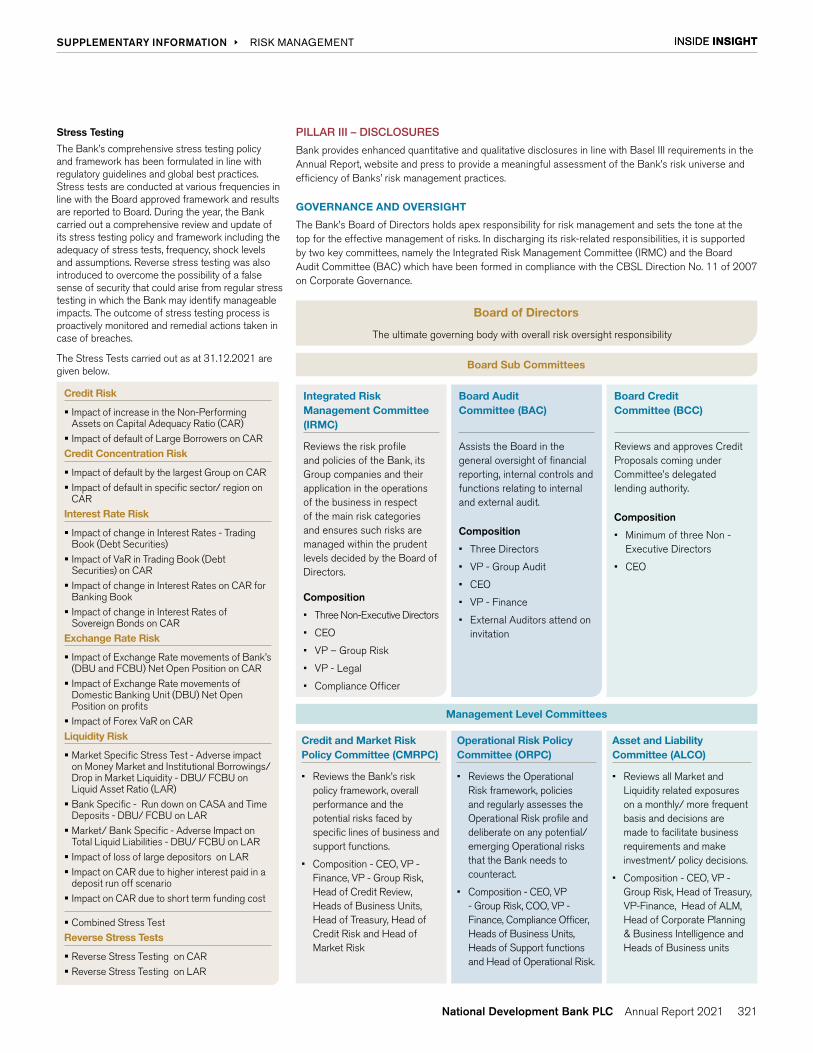
INSIDE INSIGHT INSIDE INSIGHT SUPPLEMENTARY INFORMATION RISK MANAGEMENT
Stress Testing
The Bank’s comprehensive stress testing policy and framework has been formulated in line with regulatory guidelines and global best practices. Stress tests are conducted at various frequencies in line with the Board approved framework and results are reported to Board. During the year, the Bank carried out a comprehensive review and update of its stress testing policy and framework including the adequacy of stress tests, frequency, shock levels and assumptions. Reverse stress testing was also introduced to overcome the possibility of a false sense of security that could arise from regular stress testing in which the Bank may identify manageable impacts. The outcome of stress testing process is proactively monitored and remedial actions taken in case of breaches.
The Stress Tests carried out as at 31.12.2021 are given below.
Credit Risk
� Impact of increase in the Non-Performing Assets on Capital Adequacy Ratio (CAR)� Impact of default of Large Borrowers on CARCredit Concentration Risk
� Impact of default by the largest Group on CAR� Impact of default in specific sector/ region on
CARInterest Rate Risk
� Impact of change in Interest Rates - Trading Book (Debt Securities) � Impact of VaR in Trading Book (Debt
Securities) on CAR� Impact of change in Interest Rates on CAR for
Banking Book� Impact of change in Interest Rates of
Sovereign Bonds on CARExchange Rate Risk
� Impact of Exchange Rate movements of Bank’s (DBU and FCBU) Net Open Position on CAR� Impact of Exchange Rate movements of
Domestic Banking Unit (DBU) Net Open Position on profits� Impact of Forex VaR on CARLiquidity Risk
� Market Specific Stress Test - Adverse impact on Money Market and Institutional Borrowings/ Drop in Market Liquidity - DBU/ FCBU on Liquid Asset Ratio (LAR)� Bank Specific - Run down on CASA and Time
Deposits - DBU/ FCBU on LAR� Market/ Bank Specific - Adverse Impact on
Total Liquid Liabilities - DBU/ FCBU on LAR� Impact of loss of large depositors on LAR� Impact on CAR due to higher interest paid in a
deposit run off scenario� Impact on CAR due to short term funding cost
� Combined Stress TestReverse Stress Tests
� Reverse Stress Testing on CAR� Reverse Stress Testing on LAR
PILLAR III – DISCLOSURES
Bank provides enhanced quantitative and qualitative disclosures in line with Basel III requirements in the Annual Report, website and press to provide a meaningful assessment of the Bank’s risk universe and efficiency of Banks’ risk management practices.
GOVERNANCE AND OVERSIGHT
The Bank’s Board of Directors holds apex responsibility for risk management and sets the tone at the top for the effective management of risks. In discharging its risk-related responsibilities, it is supported by two key committees, namely the Integrated Risk Management Committee (IRMC) and the Board Audit Committee (BAC) which have been formed in compliance with the CBSL Direction No. 11 of 2007 on Corporate Governance.
Board of Directors
The ultimate governing body with overall risk oversight responsibility
Board Sub Committees
Management Level Committees
Integrated Risk Management Committee (IRMC)
Reviews the risk profile and policies of the Bank, its Group companies and their application in the operations of the business in respect of the main risk categories and ensures such risks are managed within the prudent levels decided by the Board of Directors.
Composition
• Three Non-Executive Directors
• CEO
• VP – Group Risk
• VP - Legal
• Compliance Officer
Board Audit Committee (BAC)
Assists the Board in the general oversight of financial reporting, internal controls and functions relating to internal and external audit.
Composition
• Three Directors
• VP - Group Audit
• CEO
• VP - Finance
• External Auditors attend on invitation
Board Credit Committee (BCC)
Reviews and approves Credit Proposals coming under Committee’s delegated lending authority.
Composition
• Minimum of three Non - Executive Directors
• CEO
Credit and Market Risk Policy Committee (CMRPC)
• Reviews the Bank’s risk policy framework, overall performance and the potential risks faced by specific lines of business and support functions.
• Composition - CEO, VP - Finance, VP - Group Risk, Head of Credit Review, Heads of Business Units, Head of Treasury, Head of Credit Risk and Head of Market Risk
Operational Risk Policy Committee (ORPC)
• Reviews the Operational Risk framework, policies and regularly assesses the Operational Risk profile and deliberate on any potential/ emerging Operational risks that the Bank needs to counteract.
• Composition - CEO, VP - Group Risk, COO, VP - Finance, Compliance Officer, Heads of Business Units, Heads of Support functions and Head of Operational Risk.
Asset and Liability Committee (ALCO)
• Reviews all Market and Liquidity related exposures on a monthly/ more frequent basis and decisions are made to facilitate business requirements and make investment/ policy decisions.
• Composition - CEO, VP - Group Risk, Head of Treasury, VP-Finance, Head of ALM, Head of Corporate Planning & Business Intelligence and Heads of Business units
321

INSIDE INSIGHT SUPPLEMENTARY INFORMATION RISK MANAGEMENT
GOVERNANCE STRUCTURE
The risk governance structure ensures accountability and ownership, whilst facilitating an appropriate level of independence and segregation of duties. The structure is based on the three lines of defence and defines the lines of authority, roles and responsibilities to efficiently manage risk across the Bank. The activities carried out during the year by the above mentioned Board Sub Committees is covered in detail in the Board Sub-committee Reports.
Ro
leR
esp
ons
ibili
tyA
cti
viti
es
Managing Business Line Operations
Accountability with decentralised primary responsibilities
Risk Management & Compliance
Centralised oversight and independently challenges the first line
Independent verification
Assurance and review
GROUP RISK MANAGEMENT DIVISION
The Bank’s Risk Management Division is independent of the business units and profit targets and reports directly to the Integrated Risk Management Committee. Each unit within the Risk Division contributes to the management of risk and co-ordinates with business functions to ensure that risk considerations are proactively integrated into the Bank’s culture.
Loan Review Unit conducts Loan Review Mechanism (LRM) activities including identifying potential problematic loans/ facilities (post approval/granting) and providing objective recommendations for remedial action to line management. In order to ensure the independence and to strengthen the pre-approval process the Credit Review Division which handles the pre credit review/approvals was taken under the Group Risk Management Division
RISK CULTURE
A culture of risk awareness is fundamental to the effective management of risks within the Bank and serves as the foundation upon which a strong risk management structure is built. The Bank’s commitment is clearly demonstrated through the establishment of strong policies and guidelines and ensuring that non-compliance risks are effectively managed. The key characteristics of a strong risk culture are identified as follows:
Commonality of Purpose, Universal A
doption
Understanding the Value of
A
Lea
rnin
g O
rgan
isat
ion
Values and Ethics and Application
Effective Risk Management
1st Line of Defense
2nd Line of Defense
3rd Line of Defense
• Primary responsibility for identifying, managing and reporting risk
• Self-Assessment of Risk and Control
• Compliance with all policies and procedures
Risk Management Activities
• Develop and implement the risk management framework, policies, systems, procedures and tools
• Providing support to the business units, review and report key risks to the IRMC
Compliance Activities
• Regulatory Adherence
• Regulatory reporting
• Anti-money laundering
Internal Audit Activities
• Review effectiveness of risk management practices and internal control framework
• Confirm level of compliance
• Identify gaps, control weaknesses in processes and highlights same to the relevant stakeholders
External Audit Activities
• Reporting to shareholders, giving an opinion on the true and fair view of the financial statements and reviewing internal controls over financial reporting process
Board of Directors
Business Line/ Credit CommitteeGroup Risk Management/
ComplianceInternal Audit
322

INSIDE INSIGHT INSIDE INSIGHT SUPPLEMENTARY INFORMATION RISK MANAGEMENT
Commonality of Purpose, Universal A
doption
Understanding the Value of
A
Lea
rnin
g O
rgan
isat
ion
People’s individual interests, values and ethics are aligned with those of the Bank
Bank’s Context
• Each individual is committed to upholding Bank values in line with the Compliance Policy and Code of Conduct
Risk is considered in all activities, from strategic planning to day-to-day operations
Bank’s Context
• Adoption of the risk governance model
• Operational Risk Coordinators in all vital departments
The collective ability of the organisation to manage risk more effectively is continuously improving
Bank’s Context
• E-Learning modules in Risk Management and Compliance
People understand the value of risk management
Bank’s Context
• Awareness sessions on risk and compliance focused areas
Values and Ethics and Application
Effective Risk Management
RISK POLICIES & PROCESSES
CREDIT RISK
� Definition: Credit risk is the risk of financial loss if a customer or counterparty fails to meet a payment obligation under a contract. It arises principally from direct lending, trade finance and leasing business, and from off-balance sheet products such as letters of credit and guarantees. As the Bank’s most significant risk exposure, credit risk generates the largest regulatory capital requirement.
Definition: Credit risk is the risk of financial loss if a customer or counterparty fails to meet a payment obligation under a contract. It arises principally from direct lending, trade finance and leasing business, and from off-balance sheet products such as letters of credit and guarantees. As the Bank’s most significant risk exposure, credit risk generates the largest regulatory capital requirement.
OBJECTIVES OF CREDIT RISK MANAGEMENT
• Ensure optimal risk-reward pay-off for the Bank to maximise returns
• Maintain the quality of the portfolio by minimising non-performing loans and probable losses
• Maintain a well-diversified portfolio by prudently managing the assets to limit concentration to any industry, sector or individual customer
• Ensure that exposures to any industry or customer are determined by the regulatory guidelines, clearly defined internal policies, debt service capability and balance sheet management guidelines
• Avoid all situations of conflict of interest and report all insider-related credits to appropriate bodies
Characteristics
323

A WELL-DEFINED CREDIT POLICY APPROVED BY THE BOARD OF DIRECTORS• Set the Credit culture of the Bank
• Specify target markets for lending
• Specify prohibited lending
• Set acceptable risk parameters
• Set remedial and recovery actions
STRUCTURED AND STANDARDISED CREDIT APPROVAL• Credit is extended only to suitable and well-identified customers
• The primary source of repayment for each credit is from an identifiable cash flow from the counterparty’s normal business operations or other financial arrangements
• Adopt a pricing mechanism that reflects variation in the risk profile of various exposures to ensure that higher risks are compensated by higher returns
• The financial performance of borrowers is to be continuously monitored and frequently reviewedDELEGATION OF AUTHORITY
• Three Credit Committees representing the Business Lines
• The delegated authority limits are reviewed periodically and the Bank follows the four-eye principle
• Lending decisions are based on detailed credit evaluation
RISK RATING• System-driven obligor risk rating, facility risk rating and retail score
cards to suit the diverse client portfolios of the Bank
• Incorporating both quantitative and qualitative parameters
PRUDENTIAL LIMITSMaximum exposure limits on;
• Single Borrower/ Group Exposures
• Prudential Group Exposure Limits
• Substantial Exposures
• Industry/ Economic Sector Limits
• Cross-border/ Country Exposure Limits
PORTFOLIO MANAGEMENT• Evaluates exposures on the basis of industry concentration, rating
quality, internally established pre specified early warning indicators
• Regular portfolio reviews and stress testing
• The exposures in off balance sheet products are treated with utmost care
• Rapid portfolio reviews in case of any geopolitical or natural disaster events
IMPAIRMENT• Board approved policy
• Clearly defined process
• Impairment based on Expected Credit Loss
CREDIT RISK MITIGATION• Ways out analysis
• Comprehensive and legally enforceable documentation of credit transactions
• Obtaining of collateral in line with the Bank’s policy and ensuring enforceability
RISK PRICING• Price the credit risk using scientific methods
POST SANCTION REVIEW AND MONITORING• Warning signals are identified
• Watch listing process
• Non-performing assets are identified at an early stage
CREDIT MANAGEMENT PROCESS
INSIDE INSIGHT SUPPLEMENTARY INFORMATION RISK MANAGEMENT
DEVELOPMENTS IN 2021
2
3
7
4
8
1
56
910
Context to Credit Risk management in 2021
• Increased pressure on customers’ repayment capabilities stemming from macro-economic pressure and pandemic-led disruptions
• Expiry of moratoriums for selected facilities
• Increasing interest rate scenario
Segregation of portfolio into 4 stress segments (i.e minimal stress, short-term stress, medium-term stress and long-term stress) and increasing monitoring through quarterly reviews. Measures such as sector GDP contribution, Industry vs Bank NPL, estimated recovery time, changes in government policies etc. were used in arriving at the stress sectors. Stressed sectors were reviewed quarterly, and the segmentation was shared with the Business lines for necessary action.
Continuous monitoring of loans under moratorium on a monthly/ quarterly basis and update of top management/ Board IRMC. Business Lines were also advised to take appropriate early action on loans coming out of Moratorium in December 2021 to prevent slippage in to NPL.
Strengthening collateral management through implementing a process for random generation of valuers for the valuation of immovable property, ensuring that the Bank was adequately mitigated from over reliance of certain preferred valuers which could lead to issues with valuation and losses to the Bank.
Continuous follow up through the watch listing process which enables close monitoring of stressed clients and to understand their plans for recovery and offer customised repayment plans. The Board Credit Committee directly reviews quarterly management reports on high risk watch listed advances.
324

Portfolio at a glance
Credit Risk Exposure - 31 December 2021
On-Balance Sheet Exposure
(LKR ’000)
Off-Balance Sheet Exposure
(LKR ’000)
Total Exposure
(LKR ’000)
Individual Impairment (LKR ’000)
Collective Impairment (LKR ’000)
Net Exposure
(LKR ’000)
Financial investments 149,164,840 - 149,164,840 255,344 2,652,491 146,257,005Loans and Receivables to Other Customers 526,141,042 235,175,766 761,316,808 11,384,328 12,247,256 737,685,224
INSIDE INSIGHT INSIDE INSIGHT SUPPLEMENTARY INFORMATION RISK MANAGEMENT
32%
1%
30%
22%23%
1%
24%
24%
22%
21%
2020
2021
Business Line-wise Composition of Portfolio - 2020/2021
Wholesale Banking
Project Finance
Business Banking
Retail
Other
Western
North Western
Southern
Central
Eastern
Sabaragamuwa
North Central
Northern
Uva
1%
73%
1%3%
5%
5%
4%5%
3%
Geographical Concentration of Portfolio - 31.12.2021
Based on Sri Lanka’s economic activity, the highest concentration of domestic portfolio was in the Western Province with a contribution of 73% during the year although the branch network is spread throughout the country
The portfolio is well balanced with around 32% concentrated in Wholesale Banking and Retail Banking contribution improving to 22%
Rated Portfolio Concentration
About 76% of the rated portfolio was concentrated in investment grades, in line with the risk appetite set by the Board.
AAA
0% 10% 20% 30% 40% 50% 60% 70% 80% 90% 100%
AA A+ A BBB+ BBB BB B C D
5%0% 12% 22% 22% 14% 7% 5%3% 10%
Rated Portfolio Concentration
Single Name Concentration
Bank complied with regulatory limits and also the internal limits set by the Board on Group and Single Borrower concentrations which are more stringent than those prescribed by the regulator.
The substantial exposures of the Bank accounted for only 116% of the capital base and was well within the internal limit.
Sector Concentration
Bank maintained a well-diversified portfolio with no over concentration to any particular sector. Bank was also in compliance with the minimum lending requirement of 10% to Agricultural sector.
NPL and Provisioning
The Bank’s NPL ratio was 4.65% as at end of the year and was below the NPL ratio of Medium Banks reflecting a better-quality portfolio than that of peers in industry.
LKR ’000
General Provision 2,133,938 Non Performing - Specific Provisions
12,403,842
Non Performing - Judgemental - Specific Provisions
3,603
Charges 43,174 Total Specific Provision on NPL 12,450,620 Performing - Judgemental - Specific Provisions
20,287
Total Loan Loss Provision 14,604,845
Regulatory provisioning mandated by CBSL
325

NPL and Regulatory (CBSL) Provisioning on Balance Sheet Exposures as at 31 December 2021
NPL Amount Provisions as at 31 December 2021
Collateral Value considered for provisioning purposes
Net Exposure
LKR ’000 LKR ’000 LKR ’000 LKR ’000
PawningSpecial Mention 55,057 - - 55,057 Substandard 45,145 9,029 - 36,116 Doubtful 8,593 4,296 - 4,296 Loss 1,713 1,713 - - HousingSpecial Mention 88,306 - - 88,306 Substandard 358,602 22,863 244,287 335,739 Doubtful 180,452 31,063 118,326 149,389 Loss 594,048 224,327 369,721 369,721 Consumer LoansSpecial Mention 423,906 - - 423,906 Substandard 9,836 1,967 - 7,869 Doubtful 81,632 40,816 - 40,816 Loss 1,680,308 1,680,308 - - Leases and Hire PurchaseSpecial Mention 267,604 - - 267,604 Substandard 332,508 66,502 - 266,007 Doubtful 213,277 106,639 - 106,639 Loss 688,807 688,807 - - Credit CardsSpecial Mention 295,765 - - 295,765 Substandard 380,552 95,138 - 285,414 Doubtful 51,791 25,896 - 25,896 Loss 77,404 77,404 - - Working Capital FacilitiesSpecial Mention 1,100,234 - - 1,100,234 Substandard 1,348,504 67,235 1,012,329 1,281,269 Doubtful 469,262 234,631 - 234,631 Loss 2,511,624 2,124,100 387,524 387,524 Term LoansSpecial Mention 513,214 - - 513,214 Substandard 890,718 169,190 44,766 721,527 Doubtful 475,277 97,914 279,448 377,363 Loss 8,336,917 4,568,819 3,768,098 3,768,098 Overdraft FacilitiesSpecial Mention 68,056 - - 68,056 Substandard 120,663 23,803 1,647 96,860 Doubtful 240,923 76,494 87,935 164,429 Loss 2,447,872 1,907,063 540,809 540,809 OtherSpecial Mention - - - - Substandard - - - - Doubtful - - - - Loss 57,826 57,826 - - Total 24,416,395 12,403,842 6,854,890 12,012,553
Exposures under Moratorium
During the last quarter of 2021, the Bank granted concessions to clients based on the CBSL circular No. 08 of 2021 and CBSL circular No. 10 of 2021 aiming to support pandemic affected businesses and individuals. As at 31st December 2021, 14% of the Bank's portfolio was under extended moratoriums based on the aforementioned circulars, of which only 2% was in non-performing status.
INSIDE INSIGHT SUPPLEMENTARY INFORMATION RISK MANAGEMENT
326

MARKET RISK
Definition: Market risk is the risk to earnings or capital due to changes in market driven variables that affect the value of trading and accrual positions. Bank’s portfolios are exposed to these variables and correlations in varying magnitudes.
Market risk categories
Key Market risk category
Risk component Description Measurement tools Severity Impact Exposure
Interest rate Risk of loss arising from movements or volatility in interest rates
Re-pricing Holding assets and liabilities and off-balance sheet positions with different principal amounts, maturity dates or re-pricing dates, which create exposure to interest rate changes
Re-pricing gaps and Interest rate sensitivity limits
low Medium Medium
Yield curve Arises when unanticipated shifts occur in the slope and the shape of the yield curves.
Rate shocks, VaR ( Value at Risk) analysis, Duration, holding period limit, PVBP analysis, Price sensitivity and MIS reports
High High High
Basis Differences in the relative movement of rate indices that are used to price instruments with similar characteristics
Rate shocks, VaR analysis and MIS reports Low Low Low
Foreign exchange
Risk of losses arising from the movements in foreign exchange rates by holding foreign currency denominated assets and liabilities with different currencies and maturities.
Regulatory Net Open Position (NOP) limit, individual and aggregate currency exposure limits, VaR analysis, gap limits, scenario analysis, stress testing and stop loss limits
High High High
Equity Possible losses arising out of prices or volatilities in individual equities
Mark to Market calculations Low Low Negligible
Commodity Exposure to changes in prices and volatilities of individual commodities
Low Low Nil
Market risk arises mainly from interest rate risk and FX risk, where the non-trading portfolio (Banking Book) which accounted for 95% of the total assets and 92% of total liabilities excluding shareholder funds. The Bank had a negligible exposure to equity risk and was insensitive to commodity related price risk.
The market risk exposure by trading and non-trading portfolios of the Bank is set out in the table below.
As at 31 December 2021 Market risk measurementCarrying amount Trading book Non-trading book
LKR ’000 LKR ’000 LKR ’000
Assets subject to market risk Cash and cash equivalents 32,678 32,678Balances with the Central Bank of Sri Lanka 16,403,362 16,403,362Placements with banks 8,299,403 8,299,403Derivative Financial Instruments 1,338,204 1,338,204Financial assets recognised through profit or loss measured at fair value 2,441,833 2,441,833Financial assets at amortised cost - loans and receivables to other customers 502,509,458 502,509,458Financial assets at amortised cost - debt and other instruments 54,262,976 54,262,976Financial assets measured at fair value through other comprehensive income 89,552,196 89,552,196Total 674,840,110 3,780,037 671,060,073
Liabilities subject to market risk Due to Banks 24,770,644 24,770,644Derivative Financial Instruments 1,048,644 1,048,644Financial Liabilities at amortised cost - due to depositors 515,330,480 515,330,480Financial Liabilities at amortised cost - due to debt securities holders 1,341,060 1,341,060 - due to other borrowers 25,228,865 25,228,865Debt securities issued 27,960,731 27,960,731Total 595,680,423 1,048,644 594,631,779
INSIDE INSIGHT INSIDE INSIGHT SUPPLEMENTARY INFORMATION RISK MANAGEMENT
327

INSIDE INSIGHT SUPPLEMENTARY INFORMATION RISK MANAGEMENT
OBJECTIVES OF MARKET RISK MANAGEMENT
� Ensure that business units optimise the risk-reward relationship within the Bank’s pre-defined risk appetite and avoid exposing the Bank to unacceptable losses.
� Identify, assess, control and report market risks to ensure that the Bank operates within the allocated risk appetite levels.
Market and Liquidity risk governance structure
BoardIntegrated Risk Management Committee - IRMC
Group Risk Management
Market Risk Middle Office - MRMO
Executive Committees
Credit and Market Risk Policy Committee - CMRPC
Asset and Liability Management Committee - ALCO
POLICY FRAMEWORK
Risk monitoring is guided by a well-defined policy framework and limit structure, covering Market, Liquidity, Asset and Liability risk management aligned to the Bank’s business model, balance sheet and risk appetite. The Board supported by the IRMC approves the risk parameters as recommended by ALCO and MRMO.
PROCESSES
The market risk management process (as set out below) provides guidance on the procedure for market risk management within the overall risk appetite of the Bank. The implementation of the Bank’s risk management policies, procedures and systems are delegated to the Head of Market Risk Middle Office who reports to the Chief Risk Officer.
Policy formulationRisk measurement
methodologies Risk reporting and
communication Systems
and controls
Implementation of management reporting systems to accurately reflect the risks taken by the Bank. Develop, implement and review the controls, Risk and Control Self-Assestments (RCSA) that enforce the adherence to established risk limits.
Risks and exposures are monitored and are reported to the senior management/ board for necessary action
Limits are assessed and recommended to ALCO / Board approval. All limits in force will be independently monitored by MRMO within pre-defined time bands
Policy formulation/ renewals are carried out considering the regulatory guidelines, best practices and material changes in risk management/ limit monitoring processes
DEVELOPMENTS IN 2021
Context to market risk management in 2021
• Sri Lanka’s shortage of foreign currency and resultant depreciation of the Sri Lankan Rupee
• Frequent regulatory guidelines issued to curtail the outflow of foreign exchange
• Increasing interest rate scenario
• Volatilities in price indices/inflation
MARKET RISK ANALYTICS
Foreign Exchange Risk
Measures adopted to manage foreign exchange risk during the year included prudential open exposure limits (in addition to regulatory limits) stress testing, scenario and VaR analysis and hedging strategies which enabled the Bank to effectively manage its risk exposure. The table below shows the Bank’s consolidated foreign exchange position and the exposure held against the Bank’s capital base which is managed well within the regulatory limit of 30%.
In view of the conditions that prevailed, the Bank closely monitored the impact of market volatilities on the Bank’s exposures whilst adopting prudential measures to mitigate the Impact on the balance sheet:
The Bank’s foreign currency position was proactively monitored and managed within the internal prudential levels, considering daily cash flows and regulatory directions. Effective risk management strategies including hedging techniques were adopted to minimise potential impacts.
More intense stress testing and scenario analysis carried out for portfolios.
Cautious management of debt instrument positions to minimise the impact of market volatility. Cut loss measures were adopted to mitigate balance sheet impact on the impairment of debt securities.
Adopt timely pricing strategies for assets and liabilities by critically analysing the market movements and regulatory guidelines.
328

INSIDE INSIGHT INSIDE INSIGHT SUPPLEMENTARY INFORMATION RISK MANAGEMENT
Bank’s exposure to FX risk
CurrencyNet Open
Position
Overall exposure in respective
foreign currency Overall exposure
in ’000 ’000 LKR ’000
US Dollars (10,079) (10,079) 2,025,858 Pound Sterling 282 282 76,645 Euro 9 9 2,537 Japanese Yen 149 149 260 Australian Dollar (52) (52) 7,535 Canadian Dollar 35 35 5,479 Other currencies ( in USD) 282 282 61,339 Total exposure ( in LKR) 2,179,652 Total capital funds as at 31 December 2021 58,932,206 Total exposure as a % of total capital funds 3.70%
Value at Risk (VaR)
In accordance with the Basel guidelines the Bank’s Foreign exchange trading portfolio is subject to VaR measurement on a daily basis, with the objective of measuring the maximum potential loss due to holding of an investment/position in the Bank’s trading book. However, the measurements are based on normal market conditions, in line with the historical performance which is an inherent limitation of the Model. The Bank did not carry a trading portfolio as at 31st December 2021, hence has no risk exposures as at date.
Value at Risk (VaR) on Forex Trading portfolio
LKR Mn
VaR - (at 99% )
As at 31 December
2021
As at 31 December
2020
Forex Trading - 6.58
Historical approach, 1 day holding period, 250 historical data
Stress testing on DBU Net Open Position (NOP)
Stress testing on DBU- NOP under different magnitudes of shocks to the exchange rate are performed to assess the impact on profitability as given below.
Bank’s Foreign Currency DBU Net Open Position and stress test results as at 31 December 2021
USD/LKR
Net Open Position Scenario 1 Scenario 2 Scenario 3 Scenario 4
Magnitude of shock (adverse)
5% 10% 15% 25%
Spot rate movement 201.00 211.05 221.10 231.15 251.25 Net open position-DBU(USD)/ Stress P&L (LKR)
(10,996,214) (110,511,950) (221,023,899) (331,535,849) (552,559,748)
Sensitivity analysis
The Bank’s major foreign currency Net Open Positions (NOP) are subject to daily sensitivity analysis to determine the impact of exchange rate movements by way of profit or loss to the Bank’s Income Statement.
Exchange Rate Sensitivity of major Foreign Currency Net Open Positions as at 31.12.2021
Spot rate shocks LKR depreciate LKR appreciate
Currency Net open
position -5% -2.5% -1% Spot rate 1% 2.5% 5%
USD (10,078,894) (101,292,885) (50,646,443) (20,258,577) 201.00 20,258,577 50,646,443 101,292,885 GBP 282,456 3,832,085 1,916,043 766,417 271.34 (766,417) (1,916,043) (3,832,085)EUR 9,349 106,581 53,291 21,316 227.99 (21,316) (53,291) (106,581)JPY 148,768 12,970 6,485 2,594 1.74 (2,594) (6,485) (12,970)AUD (51,717) (376,694) (188,347) (75,339) 145.67 75,339 188,347 376,694 Total (97,717,942) (48,858,971) (19,543,588) 19,543,588 48,858,971 97,717,942
Interest Rate Risk (IRR)
Assets in the Bank’s trading book (held for trading/Fair value through P/L) are held primarily for generating profits through short term differences in prices/yields while the banking book (available for sale (AFS) / Fair value through OCI and held to maturity /Amortised cost) comprises assets and liabilities, which are contracted basically for steady income generation and are generally held till maturity. Thus, the Bank assesses the price risk in the trading book, whilst the earnings or economic value changes are monitored in the banking book.
329

Interest Rate Risk in Trading Book
Key IndicatorPosition as at 31 December 2021
Position as at 31 December 2020
Mark to market of Financial Assets measured at fair value through profit or loss - LKR (0.32) MnMark to market of Financial Assets measured at fair value through Other Comprehensive Income LKR (2,052) Mn LKR 301 MnDuration of debt securities -Financial Assets measured at fair value through profit & loss - 0.34 YearsDuration of debt securities -Financial Assets measured at fair value through Other Comprehensive Income 0.59 Years 1.15 YearsDuration of debt securities; International Sovereign Bonds -Financial Assets measured at fair value through Other Comprehensive Income
1.24 Years 2.12 Years
The Bank’s Fixed Income securities portfolio is subject to VaR measurement under historical simulation method on a daily basis and the portfolios are managed at prudent levels.
Value at Risk (VaR) on Treasury bills/bonds portfolioLKR Mn
VaR - (at 99% ) As at 31
December 2021As at 31
December 2020
Debt securities - Financial Assets measured at fair value through profit or loss - 1.65 Debt securities - Financial Assets measured at fair value through Other Comprehensive Income 34.69 234.77
Historical approach, 1 day holding period, 250 historical data
Interest Rate Risk in the Banking Book (IRRBB)The IRRBB arises mainly through non-trading asset and liabilities such as loans and advances, which is measured and managed through price sensitivity /EVE (Economic value of Equity) NII and interest rate sensitivity gap analysis. The price sensitivity/ Duration analysis (Economic value perspective) of the Balance Sheet is managed within the risk parameters whilst maximising the market potential on interest sensitive assets and liabilities. During the year, the Bank’s net interest margin was pressured to the rising interest rate scenario, stemming from a tight monetary policy.
Price sensitivity
LKR Mn
Price Sensitivity of assets and liabilitiesPrice sensitivity
2021Price sensitivity
2020
As at 31 December 1,042 160Average for the year 583 914Maximum for the year 1,042 1,292Minimum for the year 61 160
Price Sensitivity - sum of value change in portfolio due to a 1% change in interest rate
Interest Rate Sensitivity gap analysis
The Bank monitors the interest rate sensitivity of assets and liabilities using re-pricing gap report. (Disclosure note No 56.4 (a) (ii))
Equity Risk
The Equity price risk arises due to adverse movements in the value of individual stock prices or equity index. The Bank does not engage in equity trading at present but the investments held in the AFS portfolio (Fair value through OCI portfolio) are subject to mark to market valuation.
LKR ‘000
Amount included in capital adequacy calculation
TYPE Carrying Value Fair ValueRealised gains/
lossesUnrealised gains
or losses
Amount adjusted from CET 1
capital
Amount considered for
Market Risk
Financial Assets measured at fair value through profit or loss
2,000,000 2,441,833 - 441,833 - 610,458
Financial Assets measured at fair value through Other Comprehensive Income
2,017,418 1,020,731 - (996,687) 524,848 -
INSIDE INSIGHT SUPPLEMENTARY INFORMATION RISK MANAGEMENT
330

INSIDE INSIGHT INSIDE INSIGHT SUPPLEMENTARY INFORMATION RISK MANAGEMENT
Commodity Risk
Commodity price risk arises due to volatilities in the commodity exposure of the Bank. The Bank did not hold any commodity exposures during the year 2021.
Counterparty Risk
When undertaking foreign exchange dealing and trading with interbank counterparts and corporates, two general types of risks arise.
� Pre-settlement Risk. - Refers to the counterpart becoming insolvent prior to the settlement date of transaction. The exposure comes by way of Banks’ inability to find an alternate party to deal on same rates (interest or exchange) due to market changes.
� Settlement Risk: Relates to the event where the counterpart to the deal is unable to honour settlement obligations (either in local currency or foreign currency) to the Bank after having taken possession of funds paid by the Bank in settlement.
The Bank sets individual counterpart limits and maximum daily delivery limits (MDDR limits) to mitigate such risk. These limits are set through critically assessing the financial standing, balance sheet size and other risk parameters of such counterparts.
LIQUIDITY RISK
Definition: Liquidity risk is the risk that the Bank is unable to meet its financial obligations in a timely manner without incurring unacceptable losses. Financial obligations include liabilities to depositors, payments due under derivative contracts, settlement of borrowings under securities and repurchase transactions, lending and investment commitments. Banks are also exposed to liquidity risk by the mismatches on maturities of assets and liabilities.
OBJECTIVES OF LIQUIDITY RISK MANAGEMENT
The objective of our liquidity framework is to ensure that all anticipated funding commitments can be met as and when due whilst maintaining the business profile. It is designed to be adaptable to changing business models, market dynamics and regulations.
POLICY FRAMEWORK
The Bank’s well-articulated liquidity risk management policies and procedures provide guidance on liquidity risk exposures and business volumes which ensure that it has sufficient liquidity to meet its financial obligations at a fair market price. The Bank also monitors key liquidity metrics regularly, both on local and foreign currency balance sheets and prudential limits are set to effectively manage the liquidity profile.
PROCESS
Liquidity risk governance structure: The responsibility for Liquidity risk management rests with the ALCO while Treasury/ALM units are responsible for executing the day-to-day liquidity management.
The Bank is also equipped with a comprehensive Liquidity Contingency Funding Plan (LCFP) linked to the Business Continuity Plan in line with the regulatory guidelines. The LCFP clearly defines the responsibilities of the Liquidity Management Team, Internal/external liquidity risk trigger points, stage for plan invocation/ de-activation and the action plans to be exercised to ensure that all stakeholders of the Bank are safeguarded. In addition, the Bank has entered in to reciprocal liquidity funding agreements with identified counterpart banks to ensure stability.
DEVELOPMENTS IN 2021
Due to lack of USD conversions, funding importers and meeting trade obligations remained extremely challenging task. Against this backdrop, the Bank was able to optimise foreign currency liquidity levels through the following measures:
Regular cash flow forecasting to ensure satisfactory liquidity position
Enhanced communication through ALCO to manage liquidity constraints and action follow-up
Structural balance sheet management through close monitoring of Balance Sheet liquidity mismatches.
Negotiations with Foreign Direct Investors (FDIs) for possible funding
Context to Liquidity Risk management in 2021
• Surplus LKR liquidity levels towards the latter part of the year reflecting slowdown in loan growth
• FCY liquidity was under stress given the shortage in the market
• Limited liquidity in the FCY interbank swap market
• Minimal international donor support
LIQUIDITY RISK ANALYTICS
Liquidity is measured through Stock approach or Flow approach. The stock approach utilises key ratios which portray the liquidity levels in the balance sheet while the flow approach is based on a statement of maturities of assets and liabilities in time bands according to the residual time to maturity. Separate gap limits are set for the local currency and foreign currency maturity mismatch reports based on the size and the nature of the Bank’s balance sheet. Limits are set for key liquidity measures, above the regulatory limit to give early warnings signals of tightening liquidity positions of the Bank. Factors such as market liquidity, exposure to interbank market, movement on loans and advances and deposit mix are regularly monitored to identify any impending liquidity strain on the Bank and are managed within the Bank’s risk appetite.
Key Risk Metrics
The Bank maintained the following regulatory ratios as at the year end
Key Indicator - RegulatoryPosition as at 31 December 2021
Position as at 31 December 2020
Statutory Liquid Asset Ratio (SLAR) % - DBU 23.14 28.84Statutory Liquid Asset Ratio (SLAR) % - FCBU 25.31 26.88Liquidity Coverage Ratio (LCR)% - LKR Currency 193.03 161.97Liquidity Coverage Ratio (LCR)% - All Currency 171.33 157.12Net Stable Funding Ratio (NSFR ) % 118.27 112.52
The key ratios used for measuring liquidity under stock approach are given below.
Key Indicator - InternalPosition as at 31 December 2021
Position as at 31 December 2020
Net Loans to Total Assets Ratio (%) 71.49 67.90Advances to Deposits Ratio (%) 95.31 90.00Liquid Assets to Short Term Liabilities (%) 35.58 33.73Commitments to Liquid Assets (%) 75.52 68.76
331

INSIDE INSIGHT SUPPLEMENTARY INFORMATION RISK MANAGEMENT
Flow approach
A statement of Maturity analysis of assets and liabilities (MAL) is prepared placing all cash inflows and outflow in the time bands according to the residual time to maturity and non-maturity items as per CBSL recommended and Bank specific behavioural assumptions. Net exposure at each time band is managed in line with the pre-defined risk appetite.
Maturity gap analysis for local currency denominated assets and liabilities - as at 31.12.2021
In LKR ‘000 Up to 1 month 1-3 Months 3-6 Months 6-12 Months 1-3 Years 3-5 Years Over 5 Years Total
Total Assets 97,874,612 82,300,292 39,454,388 64,445,311 112,143,683 71,406,005 102,402,829 570,027,121 Total Liabilities 66,156,199 109,394,233 68,505,376 79,786,799 74,598,135 53,717,524 117,868,855 570,027,121 Net Liquidity period Gap 31,718,413 (27,093,941) (29,050,988) (15,341,488) 37,545,548 17,688,481 (15,466,026) -
Maturity gap analysis for foreign currency denominated assets and liabilities - as at 31.12.2021
In USD ‘000 Up to 1 month 1-3 Months 3-6 Months 6-12 Months 1-3 Years 3-5 Years Over 5 Years Total
Total Assets 142,041 127,437 51,699 43,606 155,051 73,039 111,582 704,455 Total Liabilities 80,927 146,931 145,689 176,263 34,117 30,452 90,077 704,455 Net Liquidity period Gap 61,114 (19,494) (93,990) (132,656) 120,933 42,588 21,505 -
Diverse funding profile
The Bank’s funding profile is analysed below based on product and currency. Regular stress tests are performed to assess the Bank’s ability to withstand stressed scenarios and maintain a healthy liquidity position. Funding requirements are assessed and managed through maturity gap analysis and cash flow reports on a regular basis. The Bank will identify short, medium and long term funding requirements in local and foreign currency whilst maintaining the budgetary requirements. The Bank benefits from a diverse funding profile, which includes CASA deposits and funding lines as a participatory financial institution. The Bank achieved a deposit growth of 13% while the CASA ratio improved to 27%.
A - Term Deposits
B - Demand Deposits
C - Savings Deposits
D - Other Deposits
E - Debentures
F - Repo Borrowing
G- Institutional Borrowings
H - Other Borrowings
63.1%5.9%
3.9%4.0%
17.9%
4.4%0.6%
0.2%
Funding diversi�cation by product
OPERATIONAL RISK
Definition: Operational Risk is defined as the risk of loss resulting from inadequate or failed internal processes, systems, human factors or from external events. It includes legal risk but excludes strategic and reputation risk. Operational risks may result in financial impact, affect business continuity, damage the organisation’s reputation, and even weaken its compliance position.
Approach to Operational Risk Management
The Bank’s Operational Risk management is guided by the “Sound Practices for the Management and Supervision of Operational Risk” issued by the Basel Committee and the regulations issued by the Central Bank of Sri Lanka and is in line with the Bank’s overall Risk Management Framework. The Operational Risk framework articulates the risk management process used to identify potential threats, in particular to identify potentially large or catastrophic losses to the Bank and its strategy to reduce the impact of risk. Roles and responsibilities are assigned to effectively monitor and evaluate risk exposures and the implementation of an enterprise-wide approach to Operational Risk. The Framework enables the maintenance of an adequate capital buffer for Operational Risk losses, instituting mechanisms to mitigate or control the risks. Mitigating actions are prioritised based on the criticality of the risk exposures and escalation mechanisms are set to ensure that the management of the Bank is fully aware of the sources of potential or emerging Operational Risks.
Product Process SystemExternal Events
Incident/Risk/Loss Reporting
Internal Loss Database
External
Internal
RCSA
KRI
Operational Risk Governance
Integrated Risk Management
Committee (IRMC)
Breaches
Breaches
Operational Risk Policy Committee (ORPC)
Business Operational Risk Sounding Board
(BORSB)
Identification
Assessment
Management and Control
Monitoring and Reporting
RISK ANALYSIS
332

INSIDE INSIGHT INSIDE INSIGHT SUPPLEMENTARY INFORMATION RISK MANAGEMENT
The Operational Risk Management Unit (ORMU) as the second line of defense facilitates the process of identifying, measuring, managing and monitoring of Operational Risks. The past, current and future Operational Risks are assessed using the Operational Risk Matrix which portrays the aggregate expected exposure towards the specific risk and thus actions are prioritised according to the criticality of risks. ORMU periodically reviews procedural changes and provide recommendations for improving/strengthening controls.
Business Operational Risk Sounding Board consisting business, support function units and ORMU staff, discuss the progress on rectification of Operational Risk events at regular intervals. Risks that require attention of senior management are escalated to the Operational Risk Policy Committee, Integrated Risk Management Committee and Board.
Key elements of the Operational Risk management framework are as follows:
� The responsibility of risk identification is assigned to all employees, and they are considered Operational Risk Managers accountable for Operational Risks under their scope of work. This has contributed towards nurturing a risk-conscious culture within the organisation
� Employees are encouraged to focus on identifying deficiencies in processes and systems, and implement solutions and remedial action together with the ORMU
� Disciplinary actions are taken on Operational Risks arising due to human factors and lessons learnt are discussed at Operational Risk awareness sessions. A mandatory eLearning module was implemented bank wide to enhance the knowledge on Operational risk among all staff
� Global operational risk events are being monitored and distributed to respective stakeholders to identify any implications within the Bank and actions required to mitigate similar risks
Operational Risk Management System (NORMS)
Facilitated the automation and consistent application of Operational Risk management methodologies across the organisation.
Incidents and near misses
Identification of the causes/underlying risks in a timely manner as and when the incidents are reported
Operational Risk losses
Maintained in a database and information is analysed to ascertain the criticality of losses and the causes of the loss events.
Risk and Control Self-Assessments (RCSA) and Key Risk Indicators (KRI)
Enables the effective identification of risks and was refined during the year to provide more focus on determining the risk profile and ensure relevance to current market conditions
Scenario Analysis
Used to and assess low-frequency/high-severity potential Operational Risks that may have severe impact to the Bank and measures are being taken to strengthen the available controls and the action plans.
Tools and methodologies
Outsourcing
With the intent of focusing on the core banking functions, the Bank has outsourced certain non-core functions to external vendors who are specialised in their respective fields. The management of outsourcing arrangements is strictly in accordance with the CBSL Outsourcing Direction 02 of 2012 and the Outsourcing Policy of the Bank. The Bank is committed to ensuring that the outsourced parties uphold and extend high standards of customer care and service excellence. All outsourcing arrangements of the Bank are evaluated by the Outsourcing Committee to be in line with the regulatory provisions.
Insurance
The Bank has a comprehensive insurance program as a key measure to mitigate operational risks. The insurance program is reviewed periodically and further refined on an on-going basis. The Bank has engaged an insurance broker to source terms, evaluate them and add value using their expertise. Operational losses which are insurable are covered by a spectrum of insurance policies on a system wide basis.
Risk Insurance Framework
General
Buildings and their contents including IT equipment are insured at replacement value. The limits of indemnity are decided upon assessing the likely exposure of risks to the Bank
Fire Insurance Policy and other insurance policies covering plate glass, machinery break downs and all electronics and computers.
Theft/Fraud
Fraudulent actions by an employee or by a third party acting on its own or with the aid of an employee with the intent to obtain illicit personal gain or through malice.
Banker's Indemnity Insurance Policy
Professional Liability
The consequences of any legal action against staff or managers as a result of their professional errors or omissions.
Professional Indemnity Policy, Directors & Officers Liability and Public Liability.
Computer Crime
Fraudulent input and modification via computer systems, electronic computer programs, electronic data and media, computer viruses, electronic and telefacsimile communications, electronic transmissions, electronic securities and voice incinerated transfers.
Computer Crime Insurance Policy
333

INSIDE INSIGHT SUPPLEMENTARY INFORMATION RISK MANAGEMENT
Operational Risk Losses - 2021 Business Lines
Commercial Banking
Payment & Settlement
Retail Banking
Commercial Banking
62.70%
5.57%
31.73%
Retail Banking
Business Disruption and System FailuresExecution, Delivery & Process Management
32%
7%45%
16%
Execution, Delivery & Process Management
External FraudDamage to Physical Assets
Operational Risk Losses - 2020 Business Lines
Commercial Banking
Payment & Settlement
Trading & Sales
Retail Banking
Payment & Settlement
Commercial Banking
Trading & Sales
43.51%
1%
99%
0.45%0.25%
55.79%
Retail Banking
Business Disruption and System Failures
Execution, Delivery & Process Management
14%
44%
40%
2%
Execution, Delivery & Process Management
Internal FraudExecution, Delivery & Process Management
Execution, Delivery & Process Management
Internal Fraud
External Fraud
Payment & Settlement
Execution, Delivery & Process Management
Developments in 2021
Context to Operational Risk management in 2021
• Increased vulnerability to health and safety risks
• Elevated cyber security risks including hacking and phishing
• Data leakage due to work from home
• Loss of revenue due to business disruption
• Control lapses, human errors, non-adherence to laid down procedures due to minimum staff operating
• Possible frauds both internal and external (customers/ 3rd parties)
BCP for staff and comprehensive employee and customer safety initiatives
Implemented stringent security measures to avoid Cyber-attacks/security threats including raised employee and customer awareness to be cautious when transacting online
Implemented security solutions for the prevention of data leakage and privileged account monitoring, prevention of insecure device connectivity to corporate network, and application specific attacks against public web services
Identify the impact on Bank’s profitability/liquidity and change the business model to minimise the exposure
Close monitoring of potential areas at risk due to minimal staff operating/revisit the vulnerable processes and introduce new controls as appropriate Eg: Processing Customer instructions via e-mail
Operational Risk performance in 2021
Majority (63%) of Operational Risk losses were under the business line of “Payment and Settlement”, followed by the losses reported under the ‘‘Retail Banking” business line (32%). Operational Risk losses for 2021 amount to 0.1% of the Capital Charge allocated for Operational Risk. Out of the losses falling under high frequency / low impact bucket, 75% contained individual loss events less than LKR 25,000.00. Total gross loss for 2021 was 25% of the total gross loss incurred in 2020. Further, the Bank was able to recover 74% of the total gross loss reported for 2021 through insurance and other sources.
Response to COVID-19
Comprehensive safety measures in line with the Bank’s Pandemic Plan and the guidelines issued by the health authorities, including new work arrangements such as shift, spilt, roster and work from home options for critical functions, including vital and non-critical functions where applicable
Initiatives to safeguard staff and customers, tightening security measures to avoid Cyber-attacks/security threats, identifying the impact on the Bank’s profitability/liquidity
Refining the business model to minimise exposures, close monitoring of potential areas at risk due to minimal staff operating/revisiting the vulnerable processes and introducing new controls as appropriate and advising staff and customers to be cautious on frauds
334
INSIDE INSIGHT INSIDE INSIGHT SUPPLEMENTARY INFORMATION RISK MANAGEMENT
Managing Cyber Risk
In an increasingly complex digital society where interconnected systems and innovative digital services define the operating standards for organisations, effectively managing cyber risks is increasingly challenging. The rapid pace of technology change and increased threats from financially motivated cyber adversaries has led to further challenges. Having understood these dynamics, the Bank strives to invest in updating its digital defenses to meet the challenges of the evolving cyber threat landscape and continue to collaborate with financial sector threat intelligence providers.
Key developments during the year included the following:
• To strengthen technical controls: Firewalls with advanced threat protection at multiple layers of defense, network segregation, intrusion prevention systems, gateway level content filtering, anti-malware solutions, centralised patch updates, vulnerability remediation and monitoring of privileged accounts activities to mitigate Cyber Risk
• Increased monitoring of online channels and use of strict controls to protect from unauthorised access, data leakages and virus/malware attacks
• Ongoing investments in upgrading its digital defences and collaborations with financial sector threat intelligence providers
• The Bank has also subscribed to the services provided by Financial Sector Computer Security Incident Response Team (FINCSIRT), where intelligence on the latest threats to the Banking industry is provided to the IT security team
• Strong policy framework complying with the Baseline Security Standards Guidelines issued by the Central Bank of Sri Lanka
• Internal and external penetration tests by employing external service providers from time to time to ensure the systems are resilient to such attacks
Business Continuity Management
The Bank’s Business Continuity Management (BCM) Policy requires comprehensive and timely plans be in place encompassing a minimum of a Business Continuity Plan (BCP) and IT Disaster Recovery Plan (IT DRP). This BCM Framework is designed to comply with the requirements of the Central Bank of Sri Lanka and is approved by the Board of Directors.
These plans are formulated following the integration of Enterprise Risk Management (ERM) Framework with effective Business Impact Analysis (BIA) processes and methodologies which anticipate all forms of threats, crisis and disasters that are inherent in the ever-changing business environment.
These plans are tested regularly at the Bank’s fully equipped Disaster Recovery (DR) Site to ensure resilience to business disruption and have been successful over years. The Governance of Business Continuity Management is steered through The Leadership Team (TLT) comprising of senior management and coordinated by the Bank’s Business Continuity Manager. During lockdown periods staff operated from split locations, on roster/shift basis and work from home including ‘BCP non-critical staff’ at our DR Site to ensure business continuity and operational readiness.
OTHER RISKS
STRATEGIC RISK
Strategic Risk can be defined as the current and prospective risk to earnings and viability arising from,
• Adverse changes in business environment with respect to the economy, political landscape, regulations, technology, actions of competitors
• Adverse business decisions
• Improper implementation of decisions
• Lack of responsiveness to changes in the business environment
Strategic risk for a Bank can manifest itself through lack of well-defined long-term strategy but more importantly because of failure to appropriately communicate and implement the strategy or due to unforeseen changes in the external environment. Formulating appropriate response plans to refine the strategy to suit the changes in the business environment is essential to management of strategic risk.
Measures in place to ensure the mitigation of risks include the following;
• The strategic plans are drawn at various level of granularity (e.g. branch level/ department level) and the implementation is reviewed through monthly meetings where variances from the growth targets are analysed and corrective actions recommended
• The Strategic Plan is also linked to individual employee performance through the performance management system and periodic performance reviews are carried out to motivate employees and create a performance driven culture
VOYAGE 2025
Voyage 2025 is the Bank’s five-year (2020/2025) strategy and was developed under the guidance of Board of Directors following extensive brainstorming by a cross functional team comprising The Leadership Team and representation from Assistant Vice Presidents and Chief Managers of the Bank. Strategy formulation was also supported by an external subject matter expert.
CROSS-BORDER RISK
Cross-border Risk arises when the Bank is unable to obtain payments from customers or third parties on their contractual obligations due to actions taken by foreign governments, mainly relating to convertibility and transferability of foreign currency and geo-political factors. Correspondent Banking Unit and Group Risk Management are responsible for the Bank’s cross-border exposures and management of exposure limits.
To effectively control the risk associated with cross-border risk, cross-border exposure/ country exposure limits are set based on the Sovereign Ratings issued by International Rating Agencies such as Fitch, Standard & Poor’s and Moody’s Corporation and linked to Bank’s capital base. Exposures are captured based on the country in which the counterpart/ counterparty bank’s main head office is domiciled. If a branch of the counterpart/ counterpart bank has been incorporated in a particular country, then exposures are to be captured in that country.
The Bank will also undertake a detailed due diligence covering the economic indicators and outlook, country rating, political risk, exchange rate risk (convertibility and transferability), banking and financial sector etc. The business lines need to manage the exposures within the board approved limits. These limits are reviewed at least annually and approved by the Board, thus mitigating the cross-border risk.
LEGAL RISK
Legal Risk is understood more from its consequences, which is incurrence of penalties, fines and sometimes loss of reputation. Legal risk may vary from institution to institution depending on the manner in which it conducts its business and the documentation it follows and is closely related to compliance and regulatory risk.
Legal risk in the Bank can manifest itself through,
• Deficiencies in the security, property, defects in title to the documentation
• Deficiencies in the documentation of the product or a transaction with an underlying contract
• Mis-selling of products, services
• Deficiencies in employee contracts
• Act of the counterparty (Customers, Shareholders, Consortium Bankers, Service Providers, Regulators etc.)
• Change in domestic and international legal environment due to legislative changes and acquisitions
• Non-adherence to laws and regulations
• Procedural failures in parate actions and litigation
335

This risk is owned and managed by the Legal Department which is assisted by third party lawyers as and when necessary to obtain an independent opinion. The Bank’s legal team comprises some of the industry’s top talent which in turn has enabled it to effectively manage legal risks. Specific risks relating to legal risk are reported periodically to Board.
COMPLIANCE RISK
Compliance Risk is defined as the risk of legal or regulatory sanctions, material financial loss, or loss to reputation and integrity an institution may suffer as a result of its failure to comply with laws, regulations, rules, related self-regulatory organisational standards, and codes of conduct applicable to its business activities. The Bank’s compliance with CBSL regulations ensure that Compliance risk is minimal.
The Bank has a clearly defined, Board approved Compliance Charter, which defines the fundamental principles, roles and responsibilities of the compliance function within the organisation as well as its relationship with senior management, the Board of Directors and the business and operational functions.
AML Risk
AML Risk materialises due to noncompliance with Anti-Money Laundering (AML) and Counter Financing of Terrorism (CFT) and Proliferation financing related regulations. This risk is mitigated by having stringent policies, procedures, processes and internal controls in place together with the implementation of the Bank’s AML/ CFT and Sanctions Program. The program is designed covering all the key pillars of the AML/ CFT framework and the key risks/ trends identified are reported to the IRMC and the Board periodically.
MODEL RISK
Board has put in place a risk model validation policy to mitigate Model Risk of the Bank. Bank validates risk models in line with the Board approved policy.
SETTLEMENT RISK
Settlement Risk refers to the risk arising on account of failed trades with counterparty banks in the foreign currency transactions. Settlement Risk arises from possible losses when the Bank is in a foreign exchange transaction pays the currency it sold but does not receive the currency it bought. Forward Contract settlement failures can arise from counterparty default, operational problems, and other factors. Settlement risk exists for any traded product. Currently, the Bank has a procedure for monitoring limit utilisation, failed trades and excess monitoring. Settlement Risk is currently controlled by way of prudent allocation and monitoring of counterparty limits including Maximum Daily Delivery Risks (MDDR) limits for counterparts.
GOVERNANCE RISK
The Board of Directors is responsible for the overall governance of the Bank which includes formulating the strategic direction, leadership to operationalise same, supervising the management of the business and reporting to shareholders on their stewardship. Bank’s Corporate Governance framework has been developed with the objective of balancing the attainment of corporate objectives while ensuring the highest standards of corporate conduct and transparency. Further the Bank clearly articulates the Group’s zero tolerance for bribery and corruption as detailed in page 116 of the Corporate Governance Report.
Please refer page 110 of the Corporate Governance Report which illustrates the governance framework of the Bank.
Summary of activities undertaken in 2021
• Annual Declarations obtained from Directors
• Ongoing training for Directors in the areas of Governance
• Monitoring of transactions carried out by the Bank with related parties of the Bank in terms of the Bank’s related party transactions policy
• Handling complaints of Customers of the Bank as per agreed service standards in accordance with the Complaint Handling Procedure
• Robust framework of communication related policies including Whistleblowing, Disclosure and Communications Policy
REPUTATIONAL RISK
Reputational Risk is the risk of indirect loss (current or prospective) arising from stakeholders’ negative experience while dealing with the institution or negative publicity regarding the Bank’s business practices which could lead to implications on market share, costly litigation expenses and revenue impacts over the long term. Reputational risk can be triggered by a risk event in any or all of the above risk categories hitherto described.
The Bank’s Reputational risk is managed through the following measures:
• Reputational risk mitigation aspects are embedded in the Bank’s policies and procedures, training programs, the Business Continuity Plan and through the Audit and Board Risk Management Committees
• Reputational risk is monitored through a reputational risk profile comprising a set of early warning indicators based on the reputational risk drivers within the reputational risk scorecard. The risk mitigation and control processes for reputational risk are designed to consider appropriate response actions to address the risks identified
• Customer Complaint Handling Process has been established under which the customers have a range of options through which they can forward their grievances to the Bank, through letters, the 24 - hour public help line and/or through the Bank website or social media
The Bank’s reputation and brand value has strengthened in recent years, as it has enhanced its customer value proposition and sought aggressive growth in selected segments. The pandemic presented an opportunity to build stronger relationships with customers and during the lockdown, the Bank ensured uninterrupted services to customers. Bank also ensured that all employees including branch and call centre staff were made aware of the implementation of CBSL mandated COVID-19 related relief measures on time. For instance,
• Moratorium requests received from customers were effectively collated, acknowledged and assigned to relevant business units and were evaluated and processed based on the guidelines stipulated in the direction
• Pursued increased digital adoption among existing and new customers
• Bank also initiated a project for the first time in Sri Lanka to process Western Union Payment via the Call Center
• Credit approvers’ team at the centre was continuously operational so that customers’ urgent credit requirements could be addressed in a timely manner
ENVIRONMENTAL & SOCIAL RISK MANAGEMENT
The main role of Environmental and Social Risk Management (ESRM) is to effectively manage the environmental and social risks stemming from debt and equity financing and strategic investments in businesses, which in turn will strengthen the Bank’s resilience. Given increasing complexity in the operating landscape, the GRM Division proactively sought to strengthen the Bank’s E&S risk assessments through revising the Environmental and Social Risk Management Framework and Environmental and Social Management System (ESMS) in 2021 by aligning with international best ESG practices.
The following key revisions/ improvements were carried out by the Bank in relation to ESRM framework/ ESMS in the year 2021.
INSIDE INSIGHT SUPPLEMENTARY INFORMATION RISK MANAGEMENT
336

GROUP RISK
The Bank together with its subsidiaries, in the process of financial intermediation are confronted with an array of financial and non-financial risks such as credit, interest rate, foreign exchange rate, liquidity, equity price, commodity price, legal, regulatory, reputational, operational etc. These risks are highly interdependent and events that affect one area of risk can have consequences on a range of other risk categories. Aggregating the risks of Group Companies remains a challenge due to their diverse business models and risk profiles. The following measures ensure that Group risk is proactively monitored and mitigated;
• Bank’s capital at risk is limited to the amount invested in these companies in the form of equity, at the time the companies were incorporated
Str
eng
then
ing
po
licy
and
fra
mew
ork
s Im
ple
men
ting
the
fra
mew
ork
ac
ross
the
org
anis
atio
nE
mp
loye
e tr
aini
ng a
nd a
war
enes
s C
om
mun
icat
ion
with
ex
tern
al s
take
hold
ers
• The ESRM Policy and the revised ESRM Manual was approved by the Board of Directors of the Bank
• The framework was also enriched in line with the standards and guidelines of Norfund, DFC in order to buttress ESRM/ ESMS practices at NDB
• The scope of the framework was widened to include the NCAP Group Companies as well
• Dedicated ESMS coordinator was appointed to operationalise ESMS Function across NDB under the supervision of the senior management
• Head of Compliance of the NCAP Group has been appointed as the ESMS coordinator for the NCAP Group and is assisted by the ESMS coordinators of the subsidiary companies
• Reviewed overall E&S assessments carried out by the business units (Corporate Banking/Project Finance and SME, Middle Market & Business Banking) at portfolio level and submitted quarterly updates to the Board IRMC of the Bank
• NDB introduced a dedicated slot in its orientation program for new recruits and promotes with the view of inculcating the diligence of ESMS and ESRM commitment of the organisation into its staff members
• The Bank also developed a training curriculum for ESMS primarily aiming at staff engaged in responsible lending
• The Bank organised workshops and webinars which were facilitated by both external trainers who are ESMS experts and internal trainers for the identified staff categories who are directly involved in the responsible lending process of the Bank
• The Bank extended comprehensive training on ‘SLBA Sustainable Banking Principles’ via the designated e-learning platform for the bank’s staff involved in the responsible lending process and its selected modules for TLT members
• Bank’s commitment towards ESMS was published through the corporate website for the external stakeholders
• Submitted periodical ESG reports to the lenders and other stakeholders
• There is representation by Bank’s Directors/ Key Management Personnel on the Boards of Directors/ Board Audit, Risk and Compliance Committee of its subsidiaries, thereby ensuring full and sufficient knowledge of subsidiaries’ operations and risk profiles
• Due to the governance structure mandated by the laws governing banking and limited liability companies, all inter-company transactions are at arms-length and full disclosure of such transactions is made
• Natural mitigation from the fact that the Bank is the holding company and owns the largest balance sheet in the group
• NDB Securities Ltd and NDB Wealth Management Ltd being licensed stock brokers and Unit Trust Managers are regulated by the SEC
• Risk Reporting framework by group companies to Centralised Group Risk Management of Bank/ IRMC/ Board for review/ corrective action
Each Group Company remains responsible for the management of risks, including associated controls and on-going monitoring processes. Risks identified by Group companies are reported to Group Risk Management Division monthly, through appropriate risk indicators (using a Risk Dashboard) and management information for review and escalation. Top risks and associated mitigants are also highlighted. The main risk categories being reviewed are as follows:
• Investment/ Credit Risk
• Operational Risk
• Market Risk
• Liquidity Risk
• Interest Rate Risk
• Concentration Risk
• Regulatory/ Compliance Risk
• Legal/ Reputation Risk
• Strategic Risk
• Any other risks relevant to the specific line of business of the Group Company
All Group Companies are required to have relevant policies and limits for monitoring purposes and to ensure that risks are within acceptable levels/ in line with internal policies and risk appetite. All risk related policies and risk appetite statement of the Group companies are vetted by Group Risk Management Division to ensure compliance with the Regulatory requirements and internal policies applicable to the Bank. Furthermore, the Operational Risk Management Unit within the Group Risk Management Division coordinates the Risk and Control Self Assessments process for the Group Companies facilitating informed decision-making by providing management with an overall view of operational risks within a business process.
FUTURE OF RISK MANAGEMENT
The Bank’s risk management capabilities have evolved from the responsibility of an individual unit to an organisation-wide risk culture permeating all business and support functions. Unprecedented changes in the operating landscape have compelled banks to consistently monitor emerging dynamics and strengthen risk management frameworks to effectively drive strategic aspirations. We will strive to move beyond compliance to embrace international best practices in risk management while proactively responding to emerging risks to navigate an increasingly complex risk landscape.
INSIDE INSIGHT INSIDE INSIGHT SUPPLEMENTARY INFORMATION RISK MANAGEMENT
337

BASEL III - PILLAR III MARKET DISCIPLINE DISCLOSURES
Pillar III Market Discipline disclosures of the Bank and the Group for the year ended 31 December as required by the Banking Act Direction No. 01 of 2016 on capital requirements under Basel III for Licensed Commercial Banks and Licensed Specialised Banks are given below.
1. REGULATORY REQUIREMENTS ON CAPITAL & LIQUIDITY
TEMPLATE I - Key Regulatory Ratios - Capital and Liquidity
BANK GROUPAs at 31 December 2021 2020 2021 2020
Regulatory Capital (LKR ’000)Common Equity Tier 1 Capital 48,441,141 37,588,780 51,937,517 40,697,560 Tier 1 Capital 48,441,141 37,588,780 51,937,517 40,697,560 Total Capital 74,578,891 58,724,327 77,983,909 61,715,675
Regulatory Capital Ratios (%) Common Equity Tier 1 Capital Ratio (Minimum Requirement - 6.5% ) 10.01 9.17 10.53 9.73 Tier 1 Capital Ratio (Minimum Requirement - 8% ) 10.01 9.17 10.53 9.73 Total Capital Ratio (Minimum Requirement - 12%) 15.42 14.32 15.82 14.75 Leverage Ratio (Minimum Requirement - 3%) 6.36 5.56 6.77 5.97
Regulatory LiquidityStatutory Liquid Assets (LKR’000) 157,514,944 163,230,459 NA NA
Statutory Liquid Assets Ratio (Minimum Requirement -20%)
Domestic Banking Unit (%) 23.14 28.84 NA NA
Off-Shore Banking Unit (%) 25.31 26.88 NA NA
Total stock of high quality liquid assets (LKR ' 000) - Rupee 89,088,289 112,786,200 NA NA
Total stock of high quality liquid assets (LKR ' 000) - All currency 112,552,154 134,410,249 NA NA
Liquidity Coverage Ratio (%) – Rupee (Minimum Requirement - 100% (2020 - 90%)) 193.03 161.97 NA NA
Liquidity Coverage Ratio (%) – All Currency (Minimum Requirement - 100% (2020 - 90%)) 171.33 157.12 NA NA
Net Stable Funding Ratio (%) – (Minimum Requirement - 100% (2020 - 90%)) 118.27 112.52 NA NA
Disclosures as required by the Circular No. 04 2018, Guidelines issued by the Central Bank of Sri Lanka to the Licensed Banks on the adoption of Sri Lanka Accounting Standard - SLFRS 9: Financial Instruments
The Bank shall stagger audited additional credit loss provisions arising from SLFRS 9 with compared to LKAS 39 as at the first day of adoption of SLFRS 9, net of any other adjustment and the tax effect on first day impact to retained earnings throughout a transitional period of four years commencing from 2018 for the purpose of computation of the Capital Adequacy Ratio.
Accordingly the Bank and the Group have deducted 100% of the first day impact on the adoption of SLFRS 9 (LKR 1,769 Mn in the Bank & Group) from the retained earnings in computing the Capital Adequacy Ratio as at 31 December 2021 (LKR 1,327 Mn in 2018, 2019 & 2020)
INSIDE INSIGHT SUPPLEMENTARY INFORMATION RISK MANAGEMENT
338

TEMPLATE II - Basel III Computation of Capital Ratios
BANK GROUPAs at 31 December 2021 2020 2021 2020
LKR ’000 LKR ’000 LKR ’000 LKR ’000
Common Equity Tier 1 (CET1) Capital after Adjustments 48,441,141 37,588,780 51,937,517 40,697,560 Common Equity Tier 1 (CET1) Capital 56,655,972 43,392,681 60,069,363 46,228,477 Equity Capital (Stated Capital/Assigned Capital) 18,263,609 8,794,333 18,263,609 8,794,333 Reserve Fund 2,571,479 2,196,479 2,571,479 2,196,479 Published Retained Earnings/(Accumulated Retained Losses) 38,113,125 32,911,330 41,628,368 35,884,426 Published Accumulated Other Comprehensive Income (OCI) (2,292,241) (509,461) (2,394,093) (646,761)General and other Disclosed Reserves - - - - Total Adjustments to CET1 Capital 8,214,831 5,803,901 8,131,846 5,530,917 Intangible Assets (net) 1,203,940 1,048,326 1,217,111 1,061,673 Deferred tax assets (net) 3,417,315 1,875,720 3,443,207 1,945,730 Defined benefit pension fund assets 379,545 143,131 379,545 143,131 Shortfall of the cumulative impairment to specific provisions 2,274,970 1,555,263 2,274,970 1,555,263 Investments in the capital of banking and financial institutions where the bank does not own more than 10 per cent of the issued ordinary share capital of the entity
524,848 647,950 817,013 825,120
Significant investments in the capital of financial institutions where the bank owns more than 10 per cent of the issued ordinary share capital of the entity
414,213 533,511 - -
Additional Tier 1 (AT1) Capital after Adjustments - - - - Additional Tier 1 (AT1) Capital - - - - Qualifying Additional Tier 1 Capital Instruments - - - - Instruments issued by Consolidated Banking and Financial Subsidiaries of the Bank and held by Third Parties
- - - -
Total Adjustments to AT1 Capital - - - - Tier 2 Capital after Adjustments 26,137,750 21,135,547 26,046,392 21,018,115 Tier 2 Capital 26,137,750 21,135,547 26,137,750 21,135,547 Qualifying Tier 2 Capital Instruments 19,705,076 15,562,998 19,705,076 15,562,998 Revaluation Gains 876,672 876,672 876,672 876,672 Loan Loss Provisions 5,556,002 4,695,877 5,556,002 4,695,877 Total Adjustments to Tier 2 - - 91,358 117,432 Others- Investments in the capital of financial institutions and where the bank does not own more than 10 per cent of the issued capital carrying voting rights of the issuing entity
- - 91,358 117,432
CET1 Capital 48,441,141 37,588,780 51,937,518 40,697,560 Total Tier 1 Capital 48,441,141 37,588,780 51,937,518 40,697,560 Total Capital 74,578,891 58,724,327 77,983,909 61,715,675 Total Risk Weighted Assets (RWA) 483,708,053 410,060,835 493,031,638 418,346,325 RWAs for Credit Risk 444,480,212 375,670,159 447,812,750 378,639,511 RWAs for Market Risk 8,151,784 7,192,688 12,487,403 11,260,664 RWAs for Operational Risk 31,076,057 27,197,988 32,731,485 28,446,150 CET1 Capital Ratio (including Capital Conservation Buffer, Countercyclical Capital Buffer & Surcharge on D-SIBs) (%)
10.01 9.17 10.53 9.73
of which: Capital Conservation Buffer (%) 2.00 2.00 2.00 2.00 of which: Countercyclical Buffer (%) - - - - of which: Capital Surcharge on D-SIBs (%) - - - - Total Tier 1 Capital Ratio (%) 10.01 9.17 10.53 9.73 Total Capital Ratio (including Capital Conservation Buffer, Countercyclical Capital Buffer & Surcharge on D-SIBs) (%)
15.42 14.32 15.82 14.75
of which: Capital Conservation Buffer (%) 2.00 2.00 2.00 2.00 of which: Countercyclical Buffer (%) - - - - of which: Capital Surcharge on D-SIBs (%) - - - -
INSIDE INSIGHT INSIDE INSIGHT SUPPLEMENTARY INFORMATION RISK MANAGEMENT
339

TEMPLATE III (a) - Basel III Computation of Leverage Ratios
BANK GROUPAs at 31 December 2021 2020 2021 2020
LKR ’000 LKR ’000 LKR ’000 LKR ’000
Tier 1 Capital 48,441,141 37,588,780 51,937,517 40,697,560
Total Exposures 761,498,728 675,776,637 767,708,927 681,568,051 On-Balance Sheet Items (excluding Derivatives and Securities Financing Transactions, but including Collateral)
693,619,365 622,527,281 699,717,781 628,095,185
Derivative Exposures 2,808,603 4,233,553 2,808,603 4,233,553 Securities Financing Transactions Exposures 3,384,052 127,163 3,384,052 127,163 Other Off-Balance Sheet Exposures 61,686,708 48,888,640 61,798,491 49,112,150 Basel III Leverage Ratio (%) (Minimum Requirement - 3%) 6.36% 5.56% 6.77% 5.97%
TEMPLATE III (b) Basel III Computation of Net Stable Funding Ratios (NSFR)
BANKAs at 31 December 2021 2020
LKR ’000 LKR ’000
Total Available Stable Funding 483,825,740 403,557,413
Required Stable Funding - On Balance Sheet Assets 404,392,394 355,554,768 Required Stable Funding - Off Balance Sheet Items 4,686,376 3,093,079 Total Required Stable Funding 409,078,770 358,647,847 Net Stable Funding Ratio (%) (Minimum Requirement - 100% (2020 - 90%)) 118.27% 112.52%
TEMPLATE IV - Basel III Computation of Liquidity Coverage Ratio - All Currency Liquidity Requirement
BANKAs at 31 December 2021 2020
TotalUn-weighted
Value
Total Weighted
Value
TotalUn-weighted
Value
Total Weighted Value
LKR ’000 LKR ’000 LKR ’000 LKR ’000
Total Stock of High-Quality Liquid Assets (HQLA) 116,687,070 112,552,154 138,207,486 134,410,249
Total Adjusted Level 1A Assets 88,870,488 88,870,488 112,938,052 112,938,052 Level 1 Assets 89,120,967 89,120,967 112,892,576 112,892,576 Total Adjusted Level 2A Assets 27,566,103 23,431,187 25,314,910 21,517,674 Level 2A Assets 27,566,103 23,431,187 25,314,910 21,517,674 Total Adjusted Level 2B Assets - - - -
Level 2B Assets - - - -Total Cash Outflows 702,832,420 132,927,343 630,094,322 136,185,613 Deposits 335,076,085 23,786,812 268,839,430 19,347,365 Unsecured Wholesale Funding 221,841,587 105,600,793 225,925,249 112,415,320 Secured Funding Transactions 1,134,683 - 1,157,153 -Undrawn Portion of Committed (Irrevocable) Facilities and Other Contingent Funding
Obligations 144,780,065 3,539,738 134,172,490 4,422,928
Additional Requirements - - - -Total Cash Inflows 120,754,827 67,233,093 84,801,867 50,638,475 Maturing Secured Lending Transactions Backed by Collateral 60,364,552 34,468,424 33,364,459 19,771,149 Other Inflows by Counterparty which are maturing within 30 days 53,924,205 32,764,669 46,259,467 30,691,239 Operational Deposits 6,466,070 - 4,825,767 -Other Cash Inflows - - 352,174 176,087 Liquidity Coverage Ratio (%) (Stock of High Quality Liquid Assets/Total Net Cash Outflows over the Next 30 Calendar Days) * 100
171.33% 157.12%
INSIDE INSIGHT SUPPLEMENTARY INFORMATION RISK MANAGEMENT
340

TEMPLATE V - Main Features of Regulatory Capital Instruments - Bank and Group
CET 1 Capital Tier 2 Instruments
Description of the Capital Instrument
Stated Capital Debenture Issue -
December 2013
Debenture Issue -
March 2019
Debenture Issue -
September 2020
Debenture Issue -
November 2021
Issuer National Development Bank PLC
National Development Bank PLC
National Development Bank PLC
National Development Bank PLC
National Development Bank PLC
Unique Identifier (e.g., ISIN or Bloomberg Identifier for Private Placement)
NDB. N0000 ISIN -LK0207N00007
Type C - LK0207D21038 Type D - LK0207D21053
Type A - LK0207D24198 Type B - LK0207D24206
ISIN - LK0207D24529 Type A - LK0207D24941 Type B - LK0207D24958
Governing Law(s) of the Instrument Companies Act No. 07 of 2007, Listing rules of the Colombo Stock Exchange, Securities and Exchange Commission of Sri Lanka Act
Companies Act No. 07 of 2007, Listing rules of the Colombo Stock Exchange, Securities and Exchange Commission of Sri Lanka Act
Companies Act No. 07 of 2007, Listing rules of the Colombo Stock Exchange, Securities and Exchange Commission of Sri Lanka Act
Companies Act No. 07 of 2007, Listing rules of the Colombo Stock Exchange , Securities and Exchange Commission of Sri Lanka Act
Companies Act No. 07 of 2007, Listing rules of the Colombo Stock Exchange, Securities and Exchange Commission of Sri Lanka Act
Original Date of Issuance Date listed 26-Apr-1993 19-Dec-2013 31-Mar-2019 25-Sep-2020 24-Nov-2021
Par Value of Instrument NA LKR 100/- LKR 100/- LKR 100/- LKR 100/-
Perpetual or Dated Perpetual Dated Dated Dated Dated
Original Maturity Date, if Applicable NA Type C - 19 Dec 2023 Type D - 19 Dec 2025
Type A - 30 Mar 2024 Type B - 30 Mar 2024
24-Sep-2025 Type A - 23 Nov 2026 Type B - 23 Nov 2028
Amount Recognised in Regulatory Capital (in LKR ‘000 as at 31 December 2021)
18,263,609 4,327,536 2,502,540 4,875,000 8,000,000
Accounting Classification (Equity/Liability) Equity Liability Liability Liability Liability
Issuer Call subject to Prior Supervisory Approval
Optional Call Date, Contingent Call Dates and Redemption Amount (LKR ‘000)
NA NA NA NA NA
Subsequent Call Dates, if Applicable NA NA NA NA NA
Coupons/Dividends
Fixed or Floating Dividend/Coupon Dividend declared as decided by the Board
Fixed coupon Fixed coupon Fixed coupon Fixed coupon
Coupon Rate and any Related Index NA Type C - 13.9% p.a Type D - 14.0% p.a
Type A - 13.50% p.a Type B - 13.95% p.a
9.5% p.a Type A - 11.90% p.a Type B - 12.00% p.a
Non-Cumulative or Cumulative NA Non-Cumulative Non-Cumulative Non-Cumulative Non-Cumulative
Convertible or Non-Convertible
If Convertible, Conversion Trigger (s) NA Non-Convertible Determined by and at the sole discretion of the Monetary Board of the Central Bank of Sri Lanka, and is defined in the Banking Act Direction No. 1 of 2016
Determined by and at the sole discretion of the Monetary Board of the Central Bank of Sri Lanka, and is defined in the Banking Act Direction No. 1 of 2016
Determined by and at the sole discretion of the Monetary Board of the Central Bank of Sri Lanka, and is defined in the Banking Act Direction No. 1 of 2016
If Convertible, Fully or Partially NA NA Fully Fully Fully
If Convertible, Mandatory or Optional NA NA Mandatory Mandatory Mandatory
If Convertible, Conversion Rate NA NA Based on the simple average of the daily Volume Weighted Average Price (VWAP) of an Ordinary Voting Share during the three months (03) period, immediately preceding the date of the Trigger Event.
Based on the simple average of the daily Volume Weighted Average Price (VWAP) of an Ordinary Voting Share during the three months (03) period, immediately preceding the date of the Trigger Event.
Based on the simple average of the daily Volume Weighted Average Price (VWAP) of an Ordinary Voting Share during the three months (03) period, immediately preceding the date of the Trigger Event.
NOTES
(i)The stated capital of the bank increased by LKR 9.46 Bn, comprising of LKR 8 Bn through the rights Issue and LKR 1.46 Bn through the Private Placement.
(ii)The Bank raised Tier II capital of LKR 8 Bn through the Debenture Issue in November 2021.
INSIDE INSIGHT INSIDE INSIGHT SUPPLEMENTARY INFORMATION RISK MANAGEMENT
341

2. RISK WEIGHTED ASSETS (RWA)
TEMPLATE VI - Summary discussion on adequacy/ meeting current and future capital requirements.
Please refer page 320 for the Capital Management section.
TEMPLATE VII - Credit Risk under Standardised Approach - Credit Risk Exposures and Credit Risk Mitigation (CRM) Effects
BANKAmount (LKR’000) as at 31 December 2021
Asset ClassExposures before Credit
Conversion Factor (CCF) and CRMExposures post CCF and CRM RWA and RWA Density (%)
On-Balance Sheet Amount
Off-Balance Sheet Amount
On-Balance Sheet Amount
Off-Balance Sheet Amount RWA
RWA Density(ii)
Claims on Central Government and Central Bank of Sri Lanka 144,052,683 - 144,052,683 1,422,690 4,388,867 3.02%Claims on Public Sector Entities 22,791,195 2,845,380 1,599,904 - 319,981 20.00%Claims on Bank's Exposures 22,038,997 47,660,160 22,038,997 7,293,735 11,360,719 38.73%Claims on Financial Institutions 39,864,653 12,998,799 37,799,853 923,436 22,163,586 57.24%Claims on Corporates 207,601,244 196,470,923 181,878,461 44,043,710 219,903,314 97.34%Retail Claims 209,052,025 38,213,945 181,267,339 8,402,213 148,709,559 78.40%Claims Secured by Residential Property 20,877,855 1,175,933 20,877,855 424,329 9,609,768 45.11%Non-Performing Assets (NPAs)(i) 16,016,088 - 16,016,088 - 18,918,510 118.12%Higher-risk Categories 488,554 - 488,554 - 1,221,384 250.00%Cash Items and Other Assets 14,870,031 - 14,870,031 - 7,884,524 53.02%Total 697,653,325 299,365,140 620,889,765 62,510,113 444,480,212
GROUPAmount (LKR’000) as at 31 December 2021
Asset ClassExposures before Credit
Conversion Factor (CCF) and CRMExposures post CCF and CRM RWA and RWA Density (%)
On-Balance Sheet Amount
Off-Balance Sheet Amount
On-Balance Sheet Amount
Off-Balance Sheet Amount RWA
RWA Density(ii)
Claims on Central Government and Central Bank of Sri Lanka 144,052,683 - 144,052,683 1,422,690 4,388,867 3.02%Claims on Public Sector Entities 22,791,195 2,845,380 1,599,904 - 319,981 20.00%Claims on Bank's Exposures 22,158,891 47,660,160 22,158,891 7,293,735 11,371,899 38.61%Claims on Financial Institutions 39,864,653 12,998,799 37,799,853 923,436 22,163,586 57.24%Claims on Corporates 207,587,687 195,861,410 181,864,904 43,897,760 219,743,805 97.33%Retail Claims 209,052,025 38,213,945 181,267,339 8,402,213 148,709,559 78.40%Claims Secured by Residential Property 20,877,855 1,175,933 20,877,855 424,329 9,609,768 45.11%Non-Performing Assets (NPAs)(i) 16,016,088 - 16,016,088 - 18,918,510 118.12%Higher-risk Categories - 515,468 - 257,734 386,601 150.00%Cash Items and Other Assets 19,185,804 - 19,185,804 - 12,200,174 63.59%Total 701,586,881 299,271,095 624,823,321 62,621,897 447,812,750
Note:
(i) NPAs – As per Banking Act Direction on classification of loans and advances, income recognition and provisioning.
(ii) RWA Density – Total RWA/Exposures post CCF and CRM.
INSIDE INSIGHT SUPPLEMENTARY INFORMATION RISK MANAGEMENT
342

TEMPLATE VIII - Credit Risk under Standardised Approach: Exposures by Asset Classes and Risk Weights
BANKAmount (LKR’000) as at 31 December 2021 (Post CCF & CRM)
0% 10% 20% 35% 50% 60% 75% 100% 150% >150%
Total Credit Exposures
Amount
Claims on Central Government and Central Bank of Sri Lanka 101,586,707 43,888,667 - - - - - - - - 145,475,374
Claims on Public Sector Entities - - 1,599,904 - - - - - - - 1,599,904
Claims on Bank's Exposures - - 14,849,220 - 12,301,025 - - 2,066,735 115,752 - 29,332,732
Claims on Financial Institutions - - 165,168 - 33,392,195 - - 4,628,866 537,059 - 38,723,288
Claims on Corporates - - 6,011,041 - 2,420,052 - - 217,491,078 - - 225,922,171
Retail Claims 674,679 - 5,808,947 - - 15,117,210 118,365,088 49,703,628 - - 189,669,552
Claims Secured by Residential Property - - - 17,988,332 - - - 3,313,852 - - 21,302,184
Non-Performing Assets (NPAs) - - - - 163,915 - - 9,883,414 5,968,759 - 16,016,088
Higher-risk Categories - - - - - - - - - 488,554 488,554
Cash Items and Other Assets 6,913,746 - 89,701 - - - - 7,866,584 - - 14,870,031
Total 109,175,132 43,888,667 28,523,981 17,988,332 48,277,187 15,117,210 118,365,088 294,954,157 6,621,570 488,554 683,399,878
GROUPAmount (LKR’000) as at 31 Dec 2021 (Post CCF & CRM)
0% 10% 20% 35% 50% 60% 75% 100% 150% >150%
Total Credit Exposures
Amount
Claims on Central Government and Central Bank of Sri Lanka 101,586,707 43,888,667 - - - - - - - - 145,475,374
Claims on Public Sector Entities - - 1,599,904 - - - - - - - 1,599,904
Claims on Bank's Exposures - - 15,058,199 - 12,184,088 - - 2,094,587 115,752 - 29,452,626
Claims on Financial Institutions - - 165,168 - 33,392,195 - - 4,628,866 537,059 - 38,723,288
Claims on Corporates - - 6,011,041 - 2,420,052 - - 217,331,571 - - 225,762,664
Retail Claims 674,679 - 5,808,947 - - 15,117,210 118,365,088 49,703,628 - - 189,669,552
Claims Secured by Residential Property - - - 17,988,332 - - - 3,313,852 - - 21,302,184
Non-Performing Assets (NPAs) - - - - 163,915 - - 9,883,414 5,968,759 - 16,016,088
Higher-risk Categories - - - - - - - 257,734 - 257,734
Cash Items and Other Assets 6,913,838 - 89,740 - - - - 12,182,226 - - 19,185,804
Total 109,175,224 43,888,667 28,732,999 17,988,332 48,160,250 15,117,210 118,365,088 299,138,144 6,879,304 - 687,445,218
Risk Weight
Risk Weight
Asset Classes
Asset Classes
INSIDE INSIGHT INSIDE INSIGHT SUPPLEMENTARY INFORMATION RISK MANAGEMENT
343

TEMPLATE IX - Market Risk under Standardised Measurement Method
BANK GROUPItem 2021 2020 2021 2020
LKR ’000 LKR ’000 LKR ’000 LKR ’000
(a) Capital Charge for Interest Rate Risk 118,135 47,774 120,387 48,943
General Interest Rate Risk 118,135 47,774 119,538 48,181(i) Net Long or Short Position 118,135 47,774 119,538 48,181(ii) Horizontal Disallowance - - - - (iii) Vertical Disallowance - - - - (iv) Options - - - - Specific Interest Rate Risk - - 849 762(b) Capital Charge for Equity 610,458 765,356 1,150,159 1,272,684(i) General Equity Risk 305,229 382,678 576,112 636,342(ii) Specific Equity Risk 305,229 382,678 574,047 636,342(c) Capital charge for Foreign Exchange & Gold 290,380 85,956 290,380 85,956Total Risk Weighted Amount for Market Risk [(a) + (b) + (c)] * CAR 8,151,784 7,192,688 12,487,403 11,260,664
TEMPLATE X - Operational Risk under Basic Indicator Approach
BANKBusiness Lines Capital Charge
Factor Fixed FactorGross Income (LKR’000) as at 31 December 2021
1st Year 2nd Year 3rd Year
The Basic Indicator Approach 15% 22,959,764 23,916,218 30,814,162 The Standardised ApproachCorporate Finance 18%Trading and Sales 18%Payment and Settlement 18%Agency Services 15%Asset Management 12%Retail Brokerage 12%Retail Banking 12%
Commercial Banking 15%The Alternative Standardised Approach - - - Corporate Finance 18%Trading and Sales 18%Payment and Settlement 18%Agency Services 15%Asset Management 12%Retail Brokerage 12%Retail Banking 12% 0.035
Commercial Banking 15% 0.035Capital Charges for Operational Risk (LKR’000)The Basic Indicator Approach 3,884,507 The Standardised Approach - The Alternative Standardised Approach - Risk Weighted Amount for Operational Risk (LKR’000)The Basic Indicator Approach 31,076,057 The Standardised Approach -
The Alternative Standardised Approach -
INSIDE INSIGHT SUPPLEMENTARY INFORMATION RISK MANAGEMENT
344

TEMPLATE X - Operational Risk under Basic Indicator Approach (Contd.)
GROUPBusiness Lines Capital Charge
Factor Fixed FactorGross Income (LKR’000) as at 31 December 2021
1st Year 2nd Year 3rd Year
The Basic Indicator Approach 15% 24,115,065 24,917,798 32,795,848 The Standardised ApproachCorporate Finance 18%Trading and Sales 18%Payment and Settlement 18%Agency Services 15%Asset Management 12%Retail Brokerage 12%Retail Banking 12%
Commercial Banking 15%The Alternative Standardised Approach - - - Corporate Finance 18%Trading and Sales 18%Payment and Settlement 18%Agency Services 15%Asset Management 12%Retail Brokerage 12%Retail Banking 12% 0.035
Commercial Banking 15% 0.035Capital Charges for Operational Risk (LKR’000)The Basic Indicator Approach 4,091,436 The Standardised Approach - The Alternative Standardised Approach - Risk Weighted Amount for Operational Risk (LKR’000)The Basic Indicator Approach 32,731,485 The Standardised Approach -
The Alternative Standardised Approach -
INSIDE INSIGHT INSIDE INSIGHT SUPPLEMENTARY INFORMATION RISK MANAGEMENT
345

3. TEMPLATE XI & XII - Differences between Accounting and Regulatory Scopes and Mapping of Financial Statement Categories with Regulatory Risk Categories – BANK
As at 31 December 2021 a b c d e
LKR ‘000
Carrying Values as Reported in Published
Financial Statements
Carrying Values under Scope of Regulatory
Reporting
Subject to Credit Risk Framework
Subject to Market Risk Framework
Not subject to Capital Requirements or Subject
to Deduction from Capital
Explanation on significant differences on (a) and (b) Measurement techniques / valuation basis
Assets 702,903,107 712,060,135 620,889,765 12,604,903 78,565,467 Cash and cash equivalents 13,409,902 13,469,517 13,469,517 - - Balances with the Central Banks of Sri Lanka 16,403,362 16,403,362 16,403,362 - - Placements with banks 8,301,320 8,300,000 8,300,000 - - Derivative financial instruments 1,338,204 - - - - Derivative Financial Instruments are separately disclosed in the published financial statements.
This amount is classified under the other assets category in regulatory reporting. Financial assets recognised through profit or loss - measured at fair value
2,441,833 - - - - Financial assets recognised through profit or loss - measured at fair value and Financial assets measured at fair value through OCI are classified as Held for trading under regulatory reporting and accrued interest classified under other assets category.
Financial assets - Held for trading - 91,358,024 78,228,273 12,604,903 524,848 Financial assets at amortised cost -loans and receivables to other customers
502,509,458 510,163,571 437,537,965 - 72,625,606 Carrying value under regulatory reporting is as per the Banking Act Direction No. 3 of 2008 Classification of Loans and Advances, Income Recognition and Provisioning. The carrying value of loans and receivables to other customers in the published financial statements is subject to impairment provision as per the impairment policy of the Bank in line with SLFRS 9.
Measurement techniques and valuation basis of allowance for impairment is explained in detail in note no 26.6 to the Financial statements.
Financial assets at amortised cost - debt and other instruments
54,262,976 - - - - Financial assets at amortised cost - debt and other instruments are classified as Held to maturity investments (Banking Book)under regulatory reporting and accrued interest classified under other assets category.
Financial investments - Held to maturity - 55,723,229 55,723,229 - - Financial assets measured at fair value through other comprehensive income
89,552,196 - - - - Financial assets measured at fair value through other comprehensive income are classified as Held for trading under regulatory reporting.
Investments in subsidiary companies 1,130,916 1,130,916 716,703 - 414,213 Intangible assets 1,203,940 1,203,940 - - 1,203,940 Property, plant and equipment 3,143,829 3,143,829 3,143,829 - - Right of use assets 1,094,607 - - - - Right of use assets are recorded under other assets in regulatory reporting. Deferred tax assets 3,417,315 3,417,315 - - 3,417,315 Other assets 4,693,249 7,746,432 7,366,887 - 379,545 Derivative Financial instruments and the interest receivables on financial assets are included under
other assets in regulatory reporting. Unamortised staff costs are included under other assets in the published financial statements.
Measurement techniques and valuation basis of staff loans are explained in detail in note no 35 to these Financial statements.
Liabilities 643,970,902 644,072,426 Due to banks 24,770,644 - - - - Due to banks balances are classified under due to other borrowed funds in regulatory reporting. Derivative financial instruments 1,048,644 - - - - Derivative Financial Instruments separately disclosed in published financial statements and
included in the other liabilities category in the regulatory reporting.
Financial liabilities at amortised cost - due to depositors 552,039,792 541,728,160 - - - Due to depositors are at Effective Interest Rate (EIR) method in published Financial Statements. Accrued interest is classified under other liabilities in regulatory reporting.
Measurement techniques and valuation basis of deposits are at Effective Interest Rate (EIR) method in published Financial Statements.
Financial Liabilities at amortised cost - due to debt securities holders
1,341,060 1,330,129 - - -
INSIDE INSIGHT SUPPLEMENTARY INFORMATION RISK MANAGEMENT
346

3. TEMPLATE XI & XII - Differences between Accounting and Regulatory Scopes and Mapping of Financial Statement Categories with Regulatory Risk Categories – BANK
As at 31 December 2021 a b c d e
LKR ‘000
Carrying Values as Reported in Published
Financial Statements
Carrying Values under Scope of Regulatory
Reporting
Subject to Credit Risk Framework
Subject to Market Risk Framework
Not subject to Capital Requirements or Subject
to Deduction from Capital
Explanation on significant differences on (a) and (b) Measurement techniques / valuation basis
Assets 702,903,107 712,060,135 620,889,765 12,604,903 78,565,467 Cash and cash equivalents 13,409,902 13,469,517 13,469,517 - - Balances with the Central Banks of Sri Lanka 16,403,362 16,403,362 16,403,362 - - Placements with banks 8,301,320 8,300,000 8,300,000 - - Derivative financial instruments 1,338,204 - - - - Derivative Financial Instruments are separately disclosed in the published financial statements.
This amount is classified under the other assets category in regulatory reporting. Financial assets recognised through profit or loss - measured at fair value
2,441,833 - - - - Financial assets recognised through profit or loss - measured at fair value and Financial assets measured at fair value through OCI are classified as Held for trading under regulatory reporting and accrued interest classified under other assets category.
Financial assets - Held for trading - 91,358,024 78,228,273 12,604,903 524,848 Financial assets at amortised cost -loans and receivables to other customers
502,509,458 510,163,571 437,537,965 - 72,625,606 Carrying value under regulatory reporting is as per the Banking Act Direction No. 3 of 2008 Classification of Loans and Advances, Income Recognition and Provisioning. The carrying value of loans and receivables to other customers in the published financial statements is subject to impairment provision as per the impairment policy of the Bank in line with SLFRS 9.
Measurement techniques and valuation basis of allowance for impairment is explained in detail in note no 26.6 to the Financial statements.
Financial assets at amortised cost - debt and other instruments
54,262,976 - - - - Financial assets at amortised cost - debt and other instruments are classified as Held to maturity investments (Banking Book)under regulatory reporting and accrued interest classified under other assets category.
Financial investments - Held to maturity - 55,723,229 55,723,229 - - Financial assets measured at fair value through other comprehensive income
89,552,196 - - - - Financial assets measured at fair value through other comprehensive income are classified as Held for trading under regulatory reporting.
Investments in subsidiary companies 1,130,916 1,130,916 716,703 - 414,213 Intangible assets 1,203,940 1,203,940 - - 1,203,940 Property, plant and equipment 3,143,829 3,143,829 3,143,829 - - Right of use assets 1,094,607 - - - - Right of use assets are recorded under other assets in regulatory reporting. Deferred tax assets 3,417,315 3,417,315 - - 3,417,315 Other assets 4,693,249 7,746,432 7,366,887 - 379,545 Derivative Financial instruments and the interest receivables on financial assets are included under
other assets in regulatory reporting. Unamortised staff costs are included under other assets in the published financial statements.
Measurement techniques and valuation basis of staff loans are explained in detail in note no 35 to these Financial statements.
Liabilities 643,970,902 644,072,426 Due to banks 24,770,644 - - - - Due to banks balances are classified under due to other borrowed funds in regulatory reporting. Derivative financial instruments 1,048,644 - - - - Derivative Financial Instruments separately disclosed in published financial statements and
included in the other liabilities category in the regulatory reporting.
Financial liabilities at amortised cost - due to depositors 552,039,792 541,728,160 - - - Due to depositors are at Effective Interest Rate (EIR) method in published Financial Statements. Accrued interest is classified under other liabilities in regulatory reporting.
Measurement techniques and valuation basis of deposits are at Effective Interest Rate (EIR) method in published Financial Statements.
Financial Liabilities at amortised cost - due to debt securities holders
1,341,060 1,330,129 - - -
INSIDE INSIGHT INSIDE INSIGHT SUPPLEMENTARY INFORMATION RISK MANAGEMENT
347

As at 31 December 2021 a b c d e
LKR ‘000
Carrying Values as Reported in Published
Financial Statements
Carrying Values under Scope of Regulatory
Reporting
Subject to Credit Risk Framework
Subject to Market Risk Framework
Not subject to Capital Requirements or Subject
to Deduction from Capital
Explanation on significant differences on (a) and (b) Measurement techniques / valuation basis
Financial Liabilities at amortised cost - due to other borrowers
25,228,865 49,126,026 - - - Due to banks balances are classified separately in the published financial statements and interest accruals are classified under other liabilities in the regulatory reporting.
Debt securities issued 27,960,731 27,222,351 - - - Debt securities issued are at Effective Interest Rate (EIR) method in published Financial Statements.
Measurement techniques and valuation basis of Debt securities issued are at Effective Interest Rate (EIR) method in published Financial Statements.
Current tax liabilities 2,407,243 2,407,243 - - - Employee benefit obligations 735,666 - - - - Other liabilities 8,438,257 22,258,517 - - - Derivative Financial instruments, Retirement benefit obligations and the interest payables on
financial liabilities are included under other liabilities in the regulatory reporting. Off-Balance Sheet Liabilities 312,072,435 297,387,174 298,771,660 Guarantees 61,705,580 61,705,580 52,000,714 - 306,789 Performance Bonds 22,399,692 22,399,692 22,333,474 - 66,218 Letters of Credit 24,253,102 24,253,102 24,032,629 - 220,473 Other Contingent Items 27,941,045 27,941,045 27,941,045 - - Undrawn Commitments 125,370,436 125,370,436 125,370,436 - - Other Commitments 50,402,580 35,717,319 47,093,362 - - Shareholders' EquityEquity capital (Stated capital /Assigned capital) 18,263,609 18,263,609 of which Amount eligible for CET1 18,263,609 18,263,609 of which Amount eligible for AT1 - - Retained earnings 39,134,379 47,152,621 Accumulated Other comprehensive income (1,037,262) - Other reserves 2,571,479 2,571,479 Total Shareholders' Equity 58,932,205 67,987,709
INSIDE INSIGHT SUPPLEMENTARY INFORMATION RISK MANAGEMENT
348
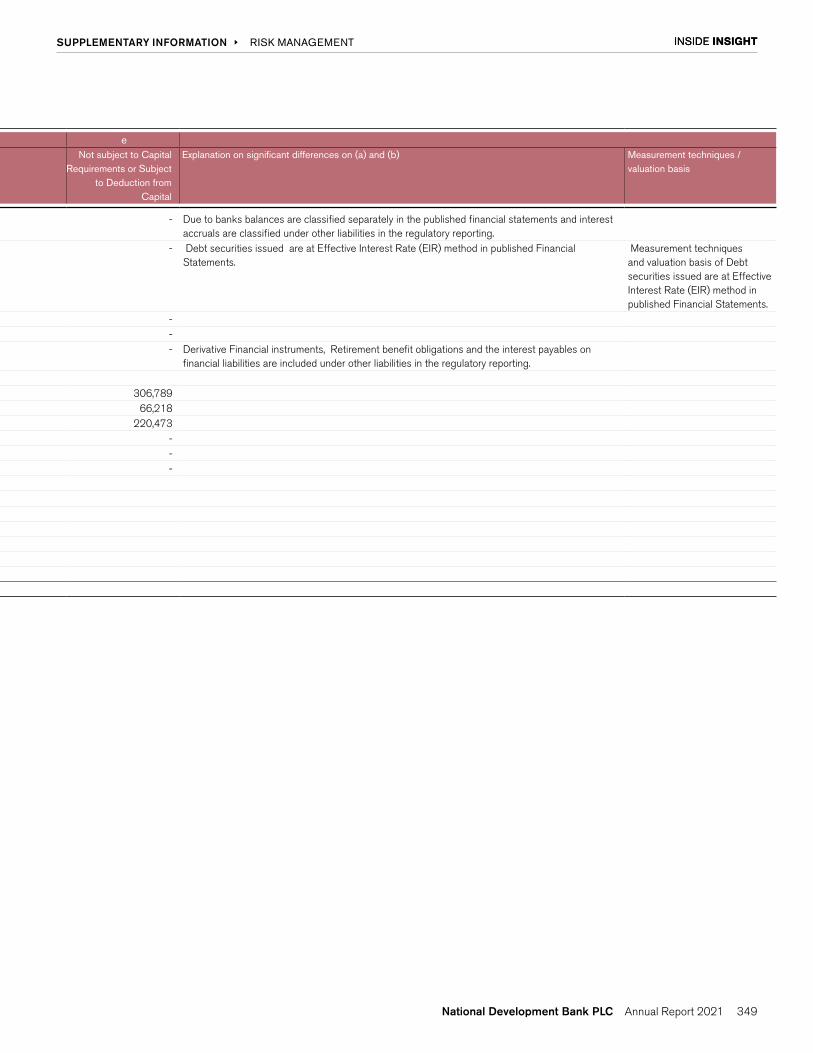
As at 31 December 2021 a b c d e
LKR ‘000
Carrying Values as Reported in Published
Financial Statements
Carrying Values under Scope of Regulatory
Reporting
Subject to Credit Risk Framework
Subject to Market Risk Framework
Not subject to Capital Requirements or Subject
to Deduction from Capital
Explanation on significant differences on (a) and (b) Measurement techniques / valuation basis
Financial Liabilities at amortised cost - due to other borrowers
25,228,865 49,126,026 - - - Due to banks balances are classified separately in the published financial statements and interest accruals are classified under other liabilities in the regulatory reporting.
Debt securities issued 27,960,731 27,222,351 - - - Debt securities issued are at Effective Interest Rate (EIR) method in published Financial Statements.
Measurement techniques and valuation basis of Debt securities issued are at Effective Interest Rate (EIR) method in published Financial Statements.
Current tax liabilities 2,407,243 2,407,243 - - - Employee benefit obligations 735,666 - - - - Other liabilities 8,438,257 22,258,517 - - - Derivative Financial instruments, Retirement benefit obligations and the interest payables on
financial liabilities are included under other liabilities in the regulatory reporting. Off-Balance Sheet Liabilities 312,072,435 297,387,174 298,771,660 Guarantees 61,705,580 61,705,580 52,000,714 - 306,789 Performance Bonds 22,399,692 22,399,692 22,333,474 - 66,218 Letters of Credit 24,253,102 24,253,102 24,032,629 - 220,473 Other Contingent Items 27,941,045 27,941,045 27,941,045 - - Undrawn Commitments 125,370,436 125,370,436 125,370,436 - - Other Commitments 50,402,580 35,717,319 47,093,362 - - Shareholders' EquityEquity capital (Stated capital /Assigned capital) 18,263,609 18,263,609 of which Amount eligible for CET1 18,263,609 18,263,609 of which Amount eligible for AT1 - - Retained earnings 39,134,379 47,152,621 Accumulated Other comprehensive income (1,037,262) - Other reserves 2,571,479 2,571,479 Total Shareholders' Equity 58,932,205 67,987,709
INSIDE INSIGHT INSIDE INSIGHT SUPPLEMENTARY INFORMATION RISK MANAGEMENT
349

DSIB ASSESSMENT AS PER THE BANKING ACT DIRECTION NO. 10 OF 2019 ON FRAMEWORK FOR DEALING WITH DOMESTIC SYSTEMATICALLY IMPORTANT BANKS
GROUP2021 2020
LKR Mn LKR Mn
SIZE INDICATOR
Section 1 - Total Exposures
Total exposures measure 767,709 681,568
INTERCONNECTEDNESS INDICATORS
Section 2 - Intra-Financial System Assets
a. Funds deposited with or lent to other financial institutions (including unused portion of committed lines extended)
(i) Funds deposited 14,481 5,416
(ii) Lending 54,894 69,794
b. Holdings of securities issued by other financial institutions 8,036 3,746
c. Net positive current exposure of securities financing transactions (SFTs) with other financial institutions 14 21
d. Over-the-counter (OTC) derivatives with other financial institutions that have a net positive mark to market value 1,172 923
Intra-financial system assets 78,597 79,900
Section 3 - Intra-Financial System Liabilities
a. Funds deposited by or borrowed from other financial institutions (including unused portion of committed lines obtained)
(i) Funds deposited 47,292 42,591
(ii) Borrowings 33,204 40,599
b. Net negative current exposure of securities financing transactions with other financial institutions 346 14
c. Over-the-counter derivatives with other financial institutions that have a net negative mark to market value 1,193 991
Intra-financial system liabilities 82,035 84,195
Section 4 - Securities Outstanding
Securities outstanding 27,290 19,290
SUBSTITUTABILITY/FINANCIAL INSTITUTION INFRASTRUCTURE INDICATORS
Section 5 - Payments made in the reporting year (excluding intragroup payments)
Payments activity 7,018,451 5,837,491
Section 6 - Assets Under Custody
Assets under custody 2,171 -
Section 7 - Underwritten Transactions in Debt and Equity Markets
Underwriting activity - -
Section 8 - Trading Volume
Trading volume (Number Mn) 14,185 12,660
INSIDE INSIGHT SUPPLEMENTARY INFORMATION RISK MANAGEMENT
350

GROUP2021 2020
LKR Mn LKR Mn
COMPLEXITY INDICATORS
Section 9 - Notional Amount of Over-the-Counter (OTC) Derivatives
OTC derivatives 50,403 127,081
Section 10 - Level 2 Assets
Level 2 assets 27,566 25,315
Section 11 - Trading and available for slae (AFS) securities
Trading and AFS securities 95,819 117,906
Section 12 - Cross-Jurisdictional Liabilities
Cross-jurisdictional liabilities (excluding derivatives and intragroup liabilities) 29,629 49,318
Section 13 - Cross-Jurisdictional Claims
Cross-jurisdictional claims (excluding derivatives and intragroup claims) 30,949 22,182
INSIDE INSIGHT INSIDE INSIGHT SUPPLEMENTARY INFORMATION RISK MANAGEMENT
351

INVESTOR RELATIONS
CONSTITUENTS OF THE INVESTOR RELATIONS ECOSYSTEM OF THE BANK
• Shareholders
• Debenture holders
• Potential investors including development financing institutions
• Investment analysts
• Stock brokers
• Credit rating agencies
• Financial press
UNDERLYING PRINCIPLES OF OUR INVESTOR RELATIONS
• Quality and timeliness of disclosures
• Transparency
• Fairness in disclosures
• Avoidance of selective disclosures
• Maintaining same levels of engagements at all times consistently, irrespective of the Group’s performance
INVESTOR SUPPORT
Investor support is extended via a wide range of engagement activities as listed below.
• Annual General Meeting
• One to one investor meetings
• Financial Statements released to the CSE
• Press releases
• Investor presentations
• Investor transcripts
• Email notifications
• Local and foreign investor fora
• Online investor webinars
• Earnings calls
• Road shows
• Investor relations web page within the Bank’s corporate website
• Dedicated communication methods to reach us
• Financial results calendars shared well in advance for quarterly results releases
THE BANK HAS A DEDICATED FUNCTION FOR MAINTAINING INVESTOR RELATIONS, IN A BID TO ENSURE SOUND RELATIONS WITH INVESTORS, IDENTIFIED AS A KEY STAKEHOLDER GROUP MAKING TREMENDOUS CONTRIBUTION TOWARDS THE SUCCESS OF THE BANK.
RECOGNITION
Annual CFA Sri Lanka Capital Market Awards – Silver award winner 2021, Gold award winner for four consecutive years [2016-2019]. Refer page 290 for full list of awards under Excellence in Investor Relations.
SHAREHOLDER MILESTONES 1979 – 2021
Under and by virtue of the National Development Bank of Sri Lanka Act No. 2 of 1979 a bank was established with an authorised capital of LKR 2,000 million comprising 20 million ordinary shares of LKR 100.00 each. (which was subsequently subdivided into 200 million ordinary shares of LKR 10.00 each)
61% of the share capital of the National Development Bank of Sri Lanka (NDBSL) was transferred to private ownership through an IPO at LKR 50.00 per share.
NDBSL was privatised further by the early conversion of its convertible debentures, reducing the Governments direct shareholding to 12.2%. A further 2.56% of the issued shares were purchased by NDBSL for an Employees Share Ownership Plan.
A 1:2 bonus issue increased the number of shares in issue to 53,750,000.
As part of its long term plans, NDBSL incorporated a commercial bank under the Companies Act No. 17 of 1982 under the name ‘NDB Bank Limited’ (NBL) to take over the business and operations of ABN Amro NV Colombo Branch.
Pursuant to the provisions of the National Development Bank of Sri Lanka (Consequential Provisions) Act No. 1 of 2005 a company by the name of National Development Bank Limited (NDBL) was incorporated in terms of the Companies Act No. 17 of 1982 (and was accorded with the Registration No. N (PBS) 1252) for the purposes of taking over the business of NDBSL on 15 June 2005 and the National Development Bank of Sri Lanka Act No. 2 of 1979 was repealed except for certain provisions contained therein.
NDBL acquired the business and operations of NBL. In view of this, the shareholders of NBL were issued with shares of NDBL at the ratio of 1 NDBL share for every 5.6 shares of NBL held by them. This resulted in the increase of the issued capital of NDBL to 54,570,257 shares. In order to facilitate this transition, on the date of such acquisition, the Central Bank of Sri Lanka granted a commercial banking license to NDBL whilst withdrawing the specialised banking license that was held by it.
1979
1993
1997
2000
2001
2005
INSIDE INSIGHT SUPPLEMENTARY INFORMATION
352

SHAREHOLDER MILESTONES 1979 – 2021
SECURITIES IN ISSUE - NDB
• Basel II compliant Listed rated unsecured subordinated redeemable debentures issued in 2013
• Basel III compliant Listed rated unsecured subordinated redeemable debentures with a non-viability conversion issued in 2019, 2020 and 2021
New securities issued during 2021
• Ordinary shares via Rights Issue and Private Placement – please refer page 235
• Basel III compliant debentures – please refer pages from 360 to 361
ORDINARY SHARES
1 FEATURES OF ORDINARY SHARES
Security Type Quoted Ordinary Shares
Listed exchange Colombo Stock Exchange (CSE) – Main Board
Featured stock indices All Share Price Index (ASPI)
Standard & Poor's Sri Lanka 20 (S&P SL20)
GICS Sector Classification Banks (SPCSEBP)
CSE stock symbol NDB.N0000
ISIN LK0207N00007
Bloomberg newswire code NDB SL
Reuters newswire code NDB.CM
2 ANALYSIS OF EQUITY MARKET PERFORMANCE AND NDB SHARE PERFORMANCE - 2021
2.1 Performance of global equity markets
The global equity markets recorded a solid performance in 2021, managing to close the year with double digit gains for the third consecutive year, despite challenges such as historically high inflation, supply chain disruptions and the COVID-19 pandemic. The Chinese market was an underperformer in 2021. This was mainly driven by the stricter controls over the economy, including strengthening of laws targeting monopolistic companies, particularly in the Education and Tech sectors. As a result, the MSCI Emerging Market Index lost 2.5% during the year, in which China is a major constituent. The US equities performed strongly with the S&P 500 Index increasing by 27% during the year. This was mainly led by the 50% increase in Energy stocks followed by 40% increase in Real Estate stocks, while the biggest Tech-stocks continued to be the top contributors to the index gains. Market gains were largely buttressed by the macroeconomic recovery and loose fiscal and monetary policies. Japanese stocks performed strongly, recording a 10% gain in 2021. European stocks recorded their second best year since 2009 with a gain of 22%, and Banks and Tech stocks outperformed. Overall, the global equity market recorded strong performance as indicated by the MSCI All Country World Index, which gained 18.5% during the year. This was supported by the bullish market sentiment with vaccines beginning to rollout and rising demand resulting in economic resurgence. Supportive polices implemented by many of the world’s largest central banks along with government stimulus packages aided the performance of global financial markets as well. Towards the end of the year, the markets declined due to rising cases of COVID-19 from the spread of the Omicron variant. The MSCI World Index gained by 22% in 2021, while the MSCI Frontier Market Index gained by 20%.
Ordinary shares
Debentures
A bonus issue of 1 new share for every 2 shares held increased the issued ordinary share capital of NDBL by 27,285,128 shares.
NDBL was re-registered as National Development Bank PLC (‘Bank’) in terms of the new Companies Act No. 07 of 2007 and accorded with the Registration No. PQ 27.
245,566 ordinary shares were issued to eligible employees as per the Equity Linked Compensation Plan (ELCP) of the Bank, bringing the total number of issued shares to 82,100,951.
Existing ordinary shares were subdivided in the proportion of one new ordinary share for every ordinary share in issue resulting in a total of 164,201,902 ordinary shares in issue.
A Rights Issue whereby 32,854,055 ordinary shares were issued.
A Rights Issue was announced to raise LKR 8.0 Bn at the ratio of 28 new ordinary voting shares for every 61 ordinary voting shares held (up to 106,780,489 shares to be issued), at a consideration of LKR 75.00 per share.
Successful completion of the Rights Issue together with a Private Placement netting LKR 9.5 Bn, whereby 124,486,416 ordinary shares were issued.
Partnered Norfund - The Norwegian Investment Fund for Developing Countries as the Bank’s top shareholder.
A total of 983,604 shares were issued as share options/grant to eligible employees as per the ELCP.
A total of 34,597,670 shares issued as scrip dividends.
2006
2007
2010
2011
2018
2020
2021
2013-2016
2017-2020
INSIDE INSIGHT INSIDE INSIGHT SUPPLEMENTARY INFORMATION INVESTOR RELATIONS
353

3 ANALYSIS OF ORDINARY SHAREHOLDERS AS AT 31 DECEMBER 2021 AS PER RULE 7.6(X) OF THE LISTING RULES OF THE COLOMBO STOCK EXCHANGE
3.1 Distribution of shareholders
As at 31 December 2021 As at 31 December 2020Shareholding Range Number of
shareholders% Number of
shares % Number of
shareholders% Number of
shares %
1-1,000 7,195 62.10 2,077,904 0.58 7,176 63.01 2,115,947 0.91 1,001-10,000 3,461 29.87 11,306,361 3.17 3,411 29.95 10,767,295 4.63 10,001-100,000 788 6.80 20,791,970 5.82 684 6.01 17,691,432 7.61 100,001-1,000,000 110 0.95 34,119,135 9.55 89 0.78 23,038,861 9.90 Over 1,000,000 33 0.28 288,828,277 80.88 29 0.25 179,023,696 76.95 Total 11,587 100.00 357,123,647 100.00 11,389 100.00 232,637,231 100.00
3.2 Resident/non-resident shareholding
As at 31 December 2021 As at 31 December 2020Shareholding Range Number of
shareholders% Number of
shares % Number of
shareholders% Number of
shares %
Resident 11,459 98.90 293,656,468 82.23 11,242 98.71 206,398,450 88.72Non-resident 128 1.10 63,467,179 17.77 147 1.29 26,238,781 11.28Total 11,587 100.00 357,123,647 100.00 11,389 100.00 232,637,231 100.00
3.3 Individual/institutional shareholding
As at 31 December 2021 As at 31 December 2020Shareholding Range Number of
shareholders% Number of
shares % Number of
shareholders% Number of
shares %
Individual 10,981 94.77 57,813,835 16.19 10,833 95.12 49,264,144 21.18 Institutional 606 5.23 299,309,812 83.81 556 4.88 183,373,087 78.82 Total 11,587 100.00 357,123,647 100.00 11,389 100.00 232,637,231 100.00
2.2 Performance of the Colombo Stock Exchange
In 2021, the Sri Lankan equity market performed exceptionally well by recording an 80.5% increase, where the ASPI reached record highs reaching 12,000 levels by the end of the year. The market returns were driven by the opening up of the economy as a result of the vaccination drive, low interest rates and a recovery in consumer spending. Greater interest was seen on export oriented stocks driven by the depreciation of the Sri Lankan Rupee. Foreign investors continued to be net sellers during the year (net foreign outflow of LKR 52.6 Bn in 2021 vs LKR 51.3 Bn in 2020) with foreign participation falling
to 5.1% of market turnover vs. 20% seen a year ago. The average daily market turnover rose by 2.6 times to LKR 4.9 Bn (LKR 1.9 Bn in 2020) due to active domestic participation. Stocks in the Transportation and Diversified Financials sectors emerged as top gainers in 2021.
2.3 Performance of the NDB share
The banking sector underperformed the broader market index in 2021 (3.7% return vs. 80.5% ASPI return). NDB’s share closed the year 11.8% lower compared to 2020. During the year, the stock price reached a high of LKR 103.59 in January and a low of LKR 67.90 in December. The stock recorded
a total turnover of LKR 3.1 Bn during the year, and the total number of trades were at 31,141. A total of 37 Mn NDB shares were traded during the year.
During the year, the Bank raised LKR 8 Bn Tier 2 capital from the capital market. The Bank also raised LKR 9.5 Bn via a rights issue and a private placement (the latter LKR 1.5 Bn through Norfund, – the Norwegian Investment Fund for Developing Countries) with the aim of facilitating Balance Sheet growth, while strengthening the Tier 1 capital base.
INSIDE INSIGHT SUPPLEMENTARY INFORMATION INVESTOR RELATIONS
354

4 20 LARGEST REGISTERED SHAREHOLDERS OF THE BANK AS AT 31 DECEMBER 2021 AS PER RULE NO 7.6(III) OF THE LISTING RULES OF THE COLOMBO STOCK EXCHANGE
2021 2020Name Number of
shares% Name Number of
shares%
1 Standard Chartered Bank Mauritius S/A Norfund
35,676,652 9.99 Employees’ Provident Fund 23,263,721 10.00
2 Employee's Provident Fund 33,942,150 9.50 Bank Of Ceylon No. 1 Account 19,454,400 8.363 Bank Of Ceylon No. 1 Account 28,384,288 7.95 Sri Lanka Insurance Corporation Ltd-General
Fund14,875,617 6.39
4 Sri Lanka Insurance Corporation Ltd-General Fund
21,703,769 6.08 Sri Lanka Insurance Corporation Ltd-Life Fund
12,367,328 5.32
5 Richard Pieris and Co Ltd - Account No. 01 20,241,043 5.67 Dr. S. Yaddehige 10,160,638 4.376 Sri Lanka Insurance Corporation Ltd-Life
Fund18,044,134 5.05 Softlogic Life Insurance PLC Account
Number 03/Life Shareholders Fund9,702,577 4.17
7 Softlogic Life Insurance PLC Account Number 03/Life Shareholders Fund
14,156,218 3.96 Employees Trust Fund Board 9,054,503 3.89
8 Employees Trust Fund Board 12,113,445 3.39 Perpetual Treasuries Limited 8,736,886 3.769 Dr. S. Yaddehige 10,160,638 2.85 Richard Pieris and Co Ltd - Account No. 01 8,606,626 3.7010 Hatton National Bank PLC A/C No 1 9,899,341 2.77 Hatton National Bank PLC A/C No 1 6,784,942 2.9211 Perpetual Treasuries Limited 8,736,886 2.45 Phoenix Ventures Private Limited 6,769,999 2.9112 SBI Ven Holdings Pte Ltd 8,669,031 2.43 Rush Japan Corporation 6,724,630 2.8913 Phoenix Ventures Private Limited 6,769,999 1.90 SBI Ven Holdings Pte Ltd 5,941,696 2.5514 Rush Japan Corporation 6,724,630 1.88 Mr. A.K. Pathirage 3,529,367 1.5215 People's Leasing & Finance PLC/Mr. D.
Schaffter6,639,562 1.86 Asiri Surgical Hospital PLC 3,470,389 1.49
16 Akbar Brothers Pvt Ltd A/C No 1 5,445,512 1.52 Akbar Brothers Pvt Ltd A/C No 1 3,453,692 1.4817 Mr. A.K. Pathirage 5,149,404 1.44 DFCC Bank PLC A/C 1 3,168,904 1.3618 Asiri Surgical Hospital PLC 5,063,354 1.42 Mr. M.J. Fernando 2,932,800 1.2619 Arpico Insurance Limited 3,395,001 0.95 Seylan Bank PLC/Arrc Capital (Pvt) Ltd 2,705,000 1.1620 DFCC Bank PLC A/C 1 3,168,904 0.89 Perpetual Equities (Private) Limited 2,532,828 1.09
264,083,961 73.95 164,236,543 70.60Others 93,039,686 26.05 Others 68,400,688 29.40Total 357,123,647 100.00 Total 232,637,231 100.00
All shares issued by the Bank are denominated only in LKR as at 31 December 2021.
5 PERCENTAGE OF THE SHARES HELD BY THE PUBLIC
As at 31 December 2021
As at 31 December 2020
Float adjusted Market Capitalisation (LKR Mn only) 17,692 14,739Parentage of the shares held by the public 71.90% 81.12%Number of public shareholders 11,555 11,359Option under which the Bank complies with the minimum Public Holding requirement 1* 1*
*As set out in the Listing Rules of the Colombo Stock Exchange
INSIDE INSIGHT INSIDE INSIGHT SUPPLEMENTARY INFORMATION INVESTOR RELATIONS
355

LKR
2017 2018 2019 2020 202150
75
100
125
150
175
Highest price
Lowest price
Price as at 31 December/last trading date of the year152.40
136.40
126.90
113.10
100.00
85.80
141.40
106.80
98.00 103.59
68.90
67.90
99.16
78.10
56.80
Share Price Movement
6 DIRECTORS’ INTEREST IN SHARES OF THE BANK
Name As at 31 December 2021
As at 31 December 2020
Number of shares Number of shares
Mr. Eshana de Silva Nil NilMr. Dimantha Seneviratne 70,820 17,697Mr. Sriyan Cooray Nil NilMr. Bernard Sinniah Nil NilDr. Dinusha Panditaratne (resigned w.e.f. 20 August 2021) Nil NilMr. Sujeewa Mudalige Nil NilMs. Hiransa Kaluthantri (resigned w.e.f. 29 April 2021) Nil NilMr. Hiran Perera Nil NilMr. Kushan D’Alwis, PC Nil NilMs. (Fay) Piyachatr Chetnakarnkul (appointed w.e.f. 25 May 2021) Nil NilMs. Chandima Dilrukshi (appointed w.e.f. 21 June 2021) Nil Nil
All shares issued to Directors including the CEO are denominated only in LKR.
7 INFORMATION ON SHARE TRADING
7.1 Share price movement trend over the past five years
Year 2021 2020 2019 2018 2017
Highest price (LKR) 103.59 99.16 113.10 141.40 152.40Date/s highest price was recorded 29 January 2021 02 January 2020 29 July 2019 22 February 2018 15 May 2017Lowest price (LKR) 67.90 56.80 85.80 98.00 126.90Date/s lowest price was recorded 21,28 and 29
15 May 2020 27 May 2019 16 October 2018 02 October 2017December 2021Price as at 31 December/last trading date of the year (LKR)
68.90 78.10 100.00 106.80 136.40
Total number of shares in issue 357,123,647 232,637,231 221,799,756 210,317,117 171,485,705
NDB share price on the date of approval of the Annual Report
LKR 68.90 AS AT 22 FEBRUARY 20227.1.1 Share price movement over the year
Month Jan-21 Feb-21 Mar-21 Apr-21 May-21 Jun-21 Jul-21 Aug-21 Sep-21 Oct-21 Nov-21 Dec-21
Highest price ( LKR ) 103.59 97.96 86.20 80.90 81.20 82.90 80.60 81.90 78.90 79.90 78.00 72.00
Lowest price ( LKR ) 75.43 79.35 77.19 75.00 74.90 78.00 75.70 75.90 75.70 76.00 70.00 67.90Price as at month end ( LKR ) 95.41 81.21 79.15 75.50 78.30 80.20 79.20 77.20 76.40 77.10 70.10 68.90
INSIDE INSIGHT SUPPLEMENTARY INFORMATION INVESTOR RELATIONS
356

7.2 Share trading details
Year 2021 2021 2020 2019 2018 2017Q4 Q3 Q2 Q1
Number of trades - NDB 31,141 9,012 5,746 4,777 11,606 27,490 8,728 10,476 7,568
Percentage of total market trades
0.38% 0.32% 0.26% 0.39% 0.62% 0.90% 0.73% 1.18% 0.77%
Number of NDB shares traded ('000)
37,197 10,318 5,434 4,718 16,728 31,710 11,742 31,703 14,073
Percentage of total shares traded in the market
0.06% 0.05% 0.03% 0.08% 0.09% 0.15% 0.12% 0.53% 0.17%
Turnover - NDB (LKR Mn) 3,050 767 422 374 1,487 2,484 1,209 3,447 1,937Average daily turnover (LKR Mn)
13 12 7 7 26 12 5 14 8
Percentage of total market turnover
0.26% 0.20% 0.13% 0.27% 0.46% 0.63% 0.71% 1.72% 0.88%
Share Trading Details
0
500
1,000
1,500
2,000
2,500
3,000
3,500
LKR Mn No.
Number of trades - NDBTurnover in LKR Mn - NDB Number of shares traded '000 - NDB
2017 2018 2019 2020 20215,000
10,000
15,000
20,000
25,000
30,000
35,000
40,000
1,2
09
3,0
50
37,19731,710
11,742
14,073
31,703
7,568
27,490
8,728
10,476
31,141
1,9
37 3,4
47
2,4
84
7.3 Shareholder funds and market capitalisation
Year 2021 2020 2019 2018 2017
Shareholder funds (NDB Group) in LKR Mn 62,727 47,976 43,383 39,012 33,012
Percentage increase/decrease in shareholder funds over the prior year 31% 11% 11% 18% 10%Market capitalisation (NDB) in LKR Mn 24,606 18,169 22,180 22,462 23,391 Percentage increase/decrease in NDB market capitalisation over the prior year
35% -18% -1% -4% -9%
Market capitalisation (CSE) in LKR Mn 5,489,168 2,960,648 2,851,313 2,839,446 2,899,291 Percentage increase/decrease in CSE market capitalisation over the prior year
85% 3% 0% -2% 6%
NDB's market capitalisation as a percentage of CSE market capitalisation 0.4% 0.6% 0.8% 0.8% 0.8%Market capitalisation rank of NDB in the CSE 44 42 27 25 26Market capitalisation (Banks sector within CSE) in LKR Mn 343,541 318,887 368,903 408,426 456,289NDB's market capitalisation as a percentage of Banks sector capitalisation 7.2% 5.7% 6.0% 5.5% 5.1%Beta value of NDB share against ASPI 0.53 1.37 1.53 1.88 1.99 Beta value of NDB share against S&P SL20 0.54 1.09 1.15 1.25 1.15
INSIDE INSIGHT INSIDE INSIGHT SUPPLEMENTARY INFORMATION INVESTOR RELATIONS
357

0
10000
20000
30000
40000
50000
60000
LKR Mn
Shareholder funds (NDB Group) in LKR Mn
2017 2018 2019 2020 2021
43
,38
3
62,
727
33
,01
2
39
,01
2
Market capitalisation (NDB) in LKR Mn
47
,97
6
22
,18
0
24
,60
6
23
,39
1
22
,46
2
18
,16
9
Shareholder Funds and Market Capitalisation
7.4 NDB share performance in comparison to selected local indices
7.5 NDB share performance in comparison to key regional indices
S&P SL Indexed to NDB NDB ASPI Indexed to NDB
50
100
150
200
250
LKR
02/2
8/17
04/3
0/17
06/3
0/17
08/3
1/17
10/3
1/17
12/3
1/17
02/2
8/18
04/3
0/18
06/3
0/18
08/3
1/18
10/3
1/18
12/3
1/18
02/2
8/19
04/3
0/19
06/3
0/19
08/3
1/19
10/3
1/19
12/3
1/19
02/2
9/20
04/3
0/20
06/3
0/20
08/3
1/20
10/3
1/20
12/3
1/20
02/2
8/21
04/3
0/21
06/3
0/21
08/3
1/21
10/3
1/21
12/3
1/21
NDB Group vs Indices
0
50
100
150
200
250
300
350
LKR
STI NDB SENSEX FBMKLCI MSCI Asia Pacific MSCI EM ASIA INDEXSET VNINDEX DSEX
02
/28
/17
04
/30
/17
06
/30
/17
08
/31
/17
10
/31
/17
12
/31
/17
02
/28
/18
04
/30
/18
06
/30
/18
08
/31
/18
10
/31
/18
12
/31
/18
02
/28
/19
04
/30
/19
06
/30
/19
08
/31
/19
10
/31
/19
12
/31
/19
02
/29
/20
04
/30
/20
06
/30
/20
08
/31
/20
10
/31
/20
12
/31
/20
02
/28
/21
04
/30
/21
06
/30
/21
08
/31
/21
10
/31
/21
12
/31
/21
NDB Group vs Indices
INSIDE INSIGHT SUPPLEMENTARY INFORMATION INVESTOR RELATIONS
358

8 KEY SHAREHOLDER RETURN INDICATORS - NDB GROUP
Year 2021 2020 2019 2018 2017
Return on equity (%) 12.47 11.20 11.59 14.26 11.09
Gross dividends paid during the year (LKR Mn) 349 1,553 1,683 1,200 1,664 Dividend per share (DPS) (LKR)* - 1.50 7.00 8.00 9.00Dividend yield (%)* - 1.92 7.00 7.49 6.60Dividend payout ratio (%)* - 6.31 30.37 30.32 35.47Earnings per share (EPS) (LKR) 22.44 21.99 20.53 26.33 19.66Dividend cover (Times)* - 14.66 2.93 3.29 2.18Total shareholder return ratio (TSR) (%) -9.86 -14.90 1.12 -16.57 -6.15Price earnings ratio (PE ratio) (Times) 3.07 3.55 4.87 4.06 6.94Net asset value per share (LKR) 175.65 206.23 195.60 185.49 192.51Price to book value (Times) 0.39 0.38 0.51 0.58 0.71
* The Board of Directors will consider a declaration of dividends for the year 2021 in due course. The Bank paid an interim cash dividend of LKR 1.50 per share for the year 2020.
INSIDE INSIGHT INSIDE INSIGHT SUPPLEMENTARY INFORMATION INVESTOR RELATIONS
DEBENTURES OF NDB
11 NDB HAS ISSUED FIVE DEBENTURES AS FOLLOWS
i. Rated unsecured subordinated redeemable debentures – November 2021 ii. Rated unsecured subordinated redeemable debentures – September 2020 iii. Rated unsecured subordinated redeemable debentures – March 2019 iv. Rated unsecured subordinated redeemable debentures – June 2015 (Matured in June 2020) v. Rated unsecured subordinated redeemable debentures – December 2013
9. EMPLOYEE SHARE OWNERSHIP SCHEMES
Employee Share Option Scheme (ESOS)
Please refer Note Number 46.3 Employee Share Option Scheme (ESOS) under Notes to the Financial Statements (page 237).
10. CAPITAL RAISING INITIATIVES 2021
Please refer Note Number 56.5 Capital Management under Notes to the Financial Statements (page 285).
359

11
(I) K
ey fe
atur
es a
nd tr
adin
g de
tails
of t
he d
eben
ture
s
2021
Nov
embe
r20
20 S
epte
mbe
r20
19 M
arch
2013
Dec
embe
r
Key
feat
ures
of t
he
debe
ntur
esTy
pes
of D
eben
ture
sTy
pe A
Type
BO
ne T
ype
Type
ATy
pe B
Type
CTy
pe D
Deb
entu
re C
ode
ND
B-B
D-
23/1
1/26
-C24
94-1
1.9
ND
B-B
D-
23/1
1/28
-C24
95-1
2N
DB
-BD
-24
/09/
25-C
2452
-9.5
ND
B-B
D-
30/0
3/24
-C24
19-1
3.5
ND
B-B
D-
30/0
3/24
-C24
20-1
3.95
ND
B/
BC
/19/
12/2
3C13
.9N
DB
/B
C/1
9/12
/25D
14
ISIN
LK02
07D
2494
1LK
0207
D24
958
LK02
07D
2452
9LK
0207
D24
198
LK02
07D
2420
6LK
0207
D21
038
LK02
07D
2105
3
Issu
e pr
ice
LKR
100
100
100
100
100
LKR
100
LKR
100
Par
val
ue L
KR
100
100
100
100
100
LKR
100
LKR
100
Inte
rest
rate
per
ann
um11
.90%
12.0
0%9.
50%
13.5
0%13
.95%
13.9
0%14
.00%
Inte
rest
pay
men
t fre
quen
cySe
mi A
nnua
llySe
mi A
nnua
llyA
nnua
llySe
mi A
nnua
llyA
nnua
llyA
nnua
llyA
nnua
lly
Ann
ual E
ffect
ive R
ate
per a
nnum
12.2
5%12
.36%
9.50
%13
.96%
13.9
5%13
.90%
14.0
0%
Dat
e of
allo
tmen
t21
Nov
embe
r 202
121
Nov
embe
r 202
125
Sep
tem
ber 2
020
31 M
arch
201
931
Mar
ch 2
019
19 D
ecem
ber 2
013
19 D
ecem
ber 2
013
Red
empt
ion
(from
the
date
of
allo
tmen
t)60
mon
ths
(5 y
ears
)84
mon
ths
(7 y
ears
)60
mon
ths
(5 y
ears
)60
mon
ths
(5 y
ears
)60
mon
ths
(5 y
ears
)12
0 m
onth
s (1
0 ye
ars)
144
mon
ths
(12
year
s)
Inte
rest
pay
men
t dat
es23
May
and
23
Nov
embe
r23
May
and
23
Nov
embe
r24
Sep
tem
ber u
p to
202
4 an
d 23
Se
ptem
ber i
n 20
25
30 S
epte
mbe
r and
30
Mar
ch30
Mar
ch31
Dec
embe
r 31
Dec
embe
r
Trad
ing
Det
ails
for
the
year
en
ded
31 D
ecem
ber
2021
CSE
Lis
ting
List
edLi
sted
List
edLi
sted
List
edLi
sted
List
ed
Bal
ance
as
at 3
1 D
ecem
ber 2
021
(LK
R M
N)
7,95
011
76,
642
1,28
24,
757
3,63
23,
581
Mar
ket V
alue
Hig
hest
Not
trad
ed d
urin
g th
e ye
arN
ot tr
aded
dur
ing
the
year
Not
trad
ed d
urin
g th
e ye
arN
ot tr
aded
dur
ing
the
year
105.
0211
0.10
Not
trad
ed d
urin
g th
e ye
ar
Low
est
102.
2811
0.10
Year
end
105.
0211
0.10
Inte
rest
Rat
eC
oupo
n R
ate
11.9
0%12
.00%
9.50
%13
.50%
13.9
5%13
.90%
14.0
0%
Effe
ctive
Ann
ual
Yie
ld11
.66%
11.7
3%9.
16%
13.1
6%13
.15%
13.1
7%13
.26%
Inte
rest
Rat
e of
com
para
ble
Gov
ernm
ent s
ecur
ity11
.14%
11.6
1%6.
57%
11.0
4%11
.04%
11.8
0%12
.09%
Oth
er R
atio
s as
at
last
trad
eIn
tere
st Y
ield
N/A
N/A
N/A
N/A
13.2
8%12
.62%
N/A
Yie
ld T
o M
atur
ityN
/AN
/AN
/AN
/A11
.31%
9.02
%N
/A
INSIDE INSIGHT SUPPLEMENTARY INFORMATION INVESTOR RELATIONS
360

INSIDE INSIGHT INSIDE INSIGHT SUPPLEMENTARY INFORMATION INVESTOR RELATIONS
11 (II) Disclosures regarding the utilisation of funds as per the objectives stated in the Debenture Prospectus for rated unsecured subordinated redeemable debentures – November 2021
Objective number
Objective as per Prospectus
Amount allocated as per Prospectus in LKR
Proposed date of utilisation as per Prospectus
Amount allocated from proceeds in LKR (A)
% of total proceeds
Amount utilised in LKR (B)
% of utilisation against allocation (B/A)
Clarification if not fully utilised including where the funds are invested
1 Improve and further strengthen the Capital Adequacy Ratio (CAR) in line with the Basel III guidelines
8,000,000,000 Within 12 months from the date of allotment (i.e. by 24 November 2022)
8,000,000,000 100% 8,000,000,000 100% -
2 Facilitate future expansion of business activities of the Bank
8,000,000,000 Within 12 months from the date of allotment (i.e. by 24 November 2022)
8,000,000,000 100% < 8,000,000,000 <100% Unutilised funds were invested in Government securities at zero risk at available market rate.
12 INFORMATION ON DEBENTURES OF THE BANK (AS PER RULE NO. 7.6 X (I) OF THE LISTING RULES OF THE COLOMBO STOCK EXCHANGE) - BANK
2021 2020
Debt Equity Ratio (%) 10.71 12.73
Interest cover (Times) 1.70 1.50 Liquidity Assets Ratio (%) - Domestic Banking Unit (DBU) (Minimum Requirement - 20%) 23.14 28.84 Liquidity Assets Ratio (%) - Foreign Currency Banking Unit (FCBU) (Minimum Requirement - 20%) 25.31 26.88 Liquidity Coverage Ratio (%) - Rupee (Minimum Requirement - 100% (2020 - 90%)) 193.03 161.97Liquidity Coverage Ratio (%) - All Currency (Minimum Requirement - 100% (2020 - 90%)) 171.33 157.12
13 OTHER INFORMATION ON DEBENTURES OF THE BANK
• Registrar to the rated unsecured subordinated redeemable debentures issued - S S P Corporate Services (Pvt) Limited No. 101 Inner Flower Road, Colombo 03
• Trustees to the rated unsecured subordinated redeemable debentures issued - Bank of Ceylon, Investment Banking Division No.1, BOC Square, Bank of Ceylon Mawatha, Colombo 01
14 DIRECTORS’ INTEREST IN LISTED DEBENTURES AS AT 31 DECEMBER 2021
None of the Directors of the Bank had any interest in any listed debentures of the Bank as at 31 December 2021 as issued in November 2021, September 2020, March 2019 and December 2013.
15 CREDIT RATINGS SUMMARY
NDB at present engages the services of Fitch Ratings Lanka Limited for local credit ratings and the Bank’s ratings are as follows.
As per rating action in August 2021
• National long term rating/Outlook: Affirmed at A+(lka); Stable
• Basel III compliant subordinated term debt: A-(lka)
• Basel II compliant subordinated term debt: A-(lka)
Please refer our Investor Relations web page within the NDB corporate website on http://www.ndbbank.com/to read the full rating reports.
361

INSIDE INSIGHT SUPPLEMENTARY INFORMATION INVESTOR RELATIONS
OTHER INFORMATION16 FINANCIAL STATEMENTS IN USD - BANK & GROUP
16.1 Statement of Profit or Loss
BANK GROUPFor the year ended 31 December 2021 2020 2021 2020
USD ’000 USD ’000 % USD ’000 USD ’000 %
Gross income 308,765 325,961 (5) 318,570 331,196 (4)
Interest income 261,947 284,744 (8) 262,454 285,545 (8)Less: Interest expenses 154,456 189,397 (18) 154,373 189,251 (18)Net interest income 107,491 95,347 13 108,081 96,294 12 Fee and commission income 28,012 22,933 22 36,711 29,293 25 Less: Fee and commission expenses 165 100 65 165 100 65 Net Fee and commission income 27,847 22,833 22 36,546 29,193 25 Net gains/(losses) from trading 10,422 5,196 101 10,422 5,196 101 Net gains/(losses) from financial assets at fair value through profit or loss 2,153 518 316 2,786 611 356 Net gains/(losses) from derecognition of financial assets 926 7,983 (88) 926 7,983 (88)Other operating income 5,305 4,587 16 5,271 2,566 105 Total operating income 154,144 136,464 13 164,032 141,844 16 Less: Impairment charges 51,028 36,511 40 50,968 36,496 40 Net operating income 103,116 99,953 3 113,064 105,348 7 Less: Operating expensesPersonnel expenses 28,197 27,782 1 31,432 30,881 2 Depreciation and amortisation expenses 4,134 4,398 (6) 4,544 5,005 (9)Other expenses 19,540 18,315 7 21,266 19,990 6 Total operating expenses 51,871 50,495 3 57,242 55,876 2 Operating profit before Value Added Tax on financial services 51,245 49,458 4 55,822 49,472 13 Less: Value Added Tax on financial services 10,015 9,771 2 10,015 9,771 2 Operating profit after Value Added Tax on financial services 41,230 39,687 4 45,807 39,701 15 Share of associate companies’ profits/(losses) - - - - - - Profit before taxation 41,230 39,687 4 45,807 39,701 15 Less: Income tax expenses 9,599 9,977 (4) 10,694 11,673 (8)Profit for the year 31,631 29,710 6 35,113 28,028 25 Profit attributable to equity holders of the parent 31,631 29,710 6 34,325 27,488 25 Non-controlling interests - - - 788 540 46 Profit for the year 31,631 29,710 6 35,113 28,028 25 Basic/Diluted Earnings per share (USD) 0.10 0.13 (23) 0.11 0.12 (8)Dividend per share (USD) - 0.10 - - 0.11 -
362
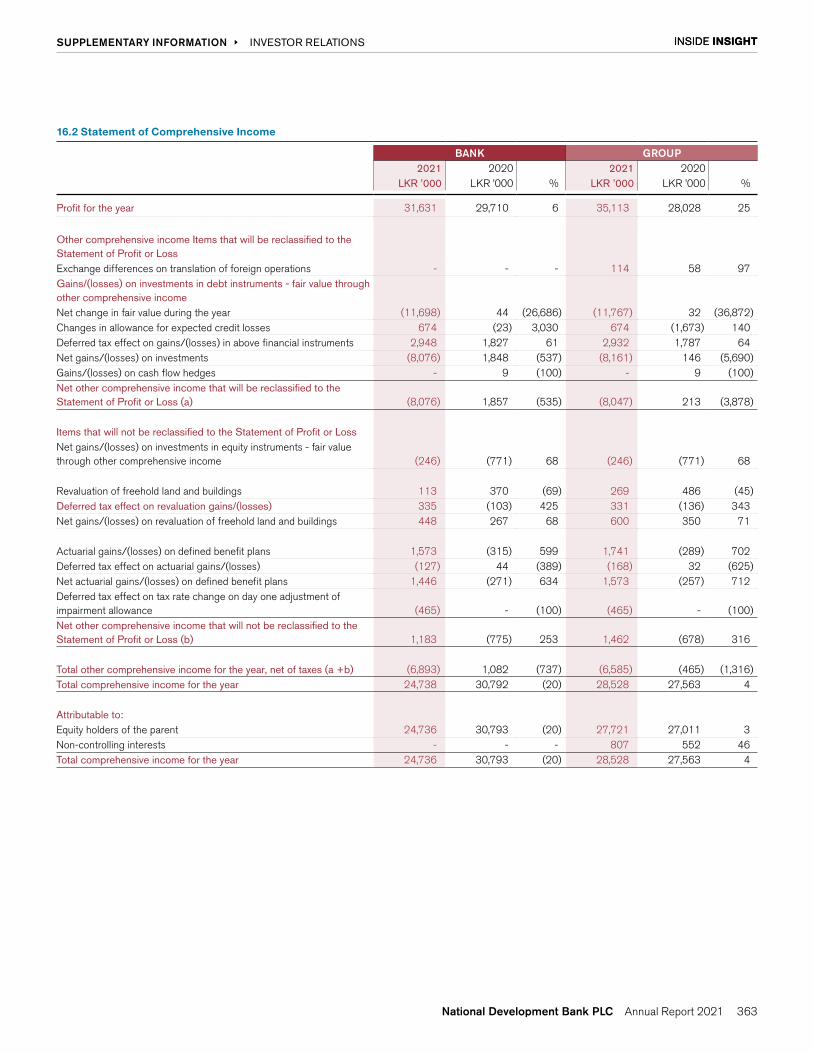
INSIDE INSIGHT INSIDE INSIGHT SUPPLEMENTARY INFORMATION INVESTOR RELATIONS
16.2 Statement of Comprehensive Income
BANK GROUP2021 2020 2021 2020
LKR ’000 LKR ’000 % LKR ’000 LKR ’000 %
Profit for the year 31,631 29,710 6 35,113 28,028 25
Other comprehensive income Items that will be reclassified to the Statement of Profit or LossExchange differences on translation of foreign operations - - - 114 58 97 Gains/(losses) on investments in debt instruments - fair value through other comprehensive incomeNet change in fair value during the year (11,698) 44 (26,686) (11,767) 32 (36,872)Changes in allowance for expected credit losses 674 (23) 3,030 674 (1,673) 140 Deferred tax effect on gains/(losses) in above financial instruments 2,948 1,827 61 2,932 1,787 64 Net gains/(losses) on investments (8,076) 1,848 (537) (8,161) 146 (5,690)Gains/(losses) on cash flow hedges - 9 (100) - 9 (100)Net other comprehensive income that will be reclassified to the Statement of Profit or Loss (a) (8,076) 1,857 (535) (8,047) 213 (3,878)
Items that will not be reclassified to the Statement of Profit or LossNet gains/(losses) on investments in equity instruments - fair value through other comprehensive income (246) (771) 68 (246) (771) 68
Revaluation of freehold land and buildings 113 370 (69) 269 486 (45)Deferred tax effect on revaluation gains/(losses) 335 (103) 425 331 (136) 343 Net gains/(losses) on revaluation of freehold land and buildings 448 267 68 600 350 71
Actuarial gains/(losses) on defined benefit plans 1,573 (315) 599 1,741 (289) 702 Deferred tax effect on actuarial gains/(losses) (127) 44 (389) (168) 32 (625)Net actuarial gains/(losses) on defined benefit plans 1,446 (271) 634 1,573 (257) 712 Deferred tax effect on tax rate change on day one adjustment of impairment allowance (465) - (100) (465) - (100)Net other comprehensive income that will not be reclassified to the Statement of Profit or Loss (b) 1,183 (775) 253 1,462 (678) 316
Total other comprehensive income for the year, net of taxes (a +b) (6,893) 1,082 (737) (6,585) (465) (1,316)Total comprehensive income for the year 24,738 30,792 (20) 28,528 27,563 4
Attributable to:Equity holders of the parent 24,736 30,793 (20) 27,721 27,011 3 Non-controlling interests - - - 807 552 46 Total comprehensive income for the year 24,736 30,793 (20) 28,528 27,563 4
363

16.3 Statement of Financial Position
BANK GROUPAs at 31 December 2021 2020 2021 2020
USD ’000 USD ’000 % USD ’000 USD ’000 %
Assets
Cash and cash equivalents 66,725 55,785 20 68,484 57,335 19 Balances with the Central Bank of Sri Lanka 81,609 36,235 125 81,609 36,235 125 Placements with banks 41,291 65,966 (37) 41,291 65,966 (37)Derivative financial instruments 6,658 7,604 (12) 6,658 7,604 (12)Financial assets recognised through profit or loss - measured at fair value
12,148 29,650 (59) 23,802 41,028 (42)
Financial assets at amortised cost - loans and receivables to other customers
2,500,047 2,263,859 10 2,499,228 2,264,265 10
Financial assets at amortised cost - debt and other instruments 269,965 237,828 14 269,965 237,828 14 Financial assets measured at fair value through other comprehensive income
445,533 577,623 (23) 446,252 578,526 (23)
Investments in subsidiary companies 5,626 6,079 (7) - - - Investments in associate companies - - - - - - Investment property - - - 12,578 12,561 0 Intangible assets 5,990 5,576 7 6,055 5,647 7 Property, plant & equipment 15,641 15,793 (1) 18,584 18,835 (1)Right of use assets 5,445 5,643 (3) 6,395 6,860 (7)Current tax receivables - - - 138 240 (43)Deferred tax assets 17,002 9,977 70 17,130 10,350 66 Other assets 23,349 16,620 40 28,212 19,122 48 Total assets 3,497,030 3,334,238 5 3,526,381 3,362,402 5
LiabilitiesDue to banks 123,238 128,581 (4) 123,488 128,581 (4)Derivative financial instruments 5,217 5,408 (4) 5,217 5,408 (4)Financial liabilities at amortised cost
Due to depositors 2,746,467 2,607,862 5 2,742,570 2,604,568 5 Due to debt securities holders 6,672 7,979 (16) 6,672 7,979 (16)Due to other borrowers 125,517 182,362 (31) 125,517 182,362 (31)
Debt securities issued 139,108 105,749 32 139,108 105,749 32 Current tax liabilities 11,976 12,220 (2) 12,866 13,635 (6)Deferred tax liabilities - - - 2,832 3,171 (11)Retirement benefit obligations 3,660 3,773 (3) 4,129 4,362 (5)Other liabilities 41,981 42,108 (0) 45,242 44,868 1 Total liabilities 3,203,836 3,096,042 3 3,207,641 3,100,683 3
EquityStated capital 90,864 46,778 94 90,864 46,778 94 Statutory reserve fund 12,793 11,683 10 12,793 11,683 10 Retained earnings 194,698 176,205 10 212,592 192,252 11 Other reserves (5,161) 3,530 (246) (4,173) 4,479 (193)Total equity to equity holders of the Bank 293,194 238,196 23 312,076 255,192 22 Non-controlling interests - - - 6,664 6,527 2 Total equity 293,194 238,196 23 318,740 261,719 22 Total liabilities and equity 3,497,030 3,334,238 5 3,526,381 3,362,402 5 Contingent liabilities and commitments 1,552,599 1,829,519 (15) 1,552,131 1,830,073 (15)Net asset value per share (USD) 0.82 1.02 (20) 0.87 1.10 (21)
INSIDE INSIGHT SUPPLEMENTARY INFORMATION INVESTOR RELATIONS
364
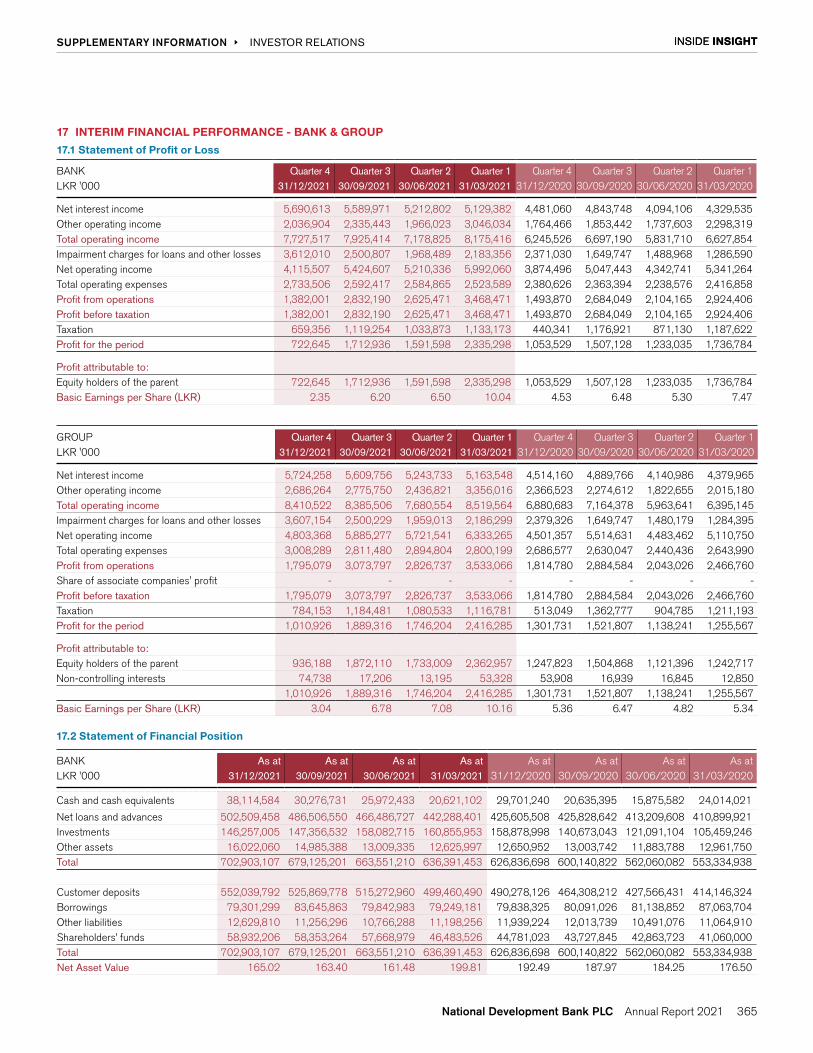
INSIDE INSIGHT INSIDE INSIGHT SUPPLEMENTARY INFORMATION INVESTOR RELATIONS
17 INTERIM FINANCIAL PERFORMANCE - BANK & GROUP
17.1 Statement of Profit or Loss
BANK Quarter 4 Quarter 3 Quarter 2 Quarter 1 Quarter 4 Quarter 3 Quarter 2 Quarter 1LKR '000 31/12/2021 30/09/2021 30/06/2021 31/03/2021 31/12/2020 30/09/2020 30/06/2020 31/03/2020
Net interest income 5,690,613 5,589,971 5,212,802 5,129,382 4,481,060 4,843,748 4,094,106 4,329,535Other operating income 2,036,904 2,335,443 1,966,023 3,046,034 1,764,466 1,853,442 1,737,603 2,298,319Total operating income 7,727,517 7,925,414 7,178,825 8,175,416 6,245,526 6,697,190 5,831,710 6,627,854Impairment charges for loans and other losses 3,612,010 2,500,807 1,968,489 2,183,356 2,371,030 1,649,747 1,488,968 1,286,590Net operating income 4,115,507 5,424,607 5,210,336 5,992,060 3,874,496 5,047,443 4,342,741 5,341,264Total operating expenses 2,733,506 2,592,417 2,584,865 2,523,589 2,380,626 2,363,394 2,238,576 2,416,858Profit from operations 1,382,001 2,832,190 2,625,471 3,468,471 1,493,870 2,684,049 2,104,165 2,924,406Profit before taxation 1,382,001 2,832,190 2,625,471 3,468,471 1,493,870 2,684,049 2,104,165 2,924,406Taxation 659,356 1,119,254 1,033,873 1,133,173 440,341 1,176,921 871,130 1,187,622Profit for the period 722,645 1,712,936 1,591,598 2,335,298 1,053,529 1,507,128 1,233,035 1,736,784
Profit attributable to:Equity holders of the parent 722,645 1,712,936 1,591,598 2,335,298 1,053,529 1,507,128 1,233,035 1,736,784Basic Earnings per Share (LKR) 2.35 6.20 6.50 10.04 4.53 6.48 5.30 7.47
GROUP Quarter 4 Quarter 3 Quarter 2 Quarter 1 Quarter 4 Quarter 3 Quarter 2 Quarter 1LKR '000 31/12/2021 30/09/2021 30/06/2021 31/03/2021 31/12/2020 30/09/2020 30/06/2020 31/03/2020
Net interest income 5,724,258 5,609,756 5,243,733 5,163,548 4,514,160 4,889,766 4,140,986 4,379,965Other operating income 2,686,264 2,775,750 2,436,821 3,356,016 2,366,523 2,274,612 1,822,655 2,015,180Total operating income 8,410,522 8,385,506 7,680,554 8,519,564 6,880,683 7,164,378 5,963,641 6,395,145Impairment charges for loans and other losses 3,607,154 2,500,229 1,959,013 2,186,299 2,379,326 1,649,747 1,480,179 1,284,395Net operating income 4,803,368 5,885,277 5,721,541 6,333,265 4,501,357 5,514,631 4,483,462 5,110,750Total operating expenses 3,008,289 2,811,480 2,894,804 2,800,199 2,686,577 2,630,047 2,440,436 2,643,990Profit from operations 1,795,079 3,073,797 2,826,737 3,533,066 1,814,780 2,884,584 2,043,026 2,466,760Share of associate companies' profit - - - - - - - -Profit before taxation 1,795,079 3,073,797 2,826,737 3,533,066 1,814,780 2,884,584 2,043,026 2,466,760Taxation 784,153 1,184,481 1,080,533 1,116,781 513,049 1,362,777 904,785 1,211,193Profit for the period 1,010,926 1,889,316 1,746,204 2,416,285 1,301,731 1,521,807 1,138,241 1,255,567
Profit attributable to:Equity holders of the parent 936,188 1,872,110 1,733,009 2,362,957 1,247,823 1,504,868 1,121,396 1,242,717Non-controlling interests 74,738 17,206 13,195 53,328 53,908 16,939 16,845 12,850
1,010,926 1,889,316 1,746,204 2,416,285 1,301,731 1,521,807 1,138,241 1,255,567Basic Earnings per Share (LKR) 3.04 6.78 7.08 10.16 5.36 6.47 4.82 5.34
17.2 Statement of Financial Position
BANK As at As at As at As at As at As at As at As atLKR '000 31/12/2021 30/09/2021 30/06/2021 31/03/2021 31/12/2020 30/09/2020 30/06/2020 31/03/2020
Cash and cash equivalents 38,114,584 30,276,731 25,972,433 20,621,102 29,701,240 20,635,395 15,875,582 24,014,021
Net loans and advances 502,509,458 486,506,550 466,486,727 442,288,401 425,605,508 425,828,642 413,209,608 410,899,921Investments 146,257,005 147,356,532 158,082,715 160,855,953 158,878,998 140,673,043 121,091,104 105,459,246Other assets 16,022,060 14,985,388 13,009,335 12,625,997 12,650,952 13,003,742 11,883,788 12,961,750Total 702,903,107 679,125,201 663,551,210 636,391,453 626,836,698 600,140,822 562,060,082 553,334,938
Customer deposits 552,039,792 525,869,778 515,272,960 499,460,490 490,278,126 464,308,212 427,566,431 414,146,324Borrowings 79,301,299 83,645,863 79,842,983 79,249,181 79,838,325 80,091,026 81,138,852 87,063,704Other liabilities 12,629,810 11,256,296 10,766,288 11,198,256 11,939,224 12,013,739 10,491,076 11,064,910Shareholders’ funds 58,932,206 58,353,264 57,668,979 46,483,526 44,781,023 43,727,845 42,863,723 41,060,000Total 702,903,107 679,125,201 663,551,210 636,391,453 626,836,698 600,140,822 562,060,082 553,334,938Net Asset Value 165.02 163.40 161.48 199.81 192.49 187.97 184.25 176.50
365

17.2 Statement of Financial Position Contd.
GROUP As at As at As at As at As at As at As at As atLKR '000 31/12/2021 30/09/2021 30/06/2021 31/03/2021 31/12/2020 30/09/2020 30/06/2020 31/03/2020
Cash and cash equivalents 38,468,035 30,696,386 26,334,894 20,883,269 29,992,579 21,105,685 16,310,634 24,363,366Net loans and advances 502,344,786 486,575,247 466,327,326 442,249,361 425,681,832 425,870,010 413,256,356 410,994,629Investments 148,743,711 149,821,893 160,557,153 163,281,491 161,187,834 144,340,530 124,700,486 109,349,505Other assets 19,245,850 17,570,909 15,657,070 15,285,993 15,269,374 13,995,662 12,892,913 13,972,132Total 708,802,382 684,664,435 668,876,443 641,700,114 632,131,619 605,311,887 567,160,389 558,679,632
Customer deposits 551,256,595 525,144,852 514,672,131 498,867,821 489,658,746 463,944,930 427,148,152 413,756,399Borrowings 79,351,814 83,645,863 79,842,983 79,249,181 79,838,325 80,091,026 81,138,852 87,063,704Other liabilities 14,127,431 12,722,611 12,057,388 12,616,824 13,431,154 13,381,040 11,857,120 12,224,982Shareholders’ funds 62,727,169 61,886,210 61,046,379 49,722,455 47,976,238 46,725,602 45,860,719 44,466,065Non-controlling interests 1,339,373 1,264,899 1,257,562 1,243,833 1,227,156 1,169,289 1,155,546 1,168,482Total 708,802,382 684,664,435 668,876,443 641,700,114 632,131,619 605,311,887 567,160,389 558,679,632Net Asset Value 175.65 173.29 170.94 213.73 206.23 200.85 197.13 185.95
18 TEN YEARS AT A GLANCE (GROUP PERFORMANCE)
18.1 Statement of Profit or loss
LKR Mn 2012 2013 2014 2015 2016 2017 2018 2019 2020 2021
Income
Net interest income 5,896 7,012 7,913 7,807 8,861 11,086 15,103 17,971 17,925 21,741 Other operating income 9,042 4,537 5,053 5,484 4,816 5,597 7,450 6,835 8,479 11,255 Total operating income 14,938 11,549 12,966 13,291 13,677 16,683 22,553 24,806 26,404 32,996
Impairment for loans & receivables and other losses
51 1261 529 746 1425 1,290 3,764 4,405 6,794 10,253
Net operating income 14,887 10,288 12,437 12,545 12,252 15,393 18,789 20,401 19,610 22,743
Less operating expensesPersonnel costs 2,333 2,660 3,172 3,634 3,793 4,025 4,899 5,460 5,748 6,323 Other operating costs 2,163 2,904 2,738 3,196 3,366 4,176 4,468 4,949 4,653 5,192 Total operating expenses 4,496 5,564 5,911 6,830 7,159 8,201 9,367 10,409 10,401 11,515
Operating profit before share of Associate co's profit before tax
10,391 4,724 6,527 5,715 5,094 7,192 9,422 9,992 9,209 11,228
Share of Associate co's profit 439 49 97 78 - - - - - -Profit before taxation 10,830 4,773 6,624 5,793 5,094 7,192 9,422 9,992 9,209 11,228 Taxation 1,898 2,061 2,378 2,123 2,279 3,797 4,146 5,107 3,992 4,166 Profit after taxation 8,932 2,712 4,246 3,670 2,815 3,395 5,276 4,885 5,217 7,062 Minority interest 78 70 112 128 124 57 140 109 101 158 Profit attributable to Group 8,854 2,642 4,134 3,542 2,691 3,453 5,136 4,776 5,117 6,904
INSIDE INSIGHT SUPPLEMENTARY INFORMATION INVESTOR RELATIONS
366

INSIDE INSIGHT INSIDE INSIGHT SUPPLEMENTARY INFORMATION INVESTOR RELATIONS
18.2 Statement of Financial Position - Group
LKR Mn 2012 2013 2014 2015 2016 2017 2018 2019 2020 2021
Assets
Liquid assets 13,269 8,139 12,737 20,002 20,252 21,549 37,855 26,259 29,993 38,468 Investments 32,499 55,614 72,971 77,257 84,437 83,062 82,715 99,405 161,188 148,744 Loans & advances 124,311 137,523 175,547 209,768 227,717 274,079 344,276 396,672 425,682 502,345 Investments in associate companies 33 77 - - - - - - -Property & equipment 1,541 1,473 2,550 2,730 2,913 3,314 3,541 4,266 4,603 4,952 Investment property 1,296 1,384 1,546 1,672 1,776 1,895 2,111 2,273 2,362 2,528 Other assets 1154 2,608 3,780 3,925 3,637 4,747 7,930 6,725 8,305 11,765 Goodwill - - - - - - - - - - Total assets 174,103 206,818 269,130 315,354 340,732 388,645 478,428 535,600 632,132 708,802
LiabilitiesBorrowings 36,630 47,344 80,768 92,331 96,279 68,617 78,189 72,958 79,837 79,350Deposits with customers 107,394 129,423 151,485 184,152 203,516 273,041 347,170 404,668 489,659 551,257 Non life insurance reserves - - - - - - - - -Long term insurance fund - - - - - - - - -Taxation 713 625 1416 1,237 1,597 3,372 3,618 2,909 3,159 3,155 Other liabilities 3,657 4,062 6,662 8,233 8,326 9,637 9,340 10,527 10,273 10,973Total liabilities 148,394 181,454 240,331 285,953 309,718 354,667 438,317 491,062 582,928 644,736
Shareholders’ fundsStated capital 864 944 1145 1,163 1,246 2,209 6,469 7,685 8,794 18,264 Statutory reserves 879 959 1011 1,243 1,246 1,336 1,636 1,896 2,196 2,571 Other reserves 924 1880 1,474 1,000 497 923 239 579 842 (839)Retained earnings 22,216 20,733 24,246 24,976 26,946 28,544 30,668 33,233 36,143 42,731 Total shareholders' funds 24,883 24,516 27,876 28,382 29,937 33,012 39,012 43,383 47,976 62,727 Minority interest 826 848 923 1019 1,077 966 1099 1,155 1,227 1,339 Total funds employed 25,709 25,364 28,799 29,401 31,013 33,978 40,111 44,538 49,203 64,066 Total liabilities & funds employed 174,103 206,818 269,130 315,354 340,732 388,645 478,428 535,600 632,132 708,802
18.3 Share Information - Group
Share Information 2012 2013 2014 2015 2016 2017 2018 2019 2020 2021
Market price per share (LKR) 137.90 160.50 250.00 194.10 156.00 136.40 106.80 100.00 78.10 68.90
Basic earnings per share (LKR) 55.31 16.48 25.14 21.51 15.69 19.66 26.33 20.53 21.99 22.44 Interim dividends per share (LKR)* 5.00 5.00 7.00 7.00 - 2.00 - - 1.50 - Final dividends per share (LKR)* 10.00 5.00 4.00 4.00 8.00 7.00 8.00 7.00 - - Total dividends per share (LKR)* 15.00 10.00 11.00 11.00 8.00 9.00 8.00 7.00 1.50 - Dividend cover (Times)* 3.69 1.65 2.29 1.96 1.96 2.18 3.29 2.93 14.66 - Price earnings ratio (Times) 2.49 9.74 9.94 9.02 9.94 6.94 4.06 4.87 3.55 3.07 Book value per share (LKR) 151.54 148.85 169.35 172.35 181.23 192.51 185.49 195.60 206.23 175.65
* The Board of Directors will consider a declaration of dividends for the year 2021 in due course. The Bank paid an interim cash dividend of LKR 1.50 per share for the year 2020.
367
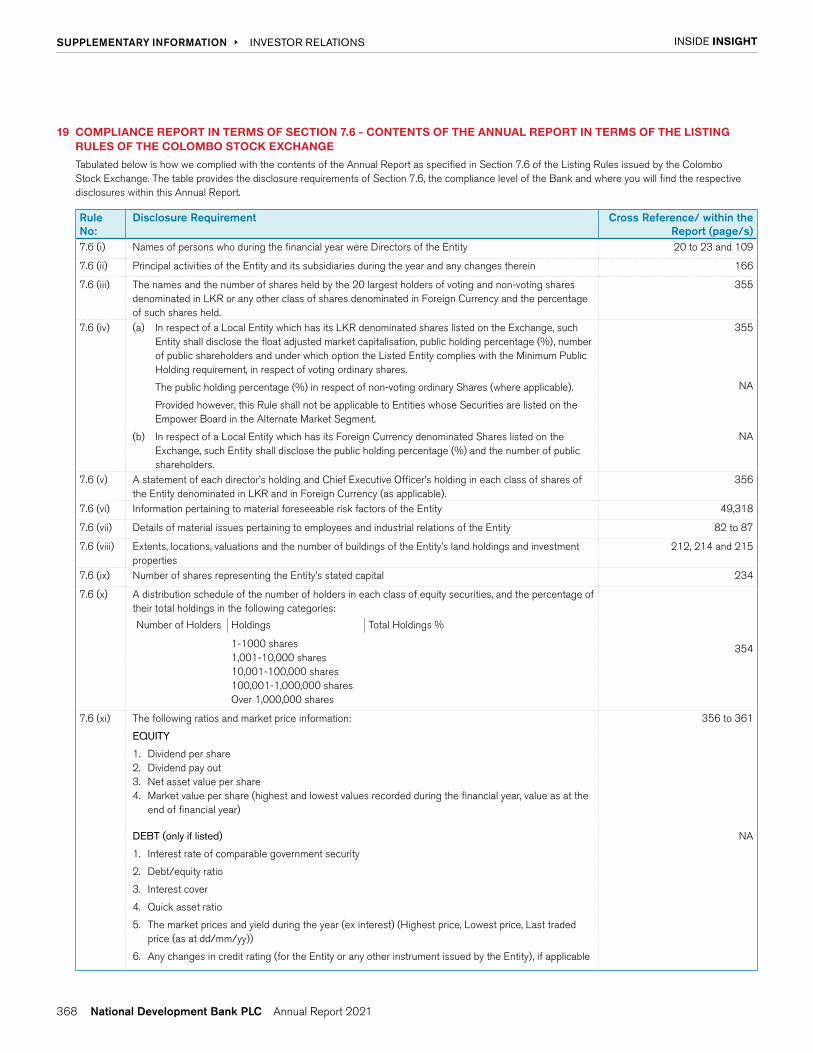
INSIDE INSIGHT SUPPLEMENTARY INFORMATION INVESTOR RELATIONS
19 COMPLIANCE REPORT IN TERMS OF SECTION 7.6 - CONTENTS OF THE ANNUAL REPORT IN TERMS OF THE LISTING RULES OF THE COLOMBO STOCK EXCHANGE
Tabulated below is how we complied with the contents of the Annual Report as specified in Section 7.6 of the Listing Rules issued by the Colombo Stock Exchange. The table provides the disclosure requirements of Section 7.6, the compliance level of the Bank and where you will find the respective disclosures within this Annual Report.
Rule No:
Disclosure Requirement Cross Reference/ within the Report (page/s)
7.6 (i) Names of persons who during the financial year were Directors of the Entity 20 to 23 and 109
7.6 (ii) Principal activities of the Entity and its subsidiaries during the year and any changes therein 166
7.6 (iii) The names and the number of shares held by the 20 largest holders of voting and non-voting shares denominated in LKR or any other class of shares denominated in Foreign Currency and the percentage of such shares held.
355
7.6 (iv) (a) In respect of a Local Entity which has its LKR denominated shares listed on the Exchange, such Entity shall disclose the float adjusted market capitalisation, public holding percentage (%), number of public shareholders and under which option the Listed Entity complies with the Minimum Public Holding requirement, in respect of voting ordinary shares.
The public holding percentage (%) in respect of non-voting ordinary Shares (where applicable).
Provided however, this Rule shall not be applicable to Entities whose Securities are listed on the Empower Board in the Alternate Market Segment.
(b) In respect of a Local Entity which has its Foreign Currency denominated Shares listed on the Exchange, such Entity shall disclose the public holding percentage (%) and the number of public shareholders.
355
NA
NA
7.6 (v) A statement of each director’s holding and Chief Executive Officer’s holding in each class of shares of the Entity denominated in LKR and in Foreign Currency (as applicable).
356
7.6 (vi) Information pertaining to material foreseeable risk factors of the Entity 49,318
7.6 (vii) Details of material issues pertaining to employees and industrial relations of the Entity 82 to 87
7.6 (viii) Extents, locations, valuations and the number of buildings of the Entity’s land holdings and investment properties
212, 214 and 215
7.6 (ix) Number of shares representing the Entity’s stated capital 234
7.6 (x) A distribution schedule of the number of holders in each class of equity securities, and the percentage of their total holdings in the following categories:
Number of Holders Holdings Total Holdings %
1-1000 shares 1,001-10,000 shares 10,001-100,000 shares 100,001-1,000,000 shares Over 1,000,000 shares
354
7.6 (xi) The following ratios and market price information:
EQUITY
1. Dividend per share 2. Dividend pay out 3. Net asset value per share 4. Market value per share (highest and lowest values recorded during the financial year, value as at the
end of financial year)
356 to 361
DEBT (only if listed)
1. Interest rate of comparable government security
2. Debt/equity ratio
3. Interest cover
4. Quick asset ratio
5. The market prices and yield during the year (ex interest) (Highest price, Lowest price, Last traded price (as at dd/mm/yy))
6. Any changes in credit rating (for the Entity or any other instrument issued by the Entity), if applicable
NA
368

INSIDE INSIGHT INSIDE INSIGHT SUPPLEMENTARY INFORMATION INVESTOR RELATIONS
Rule No:
Disclosure Requirement Cross Reference/ within the Report (page/s)
7.6 (xii) Significant changes in the Entity’s or its subsidiaries’ fixed assets and the market value of land, if the value differs substantially from the book value;
NA
7.6 (xiii) If during the financial year the Entity has raised funds through an Initial Public Offering and/or a further issue of Securities (as applicable);
235,360,361
a. the manner in which the funds of such issue/s have been utilised in conformity with the format provided by the Exchange from time to time;
b. if any shares or debentures have been issued, the number, class and consideration received and the reason for the issue; and
c. any material change in the use of funds raised through an issue of Securities
In the event the funds raised through the Initial Public Offering and/or the further issue of Securities (as applicable) have been fully utilised by the Listed Entity as disclosed in the Prospectus and/or Circular to shareholders between two financial periods, the Entity shall disclose such fact in the immediate succeeding Annual Report or the Interim Financial Statement, whichever is published first
7.6 (xiv) a. Employee share option schemes 237
b. Employee share purchase schemes NA
7.6 (xv) Disclosures pertaining to Corporate Governance practices in terms of Rules 7.10.3, 7.10.5 c. and 7.10.6 c. of Section 7 of the Rules
292 to 317
7.6 (xvi) Related Party transactions exceeding 10% of the Equity or 5% of the total assets of the Entity as per Audited Financial Statements, whichever is lower
304
7.6 (xvii) In the event a Listed Entity has its Foreign Currency denominated Securities listed on the Exchange, the Entity shall additionally disclose the following in its Annual Report:
(a) The Trading Currency of such Securities
(b) A detailed description of the utilisation of the proceeds held in the SFCA of the Entity for any capital transaction/s outside Sri Lanka, including the amount of proceeds utilised, as a percentage (%) of the total proceeds credited to the SFCA of the Entity pursuant to the Initial Public Offering.
(c) A Statement of compliance by the Listed Entity vis-à-vis the Applicable Foreign Exchange Regulations including but not limited to the following:
i) Maintenance of foreign exchange earnings at a minimum level of fifty per centum (50%) of its total annual revenue which is equivalent to a minimum of USD 5 Mn (5,000,000)
or a negative statement;
ii) The amount of proceeds held in the SFCA, which have been utilised by the Entity for any capital transactions outside Sri Lanka;
iii) Repatriation of income of the investments made through the SFCA into Sri Lanka; and,
iv) The amount of capital gains of the proceeds utilised for any capital transactions outside Sri Lanka.
(d) A status update on the residual of the proceeds which are not utilised for capital transactions outside Sri Lanka.
NA
20 SHAREHOLDER ENQUIRIES AND COMMUNICATIONS
Please refer Corporate Information (page 386).
369

KEY EVENTS
JANUARY
� Promotes LANKAQR in Colombo together with the Central Bank of Sri Lanka
� Wins the coveted Grand Prix at SLIM Digis 2.0 Awards
� NDB relocates Its Moratuwa branch for a Bigger, Better and Bolder Banking experience
FEBRUARY
� Conducts Webinars for female achievers at Sri Lanka Vanithabhimana programme
� Opens a Trade Hub at Old Moor Street
MARCH
� Launches NDB Family Banking
� Sri Lanka Vanithabhimana Grand Finale - NDB pays tribute to female trailblazers at Nelum Pokuna Theatre
� Named as Sri Lanka’s Best DigitalBank 2021 by Asiamoney
APRIL
� Signs MOU with Department of Registration of Persons to align with the National Roadmap for Digitalization of Payment Services
MAY
� Becomes the Highest Gainer within the Top 20 of Sri Lanka’s Most Valuable Brands
JUNE
� Partners SL@100 to enable increased access to finance for mid-market firms and SMEs
� Plants Moodilla trees with the Road Development Authority along the new Marine Drive stretch in Colombo
� Introduces Digital Account Opening for customers with video conferencing capabilities
� NDB NEOS introduces CRIB Reports/ Scores download feature
JULY
� Becomes the first local bank in Sri Lanka to be named as a “Great Place to Work”
� Relocates Narahenpita Branch for an enhanced customer experience
AUGUST
� Sri Lanka Vanithabhimana launches the second edition for 2021/2022
SEPTEMBER
� Launches new brand positioning “The Future is Banking on Us”
� Launches Virtual Know Your Custome
OCTOBER
r (vKYC) together with NDB NEOS
� Honoured as one of the Top 10 Most Admired Companies in Sri Lanka by CIMA Sri Lanka, ICCSL and Daily FT
� Introduces digital signatures for internal and external usage in Sri Lanka
� Introduces first ever Mobile App for SMEs - NEOSBIZ
NOVEMBER
� Introduces ‘NDB Zee’ -The Ultimate Account for Today’s Youth
� NDB Jayagamu Sri Lanka celebrates a year of success
DECEMBER
� Becomes the first bank in Sri Lanka to pave the path to digitalization with TradeLens - A Blockchain Technology
� Launches ‘Ratapuraama LANKAQR’ together with the Central Bank of Sri Lanka in Negombo
� NDB “Santa’s Gift Box” Promo continues for the fifth consecutive year
INSIDE INSIGHT SUPPLEMENTARY INFORMATION
370

No Branch Code
Branch Name Address General Region Name District Province
001 094 Akkaraipattu No. 487, Main Street, Akkaraipattu 067 7448000/1 North East Region Ampara Eastern002 065 Akuressa No. 21, Main Street, Akuressa 041 7448000/1 Southern Region Matara Southern003 059 Aluthgama No. 267, Galle Road, Aluthgama 0347448010/1 Southern Region Kalutara Western 004 047 Ambalangoda No. 333, Galle Road, Ambalangoda 0917448000/1 Southern Region Galle Southern005 048 Ambalantota No. 127, Main Street, Ambalantota 047 7448000/1 Southern Region Hambanthota Southern006 040 Ampara No. 75, D S Sennanayake Street, Ampara 063 7448000/1 Uva- Sabaragamuwa
RegionAmpara Eastern
007 019 Anuradhapura No. 522/C, Maithreepala Senanayake Mw, New Town, Anuradhapura
025 7448000/1 North Central Region Anuradhapura North Central
008 071 Athurugiriya No. 70/15A, Borella Road, Athurugiriya 011 7448060/1 Greater Colombo Region Colombo Western 009 034 Avissawella No. 93, Ratnapura Road, Avissawella 036 7448000/1 Uva- Sabaragamuwa
RegionColombo Western
010 018 Badulla No. 242, Lower Street, Badulla 055 7448000/1 Central Region Badulla Uva011 077 Balangoda No. 24 A, Barns Ratwatte Mawatha,
Balangoda0457448000/1 Uva- Sabaragamuwa
RegionRatnapura Sabaragamuwa
012 051 Bandarawela No. 317, Main Street, Bandarawela 057 7448000/1 Central Region Badulla Uva013 090 Battaramulla No. 245, Main Street, Battaramulla 011 7448090/1 Greater Colombo Region Colombo Western 014 039 Batticaloa No. 16, Liyods Avenue, Batticaloa 065 7448000/1 North East Region Batticaloa Eastern015 072 Boralesgamuwa No. 39, Kesbawa Road, Boralesgamuwa 0117448063/4 Greater Colombo Region Colombo Western 016 052 Borella No. 31/5, Dr. N M Perera Mawatha, Borella 0117 448078/9 Colombo Region Colombo Western 017 099 Chavakachcheri No. 1,3,5, Kandy Road, Chavakachcheri 0217448013/4 North East Region Jaffna Northern018 093 Chenkalady Trincomalee Road, Chenkalady 065 7448003/4 North East Region Batticaloa Eastern019 010 Chilaw No. 50-52, Skyline Building, Colombo
Road, Chilaw032 7448000/1 North Western Region Puttalam North Western
020 062 Chunnakam No. 30, K.K.S. road, Chunnakam 021 7448018/9 North East Region Jaffna Northern021 100 Colombo 7 No. 103A, Dharmapala Mawatha, Colombo
07011 7448004/5 Colombo Region Colombo Western
022 064 Dambulla No. 42, Kurunegala road, Dambulla 066 7448000/1 North Central Region Matale Central023 114 Digana No. 59/6, Gonawala Road ,Digana 081 7448003/4 Central Region Kandy Central024 078 Eheliyagoda No. 302, Main street, Ehaliyagoda 036 7448003/4 Uva- Sabaragamuwa
RegionRatnapura Sabaragamuwa
025 067 Elpitiya No. 23, Ambalangoda Road, Elpitiya 091 7448003/4 Southern Region Galle Southern026 058 Embilipitiya No. 67, Pallegama, Embilipitiya 047 7448003/4 Uva- Sabaragamuwa
RegionRatnapura Sabaragamuwa
027 113 Fort No. 39, Canal Row, Colombo 01 011 7448111/2 Colombo Region Colombo Western 028 021 Galle No. 1/A, Abeysekara Building, Wakwella
Road, Galle 091 7448006/7 Southern Region Galle Southern
029 029 Gampaha No. 03, Yakkala Road, Gampaha 033 7448000/1 North Western Region Gampaha Western 030 050 Gampola No. 75, Nuwara Eliya Road, Gampola 081 7448000/1 Central Region Kandy Central031 086 Giriulla No. 86, Negombo Road, Giriulla 037 7558010/1 North Central Region Kurunegala North Western032 057 Hambanthota No. 34, Wilmot street, Hambantota 047 7448006/7 Southern Region Hambanthota Southern033 096 Hanwella No. 130/C, Pahala Hanwella, Hanwella 036 7448006/7 Uva- Sabaragamuwa
RegionColombo Western
034 003 Havelock Town No. 117, Havelock Road, Colombo 05 0117 448006/7 Colombo Region Colombo Western 035 088 Hendala No. 46A Hendala Road, Hendala 011 7448094/3 North Western Region Gampaha Western 036 106 Hikkaduwa No. 245, Galle Road, Hikkaduwa 091 7448009/10 Southern Region Galle Southern037 102 Hingurakgoda No. 10, Airport Road, Hingurakgoda 027 7558010/1 North Central Region Polonnaruwa North Central038 030 Homagama No. 64A, Highlevel Road, Homagama 011 7448045/6 Greater Colombo Region Colombo Western 039 027 Horana No. 135, Panadura Road, Horana 034 7448013/5 Colombo Region Kalutara Western 040 044 Ja - Ela No. 121, Colombo Road, Ja-Ela 011 7448075/6 North Western Region Gampaha Western 041 037 Jaffna No. 62/6, Stanley Road, Jaffna 021 7448011/24 North East Region Jaffna Northern042 026 Kadawatha No. 147, Kandy Road, Kadawatha 011 7448036/7 North Western Region Gampaha Western 043 060 Kaduruwela No. 25, Batticaloa Road, Polonnaruwa 027 7558003/4 North Central Region Polonnaruwa North Central044 055 Kaduwela No. 501/2, Awissawella Road, Kaduwela 011 7448081/2 Greater Colombo Region Colombo Western
BRANCH NETWORK OF THE BANK
INSIDE INSIGHT INSIDE INSIGHT SUPPLEMENTARY INFORMATION BRANCH NETWORK OF THE BANK
371

No Branch Code
Branch Name Address General Region Name District Province
045 084 Kahawatte No. 149, Main Street, Kahawatte 045 7448003/4 Uva- Sabaragamuwa Region
Ratnapura Sabaragamuwa
046 053 Kalmunai No. 165, Batticaloa Road, Kalmunai 067 7448003/4 North East Region Ampara Eastern047 016 Kalutara No. 290 Galle Road, Kalutara South 034 7448016/7 Southern Region Kalutara Western 048 028 Kandana No. 677, Negombo Road, Kandana 011 7448039/40 North Western Region Gampaha Western 049 002 Kandy No. 133, Kotugodella Veediya, Kandy 081 7448015/6 Central Region Kandy Central050 080 Kandy City Centre L 1 - 3 , Level 1, Kandy City Center, No. 05,
Dalada weediya, Kandy081 7448006/7 Central Region Kandy Central
051 109 Katana No. 05, Koongashandiya, Katana 031 7448000/1 North Western Region Gampaha Western 052 110 Katugastota No. 111, Kurunegala Road, Katugastota 081 7448009/10 Central Region Kandy Central053 082 Katunayake No. 745 , Baseline Road, Aweriwatta,
Katunayaka011 7448096/7 North Western Region Gampaha Western
054 017 Kegalle No. 261/1, Kandy Road, Kegalle 035 7448003/4 Central Region Kegalle Sabaragamuwa055 083 Kekirawa No. 61, Opposite Government Hospital,
Main Street, Kekirawa0257448003/4 North Central Region Anuradhapura North Central
056 025 Kiribathgoda No. 540, New Hunupitiya Road, Dalugama, Kelaniya
011 7448033/4 North Western Region Gampaha Western
057 089 Kochchikade No 96,Chilaw Road, Kochchikade 031 7448003/4 North Western Region Gampaha Western 058 032 Kohuwela No. 143, S De S Jayasinghe Mawatha,
Nugegoda0117 448051/2 Greater Colombo Region Colombo Western
059 014 Kollupitiya No.321, Galle Road, Colombo 3 011 7448018/9 Colombo Region Colombo Western 060 024 Kotahena No. 295, George R De Silva Mw, Colombo
130117 448030/1 Colombo Region Colombo Western
061 111 Kottawa No. 365/1 A, High Level Road, Kottawa 011 7448099/100 Greater Colombo Region Colombo Western 062 042 Kuliyapitiya No. 133, Main Street, Kuliyapitiya 037 7558003/4 North Central Region Kurunegala North Western063 007 Kurunegala No. 6, Rajapihilla Mw, K'Gala 037 7558006/7 North Central Region Kurunegala North Western064 012 Maharagama No. 108 A, Highlevel Road, Maharagama 011 7448015/6 Greater Colombo Region Colombo Western 065 105 Mahawewa Chilaw Road, Mahawewa 032 7448003/4 North Western Region Puttalam North Western066 075 Mahiyanganaya No. 02,New Town, Mahiyanganaya 055 7448003/4 Central Region Badulla Uva067 031 Malabe No. 760, New Kandy Road, Malabe 0117448049/8 Greater Colombo Region Colombo Western 068 097 Manipay No. 260, Manipay Road, Manipay 021 7448021/2 North East Region Jaffna Northern069 103 Marine Drive No. 42, Sagara Road, Marine Drive,
Colombo 04011 7448102/3 Colombo Region Colombo Western
070 046 Matale No. 144, Main Street, Matale 066 7448003/4 Central Region Matale Central071 006 Matara No. 60, Uyanwatte Rd, Matara 041 7448003/4 Southern Region Matara Southern072 045 Mathugama No. 98, Agalawatta Road, Mathugama 034 7448022/3 Southern Region Kalutara Western 073 063 Minuwangoda No. 49, Negombo Road, Minuwangoda 011 7448084/5 North Western Region Gampaha Western 074 070 Monaragala No. 29, Pothuwil Road, Monaragala 055 7448006/7 Uva- Sabaragamuwa
RegionMonaragala Uva
075 015 Moratuwa No. 255, Galle Road, Idama, Moratuwa 011 7448021/2 Colombo Region Colombo Western 076 020 Mount Lavinia No. 431/433, Galle Road, Mount Lavinia 011 7448024/5 Colombo Region Colombo Western 077 074 Narahenpita No. 92, Kirula Road, Narahenpita, Colombo
05011 7448105/6 Colombo Region Colombo Western
078 091 Narammala No. 144, Kurunegala Road, Narammala 037 7558013/4 North Central Region Kurunegala North Western079 095 Nattandiya No. 82, Marawila Road, Nattandiya 032 7448006/7 North Western Region Puttalam North Western080 061 Nawalapitiya No. 70B, Gampola Road, Nawalapitiya 054 7448000/1 Central Region Kandy Central081 001 Nawam Mawatha No. 40, Nawam Mw, Colombo 02 011 7448000/1 Colombo Region Colombo Western 082 009 Negombo No. 121, St.Joseph Street, Negombo 031 7448006/7 North Western Region Gampaha Western 083 066 Nelliady No. 109, Jaffna Road, Nelliady 021 7448012/27 North East Region Jaffna Northern084 069 Nikaweratiya No. 65, Puttalam Road, Nikaweratiya 037 7558016/7 North Central Region Kurunegala North Western085 054 Nittambuwa No. 496, Kandy Road, Nittambuwa 033 7448003/4 North Western Region Gampaha Western 086 004 Nugegoda No. 152,Nawala Rd, Nugegoda 011 7448009/10 Greater Colombo Region Colombo Western 087 076 Nuwara Eliya No. 50/2 , Siva Complex, Block C, Lawson
Street, Nuwaraeliya052 7448000/1 Central Region Nuwara Eliya Central
088 079 Old Moor Street No. 311, Old Moor Street, Colombo 12 011 7448108/9 Colombo Region Colombo Western
INSIDE INSIGHT SUPPLEMENTARY INFORMATION BRANCH NETWORK OF THE BANK
372

No Branch Code
Branch Name Address General Region Name District Province
089 035 Panadura No. 319, Galle Road, Panadura 038 7448000/1 Colombo Region Kalutara Western 090 022 Pelawatte No. 301, Pannipitiya Road, Battaramulla 011 7448027/8 Greater Colombo Region Colombo Western 091 043 Pettah No. 137,133/1, Main Street, Colombo 11 011 7448072/3 Colombo Region Colombo Western 092 049 Pilimathalawa No. 240, Colombo Road, Pilimathalawa 081 7448012/3 Central Region Kandy Central093 023 Piliyandala No. 120 , Horana Road, Piliyandala 011 7448057/8 Greater Colombo Region Colombo Western 094 087 Pitakotte No. 322B, Kotte Road, Pitakotte 011 7448114/5 Greater Colombo Region Colombo Western 095 112 Private Wealth
CentreNo. 135, Rainbow Business Centre, Bauddhaloka Mawatha, Colombo 04
011 7448087/8 Colombo Region Colombo Western
096 033 Puttalam No. 104, Kurunegala Road, Puttalam 032 7448009/10 North Central Region Puttalam North Western097 005 Rajagiriya No. 505, Srijayawardenapura Etul Kotte,
Kotte011 7448012/3 Greater Colombo Region Colombo Western
098 073 Ratmalana No. 151, Galle Road, Ratmalana 011 7448066/7 Colombo Region Colombo Western 099 013 Ratnapura No. 211, Main Street, Rathnapura 045 7448006/7 Uva- Sabaragamuwa
RegionRatnapura Sabaragamuwa
100 115 Shangri-la One Galle Face Mall, Premises no L 1 - 77, No 1 A, Colombo 02
011 7448117/8 Colombo Region Colombo Western
101 116 Tangalle No. 90A , Matara Road , Tangalle 047 7448009/10 Southern Region Hambanthota Southern102 104 Thambuttegama No. 255A, Main Street, Thambuttegama 025 7448006/7 North Central Region Anuradhapura North Central103 098 Thirunelveli No. M102, Palaly Road, Jaffna 021 7448016/17 North East Region Jaffna Northern104 092 Tissamaharama No. 133 E, New Town, Tissamaharama 047 7448012/3 Southern Region Hambanthota Southern105 038 Trincomalee No. 91& 93, North Coast Road,
Trincomalee026 7448000/1 North East Region Trincomalee Eastern
106 081 Uragasmanhandiya No. 131, Main Street, Uragasmanhandiya 091 7448012/3 Southern Region Galle Southern107 041 Vauniya No. 188, 190, 192 & 190/1, Kandy Road,
Vavuniya024 7448000/1 North East Region Vavuniya Northern
108 101 Warakapola No. 96 & 98, Main Street, Warakapola 035 7448000/1 Central Region Kegalle Sabaragamuwa109 056 Wariyapola Navinna Bldg, Puttlam Road, Wariyapola 037 7558019/20 North Central Region Kurunegala North Western110 011 Wattala No. 378A, Negombo Road, Wattala 011 7448042/3 North Western Region Gampaha Western 111 008 Wellawatte No. 302, Galle Road, Colombo 6 011 7448120/1 Colombo Region Colombo Western 112 036 Wennappuwa No. 204, Chilaw Road, Wennappuwa 031 7448009/10 North Western Region Puttalam North Western113 068 Yakkala No. 65/5 B, Kandy Road, Yakkala 033 7448006/7 North Western Region Gampaha Western
More information on the Bank’s branches, such as address, location on Google Maps and Operating Hours are accessible in the Bank’s corporate web site www.ndbbnak.com, NDB NEOS mobile banking app and NDB NEOS online banking platform.
REGIONAL MANAGERS & REGIONAL OPERATIONS MANAGERS DETAILS
Rule No:
Region Regional Office Regional Manager Regional Operations Manager General Number
1 Colombo Region Borella Sydney Downall Chathurika Gunarathne 011 2 685 711 / 2
2 Greater Colombo Region Kohuwala Chandima Alwis Sanjiva Peiris 011 2 812 564
3 Southern Region Matara Thilina Hewage Sumith Kahaduwarachchi 041 2 227 161 / 3
4 North Western Region Kandana Romesh Tissera Nirmalan Gomes 011 2 071 493
5 North Central Region Kurunegala Sisira Herath Thanuja Dayarathna 037 4 692 421
6 Central Region Kandy Nalin Abeyratne Nilamdeen Ahamath 081 2 238 786
7 Uva - Sabaragamuwa Region Ratnapura Vinjaya Jayasinghe Kasun Bandara 045 2 223 839
8 North East Region Jaffna Brinthapan Selvanayakam Jacob Louis 021 2 217 395
INSIDE INSIGHT INSIDE INSIGHT SUPPLEMENTARY INFORMATION BRANCH NETWORK OF THE BANK
373

Company Head Office/Branch
Postal address Contact person Telephone Fax Email address
NDB Capital Holdings Limited
Level 1, NDB Capital Building, No 135, Bauddhaloka Mawatha, Colombo 4
Mr.Isuru Somaratne 0777-745591 0112-300393 [email protected]
NBD Investment Bank Limited
Level 1, NDB Capital Building, No 135, Bauddhaloka Mawatha, Colombo 4
Mr.Darshan Perera 011-2300385 011-2300393 [email protected]
NDB Wealth Management Limited
Level G, NDB Capital Building, No 135, Bauddhaloka Mawatha, Colombo 4
Mr. Prabodha Samarasekera
011-2303232 011-2303237 [email protected]
NDB Securities (Pvt) Limited
Level 2, NDB Capital Building, No 135, Bauddhaloka Mawatha, Colombo 4
Mr. Gihan R. Cooray 011-2131000/05 011-2314181 [email protected]
NDB Capital Limited [Bangladesh]
Uday Tower, 6th Floor, (South-West Side), 57 & 57/A, Gulshan Avenue,Gulshan 1, Dhaka 1212., Bangladesh
Mr. Kazi Farhan Zahir 0880-2-9888626 0880-2-9888906 [email protected]
NDB Zephyr Partners Lanka (Private) Limited
No. 48/5/1 (West Wing), Parkway Building, Park Street, Colombo 02
Mr. Girish Patil 0112-303810 0112-307155 [email protected]
NDB Zephyr Partners Limited
Sanne Mauritius, IFS Court, Bank Street, TwentyEight Cybercity, Ebène 72201, Republic of Mauritius
Ms. Jema Gangalaramsamy
0230 467 8695 0230 467 4000 [email protected]
Development Holdings (Pvt) Limited
No.42, NDB EDB Tower (2nd floor), Nawam Mawatha, Colombo 02
Mr. Kumudu Priyanga
011-2300174 011-2300174 [email protected]
ASIA
BAHRAINBANGLADESHCAMBODIACHINAHONG KONGINDIAINDONESIAISRAELJAPANJORDANKAZAKHSTANKUWAITLEBANONMACAO
MALAYSIAMALDIVESNEPALOMANPAKISTANPHILIPPINESQATARRUSSIAN FEDERATIONSAUDI ARABIASINGAPORESOUTH KOREASRI LANKATAIWANTHAILANDTURKEYUNITED ARAB EMIRATESVIETNAM
EUROPE
AUSTRIABELGIUMBULGARIACYPRUSCZECH REPUBLICDENMARKESTONIAFINLANDFRANCEGERMANYGREECEGUERNSEY CIIRELANDHUNGARYITALYLATVIALUXEMBOURGMOLDOVAMONACONETHERLANDSNORWAYPOLANDPORTUGALROMANIASLOVAKIASLOVENIASPAINSWEDENSWITZERLANDUKRAINEUNITED KINGDOM
AFRICA
ALGERIACAMEROONCONGOCOTE DIVOIREEGYPTGABONKENYAMADAGASCARMAURITANIAMAURITIUSMOROCCONIGERIASENEGALSEYCHELLESSOUTH AFRICATANZANIATUNISIAZAMBIA
NETWORK OF GROUP COMPANIES
CORRESPONDENT RELATIONSHIPSAUSTRALIA
AUSTRALIA
OCEANIA
NEW ZEALAND
SOUTH AMERICA
BOLIVIA
BRAZIL
CHILE
COLOMBIA
PERU
URUGUAY
NORTH AMERICA
BAHAMAS
CANADA
MEXICO
UNITED STATES
North America
South America
Africa
Asia
Australia
Oceania
Europe
INSIDE INSIGHT SUPPLEMENTARY INFORMATION NETWORK OF GROUP COMPANIES
374

GRI CONTENT INDEX
GRI Standard Disclosure Page number Omission
GRI 101: Foundation 2016 (does not include any disclosures)
General Disclosures
GRI 102: General Disclosures 2016 102-1 Name of Organisation 3
102-2 Activities, brands, products and services 93
102-3 Location of headquarters 386
102-4 Location of operations 3
102-5 Ownership and legal form 386
102-6 Markets served 80-81
102-7 Scale of the organisation 10
102-8 Information on employees and other workers 83
102-9 Supply chain 96
102-10 Significant changes to the organisation and supply chain 3
102-11 Precautionary principle 55
102-12 External initiatives 4
102-13 Membership of associations 96
102-14 Statement from senior decision maker 15-17
102-16 Values, principles, norms and standards of behaviour 31,121
102-18 Governance Structure 111
102-40 List of stakeholder groups 38-41
102-41 Collective bargaining agreements 85
102-42 Identifying and selecting stakeholders 38
102-43 Approach to stakeholder engagement 38-41
102-44 Key topics and concerns raised 38-41
102-45 Entities included in the consolidated financial statements 166
102-46 Defining report content and topic boundary 3,48-49
102-47 Material topics 49,105
102-48 Restatement of information 3
102-49 Changes in reporting 48
102-50 Reporting period 3
102-51 Date of most recent report 3
102-52 Reporting cycle 3
102-53 Contact point for questions regarding Report 5
102-54 Claims of reporting in accordance with GRI Standards 4
102-55 GRI context index 375-377
102-56 External assurance 4,103
Material topics
Economic Performance
GRI 103: Management Approach 103-1 Explanation of material topics and its boundaries 105, 31
103-2 The Management Approach and its components 31
103-2 Evaluation of the Management Approach 31
GRI 201: Economic Performance 2016 201-1- Direct economic value generated and distributed 31
201-2- Financial implications and other risks and opportunities due climate change
98
201-3 Defined benefit plan obligations and other retirement plans 228
INSIDE INSIGHT INSIDE INSIGHT SUPPLEMENTARY INFORMATION
375

GRI Standard Disclosure Page number Omission
Market Presence
GRI 103: Management Approach 103-1 Explanation of material topics and its boundaries 82,105
103-2 The Management Approach and its components 82
103-2 Evaluation of the Management Approach 82
GRI 202: Market Presence 2016 202-2: Proportion of senior management hired from local community 83
Tax
GRI 103: Management Approach 207-1 Approach to tax 60,105
207-2 Tax governance, control, and risk management 60
207-3 Stakeholder engagement and management of concerns related to tax 60
GRI 207: Tax 2019 207-4 Country by country reporting 189
Materials
GRI 103: Management Approach 103-1 Explanation of material topics and its boundaries 100,105
103-2 The Management Approach and its components 97
103-2 Evaluation of the Management Approach 97
GRI 301: Materials 2016 301-1 Materials used by weight or volume 100
Energy
GRI 103: Management Approach 103-1 Explanation of material topics and its boundaries 98,105
103-2 The Management Approach and its components 98
103-2 Evaluation of the Management Approach 98
GRI 302: Energy 2016 302-1 Energy consumption within the organization 99
Emissions
GRI 103: Management Approach 103-1 Explanation of material topics and its boundaries 98,105
103-2 The Management Approach and its components 98
103-2 Evaluation of the Management Approach 98
GRI 305 Emissions: 2016 305-1 Direct greenhouse gas (GHG) emissions 99
305-2 Energy indirect greenhouse gas (GHG) emissions (Scope 2) 99
305-3 Other indirect greenhouse gas (GHG) emissions (Scope 3) 99
305-4 GHG emission intensity 56
Environmental compliance
GRI 103: Management Approach 103-1 Explanation of material topics and its boundaries 97,105
103-2 The Management Approach and its components 97
103-3 Evaluation of the Management Approach 97
GRI 307 Environmental compliance 307-1 Non-compliance with environmental laws and regulations 97
Employment
GRI 103: Management Approach 103-1 Explanation of material topics and its boundaries 82,105
103-2 The Management Approach and its components 82
103-2 Evaluation of the Management Approach 82
GRI 401: Employment 2016 401-1 Employee hires and turnover 84
401-2 Benefits provided to full time employees that are not provided to temporary or part-time employees
84
401-3 Parental leave 87
Labour Management Relations
GRI 103: Management Approach 103-1 Explanation of material topics and its boundaries 85,105
103-2 The Management Approach and its components 85
103-2 Evaluation of the Management Approach 85
GRI 402: Labour Management Relations 2016
402-1 Minimum notice periods regarding operational changes 85
INSIDE INSIGHT SUPPLEMENTARY INFORMATION GRI CONTENT INDEX
376

GRI Standard Disclosure Page number Omission
Training and education
GRI 103: Management Approach 103-1 Explanation of material topics and its boundaries 85,105
103-2 The Management Approach and its components 85
103-2 Evaluation of the Management Approach 85
GRI 404: Training and education 404-1 Average hours of training per year per employee 86
404-2 Programs for upgrading skills and transition assistance programmes 85
404-3 Percentage of employees receiving regular performance and career development reviews
84
Diversity and equal opportunity
GRI 103: Management Approach 103-1 Explanation of material topics and its boundaries 87,105
103-2 The Management Approach and its components 87
103-2 Evaluation of the Management Approach 87
GRI 405: Diversity and equal opportunity 2016
405-2 Ratio of basic salary and remuneration of women to men 87
Local Communities
GRI 103: Management Approach 103-1 Explanation of material topics and its boundaries 96,105
103-2 The Management Approach and its components 96
103-2 Evaluation of the Management Approach 96
GRI 413: Local communities 2016 413-1 Operations with local community engagement, impact assessments and development programmes
96
Marketing and labelling
GRI 103: Management Approach 103-1 Explanation of material topics and its boundaries 92,105
103-2 The Management Approach and its components 92
103-2 Evaluation of the Management Approach 92
GRI 417: Marketing and labelling
417-2 Incidents of non-compliance concerning product and service information and labelling
92
417-3 Incidents of non-compliance concerning marketing communications 92
Customer Privacy
GRI 103: Management Approach 103-1 Explanation of material topics and its boundaries 78,105
103-2 The Management Approach and its components 78
103-2 Evaluation of the Management Approach 78
GRI 418: Customer Privacy 2016 418-1 Total number of substantiated complaints regarding breaches of customer privacy and losses of customer data
78
SUPPLEMENTARY INFORMATION GRI CONTENT INDEX
377

AAcceptances
Promise to pay, created when the drawee of a time draft, stamps or writes the word ‘accepted’ above his signature and a designated payment date.
Accounting Policies
The specific principles, bases, conventions, rules and practices adopted by an entity in preparing and presenting Financial Statements.
Accrual Basis
Recognising the effects of transaction and other events when they occur without waiting for receipt or payment of cash or its equivalent.
Actuarial Gain/Loss
Gains or losses arising from the difference between estimates and actual experience in the entity’s pension plan and retirement gratuity.
Actuarial Assumptions
An entity’s unbiased and mutually compatible best estimates of the demographic and financial variable that will determine the ultimate cost of providing post-employment benefits.
Amortisation
The systematic allocation of the depreciable amount of an intangible asset over its useful life.
Amortised Cost
The amount at which the financial asset or financial liability is measured at initial recognition minus principal prepayments, plus or minus the cumulative amortisation using the effective interest rate method of any difference between that initial amount and the maturity amount, and minus any reduction (directly or through the use of an allowance account) for impairment or uncollectability.
Asset and Liability Committee (ALCO)
A risk-management committee in a bank that generally comprises the Senior Management of the institution. The ALCO’s primary goal is to evaluate, monitor and approve practices relating to risk due to imbalances in the capital structure. Among the factors considered are liquidity risk, interest rate risk, operational risk and external events that may affect the Bank’s forecast and strategic balance sheet allocations.
Associate
An entity, including an unincorporated entity such as a partnership, over which the investor has significant influence and that is neither a subsidiary nor an interest in a joint venture.
Average Weighted Deposit Rate (AWDR)
AWDR is calculated by the Central Bank weekly, based on Commercial bank’s deposit rates offered to their prime customers during the week.
Average Weighted PRIME Lending Rate
(AWPLR)
AWPLR is calculated by the Central Bank weekly based on commercial banks’ lending rates offered to their prime customers during the week.
BBasel III
The Basel Committee on Banking Supervision’s details of strengthened global regulatory standards on Bank capital adequacy and liquidity.
Basis point (BP)
One hundredth of a percentage point, i.e. 100bp equals 1%, used in quoting movements in interest rates, security yields, etc.
CCapital Adequacy Ratios
The relationship between capital and risk- weighted assets as defined in the framework developed by the Bank for International Settlements (BIS) and as modified by the Central Bank of Sri Lanka to suit local requirements.
Capitals
Refer to any stock of value such as customer base, staff strength, relationships with the community, etc. that will increase, decrease or transform through the activities of an organisation and that will help it generate earnings in the future.
Cash Equivalents
Short term highly liquid investments that are readily convertible to known amounts of cash and which are subject to an insignificant risk of changes in value.
Cash flows
Cash flows are inflows and outflows of cash and cash equivalents.
Cash Generating Unit (CGU)
The smallest identifiable group of assets that generates cash inflows that are largely independent of the cash inflows from other assets or groups of assets.
Collectively Assessed Impairment Allowance Provisions
Also known as portfolio impairment provisions. Impairment assessment on a collective basis for homogeneous groups of loans that are not considered individually significant and to cover losses that has been incurred but has not yet been identified at the reporting date. Typically assets within the Retail Banking business (housing, personal, leasing, credit cards etc.) are assessed on a portfolio basis.
Commitments
Credit facilities approved but not yet utilised by the clients at the date of the Statement of Financial Position.
Contract
An agreement between two or more parties that creates enforceable rights and obligations.
Consolidated Financial Statements
Consolidated Financial Statements are the Financial Statements of a group in which the assets, liabilities, equity, income, expenses and cash flows of the parent and its subsidiaries are presented as those of a single economic activity.
Contingencies
A condition or situation existing at the date of the Statement of Financial Position where the outcome will be confirmed only by occurrence or non-occurrence of one or more future events.
Contractual Maturity
Contractual Maturity refers to the final payment date of a loan or other financial instrument, at which point all the remaining outstanding principal will be repaid and interest is due to be paid.
Control
Control is the power over an investee, exposure, or rights, to variable returns from its involvement with the investee, and the ability to use its powers over the investee to affect the amount of the investor’s returns.
GLOSSARY OF FINANCIAL AND BANKING TERMS
INSIDE INSIGHT INSIDE INSIGHT SUPPLEMENTARY INFORMATION
378

Corporate Governance
The process by which corporate entities are governed. It is concerned with the way in which power is exercised over the management and direction of entity, the supervision of executive actions and accountability to owners and others.
Correspondent Bank
A bank in a foreign country that offers banking facilities to the customers of a bank in another country.
Cost to Income Ratio
Operating expenses excluding impairment for loans and receivables and other losses as a percentage of total operating income.
Country Risk
The risk that a foreign government will not fulfil its obligations or obstructs the remittance of funds by debtors, either for financial reasons (transfer risk) or for other reasons (political risk)
Credit Ratings
An evaluation of a corporate’s ability to repay its obligations or the likelihood of not defaulting, carried out by an independent rating agency.
Currency Risk
The risk that the fair value or future cash flows of a financial instrument will fluctuate because of changes in foreign exchange rates.
Credit Risk Mitigation
A technique to reduce the credit risk associated with an exposure by application of credit risk mitigates such as collateral, guarantee and credit protection.
Credit Risk
Credit risk or default risk is most simply defined as the potential that a borrower or counterparty will fail to meet its obligations in accordance with agreed terms and conditions.
Currency swaps
The simultaneous purchase of an amount of currency for spot settlement and the sale of the same amount of the same currency for forward settlement.
Customers Deposits
Money deposited by account holders. Such funds are recorded as liabilities.
DDebt Restructuring/Rescheduling
This is when the terms and provisions of outstanding debt agreements are changed. This is often done in order to improve cash flow and the ability of the borrower to repay the debt. It can involve altering the repayment schedules as well as debt or interest charge reduction.
Deferred Taxation
Sum set aside for tax in the Financial Statements that may become payable/receivable in a financial year other than the current financial year.
Delinquency
A debt or other financial obligation is considered to be in a state of delinquency when payments are overdue. Loans and receivables are considered to be delinquent when consecutive payments are missed. Also known as ‘Arrears’.
Depreciation
The systematic allocation of the depreciable amount of an asset over its useful life.
Derecognition
Removal of a previously recognised financial asset or financial liability from an entity’s Statement of Financial Position.
Derivatives
A derivative is a financial instrument or other contract, the value of which changes in response to some underlying variable (e.g., an interest rate).
Discount Rate
A rate used to place a current value on future cash flows. It is needed to reflect the fact that money has a time value.
Dividend Cover
Profit after tax divided by gross dividends. This ratio measures the number of times dividend is covered by current year’s distributable profits.
Dividend Yield
Dividend earned per share as a percentage of its market value.
Documentary Credits
Commercial letters of credit provided for payment by a bank to the named beneficiary usually the seller of merchandise, against delivery of documents specified in the credit.
EEarnings per Ordinary Share (EPS)
Profit attributable to ordinary shareholders divided by the weighted average number of ordinary shares in issue.
Economic Value Added (EVA)
A measure of productivity which takes into consideration cost of total invested equity.
Effective Interest Rate (EIR)
Rate that exactly discounts estimated future cash payments or receipts through the expected life of the financial instruments or when appropriate a shorter period to the net carrying amount of the financial asset or financial liability.
Effective Tax Rate
Provision for taxation including deferred tax divided by the operating profit before tax on financial services.
Embedded Derivatives
An embedded derivative is a component of a hybrid (combined) instrument that also includes a non-derivative host contract with the effect that some of the cash flows of the combined instrument vary in a way similar to a stand- alone derivative.
Employee Share Option Scheme (ESOS)
A method of giving employees shares in the business for which they work.
Equity Method
This is a method of accounting whereby the investment is initially recognised at cost and adjusted thereafter for the post-acquisition changes in the investor’s share of net assets of the investee. The profit or loss of the investor includes the investor’s share of the profit or loss of the investee.
Equity risk
The risk arising from positions, either long or short, in equities or equity-based instruments, which create exposure to a change in the market price of the equities or equity instruments.
Equity Instrument
Equity instrument is any contract that evidences a residual interest in the assets of an entity after deducting all of its liabilities.
INSIDE INSIGHT SUPPLEMENTARY INFORMATION GLOSSARY OF FINANCIAL AND BANKING TERMS
379

Events after the Reporting Period
Events after the reporting period are those events, favourable and unfavourable, that occur between the end of the reporting period and the date when the Financial Statements are authorised for issue.
Ex- Dividend Date
A classification of trading shares when a declared dividend belongs to the seller rather than the buyer. A stock will be give ex-dividend status if a person has been confirmed by the company to receive the dividend payment. The date on or after which a security is traded without a previously declared dividend or distribution.
Expected Credit Loss
The amount expected to be lost on an exposure over the life of the asset. ECL is calculated by multiplying the Probability of Default (a percentage) by the Exposure at Default (an amount) and Loss Given Default (a percentage).
Exposure
A claim, contingent or position which carries a risk of financial loss.
FFair Value
The amount for which an asset could be exchanged or a liability settled, between knowledgeable, willing parties in an arm’s length transaction.
Fair Value Adjustment
An adjustment to the fair value of a financial instrument which is determined using a valuation technique (level 2 and level 3) to include additional factors that would be considered by a market participant that are not incorporated within the valuation model.
Fair Value Through Profit or Loss
A financial asset/liability: Acquired/incurred principally for the purpose of selling or repurchasing it in the near term, part of a portfolio of identified financial instruments that are managed together and for which there is evidence of a recent actual pattern of a short- term profit-taking, or a derivative (except for a derivative that is a financial guarantee contract).
Finance Lease
A contract whereby a lessor conveys to the lessee the right to use an asset for rent over an agreed period of time which is sufficient to amortise the capital outlay of the lessor. The lessor retains ownership of the asset but transfers substantially all the risks and rewards of ownership to the lessee.
Financial Assets
Any assets that is cash, equity instrument of another entity, a contractual right to receive cash or contractual right to receive another financial asset from another entity.
Financial Instruments
A financial instrument is any contract that gives rise to both a financial asset in one entity and a financial liability or equity instrument in another entity.
Financial Liabilities
A contractual obligation to deliver cash or another financial asset to another entity or to exchange financial assets or financial liabilities with another entity under conditions that are potentially unfavourable to the entity.
Financial Risk
The risk of a possible future change in one or more of a specified interest rate, financial instrument price, commodity price, foreign exchange rate, index of prices or rates or credit rating or credit index or other variable that the variable is not specific to the party to the contract.
Foreign Exchange Income
The realised gains recorded when assets or liabilities denominated in foreign currencies are translated into Sri Lankan rates which differ from those rates in force at inception or on the previous reporting date. Foreign exchange income also arises from trading in foreign currencies.
Forward Exchange Contract
Agreement between two parties to exchange one currency for another at a future date at a rate agreed upon today.
GGlobal Reporting Initiative (GRI)
GRI is a leading organisation in the sustainability field. GRI promotes the use of sustainability reporting as a way for organisations to become more sustainable and contribute to sustainable development.
Going Concern
The Financial Statements are normally prepared on the assumption that an entity is a going concern and will continue in operation for the foreseeable future. Hence, it is assumed that the entity has neither the intention nor the need to liquidate or curtail materially or the scale of its operations.
Goodwill
An asset representing the future economic benefits arising from other assets acquired in a business combination that are not individually identified and separately recognised.
Gross Dividend
The portion of profits distributed to the shareholders.
Group
A Group is a parent and all its subsidiaries and associates.
Guarantees
Three party agreement involving a promise by one party (the guarantor) to fulfil the obligations of a person owing a debt if that person fails to perform.
HHedging
A strategy under which transactions are effected with the aim of providing cover against the risk of unfavourable price movements (Interest rate, Prices and Commodities, etc.).
Held-for-Trading
Debt and equity investments that are purchased with the intent of selling them within a short period of time (usually less than one year).
Held-to-Maturity
Investments and debt securities that a Company has the ability and intent to hold until maturity.
High Quality Liquid Assets (HQLA)
HQLA are assets that can be easily and immediately converted into cash at little or no loss of value that can be readily sold or used as collateral to obtain funds in a range of stress scenarios and are unencumbered, i.e. without legal, regulatory or operational impediments.
Historical Cost
Historical cost is the original nominal value of an economic item.
IImpaired Loans
Loans where identified impairment allowances have been raised and also include loans which are collateralised or where indebtedness has already been written down to the expected realisable value. The impaired loan category may include loans, which, while impaired, are still performing.
INSIDE INSIGHT INSIDE INSIGHT SUPPLEMENTARY INFORMATION GLOSSARY OF FINANCIAL AND BANKING TERMS
380

Impairment charges for Loans and Receivables
Amounts set aside against possible losses on loans, receivables and other credit facilities as a result of such facilities becoming partly or wholly uncollectible.
Impairment
This occurs when recoverable amount of an asset is less than its carrying amount.
Impairment Allowances
Impairment allowances are provisions held on the Statement of Financial Position as a result of the raising of a charge against profit for the incurred (under LKAS 39)/expected (under SLFRS 9)loss. An impairment allowance may either be identified or unidentified and individual (specific) or collective (portfolio).
Individually Significant Loans
Exposures which are above a certain threshold decided by the Bank’s management which should be assessed for objective evidence, measurement, and recognition of impairment on an individual basis.
Intangible Asset
An intangible asset is an identifiable non- monetary asset without physical substance.
Integrated Reporting
A methodology of reporting an organisation’s strategy, governance, financial performance and prospects in relation to the creation of value over the short, medium and long term in its economic, social and environmental context.
Interest Cover
A ratio showing the number of times interest charges is covered by earnings before interest and tax.
Interest Margin
Net interest income expressed as a percentage of average interest earning assets.
Interest Rate Risk
The risk that the fair value or future cash flows of a financial instrument will fluctuate because of changes in market interest rates.
Interest Rate SWAP
An agreement between two parties where one stream of future interest payments is exchanged for another stream of future interest payments based on a specified principal amount.
Interest Spread
This represents the difference between the average interest rate earned and the average interest rate paid on funds.
Investment banking
A specific division of banking related to the creation of capital for other companies. Investment banks underwrite new debt and equity securities for all types of corporations. Investment banks also provide guidance to issuers regarding the issue and placement of stock.
Investment Property
A real estate property that has been purchased with the intention of earning a return on the investment (purchase), either through rent (income), the future resale of the property, or both.
KKey Management Personnel
Key Management Personnel are those persons having authority and responsibility for planning, directing and controlling the activities of the entity, directly or indirectly, including any Director (whether Executive or otherwise) of that entity and key employees who are holding directorships in subsidiary companies and other key employees who meet the criteria mentioned above.
LLiquid Assets
Assets that are held in cash or in a form that can be converted to cash readily, such as deposits with other banks, Bills of Exchange, Treasury Bills and Bonds.
Liquidity coverage ratio (LCR)
Ratio of stock of high quality liquid assets available to total net cash outflows over next 30 calendar days. LCR is expected to improve the banking sector’s ability to absorb shocks arising from financial and economic stress, thus, reducing the risk of spillover from the financial sector to the real economy.
Liquidity Risk
The risk that an entity will encounter difficulty in meeting obligations associated with financial liabilities.
Loan-to-Value Ratio
The loan-to-value (LTV) ratio is a financial term used by lenders to express the ratio of a loan to the value of an asset purchased. The term is commonly used to represent the ratio of the first mortgage lien as a percentage of the total appraised value of real property.
Loss Given Default (LGD)
The estimated ratio (percentage) of the loss on an exposure to the amount outstanding at default (EAD) upon default of counterparty.
MMarket Capitalisation
Number of ordinary shares in issue multiplied by the market value of a share as at a date.
Market Risk
This refers to the possibility of loss arising from changes in the value of a financial instrument as a result of changes in market variables such as interest rates, exchange rates, credit spreads and other asset prices.
Materiality
The relative significance of a transaction or an event, the omission or misstatement of which could influence the economic decisions of users of Financial Statements.
NNet Assets Value per Ordinary Share
Shareholders’ funds excluding preference shares, if any, divided by the number of ordinary shares in issue.
Net Assets Value per Share
Shareholders’ funds divided by the number of ordinary shares in issue.
Net Interest Income (NII)
The difference between the amounts a bank earns on assets such as loans and securities and the amount it pays on liabilities such as deposits, refinance funds and inter-bank borrowings.
Net Interest Margins (NIM)
Net interest income expressed as a percentage of average Total Assets.
Net stable funding ratio (NSFR)
The ratio of available stable funding to required stable funding over a one year time horizon, assuming a stressed scenario. Available stable funding would include items such as equity capital, preferred stock with a maturity of over one year and liabilities with an assessed maturity of over one year. The Basel III rules require this ratio to be over 90% with effect from 01 January 2019. The NSFR is still subject to an observation period and review to address any unintended consequences.
INSIDE INSIGHT SUPPLEMENTARY INFORMATION GLOSSARY OF FINANCIAL AND BANKING TERMS
381

Non-Controlling Interest/Minority Interest
Equity in a subsidiary not attributable, directly or indirectly, to a Parent.
Non-Performing Loans (NPLs)
A loan or a receivable placed on cash basis (i.e. Interest income is only recognised when cash is received) because, in the opinion of management, there is reasonable doubt regarding the collectability of principal or interest.
Nostro Account
A bank account held in a foreign country by a domestic bank, denominated in the currency of that country. Nostro accounts are used to facilitate the settlement of foreign exchange trade transactions.
NPL Ratio
Total non-performing loans and receivables (net of interest in suspense) divided by total loans and receivables portfolio (net of interest in suspense).
OOpen Credit Exposure Ratio
Total net non-performing loans and advances expressed as a percentage of shareholders’ fund.
Operational Risk
This refers to the risk of loss resulting from inadequate or failed internal processes, people and systems or from external events.
PParent
A parent is an entity that has one or more subsidiaries.
Past Due
A financial asset is past due when a counterparty has failed to make a payment when contractually due.
Power
The power is the existing rights that give the current ability to direct the relevant activities.
Price Earnings Ratio (P/E Ratio)
Market price of a share divided by earnings per share.
Probability of default (PD)
The probability that an obligor will default on an obligation within a given period of time.
Projected Unit Credit Method (PUC)
An actuarial valuation method that sees each period of service as giving rise to an additional unit of benefit entitlement and measures each unit separately to build up the final obligation. (sometimes known as the accrued benefit method pro-rated on service or as the benefit/years of service method). Prudence Inclusion of a degree of caution in the exercise of judgment needed in making the estimates required under conditions of uncertainty, such that assets or income are not overstated and liabilities or expenses are not understated.
Prudence
Inclusion of a degree of caution in the exercise of judgment needed in making the estimates required under conditions of uncertainty, such that assets or income are not overstated and liabilities or expenses are not understated.
RRelated Parties
Parties where one party has the ability to control the other party or exercise significant influence over the other party in making financial and operating decisions, directly or indirectly.
Related Party Transactions (RTP)
RPT is a transfer of resources, services or obligations between a reporting entity and a related party, regardless whether a price is charged.
Remittances
A remittance is a transfer of money by a foreign worker to an individual in his or her home country.
Repurchase Agreement
Contract to sell and subsequently repurchase securities at a specified date and price.
Retained Earnings
Reserves that are set aside for future distribution and investments.
Return on Average Assets (ROA)
Profit after tax divided by the average assets.
Return on Average Equity (ROE)
Net profit for the year, less preference share dividends, if any, expressed as a percentage of average ordinary shareholders’ equity.
Revaluation Reserve
Part of the shareholders’ equity that arises from changes in the current value of property, plant and equipment.
Revenue Reserve
Reserves set aside for future distribution and investment.
Risk-Weighted Assets
The sum total of assets as per the Statement of Financial Position and the credit equivalent of assets that are not on the Statement of Financial Position multiplied by the relevant risk weighting factors.
Rights Issue
Issue of shares to the existing shareholders at an agreed price, generally lower than market price.
SSegment Reporting
Segment reporting indicates the contribution to the revenue derived from business segments such as banking operations, leasing operations, stock broking and securities dealing, property and insurance.
Segmental Analysis
Analysis of financial information by segments of an entity specifically, the different industries and the different geographical areas in which it operates.
Shareholders’ Funds
Total of stated capital and revenue reserves.
Significant influence
If an entity holds, directly or indirectly (e.g. through subsidiaries), 20 percent or more of the voting power of the investee, it is presumed that the entity has significant influence, unless it can be clearly demonstrated otherwise.
Single Borrower Limit (SBL)
33% of the regulatory capital base.
Statutory Reserve Fund
A capital reserve created as per the provisions of the Banking Act, No. 30 of 1988.
INSIDE INSIGHT INSIDE INSIGHT SUPPLEMENTARY INFORMATION GLOSSARY OF FINANCIAL AND BANKING TERMS
382

Subsidiary
An entity, including an unincorporated entity such as a partnership, which is controlled by another entity (known as the Parent).
Substance Over Form
The consideration that the accounting treatment and the presentation in Financial Statements of transactions and events should be governed by their substance and financial reality and not merely by legal form.
Swaps
The simultaneous purchase of an amount of a currency for spot settlement and the sale of the same amount of the same currency for forward settlement.
TTier I Capital
Core capital representing permanent shareholders’ equity and reserves created or increased by appropriations of retained earnings or other surpluses.
Tier II Capital
Supplementary capital representing revaluation reserves, general provisions and other capital instruments, which combine certain characteristics of equity and debt such as hybrid capital instruments and subordinated term debts.
Total Capital
Capital base is summation of the core capital (Tier I) and the supplementary capital (Tier II).
Transaction Costs
Incremental costs that is directly attributable to the acquisition, issue or disposal of a financial asset or financial liability.
Transfer Pricing Arrangement
Transfer pricing involves the terms and prices at which related parties sell (or should sell) goods or services to each other. When the parties are located in different taxing jurisdictions, opportunities exist for the movement of income to a lower-taxing jurisdiction. A transfer pricing arrangement is developed to combat potential losses of income tax revenue.
UUnit Trust
An undertaking formed to invest in securities under the terms of a trust deed.
Useful Life
Useful life is the period over which an asset is expected to be available for use by an entity or the number of production or similar units expected to be obtained from the asset by an entity.
VValue Added
Value of wealth created by providing banking and other related services less the cost of providing such services.
Value-at-risk (VaR)
A measure of the loss that could occur on risk positions as a result of adverse movements in market risk factors (e.g. rates, prices, volatilities) over a specified time horizon and to a given level of confidence.
Vostro Account
A local currency account maintained by a local bank for a foreign (correspondent) bank. For the foreign bank, it is a nostro account. The domestic bank acts as custodian or manages the account of a foreign counterpart.
YYield-to-Maturity
The discount rate at which a security’s present value of future cash flows will be equal to the security’s current price.
INSIDE INSIGHT SUPPLEMENTARY INFORMATION GLOSSARY OF FINANCIAL AND BANKING TERMS
383

Notice is hereby given that the seventeenth (17) Annual General Meeting (AGM) of National Development Bank PLC (the Bank) will be held as a ‘virtual meeting’ from the Board Room of the Bank, 14th Floor, DHPL Building, No. 42, Nawam Mawatha, Colombo 02 at 02.30 p.m. on Wednesday, the Thirtieth (30) day of March, Two Thousand and Twenty Two (2022) and the business to be brought before the meeting will be:
1. To lay before the shareholders for consideration, the Annual Report for the year ended 31 December 2021.
2. To re-elect Mr. Sujeewa Mudalige, as a Director in terms of Article 42 of the Articles of Association of the Bank.
3. To re-elect Mr. Bernard Sinniah, as a Director in terms of Article 42 of the Articles of Association of the Bank.
4. To reappoint Messrs. Ernst & Young, Chartered Accountants, as Auditors of the Bank as set out in Section 154 of the Companies Act No. 07 of 2007 and Section 39 of the Banking Act No. 30 of 1988 (as amended) and to fix the fees and expenses of such Auditors.
5. To determine the aggregate remuneration payable to Non-Executive Directors including the Chairman in terms of Article 58 of the Articles of Association of the Bank and to authorise the Board of Directors to approve other remuneration and benefits to the Directors (including the remuneration of the Executive Director/s) in terms of Section 216 of the Companies Act No. 07 of 2007.
6. To authorise the Board of Directors to determine donations for the financial year 2022 under the Companies Donations Act No. 26 of 1951.
By Order of the Board,
Ms. Shehani RanasingheCompany Secretary
22 February 2022Colombo
Notes:
1. A shareholder entitled to attend and vote at the meeting is entitled to appoint a proxy holder to attend and vote in his/her stead.
2. A proxy holder need not be a shareholder of the Bank.
3. The Form of Proxy is sent herewith. The completed Form of Proxy must reach the Company Secretary at the Head Office of the Bank, at No. 40, Nawam Mawatha, Colombo 02 or can be sent via email to [email protected] or through facsimile number 0112 341 050 not later than 24 hours prior to the time appointed for the holding of the meeting in accordance with Article 29 of the Articles of Association of the Bank.
4. Voting shall be by any one of the following methods as determined by the Chairman of the meeting unless a poll is demanded;
I. voting by voice
II. voting by show of hands
III. a vote cast by electronic means whereby each shareholder’s response can be identified (as done by a show of hands), where the meeting is facilitated by electronic means.
Every shareholder who is present in person or is represented by a proxy or attorney or an authorised representative (either physically or virtually) shall have one (01) vote.
A declaration by the Chairman of the meeting that a resolution is carried by the requisite majority or lost is conclusive evidence of that fact.
At a meeting of shareholders, a poll may be demanded on a particular question as provided for in the Companies Act No. 07 of 2007.
If a poll is taken, votes must be counted according to the votes attached to the shares of each shareholder present (in person or through digital means) and voting. In the case of an equality of votes, whether on a show of hands or on a poll, the Chairman of the meeting shall be entitled to a second or casting vote.
5. All shareholders participating in the virtual meeting / AGM are requested to forward the duly completed Form 1 (attached hereto as Annexure 1) via post to the Company Secretary at the registered office of the Bank or email to the Company Secretary ([email protected]) or to facsimile number – 0112 341 050 no later than 12 noon on 18 March 2022 to enable the Bank to share login information for the meeting.
6. All shareholders participating in the virtual meeting / AGM should carefully read the guidelines and special instructions to shareholders provided herewith to understand the modality of participation.
NOTICE OF MEETING
INSIDE INSIGHT INSIDE INSIGHT SUPPLEMENTARY INFORMATION
384

Guidelines and Special Instructions to Shareholders:
1. The virtual meeting / AGM is held in accordance with the Articles of Association of the Bank, the prevailing laws and relevant guidelines issued by the Colombo Stock Exchange.
2. Only the Board of Directors, Company Secretary and the representatives of the Auditors of the Bank along with relevant persons representing The Leadership Team and others essential for the administration of formalities of the meeting will assemble at the place specified as the venue of the meeting. All others, including shareholders, will participate via MsTeams following the steps below;
a) All shareholders wishing to participate at the virtual meeting / AGM must forward the duly completed Form 1 (attached hereto as Annexure 1) via post to the Company Secretary at the registered office of the Bank or email to the Company Secretary ([email protected]) or to facsimile number – 0112 341 050 no later than 12 noon on 18 March 2022 to enable the Bank to make the required arrangements.
b) The Bank will get in touch with you within 24 hours of the meeting, providing to you the details to *login to the meeting on the said date.
c) All participating shareholders will have to pre-register themselves online prior to the commencement of the meeting and will be authenticated to participate. As such all shareholders must strictly ensure that the details provided in the Form 1 shared with the Company Secretary and the online pre-registration must be the same.
3. All shareholders will be given an opportunity to speak at the meeting as directed by the Chairman. All shareholders speaking at the meeting are requested to state their name (as registered in Form 1 and the online pre-registration) for the purpose of identification. It is of utmost importance that shareholders wait till they are given an opportunity to speak and once having got an opportunity to speak, wait until all other shareholders have had a turn to speak on a given matter before asking a second question or making a comment.
4. Shareholders are also given the opportunity to forward their queries via post to the Company Secretary at the registered office of the Bank or email to the Company Secretary ([email protected]) or to facsimile number – 0112 341 050 no later than 12 noon on 23 March 2022 and your concerns will be addressed as deemed appropriate by the Chairman.
5. Voting on the items on the Agenda by a show of hands will be registered by using an online eballot platform, the details of which will be shared with shareholders prior to the commencement of the meeting.
6. Shareholders are encouraged to opt to duly completing the Form of Proxy clearly setting out their preference of vote under each item of the Agenda set out in the Form of Proxy and to appoint one of the Directors of the Bank to act on their behalf in order that in the event a shareholder cannot participate at the meeting such shareholder’s vote may be identified and recorded as if such shareholder were present at the meeting.
The duly completed Form of Proxy must reach the Company Secretary (in accordance with the instructions specified therein), not less than twenty four (24) hours before the time appointed for the holding of the Meeting so that your proxy could represent you at the AGM and exercise your vote in accordance with your directions.
For the Bank’s administrative convenience however, the Bank would very much appreciate and requests all shareholders to send in their Proxy Forms along with their Registration Form (Form 1) to reach the Bank on or before than 12 noon on 18 March 2022 as this would enable the Bank to efficiently make all arrangements for the virtual meeting.
7. The Bank intends to proceed to hold the virtual meeting / AGM as planned despite the present pandemic. As such in the event any further communications are to be made to the shareholders, the same will be made via the Colombo Stock Exchange website and/ or the bank website https://www.ndbbank.com.
8. For further queries on the arrangements made by the Bank you may contact one of the following persons who will be happy to assist you.
Name Contact No.
Shehani Benjamin 0112 448 448 Ext: 35010
Hansani Nawagamuwage 0112 448 448 Ext: 35011
9. A dedicated contact number will be provided to all shareholders participating at the virtual meeting / AGM to address any technical difficulties faced in accessing / participating at the meeting.
*Login details are authorised only for the use by individual shareholders / proxy holders and authorised representatives in the case of corporate / institutional shareholders. The Bank will not be responsible or liable for the misuse of login details and access granted to the meeting.
INSIDE INSIGHT SUPPLEMENTARY INFORMATION NOTICE OF MEETING
385
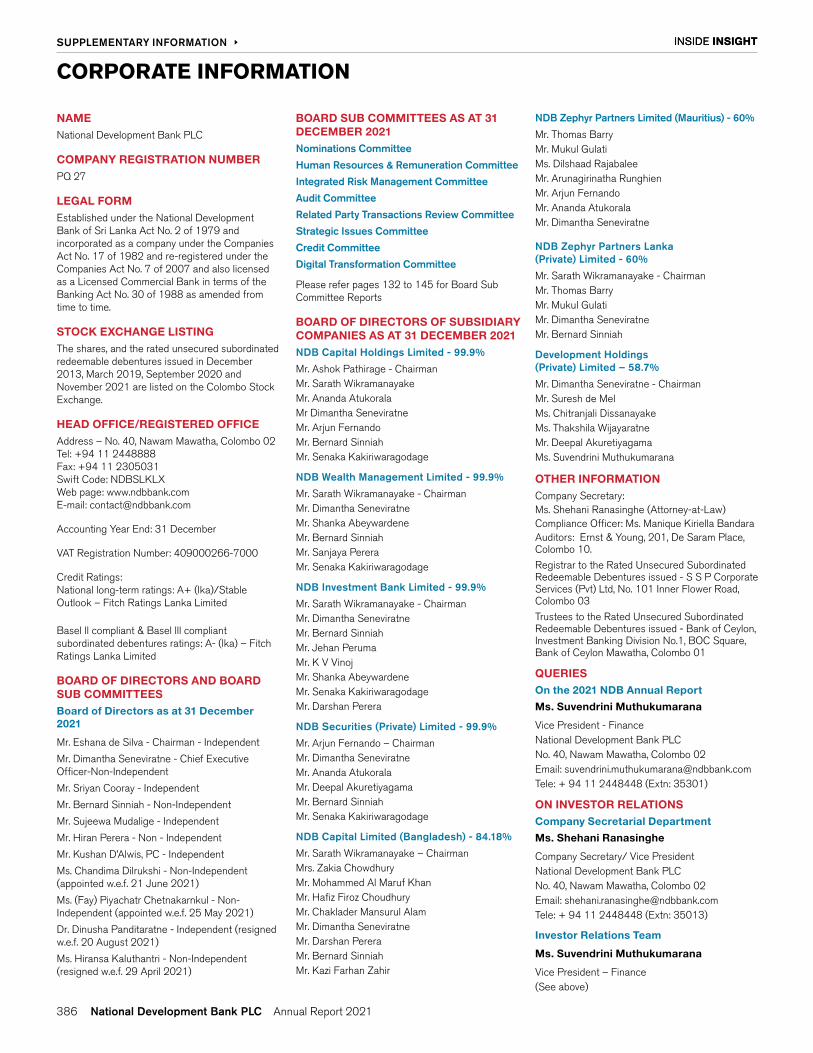
NAME National Development Bank PLC
COMPANY REGISTRATION NUMBERPQ 27
LEGAL FORM Established under the National Development Bank of Sri Lanka Act No. 2 of 1979 and incorporated as a company under the Companies Act No. 17 of 1982 and re-registered under the Companies Act No. 7 of 2007 and also licensed as a Licensed Commercial Bank in terms of the Banking Act No. 30 of 1988 as amended from time to time.
STOCK EXCHANGE LISTINGThe shares, and the rated unsecured subordinated redeemable debentures issued in December 2013, March 2019, September 2020 and November 2021 are listed on the Colombo Stock Exchange.
HEAD OFFICE/REGISTERED OFFICE Address – No. 40, Nawam Mawatha, Colombo 02Tel: +94 11 2448888Fax: +94 11 2305031Swift Code: NDBSLKLXWeb page: www.ndbbank.comE-mail: [email protected]
Accounting Year End: 31 December
VAT Registration Number: 409000266-7000
Credit Ratings: National long-term ratings: A+ (lka)/Stable Outlook – Fitch Ratings Lanka Limited
Basel ll compliant & Basel lll compliant subordinated debentures ratings: A- (lka) – Fitch Ratings Lanka Limited
BOARD OF DIRECTORS AND BOARD SUB COMMITTEES Board of Directors as at 31 December 2021
Mr. Eshana de Silva - Chairman - Independent
Mr. Dimantha Seneviratne - Chief Executive Officer-Non-Independent
Mr. Sriyan Cooray - Independent
Mr. Bernard Sinniah - Non-Independent
Mr. Sujeewa Mudalige - Independent
Mr. Hiran Perera - Non - Independent
Mr. Kushan D’Alwis, PC - Independent
Ms. Chandima Dilrukshi - Non-Independent (appointed w.e.f. 21 June 2021)
Ms. (Fay) Piyachatr Chetnakarnkul - Non-Independent (appointed w.e.f. 25 May 2021)
Dr. Dinusha Panditaratne - Independent (resigned w.e.f. 20 August 2021)
Ms. Hiransa Kaluthantri - Non-Independent (resigned w.e.f. 29 April 2021)
BOARD SUB COMMITTEES AS AT 31 DECEMBER 2021Nominations Committee
Human Resources & Remuneration Committee
Integrated Risk Management Committee
Audit Committee
Related Party Transactions Review Committee
Strategic Issues Committee
Credit Committee
Digital Transformation Committee
Please refer pages 132 to 145 for Board Sub Committee Reports
BOARD OF DIRECTORS OF SUBSIDIARY COMPANIES AS AT 31 DECEMBER 2021NDB Capital Holdings Limited - 99.9%
Mr. Ashok Pathirage - Chairman Mr. Sarath Wikramanayake Mr. Ananda Atukorala Mr Dimantha Seneviratne Mr. Arjun Fernando Mr. Bernard SinniahMr. Senaka Kakiriwaragodage
NDB Wealth Management Limited - 99.9%
Mr. Sarath Wikramanayake - Chairman Mr. Dimantha Seneviratne Mr. Shanka Abeywardene Mr. Bernard SinniahMr. Sanjaya PereraMr. Senaka Kakiriwaragodage
NDB Investment Bank Limited - 99.9%
Mr. Sarath Wikramanayake - Chairman Mr. Dimantha Seneviratne Mr. Bernard Sinniah Mr. Jehan PerumaMr. K V Vinoj Mr. Shanka Abeywardene Mr. Senaka KakiriwaragodageMr. Darshan Perera
NDB Securities (Private) Limited - 99.9%
Mr. Arjun Fernando – Chairman Mr. Dimantha Seneviratne Mr. Ananda Atukorala Mr. Deepal AkuretiyagamaMr. Bernard SinniahMr. Senaka Kakiriwaragodage
NDB Capital Limited (Bangladesh) - 84.18%
Mr. Sarath Wikramanayake – Chairman Mrs. Zakia Chowdhury Mr. Mohammed Al Maruf Khan Mr. Hafiz Firoz Choudhury Mr. Chaklader Mansurul AlamMr. Dimantha Seneviratne Mr. Darshan Perera Mr. Bernard SinniahMr. Kazi Farhan Zahir
NDB Zephyr Partners Limited (Mauritius) - 60%
Mr. Thomas BarryMr. Mukul GulatiMs. Dilshaad RajabaleeMr. Arunagirinatha RunghienMr. Arjun FernandoMr. Ananda AtukoralaMr. Dimantha Seneviratne
NDB Zephyr Partners Lanka(Private) Limited - 60%
Mr. Sarath Wikramanayake - ChairmanMr. Thomas BarryMr. Mukul GulatiMr. Dimantha SeneviratneMr. Bernard Sinniah
Development Holdings (Private) Limited – 58.7%
Mr. Dimantha Seneviratne - Chairman Mr. Suresh de MelMs. Chitranjali DissanayakeMs. Thakshila WijayaratneMr. Deepal AkuretiyagamaMs. Suvendrini Muthukumarana
OTHER INFORMATIONCompany Secretary: Ms. Shehani Ranasinghe (Attorney-at-Law)Compliance Officer: Ms. Manique Kiriella BandaraAuditors: Ernst & Young, 201, De Saram Place, Colombo 10.
Registrar to the Rated Unsecured Subordinated Redeemable Debentures issued - S S P Corporate Services (Pvt) Ltd, No. 101 Inner Flower Road, Colombo 03
Trustees to the Rated Unsecured Subordinated Redeemable Debentures issued - Bank of Ceylon, Investment Banking Division No.1, BOC Square, Bank of Ceylon Mawatha, Colombo 01
QUERIESOn the 2021 NDB Annual Report
Ms. Suvendrini Muthukumarana
Vice President - FinanceNational Development Bank PLCNo. 40, Nawam Mawatha, Colombo 02Email: [email protected]: + 94 11 2448448 (Extn: 35301)
ON INVESTOR RELATIONS Company Secretarial Department
Ms. Shehani Ranasinghe
Company Secretary/ Vice PresidentNational Development Bank PLCNo. 40, Nawam Mawatha, Colombo 02Email: [email protected]: + 94 11 2448448 (Extn: 35013)
Investor Relations Team
Ms. Suvendrini Muthukumarana
Vice President – Finance(See above)
CORPORATE INFORMATION
INSIDE INSIGHT INSIDE INSIGHT SUPPLEMENTARY INFORMATION
386

FORM OF PROXY
I/We .............................................................................................................................................................................................................................................................................................................................................................................................
(holder/s of NIC/s..................................................................................................................................................................) of ................................................................................................................................................................................
..........................................................................................................................................................................................................................................................................................................................................................................................................
..................................................................................................................................................... being a shareholder / shareholders of National Development Bank PLC (‘the Bank’) hereby appoint;
1. ................................................................................................................................................................................................................................................................................................................................................................................................
..................................................................................................................................................................................... (holder of NIC No. ...........................................................................................................................................................)
of ............................................................................................................................................................................................................................................................................................................................................ or failing him/her
2. Mr. Eshana de Silva (Chairman of the Bank) of Colombo or failing him,
Mr. Sriyan Cooray of Colombo or failing him, Mr. Bernard Sinniah of Colombo or failing him, Mr. Sujeewa Mudalige of Colombo or failing him, Mr. Hiran Perera of Colombo or failing him, Mr. Kushan D’Alwis, PC of Colombo or failing him, Ms. (Fay) Piyachatr Chetnakarnkul of Colombo or failing her, Ms. Chandima Dilrukshi of Colombo or failing her, Mr. Dimantha Seneviratne (Director/ CEO of the Bank) of Colombo
as my/our proxy to represent me/us and to vote for me/us and on my/our behalf at the Seventeenth (17) Annual General Meeting of the Bank to be held on Wednesday, the Thirtieth (30) day of March, 2022 and at any adjournment thereof and at every poll which may be taken in consequence thereof. I/We the undersigned hereby authorise my/our proxy to vote on my/our behalf in accordance with the preferences indicated below:
For Against
1. To reappoint Mr. Sujeewa Mudalige, as a Director in terms of Article 42 of the Articles of Association of the Bank.
2. To re-elect Mr. Bernard Sinniah, as a Director in terms of Article 42 of the Articles of Association of the Bank.
3. To reappoint Messrs. Ernst & Young, Chartered Accountants, as Auditors of the Bank as set out in Section 154 of the Companies Act No. 07 of 2007 and Section 39 of the Banking Act No. 30 of 1988 (as amended) and to fix the fees and expenses of such Auditors.
4. To determine the aggregate remuneration payable to Non-Executive Directors including the Chairman in terms of Article 58 of the Articles of Association of the Bank and to authorise the Board of Directors to approve other remuneration and benefits to the Directors (including the remuneration of the Executive Director/s) in terms of Section 216 of the Companies Act No. 07 of 2007.
5. To authorise the Board of Directors to determine donations for the financial year 2022 under the Companies Donations Act No. 26 of 1951
As witness I/We have set my/our hand/s hereunto this .................................................................................................................................. day of ............................................................................................................
....................................................................................................................... Two Thousand and Twenty Two (2022).
................................................................................................................
Signature of the Shareholder / Shareholders
387

Instructions for completion of the Form of Proxy
1. In order to appoint a proxy holder, kindly complete the Form of Proxy. The full name and the registered address of the shareholder appointing the proxy should be legibly entered in the Form of Proxy and should be signed and dated by the shareholder. The duly completed Form of Proxy must be deposited at the Registered Office of the Bank, at No. 40, Nawam Mawatha, Colombo 02 or via email to the Company Secretary ([email protected]) or by facsimile No. 0112 341050 not later than 24 hours prior to the time appointed for the holding of the meeting in accordance with Article 29 of the Articles of Association of the Bank.
For the Bank’s administrative convenience the Bank would very much appreciate and requests all shareholders to send in their Proxy Forms along with their Registration Form (Form 1) to reach the Bank no later than 12 noon on 18 March 2022 as this would enable the Bank to efficiently make all arrangements for the virtual meeting.
2. Shareholders/ proxy holders who are unable to connect to the AGM via audio or audio visual means are strongly encouraged to appoint one of the Directors of the Bank to act on their behalf in order that each shareholder’s vote may be identified and recorded as if such shareholder were participating at the meeting.
3. Shareholders appointing a proxy should duly complete the Form of Proxy clearly setting out their preference of vote in the Form of Proxy.
Please indicate an “X” in the cage provided how your Proxy should vote on each resolution. If no indication is given, or if there is, in the view of the proxy holder, any doubt (by reason of the manner in which the instructions contained in the proxy have been completed) as to the way in which the proxy holder should vote, the proxy holder in his/her discretion may vote as he/she thinks fit.
4. If the Form of Proxy is signed by an Attorney, the relevant Power of Attorney or a notarially certified copy thereof, should also accompany the completed Form of Proxy if the Power of Attorney has not already been registered with the Bank.
5. If you wish to appoint a person other than the Chairman or a Director of the Bank as your proxy, please insert the relevant information in the Form of Proxy and forward same to the Company Secretary together with Form 1 no later than 12 noon on 18 March 2022 so that the Login information can be shared with your proxy holder to connect to the virtual meeting / AGM via audio or audio visual means.
6. The proxy holder appointed need not be a shareholder of the Bank.
7. In case of a corporate shareholder, the proxy must be executed under its Common Seal (if applicable) or in such other manner prescribed by the Articles of Association or other constitutional documents.
8. The first joint holder shall have the power to sign the Form of Proxy without the concurrence of the other joint holder/s.
388

Designed & produced by
Printed by Softwave Printing & Packaging (Pvt) Ltd