annual report - 2021
104
ENGINEERED FOR LIFE ANNUAL REPORT 2021
-
Upload
khangminh22 -
Category
Documents
-
view
0 -
download
0
Transcript of annual report - 2021

ENGINEERED FOR LIFE
ANNUALREPORT
2021

AN NUALREPORT
2 0 2 1
A B O U T U S
R EVENUE PROFILE FINANCIALHIGHLIGHTS(in millions, except per share data)
Segments
MotionTechnologies
IndustrialProcess
Connect &ControlTechnologies
Regions
NorthAmerica
Europe
Asia
Middle East& Africa
SouthAmerica
End Markets
Automotive &Rail
Chemical &IndustrialPumpsAerospace &Defense
GeneralIndustrial
Energy
Revenue Adjusted SegmentOperating Income &Adjusted SegmentOperating Margin*
Adjusted Earnings PerShare*
Free Cash Flow*[1]Excluding Q2 2021 $398Masbestos payment
*For a reconciliation of non-GAAP to GAAP results, please refer to the section titled “Results and Filings” on our website at investors.itt.com.
$2,846
$2,478
$2,765
FY 2019 FY 2020 FY 2021
$456
$376
$477
16.0%
15.2%
17.2%
12.0%
13.0%
14.0%
15.0%
16.0%
17.0%
18.0%
19.0%
20.0%
$-
$1 00
$2 00
$3 00
$4 00
$5 00
$6 00
FY 2019 FY 2020 FY 2021
$3.81
$3.20
$4.05
FY 2019 FY 2020 FY 2021
$266
$372
$301[1]
FY 2019 FY 2020 FY 2021
At ITT, we have a clear purpose as a company and a team – to partner with our customersin key global end markets to solve their most critical problems. That vision is core to who we are, and over the past few years it has driven our focus on continuously building our foundation,capabilities and track record as a growth-oriented, muti-industrial manufacturing andtechnology company.

AN NUALREPORT
2 0 2 1CEO LETTER
DEAR SHAREHOLDERS, CUSTOMERS, AND ITTEMPLOYEES,I am humbled by what ITT accomplished in 2021. Our ITTers continuously worked safely, day in and dayout, to deliver on our commitments to our customers and our shareholders. Despite the ongoing challengesrelated to COVID-19, the global supply shortage, and unprecedented raw materials inflation, our teamsdelivered a strong performance in 2021, eclipsing our pre-pandemic performance in 2019 in manyrespects. This was a direct result of the resilience of the nearly ten thousand ITT employees across theglobe working to gether.
OVERVIEW
INNOVATIONANDGROWTH
continued to outperform the global automotivemarket thanks to best-in-class quality and on-time performance despite the ongoingsemiconductor chip shortage.
OPERATIONAL EXCELLENCEThroughout 2021 I witnessed firsthand thechallenges our teams and our customersexperienced related to the global supplychain, including component shortages, workerabsenteeism, freight delays, and of course thesemiconductor shortage. Despite all this, ITT’sfull year operating margin and adjustedearnings per share surpassed 2019 pre-pandemic levels.
We delivered 16% operating margins, 120basis points above 2019 and a new record forITT.We also overcame over $80million of rawmaterials inflation with strategic price andproductivity actions. And we remainedfocused on delivering for our customers, witha near perfect on-time delivery performance inthe Friction OE business.
In a showing of significant progress, both ourIndustrial Process and Connect & Controlbusinesses grew adjusted operating marginsover 200 basis points in 2021 despitesignificant supply chain challenges. Still, wehave more work to do and there will be moreopportunities in 2022 and beyond.
CAPITAL DEPLOYMENT
IN CONCLUSIONI am as excited as ever for the journey in2022 and beyond. ITT operates in endmarkets that are poised to grow in thepost-pandemic e c o n omy , whether it isautomotive, commercial aerospace orgeneral industrial. And we are alreadywinning in the marketplace, as evidencedby the growing demand in orders. ITT willcontinue to drive performance for ourcustomers, execute our organic andinorganic initiatives and invest in ourbusiness in 2022 and beyond.
On behalf of everyone at ITT, I would liketo thank you for your support andcommitment in 2021. SiamoPronti!
Sincerely,
LucaSavi
Throughout the pandemic, we continued to invest in our businesses. For the past three years, our research and development expense was over 3% of sales, and capital expenditures increased nearly 40% in 2021. This is a reflection of the opportunities we see across the ITT portfolio, including green projects to support our sustainability initiatives.
In 2021 we continued to execute our balanced approach to capital deployment and deployed nearly two times our annual adjusted free cash flow. This included the repurchase of over $100 million of ITT shares, which reduced our weighted average share count by 1%, and the divestiture of a subsidiary holding all legacy asbestos liabilities and related assets. With legacy asbestos liabilities out of the way, ITT is now poised to execute strategic acquisitions, and we are ready.
Our strong cash position will enable ITT to execute all facets of our capital deployment strategy in 2022. We have already announced
a 20% increase in our quarterly dividend from 2021 and plan to continue to focus on organic investments, M&A and share repurchases throughout the year.
ITT’s products are winning in the market-place, and we saw that in our order rates and backlog growth in 2021. Organic orders grew 20% in 2021, with an 18% increase in organ-ic backlog compared to 2020. We are seeing broad-based demand across our long-cyclepumps and short-cycle offerings in Industri-al Process, in our components portfolio that serves commercial aerospace and industrialmarkets in Connect & Control, and in our orig-inal equipment and aftermarket Friction brakepad business in Molton Technologies, which
In the past three years I have been CEO, we have been focused on the health of our
protocols in 2020 to protect our employees, empowering them to operate safely, andrestarted deliveries to our customers faster than the competition. And in 2021 our injury frequency rate and injury severity rate both declined despite higher output compared to 2020. The health and safety of our people remains a priority today and always, andat ITT we believe this will drive stronger performance over the long term.
We secured content on 33 new electric vehicle platforms in 2021 and as a result, our
approximately 20% of the total Frictionbusiness, and it continues to grow. We arealso advancing our value-add, value-engineering initiative across IndustrialProcess and Connect & Control Technologies to revitalize our pump and connector portfolios. Lastly, we are cultivating disruptive technologies and products to support our customers.
AN NUALREPORT
2 0 2 1
OUR TEAMITT BOARD OF
DIRECTORS
ITTLEADERSHIP
TEAM
Richard P. Lavin
Orlando D. AshfordExecutive Chairman of Azamara
Donald DeFosset, Jr.Former Chairman, Chief ExecutiveOfficer and President, WalterIndustries, Inc.
Luca SaviChief Executive Officer and President
Davide BarbonSenior Vice President andPresident, Asia Pacific
Emmanuel CapraisSenior Vice President andChief Financial Officer
GeraudDarnisFormer President and Chief ExecutiveOfficer, UTC Building & IndustrialSystems
Nicholas C. FanandakisFormer Executive Vice President,DuPont de Nemours, Inc.
Rebecca A.McDonaldFormer Chief Executive Officer,Laurus Energy, Inc.
Ryan FlynnSenior Vice President and President,Connect & Control Technologies
Carlo GhirardoSenior Vice President andPresident, Motion Technologies
Mary Beth GustafssonSenior Vice PresidentandGeneral Counsel
Timothy H. PowersFormer Chairman, Chief ExecutiveOfficer and President, Hubbell,Incorporated
Cheryl L. ShaversChairman and Chief Executive Officer,Global Smarts, Inc.
Sabrina SoussanChief Executive Officer,Suez Group
Maurine LembesisSenior Vice President andChief Human Resources Officer
BartekMakowieckiSenior Vice President, Strategy and BusinessDevelopment
David StebleinSenior Vice President andPresident, Industrial Process
SHAREHOLDERINFORMATION
INDEPENDENT REGISTEREDPUBLIC ACCOUNTING FIRM
Deloitte & Touche LLP695 East Main StreetStamford, CT 06901
TRANSFER AGENT& REGISTRARComputershare462 South 4th Street, Suite 1600Louisville, KY 40202(888) 217-2614
ANNUALMEETING OF SHAREHOLDERSThe annual meeting will be held at 9 a.m. EDT onWednesday, May 18, 2022 virtually, via a live webcast atwww.virtualshareholdermeeting.com/ITT2022
CORPORATE GOVERNANCECopies of the ITT Code of Conduct, Corporate GovernancePrinciples and Committee charters are available on our website:www.itt.com.
ETHICS & COMPLIANCEITT encourages its employees and others to report possibleviolations of our Code of Conduct. ITT’s ethics hotline can bereached at + 1 (866) 886-8385 or at ethics. .com
FOR CORPORATE INFORMATION, CONTACT:Mark Macaluso, Investor [email protected]
CEO &PRESIDENTLuca Savi
WORLDWIDE EMPLOYEES9,900
FOUNDED1920
NYSEITT
Luca SaviChief Executive Officer and President,ITT Inc.
Chairman of the ITT Board of Directors and Former Chief Executive Officer and President, Commercial Vehicle Group, Inc.

UNITED STATES SECURITIES AND EXCHANGE COMMISSIONWASHINGTON, D.C. 20549
FORM 10-K(Mark One)
☑ ANNUAL REPORT PURSUANT TO SECTION 13 OR 15(d) OF THE SECURITIESEXCHANGE ACT OF 1934
For the fiscal year ended December 31, 2021OR
☐ TRANSITION REPORT PURSUANT TO SECTION 13 OR 15(d) OF THE SECURITIESEXCHANGE ACT OF 1934
For the Transition period from_____ to _____Commission File No. 001-05672
ITT INC.Incorporated in the State of Indiana 81-1197930
(State or Other Jurisdiction of Incorporation or Organization) (I.R.S. Employer Identification No.)
1133 Westchester AvenueWhite Plains, NY 10604
(Principal Executive Office)Telephone Number: (914) 641-2000
Securities registered pursuant to Section 12(b) of the Act:
Title of each class Trading Symbol(s)Name of each exchange on which
registeredCommon Stock, par value $1.00 per share ITT New York Stock Exchange
Securities registered pursuant to Section 12(g) of the Act: None.Indicate by check mark if the registrant is a well-known seasoned issuer, as defined in Rule 405 of the Securities Act. Yes þ No ¨
Indicate by check mark if the registrant is not required to file reports pursuant to Section 13 or Section 15(d) of the Act. Yes¨ No þ
Indicate by check mark whether the registrant (1) has filed all reports required to be filed by Section 13 or 15(d) of the Securities Exchange Act of1934 during the preceding 12 months (or for such shorter period that the registrant was required to file such reports), and (2) has been subject tosuch filing requirements for the past 90 days. Yes þ No ¨
Indicate by check mark whether the registrant has submitted electronically every Interactive Data File required to be submitted pursuant toRule 405 of Regulation S-T (§232.405 of this chapter) during the preceding 12 months (or for such shorter period that the registrant was requiredto submit such files). Yes þ No ¨
Indicate by check mark whether the registrant is a large accelerated filer, an accelerated filer, a non-accelerated filer, a smaller reportingcompany, or an emerging growth company. See the definitions of "large accelerated filer," "accelerated filer," "smaller reporting company," and"emerging growth company" in Rule 12b-2 of the Exchange Act.
☑ Large accelerated filer ☐ Accelerated filer ☐ Non-accelerated filer ☐ Smaller reporting company☐ Emerging growth company
If an emerging growth company, indicate by check mark if the registrant has elected not to use the extended transition period for complying withany new or revised financial accounting standards provided pursuant to Section 13(a) of the Exchange Act. ¨Indicate by check mark whether the registrant has filed a report on and attestation to its management's assessment of the effectiveness of itsinternal control over financial reporting under Section 404(b) of the Sarbanes-Oxley Act (15 U.S.C. 7262(b)) by the registered public accountingfirm that prepared or issued its audit report. Yes þ No ¨
Indicate by check mark whether the registrant is a shell company (as defined in Rule 12b-2 of the Act). Yes ☐ No þ
The aggregate market value of common stock of the registrant held by non-affiliates of the registrant on June 30, 2021 was approximately $7.8billion. As of February 14, 2022, there were 85.3 million shares of the registrant's common stock outstanding.
DOCUMENTS INCORPORATED BY REFERENCEPortions of the registrant’s Definitive Proxy Statement to be filed with the Securities and Exchange Commission pursuant to Regulation 14A for its2022 Annual Meeting of Shareholders are incorporated by reference in Part II and Part III of this Form 10-K.

TABLE OF CONTENTS
ITEM PAGEPART I1 Description of Business 11A Risk Factors 101B Unresolved Staff Comments 192 Properties 193 Legal Proceedings 194 Mine Safety Disclosures 21* Information About Our Executive Officers 20
PART II5 Market for Registrant’s Common Equity, Related Stockholder Matters and Issuer Purchases of Equity Securities 226 Selected Financial Data 237 Management’s Discussion and Analysis of Financial Condition and Results of Operations 247A Quantitative and Qualitative Disclosures About Market Risk 418 Financial Statements and Supplementary Data 429 Changes in and Disagreements with Accountants on Accounting and Financial Disclosure 429A Controls and Procedures 439B Other Information 44
PART III10 Directors, Executive Officers and Corporate Governance 4611 Executive Compensation 4612 Security Ownership of Certain Beneficial Owners and Management and Related Stockholder Matters 4613 Certain Relationships and Related Transactions, and Director Independence 4614 Principal Accounting Fees and Services 46
PART IV15 Exhibits and Financial Statement Schedule 4716 Form 10-K Summary 47Exhibit Index II-1Signatures II-3
* Included pursuant to the General Instruction to Item 401 of Regulation S-K.
WHERE YOU CAN FIND MORE INFORMATION
We file annual, quarterly and current reports, proxy statements and other information with the U.S. Securitiesand Exchange Commission (the SEC). The SEC maintains a website at www.sec.gov on which you may access ourSEC filings. In addition, we make available free of charge at www.itt.com/investors copies of materials we file with,or furnish to, the SEC as soon as reasonably practical after we electronically file or furnish these reports, as well asother important information that we disclose from time to time. Information contained on our website, or that can beaccessed through our website, does not constitute a part of this Annual Report on Form 10-K. We have included ourwebsite address only as an inactive textual reference and do not intend it to be an active link to our website.
Our corporate headquarters are located at 1133 Westchester Avenue, White Plains, New York 10604 and thetelephone number of this location is (914) 641-2000.
FORWARD-LOOKING AND CAUTIONARY STATEMENTSSome of the information included herein includes forward-looking statements intended to qualify for the safe
harbor from liability established by the Private Securities Litigation Reform Act of 1995. These forward-lookingstatements are not historical facts, but rather represent only a belief regarding future events based on currentexpectations, estimates, assumptions and projections about our business, future financial results and the industry inwhich we operate, and other legal, regulatory and economic developments. These forward-looking statementsinclude, but are not limited to, future strategic plans and other statements that describe the company’s businessstrategy, outlook, objectives, plans, intentions or goals, and any discussion of future events and future operating orfinancial performance.
We use words such as “anticipate,” “estimate,” “expect,” “project,” “intend,” “plan,” “believe,” “target,” “future,”“may,” “will,” “could,” “should,” “potential,” “continue,” “guidance” and other similar expressions to identify suchforward-looking statements. By their nature, forward-looking statements are inherently uncertain, unpredictable,outside of ITT's control, and involve known and unknown risks, uncertainties and other important factors that couldcause actual results to differ materially from those expressed or implied in, or reasonably inferred from, suchforward-looking statements.
Where in any forward-looking statement we express an expectation or belief as to future results or events, suchexpectation or belief is based on current plans and expectations of our management, expressed in good faith andbelieved to have a reasonable basis. However, there can be no assurance that the expectation or belief will occur orthat anticipated results will be achieved or accomplished.
Among the factors that could cause our results to differ materially from those indicated by forward-lookingstatements are risks and uncertainties inherent in our business including, without limitation:
• impacts on our business due to the COVID-19 pandemic, including:◦ variant strains of the virus, as well as the timing, effectiveness and availability of, and people’s
receptivity to, vaccines or other medical remedies;◦ disruptions to our operations and demand for our products, increased costs, disruption of supply
chain, and other constraints in the availability of materials and other necessary services;◦ government-mandated site closures, employee illness, skilled labor shortages, the impact of
potential travel restrictions, stay-in-place restrictions, and vaccination requirements on our businessand workforce; and
◦ customer and supplier bankruptcies, impacts to the global economy and financial markets, andliquidity challenges in accessing capital markets;
• uncertain global economic and capital markets conditions, including those due to COVID-19, tradedisputes between the U.S. and its trading partners, actions taken by the current U.S. administration,political and social unrest, and the availability and fluctuations in prices of steel, oil, copper, and othercommodities;
• volatility in raw material prices and our suppliers’ ability to meet quality and delivery requirements;• failure to manage the distribution of products and services effectively;• failure to compete successfully and innovate in our markets;• failure to protect our intellectual property rights or violations of the intellectual property rights of others;• the extent to which there are quality problems with respect to manufacturing processes or finished goods;• the risk of cybersecurity breaches;• loss of or decrease in sales from our most significant customers;• risks due to our operations and sales outside the U.S. and in emerging markets;

• fluctuations in foreign currency exchange rates and the impact of such fluctuations on our hedgingarrangements;
• fluctuations in demand or customers’ levels of capital investment and maintenance expenditures,especially in the energy, chemical, and mining markets, or changes in our customers’ anticipatedproduction schedules, especially in the commercial aerospace market;
• the risk of material business interruptions, particularly at our manufacturing facilities;• risk of liabilities from past divestitures and spin-offs;• failure of portfolio management strategies, including cost-saving initiatives, to meet expectations;• risks related to government contracting, including changes in levels of government spending and
regulatory and contractual requirements applicable to sales to the U.S. government, including the impactof COVID-19 vaccination mandates on our ability to continue to participate in federal contracting;
• fluctuations in our effective tax rate, including as a result of possible tax reform legislation in the U.S.;• changes in environmental laws or regulations, discovery of previously unknown or more extensive
contamination, or the failure of a potentially responsible party to perform;• failure to comply with the U.S. Foreign Corrupt Practices Act (or other applicable anti-corruption
legislation), export controls and trade sanctions, including tariffs;• risk of product liability claims and litigation; and• changes in laws relating to the use and transfer of personal and other information.
Refer to Item 1A, Risk Factors for more information on factors that could cause actual results or events to differmaterially from those anticipated and disclosed within this Annual Report on Form 10-K, our Quarterly Reports onForm 10-Q and in other documents we file from time to time with the SEC.
The forward-looking statements included in this report speak only as of the date of this report. We undertake noobligation (and expressly disclaim any obligation) to update any forward-looking statements, whether written or oralor as a result of new information, future events or otherwise.

PART I
ITEM 1. DESCRIPTION OF BUSINESS(Amounts reported in this Annual Report on Form 10-K, except per share amounts, are stated in millions unless otherwise specified. Referencesherein to "ITT," "the Company," and such words as "we," "us," and "our" include ITT Inc. and its subsidiaries on a consolidated basis, unless thecontext otherwise indicates.)
COMPANY OVERVIEWITT is a diversified manufacturer of highly engineered critical components and customized technology solutions
primarily for the transportation, industrial, and energy markets. We manufacture components that are integral to theoperation of equipment, systems and manufacturing processes in these key markets. Our products provide enablingfunctionality for applications where reliability and performance are critically important to our customers and theusers of their products. We operate through three primary segments: Motion Technologies (MT), Industrial Process(IP), and Connect & Control Technologies (CCT).
2021 COMPANY SNAPSHOT• $2.8 billion of sales across approx. 125 countries • Approx. 9,900 employees in 35 countries• Global presence with 70% of revenue outside the U.S. • Balanced and diversified portfolio
Revenue by Segment(2021)
MT 50% IP 30%
CCT 20%
Revenue by Geography(2021)
NorthAmerica 38%
Europe 37%
Asia 18%Other 7%
MT is a global manufacturer of highly engineered and durable brake pads, shock absorbers, and dampingtechnologies for the automotive and rail markets. IP is a global manufacturer of industrial pumps, valves, andmonitoring and control systems, and provides aftermarket services, for the energy, chemical and petrochemical,pharmaceutical, general industrial, mining, pulp and paper, food and beverage, and biopharmaceutical markets.CCT is a global designer and manufacturer of harsh-environment connectors and critical energy absorption and flowcontrol components, primarily for the aerospace, defense, and industrial markets. For additional segmentinformation, see Segment Information section below.
Business Model and Strategy
Our businesses share a common, repeatable operating model centered on our engineering capabilities. Eachbusiness applies its technology and engineering expertise to solve our customers' most pressing challenges. Ourtechnological applications foster an ongoing business relationship with our customers which provides us with uniqueinsight into our customers' requirements while enabling us to develop solutions to better assist our customersachieve their business goals. Our technology and customer intimacy together provides opportunities to capturerecurring revenue streams, aftermarket opportunities, and long-lived platforms from original equipmentmanufacturers (OEMs).
We create long-term stakeholder value through our four strategic priorities of customer centricity, operationalexcellence, effective capital deployment and sustainability and innovation. Our strategy is designed to achievepremier financial performance by combining profitable growth with operational improvements, while keeping ourcustomers at the center of everything we do.
Our operational improvements optimize safety, quality, on time delivery, and productivity. We are on a journey toestablish a higher performance culture that goes beyond the factory floor to improve the efficiency and effectivenessof all critical processes in the value chain. These initiatives encompass not only continuous improvement principles,but also leadership, talent, and cultural aspects. For additional information, see "Human Capital Management"within Other Company Information.
1

We believe ITT has the opportunity to continue to expand geographically, enhance existing products anddevelop new products, improve our market position, and increase earnings through organic growth and targetedacquisitions. We are expanding in international markets and investing in new products that leverage our deepengineering capabilities. We continue to evaluate investments that will enable us to strategically and efficientlydeploy capital, including close-to-core acquisitions that have unique and differentiated products, services, andtechnologies. Effective capital deployment, including resource optimization and a disciplined focus on cash flowmanagement, are a major part of how we plan to achieve our strategy and deliver strong shareholder returns.
Primary Businesses and Brands
Our businesses are committed to quality, reliability, durability, and engineering excellence. Our brands have astrong international presence across many emerging markets, including China, India, Mexico, Brazil, and SaudiArabia.
OUR KEY BRANDSMT • ITT Friction Technologies • KONI • Wolverine Advanced Materials
• Axtone • Novitek • GaltIP • Goulds Pumps® • Bornemann® • Engineered Valves®
• PRO Services® • C'treat® • i-ALERT®
• Rheinhütte PumpenCCT • Cannon® • VEAM® • BIW Connector Systems®
• Aerospace Controls • Enidine® • Compact Automation®
• Neo-Dyn® Process Controls • Conoflow® • Matrix Composites
SEGMENT INFORMATIONSee Note 3, Segment Information, to the Consolidated Financial Statements for financial information about each
of our segments.
Motion Technologies (MT)
The Motion Technologies segment is a manufacturer of brake pads, shims, shock absorbers, energy absorptioncomponents, and sealing technologies primarily for the transportation industry, including passenger cars and trucks,light- and heavy-duty commercial and military vehicles, buses, and trains. MT consists of the following primarybusiness units: ITT Friction Technologies, Wolverine Advanced Materials, and KONI & Axtone.
ITT Friction Technologies (Friction)
Friction manufactures a range of brake pads installed as original equipment (OE) on passenger cars (bothinternal combustion engine vehicles and electric vehicles) and light commercial vehicles. Demand for our productsstems from a variety of end customers and automotive platforms around the world. OE brake pads are sold directlyto OEMs or to Tier-1 brake manufacturers. Our OE brake pads are designed to meet customer specifications andenvironmental regulations, and to satisfy an array of performance standards across multiple geographies. Mostautomotive OEM platforms (car models) require specific brake pad formulations and have demanding quality,delivery, and volume schedules. Friction anticipated the industry transition towards copper-free brake pads, and is arecognized industry leader in the paradigm shift towards new brake pad formulations that are designed, developedand tested specifically for electric vehicles (EV). Friction's success in developing brake pads for EVs has led it towin multiple EV platform awards with traditional and new OEMs.
Friction also manufactures aftermarket brake pads designed for the automotive service and repairs market. Thismarket consists of both OE dealers, also referred to as original equipment service (OES) networks, andindependent aftermarket networks. Brake pads sold within the OES network generally match the specifications of anoriginal auto platform OE brake pad and are sold either directly to OEMs or to Tier-1 brake manufacturers, such asContinental AG (Continental), or indirectly through independent distributor channels. Our catalog of pads sold inindependent aftermarket networks features technology designed to provide a range of braking performance levels.
Wolverine Advanced Materials (Wolverine)
Wolverine is a manufacturer of custom damping technologies for automotive braking systems (for both internalcombustion engine vehicles and EVs) and specialized gasket sealing solutions for harsh operating environments.
2

Wolverine sells its products, which consist primarily of brake shims and gaskets, to Tier-2 brake pad suppliers(including Friction Technologies) and to Tier-1 manufacturers. Brake shims are thin metal and rubber adhesivedampeners that fit onto the brake pad and against the brake caliper to prevent excessive noise and vibration.Gaskets are an anti-vibration and sealing solution that prevent fluid spillage in applications such as engines,transmissions, exhaust systems, fuel systems, and a variety of pneumatic systems. These products are sold eitheras coils of rubber-coated sheet metal or stamped into finished component parts.
KONI & Axtone
The KONI & Axtone business services four main end markets: railway rolling stock for freight and passengertrains; car and racing; bus, truck and trailer; and defense.
Railway provides a wide range of equipment for passenger rail, locomotives, freight cars, high speed trains, andlight rail. Offerings include customized energy absorption solutions, hydraulic shock absorbers (primary, lateral,and inter-car), yaw dampers, springs, visco-elastic and hydraulic buffers, coupler components, and crashmitigation. Revenue from our rail damping systems is balanced between OE and aftermarket customers. Salesare made either directly to train manufacturers and train operators carrying out scheduled train maintenanceprograms, or indirectly through distributors. KONI & Axtone are lifetime partners of rail customers, offering repairand overhauling capabilities for their products.
Car and Racing features performance shock absorbers often using our Frequency Selective Damping (FSD)technology. FSD products generally are used by car and racing enthusiasts who desire to modify their cars forincreased handling performance and comfort. KONI aftermarket car shock absorbers are sold around the world,directly to customers and through a distribution network that markets KONI products into specific geographies orcustomer groups. KONI shock absorbers are also incorporated into new OEM platform designs and sold to Tier-1shock absorber manufacturers.
Bus, Truck and Trailer and Defense manufactures hydraulic and hydro-pneumatic shock absorbers for sale to bothOEM and aftermarket customers.
Other Information
MT has a global manufacturing footprint with advanced automation capabilities, with production facilities inEurope, China, and North America.
MT competes in markets primarily served by large and well-established national and global companies. Keycompetitive drivers within the brake pad and brake shim business include technical expertise, formulationdevelopment capabilities, scale production, product performance, high-quality standards, customer intimacy,reputation, and the ability to meet demanding delivery and volume schedules in a limited amount of time. We havewell-established, long-term relationships with our OE and OES brake pad customers based on mutual trust, localproximity, and a wide range of cooperative activities, ranging from design, to sampling, prototyping, and testingphases of brake pads. MT is also a leading supplier of aftermarket brake pads within the highly fragmented globalmarket.
Competitive drivers in MT's rail business include customer intimacy, price, technical expertise, and productperformance. MT rail products are considered critical components because of safety requirements and thus they aredesigned specifically for different train applications, and must satisfy strict compliance requirements. MT is a globalleader in rail suspension components, freight coupling devices currently used in Europe, and crash absorptionsystems.
MT's sales to Continental, a supplier to the automotive industry and MT's largest customer, represent 20% ofMT's 2021 revenue. Automaker requests to use ITT brake pads in their Continental-produced braking systems(calipers) typically account for approximately half of MT's revenue from Continental. These automaker requests aregenerally formalized through supply agreements signed directly between MT and automakers. The remainder ofMT's sales to Continental is through a long-term agreement to supply Continental with aftermarket parts.
Industrial Process (IP)
The Industrial Process segment is an OEM and an aftermarket parts and service provider of industrial pumps,valves, plant optimization, and remote monitoring systems and services. IP's products serve an extensive base ofcustomers ranging from large multi-national companies and engineering, procurement, and construction (EPC) firmsto regional distributors and various other end-users. IP has a global manufacturing footprint with significantoperations in the United States, South Korea, Saudi Arabia, Mexico, and Germany. IP's customers operate in globalinfrastructure and natural resource markets such as energy, chemical and petrochemical, pharmaceutical, general
3

industrial, mining, pulp and paper, food and beverage, and power generation. IP's marketplace-recognized brandsinclude Goulds Pumps®, Bornemann®, Rheinhütte Pumpen, Engineered Valves®, PRO Services®, C'treat®, and i-ALERT®.
Industrial Pumps
Industrial pumps are used by a wide array of customers and applications primarily in the chemical, energy,mining, general industrial, pharmaceutical, and power generation markets. IP designs and manufactures configured-to-order and standards-based industrial pumps that are highly engineered and customized to customer needs.These products include a broad portfolio of centrifugal and twin screw positive displacement pumps that meet thefollowing industry-recognized standards: American Petroleum Institute (API), American National Standards Institute(ANSI), ATmosphere EXplosible, European Directive 2014/34/EC (ATEX), IEC standards (IECEx), and InternationalOrganization for Standardization (ISO). Our project pumps are generally part of larger and more complex capitalprojects, have longer lead times than baseline pumps, and are generally managed by EPC firms.
Valves
Valves are manufactured to handle a wide variety of process conditions and solve unique challenges in thebiopharmaceutical, chemical, mining, power generation, pulp and paper, and general industrial markets. Ourportfolio of valve products includes knife-gate valves, ball valves, and hygienic and industrial diaphragm valves,marketed under the brand names EnviZion®, Cam-Line®, Cam-Tite®, Dia-Flo®, Fabri-Valve®, Pure-Flo®, andSkotch®. Our EnviZion® valve has embedded technologies for faster maintenance turnarounds, lower system start-up time, higher equipment uptime, and greater production capacity for drug manufacturers. New to our portfolio isthe Integrated Sensing Platform (ISP), which is a next-generation linear position sensing technology for EnviZion®and Pure-Flo® hygienic diaphragm valves, developed specifically for the toughest applications in the Biopharm andsanitary industries.
Aftermarket
Our aftermarket solutions, which represent approximately 45% of IP's revenue, provide customers withreplacement parts, services, and plant optimization solutions that reduce total cost of ownership of pumps androtating equipment. In addition to providing standard repairs, IP also develops engineered solutions for specificcustomer process issues. Examples include innovative technologies like PumpSmart® Control & ProtectionTechnology and i-ALERT® Equipment Health Monitoring Devices, which remotely control and monitor pumps andother rotating equipment in an industrial environment.
Other Information
IP markets via a global and diversified sales channel structure. End-users are serviced by an extensive networkof independent distributors, to whom we sell our products and which account for approximately one-third of revenue.We also sell directly to end-users through our customer-focused direct sales and service organization. In addition,we have focused channels dedicated to supporting EPC firms, as their needs are often distinct from those ofdistribution and end-user customers.
The pump and valve markets we serve are highly competitive and fragmented. For most of our products, thereare many regional competitors and a limited number of larger global peers. Primary customer purchase decisiondrivers include price, lead time and on-time performance, brand recognition, quality, breadth of product and serviceofferings, commercial terms, technical support, and localization. Pricing can be very competitive for large projectsbecause completed projects generate ongoing profitable aftermarket opportunities for the OE provider.
Connect & Control Technologies (CCT)
The Connect & Control Technologies segment designs and manufactures a range of highly-engineeredconnectors and specialized products for critical applications supporting various markets including aerospace anddefense, industrial, transportation (including EVs), medical, and energy. CCT’s products are often components onlong-lived platforms that generate recurring aftermarket and replacement opportunities. CCT has organized itsbusiness around product offerings and end-user markets, with dedicated teams specializing in solutions for theirspecific markets, providing focused customer support and expertise.
Connector Products
The connector product portfolio includes high-performance connectors of the following types: Circular,Rectangular, Radio Frequency, Fiber Optic, D-sub Miniature, Micro-Miniature, and cable assemblies. Brands includeCannon®, VEAM®, and BIW Connector Systems®, which deliver solutions to enable the transfer of data, signals, and
4

power into various end-user markets including aerospace, defense, industrial, transportation, medical, and energy.These brands are known for high-performance, high-reliability solutions which withstand high temperatures andpressure and are resistant to corrosive environments. In certain harsh environment markets, our connector productsare considered market leaders because of our technological capabilities, cost performance, and global footprint.
Products for the aerospace and defense markets include industry standards-based connectors and late stagecustomized solutions for most segments of the commercial aviation and defense industries. These products aredesigned to withstand the extreme conditions in harsh environments that are typical in aviation and militaryapplications and where reliability and safety are critical factors.
Products for the industrial markets include connectors for industrial production and transportation equipment,industrial electronics and instruments, and other industrial and medical applications. Products for the transportationmarkets include connectors for passenger rail, heavy-duty vehicles, and electric vehicle charging stationapplications.
Products for the energy markets include connectors that provide power for electric submersible pumps in oilwells, reservoir monitoring instruments, and electrical downhole heaters. Specific product applications includeelectrical power penetrators for wellheads, packers, and pods that are able to accommodate various sizes andprovide for multiple sealing strategies and ratings.
Control Products
The control product portfolio consists of highly engineered actuation, flow control, energy absorption,environmental control, and composite component solutions for the aerospace, defense, and industrial markets.
Control products for the aerospace and defense markets include actuators, valves, pumps and switches for flowcontrol applications, rate controls, seat recline locks and elastomer isolators for aircraft interiors, elastomericbearings for rotorcraft vibration isolation, heaters, hoses, and composite ducting for environmental control systems,and advanced composites for engine applications. Brands include Aerospace Controls, Enidine®, and MatrixComposites.
Control products for the industrial markets include shock absorbers, wire ropes and actuators for factory andwarehouse automation, regulators and switches for process control applications, seismic isolators and large boreshocks for protection of critical infrastructure, and regulators for natural gas vehicles. Brands include Enidine®,Compact Automation®, Turn-Act®, Neo-Dyn®, and Conoflow®.
Other Information
CCT has a global production footprint, including facilities in the United States, Mexico, Germany, Italy, China,and Japan, which provide close geographic proximity to key customers. CCT competes with a large number ofcompanies in highly fragmented industries, ranging from large public multi-national corporations to small privatelyheld local firms, depending on the product line and region. CCT's ability to compete successfully depends uponnumerous factors, including quality, price, lead time, performance, brand recognition, customer service, innovation,application expertise, and previous installation history. In addition, collaboration with customers to deliver a widerange of product offerings has allowed CCT to compete effectively, to cultivate and maintain strong customerrelationships, and to expand into new markets. CCT products are sold directly and indirectly through numerouschannels, including distributors. CCT has long-lasting relationships with distributors, as many have been sellingcertain CCT products for decades. Sales to distributors represented approximately one-third of CCT's 2021revenue.
5

OTHER COMPANY INFORMATION
Key Components and Raw Materials
All of our businesses require various manufactured components and raw materials, the availability and prices ofwhich may fluctuate.
MANUFACTURED COMPONENTS ASSEMBLED INTO OUR PRODUCTS• Motors • Castings• Mechanical Seals • Machined Castings• Metal Fabrications • Miscellaneous Metal, Plastic, and Electronic Components
PRIMARY RAW MATERIALS• Steel • Gold • Copper • Nickel• Iron • Aluminum • Tin • Rubber• Specialty Alloys, including Titanium
Raw materials are purchased in various forms, such as sheet, bar, rod and wire stock, pellets, and metalpowders. We also use various specialty resins and adhesives. Raw materials, supplies and product subassembliesare purchased from third-party suppliers, contract manufacturers, and commodity dealers. For most of our products,we have existing alternate sources of supply, or such materials are readily available. However, in some instanceswe depend on a single source of supply, manufacturing or assembly, or participate in commodity markets that maybe subject to a limited number of suppliers.
Our operating results are generally exposed to fluctuations in the prices and supply constraints of raw materialsand commodities due to inflation, supply chain disruptions and tariffs imposed by the U.S. and other countries. Wecontinually monitor the business conditions of our supply chain to maintain our market position and to avoidpotential supply disruptions. During 2021, we experienced, and continue to experience, significant disruptions to oursupply chain caused primarily by the COVID-19 pandemic. These supply chain challenges have resulted inshortages of materials, including commodities such as steel, and other components that we use in our productionprocesses. Because of the rising demand for raw materials globally, we have experienced significant increases inprices and shipping costs, which impacted our financial results. See Item 7, Management's Discussion and Analysisfor additional information. We have been able to partially mitigate the impact of this inflation via fixed-price supplycontracts with suppliers, price increases to customers and productivity savings. We typically acquire materials andcomponents through a combination of blanket and scheduled purchase orders to support our materialsrequirements for an average of four to eight weeks, with the exception of some specialty materials. In limitedcircumstances, we may have to obtain scarce components for higher prices on the spot market, which may have anegative impact on our results. We also acquire certain inventory in anticipation of supply constraints or enter intolonger-term pricing commitments with vendors to improve the priority, price, and availability of supply. We evaluatehedging opportunities to mitigate or minimize the risk of margin erosion resulting from the volatility of commodityprices. The challenges associated with supply chain disruptions, inflation and tariffs are expected to continue in2022, and we are unable to reasonably predict when they will be resolved. As a result, we cannot provide assurancethat we will not be adversely affected by materials price volatility or the availability of supplies to meet customerdemand in the future.
Manufacturing MethodsOur businesses utilize two primary methods to fulfill demand for products: build-to-order and engineer-to-order.
• Build-to-order consists of assembling a group of products with the same pre-defined specifications, generallyfor our OEM customers. We employ build-to-order capabilities to maximize manufacturing and logisticsefficiencies by producing high volumes of basic product configurations.
• Engineer-to-order consists of assembling a customized system according to a customer’s individual orderspecifications. Engineer-to-order permits the configuration of units to meet the customized requirements ofour customers.
In both cases, we offer design, integration, test, and other production value-added services. Our inventorymanagement and distribution practices in both build-to-order and engineer-to-order seek to improve customerdelivery performance and minimize inventory holding periods.
6
Intellectual PropertyWhere appropriate, we seek patent protection for inventions and improvements that are likely to be incorporated
into our products or where proprietary rights are expected to improve our competitive position. The highlycustomized application engineering embedded within our products, our proprietary rights, our knowledgecapabilities, and our brand recognition all contribute to enhancing our competitive position.
Although we own and control a significant number of patents, trade secrets, confidential information,trademarks, trade names, copyrights, and other intellectual property rights which, in the aggregate, are of materialimportance to our business, management believes that our Company, as a whole, as well as each of our coresegments, is not materially dependent on any one intellectual property right or related group of such rights. Patents,patent applications, and license agreements will expire or terminate over time by operation of law, in accordancewith their terms or otherwise. As the portfolio of our patents, patent applications, and license agreements hasevolved over a long period of time, we do not expect the expiration of any specific patent or other intellectualproperty right to have a material adverse effect on our financial statements.
Research and DevelopmentResearch and Development (R&D) is key to our strategy and is generally focused on the design of highly
engineered solutions. R&D focuses on developing competitive solutions to address clear needs in the marketsegments we serve. In addition, we work closely with our customers to address their needs by engineering solutionsto fit their particular application, thus enabling our customers to achieve their specific goals. We believe R&D is asource of competitive advantage and, in recent years, we have invested in new product innovation, includingopening new innovation centers in Italy and China to support our R&D efforts. We plan to continue this effort in thefuture. R&D as a percentage of sales was 3.4% during 2021, 2020, and 2019.
Cyclicality and SeasonalityMany of the businesses in which we operate are subject to specific industry and general economic cycles. We
consider our connector products in our CCT segment to be an early-cycle business, meaning it generally isimpacted in the early portion of an economic cycle. Our automotive and aerospace components businesses tend tobe impacted in the middle portion of the cycle, and our industrial pump business typically is impacted late in theeconomic cycle.
Our businesses experience limited seasonal variations. Revenue impacts from the limited seasonal variationsare typically mitigated by our backlog of orders that allows us to adjust levels of production across different periods.
Environmental MattersWe are subject to stringent federal, state, local, and foreign environmental laws and regulations concerning air
emissions, water discharges and waste disposal. In the U.S., these include, but are not limited to, the Federal CleanAir Act, the Clean Water Act, the Resource, Conservation and Recovery Act, and the Comprehensive EnvironmentalResponse, Compensation and Liability Act. Environmental requirements are significant factors affecting ouroperations. We have established an internal program to assess compliance with applicable environmentalrequirements at our facilities. The program, which includes periodic audits of many of our locations, including ourmajor operating facilities, is designed to identify problems in a timely manner, correct deficiencies and prevent futurenoncompliance. ITT's environmental liabilities are, for the most part, not associated with current operating facilities(only two of ITT's 26 locations with environmental liabilities are current operating sites). Additionally, ITT’s diligentapproach to remediation has resulted in a reduction in the number of ongoing environmental remediation matters byapproximately 50% over the past six years.
We closely monitor our environmental responsibilities, together with trends in environmental laws. In addition,we have purchased insurance protection against certain environmental risks arising from our business activities.Environmental laws and regulations are subject to change, and the nature and timing of such changes, if any, isdifficult to predict. As actual costs incurred at identified sites in future periods may vary from our current estimatesgiven the inherent uncertainties in evaluating environmental exposures, management believes it is possible that theoutcome of these uncertainties may have a material adverse effect on our financial statements. For additionalinformation regarding environmental matters, see "Critical Accounting Estimates" within Item 7, Management'sDiscussion and Analysis, Note 20, Commitments and Contingencies, to the Consolidated Financial Statements, andour September 2021 sustainability report, SustainabilITTy 2021 Supplement, which can be found on our website.
Human Capital ManagementIn order to continue innovating in the industries we serve, ITT remains committed to attracting and retaining top
talent. We strive to make ITT a diverse, inclusive, and safe workplace for all, and create a higher performance
7
culture with opportunities and training for employees to develop and grow professionally and personally. In addition,we offer competitive compensation, benefits, and health and wellness programs.
As of December 31, 2021, we had approximately 9,900 employees located in 35 countries, includingapproximately 2,600 employees in the U.S. As of December 31, 2021, approximately 21% of our U.S. employeesare represented by unions. No one unionized facility accounted for more than 11% of ITT's total revenues. Inaddition, many of our global employees are covered by collective agreements or represented by works councils orother groups. We continually focus on building strong relationships with our employees, and we have notexperienced any material strikes or work stoppages in the past several years.
Corporate Governance and Oversight
We believe the success of our business is tied to the strength of our human capital. In order to foster a higher-performance culture, we are committed to maintaining effective strategies to support recruiting and hiring,onboarding and training, compensation planning, performance management, and professional development. Tofacilitate oversight of these matters, our Board of Directors (the “Board”) is composed of highly experienced anddiverse individuals. The role of the Board is to oversee the affairs of the Company, including those pertaining tohuman capital, and to ensure the overall success of the business. The Board and our executive leadership team arecommitted to creating and adhering to policies and practices that will help attract, retain, and develop a workforcealigned with our human capital strategies, goals and values. The Board and executive leadership team also workclosely together to evaluate human capital areas, such as those involving workplace health, safety, and well-being;and to implement measures to support these areas.
Diversity, Equity and Inclusion
Diversity, equity and inclusion (DEI) are key business priorities for ITT and core to our values as a company. Weare committed to fostering an inclusive culture that is fueled by diverse ideas and perspectives, and to leveragingthese differences in ways that positively impact our performance, the engagement of our people, and the globalcommunities in which we operate. Along with this, we demonstrate our commitment to DEI through actions and wealign our efforts to our strategic workplace and marketplace goals. This includes creating an environment where allITTers are able to fully engage, achieve their potential, and freely share ideas to guide us toward innovative thinkingand better business decisions and solutions. It also includes driving practices and programs to build and supportdiverse representation in our employee population, including diversity with regard to race, religion, gender, disability,nationality, age, sexual orientation, ethnic background, and more. For additional information about actions at ITT todrive DEI, along with our diversity metrics and statistics, please refer to our 2019 Sustainability Report and 2020and 2021 annual supplements. Our next sustainability report supplement, to be published in 2022, will provideadditional information about the progress we are making against our DEI strategy, including the diverserepresentation goals we have set for the next five years. We firmly believe we will create more success bycontinuously learning from each other's ideas, opinions and experiences. We also believe that by creating a diverseenvironment, we will sustain and propel our success in the global marketplace to create long-term sustainable valuefor all our stakeholders.
Health, Safety and Well-being
At ITT, the health, safety, and well-being of our employees is our number one priority. Our Environmental,Safety, Health and Security (ESH&S) team provides for the systemic control of workplace risks and drives continualimprovement of environmental and occupational safety and health protocols at all our sites around the world. Wechallenge ourselves to continually reduce injury frequency and severity by engaging employees in our “Accept OnlyZero” safety accountability system and fostering an environment where employees take responsibility for theiractions and have access to tools and training to work safely together.
The COVID-19 pandemic has magnified the importance of keeping our employees safe and healthy. Inresponse to the pandemic, we have taken actions as part of our "Ready, Safe, Go!" program to help protect ourworkforce. We created core crisis teams and enacted safety measures at all of our sites. These measures includedenhanced cleaning protocols, temperature checks, on-site rapid testing, and distribution of personal protectiveequipment and testing kits. We also redesigned employee workspaces to enable social distancing and allowed non-manufacturing employees to work from home when appropriate. As a result of these measures, we have been ableto operate our facilities as safely as reasonably possible under the circumstances.
8

Talent Development
We invest significant resources to develop our talent and to remain a worldwide leader in the manufacturing ofhighly engineered customized products and solutions. We foster employee growth and development by providingnumerous training and experiential opportunities across the globe and by engaging in active talent reviews and in-depth succession planning sessions globally. Our talent development programs provide employees with theresources they need to help achieve their career goals and to build strong management and leadership skills.
Compensation and Benefits
We provide flexible compensation and benefits programs to help meet the needs of our employees. In additionto base salaries, we offer numerous benefits for certain eligible employees, including annual bonuses, stockawards, a 401(k) Plan, healthcare and insurance benefits, health savings and flexible spending accounts, paid timeoff, family leave, flexible work schedules, employee assistance programs, and tuition reimbursement. With respectto stock awards, we have used discretionary equity-based grants with vesting conditions to facilitate the retention ofkey personnel, particularly those identified as high-performing talent.
General Developments of the Business
There have been no acquisitions or significant business developments since our previous Form 10-K filing, withthe exception of the divestiture of InTelCo Management LLC (InTelCo), a former subsidiary which held our asbestos-related assets and liabilities. See Note 20, Commitments and Contingencies, for further information.
9
ITEM 1A. RISK FACTORS
We are subject to a wide range of factors that could materially affect future developments and performance.Because of these factors, past performance may not be a reliable indicator of future results. You should carefullyconsider, together with the other information contained in this Annual Report on Form 10-K, the risks anduncertainties described below. These risks may have an adverse material effect on our reputation, business, resultsof operations, financial condition, or cash flows. In addition to these risks, there may be additional risks anduncertainties that adversely affect our business, performance, or financial condition in the future that are notpresently known, are not currently believed to be significant, or are not identified below because they are commonto most or all companies.
Business and Operating Risks
Our financial results have been, and may continue to be, adversely affected by the COVID-19 pandemic,including as a result of supply chain challenges, restrictions or vaccination requirements imposed by theU.S. or foreign governments, and general market reactions to the risks posed by COVID-19.
The COVID-19 pandemic and the resulting measures enacted by federal, state and local governments to containthe outbreak have caused, and continue to cause, significant disruptions in our businesses and in the globalindustries where we operate. These disruptions have had, and may continue to have, a material adverse effect onour financial condition and results of operations due to the occurrence of the following:
• the emergence of variant strains of the virus, including Delta and Omicron, as well as the timing,effectiveness and availability of, and people’s receptivity to, vaccines or other medical remedies;
• government-mandated site closures, employee illness, skilled labor shortages, the impact of potential travelrestrictions, stay-in-place restrictions, and vaccination requirements on our business and workforce (seerisk factor related to government contracting for additional information);
• missed or late customer deliveries due to labor shortages or disruptions in our global supply chain as aresult of congested shipping ports around the world, delayed supplier deliveries, supplier performance orfinancial concerns, or the inability to procure supplier inputs at reasonable prices or at all; and
• delays in collections or an inability to collect on customer receivables, including due to customer bankruptcy.
With respect to vaccination requirements that could impact our business and workforce, on November 5, 2021,the U.S. Department of Labor’s Occupational Safety and Health Administration (OSHA) published an EmergencyTemporary Standard (ETS) in the Federal Register, mandating either full vaccination or at least weekly testing ofemployees for employers with 100 or more employees. However, following legal challenges, OSHA withdrew theETS and is prioritizing its resources to focus on finalizing a permanent COVID-19 healthcare standard. In addition,in Italy and Germany, which produced sales of 24% and 11% of our consolidated 2021 revenue, respectively, thegovernment has mandated proof of vaccination, a negative rapid swab test, or recent recovery from a COVID-19infection to be able to go to the workplace. These mandates went into effect during the fourth quarter of 2021. At thistime, we cannot predict the scope of any future legislation the U.S. federal government may seek to implementregarding vaccination mandates, or the impact that the Italian or German vaccination mandates, or potential futurelegislation, whether in the U.S. or abroad, may have on our workforce or business operations
The ultimate impact of the COVID-19 pandemic on our operations and financial performance will depend onfuture developments that are not within our control, including, but not limited to, the severity and duration of thepandemic, the availability and effectiveness of vaccines or other medical remedies against COVID-19, theeffectiveness of government stimulus programs, the severity of a resurgence of COVID-19 or new strains of thevirus, the extent to which people continue to work from home, restrictions on or people's attitudes towards travel,and the pace of recovery when the COVID-19 pandemic subsides. At this time, we cannot predict the duration or fullmagnitude of the COVID-19 pandemic, the various governmental containment measures or the resulting disruptionsto our markets and our business. The longer the pandemic continues, including as a result of a resurgence of thevirus or the emergence of a more severe strain of the virus, the more likely that the foregoing risks will be realizedand that other negative impacts on our business will occur, including some that we are unable to currently predict.
10

Our operating results and our ability to maintain liquidity or procure capital have been, and may continue tobe, adversely affected by unfavorable or uncertain global economic and capital market conditions.
We have experienced and expect to continue to experience volatility in revenues, operating results andprofitability due to uncertain global economic and capital market conditions and the COVID-19 pandemic. We haveundertaken measures to reduce the impact of this volatility through diversification of markets and expansion of thegeographic regions in which we operate. The end markets we serve include automotive, aerospace, energy,industrial, mining, chemical, and defense, each of which is impacted by specific industry and general economiccycles. Important factors impacting our businesses include, but are not limited to, the overall strength of the globaleconomy and our customers’ confidence in local and global macroeconomic conditions, industrial spending, taxrates, interest rates, the availability of commercial financing, and regulations and tariffs in the jurisdictions in whichwe operate. Instability in the global credit markets and geopolitical environment in many parts of the world may putpressure on global economic conditions. If global economic and market conditions, or economic conditions in keymarkets or regions deteriorate, we may experience material impacts on our financial statements.
We closely monitor the credit-worthiness of our customers and evaluate their ability to meet their obligations.However, adverse changes to financial conditions could jeopardize these counterparty obligations. A tightening ofcredit markets may reduce funds available to our customers to pay for our products and services for a prolongedand perhaps unknown period of time. Restrictive credit markets may also result in customers extending terms forpayment and may result in us having higher customer receivables with increased risk of default.
Should market conditions deteriorate, this may also adversely affect our ability to manage inventory levels andmaintain current levels of profitability. We could lose access to commercial paper markets or to our currentlyavailable lines of credit. We could be required to raise additional capital and be unable to do so or able to do so onlyon unfavorable terms. Deteriorating market conditions could also indicate an impairment in the value of our goodwilland intangible assets in one or more of our reporting units which would require us to recognize a non-cash chargeto our Statement of Operations. We test both goodwill and intangible assets for impairment on an annual basis andwhenever events or changes in circumstances indicate the carrying value of an asset may not be recoverable. Indoing so, in the first quarter of 2020, we determined that certain intangible assets within our IP segment, includingan indefinite-lived trademark, customer relationships and proprietary technology, would not be recoverable, whichresulted in us recognizing a non-cash charge of $12.3.
Our business has been, and may continue to be, adversely affected by raw material price volatility and theinability of suppliers to meet quality and delivery requirements.
Our business relies on third-party suppliers for raw materials, components and contract manufacturing servicesto produce our products. The supply of raw materials to ITT and to its component parts suppliers has been, and maycontinue to be, interrupted for a variety of reasons, including worldwide supply chain challenges, shipping issues,and demand for and availability of key raw materials. For most of our products, we have existing alternate sourcesof supply, or the required materials have historically been readily available. In limited instances, we depend on asingle source of supply, manufacturing or assembly or participate in commodity markets that may be subject to alimited number of suppliers. Although we believe we could obtain and qualify alternative sources for most sole andlimited source supplier materials, if necessary, the transition to an alternative source could be complex, costly, andprotracted, especially if the change requires us to redesign our systems. Delays in obtaining supplies have resultedfrom, and may continue to result from, a number of factors affecting our suppliers, including the COVID-19pandemic, congested shipping ports around the world, production interruptions, capacity constraints, labor disputesor shortages, the impaired financial condition of a particular supplier, the ability to meet regulatory requirements,and commitments to other purchasers. Any delay in our suppliers’ abilities to provide us with sufficient quality or flowof materials or any supplier price increases, or decreased availability of raw materials or commodities could impairour ability to deliver products to our customers or may significantly impact our profitability. In addition, commodityprices and the prices for other raw materials necessary for production have fluctuated, and may continue tofluctuate, significantly, and in 2021, the increase in raw materials and shipping costs negatively impacted ourfinancial results. We have not always been able to pass along raw material and component price increases to ourcustomers, which has impacted, and may continue to impact, our sales growth and profitability.
Failure to innovate, protect our intellectual property rights, provide high-quality products, or respond tocompetitors could adversely impact our business and financial results.
We believe the principal points of competition in our markets are product performance, reliability and innovation,application expertise, enforcement of intellectual property rights, brand reputation, energy efficiency, product lifecycle cost, timeliness of delivery, proximity of service centers, effectiveness of distribution channels, and price.
11

Maintaining and improving our competitive position will require continued investment by us in manufacturing,research and development, engineering, marketing, customer service and support, and our distribution networks.Insufficient investment in these areas may result in a failure to maintain our competitive position. In addition, ourexisting competitors, or potential new competitors, may develop products that are cheaper and/or superior to ourproducts, or may develop more efficient or effective methods of providing products and services or may adapt morequickly than we do to new technologies or evolving customer requirements. These pressures may result in ushaving to take actions, such as adjusting the prices of certain products, in order to stay competitive.
Obtaining, maintaining and enforcing our proprietary rights is another factor that is critical to the success of ourbusiness and our ability to remain competitive. For certain products and manufacturing processes, we rely onpatents, trademarks, trade secrets, non-disclosure agreements and other contracts to protect these rights. Thesecontracts may be breached, or may not prevent competitors from independently developing or selling similarproducts. In addition, during the normal course of business, we could unintentionally infringe or violate theproprietary rights of others. Intellectual property litigation could be time consuming for management, and couldresult in significant legal expense to either pursue claims against others, or to defend ourselves. If we are unable toprotect our patents, trademarks, or other proprietary rights, or if we infringe or violate the rights of others, our abilityto remain competitive could be adversely impacted.
We manufacture key components that are integral to the operation of systems and manufacturing processes inthe markets we serve. The reliability and performance of our products are critically important to our customers andthe users of their products. Accordingly, quality is extremely important to us and our customers due to the potentiallycostly consequences of product failure. Our quality certifications, including products manufactured to militaryspecifications, are critical to the marketing success of our goods and services. Our success in part depends on ourability to manufacture to exact tolerances precision-engineered components, subassemblies, and finished devicesfrom multiple materials. If our components fail to meet these standards or fail to adapt to evolving standards, wecould damage our reputation as a manufacturer of high-quality components, which could hurt our ability to remaincompetitive and result in a loss of customers, market share, or product sales.
If we are unable to maintain our competitive position, our business, results of operations, or financial conditioncould be materially adversely affected.
Our industry is experiencing a skilled labor shortage and if we are unable to hire and retain key personnel,including senior management and engineering talent, our ability to operate or grow our business could benegatively impacted.
The manufacturing industry is currently experiencing a skilled labor shortage. This shortage has createddifficulties for the Company in attracting and retaining factory employees and in meeting customer demand. Wecurrently have a significant number of open positions and we expect this to remain so in 2022. A failure to attract orretain highly skilled personnel could adversely affect our operating results, our ability to deliver products andservices to our customers, or our ability to grow our business. In addition, the COVID-19 pandemic and publichealth responses to the pandemic, including potential vaccination mandates, could increase employee attrition andmake it more difficult to secure future labor needs. Our future success will continue to depend, to a significantextent, on our ability to attract or retain senior management, engineers, and other key personnel, which will dependon our ability to offer competitive compensation, training, flexibility, and other benefits that prospective employeesdesire.
Our operations could be disrupted and our business could be materially and adversely affected by ourinability to prevent, detect or adequately respond to cyber security breaches.
The efficient operation of our business is dependent on information technology systems, some of which aremanaged by third parties. In the ordinary course of business, we collect and store confidential information, includingproprietary business information belonging to us, our customers, suppliers, business partners and other third partiesand personally identifiable information of our employees.
Our information technology systems and those of third party service providers may be susceptible to damage,disruptions or shutdowns due to power outages, hardware failures, telecommunication failures, cyber-attacks, anduser errors. Although we actively manage the risks to our information systems that are within our control, we canprovide no assurance that our actions or those of our third party service providers will be successful in eliminating ormitigating risks to our systems, networks or data. If we experience a disruption in our information technologysystems, it could result in the loss of sales and customers and significant incremental costs, which could materiallyadversely affect our business. Even the most well-protected information systems are vulnerable to internal andexternal security breaches including, but not limited to, those by computer hackers and cyber terrorists utilizing
12

techniques such as phishing, ransomware, or denial of service attacks. As a provider of products and services togovernment and commercial customers, and particularly as a government contractor, we are subject to aheightened risk of security breaches caused by computer viruses, illegal break-ins or hacking, sabotage, or acts ofvandalism, including by foreign governments and cyber terrorists. Furthermore, information technology securitythreats are increasing in sophistication, intensity, and frequency. A security breach may occur, including breachesthat we may be unable to detect. The unavailability of our information systems, the failure of these systems toperform as anticipated for any reason or any significant breach of security could cause significant disruption to ourbusiness or could result in decreased performance and increased costs.
The processing and storage of certain information is increasingly subject to privacy and data securityregulations, and many such regulations are country-specific. The interpretation and application of data protectionlaws in the U.S., Europe, and elsewhere are uncertain, evolving and may be inconsistent across jurisdictions.Compliance with these various laws may be onerous and require us to incur substantial costs or to change ourbusiness practices in a manner that adversely affects our business, while failure to comply with such laws maysubject us to substantial penalties.
If we are unable to protect sensitive information, our customers or governmental authorities could question theadequacy of our security processes and procedures and our compliance with evolving privacy and data securityregulations and government cyber security requirements for government contractors, potentially causing us to losebusiness. A breach could also result in the loss of our intellectual property, potentially impacting our long-termcapability to compete for sales of affected products. In addition, a breach of security of our information systemscould result in litigation, regulatory action and potential liability, as well as increased costs to implement furtherinformation security measures. If we are unable to prevent, detect or adequately respond to cyber securitybreaches, our operations could be disrupted, our reputation could be harmed and our business could be materiallyand adversely affected.
A significant portion of our revenue is derived from a single customer. Loss of this customer, a loss ofbusiness with this customer, or a reduction in this customer's market share, could adversely impact ourfinancial results.
Sales to Continental, a supplier to the automotive industry and ITT's largest customer, were approximately 10%of our total revenue in 2021. Automaker requests to use ITT brake pads in their Continental-produced brakingsystems (calipers) typically account for approximately half of MT's revenue from Continental. These automakerrequests are generally formalized through supply agreements signed directly between MT and automakers. Theremainder of MT's sales to Continental is generated from a 10-year agreement to supply Continental withaftermarket parts, which is set to expire in 2023. We are currently in discussions with Continental to renew thisagreement, and we anticipate we will reach an agreement with Continental in the near future. The loss of thiscustomer, failure to renew this long-term aftermarket agreement on terms at least as favorable as the currentcontract or at all, or a reduction in this customer's market share could have a material adverse effect on ourbusiness, results of operations, or financial condition.
Due to our operations and sales outside of the U.S., we are subject to inherent business risks, including theimposition of tariffs and significant movements in foreign currency exchange rates, which may adverselyaffect our financial results.
Our international operations, including U.S. exports, comprise a growing portion of our operations and are astrategic focus for continued future growth. Our sales in emerging markets such as Mexico, South America, China,Russia, and the Middle East have been increasing. In 2021, 70% of our total sales were to customers operatingoutside of the United States compared to 67% in 2020. Our sales from international operations and export sales aresubject to varying degrees of risks inherent in doing business outside of the United States. These risks include thefollowing, some of which could be impacted by changes in international trade agreements or the imposition orincrease of tariffs or trade sanctions between the United States and other countries:
• possibility of unfavorable circumstances arising from host country laws or regulations;• restrictions, regulations, or tax liabilities on currency repatriation;• potential negative consequences from changes to taxation policies;• the disruption of operations from labor and political disturbances;• our ability to hire and maintain qualified staff in these regions;• changes in tariffs and trade barriers, sanctioned countries and individuals, and import and export licensingrequirements; and
13

• fluctuations in foreign currency exchange rates
Our operations in emerging markets could involve additional uncertainties, including risks that governments mayimpose limitations or prohibitions on our ability to repatriate funds, impose or increase withholding or other taxes onremittances and other payments to us, seek to nationalize our assets, or impose or increase investment barriers orother restrictions that may adversely affect our business. In addition, emerging markets pose other uncertainties,including challenges to our ability to protect our intellectual property, pressure on the pricing of our products, andrisks of political instability.
Beginning in 2018, the U.S. government undertook a series of actions to increase tariffs on certain goodsimported into the U.S., including steel and aluminum, and in response governments in Europe and China imposedretaliatory tariffs on various goods, including on certain goods we sell into those countries. The tariffs with Europelargely remained in place until the fourth quarter of 2021 and the tariffs with China remain in place. These tariffshave negatively impacted demand for our products as well as the cost of certain parts and materials that wepurchase from vendors located in these countries. We have been mitigating, and will continue attempting tomitigate, the impact of these tariffs by lowering input costs through efficient utilization of our global manufacturingfootprint, supplier and customer negotiations, and diversification strategies. However, we expect that continuedtrade disputes between the U.S. and China and other countries, and other governmental actions related to tariffs orinternational trade agreements or policies may continue to adversely impact demand for our products as well as ourcosts.
The cost of compliance with increasingly complex and often conflicting regulations worldwide can also impairour flexibility in modifying product, marketing, pricing, or other strategies for growing our businesses, as well as ourability to improve productivity and maintain acceptable profit margins.
Because a significant portion of our sales are to customers operating outside the U.S., our financial results areimpacted by foreign currency fluctuations. The primary foreign currencies to which we have exposure are the Euro,Chinese renminbi, Czech koruna, South Korean won, Hong Kong dollar, and Saudi riyal. Any significant change inthe value of currencies of the countries in which we do business relative to the value of the U.S. dollar could impactour ability to sell products or control costs. In addition, our international subsidiaries report their results of operationsand financial position in their respective local currencies (i.e., functional currencies), which are then translated intoU.S. dollars for financial reporting purposes. As the relationship between these foreign currencies and the U.S.dollar changes, our financial results could be adversely affected upon translation. From time to time, we may enterinto derivative contracts to hedge some of these foreign currency exposures. However, our hedging strategy mayfail to reduce our exposure and could even result in an unfavorable impact to our financial results.
Our business is impacted by our customers' levels of capital investment and maintenance expenditures,particularly in the aerospace, energy, chemical, and mining markets.
Demand for certain aerospace and industrial products and services depends on the level of capital investmentand planned maintenance expenditures of our customers which, in turn, depend on general economic conditions,availability of credit, economic conditions within their respective industries, volatility in commodity prices,expectations of future market behavior, and their liquidity and financial position. The ability of our customers tofinance capital investment and maintenance may also be affected by factors independent of the conditions in theirindustries, such as the condition of global credit and capital markets. For example, demand for our aerospaceproducts, including connectors, has historically been driven by demand from the aviation industry for new aircraftand maintenance, repair, and overhaul services, which continue to suffer from reduced global air travel arising fromthe COVID-19 pandemic. Accordingly, some of our customers have chosen to postpone capital investment andmaintenance, and may continue doing so in the future, potentially even during favorable conditions in theirindustries or markets, which has led, and may continue leading, to a delay or cancellation of orders.
Our customer's businesses, particularly those in the energy, chemical, and mining industries, which representedapproximately 8%, 9%, and 3%, respectively, of our 2021 revenue, are to varying degrees cyclical and haveexperienced, and may in the future experience, periodic downturns of varying severity. For example, the volatility ofthe energy market has generally been dependent upon the prevailing view of future gas and oil prices, which areinfluenced by numerous supply and demand factors, including availability and cost of capital, global and domesticeconomic conditions, environmental regulations, policies of the Organization of the Petroleum Exporting Countries(OPEC) countries and Russia, and other factors. Our customers in these industries, particularly those whosedemand for our products and services is primarily profit-driven, historically have tended to delay large capitalprojects, including expensive maintenance and upgrades, during economic downturns. Additionally, fluctuatingenergy demand forecasts and commodity pricing and other macroeconomic factors may cause our customers to bemore conservative in their capital planning, which could reduce demand for our products and services. Reduced
14

demand for our products and services could result in the delay or cancellation of existing orders or lead to excessmanufacturing capacity, which unfavorably impacts our absorption of fixed manufacturing costs. This reduceddemand may also erode average selling prices in our industry. These factors could have a material adverse effecton our business, results of operations and financial condition.
A material business interruption, particularly at one of our manufacturing facilities, could negatively impactour ability to generate sales and meet customer demand.
If operations at one or more of our manufacturing facilities were to be disrupted as a result of an equipmentfailure, natural disaster, power outage, fire, explosion, act of terrorism, war, IT system failure, cyber-attack, adverseweather condition, labor dispute, epidemic or pandemic illness (including without limitation, COVID-19), relocation ofproduction location, or any other reason, our ability to meet customer demand for our products may be impacted.We have business continuity plans in place to mitigate the effects of such interruptions, but these plans may not besufficient to resolve the issues in a timely manner. A significant interruption in production capability could alsorequire us to make substantial payments due to non-performance. We also have insurance for certain coveredlosses which we believe to be adequate to offset a significant portion of the costs for reconstruction of facilities andequipment, as well as certain financial losses resulting from production interruptions or shutdowns. However, anyrecovery under our insurance policies would be subject to deductibles and, depending on the coverage, may notoffset the lost revenues or increased expenses that may be experienced during the disruption of operations.
New or recent mergers or acquisitions could present operational challenges and past divestitures and spin-offs may expose us to potential liabilities, all of which could adversely affect our results of operations andfinancial position.
We regularly review our portfolio of businesses and pursue growth through the acquisition of other companies,assets and product lines that either complement or expand our existing businesses. Although we conduct what webelieve to be a prudent level of investigation regarding the operating and financial condition of the businesses wepurchase, a level of risk remains regarding the actual operating condition of these businesses. Until we actuallyassume operating control of these businesses and their operations, we may not be able to ascertain the actualvalue or understand the potential liabilities of, or challenges facing, the acquired businesses and their operations.Acquisitions involve a number of risks and present financial, managerial and operational challenges that could havea material adverse effect on our reputation, financial results, and business. These include the possibility that:
• an acquired business could under-perform relative to our expectations,• we could fail to realize the expected synergies of an acquisition,• we could experience difficulties in the integration of technology, operations, personnel and financial and
other systems,• we could have acquired substantial undisclosed liabilities,• there could be insufficient internal controls over financial activities or financial reporting at an acquired
company that could impact us on a consolidated basis,• management attention could be diverted from other businesses,• we could lose key employees of the acquired businesses,• we could experience increased capital requirements, and• the acquisition could result in customer dissatisfaction.
We have divested a number of businesses, including as part of spin-offs in 1995 and 2011. With respect tosome of these former businesses, we have contractually agreed to indemnify the counterparties against, orotherwise retain, certain liabilities, including, certain lawsuits, tax liabilities, product liability claims, andenvironmental matters. Even without ongoing contractual indemnification obligations, we could be exposed toliabilities arising out of such divestitures. In addition, the counterparties to those divestitures may have agreed toindemnify us or assume certain liabilities relating to those divestitures. However, there can be no assurance that theindemnity or assumption of liability by the counterparties will be sufficient to protect us against the full amount ofthese liabilities, or that a counterparty will be able to fully satisfy its obligations. Third parties also could seek to holdus responsible for any of the liabilities that a counterparty agreed to assume. Even if we ultimately succeed inrecovering any amounts for which we were initially held liable, we may be temporarily required to bear these lossesourselves. From time to time, we make minority investments in other companies and we risk losing part or all of ourcapital in any such investment.
15
Increased scrutiny from investors, lenders, and other market participants regarding our environmental,social and governance, or sustainability responsibilities could expose us to additional costs and adverselyimpact our liquidity, results of operations, reputation, employee retention, and share price.
There is an increasing focus from certain investors, customers and other key stakeholders on corporateresponsibility, specifically related to environmental, social and governance (ESG) matters, including climate change.Some investors have used, and may continue to use, ESG criteria to guide their investment strategies and, in somecases, have chosen, and may continue to choose, not to invest in ITT, or to divest their holdings of ITT, if theybelieve our policies relating to corporate responsibility are inadequate.
The ESG factors by which companies’ corporate responsibility practices are assessed have been evolving andmay continue to evolve. Additionally, the requirements of U.S. public companies in regards to ESG compliance hasbeen increasing and may continue to increase. This has resulted in greater expectations of us and have caused us,and may continue causing us, to undertake costly initiatives to satisfy such new criteria. If we are unable to satisfynew corporate responsibility criteria, investors may conclude our policies with respect to corporate responsibility areinadequate. We risk damage to our brand and reputation in the event that our corporate responsibility procedures orstandards do not meet the standards set by various constituencies. Furthermore, if our competitors’ corporateresponsibility performance is perceived to be greater than ours, potential or current investors may elect to investwith our competitors instead, which we have experienced to date. In addition, in the event we communicate certaininitiatives and goals regarding ESG matters, we could fail, or be perceived to fail, in our achievement of suchinitiatives or goals, or we could be criticized for the scope of such initiatives or goals. If we fail to satisfy theexpectations of investors and other key stakeholders or our initiatives are not executed as planned, our reputation,employee retention and the willingness of our customers and suppliers to do business with us, financial results, andshare price could be materially and adversely affected.
Legal and Regulatory Risks
We are subject to risks related to government contracting, including changes in levels of governmentspending and regulatory and contractual requirements applicable to sales to the U.S. government.
Our Connect & Control Technologies and Motion Technologies segments derive a portion of their revenue fromsales to U.S. government customers and higher tier contractors who sell to the U.S. government. The government'sexpenditures are subject to political and budgetary fluctuations and constraints, which may result in significantunexpected changes in levels of demand for our products. In addition, the award, administration and performance ofgovernment contracts is subject to regulatory and contractual requirements that differ significantly from the termsand conditions that apply to contracts with our non-governmental customers. We have in the past and may in thefuture be subject to audits and investigations to evaluate our compliance with these requirements. If we are found tohave failed to comply with requirements applicable to government contractors, we may be subject to variousactions, including but not limited to fines or penalties, reductions in the value of our government contracts,restrictions on the sale of certain products to the government, or suspension or debarment from governmentcontracting. Failure to comply with applicable requirements also could harm our reputation and our ability tocompete for future government contracts or sell equivalent commercial products.
On September 9, 2021, U.S. President Biden issued an executive order requiring all employers with U.S.government contracts to ensure that their U.S.-based employees, contractors, and subcontractors, that work on orin support of U.S. government contracts, are fully vaccinated by December 8, 2021, and it only permits limitedexceptions for medical and religious reasons. The deadline date was ultimately adjusted to January 18, 2022.However, a federal court in Georgia has subsequently issued a nationwide injunction that bars the federalgovernment from enforcing vaccine mandate clauses in covered contracts and subcontracts during the pendency ofthe case. At this time, we cannot predict whether the executive order will withstand judicial scrutiny or when it mightbe enforced, whether the federal government will seek to pass new legislation regarding vaccine mandates, or theimpact the order or potential future legislation or similar mandates issued in other jurisdictions where we havegovernment contracts may have on our workforce or business operations.
If we are not able to meet the requirements for government contractors, we may lose orders, which could havea material adverse effect on our business, financial condition, and results of operations.
16

Changes in our effective tax rates as a result of changes in the realizability of our deferred tax assets, thegeographic mix of earnings, tax examinations or disputes, tax authority rulings, or changes in the tax laws,may adversely affect our financial results.
The Company is subject to taxes in the U.S. and in various foreign jurisdictions. We exercise significantjudgment in calculating our provision for income taxes and other tax liabilities. In the ordinary course of ourbusiness, there are many transactions and calculations where the ultimate tax determination is uncertain. Changesin domestic or foreign tax laws and regulations, or their interpretation, could result in higher or lower tax ratesassessed or changes in the taxability of certain income or the deductibility of certain expenses, thereby affecting ourtax expense and profitability. Any significant increase in our future effective tax rates could reduce net income infuture periods. Given the global nature of our business, a number of factors may increase our future effective taxrates, including changes in the geographic mix of our profits among jurisdictions with differing statutory income taxrates; sustainability of historical income tax rates in the jurisdictions in which we conduct business; changes in taxlaws applicable to us; expiration, renewal, or application of tax holidays; the resolution of issues arising from taxaudits with various tax authorities; or changes in the valuation of our deferred tax assets, deferred tax liabilities, anddeferred tax asset valuation allowances.
The amount of income taxes and other taxes we have paid are subject to ongoing audits by U.S. federal, state,and local tax authorities and by non-U.S. authorities. If these audits result in assessments different from amountspaid or reserved, future financial results may include unfavorable tax adjustments. We are currently under routineexamination by the U.S. Internal Revenue Service and other U.S. and non-U.S. tax authorities, and we may besubject to additional examinations in the future. The tax authorities may disagree with our tax treatment of certainmaterial items and thereby increase our tax liability. Failure to sustain our position in these matters could result in amaterial adverse effect on our financial statements.
We are closely monitoring the potential passage of new U.S. tax legislation, which could result in substantialchanges to the current U.S. tax system, including changes to the statutory corporate tax rate. In addition, we areevaluating changes in tax laws resulting from the Organization for Economic Cooperation and Development’s(OECD) multi-jurisdictional plan of action to address base erosion and profit shifting. These changes could have amaterial adverse effect on our effective tax rate. As the effects of a change in U.S. tax law must be recognized in theperiod in which the new legislation is enacted, should new legislation be signed into law, our financial results couldbe materially impacted.
Changes in environmental laws or regulations, the discovery of previously unknown or more extensivecontamination, or the failure of a potentially responsible party to perform may adversely affect our financialresults.
We are subject to a variety of federal, state, local and foreign laws, rules and regulations related to the use,storage, handling, discharge or disposal of certain toxic, volatile or otherwise hazardous chemicals, gases and othersubstances used in manufacturing our products that could require us to incur substantial expenses. Environmentallaws and regulations allow for the assessment of substantial fines and criminal sanctions as well as facilityshutdowns to address violations, and may require the installation of costly pollution control equipment or operationalchanges to limit emissions or discharges. The discovery of previously unknown or more extensive contamination ata site which the Company previously operated or currently operates could suddenly subject the Company to costlyremediation efforts. We could be affected directly or indirectly through impacts on our customers and suppliers bychanges in environmental laws or regulations, including, for example, those imposed in response to vapor intrusionor climate change concerns and violations by us of such laws and regulations. We may also be impacted by theadequacy of insurance policies, our inability to recover costs associated with any such developments, or financialinsolvency of other potentially responsible parties which could have a material adverse effect on our business,financial condition and results of operations. In addition, new laws and regulations that might favor the increaseduse of non-fossil fuels, including nuclear, wind, solar and bio-fuels or that are designed to increase energy efficiency,could reduce demand for oil and gas production or power generation resulting in lower spending by our IPcustomers.
17

Failure to comply with the U.S. Foreign Corrupt Practices Act or other applicable anti-corruption legislation,as well as export controls and trade sanctions, could result in fines or criminal penalties.
We operate in a number of countries throughout the world, including countries known to have a reputation forcorruption. We are committed to doing business in accordance with applicable anti-corruption laws. However, wecannot provide assurance that our internal controls will always protect us from reckless or criminal acts committedby our employees, agents or business partners that would violate U.S. and/or applicable non-U.S. laws, includinganti-bribery, competition, trade sanctions and regulation, and other laws including but not limited to, the U.S. ForeignCorrupt Practices Act of 1977 and the U.K. Bribery Act of 2010, as well as trade sanctions administered by theOffice of Foreign Assets Control, the U.S. Department of State and the U.S. Department of Commerce. Any suchviolation could result in substantial fines, sanctions, civil and/or criminal penalties, suspension or debarment fromgovernment contracts, or curtailment of operations in certain jurisdictions, and might adversely affect our business,financial condition or results of operations or financial position. Furthermore, detecting, investigating, and resolvingactual or alleged violations is expensive and can consume significant time and attention of our senior management.Even the allegation or appearance of our employees, agents or business partners acting improperly or illegallycould damage our reputation and result in significant expenditures in investigating and responding to such actions.
We are subject to laws, regulations and potential claims relating to product liability.
Our business exposes us to potential product liability risks that are inherent in the design, manufacture, andmarketing of products for the markets we serve. In addition, many of the devices we manufacture and sell arecritical components designed to be used in harsh environments for long periods of time where the cost of failure ishigh. Component failures, manufacturing defects, design flaws, or inadequate disclosure of product-related risks orproduct-related information could result in an unsafe condition or injury to, or death of, an end-user of our products.The occurrence of such a problem could result in product liability claims or a recall of, or safety alert relating to, oneor more of our products which could ultimately result, in certain cases, in the removal of such products from themarketplace and claims regarding costs associated therewith. Product liability claims or product recalls in the future,regardless of their ultimate outcome, could have an adverse effect on our reputation and on our ability to attract andretain customers for our products.
Anti-takeover provisions in our organizational documents and Indiana law could delay or prevent a changein control.
Certain provisions of our articles of incorporation and by-laws may delay or prevent a merger or acquisition thata shareholder may consider favorable. For example, the articles of incorporation authorize our Board of Directors toissue one or more series of preferred stock. Such provisions may also discourage acquisition proposals or delay orprevent a change in control, which could harm our stock price. Indiana law also imposes some restrictions onmergers and other business combinations between any holder of 10% or more of our outstanding common stockand us as well as certain restrictions on the voting rights of "control shares" of an "issuing public corporation."
18

ITEM 1B. UNRESOLVED STAFF COMMENTS
None.
ITEM 2. PROPERTIES
We own or lease over 100 manufacturing plants, warehouses, service centers, and sales and administrativeoffices to support our operations. These properties are located in various regions around the world, including NorthAmerica, Europe, Asia, South America and the Middle East. We consider these properties to be in good conditionwith sufficient capacity to accommodate the Company’s needs.
The following table summarizes the number of our material properties (other than our corporate headquarters)by business segment as of December 31, 2021. We consider our properties containing 25,000 square feet or more,which primarily consist of manufacturing locations, to be material. Our material properties account for over 90% ofthe total square feet of our properties.
MotionTechnologies
IndustrialProcess
Connect & ControlTechnologies Total
Number of Owned Locations 13 11 5 29Number of Leased Locations 9 21 5 35Total Locations 22 32 10 64
Additionally, our corporate headquarters is located in White Plains, New York and is approximately 50,000square feet. In October 2020, we signed a lease to relocate our corporate headquarters to Stamford, Connecticut.We expect to move to the new location in the second quarter of 2022.
ITEM 3. LEGAL PROCEEDINGS
From time to time, we are involved in legal proceedings that are incidental to the operation of our businesses.Some of these proceedings allege damages relating to environmental exposure, intellectual property matters,copyright infringement, personal injury claims, employment and employee benefit matters, government contractissues and commercial or contractual disputes and acquisitions or divestitures. Descriptions of certain legalproceedings to which the Company is a party are contained in Note 20, Commitments and Contingencies, to theConsolidated Financial Statements.
As described in Note 20, Commitments and Contingencies, on July 1, 2021, we completed the divestiture ofInTelCo Management LLC (InTelCo), a former subsidiary which held our asbestos-related assets and liabilities. Inconnection with the divestiture, we contributed approximately $398 to InTelCo. Under the purchase agreement, thebuyer and InTelCo agreed to indemnify the Company and its affiliates for all asbestos-related and other productliabilities, while the Company agreed to indemnify InTelCo and its affiliates for all other historical liabilities ofInTelCo, which includes any losses with respect to release of, or exposure to, hazardous materials. Theseindemnification obligations are not subject to any cap or time limitation. As a result of the divestiture, we believe wehave resolved our involvement in material legal proceedings related to asbestos exposure.
19

INFORMATION ABOUT OUR EXECUTIVE OFFICERSThe executive officers of the Company as of February 1, 2022, are listed below.
Name Age Current TitleLuca Savi 56 President and Chief Executive OfficerDavide Barbon 52 Senior Vice President and President, Asia PacificJohn Capela 42 Vice President and Chief Accounting OfficerEmmanuel Caprais 47 Senior Vice President and Chief Financial OfficerRyan F. Flynn 50 Senior Vice President and President, Connect & Control TechnologiesCarlo Ghirardo 51 Senior Vice President and President, Motion TechnologiesMary Elizabeth Gustafsson 62 Senior Vice President and General Counsel and Corporate SecretaryMaurine C. Lembesis 55 Senior Vice President and Chief Human Resources OfficerBartek Makowiecki 43 Senior Vice President, Strategy and Business DevelopmentDavid Steblein 67 Senior Vice President and President, Industrial Process
Luca Savi has served as our Chief Executive Officer, President and a director of the Company since January 2019.He previously served as President and Chief Operating Officer of the Company from August 2018 to December2018 and as Executive Vice President and Chief Operating Officer from January 2017 to August 2018. Prior tothat, he served as Executive Vice President, Motion Technologies from February 2016 to January 2017 and asSenior Vice President and President, Motion Technologies from November 2011 to February 2016. Prior tojoining ITT, Mr. Savi served as Chief Operating Officer, Comau Body Welding at Comau, a subsidiary of the FiatGroup responsible for producing and serving advanced manufacturing systems, from 2009 to 2011 and as ChiefExecutive Officer, Comau North America from 2007 to 2009. Mr. Savi previously held leadership roles atHoneywell International, Royal Dutch Shell and technical roles at Ferruzzi-Montedison Group. Mr. Savi iscurrently a director of MSA Safety Inc. and serves on their compensation committee.
Davide Barbon has served as our Senior Vice President and President, Asia Pacific Region since October 2020. Hepreviously served as General Manager of the KONI and Axtone businesses within Motion Technologies fromJanuary 2017. Mr. Barbon joined the Company in 2010, initially serving in the Brazil, Russia, India and China(BRIC) business of Motion Technologies, and then led its China business for five years. Prior to joining ITT, hespent 14 years with JLG Industries, where he had a number of roles of increasing responsibility across theUnited States, Europe, and Latin America.
John Capela has served as our Vice President and Chief Accounting Officer since November 2018. Prior to joiningITT, he served as Executive Vice President, Chief Accounting Officer and Corporate Controller of Toys “R” Us,Inc. from May 2018 to November 2018 and as Vice President and Corporate Controller from March 2018 to May2018. Prior to that, Mr. Capela served as Vice President and Assistant Controller from May 2015 to March 2018and held various other positions of increasing levels of responsibility at Toys “R” Us, Inc. Prior to joining Toys“R” Us, Inc. in March 2007, Mr. Capela spent several years with PricewaterhouseCoopers LLP in its auditpractice. Mr. Capela is also a Certified Public Accountant and a Chartered Global Management Accountant.
Emmanuel Caprais has served as our Senior Vice President and Chief Financial Officer since October 2020. Hepreviously served as Vice President of Finance and Group Chief Financial Officer, in charge of the Company’sbusiness unit finance teams, Financial Planning & Analysis and Investor Relations for the company. Mr. Capraisjoined ITT in 2012, at which time he served as segment Chief Financial Officer of Motion Technologies and laterIndustrial Process. Prior to joining ITT, Mr. Caprais held leadership roles in finance at Marelli, and earlier heldpositions of increasing responsibility in finance at Valeo across North America and Europe.
Ryan F. Flynn has served as Senior Vice President and President, Connect and Control Technologies since October2020. Prior to that, Mr. Flynn was Senior Vice President and President, Asia Pacific Region from January 2019.He previously served as General Manager of Motion Technologies China from 2016. Prior to joining ITT, Mr.Flynn served as Executive Vice President and Head of Business Area Equipment for Konecranes from 2013 to2016 and held various other positions with Konecranes including the Asia-Pacific President and Director for itsPort Cranes & Lifttrucks businesses in Asia from 2005 to 2013.
20

Carlo Ghirardo has served as our Senior Vice President and President, Motion Technologies since April 2018. Priorto joining ITT, he served as President of Eaton’s Vehicle Group EMEA region since 2017. He also served asVice President and General Manager of Eaton’s Engine Air Management Product Group from 2015, as VicePresident and General Manager of Eaton’s Valvetrain Division from 2010, as well as holding various otherexecutive roles in global operations from 2003. Prior to that, Mr. Ghirardo held leadership positions at UnitedTechnologies Corporation and Michelin. He also acquired lean manufacturing consulting and projectmanagement experience with Galgano & Associati working in transformation projects across Europe.
Mary Elizabeth Gustafsson has served as our Senior Vice President and General Counsel since February 2014.She has also served as our Corporate Secretary since April 2019 and as our Chief Compliance Officer fromAugust 2014 through July 2021. Prior to joining ITT, Ms. Gustafsson served as Executive Vice President,General Counsel and Corporate Secretary of First Solar Inc. from 2009 to 2013 and from 2008 to 2009 as VicePresident, General Counsel. Prior to that Ms. Gustafsson was Senior Vice President, General Counsel andSecretary of American Standard Companies, Inc. from 2005 to 2008.
Maurine C. Lembesis has served as our Senior Vice President and Chief Human Resources Officer since January2019. She joined ITT in 2013 and previously served as Vice President and Corporate Human ResourcesBusiness Partner and prior to that as Executive Director, Corporate Human Resources. Prior to joining ITT, sheheld roles of increasing responsibility in Human Resources at Avon Products Inc., including the role of ExecutiveDirector of Human Resources. In addition, Ms. Lembesis held various other human resources roles at CapitalGroup Companies, Pfizer Inc. and GE Capital.
Bartek Makowiecki has served as our Senior Vice President, Strategy and Business Development since September2021. Prior to joining ITT, he served as Global Head of Strategy, M&A and Venturing of Ingredion Incorporatedfrom October 2017 to September 2021. Immediately prior, he served as Director, Corporate Strategy & Head ofM&A at Owens Corning from November 2015 to October 2017. Prior to that, Mr. Makowiecki held roles ofincreasing responsibility in global strategy and M&A at Parker-Hannifin Corporation from August 2003 toOctober 2015.
David Steblein has served as our Senior Vice President and President, Industrial Process since April 2021. Hepreviously served as Vice President and General Manager, Americas for Industrial Process after rejoining theCompany in May 2007. Prior to joining ITT, he held general manager, sales, and marketing leadership positionsat SPX Corporation and Emerson Electric, and earlier in his career held various roles of increasing responsibilityat IP's Goulds Pumps.
ITEM 4. MINE SAFETY DISCLOSURESNot applicable.
21

PART II
ITEM 5. MARKET FOR REGISTRANT'S COMMON EQUITY, RELATED STOCKHOLDERMATTERS AND ISSUER PURCHASES OF EQUITY SECURITIES
COMMON STOCK AND DIVIDENDSOur common stock is reported in the consolidated transaction reporting system of the New York Stock
Exchange (NYSE), the principal market in which this security is traded (under the trading symbol "ITT"). There wereapproximately 6,364 holders of record of our common stock on February 14, 2022.
The amount and timing of dividends payable on our common stock are within the sole discretion of our Board ofDirectors and will be based on, and affected by, a number of factors, including our financial position and results ofoperations, available cash, expected capital spending plans, prevailing business conditions, and other factors theBoard deems relevant. Therefore, we cannot provide any assurance as to what level of dividends, if any, will be paidin the future.
During the fiscal year ended December 31, 2021, no equity securities of the Company were sold by theCompany that were not registered under the Securities Act.
ISSUER PURCHASES OF EQUITY SECURITIES
On October 30, 2019, the Board of Directors approved an indefinite term $500 share repurchase program (the2019 Plan). We continue to utilize the 2019 Plan in a manner that is consistent with our capital allocation process,which has centered on those investments necessary to grow our businesses organically and through acquisitions,while also providing cash returns to shareholders. The following table summarizes our purchases of our commonstock for the quarter ended December 31, 2021.
(IN MILLIONS, EXCEPT PER SHAREAMOUNTS)
PERIOD
TOTALNUMBEROF SHARESPURCHASED
AVERAGEPRICEPAID
PER SHARE(1)
TOTAL NUMBER OFSHARES PURCHASED ASPART OF PUBLICLY
ANNOUNCED PLANS ORPROGRAMS
APPROXIMATE DOLLARVALUE OF SHARES THATMAY YET BE PURCHASEDUNDER THE PLANS OR
PROGRAMS10/1/2021 - 10/31/2021 — $ — — $388.711/1/2021 - 11/30/2021 — $ — — $388.712/1/2021 - 12/31/2021 0.1 $ 94.73 0.1 $384.0
(1) Average price paid per share is calculated on a settlement basis and includes commissions.
22

COMPANY STOCK PERFORMANCE
The following graph shows a comparison of the cumulative total shareholder return for ITT, the S&P 400 MidCap Index, and the S&P 400 Capital Goods Index over the five years ended December 31, 2021. It shows the shareprice appreciation of a $100 investment made on December 31, 2016, assuming any dividends paid are reinvested.
COMPARISON OF CUMULATIVE FIVE-YEAR TOTAL RETURN
ITT Inc. S&P 400 Mid-Cap S&P 400 Capital Goods
2016 2017 2018 2019 2020 2021$75
$100
$125
$150
$175
$200
$225
$250
$275
$300
12/31/2016 12/31/2017 12/31/2018 12/31/2019 12/31/2020 12/31/2021ITT Inc. $ 100.00 $ 140.06 $ 127.93 $ 197.75 $ 208.47 $ 279.29S&P 400 Mid-Cap $ 100.00 $ 116.23 $ 103.33 $ 130.37 $ 148.16 $ 184.81S&P 400 Capital Goods $ 100.00 $ 124.69 $ 107.22 $ 142.34 $ 170.58 $ 217.77
This graph is not, and is not intended to be, indicative of future performance of our common stock. This graphshall not be deemed "filed" with the SEC or subject to the liabilities of Section 18 of the Exchange Act, and shouldnot be deemed to be incorporated by reference into any of our prior or subsequent filings under the Securities Act.
ITEM 6. SELECTED FINANCIAL DATA
Not applicable.
23

ITEM 7. MANAGEMENT'S DISCUSSION & ANALYSIS OF FINANCIAL CONDITION ANDRESULTS OF OPERATIONS
The following discussion should be read in conjunction with the consolidated financial statements and the notesrelated thereto. As we noted earlier in the Forward-Looking and Cautionary Statements of this Annual Report onForm 10-K, this Part II, Item 7, Management’s Discussion and Analysis of Financial Condition and Results ofOperations, and Part II, Item 7A, Quantitative and Qualitative Disclosures about Market Risk (along with othersections of this Annual Report), may contain forward-looking statements. The risks discussed in Part I, Item 1A, RiskFactors, and other risks identified in this Annual Report on Form 10-K could cause our actual results to differmaterially from those expressed by such forward-looking statements.
All comparisons included within this Part II, Item 7, Management’s Discussion and Analysis of FinancialCondition and Results of Operations, refer to results for the year ended December 31, 2021 compared to the yearended December 31, 2020, unless stated otherwise. Additionally, all financial results and share repurchases arereported in millions, unless stated otherwise. Please refer to our Annual Report on Form 10-K (2020 Annual Report)for a discussion of the year ended December 31, 2020 compared to the year ended December 31, 2019.
OVERVIEWITT Inc., through its worldwide subsidiaries, is a diversified manufacturer of highly engineered critical
components and customized technology solutions for the transportation, industrial and energy markets. Our productand service offerings are organized into three segments: Motion Technologies (MT), Industrial Process (IP), andConnect & Control Technologies (CCT). We refer you to Part I, Item 1, Description of Business for a further overviewof our company, segments, products and service offerings, and other information about the business.
EXECUTIVE SUMMARY
In 2021 we delivered strong results, which included double-digit revenue growth, 400 basis points of segmentoperating margin expansion, and effective deployment of capital. The following table provides a summary of keyperformance indicators for 2021 in comparison to 2020.
Summary of Key Performance Indicators for 2021
RevenueSegment Operating
IncomeIncome from
Continuing Operations EPS$2,765 $467 $315 $3.64
12% Increase 47% Increase 360% Increase 367% Increase
Organic RevenueAdjusted SegmentOperating Income
Adjusted Income fromContinuing Operations
AdjustedEPS
$2,717 $477 $351 $4.05
10% Increase 27% Increase 26% Increase 27% Increase
See the section titled "Key Performance Indicators and Non-GAAP Measures" for a definition and reconciliationof organic revenue, adjusted segment operating income, adjusted income from continuing operations, and adjustedEPS.
Our 2021 results include:
• Revenue of $2,765.0 increased $287.2, including favorable foreign exchange of $48.1. Organic revenueimproved 9.6% as a result of strong top-line performance within our MT and CCT segments. MTexperienced significant growth in its Friction business, which continued to outperform the global automotivemarket, while CCT saw strong growth in connector sales.
• Segment operating income of $466.7 increased $148.1, primarily driven by higher sales volume, strategiccommercial actions, a reduction in restructuring costs, prior year asset impairment charges, and savingsfrom productivity actions. The increase was partially offset by supply chain disruptions resulting in increasedraw material and shipping costs, strategic growth investments and a reversal of temporary cost reductionsthat were executed in 2020.
24

• Income from continuing operations of $314.8 increased $246.3, primarily due to higher segment operatingincome, prior year pension settlement charges of $108.2, net of tax (see Note 16, Postretirement BenefitPlans) and prior year asbestos charges of $48.9, net of tax (see Note 20, Commitments andContingencies). During 2021, we divested our entire net asbestos liability, which resulted in an after-tax lossof $28.1. Consequently, earnings per diluted share increased from $0.78 to $3.64.
In 2021, we were focused on execution and value-creation, while managing the continued challenges causedby the COVID-19 pandemic. We implemented strategic actions to minimize the impact of disruption to our globalsupply chain. The following examples highlight some of the strategic actions we took during the year to position usfor continued success:
• We invested in additional capacity at our Friction plants to support the automotive share gains achieved withnew and existing customers, including content on over 30 electric vehicle platforms.
• We continue to extend and accelerate value-analysis-value engineering (VA/VE) product redesign, whichnow encompasses 30% of IP's product portfolio.
• We divested our legacy asbestos liabilities, reducing our overall risk profile and allowing us additionalflexibility without the time and resource constraints associated with having to manage these long-termliabilities.
In addition to the above strategic deployments of capital, during 2021 we repurchased 1.2 shares of commonstock on the open market for $105 and paid out $76 in dividends to our shareholders. Our dividends declared in2021 of $0.88 per share represented a 30% increase over the dividends per share declared in 2020.
COVID-19 Update:
During 2021, we continued to be proactive in our response to the challenges stemming from the COVID-19pandemic. We worked closely with our suppliers in an effort to minimize disruptions within our global supply chain,which included limited availability and inflationary pressures on key raw materials, supplier and shipping delays, andindustry-wide shortages of skilled labor. We worked closely with customers to minimize these disruptions andimplemented strategic commercial actions to mitigate the impact of rising material and shipping costs. As a result,we have been able to deliver for our customers and cultivate growth opportunities despite this challengingmacroeconomic environment.
Future impacts of COVID-19 on our business and financials remain uncertain and will be dependent on theduration of the COVID-19 pandemic, including variant strains of the virus, the timing, effectiveness, and availabilityof, and people’s receptivity to, vaccines or other medical remedies, potential impacts from any mandatoryvaccination requirements, and our ability to respond to future challenges posed by the pandemic. See Part II, Item1A, Risk Factors, for an additional discussion of risk related to COVID-19.
DISCUSSION OF FINANCIAL RESULTS2021 VERSUS 2020For the Year Ended December 31 2021 2020 ChangeRevenue $ 2,765.0 $2,477.8 11.6 %Gross profit 899.5 782.2 15.0 %Gross margin 32.5 % 31.6 % 90 bpOperating expenses 395.2 555.7 (28.9) %Operating expense to revenue ratio 14.3 % 22.4 % (810)bpOperating income 504.3 226.5 122.6 %Operating margin 18.2 % 9.1 % 910 bpInterest and non-operating (income) expense, net (4.8) 141.3 (103.4) %Income tax expense 189.6 15.3 1,139.2 %Effective tax rate 37.2 % 18.0 % 1,920 bpIncome from continuing operations attributable to ITT Inc. 314.8 68.5 359.6 %Net income attributable to ITT Inc. $ 316.3 $ 72.5 336.3 %
All comparisons included within the Discussion of Financial Results for 2021 versus 2020 refer to results for theyear ended December 31, 2021 compared to the year ended December 31, 2020, unless stated otherwise.
25

REVENUEThe following table summarizes the revenue derived from each of our segments.
For the Year Ended December 31 2021 2020 Change
Organicgrowth
(decline)(a)
Motion Technologies $ 1,368.6 $ 1,121.1 22.1 % 18.5 %Industrial Process 843.2 843.0 — % (0.7)%Connect & Control Technologies 554.7 516.5 7.4 % 7.0 %Eliminations (1.5) (2.8)Total Revenue $ 2,765.0 $ 2,477.8 11.6 % 9.6 %
(a) See the section titled "Key Performance Indicators and Non-GAAP Measures" for a definition and reconciliation of organicrevenue.
Motion Technologies
MT revenue for the year ended December 31, 2021 increased $247.5. Excluding the impact of favorable foreigncurrency translation of $39.9, organic revenue increased $207.6, primarily due to growth in our Friction business of21% driven by continued OE outperformance versus automotive production rates and strength in aftermarket. Inaddition, our Wolverine business grew 17% driven by strength in sealings. Our KONI & Axtone business grew 4%driven by strength in automotive aftermarket equipment, partially offset by a decline in rail.
The automotive industry experienced a global semiconductor supply shortage throughout 2021. The shortagecontinues to create supply chain disruptions and production declines for our automotive OEM customers. As aresult, demand for our OEM brake pads and parts was and may continue to be adversely affected until the shortageis resolved. Although this shortage has had and may continue to have a negative impact on revenue, we continue tosignificantly outperform automotive production rates globally.
Industrial Process
IP revenue for the year ended December 31, 2021 increased $0.2. Excluding the impact of favorable foreigncurrency translation of $6.3, organic revenue decreased $6.1 primarily driven by a decline in sales of baselinepumps of 7% mainly within the chemical and energy markets. Additionally, pump projects decreased 5% primarilywithin the chemical and mining markets. This was partially offset by growth in parts and valves across all endmarkets.
The level of order and shipment activity at IP can vary significantly from period to period due to pump projectswhich are highly engineered, customized to customer needs, and have longer lead times. Total IP orders during2021 were $940.8, an increase of 17.9% compared to the prior year, including $251.6 of orders in the fourth quarter,which represents 37.0% growth from last year. IP's backlog as of December 31, 2021 was $444.4, reflecting anincrease of $77.0, or 21.0%, compared to December 31, 2020. Our backlog represents firm orders that have beenreceived, acknowledged, and entered into our production systems.
Connect & Control Technologies
CCT revenue for the year ended December 31, 2021 increased $38.2. Excluding the impact of favorable foreigncurrency impact of $1.9, organic revenue increased $36.3 driven by growth in connector sales of 20%. Thisincrease was partially offset by an 11% decline in component sales, primarily within the aerospace market. Althoughwe have seen an increase in commercial air travel, we do not expect to see a significant improvement in aerospacesales until the second half of 2022, at the earliest, given what we believe are high levels of inventory that airframerscontinue to work through.
26

GROSS PROFITGross profit for 2021 was $899.5, reflecting a gross margin of 32.5%. Gross profit for 2020 was $782.2,
reflecting a gross margin of 31.6%. The increase in gross profit was primarily driven by higher sales volume,productivity savings and strategic commercial actions. These items were partially offset by increases in rawmaterial, shipping, and labor costs, as discussed further below.
Since 2020, the cost of raw materials, including commodities such as steel, that we use in our productionprocesses has significantly increased. The rising prices are mainly a result of increased demand fueled byeconomic recovery from the COVID-19 pandemic, as well as lower supply since global production capacity was cutin 2020. The impact of higher commodity prices on our financial results during 2021 was partially mitigated by fixed-price supply contracts with suppliers, especially in the first half of 2021. The expiration of these fixed-price contracts,continued raw materials inflation, and supply constraints may continue to unfavorably impact our financial resultsduring 2022. We have been able to offset some of this impact through strategic commercial actions and productivitysavings, which we will continue pursuing in 2022.
During 2021, worldwide supply chain challenges exacerbated by the COVID-19 pandemic and the rising demandfor physical goods have created upward pressure on shipping costs globally. These supply chain disruptions havecontributed to congested shipping ports around the world, causing shipping delays and, in many cases, additionalcosts to be incurred in order to meet customer demand. As a result of these external pressures, our shipping costs,including for inbound and outbound freight, have increased as compared to the prior year, which has negativelyimpacted our gross profit. At this time, we are unable to predict when these issues will be resolved. Continuedsupply chain challenges could have a material impact on our future financial results.
The manufacturing industry is also currently experiencing a skilled labor shortage. This shortage has createddifficulties for the Company in attracting and retaining factory employees and in meeting customer demand,resulting in additional labor costs. In addition, in Italy and Germany, which produced sales of 24% and 11% of ourconsolidated 2021 revenue, respectively, the government has mandated proof of vaccination, a negative rapid swabtest, or recent recovery from COVID-19 to be able to go to the workplace. These mandates went into effect duringthe fourth quarter of 2021, and could create further employee attrition and difficulty in securing future labor needs. Ifsimilar mandates to the Italian or German mandates are issued in the U.S. or other jurisdictions in which weoperate, similar attrition and employment issues may arise. As a result of these circumstances, our financial resultshave been, and may continue to be, negatively impacted. For additional information regarding the government-mandate on COVID-19 vaccination, see Part II, Item 1A, Risk Factors.
OPERATING EXPENSES
The following table provides further information by expense type, as well as a breakdown of operating expenseby segment.
For the Year Ended December 31 2021 2020 ChangeGeneral and administrative expenses $ 214.3 $ 198.7 7.9 %Sales and marketing expenses 150.8 146.5 2.9 %Research and development expenses 94.9 84.9 11.8 %Asbestos-related (benefit) costs, net (74.4) 66.3 (212.2)%Restructuring costs 9.6 43.0 (77.7)%Asset impairment charges — 16.3 (100.0)%Total operating expenses $ 395.2 $ 555.7 (28.9)%By Segment:Motion Technologies $ 158.0 $ 150.5 5.0 %Industrial Process 155.8 197.8 (21.2)%Connect & Control Technologies 119.0 115.3 3.2 %Corporate & Other (37.6) 92.1 (140.8)%
27

General and administrative (G&A) expenses for the year ended December 31, 2021 increased $15.6. Theincrease was primarily due to higher personnel costs, which was partially the result of temporary cost actions in theprior year taken in response to the COVID-19 pandemic, which included a temporary reduction in executivecompensation and suspension of select 401(k) benefits for certain U.S. employees that were reinstated for 2021.Last year, we also benefited from higher employee retention credits in connection with the Coronavirus Aid, Relief,and Economic Security Act (the 2020 CARES Act). Additionally, environmental costs were higher in 2021 by $5.8,primarily due to prior-year insurance-related recoveries.
The increase in G&A expenses was partially offset by favorable foreign currency impact of $9.5, lower bad debtexpense of $8.2, and a land sale gain of $7.0.
Sales and marketing expenses for the year ended December 31, 2021 increased $4.3, primarily driven byhigher incentive-based compensation in the current year, as well as prior year discretionary spending reductionsand temporary personnel cost actions taken in response to the COVID-19 pandemic.
Research and development (R&D) expenses for the year ended December 31, 2021 increased $10.0 due tocontinued strategic investments in innovation and new product development to drive future growth.
Asbestos-related matters resulted in a net benefit of $74.4 for the year ended December 31, 2021, due to therecognition of a pre-tax gain of $88.8 from the divestiture of InTelCo, which was executed on July 1, 2021. Duringthe year ended December 31, 2020, we recognized costs of $135.9 related to extending our projection period toinclude pending claims and claims expected to be filed through 2052, reflecting the full time period over which weexpected asbestos claims to be filed against InTelCo. The prior year benefited from insurance settlementagreements resulting in a net gain of $100.4. The following table summarizes our total net asbestos-relatedcharges.
For the Year Ended December 31 2021 2020 ChangeAsbestos provision, net $ 14.4 $ 30.8 $ (16.4)Gain on divestiture before tax (88.8) — (88.8)Asbestos remeasurement, net — 135.9 (135.9)Settlement agreements — (100.4) 100.4Asbestos-related (benefit) costs, net $ (74.4) $ 66.3 $ (140.7)
See Note 20, Commitments and Contingencies, to the Consolidated Condensed Financial Statements for furtherinformation.
Restructuring costs decreased $33.4 during the year ended December 31, 2021. Restructuring costs recordedin the prior year were mainly related to cost actions taken as part of our 2020 Global Restructuring Plan, which wasan organizational-wide restructuring to reduce the overall cost structure of the Company in response to thechallenges caused by the COVID-19 pandemic. See Note 5, Restructuring Actions, to the Consolidated CondensedFinancial Statements for further information.
Asset impairment charges during the year ended December 31, 2020 were related to a business within IP thatprimarily serves the global upstream oil and gas market. See Note 11, Plant, Property and Equipment, Net, andNote 12, Goodwill and Other Intangible Assets, Net, to the Consolidated Condensed Financial Statements forfurther information.
28

OPERATING INCOME
The following table summarizes our operating income and operating margin by segment.
For the Year Ended December 31 2021 2020 ChangeMotion Technologies $ 258.2 $ 184.0 40.3 %Industrial Process 126.8 77.6 63.4 %Connect & Control Technologies 81.7 57.0 43.3 %Segment operating income 466.7 318.6 46.5 %Asbestos-related benefit (costs), net 74.4 (66.3) 212.2 %Other corporate costs (36.8) (25.8) (42.6) %Total corporate and other benefit (costs), net 37.6 (92.1) 140.8 %Total operating income $ 504.3 $ 226.5 122.6 %Operating margin:Motion Technologies 18.9 % 16.4 % 250 bpIndustrial Process 15.0 % 9.2 % 580 bpConnect & Control Technologies 14.7 % 11.0 % 370 bpSegment operating margin 16.9 % 12.9 % 400 bpConsolidated operating margin 18.2 % 9.1 % 910 bp
MT operating income for the year ended December 31, 2021 increased $74.2 primarily due to higher salesvolume, strategic commercial actions, savings from net productivity, lower restructuring costs of $8.8, and a gain onsale of land of $7.0. The increase was partially offset by higher raw material costs, which were due to supply chainchallenges, and strategic investments to drive future growth.
IP operating income for the year ended December 31, 2021 increased $49.2. The increase in operating incomewas primarily driven by net productivity savings, lower restructuring costs of $16.4, prior year asset impairments of$16.3, and a reduction in bad debt expense of $7.4 mainly from collections of aged receivables. The increase waspartially offset by unfavorable raw material, shipping, and labor costs.
CCT operating income for the year ended December 31, 2021 increased $24.7, driven by savings from netproductivity, higher sales volume, and lower restructuring costs of $6.1. The increase was partially offset by higherraw material costs.
Other corporate costs, net, increased $11.0 primarily driven by higher personnel costs, which was partially theresult of temporary prior year cost actions taken in response to the COVID-19 pandemic. The increase in othercorporate costs was also attributable to higher environmental-related costs of $5.6, which was primarily driven byinsurance-related recoveries in the prior year.
INTEREST AND NON-OPERATING (INCOME) EXPENSE, NET
The following table summarizes our interest and non-operating (income) expense, net.
For the Year Ended December 31 2021 2020 ChangeInterest (income), net $ (1.1) $ (0.7) 57.1 %Miscellaneous (income), net (2.4) (2.2) 9.1 %Non-operating postretirement (benefit) costs, net (1.3) 144.2 (100.9)%Total interest and non-operating (income) expense, net $ (4.8) $ 141.3 (103.4)%
The decrease in non-operating postretirement costs was due to the termination of our U.S. qualified pensionplan and transfer of the plan's liabilities to an insurance company in the prior year. In connection with thetermination, we recognized a settlement charge of $136.9, which primarily represents the acceleration of deferredcharges previously accrued in accumulated other comprehensive loss and derecognition of the net assets of theplan. See Note 16, Postretirement Benefit Plans, to the Consolidated Condensed Financial Statements for furtherinformation.
29

INCOME TAX EXPENSE
The following table summarizes our income tax expense and effective tax rate.
For the Year Ended December 31 2021 2020 ChangeIncome tax expense $189.6 $ 15.3 1,139.2 %Effective tax rate 37.2 % 18.0 % 1,920 bp
The higher effective tax rate in 2021 compared to 2020 resulted from the Company recording tax expense onthe reversal of previously recorded deferred tax assets of $116.9 resulting from the Company's divestiture of theentity holding asbestos-related assets and liabilities (see Note 20, Commitments and Contingencies, for furtherinformation). The lower effective rate in 2020 included a benefit of $25.9 resulting from an internal reorganization inEurope. The reorganization increased projections of future earnings, which will result in the realization of a portionof our deferred tax assets. This benefit was partially offset by the recognition of a $21.7 valuation allowance on ourGermany and UK entities.
The Company’s financial condition and results of operations have been and may continue to be adverselyaffected by the COVID-19 pandemic and the governmental and market reactions to COVID-19. The impacts onearnings have already had, and may continue to have, an impact on the Company’s overall effective tax rate.
We operate in various tax jurisdictions and are subject to examination by tax authorities in these jurisdictions. Weare currently under examination in several jurisdictions including the Czech Republic, Germany, Hong Kong, India,Italy, Japan, the U.S. and Venezuela. The calculation of our tax liability for unrecognized tax benefits includesdealing with uncertainties in the application of complex tax laws and regulations in various tax jurisdictions. Due tothe complexity of some uncertainties, the ultimate resolution may result in a payment that is materially different fromour current estimate of the unrecognized tax benefit. Over the next 12 months, the net amount of the tax liability forunrecognized tax benefits in foreign and domestic jurisdictions could change by approximately $1 due to changes inaudit status, expiration of statutes of limitations and other events.
See Note 6, Income Taxes, to the Consolidated Financial Statements for further information on tax-relatedmatters.
LIQUIDITY AND CAPITAL RESOURCESFunding and Liquidity StrategyWe monitor our funding needs and execute strategies to meet overall liquidity requirements, including the
management of our capital structure, on both a short- and long-term basis. Significant factors that affect our overallmanagement of liquidity include our cash flow from operations, credit ratings, the availability of commercial paper,access to bank lines of credit, term loans, and the ability to attract long-term capital on satisfactory terms. Weassess these factors along with current market conditions on a continuous basis, and as a result, may alter the mixof our short- and long-term financing when it is advantageous to do so. We expect to have enough liquidity to fundoperations for at least the next 12 months and beyond.
We manage our worldwide cash requirements considering available funds among the many subsidiaries throughwhich we conduct business and the cost effectiveness with which those funds can be accessed. We have identifiedand continue to look for opportunities to access cash balances in excess of local operating requirements to meetour global liquidity needs in a cost-efficient manner. We plan to continue transferring cash between certaininternational subsidiaries and the U.S. when it is cost effective to do so. We will also continue to support growth andexpansion in markets outside of the U.S. through the enhancement of existing products and development of newproducts, increased capital spending, and potential foreign acquisitions. Net cash distributions from foreigncountries to the U.S. during the years ended December 31, 2021 and 2020 were $116.9 and $498.2, respectively. In2020, we distributed a larger amount of cash as a precautionary measure in response to the COVID-19 pandemic.The timing and amount of any additional future distributions remains under evaluation based on our jurisdictionalcash needs.
The Company continues to evaluate the various global governmental programs instituted in response toCOVID-19, including the American Rescue Plan Act of 2021 (ARPA). ARPA builds upon many of the measures inthe 2020 CARES Act and the Consolidated Appropriations Act of 2020, and generally provides for various workforceincentives, including an employee retention credit. However, on November 15, 2021, President Biden signed intolaw the Infrastructure Investment and Jobs Act, which repealed the employee retention credit effective September
30

30, 2021. During the years ended December 31, 2021 and 2020, the Company recognized a benefit withinoperating income of $5.1 and $10.4, respectively, related to the employee retention credit. As of December 31,2021, we have not incurred any borrowings under governmental loan programs. We continue to monitor the effectsthat ARPA, the 2020 CARES Act, and other similar legislation globally may have on our liquidity position.
The amount and timing of dividends payable on our common stock are within the sole discretion of our Board ofDirectors and will be based on, and affected by, a number of factors, including our financial position and results ofoperations, available cash, expected capital spending plans, prevailing business conditions, and other factors theBoard of Directors deems relevant. Therefore, we cannot provide any assurance as to what level of dividends, ifany, will be paid in the future. Aggregate dividends paid in 2021 were $75.8, compared to $59.0 in 2020, reflectingannual per share amounts of $0.880 and $0.676, respectively. In the first quarter of 2022, we declared a quarterlydividend of $0.26 per share for shareholders of record on March 9, 2022, which will be paid on April 4, 2022.
In 2021 and 2020, we repurchased and retired 1.2 and 1.7 shares of common stock for $104.8 and $73.2,respectively, under our share repurchase plans. Separate from our share repurchase plans, the Companyrepurchased 0.1 shares and 0.2 shares for an aggregate price of $11.7 and $11.0 during 2021 and 2020,respectively, in settlement of employee tax withholding obligations due upon the vesting of RSUs and PSUs. Allrepurchased shares are canceled immediately following the repurchases.
Commercial PaperWhen available and economically feasible, we have accessed the commercial paper market through programs in
place in the U.S. and Europe to supplement cash flows generated internally and to provide additional short-termfunding for strategic investments and other funding requirements. We manage our short-term liquidity through theuse of our commercial paper program by adjusting the level of commercial paper borrowings as opportunities todeploy additional capital arise and it is cost effective to do so. As of December 31, 2021, we had total commercialpaper outstanding of $195.4, issued through both the Company's U.S. and Euro programs. We had $150.0 ofcommercial paper outstanding under the U.S. program, which was used to partially fund the divestiture of the entityholding legacy asbestos-related assets and liabilities (see Note 20, Commitments and Contingencies). We had$45.4 of commercial paper outstanding under the Euro program. As of December 31, 2020, we had commercialpaper outstanding of $104.3, issued entirely under the Company's Euro program. All outstanding commercial paperfor both periods had maturity terms less than three months from the date of issuance. Our average daily outstandingcommercial paper balance for the years ended 2021 and 2020 was $133.5 and $76.4, respectively, and themaximum outstanding commercial paper during each of those respective years was $197.5 and $159.1.
Revolving Credit Agreement
On August 5, 2021, we entered into a revolving credit facility agreement with a syndicate of third party lendersincluding Bank of America, N.A., as administrative agent (the 2021 Revolving Credit Agreement). The 2021Revolving Credit Agreement matures in August 2026 and provides for an aggregate principal amount of up to $700of (i) revolving extensions of credit (the revolving loans) outstanding at any time, and (ii) letters of credit for a faceamount up to $100 at any time outstanding. Subject to certain conditions, we are permitted to terminatepermanently the total commitments and reduce commitments by a minimum aggregate amount of $10 or any wholemultiple of $1 in excess thereof. Borrowings under the credit facility are available in U.S. dollars, Euros, Britishpound sterling or any other currency that may be requested by us, subject to the approval of the administrativeagent and each lender. We are permitted to request that lenders increase the commitments under the facility by upto $350 for a maximum aggregate principal amount of $1,050; however, this is subject to certain conditions andtherefore may not be available to us. As of December 31, 2021 and 2020, we had no outstanding borrowings underthe current or former revolving credit agreements. See Note 15, Debt, to the Consolidated Condensed FinancialStatements for further information.
The Company's ability to access the global capital markets and the related cost of financing is dependent upon,among other factors, the Company's credit ratings. Our credit ratings as of December 31, 2021 were as follows:
Rating AgencyShort-TermRatings
Long-TermRatings
Standard & Poor’s A-2 BBBMoody’s Investors Service P-2 Baa2Fitch Ratings F2 BBB+
There were no changes to our credit ratings during 2021. Please refer to the rating agency websites and pressreleases for more information.
31

Sources and Uses of LiquidityOur principal source of liquidity is our cash flow generated from operating activities, which provides us with the
ability to meet the majority of our short-term funding requirements. The following table summarizes net cash derivedfrom operating, investing, and financing activities for the years ended December 31, 2021 and 2020.
2021 2020Operating activities $ (8.4) $ 435.9Investing activities (82.3) (65.8)Financing activities (99.8) (158.6)Foreign exchange (22.6) 35.2Total net cash flow provided by continuing operations $ (213.1) $ 246.7
Operating ActivitiesThe decrease in net cash from operating activities of $444.3 was primarily due to a one-time cash payment of
$398.0 related to the divestiture of the entity holding legacy asbestos-related assets and liabilities. In addition, wemade working capital investments in our business to support sales growth. These items were partially offset by anincrease in segment operating income.
Investing ActivitiesThe increase in net cash used in investing activities of $16.5 was driven by an increase in capital expenditures of
$24.7 to support future growth initiatives, partially offset by cash proceeds of $7.1 related to a sale of land within ourMT segment.
Financing ActivitiesThe decrease in net cash used in financing activities of $58.8 was primarily driven by an increase in net
commercial paper borrowings of $82.3 and prior year revolver repayments, net of borrowings, of $28.9. This waspartially offset by an increase in repurchases of ITT common stock of $32.3 and dividends paid of $16.8.
Asbestos
During 2021, we completed the divestiture of InTelCo Management LLC (InTelCo), a former subsidiary whichholds our legacy asbestos-related assets and liabilities, relieving us from any obligation with respect to pending andfuture asbestos claims. In connection with the divestiture, we contributed approximately $398 to InTelCo. As a resultof the divestiture transaction, we will no longer incur any asbestos-related cash outflows. See Note 20,Commitments and Contingencies, for additional information.
Funding of Postretirement Plans
The following table provides a summary of the funded status of our postretirement benefit plans as ofDecember 31, 2021 and 2020.
2021 2020U.S.
PensionNon-U.S.Pension
OtherBenefits Total
U.S.Pension
Non-U.S.Pension
OtherBenefits Total
Fair value of plan assets $ — $ 0.5 $ — $ 0.5 $ — $ 0.5 $ — $ 0.5Projected benefit obligation 14.8 93.1 106.4 214.3 15.5 109.0 118.3 242.8Funded status $ (14.8) $ (92.6) $ (106.4) $ (213.8) $ (15.5) $ (108.5) $ (118.3) $ (242.3)
32
In 2020, we completed the termination of our U.S. qualified pension plan by providing lump sum payments toeligible participants who elected to receive them, and by purchasing a group annuity contract from MassMutual LifeInsurance Company (MassMutual) for the remaining projected benefit obligation. The termination was funded withplan assets of approximately $320 and cash of $8.4. Our non-U.S. pension plans, which are typically not fundeddue to local regulations, had a decline in projected benefit obligation of $15.9 during 2021, primarily due to a higherdiscount rate and favorable foreign currency translation. Our other employee-related benefit plans are generallyunfunded plans as well. The projected benefit obligation of these plans declined by $11.9 during 2021 primarily dueto an increase in the discount rate.
Contributions to our U.S. and non-U.S. pension and other postretirement plans were $10.5 and $18.0 during2021 and 2020, respectively, which were used to fund participant benefits. We currently estimate 2022 contributionsto our pension and other postretirement benefits plans of $14.
See Note 16, Postretirement Benefit Plans, for additional financial information related to our postretirementobligations.
Capital Resources
Long-term debt is generally defined as any debt with an original maturity greater than 12 months. As ofDecember 31, 2021, we have access to short- and long-term funding sources. These include access to the capitalmarkets through a commercial paper program, as well as $700 of available borrowing capacity under our 2021Revolving Credit Agreement, which may potentially be expanded to $1,050 under the agreement. In addition, wehave market access to secure longer-term funding, if needed. Our commercial paper program is supported by our2021 Revolving Credit Agreement and our policy is to maintain unused committed bank lines of credit in an amountgreater than outstanding commercial paper balances.
The table below provides long-term debt outstanding as of December 31, 2021 and 2020.
2021 2020Current portion of long-term debt $ 2.2 $ 2.5Non-current portion of long-term debt 9.9 13.0Total long-term debt $ 12.1 $ 15.5
Contractual Obligations
The following table summarizes ITT’s commitment to make future payments under long-term contractualobligations as of December 31, 2021.
Payments Due By Period
TotalLess Than1 Year 1-3 Years 3-5 Years
More Than5 Years
Long-term debt $ 12.1 $ 2.2 $ 4.5 $ 5.4 $ —Operating leases 91.8 19.9 31.2 19.3 21.4Purchase obligations(a) 137.3 134.4 2.9 — —Postretirement benefit payments(b) 213.8 14.1 25.3 23.5 150.9Other long-term obligations(c) 71.8 6.8 10.5 10.4 44.1Total $ 526.8 $ 177.4 $ 74.4 $ 58.6 $ 216.4
In addition to the amounts presented in the table above, we have recorded liabilities for uncertain tax positionsof $2.8 in our Consolidated Balance Sheet at December 31, 2021. This amount has been excluded from thecontractual obligations table due to an inability to reasonably estimate the timing of payments in individual years.
(a) Represents unconditional purchase agreements that are enforceable and legally binding and that specify allsignificant terms to purchase goods or services, including fixed or minimum quantities to be purchased; fixed,minimum or variable price provisions; and the approximate timing of the transaction. Purchase agreementsthat are cancellable without penalty have been excluded.
(b) Represents the projected timing of payments for benefits earned to date and the expectation that certainfuture service will be earned by current active employees for our pension and other employee-related benefitplans. See Note 16, Postretirement Benefit Plans, for additional financial information related to ourpostretirement obligations.
33

(c) Other long-term obligations include amounts recorded on our December 31, 2021 Consolidated BalanceSheet, including estimated environmental payments and employee compensation agreements. We estimatebased on historical experience that we will spend approximately $4 per year on environmental investigationand remediation. A portion of our environmental investigation and remediation costs are legally mandatedthrough various orders and agreements with state and federal oversight agencies. At December 31, 2021, ourrecorded environmental liability was $54.1. See Note 20, Commitments and Contingencies, to theConsolidated Financial Statements for further information.
Off-Balance Sheet Arrangements
Off-balance sheet arrangements represent transactions, agreements or other contractual arrangements withunconsolidated entities, where an obligation or contingent interest exists. Our off-balance sheet arrangements, as ofDecember 31, 2021, consist of indemnities related to acquisition and disposition agreements and certain third-partyguarantees.
Indemnities
Since our founding in 1920, we have acquired and disposed of numerous businesses. The related acquisitionand disposition agreements allocate certain assets and liabilities among the parties and contain variousrepresentation and warranty clauses and may provide indemnities for a misrepresentation or breach of therepresentations and warranties by either party or for assumed or excluded liabilities. These provisions address avariety of subjects. The term and monetary amounts of each such provision are defined in the specific agreementsand may be affected by various conditions and external factors. Many of the provisions have expired either byoperation of law or as a result of the terms of the agreement. We do not have a liability recorded for these expiredprovisions and are not aware of any claims or other information that would give rise to material payments undersuch provisions.
Guarantees
We had $129.4 of guarantees, letters of credit and similar arrangements outstanding at December 31, 2021,primarily pertaining to commercial or performance guarantees and insurance matters. We have not recorded anymaterial loss contingencies under these guarantees, letters of credit and similar arrangements as of December 31,2021 as the likelihood of nonperformance by the underlying obligors is considered remote. From time to time, wemay provide certain third-party guarantees that may be affected by various conditions and external factors, some ofwhich could require that payments be made under such guarantees. We do not consider the maximum exposure orcurrent recorded liabilities under our third-party guarantees to be material either individually or in the aggregate. Wedo not believe such payments would have a material adverse impact on our financial statements.
34
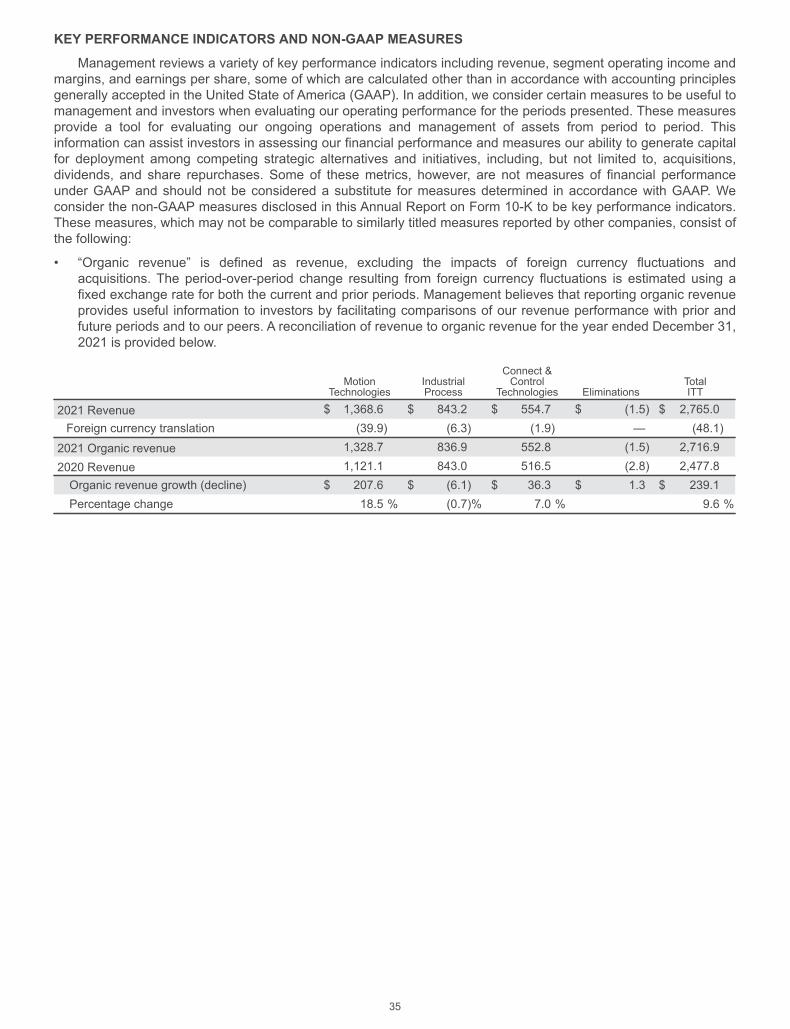
KEY PERFORMANCE INDICATORS AND NON-GAAP MEASURES
Management reviews a variety of key performance indicators including revenue, segment operating income andmargins, and earnings per share, some of which are calculated other than in accordance with accounting principlesgenerally accepted in the United State of America (GAAP). In addition, we consider certain measures to be useful tomanagement and investors when evaluating our operating performance for the periods presented. These measuresprovide a tool for evaluating our ongoing operations and management of assets from period to period. Thisinformation can assist investors in assessing our financial performance and measures our ability to generate capitalfor deployment among competing strategic alternatives and initiatives, including, but not limited to, acquisitions,dividends, and share repurchases. Some of these metrics, however, are not measures of financial performanceunder GAAP and should not be considered a substitute for measures determined in accordance with GAAP. Weconsider the non-GAAP measures disclosed in this Annual Report on Form 10-K to be key performance indicators.These measures, which may not be comparable to similarly titled measures reported by other companies, consist ofthe following:
• “Organic revenue” is defined as revenue, excluding the impacts of foreign currency fluctuations andacquisitions. The period-over-period change resulting from foreign currency fluctuations is estimated using afixed exchange rate for both the current and prior periods. Management believes that reporting organic revenueprovides useful information to investors by facilitating comparisons of our revenue performance with prior andfuture periods and to our peers. A reconciliation of revenue to organic revenue for the year ended December 31,2021 is provided below.
MotionTechnologies
IndustrialProcess
Connect &Control
Technologies EliminationsTotalITT
2021 Revenue $ 1,368.6 $ 843.2 $ 554.7 $ (1.5) $ 2,765.0Foreign currency translation (39.9) (6.3) (1.9) — (48.1)
2021 Organic revenue 1,328.7 836.9 552.8 (1.5) 2,716.9
2020 Revenue 1,121.1 843.0 516.5 (2.8) 2,477.8Organic revenue growth (decline) $ 207.6 $ (6.1) $ 36.3 $ 1.3 $ 239.1Percentage change 18.5 % (0.7)% 7.0 % 9.6 %
35

• “Adjusted operating income” and “Adjusted segment operating income” are defined as operating income,adjusted to exclude special items that include, but are not limited to, asbestos-related impacts, restructuring,certain asset impairment charges, certain acquisition-related impacts, and unusual or infrequent operatingitems. Special items represent charges or credits that impact current results, which management views asunrelated to the Company’s ongoing operations and performance. “Adjusted operating margin” and “Adjustedsegment operating margin” are defined as adjusted operating income or adjusted segment operating incomedivided by revenue. We believe that these financial measures are useful to investors and other users of ourfinancial statements in evaluating ongoing operating profitability, as well as in evaluating operating performancein relation to our competitors.A reconciliation of operating income to adjusted operating income for the years ended December 31, 2021 and
2020 are provided in the tables below.
Year Ended December 31, 2021Motion
TechnologiesIndustrialProcess
Connect &Control
TechnologiesTotal
Segment Corporate ITT Inc.Operating income $ 258.2 $ 126.8 $ 81.7 $ 466.7 $ 37.6 $ 504.3Asbestos-related benefit, net — — — — (74.4) (74.4)Restructuring costs 3.9 3.1 2.4 9.4 0.2 9.6Other(b) — 0.6 — 0.6 2.5 3.1
Adjusted operating income (loss) $ 262.1 $ 130.5 $ 84.1 $ 476.7 $ (34.1) $ 442.6Adjusted operating margin 19.2 % 15.5 % 15.2 % 17.2 % N/A 16.0 %
Year Ended December 31, 2020Operating income (loss) $ 184.0 $ 77.6 $ 57.0 $ 318.6 $ (92.1) $ 226.5Asbestos-related costs, net — — — — 66.3 66.3Restructuring costs 12.7 19.5 8.5 40.7 2.3 43.0Asset impairment charges(a) — 16.3 — 16.3 — 16.3Other(b) — 0.6 0.2 0.8 2.8 3.6Adjusted operating income (loss) $ 196.7 $ 114.0 $ 65.7 $ 376.4 $ (20.7) $ 355.7
Adjusted operating margin 17.5 % 13.5 % 12.7 % 15.2 % N/A 14.4 %
(a) Asset impairment charges in 2020 are related to a business within IP that primarily serves the global upstream oil andgas market.
(b) Other costs at Corporate primarily reflects accelerated amortization of an intangible asset.
36

• “Adjusted income from continuing operations” is defined as income from continuing operations attributable toITT Inc. adjusted to exclude special items that include, but are not limited to, asbestos-related impacts,restructuring, certain asset impairment charges, pension termination and settlement impacts, certainacquisition-related impacts, income tax settlements or adjustments, and unusual or infrequent items. Specialitems represent charges or credits, on an after-tax basis, that impact current results, which management viewsas unrelated to the Company’s ongoing operations and performance. The after-tax basis of each special item isdetermined using the jurisdictional tax rate of where the expense or benefit occurred. “Adjusted income fromcontinuing operations per diluted share” (Adjusted EPS) is defined as adjusted income from continuingoperations divided by diluted weighted average common shares outstanding. We believe that adjusted incomefrom continuing operations and adjusted EPS are useful to investors and other users of our financial statementsin evaluating ongoing operating profitability, as well as in evaluating operating performance in relation to ourcompetitors.A reconciliation of adjusted income from continuing operations, including adjusted earnings per diluted share, to
income from continuing operations and income from continuing operations per diluted share for the years endedDecember 31, 2021 and 2020 are provided in the table below.
2021 2020
Income from continuing operations attributable to ITT Inc. $ 314.8 $ 68.5Net asbestos-related costs, net of tax expense (benefit) of $113.5 and ($17.4), respectively 39.1 48.9Restructuring costs, net of tax benefit of $2.4 and $7.1, respectively 7.2 35.9Pension termination and related (benefit) costs, net of tax expense (benefit) of $0.8 and ($33.4),respectively (2.6) 108.2Asset impairment charges, net of tax benefit of $0.0 and $0.2, respectively(a) — 16.1Tax-related special items(b) (10.5) (1.3)Other costs, net of tax benefit of $0.6 and $0.7, respectively(c) 2.5 2.9
Adjusted income from continuing operations $ 350.5 $ 279.2Income from continuing operations attributable to ITT Inc. per diluted share (EPS) $ 3.64 $ 0.78Adjusted EPS $ 4.05 $ 3.20
(a) Asset impairment charges in 2020 are related to a business within IP that primarily serves the global upstream oil and gasmarket.
(b) The following table details significant components of the tax-related special items. See Note 6, Income Taxes, toConsolidated Financial Statements for further information.
2021 2020Charge on undistributed foreign earnings $ 4.0 $ 6.3Change in deferred tax asset valuation allowance (1.9) (6.2)Change in uncertain tax positions (15.3) (4.4)Other 2.7 3.0Net tax-related special items $ (10.5) $ (1.3)
(c) Other costs primarily relates to accelerated amortization of certain intangible assets.
37

CRITICAL ACCOUNTING ESTIMATESThe preparation of financial statements and related disclosures in accordance with GAAP requires us to make
judgments, estimates and assumptions that affect the amounts reported in the financial statements andaccompanying notes. Significant accounting policies used in the preparation of the financial statements arediscussed in Note 1, Description of Business, Basis of Presentation and Summary of Significant AccountingPolicies, to the Consolidated Financial Statements. An accounting policy is deemed critical if it requires anaccounting estimate to be made based on assumptions about matters that are highly uncertain at the time theestimate is made, if different estimates reasonably could have been used, or if changes to the estimate that arereasonably possible could materially affect the financial statements. Senior management has discussed thedevelopment, selection and disclosure of these estimates with the Audit Committee of ITT’s Board of Directors.
The accounting estimates and assumptions discussed below are those that we consider most critical to fullyunderstanding our financial statements and evaluating our results as they are inherently uncertain, involve the mostsubjective or complex judgments, include areas where different estimates reasonably could have been used, andthe use of an alternative estimate that is reasonably possible could materially affect the financial statements. Webase our estimates on historical experience and other data and assumptions believed to be reasonable under thecircumstances, the results of which form the basis for making judgments about the carrying values of assets andliabilities that are not readily apparent from other sources. Management believes the accounting estimatesemployed and the resulting balances reported in the Consolidated Financial Statements are reasonable; however,actual results could differ materially from our estimates and assumptions.
Revenue Recognition
Revenue is derived from the sale of products and services to customers. We recognize revenue to depict thetransfer of promised goods or services to customers in an amount that reflects the consideration to which we expectto be entitled in exchange for those goods or services. For product sales, other than certain long-term constructionand production type contracts where we have no alternative use for the product and have an enforceable right topayment, we recognize revenue at the time control of our promised goods or services passes to the customer,generally when products are shipped and the contractual terms have been fulfilled.
We recognize revenue for certain highly customized long-term design and build projects using the cost-to-costmethod, based upon the percentage of costs incurred to total projected costs. Revenue and profit recognized underthe cost-to-cost method are based on management’s estimates of measures such as total contract revenues,contract costs and the extent of progress toward completion. Due to the long-term nature of the contracts, theseestimates are subject to uncertainties and require significant judgment. Estimates of contract costs include laborhours and rates, and material costs. These estimates consider historical performance, the complexity of the work tobe performed, the estimated time to complete the project, and other economic factors such as inflation and marketrates. We update our estimates on a periodic basis and any revisions to such estimates are recorded in earnings inthe period in which they are determined. Provisions for estimated losses, if any, on uncompleted long-termcontracts, are made in the period in which such losses are determined.
For contracts recognized at a point in time, provisions for estimated losses, if any, on uncompletedarrangements, are recognized in the period in which such losses are determined. These estimates are subject touncertainties and require significant judgment. They may consider historical performance, the complexity of thework to be performed, the estimated time to complete the project, and other economic factors such as inflation.
Additionally, accruals for estimated expenses related to sales returns and warranties are made at the timeproducts are sold. Reserves for sales returns, rebates and other allowances are established using historicalinformation on the frequency of returns for a particular product and period over which products can be returned. Fordistributors and resellers, our typical return period is less than 180 days. Future market conditions and producttransitions may require us to take actions to increase customer incentive offerings, possibly resulting in a reductionin revenue at the time the incentive is offered.
Warranty accruals are established using historical information on the nature, frequency, and average cost ofwarranty claims and estimates of future costs. Our standard product warranty terms generally include post-salessupport and repairs or replacement of a product at no additional charge for a specified period of time. Although weengage in extensive product quality programs and processes, we base our estimated warranty obligation on productwarranty terms offered to customers, ongoing product failure rates, materials usage, service delivery costs incurredin correcting a product failure, and specific product class failures outside of our baseline experience and associatedoverhead costs. If actual product failure rates, repair rates, or any other post-sales support costs differ from theseestimates, revisions to the estimated warranty liability would be required.
38

For certain highly complex contracts, design, engineering, and other preproduction costs may be capitalized ifthe costs relate directly to a contract or anticipated contract that the entity can specifically identify, the costsgenerate or enhance resources of the entity that will be used in satisfying performance obligations in the future andthe costs are expected to be recovered. In addition to direct labor and materials to fulfill a contract or anticipatedcontract, we exercise judgment in determining which costs are allocated, including allocations of contractmanagement and depreciation of tooling used to fulfill the contract. Additionally, overall contract profitability isestimated in determining cost recoverability.
Income Taxes
Deferred income tax assets and liabilities are determined based on the estimated future tax effects ofdifferences between the financial reporting and tax bases of assets and liabilities, applying currently enacted taxrates in effect for the year in which we expect the differences will reverse. We periodically assess the likelihood thatwe will be able to recover our deferred tax assets, and we reflect any changes to our estimate of the amount we aremore likely than not to realize as a valuation allowance, with a corresponding adjustment to earnings or othercomprehensive income (loss), as appropriate. The ultimate realization of deferred tax assets depends on thegeneration of future taxable income (including the reversals of deferred tax liabilities) during the periods in whichthose deferred tax assets will become deductible.
The Company assesses all available positive and negative evidence regarding the realizability of its deferredtax assets. Significant judgment is required in assessing the need for any valuation allowance recorded againstdeferred tax assets. In assessing the need for a valuation allowance, we consider all available evidence, bothpositive and negative, including the future reversal of existing taxable temporary differences, taxable income incarryback periods, prudent and feasible tax planning strategies, estimated future taxable income, and whether wehave a recent history of losses. The valuation allowance can be affected by changes to tax regulations,interpretations and rulings, changes to enacted statutory tax rates, and changes to future taxable income estimates.
Our effective tax rate reflects the impact of certain undistributed foreign earnings for which we have notprovided U.S. taxes because these earnings are considered indefinitely reinvested outside of the U.S. We planforeign earnings remittance amounts based on projected cash flow needs, as well as the working capital and long-term investment requirements of our foreign subsidiaries and our domestic operations. Based on theseassumptions, we estimate the amount we will distribute to the U.S. and accrue U.S. and foreign taxes on theseplanned foreign remittance amounts. Material changes in our estimates of cash, working capital and long-terminvestment requirements in the various jurisdictions in which we do business could impact our effective tax rate. Ourprovision for income taxes could be adversely impacted by changes in our geographic mix of earnings or changes inthe enacted tax rates in the jurisdictions in which we conduct our business.
The calculation of our deferred and other tax balances involves significant management judgment when dealingwith uncertainties in the application of complex tax regulations and rulings in a multitude of taxing jurisdictionsacross our global operations. The Company is routinely audited by U.S. federal, state and foreign tax authorities,the results of which could cause proposed assessments against the Company. We recognize potential liabilities andrecord tax liabilities for anticipated tax audit issues based on our estimate of whether, and to the extent to which,additional taxes will be due. Furthermore, we recognize the tax benefit from an uncertain tax position only if it ismore likely than not that the tax position will be sustained on examination by the taxing authorities, based on thetechnical merits of the position in consideration of applicable tax statutes and related interpretations and precedentsand the expected outcome of the proceedings (or negotiations) with the taxing authorities. Tax benefits recognizedin the financial statements from such a position are measured based on the largest benefit that has a greater than50% likelihood of being realized on ultimate settlement.
We adjust our liability for uncertain tax positions in light of changing facts and circumstances; however, theultimate resolution of a tax examination may differ from the amounts recorded in the financial statements for anumber of reasons, including the Company’s decision to settle rather than litigate a matter, relevant legal precedentrelated to similar matters, and the Company’s success in supporting its filing positions with the tax authorities. If ourestimate of tax liabilities proves different than the ultimate outcome, such differences will affect the provision forincome taxes in the period in which such determination is made.
39

Goodwill and Other Intangible Assets
We review goodwill and indefinite-lived intangible assets for impairment annually and whenever events orchanges in circumstances indicate the carrying value of an asset may not be recoverable. We also review thecarrying value of our finite-lived intangible assets for potential impairment when impairment indicators arise. Weconduct our annual impairment tests as of the first day of the fourth quarter. When reviewing for impairment, wemay opt to make an initial qualitative evaluation, which considers present events and circumstances, to determinethe likelihood of impairment. Our decision to perform a qualitative impairment assessment for an individual reportingunit in a given year is influenced by a number of factors, including the significance of the excess of the reportingunit's estimated fair value over carrying value at the last quantitative assessment date, changes in macroeconomic,industry and reporting-unit specific conditions and the amount of time in between quantitative fair valuemeasurements. If the likelihood of impairment is not considered to be more likely than not, then no further testing isperformed.
In cases when we opt not to perform a qualitative evaluation, or the qualitative evaluation indicates that thelikelihood of impairment is more likely than not, we then perform a quantitative impairment test for goodwill. We testeach reporting unit for goodwill impairment quantitatively at a minimum of once every three years. We compare theestimated fair value of each reporting unit to its carrying value. If the estimated fair value of the reporting unitexceeds the carrying value of the net assets assigned to that reporting unit, goodwill is not impaired. If the carryingvalue of the net assets assigned to the reporting unit exceeds its fair value, then we record an impairment lossequal to the difference. In our annual impairment test for indefinite-lived intangible assets, we compare the fair valueof those assets to their carrying value. We recognize an impairment loss when the estimated fair value of theindefinite-lived intangible asset is less than its carrying value.
We estimate the fair value of our reporting units using an income approach. Under the income approach, wecalculate fair value based on the present value of estimated future cash flows. We estimate the fair value of ourindefinite-lived intangible assets using the relief from royalty method. The relief from royalty method estimates theportion of a company’s earnings attributable to an intellectual property asset based on an assumed royalty rate thatthe company would have paid had the asset not been owned.
Determining the fair value of a reporting unit or an indefinite-lived intangible asset is judgmental in nature andinvolves the use of significant estimates and assumptions, particularly related to future operating results and cashflows. These estimates and assumptions include, but are not limited to, revenue growth rates and operating marginsused to calculate projected future cash flows, risk-adjusted discount rates, assumed royalty rates, future economicand market conditions, and the identification of appropriate market comparable data. In addition, the identification ofreporting units and the allocation of assets and liabilities to the reporting units when determining the carrying valueof each reporting unit also requires judgment. Goodwill is tested for impairment at the reporting unit level, which,based on the applicable accounting guidance, is either the operating segment or one level below (e.g., the divisionsof our Connect & Control Technology segment). The fair value of our reporting units and indefinite-lived intangibleassets are based on estimates and assumptions that are believed to be reasonable. Significant changes to theseestimates and assumptions could adversely impact our conclusions. Actual future results may differ from thoseestimates. During the fourth quarter of 2021, we performed our annual impairment assessment and determined thatthe estimated fair values of our goodwill reporting units were substantially in excess of each of their carrying values.Had different reporting units been identified or had different valuation techniques or assumptions been utilized, theresults of our impairment tests could have resulted in an impairment loss, which could have been material.
See Note 12, Goodwill and Other Intangible Assets, Net, to the Consolidated Financial Statements for moreinformation.
Environmental Liabilities
We are subject to various federal, state, local, and foreign environmental laws and regulations that requireenvironmental assessment or remediation efforts. Accruals for environmental exposures are recorded on a site-by-site basis when it is probable that a liability has been incurred and the amount of the liability can be reasonablyestimated, based on current law and existing technologies. Significant judgment is required to determine both thelikelihood of a loss and the estimated amount of loss. Engineering studies, probability techniques, historicalexperience, and other factors are used to identify and evaluate remediation alternatives and their related costs inestimating our reserve for environmental liabilities. Our environmental reserve of $54.1 at December 31, 2021,represents management’s estimate of undiscounted costs expected to be incurred related to environmentalassessment or remediation efforts, including related legal fees, without regard to potential recoveries from insurancecompanies or other third parties. Our estimated liability is reduced to reflect the participation of other potentiallyresponsible parties in those instances where it is probable that such parties are legally responsible and financially
40

capable of paying their respective share of the relevant costs and that share can be reasonably estimated. Ourenvironmental accruals are reviewed and adjusted for progress of investigation and remediation efforts and asadditional technical or legal information become available, such as the impact of negotiations with regulators andother potentially responsible parties, settlements, rulings, advice of legal counsel, and other current information.
We closely monitor our environmental responsibilities, together with trends in the environmental laws.Environmental remediation reserves are subject to numerous inherent uncertainties that affect our ability to estimateour share of the costs. Such uncertainties involve incomplete information regarding particular sites, incompleteinformation regarding other potentially responsible parties, uncertainty regarding the nature and extent ofcontamination at each site, uncertainties concerning the extent of remediation required under existing regulations,uncertainties concerning our share of any remediation liability, if any, widely varying cost estimates associated withpotential alternative remedial approaches, uncertainty with regard to the length of time required to remediate aparticular site, uncertainties concerning the potential effects of continuing improvements in remediation technology,and unpredictable nature and timing of changes in environmental standards and regulatory requirements. The effectof legislative or regulatory changes on environmental standards could be material to the Company’s financialstatements. Additionally, violations by us of such laws and regulations, discovery of previously unknown or moreextensive contamination, litigation involving environmental impacts, our inability to recover costs associated withany such developments, or financial insolvency of other potentially responsible parties could have a materialadverse effect on our financial statements.
Although it is not possible to predict with certainty the ultimate costs of environmental remediation, thereasonably possible high-end of our estimated environmental liability range at December 31, 2021 was $93.8.
Recent Accounting Pronouncements
See Note 2, Recent Accounting Pronouncements, to the Consolidated Financial Statements for a completediscussion of recent accounting pronouncements.
ITEM 7A. QUANTITATIVE AND QUALITATIVE DISCLOSURES ABOUT MARKET RISK
As a result of our global operating and financing activities, we are exposed to market risks from changes inforeign currency exchange rates, interest rates, and commodity prices, which may adversely affect our operatingresults and financial position. The impact from changes in market conditions is generally minimized through ournormal operating and financing activities. However, we may use derivative instruments, primarily forward contracts,interest rate swaps and futures contracts, to manage some of these exposures. We do not use derivative financialinstruments for trading or other speculative purposes. To minimize the risk of counterparty non-performance,derivative instruments are entered into with major financial institutions and there is no significant concentration withany one counterparty.
Foreign Currency Exchange Rate Exposures
Our foreign currency exchange rate risk relates to receipts from customers, payments to suppliers andintercompany transactions denominated in foreign currencies. Our principal currency exposures relate to the Euro,Chinese renminbi, Czech koruna, South Korean won, Hong Kong dollar, and Saudi riyal. Based on a sensitivityanalysis at December 31, 2021, a hypothetical 10% change in the foreign currency exchange rates for the yearended December 31, 2021 would have resulted in translation impact to our pre-tax earnings of approximately $32,due primarily to the Euro, Chinese renminbi, and Czech koruna. This calculation assumes that all currencies changein the same direction and proportion relative to the U.S. dollar and that there are no indirect effects, such aschanges in non-U.S. dollar sales volumes or prices. This calculation does not take into account the impact of theforeign currency forward exchange contracts discussed above.
Interest Rate Exposures
As of December 31, 2021, our outstanding commercial paper was $195.4, with a weighted average interest rateof 0.10%. We estimate that a hypothetical increase in interest rates of 100 basis points would result inapproximately $2 of additional annual interest expense based on current borrowing levels.
41

Commodity Price Exposures
Portions of our business are exposed to volatility in the prices of certain commodities, such as steel, gold,copper, nickel, iron, aluminum, tin, and rubber as well as specialty alloys, including titanium that we purchase in theraw form, or that are used in purchased component parts. The prices of these and other commodities may also beimpacted by tariffs. When practical, we attempt to control such costs through fixed-price contracts with suppliers;however, we are prone to exposure as these contracts expire. We evaluate hedging opportunities to mitigate orminimize the risk of operating margin erosion resulting from the volatility of commodity prices. Since 2020, the costof raw materials, including commodities such as steel, that we use in our production processes has increased. Therising prices are mainly a result of increased demand fueled by economic recovery from the COVID-19 pandemic aswell as lower supply since global production capacity was cut in 2020. The impact of higher commodity prices onour financial results during 2021 was partially mitigated by fixed-price supply contracts with suppliers. Assuming allother variables remain constant, we estimate that a hypothetical 10% change in steel prices, excluding any impactof purchased component parts, would impact pre-tax earnings by approximately $7 to $9. We estimate that ahypothetical 10% change in prices for any other commodity would not be material to our financial statements.
ITEM 8. FINANCIAL STATEMENTS AND SUPPLEMENTARY DATA
See Index to Consolidated Financial Statements herein.
ITEM 9. CHANGES IN AND DISAGREEMENTS WITH ACCOUNTANTS ONACCOUNTING AND FINANCIAL DISCLOSURE
None.
42
ITEM 9A. CONTROLS AND PROCEDURES
Attached as exhibits to this Annual Report on Form 10-K are certifications of the Company’s Chief ExecutiveOfficer (CEO) and Chief Financial Officer (CFO), which are required in accordance with Rule 13a-14 under theExchange Act, as amended.
(a) Evaluation of Disclosure Controls and ProceduresThe Company, with the participation of various levels of management, including the CEO and CFO, conducted
an evaluation of effectiveness of the design and operation of our disclosure controls and procedures (as defined inRules 13a-15(e) and 15d-15(e) of the Exchange Act) as of December 31, 2021. Based on such evaluation, suchofficers have concluded that, as of the end of the period covered by this report, the Company’s disclosure controlsand procedures are effective.
The Company's Disclosure Committee has the responsibility of considering and evaluating the materiality ofinformation and reviewing disclosure obligations on a timely basis. The Disclosure Committee meets regularly andassists the CEO and the CFO in designing, establishing, reviewing, and evaluating the Company’s disclosurecontrols and procedures.
(b) Management’s Report on Internal Control Over Financial ReportingThe Company’s management is responsible for establishing and maintaining adequate internal control over
financial reporting as defined in Rules 13a-15(f) and 15d-15(f) under the Exchange Act. The Company’s internalcontrol over financial reporting is a process designed to provide reasonable assurance regarding the reliability offinancial reporting and the preparation of financial statements for external purposes in accordance with accountingprinciples generally accepted in the United States of America.
Internal control over financial reporting includes those policies and procedures that (i) pertain to themaintenance of records that, in reasonable detail, completely, accurately and fairly reflect the transactions anddispositions of the Company’s assets; (ii) provide reasonable assurance that transactions are recorded asnecessary to permit preparation of the financial statements in accordance with accounting principles generallyaccepted in the United States of America; (iii) provide reasonable assurance that Company receipts andexpenditures are made only in accordance with the authorization of management and the directors of the Company,and (iv) provide reasonable assurance regarding prevention or timely detection of unauthorized acquisition, use, ordisposition of assets that could have a material effect on the Consolidated Financial Statements. Internal controlover financial reporting includes the controls themselves, monitoring and internal auditing practices, and actionstaken to correct any identified deficiencies.
Management assessed the effectiveness of the Company’s internal control over financial reporting as ofDecember 31, 2021. Management based this assessment on criteria for effective internal control over financialreporting described in the 2013 "Internal Control — Integrated Framework" released by the Committee ofSponsoring Organizations (COSO) of the Treadway Commission. Management's assessment included anevaluation of the design of the Company’s internal control over financial reporting and testing of the operationaleffectiveness of its internal control over financial reporting. Management reviewed the results of its assessment withthe Audit Committee of our Board of Directors. Based on this assessment, management determined that, as ofDecember 31, 2021, the Company maintained effective internal control over financial reporting.
The Company’s management, including the CEO and the CFO, does not expect that our internal control overfinancial reporting, because of inherent limitations, will prevent or detect all errors and all fraud. Also, projections ofany evaluation of effectiveness to future periods are subject to the risk that controls may be inadequate because ofchanges in conditions, or that the degree of compliance with the policies or procedures may deteriorate.
Management’s assessment, included herein, should be read in conjunction with the certifications and theattestation report on the registrant's internal control over financial reporting issued by Deloitte & Touche LLP, anindependent registered public accounting firm, as stated in their report, which appears subsequent to Item 9B in thisAnnual Report on Form 10-K.
(c) Changes in Internal Control over Financial ReportingDuring the three months ended December 31, 2021, no change occurred in our internal control over financial
reporting that materially affected, or is reasonably likely to materially affect, our internal control over financialreporting.
43

ITEM 9B. OTHER INFORMATION
Disclosure pursuant to Section 219 of the Iran Threat Reduction & Syria Human Rights Act (ITRA)
This disclosure is made pursuant to Section 219 of the Iran Threat Reduction and Syria Human Rights Act of2012 which added subsection (r) to Section 13 of the Exchange Act (Section 13(r)). Section 13(r) requires an issuerto disclose in its annual or quarterly reports whether it or any of its affiliates have knowingly engaged in certainactivities, transactions or dealings relating to Iran. Disclosure of such activities, transactions or dealings is requiredeven when conducted outside the United States by non-U.S. persons in compliance with applicable law, andwhether or not such activities are sanctionable under U.S. law.
In its 2012 Annual Report, ITT described its acquisition of all the shares of Joh. Heinr. Bornemann GmbH(Bornemann) in November 2012, as well as certain activities of Bornemann in Iran and the wind down of thoseactivities in accordance with a General License issued on December 26, 2012 (the General License) by the Office ofForeign Assets Control. As permitted by the General License, on or before March 8, 2013, Bornemann completedthe wind-down activities and ceased all activities in Iran. As required to be disclosed by Section 13(r), the grossrevenues and operating income to Bornemann from its Iranian activities subsequent to its acquisition by ITT wereEuros 2.2 million and Euros 1.5 million, respectively. Prior to its acquisition by ITT, Bornemann issued aperformance bond to its Iranian customer in the amount of Euros 1.3 million (the Bond). Bornemann requested thatthe Bond be canceled prior to March 8, 2013; however, the former customer refused this request and as a result theBond remains outstanding. Bornemann did not receive gross revenues or operating income, or pay interest, withrespect to the Bond in any subsequent periods through December 31, 2021, however, Bornemann did pay annualfees of approximately Euros 10 thousand in 2021, and Euros 11 thousand in both 2020 and 2019, to the Germanfinancial institution which is maintaining the Bond.
44
REPORT OF INDEPENDENT REGISTERED PUBLIC ACCOUNTING FIRM
To the Shareholders and the Board of Directors of ITT Inc.
Opinion on Internal Control over Financial Reporting
We have audited the internal control over financial reporting of ITT Inc. and subsidiaries (the "Company") as ofDecember 31, 2021, based on criteria established in Internal Control — Integrated Framework (2013) issued by theCommittee of Sponsoring Organizations of the Treadway Commission (COSO). In our opinion, the Companymaintained, in all material respects, effective internal control over financial reporting as of December 31, 2021,based on criteria established in Internal Control — Integrated Framework (2013) issued by COSO.
We have also audited, in accordance with the standards of the Public Company Accounting Oversight Board (UnitedStates) (PCAOB), the consolidated financial statements as of and for the year ended December 31, 2021, of theCompany and our report dated February 16, 2022, expressed an unqualified opinion on those financial statements.
Basis for Opinion
The Company’s management is responsible for maintaining effective internal control over financial reporting and forits assessment of the effectiveness of internal control over financial reporting, included in the accompanyingManagement’s Report on Internal Control Over Financial Reporting. Our responsibility is to express an opinion onthe Company’s internal control over financial reporting based on our audit. We are a public accounting firmregistered with the PCAOB and are required to be independent with respect to the Company in accordance with theU.S. federal securities laws and the applicable rules and regulations of the Securities and Exchange Commissionand the PCAOB.
We conducted our audit in accordance with the standards of the PCAOB. Those standards require that we plan andperform the audit to obtain reasonable assurance about whether effective internal control over financial reportingwas maintained in all material respects. Our audit included obtaining an understanding of internal control overfinancial reporting, assessing the risk that a material weakness exists, testing and evaluating the design andoperating effectiveness of internal control based on the assessed risk, and performing such other procedures as weconsidered necessary in the circumstances. We believe that our audit provides a reasonable basis for our opinion.
Definition and Limitations of Internal Control over Financial Reporting
A company’s internal control over financial reporting is a process designed to provide reasonable assuranceregarding the reliability of financial reporting and the preparation of financial statements for external purposes inaccordance with generally accepted accounting principles. A company’s internal control over financial reportingincludes those policies and procedures that (1) pertain to the maintenance of records that, in reasonable detail,accurately and fairly reflect the transactions and dispositions of the assets of the company; (2) provide reasonableassurance that transactions are recorded as necessary to permit preparation of financial statements in accordancewith generally accepted accounting principles, and that receipts and expenditures of the Company are being madeonly in accordance with authorizations of management and directors of the Company; and (3) provide reasonableassurance regarding prevention or timely detection of unauthorized acquisition, use, or disposition of the Company’sassets that could have a material effect on the financial statements.
Because of its inherent limitations, internal control over financial reporting may not prevent or detect misstatements.Also, projections of any evaluation of effectiveness to future periods are subject to the risk that controls maybecome inadequate because of changes in conditions, or that the degree of compliance with the policies orprocedures may deteriorate.
/s/ Deloitte & Touche LLPStamford, ConnecticutFebruary 16, 2022
45

PART IIIITEM 10. DIRECTORS, EXECUTIVE OFFICERS AND CORPORATE GOVERNANCE
Information required by this Item 10 is incorporated by reference from the information provided under thesections entitled "Voting Items," "How to Vote," "Election of Directors (Proxy Item No. 1)," "Corporate Governanceand Related Matters-Overview of Committees-Audit Committee" and "Audit Committee Report" in our ProxyStatement for the 2022 Annual Meeting of Shareholders (2022 Proxy Statement).
Information required by this Item 10 with respect to executive officers of the Company is contained under theheading "Information About Our Executive Officers" in Part I of this Annual Report on Form 10-K.
ITT has adopted corporate governance principles and charters for each of its standing committees. Theprinciples address director qualification standards and responsibilities, access to management and independentadvisors, compensation, orientation and continuing education, management succession principles and board andcommittee self-evaluation. The corporate governance principles and charters are available on the Company’swebsite at www.itt.com/investors/governance. A copy of the corporate governance principles and charters is alsoavailable to any shareholder who requests a copy from the Company’s secretary.
ITT has also adopted a written code of ethics, the "Code of Conduct," which is applicable to all directors,employees and officers (including the Company’s principal executive officer, principal financial officer, principalaccounting officer or controller, or person performing similar functions). The Company’s Code of Conduct isavailable on our website at www.itt.com. We intend to satisfy the disclosure requirement under Item 5.05 of Form 8-K regarding an amendment to, or waiver from, a provision of our Code of Conduct by posting such information onour website at www.itt.com.
Pursuant to New York Stock Exchange (NYSE) Listing Company Manual Section 303A.12(a), the Companysubmitted a Section 12(a) CEO Certification to the NYSE in 2021. The Company also filed with the SEC, as exhibitsto the Company’s current Annual Report on Form 10-K, the certifications required under Section 302 of theSarbanes-Oxley Act for its Chief Executive Officer and Chief Financial Officer.
ITEM 11. EXECUTIVE COMPENSATIONInformation required by this Item 11 is incorporated by reference to the discussion under the headings "2021
Non-Management Director Compensation," "Compensation Tables," "Compensation Discussion and Analysis,""Compensation and Human Capital Committee Report" and "Compensation Committee Interlocks and InsiderParticipation" in our 2022 Proxy Statement.
ITEM 12. SECURITY OWNERSHIP OF CERTAIN BENEFICIAL OWNERS ANDMANAGEMENT AND RELATED STOCKHOLDER MATTERSInformation required by this Item 12 is incorporated by reference to the discussion under the caption "Other
Matters - Stock Ownership of Directors, Executive Officers, and Certain Shareholders," and "Equity CompensationPlan Information" in our 2022 Proxy Statement.
ITEM 13. CERTAIN RELATIONSHIPS AND RELATED TRANSACTIONS AND DIRECTORINDEPENDENCEInformation required by this item is incorporated by reference to the discussions under the captions "Corporate
Governance and Related Matters-Policies for Approving Related Party Transactions" and "Corporate Governanceand Related Matters-Director Independence" in our 2022 Proxy Statement.
ITEM 14. PRINCIPAL ACCOUNTING FEES AND SERVICESInformation about the fees for 2021 and 2020 for professional services rendered by our independent registered
public accounting firm is incorporated by reference to the discussion under the heading "Ratification of Appointmentof the Independent Registered Public Accounting Firm (Proxy Item No. 2)" of our 2022 Proxy Statement. Our AuditCommittee’s policy on pre-approval of audit and permissible non-audit services of our independent registered publicaccounting firm is also incorporated by reference to the discussion under the heading "Ratification of Appointment ofthe Independent Registered Public Accounting Firm (Proxy Item No. 2)" of our 2022 Proxy Statement.
46

PART IV
ITEM 15. EXHIBITS AND FINANCIAL STATEMENT SCHEDULES
(a) Documents filed as a part of this report:
1. See Index to Consolidated Financial Statements appearing on page 48 for a list of the financial statementsfiled as a part of this report.
2. See Exhibit Index on page II-1 for a list of the exhibits filed or incorporated herein as a part of this report.
(b) Financial Statement Schedules are omitted because of the absence of the conditions under which they arerequired or because the required information is included in the Consolidated Financial Statements filed as partof this report.
ITEM 16. FORM 10-K SUMMARY
Not Applicable.
47

INDEX TO CONSOLIDATED FINANCIAL STATEMENTS
ITEM PAGEReport of Independent Registered Public Accounting Firm (PCAOB ID No. 34) 49Consolidated Statements of Operations for the years ended December 31, 2021, 2020 and 2019 51Consolidated Statements of Comprehensive Income for the years ended December 31, 2021, 2020 and 2019 52Consolidated Balance Sheets as of December 31, 2021 and 2020 53Consolidated Statements of Cash Flows for the years ended December 31, 2021, 2020 and 2019 54Consolidated Statements of Changes in Shareholders’ Equity for the years ended December 31, 2021, 2020 and 2019 55Notes to the Consolidated Financial Statements: 56Note 1 – Description of Business, Basis of Presentation and Summary of Significant Accounting Policies 56Note 2 – Recent Accounting Pronouncements 63Note 3 – Segment Information 64Note 4 – Revenue 66Note 5 – Restructuring Actions 67Note 6 – Income Taxes 69Note 7 – Earnings Per Share Data 72Note 8 – Receivables, Net 72Note 9 – Inventories, Net 73Note 10 – Other Current and Non-Current Assets 73Note 11 – Plant, Property and Equipment, Net 74Note 12 – Goodwill and Other Intangible Assets, Net 74Note 13 – Accrued Liabilities and Other Non-Current Liabilities 76Note 14 – Leases 76Note 15 – Debt 77Note 16 – Postretirement Benefit Plans 78Note 17 – Long-Term Incentive Employee Compensation 82Note 18 – Capital Stock 84Note 19 – Accumulated Other Comprehensive Loss 85Note 20 – Commitments and Contingencies 85Note 21 – Guarantees, Indemnities and Warranties 89Note 22 – Derivative Financial Instruments 89
48

REPORT OF INDEPENDENT REGISTERED PUBLIC ACCOUNTING FIRM
To the Shareholders and the Board of Directors of ITT Inc.
Opinion on the Financial Statements
We have audited the accompanying consolidated balance sheets of ITT Inc. and subsidiaries (the "Company") as ofDecember 31, 2021 and 2020, the related consolidated statements of operations, comprehensive income,Shareholders’ equity, and cash flows, for each of the three years in the period ended December 31, 2021, and therelated notes (collectively referred to as the “financial statements”). In our opinion, the financial statements presentfairly, in all material respects, the financial position of the Company as of December 31, 2021 and 2020, and theresults of its operations and its cash flows for each of the three years in the period ended December 31, 2021, inconformity with accounting principles generally accepted in the United States of America.
We have also audited, in accordance with the standards of the Public Company Accounting Oversight Board (UnitedStates) (PCAOB), the Company's internal control over financial reporting as of December 31, 2021, based oncriteria established in Internal Control — Integrated Framework (2013) issued by the Committee of SponsoringOrganizations of the Treadway Commission and our report dated February 16, 2022, expressed an unqualifiedopinion on the Company's internal control over financial reporting.
Basis for Opinion
These financial statements are the responsibility of the Company’s management. Our responsibility is to express anopinion on the Company’s financial statements based on our audits. We are a public accounting firm registered withthe PCAOB and are required to be independent with respect to the Company in accordance with the U.S. federalsecurities laws and the applicable rules and regulations of the Securities and Exchange Commission and thePCAOB.
We conducted our audits in accordance with the standards of the PCAOB. Those standards require that we planand perform the audit to obtain reasonable assurance about whether the financial statements are free of materialmisstatement, whether due to error or fraud. Our audits included performing procedures to assess the risks ofmaterial misstatement of the financial statements, whether due to error or fraud, and performing procedures thatrespond to those risks. Such procedures included examining, on a test basis, evidence regarding the amounts anddisclosures in the financial statements. Our audits also included evaluating the accounting principles used andsignificant estimates made by management, as well as evaluating the overall presentation of the financialstatements. We believe that our audits provide a reasonable basis for our opinion.
Critical Audit Matters
The critical audit matters communicated below are matters arising from the current-period audit of the financialstatements that were communicated or required to be communicated to the audit committee and that (1) relate toaccounts or disclosures that are material to the financial statements and (2) involved our especially challenging,subjective, or complex judgments. The communication of critical audit matters does not alter in any way our opinionon the financial statements, taken as a whole, and we are not, by communicating the critical audit matters below,providing separate opinions on the critical audit matters or on the accounts or disclosures to which they relate.
Asbestos Matters - refer to Note 20 in the Notes to the Consolidated Financial Statements
On June 30, 2021, ITT Inc. entered into a purchase agreement with a buyer that resulted in transferring 100% of theequity interests of InTelCo, a subsidiary of ITT Inc., along with a cash contribution of $398 million. As InTelCo wasthe obligor for the Company's asbestos-related liabilities of $797 million and policyholder of the related insuranceassets of $401.4 million, the rights and obligations related to these items transferred upon the sale. Following thecompletion of the transfer, the Company no longer has any obligation with respect to pending and future asbestosclaims. As such, InTelCo has been deconsolidated from the 2021 financial results, as the Company no longermaintains control of the entity. Therefore, all associated assets and liabilities are no longer reported on theconsolidated balance sheet. The transaction resulted in a pre-tax gain of $88.8 million.
Auditing the Company’s evaluation to deconsolidate InTelCo required a high degree of auditor effort given thecomplexity of the accounting guidance, the purchase agreement, and the other related agreements. Subsequent tothe transaction, ITT evaluated whether InTelCo met the definition of a variable interest entity resulting from acontrolling financial interest or the ability to control the subsidiary’s assets and liabilities, and if so would continue to
49

be consolidated with the Company. We identified the Company’s evaluation to deconsolidate InTelCo as a criticalaudit matter.
Our audit procedures to test the Company’s evaluation to deconsolidate InTelCo included the following, amongothers:
• Tested the operating effectiveness of controls over the Company’s accounting evaluation to deconsolidate.▪ Read the purchase agreement and related agreements to evaluate the Company’s ability to have power or
control over InTelCo’s assets and liabilities, if the Company would be required to absorb any future losses,and if the Company would be the primary beneficiary to InTelCo upon the close of the transaction.
▪ Read the third-party valuation regarding the solvency of the InTelCo entity and the sufficiency of its equity tofund its activities without additional financial support from the Company.
▪ Evaluated the governance and management structure of InTelCo to determine if any characteristics of acontrolling financial interest continued to exist through voting rights, board seats, or continuing involvementin the management of asbestos and other product liability exposures.
/s/ Deloitte & Touche LLPStamford, ConnecticutFebruary 16, 2022We have served as the Company's auditor since 2002.
50

CONSOLIDATED STATEMENTS OF OPERATIONS
(IN MILLIONS, EXCEPT PER SHARE AMOUNTS)YEARS ENDED DECEMBER 31 2021 2020 2019Revenue $ 2,765.0 $ 2,477.8 $ 2,846.4Costs of revenue 1,865.5 1,695.6 1,936.3Gross profit 899.5 782.2 910.1
General and administrative expenses 214.3 198.7 241.3Sales and marketing expenses 150.8 146.5 165.9Research and development expenses 94.9 84.9 97.9Asbestos-related (benefit) costs, net (74.4) 66.3 (20.2)Restructuring costs 9.6 43.0 12.8Asset impairment charges — 16.3 1.0Operating income 504.3 226.5 411.4
Interest (income), net (1.1) (0.7) (4.1)Non-operating postretirement (benefit) costs, net (1.3) 144.2 4.5Miscellaneous (income), net (2.4) (2.2) (3.4)Income from continuing operations before income tax 509.1 85.2 414.4
Income tax expense 189.6 15.3 89.9Income from continuing operations 319.5 69.9 324.5
Income from discontinued operations, net of tax (expense) benefit of$0.2, $(0.2), and $0.6, respectively 1.5 4.0 1.7Net income 321.0 73.9 326.2
Less: Income attributable to noncontrolling interests 4.7 1.4 1.1Net income attributable to ITT Inc. $ 316.3 $ 72.5 $ 325.1
Amounts attributable to ITT Inc.:Income from continuing operations, net of tax $ 314.8 $ 68.5 $ 323.4Income from discontinued operations, net of tax 1.5 4.0 1.7Net income $ 316.3 $ 72.5 $ 325.1
Earnings per share attributable to ITT Inc.:Basic:Continuing operations $ 3.66 $ 0.79 $ 3.69Discontinued operations 0.02 0.05 0.02Net income $ 3.68 $ 0.84 $ 3.71
Diluted:Continuing operations $ 3.64 $ 0.78 $ 3.65Discontinued operations 0.02 0.05 0.02Net income $ 3.66 $ 0.83 $ 3.67
Weighted average common shares – basic 86.0 86.7 87.7Weighted average common shares – diluted 86.5 87.3 88.6
The accompanying Notes to the Consolidated Financial Statements are an integral part of the above Consolidated Statements ofOperations.
51
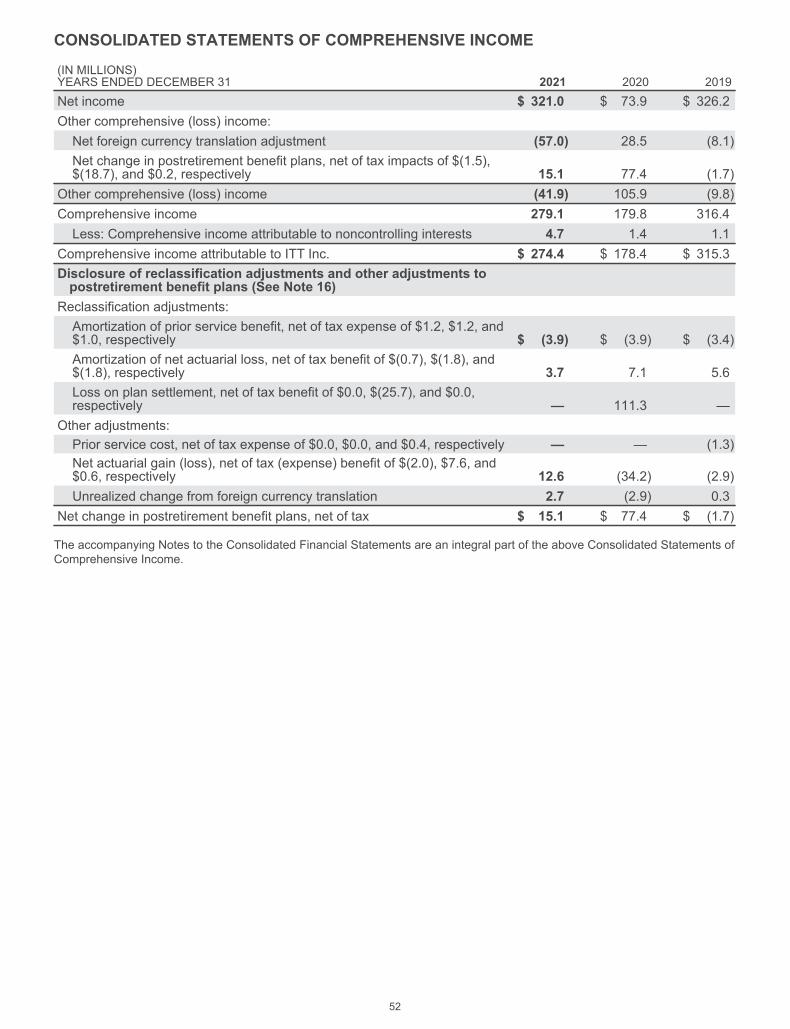
CONSOLIDATED STATEMENTS OF COMPREHENSIVE INCOME
(IN MILLIONS)YEARS ENDED DECEMBER 31 2021 2020 2019Net income $ 321.0 $ 73.9 $ 326.2Other comprehensive (loss) income:Net foreign currency translation adjustment (57.0) 28.5 (8.1)Net change in postretirement benefit plans, net of tax impacts of $(1.5),$(18.7), and $0.2, respectively 15.1 77.4 (1.7)
Other comprehensive (loss) income (41.9) 105.9 (9.8)Comprehensive income 279.1 179.8 316.4Less: Comprehensive income attributable to noncontrolling interests 4.7 1.4 1.1
Comprehensive income attributable to ITT Inc. $ 274.4 $ 178.4 $ 315.3Disclosure of reclassification adjustments and other adjustments topostretirement benefit plans (See Note 16)
Reclassification adjustments:Amortization of prior service benefit, net of tax expense of $1.2, $1.2, and$1.0, respectively $ (3.9) $ (3.9) $ (3.4)Amortization of net actuarial loss, net of tax benefit of $(0.7), $(1.8), and$(1.8), respectively 3.7 7.1 5.6Loss on plan settlement, net of tax benefit of $0.0, $(25.7), and $0.0,respectively — 111.3 —
Other adjustments:Prior service cost, net of tax expense of $0.0, $0.0, and $0.4, respectively — — (1.3)Net actuarial gain (loss), net of tax (expense) benefit of $(2.0), $7.6, and$0.6, respectively 12.6 (34.2) (2.9)Unrealized change from foreign currency translation 2.7 (2.9) 0.3
Net change in postretirement benefit plans, net of tax $ 15.1 $ 77.4 $ (1.7)
The accompanying Notes to the Consolidated Financial Statements are an integral part of the above Consolidated Statements ofComprehensive Income.
52

CONSOLIDATED BALANCE SHEETS(IN MILLIONS, EXCEPT PER SHARE AMOUNTS)DECEMBER 31 2021 2020AssetsCurrent assets:Cash and cash equivalents $ 647.5 $ 859.8Receivables, net 555.1 507.5Inventories, net 430.9 360.5Other current assets 88.6 189.5Total current assets 1,722.1 1,917.3Plant, property and equipment, net 509.1 525.1Goodwill 924.3 944.8Other intangible assets, net 85.7 106.4Asbestos-related assets — 353.7Deferred income taxes 63.4 158.3Other non-current assets 260.8 272.0Total non-current assets 1,843.3 2,360.3Total assets $ 3,565.4 $ 4,277.6Liabilities and Shareholders’ EquityCurrent liabilities:Commercial paper and current maturities of long-term debt $ 197.6 $ 106.8Accounts payable 373.4 306.8Accrued liabilities 357.3 457.4Total current liabilities 928.3 871.0Asbestos-related liabilities — 840.6Postretirement benefits 199.9 227.5Other non-current liabilities 206.5 210.6Total non-current liabilities 406.4 1,278.7Total liabilities 1,334.7 2,149.7Shareholders’ equity:Common stock:Authorized – 250.0 shares, $1 par value per shareIssued and Outstanding – 85.5 and 86.5 shares, respectively 85.5 86.5Retained earnings 2,461.6 2,319.3Accumulated other comprehensive loss:Postretirement benefit plans (40.8) (55.9)Cumulative translation adjustments (280.5) (223.5)
Total ITT Inc. shareholders' equity 2,225.8 2,126.4Noncontrolling interests 4.9 1.5Total shareholders’ equity 2,230.7 2,127.9Total liabilities and shareholders’ equity $ 3,565.4 $ 4,277.6
The accompanying Notes to the Consolidated Financial Statements are an integral part of the above Consolidated BalanceSheets.
53

CONSOLIDATED STATEMENTS OF CASH FLOWS
(IN MILLIONS)YEARS ENDED DECEMBER 31 2021 2020 2019Operating ActivitiesIncome from continuing operations attributable to ITT Inc. $ 314.8 $ 68.5 $ 323.4Adjustments to income from continuing operations:Depreciation and amortization 113.1 112.2 113.4Equity-based compensation 16.5 13.4 15.7Asbestos-related (benefit) costs, net (74.4) 66.3 (20.2)Pension settlement charges — 137.0 —Deferred income tax expense (benefit) 115.7 (43.9) 30.9Asset impairment charges — 16.3 1.0Other non-cash charges, net 21.3 43.0 38.8Asbestos-related payments, net (14.9) (9.8) (21.6)Contributions to postretirement plans (10.5) (18.0) (22.9)Contribution to divest asbestos-related assets and liabilities (398.0) — —Changes in assets and liabilities:Change in receivables (62.2) 83.3 (40.6)Change in inventories (82.7) 36.5 (0.6)Change in contract assets (2.5) (1.0) 2.7Change in contract liabilities (3.6) (1.9) (5.1)Change in accounts payable 77.6 (34.7) (1.9)Change in accrued expenses 15.8 4.2 (14.7)Change in income taxes 8.2 (6.2) (9.6)Other, net (42.6) (29.3) (31.0)Net Cash – Operating activities (8.4) 435.9 357.7
Investing ActivitiesCapital expenditures (88.4) (63.7) (91.4)Proceeds from sale of long-lived assets 8.0 1.7 0.9Acquisitions, net of cash acquired — (4.7) (113.1)Other, net (1.9) 0.9 0.2Net Cash – Investing activities (82.3) (65.8) (203.4)Financing ActivitiesCommercial paper, net borrowings (repayments) 95.4 13.1 (27.2)Short-term revolving loans, borrowings — 495.8 —Short-term revolving loans, repayments — (524.7) —Long-term debt, issued — 1.5 8.1Long-term debt, repayments (2.4) (2.5) (3.2)Repurchase of common stock (116.5) (84.2) (41.4)Dividends paid (75.8) (59.0) (52.1)Proceeds from issuance of common stock 1.2 4.3 14.9Other, net (1.7) (2.9) (0.6)Net Cash – Financing activities (99.8) (158.6) (101.5)Exchange rate effects on cash and cash equivalents (22.6) 35.2 (3.0)Net cash from discontinued operations – operating activities 0.8 1.0 0.9
Net change in cash and cash equivalents (212.3) 247.7 50.7Cash and cash equivalents – beginning of year (includes restricted cash of $0.8,$0.8, and $1.0, respectively) 860.6 612.9 562.2Cash and Cash Equivalents – end of Period (includes restricted cash of $0.8, $0.8,and $0.8, respectively) $ 648.3 $ 860.6 $ 612.9Supplemental Cash Flow DisclosuresCash paid during the year for:Interest $ 3.3 $ 3.3 $ 2.5Income taxes, net of refunds received 61.3 61.1 63.4
The accompanying Notes to the Consolidated Financial Statements are an integral part of the above Consolidated Statements ofCash Flows.
54

CONSOLIDATED STATEMENTS OF CHANGES IN SHAREHOLDERS’ EQUITY
(IN MILLIONS, EXCEPT SHARE AMOUNTS) Common StockRetainedEarnings
AccumulatedOther
ComprehensiveLoss
NoncontrollingInterest
TotalShareholders'
Equity(Shares) (Dollars)
December 31, 2018 87.6 $ 87.6 $ 2,110.3 $ (375.5) $ 2.5 $ 1,824.9
Activity from stock incentive plans 1.0 1.0 29.6 — — 30.6Share repurchases (0.8) (0.8) (40.6) — — (41.4)Net income — — 325.1 — 1.1 326.2Dividends declared ($0.588 per share) — — (52.0) — — (52.0)Dividend to noncontrolling interest — — — — (0.7) (0.7)Total other comprehensive loss, net of tax — — — (9.8) — (9.8)December 31, 2019 87.8 87.8 2,372.4 (385.3) 2.9 2,077.8
Activity from stock incentive plans 0.6 0.6 17.1 — — 17.7Share repurchases (1.9) (1.9) (82.3) — — (84.2)Cumulative adjustment for accounting change — — (1.2) — — (1.2)Net income — — 72.5 — 1.4 73.9Dividends declared ($0.676 per share) — — (58.9) — — (58.9)Dividend to noncontrolling interest — — — — (0.9) (0.9)Purchase of noncontrolling interest — — (0.3) — (1.9) (2.2)Total other comprehensive income, net of tax — — — 105.9 — 105.9December 31, 2020 86.5 86.5 2,319.3 (279.4) 1.5 2,127.9
Activity from stock incentive plans 0.3 0.3 17.4 — — 17.7Share repurchases (1.3) (1.3) (115.2) — — (116.5)Net income — — 316.3 — 4.7 321.0Dividends declared ($0.88 per share) — — (76.2) — — (76.2)Dividend to noncontrolling interest — — — — (1.4) (1.4)Total other comprehensive loss, net of tax — — — (41.9) — (41.9)Other — — — — 0.1 0.1December 31, 2021 85.5 $ 85.5 $ 2,461.6 $ (321.3) $ 4.9 $ 2,230.7
The accompanying Notes to the Consolidated Financial Statements are an integral part of the above Consolidated Statements ofChanges in Shareholders’ Equity.
55

NOTES TO THE CONSOLIDATED FINANCIAL STATEMENTS(DOLLARS AND SHARES (EXCEPT PER SHARE AMOUNTS) IN MILLIONS, UNLESS OTHERWISE STATED)
NOTE 1DESCRIPTION OF BUSINESS, BASIS OF PRESENTATION AND SUMMARY OFSIGNIFICANT ACCOUNTING POLICIESDescription of Business
ITT Inc. is a diversified manufacturer of highly engineered critical components and customized technologysolutions for the transportation, industrial, and energy markets. Unless the context otherwise indicates, referencesherein to "ITT," "the Company," and such words as "we," "us," and "our" include ITT Inc. and its subsidiaries. ITToperates in three segments: Motion Technologies, consisting of friction and shock and vibration equipment;Industrial Process, consisting of industrial flow equipment and services; and Connect & Control Technologies,consisting of electronic connectors, fluid handling, motion control, composite materials, and noise and energyabsorption products. Financial information for our segments is presented in Note 3, Segment Information.
In March 2020, the World Health Organization declared the outbreak of the novel coronavirus (COVID-19) apandemic, resulting in certain local government-mandated site closures. Although most of our businesses weredeemed essential, we experienced disruption in our operations due to decreased customer demand, elevated safetystandards to keep our employees safe, and temporary plant closures. The Company continues to face certain risksand uncertainties resulting from COVID-19, including the severity of a resurgence of COVID-19 or new strains of thevirus, the timing, effectiveness and availability of, and people's receptivity to, COVID-19 vaccines or other potentialremedies, and impacts from potential mandatory vaccination requirements. Due to these uncertainties, the severityand extent of future impacts from COVID-19 or any new strains of the virus cannot be reasonably estimated at thistime.
Basis of Presentation
The Consolidated Financial Statements and Notes thereto were prepared in conformity with accountingprinciples generally accepted in the United States of America (GAAP).
The preparation of financial statements in conformity with GAAP requires management to make estimates andassumptions that affect the reported amounts of assets and liabilities, the disclosure of contingent assets andliabilities at the date of the financial statements, and the reported amounts of revenue and expenses during thereporting period. Estimates are revised as additional information becomes available. Estimates and assumptionsare used for, but not limited to, revenue recognition, unrecognized tax benefits, deferred tax valuation allowances,projected benefit obligations for postretirement plans, accounting for business combinations, goodwill and otherintangible asset impairment testing, environmental liabilities, allowance for credit losses and inventory valuation.Actual results could differ from these estimates.
Certain prior year amounts have been reclassified to conform to the current year presentation.
Significant Accounting Policies
Principles of ConsolidationOur consolidated financial statements include the accounts of all majority-owned subsidiaries. ITT consolidates
companies in which it has a controlling financial interest or when ITT is considered the primary beneficiary of avariable interest entity. The results of companies acquired or disposed of during the fiscal year are included in theConsolidated Financial Statements from the effective date of acquisition or up to the date of disposal. Allintercompany transactions have been eliminated.
Revenue RecognitionRevenue is derived from the sale of products and services to customers. We recognize revenue to depict the
transfer of promised goods or services to customers in an amount that reflects the consideration to which we expectto be entitled in exchange for those goods or services.
For product sales, we consider practical and contractual limitations in determining whether there is an alternativeuse for the product. For example, long-term design and build contracts are typically highly customized to acustomer’s specifications. For contracts with no alternative use and an enforceable right to payment for workperformed to date, including a reasonable profit if the contract were terminated at the customer’s convenience forreason other than nonperformance, we recognize revenue over time. All other product sales are recognized at apoint in time.
56

For contracts recognized over time, we use the cost-to-cost method or the units-of-delivery method, dependingon the nature of the contract, including length of production time.
For contracts recognized at a point in time, we recognize revenue when control passes to the customer, which isgenerally based on shipping terms that address when title and risk and rewards pass to the customer. However, wealso consider certain customer acceptance provisions as certain contracts with customers include installation,testing, certification or other acceptance provisions. In instances where contractual terms include a provision forcustomer acceptance, we consider whether we have previously demonstrated that the product meets objectivecriteria specified by either the seller or customer in assessing whether control has passed to the customer.
For service contracts, we recognize revenue as the services are rendered if the customer is benefiting from theservice as it is performed, or otherwise upon completion of the service. Separately priced extended warranties arerecognized as a separate performance obligation over the warranty period.
The transaction price in our contracts consists of fixed consideration and the impact of variable considerationincluding returns, rebates and allowances, and penalties. Variable consideration is generally estimated using aprobability-weighted approach based on historical experience, known trends, and current factors including marketconditions and status of negotiations.
When there is more than one performance obligation, the transaction price is allocated to the performanceobligations based on the relative estimated standalone selling prices. If not sold separately, estimated standaloneselling prices are determined considering various factors including market and pricing trends, geography, productcustomization, and profit objectives. Revenue is recognized when the appropriate revenue recognition criteria forthe individual performance obligations have been satisfied.
Revenue is reported net of any required taxes collected from customers and remitted to government authorities,with the collected taxes recorded as current liabilities until remitted to the relevant government authority.
Shipping and handling activities are accounted for as activities to fulfill a promise to transfer a product to acustomer. As such, shipping and handling activities are not evaluated as a separate performance obligation.
For most contracts, payment is due from the customer within 30 to 90 days after the product is delivered or theservice has been performed. For design and build contracts, we generally collect progress payments from thecustomer throughout the term of the contract, resulting in contract assets or liabilities depending on the timing of thepayments. Contract assets consist of unbilled amounts when revenue recognized exceeds customer billings.Contract liabilities consist of advance payments and billings in excess of revenue recognized.
Design and engineering costs for highly complex products to be sold under a long-term production-type contractare capitalized and amortized in a manner consistent with revenue recognition of the related contract or anticipatedcontract. Other design and development costs are capitalized only if there is a contractual guarantee forreimbursement. Costs to obtain a contract (e.g., commissions) for contracts greater than one year are capitalizedand amortized in a manner consistent with revenue recognition of the related contract.
Product WarrantiesOur standard product warranty terms generally include post-sales support and repairs or replacement of a
product at no additional charge for a specified period of time. Accruals for estimated expenses related to productwarranties are made at the time revenue is recognized and are recorded as a component of costs of revenue. Weestimate the liability for warranty claims based on our standard warranties, the historical frequency of claims and thecost to replace or repair our products under warranty. Factors that influence our warranty liability include the numberof units sold, the length of warranty term, historical and anticipated rates of warranty claims and the cost per claim.
Asbestos-Related Liabilities and AssetsEffective July 1, 2021, the Company divested the entity holding legacy asbestos-related assets and liabilities. As
a result of the transaction, all associated assets and liabilities are no longer reported on the Consolidated BalanceSheet. Prior to the divestiture, our asbestos liability estimate was recognized on an undiscounted basis as the timingof future cash flows may vary. Assumptions utilized in estimating the liability for both pending and unasserted claimsincluded: disease type, average settlement costs, percentage of claims settled or dismissed, the number of claimsestimated to be compensated by the Company in the future, and the costs to defend such claims. In 2020, weextended the measurement period over which we estimated our asbestos liability to include pending claims andunasserted claims estimated to be filed through 2052, including legal fees, reflecting the full time period over whichwe expected asbestos-related claims to be filed against the entities. Previous estimates included pending claimsand claims expected to be filed over the next 10 years. See Note 20, Commitments and Contingencies, foradditional information.
57
Postretirement Benefit PlansITT sponsors numerous pension and other employee-related defined benefit plans (collectively, postretirement
benefit plans). Substantially all of our U.S. postretirement benefit plans are closed to new participants.Postretirement benefit obligations are generally determined, where applicable, based on participant years ofservice, future compensation, age at retirement or termination, and the assumed rate of future healthcare costincreases. The determination of projected benefit obligations and the recognition of expenses related topostretirement benefit plans are dependent on various assumptions that are judgmental. The assumptions involvedin the measurement of our postretirement benefit plan obligations and net periodic postretirement costs primarilyrelate to discount rates, mortality and termination rates, and other factors. Management develops each assumptionusing relevant Company experience in conjunction with market-related data for each individual country in whichsuch plans exist. Actual results that differ from our assumptions are accumulated and are amortized over theestimated future working life, or remaining lifetime, of the plan participants depending on the nature of the retirementplan. For the recognition of net periodic postretirement cost, the calculation of the long-term expected return on planassets is generally derived using a market-related value of plan assets based on yearly average asset values at themeasurement date over the last 5 years.
The funded status of all plans is recorded on our balance sheet. Actuarial gains and losses and prior servicecosts or credits that have not yet been recognized through net income are recorded in accumulated othercomprehensive income within shareholders’ equity, net of taxes, until they are amortized as a component of netperiodic postretirement cost.
In 2020, the Company terminated its U.S. qualified pension plan by purchasing a group annuity contract fromMassMutual Life Insurance Company (MassMutual), which fully assumed the responsibility for paying andadministering pension benefits to approximately five thousand plan participants and their beneficiaries. Inconnection with the plan termination, the Company settled all future obligations under the plan by providing lumpsum payments to eligible participants who elected to receive them, and by transferring the remaining projectedbenefit obligation to the insurance company. See Note 16, Postretirement Benefit Plans, for additional information.
Research & DevelopmentResearch and development activities are charged to expense as incurred. R&D as a percentage of sales was
3.4% during 2021, 2020 and 2019.
Income TaxesWe determine the provision for income taxes using the asset and liability approach. Under this approach,
deferred income tax assets and liabilities are determined based on the estimated future tax effects of differencesbetween the financial reporting and tax bases of assets and liabilities, applying currently enacted tax rates in effectfor the year in which we expect the differences will reverse. The ultimate realization of deferred tax assets isdependent on the generation of future taxable income (including the reversals of deferred tax liabilities) during theperiods in which those deferred tax assets will become deductible.
We record a valuation allowance against our deferred tax assets when it is more likely than not that all or aportion of the deferred tax assets will not be realized. In assessing the need for a valuation allowance, the Companyconsiders all available positive and negative evidence regarding the realizability of its deferred tax assets, includingthe future reversal of existing taxable temporary differences, taxable income in carryback periods, prudent andfeasible tax planning strategies, estimated future taxable income, and whether we have a recent history of losses.The valuation allowance can be affected by changes to tax regulations, interpretations and rulings, changes toenacted statutory tax rates, and changes to future taxable income estimates.
We have not provided deferred tax liabilities for the impact of U.S. income taxes on book over tax basis whichwe consider indefinitely reinvested outside the U.S. We plan foreign earnings remittance amounts based onprojected cash flow needs, as well as the working capital and long-term investment requirements of foreignsubsidiaries and our domestic operations.
Furthermore, we recognize the tax benefit from an uncertain tax position only if it is more likely than not that thetax position will be sustained on examination by the taxing authorities, based on the technical merits of the positionin consideration of applicable tax statutes and related interpretations and precedents and the expected outcome ofthe proceedings (or negotiations) with the taxing authorities. Tax benefits recognized in the financial statementsfrom such a position are measured based on the largest benefit that has a greater than 50% likelihood of beingrealized on ultimate settlement.
The Company has elected to account for Global Intangible Low Taxed Income as a current period expensewhen incurred.
58

Earnings Per ShareBasic earnings per common share considers the weighted average number of common shares outstanding.
Diluted earnings per share considers the outstanding shares utilized in the basic earnings per share calculation aswell as the dilutive effect of outstanding stock options and restricted stock that do not contain rights to nonforfeitabledividends. Diluted shares outstanding include the dilutive effect of in-the-money options, unvested restricted stockunits and unvested performance stock units. The dilutive effect of such equity awards is calculated based on theaverage share price for each reporting period using the treasury stock method. Common stock equivalents areexcluded from the computation of earnings per share if they have an anti-dilutive effect.
Cash and Cash EquivalentsITT considers all highly liquid investments purchased with an original maturity or remaining maturity at the time
of purchase of three months or less to be cash equivalents. Cash equivalents primarily include fixed-maturity timedeposits and money market investments. Restricted cash was $0.8 as of December 31, 2021 and 2020. Restrictedcash is presented within Other current assets and Other non-current assets.
Concentrations of Credit RiskFinancial instruments that potentially subject ITT to significant concentrations of credit risk consist principally of
cash and cash equivalents, accounts and notes receivables from trade customers, investments, and derivatives. Wemaintain cash and cash equivalents with various financial institutions located in different geographical regions, andour policy is designed to limit exposure to any individual counterparty. Derivative financial instruments aretransacted with multiple highly reputable financial institutions. As part of our risk management processes, weperform periodic evaluations of the relative credit standing of the financial institutions with which we transact. Wehave not sustained any material credit losses during the previous three years with respect to financial instrumentsheld at financial institutions.
Credit risk with respect to accounts receivable is generally diversified due to the large number of entitiescomprising ITT’s customer base and their dispersion across many different industries and geographic regions.However, our largest customer represents approximately 11% and 12% of the December 31, 2021 and 2020outstanding trade accounts receivable balance, respectively. Occasionally, we enter into notes receivables withcertain of our customers. These notes receivables have maturities of six to 12 months and are guaranteed byreputable banks. ITT performs ongoing credit evaluations of the financial condition of its third-party distributors,resellers and other customers and requires collateral, such as letters of credit and bank guarantees, in certaincircumstances.
Factoring of Trade ReceivablesFactoring arrangements, whereby substantially all economic risks and rewards associated with trade
receivables are transferred to a third party, are accounted for by derecognizing the trade receivables upon receipt ofcash proceeds from the factoring arrangement. Factoring arrangements, whereby some, but not substantially all, ofthe economic risks and rewards are transferred to a third party and the assets subject to the factoring arrangementremain under the Company's control are accounted for by not derecognizing the trade receivables and recognizingany related obligations to the third party. As of December 31, 2021, we did not have any trade receivables subjectedto factoring.
Allowance for Credit LossesWe determine our allowance for credit losses using a combination of factors to reduce our trade receivables and
contract asset balances to the net amount expected to be collected. The allowance is based on a variety of factorsincluding the length of time receivables are past due, macroeconomic trends and conditions, significant one-timeevents, historical experience, and expectations of future economic conditions. We also record an allowance forindividual accounts when we become aware of specific customer circumstances, such as in the case of bankruptcyfilings or deterioration in the customer’s operating results or financial position. The past due or delinquency status ofa receivable is based on the contractual payment terms of the receivable. If circumstances related to the specificcustomer change, we adjust estimates of the recoverability of receivables as appropriate.
InventoriesInventories, which include the costs of material, labor and overhead, are stated at the lower of cost or net
realizable value. Cost is generally computed using the standard cost method, which approximates actual cost on afirst-in, first-out (FIFO) basis. Variances between standard and actual costs are charged to cost of sales orcapitalized to inventory. Estimated losses from obsolete and slow-moving inventories are recorded to reduceinventory values to their estimated net realizable value and are charged to cost of sales. At the point of lossrecognition, a new cost basis for that inventory is established and subsequent changes in facts and circumstances
59

do not result in a recovery in carrying value. Inventories valued under the last-in, first-out (LIFO) method represent13.4% and 12.5% of total 2021 and 2020 inventories, respectively. We have a LIFO reserve of $14.1 and $12.0recorded as of December 31, 2021 and 2020, respectively.
Plant, Property and EquipmentPlant, property and equipment, including capitalized interest applicable to major project expenditures, are
recorded at cost. Depreciation is computed on a straight-line basis over the estimated useful lives of the assets.Leasehold improvements are depreciated over the life of the lease or the asset, whichever is shorter. Fullydepreciated assets are retained in property and accumulated depreciation accounts until disposal. Repairs andmaintenance costs are expensed as incurred.
During 2021, we recorded a gain of $7.0 related to the sale of land with a book value of $0.1 that was previouslyheld by a business within our MT segment. The gain on sale was recorded within general and administrativeexpenses in our Consolidated Statements of Operations.
LeasesThe Company enters into leases for the use of premises and equipment, primarily classified as operating
leases. Operating lease costs are recognized as an operating expense over the lease term on a straight-line basis.For leases with terms greater than 12 months, we record a right-of-use asset and lease liability equal to the presentvalue of the lease payments. In determining the discount rate used to measure the right-of-use asset and leaseliability, we utilize the Company’s incremental borrowing rate and consider the term of the lease, as well as thegeographic location of the leased asset.
Where options to renew a lease are available, they are included in the lease term and capitalized on thebalance sheet to the extent there would be a significant economic penalty not to elect the option. Certain real estateleases are subject to periodic changes in an index or market rate. Although lease liabilities are not remeasured as aresult of changes to an index or rate, these changes are treated as variable lease payments and recognized in theperiod in which the obligation for those payments is incurred. Variable lease expense also includes property tax andproperty insurance costs.
Capitalized Internal Use SoftwareCosts incurred in the preliminary project stage of developing or acquiring internal use software are expensed as
incurred. After the preliminary project stage is completed, management has approved the project and it is probablethat the project will be completed and the software will be used for its intended purpose, ITT capitalizes certaininternal and external costs incurred to acquire or create internal use software, principally related to software coding,designing system interfaces and installation and testing of the software. ITT amortizes capitalized internal usesoftware costs using the straight-line method over the estimated useful life of the software, generally from 3 to 7years.
InvestmentsInvestments in fixed-maturity time deposits having an original maturity exceeding three months at the time of
purchase, referred to as short-term time deposits, are classified as held-to-maturity and are recorded at amortizedcost, which approximates fair value. There were no short-term time deposits held as of December 31, 2021 andDecember 31, 2020.
Investments in entities where we have the ability to exercise significant influence, but do not control, areaccounted for under the equity method of accounting and are included in other noncurrent assets on ourConsolidated Balance Sheets. Significant influence typically exists if we have a 20% to 50% ownership interest inthe investee. Under this method of accounting, our share of the net earnings or losses of the investee is included innon-operating profit in miscellaneous income, net on our Consolidated Statements of Operations. We evaluate ourequity method investments for impairment whenever events or changes in circumstances indicate that the carryingamounts of such investments may be impaired. If a decline in the value of an equity method investment isdetermined to be other than temporary, a loss is recorded in earnings in the current period.
Investments in entities for which we do not have significant operating influence (we generally hold a less than20% ownership stake in these entities) are initially recorded at the purchase price. For investments in entities withreadily determinable fair values (e.g., publicly traded), the investment is measured at fair value each subsequentreporting period. For investments in entities without a readily determinable fair value, we have made an accountingpolicy election to measure the investment at cost, adjusted for any impairments and/or observable price changes. Inboth cases, these investments are included in other noncurrent assets on our Consolidated Balance Sheets, withany gains or losses and dividends received recognized in non-operating profit in miscellaneous income, net on ourConsolidated Statements of Operations.
60
Investments in corporate-owned life insurance (COLI) policies are recorded at their cash surrender values as ofthe balance sheet date. The Company’s investments in COLI policies are included in other non-current assets in theconsolidated balance sheets and were $118.2 and $113.7 at December 31, 2021 and 2020, respectively. Changesin the cash surrender value during the period generally reflect gains or losses in the fair value of assets, premiumpayments, and policy redemptions. Gains from COLI investments of $3.9, $4.3, and $4.8 were recorded withingeneral and administrative expenses in the Consolidated Statements of Operations during years endedDecember 31, 2021, 2020 and 2019, respectively. Cash receipts from COLI policies were $0.0, $0.9, and $1.7during 2021, 2020, and 2019, respectively, and are recognized in investing activities in the Consolidated Statementsof Cash Flows.
Long-Lived Asset ImpairmentLong-lived assets, including intangible assets with finite lives and capitalized internal use software, are tested
for impairment whenever events or changes in circumstances indicate their carrying value may not be recoverable.We assess the recoverability of long-lived assets based on the undiscounted future cash flow the assets areexpected to generate and recognize an impairment loss when estimated undiscounted future cash flows expectedto result from the use of the asset plus net proceeds expected from disposition of the asset, if any, are less than thecarrying value of the asset. When an impairment is identified, we reduce the carrying amount of the asset to itsestimated fair value based on a discounted cash flow approach or, when available and appropriate, to comparablemarket values. During the first quarter of 2020, we recorded an impairment of $4.0 for a business within theIndustrial Process segment. See Note 11, Plant, Property and Equipment, Net, for additional information.
Goodwill and Intangible AssetsGoodwill represents purchase consideration paid in a business combination that exceeds the values assigned
to the net assets of the acquired business. Intangible assets include customer relationships, proprietary technology,trademarks, patents and other intangible assets. Intangible assets with a finite life are generally amortized on astraight-line basis over an estimated economic useful life, which generally ranges from 7-20 years, and are testedfor impairment if indicators of impairment are identified. Certain of our intangible assets have an indefinite life,namely certain brands and trademarks.
Goodwill and indefinite-lived intangible assets are not amortized, but rather are tested for impairment annually(or more frequently if impairment indicators arise, such as changes to the reporting unit structure, significantadverse changes in the business climate or an adverse action or assessment by a regulator). We conduct ourannual impairment testing on the first day of the fourth fiscal quarter. We may perform an initial qualitativeevaluation which considers present events and circumstances, to determine the likelihood of impairment. If thelikelihood of impairment is not considered to be more likely than not, then no further testing is performed. If it isconsidered to be more likely than not that the asset is impaired based on the qualitative evaluation or we elect not toperform a qualitative evaluation, then a quantitative impairment test is performed. In the quantitative impairmenttest, the fair value of each reporting unit is compared to its carrying amount. If the fair value of a reporting unitexceeds its carrying value, there is no impairment. If the carrying value of the reporting unit exceeds its estimatedfair value, then we record an impairment loss equal to the difference. For indefinite-lived intangibles, if it isconsidered to be more likely than not that the asset is impaired, we compare the fair value of those assets to theircarrying value. We recognize an impairment loss when the estimated fair value of the indefinite-lived intangibleasset is less than its carrying value. During the first quarter of 2020, we determined that certain intangible assetswithin the Industrial Process segment, including an indefinite-lived trademark, customer relationships andproprietary technology, would not be recoverable, resulting in an impairment of $12.3. See Note 12, Goodwill andOther Intangible Assets, Net, for additional information.
We estimate the fair value of our reporting units using an income approach. Under the income approach, weestimate fair value based on the present value of estimated future cash flows. We estimate the fair value of ourindefinite-lived intangible assets using the relief from royalty method. The relief from royalty method estimates theportion of a company’s earnings attributable to an intellectual property asset based on an assumed royalty rate thatthe company would have paid had the asset not been owned.
Business CombinationsWe allocate the purchase price of acquisitions to the tangible and intangible assets acquired, liabilities
assumed, and non-controlling interests in the acquiree based on their estimated fair value at the acquisition date.Changes to acquisition date fair values prior to the expiration of the measurement period, a period not to exceed 12months from date of acquisition, are recorded as an adjustment to the associated goodwill in the reporting period inwhich the adjustment amounts are determined. Changes to acquisition date fair values after expiration of themeasurement period are recorded in earnings. The excess of the acquisition price over those estimated fair values
61

is recorded as goodwill. Acquisition-related expenses are expensed as incurred and the costs associated withrestructuring actions initiated after the acquisition are recognized separately from the business combination.
Commitments and ContingenciesWe record accruals for commitments and loss contingencies when it is probable that a liability has been
incurred and the amount of loss can be reasonably estimated. Significant judgment is required to determine bothprobability and the estimated amount of loss, and these assessments can involve a series of complex judgmentsabout future events and may rely on estimates and assumptions that have been deemed reasonable bymanagement. We review these accruals quarterly and adjust the accruals to reflect the impact of negotiations,settlements, rulings, advice of legal counsel, and other current information. See Note 20, Commitments andContingencies, for additional information.
Environmental-Related Liabilities and AssetsAccruals for environmental matters are recorded on a site-by-site basis when it is probable that a liability has
been incurred and the amount of the liability can be reasonably estimated, based on current law and existingtechnologies. Our estimated liability is reduced to reflect the participation of other potentially responsible parties inthose instances where it is probable that such parties are legally responsible and financially capable of paying theirrespective shares of the relevant costs, and that share can be reasonably estimated. Environmental liabilities areprimarily included in other non-current liabilities at undiscounted amounts.
The Company records an asset related to its environmental insurance and other expected third partyrecoveries. The environmental-related asset represents our best estimate of probable recoveries from third partiesfor costs incurred in past periods, as well as costs estimated to be incurred in future periods.
Environmental costs and related recoveries are recorded within general and administrative expenses on ourConsolidated Statements of Operations, other than those related to discontinued operations.
Foreign CurrencyThe national currencies of our foreign subsidiaries are generally the functional currencies. Balance Sheet
accounts are translated at the exchange rate in effect at the end of each period, except for equity which is translatedat historical rates; Statement of Operations accounts are translated at the average rates of exchange prevailingduring the period. Gains and losses resulting from foreign currency translation are reflected in the cumulativetranslation adjustments component of shareholders’ equity.
For foreign subsidiaries that do not use the local currency as their functional currency, foreign currency assetsand liabilities are remeasured to the foreign subsidiary’s functional currency using end of period exchange rates,except for nonmonetary balance sheet accounts, which are remeasured at historical exchange rates.
For transactions denominated in other than the functional currency, revenue and expenses are remeasured ataverage exchange rates in effect during the reporting period in which the transactions occurred, except forexpenses related to nonmonetary assets and liabilities. Transaction gains or losses from foreign currencyremeasurement are reported in general and administrative expenses in the Consolidated Statements of Operations.During 2021, we recognized a transaction gain of $1.9. During 2020, and 2019, we recognized transaction losses of$7.6, and $2.7, respectively.
Derivative Financial InstrumentsFrom time to time, the Company may use derivative financial instruments, primarily foreign currency forward
and option contracts, to mitigate exposure from foreign currency exchange rate fluctuations as it pertains to receiptsfrom customers, payments to suppliers and intercompany transactions; as well as from commodity pricefluctuations. We record derivatives at their fair value as either an asset or liability. For derivatives not designated ashedges, adjustments to reflect changes in the fair value of our derivatives are included in earnings. For cash flowhedges that qualify and are designated for hedge accounting, the effective portion of the change in fair value of thederivative is recorded in accumulated other comprehensive loss and subsequently recognized in earnings when thehedged transaction affects earnings. Any ineffective portion is recognized immediately in earnings. As ofDecember 31, 2021 and 2020, no derivatives were designated as hedges. The differentials paid or received oninterest rate swap agreements are recognized as adjustments to interest expense. Derivative contracts involve therisk of non-performance by the counterparty. The fair value of our foreign currency contracts are determined usingthe net position of the contracts and the applicable spot rates and forward rates as of the reporting date. See Note22, Derivative Financial Instruments, for additional information.
62

Related PartiesRelated party transactions include those between: a parent and its subsidiaries; subsidiaries of a common
parent; an entity and trusts for the benefit of employees, such as pension and profit-sharing trusts that are managedby or under the trusteeship of the entity’s management; an entity and its principal owners, management, ormembers of their immediate families; and affiliates. In January 2021, the Company entered into a three-monthconsulting agreement for $0.2 with Thomas Scalera, ITT's former Executive Vice President and Chief FinancialOfficer. The consulting agreement included, but was not limited to, financial, accounting, and investor relationsadvisory services.
NOTE 2RECENT ACCOUNTING PRONOUNCEMENTS
The Company considers the applicability and impact of all accounting standard updates (ASUs). ASUs not listedbelow were assessed and determined to be either not applicable or are expected to have minimal impact on ourconsolidated financial position or results of operations.
Measurement of Credit Losses on Financial Instruments (ASU 2016-13):
In June 2016, the FASB issued updated guidance that requires entities to use a current expected credit lossmodel to measure credit-related impairments for financial instruments held at amortized cost, including tradereceivables. The current expected credit loss model is based on relevant information about past events, includinghistorical experience, conditions at the date of measurement, and reasonable and supportable forecasts that affectcollectability. Current expected credit losses, and subsequent adjustments, represent an estimate of lifetimeexpected credit losses that are recorded as an allowance deducted from the amortized cost of the financialinstrument. The updated guidance was effective for the Company beginning on January 1, 2020 and was adoptedusing a modified retrospective transition approach, resulting in an increase in our allowance for credit losses relatedto receivables and contract assets. The cumulative effect of changes resulting from the adoption of ASU 2016-13was $1.2, net of tax, and was reflected in our Consolidated Balance Sheet within retained earnings as of January 1,2020. Refer to Note 8, Receivables, Net for additional information.
Reference Rate Reform (ASU 2021-01):
In March 2020 and January 2021, the FASB issued ASU 2020-04, Reference Rate Reform (Topic 848):Facilitation of the Effects of Reference Rate Reform on Financial Reporting and ASU 2021-01, Reference RateReform (Topic 848): Scope, respectively. Together, the ASUs provide temporary optional expedients and exceptionsto the U.S. GAAP guidance on contract modifications and hedge accounting to ease the financial reporting burdensrelated to the expected market transition from the London Interbank Offered Rate (LIBOR) and other interbankoffered rates to alternative reference rates. This guidance was effective beginning on March 12, 2020. We haveevaluated this guidance, and have concluded that it does not have a significant impact on our operating results,financial position, or cash flows.
63

NOTE 3SEGMENT INFORMATION
The Company’s segments are reported on the same basis used by our chief operating decision maker, forevaluating performance and for allocating resources. Our three reportable segments are referred to as: MotionTechnologies, Industrial Process, and Connect & Control Technologies.
Motion Technologies manufactures brake components and specialized sealing solutions, shock absorbers anddamping technologies primarily for the global automotive, truck and trailer, public bus and rail transportationmarkets.
Industrial Process manufactures engineered fluid process equipment serving a diversified mix of customers inglobal industries such as chemical, energy, mining, and other industrial process markets and is a provider ofplant optimization and efficiency solutions and aftermarket services and parts.
Connect & Control Technologies manufactures harsh-environment connector solutions, critical energyabsorption, flow control components, and composite materials for the aerospace and defense, generalindustrial, medical, and energy markets.
Corporate and Other consists of corporate office expenses including compensation, benefits, occupancy,depreciation, and other administrative costs, as well as charges related to certain matters, such as asbestos andenvironmental liabilities, that are managed at a corporate level and are not included in segment results whenevaluating performance or allocating resources. Assets of the segments exclude general corporate assets, whichprincipally consist of cash, investments, asbestos-related receivables, deferred taxes, and certain property, plantand equipment.
The following table presents our revenue, operating income, and operating margin for each segment.
Revenue Operating Income Operating MarginFor the Year Ended 2021 2020 2019 2021 2020 2019 2021 2020 2019Motion Technologies $1,368.6 $1,121.1 $1,241.8 $ 258.2 $ 184.0 $ 216.1 18.9 % 16.4 % 17.4 %Industrial Process 843.2 843.0 943.8 126.8 77.6 104.7 15.0 % 9.2 % 11.1 %Connect & ControlTechnologies 554.7 516.5 663.9 81.7 57.0 111.5 14.7 % 11.0 % 16.8 %Eliminations (1.5) (2.8) (3.1) — — — — — —Total segment results 2,765.0 2,477.8 2,846.4 466.7 318.6 432.3 16.9 % 12.9 % 15.2 %Asbestos-related benefit(costs), net(a) — — — 74.4 (66.3) 20.2 — — —Other corporate costs — — — (36.8) (25.8) (41.1) — — —
Total Corporate and otherbenefit (costs) — — — 37.6 (92.1) (20.9) — — —Total $2,765.0 $2,477.8 $2,846.4 $ 504.3 $ 226.5 $ 411.4 18.2 % 9.1 % 14.5 %
(a) The 2021 period includes a pre-tax gain of $88.8 resulting from the InTelCo Management LLC (InTelCo) divestituretransaction. The 2020 period includes the impact of extending the net asbestos measurement over the full time period weexpected claims to be filed against InTelCo. See Note 20, Commitments and Contingencies, for further information.
The following table presents our assets as of December 31, 2021 and 2020, as well as our capital expendituresand depreciation and amortization expense for the years ended December 31, 2021, 2020, and 2019, by segment.
AssetsCapital
ExpendituresDepreciation
and Amortization
2021 2020 2021 2020 2019 2021 2020 2019Motion Technologies $ 1,272.8 $ 1,202.3 $ 71.1 $ 43.8 $ 57.7 $ 64.1 $ 60.0 $ 58.6Industrial Process 1,030.0 1,069.6 6.7 8.3 11.2 22.3 23.7 26.3Connect & Control Technologies 719.3 720.5 8.5 10.6 19.4 21.8 23.1 21.8Corporate and Other(a) 543.3 1,285.2 2.1 1.0 3.1 4.9 5.4 6.7Total $ 3,565.4 $ 4,277.6 $ 88.4 $ 63.7 $ 91.4 $ 113.1 $ 112.2 $ 113.4
(a) The decrease in Corporate total assets during 2021 is due to the InTelCo divestiture transaction. See Note 20,Commitments and Contingencies, for further information.
64

The following table displays consolidated revenue by geographic region. Revenue is attributed to individualregions based on the destination of the product or service delivery.
For the Year Ended December 31, 2021Motion
TechnologiesIndustrialProcess
Connect &Control
Technologies Eliminations TotalNorth America(a) $ 249.9 $ 470.1 $ 331.4 $ (1.5) $ 1,049.9Europe(b) 798.8 96.0 115.5 — 1,010.3Asia(c) 307.8 99.8 84.0 — 491.6Middle East and Africa 1.0 97.7 18.1 — 116.8South America 11.1 79.6 5.7 — 96.4Total $ 1,368.6 $ 843.2 $ 554.7 $ (1.5) $ 2,765.0
For the Year Ended December 31, 2020North America(a) $ 187.3 $ 479.0 $ 319.3 $ (2.6) $ 983.0Europe(b) 676.4 95.5 97.4 — 869.3Asia(c) 243.8 93.1 77.0 (0.2) 413.7Middle East and Africa 1.5 92.0 18.8 — 112.3South America 12.1 83.4 4.0 — 99.5Total $ 1,121.1 $ 843.0 $ 516.5 $ (2.8) $ 2,477.8
For the Year Ended December 31, 2019North America(a) $ 204.4 $ 558.7 $ 431.9 $ (2.9) $ 1,192.1Europe(b) 780.5 89.7 125.9 — 996.1Asia(c) 241.7 101.9 83.8 (0.2) 427.2Middle East and Africa 2.3 114.1 16.3 — 132.7South America 12.9 79.4 6.0 — 98.3Total $ 1,241.8 $ 943.8 $ 663.9 $ (3.1) $ 2,846.4
(a) Includes revenue of $842.9, $811.0, and $989.4 from the United States for 2021, 2020, and 2019, respectively.(b) Includes revenue of $418.3, $334.9, and $391.2 from Germany for 2021, 2020, and 2019, respectively.(c) Includes revenue of $306.5, $232.9, and $227.6 from China for 2021, 2020, and 2019, respectively.
The following table displays Plant, Property and Equipment (PPE), net by geographic region.
As of December 31 2021 2020North America(a) $ 160.6 $ 174.1Europe(b) 263.8 263.8Asia(c) 81.1 83.7Middle East and Africa 0.6 0.2South America 3.0 3.3Total $ 509.1 $ 525.1
(a) Includes PPE, net of $130.3 and $141.8 in the United States as of December 31, 2021 and 2020, respectively.(b) Includes PPE, net of $115.7 and $108.2 in Italy as of December 31, 2021 and 2020, respectively.(c) Includes PPE, net of $52.5 and $51.7 in China as of December 31, 2021 and 2020, respectively.
65

NOTE 4REVENUE
The following table represents our revenue disaggregated by end market.
For the Year Ended December 31, 2021Motion
TechnologiesIndustrialProcess
Connect &Control
Technologies Eliminations TotalAuto and rail $1,335.1 $ — $ — $ — $1,335.1Chemical and industrial pumps — 659.0 — — 659.0Aerospace and defense 8.3 — 261.4 — 269.7Energy — 184.2 38.1 — 222.3General industrial 25.2 — 255.2 (1.5) 278.9
Total $1,368.6 $ 843.2 $ 554.7 $ (1.5) $2,765.0
For the Year Ended December 31, 2020Auto and rail $ 1,104.6 $ — $ — $ (0.2) $1,104.4Chemical and industrial pumps — 660.5 — — 660.5Aerospace and defense 6.7 — 284.7 — 291.4Energy — 182.5 31.3 — 213.8General industrial 9.8 — 200.5 (2.6) 207.7Total $ 1,121.1 $ 843.0 $ 516.5 $ (2.8) $2,477.8
For the Year Ended December 31, 2019Auto and rail $ 1,222.6 $ — $ — $ (0.2) $1,222.4Chemical and industrial pumps — 701.7 — — 701.7Aerospace and defense 9.1 — 409.2 — 418.3Energy — 242.1 39.4 — 281.5General industrial 10.1 — 215.3 (2.9) 222.5Total $ 1,241.8 $ 943.8 $ 663.9 $ (3.1) $2,846.4
During 2021, 2020, and 2019, a single external customer, Continental AG, accounted for 9.8%, 9.1%, and 9.8%of consolidated ITT revenue, respectively. Revenue from this customer is reported within our Motion Technologiessegment.
Revenue recognized related to our Industrial Process segment primarily consists of pumps, valves and plantoptimization systems and related services which serve the general industrial, energy, chemical and petrochemical,pharmaceutical, mining, pulp and paper, food and beverage, and power generation markets. Many of IndustrialProcess’s products are highly engineered and customized to our customer needs and therefore do not have analternative use. For these longer term design and build projects, if the contract states that we also have anenforceable right to payment, we recognize revenue over time using the cost-to-cost method as we satisfy theperformance obligations identified in the contract. If no right to payment exists, revenue is recognized at a point intime, generally based on shipping terms. A majority of our design and build project contracts currently do not have aright to payment. For pumps that do have an alternative use to us, revenue is recognized at a point in time.Revenue on service and repair contracts, representing 3% of consolidated ITT revenue in 2021 and 4% in 2020and 2019, is recognized after the services have been rendered or over the service contract period.
Our Motion Technologies segment manufactures brake pads, shims, shock absorbers, and energy absorptioncomponents, and sealing technologies primarily for the transportation industry. Our Connect & Control Technologiessegment designs and manufactures a range of highly engineered connectors and specialized control componentsfor critical applications supporting various markets including aerospace and defense, industrial, transportation,medical, and energy. In both of these segments, most products have an alternative use. Therefore, revenue forthose products is recognized at a point in time when control passes to the customer. In certain circumstances, wehave concluded we do not have an alternative use for the component product. In these cases, due to the short-termnature of the production process we use a units-of-delivery method of revenue recognition.
66

Contract Assets and Liabilities
Contract assets consist of unbilled amounts where revenue recognized exceeds customer billings. Contractliabilities consist of advance payments and billings in excess of revenue recognized. The following table representsour net contract assets and liabilities.
As of December 31 2021 2020 ChangeCurrent contract assets $ 20.6 $ 19.1 7.9 %Noncurrent contract assets 0.3 — **Current contract liabilities (46.6) (56.2) (17.1)%Noncurrent contract liabilities (4.4) (0.1) **Net contract liabilities $ (30.1) $ (37.2) (19.1)%
** Resulting percentage change not considered meaningful
Our net contract liability decreased $7.1, or 19.1%, during 2021. During 2021, we recognized revenue of $48.5,related to contract liabilities at December 31, 2020.
The aggregate amount of the transaction price allocated to unsatisfied or partially satisfied performanceobligations was $891.3 as of December 31, 2021. Of this amount, we expect to recognize approximately $770 to$790 of revenue during 2022 and the remainder thereafter.
As of December 31, 2021 and 2020, deferred contract costs, net were $5.5 and $6.5, respectively, primarilyrelated to pre-contract costs. During 2021 and 2020, we amortized $0.9 and $1.6, respectively.
NOTE 5RESTRUCTURING ACTIONS
We have initiated various restructuring actions throughout our businesses during the past three years. The 2020Global Restructuring Plan identified as individually significant is described further below. There were no otherrestructuring actions considered individually significant. The following table provides restructuring costs bycomponent and by segment.
For the Year Ended December 31 2021 2020 2019By component:Severance and other employee-related costs $ 8.0 $ 41.5 $ 12.4Asset write-offs 0.6 — —Other 1.0 1.5 0.4
Total restructuring costs $ 9.6 $ 43.0 $ 12.8By segment:Motion Technologies $ 3.9 $ 12.7 $ 4.9Industrial Process 3.1 19.5 5.7Connect & Control Technologies 2.4 8.5 2.0Corporate and Other 0.2 2.3 0.2
67

The following table displays a rollforward of our total restructuring liability, presented on our ConsolidatedBalance Sheet within accrued liabilities.
2021 2020Restructuring liability - January 1 $ 19.1 $ 7.5Restructuring costs 11.7 44.1Reversal of prior accruals (2.1) (1.1)Cash payments (16.5) (33.0)Asset write-offs (0.6) —Foreign exchange translation and other (0.6) 1.6
Restructuring liability - December 31 $ 11.0 $ 19.1By accrual type:Severance and other employee-related $ 10.9 $ 18.6Other 0.1 0.5
2020 Global Restructuring Plan
During 2020, an organizational-wide restructuring plan was initiated to reduce the overall cost structure of theCompany primarily in response to an anticipated reduction in demand from the COVID-19 pandemic (the 2020Global Restructuring Plan). Total restructuring charges incurred in connection with the restructuring plan through theDecember 31, 2021 were $46.6, principally related to involuntary severance costs. Additional restructuring chargesto complete this action are not expected to be significant.
The following table summarizes the restructuring costs incurred during 2021 and the cumulative costs incurredthrough December 31, 2021 by segment related to the 2020 Global Restructuring Plan.
Incurredin 2021
Incurredto Date
Motion Technologies $ — $ 12.7Industrial Process 2.5 22.5Connect & Control Technologies — 8.8Corporate and Other — 2.6Total $ 2.5 $ 46.6
The following table displays a rollforward of the restructuring liability related to the 2020 Global RestructuringPlan, which we expect to be substantially paid during 2022.
2021 2020Beginning balance - January 1 $ 17.1 $ —Restructuring costs 2.5 43.8Cash payments (13.6) (27.9)Asset write-offs (0.6) —Foreign exchange translation and other (0.6) 1.2
Ending balance - December 31 $ 4.8 $ 17.1
68
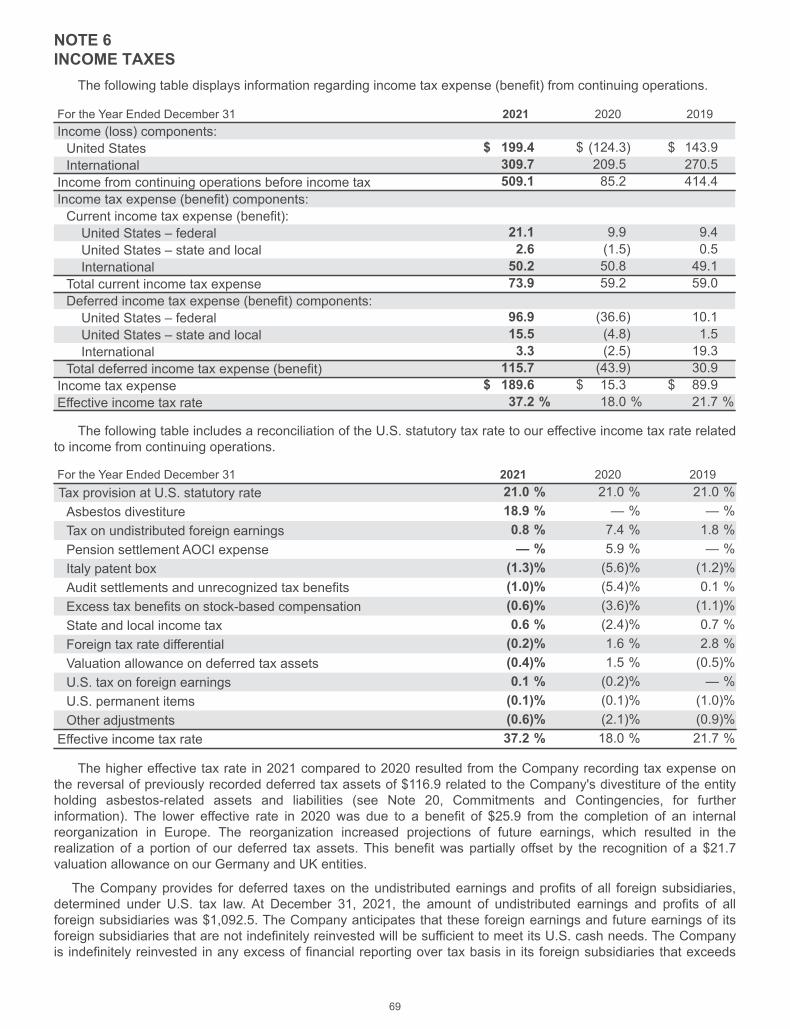
NOTE 6INCOME TAXES
The following table displays information regarding income tax expense (benefit) from continuing operations.
For the Year Ended December 31 2021 2020 2019Income (loss) components:United States $ 199.4 $ (124.3) $ 143.9International 309.7 209.5 270.5Income from continuing operations before income tax 509.1 85.2 414.4Income tax expense (benefit) components:Current income tax expense (benefit):United States – federal 21.1 9.9 9.4United States – state and local 2.6 (1.5) 0.5International 50.2 50.8 49.1
Total current income tax expense 73.9 59.2 59.0Deferred income tax expense (benefit) components:United States – federal 96.9 (36.6) 10.1United States – state and local 15.5 (4.8) 1.5International 3.3 (2.5) 19.3
Total deferred income tax expense (benefit) 115.7 (43.9) 30.9Income tax expense $ 189.6 $ 15.3 $ 89.9Effective income tax rate 37.2 % 18.0 % 21.7 %
The following table includes a reconciliation of the U.S. statutory tax rate to our effective income tax rate relatedto income from continuing operations.
For the Year Ended December 31 2021 2020 2019Tax provision at U.S. statutory rate 21.0 % 21.0 % 21.0 %Asbestos divestiture 18.9 % — % — %Tax on undistributed foreign earnings 0.8 % 7.4 % 1.8 %Pension settlement AOCI expense — % 5.9 % — %Italy patent box (1.3)% (5.6)% (1.2)%Audit settlements and unrecognized tax benefits (1.0)% (5.4)% 0.1 %Excess tax benefits on stock-based compensation (0.6)% (3.6)% (1.1)%State and local income tax 0.6 % (2.4)% 0.7 %Foreign tax rate differential (0.2)% 1.6 % 2.8 %Valuation allowance on deferred tax assets (0.4)% 1.5 % (0.5)%U.S. tax on foreign earnings 0.1 % (0.2)% — %U.S. permanent items (0.1)% (0.1)% (1.0)%Other adjustments (0.6)% (2.1)% (0.9)%Effective income tax rate 37.2 % 18.0 % 21.7 %
The higher effective tax rate in 2021 compared to 2020 resulted from the Company recording tax expense onthe reversal of previously recorded deferred tax assets of $116.9 related to the Company's divestiture of the entityholding asbestos-related assets and liabilities (see Note 20, Commitments and Contingencies, for furtherinformation). The lower effective rate in 2020 was due to a benefit of $25.9 from the completion of an internalreorganization in Europe. The reorganization increased projections of future earnings, which resulted in therealization of a portion of our deferred tax assets. This benefit was partially offset by the recognition of a $21.7valuation allowance on our Germany and UK entities.
The Company provides for deferred taxes on the undistributed earnings and profits of all foreign subsidiaries,determined under U.S. tax law. At December 31, 2021, the amount of undistributed earnings and profits of allforeign subsidiaries was $1,092.5. The Company anticipates that these foreign earnings and future earnings of itsforeign subsidiaries that are not indefinitely reinvested will be sufficient to meet its U.S. cash needs. The Companyis indefinitely reinvested in any excess of financial reporting over tax basis in its foreign subsidiaries that exceeds
69

undistributed earnings and profits. At December 31, 2021, the indefinitely reinvested excess of financial reportingover tax basis was $196.4.
Deferred tax assets and liabilities include the following:
As of December 31 2021 2020Deferred Tax Assets:Loss carryforwards $ 121.3 $ 128.6Asbestos — 116.7Employee benefits 60.1 64.7Accruals 32.0 36.8Inventory 22.7 22.5Credit carryforwards 6.2 3.4Investment 1.7 0.5Other 20.9 27.0Gross deferred tax assets 264.9 400.2Less: Valuation allowance 108.8 123.0Net deferred tax assets $ 156.1 $ 277.2Deferred Tax Liabilities:Intangibles $ (38.0) $ (40.9)Undistributed earnings (46.5) (49.2)Accelerated depreciation (27.3) (30.3)Total deferred tax liabilities $ (111.8) $ (120.4)Net deferred tax assets $ 44.3 $ 156.8
Deferred taxes are presented in the Consolidated Balance Sheets as follows:
As of December 31 2021 2020Non-current assets $ 63.4 $ 158.3Other non-current liabilities (19.1) (1.5)Net deferred tax assets $ 44.3 $ 156.8
The table included below provides a rollforward of our valuation allowance on net deferred income tax assets.State Foreign Total
DTA valuation allowance - December 31, 2018 $ 57.3 $ 83.7 $ 141.0Change in assessment — 5.6 5.6Current year operations (8.8) (8.0) (16.8)DTA valuation allowance - December 31, 2019 $ 48.5 $ 81.3 $ 129.8Change in assessment — (6.2) (6.2)Current year operations (8.1) 7.5 (0.6)DTA valuation allowance - December 31, 2020 $ 40.4 $ 82.6 $ 123.0Change in assessment — (1.9) (1.9)Current year operations (4.7) (7.6) (12.3)DTA valuation allowance - December 31, 2021 $ 35.7 $ 73.1 $ 108.8
The Company continues to maintain a valuation allowance against certain deferred tax assets attributable tostate net operating losses and tax credits, and certain foreign net deferred tax assets primarily in Luxembourg,China, and Germany which are not expected to be realized. Management assesses the available positive andnegative evidence to estimate whether sufficient future taxable income will be generated to permit the use ofdeferred tax assets. The cumulative loss incurred over the three-year period ending December 31, 2021 constitutessignificant objective negative evidence, resulting in the recognition of a valuation allowance against the net deferredtax assets for these jurisdictions. Such objective negative evidence limits our ability to consider subjective positiveevidence, such as our projections of future taxable income. The amount of the deferred tax asset considered
70
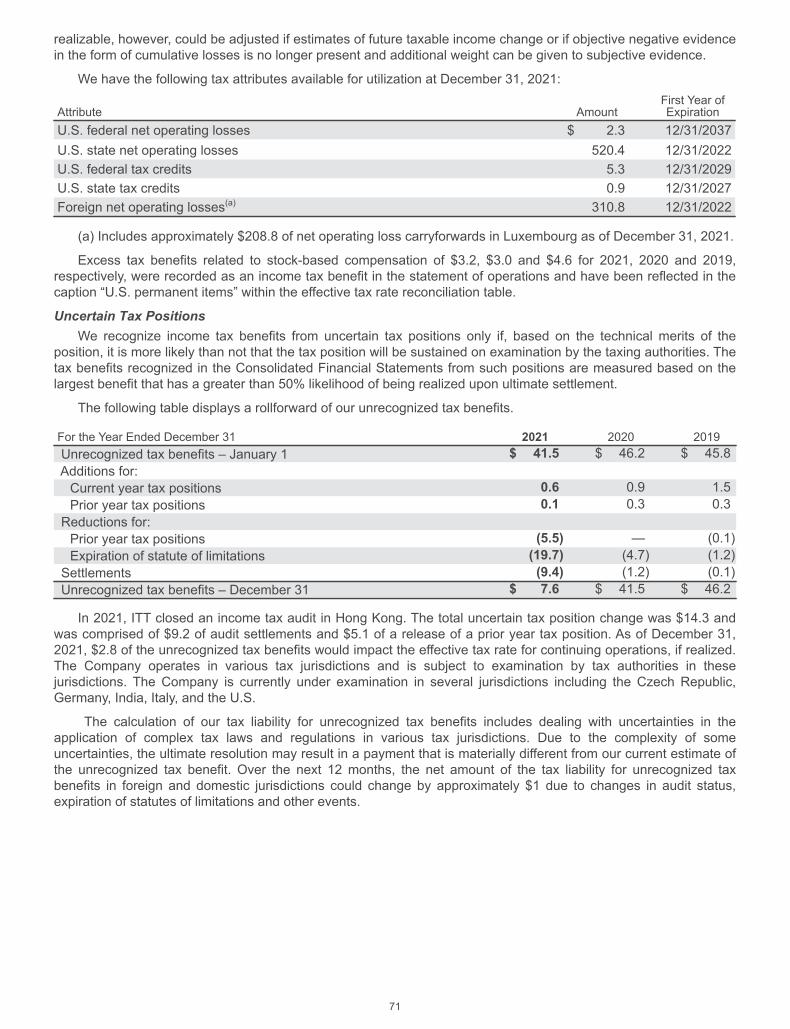
realizable, however, could be adjusted if estimates of future taxable income change or if objective negative evidencein the form of cumulative losses is no longer present and additional weight can be given to subjective evidence.
We have the following tax attributes available for utilization at December 31, 2021:
Attribute AmountFirst Year ofExpiration
U.S. federal net operating losses $ 2.3 12/31/2037U.S. state net operating losses 520.4 12/31/2022U.S. federal tax credits 5.3 12/31/2029U.S. state tax credits 0.9 12/31/2027Foreign net operating losses(a) 310.8 12/31/2022
(a) Includes approximately $208.8 of net operating loss carryforwards in Luxembourg as of December 31, 2021.
Excess tax benefits related to stock-based compensation of $3.2, $3.0 and $4.6 for 2021, 2020 and 2019,respectively, were recorded as an income tax benefit in the statement of operations and have been reflected in thecaption “U.S. permanent items” within the effective tax rate reconciliation table.
Uncertain Tax PositionsWe recognize income tax benefits from uncertain tax positions only if, based on the technical merits of the
position, it is more likely than not that the tax position will be sustained on examination by the taxing authorities. Thetax benefits recognized in the Consolidated Financial Statements from such positions are measured based on thelargest benefit that has a greater than 50% likelihood of being realized upon ultimate settlement.
The following table displays a rollforward of our unrecognized tax benefits.
For the Year Ended December 31 2021 2020 2019Unrecognized tax benefits – January 1 $ 41.5 $ 46.2 $ 45.8Additions for:Current year tax positions 0.6 0.9 1.5Prior year tax positions 0.1 0.3 0.3Reductions for:Prior year tax positions (5.5) — (0.1)Expiration of statute of limitations (19.7) (4.7) (1.2)Settlements (9.4) (1.2) (0.1)Unrecognized tax benefits – December 31 $ 7.6 $ 41.5 $ 46.2
In 2021, ITT closed an income tax audit in Hong Kong. The total uncertain tax position change was $14.3 andwas comprised of $9.2 of audit settlements and $5.1 of a release of a prior year tax position. As of December 31,2021, $2.8 of the unrecognized tax benefits would impact the effective tax rate for continuing operations, if realized.The Company operates in various tax jurisdictions and is subject to examination by tax authorities in thesejurisdictions. The Company is currently under examination in several jurisdictions including the Czech Republic,Germany, India, Italy, and the U.S.
The calculation of our tax liability for unrecognized tax benefits includes dealing with uncertainties in theapplication of complex tax laws and regulations in various tax jurisdictions. Due to the complexity of someuncertainties, the ultimate resolution may result in a payment that is materially different from our current estimate ofthe unrecognized tax benefit. Over the next 12 months, the net amount of the tax liability for unrecognized taxbenefits in foreign and domestic jurisdictions could change by approximately $1 due to changes in audit status,expiration of statutes of limitations and other events.
71
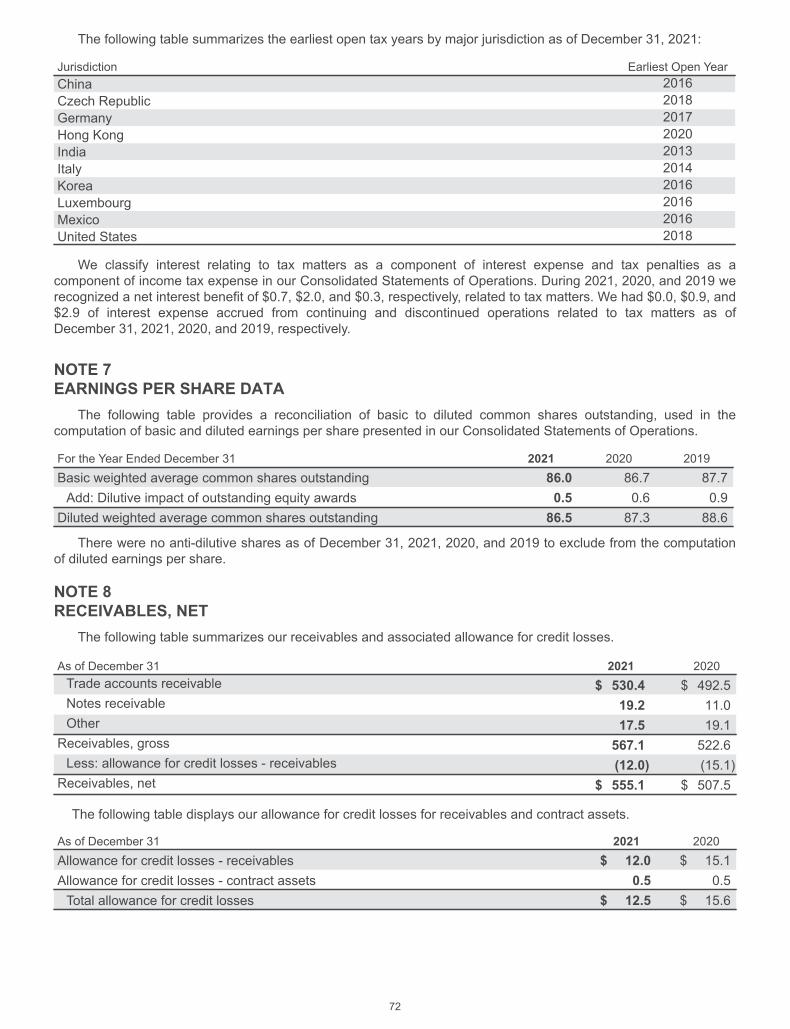
The following table summarizes the earliest open tax years by major jurisdiction as of December 31, 2021:
Jurisdiction Earliest Open YearChina 2016Czech Republic 2018Germany 2017Hong Kong 2020India 2013Italy 2014Korea 2016Luxembourg 2016Mexico 2016United States 2018
We classify interest relating to tax matters as a component of interest expense and tax penalties as acomponent of income tax expense in our Consolidated Statements of Operations. During 2021, 2020, and 2019 werecognized a net interest benefit of $0.7, $2.0, and $0.3, respectively, related to tax matters. We had $0.0, $0.9, and$2.9 of interest expense accrued from continuing and discontinued operations related to tax matters as ofDecember 31, 2021, 2020, and 2019, respectively.
NOTE 7EARNINGS PER SHARE DATA
The following table provides a reconciliation of basic to diluted common shares outstanding, used in thecomputation of basic and diluted earnings per share presented in our Consolidated Statements of Operations.
For the Year Ended December 31 2021 2020 2019Basic weighted average common shares outstanding 86.0 86.7 87.7Add: Dilutive impact of outstanding equity awards 0.5 0.6 0.9Diluted weighted average common shares outstanding 86.5 87.3 88.6
There were no anti-dilutive shares as of December 31, 2021, 2020, and 2019 to exclude from the computationof diluted earnings per share.
NOTE 8RECEIVABLES, NET
The following table summarizes our receivables and associated allowance for credit losses.
As of December 31 2021 2020Trade accounts receivable $ 530.4 $ 492.5Notes receivable 19.2 11.0Other 17.5 19.1Receivables, gross 567.1 522.6Less: allowance for credit losses - receivables (12.0) (15.1)Receivables, net $ 555.1 $ 507.5
The following table displays our allowance for credit losses for receivables and contract assets.
As of December 31 2021 2020Allowance for credit losses - receivables $ 12.0 $ 15.1Allowance for credit losses - contract assets 0.5 0.5Total allowance for credit losses $ 12.5 $ 15.6
72

The following table displays a rollforward of our total allowance for credit losses.
2021 2020 2019Total allowance for credit losses – January 1 $ 15.6 $ 12.8 $ 18.3Impact of adoption of ASU 2016-13 (See Note 2) — 1.7 —(Recoveries) charges to income, net (2.0) 6.2 3.5Write-offs (1.0) (5.5) (9.2)Foreign currency and other (0.1) 0.4 0.2Total allowance for credit losses – December 31 $ 12.5 $ 15.6 $ 12.8
NOTE 9INVENTORIES, NET
The following table summarizes our net inventories.
As of December 31 2021 2020Finished goods $ 73.0 $ 63.1Work in process 92.3 77.5Raw materials 265.6 219.9Inventories, net $ 430.9 $ 360.5
NOTE 10OTHER CURRENT AND NON-CURRENT ASSETS
The following table summarizes our other current and non-current assets.
As of December 31 2021 2020Advance payments and other prepaid expenses $ 44.1 $ 39.6Current contract assets, net 20.6 19.1Prepaid income taxes 10.4 29.0Asbestos-related assets (See Note 20) — 91.0Other 13.5 10.8Other current assets $ 88.6 $ 189.5Other employee benefit-related assets $ 118.4 $ 113.9Operating lease right-of-use assets 78.0 87.3Capitalized software costs 16.7 23.9Equity method and other investments 14.5 11.7Environmental-related assets 8.5 10.6Other 24.7 24.6Other non-current assets $ 260.8 $ 272.0
73

NOTE 11PLANT, PROPERTY AND EQUIPMENT, NET
The following table summarizes our property, plant, and equipment, net of accumulated depreciation.
As of December 31Useful life(in years) 2021 2020
Machinery and equipment 2 - 10 $ 1,202.0 $ 1,205.7Buildings and improvements 5 - 40 265.5 273.9Furniture, fixtures and office equipment 3 - 7 78.3 82.0Construction work in progress 62.8 44.7Land and improvements 32.5 34.6Other 4.3 5.0Plant, property and equipment, gross 1,645.4 1,645.9Less: accumulated depreciation (1,136.3) (1,120.8)Plant, property and equipment, net $ 509.1 $ 525.1
Depreciation expense of $85.8, $83.2 and $84.1 was recognized in 2021, 2020 and 2019, respectively.
During 2020, we recorded an impairment of $4.0 for a business within our IP segment due to challengingeconomic conditions in the upstream oil and gas market combined with impacts associated with the COVID-19pandemic. Long-lived assets of the business, with a carrying value of $14.0, primarily building and improvements,machinery and equipment, were reduced to their estimated fair value of $10.0. Our estimate of fair value,categorized within Level 3 of the fair value hierarchy, was determined based on a market approach estimating thenet proceeds that would be received for the sale of the assets. Significant additional adverse changes to theeconomic environment and future cash flows of other businesses could cause us to record additional impairmentcharges in future periods, which may be material.
NOTE 12GOODWILL AND OTHER INTANGIBLE ASSETS, NETGoodwill
The following table provides a rollforward of the carrying amount of goodwill by segment.
MotionTechnologies
IndustrialProcess
Connect &Control
Technologies TotalGoodwill - December 31, 2019 $ 293.6 $ 354.1 $ 279.5 $ 927.2Adjustments to purchase price allocations — (2.5) — (2.5)Foreign currency 4.5 13.8 1.8 20.1Goodwill - December 31, 2020 $ 298.1 $ 365.4 $ 281.3 $ 944.8Foreign currency (5.8) (13.0) (1.7) (20.5)Goodwill - December 31, 2021 $ 292.3 $ 352.4 $ 279.6 $ 924.3
74
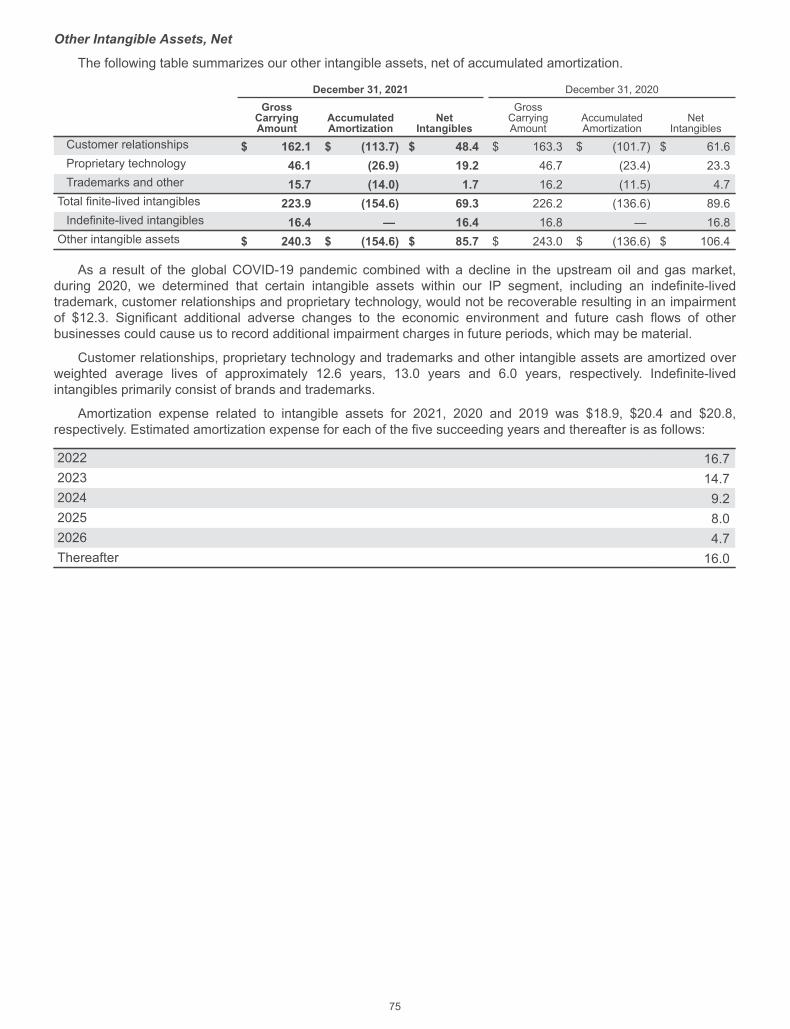
Other Intangible Assets, Net
The following table summarizes our other intangible assets, net of accumulated amortization.
December 31, 2021 December 31, 2020GrossCarryingAmount
AccumulatedAmortization
NetIntangibles
GrossCarryingAmount
AccumulatedAmortization
NetIntangibles
Customer relationships $ 162.1 $ (113.7) $ 48.4 $ 163.3 $ (101.7) $ 61.6Proprietary technology 46.1 (26.9) 19.2 46.7 (23.4) 23.3Trademarks and other 15.7 (14.0) 1.7 16.2 (11.5) 4.7Total finite-lived intangibles 223.9 (154.6) 69.3 226.2 (136.6) 89.6Indefinite-lived intangibles 16.4 — 16.4 16.8 — 16.8Other intangible assets $ 240.3 $ (154.6) $ 85.7 $ 243.0 $ (136.6) $ 106.4
As a result of the global COVID-19 pandemic combined with a decline in the upstream oil and gas market,during 2020, we determined that certain intangible assets within our IP segment, including an indefinite-livedtrademark, customer relationships and proprietary technology, would not be recoverable resulting in an impairmentof $12.3. Significant additional adverse changes to the economic environment and future cash flows of otherbusinesses could cause us to record additional impairment charges in future periods, which may be material.
Customer relationships, proprietary technology and trademarks and other intangible assets are amortized overweighted average lives of approximately 12.6 years, 13.0 years and 6.0 years, respectively. Indefinite-livedintangibles primarily consist of brands and trademarks.
Amortization expense related to intangible assets for 2021, 2020 and 2019 was $18.9, $20.4 and $20.8,respectively. Estimated amortization expense for each of the five succeeding years and thereafter is as follows:
2022 16.72023 14.72024 9.22025 8.02026 4.7Thereafter 16.0
75

NOTE 13ACCRUED LIABILITIES AND OTHER NON-CURRENT LIABILITIES
The following table summarizes our accrued liabilities and other non-current liabilities.
As of December 31 2021 2020Compensation and other employee-related benefits $ 155.2 $ 137.3Contract liabilities and other customer-related liabilities 69.1 73.7Accrued income taxes and other tax-related liabilities 33.6 36.9Operating lease liabilities 20.1 19.8Accrued warranty costs 17.7 23.1Environmental and other legal matters 13.5 19.1Accrued restructuring costs 11.0 19.1Asbestos-related liabilities (see Note 20) — 91.4Other 37.1 37.0Accrued and other current liabilities $ 357.3 $ 457.4Operating lease liabilities $ 64.0 $ 72.4Environmental liabilities 50.1 50.1Deferred income taxes and other tax-related liabilities 29.0 11.9Compensation and other employee-related benefits 29.2 29.4Non-current maturities of long-term debt 9.9 13.0Other 24.3 33.8Other non-current liabilities $ 206.5 $ 210.6
NOTE 14LEASES
The Company’s lease portfolio primarily relates to real estate, which may be used for manufacturing or non-manufacturing purposes (e.g., office space), and contains lease terms generally ranging between one and 18 years.Our lease portfolio also includes vehicles and equipment. Substantially all of our leases are classified as operatingleases.
Short-term lease costs, variable lease costs, finance lease costs, and sublease income were not material for theyears ended December 31, 2021, 2020 and 2019. Operating lease costs were $25.7, $25.0, and $25.1 for the yearsended December 31, 2021, 2020 and 2019, respectively.
The following table displays our future lease obligations related to non-cancellable operating leases with aninitial term in excess of 12 months as of December 31, 2021
2022 $ 19.92023 17.92024 13.32025 10.42026 8.9Thereafter 21.4Total undiscounted future operating lease obligations 91.8Less: imputed interest 7.7Present value of future operating lease obligations $ 84.1
76

The following table includes other supplemental information regarding our operating leases.
As of or for the Year Ended December 31 2021 2020Operating cash outflows from operating leases $ 23.4 $ 22.6Right-of-use assets obtained in exchange for new operating lease liabilities $ 16.9 $ 28.0Weighted average remaining lease term (in years) 6.0 6.4Weighted average discount rate(a) 2.5 % 2.6 %
(a) We use a discount rate for each lease based on an estimated incremental borrowing rate over a similar term as the lease,as the discount rate implicit in each lease cannot be readily determined.
NOTE 15DEBT
The following table summarizes our outstanding debt obligations.
As of December 31 2021 2020Commercial paper $ 195.4 $ 104.3Current maturities of long-term debt 2.2 2.5Commercial paper and current maturities of long-term debt 197.6 106.8Non-current maturities of long-term debt 9.9 13.0Total debt $ 207.5 $ 119.8
Commercial Paper
Commercial paper outstanding as of December 31, 2021 was issued through both the Company’s U.S. andEuro programs. Commercial paper outstanding under the U.S. program was $150.0, with a weighted averageinterest rate of 0.28%. Commercial paper outstanding under the Euro program was $45.4, with a weighted averagenegative interest rate of (0.47)%. Commercial paper outstanding of $104.3 as of December 31, 2020 was issuedentirely under the Company’s Euro program and had a weighted average negative interest rate of (0.06)%.Outstanding commercial paper for both periods had maturity terms less than three months from the date ofissuance.
Short-term Loans
On August 5, 2021, we entered into a revolving credit facility agreement with a syndicate of third party lendersincluding Bank of America, N.A., as administrative agent (the 2021 Revolving Credit Agreement). Upon itseffectiveness, this agreement replaced our existing $500 revolving credit facility due November 2022 (the 2014Revolving Credit Agreement). The 2021 Revolving Credit Agreement matures in August 2026 and provides for anaggregate principal amount of up to $700. The 2021 Revolving Credit Agreement provides for a potential increase ofcommitment of up to $350 for a possible maximum of $1,050 in aggregate commitments at the request of theCompany and with the consent of the institutions providing such increase of commitments.
The interest rate per annum on the 2021 Revolving Credit Agreement is based on the LIBOR rate of the currencywe borrow in, plus a margin of 1.1%, with applicable benchmark replacement rates for the currencies availablewhen LIBOR is phased out as a result of the ongoing reference rate reform. As of December 31, 2021 andDecember 31, 2020, we had no outstanding obligations under the current or former revolving credit facility. There isa 0.15% fee per annum applicable to the commitments under the 2021 Revolving Credit Agreement. The marginand fees are subject to adjustment should the Company’s credit ratings change.
The 2021 Revolving Credit Agreement contains customary affirmative and negative covenants that, among otherthings, will limit or restrict our ability to: incur additional debt or issue guarantees; create certain liens; merge orconsolidate with another person; sell, transfer, lease or otherwise dispose of assets; liquidate or dissolve; and enterinto restrictive covenants. Additionally, the 2021 Revolving Credit Agreement requires us not to permit the ratio ofconsolidated total indebtedness to consolidated earnings before interest, taxes, depreciation and amortization(EBITDA) (leverage ratio) to exceed 3.50 to 1.00, with a qualified acquisition step up immediately following suchqualified acquisition of 4.00 to 1.00 for four quarters, 3.75 to 1.00 for two quarters thereafter, and returning to 3.50 to1.00 thereafter.
77

As of December 31, 2021, our leverage ratio associated with the 2021 Revolving Credit Agreement was withinthe prescribed threshold.
On April 29, 2020, we entered into two 364-day term revolving credit agreements totaling $200 (the IncrementalRevolving Credit Agreements) which provided the Company with additional liquidity in excess of the 2014 RevolvingCredit Agreement. The credit agreements expired in April 2021 and we did not borrow under these agreements andopted not to renew. Borrowings were available in U.S. dollars and the interest rate per annum was based on theLIBOR rate, adjusted for statutory reserve requirements, plus a margin of up to 1.55%. The Incremental RevolvingCredit Agreements were subject to fees of up to 0.35% per annum.
Long-term Debt
Our long-term debt is specific to outstanding Italian government loans maturing in June 2027. These loans carrya weighted average fixed interest rate of 0.71% and require annual principal and interest payments of approximately$2.2 through maturity. The non-current portion of long-term debt is presented within other non-current liabilities inour Consolidated Balance Sheets.
NOTE 16POSTRETIREMENT BENEFIT PLANSDefined Contribution Plans
Substantially all of ITT’s U.S. and certain international employees are eligible to participate in a definedcontribution plan. ITT sponsors numerous defined contribution savings plans, which allow employees to contribute aportion of their pre-tax and/or after-tax income in accordance with specified guidelines. Certain plans require us tomatch a portion of the employee contributions. Company contributions charged to expense amounted to $14.5,$10.6 and $17.6 for 2021, 2020 and 2019, respectively. Contributions during 2020 were impacted by a temporarysuspension of select 401(k) benefits for certain U.S. participants as a cost reduction measure in response to theCOVID-19 pandemic.
The ITT Stock Fund, an investment option in our U.S. based defined contribution plan, is considered anemployee stock ownership plan and, as a result, participants in the ITT Stock Fund may receive dividends in cashor may reinvest such dividends into the ITT Stock Fund. The ITT Stock Fund held approximately 0.1 shares of ITTcommon stock at December 31, 2021.
Defined Benefit Plans
ITT currently sponsors a number of defined benefit pension plans, primarily outside of the U.S., which haveapproximately 950 active participants. As of December 31, 2021, international pension plans represented 86% ofour total projected pension benefit obligation. There is one remaining U.S. pension plan, which is frozen to newparticipants. International plan benefits are primarily determined based on participant years of service, futurecompensation, and age at retirement or termination.
ITT also provides health care and life insurance benefits for eligible U.S. employees upon retirement. In somecases, the plan is still open to certain union employees, but the majority of these plans are closed to newparticipants. The majority of the liability pertains to retirees with postretirement medical insurance.
U.S. Qualified Pension Plan Termination
In 2020, the Company terminated its U.S. qualified pension plan by purchasing a group annuity contract fromMassMutual Life Insurance Company (MassMutual), which fully assumed the responsibility for paying andadministering pension benefits to approximately five thousand plan participants and their beneficiaries. Inconnection with the plan termination, the Company settled all future obligations under the plan by providing lumpsum payments to eligible participants who elected to receive them, and by transferring the remaining projectedbenefit obligation to the insurance company. Consequently, in 2020, the Company recognized a settlement chargeof $136.9 within non-operating expenses, which primarily represents the acceleration of deferred charges previouslyincluded within accumulated other comprehensive loss and derecognition of the net assets of the plan. Thetermination was initially funded with plan assets of approximately $320 and cash of $8.4. In 2021, the funding wasfinalized, resulting in a gain of $3.4 presented within the non-operating postretirement (benefit) costs line in theConsolidated Statements of Operations.
78

Balance Sheet Information
The following table provides a summary of the funded status of our postretirement benefit plans and thepresentation of the funded status within our Consolidated Balance Sheet as of December 31, 2021 and 2020.
2021 2020
PensionOtherBenefits Total Pension
OtherBenefits Total
Fair value of plan assets $ 0.5 $ — $ 0.5 $ 0.5 $ — $ 0.5
Projected benefit obligation 107.9 106.4 214.3 124.5 118.3 242.8
Funded status $ (107.4) $ (106.4) $ (213.8) $ (124.0) $ (118.3) $ (242.3)
Amounts reported within:
Non-current assets $ 0.2 $ — $ 0.2 $ 0.2 $ — $ 0.2
Accrued liabilities (5.5) (8.6) (14.1) (5.8) (9.2) (15.0)
Non-current liabilities (102.1) (97.8) (199.9) (118.4) (109.1) (227.5)
A portion of our projected benefit obligation includes amounts that have not yet been recognized as expense inour results of operations. Such amounts are recorded within accumulated other comprehensive loss until they areamortized as a component of net periodic postretirement cost. The following table provides a summary of amountsrecorded within accumulated other comprehensive loss at December 31, 2021 and 2020.
2021 2020
PensionOtherBenefits Total Pension
OtherBenefits Total
Net actuarial loss $ 30.0 $ 28.4 $ 58.4 $ 40.9 $ 39.2 $ 80.1
Prior service cost (benefit) 0.3 (22.0) (21.7) 0.4 (27.1) (26.7)
Total $ 30.3 $ 6.4 $ 36.7 $ 41.3 $ 12.1 $ 53.4
The following tables provide a rollforward of the benefit obligation, plan assets and funded status for ourU.S. and international pension plans and our other employee-related defined benefit plans for the years endedDecember 31, 2021 and 2020.
2021 2020U.S.
PensionInt’l
PensionOtherBenefits Total
U.S.Pension
Int’lPension
OtherBenefits Total
Change in benefit obligationBenefit obligation – January 1 $ 15.5 $ 109.0 $ 118.3 $ 242.8 $ 310.4 $ 98.4 $ 116.6 $ 525.4
Service cost — 1.4 0.7 2.1 — 1.5 0.8 2.3
Interest cost 0.3 0.7 1.8 2.8 6.9 1.0 2.8 10.7
Actuarial (gain) loss(a) (0.1) (6.3) (8.2) (14.6) 45.0 3.3 4.0 52.3
Benefits paid (0.9) (3.2) (6.2) (10.3) (18.9) (3.6) (5.9) (28.4)
Settlement — (0.2) — (0.2) (327.9) (0.6) — (328.5)
Foreign currency translation — (8.3) — (8.3) — 9.0 — 9.0
Benefit obligation – December 31 $ 14.8 $ 93.1 $ 106.4 $ 214.3 $ 15.5 $ 109.0 $ 118.3 $ 242.8
(a) In 2021, the actuarial gain is primarily due to an increase in discount rates. In 2020, the actuarial loss is primarily due toa decrease in discount rates in addition to the annuity premium in connection with the U.S. qualified pension plantermination.
79

2021 2020U.S.
PensionInt’l
PensionOtherBenefits Total
U.S.Pension
Int’lPension
OtherBenefits Total
Change in plan assetsPlan assets – January 1 $ — $ 0.5 $ — $ 0.5 $ 319.9 $ 0.6 $ 1.3 $ 321.8
Actual return on plan assets — — — — 20.0 — — 20.0
Employer contributions 0.9 3.4 6.2 10.5 9.3 4.1 4.6 18.0
Benefits and expenses paid (0.9) (3.2) (6.2) (10.3) (21.3) (3.6) (5.9) (30.8)
Settlement — (0.2) — (0.2) (327.9) (0.6) — (328.5)
Plan assets – December 31 $ — $ 0.5 $ — $ 0.5 $ — $ 0.5 $ — $ 0.5
Funded status at end of year $ (14.8) $ (92.6) $ (106.4) $ (213.8) $ (15.5) $ (108.5) $ (118.3) $ (242.3)
The accumulated benefit obligation for all defined benefit pension plans was $105.5 and $121.6 atDecember 31, 2021 and 2020, respectively. Information for pension plans with an accumulated benefit obligation inexcess of plan assets is included in the following table.
2021 2020Projected benefit obligation $ 107.6 $ 124.2
Accumulated benefit obligation 105.3 121.3
Fair value of plan assets — —
Statements of Operations Information
The following table provides the components of net periodic postretirement cost and other amounts recognizedin other comprehensive loss for each of the years ended December 31, 2021, 2020 and 2019 as they pertain to ourdefined benefit pension plans.
2021 2020 2019U.S.
PensionInt’l
Pension TotalU.S.
PensionInt’l
Pension TotalU.S.
PensionInt’l
Pension TotalNet periodic postretirement cost - pensionService cost $ — $ 1.4 $ 1.4 $ — $ 1.5 $ 1.5 $ 0.2 $ 1.2 $ 1.4Interest cost 0.3 0.7 1.0 6.9 1.0 7.9 11.1 1.5 12.6Expected return on plan assets — — — (7.2) — (7.2) (14.8) — (14.8)Amortization of net actuarial loss 0.2 1.6 1.8 4.8 1.5 6.3 4.3 0.8 5.1Amortization of prior service cost — — — — — — 0.7 — 0.7Net periodic postretirement cost 0.5 3.7 4.2 4.5 4.0 8.5 1.5 3.5 5.0Settlement charge and other(a) (3.4) — (3.4) 136.9 0.1 137.0 — — —Total net periodic postretirement cost (2.9) 3.7 0.8 141.4 4.1 145.5 1.5 3.5 5.0Other changes in plan assets and benefit obligationsrecognized in other comprehensive incomeNet actuarial (gain) loss (0.1) (6.3) (6.4) 34.7 3.2 37.9 (10.2) 10.3 0.1Amortization of net actuarial loss (0.2) (1.6) (1.8) (141.7) (1.6) (143.3) (4.3) (0.8) (5.1)Amortization of prior service cost — — — — — — (0.7) — (0.7)Foreign currency translation — (2.7) (2.7) — 2.9 2.9 — (0.3) (0.3)
Total change recognized in othercomprehensive income (0.3) (10.6) (10.9) (107.0) 4.5 (102.5) (15.2) 9.2 (6.0)Total impact from net periodicpostretirement cost and changes inother comprehensive income $ (3.2) $ (6.9) $ (10.1) $ 34.4 $ 8.6 $ 43.0 $ (13.7) $ 12.7 $ (1.0)
(a) 2021 includes income of $3.4 from a pricing adjustment associated with the termination and sale of the U.S. qualifiedpension plan. In 2020, the Company recorded a settlement charge of $136.9 related to the termination and sale of theU.S. qualified pension plan.
80

The following table provides the components of net periodic postretirement cost and other amounts recognizedin other comprehensive loss for each of the years ended December 31, 2021, 2020 and 2019 as they pertain toother employee-related defined benefit plans.
2021 2020 2019Net periodic postretirement cost - other postretirementService cost $ 0.7 $ 0.8 $ 0.7Interest cost 1.8 2.8 4.0Expected return on plan assets — — (0.2)Amortization of net actuarial loss 2.6 2.6 2.3Amortization of prior service credit (5.1) (5.1) (5.1)Total net periodic postretirement cost — 1.1 1.7Other changes in plan assets and benefit obligations recognized in othercomprehensive incomeNet actuarial (gain) loss (8.2) 3.9 3.4Prior service cost — — 1.7Amortization of net actuarial loss (2.6) (2.6) (2.3)Amortization of prior service credit 5.1 5.1 5.1Total changes recognized in other comprehensive income (5.7) 6.4 7.9Total impact from net periodic postretirement cost and changes in othercomprehensive income $ (5.7) $ 7.5 $ 9.6
Postretirement Plan Assumptions
The determination of projected benefit obligations and the recognition of expenses related to postretirementbenefit plans are dependent on various assumptions that are judgmental and developed in consultation withexternal advisors. Management develops each assumption using relevant Company experience in conjunction withmarket-related data for each individual country in which such plans exist. Periodically, the Company performsexperience studies to validate certain actuarial assumptions such as age of retirement, rates of turnover, utilizationof optional forms of payments. The actuarial assumptions are based on the provisions of the applicable accountingpronouncements, review of various market data and discussion with our external advisors. Assumptions arereviewed annually and adjusted as necessary. Changes in these assumptions could materially affect our financialstatements.
The following table provides the weighted-average assumptions used to determine projected benefit obligationsand net periodic postretirement cost, as they pertain to our U.S. and non-U.S. defined benefit pension plans andother employee-related defined benefit plans.
2021 2020U.S.
PensionInt’l
PensionOtherBenefits
U.S.Pension
Int’lPension
OtherBenefits
Obligation Assumptions:Discount rate 2.7 % 1.1 % 2.7 % 2.4 % 0.7 % 2.4 %Rate of future compensation increase N/A 3.3 % N/A N/A 2.9 % N/ACost Assumptions:Discount rate 2.4 % 0.7 % 2.4 % 3.2 % 1.0 % 3.2 %Expected return on plan assets N/A 1.0 % N/A 4.0 % 1.0 % 6.0 %
The discount rate is used to calculate the present value of expected future benefit payments at themeasurement date. The discount rate assumption is based on current investment yields of high-quality fixed incomeinvestments during the retirement benefits maturity period. The pension discount rate is determined by consideringan interest rate yield curve comprising AAA/AA bonds, with maturities that are generally between zero and 30 years,developed by the plan's actuaries. Annual benefit payments are then discounted to present value using this yieldcurve to develop a single discount rate matching the plan's characteristics.
We estimate the service and interest components of net periodic benefit cost of the U.S. defined benefit plansby discounting the individual expected cash flows underlying the service cost and interest cost using the applicablespot rates from the yield curve used to discount the cash flows in measuring the benefit obligation.
81

The rate of future compensation increase assumption for foreign plans reflects our long-term actual experienceand future and near-term outlook. The rate of future compensation increase assumption is not applicable for theU.S. plan because the plan is frozen.
The Company has updated the mortality assumption to reflect the most recent projection update.
The assumed rate of future increases in the per capita cost of health care (the health care trend rate) is 6.2% forpre-age 65 retirees and 5.6% for post-age 65 retirees for 2022, decreasing ratably to 4.5% in 2028. To the extentthat actual experience differs from these assumptions, the effect will be amortized over the average future workinglife or life expectancy of the plan participants.
Fair Value of Plan Assets
As of December 31, 2021 and 2020, our plan assets were not considered material.
Contributions
Although we make contributions to our postretirement benefit plans when considered necessary oradvantageous to do so, the minimum funding requirements established by local government funding or taxingauthorities, or established by other agreements, may influence future contributions. Funding requirements underIRS rules are a major consideration in making contributions to our defined benefit pension plans in the U.S. Inaddition, we fund certain of our international pension plans in countries where funding is allowable and tax-efficient.During 2021 and 2020, we contributed $4.3 and $13.4, respectively, to our global pension plans which includes $8.4associated with the termination of our U.S. qualified plan in 2020. We anticipate making contributions to our globalpension plans of approximately $6 during 2022.
We contributed $6.2 and $4.6 to our other employee-related defined benefit plans during 2021 and 2020,respectively. We estimate that the 2022 contributions to our other employee-related defined benefit plans will beapproximately $9.
Estimated Future Benefit Payments
The following table provides the projected timing of payments for benefits earned to date and the expectationthat certain future service will be earned by current active employees for our pension and other employee-relatedbenefit plans.
U.S.Pension
Int’lPension
OtherBenefits
2022 $ 0.9 $ 4.7 $ 8.52023 0.9 3.7 8.12024 0.9 3.9 7.82025 0.9 3.5 7.52026 0.9 3.7 7.02027 - 2031 4.4 18.7 31.1
NOTE 17LONG-TERM INCENTIVE EMPLOYEE COMPENSATION
The 2011 Omnibus Incentive Plan (2011 Incentive Plan) was approved by shareholders and established in Mayof 2011 to provide for the awarding of options on common shares and full value restricted common shares or unitsto employees and non-employee directors. As of December 31, 2021, 36.9 shares were available for future grantsunder the 2011 Incentive Plan. The Company makes shares available for the exercise of stock options or vesting ofrestricted shares or units by purchasing shares in the open market.
Our long-term incentive plan (LTIP) awards are comprised of two components: restricted stock units (RSUs) andperformance stock units (PSUs). The majority of RSUs settle in shares; however RSUs and PSUs granted to certaininternational employees are settled in cash. We account for equity-settled RSUs and PSUs as equity-basedcompensation awards. We account for cash-settled RSUs and PSUs as liability-based awards. PSUs containequally weighted performance conditions for total shareholder return (TSR) and return on invested capital(ROIC). PSUs vest based on predetermined performance metrics that align with the Company's stock price andfinancial performance following a three-year performance period and are subject to a payout factor which includes amaximum and minimum payout. PSUs are accounted for as two distinct awards, a TSR award and a ROIC award.
82

LTIP costs are primarily recorded within general and administrative expenses in our Consolidated Statements ofOperations, at fair value over the requisite service period (typically three years) on a straight-line basis and arereduced by forfeitures as they occur.
The following table summarizes our share-based compensation expense associated with our LTIP awards.
For the Year Ended December 31 2021 2020 2019Equity-based awards $ 16.5 $ 13.4 $ 15.7Liability-based awards 1.3 0.8 2.8Total share-based compensation expense $ 17.8 $ 14.2 $ 18.5
As of December 31, 2021, there was $21.4 of total unrecognized compensation cost related to non-vestedequity awards. This cost is expected to be recognized ratably over a weighted-average period of 1.8 years.Additionally, unrecognized compensation cost related to liability-based awards was $1.3, which is expected to berecognized ratably over a weighted-average period of 1.9 years.
The fair value of equity-settled restricted stock units is determined using the closing price of the Company’scommon stock on the date of grant. The fair value of cash-settled RSUs is remeasured using the closing price ofITT's common stock at the end of each reporting period. Recipients do not have voting rights and do not receivecash dividends during the restriction period. Dividend equivalents on RSUs, which are subject to forfeiture, areaccrued and paid in cash upon vesting of the RSU. If a recipient retires or is terminated other than for cause, a prorata portion of the RSU may vest.
For PSUs, the fair value of the ROIC award is based on the closing price of ITT common stock on the date ofgrant less the present value of expected dividend payments during the vesting period. For ROIC awards granted in2021, a dividend yield of 1.04% was assumed based on ITT's annualized dividend payment of $0.88 per share andthe March 4, 2021 closing stock price of $84.27. The fair value of the ROIC award is fixed on the grant date;however, a probability assessment is performed each reporting period to estimate the likelihood of achieving theROIC targets and the amount of compensation to be recognized.
The fair value of the TSR award is measured using a Monte Carlo simulation on the date of grant, measuringpotential total shareholder return for ITT relative to the other companies in the S&P 400 Capital Goods Index (theTSR Performance Group). The expected volatility of ITT's stock price is based on the historical volatility of a peergroup while expected volatility for the other companies in the TSR Performance Group is based on their own stockprice history. For TSR awards granted in 2021, all volatility and correlation measures were based on three years ofdaily historical price data through March 4, 2021, corresponding to the three-year performance period of the award.As the grant date occurs after the beginning of the performance period, actual TSR performance between thebeginning of the performance period (December average closing stock price) and the grant date was reflected in thevaluation. For TSR awards granted in 2021, a dividend yield of 1.04% was assumed based on ITT's annualizeddividend payment of $0.88 per share and the March 4, 2021 closing stock price of $84.27.
The table below provides a rollforward of outstanding RSUs and PSUs for each of the years ended December31, 2021, 2020 and 2019.
2021 2020 2019
Restricted Stock andPerformance Units Shares
WeightedAverageGrant DateFair Value Shares
WeightedAverageGrant DateFair Value Shares
WeightedAverageGrant DateFair Value
Outstanding – January 1 0.8 $ 59.25 1.0 $ 51.24 1.2 $ 42.94Granted 0.3 90.14 0.3 61.13 0.3 60.91Performance adjustment(a) — — 0.1 57.88 0.1 44.87Vested and issued (0.3) 57.36 (0.5) 44.86 (0.6) 38.03Forfeited (0.1) 68.18 (0.1) 59.50 — —Outstanding – December 31 0.7 $ 71.21 0.8 $ 59.25 1.0 $ 51.24Vested pending issuance 0.1 $ 65.25 0.2 $ 57.88 0.2 $ 44.87
(a) Represents an adjustment for performance results achieved related to outstanding PSU shares that vested during theperiod and are pending issuance.
83

The table below provides the number of the outstanding shares by award type. Cash-settled PSUs outstandingwere not material.
As of December 31 2021 2020 2019Equity-settled RSUs 0.4 0.4 0.5Cash-settled RSUs — — 0.1Equity-settled PSUs 0.3 0.4 0.4
As of December 31, 2021, substantially all RSUs outstanding are expected to vest. As of December 31, 2021,the total number of PSUs expected to vest based on current performance estimates, including those vested butpending issuance, was 0.3.
Non-Qualified Stock Options
Prior to 2017, our LTIP award grants also included non-qualified stock options (NQOs). NQOs outstanding andexercisable were 0.1, 0.2 and 0.3 as of December 31, 2021, 2020 and 2019. As of December 31, 2021, there wereno options "out-of-the-money" and all options outstanding were fully vested. NQOs exercised of 0.1, 0.1, and 0.4during December 31, 2021, 2020 and 2019 resulted in cash proceeds of $1.2, $4.3 and $14.9, respectively.
The income tax benefit realized during 2021, 2020 and 2019 associated with exercised stock options andvested restricted stock was $3.2, $4.1 and $6.5, respectively. Excess tax benefits arising from exercised stockoptions and vested restricted stock were $3.2, $3.0 and $4.6 for 2021, 2020 and 2019, respectively.
NOTE 18CAPITAL STOCK
ITT has authority to issue an aggregate of 300 shares of capital stock, of which 250 shares have beendesignated as common stock having a par value of $1 per share and 50 shares have been designated as preferredstock not having any par or stated value. There was no preferred stock outstanding as of December 31, 2021 and2020.
The holders of ITT common stock are entitled to receive dividends when and as declared by ITT’s Board ofDirectors. Dividends are paid quarterly. Dividends declared were $0.880, $0.676 and $0.588 per common share in2021, 2020, and 2019, respectively.
On October 30, 2019, the Board of Directors approved our current program, an indefinite term $500 open-market share repurchase program (the 2019 Plan). Repurchase activity under the 2019 Plan commenced followingfulfillment of the prior $1,000 open-market share repurchase program, which was reached during the first quarter of2020. During 2021, 2020, and 2019, we repurchased and retired 1.2 shares, 1.7 shares, and 0.5 shares of commonstock for $104.8, $73.2 and $28.7, respectively, under our share repurchase programs.
Separate from our open-market share repurchase programs, the Company repurchased 0.1 shares, 0.2 shares,and 0.3 shares for an aggregate purchase price of $11.7, $11.0, and $12.7, during 2021, 2020 and 2019,respectively, associated with the net settlement of employee equity awards to cover tax withholding obligations thatbecame due upon vesting.
84
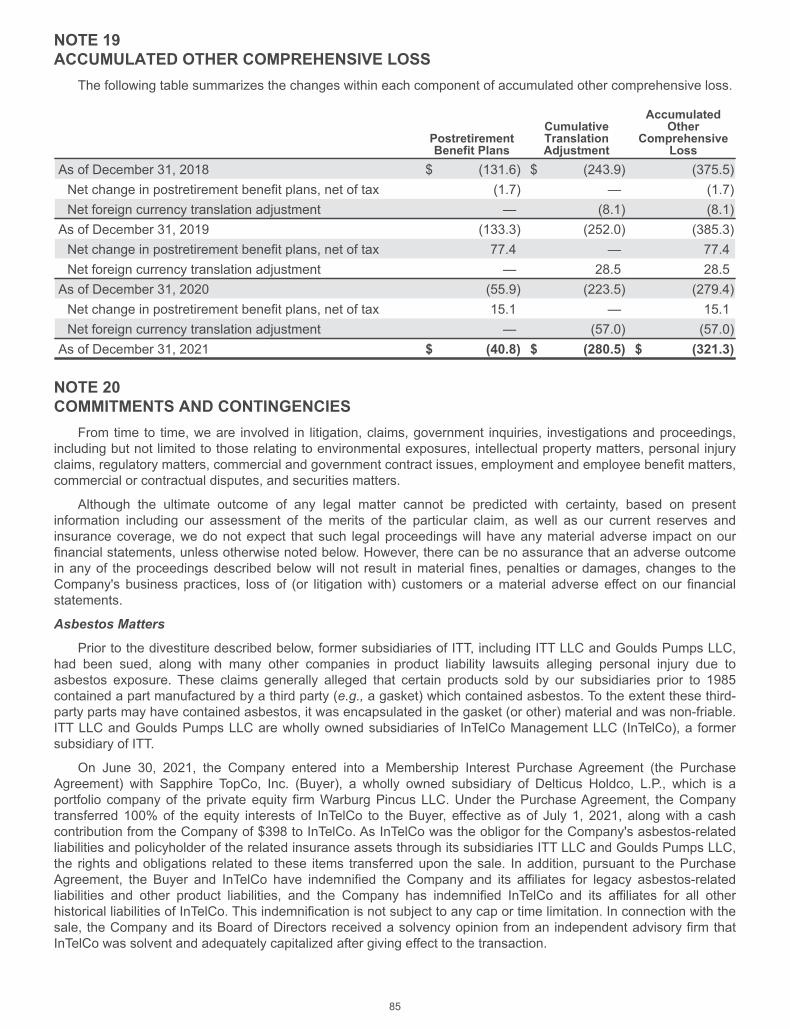
NOTE 19ACCUMULATED OTHER COMPREHENSIVE LOSS
The following table summarizes the changes within each component of accumulated other comprehensive loss.
PostretirementBenefit Plans
CumulativeTranslationAdjustment
AccumulatedOther
ComprehensiveLoss
As of December 31, 2018 $ (131.6) $ (243.9) (375.5)Net change in postretirement benefit plans, net of tax (1.7) — (1.7)Net foreign currency translation adjustment — (8.1) (8.1)As of December 31, 2019 (133.3) (252.0) (385.3)Net change in postretirement benefit plans, net of tax 77.4 — 77.4Net foreign currency translation adjustment — 28.5 28.5As of December 31, 2020 (55.9) (223.5) (279.4)Net change in postretirement benefit plans, net of tax 15.1 — 15.1Net foreign currency translation adjustment — (57.0) (57.0)As of December 31, 2021 $ (40.8) $ (280.5) $ (321.3)
NOTE 20COMMITMENTS AND CONTINGENCIES
From time to time, we are involved in litigation, claims, government inquiries, investigations and proceedings,including but not limited to those relating to environmental exposures, intellectual property matters, personal injuryclaims, regulatory matters, commercial and government contract issues, employment and employee benefit matters,commercial or contractual disputes, and securities matters.
Although the ultimate outcome of any legal matter cannot be predicted with certainty, based on presentinformation including our assessment of the merits of the particular claim, as well as our current reserves andinsurance coverage, we do not expect that such legal proceedings will have any material adverse impact on ourfinancial statements, unless otherwise noted below. However, there can be no assurance that an adverse outcomein any of the proceedings described below will not result in material fines, penalties or damages, changes to theCompany's business practices, loss of (or litigation with) customers or a material adverse effect on our financialstatements.
Asbestos Matters
Prior to the divestiture described below, former subsidiaries of ITT, including ITT LLC and Goulds Pumps LLC,had been sued, along with many other companies in product liability lawsuits alleging personal injury due toasbestos exposure. These claims generally alleged that certain products sold by our subsidiaries prior to 1985contained a part manufactured by a third party (e.g., a gasket) which contained asbestos. To the extent these third-party parts may have contained asbestos, it was encapsulated in the gasket (or other) material and was non-friable.ITT LLC and Goulds Pumps LLC are wholly owned subsidiaries of InTelCo Management LLC (InTelCo), a formersubsidiary of ITT.
On June 30, 2021, the Company entered into a Membership Interest Purchase Agreement (the PurchaseAgreement) with Sapphire TopCo, Inc. (Buyer), a wholly owned subsidiary of Delticus Holdco, L.P., which is aportfolio company of the private equity firm Warburg Pincus LLC. Under the Purchase Agreement, the Companytransferred 100% of the equity interests of InTelCo to the Buyer, effective as of July 1, 2021, along with a cashcontribution from the Company of $398 to InTelCo. As InTelCo was the obligor for the Company's asbestos-relatedliabilities and policyholder of the related insurance assets through its subsidiaries ITT LLC and Goulds Pumps LLC,the rights and obligations related to these items transferred upon the sale. In addition, pursuant to the PurchaseAgreement, the Buyer and InTelCo have indemnified the Company and its affiliates for legacy asbestos-relatedliabilities and other product liabilities, and the Company has indemnified InTelCo and its affiliates for all otherhistorical liabilities of InTelCo. This indemnification is not subject to any cap or time limitation. In connection with thesale, the Company and its Board of Directors received a solvency opinion from an independent advisory firm thatInTelCo was solvent and adequately capitalized after giving effect to the transaction.
85

Following the completion of the transfer, the Company no longer has any obligation with respect to pending andfuture asbestos claims relating to these matters. As such, InTelCo has been deconsolidated from our 2021 financialresults, as we no longer maintain control of the entity. Therefore, all associated assets and liabilities are no longerreported on the consolidated balance sheet. The transaction resulted in a pre-tax gain of $88.8. Additionally, theCompany recorded tax expense as a result of the reversal of previously recorded deferred tax assets of $116.9,resulting in an after-tax loss of $28.1.
The following table summarizes the impacts that resulted from the divestiture of InTelCo.
Cash and cash equivalents $ (398.0)Current asbestos-related assets (91.0)Long-term asbestos-related assets (310.4)Accrued liabilities 91.2Long-term asbestos-related liabilities 797.0Gain on divestiture of legacy asbestos-related assets and liabilities before income tax $ 88.8Less: income tax expense 116.9Loss on divestiture of legacy asbestos-related assets and liabilities, net of tax $ (28.1)
Estimating the Liability and Related Asset
Prior to the divestiture of the entity holding legacy asbestos-related assets and liabilities, the Companyrecognized an estimated asbestos liability for pending claims and claims expected to be filed in the future, includinglegal fees. We conducted an annual remeasurement to review and update the underlying assumptions used toestimate our asbestos liability and related assets, including a reassessment of the time horizon over which areasonable estimate of unasserted claims can be projected. In 2020, we extended our projection to include pendingclaims and claims expected to be filed through 2052, reflecting the full time period over which we expectedasbestos-related claims to be filed against InTelCo. Previous estimates included pending claims and claimsexpected to be filed over the next 10 years. Our ability to reasonably estimate the liability over the full time horizonresulted from the culmination of various factors, including:
• We observed stability in our data, particularly our experience in the number and percentage of claimscompensated by InTelCo, the amounts paid to settle claims, and related defense costs, subsequent to theimplementation of our one-firm defense strategy.
• Favorable developments in our insurance coverage litigation, including a stipulation filed with the court in2020, upon which we subsequently entered into a coverage-in-place agreement with a group of insurersregarding the remaining available and solvent limits of a significant coverage block, and our experience withinsurance settlements, provided additional certainty with respect to the availability of insurance to reimburseus for certain asbestos-related expenses and the overall net exposure of InTelCo.
Overall, we believed there was greater predictability of outcomes from insurance settlements and stability ofunderlying inputs used in calculating the gross liability. As a result, we believed the uncertainty in calculating the netliability was reduced and we had sufficient reliability to transition to a full time horizon. Consequently, in 2020, weincreased our estimated undiscounted asbestos liability, including legal fees, by $155.7. As of December 31, 2020,the liability for pending claims and claims estimated to be filed through 2052 was $932.0. The asbestos liability wasnot discounted to present value as the timing of future cash flows may vary.
The methodology used to estimate our asbestos liability for pending claims and claims estimated to be filedthrough 2052 determined a point estimate based on our assessment of the value of each underlying assumption,rather than a range of reasonably possible outcomes, and relied on and included the following:
• interpretation of a widely accepted forecast of the population likely to have been exposed to asbestos in theworkplace;
• widely accepted epidemiological studies estimating the number of people likely to develop mesotheliomaand lung cancer from exposure to asbestos;
• InTelCo's historical experience with the filing of non-malignant claims against it and the historicalrelationship between non-malignant and malignant claims filed against InTelCo;
• analysis of the number of likely asbestos personal injury claims to be compensated by InTelCo based onsuch epidemiological and historical data and InTelCo’s recent claims experience in settling and dismissingclaims;
• analysis of InTelCo’s pending cases, by disease type;
86

• analysis of InTelCo’s recent experience to determine the expected settlement value of claims, by diseasetype;
• analysis of InTelCo’s recent experience in the ratio of settled claims to total resolved claims, by diseasetype; and
• analysis of InTelCo’s defense costs, including agreements in place with external counsel.
In addition, prior to the divestiture of InTelCo, we recorded a corresponding undiscounted asbestos-relatedasset that represented our best estimate of probable recoveries from our insurers for the estimated asbestosliabilities. In developing this estimate, the Company considered coverage-in-place and other agreements with itsinsurers, and a number of additional factors. These additional factors reviewed include the financial viability of ourinsurance carriers and any related solvency issues, the method by which losses would be allocated to the variousinsurance policies and the years covered by those policies, the extent to which settlement and defense costs wouldbe reimbursed by the insurance policies and interpretation of the various policy and contract terms and limits andtheir interrelationships, and various judicial determinations relevant to our insurance programs. As a result of theextension of the measurement period during 2020, we increased the asbestos-related asset by $19.8, representingadditional recoveries due to the increase in the estimated liability for certain claims.
Settlement Agreements
The Company periodically entered into settlement agreements with insurers to settle responsibility for insuranceclaims. Under the terms of the settlements, the insurers agreed to a payment or specified series of payments to aQualified Settlement Fund for past costs and/or agree to provide coverage for certain future asbestos claims onspecified terms and conditions. In March 2020, we finalized a settlement agreement with a group of insurers tosettle responsibility for claims under certain insurance policies for a lump sum payment of $66.4, resulting in abenefit of $52.5. During June 2020, we entered into a settlement agreement with an insurer accelerating paymentspreviously included in a buyout agreement, resulting in a loss of $4.2. In December 2020, ITT entered into acoverage-in-place agreement with a group of insurers resulting in a benefit of $52.1.
Asbestos-Related (Benefit) Costs, Net
The table below summarizes the total net asbestos-related (benefit) costs for the years ended December 31,2021, 2020 and 2019.
2021 2020 2019Asbestos provision, net(a) $ 14.4 $ 30.8 $ 47.9Gain on divestiture before income tax (88.8) — —Asbestos remeasurement, net(b) — 135.9 (68.1)Settlement agreements and other — (100.4) —Asbestos-related (benefit) costs, net $ (74.4) $ 66.3 $ (20.2)
Changes in Financial Position
The following table provides a rollforward of the estimated asbestos liability and related assets for the yearsended December 31, 2021 and 2020.
2021 2020
Liability Asset Net Liability Asset NetBalance as of January 1 $ 932.0 $ 444.7 $ 487.3 $ 817.6 $ 386.8 $ 430.8Asbestos provision(a) 13.4 (1.0) 14.4 37.1 6.3 30.8Asbestos remeasurement(b) — — — 155.7 19.8 135.9Settlement agreements — — — — 100.4 (100.4)Net cash activity and other(a) (57.2) (42.3) (14.9) (78.4) (68.6) (9.8)Divestiture of legacy asbestos-related assets and liabilities (888.2) (401.4) (486.8)Balance as of December 31 $ — $ — $ — $ 932.0 $ 444.7 $ 487.3
Current portion — — 91.4 91.0Noncurrent portion — — 840.6 353.7
87
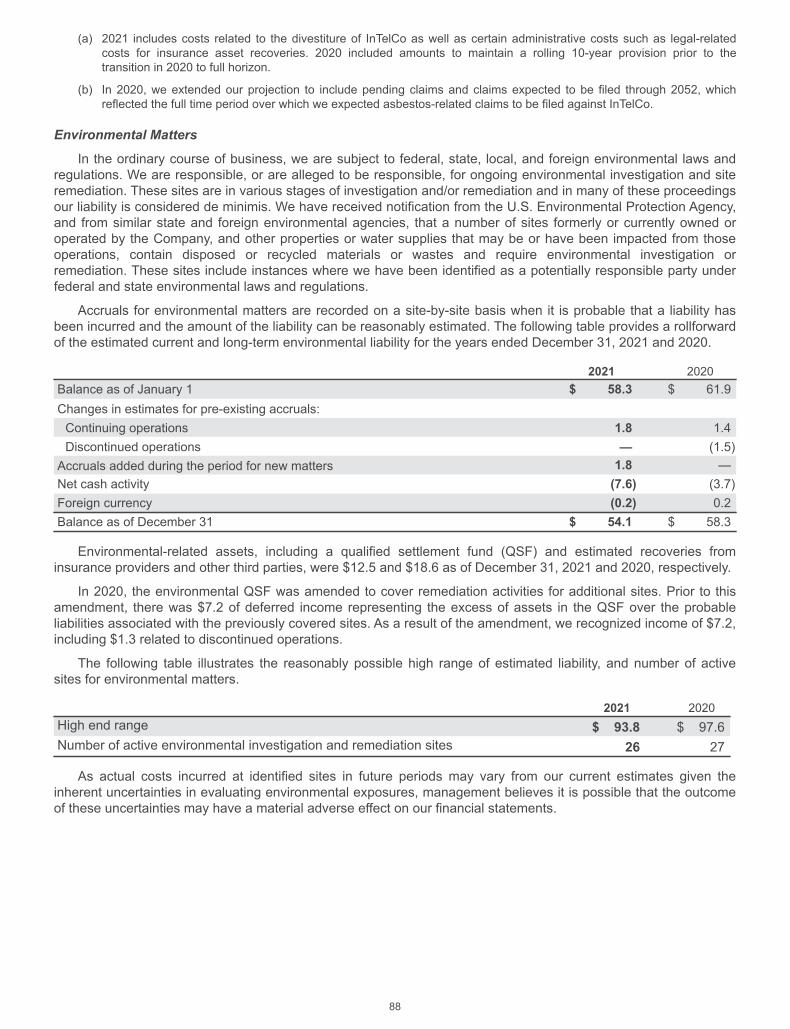
(a) 2021 includes costs related to the divestiture of InTelCo as well as certain administrative costs such as legal-relatedcosts for insurance asset recoveries. 2020 included amounts to maintain a rolling 10-year provision prior to thetransition in 2020 to full horizon.
(b) In 2020, we extended our projection to include pending claims and claims expected to be filed through 2052, whichreflected the full time period over which we expected asbestos-related claims to be filed against InTelCo.
Environmental Matters
In the ordinary course of business, we are subject to federal, state, local, and foreign environmental laws andregulations. We are responsible, or are alleged to be responsible, for ongoing environmental investigation and siteremediation. These sites are in various stages of investigation and/or remediation and in many of these proceedingsour liability is considered de minimis. We have received notification from the U.S. Environmental Protection Agency,and from similar state and foreign environmental agencies, that a number of sites formerly or currently owned oroperated by the Company, and other properties or water supplies that may be or have been impacted from thoseoperations, contain disposed or recycled materials or wastes and require environmental investigation orremediation. These sites include instances where we have been identified as a potentially responsible party underfederal and state environmental laws and regulations.
Accruals for environmental matters are recorded on a site-by-site basis when it is probable that a liability hasbeen incurred and the amount of the liability can be reasonably estimated. The following table provides a rollforwardof the estimated current and long-term environmental liability for the years ended December 31, 2021 and 2020.
2021 2020Balance as of January 1 $ 58.3 $ 61.9Changes in estimates for pre-existing accruals:Continuing operations 1.8 1.4Discontinued operations — (1.5)Accruals added during the period for new matters 1.8 —Net cash activity (7.6) (3.7)Foreign currency (0.2) 0.2Balance as of December 31 $ 54.1 $ 58.3
Environmental-related assets, including a qualified settlement fund (QSF) and estimated recoveries frominsurance providers and other third parties, were $12.5 and $18.6 as of December 31, 2021 and 2020, respectively.
In 2020, the environmental QSF was amended to cover remediation activities for additional sites. Prior to thisamendment, there was $7.2 of deferred income representing the excess of assets in the QSF over the probableliabilities associated with the previously covered sites. As a result of the amendment, we recognized income of $7.2,including $1.3 related to discontinued operations.
The following table illustrates the reasonably possible high range of estimated liability, and number of activesites for environmental matters.
2021 2020High end range $ 93.8 $ 97.6Number of active environmental investigation and remediation sites 26 27
As actual costs incurred at identified sites in future periods may vary from our current estimates given theinherent uncertainties in evaluating environmental exposures, management believes it is possible that the outcomeof these uncertainties may have a material adverse effect on our financial statements.
88

NOTE 21GUARANTEES, INDEMNITIES AND WARRANTIESIndemnities
Since our founding in 1920, we have acquired and disposed of numerous businesses. The related acquisitionand disposition agreements allocate certain assets and liabilities among the parties and contain variousrepresentation and warranty clauses and may provide indemnities for a misrepresentation or breach of therepresentations and warranties by either party or for assumed or excluded liabilities. These provisions address avariety of subjects. The term and monetary amounts of each such provision are defined in the specific agreementsand may be affected by various conditions and external factors. Many of the provisions have expired either byoperation of law or as a result of the terms of the agreement. We do not have a liability recorded for these expiredprovisions and are not aware of any claims or other information that would give rise to material payments undersuch provisions.
Guarantees
We have $129.4 of guarantees, letters of credit and similar arrangements outstanding at December 31, 2021,primarily pertaining to commercial or performance guarantees and insurance matters. We have not recorded anymaterial loss contingencies under these guarantees, letters of credit and similar arrangements as of December 31,2021 as the likelihood of nonperformance by ITT is considered remote. From time to time, we may provide certainthird-party guarantees that may be affected by various conditions and external factors, some of which could requirethat payments be made under such guarantees. We do not consider the maximum exposure or current recordedliabilities under our third-party guarantees to be material either individually or in the aggregate. We do not believesuch payments would have a material adverse impact on our financial statements.
Warranties
ITT warrants numerous products, the terms of which vary widely. In general, ITT warrants its products againstdefect and specific non-performance. In certain markets, such as automotive, aerospace and rail, liability for productdefects could extend beyond the selling price of the product and could be significant if the defect interruptsproduction or results in a recall. The table included below provides changes in the warranty accrual forDecember 31, 2021 and 2020.
2021 2020Warranty accrual – January 1 $ 25.4 $ 20.5Warranty expense 4.6 12.3Payments (8.8) (8.2)Foreign currency and other (1.1) 0.8Warranty accrual – December 31 $ 20.1 $ 25.4
NOTE 22DERIVATIVE FINANCIAL INSTRUMENTS
As of December 31, 2021, the U.S. dollar equivalent notional value of outstanding foreign currency forward andoption contracts, which are denominated in euros, was $24.2 and the fair value was $1.9, recorded within othercurrent assets in our Consolidated Balance Sheet. There were no derivative contracts outstanding as ofDecember 31, 2020. During the years ended December 31, 2021 and 2020, we recognized losses related to foreigncurrency derivatives not designated as hedges of $1.4 and $1.4, respectively, within general and administrativeexpenses in our Consolidated Income Statement.
From time to time, we enter into call option contracts to mitigate exposure to commodity price fluctuations.There were no call option contracts outstanding as of December 31, 2021 and 2020.
We utilize market approaches to estimate the fair value of our derivative instruments by discounting anticipatedfuture cash flows derived from the derivative’s contractual terms and observable foreign exchange rates. The fairvalues of the derivatives summarized above are determined based on Level 2 inputs in the fair value hierarchy.
89

EXHIBIT INDEX
2.1 Membership Interest Purchase Agreement, dated as of June 30, 2021, among ITT Inc., InTelCo Management LLC,and Sapphire TopCo, Inc.Incorporated by reference to Exhibit 2.1 of ITT Inc.’s Form 8-K dated July 1, 2021
3.1 Amended and Restated Articles of Incorporation, effective as of May 23, 2018Incorporated by reference to Exhibit 3.1 of ITT Inc.’s Form 8-K dated May 25, 2018
3.2 Amended and Restated By-laws of ITT Inc., effective as of December 11, 2020Incorporated by reference to Exhibit 3.1 of ITT Inc.’s Form 8-K dated December 15, 2020
4.1 Description of Registrant's SecuritiesIncorporated by reference to Exhibit 4.1 of ITT Inc.’s Form 10-K for the year ended December 31, 2019
10.1 Credit Agreement, dated as of April 29, 2020, between ITT Inc. and U.S. Bank National AssociationIncorporated by reference to Exhibit 10.5 of ITT Inc.’s Form 10-Q for the quarter ended March 31, 2020
10.2 Credit Agreement, dated as of April 29, 2020, between ITT Inc. and BNP ParibusIncorporated by reference to Exhibit 10.6 of ITT Inc.’s Form 10-Q for the quarter ended March 31, 2020
10.3 Credit Agreement, dated August 5, 2021, among ITT Inc. and Other Parties Signatory TheretoIncorporated by reference to Exhibit 10.1 of ITT Inc.’s Form 10-Q for the quarter ended July 3, 2021
10.4 Indenture between ITT Corporation and Union Bank N.A., as Trustee dated May 1, 2009Incorporated by reference to Exhibit 4.3 of ITT Inc.’s Form S-3 dated September 18, 2015
10.5 First Supplemental Indenture, dated as of May 16, 2016, between ITT Corporation, ITT Inc. and MUFG Union Bank,N.A. as TrusteeIncorporated by reference to Exhibit 4.2 of ITT Inc.’s Post-Effective Amendment No.1 to Registration Statement onForm S-3 dated May 16, 2016
10.6* ITT Annual Incentive Plan for Executive Officers, amended and restated as of May 16, 2016Incorporated by reference to Exhibit 10.5 of ITT Inc.’s Form 10-Q for the quarter ended June 30, 2016
10.7* ITT Retirement Savings Plan (amended and restated effective January 1, 2020)Incorporated by reference to Exhibit 10.18 of ITT Inc.’s Form 10-K for the year ended December 31, 2020
10.8* ITT Supplemental Retirement Savings Plan, amended and restated as of May 2, 2020Incorporated by reference to Exhibit 10.19 of ITT Inc.’s Form 10-K for the year ended December 31, 2020
10.9* ITT Senior Executive Severance Pay Plan, amended and restated as of June 17, 2019Incorporated by reference to Exhibit 10.2 of ITT Inc.’s Form 10-Q for the quarter ended June 30, 2019
10.10* ITT Senior Executive Change in Control Severance Pay Plan, amended and restated as of June 17, 2019Incorporated by reference to Exhibit 10.3 of ITT Inc.’s Form 10-Q for the quarter ended June 30, 2019
10.11* ITT Change in Control Severance Plan, amended and restated as of May 16, 2016Incorporated by reference to Exhibit 10.10 of ITT Inc.’s Form 10-Q for the quarter ended June 30, 2016
10.12* ITT Deferred Compensation Plan, as amended and restated as of May 16, 2016Incorporated by reference to Exhibit 10.4 of ITT Inc.’s Form 8-K dated May 16, 2016
10.13* ITT Deferred Compensation Plan for Non-Employee Directors, amended and restated as of January 1, 2020Incorporated by reference to Exhibit 10.4 of ITT Inc.’s Form 10-Q for the quarter ended March 31, 2020
10.14* Non-Employee Director Compensation SummaryIncorporated by reference to Exhibit 10.1 of ITT Inc.’s Form 10-Q for the quarter ended June 30, 2019
10.15* 2011 Omnibus Incentive PlanIncorporated by reference to Exhibit 4.3 of ITT Inc.’s Registration Statement on Form S-8 as filed on October 28,2011
10.16* ITT 2003 Equity Incentive Plan, amended and restated as of February 15, 2008 and approved by shareholders onMay 13, 2008 (previously amended and restated as of July 13, 2004 and subsequently amended as of December 18,2006) and previously known as ITT Industries, Inc. 2003 Equity Incentive PlanIncorporated by reference to Exhibit 10.5 of ITT Inc.’s Form 10-Q for the quarter ended June 30, 2008
10.17* Omnibus Amendment to Long-Term Incentive Plans, dated as of May 16, 2016Incorporated by reference to Exhibit 10.2 of ITT Inc.’s Current Report on Form 8-K dated May 16, 2016
10.18* Amendment to the ITT Consolidated Hourly Pension Plan, dated as of February 19, 2020Incorporated by reference to Exhibit 10.3 of ITT Inc.’s Form 10-Q for the quarter ended March 31, 2020
10.19* Consulting Agreement between Thomas Scalera and ITT Inc.Incorporated by reference to Exhibit 10.1 of ITT Inc.’s Form 10-Q for the quarter ended September 30, 2020
10.20* Form of 2021 Performance Unit Award AgreementIncorporated by reference to Exhibit 10.1 of ITT Inc.’s Form 10-Q for the quarter ended March 31, 2021
10.21* Form of 2021 Restricted Stock Unit Award AgreementIncorporated by reference to Exhibit 10.2 of ITT Inc.’s Form 10-Q for the quarter ended March 31, 2021
ExhibitNumber Description
II-1

10.22* Form of 2020 Performance Unit Award AgreementIncorporated by reference to Exhibit 10.1 of ITT Inc.’s Form 10-Q for the quarter ended March 31, 2020
10.23* Form of 2020 Restricted Stock Unit Award AgreementIncorporated by reference to Exhibit 10.2 of ITT Inc.’s Form 10-Q for the quarter ended March 31, 2020
10.24* Form of 2019 Performance Unit Award AgreementIncorporated by reference to Exhibit 10.1 of ITT Inc.’s Form 10-Q for the quarter ended March 31, 2019
10.25* Form of 2019 Restricted Stock Unit Award AgreementIncorporated by reference to Exhibit 10.2 of ITT Inc.’s Form 10-Q for the quarter ended March 31, 2019
10.26 Form of ITT Inc. Indemnification Agreement with its directors and officersIncorporated by reference to Exhibit 10.5 to ITT Inc.’s Form 8-K dated May 16, 2016
21.1 Subsidiaries of the Registrant23.1 Consent of Deloitte & Touche LLP31.1 Certification pursuant to Rule 13a-14(a)/15d-14(a) of the Securities Exchange Act of 1934, as adopted pursuant to
Section 302 of the Sarbanes-Oxley Act of 200231.2 Certification pursuant to Rule 13a-14(a)/15d-14(a) of the Securities Exchange Act of 1934, as adopted pursuant to
Section 302 of the Sarbanes-Oxley Act of 200232.1 Certification Pursuant to 18 U.S.C. Section 1350, as adopted pursuant to Section 906 of the Sarbanes-Oxley Act of
200232.2 Certification Pursuant to 18 U.S.C. Section 1350, as adopted pursuant to Section 906 of the Sarbanes-Oxley Act of
2002101 The following materials from ITT Inc.’s Annual Report on Form 10-K for the year ended December 31, 2021,
formatted in iXBRL ( inline Extensible Business Reporting Language): (i) Consolidated Statements of Operations,(ii) Consolidated Statements of Comprehensive Income, (iii) Consolidated Balance Sheets, (iv) ConsolidatedStatements of Cash Flows, (v) Consolidated Statements of Changes in Shareholders’ Equity and (vi) Notes to theConsolidated Financial Statements
104 Cover Page Interactive Data File (embedded within the Inline XBRL document).
ExhibitNumber Description
* Management compensatory plan
II-2
SIGNATURESPursuant to the requirements of Section 13 or 15(d) of the Securities Exchange Act of 1934, the registrant has
duly caused this report to be signed on its behalf by the undersigned, thereunto duly authorized.
ITT Inc.(Registrant)
By: /S/ JOHN CAPELA
John CapelaVice President and Chief Accounting Officer
(Principal Accounting Officer)
February 16, 2022
II-3

Pursuant to the requirements of the Securities Exchange Act of 1934, this report has been signed below bythe following persons on behalf of the registrant and in the capacities and on the dates indicated.
SIGNATURE TITLE DATE
/S/ LUCA SAVI Chief Executive Officer,President and Director
February 16, 2022Luca Savi
(Principal Executive Officer)
/S/ EMMANUEL CAPRAIS Senior Vice President andChief Financial Officer
February 16, 2022Emmanuel Caprais
(Principal Financial Officer)
/S/ JOHN CAPELA Vice President andChief Accounting Officer
February 16, 2022John Capela
(Principal Accounting Officer)
/S/ ORLANDO D. ASHFORD Director February 16, 2022Orlando D. Ashford
/S/ GERAUD DARNIS Director February 16, 2022Geraud Darnis
/S/ DONALD DEFOSSET, JR. Director February 16, 2022Donald DeFosset, Jr.
/S/ NICHOLAS C. FANANDAKIS Director February 16, 2022Nicholas C. Fanandakis
/S/ RICHARD P. LAVIN Director February 16, 2022Richard P. Lavin
/S/ REBECCAA. MCDONALD Director February 16, 2022Rebecca A. McDonald
/S/ TIMOTHY H. POWERS Director February 16, 2022Timothy H. Powers
/S/ CHERYL L. SHAVERS Director February 16, 2022Cheryl L. Shavers
/S/ SABRINA SOUSSAN Director February 16, 2022Sabrina Soussan
II-4


AN NUALREPORT
2 0 2 1
OUR GLOBAL MANUFACTURING FOOTPRINT
NORTH & SO U THAMER ICA
EUROP E , M I D D L EEAST & AFR ICA
ITT is a diversified leading global manufacturer of highly engineered critical components andcustomized technology solutions for the transportation, industrial, and energy markets. With astrong global footprint of more than 100 facilities, including about 60 manufacturing sites, we arewell positioned to solve the most critical challenges of our customers around the world. Ourlocations include manufacturing facilities and global service capabilities in 35 countries. Throughthese worldwide operations and building on our heritage of innovation, our approximately 9,900team members partner with customers to deliver enduring solutions that make a lasting differenceand help the world move forward. ITT is headquartered in White Plains, NY, with sales inapproximately 125 countries. The company generated 2021 revenues of $2.8 billion. For moreinformation, visit www.itt.com.
AS IA
INDUSTR IAL PROCESS
Amory, MississippiBuenos Aires, ArgentinaChungbuk, South KoreaDammam, Saudi ArabiaLancaster, PennsylvaniaObernkirchen, GermanyRennerod, GermanySalto, BrazilSantiago, ChileSeneca Falls, New YorkThe Woodlands, TexasTizayuca, MexicoVadodara, IndiaWangara, AustraliaWiesbaden, GermanyZachary, Louisiana
CONNEC T AND CONTR OLTECHNOL OGIES
Bad König, GermanyIrvine, CaliforniaLainate, ItalyNogales, MexicoOrchard Park, New YorkRockledge, FloridaSanta Rosa, CaliforniaShenzhen, ChinaValencia, CaliforniaWeinstadt, GermanyWestminster, South CarolinaWuxi, ChinaZama, Japan
MO TION TECHNOL OGIES
Barge, ItalyBlacksburg, VirginiaChangshu, ChinaDearborn, MichiganHebron, KentuckyKa czuga, PolandLeesburg, FloridaLünen, GermanyNeitersen, GermanyNovi, MichiganÖhringen, GermanyOstrava, Czech RepublicOud-Beijerland, NetherlandsProstejov, Czech RepublicSilao, MexicoStalowa Wola, PolandTermoli, ItalyVauda Canavese, ItalyWuxi, ChinaMoscow, RussiaShanghai, China
IT T WOR LD
White Plains, New York
Designs and manufactures pumps, valves and monitoring and control systems, and provides aftermarket services for the energy, chemical, mining and other industrial process markets.
Designs and manufactures brake pads, shockabsorbers and dampening technologies for the automotive and rail markets.
Designs and manufactures harsh-environment connectors and critical energy absorption and flow control components primarily for the aerospace, defense, and industrial markets.
ITT has a global footprint consisting of manufacturing, office and sales, and global service facilities, including the identified locations by segment.

AN NUALREPORT
2 0 2 1
www.itt.com
©2022 ITT Inc.
1133 Westchester AvenueWhite Plains, 10604(914) 641- 2000
New York