TomTom Annual Report 2021
122
-
Upload
khangminh22 -
Category
Documents
-
view
0 -
download
0
Transcript of TomTom Annual Report 2021

CONTENTSTomTom Annual Report 2021
WE ARE TOMTOM FINANCIALSMessage from the CEO / 3 Consolidated financial statements / 67At a glance / 4 Consolidated statement of income / 68How we create value / 5 Consolidated statement of comprehensive income / 68Our businesses / 6 Consolidated balance sheet / 69Our products and technologies / 7 Consolidated statement of cash flows / 69People and culture / 10 Consolidated statement of changes in equity / 70Environmental, Social and Governance / 13 Notes to the consolidated financial statements / 71Privacy and data governance / 24Financial review / 25 Company financial statements / 103Operational review / 28 Company statement of income / 104
Company balance sheet / 104GOVERNANCE Notes to the company financial statements / 105Corporate governance / 30Management Board / 33 Other information / 107Supervisory Board / 36 Other information / 108Supervisory Board report / 40 Independent auditor's report / 109Remuneration report / 45Risk management and control / 58 SUPPLEMENTARY INFORMATIONInvestor relations / 63 Quarterly overview 2021 / 116Management Board statements / 64 Definitions and abbreviations / 118
Non-GAAP measures / 119Forward-looking statements / 120
TOMTOM NV / ANNUAL REPORT 2021 / PAGE 1
WE ARE TOMTOM
Our location technology connectspeople and businesses globally.We enable smarter movement through our maps, our services and our software
Message from the CEO / 3At a glance / 4How we create value / 5Our businesses / 6Our products and technologies / 7People and culture / 10Environmental, Social and Governance / 13Privacy and data governance / 24Financial review / 25Operational review / 28
TOMTOM NV / ANNUAL REPORT 2021 / PAGE 2
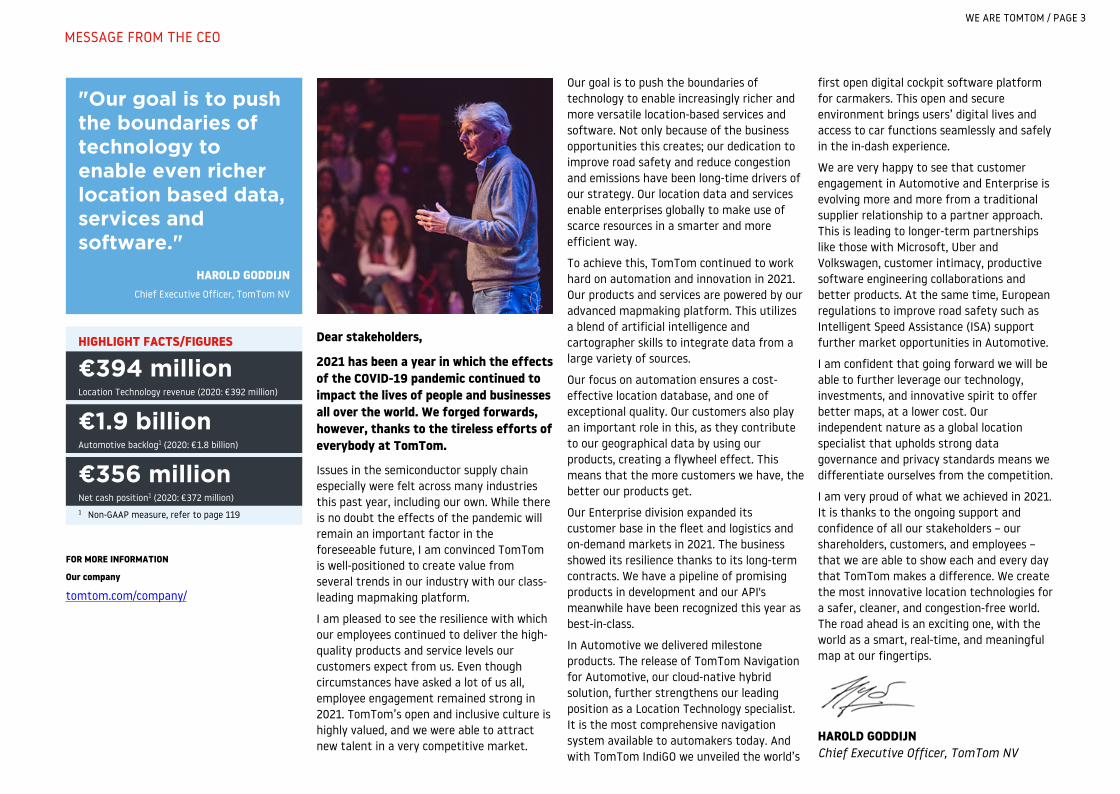
"Our goal is to push the boundaries of technology to enable even richer location based data, services and software."
HAROLD GODDIJNChief Executive Officer, TomTom NV
HIGHLIGHT FACTS/FIGURES
€394 millionLocation Technology revenue (2020: €392 million)
€1.9 billionAutomotive backlog1 (2020: €1.8 billion)
€356 millionNet cash position1 (2020: €372 million)1 Non-GAAP measure, refer to page 119
FOR MORE INFORMATION
Our company
tomtom.com/company/
Dear stakeholders,
2021 has been a year in which the effects of the COVID-19 pandemic continued to impact the lives of people and businesses all over the world. We forged forwards, however, thanks to the tireless efforts of everybody at TomTom.
Issues in the semiconductor supply chain especially were felt across many industries this past year, including our own. While there is no doubt the effects of the pandemic will remain an important factor in the foreseeable future, I am convinced TomTom is well-positioned to create value from several trends in our industry with our class-leading mapmaking platform.
I am pleased to see the resilience with which our employees continued to deliver the high-quality products and service levels our customers expect from us. Even though circumstances have asked a lot of us all, employee engagement remained strong in 2021. TomTom’s open and inclusive culture is highly valued, and we were able to attract new talent in a very competitive market.
Our goal is to push the boundaries of technology to enable increasingly richer and more versatile location-based services and software. Not only because of the business opportunities this creates; our dedication to improve road safety and reduce congestion and emissions have been long-time drivers of our strategy. Our location data and services enable enterprises globally to make use of scarce resources in a smarter and more efficient way.
To achieve this, TomTom continued to work hard on automation and innovation in 2021. Our products and services are powered by our advanced mapmaking platform. This utilizes a blend of artificial intelligence and cartographer skills to integrate data from a large variety of sources.
Our focus on automation ensures a cost-effective location database, and one of exceptional quality. Our customers also play an important role in this, as they contribute to our geographical data by using our products, creating a flywheel effect. This means that the more customers we have, the better our products get.
Our Enterprise division expanded its customer base in the fleet and logistics and on-demand markets in 2021. The business showed its resilience thanks to its long-term contracts. We have a pipeline of promising products in development and our API's meanwhile have been recognized this year as best-in-class.
In Automotive we delivered milestone products. The release of TomTom Navigation for Automotive, our cloud-native hybrid solution, further strengthens our leading position as a Location Technology specialist. It is the most comprehensive navigation system available to automakers today. And with TomTom IndiGO we unveiled the world’s
first open digital cockpit software platform for carmakers. This open and secure environment brings users’ digital lives and access to car functions seamlessly and safely in the in-dash experience.
We are very happy to see that customer engagement in Automotive and Enterprise is evolving more and more from a traditional supplier relationship to a partner approach. This is leading to longer-term partnerships like those with Microsoft, Uber and Volkswagen, customer intimacy, productive software engineering collaborations and better products. At the same time, European regulations to improve road safety such as Intelligent Speed Assistance (ISA) support further market opportunities in Automotive.
I am confident that going forward we will be able to further leverage our technology, investments, and innovative spirit to offer better maps, at a lower cost. Our independent nature as a global location specialist that upholds strong data governance and privacy standards means we differentiate ourselves from the competition.
I am very proud of what we achieved in 2021. It is thanks to the ongoing support and confidence of all our stakeholders – our shareholders, customers, and employees – that we are able to show each and every day that TomTom makes a difference. We create the most innovative location technologies for a safer, cleaner, and congestion-free world. The road ahead is an exciting one, with the world as a smart, real-time, and meaningful map at our fingertips.
HAROLD GODDIJNChief Executive Officer, TomTom NV
WE ARE TOMTOM / PAGE 3
MESSAGE FROM THE CEO

The geolocation technology specialistAt TomTom we are providing geolocation technology for drivers, carmakers, enterprises and developers.
Our maps, navigation software, real-time traffic information and APIs connect people and businesses on a global scale, making the roads safer, the drive easier and the air cleaner.
We are founder-led and headquartered in Amsterdam with offices in 24 countries. Together, we are a 4,400+ strong team of talented, diverse individuals who make the TomTom technologies that hundreds of millions of drivers, businesses and governments rely on.
OUR HISTORYFounded in 1991, we have grown from a Dutch-based start-up into the world's leading geolocation technology specialist.
What started with software development for business-to-business mobile applications and personal digital assistants for consumers led to the creation of a new product: the portable navigation device (PND).
Today, we are a trusted partner for innovative geolocation-based products for the technology industry, carmakers, governments and developers.
OUR STRATEGYOur strategy is to grow our Location Technology business by delivering state of the art products and services that are easily integrated in the applications of our customers.
Our people are core to our strategy. We continuously coach and encourage them to achieve great things, empowering them to be their best and providing them with growth and learning opportunities.
Our product innovation priorities are:
• Our mapmaking platform – increasing automation and processing new sources. This will create a cost advantage and shorten the time between real-world changes and those changes being reflected in customer applications
• Data contributions from customers – creating a flywheel effect; the more customers we have, the better our products get
• Traffic-dependent road navigation – including lane-level navigation, travel time prediction accuracy, and a configurable trade-off between onboard and online map
• Our online services – availability, scalability, and securityOur product priorities to target new customer requirements are:
• Fleet-based applications – including logistics (planned deliveries) and on-demand services, such as e-hailing and food delivery
• Electric vehicles (EV) – including providing accurate charging station POI data and EV routing
• Intelligent Speed Assistance – requiring accurate speed restriction data
• Digital cockpit – enabling Automotive customers to provide a mobile-beating experience with less time and effort that implements their design choices, and maintains competitiveness through continuous software updates
WE ARE TOMTOM / PAGE 4
AT A GLANCE
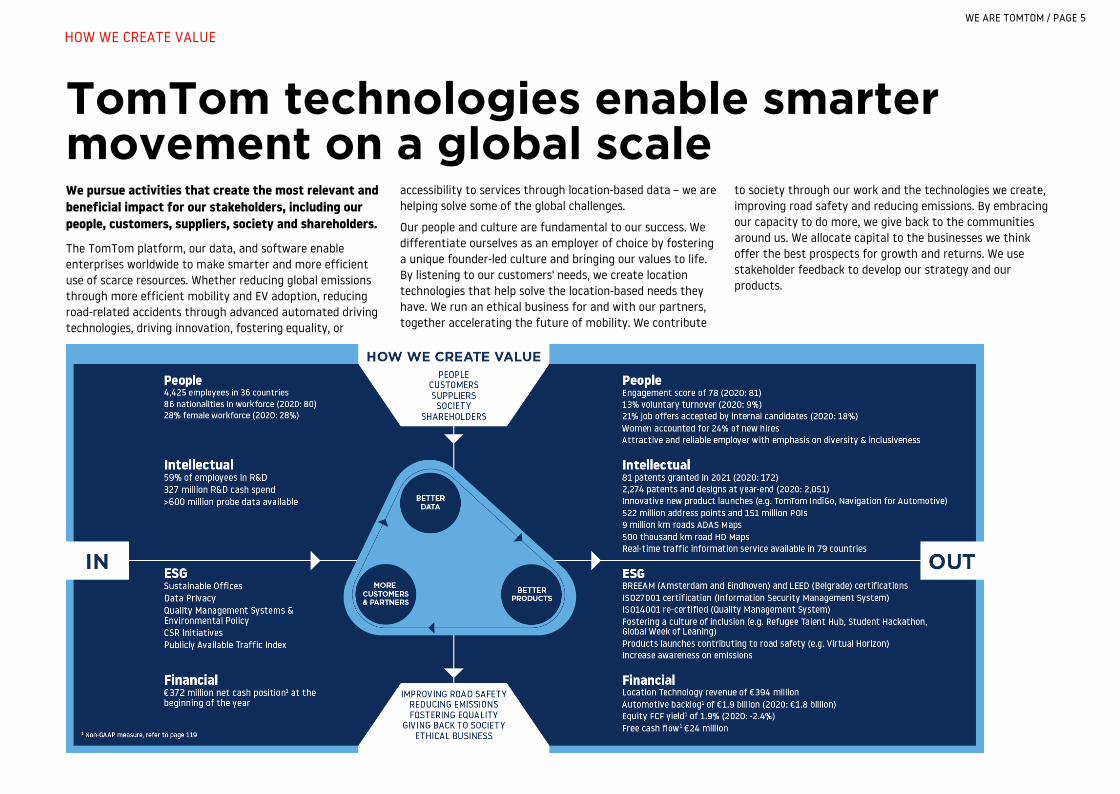
TomTom technologies enable smarter movement on a global scaleWe pursue activities that create the most relevant and beneficial impact for our stakeholders, including our people, customers, suppliers, society and shareholders.
The TomTom platform, our data, and software enable enterprises worldwide to make smarter and more efficient use of scarce resources. Whether reducing global emissions through more efficient mobility and EV adoption, reducing road-related accidents through advanced automated driving technologies, driving innovation, fostering equality, or
accessibility to services through location-based data – we are helping solve some of the global challenges.
Our people and culture are fundamental to our success. We differentiate ourselves as an employer of choice by fostering a unique founder-led culture and bringing our values to life. By listening to our customers' needs, we create location technologies that help solve the location-based needs they have. We run an ethical business for and with our partners, together accelerating the future of mobility. We contribute
to society through our work and the technologies we create, improving road safety and reducing emissions. By embracing our capacity to do more, we give back to the communities around us. We allocate capital to the businesses we think offer the best prospects for growth and returns. We use stakeholder feedback to develop our strategy and our products.
WE ARE TOMTOM / PAGE 5
HOW WE CREATE VALUE
We are well-positioned to capture value from the trends shaping our industry
MARKET OPPORTUNITIES
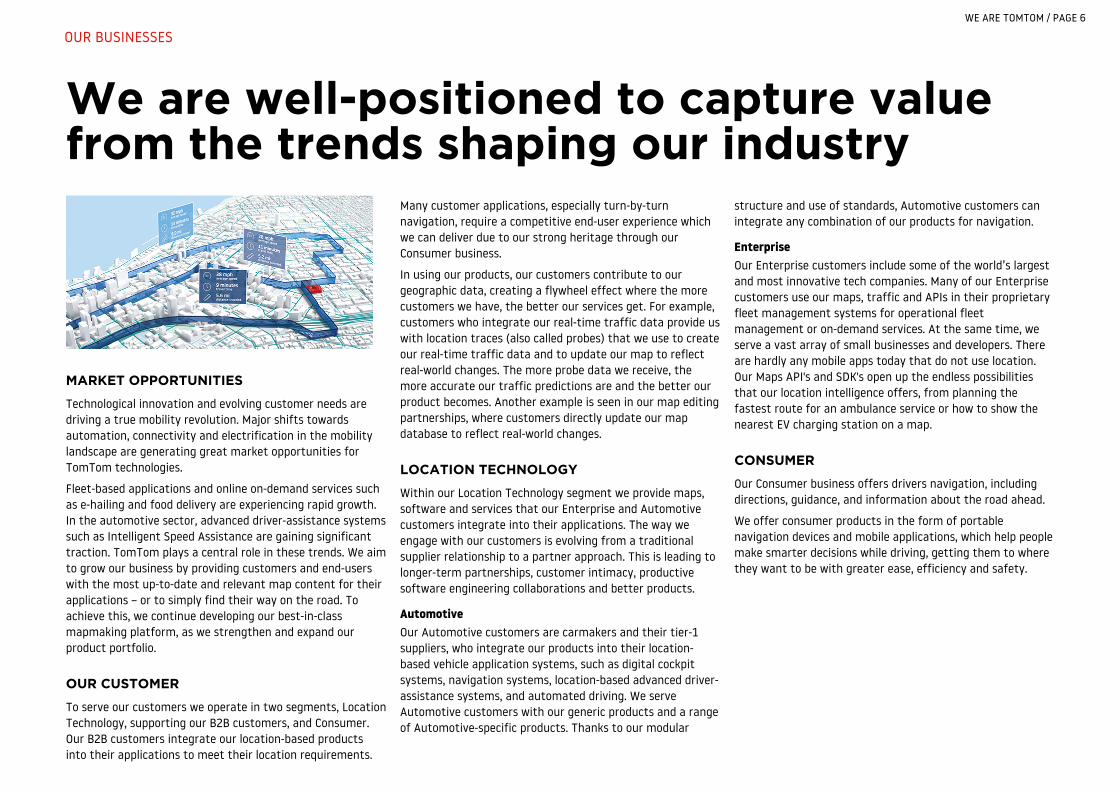
Technological innovation and evolving customer needs are driving a true mobility revolution. Major shifts towards automation, connectivity and electrification in the mobility landscape are generating great market opportunities for TomTom technologies.
Fleet-based applications and online on-demand services such as e-hailing and food delivery are experiencing rapid growth. In the automotive sector, advanced driver-assistance systems such as Intelligent Speed Assistance are gaining significant traction. TomTom plays a central role in these trends. We aim to grow our business by providing customers and end-users with the most up-to-date and relevant map content for their applications – or to simply find their way on the road. To achieve this, we continue developing our best-in-class mapmaking platform, as we strengthen and expand our product portfolio.
OUR CUSTOMER
To serve our customers we operate in two segments, Location Technology, supporting our B2B customers, and Consumer. Our B2B customers integrate our location-based products into their applications to meet their location requirements.
Many customer applications, especially turn-by-turn navigation, require a competitive end-user experience which we can deliver due to our strong heritage through our Consumer business.
In using our products, our customers contribute to our geographic data, creating a flywheel effect where the more customers we have, the better our services get. For example, customers who integrate our real-time traffic data provide us with location traces (also called probes) that we use to create our real-time traffic data and to update our map to reflect real-world changes. The more probe data we receive, the more accurate our traffic predictions are and the better our product becomes. Another example is seen in our map editing partnerships, where customers directly update our map database to reflect real-world changes.
LOCATION TECHNOLOGY
Within our Location Technology segment we provide maps, software and services that our Enterprise and Automotive customers integrate into their applications. The way we engage with our customers is evolving from a traditional supplier relationship to a partner approach. This is leading to longer-term partnerships, customer intimacy, productive software engineering collaborations and better products.
Automotive Our Automotive customers are carmakers and their tier-1 suppliers, who integrate our products into their location-based vehicle application systems, such as digital cockpit systems, navigation systems, location-based advanced driver-assistance systems, and automated driving. We serve Automotive customers with our generic products and a range of Automotive-specific products. Thanks to our modular
structure and use of standards, Automotive customers can integrate any combination of our products for navigation.
Enterprise Our Enterprise customers include some of the world’s largest and most innovative tech companies. Many of our Enterprise customers use our maps, traffic and APIs in their proprietary fleet management systems for operational fleet management or on-demand services. At the same time, we serve a vast array of small businesses and developers. There are hardly any mobile apps today that do not use location. Our Maps API's and SDK's open up the endless possibilities that our location intelligence offers, from planning the fastest route for an ambulance service or how to show the nearest EV charging station on a map.
CONSUMER
Our Consumer business offers drivers navigation, including directions, guidance, and information about the road ahead.
We offer consumer products in the form of portable navigation devices and mobile applications, which help people make smarter decisions while driving, getting them to where they want to be with greater ease, efficiency and safety.
WE ARE TOMTOM / PAGE 6
OUR BUSINESSES
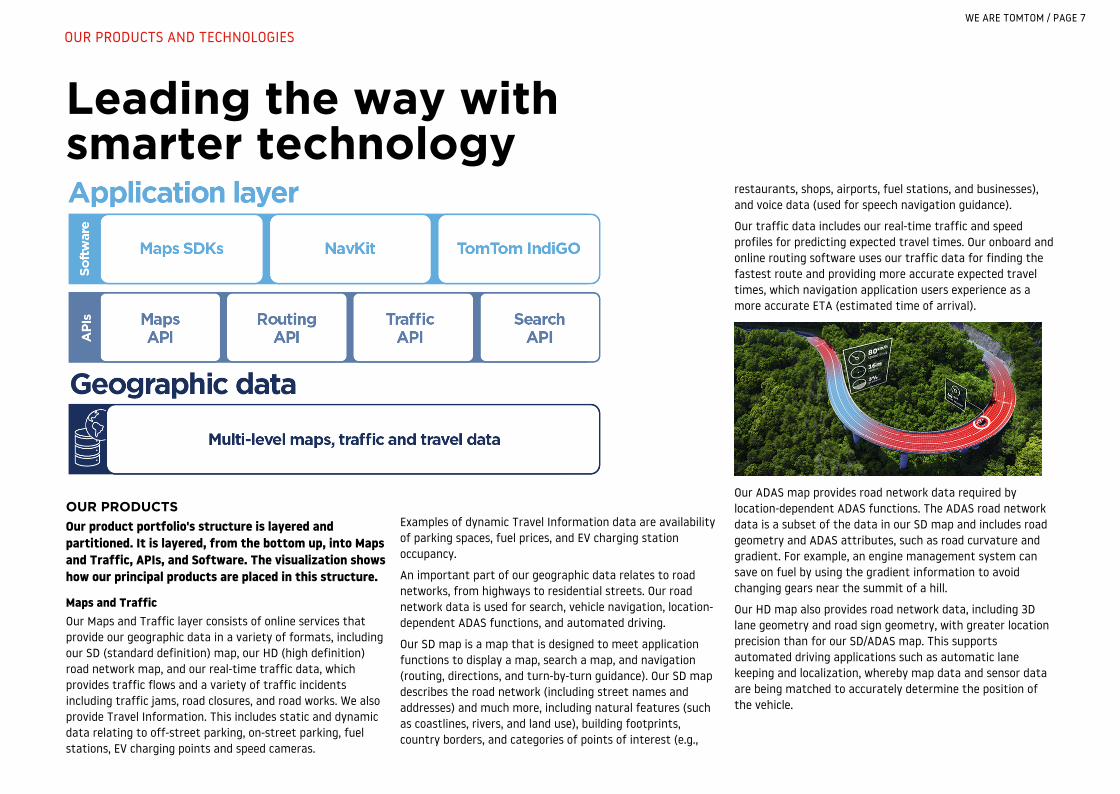
Leading the way with smarter technology
OUR PRODUCTSOur product portfolio's structure is layered and partitioned. It is layered, from the bottom up, into Maps and Traffic, APIs, and Software. The visualization shows how our principal products are placed in this structure.
Maps and TrafficOur Maps and Traffic layer consists of online services that provide our geographic data in a variety of formats, including our SD (standard definition) map, our HD (high definition) road network map, and our real-time traffic data, which provides traffic flows and a variety of traffic incidents including traffic jams, road closures, and road works. We also provide Travel Information. This includes static and dynamic data relating to off-street parking, on-street parking, fuel stations, EV charging points and speed cameras.
Examples of dynamic Travel Information data are availability of parking spaces, fuel prices, and EV charging station occupancy.
An important part of our geographic data relates to road networks, from highways to residential streets. Our road network data is used for search, vehicle navigation, location-dependent ADAS functions, and automated driving.
Our SD map is a map that is designed to meet application functions to display a map, search a map, and navigation (routing, directions, and turn-by-turn guidance). Our SD map describes the road network (including street names and addresses) and much more, including natural features (such as coastlines, rivers, and land use), building footprints, country borders, and categories of points of interest (e.g.,
restaurants, shops, airports, fuel stations, and businesses), and voice data (used for speech navigation guidance).
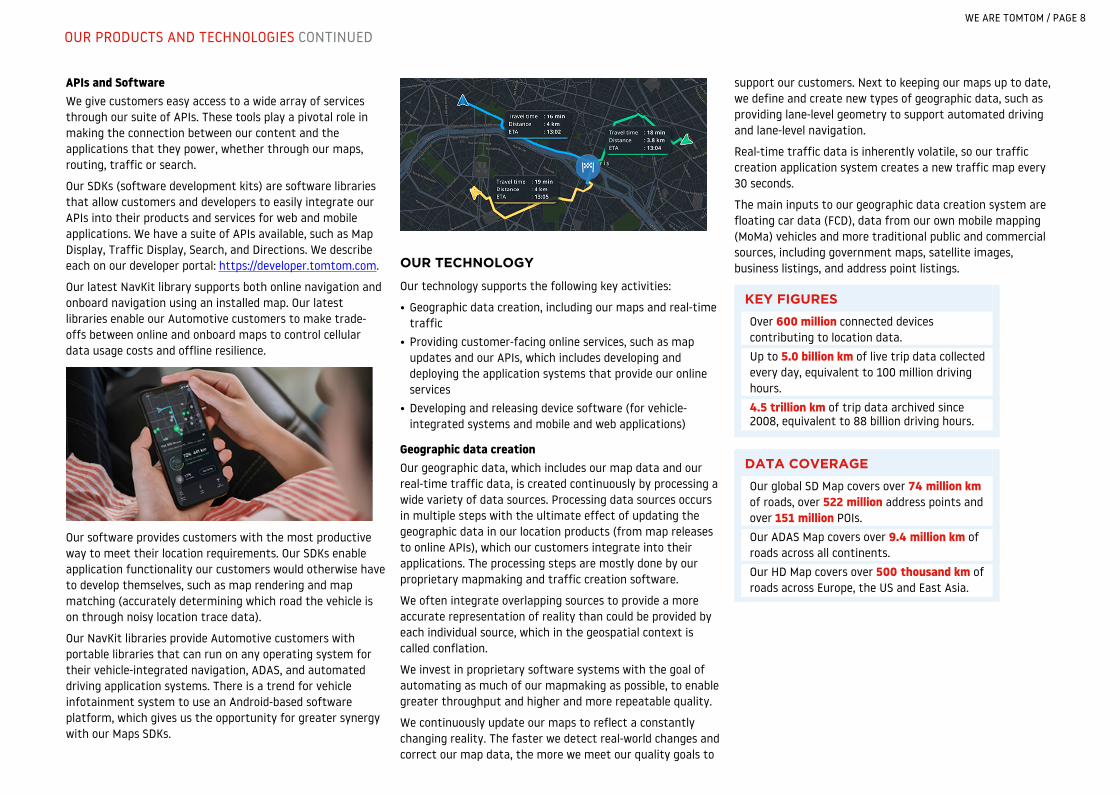
Our traffic data includes our real-time traffic and speed profiles for predicting expected travel times. Our onboard and online routing software uses our traffic data for finding the fastest route and providing more accurate expected travel times, which navigation application users experience as a more accurate ETA (estimated time of arrival).
Our ADAS map provides road network data required by location-dependent ADAS functions. The ADAS road network data is a subset of the data in our SD map and includes road geometry and ADAS attributes, such as road curvature and gradient. For example, an engine management system can save on fuel by using the gradient information to avoid changing gears near the summit of a hill.
Our HD map also provides road network data, including 3D lane geometry and road sign geometry, with greater location precision than for our SD/ADAS map. This supports automated driving applications such as automatic lane keeping and localization, whereby map data and sensor data are being matched to accurately determine the position of the vehicle.
WE ARE TOMTOM / PAGE 7
OUR PRODUCTS AND TECHNOLOGIES
APIs and SoftwareWe give customers easy access to a wide array of services through our suite of APIs. These tools play a pivotal role in making the connection between our content and the applications that they power, whether through our maps, routing, traffic or search.
Our SDKs (software development kits) are software libraries that allow customers and developers to easily integrate our APIs into their products and services for web and mobile applications. We have a suite of APIs available, such as Map Display, Traffic Display, Search, and Directions. We describe each on our developer portal: https://developer.tomtom.com.
Our latest NavKit library supports both online navigation and onboard navigation using an installed map. Our latest libraries enable our Automotive customers to make trade-offs between online and onboard maps to control cellular data usage costs and offline resilience.
Our software provides customers with the most productive way to meet their location requirements. Our SDKs enable application functionality our customers would otherwise have to develop themselves, such as map rendering and map matching (accurately determining which road the vehicle is on through noisy location trace data).
Our NavKit libraries provide Automotive customers with portable libraries that can run on any operating system for their vehicle-integrated navigation, ADAS, and automated driving application systems. There is a trend for vehicle infotainment system to use an Android-based software platform, which gives us the opportunity for greater synergy with our Maps SDKs.
OUR TECHNOLOGY
Our technology supports the following key activities:
• Geographic data creation, including our maps and real-time traffic
• Providing customer-facing online services, such as map updates and our APIs, which includes developing and deploying the application systems that provide our online services
• Developing and releasing device software (for vehicle-integrated systems and mobile and web applications)
Geographic data creationOur geographic data, which includes our map data and our real-time traffic data, is created continuously by processing a wide variety of data sources. Processing data sources occurs in multiple steps with the ultimate effect of updating the geographic data in our location products (from map releases to online APIs), which our customers integrate into their applications. The processing steps are mostly done by our proprietary mapmaking and traffic creation software.
We often integrate overlapping sources to provide a more accurate representation of reality than could be provided by each individual source, which in the geospatial context is called conflation.
We invest in proprietary software systems with the goal of automating as much of our mapmaking as possible, to enable greater throughput and higher and more repeatable quality.
We continuously update our maps to reflect a constantly changing reality. The faster we detect real-world changes and correct our map data, the more we meet our quality goals to
support our customers. Next to keeping our maps up to date, we define and create new types of geographic data, such as providing lane-level geometry to support automated driving and lane-level navigation.
Real-time traffic data is inherently volatile, so our traffic creation application system creates a new traffic map every 30 seconds.
The main inputs to our geographic data creation system are floating car data (FCD), data from our own mobile mapping (MoMa) vehicles and more traditional public and commercial sources, including government maps, satellite images, business listings, and address point listings.
KEY FIGURES
Over 600 million connected devices contributing to location data. Up to 5.0 billion km of live trip data collected every day, equivalent to 100 million driving hours.4.5 trillion km of trip data archived since 2008, equivalent to 88 billion driving hours.
DATA COVERAGE
Our global SD Map covers over 74 million km of roads, over 522 million address points and over 151 million POIs.Our ADAS Map covers over 9.4 million km of roads across all continents.Our HD Map covers over 500 thousand km of roads across Europe, the US and East Asia.
WE ARE TOMTOM / PAGE 8
OUR PRODUCTS AND TECHNOLOGIES CONTINUED
Providing customer-facing online servicesOur location products are either implemented as an online service (e.g., our Map Display API) or depend on one or more online services (e.g., our Maps SDKs). The following list shares typical examples of how customers depend on our online services:
• Customers integrate our map releases and real-time traffic feed into their applications
• Whether they use our SDK or not, customers integrate our Maps APIs into their mobile, web or vehicle-integrated applications, or server-side application systems
• Automotive customers integrate a wide variety of online services, including our map update services, real-time traffic feed, TPEG, and our online APIs into their vehicle-based application systems, including navigation, ADAS, and automated driving
Our online services include services to ingest the FCD that our customers provide, which we process to create real-time traffic and to keep our maps up to date.
Developing and releasing device softwareWe develop device-side software for web developers, mobile app developers, and vehicle-integrated systems, which we deliver as SDKs.
Our device software can be divided into:
• Maps SDKs for web and mobile app developers as a more productive way to use our Maps APIs and to implement device-side functions customers would otherwise have to develop themselves
• Vehicle libraries for vehicle integrated systems, typically using both onboard and online maps
• Our TomTom IndiGO framework of software libraries, which significantly reduces the time and development effort in developing a vehicle digital cockpit, and where our navigation software is pre-integrated
Our Maps SDK, vehicle libraries, and TomTom IndiGO framework include software that provides device-side application use cases (from an onboard or an online map) and software that implements the user interface, benefiting from the user experience design capability we have developed as a consumer electronics company.
KEY FIGURES
Real-time traffic information service available in 79 countries.Over 540 thousand EV charging points in 98 countries.Weather information available in 158 countries.On-Street Parking information available in 114 cities in 21 countries.Off-Street Parking information available in more than 80 countries. The TomTom ADAS Map powers more than 5 million automated vehicles sold.
WE ARE TOMTOM / PAGE 9
OUR PRODUCTS AND TECHNOLOGIES CONTINUED
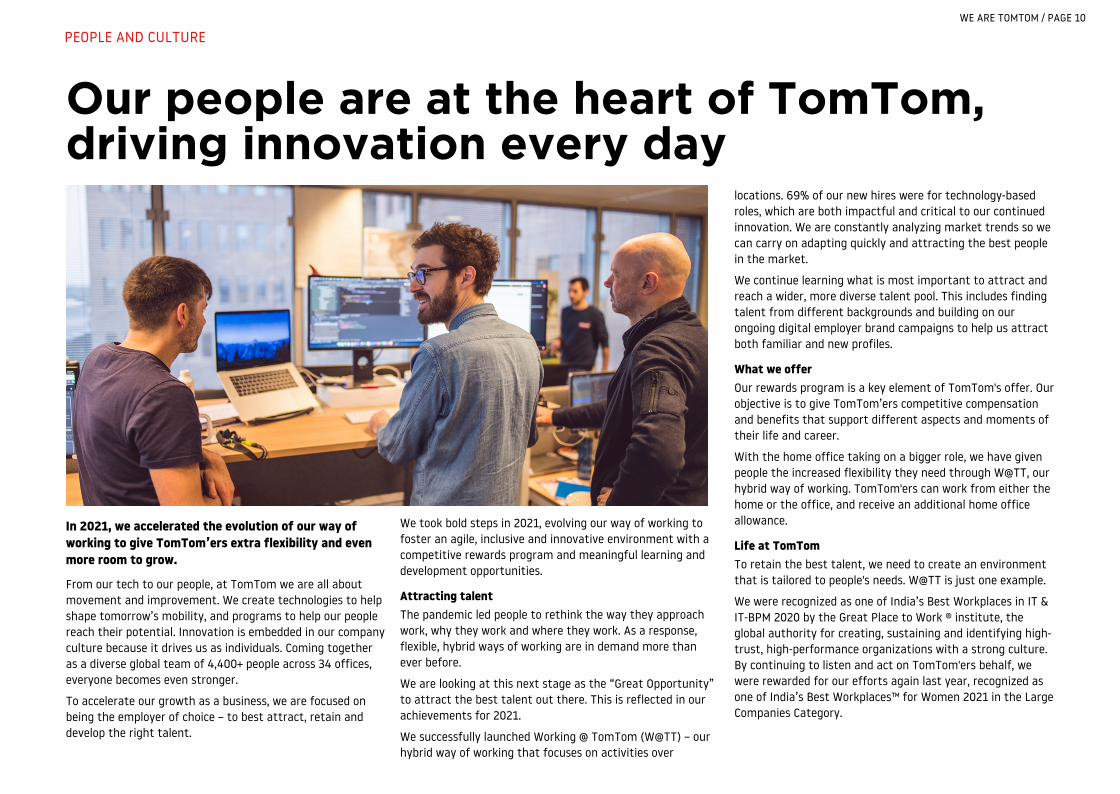
Our people are at the heart of TomTom, driving innovation every day
In 2021, we accelerated the evolution of our way of working to give TomTom’ers extra flexibility and even more room to grow.
From our tech to our people, at TomTom we are all about movement and improvement. We create technologies to help shape tomorrow’s mobility, and programs to help our people reach their potential. Innovation is embedded in our company culture because it drives us as individuals. Coming together as a diverse global team of 4,400+ people across 34 offices, everyone becomes even stronger.
To accelerate our growth as a business, we are focused on being the employer of choice – to best attract, retain and develop the right talent.
We took bold steps in 2021, evolving our way of working to foster an agile, inclusive and innovative environment with a competitive rewards program and meaningful learning and development opportunities.
Attracting talentThe pandemic led people to rethink the way they approach work, why they work and where they work. As a response, flexible, hybrid ways of working are in demand more than ever before.
We are looking at this next stage as the “Great Opportunity” to attract the best talent out there. This is reflected in our achievements for 2021.
We successfully launched Working @ TomTom (W@TT) – our hybrid way of working that focuses on activities over
locations. 69% of our new hires were for technology-based roles, which are both impactful and critical to our continued innovation. We are constantly analyzing market trends so we can carry on adapting quickly and attracting the best people in the market.
We continue learning what is most important to attract and reach a wider, more diverse talent pool. This includes finding talent from different backgrounds and building on our ongoing digital employer brand campaigns to help us attract both familiar and new profiles.
What we offerOur rewards program is a key element of TomTom's offer. Our objective is to give TomTom’ers competitive compensation and benefits that support different aspects and moments of their life and career.
With the home office taking on a bigger role, we have given people the increased flexibility they need through W@TT, our hybrid way of working. TomTom'ers can work from either the home or the office, and receive an additional home office allowance.
Life at TomTomTo retain the best talent, we need to create an environment that is tailored to people's needs. W@TT is just one example.
We were recognized as one of India’s Best Workplaces in IT & IT-BPM 2020 by the Great Place to Work ® institute, the global authority for creating, sustaining and identifying high-trust, high-performance organizations with a strong culture. By continuing to listen and act on TomTom'ers behalf, we were rewarded for our efforts again last year, recognized as one of India’s Best Workplaces™ for Women 2021 in the Large Companies Category.
WE ARE TOMTOM / PAGE 10
PEOPLE AND CULTURE
This recognition is indicative of our efforts to give TomTom’ers a working space – both in the office and online – that is inclusive, offering equal opportunities and resources for all.
We are always looking for more ways to make ourselves a better employer. Employee communication plays a key role here. We strive to be consistent and provide continued opportunities for TomTom’ers to tell us how they are feeling about the organization, what works well and what could be improved. To get this information, we send out regular engagement surveys.
In 2021, we ran one engagement survey in April and one in October, receiving a response rate of 89% and 87% respectively. These are high percentages, and our overall engagement scores (77 and 78) are both higher than the industry benchmark of 73. Such results also show the level of TomTom'ers' willingness to communicate their experience as they are working at TomTom.
Upon release of the survey results, TomTom’s leaders and people managers came together with TomTom’ers to discuss the right ways of implementing the survey’s feedback. Site owners at our offices around the world also have access to the aggregated results so they can make improvements at a local level. Overall, it is a global effort to make TomTom an even greater place to work.
Thanks to our efforts, in 2021 we were nominated for two LinkedIn Talent Awards: "Employee Engagement Champion" and "Best Culture of Learning." We are proud of these awards. As people evolve, so does our organization. In 2021 an integral part of our mission therefore focused on a new TomTom leadership initiative.
Growing leaders at every levelOur organization’s success is tightly tied to the success of our people and strength of our leaders. In 2021 we encouraged every single TomTom’er to “Choose to Lead” – because showing leadership is for everyone, and anyone can be the source of positively influence.
By choosing to lead, TomTom’ers themselves grow and develop as they close the gap between our current reality and our aspirations as a company – where TomTom is now and where we want TomTom to be.
We developed a Leadership Foundation to clarify and support the leadership behaviors, principles and values that every TomTom’er can choose to practice.
We carefully tailored a program of online sessions around our Leadership Foundation to encourage TomTom’ers to recognize their hidden potential, unlock it, and show how they can take the next steps to growth. By doing so, we empower our people to make a positive change, develop with the organization and see the impact they are having on TomTom’s success.
We also created a development toolkit to enable managers to encourage TomTom’ers to embody the Leadership Foundation, cascading this down within their teams. The toolkit includes management development tracks on Hone (an online leadership training provider), as well as learning maps and mentoring sessions.
Innovation at TomTom Our global innovation program, TomTom Lab, gives TomTom'ers the freedom to come up with their own ideas (relevant to TomTom) and develop them collaboratively with colleagues across the organization. This adds to our agile working culture, where TomTom'ers are empowered to find the right solution no matter where they are or what role they play within the organization.
TomTom Lab leads up to our annual hackathon, What the Hack, where we bring together TomTom’ers from around the world every year to work on whatever they think will benefit our customers, our business and our positive impact as an organization.
In 2021, we expanded TomTom Lab with two new hackathons to inspire innovation outside of TomTom: a Family Hack and TomTom n.EXT, our first-ever global student hackathon.
The Family Hack gives TomTom’ers the opportunity to innovate together with their families and friends, both inside and outside TomTom. Driven by the winning idea from 2020’s hackathon, the Family Hack asked teams to create a Roblox game using TomTom data. Considering the extent of Roblox’s popularity – with over 43 million active daily users – the Family Hack gave participants (and us) the chance to introduce our maps to a whole new market.
With TomTom n.EXT we brought together students from top tech universities in the Netherlands, Poland, the U.S. and India to compete in challenges set by TomTom. Our leading goal was to help building and developing the future generation of engineers, in alignment with the United Nations’ Sustainable Development Goal 4 (Quality Education).
WE ARE TOMTOM / PAGE 11
PEOPLE AND CULTURE CONTINUED

Greater work flexibilityA working environment that enables focus, great collaboration and high levels of creativity and productivity is essential for TomTom'ers to best innovate and lead.
With people moving from the office to working fully remotely during the pandemic, we learned that the right working space is a flexible concept. When asked, TomTom’ers overall preferred a balance of home and office.
This inspired our activity-based Working @ TomTom (W@TT) initiative, launched at the beginning of 2021. Recognizing the benefits of working at home and the office, W@TT offers the best of both worlds. TomTom’ers, with their team and manager, decide how they balance working in the office and at home, depending on what they need to do.
We are making important changes in our offices to accommodate flexible working. Changing how they are set up and used will make them more active and adaptable. Our office in Pune, India, is the first to undergo a W@TT redesign.
W@TT gives TomTom’ers and their teams the freedom and flexibility to use the workspace that fits their activities to make the biggest impact.
Setting the exampleW@TT, Choose to Lead and our hackathons continue to evolve life at TomTom. During such changes, strong, vocal leaders are important to help guide TomTom'ers through and ensure transparency on where TomTom is going. Our Senior Leadership Team, made up of leaders from across the business, is playing an important, active role.
Our quarterly All Hands brings our leaders together to align all TomTom’ers on how we are building towards our next chapter. We also have Ask Me Anything sessions (AMAs), during which TomTom’ers are invited to ask open questions on key topics such as our business and product strategy.
Both the All Hands and AMAs stimulate an open dialogue between leaders and TomTom’ers. By outlining what is happening within TomTom, what we want to achieve and how we can achieve it together, leaders continue empowering all TomTom'ers to make decisions.
Employee well-being during COVID-19Safety and employee well-being have been the primary drivers of our response during the pandemic.
Following the local recommendations by government and health authorities where we operate, we transitioned all TomTom’ers to work from home, where applicable. As a global technology company, TomTom’ers were already collaborating across multiple locations and time zones with colleagues who are not in the same physical place. This, along with an efficient response by a dedicated team, meant we were able to collaborate effectively and continue delivering on our strategic priorities. TomTom’ers demonstrated great adaptability and resilience, showing a strong sense of commitment towards each other and the organization.
Every one of us experienced the impact of this global pandemic in different ways. During this time, we placed extra emphasis on the well-being of TomTom’ers. We launched mechanisms to support our employees, including workshops, webinars, information sessions on best practices from experts, and online advice on various topics directly from other TomTom'ers.
We also organized TomTalks events with external speakers, improved our assistance offering in multiple countries, and started a Buddy program to help our employees maintain contact with one another, among other initiatives to promote a sense of community.
Extra steps for mental well-beingA safe and healthy working environment is key to helping TomTom’ers feel empowered and comfortable. Our well-being efforts focus on creating such an environment, organizing initiatives and sessions to raise awareness around health issues.
In response to another year of the pandemic, in 2021 we emphasized mental health support for TomTom’ers. Our core campaign, TomTom Mental Health Week, communicated a simple message: “Your Mental Health Matters.”
WE ARE TOMTOM / PAGE 12
PEOPLE AND CULTURE CONTINUED

Creating a better world goes beyond our technologies
At TomTom, corporate responsibility is not an afterthought or about checking a box. We are guided by our desire to create a better world. Our values and vision come through in our products and services, people and communities, and our business operations.
As a global business, we embrace our responsibility to not only minimize our negative impact, but also to maximize the positive one. Our Traffic data helps local governments to manage traffic, businesses to plan smarter working hours and drivers to avoid congested roads, meaning less emissions. We also know that our impact on creating a better world goes beyond our technologies, and we take this responsibility seriously. As a leading location technology expert we strive to not only change the world with our products and services but also to inspire the next generation of tech talent and innovators. Further, we organize initiatives to give back to the communities in which we are present.
Our ambition is to enable a better world for all through our products and services, our business practices and our community involvement.At TomTom we recognize the climate change challenges and are committed to ensuring a sustainable business for our customers and the planet. TomTom's impact on improving road safety and reducing congestion and emissions started many years ago, when we launched the world's first route-planning software for mobile devices. We have since come a long way thanks to the continued innovation of our products and services. Based on our Environmental Policy, we are continually taking steps to reduce our environmental impact through our responsible internal business practices: our Go Green office sustainability programs, practices around materials and energy, waste recycling efforts, and driving a responsible supply chain.
Guided by five central pillars in 2021, which we consider our material topics, TomTom'ers support our drive for a responsible business:
• Reducing environmental impact• Fostering equality• Giving back to society• Improving road safety• Upholding ethical business practices
Supported by the Management Board and the Supervisory Board, TomTom took many initiatives for enhanced reporting on these pillars in 2021. We made progress in improving our reporting in 2021 and are still in the process of identifying material topics and developing KPIs. We have initiated reporting on Scope 1 and Scope 2 emissions in this Annual Report 2021. With the reporting base set, TomTom will perform a materiality assessment and publish a materiality matrix in the Annual Report 2022 to reassess the material topics and related material risks. All with the aim to move to integrated reporting over time. We will continue improving and expanding our reporting initiatives, included in this section, in 2022.
WE ARE TOMTOM / PAGE 13
ENVIRONMENTAL, SOCIAL AND GOVERNANCE

AMBITION
At TomTom, we are committed to sustainability. With our products and services we help everyone – people, cities, governments and businesses – make smarter decisions, to help save millions of lives globally, eliminate congestion, reduce emissions, and allow us to rebuild cities around people and not just cars.
Since 2020, TomTom integrates the UN Global Compact and its principles as integral parts of our CSR strategy, our culture and our day-to-day operations. Our social commitments are centered around the three Sustainable Development Goals (SDGs) that best align with TomTom's vision as set in 2020 (SDG 4 Quality education, SDG 5 Gender equality, and SDG 11 Sustainable cities and communities). TomTom remains committed to the following SDG targets:
COMMITMENT SDG'sTarget 4.4By 2030, substantially increase the number of youth and adults who have relevant skills, including technical and vocational skills, for employment, decent jobs and entrepreneurship
Target 5.5Ensure women’s full and effective participation and equal opportunities for leadership at all levels of decision-making in political, economic and public life
Target 11.6By 2030, reduce the adverse per capita environmental impact of cities, including by paying special attention to air quality and municipal and other waste management
2021 was a year of continuing development. We strengthened the ESG governance structure by appointing an ESG coordinator and an ESG working group. It was determined that the current SDG social scope needed to be expanded with our environmental footprint. While reviewing the SDG targets and the overall ESG reporting requirements, as indicated above, it was concluded that a more structured materiality assessment was needed in order to set concrete and meaningful key performance indicators (KPIs).
In 2022, we plan to perform a materiality assessment, involving both internal and external stakeholders, and create a materiality matrix which will allow us to set clear and measurable KPIs. In addition, we will continue enhancing our emission reporting, and formalizing our reporting framework for communicating our progress towards our set targets to the Management Board and the Supervisory Board, and to our stakeholders. Having KPIs, underpinned by a broad materiality assessment and a materiality matrix, and adequate data collection practices in place, will further drive us towards a fully integrated ESG strategy.
EU TAXONOMY
The EU Taxonomy establishes an EU-wide classification framework intended to provide businesses and investors with a common language to identify, and to report on as of 1 January 2022, to what degree economic activities can be considered environmentally sustainable through the creation of activity specific sustainability criteria. Under the requirements of the EU Taxonomy, companies currently in scope of NFRD need to disclose for reporting period 2021 the proportion of Taxonomy-eligible and Taxonomy non-eligible economic activities in their total turnover, Capital Expenditures (CAPEX) and Operating Expenses (OPEX) including some qualitative information.
In 2021, TomTom has performed an assessment of the applicable EU Taxonomy criteria. Based on this assessment we concluded that our revenue generating activities do not fall under any of the activities described in the Annexes for Climate Change Mitigation and Climate Change Adaptation.
Hence the proportion of revenue that can be considered as eligible is 0% of our total revenue of €507 million. As these definitions are broadly formulated, our assessment is based on our interpretations on how this applies to our business activities and the impact thereof on eligibility. More information on our product offerings and their impact on the environment can be found in the Environmental section on the next page. Disclosures on the nature of our revenue and the accounting policy relating to revenue recognition are provided in note 6 of the financial statements.
In relation to our efforts to make our offices and facilities more sustainable, activities such as the implementation of energy management systems can be considered as eligible activities for the KPIs Operating Expenses (OPEX) and Capital Expenditures (CAPEX). The proportion of our operating expenses and capital expenditures attributed to these activities are both considered to be less than 1% of respectively our total operating expenses and capital expenditures. Refer note 15 of the financial statements for more information on capital expenditures as well as the related accounting policies. Operating expenses per the EU Taxonomy definition covers direct non-capitalized costs that relate to research and development, building renovation measures, short-term lease, maintenance and repair, and any other direct expenditures relating to the day-to-day servicing of assets of property, plant and equipment. This differs from the definition of operating expenses in our financial statements.
We will continue to assess our eligibility and the extent of EU Taxonomy alignment in 2022. Future guidance could result in more accurate definitions and other decision-making in meeting reporting obligations that may come into force, which could impact future EU Taxonomy reporting.
WE ARE TOMTOM / PAGE 14
ENVIRONMENTAL, SOCIAL AND GOVERNANCE CONTINUED

REDUCING ENVIRONMENTAL IMPACTAt TomTom we see climate change as an important environmental risk and feel responsible to reduce our own operational environmental impact. Through our offerings we are enabling everyone – people, cities, governments and businesses – to make smarter decisions and move towards a world with less emissions. While doing so, we are committed to operational sustainability. We adhere to our Environmental Policy and are continually increasing our efforts to identify and minimize our impact on the environment through responsible business practices.
Technologies to reduce emissionsInterest in electric vehicles (EVs) is soaring, yet their adoption is held back by doubts around practical feasibility. Drivers experience range anxiety, as they are unsure of the vehicle's range and the charging availability along their route. Our products help turn this range anxiety into range accuracy, offering piece of mind to drivers and accelerating the transition towards a cleaner and more sustainable future.
An EV's range depends on much more than its current battery level. Driving speed, traffic, road type and elevation all impact how far a vehicle can go. TomTom EV Routing and Range takes these factors and more into account to plan efficient routes, provide precise range predictions and calculate reliable estimated times of arrival – making every drive enjoyable and effortless. That includes long-distance EV routing that shows drivers where and when to charge on long journeys, as well as how long the stop will take. We also help drivers choose the best time and place for charging, based on availability, charging speed and user preferences.
Environmental policyOur Environmental Policy gives guidance to our employees, suppliers, customers, and other relevant stakeholders on how we uphold our environmental standards in everything we do, and helps us keep track of our goals, specific targets and continuous progress.
Our Environmental Policy and associated activities are part of our integrated Quality Management System (QMS), which helps us in our efforts to continuously improve our responsible business practices and supports our vision. Our QMS, which includes our Amsterdam and Eindhoven offices, is compliant with the requirements of the International Organization for Standardization (ISO) 14001:2015 and was re-certified in 2021. The QMS aims to support the business by meeting legal requirements, industry standards, and customer/stakeholder requirements and expectations, helping us minimize our environmental impact. Regular audits are performed by both QMS external auditors, and Group Internal Audit as a control mechanism.
WE ARE TOMTOM / PAGE 15
ENVIRONMENTAL, SOCIAL AND GOVERNANCE CONTINUED
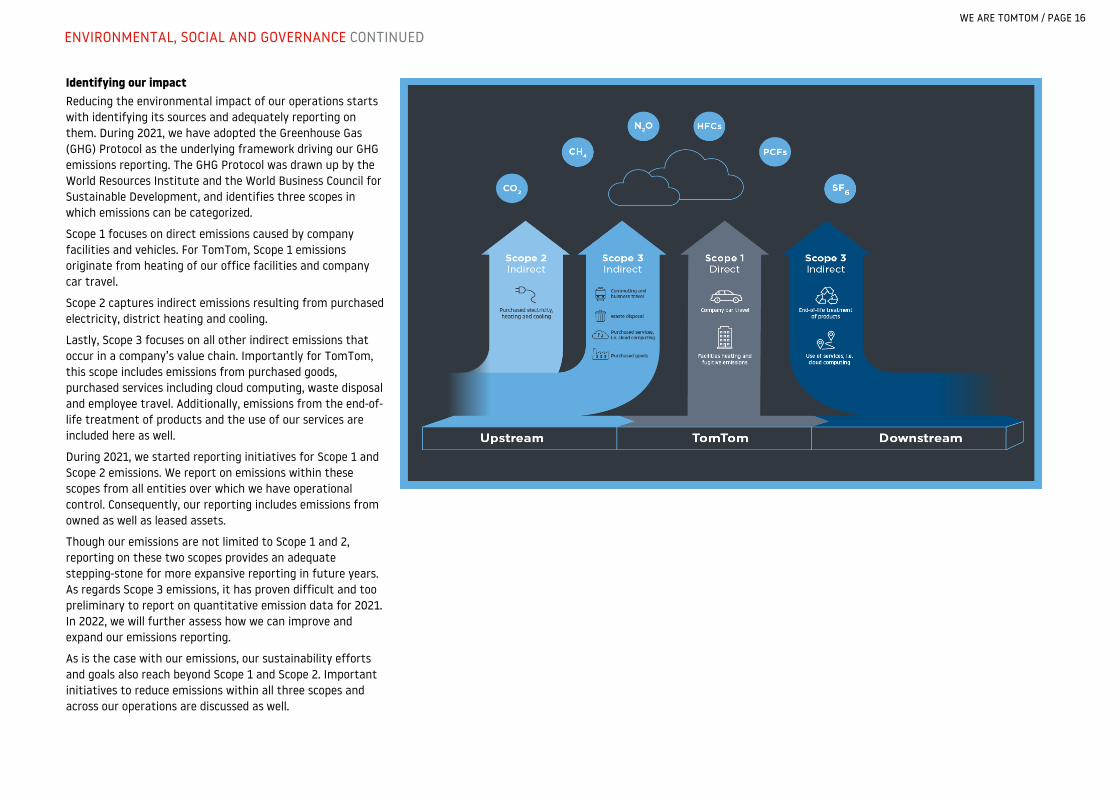
Identifying our impact Reducing the environmental impact of our operations starts with identifying its sources and adequately reporting on them. During 2021, we have adopted the Greenhouse Gas (GHG) Protocol as the underlying framework driving our GHG emissions reporting. The GHG Protocol was drawn up by the World Resources Institute and the World Business Council for Sustainable Development, and identifies three scopes in which emissions can be categorized.
Scope 1 focuses on direct emissions caused by company facilities and vehicles. For TomTom, Scope 1 emissions originate from heating of our office facilities and company car travel.
Scope 2 captures indirect emissions resulting from purchased electricity, district heating and cooling.
Lastly, Scope 3 focuses on all other indirect emissions that occur in a company’s value chain. Importantly for TomTom, this scope includes emissions from purchased goods, purchased services including cloud computing, waste disposal and employee travel. Additionally, emissions from the end-of-life treatment of products and the use of our services are included here as well.
During 2021, we started reporting initiatives for Scope 1 and Scope 2 emissions. We report on emissions within these scopes from all entities over which we have operational control. Consequently, our reporting includes emissions from owned as well as leased assets.
Though our emissions are not limited to Scope 1 and 2, reporting on these two scopes provides an adequate stepping-stone for more expansive reporting in future years. As regards Scope 3 emissions, it has proven difficult and too preliminary to report on quantitative emission data for 2021. In 2022, we will further assess how we can improve and expand our emissions reporting.
As is the case with our emissions, our sustainability efforts and goals also reach beyond Scope 1 and Scope 2. Important initiatives to reduce emissions within all three scopes and across our operations are discussed as well.
WE ARE TOMTOM / PAGE 16
ENVIRONMENTAL, SOCIAL AND GOVERNANCE CONTINUED
SCOPE 1 EMISSIONS
The reported Scope 1 emission figures are computed in accordance with the methods set out in the GHG Protocol. Even though the figures have been carefully computed, limited data availability has led us to use diverging methodologies per emission source.
Under the GHG Protocol, several calculation methods are given. The most accurate reporting is achieved by using the asset-specific method, which considers emissions from individual assets. This method requires detailed consumption data. Should these data not be available, the average-data method allows us to calculate emissions from assets using externally sourced emission factors. Figures for most sources of emissions are computed using a combination of the asset-specific and average-data method, as applicable per asset.
We aim to expand our data collection efforts in 2022, allowing us to increase the accuracy of Scope 1 reporting.
FacilitiesA portion of our Scope 1 emissions originate with fugitive emissions from refrigerant leakages and the use of fossil fuels for heating in our offices. These emissions are estimated using actual consumption data for all of our offices in the Netherlands, our Lebanon, NH (US) office, and a few minor office locations.
For other offices and leased coworking spaces, we compute emissions using the average-data method. We use the most recent available figures from the U.S. Energy Information Administration’s (EIA) Commercial Buildings Energy Consumption Survey (CBECS) as our main source of office energy intensity, adapting the figures to account for differing climates across our global footprint. Energy intensity figures are multiplied by floor areas, to arrive at emission estimates.
VehiclesOur vehicles also contribute to our Scope 1 emissions. We operate a fleet of leased passenger cars and an array of specialist mobile mapping (MoMa) vehicles.
We have collected consumption data for all vehicles, and report on their emissions for 2021. In addition, we report on comparative figures for 2020 emissions from our lease fleet. MoMa vehicle consumption data over 2020 was not available.
SCOPE 2 EMISSIONS
Scope 2 includes our indirect emissions from purchased electricity and district heating. These emissions center around our office locations, both owned and leased.
FacilitiesWe have actual consumption data for our offices in the Netherlands, Lebanon, NH (US), and some other locations. Due to limited data availability, we used average-data formulas to estimate energy consumption for other offices. Consumption estimates were made using energy intensity figures from EIA’s CBECS and floor area data. Though this is in line with the GHG Protocol, we aim to strengthen our data collection in 2022. This will allow for a more accurate representation of our indirect emissions.
Having collected or estimated consumption figures, our emissions from purchased electricity and district heating are computed using grid average emission factors per location.
To accelerate the global energy transition and lower TomTom’s corporate carbon footprint we extended renewable electricity certificates for our office locations in Amsterdam, Eindhoven, Ghent, and Lodz in 2021. We included our Lebanon, NH (US), Berlin, and brand-new Hanover office in this strategy, which will be continued in 2022.
Since we employ renewable energy certificates, the GHG Protocol demands us to report on Scope 2 emissions using two methods. Using the market-based method, we take the certificates into consideration. Conversely, the location-based method does not allow for the consideration of contractual instruments, only taking into account consumption data and grid-average emissions.
SCOPE 1 & 2 EMISSIONS PERFORMANCE
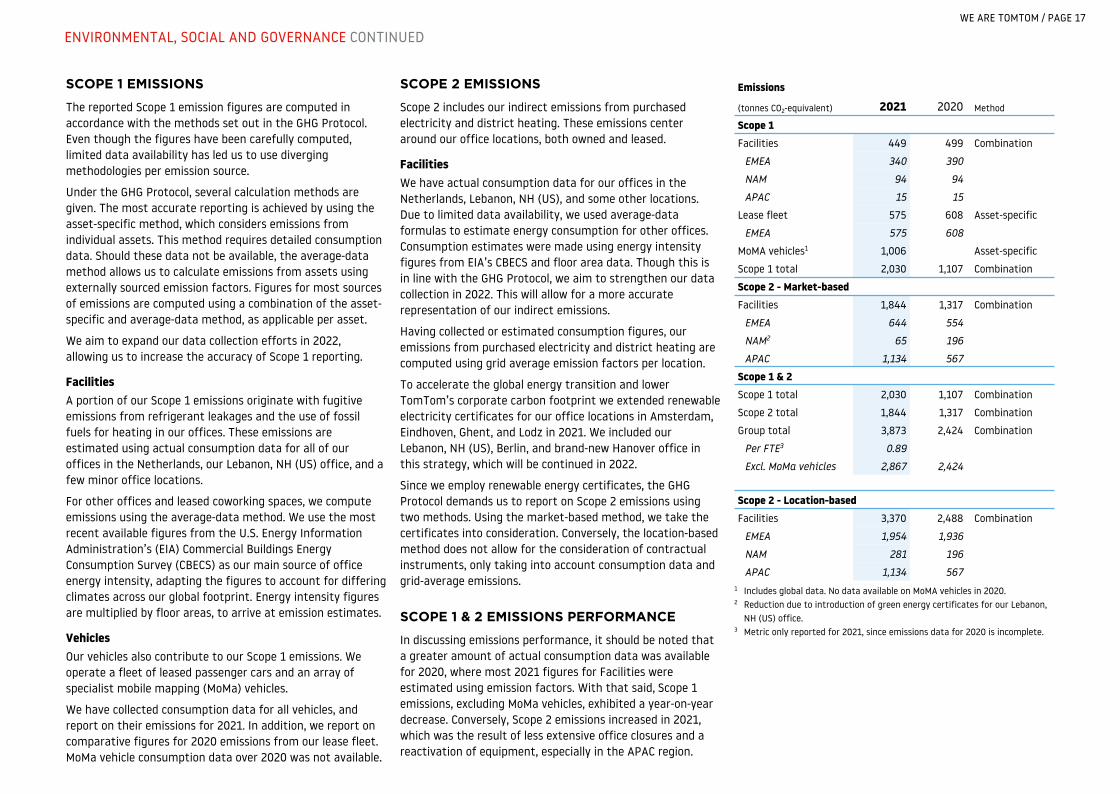
In discussing emissions performance, it should be noted that a greater amount of actual consumption data was available for 2020, where most 2021 figures for Facilities were estimated using emission factors. With that said, Scope 1 emissions, excluding MoMa vehicles, exhibited a year-on-year decrease. Conversely, Scope 2 emissions increased in 2021, which was the result of less extensive office closures and a reactivation of equipment, especially in the APAC region.
Emissions
(tonnes CO2-equivalent) 2021 2020 Method
Scope 1Facilities 449 499 Combination
EMEA 340 390
NAM 94 94
APAC 15 15
Lease fleet 575 608 Asset-specific
EMEA 575 608
MoMA vehicles1 1,006 Asset-specific
Scope 1 total 2,030 1,107 Combination
Scope 2 - Market-basedFacilities 1,844 1,317 Combination
EMEA 644 554
NAM2 65 196
APAC 1,134 567
Scope 1 & 2Scope 1 total 2,030 1,107 Combination
Scope 2 total 1,844 1,317 Combination
Group total 3,873 2,424 Combination
Per FTE3 0.89
Excl. MoMa vehicles 2,867 2,424
Scope 2 - Location-basedFacilities 3,370 2,488 Combination
EMEA 1,954 1,936
NAM 281 196
APAC 1,134 5671 Includes global data. No data available on MoMA vehicles in 2020.2 Reduction due to introduction of green energy certificates for our Lebanon,
NH (US) office.3 Metric only reported for 2021, since emissions data for 2020 is incomplete.
WE ARE TOMTOM / PAGE 17
ENVIRONMENTAL, SOCIAL AND GOVERNANCE CONTINUED
SCOPE 1 & 2 INITIATIVES
Scope 1 and Scope 2 emissions center on the environmental impact of our buildings and vehicles. We have launched several initiatives to limit our emissions.
Sustainable officesTo limit emissions stemming from our offices, we are actively promoting energy efficiency and working towards green building certifications for a wide range of our locations.
Energy efficiencyIn 2021 we launched an energy management system to collect and monitor energy and water consumption from 43 data points across 13 office locations. Due to the ongoing COVID-19 pandemic and governmental measures, changes in working conditions under our Working @ TomTom program and technical challenges in tenant spaces, we lowered the priority of our energy initiative. However, further development and automation of this process in 2022 must lead to a complete overview of Scope 2 energy consumption by 2022 across all office locations.
We accomplished becoming more transparent towards stakeholders about the environmental impact of internal operations by displaying the actual performance of our office utilities in three office locations in the Netherlands, representing around 25% of our workforce. The primary energy use of our offices in the Netherlands was impacted by fluctuating office occupancy during the COVID-19 pandemic.
Primary energy use (GJ/m2) 2021 2020Netherlands 0.78 0.88
Green building certificationsTomTom conducts green building assessments in various global office locations. Internationally recognized assessment and certification schemes such as BREEAM (Building Research Establishment Environmental Assessment Method) and LEED (Leadership in Energy and Environmental Design) are being used to adopt best practices and accomplish sustainable development goals. Topics addressed in these assessments are climate change, human health, water efficiency, biodiversity, and material use.
Following the successful BREEAM-NL certification for our headquarters office in Amsterdam (Amsterdam DRK) in 2020, our newly built Belgrade office was LEED BD+C (Gold) certified in February 2021. Our headquarters office in Amsterdam and our Eindhoven office became BREEAM In Use (Very Good) certified in December 2021. In addition, we strived to have our other office in Amsterdam (Amsterdam ODE) and Ghent offices BREEAM In Use (Very Good) certified in 2021. However, due to challenges in the timely completion of the pre-assessment, these certifications are postponed to the first quarter of 2022. The re-certification of our Ghent office is managed by the landlord to create impact on a larger scale with the ambition to get the complete building certified ranking BREEAM Very Good by 2023.
Our Amsterdam and Eindhoven offices operated carbon emission neutral in 2021 as a result of purchasing certified wind energy, the use of geothermal heating and cooling, and refrigerant management.
In 2022 we will continue with these sustainable office initiatives, replicating them in other strategic locations. We aim to have our brand-new Pune office and our Belgrade office LEED ID+C (Gold) certified. These certifications allow us to enhance internal sustainability performance and lower our Scope 1 and Scope 2 emissions accordingly.
Efficient vehiclesAs mentioned above, we are focusing on improving the efficiency of our buildings, an objective that also extends to our vehicle fleet.
For this reason, in August 2021, TomTom released its new Company Car Policy in Belgium which will be further extended to all European countries in 2022. This policy paves the way for the electrification of our fleet. The intent is to provide full electric or plugin hybrid lease cars by default.
SCOPE 3 INITIATIVES
Our emissions reporting is limited to Scope 1 and Scope 2 emissions, though our efforts also touch on Scope 3 emissions. We are driving a responsible supply chain, carefully managing our resources and promoting efficient operations.
Driving a responsible supply chainWe maintain a high level of social responsibility towards our customers and suppliers. In 2021, we stepped down as a member of the Responsible Business Alliance (RBA). We established our own TomTom Supplier Code of Conduct (SCoC) that sets out our expectations towards our business partners. As a result, any existing or new suppliers who have been provided with this SCoC must sign it and confirm their full compliance. Suppliers are also asked to acknowledge our Environmental Policy, to support our plans and efforts to reduce the environmental footprint of our business activities, and to improve social, environmental and ethical practices.
Cloud hosting and data centersHigh-quality, comprehensive location data is key to building the next generation of location-based applications. Dealing with big data to develop our products and services requires advanced, scalable, state-of-the-art technology, including secure, scalable data storage and hosting.
Our activities result in emissions from using either on-premise data centers or our use of cloud storage providers. In recent years, we have moved the majority of our activities to outsourced cloud-hosted storage such as Amazon Web Services and Microsoft Azure, which helps us manage these services and their impact more efficiently. In 2022, we will focus on working together with our suppliers on emissions reporting.
ManufacturingOutsourcing is an important element of our Consumer business model. The assembly of our Consumer navigation devices, accessories and (reverse) logistics is entirely outsourced. It is of great importance that our suppliers recognize and observe fundamental human rights, safety and the environment in their operations. As part of our Corporate Environmental Product Compliance program, we proactively monitor the legislative and regulatory developments that apply to our products, accessories and packaging in order to establish our corporate and supplier requirements. Environmental legislation on chemical substances is continually evolving; therefore we consistently monitor, evaluate and communicate these changes with our business partners to ensure we are current and compliant.
WE ARE TOMTOM / PAGE 18
ENVIRONMENTAL, SOCIAL AND GOVERNANCE CONTINUED

Management of resources, efficiency and consumptionWe have undertaken several initiatives to monitor and manage our consumption of resources in our offices.
WaterWe have implemented tooling to monitor water usage in the Netherlands, covering around 25% of our workforce. The impact of low office occupancy during COVID-19 restrictions in the Netherlands, is visible in the office water usage per FTE. Prior to the COVID-19 pandemic, the national average water consumption in the Netherlands in office buildings was 7.1 m3/FTE.
Water use
(m3/FTE) 2021 2020
Netherlands 2.92 2.71
In 2021 we started water usage reporting initiatives for our offices in Lodz, Ghent, Pune and Taipei, which will create a baseline for further opportunities for improvement in 2022.
ResourcesWhenever available we strive to use Forest Stewardship Council (FSC) certified products in cooperation with licensed suppliers. In previous years, we already selected FSC certified catering and sanitation products (e.g. coffee cups, toilet paper) by default. Now all frequently used furniture suppliers and construction contractors signed our letter of compliance and we continue to include responsible sourcing of timber products in new tenders. One highly valued furniture supplier took the effort to become licensed and together we are committed to continue our efforts against unsustainable deforestation. In 2021 we worked together with our stationary supplier to assess our standard range of products and selected 32 preferred sustainable alternatives based on their recycled and eco-friendly contents.
Waste management and recyclingTomTom is committed to a proactive global take-back strategy since we started our global waste recycling program in 2019. Our strategy spans waste generated at both our facilities and within our supply chain.
FacilitiesWe have implemented recycling in all TomTom offices worldwide, focused on increasing recycled waste and reducing general waste. The program entails separating waste at the source, making sure each waste type is processed properly by our suppliers, ensuring that waste recycling takes place within the country, and specified raw materials are to be created out of our office waste.
Our new way of working affects the quantities of material demand and office waste. This can be seen in the footprints of our offices and, for example, in waste statistics for the Netherlands. The changes to our way of working, caused by the COVID-19 pandemic, led us to execute major clean-ups of our storage rooms and archives in 2021. We disposed 96 two-sit desks to be reused by resellers and charities. This contributed significantly to waste volume and led to a decrease in the percentage of waste recycled, while increasing the percentage of waste that was reused.
Office waste
(% of waste in the Netherlands) 2021 2020
Reused 39 % 0 %
Recycled 29 % 55 %
Composted 11 % 8 %
Energy recovery 21 % 37 %
Landfill 0 % 0 %
Total (in kg) 33,239 31,218
We continue to move away from environmentally less preferable disposal methods like energy recovery and landfills. With more TomTom'ers returning to our offices, we aim to improve the ratio of composted, recycled and reused waste by creating awareness and sharing educative communication materials about separation at the source in 2022.
Supply chainBecause of our ongoing shift towards providing more data, content and services and declining PND sales, we expect to produce less waste in our supply chain over the coming years, resulting in a smaller environmental footprint. This is also reflected in the amount of associated waste recycled, which is decreasing.
Recycled waste
(Tons, unless stated otherwise) 2021 20201
Electrical and electronic equipment (WEEE) 197 225
Battery waste 13 14
Packaging waste2 211 2321 Data deviates from reported numbers in Corporate Responsibility Report
2020.2 Excludes data from the USA, Australia and New Zealand.
We remain committed to recycling and a responsible end-of-life treatment of our sold products.
TravelingSustainability is a top priority for TomTom's Travel Program in 2022. When booking travel, travelers will be encouraged to replace short-haul flights for trains, and the preferred hotels will be carefully selected based on their sustainability program.
WE ARE TOMTOM / PAGE 19
ENVIRONMENTAL, SOCIAL AND GOVERNANCE CONTINUED
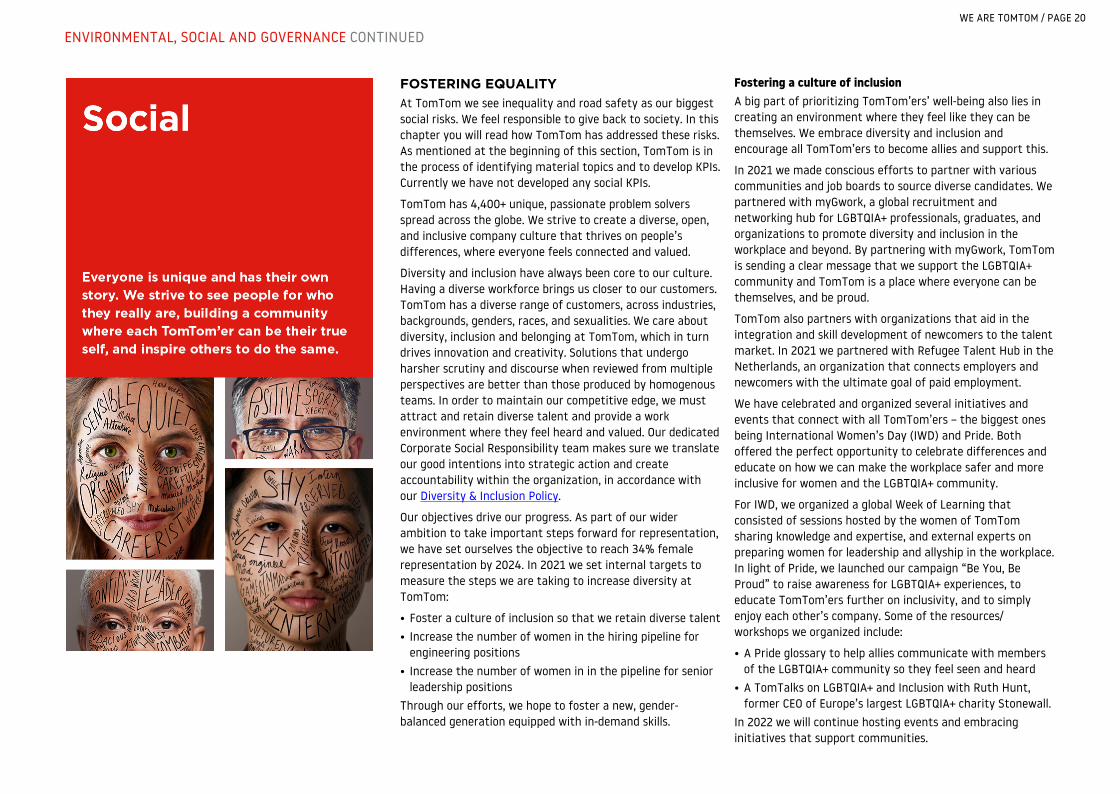
FOSTERING EQUALITYAt TomTom we see inequality and road safety as our biggest social risks. We feel responsible to give back to society. In this chapter you will read how TomTom has addressed these risks. As mentioned at the beginning of this section, TomTom is in the process of identifying material topics and to develop KPIs. Currently we have not developed any social KPIs.
TomTom has 4,400+ unique, passionate problem solvers spread across the globe. We strive to create a diverse, open, and inclusive company culture that thrives on people’s differences, where everyone feels connected and valued.
Diversity and inclusion have always been core to our culture. Having a diverse workforce brings us closer to our customers. TomTom has a diverse range of customers, across industries, backgrounds, genders, races, and sexualities. We care about diversity, inclusion and belonging at TomTom, which in turn drives innovation and creativity. Solutions that undergo harsher scrutiny and discourse when reviewed from multiple perspectives are better than those produced by homogenous teams. In order to maintain our competitive edge, we must attract and retain diverse talent and provide a work environment where they feel heard and valued. Our dedicated Corporate Social Responsibility team makes sure we translate our good intentions into strategic action and create accountability within the organization, in accordance with our Diversity & Inclusion Policy.
Our objectives drive our progress. As part of our wider ambition to take important steps forward for representation, we have set ourselves the objective to reach 34% female representation by 2024. In 2021 we set internal targets to measure the steps we are taking to increase diversity at TomTom:
• Foster a culture of inclusion so that we retain diverse talent• Increase the number of women in the hiring pipeline for
engineering positions• Increase the number of women in in the pipeline for senior
leadership positionsThrough our efforts, we hope to foster a new, gender-balanced generation equipped with in-demand skills.
Fostering a culture of inclusionA big part of prioritizing TomTom’ers’ well-being also lies in creating an environment where they feel like they can be themselves. We embrace diversity and inclusion and encourage all TomTom’ers to become allies and support this.
In 2021 we made conscious efforts to partner with various communities and job boards to source diverse candidates. We partnered with myGwork, a global recruitment and networking hub for LGBTQIA+ professionals, graduates, and organizations to promote diversity and inclusion in the workplace and beyond. By partnering with myGwork, TomTom is sending a clear message that we support the LGBTQIA+ community and TomTom is a place where everyone can be themselves, and be proud.
TomTom also partners with organizations that aid in the integration and skill development of newcomers to the talent market. In 2021 we partnered with Refugee Talent Hub in the Netherlands, an organization that connects employers and newcomers with the ultimate goal of paid employment.
We have celebrated and organized several initiatives and events that connect with all TomTom’ers – the biggest ones being International Women’s Day (IWD) and Pride. Both offered the perfect opportunity to celebrate differences and educate on how we can make the workplace safer and more inclusive for women and the LGBTQIA+ community.
For IWD, we organized a global Week of Learning that consisted of sessions hosted by the women of TomTom sharing knowledge and expertise, and external experts on preparing women for leadership and allyship in the workplace. In light of Pride, we launched our campaign “Be You, Be Proud” to raise awareness for LGBTQIA+ experiences, to educate TomTom’ers further on inclusivity, and to simply enjoy each other’s company. Some of the resources/workshops we organized include:
• A Pride glossary to help allies communicate with members of the LGBTQIA+ community so they feel seen and heard
• A TomTalks on LGBTQIA+ and Inclusion with Ruth Hunt, former CEO of Europe’s largest LGBTQIA+ charity Stonewall.
In 2022 we will continue hosting events and embracing initiatives that support communities.
WE ARE TOMTOM / PAGE 20
ENVIRONMENTAL, SOCIAL AND GOVERNANCE CONTINUED
Women in engineering and leadership positionsWe believe diversity makes TomTom stronger as a company. Our people have a wide variety of backgrounds. There are people with disabilities, people from the LGBTQIA+ community, people of color, and more. We take effort to include everyone and strive for diversity, on our journey to delight our customers together and become a better, stronger company.
As a direct result of setting the targets and objective to reach 34% female representation by 2024, TomTom hired more women in 2021. Women accounted for 24% of new hires in 2021 compared to 19% in 2020.
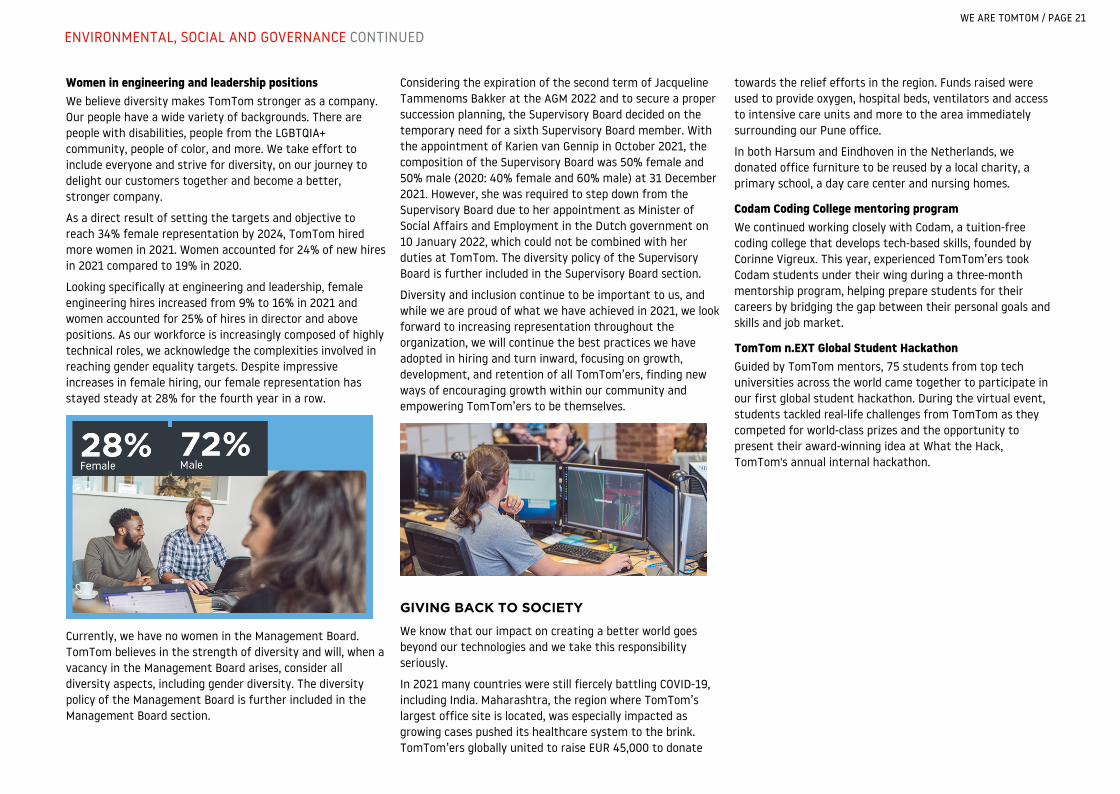
Looking specifically at engineering and leadership, female engineering hires increased from 9% to 16% in 2021 and women accounted for 25% of hires in director and above positions. As our workforce is increasingly composed of highly technical roles, we acknowledge the complexities involved in reaching gender equality targets. Despite impressive increases in female hiring, our female representation has stayed steady at 28% for the fourth year in a row.
Currently, we have no women in the Management Board. TomTom believes in the strength of diversity and will, when a vacancy in the Management Board arises, consider all diversity aspects, including gender diversity. The diversity policy of the Management Board is further included in the Management Board section.
Considering the expiration of the second term of Jacqueline Tammenoms Bakker at the AGM 2022 and to secure a proper succession planning, the Supervisory Board decided on the temporary need for a sixth Supervisory Board member. With the appointment of Karien van Gennip in October 2021, the composition of the Supervisory Board was 50% female and 50% male (2020: 40% female and 60% male) at 31 December 2021. However, she was required to step down from the Supervisory Board due to her appointment as Minister of Social Affairs and Employment in the Dutch government on 10 January 2022, which could not be combined with her duties at TomTom. The diversity policy of the Supervisory Board is further included in the Supervisory Board section.
Diversity and inclusion continue to be important to us, and while we are proud of what we have achieved in 2021, we look forward to increasing representation throughout the organization, we will continue the best practices we have adopted in hiring and turn inward, focusing on growth, development, and retention of all TomTom’ers, finding new ways of encouraging growth within our community and empowering TomTom’ers to be themselves.
GIVING BACK TO SOCIETY
We know that our impact on creating a better world goes beyond our technologies and we take this responsibility seriously.
In 2021 many countries were still fiercely battling COVID-19, including India. Maharashtra, the region where TomTom’s largest office site is located, was especially impacted as growing cases pushed its healthcare system to the brink. TomTom’ers globally united to raise EUR 45,000 to donate
towards the relief efforts in the region. Funds raised were used to provide oxygen, hospital beds, ventilators and access to intensive care units and more to the area immediately surrounding our Pune office.
In both Harsum and Eindhoven in the Netherlands, we donated office furniture to be reused by a local charity, a primary school, a day care center and nursing homes.
Codam Coding College mentoring programWe continued working closely with Codam, a tuition-free coding college that develops tech-based skills, founded by Corinne Vigreux. This year, experienced TomTom’ers took Codam students under their wing during a three-month mentorship program, helping prepare students for their careers by bridging the gap between their personal goals and skills and job market.
TomTom n.EXT Global Student HackathonGuided by TomTom mentors, 75 students from top tech universities across the world came together to participate in our first global student hackathon. During the virtual event, students tackled real-life challenges from TomTom as they competed for world-class prizes and the opportunity to present their award-winning idea at What the Hack, TomTom's annual internal hackathon.
WE ARE TOMTOM / PAGE 21
ENVIRONMENTAL, SOCIAL AND GOVERNANCE CONTINUED
IMPROVING ROAD SAFETY We are committed to investing in technologies that make roads safer for all. Road crashes take a huge toll on individuals, families and nations, claiming the lives of more than 3,000 people each day. We are creating technologies that make driving safer, such as:
• Embedded navigation, consisting of SD/HD maps and navigation software that enhances driver concentration on the road ahead
• ADAS map features for more advanced automated vehicle safety features (speed limits, tail gate warnings, automatic braking and gear shifting)
• Navigation and routing provide accurate route guidance and estimated times of arrival, enabling drivers to get where they are going on time with less stress
• Traffic information services provide early warnings about traffic incidents such as upcoming jams, helping drivers slow down gradually rather than needing to brake sharply.
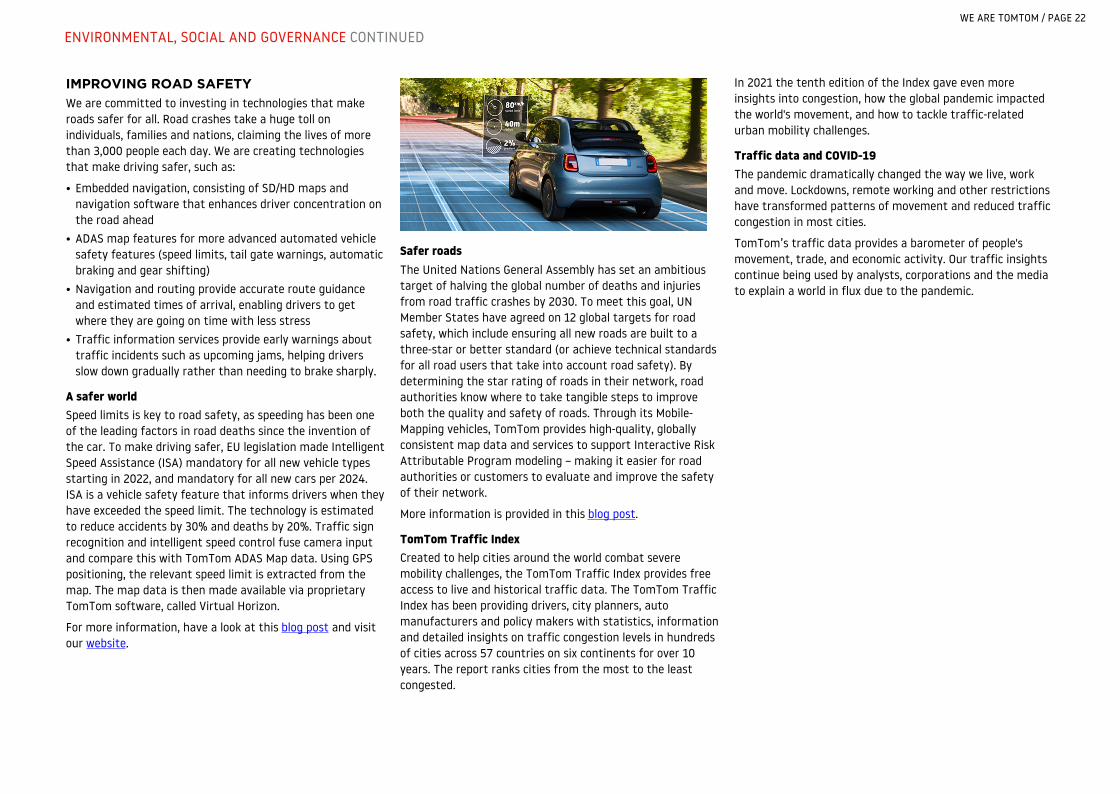
A safer worldSpeed limits is key to road safety, as speeding has been one of the leading factors in road deaths since the invention of the car. To make driving safer, EU legislation made Intelligent Speed Assistance (ISA) mandatory for all new vehicle types starting in 2022, and mandatory for all new cars per 2024. ISA is a vehicle safety feature that informs drivers when they have exceeded the speed limit. The technology is estimated to reduce accidents by 30% and deaths by 20%. Traffic sign recognition and intelligent speed control fuse camera input and compare this with TomTom ADAS Map data. Using GPS positioning, the relevant speed limit is extracted from the map. The map data is then made available via proprietary TomTom software, called Virtual Horizon.
For more information, have a look at this blog post and visit our website.
Safer roadsThe United Nations General Assembly has set an ambitious target of halving the global number of deaths and injuries from road traffic crashes by 2030. To meet this goal, UN Member States have agreed on 12 global targets for road safety, which include ensuring all new roads are built to a three-star or better standard (or achieve technical standards for all road users that take into account road safety). By determining the star rating of roads in their network, road authorities know where to take tangible steps to improve both the quality and safety of roads. Through its Mobile-Mapping vehicles, TomTom provides high-quality, globally consistent map data and services to support Interactive Risk Attributable Program modeling – making it easier for road authorities or customers to evaluate and improve the safety of their network.
More information is provided in this blog post.
TomTom Traffic IndexCreated to help cities around the world combat severe mobility challenges, the TomTom Traffic Index provides free access to live and historical traffic data. The TomTom Traffic Index has been providing drivers, city planners, auto manufacturers and policy makers with statistics, information and detailed insights on traffic congestion levels in hundreds of cities across 57 countries on six continents for over 10 years. The report ranks cities from the most to the least congested.
In 2021 the tenth edition of the Index gave even more insights into congestion, how the global pandemic impacted the world's movement, and how to tackle traffic-related urban mobility challenges.
Traffic data and COVID-19The pandemic dramatically changed the way we live, work and move. Lockdowns, remote working and other restrictions have transformed patterns of movement and reduced traffic congestion in most cities.
TomTom’s traffic data provides a barometer of people's movement, trade, and economic activity. Our traffic insights continue being used by analysts, corporations and the media to explain a world in flux due to the pandemic.
WE ARE TOMTOM / PAGE 22
ENVIRONMENTAL, SOCIAL AND GOVERNANCE CONTINUED
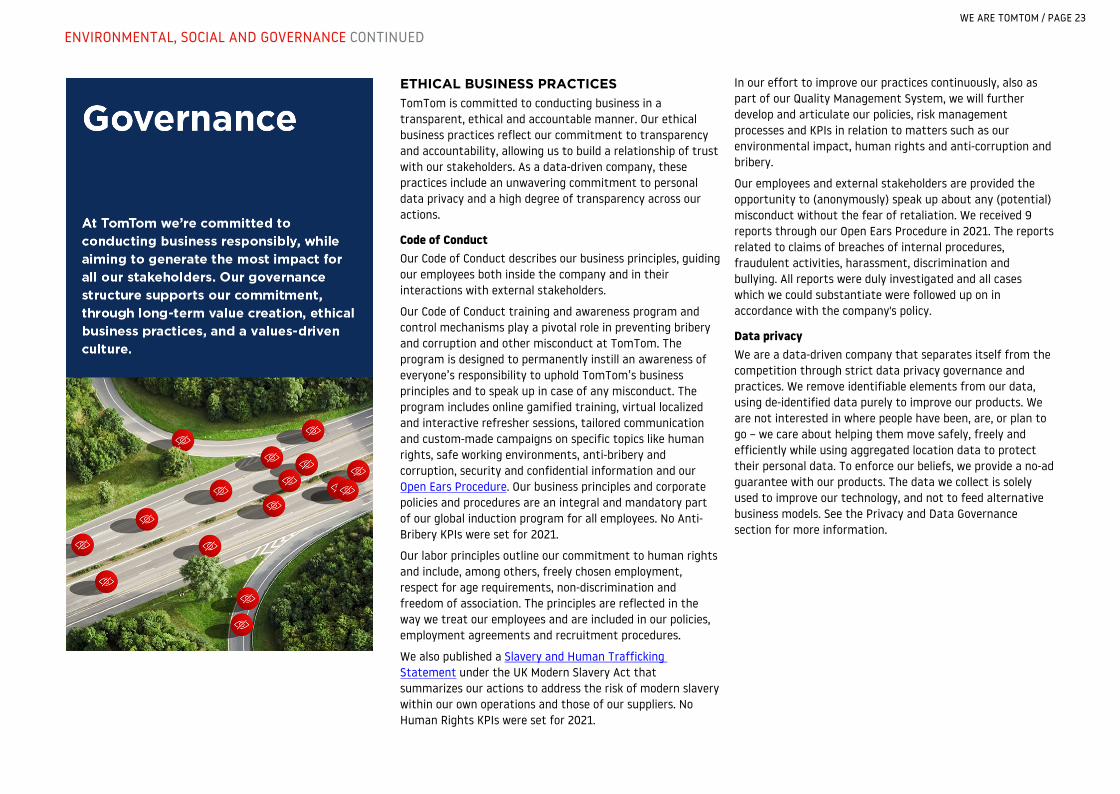
ETHICAL BUSINESS PRACTICES TomTom is committed to conducting business in a transparent, ethical and accountable manner. Our ethical business practices reflect our commitment to transparency and accountability, allowing us to build a relationship of trust with our stakeholders. As a data-driven company, these practices include an unwavering commitment to personal data privacy and a high degree of transparency across our actions.
Code of ConductOur Code of Conduct describes our business principles, guiding our employees both inside the company and in their interactions with external stakeholders.
Our Code of Conduct training and awareness program and control mechanisms play a pivotal role in preventing bribery and corruption and other misconduct at TomTom. The program is designed to permanently instill an awareness of everyone’s responsibility to uphold TomTom’s business principles and to speak up in case of any misconduct. The program includes online gamified training, virtual localized and interactive refresher sessions, tailored communication and custom-made campaigns on specific topics like human rights, safe working environments, anti-bribery and corruption, security and confidential information and our Open Ears Procedure. Our business principles and corporate policies and procedures are an integral and mandatory part of our global induction program for all employees. No Anti-Bribery KPIs were set for 2021.
Our labor principles outline our commitment to human rights and include, among others, freely chosen employment, respect for age requirements, non-discrimination and freedom of association. The principles are reflected in the way we treat our employees and are included in our policies, employment agreements and recruitment procedures.
We also published a Slavery and Human Trafficking Statement under the UK Modern Slavery Act that summarizes our actions to address the risk of modern slavery within our own operations and those of our suppliers. No Human Rights KPIs were set for 2021.
In our effort to improve our practices continuously, also as part of our Quality Management System, we will further develop and articulate our policies, risk management processes and KPIs in relation to matters such as our environmental impact, human rights and anti-corruption and bribery.
Our employees and external stakeholders are provided the opportunity to (anonymously) speak up about any (potential) misconduct without the fear of retaliation. We received 9 reports through our Open Ears Procedure in 2021. The reports related to claims of breaches of internal procedures, fraudulent activities, harassment, discrimination and bullying. All reports were duly investigated and all cases which we could substantiate were followed up on in accordance with the company's policy.
Data privacyWe are a data-driven company that separates itself from the competition through strict data privacy governance and practices. We remove identifiable elements from our data, using de-identified data purely to improve our products. We are not interested in where people have been, are, or plan to go – we care about helping them move safely, freely and efficiently while using aggregated location data to protect their personal data. To enforce our beliefs, we provide a no-ad guarantee with our products. The data we collect is solely used to improve our technology, and not to feed alternative business models. See the Privacy and Data Governance section for more information.
WE ARE TOMTOM / PAGE 23
ENVIRONMENTAL, SOCIAL AND GOVERNANCE CONTINUED
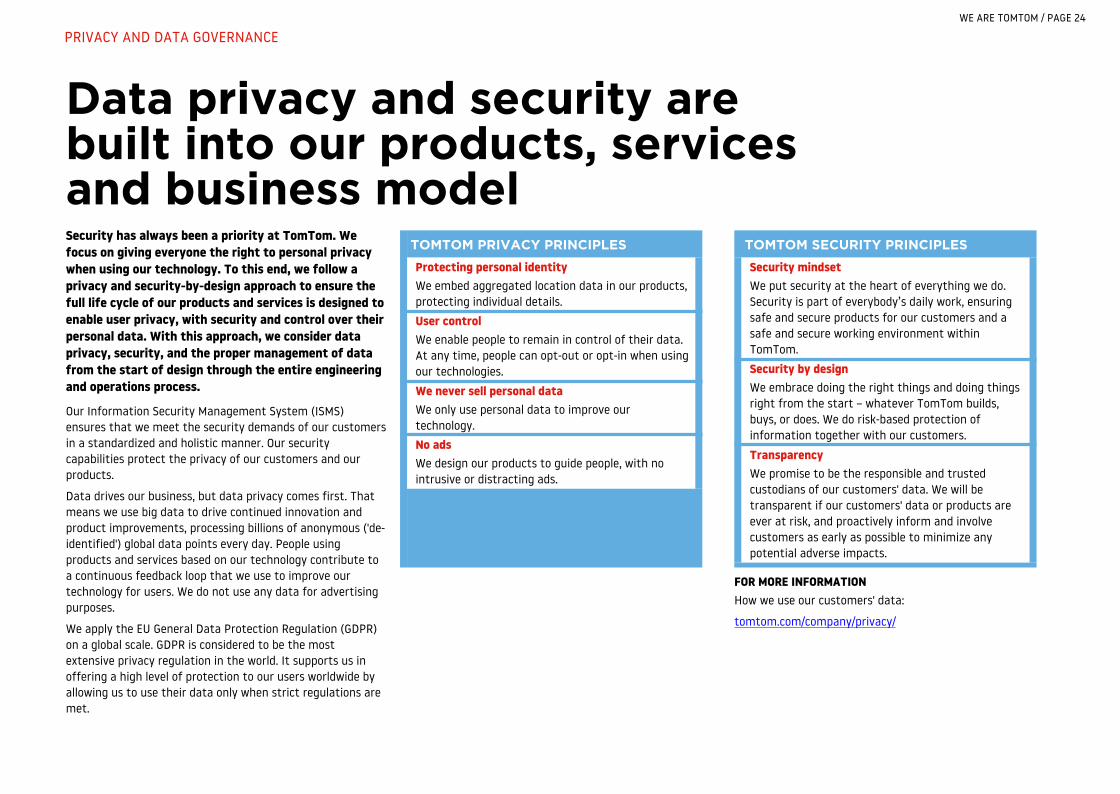
Data privacy and security are built into our products, services and business modelSecurity has always been a priority at TomTom. We focus on giving everyone the right to personal privacy when using our technology. To this end, we follow a privacy and security-by-design approach to ensure the full life cycle of our products and services is designed to enable user privacy, with security and control over their personal data. With this approach, we consider data privacy, security, and the proper management of data from the start of design through the entire engineering and operations process.
Our Information Security Management System (ISMS) ensures that we meet the security demands of our customers in a standardized and holistic manner. Our security capabilities protect the privacy of our customers and our products.
Data drives our business, but data privacy comes first. That means we use big data to drive continued innovation and product improvements, processing billions of anonymous ('de-identified') global data points every day. People using products and services based on our technology contribute to a continuous feedback loop that we use to improve our technology for users. We do not use any data for advertising purposes.
We apply the EU General Data Protection Regulation (GDPR) on a global scale. GDPR is considered to be the most extensive privacy regulation in the world. It supports us in offering a high level of protection to our users worldwide by allowing us to use their data only when strict regulations are met.
TOMTOM PRIVACY PRINCIPLES
Protecting personal identityWe embed aggregated location data in our products, protecting individual details.
User control We enable people to remain in control of their data. At any time, people can opt-out or opt-in when using our technologies.
We never sell personal dataWe only use personal data to improve our technology.
No adsWe design our products to guide people, with no intrusive or distracting ads.
TOMTOM SECURITY PRINCIPLES
Security mindsetWe put security at the heart of everything we do. Security is part of everybody’s daily work, ensuring safe and secure products for our customers and a safe and secure working environment within TomTom.
Security by design We embrace doing the right things and doing things right from the start – whatever TomTom builds, buys, or does. We do risk-based protection of information together with our customers.
Transparency We promise to be the responsible and trusted custodians of our customers' data. We will be transparent if our customers' data or products are ever at risk, and proactively inform and involve customers as early as possible to minimize any potential adverse impacts.
FOR MORE INFORMATIONHow we use our customers' data:
tomtom.com/company/privacy/
WE ARE TOMTOM / PAGE 24
PRIVACY AND DATA GOVERNANCE

Strong cash generation, despite semiconductor supply chain issues(€ in millions, unless stated otherwise) 2021 2020 YoY change
Location Technology 394.0 392.2 0% Consumer 112.9 136.0 -17% Revenue 506.9 528.2 -4%
Gross profit 407.1 423.4 -4% Gross margin (%) 80 % 80%
EBITDA1 -19.5 -2.1EBITDA margin (%)1 -4 % 0%
Operating result (EBIT)1 -93.2 -287.7Operating margin (%)1 -18 % -54%
Net result -94.7 -257.6
Free cash flow (FCF)1 23.5 -26.5Free cash flow as a % of revenue 5 % (5%)
1 This is a non-GAAP measure and is further explained on page 119.
RevenueIn 2021 our Location Technology segment, consisting of our Automotive and Enterprise businesses, showed mixed results. Enterprise continues to perform solidly. But the recovery of Automotive has lagged expectations because industrywide semiconductor supply chain issues are hampering car production volumes. Our Consumer segment performed in line with our expectations.
Group revenue was €507 million, 4% lower compared with €528 million in 2021. Location Technology revenue remained relatively flat compared with last year. An increase of 4% in Enterprise revenue was offset by 2% decline in Automotive revenue. Consumer revenue for the year was €113 million, 17% lower compared with last year.
From a regional perspective, 58% of 2021 revenue was generated in Europe (2020: 63%), 27% in North America (2020: 26%) and 15% in the rest of the world (2020: 11%).
Gross profitThe gross margin for the year was 80%, equal to last year. The gross profit for the year was €407 million, 4% lower than in 2020.
Operating expensesTotal operating expenses (OPEX) for 2021 were €500 million compared with €711 million in 2020. The year-on-year OPEX decrease is mainly from lower amortization as the map asset from the Tele Atlas acquisition back in 2008 was fully amortized during 2020. OPEX excluding Depreciation & Amortization was relatively flat year on year.
In research and development (R&D) we maintained our investment level and continue executing on our strategy for further automating our mapmaking process and developing online products. Total R&D cash spend during the year, including capital expenditures and capitalized contract costs, showed a modest increase (2021: €327 million; 2020: €318 million). R&D operating expenses decreased by €201 million resulting from lower amortization (2021: €47 million; 2020: €257 million).
Sales and Marketing expenses decreased by €12 million due to a combination of lower amortization and the alignment of the Consumer organization with the revenue trend. General & Administrative expenses showed a modest increase of €3 million year on year.
2021 EBITDA decreased year on year to -€20 million (2020: -€2 million) due to a decrease in Location Technology EBITDA following higher R&D expenses.
Net resultThe total net result for the year was a loss of €95 million (2020: loss of €258 million).
Balance sheetTotal assets decreased by €87 million, from €978 million at the start of the year to €891 million at the end of December 2021. The decrease reflects further amortization of our map database and a decrease in both working capital and cash (including fixed term deposits). The year on year decrease in working capital items such as trade receivables and inventories reflect to some extent the lower revenues in Consumer and Automotive.
Deferred revenue increased from €404 million at the end of last year to €441 million mainly driven by payments received from Automotive customers which are required to be deferred.
Cash flowTotal cash flows from operating activities in 2021 was an inflow of €37 million, an increase of €57 million compared with an outflow of €20 million in 2020. The year-on-year trend is due to timing of invoicing and collection.
WE ARE TOMTOM / PAGE 25
FINANCIAL REVIEW
Total cash flow from investing activities in 2021 was an outflow of €20 million compared with an inflow of €74 million in 2020. Excluding the movements of cash placed in fixed term deposits, the cash flow used in investing activities increased by €7 million year on year to €13 million (2020: €6 million). The increase is due to higher investments in property, plant and equipment this year.
Free cash flow1 is an inflow of €24 million compared with an outflow of €26 million in 2020.
Cash and liquidityThe cash flow from financing activities for the year was an outflow of €44 million (2020: outflow of €30 million). This includes the completion of the share buyback of €33 million (2020: €17 million).
In 2021, 893 thousand options (2020: 645 thousand options) were exercised resulting in a €5 million cash inflow for the year (2020: €2 million).
At year-end 2021, TomTom had no outstanding bank borrowings and reported a net cash1 position of €356 million (2020: €372 million) .
Outlook Last year, we were confronted with lower car production volumes resulting from supply chain shortages affecting our Automotive revenue. For this year, 2022, we have assumed that these supply chain shortages will persist throughout the year. Nevertheless, we expect an increase in our Automotive operational revenue1. The effect on our reported revenue will be partly moderated, as our Automotive products increasingly shift towards a software-as-a-service model and thus the recognition of corresponding reported revenue is phased over a longer period of time.
In the Enterprise business, we renewed various customer contracts. Some of these renewals reflect lower usage, translating into a reduced contract value. This will affect our Enterprise revenue as of the fourth quarter of 2022 and beyond.
In 2022, we expect our Location Technology revenue, combination of Automotive and Enterprise, to be relatively flat and our Consumer revenue to decrease. This will result in an expected decline in Group revenue.
Our free cash flow1 will be negative in 2022 as we will increase investments in the further automation of our mapmaking platform and our application layer. This will allow us to improve our competitive position and capture market opportunities.
The total number of employees in 2022 is expected to be comparable with 2021.
For 2023, we expect continued increases in Automotive operational revenue1. Combined with cost-efficiency gains, we expect this to result in a strong positive free cash flow in 2023 and onwards.
1. Free cash flow (FCF), net cash and operational revenue are non-GAAP measures and are further explained on page 119
WE ARE TOMTOM / PAGE 26
FINANCIAL REVIEW CONTINUED
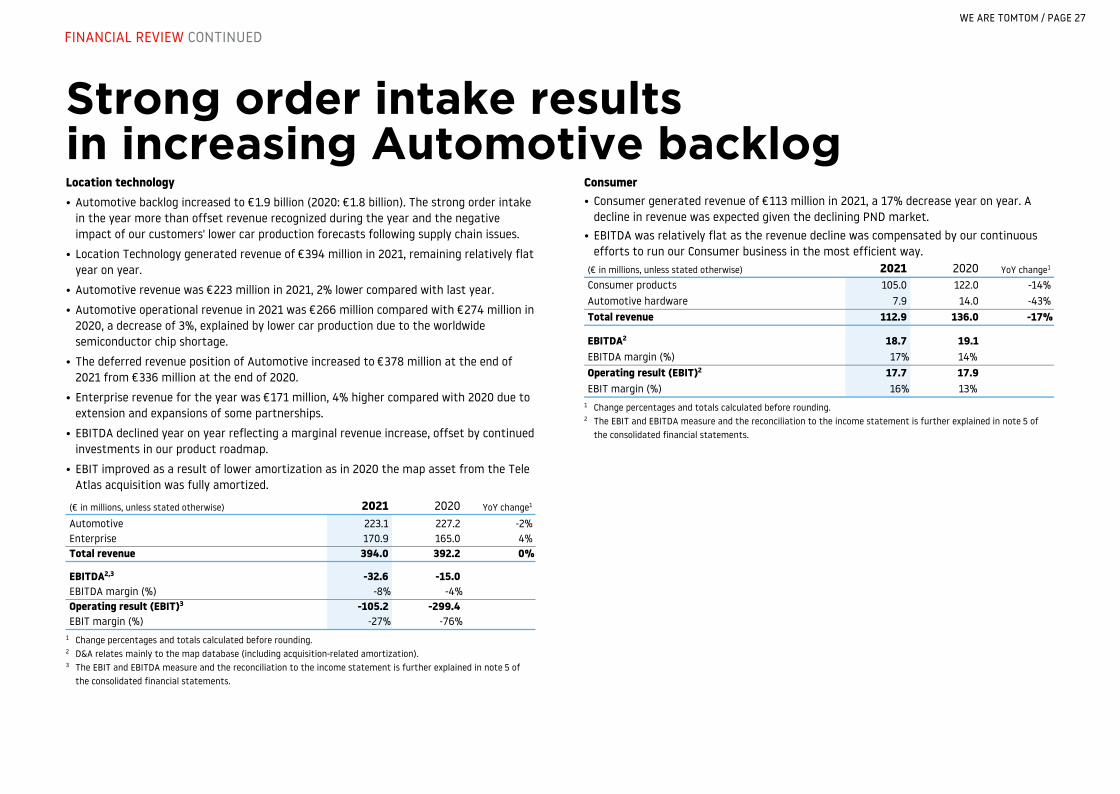
Strong order intake results in increasing Automotive backlogLocation technology• Automotive backlog increased to €1.9 billion (2020: €1.8 billion). The strong order intake
in the year more than offset revenue recognized during the year and the negative impact of our customers' lower car production forecasts following supply chain issues.
• Location Technology generated revenue of €394 million in 2021, remaining relatively flat year on year.
• Automotive revenue was €223 million in 2021, 2% lower compared with last year.
• Automotive operational revenue in 2021 was €266 million compared with €274 million in 2020, a decrease of 3%, explained by lower car production due to the worldwide semiconductor chip shortage.
• The deferred revenue position of Automotive increased to €378 million at the end of 2021 from €336 million at the end of 2020.
• Enterprise revenue for the year was €171 million, 4% higher compared with 2020 due to extension and expansions of some partnerships.
• EBITDA declined year on year reflecting a marginal revenue increase, offset by continued investments in our product roadmap.
• EBIT improved as a result of lower amortization as in 2020 the map asset from the Tele Atlas acquisition was fully amortized.
(€ in millions, unless stated otherwise) 2021 2020 YoY change1
Automotive 223.1 227.2 -2% Enterprise 170.9 165.0 4% Total revenue 394.0 392.2 0%
EBITDA2,3 -32.6 -15.0EBITDA margin (%) -8 % -4 %Operating result (EBIT)3 -105.2 -299.4EBIT margin (%) -27 % -76 %
1 Change percentages and totals calculated before rounding.2 D&A relates mainly to the map database (including acquisition-related amortization).3 The EBIT and EBITDA measure and the reconciliation to the income statement is further explained in note 5 of
the consolidated financial statements.
Consumer• Consumer generated revenue of €113 million in 2021, a 17% decrease year on year. A
decline in revenue was expected given the declining PND market.• EBITDA was relatively flat as the revenue decline was compensated by our continuous
efforts to run our Consumer business in the most efficient way.(€ in millions, unless stated otherwise) 2021 2020 YoY change1
Consumer products 105.0 122.0 -14% Automotive hardware 7.9 14.0 -43% Total revenue 112.9 136.0 -17%
EBITDA2 18.7 19.1EBITDA margin (%) 17 % 14% Operating result (EBIT)2 17.7 17.9EBIT margin (%) 16 % 13%
1 Change percentages and totals calculated before rounding.2 The EBIT and EBITDA measure and the reconciliation to the income statement is further explained in note 5 of
the consolidated financial statements.
WE ARE TOMTOM / PAGE 27
FINANCIAL REVIEW CONTINUED
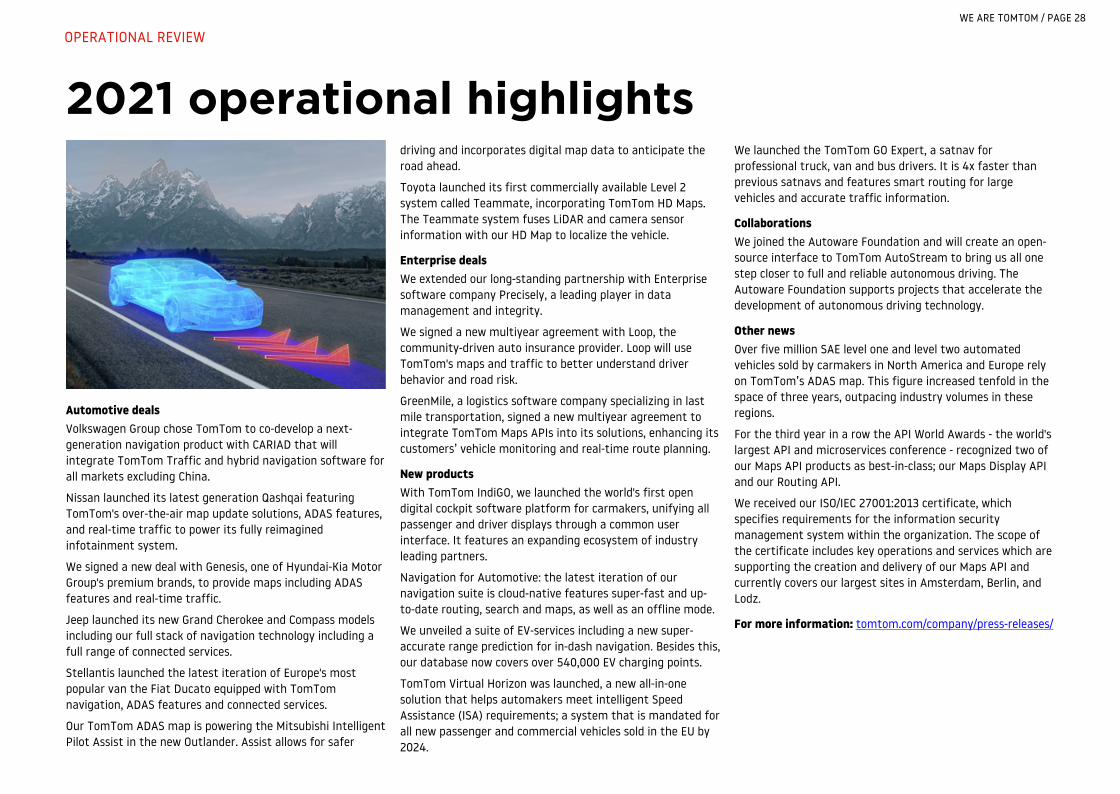
2021 operational highlights
Automotive dealsVolkswagen Group chose TomTom to co-develop a next-generation navigation product with CARIAD that will integrate TomTom Traffic and hybrid navigation software for all markets excluding China.
Nissan launched its latest generation Qashqai featuring TomTom's over-the-air map update solutions, ADAS features, and real-time traffic to power its fully reimagined infotainment system.
We signed a new deal with Genesis, one of Hyundai-Kia Motor Group's premium brands, to provide maps including ADAS features and real-time traffic.
Jeep launched its new Grand Cherokee and Compass models including our full stack of navigation technology including a full range of connected services.
Stellantis launched the latest iteration of Europe's most popular van the Fiat Ducato equipped with TomTom navigation, ADAS features and connected services.
Our TomTom ADAS map is powering the Mitsubishi Intelligent Pilot Assist in the new Outlander. Assist allows for safer
driving and incorporates digital map data to anticipate the road ahead.
Toyota launched its first commercially available Level 2 system called Teammate, incorporating TomTom HD Maps. The Teammate system fuses LiDAR and camera sensor information with our HD Map to localize the vehicle.
Enterprise dealsWe extended our long-standing partnership with Enterprise software company Precisely, a leading player in data management and integrity.
We signed a new multiyear agreement with Loop, the community-driven auto insurance provider. Loop will use TomTom's maps and traffic to better understand driver behavior and road risk.
GreenMile, a logistics software company specializing in last mile transportation, signed a new multiyear agreement to integrate TomTom Maps APIs into its solutions, enhancing its customers’ vehicle monitoring and real-time route planning.
New products With TomTom IndiGO, we launched the world's first open digital cockpit software platform for carmakers, unifying all passenger and driver displays through a common user interface. It features an expanding ecosystem of industry leading partners.
Navigation for Automotive: the latest iteration of our navigation suite is cloud-native features super-fast and up-to-date routing, search and maps, as well as an offline mode.
We unveiled a suite of EV-services including a new super-accurate range prediction for in-dash navigation. Besides this, our database now covers over 540,000 EV charging points.
TomTom Virtual Horizon was launched, a new all-in-one solution that helps automakers meet intelligent Speed Assistance (ISA) requirements; a system that is mandated for all new passenger and commercial vehicles sold in the EU by 2024.
We launched the TomTom GO Expert, a satnav for professional truck, van and bus drivers. It is 4x faster than previous satnavs and features smart routing for large vehicles and accurate traffic information.
CollaborationsWe joined the Autoware Foundation and will create an open-source interface to TomTom AutoStream to bring us all one step closer to full and reliable autonomous driving. The Autoware Foundation supports projects that accelerate the development of autonomous driving technology.
Other newsOver five million SAE level one and level two automated vehicles sold by carmakers in North America and Europe rely on TomTom’s ADAS map. This figure increased tenfold in the space of three years, outpacing industry volumes in these regions.
For the third year in a row the API World Awards - the world's largest API and microservices conference - recognized two of our Maps API products as best-in-class; our Maps Display API and our Routing API.
We received our ISO/IEC 27001:2013 certificate, which specifies requirements for the information security management system within the organization. The scope of the certificate includes key operations and services which are supporting the creation and delivery of our Maps API and currently covers our largest sites in Amsterdam, Berlin, and Lodz.
For more information: tomtom.com/company/press-releases/
WE ARE TOMTOM / PAGE 28
OPERATIONAL REVIEW
GOVERNANCEWe aim to create the mostrelevant and beneficial impact for all stakeholders in everything that we do through a successful sustainable value creation model
Corporate governance / 30Management Board / 33Supervisory Board / 36Supervisory Board report / 40Remuneration report / 45Risk management and control / 58Investor relations / 63Management Board statements / 64
TOMTOM NV / ANNUAL REPORT 2021 / PAGE 29
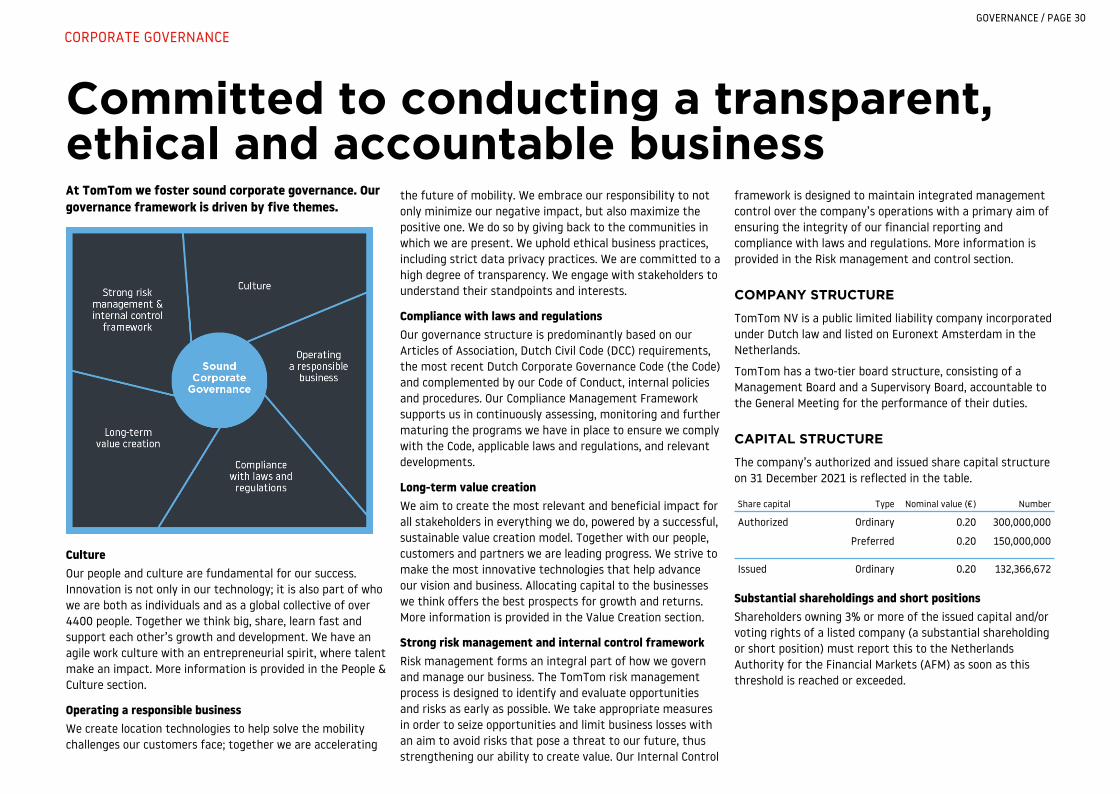
Committed to conducting a transparent, ethical and accountable businessAt TomTom we foster sound corporate governance. Our governance framework is driven by five themes.
CultureOur people and culture are fundamental for our success. Innovation is not only in our technology; it is also part of who we are both as individuals and as a global collective of over 4400 people. Together we think big, share, learn fast and support each other’s growth and development. We have an agile work culture with an entrepreneurial spirit, where talent make an impact. More information is provided in the People & Culture section.
Operating a responsible businessWe create location technologies to help solve the mobility challenges our customers face; together we are accelerating
the future of mobility. We embrace our responsibility to not only minimize our negative impact, but also maximize the positive one. We do so by giving back to the communities in which we are present. We uphold ethical business practices, including strict data privacy practices. We are committed to a high degree of transparency. We engage with stakeholders to understand their standpoints and interests.
Compliance with laws and regulationsOur governance structure is predominantly based on our Articles of Association, Dutch Civil Code (DCC) requirements, the most recent Dutch Corporate Governance Code (the Code) and complemented by our Code of Conduct, internal policies and procedures. Our Compliance Management Framework supports us in continuously assessing, monitoring and further maturing the programs we have in place to ensure we comply with the Code, applicable laws and regulations, and relevant developments.
Long-term value creationWe aim to create the most relevant and beneficial impact for all stakeholders in everything we do, powered by a successful, sustainable value creation model. Together with our people, customers and partners we are leading progress. We strive to make the most innovative technologies that help advance our vision and business. Allocating capital to the businesses we think offers the best prospects for growth and returns. More information is provided in the Value Creation section.
Strong risk management and internal control frameworkRisk management forms an integral part of how we govern and manage our business. The TomTom risk management process is designed to identify and evaluate opportunities and risks as early as possible. We take appropriate measures in order to seize opportunities and limit business losses with an aim to avoid risks that pose a threat to our future, thus strengthening our ability to create value. Our Internal Control
framework is designed to maintain integrated management control over the company’s operations with a primary aim of ensuring the integrity of our financial reporting and compliance with laws and regulations. More information is provided in the Risk management and control section.
COMPANY STRUCTURE
TomTom NV is a public limited liability company incorporated under Dutch law and listed on Euronext Amsterdam in the Netherlands.
TomTom has a two-tier board structure, consisting of a Management Board and a Supervisory Board, accountable to the General Meeting for the performance of their duties.
CAPITAL STRUCTURE
The company’s authorized and issued share capital structure on 31 December 2021 is reflected in the table.
Share capital Type Nominal value (€) Number
Authorized Ordinary 0.20 300,000,000
Preferred 0.20 150,000,000
Issued Ordinary 0.20 132,366,672
Substantial shareholdings and short positionsShareholders owning 3% or more of the issued capital and/or voting rights of a listed company (a substantial shareholding or short position) must report this to the Netherlands Authority for the Financial Markets (AFM) as soon as this threshold is reached or exceeded.
GOVERNANCE / PAGE 30
CORPORATE GOVERNANCE
The following shareholders (in)directly owning 3% or more of the company’s issued capital and/or voting rights were registered with the AFM as of 31 December 2021:
Name % issued capital/voting rights
Harold Goddijn – Founder 11.6 %
Corinne Vigreux – Founder 11.3 %
Peter Frans Pauwels – Founder 11.1 %
Pieter Geelen – Founder 10.7 %
J.H.H. De Mol between 5% and 10%
DNB Asset Management AS between 5% and 10%
GENERAL MEETING
The General Meeting is held at least once a year and takes place in Amsterdam, the Netherlands. The General Meeting is convened by public notice via our website.
Recurring agenda items are the the adoption of the financial statements, the discharge of the Management Board and Supervisory Board from responsibility for the performance of their respective duties for the previous financial year, and the remuneration of the Management Board and the Supervisory Board. When deemed necessary in the interests of the company, an Extraordinary General Meeting may be convened by resolution of the Management Board or the Supervisory Board.
The minutes and the resolutions of the General Meeting are recorded in writing. The minutes are available to the shareholders on our website no later than three months after the meeting.
Powers of the General MeetingThe General Meeting have the following rights and powers:
• adopt the financial statements;• approve amendments to the Articles of Association;• appoint, suspend or dismiss members of the Management
Board and the Supervisory Board;• discharge the Management Board and Supervisory Board
from responsibility for the performance of their respective duties for the previous financial year;
• advise on the remuneration report of the Management Board and the Supervisory Board;
• approve remuneration policy every 4 years and any amendments to the remuneration policy of the Management Board and the Supervisory Board;
• authorize the Management Board to repurchase or cancel outstanding shares;
• authorize the Management Board to issue, or to grant rights to subscribe for, shares in the capital of the company for general (up to 10%) and/or specific purposes (up to 10% of the issued share capital);
• authorize the Management Board to restrict or exclude the preemptive rights of existing shareholders on the issuance of, or right to subscribe for, shares in relation to authority granted, as mentioned above; and
• appoint the external auditor.
Voting rightsEach of our ordinary shares and preferred shares, which have not been issued, is entitled to one vote. The voting rights attached to any shares held by the company are suspended as long as they are held in treasury.
Resolutions of the General Meeting are adopted by an absolute majority of the votes cast, except where Dutch law or the company’s Articles of Association provide for a special majority.
The company’s Articles of Association stipulate the percentage of votes required to be cast to execute the powers of the General Meeting. These percentages are also in accordance with Dutch Law.
The following resolutions of the General Meeting require that a minimum of 50% of our issued share capital is represented at the meeting, and at least two-thirds of the votes cast by those represented at the meeting:
• cancel a binding nomination for the appointment of a member of the Management Board or the Supervisory Board;
• appoint a member of the Management Board or the Supervisory Board in contravention of the binding nomination by the Supervisory Board; or in case the
Supervisory Board did not make use of its rights to make a binding nomination; and
• dismiss or suspend a member of the Management Board or the Supervisory Board.
Irrespective of the share capital represented at the General Meeting the following resolutions require a majority of at least two-thirds of the issued share capital that are represented at the meeting:
• amend the Articles of Association; • restriction and exclusion of preemptive rights, or the
designation of the Management Board as the authorized body to exclude or restrict such rights;
• reduction of the issued share capital; and• a legal merger or legal de-merger of the company.
Issue of shares The Management Board is authorized by a resolution of the General Meeting to issue shares, or grant rights to subscribe for shares, subject to the approval of the Supervisory Board and limited to 10% of the issued share capital. No resolution of the General Meeting is required for the issuance of shares pursuant to this previously granted right.
The Management Board continues to believe it is in the company’s best interest to be in a position to react promptly when business opportunities arise that require the issuance of ordinary shares.
The Management Board wishes to be authorized to issue ordinary, or grant rights to subscribe for, shares should such an occasion arise, without the need to obtain prior approval from the shareholders at an Extraordinary General Meeting. Such meetings take time to convene and could generate disruptive market speculation.
GOVERNANCE / PAGE 31
CORPORATE GOVERNANCE CONTINUED
Repurchase by the company of its own shares
On 15 February 2021, TomTom announced the resumption of its share buyback program to repurchase ordinary TomTom shares on Euronext Amsterdam. The original program, partially executed in 2020, was to repurchase shares for an amount up to €50 million. The program was suspended on 31 March 2020, as a precautionary measure in light of the COVID-19 pandemic. Under this program, completed on 27 May 2021, a total of 6,687,092 ordinary TomTom shares were repurchased at an average price of €7.48 per share, for a total consideration of €50 million. TomTom will use the shares to cover its commitments arising from its long-term employee incentive plans.
On 31 December 2021, the remaining number of treasury shares outstanding was 5,417,122, equal to a capital interest of 4.1% of TomTom NV. Details of the share buyback transactions can be found on our corporate website.
Preferred sharesStichting Continuïteit TomTom (referred to as the Foundation) has been granted a call option entitling it to subscribe for preferred shares up to 100% of the aggregate nominal value of the outstanding ordinary shares at the time of issue, up to a maximum of the number of preferred shares included in the authorized capital at the time of issue. The Foundation shall subscribe for the preferred shares at par value. Immediately after subscribing for preferred shares, the Foundation shall proceed to pay one-quarter of the nominal value of the preferred shares at the time of issue.
Three-quarters of the nominal amount shall only need to be paid upon call by the company, without prejudice to the provisions of article 2:84 of the DCC. The Foundation is entitled to exercise the option right in one or more tranches. The possible issuance of preferred shares to the Foundation will be temporary and subject to the Articles of Association and the legislation on takeovers.
Unless the preferred shares have been issued pursuant to a resolution of the General Meeting, the Articles of Association require that a General Meeting be held within one year after the issue of preferred shares to consider their purchase or withdrawal. If no resolution on the purchase or withdrawal of the preferred shares is adopted at such a General Meeting, a
General Meeting will be held every year thereafter for as long as the preferred shares remain outstanding.
The Foundation was established in 2005, with a board independent of TomTom. The purpose of the Foundation is to safeguard the company’s interests and all of its stakeholders and to prevent situation or mitigate circumstances that may threaten its continuity or identity.
To date, no preferred shares have been issued.
2021 General MeetingsDuring 2021, two General Meetings were held. On 15 April 2021, the Annual General Meeting was held fully virtually in accordance with the emergency bill (Tijdelijke wet COVID-19 Justitie en Veiligheid), which entered into force on 24 April 2020. The key resolutions passed by the General Meeting were the reappointment of Harold Goddijn as a member of the Management Board and the reappointment of Jack de Kreij and Michael Rhodin as members of the Supervisory Board. The complete list of resolutions passed is available on our corporate website.
A physical Extraordinary General Meeting was held on 28 October 2021, for the purpose of appointing Karien van Gennip as new Supervisory Board member.
Tax principlesTomTom’s contribution to society includes the payment of taxes. The taxes we pay help fund public services provided by governmental institutions in the countries where we operate. Our approach to tax is formulated and published on our corporate governance website.
The following table provides an overview of our net payments of corporate income tax:
(€ in thousands) 2021 2020
Europe 6,171 6,136
North America 475 669
Rest of World 923 1,208
7,569 8,013
As shown in the table above, taxation is an integral part of our business and is paid in the regions where we operate.
For more informationCorporate Governance
TomTom Shareholder Meetings
GOVERNANCE / PAGE 32
CORPORATE GOVERNANCE CONTINUED

Management BoardThe Management Board is responsible for the day-to-day management of TomTom’s operations. Our Management Board consists of three members:
HAROLD GODDIJNCHIEF EXECUTIVE OFFICERNationality DutchYear of first appointment 2001Term of office 2021–2025Age 61
Current positionsMember of the Supervisory Board of Coolblue
Former positionsHarold began his career with a venture capital firm. In 1989, he founded and led Psion Netherlands BV, a joint venture with Psion PLC. He also served on the board of Psion PLC. In 1991, he co-founded TomTom together with Corinne Vigreux, Peter-Frans Pauwels and Pieter Geelen. Harold has been the CEO of TomTom since 2001.
EducationMaster’s degree in Economics, University of Amsterdam
TACO TITULAERCHIEF FINANCIAL OFFICERNationality DutchYear of first appointment 2015Term of office 2019–2023Age 50
Current positionsMember of the Executive Master of Finance and Control Advisory Board, University of Amsterdam
Former positionsTaco joined TomTom in 2005, holding various senior management positions in Group Control, Treasury and Investor Relations before his appointment as CFO in 2015. Prior to TomTom, Taco spent eight years with KPN, holding senior management roles in Finance and Investor Relations.
EducationMaster’s degree in Business Economics, University of Groningen
ALAIN DE TAEYEMEMBER OF THE MANAGEMENT BOARDNationality BelgianYear of first appointment 2008Term of office 2020–2024Age 64
Current positionsNon-Executive Director of Cyient Ltd
Former positionsAlain founded Informatics and Management Consultants (I&M), where, next to IT Consultancy, he continued his research work on digital map databases and routing. In 1989, I&M was integrated into the Dutch Tele Atlas Group. From 1990, Alain headed Tele Atlas, which was acquired by TomTom in 2008. The same year, Alain became a member of TomTom’s Management Board.
EducationGraduated as engineer-architect, University of Ghent
GOVERNANCE / PAGE 33
MANAGEMENT BOARD
Composition and appointmentAccording to our Articles of Association, the Management Board must consist of at least two members, and is jointly (two members acting jointly) authorized to represent the company. Each member is appointed for a maximum period of four years, with the possibility of re-appointment for consecutive four-year terms in accordance with the Code.
No member holds more than two supervisory positions at Dutch ‘large companies’ in accordance with article 2:132a of the DCC.
The General Meeting appoints the members of the Management Board, subject to the right of the Supervisory Board, to make a binding nomination as described under the powers of the General Meeting.
DiversityThe Management Board’s composition is based on diversity of experience, background, skills, knowledge and insights. Currently, TomTom has no women in the Management Board, even though the Supervisory Board has set goals for diversity and inclusion to have at least on woman in the Management Board. We believe in the strength of diversity and will, when a vacancy in the Management Board arises, consider all diversity aspects, including gender.
As our workforce is increasingly composed of highly technical and engineering roles, we acknowledge the complexities involved in reaching gender equality targets. Nevertheless, as part of our wider ambition to take important steps forward for representation, we have set ourselves specific targets to increase gender equality in senior management. More information on diversity and inclusion can found in our Diversity and Inclusion Policy, the Environmental, Social and Governance section and on the TomTom website.
Responsibilities The Management Board is responsible for the day-to-day management of TomTom’s operations and is guided by the company’s interests and considers the interests of all stakeholders.
Management Board’s responsibilities involve, among others:
• create long-term value by establishing and achieving strategic objectives;• manage an adequate risk management and internal control framework; and • manage legal compliance and sustainability matters. The Management Board consults with the Supervisory Board on important matters and submits important decisions to the Supervisory Board for its preapproval, as further described in the company’s Articles of Association, which are available on our corporate governance website page.
The Management Board is accountable for its actions to the Supervisory Board and the General Meeting.
Risk management and internal control frameworkWe have a risk management and internal control framework in place. Our risk management is designed to identify and evaluate opportunities and risks as early as possible and to take appropriate measures in order to seize opportunities and limit business losses. The strategic risks and opportunities are monitored continuously over the year by our Portfolio Management department.
The operational, financial and legal and compliance risks are monitored by our corporate risk management function, which also has regular meetings with the Portfolio Management to ensure complete reporting on the overall risk profile of TomTom. The group risk profile is taken into account when establishing our strategy, annual business plans and budgets. The internal controls are contained and maintained in the Internal Control Framework.
The Audit Committee assists the Supervisory Board in its responsibility to oversee the system of internal control and risk management, including the effectiveness of the internal auditors. For more information reference is made to the Audit Committee activities included in the Supervisory Board Report.
A full overview of the risk management and the internal control framework is included in the Risk management and control section.
GOVERNANCE / PAGE 34
MANAGEMENT BOARD CONTINUED

Committees
The Management Board is supported by committees in their day-to-day management responsibility.
Committees Composition Responsibilities
Senior Leadership Team1
Chief Technical Officer, Chief Product Officer, Managing Directors (Automotive, Enterprise, Consumer), Chief Architect, Chief Marketing Officer and Chief HR Officer
Supports the Management Board members with expertise and advice in executing the company's strategy and business priorities.
Technology, Risk & Compliance Forum
Chief Technical Officer, Chief Product Officer, Chief Architect, and representatives from Business Units, Security & Safety, Engineering Departments and Shared Services
i) Establishing and maintaining an adequate security management system aligned with the company's priorities and with the Management Board and Senior Leadership Team's decisions on strategy priorities and risks.
ii) reporting on business-critical compliance matters
Disclosure Committee
Representatives of Automotive, Enterprise, Legal, Group Control, Investor Relations and Corporate Communications
(i) Ensure compliance with the disclosure requirements under applicable laws and regulations;
(ii) assist and inform the Management Board on the maintenance and evaluation of disclosure controls and procedures; and
(iii) gather all relevant financial and non-financial information and assess materiality, timelines and necessity for disclosure of such information.
1 Not deemed to be an Executive Committee, as referred to in best practice provision 2.1.3 of the Code.
Conflicts of interest
Members of the Management Board must report any (potential) conflict of interest to the Chairman of the Supervisory Board. The Supervisory Board shall decide whether a conflict of interest exists.
The member of the Management Board who has a (potential) conflict of interest shall not participate in discussions and decision-making on a subject or transaction in relation to which the member has a conflict of interest with the company. Decisions to enter into transactions under which members of the Management Board have conflicts of interest that are of material significance to the company and/or to the relevant member(s) of the Management Board, require the approval of the Supervisory Board. No such transactions have been concluded in 2021.
In addition, in accordance with provision 2.7.5 of the Code, we report that no transactions occurred in 2021 between the company and legal or natural persons who hold at least 10% of the shares in the company.
RemunerationThe Supervisory Board determines each Management Board member’s remuneration in line with the Remuneration Policy. The Remuneration Policy is subject to a binding vote of the General Meeting once every four years. This vote occurred for the first time in 2020.
The application of the Remuneration Policy over 2021 is described in the Remuneration Report and is subject to an advisory vote of the General Meeting in 2022.
The remuneration of individual members of the Management Board can be found in the Remuneration Report. The Remuneration Policy can be found on the TomTom website.
GOVERNANCE / PAGE 35
MANAGEMENT BOARD CONTINUED
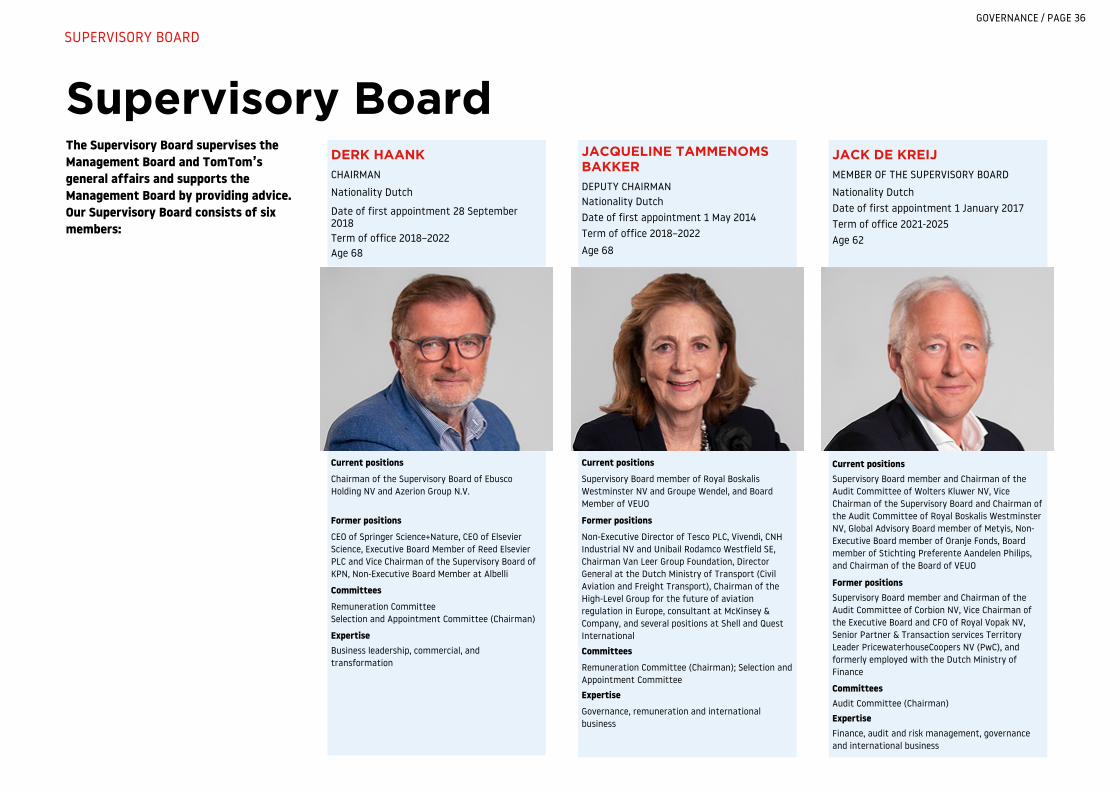
Supervisory BoardThe Supervisory Board supervises the Management Board and TomTom’s general affairs and supports the Management Board by providing advice. Our Supervisory Board consists of six members:
DERK HAANKCHAIRMAN
Nationality Dutch
Date of first appointment 28 September 2018Term of office 2018–2022Age 68
Current positionsChairman of the Supervisory Board of Ebusco Holding NV and Azerion Group N.V.
Former positionsCEO of Springer Science+Nature, CEO of Elsevier Science, Executive Board Member of Reed Elsevier PLC and Vice Chairman of the Supervisory Board of KPN, Non-Executive Board Member at Albelli
CommitteesRemuneration CommitteeSelection and Appointment Committee (Chairman)
ExpertiseBusiness leadership, commercial, and transformation
JACQUELINE TAMMENOMS BAKKERDEPUTY CHAIRMANNationality DutchDate of first appointment 1 May 2014Term of office 2018–2022Age 68
Current positionsSupervisory Board member of Royal Boskalis Westminster NV and Groupe Wendel, and Board Member of VEUO
Former positionsNon-Executive Director of Tesco PLC, Vivendi, CNH Industrial NV and Unibail Rodamco Westfield SE, Chairman Van Leer Group Foundation, Director General at the Dutch Ministry of Transport (Civil Aviation and Freight Transport), Chairman of the High-Level Group for the future of aviation regulation in Europe, consultant at McKinsey & Company, and several positions at Shell and Quest International
CommitteesRemuneration Committee (Chairman); Selection and Appointment Committee
ExpertiseGovernance, remuneration and international business
JACK DE KREIJMEMBER OF THE SUPERVISORY BOARD
Nationality DutchDate of first appointment 1 January 2017Term of office 2021-2025Age 62
Current positionsSupervisory Board member and Chairman of the Audit Committee of Wolters Kluwer NV, Vice Chairman of the Supervisory Board and Chairman of the Audit Committee of Royal Boskalis Westminster NV, Global Advisory Board member of Metyis, Non-Executive Board member of Oranje Fonds, Board member of Stichting Preferente Aandelen Philips, and Chairman of the Board of VEUO
Former positionsSupervisory Board member and Chairman of the Audit Committee of Corbion NV, Vice Chairman of the Executive Board and CFO of Royal Vopak NV, Senior Partner & Transaction services Territory Leader PricewaterhouseCoopers NV (PwC), and formerly employed with the Dutch Ministry of Finance
CommitteesAudit Committee (Chairman)
ExpertiseFinance, audit and risk management, governance and international business
GOVERNANCE / PAGE 36
SUPERVISORY BOARD
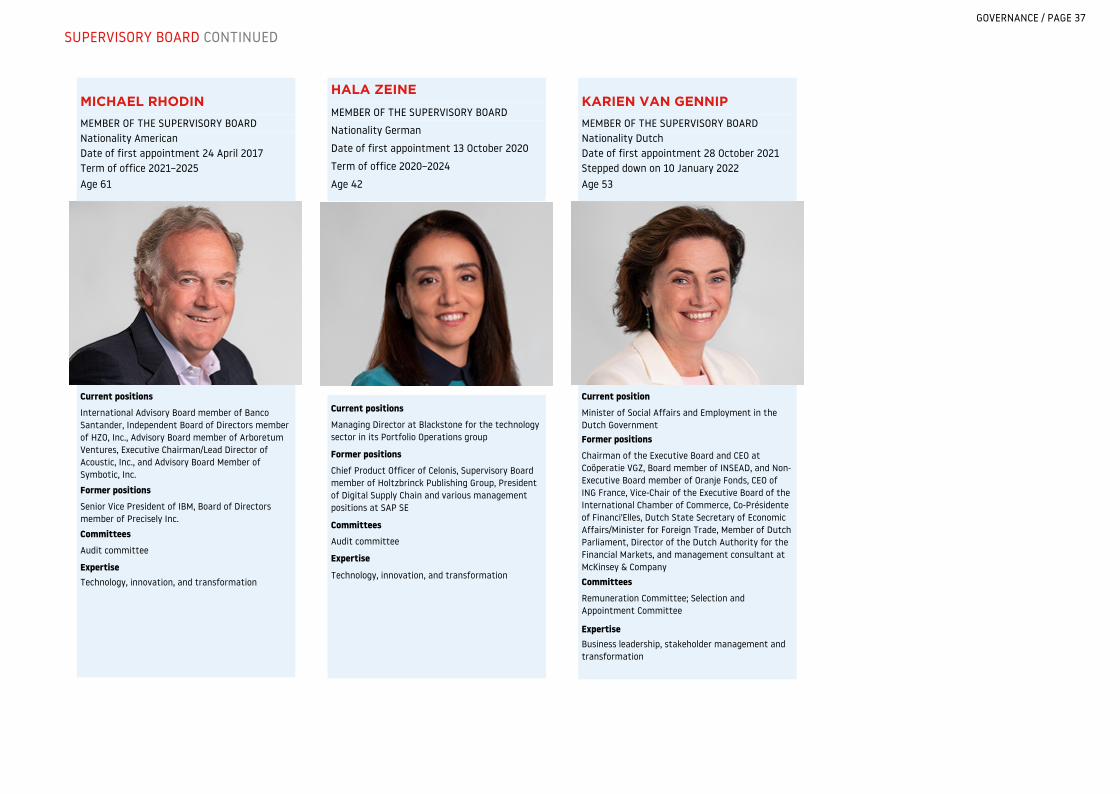
MICHAEL RHODINMEMBER OF THE SUPERVISORY BOARDNationality AmericanDate of first appointment 24 April 2017Term of office 2021–2025Age 61
Current positionsInternational Advisory Board member of Banco Santander, Independent Board of Directors member of HZO, Inc., Advisory Board member of Arboretum Ventures, Executive Chairman/Lead Director of Acoustic, Inc., and Advisory Board Member of Symbotic, Inc.
Former positionsSenior Vice President of IBM, Board of Directors member of Precisely Inc.
CommitteesAudit committee
ExpertiseTechnology, innovation, and transformation
HALA ZEINE
MEMBER OF THE SUPERVISORY BOARD
Nationality German
Date of first appointment 13 October 2020
Term of office 2020–2024
Age 42
Current positionsManaging Director at Blackstone for the technology sector in its Portfolio Operations group
Former positionsChief Product Officer of Celonis, Supervisory Board member of Holtzbrinck Publishing Group, President of Digital Supply Chain and various management positions at SAP SE
CommitteesAudit committee
Expertise
Technology, innovation, and transformation
KARIEN VAN GENNIPMEMBER OF THE SUPERVISORY BOARDNationality DutchDate of first appointment 28 October 2021Stepped down on 10 January 2022Age 53
Current positionMinister of Social Affairs and Employment in the Dutch GovernmentFormer positionsChairman of the Executive Board and CEO at Coöperatie VGZ, Board member of INSEAD, and Non-Executive Board member of Oranje Fonds, CEO of ING France, Vice-Chair of the Executive Board of the International Chamber of Commerce, Co-Présidente of Financi'Elles, Dutch State Secretary of Economic Affairs/Minister for Foreign Trade, Member of Dutch Parliament, Director of the Dutch Authority for the Financial Markets, and management consultant at McKinsey & Company
CommitteesRemuneration Committee; Selection and Appointment Committee
ExpertiseBusiness leadership, stakeholder management and transformation
GOVERNANCE / PAGE 37
SUPERVISORY BOARD CONTINUED
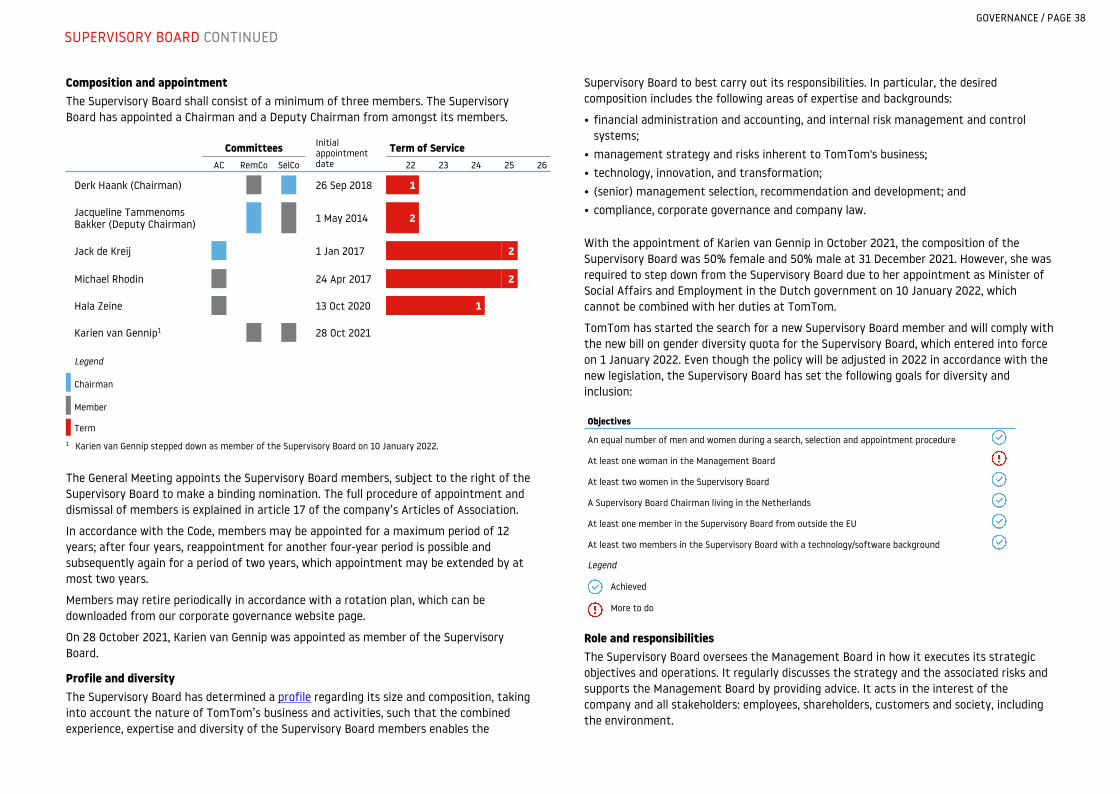
Composition and appointmentThe Supervisory Board shall consist of a minimum of three members. The Supervisory Board has appointed a Chairman and a Deputy Chairman from amongst its members.
Committees Initial appointment date
Term of ServiceAC RemCo SelCo 22 23 24 25 26
Derk Haank (Chairman) 26 Sep 2018 1
Jacqueline Tammenoms Bakker (Deputy Chairman) 1 May 2014 2
Jack de Kreij 1 Jan 2017 2
Michael Rhodin 24 Apr 2017 2
Hala Zeine 13 Oct 2020 1
Karien van Gennip1 28 Oct 2021
Legend
Chairman
Member
Term1 Karien van Gennip stepped down as member of the Supervisory Board on 10 January 2022.
The General Meeting appoints the Supervisory Board members, subject to the right of the Supervisory Board to make a binding nomination. The full procedure of appointment and dismissal of members is explained in article 17 of the company’s Articles of Association.
In accordance with the Code, members may be appointed for a maximum period of 12 years; after four years, reappointment for another four-year period is possible and subsequently again for a period of two years, which appointment may be extended by at most two years.
Members may retire periodically in accordance with a rotation plan, which can be downloaded from our corporate governance website page.
On 28 October 2021, Karien van Gennip was appointed as member of the Supervisory Board.
Profile and diversityThe Supervisory Board has determined a profile regarding its size and composition, taking into account the nature of TomTom’s business and activities, such that the combined experience, expertise and diversity of the Supervisory Board members enables the
Supervisory Board to best carry out its responsibilities. In particular, the desired composition includes the following areas of expertise and backgrounds:
• financial administration and accounting, and internal risk management and control systems;
• management strategy and risks inherent to TomTom's business; • technology, innovation, and transformation; • (senior) management selection, recommendation and development; and • compliance, corporate governance and company law.
With the appointment of Karien van Gennip in October 2021, the composition of the Supervisory Board was 50% female and 50% male at 31 December 2021. However, she was required to step down from the Supervisory Board due to her appointment as Minister of Social Affairs and Employment in the Dutch government on 10 January 2022, which cannot be combined with her duties at TomTom.
TomTom has started the search for a new Supervisory Board member and will comply with the new bill on gender diversity quota for the Supervisory Board, which entered into force on 1 January 2022. Even though the policy will be adjusted in 2022 in accordance with the new legislation, the Supervisory Board has set the following goals for diversity and inclusion:
Objectives
An equal number of men and women during a search, selection and appointment procedure
At least one woman in the Management Board
At least two women in the Supervisory Board
A Supervisory Board Chairman living in the Netherlands
At least one member in the Supervisory Board from outside the EU
At least two members in the Supervisory Board with a technology/software background
Legend
Achieved
More to do
Role and responsibilitiesThe Supervisory Board oversees the Management Board in how it executes its strategic objectives and operations. It regularly discusses the strategy and the associated risks and supports the Management Board by providing advice. It acts in the interest of the company and all stakeholders: employees, shareholders, customers and society, including the environment.
GOVERNANCE / PAGE 38
SUPERVISORY BOARD CONTINUED
According to our Articles of Association certain decisions of the Management Board are subject to the approval of the Supervisory Board. This includes resolutions of the Management Board to issue, or grant rights to acquire, shares or restrict or exclude pre-emptive rights. Reference in this respect to article 14 of our Articles of Association.
A description of the activities of the Supervisory Board in 2021 is given in the Supervisory Board Report section.
CommitteesIn line with the Code, the Supervisory Board has established an Audit Committee, a Remuneration Committee and a Selection and Appointment Committee. Each of these committees is staffed by members of the Supervisory Board and at least one of the members of the Audit Committee is an expert in financial reporting or auditing financial statements according to the criteria of the Decree Establishing Audit Committee.
A description of the activities performed by each of the committees during 2021 is given in the Supervisory Board Report.
Audit committeeThe Audit Committee (AC) undertakes preparatory work for the Supervisory Board’s decision-making regarding the supervision of the integrity and quality of the company’s financial reporting and the effectiveness of the company’s internal risk management and control systems. The AC monitors the performance and observations of the external auditor and the effectiveness of the external audit process, as well as its independence.
For its composition and the way in which the AC discharges its duties, reference is made to the AC Charter.
Selection and Appointment committeeThe Selection and Appointment Committee (SelCo) is responsible for the size and composition of the Supervisory Board, its succession planning and the functioning of its members. It also pays strong attention to the company’s talent management and succession planning for key positions.
For its composition and the way in which the SelCo discharges its duties, reference is made to the SelCo Rules.
Remuneration committeeThe Remuneration committee (RemCo) prepares the Supervisory Board’s decision-making regarding the remuneration of the individual Management Board members and the remuneration of the Supervisory Board. The RemCo oversees the effectiveness, relevance and implementation of the Remuneration Policy.
For its composition and the way in which the RemCo discharges its duties, reference is made to the RemCo Rules.
Conflicts of interestMembers of the Supervisory Board (excluding the Chairman) must report any (potential) conflict of interest to the Chairman of the Supervisory Board. If the (potential) conflict of interest involves the Chairman of the Supervisory Board, it must be reported to the Deputy Chairman of the Supervisory Board. The Supervisory Board shall decide whether a conflict of interest exists.
The member who has a (potential) conflict of interest shall not participate in discussions and decision-making on a subject or transaction in relation to which the member has a conflict of interest with the company. Decisions to enter into transactions under which members of the Supervisory Board have conflicts of interest that are of material significance to the company and/or to the relevant member(s) of the Supervisory Board, require the approval of the Supervisory Board. No such transactions have been concluded in 2021.
RemunerationThe General Meeting determines the remuneration of the members of the Supervisory Board including the members of its committees. The Supervisory Board Remuneration Policy is subject to a binding vote of the General Meeting once every four years. This vote occurred for the first time in 2020.
The application of the Remuneration Policy over 2021 is described in the Remuneration Report (also available on our corporate website) which report is subject to an advisory vote of the General Meeting in 2022.
The remuneration of individual members of the Supervisory Board can be found in the Remuneration Report. The Remuneration Policy can be found on the corporate website.
For more informationCorporate governance-related documents are available on our website, including, amongst others:
• Articles of Association• Management Board Remuneration Policy • Supervisory Board Remuneration Policy• Supervisory Board Rotation Plan• Code of Conduct• Open Ears Procedure• Diversity and Inclusion Policy • Policy on bilateral and other contacts with shareholders• Inside Information Policy
GOVERNANCE / PAGE 39
SUPERVISORY BOARD CONTINUED

Reaching the best standards of good corporate governance
"TomTom is a leading independent specialist in location technology. With its innovative product portfolio and supporting technologies, TomTom plays a key role in a highly competitive market where rapid technological developments are the only constant. In this dynamic environment, as a Supervisory Board, we see as our most important task ensuring that TomTom continues following and implementing a strategy that positions the company for future growth. In doing so, the Supervisory Board will ensure that a sustainable business model is used that aims to create value for all stakeholders involved."
DERK HAANKChairman of the Supervisory Board
2021 has been a challenging year for TomTom. Automotive's recovery has fallen short of expectations, as semiconductor supply chain issues across the sector are also hampering car production volumes. As a result, revenue estimates have been revised down during the year. Encouragingly, the way TomTom deals with its customers is evolving from a traditional supplier relationship to a partnership approach. Direct customer feedback on location data and product requirements open new opportunities.
We wholeheartedly support the Management Board with executing its strategy. By further automating and investing in new technologies and joining forces with partners, TomTom will bring further product innovation to its customers.
We commended management for the way it managed the company during a new pandemic year. The meticulous attention to safety and welfare of the employees, while no material loss of productivity was incurred, is creditable. The
management's continuous pursuit of product innovation, automation, switching to online and performance management is testimony to resilience and high quality.
TomTom’s agile and entrepreneurial work culture, where talents learn fast, have impact, and support each others' growth and development, is highly valued among employees and by its customers. This remains important especially now the talent market has changed significantly. The pandemic led people to rethink the way they approach work, why they work and where they work. It is also up to the Supervisory Board to make sure TomTom's great culture continues to be nurtured.
We thank TomTom's shareholders for their confidence in the company and its management and express our appreciation to all employees and the Management Board for their continued dedication and commitment to the company.
On behalf of the Supervisory Board
DERK HAANKChairman of the Supervisory Board
GOVERNANCE / PAGE 40
SUPERVISORY BOARD REPORT

SUPERVISORY BOARD MEMBERS
TomTom’s Supervisory Board consists of six members. A member is appointed for a period of four years and may then be reappointed once for another four-year period. Subsequently, a member may be reappointed again for a period of two years, which appointment may be extended by, at most, two years.
Biographies of the members of the Supervisory Board, as well as the information on the members as prescribed by the Corporate Governance Code (Code) can be found in the Supervisory Board section, which also provides details of the Supervisory Board’s committees and its members. All current members are independent within the meaning of best practice provisions 2.1.7 through 2.1.9 of the Code.
MEETINGS AND ATTENDANCE
Half of the formal Supervisory Board meetings took place physically and half virtually due to restrictions of the COVID-19 pandemic. The Supervisory Board also met regularly through conference calls to discuss financial updates and recent developments within the company. Once per quarter the Supervisory Board had its regular meeting to review the quarter in detail and to be provided with an operational update by the Management Board. The Management Board members attended all those meetings. The Supervisory Board members accomplished a 100% attendance rate.
SB formal meetings1
SB update calls AC RemCo SelCo
Derk Haank 6/6 5/6 6/6 4/4
Jacqueline Tammenoms Bakker 6/6 6/6 6/6 4/4
Jack de Kreij 6/6 5/6 4/4
Michael Rhodin 6/6 6/6 4/4
Hala Zeine 6/6 5/6 4/4
Karien van Gennip2 2/21 3 physical meetings and 3 virtual meetings. 2 First appointed on 28 October 2021
All members had sufficient time available for their duties relating to their membership of the Supervisory Board as demonstrated by their availability for ad hoc calls, prompt
responses to emails, good meeting preparation and active participation in meeting discussions.
Meeting agendas were prepared through consultation with the Chairman, the Management Board and the Company Secretary. In addition to regular meetings, the Supervisory Board Chairman had regular contact with TomTom’s CEO. Further and outside the regular meeting frequency, Supervisory Board members held informal consultations with members of the Management Board and senior management to remain closely informed about the business.
Supervisory Board meetings are preceded by committee meetings. The committees’ chairs work closely together with senior management and conduct regular meetings to set agendas and prepare relevant information for the committee meetings.
STRATEGIC OVERSIGHT
The Supervisory Board devoted considerable time to reviewing TomTom’s strategy and progress in the execution thereof. Regular discussions were held with the Management Board on the strategic priorities of the Location Technology business. During these sessions, the Supervisory Board ensured that the Management Board’s ideas were challenged and tested in order to reach decisions that would underpin the company’s strategy.
The Supervisory Board paid special attention to the impact of the global supply chain issues, especially in the international semiconductor markets, on the company’s people, operations, financial performance and strategy.
Ample time was spent reviewing the constantly changing technology landscape within which TomTom operates as well as the impact thereof on the company’s strategy, including the framework for cyber security . Each quarter, updates were provided to the Supervisory Board on market trends and the impact thereof on the company’s strategic priorities. The Supervisory Board also discussed and assessed TomTom's position in the competitive landscape. The Supervisory Board engaged an external expert in the automotive industry to obtain an outside-in perspective of industry trends and developments.
The Audit Committee kept the Supervisory Board informed of the company’s strategic, financial, legal and compliance, and operational risks, as well as the actions taken, and internal control and management systems in place, to manage these risks.
Business review and financial oversightThe Management Board regularly updated the Supervisory Board on commercial opportunities, deals, and partnerships. Every quarter, reports were provided by senior management that outlined the developments, achievements, challenges and opportunities in each market segment, HR and our technology department.
The Supervisory Board was frequently updated on the progress made within our mapmaking and technologies, and the positioning and traction of these technology components in the marketplace. The implementation of a Product Management organization was also a topic on which the Supervisory Board was frequently updated.
The company’s financial results and its cash generation were presented and closely supervised throughout the year. The semiconductor supply chain issues across the sector and the impact hereof on the company's revenue were closely monitored. The level of investment in the company's core technologies were thoroughly assessed every quarter. The Supervisory Board reviewed and approved the budget for 2022.
Every quarter, the Supervisory Board was updated on the company’s Investor Relations activities, such as share price developments, analysts’ research and communication with shareholders. The quarterly updates and the press releases regarding the full- and half-year results were all reviewed and approved by the Supervisory Board.
GOVERNANCE / PAGE 41
SUPERVISORY BOARD REPORT CONTINUED
Culture and engagementThe Supervisory Board continued to meet talent from within the company, staying in touch with the TomTom culture, dynamics and operational challenges. For this purpose, among other things, quarterly sessions were organized to facilitate a ‘Meet and Greet’ between the members of the SelCo and selected talent. In an open and transparent setting, they held a group dialogue on relevant matters.
The Supervisory Board and the Dutch Works Council held two meetings.
The Supervisory Board was regularly updated on the company’s governance and organizational structure.
Succession planningThe Supervisory Board discussed its rotation schedule and succession planning. Considering the expiration of the second term of Jacqueline Tammenoms Bakker at the AGM 2022 and to secure a proper succession planning, the Supervisory Board decided on the temporary need for a sixth Supervisory Board member based on the desired profile for the Supervisory Board. With the appointment of Karien van Gennip on 28 October 2021, the current composition was deemed to suffice the company’s future needs. Karien van Gennip was required to step down from the Supervisory Board due to her appointment as Minister of Social Affairs and Employment in the Dutch government on 10 January 2022. More information can be found in the Supervisory Board section.
Corporate responsibility An update was provided on the company’s progress on its Corporate Responsibility program, including the efforts to meeting its commitments as reflected in the Diversity and Inclusion goals. More information can be found in the Environmental, Social and Governance section.
REMUNERATION
The remuneration of the members of the Supervisory Board and the additional remuneration of the Chairman and the members of its committees is determined by the General Meeting, last amended in 2020. For more information, see the Remuneration Report.
EVALUATION
In principle, the Supervisory Board engages with a third party to assess its functioning every three years, the next time in 2022.
The Supervisory Board and its committees reviewed and discussed its own function, the functioning of its individual members, committees and the functioning of the Management Board and its members, without the Management Board being present. All members of the Supervisory Board and Management Board completed a evaluation questionnaire followed up by an individual interview with the Chairman of the Supervisory Board.
The outcome was discussed among the Supervisory Board members in an evaluation session. It was concluded that the Supervisory Board performs well and is run efficiently. The re-introduction of (informal) physical meetings in the second half of the year were appreciated. The board dynamics are healthy; there is an open speak-up culture and great willingness to collaborate and share information. The Supervisory Board appreciated the time spent on further increasing its knowledge and understanding of (technology) developments relevant to TomTom and its industry, and will continue to do this.
The Management Board evaluates its own functioning annually. The Chairman of the Supervisory Board was informed about the outcome hereof by the CEO.
AUDIT COMMITTEE
Meetings and attendanceThe AC met each quarter throughout 2021, these four meetings were held prior to the publication of the quarterly financial results. The meetings had an overall attendance rate of 100%. All meetings were attended in full by the CFO and the Head of Corporate Accounting and Internal Audit. Next to the regular AC meetings, the AC had several clarification calls on specific topics.
The other members of the Management Board attended the meetings as required (for instance, where group risks and internal controls were discussed).
The external auditor attended each of the quarterly AC meetings in full to report on its audit plan, quarterly procedures, management letter and the long form auditor's report. The AC and the external auditor also met separately, without the Management Board present, in order to facilitate free and open discussions on other relevant topics such as quality of risk assessments and the collaboration with the Management Board and the organization.
Other heads of departments (e.g. Treasury, Tax, Investor Relations, Group Control, Business Finance, Legal and Compliance, Privacy and Security, Financial Shared Service Center and IT) were invited when the AC deemed it necessary and appropriate.
Financial oversightThe AC assisted the Supervisory Board in its responsibility to oversee the system of internal control and risk management, the effectiveness of the internal auditors, the company’s financing, financial statements and financial reporting process. In relation to the external auditor, the AC monitored its performance and the effectiveness of the external audit process, as well as its independence.
A core task of the AC was to extensively review the financial reports before consideration by the full Supervisory Board. Throughout the year, the AC monitored and reviewed the quarterly financial results and full-year financial statements as presented under IFRS (as adopted by the EU and in accordance with Part 9 of Book 2 of the Dutch Civil Code), including the respective disclosures prior to their release. Guidance to the financial markets was also discussed. Special attention was paid to revenue recognition including the deferred revenue position as well as unbilled receivables, the impairment review of goodwill and other intangibles, and the operational and financial implications of the semiconductor supply chain issues and COVID-19.
The AC also discussed topics related to cybersecurity (and the ISO27001 certification), TomTom’s third-party cloud platforms, new financial system implementations, legal and regulatory compliance and whistleblowing reports.
Other areas of attention were significant estimates, the global tax position and the status of legal claims and proceedings.
GOVERNANCE / PAGE 42
SUPERVISORY BOARD REPORT CONTINUED
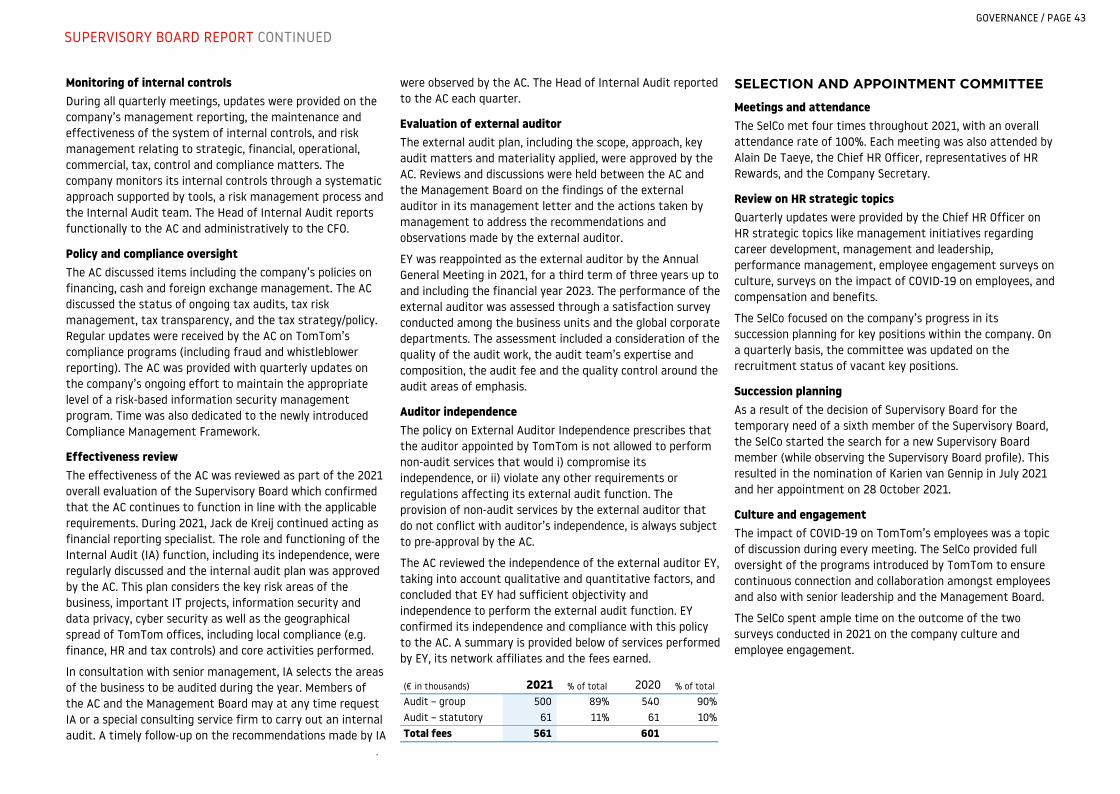
Monitoring of internal controlsDuring all quarterly meetings, updates were provided on the company’s management reporting, the maintenance and effectiveness of the system of internal controls, and risk management relating to strategic, financial, operational, commercial, tax, control and compliance matters. The company monitors its internal controls through a systematic approach supported by tools, a risk management process and the Internal Audit team. The Head of Internal Audit reports functionally to the AC and administratively to the CFO.
Policy and compliance oversightThe AC discussed items including the company’s policies on financing, cash and foreign exchange management. The AC discussed the status of ongoing tax audits, tax risk management, tax transparency, and the tax strategy/policy. Regular updates were received by the AC on TomTom’s compliance programs (including fraud and whistleblower reporting). The AC was provided with quarterly updates on the company’s ongoing effort to maintain the appropriate level of a risk-based information security management program. Time was also dedicated to the newly introduced Compliance Management Framework.
Effectiveness reviewThe effectiveness of the AC was reviewed as part of the 2021 overall evaluation of the Supervisory Board which confirmed that the AC continues to function in line with the applicable requirements. During 2021, Jack de Kreij continued acting as financial reporting specialist. The role and functioning of the Internal Audit (IA) function, including its independence, were regularly discussed and the internal audit plan was approved by the AC. This plan considers the key risk areas of the business, important IT projects, information security and data privacy, cyber security as well as the geographical spread of TomTom offices, including local compliance (e.g. finance, HR and tax controls) and core activities performed.
In consultation with senior management, IA selects the areas of the business to be audited during the year. Members of the AC and the Management Board may at any time request IA or a special consulting service firm to carry out an internal audit. A timely follow-up on the recommendations made by IA
were observed by the AC. The Head of Internal Audit reported to the AC each quarter.
Evaluation of external auditorThe external audit plan, including the scope, approach, key audit matters and materiality applied, were approved by the AC. Reviews and discussions were held between the AC and the Management Board on the findings of the external auditor in its management letter and the actions taken by management to address the recommendations and observations made by the external auditor.
EY was reappointed as the external auditor by the Annual General Meeting in 2021, for a third term of three years up to and including the financial year 2023. The performance of the external auditor was assessed through a satisfaction survey conducted among the business units and the global corporate departments. The assessment included a consideration of the quality of the audit work, the audit team’s expertise and composition, the audit fee and the quality control around the audit areas of emphasis.
Auditor independenceThe policy on External Auditor Independence prescribes that the auditor appointed by TomTom is not allowed to perform non-audit services that would i) compromise its independence, or ii) violate any other requirements or regulations affecting its external audit function. The provision of non-audit services by the external auditor that do not conflict with auditor’s independence, is always subject to pre-approval by the AC.
The AC reviewed the independence of the external auditor EY, taking into account qualitative and quantitative factors, and concluded that EY had sufficient objectivity and independence to perform the external audit function. EY confirmed its independence and compliance with this policy to the AC. A summary is provided below of services performed by EY, its network affiliates and the fees earned.
(€ in thousands) 2021 % of total 2020 % of total
Audit – group 500 89 % 540 90 %Audit – statutory 61 11 % 61 10 %Total fees 561 601
.
SELECTION AND APPOINTMENT COMMITTEE
Meetings and attendanceThe SelCo met four times throughout 2021, with an overall attendance rate of 100%. Each meeting was also attended by Alain De Taeye, the Chief HR Officer, representatives of HR Rewards, and the Company Secretary.
Review on HR strategic topicsQuarterly updates were provided by the Chief HR Officer on HR strategic topics like management initiatives regarding career development, management and leadership, performance management, employee engagement surveys on culture, surveys on the impact of COVID-19 on employees, and compensation and benefits.
The SelCo focused on the company’s progress in its succession planning for key positions within the company. On a quarterly basis, the committee was updated on the recruitment status of vacant key positions.
Succession planningAs a result of the decision of Supervisory Board for the temporary need of a sixth member of the Supervisory Board, the SelCo started the search for a new Supervisory Board member (while observing the Supervisory Board profile). This resulted in the nomination of Karien van Gennip in July 2021 and her appointment on 28 October 2021.
Culture and engagement The impact of COVID-19 on TomTom’s employees was a topic of discussion during every meeting. The SelCo provided full oversight of the programs introduced by TomTom to ensure continuous connection and collaboration amongst employees and also with senior leadership and the Management Board.
The SelCo spent ample time on the outcome of the two surveys conducted in 2021 on the company culture and employee engagement.
GOVERNANCE / PAGE 43
SUPERVISORY BOARD REPORT CONTINUED

REMUNERATION COMMITTEE
Meetings and attendanceThe RemCo met six times in the course of 2021, with an overall attendance rate of 100%. Each meeting was also attended by Alain De Taeye, representatives of HR Rewards, the Chief HR Officer and the Company Secretary.
Scenario analysis and pay ratio A scenario analysis was carried out to evaluate the variable components of the remuneration packages of the Management Board members. The RemCo reviewed the pay ratio.
Variable RemunerationAt the beginning of 2021, the RemCo proposed, and the Supervisory Board agreed, metrics for Location Technology revenue and free cash flow (weighted equally at 50% each) to determine the 2021 short-term incentive (STI) for the Management Board. The RemCo regularly reviewed the Management Board members’ progress against those metrics. The RemCo also proposed the allocation of RSUs in April 2021, which subsequently were approved by the Supervisory Board. The deliberations underlying the decisions made regarding the STI and the LTI are described in the Remuneration Report.
Stakeholder engagement At the Annual General Meeting a positive advisory vote was cast for the 2020 Remuneration Report and the Remuneration Policy for the Management Board and the Supervisory Board were approved. The RemCo evaluated and considered the feedback received from stakeholders during the Annual General Meeting and defined actions. It continued to have an open dialogue with Eumedion, VEB and ISS in 2021. The response to this feedback is included in the Remuneration Report.
2021 Remuneration ReportFor a full outline of the Remuneration Policy, its application in 2021 and outlook for 2022, reference is made to the 2021 Remuneration Report.
The Remuneration Report forms an integral part of the Supervisory Board report and is prepared in accordance with
the requirements as laid down in the Dutch Civil Code and best practice provision 3.4.1 of the Code. The Supervisory Board has approved the Remuneration Report.
FINANCIAL STATEMENTS FOR 2021
TomTom’s annual financial statements for 2021, prepared by the Management Board, have been audited by EY. The financial statements, independent auditor’s report and management letter of the external auditor were discussed extensively with the auditors by the Audit Committee in the presence of the Management Board, and by the full Supervisory Board with the Management Board.
The Supervisory Board believes the financial statements for 2021 of TomTom NV meet all requirements for correctness and transparency. The Supervisory Board has approved the 2021 financial statements for 2021. All members of the Supervisory Board and members of the Management Board have signed the financial statements for 2021 pursuant to the statutory obligations under article 2:101 (2) of the DCC.
The Supervisory Board recommends to the General Meeting to adopt the financial statements for 2021, and requests that the General Meeting discharges the Management Board members’ responsibility for the conduct of business in 2021 and the Supervisory Board members’ supervision in 2021. The Annual Report for 2021 is available at the company’s offices on request and on the company’s website: corporate.tomtom.com/annuals.cfm
The Supervisory Board would like to thank TomTom’s shareholders for their trust in the company and its management and express its appreciation to all employees and the Management Board for the continued dedication and commitment to the company.
Amsterdam, 4 February 2022
The Supervisory BoardDERK HAANKJACQUELINE TAMMENOMS BAKKER JACK DE KREIJMICHAEL RHODIN HALA ZEINE
GOVERNANCE / PAGE 44
SUPERVISORY BOARD REPORT CONTINUED
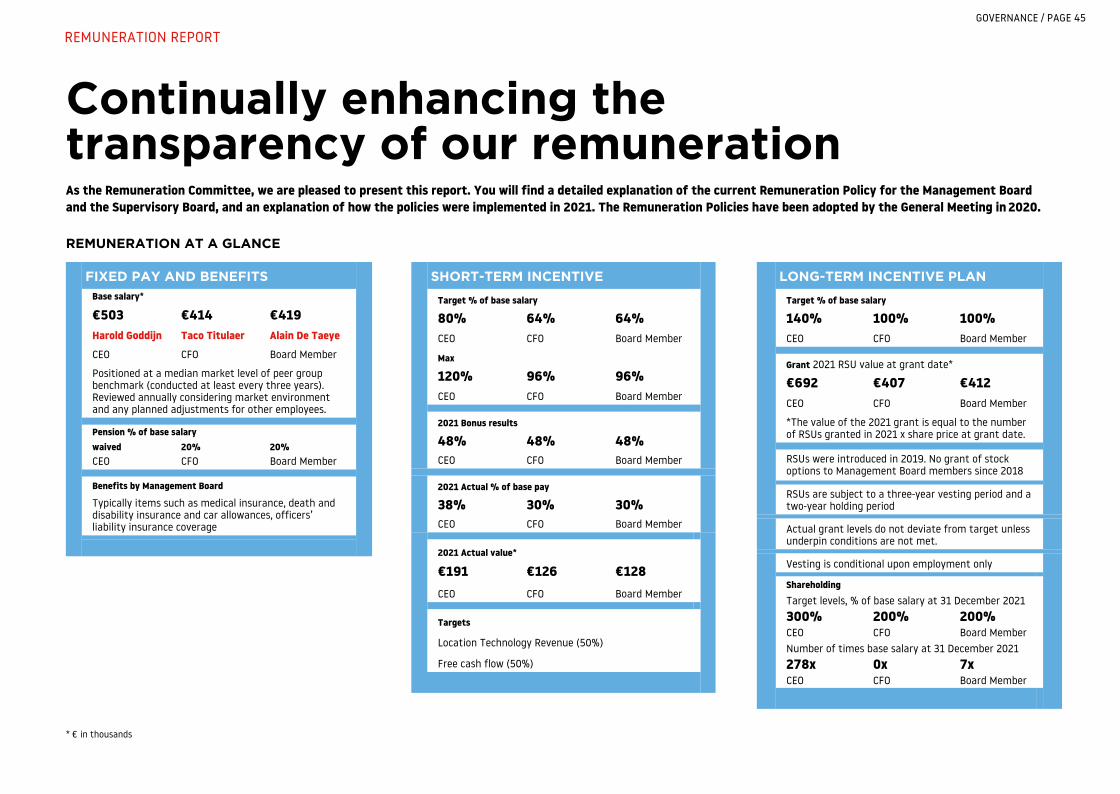
Continually enhancing the transparency of our remunerationAs the Remuneration Committee, we are pleased to present this report. You will find a detailed explanation of the current Remuneration Policy for the Management Board and the Supervisory Board, and an explanation of how the policies were implemented in 2021. The Remuneration Policies have been adopted by the General Meeting in 2020.
REMUNERATION AT A GLANCE
FIXED PAY AND BENEFITSBase salary*
€503 €414 €419Harold Goddijn Taco Titulaer Alain De Taeye
CEO CFO Board Member
Positioned at a median market level of peer group benchmark (conducted at least every three years). Reviewed annually considering market environment and any planned adjustments for other employees.
Pension % of base salarywaived 20% 20%CEO CFO Board Member
Benefits by Management Board
Typically items such as medical insurance, death and disability insurance and car allowances, officers’ liability insurance coverage
* € in thousands
SHORT-TERM INCENTIVE
Target % of base salary
80% 64% 64%CEO CFO Board Member
Max
120% 96% 96%CEO CFO Board Member
2021 Bonus results
48% 48% 48%CEO CFO Board Member
2021 Actual % of base pay
38% 30% 30%CEO CFO Board Member
2021 Actual value*
€191 €126 €128CEO CFO Board Member
Targets
Location Technology Revenue (50%)
Free cash flow (50%)
LONG-TERM INCENTIVE PLAN
Target % of base salary
140% 100% 100%CEO CFO Board Member
Grant 2021 RSU value at grant date*
€692 €407 €412CEO CFO Board Member
*The value of the 2021 grant is equal to the number of RSUs granted in 2021 x share price at grant date.
RSUs were introduced in 2019. No grant of stock options to Management Board members since 2018
RSUs are subject to a three-year vesting period and a two-year holding period
Actual grant levels do not deviate from target unless underpin conditions are not met.
Vesting is conditional upon employment only
ShareholdingTarget levels, % of base salary at 31 December 2021300% 200% 200%CEO CFO Board MemberNumber of times base salary at 31 December 2021278x 0x 7xCEO CFO Board Member
GOVERNANCE / PAGE 45
REMUNERATION REPORT

Our Remuneration Policy provides a company-wide framework for results-driven remuneration, supportive to the achievement of TomTom’s strategic objectives, our operational and financial results and the delivery of long-term value creation for all stakeholders. It is designed to attract and retain senior talent, and to provide fair, competitive, and responsible remuneration for all employees, in a simple and transparent manner.
The Policy reflects the following principles:
• Alignment with, and underpinning behavior towards, the achievement of TomTom’s vision and strategy and the creation of long-term value
• Alignment of pay structures throughout TomTom
• Competitive with companies with whom we compete for talent
• Consideration of stakeholders’ perspectives and the level of support in society
• Aspiration to live up to the highest standards of good corporate governance and enhanced transparency
REMUNERATION OF THE MANAGEMENT BOARD
The Supervisory Board ensures that the policy and its implementation are linked to the company’s strategic priorities and decides how to reward the successful delivery of the company’s strategy by the Management Board.
Our strategy balances growth objectives, financial stability and investments to position TomTom competitively in the evolving field of location technologies. The remuneration of Management Board members is intended to encourage behaviors that drive the generation of both short-term results to ensure ongoing operational improvement and financial stability, and long-term value by pursuing growth and partnership opportunities through our location technologies and innovative services.
INTERNAL ALIGNMENT
The Remuneration Committee reviews the alignment of pay structures throughout the organization by considering the consistency in the approach to setting remuneration components, performing a scenario analysis and evaluating the pay ratio.
Each individual Management Board member shares his view of his own remuneration package with the Chairman of the Remuneration Committee at least once per year. The feedback is shared with the other Remuneration Committee member, who together consider all feedback when discussing and evaluating the Remuneration Policy, including its components and outlook.
Scenario analysisA scenario analysis of the possible outcomes of the variable components and the impact on the Management Board members’ remuneration is conducted annually to minimize the risk that the performance criteria lead to inappropriate outcomes.
The effect of different performance scenarios on the level and composition of remuneration was analyzed and the outcome was taken into consideration by the Supervisory Board when reviewing the Management Board members’ remuneration. These scenarios include minimum (0%), target (100%) and maximum (150%) variable pay achievement and share price decrease of 20%, no change to the TomTom share price, and a share price increase of 20%. Under all scenarios (minimum, target, and maximum performance levels), the Supervisory Board considered that the range of potential remuneration is within outcomes that are appropriate for that level of performance.
Pay ratioThe pay ratio reflects the average total compensation of the total global employee workforce, relative to the total remuneration package of the CEO and the total Management Board. Social security is excluded from the measure of compensation.
APPLICATION AND OUTCOME
This calculation of the pay ratio has resulted in the following outcome:
Pay ratio1 2017 2018 2019 2020 2021CEO 25.0 28.9 27.1 20.1 22.7 Management Board 19.2 22.8 22.2 17.0 19.0
1 Excluding the cost of social security.
Annually, TomTom reviews local competitive dynamics and the livable wage in each of our operating locations. If needed, adjustments are made to ensure employees compensation are at market and above livable wage levels as part of TomTom’s efforts to be a good employer. The outcomes of these reviews contribute to our pay ratio.
The decrease of the pay ratio in 2019 and 2020 was caused by the investments made in employees' salaries in the company’s key markets, in combination with a zero bonus payout for the Management Board members in 2020 further decreasing the ratio.
In 2021, investments were also made in employees' salaries in the company’s key markets, yet the ratio for 2021 increased by 2.6 points as an effect of the Management Board's achievement against short-term incentive performance metrics and subsequent bonus result for 2021.
Despite the 2.6 points increase in pay ratio, the Supervisory Board deems TomTom's pay ratio remaining at a low end. The current level is acceptable but is requiring a continuous attention.
GOVERNANCE / PAGE 46
REMUNERATION REPORT CONTINUED
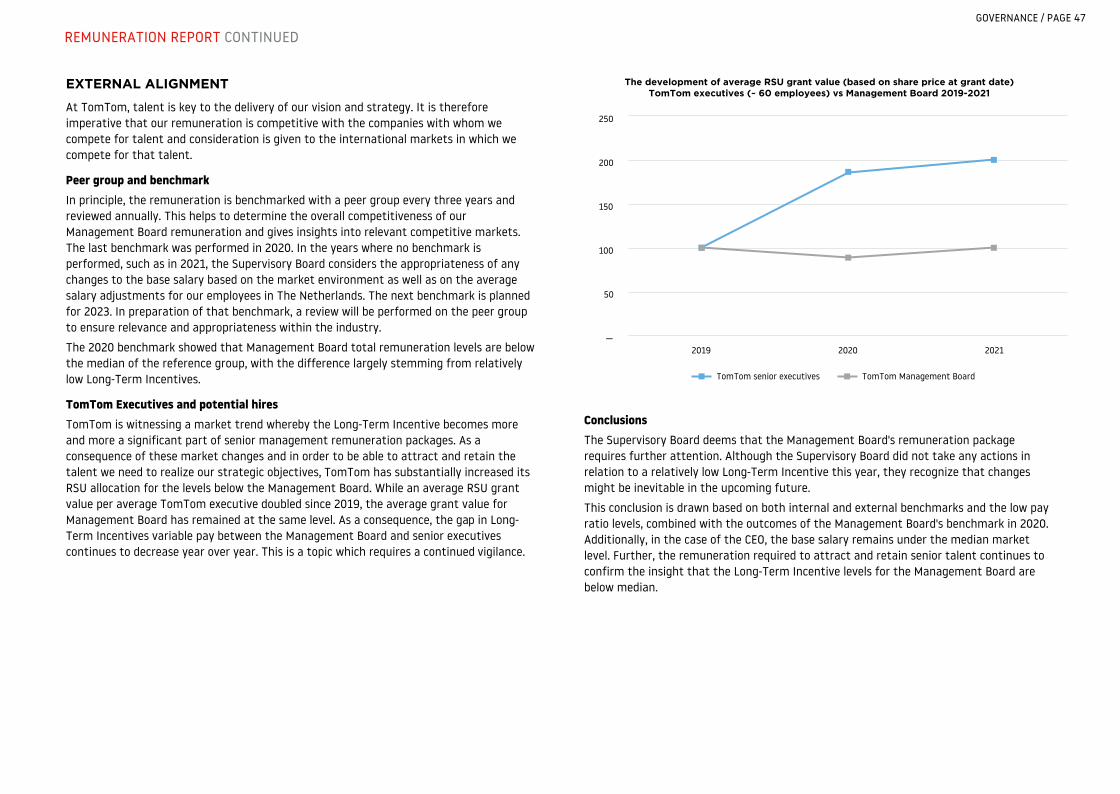
EXTERNAL ALIGNMENT
At TomTom, talent is key to the delivery of our vision and strategy. It is therefore imperative that our remuneration is competitive with the companies with whom we compete for talent and consideration is given to the international markets in which we compete for that talent.
Peer group and benchmarkIn principle, the remuneration is benchmarked with a peer group every three years and reviewed annually. This helps to determine the overall competitiveness of our Management Board remuneration and gives insights into relevant competitive markets. The last benchmark was performed in 2020. In the years where no benchmark is performed, such as in 2021, the Supervisory Board considers the appropriateness of any changes to the base salary based on the market environment as well as on the average salary adjustments for our employees in The Netherlands. The next benchmark is planned for 2023. In preparation of that benchmark, a review will be performed on the peer group to ensure relevance and appropriateness within the industry.
The 2020 benchmark showed that Management Board total remuneration levels are below the median of the reference group, with the difference largely stemming from relatively low Long-Term Incentives.
TomTom Executives and potential hiresTomTom is witnessing a market trend whereby the Long-Term Incentive becomes more and more a significant part of senior management remuneration packages. As a consequence of these market changes and in order to be able to attract and retain the talent we need to realize our strategic objectives, TomTom has substantially increased its RSU allocation for the levels below the Management Board. While an average RSU grant value per average TomTom executive doubled since 2019, the average grant value for Management Board has remained at the same level. As a consequence, the gap in Long-Term Incentives variable pay between the Management Board and senior executives continues to decrease year over year. This is a topic which requires a continued vigilance.
The development of average RSU grant value (based on share price at grant date)TomTom executives (~ 60 employees) vs Management Board 2019-2021
TomTom senior executives TomTom Management Board
2019 2020 2021—
50
100
150
200
250
ConclusionsThe Supervisory Board deems that the Management Board's remuneration package requires further attention. Although the Supervisory Board did not take any actions in relation to a relatively low Long-Term Incentive this year, they recognize that changes might be inevitable in the upcoming future.
This conclusion is drawn based on both internal and external benchmarks and the low pay ratio levels, combined with the outcomes of the Management Board's benchmark in 2020. Additionally, in the case of the CEO, the base salary remains under the median market level. Further, the remuneration required to attract and retain senior talent continues to confirm the insight that the Long-Term Incentive levels for the Management Board are below median.
GOVERNANCE / PAGE 47
REMUNERATION REPORT CONTINUED
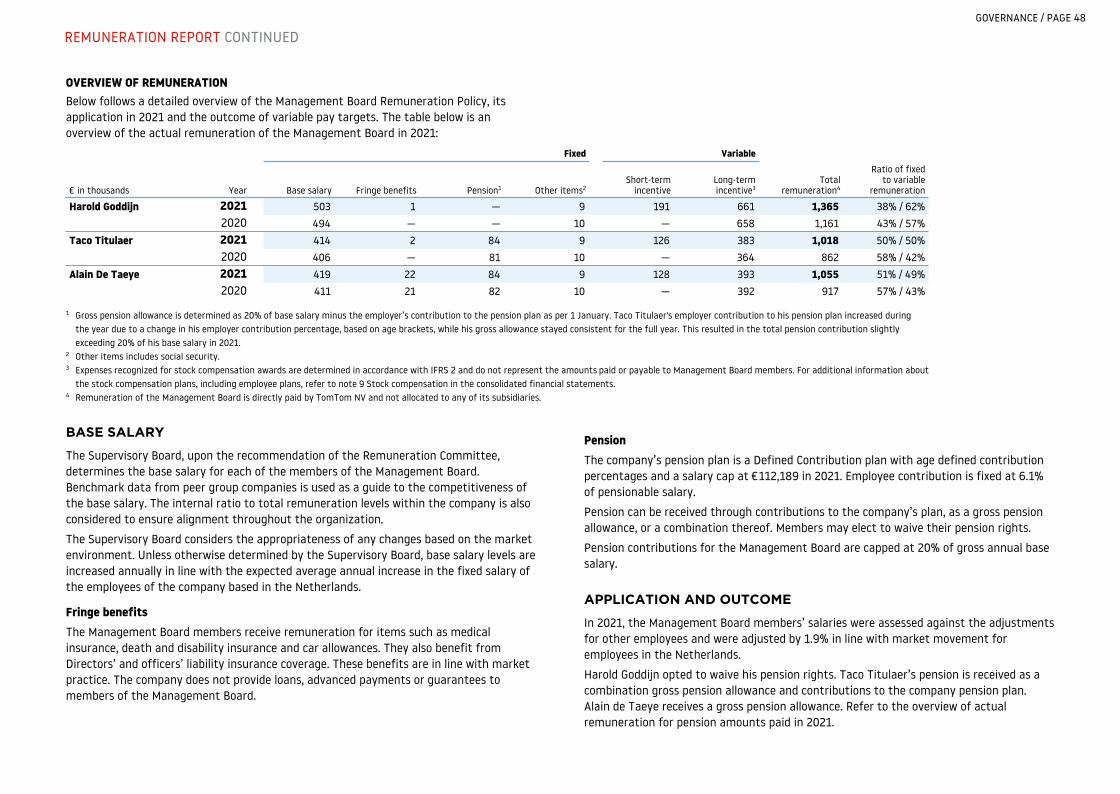
OVERVIEW OF REMUNERATIONBelow follows a detailed overview of the Management Board Remuneration Policy, its application in 2021 and the outcome of variable pay targets. The table below is an overview of the actual remuneration of the Management Board in 2021:
Fixed Variable
€ in thousands Year Base salary Fringe benefits Pension1 Other items2Short-term
incentiveLong-term incentive3
Total remuneration4
Ratio of fixed to variable
remuneration
Harold Goddijn 2021 503 1 — 9 191 661 1,365 38% / 62%2020 494 — — 10 — 658 1,161 43% / 57%
Taco Titulaer 2021 414 2 84 9 126 383 1,018 50% / 50%2020 406 — 81 10 — 364 862 58% / 42%
Alain De Taeye 2021 419 22 84 9 128 393 1,055 51% / 49%2020 411 21 82 10 — 392 917 57% / 43%
1 Gross pension allowance is determined as 20% of base salary minus the employer’s contribution to the pension plan as per 1 January. Taco Titulaer's employer contribution to his pension plan increased during the year due to a change in his employer contribution percentage, based on age brackets, while his gross allowance stayed consistent for the full year. This resulted in the total pension contribution slightly exceeding 20% of his base salary in 2021.
2 Other items includes social security.3 Expenses recognized for stock compensation awards are determined in accordance with IFRS 2 and do not represent the amounts paid or payable to Management Board members. For additional information about
the stock compensation plans, including employee plans, refer to note 9 Stock compensation in the consolidated financial statements. 4 Remuneration of the Management Board is directly paid by TomTom NV and not allocated to any of its subsidiaries.
BASE SALARY
The Supervisory Board, upon the recommendation of the Remuneration Committee, determines the base salary for each of the members of the Management Board. Benchmark data from peer group companies is used as a guide to the competitiveness of the base salary. The internal ratio to total remuneration levels within the company is also considered to ensure alignment throughout the organization.
The Supervisory Board considers the appropriateness of any changes based on the market environment. Unless otherwise determined by the Supervisory Board, base salary levels are increased annually in line with the expected average annual increase in the fixed salary of the employees of the company based in the Netherlands.
Fringe benefitsThe Management Board members receive remuneration for items such as medical insurance, death and disability insurance and car allowances. They also benefit from Directors’ and officers’ liability insurance coverage. These benefits are in line with market practice. The company does not provide loans, advanced payments or guarantees to members of the Management Board.
PensionThe company’s pension plan is a Defined Contribution plan with age defined contribution percentages and a salary cap at €112,189 in 2021. Employee contribution is fixed at 6.1% of pensionable salary.
Pension can be received through contributions to the company’s plan, as a gross pension allowance, or a combination thereof. Members may elect to waive their pension rights.
Pension contributions for the Management Board are capped at 20% of gross annual base salary.
APPLICATION AND OUTCOME
In 2021, the Management Board members’ salaries were assessed against the adjustments for other employees and were adjusted by 1.9% in line with market movement for employees in the Netherlands.
Harold Goddijn opted to waive his pension rights. Taco Titulaer’s pension is received as a combination gross pension allowance and contributions to the company pension plan. Alain de Taeye receives a gross pension allowance. Refer to the overview of actual remuneration for pension amounts paid in 2021.
GOVERNANCE / PAGE 48
REMUNERATION REPORT CONTINUED

SHORT-TERM INCENTIVE
Management Board members participate in the short-term, annual incentive plan. The Management Board and Employees short term incentive plans are aligned, however measurements and targets for employees differ per segment. The annual incentive has an at-target payout level of 80% of base salary for the CEO and 64% of base salary for other members of the Management Board.
On an annual basis at the beginning of the year the Supervisory Board determines the performance criteria (financial and/or other quantitative/qualitative criteria) for the Management Board based on the company’s strategic agenda and sets challenging yet realistic target levels for each performance criteria.
The performance criteria provide the framework for employee incentive schemes which are cascaded down by the Management Board to the rest of the organization.
According to our policy, financial criteria may include, but are not limited to, one or more of the following: (operational) revenue; (adjusted) EBITDA; EBITDA minus CAPEX; and free cash flow. Once targets are set, they do not change during the year. Performance is reviewed each quarter and the final assessment against the targets, with any potential payout occurring during the first quarter of the next financial year. A minimum level of performance must be achieved before any payment under the plan will be made and payout is capped at an outstanding level of performance, known as the maximum.
The performance assessment under the short-term incentive plan is based on an evaluation of the past financial year. To determine the performance versus targets, the reported results will be assessed and in case required adjusted for exceptional items.
The Remuneration Committee investigates, deliberates and determines the annual incentive of each Management Board member. The Supervisory Board assesses whether the outcome of the calculated payout is justified by the overall business performance and considers its fairness in light of provision 2:135 sub 6 of the DCC. In preparation for that assessment, the Chairs of the Remuneration Committee and the Audit Committee review the final outcomes, including any quality of earnings elements and relevant aspects of operational business performance.
APPLICATION AND OUTCOME
In 2021, as in recent years, the Supervisory Board chose to apply financial criteria only. The possibility of including qualitative criteria, for instance such as ESG, was discussed. However, it was concluded that the simplicity of focus on two financial criteria outweighed the benefits of adding qualitative criteria in 2021.
The performance criteria for the 2021 short-term incentive plan were aligned with the financial guidance given to the financial markets. The targets reflect the importance of balancing targeted growth in key areas (Location Technology revenue) and overall profitability (free cash flow).
The revenue metric is specific to Location Technology and excludes revenue from Consumer. This metric is an indicator of the company's long-term strategic ambition in the Location Technology market. It reflects how our customers value our products and TomTom as a partner.
The free cash flow of the TomTom group, including the Consumer segment, is considered as an appropriate indicator for profitability. Free cash flow is cash from operating activities minus capital expenditure. This metric reflects the emphasis on the company's financial stability and ensures that the company is well positioned for future key investments.
In 2021 the performance targets, levels and relative weighting were set as follows:
Performance metric Weighting
Minimum performance
(0%)
Target 2021
(100%)
Maximum performance
(150%)Actual
achievement
Location Technology revenue
50% €420 million €433 million €450 million 0 %
Free cash flow 50% €16 million €33 million €41 million 96%
Location Technology revenue in 2021 did not reach the threshold set at the beginning of the year. Our Enterprise business continues to perform solidly. But the recovery of our Automotive business has lagged expectations because industrywide semiconductor supply chain issues are hampering car production volumes.
Our free cash flow adjusted for exceptional working capital movements, met the lower threshold as lower revenue was partly offset by lower spend.
The weighted achievement on the two performance metrics result in respectively 38% award as % of base salary for the CEO and 30% for the other two board members.
The following table summarizes the performance of the Management Board and the corresponding short-term incentive award based on the assessment of the plan:
€ in thousands Base salaryTarget % of base salary
Weighted achievement performance
metricsActual award
2021
Harold Goddijn 503 80% 48% 191 (38%)
Taco Titulaer 414 64% 48% 126 (30%)
Alain De Taeye 419 64% 48% 128 (30%)
GOVERNANCE / PAGE 49
REMUNERATION REPORT CONTINUED
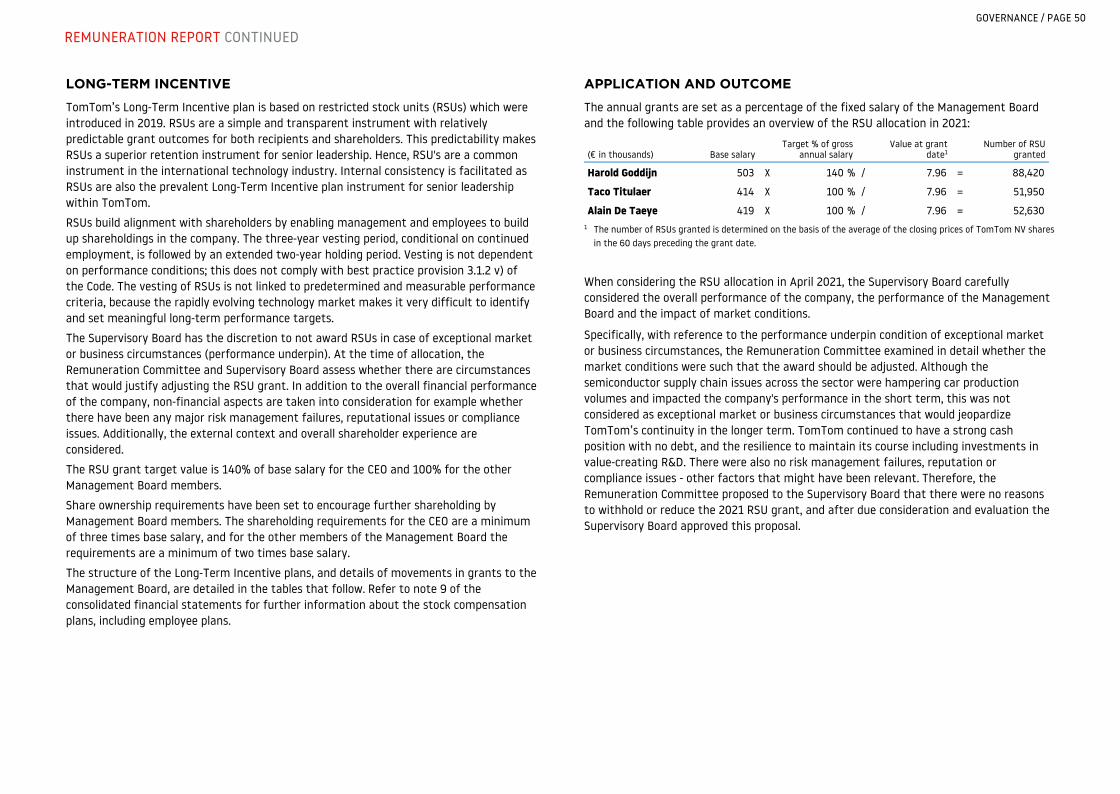
LONG-TERM INCENTIVE
TomTom’s Long-Term Incentive plan is based on restricted stock units (RSUs) which were introduced in 2019. RSUs are a simple and transparent instrument with relatively predictable grant outcomes for both recipients and shareholders. This predictability makes RSUs a superior retention instrument for senior leadership. Hence, RSU's are a common instrument in the international technology industry. Internal consistency is facilitated as RSUs are also the prevalent Long-Term Incentive plan instrument for senior leadership within TomTom.
RSUs build alignment with shareholders by enabling management and employees to build up shareholdings in the company. The three-year vesting period, conditional on continued employment, is followed by an extended two-year holding period. Vesting is not dependent on performance conditions; this does not comply with best practice provision 3.1.2 v) of the Code. The vesting of RSUs is not linked to predetermined and measurable performance criteria, because the rapidly evolving technology market makes it very difficult to identify and set meaningful long-term performance targets.
The Supervisory Board has the discretion to not award RSUs in case of exceptional market or business circumstances (performance underpin). At the time of allocation, the Remuneration Committee and Supervisory Board assess whether there are circumstances that would justify adjusting the RSU grant. In addition to the overall financial performance of the company, non-financial aspects are taken into consideration for example whether there have been any major risk management failures, reputational issues or compliance issues. Additionally, the external context and overall shareholder experience are considered.
The RSU grant target value is 140% of base salary for the CEO and 100% for the other Management Board members.
Share ownership requirements have been set to encourage further shareholding by Management Board members. The shareholding requirements for the CEO are a minimum of three times base salary, and for the other members of the Management Board the requirements are a minimum of two times base salary.
The structure of the Long-Term Incentive plans, and details of movements in grants to the Management Board, are detailed in the tables that follow. Refer to note 9 of the consolidated financial statements for further information about the stock compensation plans, including employee plans.
APPLICATION AND OUTCOME
The annual grants are set as a percentage of the fixed salary of the Management Board and the following table provides an overview of the RSU allocation in 2021:
(€ in thousands) Base salaryTarget % of gross
annual salaryValue at grant
date1Number of RSU
granted
Harold Goddijn 503 X 140 % / 7.96 = 88,420
Taco Titulaer 414 X 100 % / 7.96 = 51,950
Alain De Taeye 419 X 100 % / 7.96 = 52,630 1 The number of RSUs granted is determined on the basis of the average of the closing prices of TomTom NV shares
in the 60 days preceding the grant date.
When considering the RSU allocation in April 2021, the Supervisory Board carefully considered the overall performance of the company, the performance of the Management Board and the impact of market conditions.
Specifically, with reference to the performance underpin condition of exceptional market or business circumstances, the Remuneration Committee examined in detail whether the market conditions were such that the award should be adjusted. Although the semiconductor supply chain issues across the sector were hampering car production volumes and impacted the company's performance in the short term, this was not considered as exceptional market or business circumstances that would jeopardize TomTom’s continuity in the longer term. TomTom continued to have a strong cash position with no debt, and the resilience to maintain its course including investments in value-creating R&D. There were also no risk management failures, reputation or compliance issues - other factors that might have been relevant. Therefore, the Remuneration Committee proposed to the Supervisory Board that there were no reasons to withhold or reduce the 2021 RSU grant, and after due consideration and evaluation the Supervisory Board approved this proposal.
GOVERNANCE / PAGE 50
REMUNERATION REPORT CONTINUED
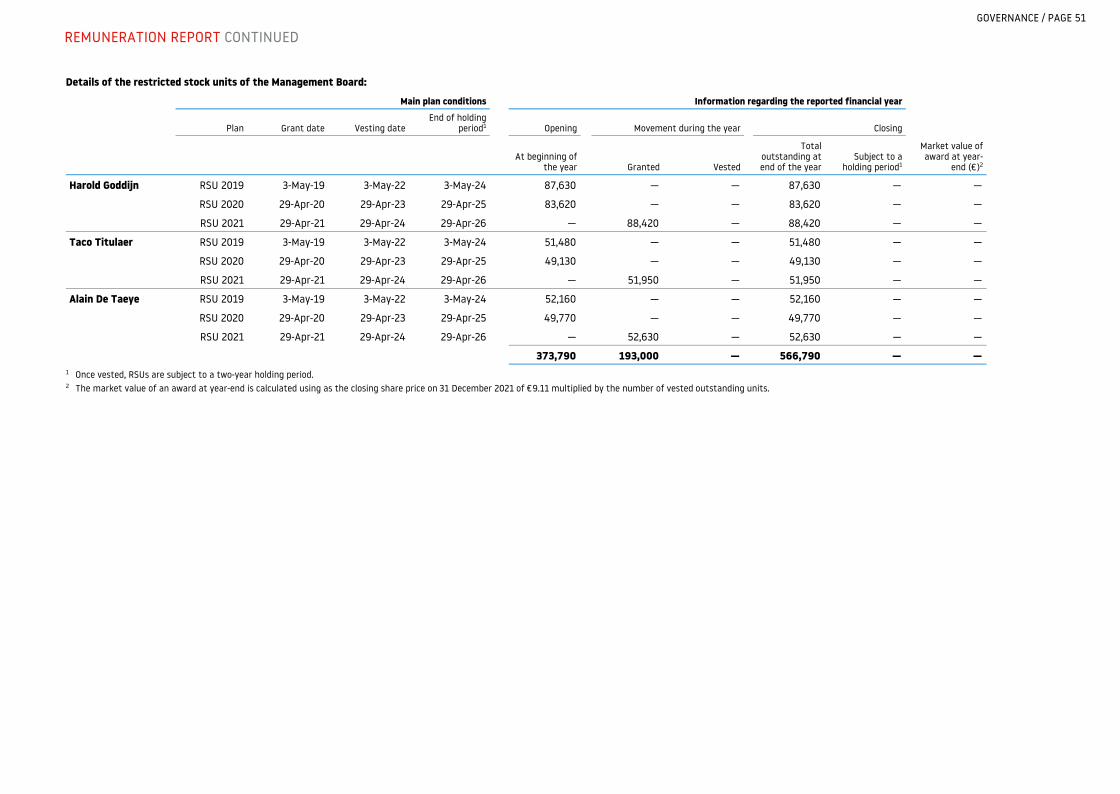
Details of the restricted stock units of the Management Board:
Main plan conditions Information regarding the reported financial year
Plan Grant date Vesting dateEnd of holding
period1 Opening Movement during the year Closing
At beginning of the year Granted Vested
Total outstanding at end of the year
Subject to a holding period1
Market value of award at year-
end (€)2
Harold Goddijn RSU 2019 3-May-19 3-May-22 3-May-24 87,630 — — 87,630 — —
RSU 2020 29-Apr-20 29-Apr-23 29-Apr-25 83,620 — — 83,620 — —
RSU 2021 29-Apr-21 29-Apr-24 29-Apr-26 — 88,420 — 88,420 — —
Taco Titulaer RSU 2019 3-May-19 3-May-22 3-May-24 51,480 — — 51,480 — —
RSU 2020 29-Apr-20 29-Apr-23 29-Apr-25 49,130 — — 49,130 — —
RSU 2021 29-Apr-21 29-Apr-24 29-Apr-26 — 51,950 — 51,950 — —
Alain De Taeye RSU 2019 3-May-19 3-May-22 3-May-24 52,160 — — 52,160 — —
RSU 2020 29-Apr-20 29-Apr-23 29-Apr-25 49,770 — — 49,770 — —
RSU 2021 29-Apr-21 29-Apr-24 29-Apr-26 — 52,630 — 52,630 — —
373,790 193,000 — 566,790 — — 1 Once vested, RSUs are subject to a two-year holding period.2 The market value of an award at year-end is calculated using as the closing share price on 31 December 2021 of €9.11 multiplied by the number of vested outstanding units.
GOVERNANCE / PAGE 51
REMUNERATION REPORT CONTINUED

Details of the stock options of the Management Board:Main plan conditions Information regarding the reported financial year
Market value of award at
year-end (€)2
Plan Grant date1 Vesting date Expiry dateExercise price
(€) Opening Movement during the year Closing
At beginning of the year Granted Vested Exercised
Total outstanding
at end of the year
Outstanding and vested
Harold Goddijn Option 2014 13-May-14 13-May-17 13-May-21 5.28 300,000 — — 300,000 — — —
Option 2015 7-May-15 7-May-18 7-May-22 7.83 210,000 — — — 210,000 210,000 268,800
Option 2016 10-May-16 10-May-19 10-May-23 7.58 112,500 — — — 112,500 112,500 172,125
Option 2017 10-May-17 10-May-20 10-May-24 9.57 165,000 — — — 165,000 165,000 —
Option 2018 2-May-18 2-May-21 2-May-25 8.13 201,500 — 201,500 — 201,500 201,500 197,470
Taco Titulaer Option 2014 13-May-14 13-May-17 13-May-21 5.28 34,600 — — 34,600 — — —
Option 2015 7-May-15 7-May-18 7-May-22 7.83 39,200 — — — 39,200 39,200 50,176
Option 2016 10-May-16 10-May-19 10-May-23 7.58 48,500 — — — 48,500 48,500 74,205
Option 2017 10-May-17 10-May-20 10-May-24 9.57 85,000 — — — 85,000 85,000 —
Option 2018 2-May-18 2-May-21 2-May-25 8.13 102,800 — 102,800 — 102,800 102,800 100,744
Alain De Taeye Option 2014 13-May-14 13-May-17 13-May-21 4.93 150,000 — — 150,000 — — —
Option 2015 7-May-15 7-May-18 7-May-22 7.83 110,000 — — — 110,000 110,000 140,800
Option 2016 10-May-16 10-May-19 10-May-23 7.58 56,500 — — — 56,500 56,500 86,445
Option 2017 10-May-17 10-May-20 10-May-24 9.57 100,000 — — — 100,000 100,000 —
Option 2018 2-May-18 2-May-21 2-May-25 8.13 120,000 — 120,000 — 120,000 120,000 117,600
1,835,600 — 424,300 484,600 1,351,000 1,351,000 1 RSUs were introduced in 2019. There has been no grant of stock options to Management Board members since 2018.2 The market value of an award at year-end is calculated as the closing share price on 31 December 2021 of €9.11, less the strike price to be paid, multiplied by the number of vested outstanding options that are in-the-money. All options that
have a strike price higher than the year-end share price are considered to be out-of-the-money at 31 December 2021 and are assumed to have no market value.
GOVERNANCE / PAGE 52
REMUNERATION REPORT CONTINUED
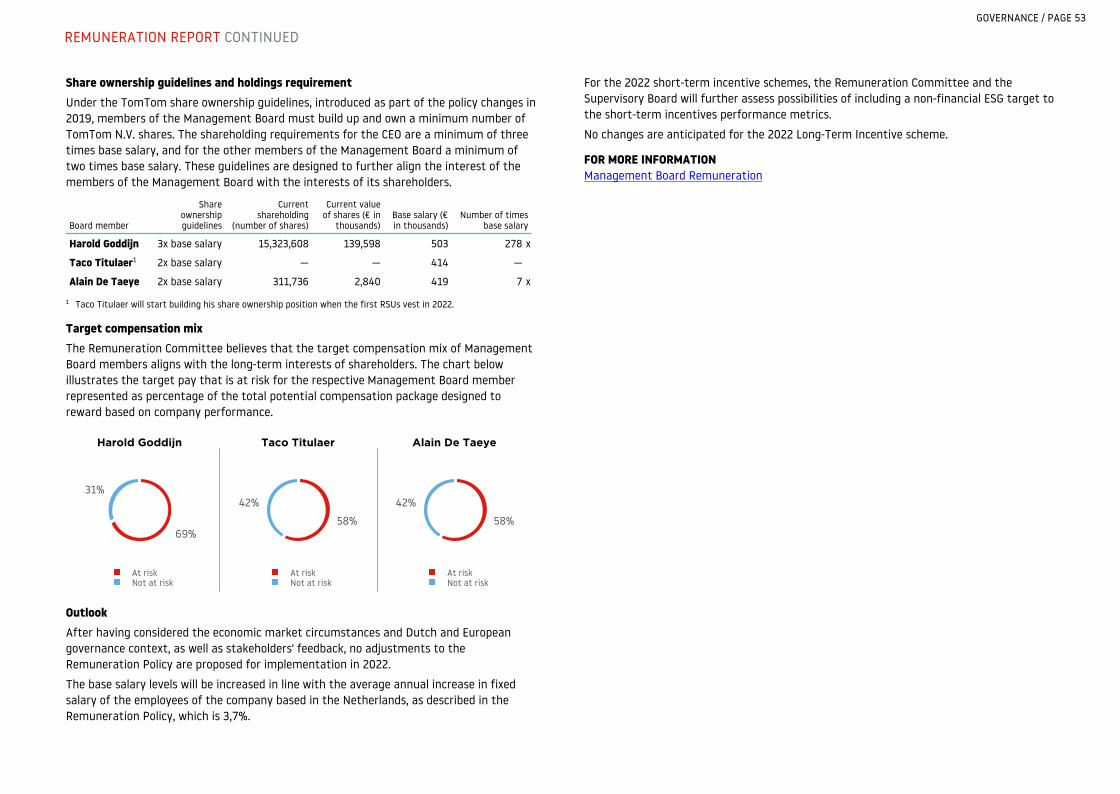
Share ownership guidelines and holdings requirementUnder the TomTom share ownership guidelines, introduced as part of the policy changes in 2019, members of the Management Board must build up and own a minimum number of TomTom N.V. shares. The shareholding requirements for the CEO are a minimum of three times base salary, and for the other members of the Management Board a minimum of two times base salary. These guidelines are designed to further align the interest of the members of the Management Board with the interests of its shareholders.
Board member
Share ownership guidelines
Current shareholding
(number of shares)
Current value of shares (€ in
thousands)Base salary (€ in thousands)
Number of times base salary
Harold Goddijn 3x base salary 15,323,608 139,598 503 278 x
Taco Titulaer1 2x base salary — — 414 —
Alain De Taeye 2x base salary 311,736 2,840 419 7 x
1 Taco Titulaer will start building his share ownership position when the first RSUs vest in 2022.
Target compensation mix The Remuneration Committee believes that the target compensation mix of Management Board members aligns with the long-term interests of shareholders. The chart below illustrates the target pay that is at risk for the respective Management Board member represented as percentage of the total potential compensation package designed to reward based on company performance.
Harold Goddijn
69%
31%
At riskNot at risk
Taco Titulaer
58%
42%
At riskNot at risk
Alain De Taeye
58%
42%
At riskNot at risk
OutlookAfter having considered the economic market circumstances and Dutch and European governance context, as well as stakeholders' feedback, no adjustments to the Remuneration Policy are proposed for implementation in 2022.
The base salary levels will be increased in line with the average annual increase in fixed salary of the employees of the company based in the Netherlands, as described in the Remuneration Policy, which is 3,7%.
For the 2022 short-term incentive schemes, the Remuneration Committee and the Supervisory Board will further assess possibilities of including a non-financial ESG target to the short-term incentives performance metrics.
No changes are anticipated for the 2022 Long-Term Incentive scheme.
FOR MORE INFORMATIONManagement Board Remuneration
GOVERNANCE / PAGE 53
REMUNERATION REPORT CONTINUED
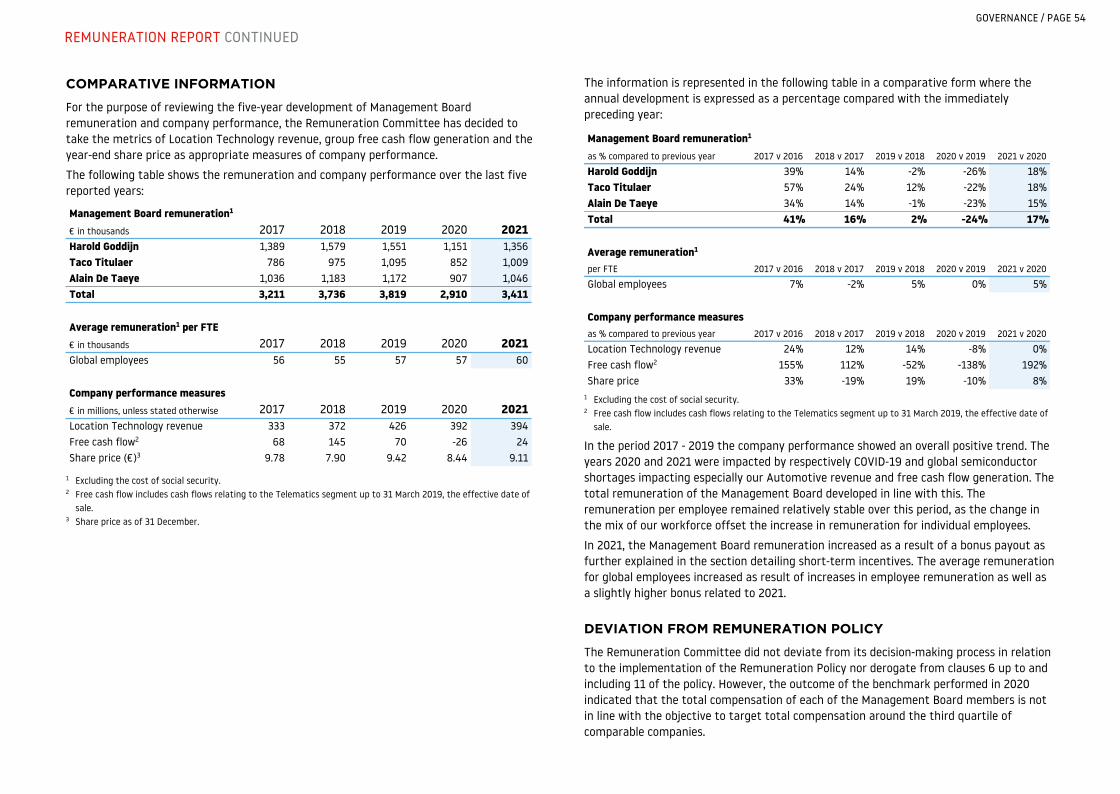
COMPARATIVE INFORMATION
For the purpose of reviewing the five-year development of Management Board remuneration and company performance, the Remuneration Committee has decided to take the metrics of Location Technology revenue, group free cash flow generation and the year-end share price as appropriate measures of company performance.
The following table shows the remuneration and company performance over the last five reported years:
Management Board remuneration1
€ in thousands 2017 2018 2019 2020 2021Harold Goddijn 1,389 1,579 1,551 1,151 1,356Taco Titulaer 786 975 1,095 852 1,009Alain De Taeye 1,036 1,183 1,172 907 1,046Total 3,211 3,736 3,819 2,910 3,411
Average remuneration1 per FTE€ in thousands 2017 2018 2019 2020 2021Global employees 56 55 57 57 60
Company performance measures€ in millions, unless stated otherwise 2017 2018 2019 2020 2021Location Technology revenue 333 372 426 392 394Free cash flow2 68 145 70 -26 24Share price (€)3 9.78 7.90 9.42 8.44 9.11
1 Excluding the cost of social security.2 Free cash flow includes cash flows relating to the Telematics segment up to 31 March 2019, the effective date of
sale.3 Share price as of 31 December.
The information is represented in the following table in a comparative form where the annual development is expressed as a percentage compared with the immediately preceding year:
Management Board remuneration1
as % compared to previous year 2017 v 2016 2018 v 2017 2019 v 2018 2020 v 2019 2021 v 2020
Harold Goddijn 39% 14% -2% -26% 18% Taco Titulaer 57% 24% 12% -22% 18% Alain De Taeye 34% 14% -1% -23% 15% Total 41% 16% 2% -24% 17%
Average remuneration1
per FTE 2017 v 2016 2018 v 2017 2019 v 2018 2020 v 2019 2021 v 2020
Global employees 7% -2% 5% 0% 5%
Company performance measuresas % compared to previous year 2017 v 2016 2018 v 2017 2019 v 2018 2020 v 2019 2021 v 2020
Location Technology revenue 24% 12% 14% -8% 0% Free cash flow2 155% 112% -52% -138% 192% Share price 33% -19% 19% -10% 8%
1 Excluding the cost of social security.2 Free cash flow includes cash flows relating to the Telematics segment up to 31 March 2019, the effective date of
sale.
In the period 2017 - 2019 the company performance showed an overall positive trend. The years 2020 and 2021 were impacted by respectively COVID-19 and global semiconductor shortages impacting especially our Automotive revenue and free cash flow generation. The total remuneration of the Management Board developed in line with this. The remuneration per employee remained relatively stable over this period, as the change in the mix of our workforce offset the increase in remuneration for individual employees.
In 2021, the Management Board remuneration increased as a result of a bonus payout as further explained in the section detailing short-term incentives. The average remuneration for global employees increased as result of increases in employee remuneration as well as a slightly higher bonus related to 2021.
DEVIATION FROM REMUNERATION POLICY
The Remuneration Committee did not deviate from its decision-making process in relation to the implementation of the Remuneration Policy nor derogate from clauses 6 up to and including 11 of the policy. However, the outcome of the benchmark performed in 2020 indicated that the total compensation of each of the Management Board members is not in line with the objective to target total compensation around the third quartile of comparable companies.
GOVERNANCE / PAGE 54
REMUNERATION REPORT CONTINUED
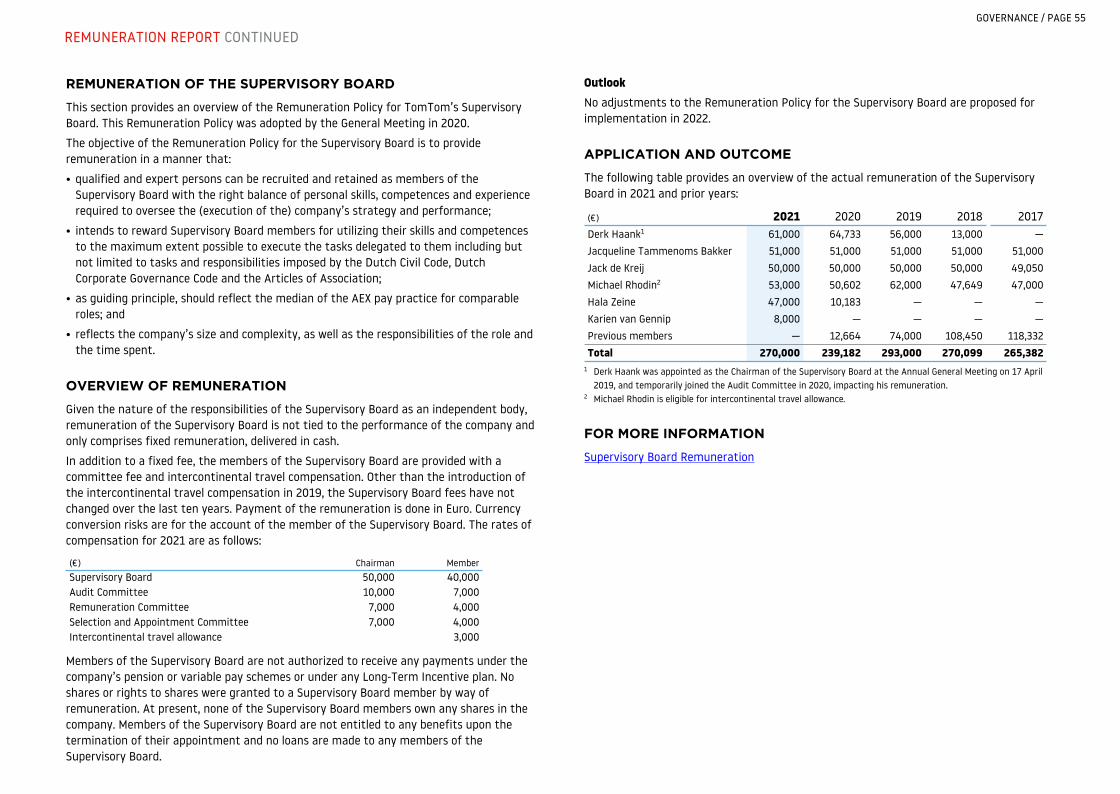
REMUNERATION OF THE SUPERVISORY BOARD
This section provides an overview of the Remuneration Policy for TomTom’s Supervisory Board. This Remuneration Policy was adopted by the General Meeting in 2020.
The objective of the Remuneration Policy for the Supervisory Board is to provide remuneration in a manner that:
• qualified and expert persons can be recruited and retained as members of the Supervisory Board with the right balance of personal skills, competences and experience required to oversee the (execution of the) company’s strategy and performance;
• intends to reward Supervisory Board members for utilizing their skills and competences to the maximum extent possible to execute the tasks delegated to them including but not limited to tasks and responsibilities imposed by the Dutch Civil Code, Dutch Corporate Governance Code and the Articles of Association;
• as guiding principle, should reflect the median of the AEX pay practice for comparable roles; and
• reflects the company’s size and complexity, as well as the responsibilities of the role and the time spent.
OVERVIEW OF REMUNERATION
Given the nature of the responsibilities of the Supervisory Board as an independent body, remuneration of the Supervisory Board is not tied to the performance of the company and only comprises fixed remuneration, delivered in cash.
In addition to a fixed fee, the members of the Supervisory Board are provided with a committee fee and intercontinental travel compensation. Other than the introduction of the intercontinental travel compensation in 2019, the Supervisory Board fees have not changed over the last ten years. Payment of the remuneration is done in Euro. Currency conversion risks are for the account of the member of the Supervisory Board. The rates of compensation for 2021 are as follows:
(€) Chairman MemberSupervisory Board 50,000 40,000Audit Committee 10,000 7,000Remuneration Committee 7,000 4,000Selection and Appointment Committee 7,000 4,000Intercontinental travel allowance 3,000
Members of the Supervisory Board are not authorized to receive any payments under the company’s pension or variable pay schemes or under any Long-Term Incentive plan. No shares or rights to shares were granted to a Supervisory Board member by way of remuneration. At present, none of the Supervisory Board members own any shares in the company. Members of the Supervisory Board are not entitled to any benefits upon the termination of their appointment and no loans are made to any members of the Supervisory Board.
OutlookNo adjustments to the Remuneration Policy for the Supervisory Board are proposed for implementation in 2022.
APPLICATION AND OUTCOME
The following table provides an overview of the actual remuneration of the Supervisory Board in 2021 and prior years:
(€) 2021 2020 2019 2018 2017Derk Haank1 61,000 64,733 56,000 13,000 —Jacqueline Tammenoms Bakker 51,000 51,000 51,000 51,000 51,000Jack de Kreij 50,000 50,000 50,000 50,000 49,050Michael Rhodin2 53,000 50,602 62,000 47,649 47,000Hala Zeine 47,000 10,183 — — —Karien van Gennip 8,000 — — — —Previous members — 12,664 74,000 108,450 118,332Total 270,000 239,182 293,000 270,099 265,382
1 Derk Haank was appointed as the Chairman of the Supervisory Board at the Annual General Meeting on 17 April 2019, and temporarily joined the Audit Committee in 2020, impacting his remuneration.
2 Michael Rhodin is eligible for intercontinental travel allowance.
FOR MORE INFORMATION
Supervisory Board Remuneration
GOVERNANCE / PAGE 55
REMUNERATION REPORT CONTINUED
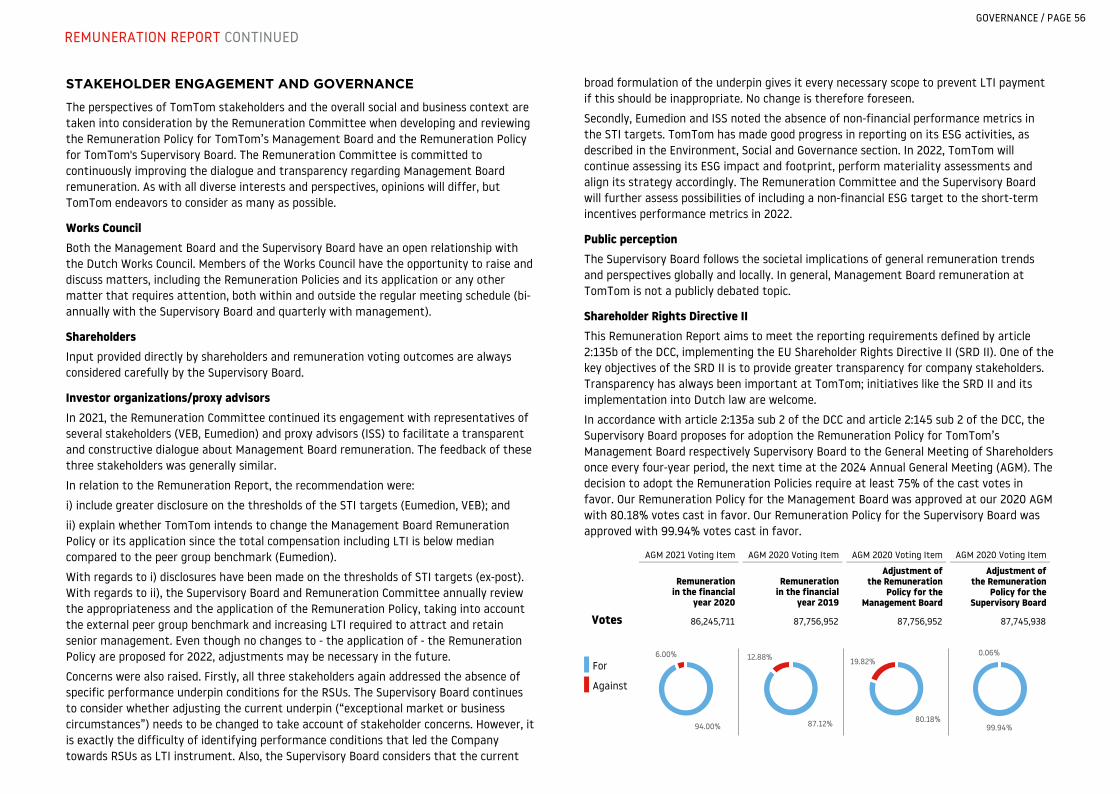
STAKEHOLDER ENGAGEMENT AND GOVERNANCE
The perspectives of TomTom stakeholders and the overall social and business context are taken into consideration by the Remuneration Committee when developing and reviewing the Remuneration Policy for TomTom’s Management Board and the Remuneration Policy for TomTom's Supervisory Board. The Remuneration Committee is committed to continuously improving the dialogue and transparency regarding Management Board remuneration. As with all diverse interests and perspectives, opinions will differ, but TomTom endeavors to consider as many as possible.
Works Council Both the Management Board and the Supervisory Board have an open relationship with the Dutch Works Council. Members of the Works Council have the opportunity to raise and discuss matters, including the Remuneration Policies and its application or any other matter that requires attention, both within and outside the regular meeting schedule (bi-annually with the Supervisory Board and quarterly with management).
ShareholdersInput provided directly by shareholders and remuneration voting outcomes are always considered carefully by the Supervisory Board.
Investor organizations/proxy advisorsIn 2021, the Remuneration Committee continued its engagement with representatives of several stakeholders (VEB, Eumedion) and proxy advisors (ISS) to facilitate a transparent and constructive dialogue about Management Board remuneration. The feedback of these three stakeholders was generally similar.
In relation to the Remuneration Report, the recommendation were:
i) include greater disclosure on the thresholds of the STI targets (Eumedion, VEB); and
ii) explain whether TomTom intends to change the Management Board Remuneration Policy or its application since the total compensation including LTI is below median compared to the peer group benchmark (Eumedion).
With regards to i) disclosures have been made on the thresholds of STI targets (ex-post). With regards to ii), the Supervisory Board and Remuneration Committee annually review the appropriateness and the application of the Remuneration Policy, taking into account the external peer group benchmark and increasing LTI required to attract and retain senior management. Even though no changes to - the application of - the Remuneration Policy are proposed for 2022, adjustments may be necessary in the future.
Concerns were also raised. Firstly, all three stakeholders again addressed the absence of specific performance underpin conditions for the RSUs. The Supervisory Board continues to consider whether adjusting the current underpin (“exceptional market or business circumstances”) needs to be changed to take account of stakeholder concerns. However, it is exactly the difficulty of identifying performance conditions that led the Company towards RSUs as LTI instrument. Also, the Supervisory Board considers that the current
broad formulation of the underpin gives it every necessary scope to prevent LTI payment if this should be inappropriate. No change is therefore foreseen.
Secondly, Eumedion and ISS noted the absence of non-financial performance metrics in the STI targets. TomTom has made good progress in reporting on its ESG activities, as described in the Environment, Social and Governance section. In 2022, TomTom will continue assessing its ESG impact and footprint, perform materiality assessments and align its strategy accordingly. The Remuneration Committee and the Supervisory Board will further assess possibilities of including a non-financial ESG target to the short-term incentives performance metrics in 2022.
Public perceptionThe Supervisory Board follows the societal implications of general remuneration trends and perspectives globally and locally. In general, Management Board remuneration at TomTom is not a publicly debated topic.
Shareholder Rights Directive IIThis Remuneration Report aims to meet the reporting requirements defined by article 2:135b of the DCC, implementing the EU Shareholder Rights Directive II (SRD II). One of the key objectives of the SRD II is to provide greater transparency for company stakeholders. Transparency has always been important at TomTom; initiatives like the SRD II and its implementation into Dutch law are welcome.
In accordance with article 2:135a sub 2 of the DCC and article 2:145 sub 2 of the DCC, the Supervisory Board proposes for adoption the Remuneration Policy for TomTom’s Management Board respectively Supervisory Board to the General Meeting of Shareholders once every four-year period, the next time at the 2024 Annual General Meeting (AGM). The decision to adopt the Remuneration Policies require at least 75% of the cast votes in favor. Our Remuneration Policy for the Management Board was approved at our 2020 AGM with 80.18% votes cast in favor. Our Remuneration Policy for the Supervisory Board was approved with 99.94% votes cast in favor.
AGM 2021 Voting Item AGM 2020 Voting Item AGM 2020 Voting Item AGM 2020 Voting Item
Remuneration in the financial
year 2020
Remuneration in the financial
year 2019
Adjustment of the Remuneration
Policy for the Management Board
Adjustment of the Remuneration
Policy for the Supervisory Board
Votes 86,245,711 87,756,952 87,756,952 87,745,938
For
Against
94.00%
6.00%
87.12%
12.88%
80.18%
19.82%
99.94%
0.06%
GOVERNANCE / PAGE 56
REMUNERATION REPORT CONTINUED
This Remuneration Report describes the process which has been followed by the Remuneration Committee in relation to the implementation of the Remuneration Policies over the given financial year, and, if applicable, any proposed revision of the Remuneration Policies.
Every year, the implementation of the Remuneration Policies, through the Remuneration Report, is put forward for an advisory vote to the AGM (in line with article 2:135b sub 2 of DCC). At our 2021 AGM, 94% votes cast in favor for our 2020 Remuneration Report.
Revision and claw back of variable payThe claw back provision as reflected in the Remuneration Policy is in accordance with Dutch law and forms an integral part of Management Board members’ employment. The Supervisory Board can revise the amount of the variable pay to an appropriate amount if payment of the bonus would be unacceptable according to standards of reasonableness and fairness.
In addition, the Supervisory Board is entitled, at its discretion, to recover on behalf of the company any variable pay awarded on the basis of incorrect financial data or other data underlying the bonus or about the circumstances that the bonus was made subject to.
This right of recovery exists irrespective of whether the Management Board member has been responsible for the incorrect financial data or other data, or was aware or should have been aware of this incorrectness. No variable remuneration was clawed-back in 2021.
Change of controlIn case of a change of control, the Supervisory Board may determine that any Long-Term Incentives, granted to a Management Board member, shall be (deemed to be) vested, and exercisable if applicable, immediately prior to and conditional upon such change of control, or during such period after the change of control as the Supervisory Board may specify. Failing exercise in such change of control event, previously granted stock options will lapse.
Severance compensationIn the event that a Management Board member’s employment is terminated by, or on the initiative of, the company, the Management Board member is entitled to a severance payment limited to 50% of one year’s base salary, unless a higher statutory severance compensation applies.
These terms will not apply if the Management Board member’s employment is terminated for any reason as set out in articles 7:677 (1) and 7:678 of the DCC. In such situations, the Management Board member will not be entitled to any severance compensation. A member of the Management Board will not be entitled to severance compensation if employment is terminated by himself, or on his own initiative.
GOVERNANCE / PAGE 57
REMUNERATION REPORT CONTINUED
Achieving smart innovative agility through sound risk management and internal controlRisk management is integral to TomTom’s strategy and to the achievement of our long-term goals. Our success as an organization depends on our ability to develop the right products and identify and exploit the opportunities generated by our business and the markets we are in.
TomTom’s risk management approach is designed to identify and evaluate opportunities and risks as early as possible and to take appropriate measures in order to seize opportunities and limit business losses. The aim is to manage risks that pose a threat to TomTom’s future and to strengthen our ability to create long-term value. Our approach is based on criteria of the Committee of Sponsoring Organizations of the Treadway Commission (COSO).
ESTABLISH A STRONG RISK MANAGEMENT ENVIRONMENT
TomTom aims to establish a strong risk management environment. Our risk management framework is designed to identify and address the strategic risks related to the development of new products and our core markets as well as our operational, financial, legal and compliance risks.
Assurance on the effectiveness of controls is obtained through, among others, management reviews, monitoring dashboards, self-assessments, internal audits and testing of certain aspects of our internal financial control systems.
Our systems are designed to manage, rather than eliminate, the risk that we fail to achieve our business objectives and can provide reasonable, but not absolute, assurance against financial loss or material misstatements in the financial statements. The key features of our systems of Internal Control are:
• Defined lines of accountability and delegation of authority• Comparison reports with analysis on actuals, budgets and forecasts• Assurance that the appropriate infrastructure, controls, policies, procedures, systems
and people are in place throughout the business• Organizational design that supports business objectives and a culture that encourages
open and transparent communication• A Code of Conduct accessible to all staff via the intranet together with whistleblowing
(Open Ears Procedure) facilities
• Financial shared service center with a centralized Enterprise Resource Planning (ERP) environment which allows us to apply a consistent level of control throughout all regions
• Centralized Treasury operations that manage cash balances and exposure to credit default and currency risks through Treasury policies, risk limits and monitoring procedures
Reviews of the internal risk management and control systems were discussed quarterly with the Audit Committee and Supervisory Board and no major failings have been identified. The Management Board concluded that the systems continue to provide reasonable assurance that the financial statements do not contain material misstatements and that no material changes to the control framework were required.
DEFINE RISK APPETITE
Our willingness to assume calculated risks and uncertainties (the risk appetite) differs for each category. Our risk appetite is determined by considering the opportunity in relation to the potential threats to achieving our strategic objectives. The level of the company’s risk appetite gives guidance as to what detailed level TomTom will take measures to control such uncertainties.
The Risk Overview table highlights the appetite and the potential impact on the group’s strategic, financial, legal and compliance and operational objectives if one or more of the main risks were to materialize. This is done by estimating the total impact of an event given that it occurred, with a 90% confidence interval. The likelihood of a risk occurring is also disclosed. The risk severities shown relate to residual risk. This means that the risks are described after taking the risk response into consideration.
ASSESS RISKS AND RISK RESPONSE
Strategic risks and opportunities are analyzed regularly as we review the product roadmap of our core technologies whereby critical developments are monitored continuously over the year. This process is facilitated by our Product Office department. The operational, financial, legal and compliance risks are monitored by our corporate risk management function. The corporate risk management function meets regularly with the Product Office to ensure overall alignment and information sharing.
GOVERNANCE / PAGE 58
RISK MANAGEMENT AND CONTROL
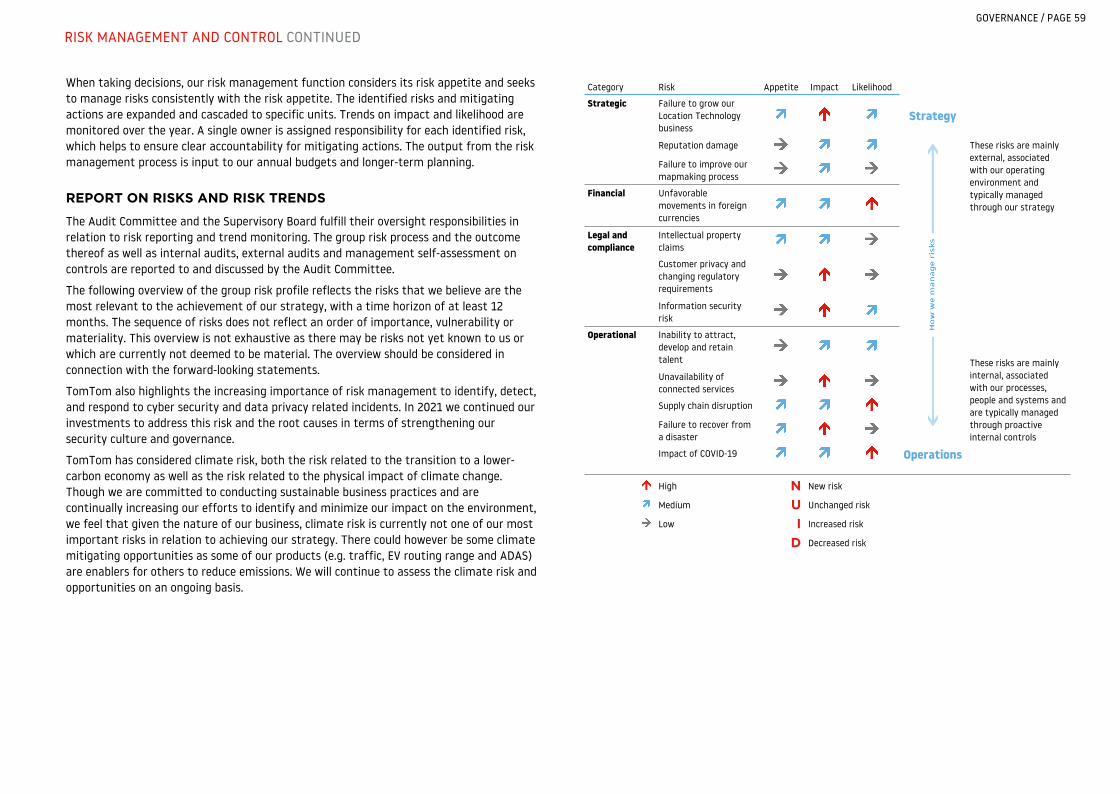
When taking decisions, our risk management function considers its risk appetite and seeks to manage risks consistently with the risk appetite. The identified risks and mitigating actions are expanded and cascaded to specific units. Trends on impact and likelihood are monitored over the year. A single owner is assigned responsibility for each identified risk, which helps to ensure clear accountability for mitigating actions. The output from the risk management process is input to our annual budgets and longer-term planning.
REPORT ON RISKS AND RISK TRENDS
The Audit Committee and the Supervisory Board fulfill their oversight responsibilities in relation to risk reporting and trend monitoring. The group risk process and the outcome thereof as well as internal audits, external audits and management self-assessment on controls are reported to and discussed by the Audit Committee.
The following overview of the group risk profile reflects the risks that we believe are the most relevant to the achievement of our strategy, with a time horizon of at least 12 months. The sequence of risks does not reflect an order of importance, vulnerability or materiality. This overview is not exhaustive as there may be risks not yet known to us or which are currently not deemed to be material. The overview should be considered in connection with the forward-looking statements.
TomTom also highlights the increasing importance of risk management to identify, detect, and respond to cyber security and data privacy related incidents. In 2021 we continued our investments to address this risk and the root causes in terms of strengthening our security culture and governance.
TomTom has considered climate risk, both the risk related to the transition to a lower-carbon economy as well as the risk related to the physical impact of climate change. Though we are committed to conducting sustainable business practices and are continually increasing our efforts to identify and minimize our impact on the environment, we feel that given the nature of our business, climate risk is currently not one of our most important risks in relation to achieving our strategy. There could however be some climate mitigating opportunities as some of our products (e.g. traffic, EV routing range and ADAS) are enablers for others to reduce emissions. We will continue to assess the climate risk and opportunities on an ongoing basis.
Category Risk Appetite Impact Likelihood
Strategic Failure to grow our Location Technology business
Strategy
Reputation damage These risks are mainly external, associated with our operating environment and typically managed through our strategy
Failure to improve our mapmaking process
Financial Unfavorable movements in foreign currencies
Legal and compliance
Intellectual property claims
Customer privacy and changing regulatory requirements
Information security risk
These risks are mainly internal, associated with our processes, people and systems and are typically managed through proactive internal controls
Operational Inability to attract, develop and retain talent
Unavailability of connected services
Supply chain disruption
Failure to recover from a disaster
Impact of COVID-19 Operations
High N New risk
Medium U Unchanged risk
Low I Increased risk
D Decreased risk
GOVERNANCE / PAGE 59
RISK MANAGEMENT AND CONTROL CONTINUED
STRATEGICRisk Trend Description Impact Response
Failure to grow our Location Technology business
I Although demand for vehicle-based as well as personal device Location Technology remains strong, we are in a market with continuously changing market needs and technology developments. We might be unable to pursue new opportunities and may lose market share versus competition. Also, new map and navigation providers are entering the location technology market, which will increase the level of competition we face.
There could be additional operational and technical challenges (successful development of new products and investing in the right technologies) in growing our Location Technology business and generate cash over the longer term in such a rapidly evolving environment. If we are unsuccessful in maintaining and growing a profitable business, our financial condition, operational result and liquidity may be materially adversely affected.
We believe TomTom is well positioned to address the future needs of our customers and to successfully pursue Automotive and Enterprise opportunities. We are focused on cementing our position as a leading location technology specialist. With our technological innovation, we continuously develop new product and service offerings in the area of location based technologies like fleet-based applications, EV services, ISA and a digital cockpit. We believe these and other innovations will allow us to remain competitive.
Reputation damage U All our products and services are brought to market under one brand. This leads to brand concentration risk. Brand value can be severely damaged, even by isolated incidents affecting the reputation of our business or our products and services.
Some of these incidents may be beyond our ability to control and can erode customer confidence in our products or services. Factors that negatively affect our reputation or brand image, such as adverse consumer publicity, not meeting service level agreements, inferior product quality or late delivery of customer commitments, could have a material adverse effect on our financial condition and results of operation.
TomTom has a process in place that reviews each new opportunity and monitors whether we can deliver upon the customers’ expectations. Next, we employ a rigorous quality management process for our products and services before they are launched. Also, internal policies, governance teams and our Code of Conduct are designed to further mitigate the risk of incidents that could result in reputation or brand damage. Lastly, TomTom’s Customer Care department aims to provide quality, responsive customer service and proactively monitors various digital platforms for customer feedback and issues.
Failure to improve our mapmaking process
U The competitive environment requires continuous investment in new technology for creating and updating map databases. All our map content needs to be constantly updated for changes in the environment and we are constantly adding new geographies and attributes to our map database to enable us to meet the needs of existing and new customers, bring out new products and expand into new markets.
If we are unable to innovate sufficiently to compete with other global map providers in terms of quality, costs, coverage and cycle times and to modernize our map creation, maintenance and delivery platforms, our map-based business may be materially adversely affected.
We aim to continuously improve our overall mapmaking process and become smarter and more efficient which is evidenced amongst others by investments in our Content Production Platform as well as partnerships we have established with amongst others our customers to further develop our content base.
FINANCIALRisk Trend Description Impact Response
Unfavorable movements in foreign currencies
U The group operates internationally and conducts business in multiple currencies. Revenue is earned in EUR, USD and other currencies, and does not necessarily match cost of sales and other costs which are largely in EUR, USD and PLN and to a lesser extent in other currencies.Foreign currency exposures on commercial transactions relate mainly to estimated purchases and sales transactions that are denominated in currencies other than our reporting currency (EUR).
Unfavorable foreign currency movements will have a negative impact on our profitability.
We manage foreign currency transaction risk mainly through forward contracts to cover forecasted net exposures. All such transactions are carried out within the guidelines set by our Corporate Treasury Policy, with appropriate risk limits and controls defined. Furthermore, we try to temper any negative foreign currency effect by conscious and calculated pricing of TomTom products and services to combat the negative impact of the exchange rate movement. Note 28 of the consolidated financial statements provides further information on other financial risks.
GOVERNANCE / PAGE 60
RISK MANAGEMENT AND CONTROL CONTINUED
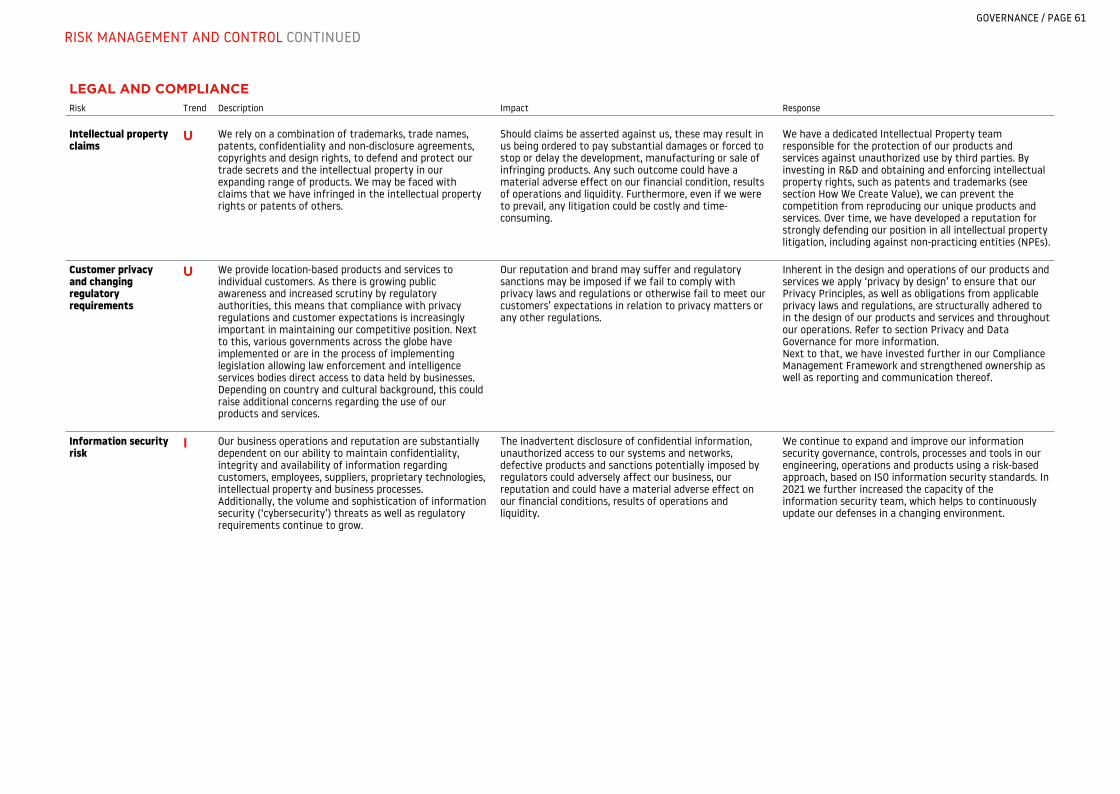
LEGAL AND COMPLIANCERisk Trend Description Impact Response
Intellectual property claims
U We rely on a combination of trademarks, trade names, patents, confidentiality and non-disclosure agreements, copyrights and design rights, to defend and protect our trade secrets and the intellectual property in our expanding range of products. We may be faced with claims that we have infringed in the intellectual property rights or patents of others.
Should claims be asserted against us, these may result in us being ordered to pay substantial damages or forced to stop or delay the development, manufacturing or sale of infringing products. Any such outcome could have a material adverse effect on our financial condition, results of operations and liquidity. Furthermore, even if we were to prevail, any litigation could be costly and time-consuming.
We have a dedicated Intellectual Property team responsible for the protection of our products and services against unauthorized use by third parties. By investing in R&D and obtaining and enforcing intellectual property rights, such as patents and trademarks (see section How We Create Value), we can prevent the competition from reproducing our unique products and services. Over time, we have developed a reputation for strongly defending our position in all intellectual property litigation, including against non-practicing entities (NPEs).
Customer privacy and changing regulatory requirements
U We provide location-based products and services to individual customers. As there is growing public awareness and increased scrutiny by regulatory authorities, this means that compliance with privacy regulations and customer expectations is increasingly important in maintaining our competitive position. Next to this, various governments across the globe have implemented or are in the process of implementing legislation allowing law enforcement and intelligence services bodies direct access to data held by businesses. Depending on country and cultural background, this could raise additional concerns regarding the use of our products and services.
Our reputation and brand may suffer and regulatory sanctions may be imposed if we fail to comply with privacy laws and regulations or otherwise fail to meet our customers’ expectations in relation to privacy matters or any other regulations.
Inherent in the design and operations of our products and services we apply ‘privacy by design’ to ensure that our Privacy Principles, as well as obligations from applicable privacy laws and regulations, are structurally adhered to in the design of our products and services and throughout our operations. Refer to section Privacy and Data Governance for more information.Next to that, we have invested further in our Compliance Management Framework and strengthened ownership as well as reporting and communication thereof.
Information security risk
I Our business operations and reputation are substantially dependent on our ability to maintain confidentiality, integrity and availability of information regarding customers, employees, suppliers, proprietary technologies, intellectual property and business processes.Additionally, the volume and sophistication of information security (‘cybersecurity’) threats as well as regulatory requirements continue to grow.
The inadvertent disclosure of confidential information, unauthorized access to our systems and networks, defective products and sanctions potentially imposed by regulators could adversely affect our business, our reputation and could have a material adverse effect on our financial conditions, results of operations and liquidity.
We continue to expand and improve our information security governance, controls, processes and tools in our engineering, operations and products using a risk-based approach, based on ISO information security standards. In 2021 we further increased the capacity of the information security team, which helps to continuously update our defenses in a changing environment.
GOVERNANCE / PAGE 61
RISK MANAGEMENT AND CONTROL CONTINUED
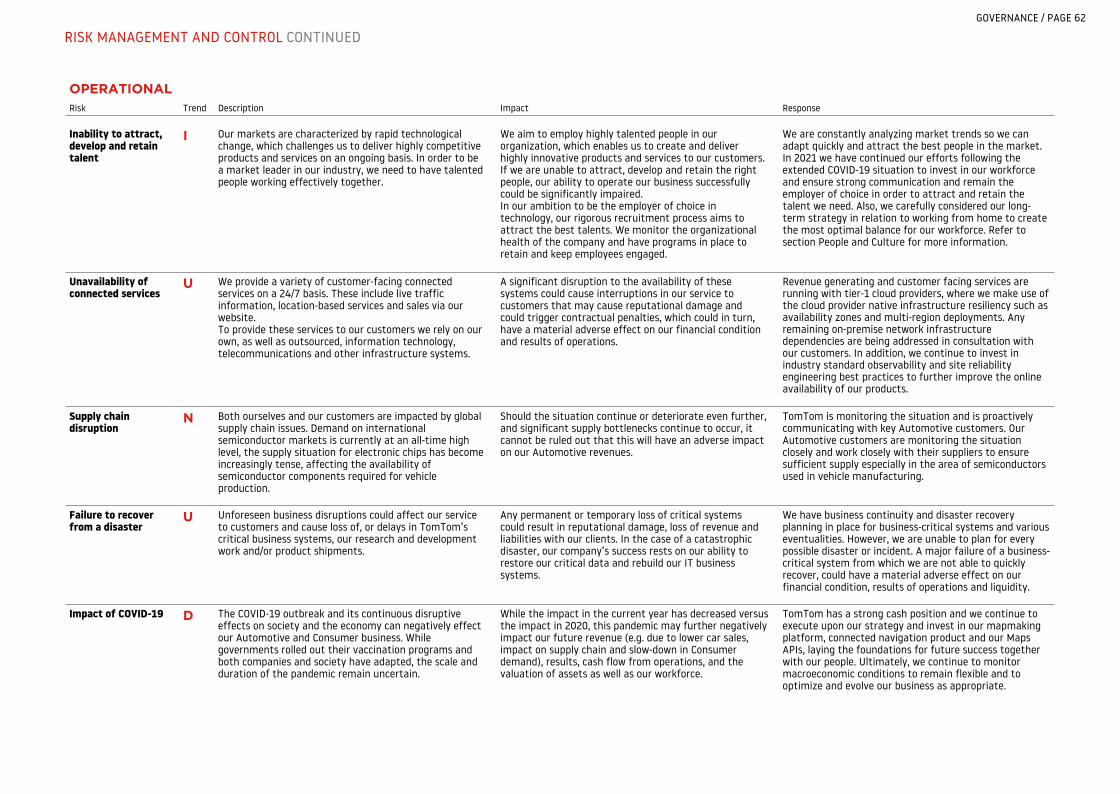
OPERATIONALRisk Trend Description Impact Response
Inability to attract, develop and retain talent
I Our markets are characterized by rapid technological change, which challenges us to deliver highly competitive products and services on an ongoing basis. In order to be a market leader in our industry, we need to have talented people working effectively together.
We aim to employ highly talented people in our organization, which enables us to create and deliver highly innovative products and services to our customers. If we are unable to attract, develop and retain the right people, our ability to operate our business successfully could be significantly impaired.In our ambition to be the employer of choice in technology, our rigorous recruitment process aims to attract the best talents. We monitor the organizational health of the company and have programs in place to retain and keep employees engaged.
We are constantly analyzing market trends so we can adapt quickly and attract the best people in the market. In 2021 we have continued our efforts following the extended COVID-19 situation to invest in our workforce and ensure strong communication and remain the employer of choice in order to attract and retain the talent we need. Also, we carefully considered our long-term strategy in relation to working from home to create the most optimal balance for our workforce. Refer to section People and Culture for more information.
Unavailability of connected services
U We provide a variety of customer-facing connected services on a 24/7 basis. These include live traffic information, location-based services and sales via our website.To provide these services to our customers we rely on our own, as well as outsourced, information technology, telecommunications and other infrastructure systems.
A significant disruption to the availability of these systems could cause interruptions in our service to customers that may cause reputational damage and could trigger contractual penalties, which could in turn, have a material adverse effect on our financial condition and results of operations.
Revenue generating and customer facing services are running with tier-1 cloud providers, where we make use of the cloud provider native infrastructure resiliency such as availability zones and multi-region deployments. Any remaining on-premise network infrastructure dependencies are being addressed in consultation with our customers. In addition, we continue to invest in industry standard observability and site reliability engineering best practices to further improve the online availability of our products.
Supply chain disruption
N Both ourselves and our customers are impacted by global supply chain issues. Demand on international semiconductor markets is currently at an all-time high level, the supply situation for electronic chips has become increasingly tense, affecting the availability of semiconductor components required for vehicle production.
Should the situation continue or deteriorate even further, and significant supply bottlenecks continue to occur, it cannot be ruled out that this will have an adverse impact on our Automotive revenues.
TomTom is monitoring the situation and is proactively communicating with key Automotive customers. Our Automotive customers are monitoring the situation closely and work closely with their suppliers to ensure sufficient supply especially in the area of semiconductors used in vehicle manufacturing.
Failure to recover from a disaster
U Unforeseen business disruptions could affect our service to customers and cause loss of, or delays in TomTom’s critical business systems, our research and development work and/or product shipments.
Any permanent or temporary loss of critical systems could result in reputational damage, loss of revenue and liabilities with our clients. In the case of a catastrophic disaster, our company’s success rests on our ability to restore our critical data and rebuild our IT business systems.
We have business continuity and disaster recovery planning in place for business-critical systems and various eventualities. However, we are unable to plan for every possible disaster or incident. A major failure of a business-critical system from which we are not able to quickly recover, could have a material adverse effect on our financial condition, results of operations and liquidity.
Impact of COVID-19 D The COVID-19 outbreak and its continuous disruptive effects on society and the economy can negatively effect our Automotive and Consumer business. While governments rolled out their vaccination programs and both companies and society have adapted, the scale and duration of the pandemic remain uncertain.
While the impact in the current year has decreased versus the impact in 2020, this pandemic may further negatively impact our future revenue (e.g. due to lower car sales, impact on supply chain and slow-down in Consumer demand), results, cash flow from operations, and the valuation of assets as well as our workforce.
TomTom has a strong cash position and we continue to execute upon our strategy and invest in our mapmaking platform, connected navigation product and our Maps APIs, laying the foundations for future success together with our people. Ultimately, we continue to monitor macroeconomic conditions to remain flexible and to optimize and evolve our business as appropriate.
GOVERNANCE / PAGE 62
RISK MANAGEMENT AND CONTROL CONTINUED
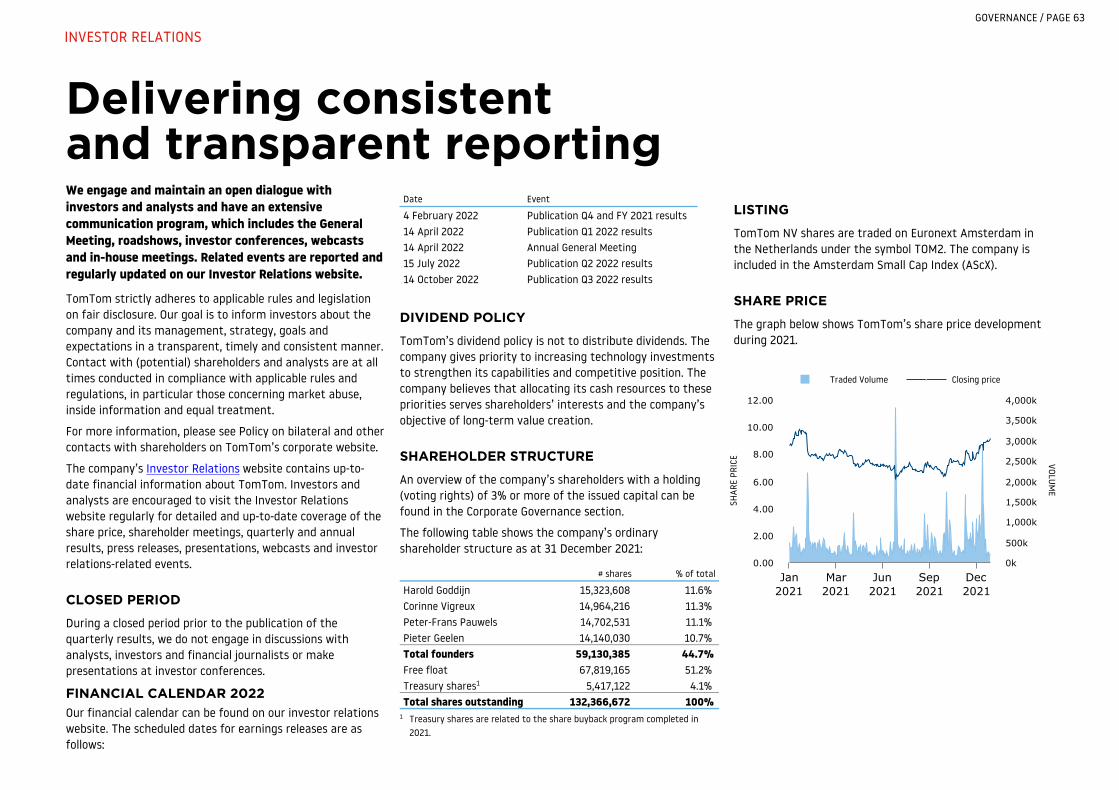
Delivering consistent and transparent reportingWe engage and maintain an open dialogue with investors and analysts and have an extensive communication program, which includes the General Meeting, roadshows, investor conferences, webcasts and in-house meetings. Related events are reported and regularly updated on our Investor Relations website.
TomTom strictly adheres to applicable rules and legislation on fair disclosure. Our goal is to inform investors about the company and its management, strategy, goals and expectations in a transparent, timely and consistent manner. Contact with (potential) shareholders and analysts are at all times conducted in compliance with applicable rules and regulations, in particular those concerning market abuse, inside information and equal treatment.
For more information, please see Policy on bilateral and other contacts with shareholders on TomTom’s corporate website.
The company’s Investor Relations website contains up-to-date financial information about TomTom. Investors and analysts are encouraged to visit the Investor Relations website regularly for detailed and up-to-date coverage of the share price, shareholder meetings, quarterly and annual results, press releases, presentations, webcasts and investor relations-related events.
CLOSED PERIOD
During a closed period prior to the publication of the quarterly results, we do not engage in discussions with analysts, investors and financial journalists or make presentations at investor conferences.
FINANCIAL CALENDAR 2022Our financial calendar can be found on our investor relations website. The scheduled dates for earnings releases are as follows:
Date Event
4 February 2022 Publication Q4 and FY 2021 results14 April 2022 Publication Q1 2022 results14 April 2022 Annual General Meeting15 July 2022 Publication Q2 2022 results14 October 2022 Publication Q3 2022 results
DIVIDEND POLICY
TomTom’s dividend policy is not to distribute dividends. The company gives priority to increasing technology investments to strengthen its capabilities and competitive position. The company believes that allocating its cash resources to these priorities serves shareholders’ interests and the company’s objective of long-term value creation.
SHAREHOLDER STRUCTURE
An overview of the company’s shareholders with a holding (voting rights) of 3% or more of the issued capital can be found in the Corporate Governance section.
The following table shows the company’s ordinary shareholder structure as at 31 December 2021:
# shares % of total
Harold Goddijn 15,323,608 11.6% Corinne Vigreux 14,964,216 11.3% Peter-Frans Pauwels 14,702,531 11.1% Pieter Geelen 14,140,030 10.7% Total founders 59,130,385 44.7% Free float 67,819,165 51.2% Treasury shares1 5,417,122 4.1% Total shares outstanding 132,366,672 100%
1 Treasury shares are related to the share buyback program completed in 2021.
LISTING
TomTom NV shares are traded on Euronext Amsterdam in the Netherlands under the symbol TOM2. The company is included in the Amsterdam Small Cap Index (AScX).
SHARE PRICE
The graph below shows TomTom’s share price development during 2021.
SHAR
E PR
ICE VOLU
ME
Traded Volume Closing price
Jan2021
Mar2021
Jun2021
Sep2021
Dec2021
0.00
2.00
4.00
6.00
8.00
10.00
12.00
0k
500k
1,000k
1,500k
2,000k
2,500k
3,000k
3,500k
4,000k
GOVERNANCE / PAGE 63
INVESTOR RELATIONS
Management Board statementsThe Management Board report (consisting of pages 3 up to and including 35, and page 58 up to and including 65), and such parts of the financial statements as referred to in the Management Board report, comprise the ‘Bestuursverslag’ within the meaning of article 2:391 of the DCC.
IN CONTROL AND RESPONSIBILITY STATEMENT
The Management Board states, in accordance with best practice provision 1.4.3 of the Code, that:
• the Management Board report provides sufficient insight into any important deficiencies in the effectiveness of the internal risk management and control systems that may have been detected during the 2021 financial year and no major failings have been detected;
• the risk management and control systems provide a reasonable assurance that the 2021 financial statements do not contain any errors of material importance. Details are set out in the section Risk management and control;
• based on TomTom’s current state of affairs, it is justified that the financial reporting is prepared on a going concern basis. This is based upon the strong cash position and the expected medium and long term free cash flow generation of the company and the risks facing the company. Commentary on the company’s cash flow, liquidity and financial position is set out in the Financial Review. The financial risk management is set out in note 27 of our consolidated financial statements; and
• the Management Board report discloses all material risks and uncertainties that are relevant regarding the expectation as to the continuity of TomTom for the 12-month period after the date of issue of this Management Board report.
The Risk management and control section of the Management Board report provides a clear substantiation of the above mentioned statement.
With reference to section 5:25c sub 2c of the Financial Markets Supervision Act, the Management Board states that, to the best of its knowledge:
• The annual financial statements give a true and fair view of the assets, liabilities, financial position and loss of the company and the undertakings included in the consolidation taken as a whole.
• The Management Board report provides a fair view of the development and performance of the business and the position of the company and the undertakings included in the consolidation taken as a whole, together with a description of the principal risks and uncertainties that the company faces.
CORPORATE GOVERNANCE STATEMENT
The information required to be included in this Corporate Governance Statement as described in articles 3, 3a and 3b of the Dutch Decree on the contents of Directors’ Report (the Decree) are incorporated in the Management Board Report and the Supervisory Board Report sections.
The main characteristics of the company’s internal risk management measures and control systems connected to its financial reporting process, as required by article 3a sub a of the Decree, are described in the In Control and Responsibility Statement.
OUR COMPLIANCE WITH THE CODE
TomTom complies with all the relevant best practice provisions of the Code, with the exception of best practice provisions 3.1.2 (v) and 4.3.3. The nature of and reasons for these deviations are explained below.
Best Practice Provision 3.1.2 (v)Best practice provision 3.1.2 (v) provides that the variable remuneration component shall be linked to measurable performance criteria determined in advance, which shall be predominantly long-term in character.
TomTom deviates from best practice provision 3.1.2 (v) to the extent that it does not link its Long-Term Incentive to predefined performance criteria. All RSUs granted under the Management Board Restricted Stock Unit Plan shall be granted conditional to continued employment of the Management Board members only. These grants have a vesting period of three years, with a subsequent two-year shareholding requirement. In addition, share ownership requirements has been set to encourage future shareholding for all Management Board members. The Supervisory Board reserves the right to decide not to award RSUs in a given year in case of exceptional market or business circumstances. The reason for this deviation is that it has proven difficult to set long-term performance targets in our rapidly evolving, dynamic market environment.
Best Practice Provision 4.3.3Best practice provision 4.3.3 provides that the General Meeting may pass a resolution to cancel the binding nature of a nomination for the appointment of a member of the Management Board or the Supervisory Board and/or a resolution to dismiss a member of the Management Board or of the Supervisory Board by an absolute majority of the votes cast. It may be provided that this majority should represent a given proportion of the issued capital, the proportion of which may not exceed one-third.
Our Articles of Association provide that a binding nomination for the appointment of Management Board or Supervisory Board members may only be set aside by a resolution of the General Meeting passed with a two-thirds majority representing more than 50% of its issued share capital. The same provision applies to any resolution to dismiss a member of the Management Board or of the Supervisory Board.
The reason for this deviation is that the company believes that maintaining continuity in its Management Board and Supervisory Board is critical for delivering long-term value creation.
GOVERNANCE / PAGE 64
MANAGEMENT BOARD STATEMENTS

The company would like to protect its stakeholders against a sudden change in management by maintaining the qualified majority and voting quorum requirement, which is consistent with Dutch law.
INFORMATION PURSUANT TO THE DECREE ARTICLE 10 TAKEOVER DIRECTIVE
The Management Board states that all information, which must be disclosed pursuant to the Decree Article 10 Takeover Directive (‘Besluit artikel 10 overnamerichtlijn’), is included in the Corporate Governance section, the Supervisory Board report and the notes referred to herein, to the extent that it is applicable to TomTom.
NON-FINANCIAL STATEMENT
Directive 2014/95/EU on the disclosure of non-financial information requires companies to publish a non-financial statement. The relevant provision has been implemented into Dutch law through the Decree disclosure on non-financial information (‘Besluit bekendmaking niet-financiële informatie’). The information regarding environmental, anti-corruption and bribery matters and respect for human rights, as required by this Decree, is incorporated in the Environment, Social and Governance section. The information regarding social and employee matters, as required by this Decree, is incorporated in the People and Culture section.
Amsterdam, 4 February 2022
The Management Board
HAROLD GODDIJNChief Executive OfficerTACO TITULAERChief Financial OfficerALAIN DE TAEYEMember of the Management Board
GOVERNANCE / PAGE 65
MANAGEMENT BOARD STATEMENTS CONTINUED
FINANCIALSEncouragingly, the way weengage with our customersis evolving from a traditionalsupplier relationshipto a partner approach
Consolidated financial statements / 67Company financial statements / 103Other information / 107
TOMTOM NV / ANNUAL REPORT 2021 / PAGE 66
FINANCIALSConsolidated financial statements
Consolidated statement of income / 68Consolidated statement of comprehensive income / 68Consolidated balance sheet / 69Consolidated statement of cash flows / 69Consolidated statement of changes in equity / 70Notes to the consolidated financial statements / 71
FINANCIALS / CONSOLIDATED FINANCIAL STATEMENTS / PAGE 67
The notes on pages 71 to 102 are an integral part of these consolidated financial statements.
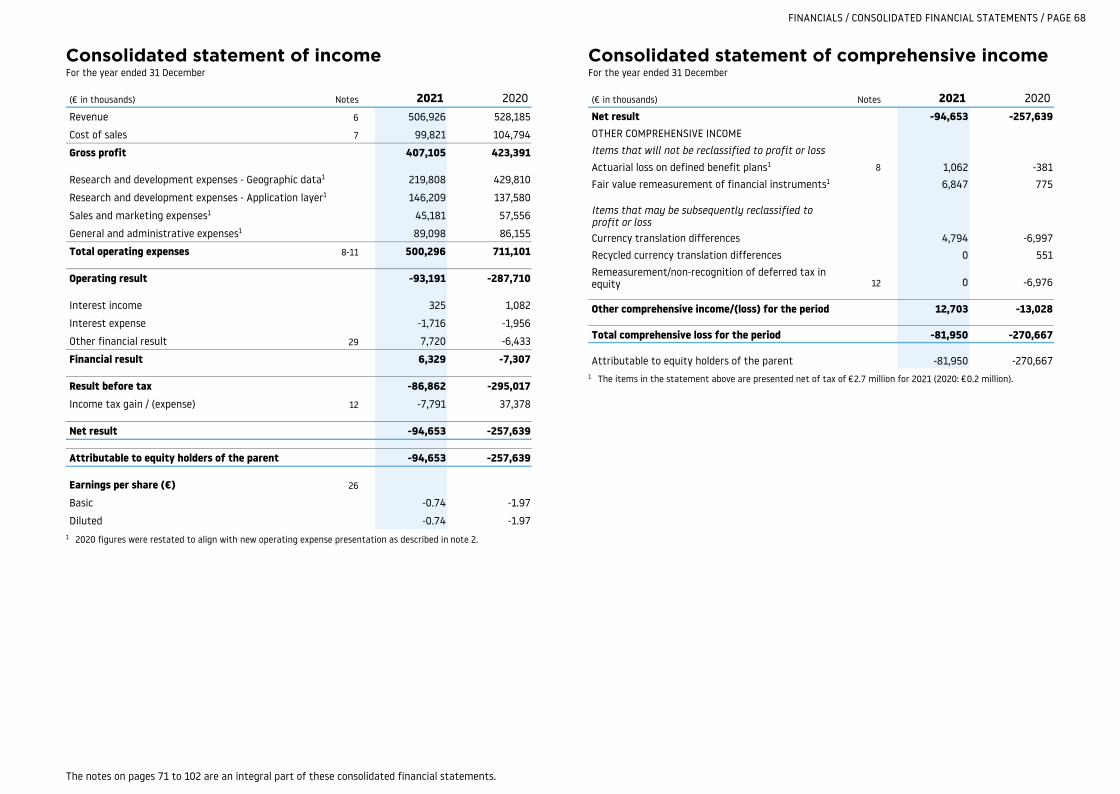
Consolidated statement of incomeFor the year ended 31 December
(€ in thousands) Notes 2021 2020Revenue 6 506,926 528,185
Cost of sales 7 99,821 104,794
Gross profit 407,105 423,391
Research and development expenses - Geographic data1 219,808 429,810
Research and development expenses - Application layer1 146,209 137,580
Sales and marketing expenses1 45,181 57,556
General and administrative expenses1 89,098 86,155
Total operating expenses 8-11 500,296 711,101
Operating result -93,191 -287,710
Interest income 325 1,082
Interest expense -1,716 -1,956
Other financial result 29 7,720 -6,433
Financial result 6,329 -7,307
Result before tax -86,862 -295,017 Income tax gain / (expense) 12 -7,791 37,378
Net result -94,653 -257,639
Attributable to equity holders of the parent -94,653 -257,639
Earnings per share (€) 26
Basic -0.74 -1.97
Diluted -0.74 -1.97 1 2020 figures were restated to align with new operating expense presentation as described in note 2.
Consolidated statement of comprehensive incomeFor the year ended 31 December
(€ in thousands) Notes 2021 2020Net result -94,653 -257,639 OTHER COMPREHENSIVE INCOMEItems that will not be reclassified to profit or lossActuarial loss on defined benefit plans1 8 1,062 -381 Fair value remeasurement of financial instruments1 6,847 775
Items that may be subsequently reclassified to profit or lossCurrency translation differences 4,794 -6,997 Recycled currency translation differences 0 551 Remeasurement/non-recognition of deferred tax in equity 12 0 -6,976
Other comprehensive income/(loss) for the period 12,703 -13,028
Total comprehensive loss for the period -81,950 -270,667
Attributable to equity holders of the parent -81,950 -270,667 1 The items in the statement above are presented net of tax of €2.7 million for 2021 (2020: €0.2 million).
FINANCIALS / CONSOLIDATED FINANCIAL STATEMENTS / PAGE 68
The notes on pages 71 to 102 are an integral part of these consolidated financial statements.
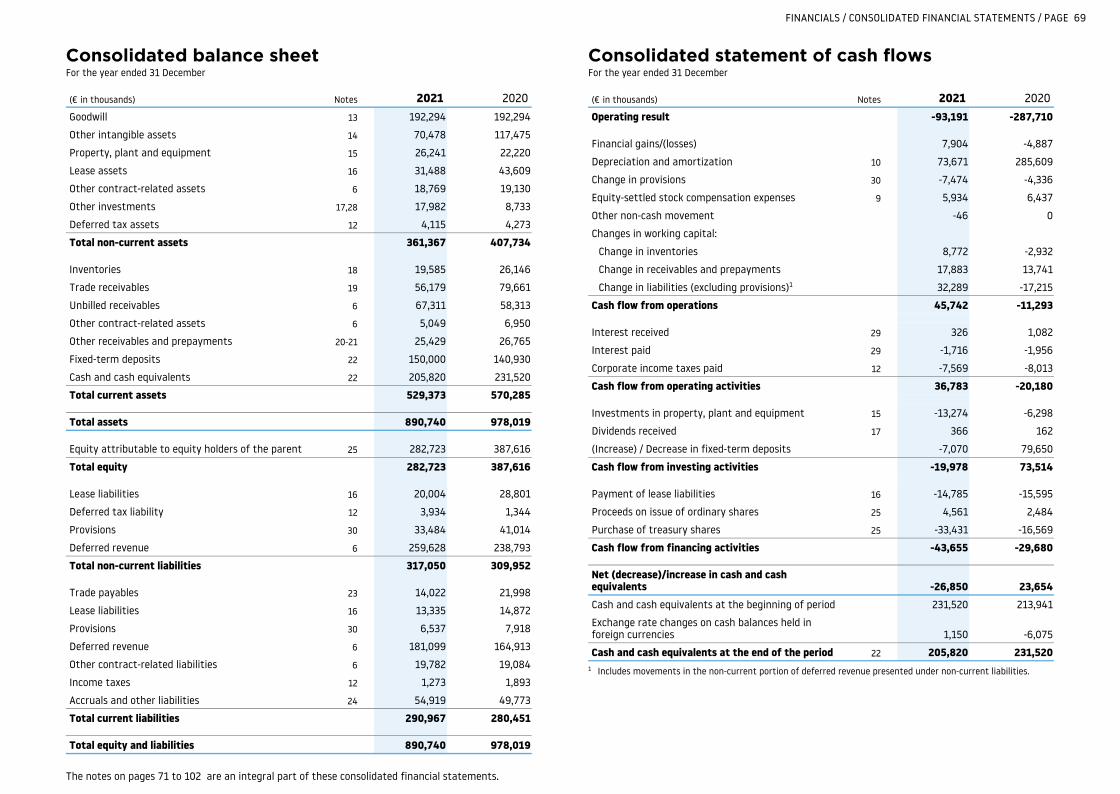
Consolidated balance sheetFor the year ended 31 December
(€ in thousands) Notes 2021 2020Goodwill 13 192,294 192,294
Other intangible assets 14 70,478 117,475
Property, plant and equipment 15 26,241 22,220
Lease assets 16 31,488 43,609
Other contract-related assets 6 18,769 19,130
Other investments 17,28 17,982 8,733
Deferred tax assets 12 4,115 4,273
Total non-current assets 361,367 407,734
Inventories 18 19,585 26,146
Trade receivables 19 56,179 79,661
Unbilled receivables 6 67,311 58,313
Other contract-related assets 6 5,049 6,950
Other receivables and prepayments 20-21 25,429 26,765
Fixed-term deposits 22 150,000 140,930
Cash and cash equivalents 22 205,820 231,520
Total current assets 529,373 570,285
Total assets 890,740 978,019
Equity attributable to equity holders of the parent 25 282,723 387,616
Total equity 282,723 387,616
Lease liabilities 16 20,004 28,801
Deferred tax liability 12 3,934 1,344
Provisions 30 33,484 41,014
Deferred revenue 6 259,628 238,793
Total non-current liabilities 317,050 309,952
Trade payables 23 14,022 21,998
Lease liabilities 16 13,335 14,872
Provisions 30 6,537 7,918
Deferred revenue 6 181,099 164,913
Other contract-related liabilities 6 19,782 19,084
Income taxes 12 1,273 1,893
Accruals and other liabilities 24 54,919 49,773
Total current liabilities 290,967 280,451
Total equity and liabilities 890,740 978,019
Consolidated statement of cash flowsFor the year ended 31 December
(€ in thousands) Notes 2021 2020Operating result -93,191 -287,710
Financial gains/(losses) 7,904 -4,887
Depreciation and amortization 10 73,671 285,609
Change in provisions 30 -7,474 -4,336
Equity-settled stock compensation expenses 9 5,934 6,437
Other non-cash movement -46 0
Changes in working capital:
Change in inventories 8,772 -2,932
Change in receivables and prepayments 17,883 13,741
Change in liabilities (excluding provisions)1 32,289 -17,215
Cash flow from operations 45,742 -11,293
Interest received 29 326 1,082
Interest paid 29 -1,716 -1,956
Corporate income taxes paid 12 -7,569 -8,013
Cash flow from operating activities 36,783 -20,180
Investments in property, plant and equipment 15 -13,274 -6,298
Dividends received 17 366 162
(Increase) / Decrease in fixed-term deposits -7,070 79,650
Cash flow from investing activities -19,978 73,514
Payment of lease liabilities 16 -14,785 -15,595
Proceeds on issue of ordinary shares 25 4,561 2,484
Purchase of treasury shares 25 -33,431 -16,569
Cash flow from financing activities -43,655 -29,680
Net (decrease)/increase in cash and cash equivalents -26,850 23,654 Cash and cash equivalents at the beginning of period 231,520 213,941
Exchange rate changes on cash balances held in foreign currencies 1,150 -6,075
Cash and cash equivalents at the end of the period 22 205,820 231,520 1 Includes movements in the non-current portion of deferred revenue presented under non-current liabilities.
FINANCIALS / CONSOLIDATED FINANCIAL STATEMENTS / PAGE 69
The notes on pages 71 to 102 are an integral part of these consolidated financial statements.

Consolidated statement of changes in equityFor the year ended 31 December
(€ in thousands) Notes Share capital Share premium Treasury shares Other reserves1 Retained earnings Shareholders’ equity
Balance as at 1 January 2020 26,473 338,124 -7,438 188,508 120,265 665,932
COMPREHENSIVE INCOMEResult for the year 0 0 0 0 -257,639 -257,639
OTHER COMPREHENSIVE INCOMECurrency translation differences2 0 0 0 -6,997 0 -6,997 Actuarial loss on defined benefit obligations 8 0 0 0 0 -381 -381 Fair value remeasurement of financial instruments 17 0 0 0 775 0 775 Recycled currency translation differences 0 0 0 551 0 551 Remeasurement of deferred tax in equity 12 0 0 0 0 -6,976 -6,976 Total other comprehensive income 0 0 0 -5,671 -7,357 -13,028
Total comprehensive income 0 0 0 -5,671 -264,996 -270,667
TRANSACTIONS WITH OWNERSStock compensation related movements 9 0 0 9,695 1,375 -2,150 8,920 Repurchase of shares 25 0 0 -16,569 0 0 -16,569
OTHER MOVEMENTSTransfers between reserves 0 0 0 -56,614 56,614 0 Balance as at 31 December 2020 26,473 338,124 -14,312 127,598 -90,267 387,616
COMPREHENSIVE INCOMEResult for the year 0 0 0 0 -94,653 -94,653 Other comprehensive incomeCurrency translation differences2 0 0 0 4,794 0 4,794 Actuarial gain on defined benefit obligations 8 0 0 0 0 1,062 1,062 Fair value remeasurement of financial instruments 17 0 0 0 6,847 0 6,847 Total other comprehensive income 0 0 0 11,641 1,062 12,703
Total comprehensive income 0 0 0 11,641 -93,591 -81,950
TRANSACTIONS WITH OWNERSStock compensation related movements 9 0 0 6,997 2,456 1,035 10,488 Repurchase of shares 25 0 0 -33,431 0 0 -33,431
OTHER MOVEMENTSTransfers between reserves 0 0 0 -42,523 42,523 0 Balance as at 31 December 2021 26,473 338,124 -40,746 99,172 -140,300 282,723
1 Other reserves include Legal reserve, Currency translation reserve and the Stock compensation reserve.2 Currency translation differences arise on the translation of foreign currencies relating to foreign operations.
FINANCIALS / CONSOLIDATED FINANCIAL STATEMENTS / PAGE 70
The notes on pages 71 to 102 are an integral part of these consolidated financial statements.
FINANCIALSConsolidated financial statements
The notes are grouped into six sections. The notes contain the relevant financial information as well as a description of accounting policy applied for the topic of the individual notes.
NOTES TO THE CONSOLIDATED FINANCIAL STATEMENTS
Section 1 Section 3 Section 5General information and basis of reporting Non-current assets and investments Financing, financial risk management
and financial instruments1 General 72 13 Goodwill 87 25 Shareholders’ equity 952 Basis of preparation 72 14 Other intangible assets 88 26 Earnings per share 963 Accounting estimates 73 15 Property, plant and equipment 90 27 Financial risk management 964 COVID-19 considerations and 16 Lease assets and lease liabilities 90 28 Financial instruments 98
semiconductor chip shortage 74 17 Other investments 92 29 Financial result 99
Section 2 Section 4 Section 6Results of the year Working capital Other disclosures
5 Segment reporting 75 18 Inventories 93 30 Provisions 1006 Revenue from contracts with 19 Trade receivables 93 31 Commitments, contingent assets
customers 76 20 Other receivables and prepayments 93 and liabilities 1017 Cost of sales 79 21 Other financial assets and liabilities 93 32 Related party transactions 1018 Personnel expenses 79 22 Cash and cash equivalents and
fixed term deposits33 Auditor’s remuneration 102
9 Stock compensation 81 94 34 Subsequent events 10210 Depreciation and amortization 83 23 Trade payables 9411 Government grants 83 24 Accruals and other liabilities 9412 Income tax 83
TOMTOM NV / ANNUAL REPORT 2021 / PAGE 71
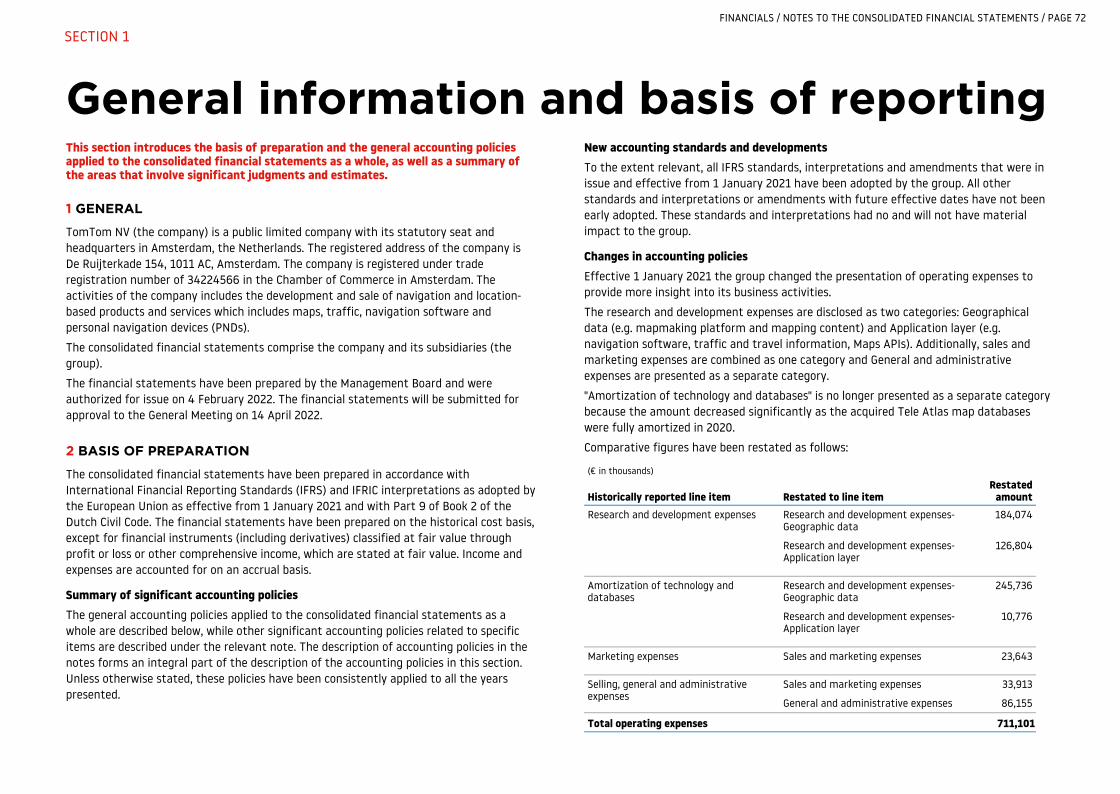
General information and basis of reportingThis section introduces the basis of preparation and the general accounting policies applied to the consolidated financial statements as a whole, as well as a summary of the areas that involve significant judgments and estimates.
1 GENERAL
TomTom NV (the company) is a public limited company with its statutory seat and headquarters in Amsterdam, the Netherlands. The registered address of the company is De Ruijterkade 154, 1011 AC, Amsterdam. The company is registered under trade registration number of 34224566 in the Chamber of Commerce in Amsterdam. The activities of the company includes the development and sale of navigation and location-based products and services which includes maps, traffic, navigation software and personal navigation devices (PNDs).
The consolidated financial statements comprise the company and its subsidiaries (the group).
The financial statements have been prepared by the Management Board and were authorized for issue on 4 February 2022. The financial statements will be submitted for approval to the General Meeting on 14 April 2022.
2 BASIS OF PREPARATION
The consolidated financial statements have been prepared in accordance with International Financial Reporting Standards (IFRS) and IFRIC interpretations as adopted by the European Union as effective from 1 January 2021 and with Part 9 of Book 2 of the Dutch Civil Code. The financial statements have been prepared on the historical cost basis, except for financial instruments (including derivatives) classified at fair value through profit or loss or other comprehensive income, which are stated at fair value. Income and expenses are accounted for on an accrual basis.
Summary of significant accounting policiesThe general accounting policies applied to the consolidated financial statements as a whole are described below, while other significant accounting policies related to specific items are described under the relevant note. The description of accounting policies in the notes forms an integral part of the description of the accounting policies in this section. Unless otherwise stated, these policies have been consistently applied to all the years presented.
New accounting standards and developmentsTo the extent relevant, all IFRS standards, interpretations and amendments that were in issue and effective from 1 January 2021 have been adopted by the group. All other standards and interpretations or amendments with future effective dates have not been early adopted. These standards and interpretations had no and will not have material impact to the group.
Changes in accounting policiesEffective 1 January 2021 the group changed the presentation of operating expenses to provide more insight into its business activities.
The research and development expenses are disclosed as two categories: Geographical data (e.g. mapmaking platform and mapping content) and Application layer (e.g. navigation software, traffic and travel information, Maps APIs). Additionally, sales and marketing expenses are combined as one category and General and administrative expenses are presented as a separate category.
"Amortization of technology and databases" is no longer presented as a separate category because the amount decreased significantly as the acquired Tele Atlas map databases were fully amortized in 2020.
Comparative figures have been restated as follows:
(€ in thousands)
Historically reported line item Restated to line itemRestated
amountResearch and development expenses Research and development expenses-
Geographic data184,074
Research and development expenses- Application layer
126,804
Amortization of technology and databases
Research and development expenses- Geographic data
245,736
Research and development expenses- Application layer
10,776
Marketing expenses Sales and marketing expenses 23,643
Selling, general and administrative expenses
Sales and marketing expenses 33,913
General and administrative expenses 86,155
Total operating expenses 711,101
FINANCIALS / NOTES TO THE CONSOLIDATED FINANCIAL STATEMENTS / PAGE 72
SECTION 1
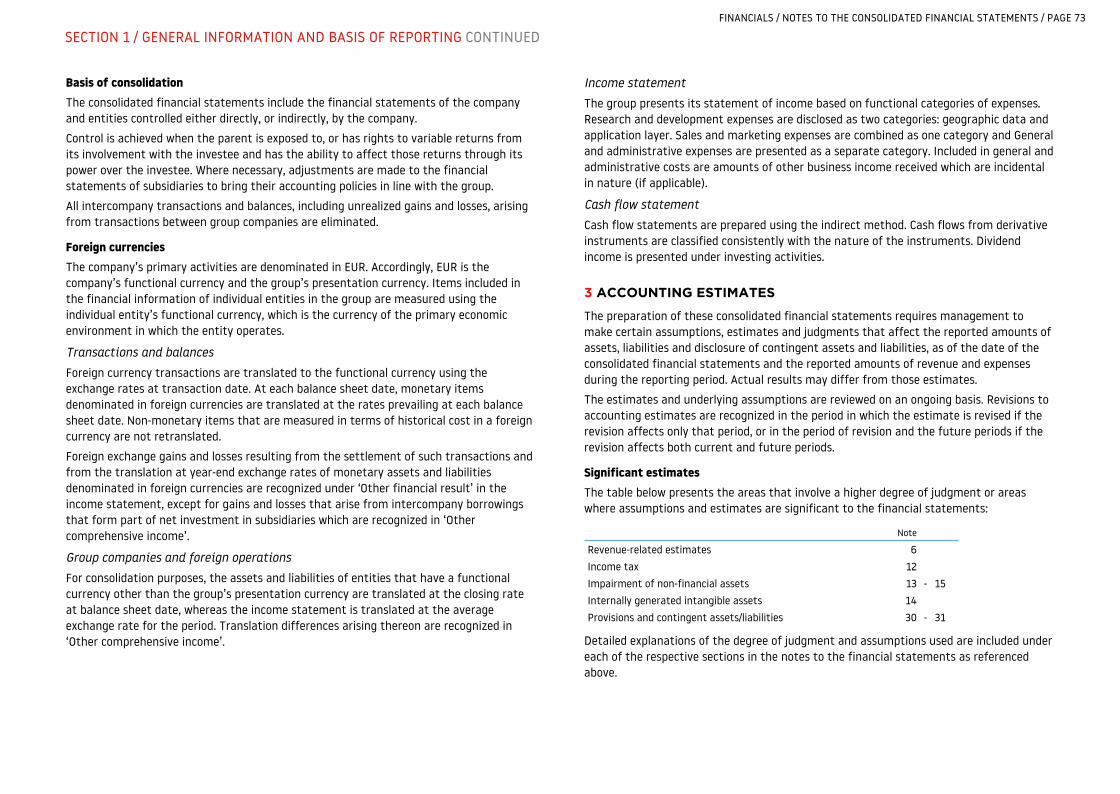
Basis of consolidationThe consolidated financial statements include the financial statements of the company and entities controlled either directly, or indirectly, by the company.
Control is achieved when the parent is exposed to, or has rights to variable returns from its involvement with the investee and has the ability to affect those returns through its power over the investee. Where necessary, adjustments are made to the financial statements of subsidiaries to bring their accounting policies in line with the group.
All intercompany transactions and balances, including unrealized gains and losses, arising from transactions between group companies are eliminated.
Foreign currenciesThe company’s primary activities are denominated in EUR. Accordingly, EUR is the company’s functional currency and the group’s presentation currency. Items included in the financial information of individual entities in the group are measured using the individual entity’s functional currency, which is the currency of the primary economic environment in which the entity operates.
Transactions and balances
Foreign currency transactions are translated to the functional currency using the exchange rates at transaction date. At each balance sheet date, monetary items denominated in foreign currencies are translated at the rates prevailing at each balance sheet date. Non-monetary items that are measured in terms of historical cost in a foreign currency are not retranslated.
Foreign exchange gains and losses resulting from the settlement of such transactions and from the translation at year-end exchange rates of monetary assets and liabilities denominated in foreign currencies are recognized under ‘Other financial result’ in the income statement, except for gains and losses that arise from intercompany borrowings that form part of net investment in subsidiaries which are recognized in ‘Other comprehensive income’.
Group companies and foreign operations
For consolidation purposes, the assets and liabilities of entities that have a functional currency other than the group’s presentation currency are translated at the closing rate at balance sheet date, whereas the income statement is translated at the average exchange rate for the period. Translation differences arising thereon are recognized in ‘Other comprehensive income’.
Income statement
The group presents its statement of income based on functional categories of expenses. Research and development expenses are disclosed as two categories: geographic data and application layer. Sales and marketing expenses are combined as one category and General and administrative expenses are presented as a separate category. Included in general and administrative costs are amounts of other business income received which are incidental in nature (if applicable).
Cash flow statement
Cash flow statements are prepared using the indirect method. Cash flows from derivative instruments are classified consistently with the nature of the instruments. Dividend income is presented under investing activities.
3 ACCOUNTING ESTIMATES
The preparation of these consolidated financial statements requires management to make certain assumptions, estimates and judgments that affect the reported amounts of assets, liabilities and disclosure of contingent assets and liabilities, as of the date of the consolidated financial statements and the reported amounts of revenue and expenses during the reporting period. Actual results may differ from those estimates.
The estimates and underlying assumptions are reviewed on an ongoing basis. Revisions to accounting estimates are recognized in the period in which the estimate is revised if the revision affects only that period, or in the period of revision and the future periods if the revision affects both current and future periods.
Significant estimatesThe table below presents the areas that involve a higher degree of judgment or areas where assumptions and estimates are significant to the financial statements:
Revenue-related estimates 6Income tax 12Impairment of non-financial assets 13 - 15Internally generated intangible assets 14Provisions and contingent assets/liabilities 30 - 31
Note
Detailed explanations of the degree of judgment and assumptions used are included under each of the respective sections in the notes to the financial statements as referenced above.
FINANCIALS / NOTES TO THE CONSOLIDATED FINANCIAL STATEMENTS / PAGE 73
SECTION 1 / GENERAL INFORMATION AND BASIS OF REPORTING CONTINUED
4 COVID-19 CONSIDERATIONS AND SEMICONDUCTOR CHIP SHORTAGEIn 2021 we showed some level of recovery in our business compared with 2020 which was impacted by the COVID-19 pandemic. Nevertheless the recovery of our Automotive revenue is still hampered by an industrywide shortage of semiconductor chips which impacts global car production. This resulted in a downward adjustment of our 2021 revenue guidance to €500 - €530 million from the previously communicated range of €520 — €570 million in 2021.
This shortage originated to a large extent from the COVID-19 pandemic when chips supply was rerouted from the car industry to the electronics industry. In addition, some of the chip producing countries to a certain extent still suffer from outbreaks and the imposed lockdowns. For contracts where revenue depends on estimated total transaction price as well as impairment testing, we have incorporated the latest insights from the industry. However, fluctuations in car sales can result in a revision of estimates relevant for the revenue recognition of such contracts. Should such estimates change, we do not expect material impact on the recognized revenue in the short term as the relevant contracts have only started recently (i.e. shorter period to be adjusted through cumulative catch-up).
The emergence of new variants of COVID-19 and the related governmental measures will continue to bring uncertainties in short and long term which may impact the demands of our products and our way working (see Risk section). Nevertheless, given our strong cash position, we are confident that we will have the resilience to maintain our strategic course despite the current uncertainties.
We continue to assess the implications of the uncertainties on the valuation of our assets and liabilities (including goodwill) on our balance sheet. This assessment did not result in any impairment or other material changes in the valuation of our assets and liabilities. More details on our goodwill impairment test can be found in note 13.
FINANCIALS / NOTES TO THE CONSOLIDATED FINANCIAL STATEMENTS / PAGE 74
SECTION 1 / GENERAL INFORMATION AND BASIS OF REPORTING CONTINUED
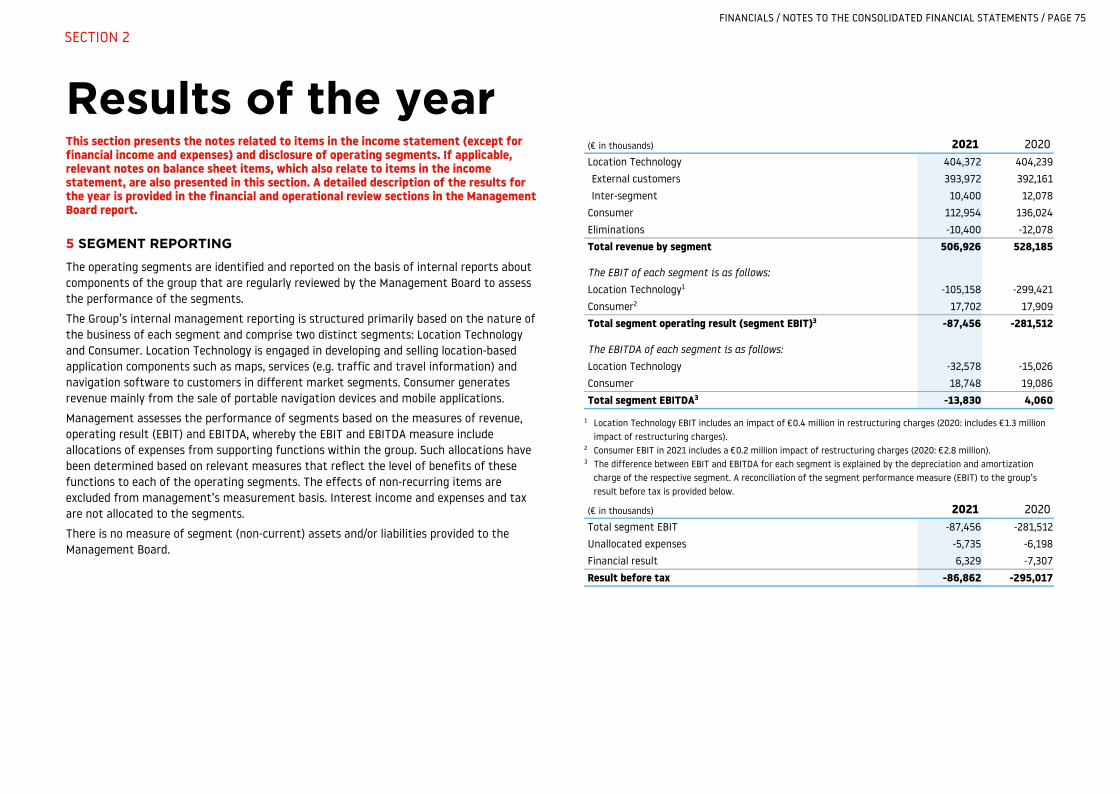
Results of the year This section presents the notes related to items in the income statement (except for financial income and expenses) and disclosure of operating segments. If applicable, relevant notes on balance sheet items, which also relate to items in the income statement, are also presented in this section. A detailed description of the results for the year is provided in the financial and operational review sections in the Management Board report.
5 SEGMENT REPORTING
The operating segments are identified and reported on the basis of internal reports about components of the group that are regularly reviewed by the Management Board to assess the performance of the segments.
The Group’s internal management reporting is structured primarily based on the nature of the business of each segment and comprise two distinct segments: Location Technology and Consumer. Location Technology is engaged in developing and selling location-based application components such as maps, services (e.g. traffic and travel information) and navigation software to customers in different market segments. Consumer generates revenue mainly from the sale of portable navigation devices and mobile applications.
Management assesses the performance of segments based on the measures of revenue, operating result (EBIT) and EBITDA, whereby the EBIT and EBITDA measure include allocations of expenses from supporting functions within the group. Such allocations have been determined based on relevant measures that reflect the level of benefits of these functions to each of the operating segments. The effects of non-recurring items are excluded from management’s measurement basis. Interest income and expenses and tax are not allocated to the segments.
There is no measure of segment (non-current) assets and/or liabilities provided to the Management Board.
(€ in thousands) 2021 2020Location Technology 404,372 404,239 External customers 393,972 392,161 Inter-segment 10,400 12,078
Consumer 112,954 136,024 Eliminations -10,400 -12,078 Total revenue by segment 506,926 528,185
The EBIT of each segment is as follows:Location Technology1 -105,158 -299,421 Consumer2 17,702 17,909 Total segment operating result (segment EBIT)3 -87,456 -281,512
The EBITDA of each segment is as follows:Location Technology -32,578 -15,026 Consumer 18,748 19,086 Total segment EBITDA3 -13,830 4,060
1 Location Technology EBIT includes an impact of €0.4 million in restructuring charges (2020: includes €1.3 million impact of restructuring charges).
2 Consumer EBIT in 2021 includes a €0.2 million impact of restructuring charges (2020: €2.8 million).3 The difference between EBIT and EBITDA for each segment is explained by the depreciation and amortization
charge of the respective segment. A reconciliation of the segment performance measure (EBIT) to the group’s result before tax is provided below.
(€ in thousands) 2021 2020Total segment EBIT -87,456 -281,512 Unallocated expenses -5,735 -6,198 Financial result 6,329 -7,307 Result before tax -86,862 -295,017
FINANCIALS / NOTES TO THE CONSOLIDATED FINANCIAL STATEMENTS / PAGE 75
SECTION 2

6 REVENUE FROM CONTRACTS WITH CUSTOMERS
Group revenue consists solely of revenue from contracts with customers. For disaggregation of revenue by operating segments, reference is made to note 5 ‘Segment reporting’. The table below shows a disaggregation of revenue by types of products and services, timing of revenue recognition and by geographical areas:
External revenue by products and services
License revenue 261,212 283,202
Rendering of services 168,426 157,092
Sale of goods 77,288 87,891
506,926 528,185
Revenue by timing of revenue recognition
Goods and services transferred at a point in time 98,166 127,967
Goods and services transferred over time 408,760 400,218
506,926 528,185
External revenue by geographical areas
Europe1 295,687 332,522
North America2 134,425 135,762
Rest of World 76,814 59,901
506,926 528,185
(€ in thousands) 2021 2020
1 Germany and France accounted for respectively 17% and 16% of 2021 revenue (19% and, 16% of 2020 revenue).2 The North American revenue in 2021 and in 2020 was generated mainly in the United States of America.
The geographical split of the group’s revenue is based on the location of the customers, while the split of revenue from licensing arrangements is based on the coverage of the group’s geographical map data and other content.Total revenue generated in the Netherlands in 2021 amounted to €10 million (2020: €19 million). Within Location Technology, there are two customers that had revenue between 10% - 15% of total group revenue in 2021. This is consistent with prior year.
CONTRACT BALANCES
Contract related asset balances consist of trade receivables, unbilled receivables, and other contract related assets as follows:
(€ in thousands) 2021 2020
Capitalized contract costs 23,200 25,530
Other deferred cost of sales 618 550
Other contract related assets 23,818 26,080
Other contract related assets are disclosed as:
Current 5,049 6,950
Non-current 18,769 19,130
Unbilled receivables is presented net of expected credit losses of €0.3 million (2020: €0.3 million). For details regarding the balance of trade receivables and expected credit losses refer to note 19.
Revenue of €164 million (2020: €150 million) was recognized from amounts included in contract liabilities at the beginning of the year. An amount of €15 million (2020: €18 million) was recognized relating to performance obligations satisfied in previous years.
Contract related liability balances are as follows:
Deferred revenue 440,727 403,706
Other contract-related liabilities1 19,782 19,084
Total contract related liabilities 460,509 422,790
Of which:
Current 200,881 183,997
Non-current 259,628 238,793
(€ in thousands) 2021 2020
1 Other contract related liabilities comprise of items such as accrued rebates, sales return allowance and stock protection accrual.
Deferred revenue amounted to €441 million at the end of the year (2020: €404 million). Deferred revenue per segment is as follows:
Location Technology 415,261 363,981
Consumer 25,466 39,725
Total deferred revenue 440,727 403,706
(€ in thousands) 2021 2020
At balance sheet date, €378 million (2020: €336 million) of Location Technology’s deferred revenue related to Automotive and €37 million (2020: €28 million) related to Enterprise.
FINANCIALS / NOTES TO THE CONSOLIDATED FINANCIAL STATEMENTS / PAGE 76
SECTION 2 / RESULTS OF THE YEAR CONTINUED
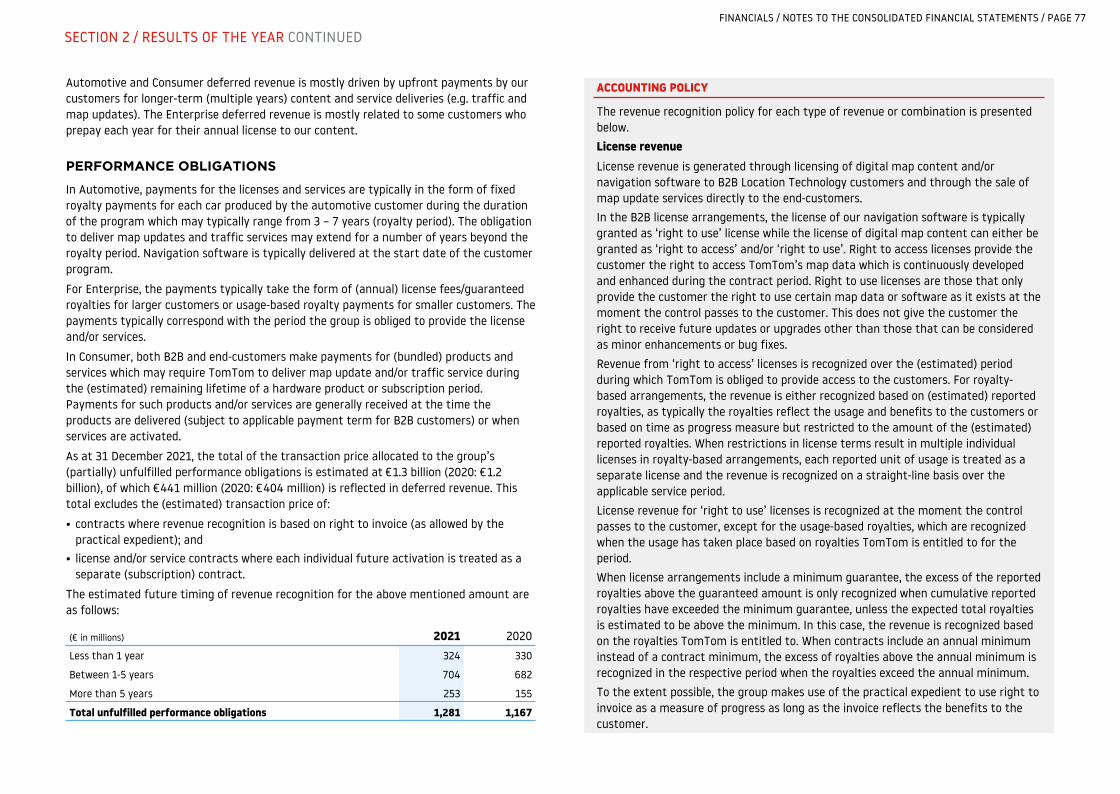
Automotive and Consumer deferred revenue is mostly driven by upfront payments by our customers for longer-term (multiple years) content and service deliveries (e.g. traffic and map updates). The Enterprise deferred revenue is mostly related to some customers who prepay each year for their annual license to our content.
PERFORMANCE OBLIGATIONS
In Automotive, payments for the licenses and services are typically in the form of fixed royalty payments for each car produced by the automotive customer during the duration of the program which may typically range from 3 – 7 years (royalty period). The obligation to deliver map updates and traffic services may extend for a number of years beyond the royalty period. Navigation software is typically delivered at the start date of the customer program.
For Enterprise, the payments typically take the form of (annual) license fees/guaranteed royalties for larger customers or usage-based royalty payments for smaller customers. The payments typically correspond with the period the group is obliged to provide the license and/or services.
In Consumer, both B2B and end-customers make payments for (bundled) products and services which may require TomTom to deliver map update and/or traffic service during the (estimated) remaining lifetime of a hardware product or subscription period. Payments for such products and/or services are generally received at the time the products are delivered (subject to applicable payment term for B2B customers) or when services are activated.
As at 31 December 2021, the total of the transaction price allocated to the group’s (partially) unfulfilled performance obligations is estimated at €1.3 billion (2020: €1.2 billion), of which €441 million (2020: €404 million) is reflected in deferred revenue. This total excludes the (estimated) transaction price of:
• contracts where revenue recognition is based on right to invoice (as allowed by the practical expedient); and
• license and/or service contracts where each individual future activation is treated as a separate (subscription) contract.
The estimated future timing of revenue recognition for the above mentioned amount are as follows:
(€ in millions) 2021 2020
Less than 1 year 324 330
Between 1-5 years 704 682
More than 5 years 253 155
Total unfulfilled performance obligations 1,281 1,167
ACCOUNTING POLICY
The revenue recognition policy for each type of revenue or combination is presented below.License revenueLicense revenue is generated through licensing of digital map content and/or navigation software to B2B Location Technology customers and through the sale of map update services directly to the end-customers.In the B2B license arrangements, the license of our navigation software is typically granted as ‘right to use’ license while the license of digital map content can either be granted as ‘right to access’ and/or ‘right to use’. Right to access licenses provide the customer the right to access TomTom’s map data which is continuously developed and enhanced during the contract period. Right to use licenses are those that only provide the customer the right to use certain map data or software as it exists at the moment the control passes to the customer. This does not give the customer the right to receive future updates or upgrades other than those that can be considered as minor enhancements or bug fixes.
Revenue from ‘right to access’ licenses is recognized over the (estimated) period during which TomTom is obliged to provide access to the customers. For royalty-based arrangements, the revenue is either recognized based on (estimated) reported royalties, as typically the royalties reflect the usage and benefits to the customers or based on time as progress measure but restricted to the amount of the (estimated) reported royalties. When restrictions in license terms result in multiple individual licenses in royalty-based arrangements, each reported unit of usage is treated as a separate license and the revenue is recognized on a straight-line basis over the applicable service period.
License revenue for ‘right to use’ licenses is recognized at the moment the control passes to the customer, except for the usage-based royalties, which are recognized when the usage has taken place based on royalties TomTom is entitled to for the period.When license arrangements include a minimum guarantee, the excess of the reported royalties above the guaranteed amount is only recognized when cumulative reported royalties have exceeded the minimum guarantee, unless the expected total royalties is estimated to be above the minimum. In this case, the revenue is recognized based on the royalties TomTom is entitled to. When contracts include an annual minimum instead of a contract minimum, the excess of royalties above the annual minimum is recognized in the respective period when the royalties exceed the annual minimum.
To the extent possible, the group makes use of the practical expedient to use right to invoice as a measure of progress as long as the invoice reflects the benefits to the customer.
FINANCIALS / NOTES TO THE CONSOLIDATED FINANCIAL STATEMENTS / PAGE 77
SECTION 2 / RESULTS OF THE YEAR CONTINUED
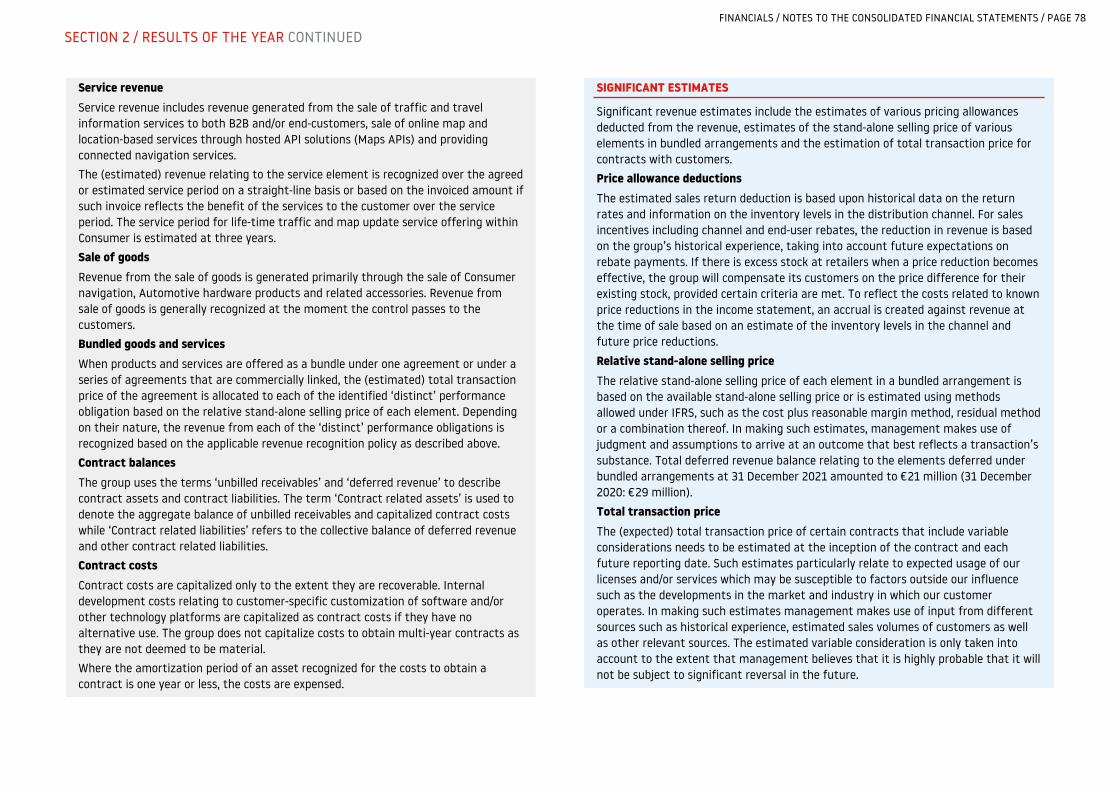
Service revenueService revenue includes revenue generated from the sale of traffic and travel information services to both B2B and/or end-customers, sale of online map and location-based services through hosted API solutions (Maps APIs) and providing connected navigation services.The (estimated) revenue relating to the service element is recognized over the agreed or estimated service period on a straight-line basis or based on the invoiced amount if such invoice reflects the benefit of the services to the customer over the service period. The service period for life-time traffic and map update service offering within Consumer is estimated at three years.
Sale of goodsRevenue from the sale of goods is generated primarily through the sale of Consumer navigation, Automotive hardware products and related accessories. Revenue from sale of goods is generally recognized at the moment the control passes to the customers.Bundled goods and servicesWhen products and services are offered as a bundle under one agreement or under a series of agreements that are commercially linked, the (estimated) total transaction price of the agreement is allocated to each of the identified ‘distinct’ performance obligation based on the relative stand-alone selling price of each element. Depending on their nature, the revenue from each of the ‘distinct’ performance obligations is recognized based on the applicable revenue recognition policy as described above.
Contract balancesThe group uses the terms ‘unbilled receivables’ and ‘deferred revenue’ to describe contract assets and contract liabilities. The term ‘Contract related assets’ is used to denote the aggregate balance of unbilled receivables and capitalized contract costs while ‘Contract related liabilities’ refers to the collective balance of deferred revenue and other contract related liabilities.
Contract costsContract costs are capitalized only to the extent they are recoverable. Internal development costs relating to customer-specific customization of software and/or other technology platforms are capitalized as contract costs if they have no alternative use. The group does not capitalize costs to obtain multi-year contracts as they are not deemed to be material.
Where the amortization period of an asset recognized for the costs to obtain a contract is one year or less, the costs are expensed.
SIGNIFICANT ESTIMATES
Significant revenue estimates include the estimates of various pricing allowances deducted from the revenue, estimates of the stand-alone selling price of various elements in bundled arrangements and the estimation of total transaction price for contracts with customers.Price allowance deductionsThe estimated sales return deduction is based upon historical data on the return rates and information on the inventory levels in the distribution channel. For sales incentives including channel and end-user rebates, the reduction in revenue is based on the group’s historical experience, taking into account future expectations on rebate payments. If there is excess stock at retailers when a price reduction becomes effective, the group will compensate its customers on the price difference for their existing stock, provided certain criteria are met. To reflect the costs related to known price reductions in the income statement, an accrual is created against revenue at the time of sale based on an estimate of the inventory levels in the channel and future price reductions.
Relative stand-alone selling priceThe relative stand-alone selling price of each element in a bundled arrangement is based on the available stand-alone selling price or is estimated using methods allowed under IFRS, such as the cost plus reasonable margin method, residual method or a combination thereof. In making such estimates, management makes use of judgment and assumptions to arrive at an outcome that best reflects a transaction’s substance. Total deferred revenue balance relating to the elements deferred under bundled arrangements at 31 December 2021 amounted to €21 million (31 December 2020: €29 million).
Total transaction priceThe (expected) total transaction price of certain contracts that include variable considerations needs to be estimated at the inception of the contract and each future reporting date. Such estimates particularly relate to expected usage of our licenses and/or services which may be susceptible to factors outside our influence such as the developments in the market and industry in which our customer operates. In making such estimates management makes use of input from different sources such as historical experience, estimated sales volumes of customers as well as other relevant sources. The estimated variable consideration is only taken into account to the extent that management believes that it is highly probable that it will not be subject to significant reversal in the future.
FINANCIALS / NOTES TO THE CONSOLIDATED FINANCIAL STATEMENTS / PAGE 78
SECTION 2 / RESULTS OF THE YEAR CONTINUED
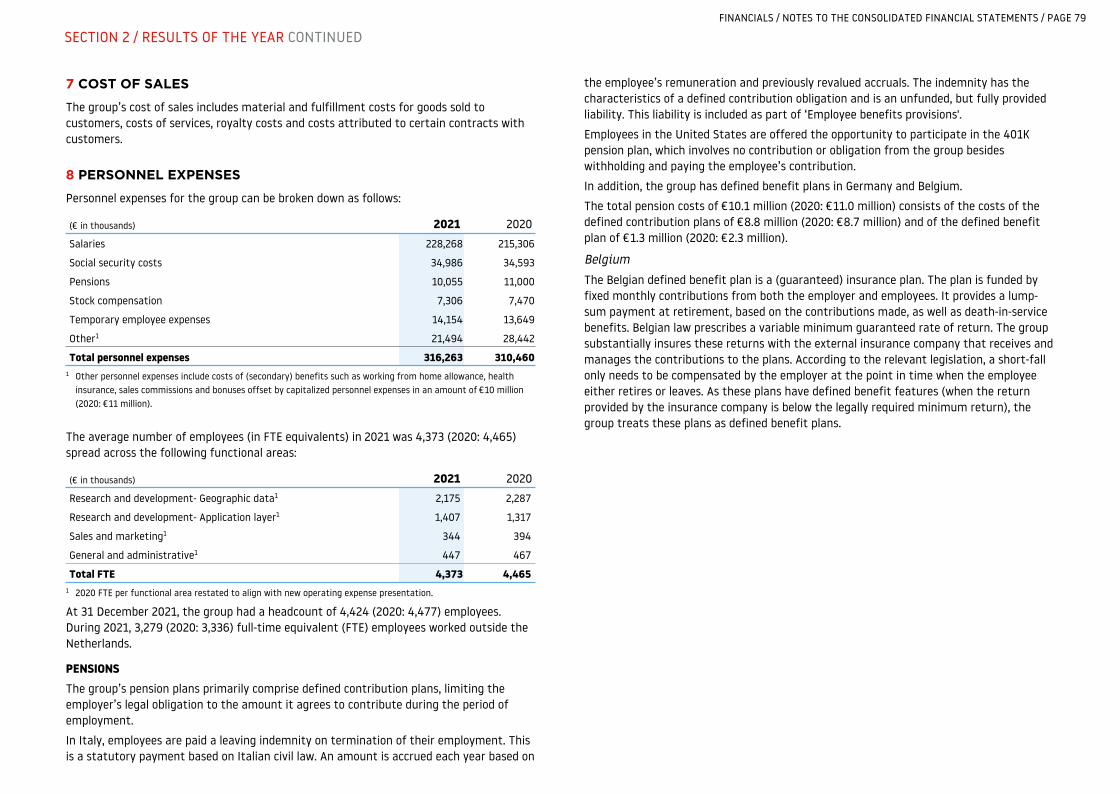
7 COST OF SALES
The group’s cost of sales includes material and fulfillment costs for goods sold to customers, costs of services, royalty costs and costs attributed to certain contracts with customers.
8 PERSONNEL EXPENSES
Personnel expenses for the group can be broken down as follows:
Salaries 228,268 215,306
Social security costs 34,986 34,593
Pensions 10,055 11,000
Stock compensation 7,306 7,470
Temporary employee expenses 14,154 13,649
Other1 21,494 28,442
Total personnel expenses 316,263 310,460
(€ in thousands) 2021 2020
1 Other personnel expenses include costs of (secondary) benefits such as working from home allowance, health insurance, sales commissions and bonuses offset by capitalized personnel expenses in an amount of €10 million (2020: €11 million).
The average number of employees (in FTE equivalents) in 2021 was 4,373 (2020: 4,465) spread across the following functional areas:
Research and development- Geographic data1 2,175 2,287
Research and development- Application layer1 1,407 1,317
Sales and marketing1 344 394
General and administrative1 447 467
Total FTE 4,373 4,465
(€ in thousands) 2021 2020
1 2020 FTE per functional area restated to align with new operating expense presentation.
At 31 December 2021, the group had a headcount of 4,424 (2020: 4,477) employees. During 2021, 3,279 (2020: 3,336) full-time equivalent (FTE) employees worked outside the Netherlands.
PENSIONSThe group’s pension plans primarily comprise defined contribution plans, limiting the employer’s legal obligation to the amount it agrees to contribute during the period of employment.
In Italy, employees are paid a leaving indemnity on termination of their employment. This is a statutory payment based on Italian civil law. An amount is accrued each year based on
the employee’s remuneration and previously revalued accruals. The indemnity has the characteristics of a defined contribution obligation and is an unfunded, but fully provided liability. This liability is included as part of ‘Employee benefits provisions'.
Employees in the United States are offered the opportunity to participate in the 401K pension plan, which involves no contribution or obligation from the group besides withholding and paying the employee’s contribution.
In addition, the group has defined benefit plans in Germany and Belgium.
The total pension costs of €10.1 million (2020: €11.0 million) consists of the costs of the defined contribution plans of €8.8 million (2020: €8.7 million) and of the defined benefit plan of €1.3 million (2020: €2.3 million).
Belgium
The Belgian defined benefit plan is a (guaranteed) insurance plan. The plan is funded by fixed monthly contributions from both the employer and employees. It provides a lump-sum payment at retirement, based on the contributions made, as well as death-in-service benefits. Belgian law prescribes a variable minimum guaranteed rate of return. The group substantially insures these returns with the external insurance company that receives and manages the contributions to the plans. According to the relevant legislation, a short-fall only needs to be compensated by the employer at the point in time when the employee either retires or leaves. As these plans have defined benefit features (when the return provided by the insurance company is below the legally required minimum return), the group treats these plans as defined benefit plans.
FINANCIALS / NOTES TO THE CONSOLIDATED FINANCIAL STATEMENTS / PAGE 79
SECTION 2 / RESULTS OF THE YEAR CONTINUED
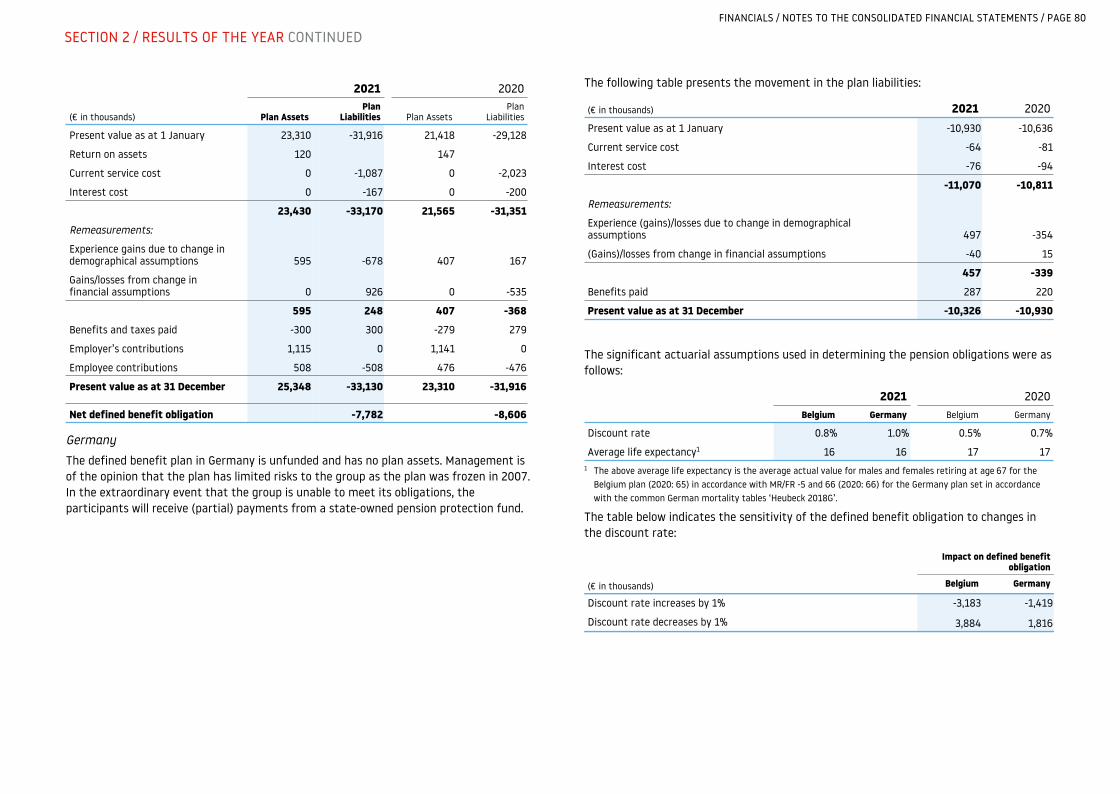
Present value as at 1 January 23,310 -31,916 21,418 -29,128
Return on assets 120 147
Current service cost 0 -1,087 0 -2,023
Interest cost 0 -167 0 -200
23,430 -33,170 21,565 -31,351
Remeasurements:
Experience gains due to change in demographical assumptions 595 -678 407 167
Gains/losses from change in financial assumptions 0 926 0 -535
595 248 407 -368
Benefits and taxes paid -300 300 -279 279
Employer’s contributions 1,115 0 1,141 0
Employee contributions 508 -508 476 -476
Present value as at 31 December 25,348 -33,130 23,310 -31,916
Net defined benefit obligation -7,782 -8,606
2021 2020
(€ in thousands) Plan AssetsPlan
Liabilities Plan AssetsPlan
Liabilities
Germany
The defined benefit plan in Germany is unfunded and has no plan assets. Management is of the opinion that the plan has limited risks to the group as the plan was frozen in 2007. In the extraordinary event that the group is unable to meet its obligations, the participants will receive (partial) payments from a state-owned pension protection fund.
The following table presents the movement in the plan liabilities:
Present value as at 1 January -10,930 -10,636
Current service cost -64 -81
Interest cost -76 -94
-11,070 -10,811
Remeasurements:
Experience (gains)/losses due to change in demographical assumptions 497 -354
(Gains)/losses from change in financial assumptions -40 15
457 -339
Benefits paid 287 220
Present value as at 31 December -10,326 -10,930
(€ in thousands) 2021 2020
The significant actuarial assumptions used in determining the pension obligations were as follows:
Discount rate 0.8 % 1.0 % 0.5 % 0.7 %
Average life expectancy1 16 16 17 17
2021 2020Belgium Germany Belgium Germany
1 The above average life expectancy is the average actual value for males and females retiring at age 67 for the Belgium plan (2020: 65) in accordance with MR/FR -5 and 66 (2020: 66) for the Germany plan set in accordance with the common German mortality tables ‘Heubeck 2018G’.
The table below indicates the sensitivity of the defined benefit obligation to changes in the discount rate:
Impact on defined benefit obligation
(€ in thousands) Belgium Germany
Discount rate increases by 1% -3,183 -1,419
Discount rate decreases by 1% 3,884 1,816
FINANCIALS / NOTES TO THE CONSOLIDATED FINANCIAL STATEMENTS / PAGE 80
SECTION 2 / RESULTS OF THE YEAR CONTINUED
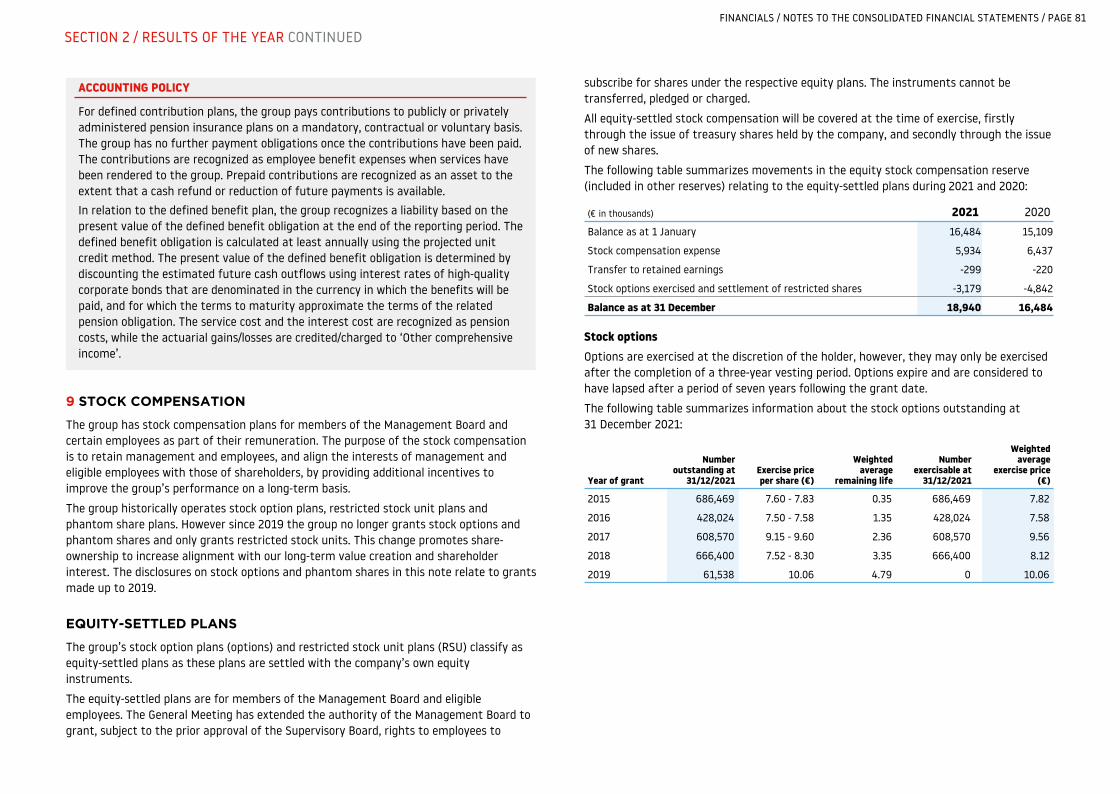
ACCOUNTING POLICY
For defined contribution plans, the group pays contributions to publicly or privately administered pension insurance plans on a mandatory, contractual or voluntary basis. The group has no further payment obligations once the contributions have been paid. The contributions are recognized as employee benefit expenses when services have been rendered to the group. Prepaid contributions are recognized as an asset to the extent that a cash refund or reduction of future payments is available.
In relation to the defined benefit plan, the group recognizes a liability based on the present value of the defined benefit obligation at the end of the reporting period. The defined benefit obligation is calculated at least annually using the projected unit credit method. The present value of the defined benefit obligation is determined by discounting the estimated future cash outflows using interest rates of high-quality corporate bonds that are denominated in the currency in which the benefits will be paid, and for which the terms to maturity approximate the terms of the related pension obligation. The service cost and the interest cost are recognized as pension costs, while the actuarial gains/losses are credited/charged to ‘Other comprehensive income’.
9 STOCK COMPENSATION
The group has stock compensation plans for members of the Management Board and certain employees as part of their remuneration. The purpose of the stock compensation is to retain management and employees, and align the interests of management and eligible employees with those of shareholders, by providing additional incentives to improve the group’s performance on a long-term basis.
The group historically operates stock option plans, restricted stock unit plans and phantom share plans. However since 2019 the group no longer grants stock options and phantom shares and only grants restricted stock units. This change promotes share-ownership to increase alignment with our long-term value creation and shareholder interest. The disclosures on stock options and phantom shares in this note relate to grants made up to 2019.
EQUITY-SETTLED PLANS
The group’s stock option plans (options) and restricted stock unit plans (RSU) classify as equity-settled plans as these plans are settled with the company’s own equity instruments.
The equity-settled plans are for members of the Management Board and eligible employees. The General Meeting has extended the authority of the Management Board to grant, subject to the prior approval of the Supervisory Board, rights to employees to
subscribe for shares under the respective equity plans. The instruments cannot be transferred, pledged or charged.
All equity-settled stock compensation will be covered at the time of exercise, firstly through the issue of treasury shares held by the company, and secondly through the issue of new shares.
The following table summarizes movements in the equity stock compensation reserve (included in other reserves) relating to the equity-settled plans during 2021 and 2020:
Balance as at 1 January 16,484 15,109
Stock compensation expense 5,934 6,437
Transfer to retained earnings -299 -220
Stock options exercised and settlement of restricted shares -3,179 -4,842
Balance as at 31 December 18,940 16,484
(€ in thousands) 2021 2020
Stock optionsOptions are exercised at the discretion of the holder, however, they may only be exercised after the completion of a three-year vesting period. Options expire and are considered to have lapsed after a period of seven years following the grant date.
The following table summarizes information about the stock options outstanding at 31 December 2021:
2015 686,469 7.60 - 7.83 0.35 686,469 7.82
2016 428,024 7.50 - 7.58 1.35 428,024 7.58
2017 608,570 9.15 - 9.60 2.36 608,570 9.56
2018 666,400 7.52 - 8.30 3.35 666,400 8.12
2019 61,538 10.06 4.79 0 10.06
Year of grant
Number outstanding at
31/12/2021Exercise price per share (€)
Weighted average
remaining life
Number exercisable at
31/12/2021
Weighted average
exercise price (€)
FINANCIALS / NOTES TO THE CONSOLIDATED FINANCIAL STATEMENTS / PAGE 81
SECTION 2 / RESULTS OF THE YEAR CONTINUED
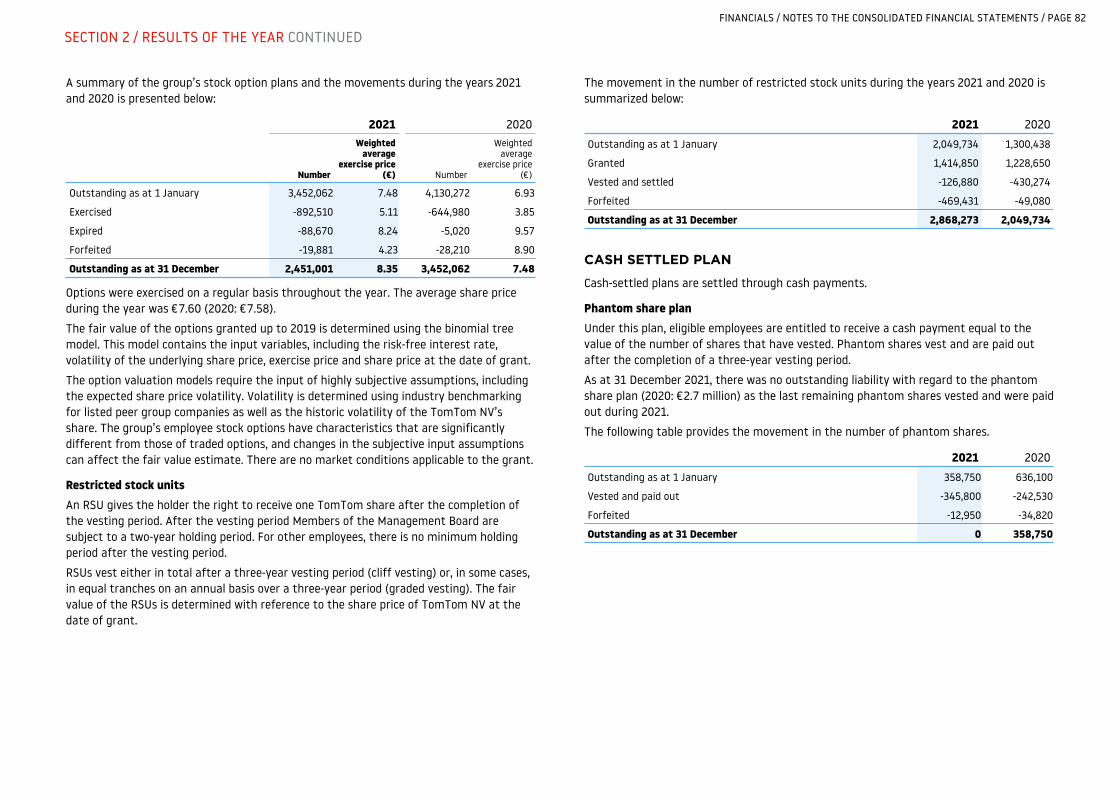
A summary of the group’s stock option plans and the movements during the years 2021 and 2020 is presented below:
Outstanding as at 1 January 3,452,062 7.48 4,130,272 6.93
Exercised -892,510 5.11 -644,980 3.85
Expired -88,670 8.24 -5,020 9.57
Forfeited -19,881 4.23 -28,210 8.90
Outstanding as at 31 December 2,451,001 8.35 3,452,062 7.48
2021 2020
Number
Weighted average
exercise price (€) Number
Weighted average
exercise price (€)
Options were exercised on a regular basis throughout the year. The average share price during the year was €7.60 (2020: €7.58).
The fair value of the options granted up to 2019 is determined using the binomial tree model. This model contains the input variables, including the risk-free interest rate, volatility of the underlying share price, exercise price and share price at the date of grant.
The option valuation models require the input of highly subjective assumptions, including the expected share price volatility. Volatility is determined using industry benchmarking for listed peer group companies as well as the historic volatility of the TomTom NV’s share. The group’s employee stock options have characteristics that are significantly different from those of traded options, and changes in the subjective input assumptions can affect the fair value estimate. There are no market conditions applicable to the grant.
Restricted stock unitsAn RSU gives the holder the right to receive one TomTom share after the completion of the vesting period. After the vesting period Members of the Management Board are subject to a two-year holding period. For other employees, there is no minimum holding period after the vesting period.
RSUs vest either in total after a three-year vesting period (cliff vesting) or, in some cases, in equal tranches on an annual basis over a three-year period (graded vesting). The fair value of the RSUs is determined with reference to the share price of TomTom NV at the date of grant.
The movement in the number of restricted stock units during the years 2021 and 2020 is summarized below:
Outstanding as at 1 January 2,049,734 1,300,438
Granted 1,414,850 1,228,650
Vested and settled -126,880 -430,274
Forfeited -469,431 -49,080
Outstanding as at 31 December 2,868,273 2,049,734
2021 2020
CASH SETTLED PLAN
Cash-settled plans are settled through cash payments.
Phantom share planUnder this plan, eligible employees are entitled to receive a cash payment equal to the value of the number of shares that have vested. Phantom shares vest and are paid out after the completion of a three-year vesting period.
As at 31 December 2021, there was no outstanding liability with regard to the phantom share plan (2020: €2.7 million) as the last remaining phantom shares vested and were paid out during 2021.
The following table provides the movement in the number of phantom shares.
Outstanding as at 1 January 358,750 636,100
Vested and paid out -345,800 -242,530
Forfeited -12,950 -34,820
Outstanding as at 31 December 0 358,750
2021 2020
FINANCIALS / NOTES TO THE CONSOLIDATED FINANCIAL STATEMENTS / PAGE 82
SECTION 2 / RESULTS OF THE YEAR CONTINUED
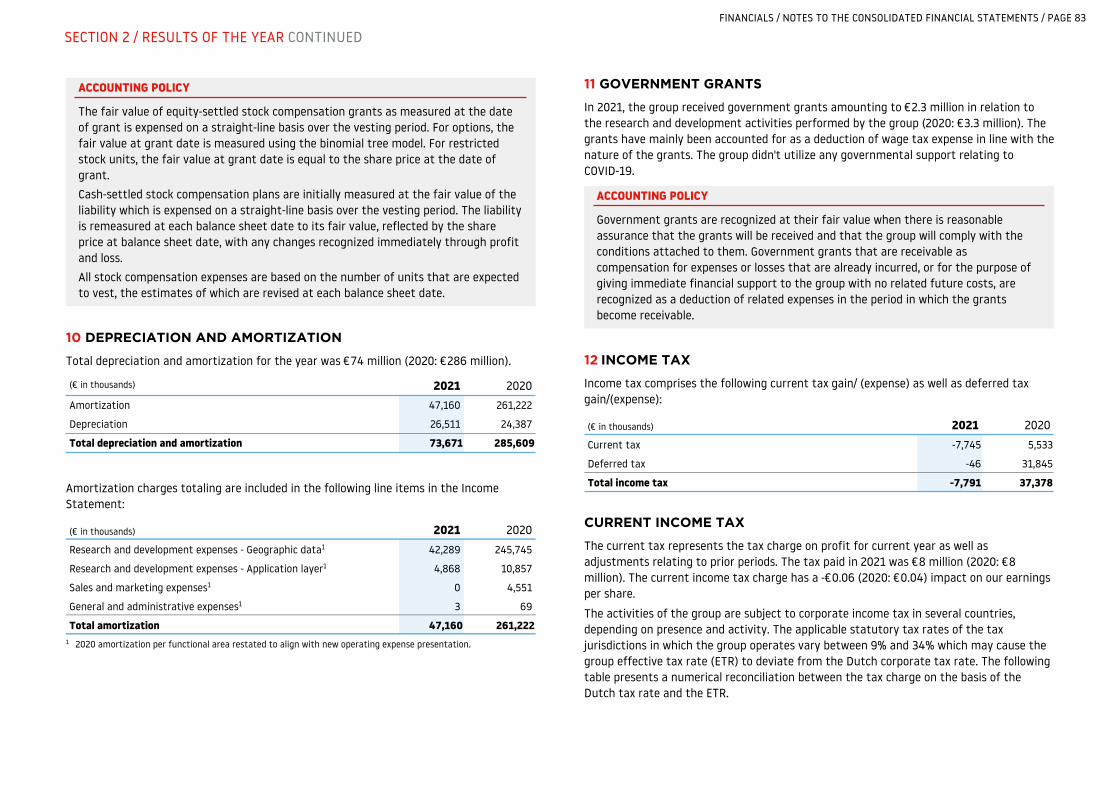
ACCOUNTING POLICY
The fair value of equity-settled stock compensation grants as measured at the date of grant is expensed on a straight-line basis over the vesting period. For options, the fair value at grant date is measured using the binomial tree model. For restricted stock units, the fair value at grant date is equal to the share price at the date of grant.
Cash-settled stock compensation plans are initially measured at the fair value of the liability which is expensed on a straight-line basis over the vesting period. The liability is remeasured at each balance sheet date to its fair value, reflected by the share price at balance sheet date, with any changes recognized immediately through profit and loss.
All stock compensation expenses are based on the number of units that are expected to vest, the estimates of which are revised at each balance sheet date.
10 DEPRECIATION AND AMORTIZATION
Total depreciation and amortization for the year was €74 million (2020: €286 million).
Amortization 47,160 261,222
Depreciation 26,511 24,387
Total depreciation and amortization 73,671 285,609
(€ in thousands) 2021 2020
Amortization charges totaling are included in the following line items in the Income Statement:
(€ in thousands) 2021 2020
Research and development expenses - Geographic data1 42,289 245,745
Research and development expenses - Application layer1 4,868 10,857
Sales and marketing expenses1 0 4,551
General and administrative expenses1 3 69
Total amortization 47,160 261,222 1 2020 amortization per functional area restated to align with new operating expense presentation.
11 GOVERNMENT GRANTS
In 2021, the group received government grants amounting to €2.3 million in relation to the research and development activities performed by the group (2020: €3.3 million). The grants have mainly been accounted for as a deduction of wage tax expense in line with the nature of the grants. The group didn't utilize any governmental support relating to COVID-19.
ACCOUNTING POLICY
Government grants are recognized at their fair value when there is reasonable assurance that the grants will be received and that the group will comply with the conditions attached to them. Government grants that are receivable as compensation for expenses or losses that are already incurred, or for the purpose of giving immediate financial support to the group with no related future costs, are recognized as a deduction of related expenses in the period in which the grants become receivable.
12 INCOME TAX
Income tax comprises the following current tax gain/ (expense) as well as deferred tax gain/(expense):
Current tax -7,745 5,533
Deferred tax -46 31,845
Total income tax -7,791 37,378
(€ in thousands) 2021 2020
CURRENT INCOME TAX
The current tax represents the tax charge on profit for current year as well as adjustments relating to prior periods. The tax paid in 2021 was €8 million (2020: €8 million). The current income tax charge has a -€0.06 (2020: €0.04) impact on our earnings per share.
The activities of the group are subject to corporate income tax in several countries, depending on presence and activity. The applicable statutory tax rates of the tax jurisdictions in which the group operates vary between 9% and 34% which may cause the group effective tax rate (ETR) to deviate from the Dutch corporate tax rate. The following table presents a numerical reconciliation between the tax charge on the basis of the Dutch tax rate and the ETR.
FINANCIALS / NOTES TO THE CONSOLIDATED FINANCIAL STATEMENTS / PAGE 83
SECTION 2 / RESULTS OF THE YEAR CONTINUED
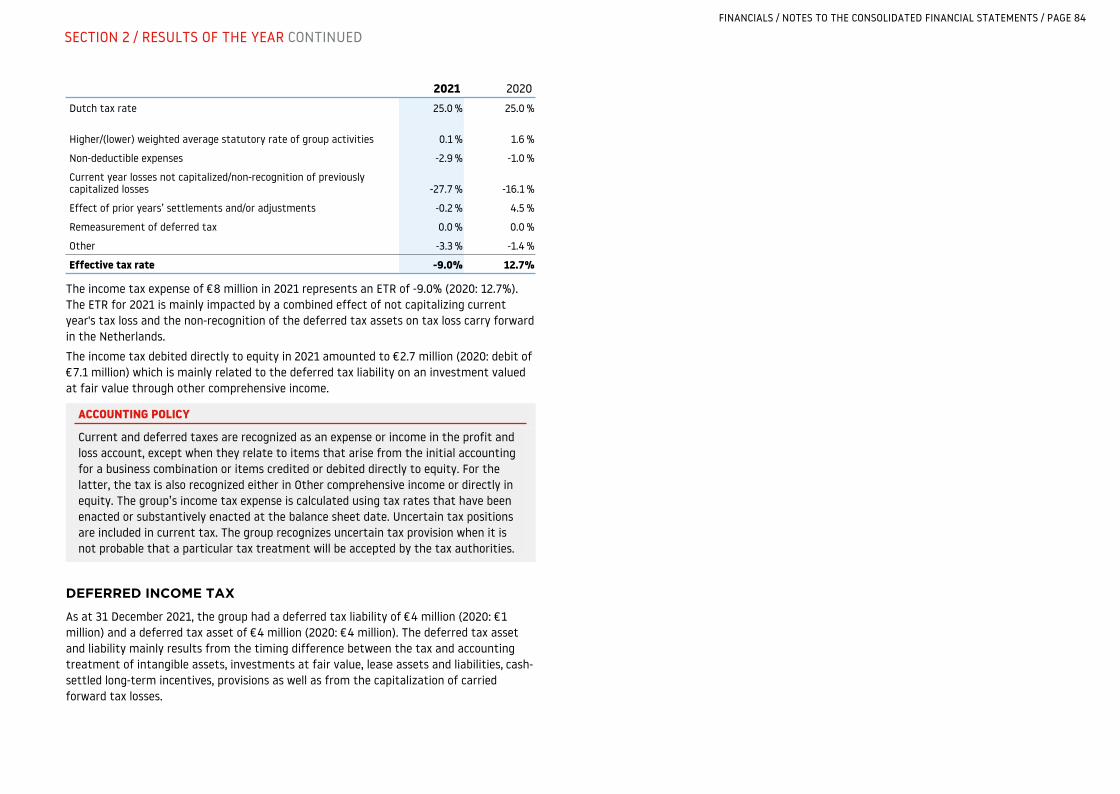
Dutch tax rate 25.0 % 25.0 %
Higher/(lower) weighted average statutory rate of group activities 0.1 % 1.6 %
Non-deductible expenses -2.9 % -1.0 %
Current year losses not capitalized/non-recognition of previously capitalized losses -27.7 % -16.1 %
Effect of prior years’ settlements and/or adjustments -0.2 % 4.5 %
Remeasurement of deferred tax 0.0 % 0.0 %
Other -3.3 % -1.4 %
Effective tax rate -9.0 % 12.7 %
2021 2020
The income tax expense of €8 million in 2021 represents an ETR of -9.0% (2020: 12.7%). The ETR for 2021 is mainly impacted by a combined effect of not capitalizing current year's tax loss and the non-recognition of the deferred tax assets on tax loss carry forward in the Netherlands.
The income tax debited directly to equity in 2021 amounted to €2.7 million (2020: debit of €7.1 million) which is mainly related to the deferred tax liability on an investment valued at fair value through other comprehensive income.
ACCOUNTING POLICY
Current and deferred taxes are recognized as an expense or income in the profit and loss account, except when they relate to items that arise from the initial accounting for a business combination or items credited or debited directly to equity. For the latter, the tax is also recognized either in Other comprehensive income or directly in equity. The group’s income tax expense is calculated using tax rates that have been enacted or substantively enacted at the balance sheet date. Uncertain tax positions are included in current tax. The group recognizes uncertain tax provision when it is not probable that a particular tax treatment will be accepted by the tax authorities.
DEFERRED INCOME TAX
As at 31 December 2021, the group had a deferred tax liability of €4 million (2020: €1 million) and a deferred tax asset of €4 million (2020: €4 million). The deferred tax asset and liability mainly results from the timing difference between the tax and accounting treatment of intangible assets, investments at fair value, lease assets and liabilities, cash-settled long-term incentives, provisions as well as from the capitalization of carried forward tax losses.
FINANCIALS / NOTES TO THE CONSOLIDATED FINANCIAL STATEMENTS / PAGE 84
SECTION 2 / RESULTS OF THE YEAR CONTINUED
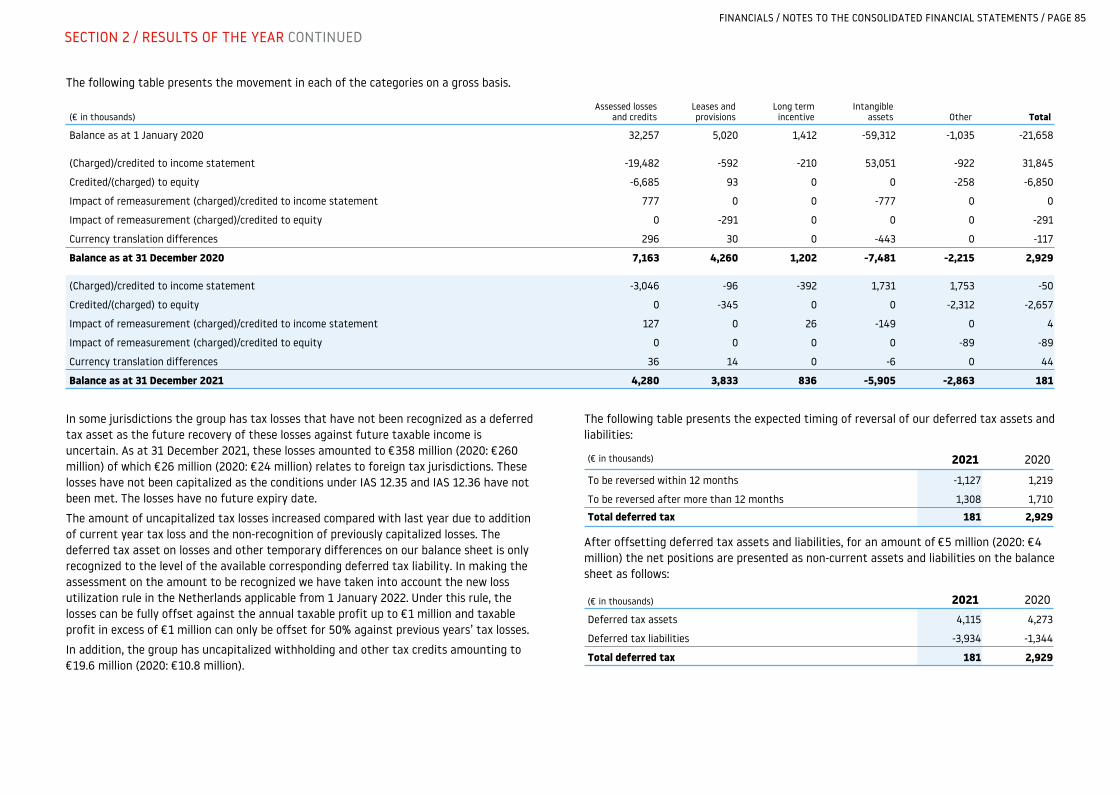
The following table presents the movement in each of the categories on a gross basis.
Balance as at 1 January 2020 32,257 5,020 1,412 -59,312 -1,035 -21,658
(Charged)/credited to income statement -19,482 -592 -210 53,051 -922 31,845
Credited/(charged) to equity -6,685 93 0 0 -258 -6,850
Impact of remeasurement (charged)/credited to income statement 777 0 0 -777 0 0
Impact of remeasurement (charged)/credited to equity 0 -291 0 0 0 -291
Currency translation differences 296 30 0 -443 0 -117
Balance as at 31 December 2020 7,163 4,260 1,202 -7,481 -2,215 2,929
(Charged)/credited to income statement -3,046 -96 -392 1,731 1,753 -50
Credited/(charged) to equity 0 -345 0 0 -2,312 -2,657
Impact of remeasurement (charged)/credited to income statement 127 0 26 -149 0 4
Impact of remeasurement (charged)/credited to equity 0 0 0 0 -89 -89
Currency translation differences 36 14 0 -6 0 44
Balance as at 31 December 2021 4,280 3,833 836 -5,905 -2,863 181
(€ in thousands)Assessed losses
and creditsLeases and provisions
Long term incentive
Intangible assets Other Total
In some jurisdictions the group has tax losses that have not been recognized as a deferred tax asset as the future recovery of these losses against future taxable income is uncertain. As at 31 December 2021, these losses amounted to €358 million (2020: €260 million) of which €26 million (2020: €24 million) relates to foreign tax jurisdictions. These losses have not been capitalized as the conditions under IAS 12.35 and IAS 12.36 have not been met. The losses have no future expiry date.
The amount of uncapitalized tax losses increased compared with last year due to addition of current year tax loss and the non-recognition of previously capitalized losses. The deferred tax asset on losses and other temporary differences on our balance sheet is only recognized to the level of the available corresponding deferred tax liability. In making the assessment on the amount to be recognized we have taken into account the new loss utilization rule in the Netherlands applicable from 1 January 2022. Under this rule, the losses can be fully offset against the annual taxable profit up to €1 million and taxable profit in excess of €1 million can only be offset for 50% against previous years’ tax losses.
In addition, the group has uncapitalized withholding and other tax credits amounting to €19.6 million (2020: €10.8 million).
The following table presents the expected timing of reversal of our deferred tax assets and liabilities:
To be reversed within 12 months -1,127 1,219
To be reversed after more than 12 months 1,308 1,710
Total deferred tax 181 2,929
(€ in thousands) 2021 2020
After offsetting deferred tax assets and liabilities, for an amount of €5 million (2020: €4 million) the net positions are presented as non-current assets and liabilities on the balance sheet as follows:
Deferred tax assets 4,115 4,273
Deferred tax liabilities -3,934 -1,344
Total deferred tax 181 2,929
(€ in thousands) 2021 2020
FINANCIALS / NOTES TO THE CONSOLIDATED FINANCIAL STATEMENTS / PAGE 85
SECTION 2 / RESULTS OF THE YEAR CONTINUED
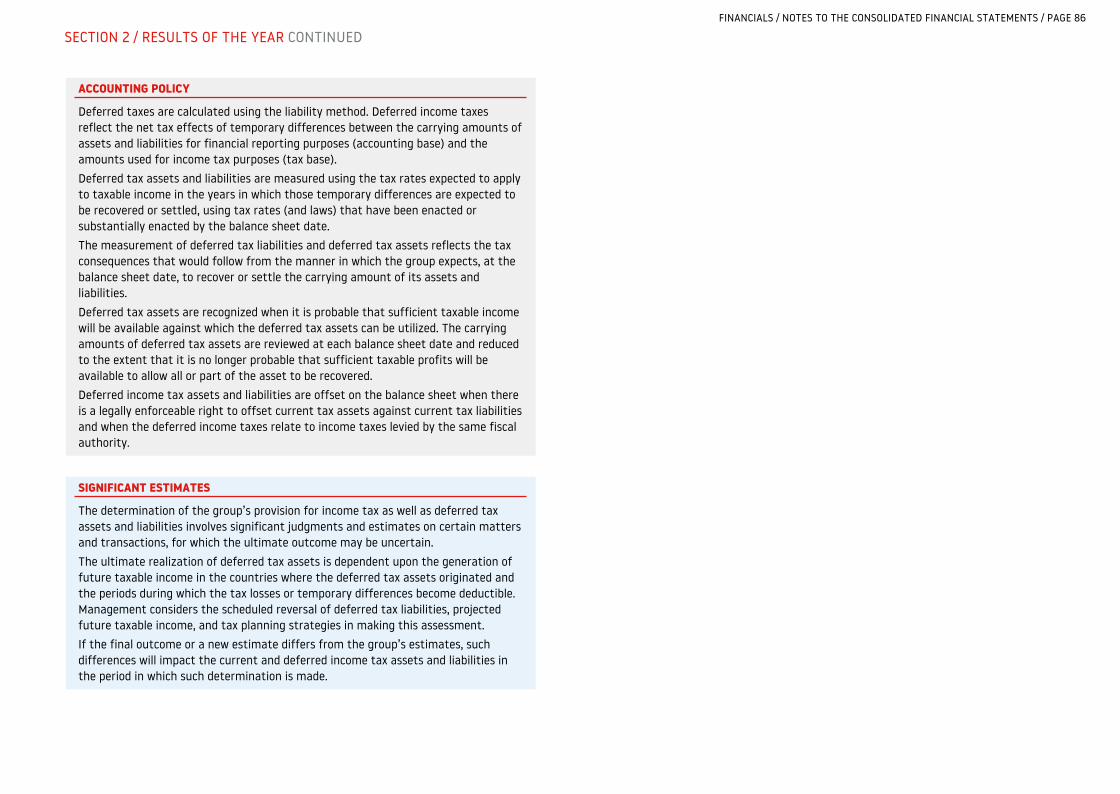
ACCOUNTING POLICY
Deferred taxes are calculated using the liability method. Deferred income taxes reflect the net tax effects of temporary differences between the carrying amounts of assets and liabilities for financial reporting purposes (accounting base) and the amounts used for income tax purposes (tax base).Deferred tax assets and liabilities are measured using the tax rates expected to apply to taxable income in the years in which those temporary differences are expected to be recovered or settled, using tax rates (and laws) that have been enacted or substantially enacted by the balance sheet date.The measurement of deferred tax liabilities and deferred tax assets reflects the tax consequences that would follow from the manner in which the group expects, at the balance sheet date, to recover or settle the carrying amount of its assets and liabilities.
Deferred tax assets are recognized when it is probable that sufficient taxable income will be available against which the deferred tax assets can be utilized. The carrying amounts of deferred tax assets are reviewed at each balance sheet date and reduced to the extent that it is no longer probable that sufficient taxable profits will be available to allow all or part of the asset to be recovered.Deferred income tax assets and liabilities are offset on the balance sheet when there is a legally enforceable right to offset current tax assets against current tax liabilities and when the deferred income taxes relate to income taxes levied by the same fiscal authority.
SIGNIFICANT ESTIMATES
The determination of the group’s provision for income tax as well as deferred tax assets and liabilities involves significant judgments and estimates on certain matters and transactions, for which the ultimate outcome may be uncertain.
The ultimate realization of deferred tax assets is dependent upon the generation of future taxable income in the countries where the deferred tax assets originated and the periods during which the tax losses or temporary differences become deductible. Management considers the scheduled reversal of deferred tax liabilities, projected future taxable income, and tax planning strategies in making this assessment.If the final outcome or a new estimate differs from the group’s estimates, such differences will impact the current and deferred income tax assets and liabilities in the period in which such determination is made.
FINANCIALS / NOTES TO THE CONSOLIDATED FINANCIAL STATEMENTS / PAGE 86
SECTION 2 / RESULTS OF THE YEAR CONTINUED
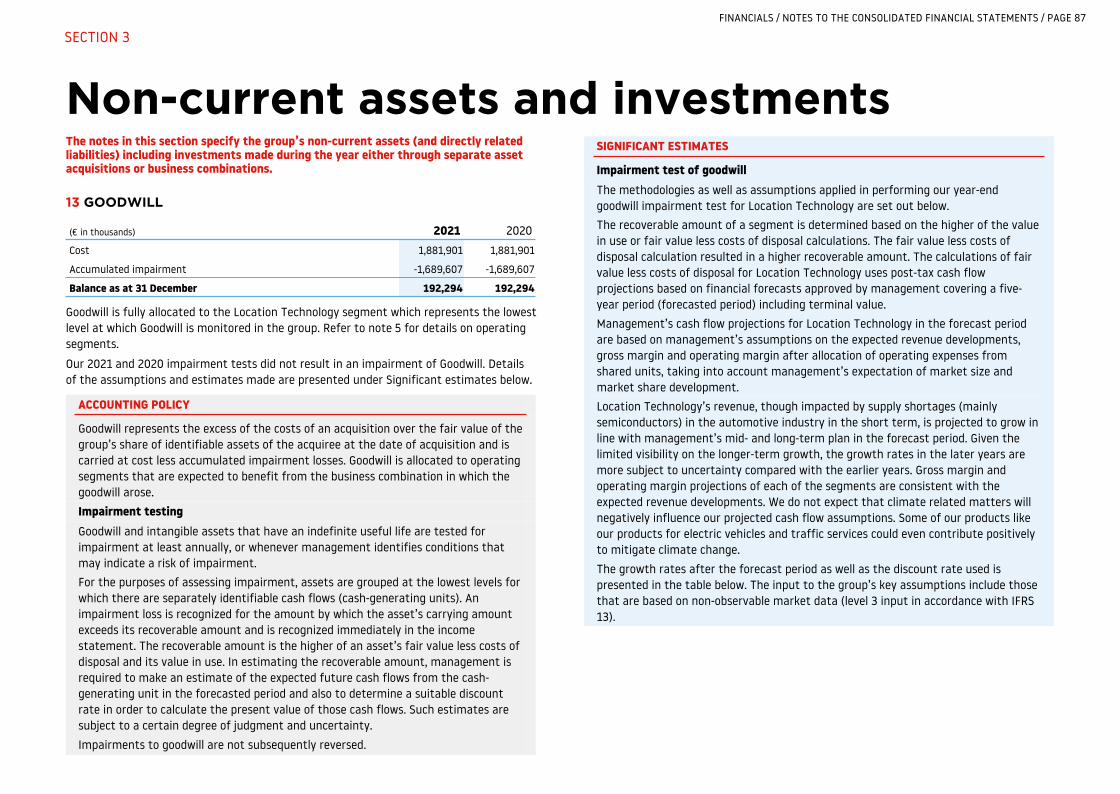
Non-current assets and investments The notes in this section specify the group’s non-current assets (and directly related liabilities) including investments made during the year either through separate asset acquisitions or business combinations.
13 GOODWILL
Cost 1,881,901 1,881,901
Accumulated impairment -1,689,607 -1,689,607
Balance as at 31 December 192,294 192,294
(€ in thousands) 2021 2020
Goodwill is fully allocated to the Location Technology segment which represents the lowest level at which Goodwill is monitored in the group. Refer to note 5 for details on operating segments.
Our 2021 and 2020 impairment tests did not result in an impairment of Goodwill. Details of the assumptions and estimates made are presented under Significant estimates below.
ACCOUNTING POLICY
Goodwill represents the excess of the costs of an acquisition over the fair value of the group’s share of identifiable assets of the acquiree at the date of acquisition and is carried at cost less accumulated impairment losses. Goodwill is allocated to operating segments that are expected to benefit from the business combination in which the goodwill arose.
Impairment testingGoodwill and intangible assets that have an indefinite useful life are tested for impairment at least annually, or whenever management identifies conditions that may indicate a risk of impairment.For the purposes of assessing impairment, assets are grouped at the lowest levels for which there are separately identifiable cash flows (cash-generating units). An impairment loss is recognized for the amount by which the asset’s carrying amount exceeds its recoverable amount and is recognized immediately in the income statement. The recoverable amount is the higher of an asset’s fair value less costs of disposal and its value in use. In estimating the recoverable amount, management is required to make an estimate of the expected future cash flows from the cash-generating unit in the forecasted period and also to determine a suitable discount rate in order to calculate the present value of those cash flows. Such estimates are subject to a certain degree of judgment and uncertainty.
Impairments to goodwill are not subsequently reversed.
SIGNIFICANT ESTIMATES
Impairment test of goodwillThe methodologies as well as assumptions applied in performing our year-end goodwill impairment test for Location Technology are set out below. The recoverable amount of a segment is determined based on the higher of the value in use or fair value less costs of disposal calculations. The fair value less costs of disposal calculation resulted in a higher recoverable amount. The calculations of fair value less costs of disposal for Location Technology uses post-tax cash flow projections based on financial forecasts approved by management covering a five-year period (forecasted period) including terminal value.
Management’s cash flow projections for Location Technology in the forecast period are based on management’s assumptions on the expected revenue developments, gross margin and operating margin after allocation of operating expenses from shared units, taking into account management’s expectation of market size and market share development.
Location Technology’s revenue, though impacted by supply shortages (mainly semiconductors) in the automotive industry in the short term, is projected to grow in line with management’s mid- and long-term plan in the forecast period. Given the limited visibility on the longer-term growth, the growth rates in the later years are more subject to uncertainty compared with the earlier years. Gross margin and operating margin projections of each of the segments are consistent with the expected revenue developments. We do not expect that climate related matters will negatively influence our projected cash flow assumptions. Some of our products like our products for electric vehicles and traffic services could even contribute positively to mitigate climate change.
The growth rates after the forecast period as well as the discount rate used is presented in the table below. The input to the group’s key assumptions include those that are based on non-observable market data (level 3 input in accordance with IFRS 13).
FINANCIALS / NOTES TO THE CONSOLIDATED FINANCIAL STATEMENTS / PAGE 87
SECTION 3

2021Location
Technology
Revenue – perpetual growth1 1.0 %
Discount rate2 8.5 %
2020
Revenue – perpetual growth1 1.0 %
Discount rate2 9.5 %1 Weighted average growth rate used to extrapolate cash flows beyond the forecasted period.2 Post-tax discount rate applied to the cash flow projections.
Discount rates used are post-tax and reflect specific risks relating to the relevant operating segments and market uncertainties in general.Management considered the effects of applying a pre-tax approach and concluded that this will not materially change the outcome of the impairment test.Expectations and input to the impairment calculation, as well as the overall outcome, have been compared with the available external information from various analysts, and to the extent available, with market information on recent comparable transactions (merger and acquisition activities of comparable companies).The sensitivity test for Location Technology showed that a reasonably possible change in any of the above-mentioned key assumptions as well as other assumptions in the forecasted period would not cause the fair value less costs of disposal to fall below the level of the carrying value. Also note that the carrying value of our Location Technology segment significantly decreased in 2020 and 2021 following the decrease in Other intangible assets (see note 14).
14 OTHER INTANGIBLE ASSETS
The movements in the intangible assets are as follows:
Cost 1,201,557 135,401 84,962 1,421,920
Accumulated amortization and impairment -843,075 -119,595 -79,090 -1,041,760
Balance as at 1 January 2020 358,482 15,806 5,872 380,160 Of which internally generated2 148,080 15,806 0 163,886
Disposals (net) 0 0 -2 -2
Amortization charges -245,237 -10,776 -5,209 -261,222
Currency translation differences -1,449 0 -12 -1,461
Movements -246,686 -10,776 -5,223 -262,685
Cost 1,198,192 135,370 59,822 1,393,384
Accumulated amortization and impairment -1,086,396 -130,340 -59,173 -1,275,909
Balance as at 31 December 2020 111,796 5,030 649 117,475 Of which internally generated2 104,463 5,030 0 109,493
Amortization charges -41,791 -4,791 -578 -47,160
Currency translation differences 163 0 0 163
Movements -41,628 -4,791 -578 -46,997
Cost 1,109,923 135,472 7,729 1,253,124
Accumulated amortization and impairment -1,039,755 -135,233 -7,658 -1,182,646
Balance as at 31 December 2021 70,168 239 71 70,478 Of which internally generated2 63,285 239 0 63,524
(€ in thousands)
Map content and
mapmaking platform1
Internally generated
technology Other Total
1 The map content represents geographical content data used for the group’s digital map database.2 Internally generated technology does not include a balance relating to technology in development in both 2021
and 2020.
During the year the total gross amount of the assets disposed across all intangible asset classes was €141 million (2020: €25 million). The decrease in amortization is due to the acquired Tele Atlas map databases being fully amortized in 2020. No internal development projects were capitalized in 2021 as they did not meet the capitalization criteria.
FINANCIALS / NOTES TO THE CONSOLIDATED FINANCIAL STATEMENTS / PAGE 88
SECTION 3 / NON-CURRENT ASSETS AND INVESTMENTS CONTINUED
ACCOUNTING POLICY
Other intangible assetsOther intangible assets includes assets that have been acquired, either through individual asset acquisitions or through business combinations, and assets that have been generated internally, such as the group’s core technology and geographical content database.Internally generated intangible assetsInternal development costs for core technology are recognized as an intangible asset if, and only if, all of the following have been demonstrated:• The technical feasibility to complete the project.• The intention to complete the intangible asset, and use or sell it.• The ability to use or sell the intangible asset.• How the intangible asset will generate probable future economic benefits.• The availability of adequate resources to complete the project.• The cost of developing the asset can be measured reliably.
Internally generated databases are capitalized until a certain level of map quality is reached and ongoing activities focus on maintenance. Internal software costs relating to development of non-core software with an estimated average useful life of less than one year and engineering costs relating to the detailed manufacturing design of new products are expensed in the period in which they are incurred.The amount initially recognized for internally generated intangible assets is the sum of the expenditure incurred from the date when the intangible asset first meets the recognition criteria listed above. All expenditures on research activities are expensed in the income statement as incurred.
Acquired intangible assetsIntangible assets acquired separately are initially recognized at cost, including directly attributable costs to bring the asset to its intended use. Intangible assets acquired in a business combination are identified and recognized separately from goodwill when they satisfy the definition of an intangible asset and their fair values can be measured reliably.The cost of such intangible assets is their fair value at the acquisition date.All intangible assets are subsequently carried at cost less accumulated amortization and accumulated impairment losses.
The amortization of other intangible assets is recorded on a straight-line basis over the following estimated useful lives as follows:• Map content and mapmaking platform: 5-12 years.• Internally generated core technology: 3-6 years.• Acquired technology: 3-5 years.• Customer relationships: 5-13 years.• Computer software: 2-5 years.
ImpairmentIntangible assets which have an indefinite useful life and intangible assets not yet ready for use are tested for impairment at least annually, or whenever management identifies conditions that may indicate a risk of impairment. Assets that are subject to amortization are tested for impairment whenever events or changes in circumstances indicate that the carrying amount may not be recoverable.
Testing is conducted as per the policy outlined in note 13.
Non-financial assets, other than goodwill, which have been subject to an impairment, are reviewed for possible reversal of the impairment at each reporting date.
SIGNIFICANT ESTIMATES
Management made use of assumptions and judgment in assessing the expected future economic benefits that can be attributed to the internally generated technology, databases and tools, as well as their expected useful lives. For internally generated databases, assumptions are also made on the level of completion, at which point the capitalization is discontinued and future activities are considered to be maintenance.Such estimates are made on a regular basis, as they can be significantly affected by changes in technology and other factors.
Impairment of intangible assetsNo impairment charge has been recorded for other intangible assets in either period presented.
FINANCIALS / NOTES TO THE CONSOLIDATED FINANCIAL STATEMENTS / PAGE 89
SECTION 3 / NON-CURRENT ASSETS AND INVESTMENTS CONTINUED
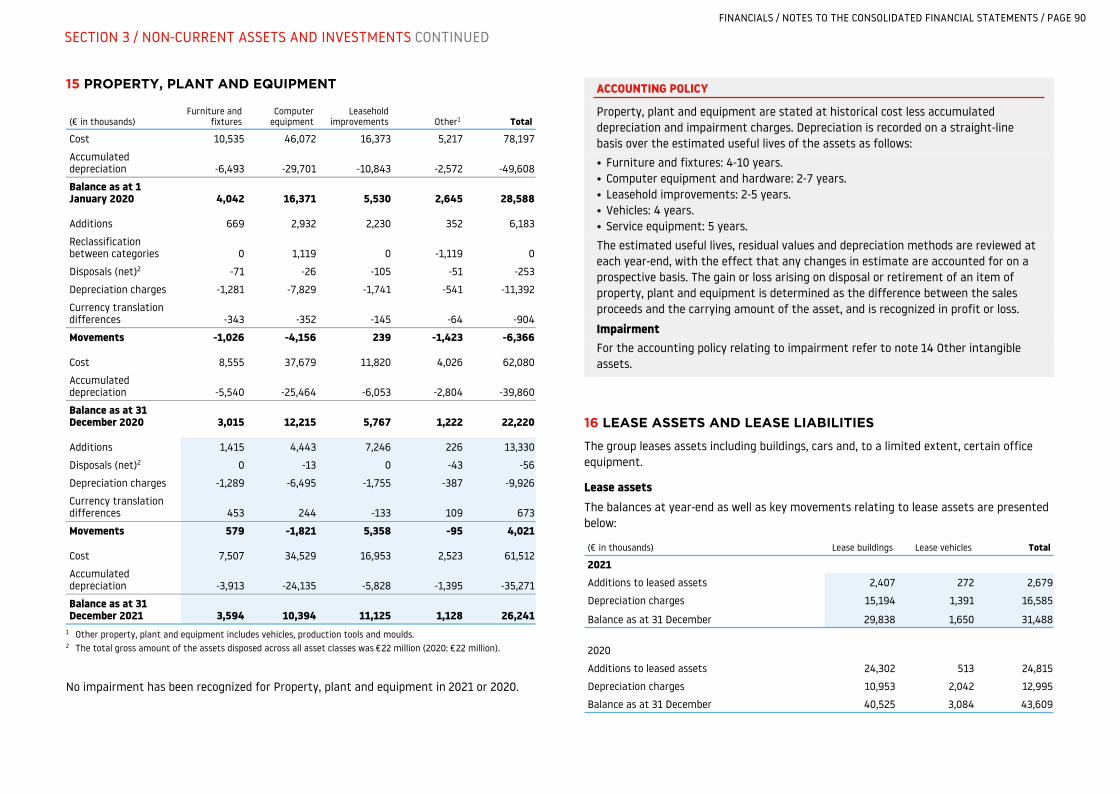
15 PROPERTY, PLANT AND EQUIPMENT
(€ in thousands)Furniture and
fixturesComputer
equipmentLeasehold
improvements Other1 Total
Cost 10,535 46,072 16,373 5,217 78,197
Accumulated depreciation -6,493 -29,701 -10,843 -2,572 -49,608
Balance as at 1 January 2020 4,042 16,371 5,530 2,645 28,588
Additions 669 2,932 2,230 352 6,183
Reclassification between categories 0 1,119 0 -1,119 0
Disposals (net)2 -71 -26 -105 -51 -253
Depreciation charges -1,281 -7,829 -1,741 -541 -11,392
Currency translation differences -343 -352 -145 -64 -904
Movements -1,026 -4,156 239 -1,423 -6,366
Cost 8,555 37,679 11,820 4,026 62,080
Accumulated depreciation -5,540 -25,464 -6,053 -2,804 -39,860
Balance as at 31 December 2020 3,015 12,215 5,767 1,222 22,220
Additions 1,415 4,443 7,246 226 13,330
Disposals (net)2 0 -13 0 -43 -56
Depreciation charges -1,289 -6,495 -1,755 -387 -9,926
Currency translation differences 453 244 -133 109 673
Movements 579 -1,821 5,358 -95 4,021
Cost 7,507 34,529 16,953 2,523 61,512
Accumulated depreciation -3,913 -24,135 -5,828 -1,395 -35,271
Balance as at 31 December 2021 3,594 10,394 11,125 1,128 26,241
1 Other property, plant and equipment includes vehicles, production tools and moulds.2 The total gross amount of the assets disposed across all asset classes was €22 million (2020: €22 million).
No impairment has been recognized for Property, plant and equipment in 2021 or 2020.
ACCOUNTING POLICY
Property, plant and equipment are stated at historical cost less accumulated depreciation and impairment charges. Depreciation is recorded on a straight-line basis over the estimated useful lives of the assets as follows:
• Furniture and fixtures: 4-10 years.• Computer equipment and hardware: 2-7 years.• Leasehold improvements: 2-5 years.• Vehicles: 4 years.• Service equipment: 5 years.
The estimated useful lives, residual values and depreciation methods are reviewed at each year-end, with the effect that any changes in estimate are accounted for on a prospective basis. The gain or loss arising on disposal or retirement of an item of property, plant and equipment is determined as the difference between the sales proceeds and the carrying amount of the asset, and is recognized in profit or loss.
ImpairmentFor the accounting policy relating to impairment refer to note 14 Other intangible assets.
16 LEASE ASSETS AND LEASE LIABILITIES
The group leases assets including buildings, cars and, to a limited extent, certain office equipment.
Lease assetsThe balances at year-end as well as key movements relating to lease assets are presented below:
2021Additions to leased assets 2,407 272 2,679
Depreciation charges 15,194 1,391 16,585
Balance as at 31 December 29,838 1,650 31,488
2020
Additions to leased assets 24,302 513 24,815
Depreciation charges 10,953 2,042 12,995
Balance as at 31 December 40,525 3,084 43,609
(€ in thousands) Lease buildings Lease vehicles Total
FINANCIALS / NOTES TO THE CONSOLIDATED FINANCIAL STATEMENTS / PAGE 90
SECTION 3 / NON-CURRENT ASSETS AND INVESTMENTS CONTINUED

Lease buildings
Buildings are leased for office space for periods of approximately of 2-5 years. Leases for office buildings typically include an option, exercisable by the group as lessee up to one year before the end of the cancellable lease term, to renew the lease for an additional period of the same duration after the end of the contract term.
At the end of the year, the group had options to extend lease contracts for leased buildings which represent potential discounted future lease payments not included in lease liabilities of €38 million (2020: €34 million).
Most real estate leases include annual escalation clauses with reference to an index or contractual rate.
Other leases
The group leases vehicles for qualifying employees with a standard lease term of four years. The group does not purchase or guarantee the value of lease vehicles.
In some cases the group leases furniture and office equipment with terms of 1-3 years. The group considers these assets to be of low-value or short-term in nature and therefore no right-of use assets and lease liabilities are recognized for these leases.
Expenses recognized relating to short-term leases and leases of low value during 2021 was €0.2 million and €0.5 million respectively (2020: €1.4 million and €0.6 million).
Lease liabilitiesThe total interest expense on lease liabilities in 2021 was €0.9 million (2020: €0.8 million) and the total cash outflow for lease related payments was €16 million (2020: €16 million). Lease liabilities have the following maturities:
(€ in thousands) 2021 2020Less than 1 year 14,059 14,638
Between 1-5 years 19,336 27,061
More than 5 years 1,473 2,900
Total undiscounted lease liabilities at 31 December 34,868 44,599
ACCOUNTING POLICY
Leases as a lesseeA contract is classified as a lease at the inception of the contract, if the contract conveys the right to control the use of an identified asset for a period in exchange for consideration.The group recognizes a right-of-use asset (lease asset) and a lease liability at the lease commencement date. The asset is initially measured at cost, which comprises the initial amount of the lease liability adjusted for any lease payments made at or before the commencement date, plus any initial direct costs incurred and an estimate of costs to restore the underlying asset, less any lease incentives received.
The lease asset is subsequently depreciated using the straight-line method from the commencement date to the end of the useful life of the right-of-use asset, considered to be indicated by the lease term. The lease asset is periodically adjusted for certain remeasurements of the lease liability and impairment losses (if any). The lease liability is initially measured at the present value of outstanding lease payments, discounted using the interest rate implicit in the lease or, if that rate cannot be readily determined, the group’s incremental borrowing rate. Generally, the group uses its incremental borrowing rate as the discount rate. The group separates payments for lease cars into lease components and non-lease components.
The lease liability is measured at amortized cost using the effective interest method and is remeasured when there is a change in future lease payments arising from a change in an index or rate or if the group changes its assessment of whether it will exercise a purchase, extension or termination option. A corresponding adjustment is made to the carrying amount of the right-of-use asset with any excess over the carrying amount of the asset being recognized in profit or loss.
Short-term leases and leases of low value assetsThe group has elected not to recognize lease assets and lease liabilities for short-term (term of 12 months or less) leases and leases of low-value assets, including IT equipment. The group recognizes the lease payments associated with these leases as an expense on a straight-line basis over the lease term.
Extension optionsExtension options are mainly applicable to leased buildings.The group assesses whether it is reasonably certain to exercise the options at lease commencement and subsequently, if there is a change in circumstances within its control. Such assessment involves management judgment and estimate based on information at the time the assessments are made.
Extension options are included in the lease term when the group has an economic incentive to exercise the option. The group considers available evidence at the time of the assessment, including potential favorable terms upon extension, potential termination penalties, the relative costs associated with potential relocation or termination of the lease and the extent of leasehold improvements undertaken.The size and the relative importance of the lease premises as well as the availability of easily substitutable assets is taken into consideration when assessing whether the group has an economic incentive to extend a lease for which it holds an option to do so.
FINANCIALS / NOTES TO THE CONSOLIDATED FINANCIAL STATEMENTS / PAGE 91
SECTION 3 / NON-CURRENT ASSETS AND INVESTMENTS CONTINUED
17 OTHER INVESTMENTS
The group held an equity interest in Cyient Ltd. (Cyient). Effective from 1 January 2020 the group changed the classification of its investment in Cyient Ltd. from an associate to a financial asset held at fair value as the conditions to treat this as an associate were no longer met. This change in classification resulted in a one-off gain of €3.1 million during 2020, included in 'Other financial result'. The group has elected to account for future changes in fair value through other comprehensive income. Total amount of fair value changes recognized during 2021 in other comprehensive income amounted to €6.8 million (2020: €0.8 million) net of tax. For accounting policies relating to financial assets at fair value, reference is made to note 28.
FINANCIALS / NOTES TO THE CONSOLIDATED FINANCIAL STATEMENTS / PAGE 92
SECTION 3 / NON-CURRENT ASSETS AND INVESTMENTS CONTINUED
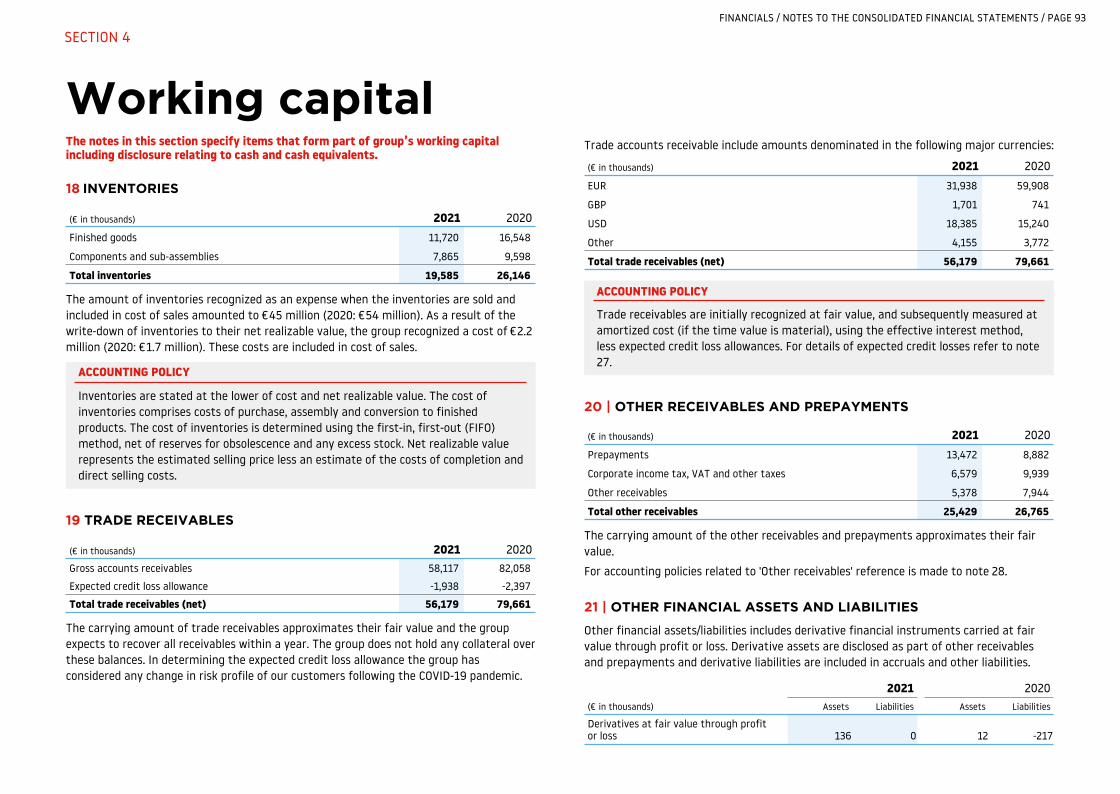
Working capital The notes in this section specify items that form part of group’s working capital including disclosure relating to cash and cash equivalents.
18 INVENTORIES
Finished goods 11,720 16,548
Components and sub-assemblies 7,865 9,598
Total inventories 19,585 26,146
(€ in thousands) 2021 2020
The amount of inventories recognized as an expense when the inventories are sold and included in cost of sales amounted to €45 million (2020: €54 million). As a result of the write-down of inventories to their net realizable value, the group recognized a cost of €2.2 million (2020: €1.7 million). These costs are included in cost of sales.
ACCOUNTING POLICY
Inventories are stated at the lower of cost and net realizable value. The cost of inventories comprises costs of purchase, assembly and conversion to finished products. The cost of inventories is determined using the first-in, first-out (FIFO) method, net of reserves for obsolescence and any excess stock. Net realizable value represents the estimated selling price less an estimate of the costs of completion and direct selling costs.
19 TRADE RECEIVABLES
Gross accounts receivables 58,117 82,058
Expected credit loss allowance -1,938 -2,397
Total trade receivables (net) 56,179 79,661
(€ in thousands) 2021 2020
The carrying amount of trade receivables approximates their fair value and the group expects to recover all receivables within a year. The group does not hold any collateral over these balances. In determining the expected credit loss allowance the group has considered any change in risk profile of our customers following the COVID-19 pandemic.
Trade accounts receivable include amounts denominated in the following major currencies:
EUR 31,938 59,908
GBP 1,701 741
USD 18,385 15,240
Other 4,155 3,772
Total trade receivables (net) 56,179 79,661
(€ in thousands) 2021 2020
ACCOUNTING POLICY
Trade receivables are initially recognized at fair value, and subsequently measured at amortized cost (if the time value is material), using the effective interest method, less expected credit loss allowances. For details of expected credit losses refer to note 27.
20 | OTHER RECEIVABLES AND PREPAYMENTS
Prepayments 13,472 8,882
Corporate income tax, VAT and other taxes 6,579 9,939
Other receivables 5,378 7,944
Total other receivables 25,429 26,765
(€ in thousands) 2021 2020
The carrying amount of the other receivables and prepayments approximates their fair value.
For accounting policies related to 'Other receivables' reference is made to note 28.
21 | OTHER FINANCIAL ASSETS AND LIABILITIES
Other financial assets/liabilities includes derivative financial instruments carried at fair value through profit or loss. Derivative assets are disclosed as part of other receivables and prepayments and derivative liabilities are included in accruals and other liabilities.
Assets Liabilities Assets Liabilities
Derivatives at fair value through profit or loss 136 0 12 -217
(€ in thousands)
2021 2020
FINANCIALS / NOTES TO THE CONSOLIDATED FINANCIAL STATEMENTS / PAGE 93
SECTION 4
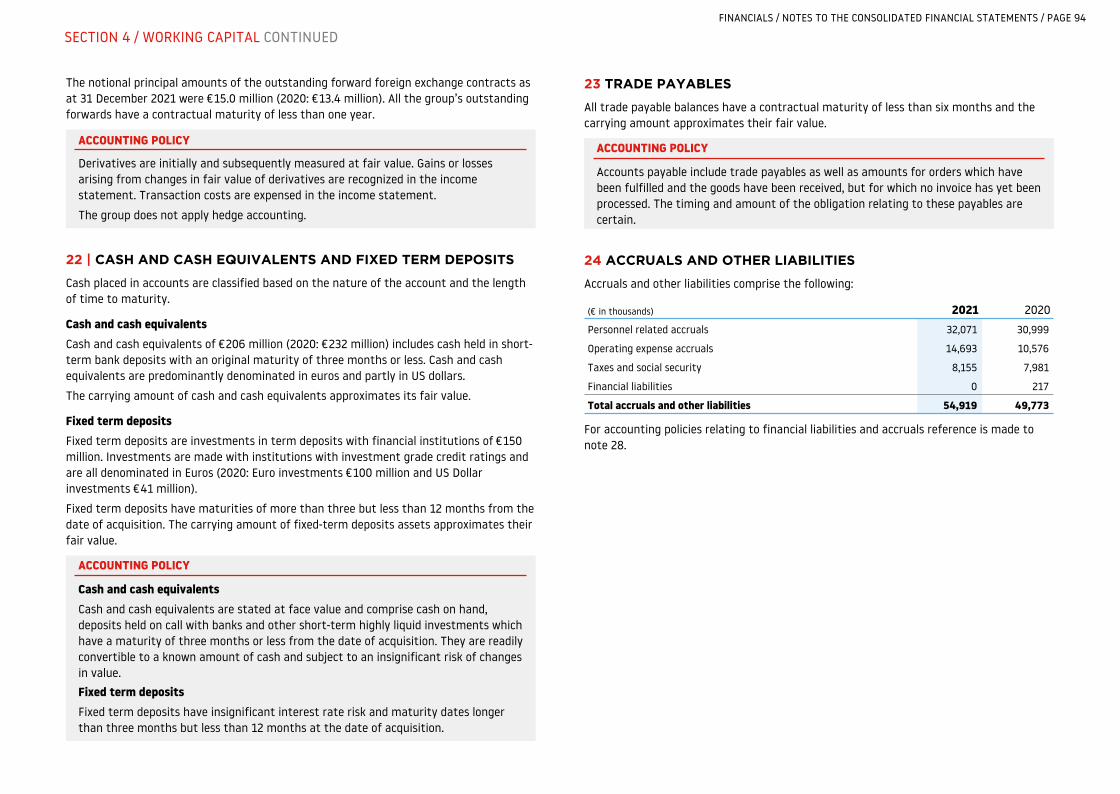
The notional principal amounts of the outstanding forward foreign exchange contracts as at 31 December 2021 were €15.0 million (2020: €13.4 million). All the group’s outstanding forwards have a contractual maturity of less than one year.
ACCOUNTING POLICY
Derivatives are initially and subsequently measured at fair value. Gains or losses arising from changes in fair value of derivatives are recognized in the income statement. Transaction costs are expensed in the income statement.
The group does not apply hedge accounting.
22 | CASH AND CASH EQUIVALENTS AND FIXED TERM DEPOSITS
Cash placed in accounts are classified based on the nature of the account and the length of time to maturity.
Cash and cash equivalentsCash and cash equivalents of €206 million (2020: €232 million) includes cash held in short-term bank deposits with an original maturity of three months or less. Cash and cash equivalents are predominantly denominated in euros and partly in US dollars.
The carrying amount of cash and cash equivalents approximates its fair value.
Fixed term depositsFixed term deposits are investments in term deposits with financial institutions of €150 million. Investments are made with institutions with investment grade credit ratings and are all denominated in Euros (2020: Euro investments €100 million and US Dollar investments €41 million).
Fixed term deposits have maturities of more than three but less than 12 months from the date of acquisition. The carrying amount of fixed-term deposits assets approximates their fair value.
ACCOUNTING POLICY
Cash and cash equivalentsCash and cash equivalents are stated at face value and comprise cash on hand, deposits held on call with banks and other short-term highly liquid investments which have a maturity of three months or less from the date of acquisition. They are readily convertible to a known amount of cash and subject to an insignificant risk of changes in value.
Fixed term depositsFixed term deposits have insignificant interest rate risk and maturity dates longer than three months but less than 12 months at the date of acquisition.
23 TRADE PAYABLES
All trade payable balances have a contractual maturity of less than six months and the carrying amount approximates their fair value.
ACCOUNTING POLICY
Accounts payable include trade payables as well as amounts for orders which have been fulfilled and the goods have been received, but for which no invoice has yet been processed. The timing and amount of the obligation relating to these payables are certain.
24 ACCRUALS AND OTHER LIABILITIES
Accruals and other liabilities comprise the following:
Personnel related accruals 32,071 30,999
Operating expense accruals 14,693 10,576
Taxes and social security 8,155 7,981
Financial liabilities 0 217
Total accruals and other liabilities 54,919 49,773
(€ in thousands) 2021 2020
For accounting policies relating to financial liabilities and accruals reference is made to note 28.
FINANCIALS / NOTES TO THE CONSOLIDATED FINANCIAL STATEMENTS / PAGE 94
SECTION 4 / WORKING CAPITAL CONTINUED
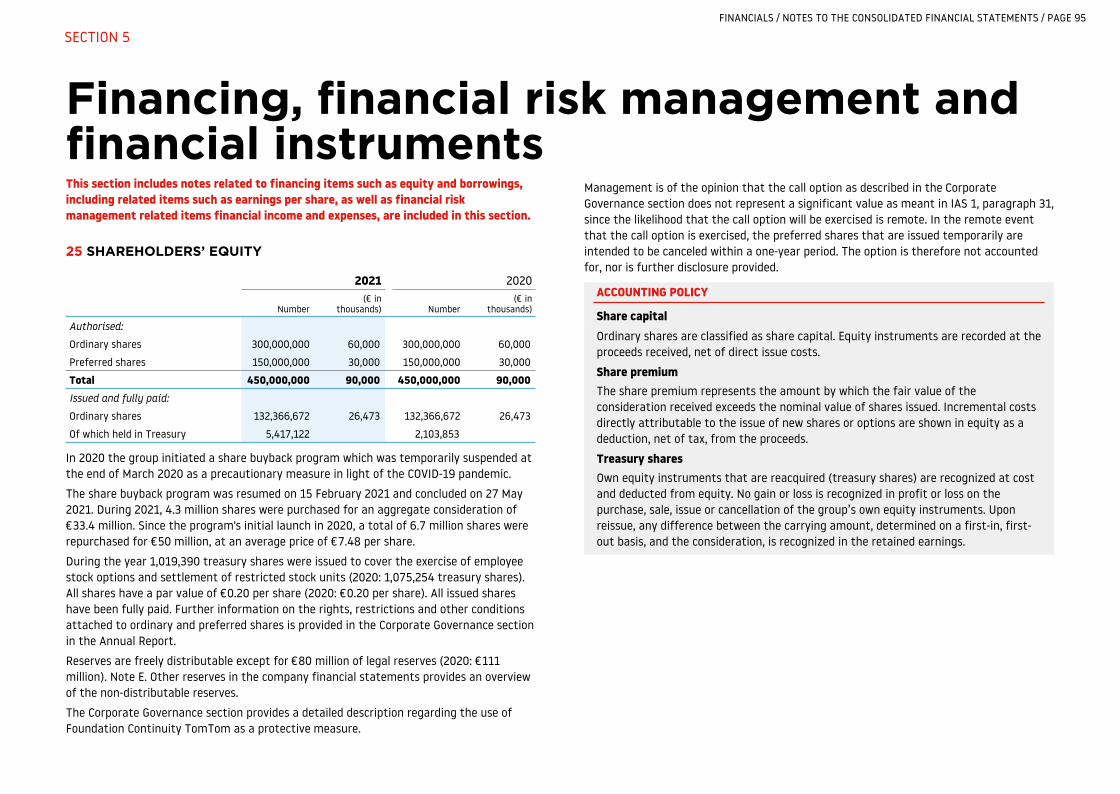
Financing, financial risk management and financial instruments This section includes notes related to financing items such as equity and borrowings, including related items such as earnings per share, as well as financial risk management related items financial income and expenses, are included in this section.
25 SHAREHOLDERS’ EQUITY
Authorised:
Ordinary shares 300,000,000 60,000 300,000,000 60,000
Preferred shares 150,000,000 30,000 150,000,000 30,000
Total 450,000,000 90,000 450,000,000 90,000 Issued and fully paid:
Ordinary shares 132,366,672 26,473 132,366,672 26,473
Of which held in Treasury 5,417,122 2,103,853
2021 2020
Number(€ in
thousands) Number(€ in
thousands)
In 2020 the group initiated a share buyback program which was temporarily suspended at the end of March 2020 as a precautionary measure in light of the COVID-19 pandemic.
The share buyback program was resumed on 15 February 2021 and concluded on 27 May 2021. During 2021, 4.3 million shares were purchased for an aggregate consideration of €33.4 million. Since the program's initial launch in 2020, a total of 6.7 million shares were repurchased for €50 million, at an average price of €7.48 per share.
During the year 1,019,390 treasury shares were issued to cover the exercise of employee stock options and settlement of restricted stock units (2020: 1,075,254 treasury shares). All shares have a par value of €0.20 per share (2020: €0.20 per share). All issued shares have been fully paid. Further information on the rights, restrictions and other conditions attached to ordinary and preferred shares is provided in the Corporate Governance section in the Annual Report.
Reserves are freely distributable except for €80 million of legal reserves (2020: €111 million). Note E. Other reserves in the company financial statements provides an overview of the non-distributable reserves.
The Corporate Governance section provides a detailed description regarding the use of Foundation Continuity TomTom as a protective measure.
Management is of the opinion that the call option as described in the Corporate Governance section does not represent a significant value as meant in IAS 1, paragraph 31, since the likelihood that the call option will be exercised is remote. In the remote event that the call option is exercised, the preferred shares that are issued temporarily are intended to be canceled within a one-year period. The option is therefore not accounted for, nor is further disclosure provided.
ACCOUNTING POLICY
Share capitalOrdinary shares are classified as share capital. Equity instruments are recorded at the proceeds received, net of direct issue costs.
Share premiumThe share premium represents the amount by which the fair value of the consideration received exceeds the nominal value of shares issued. Incremental costs directly attributable to the issue of new shares or options are shown in equity as a deduction, net of tax, from the proceeds.
Treasury sharesOwn equity instruments that are reacquired (treasury shares) are recognized at cost and deducted from equity. No gain or loss is recognized in profit or loss on the purchase, sale, issue or cancellation of the group’s own equity instruments. Upon reissue, any difference between the carrying amount, determined on a first-in, first-out basis, and the consideration, is recognized in the retained earnings.
FINANCIALS / NOTES TO THE CONSOLIDATED FINANCIAL STATEMENTS / PAGE 95
SECTION 5

26 EARNINGS PER SHARE
The calculation of basic and diluted earnings per share is based on the following data:
Net result attributable to ordinary equity holders -94,653 -257,639
Number of sharesWeighted average number of ordinary shares for basic earnings per share 127,714 130,562
Effect of dilutive potential ordinary sharesStock options and restricted stock units 1,716 1,144
Weighted average number of ordinary shares for diluted earnings per share 129,430 131,706
Earnings per share (€)Basic -0.74 -1.97
Diluted -0.74 -1.97
(€ in thousands) 2021 2020
ACCOUNTING POLICY
Basic earnings per shareBasic earnings per share is calculated by dividing the profit attributable to equity holders of the company by the weighted average number of ordinary shares outstanding during the year. Treasury shares are deducted from the number of ordinary shares outstanding on a weighted average basis.Diluted earnings per shareDiluted earnings per share is calculated by adjusting the weighted average number of ordinary shares outstanding to assume conversion of all dilutive potential ordinary shares arising from stock options and other equity-settled stock compensation plans. When the effect of the equity-settled stock compensation plans is anti-dilutive, the number is excluded from the calculation of diluted earnings.
27 FINANCIAL RISK MANAGEMENT
The group’s activities result in exposure to a variety of financial risks including credit, foreign currency, liquidity, interest rate and capital risk. Management policies have been established to identify, analyze and monitor these risks, and to set appropriate risk limits and controls. Financial risk management is carried out in accordance with our Corporate Treasury Policy. The written principles and policies are reviewed periodically to reflect changes in market conditions, the activities of the business and laws and regulations affecting the group’s business.
CreditCredit risk arises primarily from cash and cash equivalents and investments held at financial institutions and, to a certain extent, from trade receivables and contract assets.
Cash balances are held with counterparties that have a credit risk rating of at least BBB-, as rated by an acknowledged rating agency. Moreover, to avoid significant concentration of exposure to particular financial institutions, we ensure that transactions and businesses are properly spread among different counterparties.
The group’s exposure from its customers is managed through establishing proper credit limits and continuous credit risk assessments for each individual customer.
Procedures include aligning credit and trading terms and conditions with an assessment of the individual characteristics and risk profile of each customer. This assessment is made based on past experiences and independent ratings from external rating agencies whenever available.
Management actively monitors the credit risk related to these customers, also taking into account the effects of COVID-19 and takes proactive action to reduce credit limits if required.
The following table summarizes the movement in the expected credit loss allowances for both trade receivables and unbilled receivables:
Balance as at 1 January -2,702 -2,714
Additions to provision -1,203 -1,239
Receivables written off during the year as uncollectible 982 52
Unused amounts reversed 737 1,208
Currency translation differences -27 -10
Balance as at 31 December -2,213 -2,702
(€ in thousands) 2021 2020
FINANCIALS / NOTES TO THE CONSOLIDATED FINANCIAL STATEMENTS / PAGE 96
SECTION 5 / FINANCING, FINANCIAL RISK MANAGEMENT AND FINANCIAL INSTRUMENTS CONTINUED
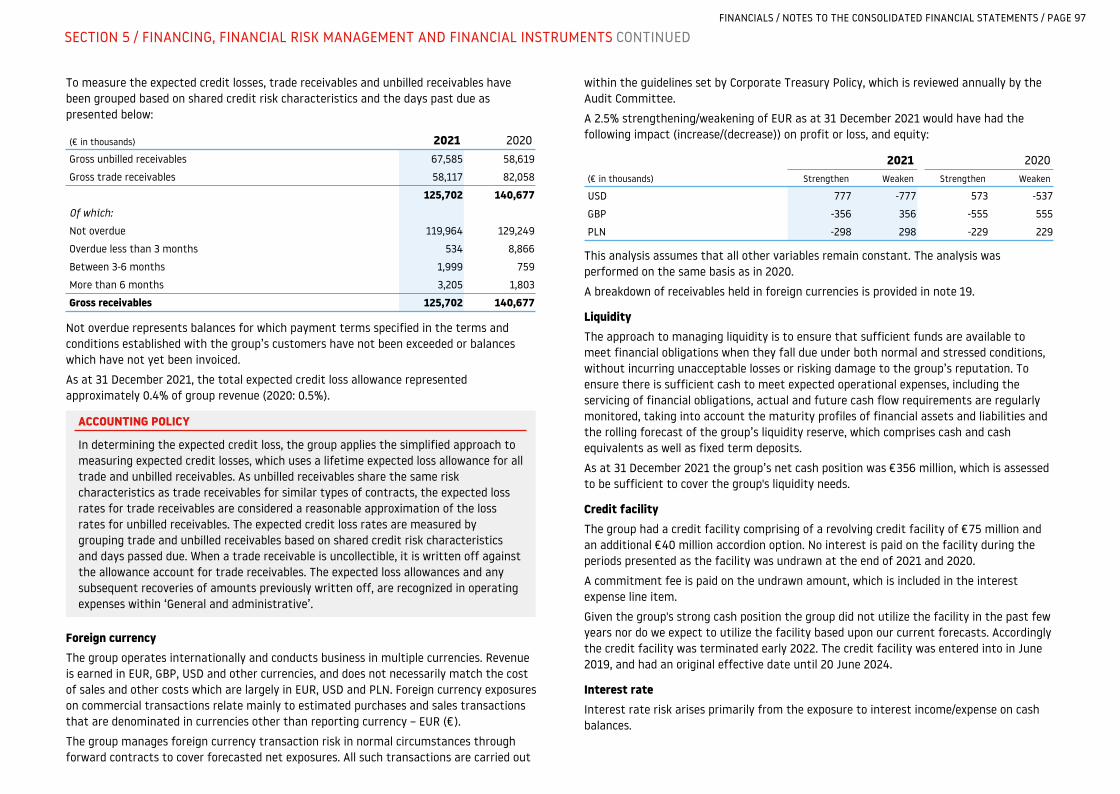
To measure the expected credit losses, trade receivables and unbilled receivables have been grouped based on shared credit risk characteristics and the days past due as presented below:
Gross unbilled receivables 67,585 58,619
Gross trade receivables 58,117 82,058
125,702 140,677 Of which:
Not overdue 119,964 129,249
Overdue less than 3 months 534 8,866
Between 3-6 months 1,999 759
More than 6 months 3,205 1,803
Gross receivables 125,702 140,677
(€ in thousands) 2021 2020
Not overdue represents balances for which payment terms specified in the terms and conditions established with the group’s customers have not been exceeded or balances which have not yet been invoiced.
As at 31 December 2021, the total expected credit loss allowance represented approximately 0.4% of group revenue (2020: 0.5%).
ACCOUNTING POLICY
In determining the expected credit loss, the group applies the simplified approach to measuring expected credit losses, which uses a lifetime expected loss allowance for all trade and unbilled receivables. As unbilled receivables share the same risk characteristics as trade receivables for similar types of contracts, the expected loss rates for trade receivables are considered a reasonable approximation of the loss rates for unbilled receivables. The expected credit loss rates are measured by grouping trade and unbilled receivables based on shared credit risk characteristics and days passed due. When a trade receivable is uncollectible, it is written off against the allowance account for trade receivables. The expected loss allowances and any subsequent recoveries of amounts previously written off, are recognized in operating expenses within ‘General and administrative’.
Foreign currencyThe group operates internationally and conducts business in multiple currencies. Revenue is earned in EUR, GBP, USD and other currencies, and does not necessarily match the cost of sales and other costs which are largely in EUR, USD and PLN. Foreign currency exposures on commercial transactions relate mainly to estimated purchases and sales transactions that are denominated in currencies other than reporting currency – EUR (€).
The group manages foreign currency transaction risk in normal circumstances through forward contracts to cover forecasted net exposures. All such transactions are carried out
within the guidelines set by Corporate Treasury Policy, which is reviewed annually by the Audit Committee.
A 2.5% strengthening/weakening of EUR as at 31 December 2021 would have had the following impact (increase/(decrease)) on profit or loss, and equity:
USD 777 -777 573 -537
GBP -356 356 -555 555
PLN -298 298 -229 229
(€ in thousands)
2021 2020Strengthen Weaken Strengthen Weaken
This analysis assumes that all other variables remain constant. The analysis was performed on the same basis as in 2020.
A breakdown of receivables held in foreign currencies is provided in note 19.
LiquidityThe approach to managing liquidity is to ensure that sufficient funds are available to meet financial obligations when they fall due under both normal and stressed conditions, without incurring unacceptable losses or risking damage to the group’s reputation. To ensure there is sufficient cash to meet expected operational expenses, including the servicing of financial obligations, actual and future cash flow requirements are regularly monitored, taking into account the maturity profiles of financial assets and liabilities and the rolling forecast of the group’s liquidity reserve, which comprises cash and cash equivalents as well as fixed term deposits.
As at 31 December 2021 the group’s net cash position was €356 million, which is assessed to be sufficient to cover the group's liquidity needs.
Credit facilityThe group had a credit facility comprising of a revolving credit facility of €75 million and an additional €40 million accordion option. No interest is paid on the facility during the periods presented as the facility was undrawn at the end of 2021 and 2020.
A commitment fee is paid on the undrawn amount, which is included in the interest expense line item.
Given the group's strong cash position the group did not utilize the facility in the past few years nor do we expect to utilize the facility based upon our current forecasts. Accordingly the credit facility was terminated early 2022. The credit facility was entered into in June 2019, and had an original effective date until 20 June 2024.
Interest rateInterest rate risk arises primarily from the exposure to interest income/expense on cash balances.
FINANCIALS / NOTES TO THE CONSOLIDATED FINANCIAL STATEMENTS / PAGE 97
SECTION 5 / FINANCING, FINANCIAL RISK MANAGEMENT AND FINANCIAL INSTRUMENTS CONTINUED

Our intention is to prioritize capital preservation and when possible we invest our surplus cash using approved investment instruments, such as bank deposits and money market fund investments. All transactions and counterparty risk limits are governed by the Corporate Treasury Policy.
CapitalThe group’s financing policy aims to maintain a capital structure that enables the group to achieve its strategic objectives and daily operational needs, and to safeguard the group’s ability to continue as a going concern.
In order to maintain or adjust the capital structure, the group may issue new shares, adjust its dividend policy, return capital to shareholders or take on new debt.
As at 31 December 2021, the group had a net cash position of €356 million (2020: €372 million).
For further quantitative disclosures in respect of liquidity, interest rate and capital risks, reference is made to note 22 and note 25.
28 FINANCIAL INSTRUMENTS
The group holds the following financial instruments for which additional disclosures are provided in the notes as indicated:
Financial assetsFinancial assets at amortized cost
Trade receivables 19 56,179 79,661
Fixed-term deposits 22 150,000 140,930
Cash and cash equivalents 22 205,820 231,520
Financial assets at fair value through profit or loss
Derivative instruments 21 136 12
Financial assets at fair value through other comprehensive income
Other investments 17,982 8,733
Total financial assets 430,117 460,856
Financial liabilitiesFinancial liabilities at amortized cost
Trade payables 23 14,022 21,998
Lease liabilities 16 33,339 43,673
Financial liabilities at fair value through profit or loss
Derivative instruments 21 0 217
Total financial liabilities 47,361 65,888
(€ in thousands) Note 2021 2020
Refer to note 27 for disclosure of group’s exposure to risks associated with financial instruments.
FINANCIALS / NOTES TO THE CONSOLIDATED FINANCIAL STATEMENTS / PAGE 98
SECTION 5 / FINANCING, FINANCIAL RISK MANAGEMENT AND FINANCIAL INSTRUMENTS CONTINUED
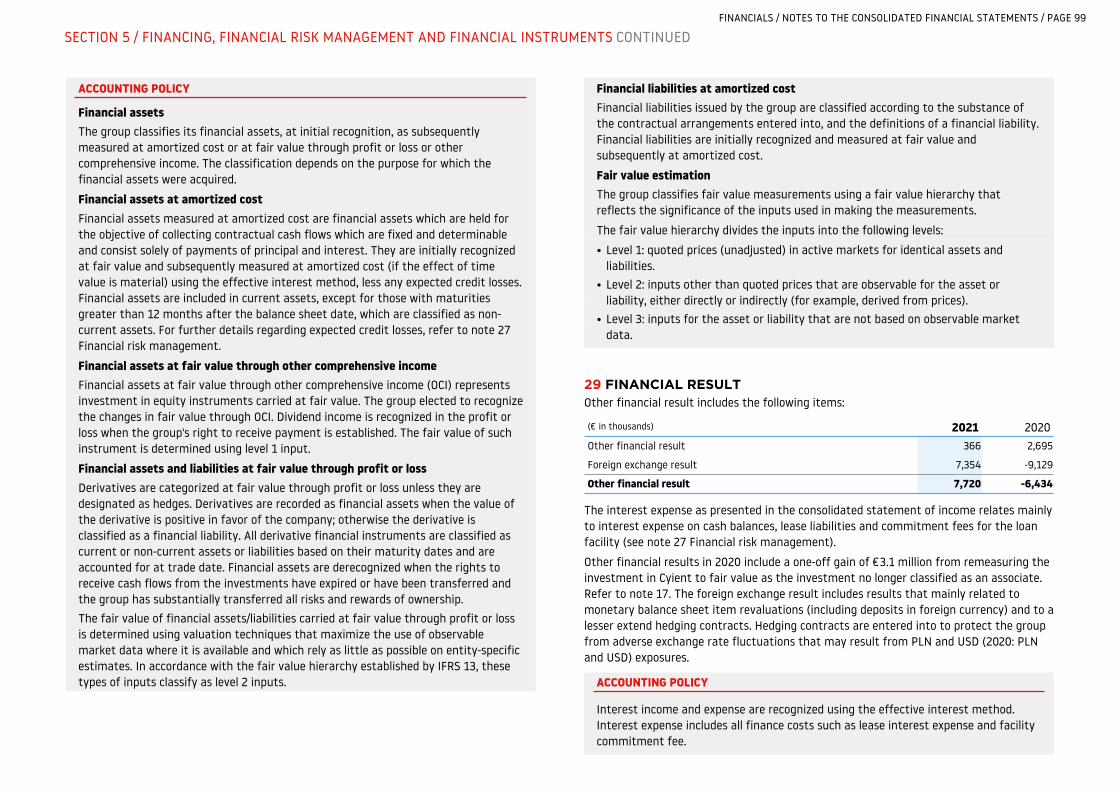
ACCOUNTING POLICY
Financial assetsThe group classifies its financial assets, at initial recognition, as subsequently measured at amortized cost or at fair value through profit or loss or other comprehensive income. The classification depends on the purpose for which the financial assets were acquired.
Financial assets at amortized costFinancial assets measured at amortized cost are financial assets which are held for the objective of collecting contractual cash flows which are fixed and determinable and consist solely of payments of principal and interest. They are initially recognized at fair value and subsequently measured at amortized cost (if the effect of time value is material) using the effective interest method, less any expected credit losses. Financial assets are included in current assets, except for those with maturities greater than 12 months after the balance sheet date, which are classified as non-current assets. For further details regarding expected credit losses, refer to note 27 Financial risk management.
Financial assets at fair value through other comprehensive incomeFinancial assets at fair value through other comprehensive income (OCI) represents investment in equity instruments carried at fair value. The group elected to recognize the changes in fair value through OCI. Dividend income is recognized in the profit or loss when the group's right to receive payment is established. The fair value of such instrument is determined using level 1 input.
Financial assets and liabilities at fair value through profit or lossDerivatives are categorized at fair value through profit or loss unless they are designated as hedges. Derivatives are recorded as financial assets when the value of the derivative is positive in favor of the company; otherwise the derivative is classified as a financial liability. All derivative financial instruments are classified as current or non-current assets or liabilities based on their maturity dates and are accounted for at trade date. Financial assets are derecognized when the rights to receive cash flows from the investments have expired or have been transferred and the group has substantially transferred all risks and rewards of ownership.
The fair value of financial assets/liabilities carried at fair value through profit or loss is determined using valuation techniques that maximize the use of observable market data where it is available and which rely as little as possible on entity-specific estimates. In accordance with the fair value hierarchy established by IFRS 13, these types of inputs classify as level 2 inputs.
Financial liabilities at amortized costFinancial liabilities issued by the group are classified according to the substance of the contractual arrangements entered into, and the definitions of a financial liability. Financial liabilities are initially recognized and measured at fair value and subsequently at amortized cost.
Fair value estimationThe group classifies fair value measurements using a fair value hierarchy that reflects the significance of the inputs used in making the measurements.
The fair value hierarchy divides the inputs into the following levels:
• Level 1: quoted prices (unadjusted) in active markets for identical assets and liabilities.
• Level 2: inputs other than quoted prices that are observable for the asset or liability, either directly or indirectly (for example, derived from prices).
• Level 3: inputs for the asset or liability that are not based on observable market data.
29 FINANCIAL RESULT Other financial result includes the following items:
Other financial result 366 2,695
Foreign exchange result 7,354 -9,129
Other financial result 7,720 -6,434
(€ in thousands) 2021 2020
The interest expense as presented in the consolidated statement of income relates mainly to interest expense on cash balances, lease liabilities and commitment fees for the loan facility (see note 27 Financial risk management).
Other financial results in 2020 include a one-off gain of €3.1 million from remeasuring the investment in Cyient to fair value as the investment no longer classified as an associate. Refer to note 17. The foreign exchange result includes results that mainly related to monetary balance sheet item revaluations (including deposits in foreign currency) and to a lesser extend hedging contracts. Hedging contracts are entered into to protect the group from adverse exchange rate fluctuations that may result from PLN and USD (2020: PLN and USD) exposures.
ACCOUNTING POLICY
Interest income and expense are recognized using the effective interest method. Interest expense includes all finance costs such as lease interest expense and facility commitment fee.
FINANCIALS / NOTES TO THE CONSOLIDATED FINANCIAL STATEMENTS / PAGE 99
SECTION 5 / FINANCING, FINANCIAL RISK MANAGEMENT AND FINANCIAL INSTRUMENTS CONTINUED

Other disclosures This section includes the notes on provisions, commitments and contingent liabilities, remunerations of members of the Management Board and the Supervisory Board, related party transactions and auditor’s remuneration.
30 PROVISIONS
Non-current 33,484 41,014
Current 6,537 7,918
Total provisions 40,021 48,932
(€ in thousands) 2021 2020
The movements in each category of provisions are as follows:
Balance as at 1 January 2020 13,439 20,198 21,383 0 55,020
Increases in provisions 1,419 431 2,121 5,508 9,479
Utilized -3,067 0 -610 -1,975 -5,652
Released -3,750 -6,165 0 0 -9,915
Balance as at 31 December 2020 8,041 14,464 22,894 3,533 48,932
Increases in provisions 972 376 335 3,063 4,746
Utilized -2,528 0 -1,822 -2,188 -6,538
Released1 -550 -5,366 0 -1,203 -7,119
Balance as at 31 December 2021 5,935 9,474 21,407 3,205 40,021
(€ in thousands) WarrantyClaims and
litigationEmployee
benefits Other Total1
1 Releases in claims and litigation mainly reflects the expiry of statute of limitations, while releases in warranty and other provisions relate to unutilized provisions.
ACCOUNTING POLICY
Provisions are recognized when:
• The group has a present obligation as a result of a past event.
• It is probable that the group will be required to settle that obligation.
• The amount can be reliably estimated.Provisions are measured at management’s best estimate of the expenditure required to settle the obligation at the balance sheet date, and are discounted to present value where the effect is material.
Warranty provision The group offers warranties mainly for its hardware products in Consumer (including Automotive hardware). Provisions for warranty costs are recognized at the date of sale of the relevant products, at management’s best estimate of the expenditure required to settle the group’s obligation. Warranty costs are recorded within cost of sales.
Claims and litigation provisionThe group made a provision for potential legal, tax penalties and other risks in various jurisdictions. The legal matters consist mainly of intellectual property infringement issues. In the normal course of business, the group receives claims relating to allegations that it has infringed intellectual property assets.In such cases, the companies making the claims seek payments that may take the form of licenses and/or damages. While these claims will be resisted, some are likely to be settled by negotiation and others are expected to result in litigation.
The cases and claims against the group often raise difficult and complex factual and legal issues which are subject to many uncertainties and complexities, including but not limited to the facts and circumstances of each particular case and claim, the jurisdiction in which each suit is brought, and the differences in applicable law. In the normal course of business, management consults with legal counsel and certain other experts on matters related to such claims and litigation. The group accrues a liability when it is determined that an adverse outcome is more likely than not, and the amount of the loss can be reasonably estimated.If the likelihood of an adverse outcome is reasonably possible or an estimate is not determinable, the matter is disclosed, provided it is material. Management is of the opinion that the provision is adequate to resolve these claims.Employee benefits provisionEmployee benefits provision relates mainly to the defined benefit pension plan in Germany and Belgium as disclosed in note 8.Other provisionOther provision and its movement in 2021 relates mainly to provisions for expected restructuring expenses.
FINANCIALS / NOTES TO THE CONSOLIDATED FINANCIAL STATEMENTS / PAGE 100
SECTION 6
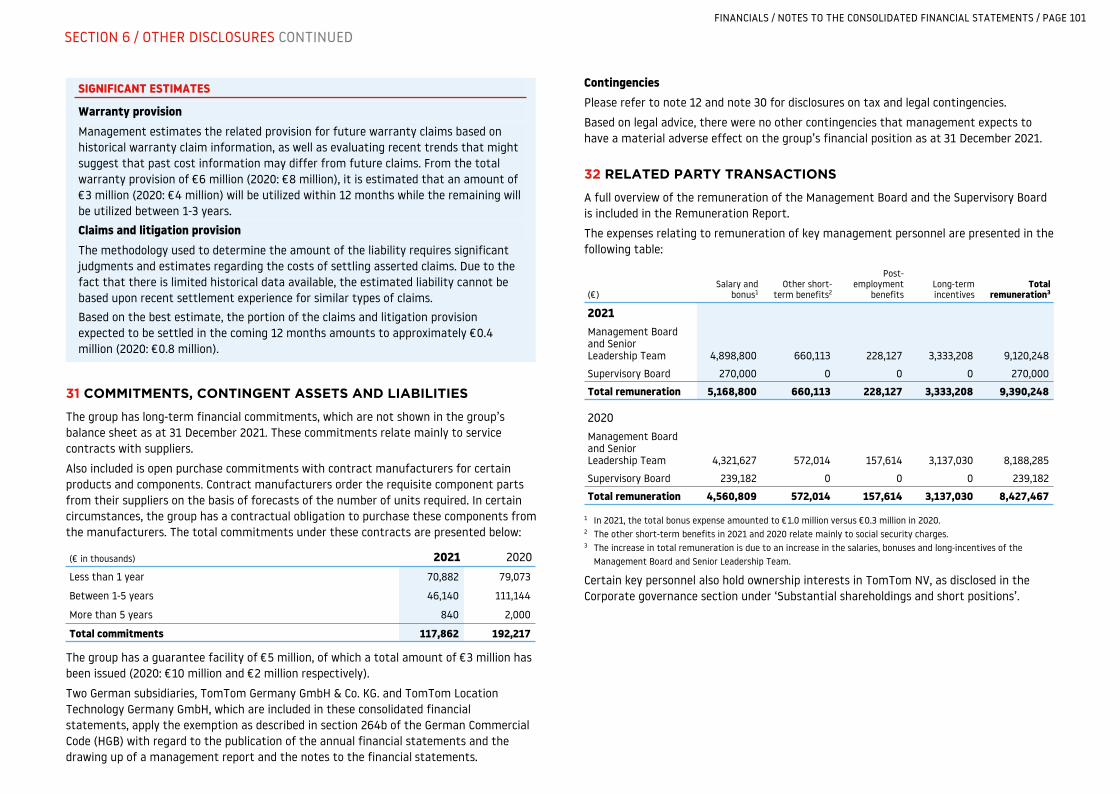
SIGNIFICANT ESTIMATES
Warranty provisionManagement estimates the related provision for future warranty claims based on historical warranty claim information, as well as evaluating recent trends that might suggest that past cost information may differ from future claims. From the total warranty provision of €6 million (2020: €8 million), it is estimated that an amount of €3 million (2020: €4 million) will be utilized within 12 months while the remaining will be utilized between 1-3 years.
Claims and litigation provisionThe methodology used to determine the amount of the liability requires significant judgments and estimates regarding the costs of settling asserted claims. Due to the fact that there is limited historical data available, the estimated liability cannot be based upon recent settlement experience for similar types of claims.Based on the best estimate, the portion of the claims and litigation provision expected to be settled in the coming 12 months amounts to approximately €0.4 million (2020: €0.8 million).
31 COMMITMENTS, CONTINGENT ASSETS AND LIABILITIES
The group has long-term financial commitments, which are not shown in the group’s balance sheet as at 31 December 2021. These commitments relate mainly to service contracts with suppliers.
Also included is open purchase commitments with contract manufacturers for certain products and components. Contract manufacturers order the requisite component parts from their suppliers on the basis of forecasts of the number of units required. In certain circumstances, the group has a contractual obligation to purchase these components from the manufacturers. The total commitments under these contracts are presented below:
Less than 1 year 70,882 79,073
Between 1-5 years 46,140 111,144
More than 5 years 840 2,000
Total commitments 117,862 192,217
(€ in thousands) 2021 2020
The group has a guarantee facility of €5 million, of which a total amount of €3 million has been issued (2020: €10 million and €2 million respectively).
Two German subsidiaries, TomTom Germany GmbH & Co. KG. and TomTom Location Technology Germany GmbH, which are included in these consolidated financial statements, apply the exemption as described in section 264b of the German Commercial Code (HGB) with regard to the publication of the annual financial statements and the drawing up of a management report and the notes to the financial statements.
ContingenciesPlease refer to note 12 and note 30 for disclosures on tax and legal contingencies.
Based on legal advice, there were no other contingencies that management expects to have a material adverse effect on the group’s financial position as at 31 December 2021.
32 RELATED PARTY TRANSACTIONS
A full overview of the remuneration of the Management Board and the Supervisory Board is included in the Remuneration Report.
The expenses relating to remuneration of key management personnel are presented in the following table:
2021Management Board and Senior Leadership Team 4,898,800 660,113 228,127 3,333,208 9,120,248
Supervisory Board 270,000 0 0 0 270,000
Total remuneration 5,168,800 660,113 228,127 3,333,208 9,390,248
2020Management Board and Senior Leadership Team 4,321,627 572,014 157,614 3,137,030 8,188,285
Supervisory Board 239,182 0 0 0 239,182
Total remuneration 4,560,809 572,014 157,614 3,137,030 8,427,467
(€)Salary and
bonus1Other short-
term benefits2
Post-employment
benefitsLong-term incentives
Total remuneration3
1 In 2021, the total bonus expense amounted to €1.0 million versus €0.3 million in 2020.2 The other short-term benefits in 2021 and 2020 relate mainly to social security charges.3 The increase in total remuneration is due to an increase in the salaries, bonuses and long-incentives of the
Management Board and Senior Leadership Team.
Certain key personnel also hold ownership interests in TomTom NV, as disclosed in the Corporate governance section under ‘Substantial shareholdings and short positions’.
FINANCIALS / NOTES TO THE CONSOLIDATED FINANCIAL STATEMENTS / PAGE 101
SECTION 6 / OTHER DISCLOSURES CONTINUED
33 AUDITOR’S REMUNERATIONThe total remuneration to Ernst & Young Accountants LLP for the statutory audit of 2021 for the group amounted to €500,000 (2020: €540,000). The total service fees paid/payable to the Ernst & Young network amounted to €561,000 (2020: €601,000). Included in the total remuneration is an amount of €561,000 (2020: €601,000) invoiced by Ernst & Young Accountants LLP, which includes an amount of €61,000 (2020: €61,000) for other statutory audits.
Details of the audit and audit-related fees paid to EY can also be found in the Audit Committee report.
34 SUBSEQUENT EVENTS
Reference is made to note H in the company financial statements.
FINANCIALS / NOTES TO THE CONSOLIDATED FINANCIAL STATEMENTS / PAGE 102
SECTION 6 / OTHER DISCLOSURES CONTINUED
FINANCIALSCompany financial statements
Company statement of income / 104Company balance sheet / 104Notes to the company financial statements / 105
TOMTOM NV / ANNUAL REPORT 2021 / PAGE 103
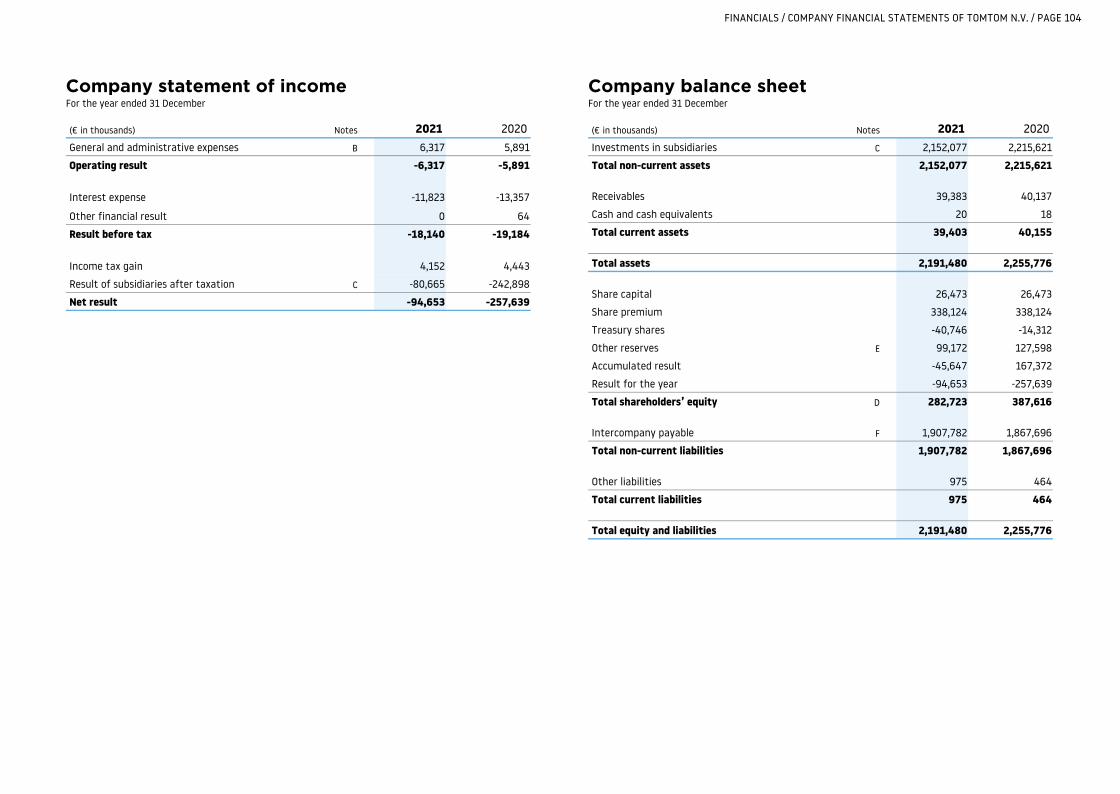
Company statement of incomeFor the year ended 31 December
Result of subsidiaries after taxation C -80,665 -242,898
Net result -94,653 -257,639
(€ in thousands) Notes 2021 2020General and administrative expenses B 6,317 5,891
Operating result -6,317 -5,891
Interest expense -11,823 -13,357
Other financial result 0 64
Result before tax -18,140 -19,184
Income tax gain 4,152 4,443
Company balance sheetFor the year ended 31 December
(€ in thousands) Notes 2021 2020Investments in subsidiaries C 2,152,077 2,215,621
Total non-current assets 2,152,077 2,215,621
Receivables 39,383 40,137
Cash and cash equivalents 20 18
Total current assets 39,403 40,155
Total assets 2,191,480 2,255,776
Share capital 26,473 26,473
Share premium 338,124 338,124
Treasury shares -40,746 -14,312
Other reserves E 99,172 127,598
Accumulated result -45,647 167,372
Result for the year -94,653 -257,639
Total shareholders’ equity D 282,723 387,616
Intercompany payable F 1,907,782 1,867,696
Total non-current liabilities 1,907,782 1,867,696
Other liabilities 975 464
Total current liabilities 975 464
Total equity and liabilities 2,191,480 2,255,776
FINANCIALS / COMPANY FINANCIAL STATEMENTS OF TOMTOM N.V. / PAGE 104
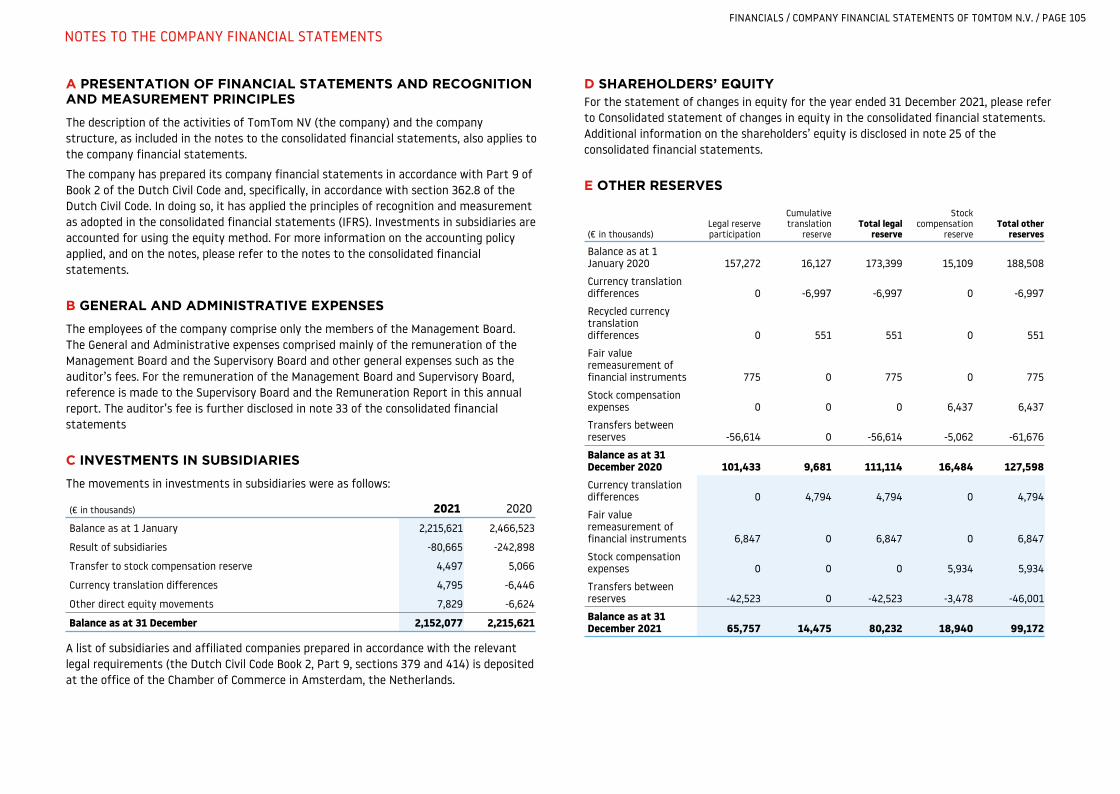
A PRESENTATION OF FINANCIAL STATEMENTS AND RECOGNITION AND MEASUREMENT PRINCIPLES
The description of the activities of TomTom NV (the company) and the company structure, as included in the notes to the consolidated financial statements, also applies to the company financial statements.
The company has prepared its company financial statements in accordance with Part 9 of Book 2 of the Dutch Civil Code and, specifically, in accordance with section 362.8 of the Dutch Civil Code. In doing so, it has applied the principles of recognition and measurement as adopted in the consolidated financial statements (IFRS). Investments in subsidiaries are accounted for using the equity method. For more information on the accounting policy applied, and on the notes, please refer to the notes to the consolidated financial statements.
B GENERAL AND ADMINISTRATIVE EXPENSES
The employees of the company comprise only the members of the Management Board. The General and Administrative expenses comprised mainly of the remuneration of the Management Board and the Supervisory Board and other general expenses such as the auditor’s fees. For the remuneration of the Management Board and Supervisory Board, reference is made to the Supervisory Board and the Remuneration Report in this annual report. The auditor’s fee is further disclosed in note 33 of the consolidated financial statements
C INVESTMENTS IN SUBSIDIARIES
The movements in investments in subsidiaries were as follows:
Balance as at 1 January 2,215,621 2,466,523
Result of subsidiaries -80,665 -242,898
Transfer to stock compensation reserve 4,497 5,066
Currency translation differences 4,795 -6,446
Other direct equity movements 7,829 -6,624
Balance as at 31 December 2,152,077 2,215,621
(€ in thousands) 2021 2020
A list of subsidiaries and affiliated companies prepared in accordance with the relevant legal requirements (the Dutch Civil Code Book 2, Part 9, sections 379 and 414) is deposited at the office of the Chamber of Commerce in Amsterdam, the Netherlands.
D SHAREHOLDERS’ EQUITY For the statement of changes in equity for the year ended 31 December 2021, please refer to Consolidated statement of changes in equity in the consolidated financial statements. Additional information on the shareholders’ equity is disclosed in note 25 of the consolidated financial statements.
E OTHER RESERVES
Balance as at 1 January 2020 157,272 16,127 173,399 15,109 188,508
Currency translation differences 0 -6,997 -6,997 0 -6,997
Recycled currency translation differences 0 551 551 0 551
Fair value remeasurement of financial instruments 775 0 775 0 775
Stock compensation expenses 0 0 0 6,437 6,437
Transfers between reserves -56,614 0 -56,614 -5,062 -61,676
Balance as at 31 December 2020 101,433 9,681 111,114 16,484 127,598 Currency translation differences 0 4,794 4,794 0 4,794
Fair value remeasurement of financial instruments 6,847 0 6,847 0 6,847
Stock compensation expenses 0 0 0 5,934 5,934
Transfers between reserves -42,523 0 -42,523 -3,478 -46,001
Balance as at 31 December 2021 65,757 14,475 80,232 18,940 99,172
(€ in thousands)Legal reserve participation
Cumulative translation
reserveTotal legal
reserve
Stock compensation
reserveTotal other
reserves
FINANCIALS / COMPANY FINANCIAL STATEMENTS OF TOMTOM N.V. / PAGE 105
NOTES TO THE COMPANY FINANCIAL STATEMENTS
LEGAL RESERVELegal reserves are the non-distributable reserves that are recorded for an amount equal to the restricted reserves of the company’s subsidiaries and the cumulative translation reserve.
STOCK COMPENSATION RESERVEThe stock compensation reserve represents the cumulative expense of issued stock options that have been granted but not exercised and restricted stock units that have not yet vested.
F INTERCOMPANY PAYABLES
Intercompany payables comprises loans provided by subsidiaries. The interest rate on the loan during 2021 is based upon the applicable inter-bank offered rate plus a margin. Given that the current interbank rates are below zero, the margin charged is set at a rate of 0.5% (2020: 1.5%). Although no repayment period has been agreed the loan has a long-term nature.
G OFF-BALANCE SHEET COMMITMENTS
The company has a guarantee facility of €5 million, of which a total amount of €2.7 million has been issued (2020: €10 million and €2.4 million respectively).
The company has also issued several declarations of joint and several liability for various group companies, in compliance with section 403 of Part 9 of Book 2 of the Dutch Civil Code.
In addition, two German subsidiaries, TomTom Germany GmbH & Co. KG. and TomTom Location Technology Germany GmbH, apply the exemption as described in section 264b of the German Commercial Code (HGB) with regard to the publication of the annual financial statements.
The company forms a fiscal unity for corporate income tax and value added tax (VAT) purposes with several of its Dutch subsidiaries. Each company within the fiscal unity is jointly and severally liable for the fiscal liability of the fiscal unity.
H SUBSEQUENT EVENTS
There has been no subsequent events from 31 December 2021 to the date of issue of these financial statements.
I PROPOSED APPROPRIATION OF RESULT The Management Board proposes to add the net loss in full to the Accumulated result.
TomTom NV
Amsterdam, 4 February 2022
The management board The supervisory boardHAROLD GODDIJN DERK HAANKTACO TITULAER JACQUELINE TAMMENOMS BAKKER ALAIN DE TAEYE JACK DE KREIJ
MICHAEL RHODIN HALA ZEINE
FINANCIALS / COMPANY FINANCIAL STATEMENTS OF TOMTOM N.V. / PAGE 106
NOTES TO THE COMPANY FINANCIAL STATEMENTS CONTINUED

FINANCIALSOther information
Other information / 108Independent auditor's report / 109
FINANCIALS / OTHER INFORMATION / PAGE 107
STATUTORY PROVISION WITH RESPECT TO APPROPRIATION OF RESULTSAccording to the company’s Articles of Association, the company’s result is freely at the disposal of the shareholders, provided that total shareholders’ equity exceeds the called-up and paid-up capital of the company, increased by legal and statutory reserves.
FOUNDATION CONTINUITY TOMTOMFor a description of the Foundation Continuity TomTom, refer to the Corporate Governance section in this Annual Report.
AUDITOR’S REPORTReference is made to the Independent auditor’s report section in this Annual Report.
FINANCIALS / OTHER INFORMATION / PAGE 108
OTHER INFORMATION
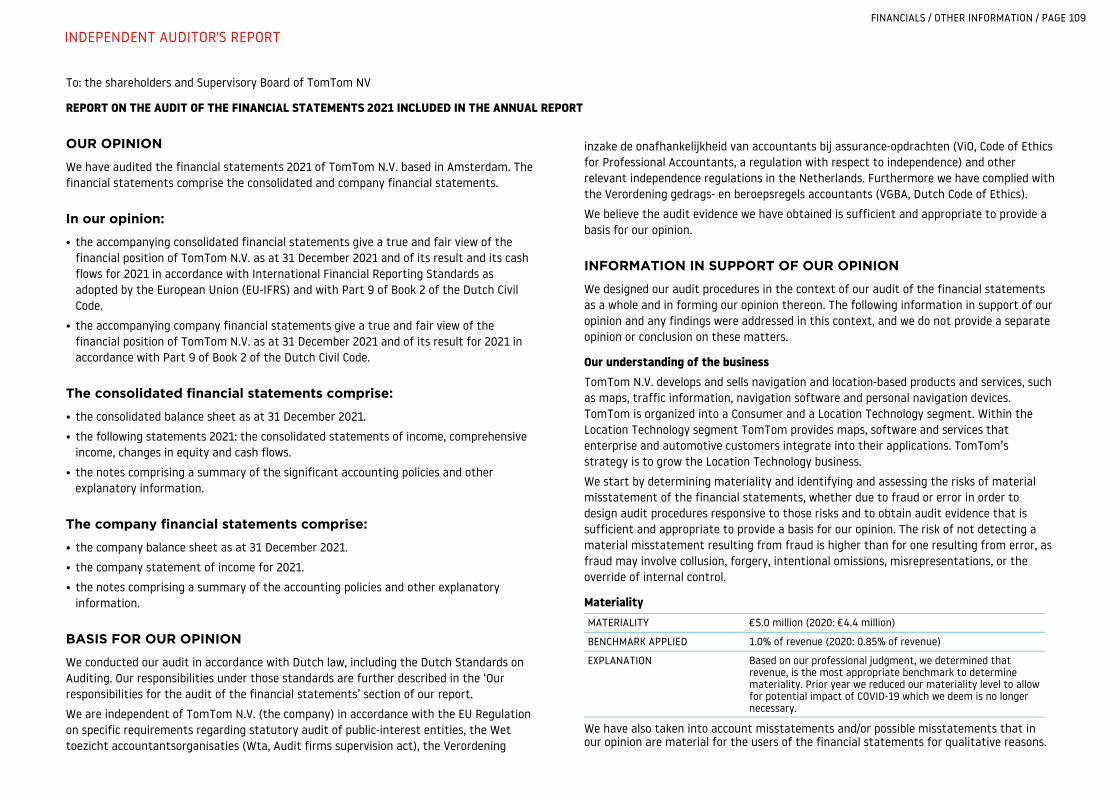
To: the shareholders and Supervisory Board of TomTom NV
REPORT ON THE AUDIT OF THE FINANCIAL STATEMENTS 2021 INCLUDED IN THE ANNUAL REPORT
OUR OPINION
We have audited the financial statements 2021 of TomTom N.V. based in Amsterdam. The financial statements comprise the consolidated and company financial statements.
In our opinion:
• the accompanying consolidated financial statements give a true and fair view of the financial position of TomTom N.V. as at 31 December 2021 and of its result and its cash flows for 2021 in accordance with International Financial Reporting Standards as adopted by the European Union (EU-IFRS) and with Part 9 of Book 2 of the Dutch Civil Code.
• the accompanying company financial statements give a true and fair view of the financial position of TomTom N.V. as at 31 December 2021 and of its result for 2021 in accordance with Part 9 of Book 2 of the Dutch Civil Code.
The consolidated financial statements comprise:
• the consolidated balance sheet as at 31 December 2021.
• the following statements 2021: the consolidated statements of income, comprehensive income, changes in equity and cash flows.
• the notes comprising a summary of the significant accounting policies and other explanatory information.
The company financial statements comprise:
• the company balance sheet as at 31 December 2021.
• the company statement of income for 2021.
• the notes comprising a summary of the accounting policies and other explanatory information.
BASIS FOR OUR OPINION
We conducted our audit in accordance with Dutch law, including the Dutch Standards on Auditing. Our responsibilities under those standards are further described in the ‘Our responsibilities for the audit of the financial statements’ section of our report.
We are independent of TomTom N.V. (the company) in accordance with the EU Regulation on specific requirements regarding statutory audit of public-interest entities, the Wet toezicht accountantsorganisaties (Wta, Audit firms supervision act), the Verordening
inzake de onafhankelijkheid van accountants bij assurance-opdrachten (ViO, Code of Ethics for Professional Accountants, a regulation with respect to independence) and other relevant independence regulations in the Netherlands. Furthermore we have complied with the Verordening gedrags- en beroepsregels accountants (VGBA, Dutch Code of Ethics).
We believe the audit evidence we have obtained is sufficient and appropriate to provide a basis for our opinion.
INFORMATION IN SUPPORT OF OUR OPINION
We designed our audit procedures in the context of our audit of the financial statements as a whole and in forming our opinion thereon. The following information in support of our opinion and any findings were addressed in this context, and we do not provide a separate opinion or conclusion on these matters.
Our understanding of the businessTomTom N.V. develops and sells navigation and location-based products and services, such as maps, traffic information, navigation software and personal navigation devices. TomTom is organized into a Consumer and a Location Technology segment. Within the Location Technology segment TomTom provides maps, software and services that enterprise and automotive customers integrate into their applications. TomTom’s strategy is to grow the Location Technology business.
We start by determining materiality and identifying and assessing the risks of material misstatement of the financial statements, whether due to fraud or error in order to design audit procedures responsive to those risks and to obtain audit evidence that is sufficient and appropriate to provide a basis for our opinion. The risk of not detecting a material misstatement resulting from fraud is higher than for one resulting from error, as fraud may involve collusion, forgery, intentional omissions, misrepresentations, or the override of internal control.
MaterialityMATERIALITY €5.0 million (2020: €4.4 million)
BENCHMARK APPLIED 1.0% of revenue (2020: 0.85% of revenue)
EXPLANATION Based on our professional judgment, we determined that revenue, is the most appropriate benchmark to determine materiality. Prior year we reduced our materiality level to allow for potential impact of COVID-19 which we deem is no longer necessary.
We have also taken into account misstatements and/or possible misstatements that in our opinion are material for the users of the financial statements for qualitative reasons.
FINANCIALS / OTHER INFORMATION / PAGE 109
INDEPENDENT AUDITOR'S REPORT
We agreed with the Supervisory Board that misstatements in excess of € 250,000, which are identified during the audit, would be reported to them, as well as smaller misstatements that in our view must be reported on qualitative grounds.
Scope of the group auditTomTom N.V. is the ultimate parent of a group of entities. The financial information of this group is included in the consolidated financial statements.
Because we are ultimately responsible for the opinion, we are also responsible for directing, supervising and performing the group audit. In this respect we have determined the nature and extent of the audit procedures to be carried out for group entities. Decisive were the size and/or the risk profile of the group entities or operations. As TomTom’s processes are highly centralized, we have applied a centralized audit approach. For the accounts which were of most significance for our audit, we have performed all audit procedures ourselves at group level.
Our audit coverage for total assets and revenues can be summarized as follows:
• for total assets our audit procedures achieved a coverage of 99%.
• for revenues our audit procedures achieved a coverage of 100%.
By performing the procedures mentioned above at components of the group, together with additional procedures at group level, we have been able to obtain sufficient and appropriate audit evidence about the group’s financial information to provide an opinion about the consolidated financial statements.
Teaming and use of specialists
We ensured that the audit team has the appropriate skills and competences which are needed for the audit of a listed client in this industry. We included specialists in the areas of IT audit (including cybersecurity), forensics, sustainability, impairment testing, income tax and pensions.
Our focus on climate-related risks
Climate objectives will be high on the public agenda in the next decades. Issues such as CO2 reduction impact financial reporting, as these issues entail risks for the business operation, the valuation of assets ('stranded assets') and provisions or the sustainability of the business model and access to financial markets of companies with a larger CO2 footprint.
As part of our audit of the financial statements, we evaluated the extent to which climate-related risks are taken into account in estimates and significant assumptions applied by TomTom N.V., especially in the area of impairment of goodwill. Furthermore, we read the Management Board report and considered whether there is any material
inconsistency between the non-financial information in the ‘Environmental’ section of the ‘Environmental, Social and Governance’ chapter and the financial statements.
Our audit procedures to address the assessed climate-related risks did not result in a key audit matter.
OUR FOCUS ON FRAUD AND NON-COMPLIANCE WITH LAWS AND REGULATIONS
Our responsibility
Although we are not responsible for preventing fraud or non-compliance and we cannot be expected to detect non-compliance with all laws and regulations, it is our responsibility to obtain reasonable assurance that the financial statements, taken as a whole, are free from material misstatement, whether caused by fraud or error.
Our audit response related to fraud risks
We identify and assess the risks of material misstatements of the financial statements due to fraud. During our audit we obtained an understanding of the company and its environment and the components of the system of internal control, including the risk assessment process and the Management Board’s process for responding to the risks of fraud and monitoring the system of internal control and how the Supervisory Board exercises oversight, as well as the outcomes.
We refer to section ‘Risk management and control’ of the Management Board report for the Management Board’s (fraud) risk assessment.
We evaluated the design and relevant aspects of the system of internal control and in particular the fraud risk assessment, as well as the code of conduct, whistle blower procedures and incident registration. We evaluated the design and the implementation of internal controls designed to mitigate fraud risks.
As part of our process of identifying fraud risks, we evaluated fraud risk factors with respect to financial reporting fraud, misappropriation of assets and bribery and corruption in close co-operation with our forensic specialists. We evaluated whether these factors indicate that a risk of material misstatement due fraud is present.
We incorporated elements of unpredictability in our audit. We also considered the outcome of our other audit procedures and evaluated whether any findings were indicative of fraud or non-compliance.
As in all of our audits, we addressed the risks related to management override of controls and when identifying and assessing fraud risks we presumed that there are risks of fraud in revenue recognition.
For the risk related to management override of controls we have we performed procedures to evaluate key accounting estimates for management bias in particular relating to important judgment areas and significant accounting estimates as disclosed in Note 3 to
FINANCIALS / OTHER INFORMATION / PAGE 110
INDEPENDENT AUDITOR'S REPORT CONTINUED
the financial statements. We have also used data analysis to identify and address high-risk journal entries. This risk did however not require significant auditor’s attention during our audit.
Fraud risk in connection with revenue recognition for the location technology segmentFraud risk In identifying and assessing fraud risks, we have identified one specific fraud risk in
our audit, which relates to revenue recognition in the location technology segment, considering that this segment includes sales contracts where revenue recognition is based on estimates and assumptions that are complex and require significant management judgment.
Our audit approach
We describe the audit procedures responsive to this fraud risk in the description of our audit approach for the key audit matter ‘Revenue recognition Location Technology’.
We considered available information and made enquiries of relevant executives, directors (including internal audit, legal, compliance, human resources and regional directors) and the Supervisory Board.The fraud risks we identified, enquires and other available information did not lead to specific indications for fraud or suspected fraud potentially materially impacting the view of the financial statements.
Our audit response related to risks of non-compliance with laws and regulations
We assessed factors related to the risks of non-compliance with laws and regulations that could reasonably be expected to have a material effect on the financial statements from our general industry experience, through discussions with the Management Board, reading minutes, inspection of internal audit and compliance reports and performing substantive tests of details of classes of transactions, account balances or disclosures.We also inspected lawyers’ letters and correspondence with regulatory authorities and remained alert to any indication of (suspected) non-compliance throughout the audit. Finally we obtained written representations that all known instances of non-compliance with laws and regulations have been disclosed to us.
OUR AUDIT RESPONSE RELATED TO GOING CONCERN
As disclosed in section ‘Capital’ in Note 27 to the financial statements and the ‘in control and responsibility statement’ in the Management Board Statements, the Management Board made a specific assessment of the company’s ability to continue as a going concern and to continue its operations for at least the next 12 months. We discussed and evaluated the specific assessment with the Management Board exercising professional judgment and maintaining professional skepticism. We considered whether the Management Board’s going concern assessment, based on our knowledge and understanding obtained through our audit of the financial statements or otherwise, contains all events or conditions that may cast significant doubt on the company’s ability to continue as a going concern. If we conclude that a material uncertainty exists, we are
required to draw attention in our auditor’s report to the related disclosures in the financial statements or, if such disclosures are inadequate, to modify our opinion.
Based on our procedures performed, we did not identify serious doubts on the company’s ability to continue as a going concern for the next 12 months.
Our conclusions are based on the audit evidence obtained up to the date of our auditor’s report. However, future events or conditions may cause a company to cease to continue as a going concern.
OUR KEY AUDIT MATTERS
Key audit matters are those matters that, in our professional judgment, were of most significance in our audit of the financial statements. We have communicated the key audit matter to the Supervisory Board. The key audit matter is not a comprehensive reflection of all matters discussed.
In comparison with previous year, our key audit matter did not change.
FINANCIALS / OTHER INFORMATION / PAGE 111
INDEPENDENT AUDITOR'S REPORT CONTINUED
REVENUE RECOGNITION LOCATION TECHNOLOGY, INCLUDING THE IMPACT OF COVID-19(Reference is made to Notes 4, 5 and Note 6 of the consolidated financial statements)
Risk TomTom’s Location Technology segment includes sales contracts where revenue recognition is based on estimates and assumptions that are complex and require significant management judgment.
Inherent to the nature of estimates and assumptions is that these could be influenced by the Management Board and consequently we identified the risk of revenue recognition (as mentioned in the section “Our audit response related to fraud risks“), specifically relating to the total contract values, and the allocation of transaction prices to performance obligations. Furthermore, the global semiconductor shortage, amplified by the Corona (COVID-19) pandemic, impacts the operational and financial performance of TomTom. This has been disclosed in Note 4 of the consolidated financial statements. Amongst others, disrupted supply chains and the global semiconductor shortage could mean a break in historic trend lines. This leads to increased estimation uncertainty, particularly for contracts where revenue recognition depends on the estimated total contract value.
Our audit approach
Our audit procedures included an assessment of the appropriateness of the company’s revenue recognition policies, understanding the internal control environment, and performing procedures on revenues using data analytics. Furthermore, we discussed and evaluated the impact of the global semiconductor shortage on the financial statements of TomTom N.V. and focused on the revenue related estimates. For relevant contracts and contract modifications we have assessed and obtained confirmation of the contractual terms and conditions including the appropriate accounting thereof, and we have performed substantive procedures relating to the estimated total contract value, including the back testing of previous estimates.For a sample of contracts containing multiple performance obligations, we evaluated the allocation of revenue to the individual performance obligations based on the estimated stand-alone selling prices of each performance obligation. For this sample, we’ve also assessed the company’s estimated values, if this was relevant for the revenue recognition. In performing our audit procedures on the financial statements and revenue related estimates we maintained our professional skepticism. We analyzed events subsequent to 31 December 2021 to determine whether any events require adjusting amounts recognized in the financial statements.We evaluated the adequacy of the Company’s disclosure around revenuesand particularly whether disclosures adequately convey significant judgments and the degree of estimation uncertainty. Furthermore we evaluated the overall view of the financial statements including the disclosures related to the impact of the global semiconductor shortage, which has been amplified by the COVID-19 pandemic.
Key observations The Management Board has updated the assumptions and estimates used based on the latest available (historic) data and expectations, including the Management Board’s assessment of the impact of the global semiconductor shortage and the COVID-19 pandemic. We agree with the assumptions and estimates used by the Management Board. Based on our procedures performed we did not identify material errors that require adjustment of the financial statements including revenue and related disclosures in accordance with EU-IFRS and Part 9 of Book 2 of the Dutch Civil Code.
REPORT ON OTHER INFORMATION INCLUDED IN THE ANNUAL REPORT
The annual report contains other information in addition to the financial statements and our auditor’s report thereon. Based on the following procedures performed, we conclude that the other information:
• is consistent with the financial statements and does not contain material misstatements.
• contains the information as required by Part 9 of Book 2 for the Management Board report and the other information as required by Sections 2:135b and 2:145 sub‑section 2 of the Dutch Civil Code for the remuneration report.
We have read the other information. Based on our knowledge and understanding obtained through our audit of the financial statements or otherwise, we have considered whether the other information contains material misstatements. By performing these procedures, we comply with the requirements of Part 9 of Book 2 and Section 2:135b sub-Section 7 of the Dutch Civil Code and the Dutch Standard 720. The scope of the procedures performed is substantially less than the scope of those performed in our audit of the financial statements.
The Management Board is responsible for the preparation of the other information, including the Management Board report in accordance with Part 9 of Book 2 of the Dutch Civil Code and other information required by Part 9 of Book 2 of the Dutch Civil Code. The Management Board and the Supervisory Board are responsible for ensuring that the remuneration report is drawn up and published in accordance with Sections 2:135b and 2:145 sub‑section 2 of the Dutch Civil Code.
REPORT ON OTHER LEGAL AND REGULATORY REQUIREMENTS AND ESEF
ENGAGEMENTWe were engaged by the Supervisory Board as auditor of TomTom N.V. on 24 April 2015, as of the audit for the year 2015 and have operated as statutory auditor ever since that date.
NO PROHIBITED NON-AUDIT SERVICESWe have not provided prohibited non-audit services as referred to in Article 5(1) of the EU Regulation on specific requirements regarding statutory audit of public-interest entities.
EUROPEAN SINGLE ELECTRONIC FORMAT (ESEF)TomTom N.V. has prepared the annual report in ESEF. The requirements for this are set out in the Delegated Regulation (EU) 2019/815 with regard to regulatory technical standards on the specification of a single electronic reporting format (hereinafter: the RTS on ESEF).
FINANCIALS / OTHER INFORMATION / PAGE 112
INDEPENDENT AUDITOR'S REPORT CONTINUED
In our opinion, the annual report, prepared in the XHTML format, including the partially marked-up consolidated financial statements, as included in the reporting package by TomTom N.V., complies in all material respects with the RTS on ESEF.
The Management Board is responsible for preparing the annual report, including the financial statements, in accordance with the RTS on ESEF, whereby the Management Board combines the various components into a single reporting package.
Our responsibility is to obtain reasonable assurance for our opinion whether the annual report in this reporting package complies with the RTS on ESEF.
Our procedures, taking into account Alert 43 of the NBA (the Netherlands Institute of Chartered Accountants), included amongst others:
• obtaining an understanding of the company's financial reporting process, including the preparation of the reporting package
• obtaining the reporting package and performing validations to determine whether the reporting package containing the Inline XBRL instance document and the XBRL extension taxonomy files has been prepared in accordance with the technical specifications as included in the RTS on ESEF
• examining the information related to the consolidated financial statements in the reporting package to determine whether all required mark-ups have been applied and whether these are in accordance with the RTS on ESEF
DESCRIPTION OF RESPONSIBILITIES FOR THE FINANCIAL STATEMENTS
RESPONSIBILITIES OF MANAGEMENT AND THE SUPERVISORY BOARD FOR THE FINANCIAL STATEMENTSThe Management Board is responsible for the preparation and fair presentation of the financial statements in accordance with EU-IFRS and Part 9 of Book 2 of the Dutch Civil Code. Furthermore, the Management Board is responsible for such internal control as it determines is necessary to enable the preparation of the financial statements that are free from material misstatement, whether due to fraud or error.
As part of the preparation of the financial statements, the Management Board is responsible for assessing the company’s ability to continue as a going concern. Based on the financial reporting frameworks mentioned, the Management Board should prepare the financial statements using the going concern basis of accounting unless the Management Board either intends to liquidate the company or to cease operations, or has no realistic alternative but to do so. The Management Board should disclose events and circumstances that may cast significant doubt on the company’s ability to continue as a going concern in the financial statements.
The Supervisory Board is responsible for overseeing the company’s financial reporting process.
OUR RESPONSIBILITIES FOR THE AUDIT OF THE FINANCIAL STATEMENTSOur objective is to plan and perform the audit engagement in a manner that allows us to obtain sufficient and appropriate audit evidence for our opinion.
Our audit has been performed with a high, but not absolute, level of assurance, which means we may not detect all material errors and fraud during our audit.
Misstatements can arise from fraud or error and are considered material if, individually or in the aggregate, they could reasonably be expected to influence the economic decisions of users taken on the basis of these financial statements. The materiality affects the nature, timing and extent of our audit procedures and the evaluation of the effect of identified misstatements on our opinion.
We have exercised professional judgment and have maintained professional skepticism throughout the audit, in accordance with Dutch Standards on Auditing, ethical requirements and independence requirements. The ‘Information in support of our opinion’ section above includes an informative summary of our responsibilities and the work performed as the basis for our opinion.
Our audit further included among others:
• performing audit procedures responsive to the risks identified, and obtaining audit evidence that is sufficient and appropriate to provide a basis for our opinion.
• obtaining an understanding of internal control relevant to the audit in order to design audit procedures that are appropriate in the circumstances, but not for the purpose of expressing an opinion on the effectiveness of the company's internal control
• evaluating the appropriateness of accounting policies used and the reasonableness of accounting estimates and related disclosures made by the Management Board
• evaluating the overall presentation, structure and content of the financial statements, including the disclosures
• evaluating whether the financial statements represent the underlying transactions and events in a manner that achieves fair presentation
COMMUNICATIONWe communicate with the Supervisory Board regarding, among other matters, the planned scope and timing of the audit and significant audit findings, including any significant findings in internal control that we identify during our audit. In this respect we also submit an additional report to the audit committee in accordance with Article 11 of the EU Regulation on specific requirements regarding statutory audit of public-interest entities. The information included in this additional report is consistent with our audit opinion in this auditor’s report.
We provide the Supervisory Board with a statement that we have complied with relevant ethical requirements regarding independence, and to communicate with them all relationships and other matters that may reasonably be thought to bear on our independence, and where applicable, related safeguards.
FINANCIALS / OTHER INFORMATION / PAGE 113
INDEPENDENT AUDITOR'S REPORT CONTINUED
From the matters communicated with the Supervisory Board, we determine the key audit matters: those matters that were of most significance in the audit of the financial statements. We describe these matters in our auditor’s report unless law or regulation precludes public disclosure about the matter or when, in extremely rare circumstances, not communicating the matter is in the public interest.
The Hague, 4 February 2022
Ernst & Young Accountants LLP
SIGNED BY: T. DE KUIJPER
FINANCIALS / OTHER INFORMATION / PAGE 114
INDEPENDENT AUDITOR'S REPORT CONTINUED

SUPPLEMENTARY INFORMATIONQuarterly overview 2021 / 116Definitions and abbreviations / 118Non-GAAP measures / 119Forward-looking statements / 120
TOMTOM NV / ANNUAL REPORT 2021 / PAGE 115
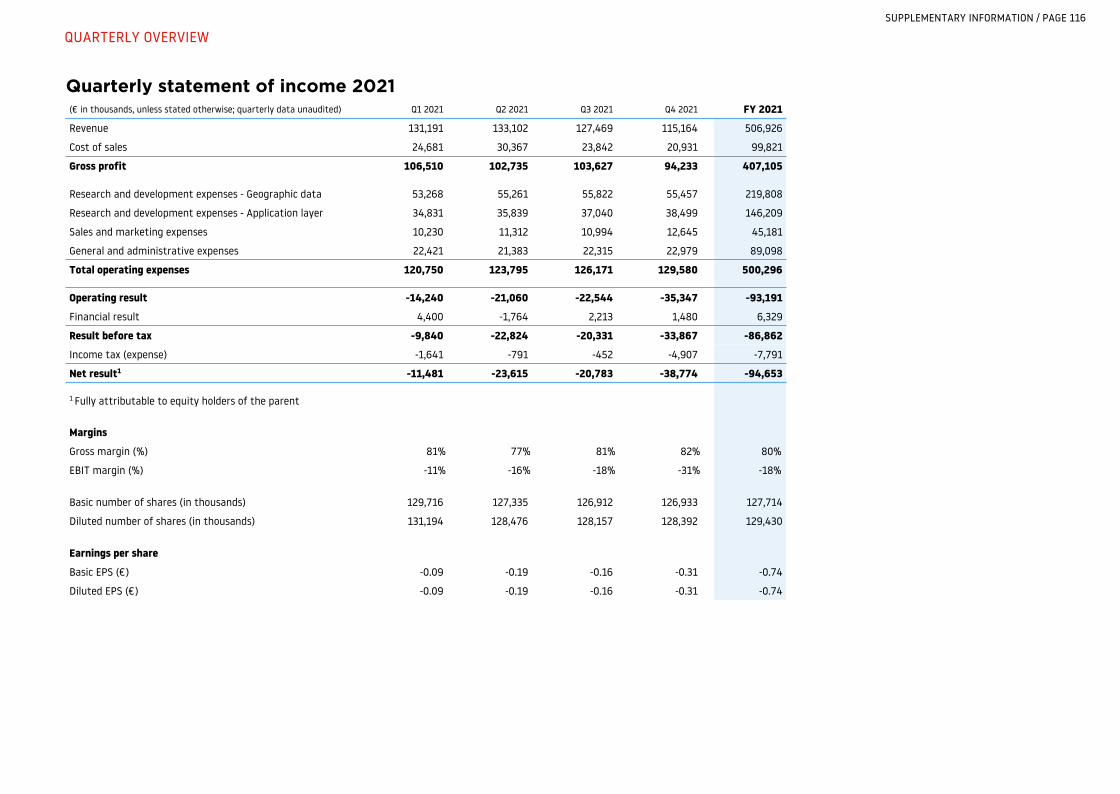
Quarterly statement of income 2021 (€ in thousands, unless stated otherwise; quarterly data unaudited) Q1 2021 Q2 2021 Q3 2021 Q4 2021 FY 2021
Revenue 131,191 133,102 127,469 115,164 506,926
Cost of sales 24,681 30,367 23,842 20,931 99,821
Gross profit 106,510 102,735 103,627 94,233 407,105
Research and development expenses - Geographic data 53,268 55,261 55,822 55,457 219,808
Research and development expenses - Application layer 34,831 35,839 37,040 38,499 146,209
Sales and marketing expenses 10,230 11,312 10,994 12,645 45,181
General and administrative expenses 22,421 21,383 22,315 22,979 89,098
Total operating expenses 120,750 123,795 126,171 129,580 500,296
Operating result -14,240 -21,060 -22,544 -35,347 -93,191
Financial result 4,400 -1,764 2,213 1,480 6,329
Result before tax -9,840 -22,824 -20,331 -33,867 -86,862
Income tax (expense) -1,641 -791 -452 -4,907 -7,791
Net result1 -11,481 -23,615 -20,783 -38,774 -94,653
1 Fully attributable to equity holders of the parent
Margins
Gross margin (%) 81% 77% 81% 82% 80%
EBIT margin (%) -11% -16% -18% -31% -18%
Basic number of shares (in thousands) 129,716 127,335 126,912 126,933 127,714
Diluted number of shares (in thousands) 131,194 128,476 128,157 128,392 129,430
Earnings per share
Basic EPS (€) -0.09 -0.19 -0.16 -0.31 -0.74
Diluted EPS (€) -0.09 -0.19 -0.16 -0.31 -0.74
SUPPLEMENTARY INFORMATION / PAGE 116
QUARTERLY OVERVIEW

Quarterly statement of cash flows 2021 (€ in thousands, quarterly data unaudited) Q1 2021 Q2 2021 Q3 2021 Q4 2021 FY 2021Operating result -14,240 -21,060 -22,544 -35,347 -93,191
Financial gains/(losses) 3,084 -970 2,753 3,037 7,904
Depreciation and amortization 21,520 18,756 17,210 16,185 73,671
Change in provisions 759 -4,277 -2,166 -1,790 -7,474
Equity-settled stock compensation expenses 1,596 1,457 955 1,926 5,934
Other non-cash movements 0 -154 2 106 -46
Changes in working capital:
Change in inventories 3,217 1,019 4,969 -433 8,772
Change in receivables and prepayments -3,447 12,692 -61,340 69,978 17,883
Change in liabilities (excluding provisions)1 -11,135 -19,241 50,777 11,888 32,289
Cash flow from operations 1,354 -11,778 -9,384 65,550 45,742
Interest received 39 267 14 6 326
Interest paid -437 -469 -418 -392 -1,716
Corporate income taxes paid -1,736 -1,078 -1,109 -3,646 -7,569
Cash flow from operating activities -780 -13,058 -10,897 61,518 36,783
Investments in property, plant and equipment -3,117 -2,732 -2,612 -4,813 -13,274
Dividends received 0 0 228 138 366
(Increase) / Decrease in fixed-term deposits 21,465 61,465 0 -90,000 -7,070
Cash flow from investing activities 18,348 58,733 -2,384 -94,675 -19,978
Payment of lease liabilities -3,814 -3,552 -3,741 -3,678 -14,785
Proceeds on issue of ordinary shares 577 3,891 0 93 4,561
Purchase of treasury shares -17,294 -16,137 0 0 -33,431
Cash flow from financing activities -20,531 -15,798 -3,741 -3,585 -43,655
Net (decrease)/increase in cash and cash equivalents -2,963 29,877 -17,022 -36,742 -26,850Cash and cash equivalents at the beginning of period 231,520 230,657 258,908 242,187 231,520
Exchange rate changes on cash balances held in foreign currencies 2,100 -1,626 301 375 1,150
Cash and cash equivalents at the end of the period 230,657 258,908 242,187 205,820 205,820
Calculation of free cash flow
Cash flow from operating activities -780 -13,058 -10,897 61,518 36,783
Investments in property, plant and equipment -3,117 -2,732 -2,612 -4,813 -13,274
Free cash flow -3,897 -15,790 -13,509 56,705 23,5091 Includes movements in the non-current portion of deferred revenue presented under Non-current liabilities.
SUPPLEMENTARY INFORMATION / PAGE 117
QUARTERLY OVERVIEW CONTINUED
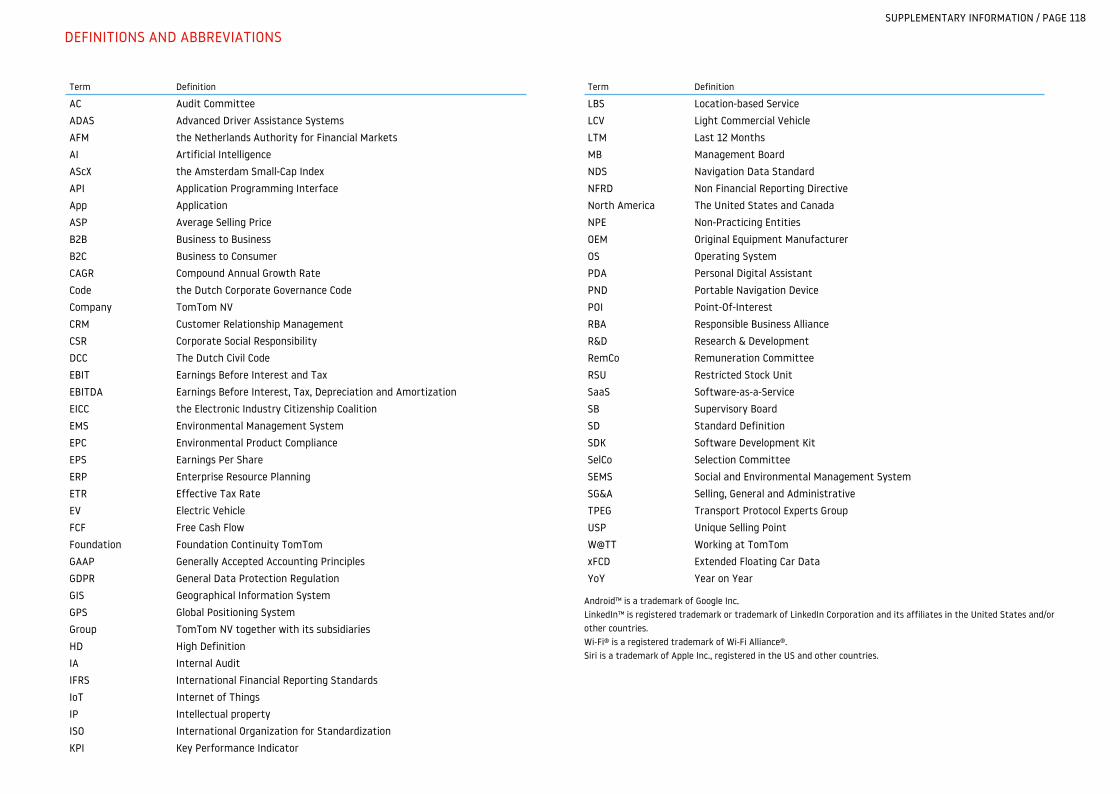
AC Audit CommitteeADAS Advanced Driver Assistance SystemsAFM the Netherlands Authority for Financial MarketsAI Artificial IntelligenceAScX the Amsterdam Small-Cap IndexAPI Application Programming InterfaceApp ApplicationASP Average Selling PriceB2B Business to BusinessB2C Business to ConsumerCAGR Compound Annual Growth RateCode the Dutch Corporate Governance CodeCompany TomTom NVCRM Customer Relationship ManagementCSR Corporate Social ResponsibilityDCC The Dutch Civil CodeEBIT Earnings Before Interest and TaxEBITDA Earnings Before Interest, Tax, Depreciation and AmortizationEICC the Electronic Industry Citizenship CoalitionEMS Environmental Management SystemEPC Environmental Product ComplianceEPS Earnings Per ShareERP Enterprise Resource PlanningETR Effective Tax RateEV Electric VehicleFCF Free Cash FlowFoundation Foundation Continuity TomTomGAAP Generally Accepted Accounting PrinciplesGDPR General Data Protection RegulationGIS Geographical Information SystemGPS Global Positioning SystemGroup TomTom NV together with its subsidiariesHD High DefinitionIA Internal AuditIFRS International Financial Reporting StandardsIoT Internet of ThingsIP Intellectual propertyISO International Organization for StandardizationKPI Key Performance Indicator
Term Definition
LBS Location-based ServiceLCV Light Commercial VehicleLTM Last 12 MonthsMB Management BoardNDS Navigation Data StandardNFRD Non Financial Reporting DirectiveNorth America The United States and CanadaNPE Non-Practicing EntitiesOEM Original Equipment ManufacturerOS Operating SystemPDA Personal Digital AssistantPND Portable Navigation DevicePOI Point-Of-InterestRBA Responsible Business AllianceR&D Research & DevelopmentRemCo Remuneration CommitteeRSU Restricted Stock UnitSaaS Software-as-a-ServiceSB Supervisory BoardSD Standard DefinitionSDK Software Development KitSelCo Selection CommitteeSEMS Social and Environmental Management SystemSG&A Selling, General and AdministrativeTPEG Transport Protocol Experts GroupUSP Unique Selling PointW@TT Working at TomTomxFCD Extended Floating Car DataYoY Year on Year
Term Definition
Android™ is a trademark of Google Inc.LinkedIn™ is registered trademark or trademark of LinkedIn Corporation and its affiliates in the United States and/or other countries. Wi-Fi® is a registered trademark of Wi-Fi Alliance®.Siri is a trademark of Apple Inc., registered in the US and other countries.
SUPPLEMENTARY INFORMATION / PAGE 118
DEFINITIONS AND ABBREVIATIONS

IMPORTANT NOTICE
In this Annual Report ‘TomTom’ ‘the company’ and the ‘the group’ are sometimes used for convenience in contexts where reference is made to TomTom NV and/or any of its subsidiaries in general or where no useful purpose is served by identifying the particular company.
FORWARD-LOOKING STATEMENTS
This document contains certain forward-looking statements with respect to the financial condition, results of operations and business of TomTom and certain of the plans and objectives of TomTom with respect to these items. In particular, the words ‘expect’, ‘anticipate’, ‘estimate’, ‘may’, ‘should’, ‘believe’, ‘outlook’, and similar expressions are intended to identify forward-looking statements. By their nature, forward-looking statements involve risk and uncertainty because they relate to events and depend on circumstances that will occur in the future.
Actual results may differ materially from those expressed in these forward-looking statements, and you should not place undue reliance on them. For a discussion of factors that could cause future results to differ from such forward-looking statements, see also the Risk management and control of this Annual Report.
THIRD-PARTY MARKET SHARE DATA
Statements regarding market share, including the company’s competitive position, contained in this Annual Report are based on outside sources such as specialized research institutes, industry and dealer panels in combination with management estimates.
SUPPLEMENTARY INFORMATION / PAGE 119
FORWARD LOOKING STATEMENTS

The financial information in this report includes measures, which are not defined by generally accepted accounting principles (GAAP) such as IFRS. We believe this information, along with comparable GAAP measurements, gives insight to investors because it provides a basis for evaluating our operational performance. Non-GAAP financial measures should not be considered in isolation from, or as a substitute for, financial information presented in compliance with GAAP. Wherever appropriate and practical, we provide reconciliations to relevant GAAP measures.
Term Definition
Operational revenue is IFRS revenue adjusted for the movement of gross deferred revenue.
Gross margin is calculated as gross profit divided by IFRS revenue.
EBIT is equal to operating result.
EBIT margin is calculated as operating result divided by IFRS revenue.
EBITDA is equal to operating result plus depreciation and amortization charges.
EBITDA margin is calculated as operating result plus depreciation and amortization charges divided by IFRS revenue.
Automotive backlog is the cumulative expected IFRS revenue from all awarded Automotive deals.
Free cash flow is cash from operating activities minus capital expenditure (investments in intangible assets and property, plant and equipment).
Net cash is cash and cash equivalents plus cash held in fixed term deposits.
Gross deferred revenue
is deferred revenue before the netting of unbilled receivables1
Equity free cash flow yield
is free cash flow divided by the market capitalization (number of outstanding share capital multiplied by the share price) at year end.
1 Deferred revenue reflects amounts not yet recognized as revenue as services still need to be delivered. Unbilled receivables represents amounts accrued for when a contractual right to invoice exists. When a single contract has both an accrual, based on contractual invoicing terms, and a deferral, because the underlying services are not yet fully delivered, the unbilled and the deferred positions are netted for presentation on the balance sheet.
SUPPLEMENTARY INFORMATION / PAGE 120
NON-GAAP MEASURES
SUPPLEMENTARY INFORMATION / PAGE 121
NON-GAAP MEASURES