BKB Annual Report 2021
57
SERVICE EXCELLENCE | ENTREPRENEURSHIP | EARNINGS | EMPLOYEES | ENVIRONMENT #IntegrityIntegrated 1 #SustainabilitySynergised #IntegrityIntegrated annual report 2021
-
Upload
khangminh22 -
Category
Documents
-
view
4 -
download
0
Transcript of BKB Annual Report 2021

S E R V I C E E X C E L L E N C E | E N T R E P R E N E U R S H I P | E A R N I N G S | E M P L O Y E E S | E N V I R O N M E N T
#IntegrityIntegrated 1
#SustainabilitySynergised
#IntegrityIntegrated
annual report 2021

P E O P L E | P L A N E T | P R O F I T
#SustainabilitySynergisedS E R V I C E E X C E L L E N C E | E N T R E P R E N E U R S H I P | E A R N I N G S | E M P L O Y E E S | E N V I R O N M E N T
#IntegrityIntegrated 21
B K B | A N N U A L R E P O R T 2 0 2 1
P E O P L E | P L A N E T | P R O F I T
#SustainabilitySynergisedS E R V I C E E X C E L L E N C E | E N T R E P R E N E U R S H I P | E A R N I N G S | E M P L O Y E E S | E N V I R O N M E N T
#IntegrityIntegrated
contents
1 2
SALIENT FEATURES
Positive turnaround performance driven by Fibres, Livestock, Retail Trade and Sugar
businesses.
Value of business + 19% to R13,2 billion
Net debt reduction of R66,6 million
EBITDA + 66% to R282,5 million
BKB producers are the biggest group of
Responsible Wool and Mohair Standards (RWS and RMS)
suppliers in the world.
HEPS improved from 37c to 132c per share
Impact of the COVID-19 pandemic well managed,
remaining agile.
Proposed dividend of 40c per share (2020: 5c per share)
Landbank financing settled with new facilities secured.
Net debt to equity ratio improved from 74.7% to 63%
Well positioned for future growth and opportunities.
R100,6 million free cash flow generated equals to
95.9% of Net profit after tax
Salient features1
OUR 2021 ANNUAL REPORT
3
About our Annual Report
4
Chairman’s message5 – 6
AN OVERVIEW OF BKB LIMITED
7
Vision, mission and values
8
Our organisational structure and brands
9
Our business profile10 – 11
Our footprint12
Our stakeholders12
PERFORMANCE13
Five-year financial summary
14
Chief Executive Officer’s report
15 – 19
Financial review20 – 23
Operations review24 – 26
GOVERNANCE27
Governance report28 – 30
Board of directors
31 – 32
Material business risks33 – 34
BKB Group: environmental, social
and governance (ESG) impacts35 – 38
Audit and Risk Committee report
39 – 40
Directors’ responsibilities
and approval 41
Group secretary’s declaration
42
Directors’ report43 – 45
Independent auditor’s report
46 – 47
ANNUAL FINANCIAL STATEMENTS
49 – 110

B K B | A N N U A L R E P O R T 2 0 2 1
4S E R V I C E E X C E L L E N C E | E N T R E P R E N E U R S H I P | E A R N I N G S | E M P L O Y E E S | E N V I R O N M E N T
#IntegrityIntegrated
SCOPE AND BOUNDARYThis Annual Report covers the BKB Group’s activities for the period 1 July 2020 to 30 June 2021. It is prepared primarily to meet the information needs of current and prospective shareholders, providers of finance and other interested stakeholders. The BKB Group’s statutory reporting responsibilities are also fulfilled by the contents of this report. The report contains a full set of the audited Company and Group Annual Financial Statements.
BKB views its Annual Report as a way of providing an insight and basic understanding of the Group’s business activities. As such, the report seeks to provide information and disclosures that are of interest to all stakeholders. The report extends beyond financial reporting and includes non-financial information and its contents are informed by BKB’s value-adding business model, strategies, risk assessments, opportunities, governance practices and operational and financial results.
REPORTING FRAMEWORKS AND GUIDELINESThe report has been designed to meet the requirements of the Companies Act, 71 of 2008, as amended (the Companies Act). The Annual Financial
Statements comply with International Financial Reporting Standards.
As stated in the Corporate Governance Report, the Board is guided by the principles contained in the King IV Report on Corporate GovernanceTM for South Africa (King IV)* and endeavours to adopt them as far as is practically possible.
INDEPENDENT ASSURANCEThe Company and Group Annual Financial Statements for the year ended 30 June 2021 were audited by PwC. Their unqualified report appears on page 46.
External verification of Broad-based Black Economic Empowerment (“BBBEE”) performance for BKB Limited and at subsidiary level is done by Moore Stephens. Their certificate is available on our website at https://www.bkb.co.za.
FORWARD-LOOKING STATEMENTSThis report contains certain forward-looking statements with respect to BKB’s prospects and performance. These are not guarantees or predictions of future performance. These statements and forecasts involve risk and uncertainty as they relate to events and depend on circumstances that may or may
not occur, as well as events which are beyond BKB’s control. Actual future results may thus differ materially from those contained in this report. Readers are therefore advised not to place undue reliance on forward-looking statements as we do not undertake to update these.
FEEDBACK AND CONTACTWe value feedback from our stakeholders and use it to ensure that we are reporting appropriately on issues that matter to them. Please direct comments and suggestions to the Company Secretary at [email protected] or +27415033060.
APPROVAL BY THE BOARDThe Board acknowledges its responsibility for the integrity of this Annual Report. The Board confirms that it has applied its collective mind to the preparation and presentation of this report and believes that it provides a balanced representation of the performance of the BKB Group. The report was approved by the Board of Directors on 14 September 2021.
* Copyright and trademarks are owned by the Institute of Directors in South Africa NPC and all of its rights are reserved.
P E O P L E | P L A N E T | P R O F I T
#SustainabilitySynergised
ABOUTOUR ANNUAL REPORT
3
OUR 2021 ANNUAL REPORT

P E O P L E | P L A N E T | P R O F I T
#SustainabilitySynergised 65
B K B | A N N U A L R E P O R T 2 0 2 1
The 2021 financial year (the year) will be remembered as one of the most challenging for BKB in recent times. The COVID-19 pandemic has been an unprecedented and unpredictable event, creating enormous challenges for businesses and economies globally. During the past year BKB has experienced both the best and the most difficult aspects of what it means to be part of the South African agricultural industry. We have much to be proud of in the way in which we have met and overcome the challenges presented by the devastating pandemic. BKB has been exceptionally resilient and has finished the year in a stronger position than when it began. I would like to empathise with those producers that are still going through very severe drought conditions and I pray that they will receive relieving rain soon so that they can get their farming businesses back into a profitable situation.
One of the reasons that BKB has been able to weather this
storm successfully is because of the strong position that my predecessor Chris Louw left the company in. Chris made an enormous contribution to BKB in the more than 20 years that he served on the Board, the majority as Chairman. He played a pivotal role in transforming BKB into the successful organisation it is today and helped create a culture in BKB that really lives our values of Service Excellence coupled with Entrepreneurship, while at the same time looking after earnings, our employees and the environment that we operate in. I would like to sincerely thank Chris for his many years of selfless service to both BKB and the agricultural industry. BKB and its stakeholders owe him an enormous debt of gratitude.
FINANCIAL RESULTSBKB has achieved a significant improvement in its financial results, recording profit before tax of R148,9 million for the 12 months to 30 June 2021, compared with R18,8 million in the previous year. Thanks to the efforts of everyone at BKB, the Group delivered a financial performance above our expectations. The financial results are especially pleasing given that 2021 was a year like no other.
The Group’s improved financials can be ascribed to its diversified business model and, particularly, the strong performances of the Fibres, Livestock, Retail trading and Sugar businesses. During the year, there has been a highly disciplined approach to managing efficiencies and costs, a focus on improving margins and stronger working capital and asset management.
The overall balance sheet position has improved with net debt reducing by R66,6 million due to solid operating cash inflows, disciplined working capital management and tight controls over capital expenditure. The reduction in borrowing levels is a significant achievement and will assist with directing cash flow into those areas of the business that require new investment and strengthening to grow future earnings and returns.
The excellent financial results for 2021 will impact directly on BKB’s shareholders and the Board has proposed a dividend of 40 cents per share (2020: 5 cents per share).
The financial results are dealt with in more detail in the CEO’s report (page 15) and financial review (page 20).
THE BOARD AND GOVERNANCEThe Board strongly believes that a culture of compliance and a commitment to applying the “BKB Values” by our employees in their day-to-day business activities are vital in ensuring BKB’s long-term success.
BKB is committed to high standards of corporate governance and endeavours to apply the principles as set out in King IV. The Company’s corporate governance
Founded over 100 years ago, BKB is an iconic South African company and it is an honour to have been appointed Chair in November 2020. It gives me great pleasure to report in my first year as Chair that the 2021 financial year has been one of significant and positive change for the BKB Group.
practices and policies support an unequivocal and full discharge of its corporate governance obligations.
The past year has been one of consistency and stability on the Board. Our experienced directors continue to serve BKB with a clear focus and dedication, ensuring that real value is created for all stakeholders. As Chair I am confident we have appropriate balance, experience and expertise at both Board and Executive level. I thank all our Board members for the wisdom and guidance provided to BKB this past year and the hard work and effort they have put in while doing so.
LOOKING AHEADOver the past year the Board has worked closely with the CEO and his leadership team to develop BKB’s strategy. The priority of the strategy is to strengthen the core businesses and secure their sustainability to ensure enhanced shareholder returns. In addition to driving our existing assets, we have identified specific growth areas. Some of
these build on our existing expertise and some involve new synergistic and value-adding areas.
We continue to assess all current operations to ensure that we invest in only those services and products that are capable of generating positive and sustainable returns.
Our connection with our customers and clients is critical to the success of BKB as we continue to strive to provide relevant, innovative and value-adding services and products.
Continuous improvements in productivity are key for South African growers and producers to compete globally. We believe that technology that provides productivity improvements to our growers and producers is essential for their ongoing profitability and sustainability. In the coming year we will further develop our future-oriented business strategy in this area to ensure that BKB meets the changing demands and needs of its customers and clients.
CLOSING REMARKSThe BKB team have been truly remarkable in adapting to difficult challenges in 2021. On behalf of the directors, I take this opportunity to extend the Board’s appreciation to Johan Stumpf, his management team and all BKB’s employees who continue to represent the Company with professionalism, pride and enthusiasm. Your hard work and high levels of customer service to BKB’s customers, suppliers and clients across the country have been the backbone of a successful year. I would also like to express our sincere thanks for the loyalty of our customers and clients, the support of our suppliers and financiers and the faith that all other stakeholders have shown in BKB.
Geoff KingwillChairman
14 September 2021
S E R V I C E E X C E L L E N C E | E N T R E P R E N E U R S H I P | E A R N I N G S | E M P L O Y E E S | E N V I R O N M E N T
#IntegrityIntegrated
CHAIRMAN’S MESSAGE
6

B K B | A N N U A L R E P O R T 2 0 2 1
S E R V I C E E X C E L L E N C E | E N T R E P R E N E U R S H I P | E A R N I N G S | E M P L O Y E E S | E N V I R O N M E N T
#IntegrityIntegrated 87
OUR VALUESOur values are simple, concrete, meaningful and capture the essence of our culture, who we are and how we interact with one another. They speak of how we go to market and our commitment to delivering a culture of excellence to all stakeholders as the Trusted Home of Agriculture.
OUR VISIONTo craft agri-business through trust and shared values.
OUR MISSIONMaximising value creation through innovation and efficiency.
BKB Limited is a leader in the agri-industry. We are the Trusted Home of Agriculture. At its core, BKB is profit-driven in the interest of all stakeholders, with a major stake held by primary producers and agricultural groupings.
VALUESVISION, MISSION AND
INTEGRITY
CONSERVE THE ENVIRONMENTThe environment is in our hands.
SERVICE EXCELLENCEService excellence is in our hands.
ENCOURAGE ENTREPRENEURSHIPOpportunity is in our hands.
DRIVE EARNINGSProsperity is in our hands.
VALUE EMPLOYEESRespect is in our hands.
P E O P L E | P L A N E T | P R O F I T
#SustainabilitySynergised7
AN OVERVIEW OF BKB LIMITED

B K B | A N N U A L R E P O R T 2 0 2 1
S E R V I C E E X C E L L E N C E | E N T R E P R E N E U R S H I P | E A R N I N G S | E M P L O Y E E S | E N V I R O N M E N T
#IntegrityIntegrated 109 P E O P L E | P L A N E T | P R O F I T
#SustainabilitySynergised
OUR
ORGANISATIONAL STRUCTURE AND BRANDSOur values, core competencies and reputation ensure the sustainability of our long-term competitive advantage.
Brokerage Services
Livestock, auctioneering & properties
Property leasing
trading
digital acceleration
financial services
Corporate & Support Services
fruit
consumer goods
grain & feed
Corporate Services
Human Resources Financial & ICT Corporate
Marketing & PR
FUELS
SERVICES AND PRODUCTS PURPOSE OPERATIONS LOCATION
FIBRE (WOOL AND MOHAIR)
Wool and mohair brokerageShearing servicesTechnical field servicesFibre trading servicesFinancing services
Maximise sustainable returns for producers by ensuring an efficient and transparent marketplace; providing an efficient logistical service, advising producers on production efficiency with a primary focus on genetic improvement.
• Warehousing• 18 shearing coordinators• 57 technical advisors
LesothoSouth Africa
TRADE AND FUEL
FuelFertiliserSeedVeterinary productsAnimal feedShearing equipmentIrrigationWool bagsSteelFencingBuilding materialHardwareGroceriesGeneral consumer goodsConvenience storesProduction financingOnline Shopping
BKB's national retail footprint was specifically created to support wool and mohair farmers. Over time, services expanded to provide a complete range of production inputs, production financing and other retail products to a broad spectrum of agricultural producers and the general public.
• 51 agri-retail shops• Four 24 hour forecourts• 3 fuel depots• Distribution Centre• 2 convenience shops• BKB online shop
Eastern CapeFree StateKwaZulu-Natal MpumalangaNorthern CapeWestern Cape
LIVESTOCK AND PROPERTIES
Calendar auctionsStud auctionsLiaison transactionsDigital and simulcast auctionsAgricultural implements auctionsFarm propertiesResidential propertiesCommercial propertiesProperty rentalsFinancing services
Utilisation of an extended regional footprint and auction infrastructure (open-cry and online) to facilitate market access for buyers and sellers of livestock, agricultural equipment and properties.
• 5 livestock regions• 11 livestock branches• 4 property branches• 46 auction points• Online auction platform
Eastern CapeFree StateGautengKwaZulu-NatalLimpopoNorthern CapeNorth WestMpumalangaWestern Cape
OUR
BUSINESS PROFILE

B K B | A N N U A L R E P O R T 2 0 2 1
P E O P L E | P L A N E T | P R O F I T
#SustainabilitySynergisedS E R V I C E E X C E L L E N C E | E N T R E P R E N E U R S H I P | E A R N I N G S | E M P L O Y E E S | E N V I R O N M E N T
#IntegrityIntegrated 1211
SERVICES AND PRODUCTS PURPOSE OPERATIONS LOCATION
DIGITAL ACCELERATION (SHIFT DX)
Blockchain-as-service traceabilityDigital marketplaceBusiness intelligence and data analyticsDigital media community management
Using new technologies to enable the agricultural supply chain to address today’s production system challenges.
• Traceability of wool and mohair bales
• Hosting on-line stud auctions • Digital media managed
solutions
PAKHOUSE BRANDS – FRUIT
ProcurementPackagingLogisticsMarketing and selling
Raisin supplier to international and local dried fruit buyers.
• 1 processing operation Northern Cape
PAKHOUSE BRANDS – GRAIN AND FEED
Storage and collateral management
Service provider to South African grain and lucerne producers, millers and traders.
• 11 SAFEX accredited grain depots
• 4 lucerne depots• 14 on-farm depots
South Africa
ProcurementPackagingManufacturingLogisticsSelling
Processing and supplying of intermediate manufactured grain products and lucerne bales to local and international buyers.
• 3 processing plants Free State
PAKHOUSE BRANDS – CONSUMER GOODS
ProcurementPackagingLogisticsSelling
Sugar and diverse consumer products supplier to local wholesale and retail buyers.
• 2 processing plants eSwatiniFree StateGauteng
We pride ourselves in having secured a wide and deep-rooted footprint across our agricultural landscape.
S E R V I C E E X C E L L E N C E | E N T R E P R E N E U R S H I P | E A R N I N G S | E M P L O Y E E S | E N V I R O N M E N T
P E O P L E | P L A N E T | P R O F I T
Natural Fibres
Consumer Goods
Retail & Fuels
Fruit
Grain & Feed
Livestock & Properties
MAP KEY
�e BKB Group’s
FOOTPRINTOF TRUST
KWAZULU-NATAL
NORTHERN CAPE
FREE STATE
SWAZILAND
EASTERN CAPE
NORTH WEST
WESTERN CAPE
MPUMALANGA
LIMPOPO
GAUTENG
LESOTHO
Employees Customers Clients Suppliers Competitors and industry bodies
Investors and shareholders
Government and regulators
Communities
OUR
FOOTPRINT
OUR
STAKEHOLDERS
OUR BUSINESS PROFILE continued

B K B | A N N U A L R E P O R T 2 0 2 1
S E R V I C E E X C E L L E N C E | E N T R E P R E N E U R S H I P | E A R N I N G S | E M P L O Y E E S | E N V I R O N M E N T
#IntegrityIntegrated 1413 P E O P L E | P L A N E T | P R O F I T
#SustainabilitySynergised
2021R’000
2020R’000
2019R’000
2018R’000
2017R’000
STATEMENT OF PROFIT OR LOSS Value of business 13 213 136 11 100 715 11 428 667 11 318 193 9 919 600Revenue/Turnover 5 544 979 4 992 180 4 768 499 4 422 557 4 231 249EBITDA(1) 282 526 170 222 140 379 312 604 297 320Depreciation and amortisation 67 158 65 872 51 899 46 629 41 153Operating profit 215 368 104 350 88 480 265 975 256 167Finance expense (net) 66 517 85 582 41 791 37 495 52 674Income tax expense 43 934 10 200 22 402 67 222 68 268Profit for the year 104 917 8 568 24 287 161 258 135 225Headline earnings 104 318 29 076 26 207 165 494 131 344
STATEMENT OF FINANCIAL POSITION Non-current assets 1 134 519 1 075 674 1 064 336 982 460 825 164Current assets 1 701 637 1 724 960 1 691 907 1 421 940 1 583 592 2 836 156 2 800 634 2 756 243 2 404 400 2 408 756Total liabilities (1 548 689) (1 625 328) (1 571 946) (1 021 207) (1 193 843)Total shareholders' equity 1 287 467 1 175 306 1 184 297 1 383 193 1 214 913Net interest bearing debt 810 931 877 505 984 371 376 002 386 990
STATEMENT OF CASH FLOWS Cash flow from operating activities 193 988 177 306 (166 005) 131 628 143 733Cash profit after tax from operations 151 306 51 011 110 632 176 677 170 784Working capital changes 42 682 126 295 (276 637) (45 049) (27 051)Cash flow from investing activities (99 802) (21 139) (60 225) (101 398) (121 953)Cash flow from financing activities (35 581) (44 354) (142 966) (58 782) 127 662Net cash flows 58 605 111 813 (369 196) (28 552) 149 442
RATIOS ROFE (%)(2) 10.6 5.8 4.7 14.5 16.1Return on equity (%) 8.1 0.7 2.1 11.7 11.1Normalised price earnings ratio (times) 6.8 27.1 10.9 6.6 5.9Dividend yield at closing price (%) 4.4 0.5 0.6 4.8 4.9Total shareholders’ equity: Total assets employed (%) 45.4 42.0 43.0 57.5 50.4Net interest bearing debt: Total assets employed (%) 28.6 31.3 35.7 15.6 16.1Net interest bearing debt: Total shareholders’ equity (%) 63.0 74.7 83.1 27.2 31.9Net interest bearing debt: EBITDA (times) 2.9 5.2 7.0 1.2 1.3
PERFORMANCE PER SHARE Number of shares in issue ('000) 88 407 88 407 88 407 93 060 93 060Share price at 30 June (cents) (last traded price) 900 1 000 1 600 1 200 950Headline earnings (cents) 132 37 32 184 163Dividends (cents) (proposed gross) 40 5 10 58 47Net asset value (cents) 1 456 1 329 1 340 1 486 1 306
(1) Earnings before interest, taxation, depreciation and amortisation (2) Return (operating profit) on funds employed (excludes cash, short term borrowings and taxation)
FIVE-YEAR FINANCIAL SUMMARY
13
PERFORMANCE
B K B | A N N U A L R E P O R T 2 0 2 1
P E O P L E | P L A N E T | P R O F I T
#SustainabilitySynergisedS E R V I C E E X C E L L E N C E | E N T R E P R E N E U R S H I P | E A R N I N G S | E M P L O Y E E S | E N V I R O N M E N T
#IntegrityIntegrated 1615
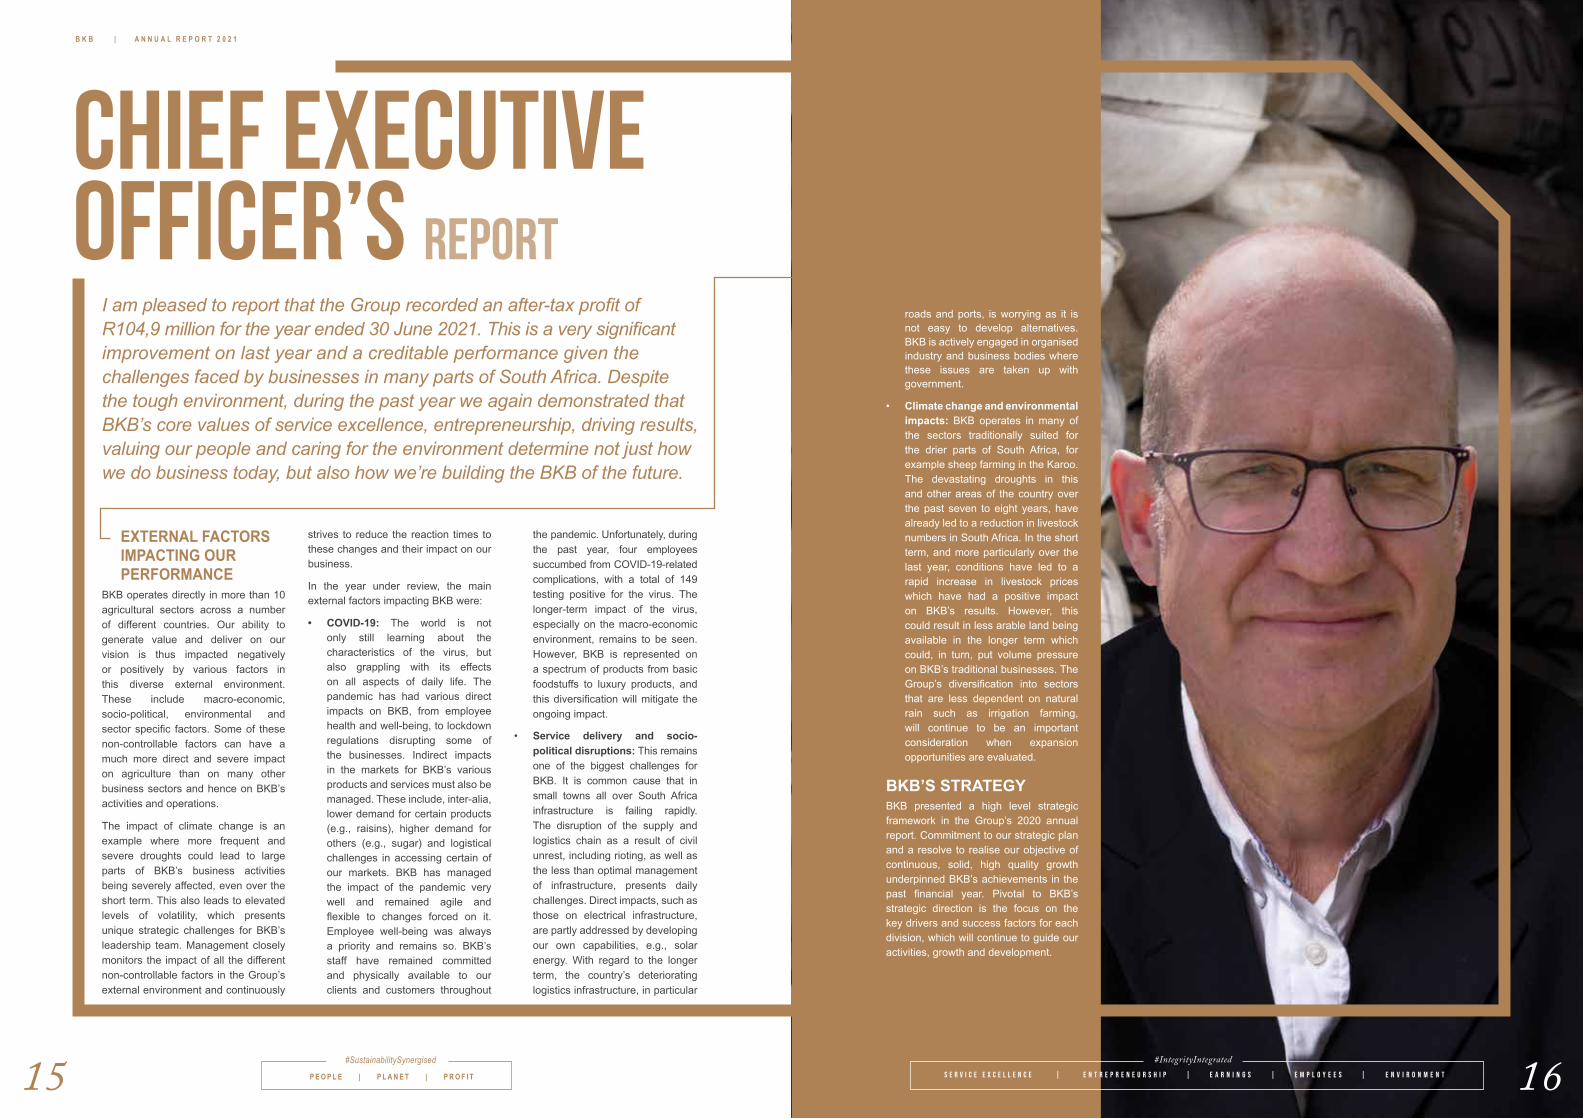
I am pleased to report that the Group recorded an after-tax profit of R104,9 million for the year ended 30 June 2021. This is a very significant improvement on last year and a creditable performance given the challenges faced by businesses in many parts of South Africa. Despite the tough environment, during the past year we again demonstrated that BKB’s core values of service excellence, entrepreneurship, driving results, valuing our people and caring for the environment determine not just how we do business today, but also how we’re building the BKB of the future.
S E R V I C E E X C E L L E N C E | E N T R E P R E N E U R S H I P | E A R N I N G S | E M P L O Y E E S | E N V I R O N M E N T
#IntegrityIntegrated 16
EXTERNAL FACTORS IMPACTING OUR PERFORMANCE
BKB operates directly in more than 10 agricultural sectors across a number of different countries. Our ability to generate value and deliver on our vision is thus impacted negatively or positively by various factors in this diverse external environment. These include macro-economic, socio-political, environmental and sector specific factors. Some of these non-controllable factors can have a much more direct and severe impact on agriculture than on many other business sectors and hence on BKB’s activities and operations.
The impact of climate change is an example where more frequent and severe droughts could lead to large parts of BKB’s business activities being severely affected, even over the short term. This also leads to elevated levels of volatility, which presents unique strategic challenges for BKB’s leadership team. Management closely monitors the impact of all the different non-controllable factors in the Group’s external environment and continuously
strives to reduce the reaction times to these changes and their impact on our business.
In the year under review, the main external factors impacting BKB were:
• COVID-19: The world is not only still learning about the characteristics of the virus, but also grappling with its effects on all aspects of daily life. The pandemic has had various direct impacts on BKB, from employee health and well-being, to lockdown regulations disrupting some of the businesses. Indirect impacts in the markets for BKB’s various products and services must also be managed. These include, inter-alia, lower demand for certain products (e.g., raisins), higher demand for others (e.g., sugar) and logistical challenges in accessing certain of our markets. BKB has managed the impact of the pandemic very well and remained agile and flexible to changes forced on it. Employee well-being was always a priority and remains so. BKB’s staff have remained committed and physically available to our clients and customers throughout
the pandemic. Unfortunately, during the past year, four employees succumbed from COVID-19-related complications, with a total of 149 testing positive for the virus. The longer-term impact of the virus, especially on the macro-economic environment, remains to be seen. However, BKB is represented on a spectrum of products from basic foodstuffs to luxury products, and this diversification will mitigate the ongoing impact.
• Service delivery and socio-political disruptions: This remains one of the biggest challenges for BKB. It is common cause that in small towns all over South Africa infrastructure is failing rapidly. The disruption of the supply and logistics chain as a result of civil unrest, including rioting, as well as the less than optimal management of infrastructure, presents daily challenges. Direct impacts, such as those on electrical infrastructure, are partly addressed by developing our own capabilities, e.g., solar energy. With regard to the longer term, the country’s deteriorating logistics infrastructure, in particular
CHIEF EXECUTIVE OFFICER’S REPORT
roads and ports, is worrying as it is not easy to develop alternatives. BKB is actively engaged in organised industry and business bodies where these issues are taken up with government.
• Climate change and environmental impacts: BKB operates in many of the sectors traditionally suited for the drier parts of South Africa, for example sheep farming in the Karoo. The devastating droughts in this and other areas of the country over the past seven to eight years, have already led to a reduction in livestock numbers in South Africa. In the short term, and more particularly over the last year, conditions have led to a rapid increase in livestock prices which have had a positive impact on BKB’s results. However, this could result in less arable land being available in the longer term which could, in turn, put volume pressure on BKB’s traditional businesses. The Group’s diversification into sectors that are less dependent on natural rain such as irrigation farming, will continue to be an important consideration when expansion opportunities are evaluated.
BKB’S STRATEGYBKB presented a high level strategic framework in the Group’s 2020 annual report. Commitment to our strategic plan and a resolve to realise our objective of continuous, solid, high quality growth underpinned BKB’s achievements in the past financial year. Pivotal to BKB’s strategic direction is the focus on the key drivers and success factors for each division, which will continue to guide our activities, growth and development.

B K B | A N N U A L R E P O R T 2 0 2 1
P E O P L E | P L A N E T | P R O F I T
#SustainabilitySynergisedS E R V I C E E X C E L L E N C E | E N T R E P R E N E U R S H I P | E A R N I N G S | E M P L O Y E E S | E N V I R O N M E N T
#IntegrityIntegrated 1817
The main strategic focus of the past year was to turn around the deteriorating financial performance of 2019 and 2020. BKB has always been known for its sound balance sheet, strong cash flows, and good returns on the funds employed in the business. For most of these measures BKB ranked number one or two among peers in the agricultural sector. In order to drive the turn around and achieve improved financial performance, management has implemented two metrics which can be used by stakeholders to measure progress. More importantly, they are being used to drive behaviour throughout the Group. A third metric focusing on growth will be added as soon as current operations are sufficiently stabilised and back on the road to profitability.
The main measures, targets and actual performance are summarised as follows:
STRATEGIC MEASURE DESCRIPTION TARGET
ACTUAL VS TARGET VS PREVIOUS YEAR
Return on funds employed (“ROFE”)
This ratio indicates how effectively management utilises all funds in the business. It is important that this should outperform the weighted average cost of capital (“WACC”) in the business.
Historically BKB achieved returns of between 1.5 and 3 percentage points in excess of WACC. The goal has been set to return to these levels in the next three years.
Actual (2021): 10.6%
Target (2021): 10.8%
Actual (2020): 5.8%
Net debt to earnings before interest, taxes, depreciation, and amortisation (“EBITDA”)
This ratio is an indication of how much balance sheet risk is taken to generate returns. In a strong, growing market such as the world has seen after the 2008 financial crisis, management can be tempted to take on high debt levels in order to increase return on equity. When a downturn happens (such as we are currently experiencing), many companies are unable to sustain these debt levels and the business can fail from a liquidity point of view.
Traditionally BKB performed extremely well on this metric. A goal has been set to get it back to a ratio of 3 over the next three years and to around 2.5 thereafter.
Actual (2021): 2.9
Target (2021): 3.0
Actual (2020): 5.2
According to these metrics BKB performed well in the past year and, to some extent, is closer to achieving the desired turnaround than envisaged a year ago. Although financial metrics such as these “show the score” to a certain extent, they do not present a complete picture of which business units contributed. BKB, especially in its traditional agri-businesses, is a service oriented business and can only be successful if it has superior human capital. The resilience and dedication of BKB’s staff through this challenging year is acknowledged and it would not have been possible to achieve what has been achieved without them.
BKB still has a distance to go to get back to pre-2018 performance levels. Management will continue to drive this and a growth metric will also be set. The good performance with regard to the balance sheet position (largely as a result of good working capital management) means that there is room to pursue organic growth as well as small, focused acquisitive opportunities.
The strategic drivers as presented in the 2020 annual report remain largely similar. The following table contains the updated strategic drivers, and also some comments with regard to progress on these:
STRATEGIC DRIVER DESCRIPTION GOAL
Protect and build selectively
These are businesses that perform well and where BKB is seen as a market leader, e.g. fibre, retail and livestock.
The focus will be to make these businesses even more effective and more customer oriented by exploiting synergistic opportunities and investing in the latest technology (e.g., digital platforms). Although acquisitive growth was not necessarily a focus area, this strategy has altered and BKB will consider opportunities both up- and down-stream in the value chain, as well as international opportunities. Some smaller acquisitions in the Livestock Division have been made, with more opportunities being investigated. These are low-risk, “bolt-on” acquisitions and have limited capital requirements. The Competition Commission has approved the merger of BKB and VKB’s Retail Divisions. The implementation thereof will be executed in such a way that both brands will continue to be managed by the entity that owns the brand. The focus will be on unlocking value in logistics and procurement.
Manage for earnings and growth
The newer businesses in PakHouse Brands fall under this category. As the acquisitions were mostly executed by leveraging the balance sheet of the target companies, bottom-line profitability is problematic for some of them. These are important businesses for BKB as they bring diversification to the Group, not only from a product and geographic perspective, but also by broadening the export-based earnings.
Focus will be on improving earnings by means of efficiency improvements, product innovation, product quality and brand development. Synergies between these businesses and external partners (e.g. VKB, with which BKB already has a relationship), will also be investigated within the framework of prevailing Competition laws. New acquisitions and/or mergers could also play a role. The improved results of BKB are mainly because of improved performance of previously under- performing businesses in PakHouse Brands. As a first step in turning these businesses around the focus was set on putting the right management in place, who in turn focused on necessary efficiency improvements.
Invest/divest These are businesses and assets that may not be performing, are not core to BKB’s future, or may still be in a development phase.
These constitute smaller businesses which were either acquired or seed-capital funded by BKB. RFID Experts Africa was moved out of Technology into the Livestock Division. The remaining technology businesses, housed in Shift DX, could benefit from an external partner/s. The clothing company, CORE Merino, could also benefit from an external partner, who is active in the fashion sector. Various alternatives regarding suitable partners are under consideration.
CHIEF EXECUTIVE OFFICER’S REPORT continued

B K B | A N N U A L R E P O R T 2 0 2 1
P E O P L E | P L A N E T | P R O F I T
#SustainabilitySynergisedS E R V I C E E X C E L L E N C E | E N T R E P R E N E U R S H I P | E A R N I N G S | E M P L O Y E E S | E N V I R O N M E N T
#IntegrityIntegrated 2019
OUTLOOKThe short to medium term outlook remains similar to the past year, with the three factors outlined above having the largest impact on results.
Livestock prices should remain fairly strong for at least the next year. Volumes will remain subdued as herds are being rebuilt after the prolonged drought. While the drought has broken in some areas, other large areas of the country are still experiencing severe drought conditions. Fibre pricing has recovered well after the initial impact of the pandemic. Fibre prices are expected to remain at these levels for the foreseeable future. Our wool business operates in a volatile environment where any unexpected shocks as a result of the COVID-19 pandemic could change the outlook.
BKB enjoys a high market share, making further growth difficult. Retail has become a star performer and the division’s focus will be to further enhance efficiencies, including leveraging the opportunities presented by joining forces with VKB. PakHouse Brands had excellent performances from its sugar and grain storage and handling businesses, which could be difficult to replicate. However, they are still expected to perform very well in the year ahead. The focus on the remaining businesses within PakHouse Brands was to turn their performance around. Although there has been good progress on this front, they are not yet achieving the profit levels expected from them. Over the next 18 months management’s focus and attention will be on getting acceptable returns from these businesses, which should mean incremental profits for the BKB Group.
BKB operates in an environment with diverse stakeholders, not only in terms of their interests, but also demographically and geographically. The Group’s
activities impact many lives as its producers also provide jobs, thereby supporting many families in some of the poorest areas in South Africa. BKB recognises this responsibility and will always attempt to fairly balance the needs and requirements of all stakeholders. Towards this end BKB backs many community projects and initiatives, supports employees on different fronts, such as bursaries for further studies, and plays a big role in a diverse number of industry bodies and NGOs, addressing issues such as the natural environment, business environment and social challenges.
BKB has been operating as an unlisted public company for many years. Although shares are traded between shareholders, the process is cumbersome and not necessarily conducive to creating sufficient liquidity. The Company is busy investigating options with regard to a simpler share trading environment, which should result in more liquidity.
BKB is in a much better position than a year ago. I would like to thank the Board for the support it provided management and employees to implement the initiatives that resulted in this improved performance. I would like to thank the executive team, and every employee of BKB, as this was and will be a team effort going forward. Producers and their farming activities remain at the heart of BKB’s success and I would like to thank all our producers, clients and customers who supported BKB during the past year.
Johan Stumpf
CEO
14 September 2021
KEY MESSAGESVALUE OF BUSINESS
and gross margin rand value GROWTH of 19%
RECOVERIES IN FIBRE AND LIVESTOCK divisional performances ABOVE EXPECTATIONS
OUTSTANDING PERFORMANCE in PAKHOUSE GRAIN STORAGE AND HANDLING while performance in GRITCO MILLS was DISAPPOINTING
IMPROVEMENTS in EXPENSE CONTROL/optimisation
STRONG FREE CASH FLOW GENERATION OF R100,6 MILLION, equals to 95.9% of net profit after tax
FINANCING FROM LANDBANK REPLACED by commercial banks
Ongoing SOLID PERFORMANCES in TRADING AND PAKHOUSE SUGAR Divisions
CHIEF EXECUTIVE OFFICER’S REPORT continued
FINANCIAL REVIEW

B K B | A N N U A L R E P O R T 2 0 2 1
P E O P L E | P L A N E T | P R O F I T
#SustainabilitySynergisedS E R V I C E E X C E L L E N C E | E N T R E P R E N E U R S H I P | E A R N I N G S | E M P L O Y E E S | E N V I R O N M E N T
#IntegrityIntegrated 2221
OVERVIEWThe financial year ended 30 June 2021 finished stronger than expected. The ongoing challenges are well documented, but the diversity of the Group's operations has again proved to be a major strength during these unprecedented times. Focus has been on limiting non-essential expenditure, managing working capital appropriately and enhancing the Group's banking facilities.
OUR CONSOLIDATED TRADING AND PROFITABILITY
VALUE OF BUSINESSThe Group prefers using value of business as a measure of performance, rather than revenue, due to the Fibre brokerage and Livestock Divisions which both earn agent commissions. Value of business grew 19% to R13,2 billion, mainly due to better than expected recoveries and performance in the Fibre (23% year on year growth) and Livestock (38% year on year growth) Divisions.
GROSS MARGINGross margin as a percentage of value of business for the Group contracted marginally to 8.7% (2020: 8.8%), which was expected due to the substantial increase in value of the lower margin Livestock business. The Trading Division's margins improved due to several operational improvement projects, upgrading of several retail shops and a changing product mix. PakHouse Sugar Division's margins benefited from competitors’ short supply while PakHouse Fruits Division also reported increased margins, mainly due to initiatives taken by the new management team.
TRADING AND PROFITABILITY CASH AND CAPITAL ALLOCATION
19%VALUE OF BUSINESS GROWTH
totalling R13,2 billion (2020: R11,1 billion)
10.6%ROFE
(2020: 5.8%)
66%EBITDA GROWTH
totalling R282,5 million (2020: R170,2 million)
2.9 XNET DEBT TO EBITDA
(2020: 5.2 X)
R104,3 MHEADLINE EARNINGS
(2020: R29,1 million)
63%NET DEBT TO EQUITY RATIO
(2020: 74.7%)
132 CENTSHEADLINE EARNINGS PER SHARE
(2020: 37 cents)
R66,6 MNET DEBT REDUCTION
totalling R173,4 million over past two years
3 XINTEREST COVER RATIO
(2020: 1.2X)
EXPENSESThe Group’s expense margin reduced as a percentage of value of business to 7.4% (2020: 8.1%) and to 17.6% (2020: 18%) of revenue. Overall, expenses increased by 8.8%, mainly driven by increased variable commissions in the Livestock Division. The Group continues to seek opportunities to reduce the cost of doing business while at the same time being mindful of necessary upgrading and maintenance of its property portfolio and investment in critical information technology to ensure data security and business continuity.
EARNINGS PER SHARE AND DIVIDENDSEarnings per share and headline earnings per share increased by 587% and 259%, to 133 cents and 132 cents respectively. The prior year impairment of intangible assets was the main adjusting item between earnings and headline earnings in the prior year.
The Board is pleased to be able to propose a gross dividend of 40 cents per share (2020: 5 cents per share), which is in line with its targeted and consistent dividend cover of approximately 3 times earnings.
OUR CONSOLIDATED CASH AND CAPITAL ALLOCATIONThe Group uses return on funds employed (ROFE) as an internal measurement across the business. ROFE measures operating profit performance on funds employed, which excludes cash, short term borrowings and taxation. The Group is proud of achieving a ROFE of 10.6% in a turnaround financial year, albeit still marginally lower than the Groups weighted average cost of capital (WACC).
WORKING CAPITALThe Group remains very focused on working capital management, particularly as operations are measured on ROFE with working capital being a substantial part of funds employed.
Working capital as a percentage of value of business reduced to 7.6% (2020: 9.3%).
Inventory levels at year end were 5.4% lower at R710,4 million (2020: R750,7 million), the principal reasons being large volumes of unsold wool on hand in the prior year and lower raisin stock in the current year due to flooding in the Upington area. Trading inventory grew by 27.7% to R286,5 million (ahead of 2% revenue growth) due to increased fuel stock prices and product mix.
The debtors book increased marginally to R888,5 million. Prior year debtors included substantial fibre-related receivables relating to an auction held on the last day of the financial year. Livestock debtors increased by 51% to R264,7 million which is in line with revenue growth and increased livestock prices.
The allowance for impairment as a percentage of the debtors book increased to 2.5% (2020: 1.7%). A conservative credit appetite and restricted approval criteria remain in place as the response to the Group's assessment of the prevailing economic climate, increased level of livestock debtors and ongoing effects of the pandemic.
FINANCIAL REVIEW continued

B K B | A N N U A L R E P O R T 2 0 2 1
P E O P L E | P L A N E T | P R O F I T
#SustainabilitySynergisedS E R V I C E E X C E L L E N C E | E N T R E P R E N E U R S H I P | E A R N I N G S | E M P L O Y E E S | E N V I R O N M E N T
#IntegrityIntegrated 2423
FREE CASH FLOWThe Group is very pleased with the current year free cash flow generation of R100,6 million, which equates to 95.9% of net profit after tax.
Free cash flow F2021 (R million)
271,2
(66,5)
(53,5)
42,7
(93,3)100,6
Operations Netinterest
Incometax
Workingcapital
changes
Capitalexpenditure
(net of disposals)
Freecash flow
net increase
0
50
100
150
200
250
300
Increase Decrease
NATURAL FIBRE (WOOL AND MOHAIR)The fibre team serves the wool and mohair industry by supplying brokerage, shearing, warehousing, and advisory services to producers in South Africa, Lesotho, Namibia, Australia and England, with a dedicated team of skilled professionals.
Its business strategy is to increase the profitability of its producers by:
- Ensuring an efficient and transparent marketplace for their products
- Providing efficient logistical services
- Advising producers on production efficiency, focusing primarily on genetic improvement
Wool prices are on the rise and maintaining this momentum will depend on how well the world copes with the new normal forced upon us all by COVID-19. House of Fibre, the
division’s independent mohair brokerage, has reached the critical mass required to make this business successful.
The Lesotho wool clip has been fully regained and will be marketed via South Africa and the BKB systems. The fibre team firmly believes that this is in the best interest of the producers in Lesotho.
BKB producers are the biggest group of suppliers in the world for the Responsible Wool and Mohair standards. The added value of certified fibre to producers amounts to more than R80 million additional income. Approximately 25% of the total SA wool clip and 65% of the SA mohair clip are certified and these percentages continue to grow.
The division has a number of ongoing initiatives in place aimed at reducing BKB’s carbon footprint. To date we have managed to sequester 11 800 tons of CO2. During the forthcoming year the division is targeting on becoming self-sufficient in terms of its water usage.
The warehouses have maintained their ISO 9001 2015 and 14001 2015 certifications as audited by SGS.
The world of textiles is changing and the division will need to adapt to significant changes in market forces where consumers are increasingly aware of human impact on the natural environment. Wool and mohair production are particularly well suited to reduce BKB’s carbon footprint significantly. To realise this potential, the division is in the process of implementing systems to substantiate its credentials, both scientifically and measurably.
The division will continue to engage with its end consumer market through its newly established trading business, Pinnacle Fibres. This business will further unlock value for BKB’s producers while developing opportunities to shorten the supply chain between producers and end-consumers or brands.
CAPITAL EXPENDITURECapital expenditure for the year increased to R104,4 million (2020: R59,7 million). Capital expenditure was carefully managed throughout the year under review. The Group invested in its grain storage and handling activities and trading branch upgrades. Plant upgrades in the Group’s fruit operations was necessary and justified by a high return on investment.
GEARINGAt 30 June 2021 the Group’s net debt to equity ratio was 63%, down from 74.7% at 30 June 2020.
The BKB Group has secured facilities of R1,23 billion through an arrangement with two of the major commercial banks. The Landbank debt has been settled by an interim bank facility while the new arrangement is being finalised. The new facilities will reduce the Group’s cost of debt, while providing sufficient credit lines and liquidity for the foreseeable future.
The Group’s focus for the year ahead will remain on maintaining conservative debt levels while at the same time positioning itself for future growth and opportunities.
APPRECIATIONI am grateful to the Board and my colleagues on the Group Executive for their ongoing support and sound judgement. I am privileged to work with such an experienced and dynamic team. Thank you to the finance teams across the Group for their hard work, resilience and enthusiasm during the past year, which was very demanding.
Jannie van NiekerkChief Financial Officer
14 September 2021
OPERATIONS REVIEW
FINANCIAL REVIEW continued
Operating profit contribution by major operation
2021
PakHouse Brands – Consumer goodsPakHouse Brands – Grain and feedPakHouse Brands – FruitLivestock and propertiesTrade and fuelFibre (Brokerage services)32%
20%19%
2%8%
18%
Value of business contribution by major operation
2021
PakHouse Brands – Consumer goodsPakHouse Brands – Grain and feedPakHouse Brands – FruitLivestock and propertiesTrade and fuelFibre (Brokerage services)26%
14%38%
3%13%
6%

B K B | A N N U A L R E P O R T 2 0 2 1
P E O P L E | P L A N E T | P R O F I T
#SustainabilitySynergisedS E R V I C E E X C E L L E N C E | E N T R E P R E N E U R S H I P | E A R N I N G S | E M P L O Y E E S | E N V I R O N M E N T
#IntegrityIntegrated 2625
TRADE AND FUELBKB Retail and Fuel Division comprises a network of 57 business units that consist of retail shops and 24-hour forecourts across the country.
The division’s strategic focus remains the support of farming producers, especially in rural areas. Strategic actions include:
- Shortening the supply chain of FMCG products by introducing a distribution centre. This will ensure standardised product ranges as well as improved stock availability at competitive prices.
- Improving the shopping experience for customers through upgrading several BKB retail shops including an integrated point of sales system.
- Stimulating fuel volume growth through the construction of at least three new forecourts and the upgrading of both Burgersdorp and Somerset East forecourts.
The Retail Division performed well, reporting operating profit growth of 6% from a high base set in the previous financial year. Various projects were initiated over the past few years, including the upgrading of several BKB retail shops, product diversification, waste reduction and optimisation of working capital levels. The division increased its fuel offering which led to increased volumes, while new supplier agreements contributed to improved margins.
The division launched the BKB online shop during the year. While the goal was to provide an immediate online solution for customers, the division will continue to improve on the platform which now also attracts non-traditional BKB customers.
The worst drought in decades continues to hit parts of the Eastern Cape, negatively affecting a number of BKB customers who are mainly small stock farmers. BKB was privileged to assist these farmers in collaboration with Moov
and EC Fuels, who both sponsored fuel towards the drilling of essential boreholes in the Steytlerville district, thereby aiding drought relief to these communities.
The division is excited to continue its support for the rural economy. A new distribution centre (“DC”) is being opened in Middelburg (Eastern Cape). This DC will significantly improve the region’s supply of consumer goods, as well as the availability of complete product ranges pertinent to the rural and farming community across the area serviced by the DC.
There are also plans to continue improving service levels and the shopping experience for our loyal customer base.
LIVESTOCK AND PROPERTIESThe division continued trading under the brands of BKB, BKBLouwid, BKB Van Wyk, BKB Riverview, BKB Wildlife and Home & Hectare Real Estate. The division focuses on marketing activities relating to livestock, agricultural equipment and properties (residential, farm and commercial properties) by means of auctions and through liaison transactions.
The division continued with its strategic focus to use new developments in information and communication technology (“ICT”) to drive innovation and remain competitive. Quality service remains a key value as the division continues to increase the use of digital technologies and social media.
After an extended ban on auctions due to the outbreak of foot-and-mouth disease in the prior year, the Livestock Division was again confronted with difficult trading conditions as a result of stringent COVID-19 restrictions. Despite these ongoing challenges, the division demonstrated a high level of resilience, with a significant 142% improvement in operating profit.
New business processes were adopted to ensure sustainability, which include an industry-wide set of biosecurity protocols at all auctions points. The division increased its market share (number of animals traded) by 16% and also successfully increased the number of auctions. The increased profitability also resulted from higher demand and prices for good quality animal and meat products, especially for export markets. The number of digital auctions also increased significantly, with the weekly digital Monday store lamb auction making a significant contribution.
The Property Division under the Home & Hectare brand experienced favourable trading conditions, especially in the residential market. This was mainly driven by the lower prime lending rate and limited stock of residential properties in the middle to lower markets.
It is expected that the current favourable trading conditions will continue over the medium term, largely driven by increased demand and shortages, especially with regard to sheep. Currently, the division is exploring opportunities to further unlock the application of RFID technologies for the benefit of both BKB and its customers (buyers and sellers).
DIGITAL ACCELERATION (SHIFT DX)Shift DX is a business set up to assist the BKB Group to transform its business models and create new opportunities by using value chain transformative technologies such as the Internet of things (IoT), blockchain-enabled traceability, mobile service delivery and precision agriculture. Globally, these new technologies play a significant role in disrupting food supply chains and help shape the transformation of the agricultural landscape.
Shift DX has three strategic business focus areas, namely Blockchain Services, Managed Services and Digital Marketplace. The division has set up a platform that uses blockchain technology to connect people, assets, and organisations to create traceability and transparency in the supply chain. BKB has been operating for over 100 years as the trusted home of agriculture. By investing in blockchain technology, it is digitalising the trusted relationship it plays in the supply chain, which allows it to create new transformative business models.
Shift DX has signed an exclusive technology supplier agreement with an international digital auctioneering business. The new agreement will leverage the business to provide a digital marketplace where the buyer and seller will meet and share trusted data underpinned by blockchain technology in a connected social media ecosystem network. In addition, the Shift DX Marketplace will tie it together and create an execution layer where information sharing turns into value.
Shift DX was established in 2019 and had its first commercial transaction in February 2020. The foot-and-mouth disease outbreak in the wool and livestock industries and the COVID-19 pandemic positively affected the adoption of Shift DX’s services. The sudden lockdown and restrictions on public gatherings put a focus on digital auction solutions. Shift DX successfully implemented a digital sales platform for BKB and Agra in Namibia, which led to more than 200 digital auctions during the year and supported 3,500 registered buyers.
PAKHOUSE BRANDSPakHouse Brands is the holding company of the agri-processing subsidiaries in the BKB Group and has interests in various supply chains from producer to consumer.
The main activities of PakHouse Brands are related to grain, lucerne, raisins and sugar. These activities include procurement, storage, processing and marketing functions. The grain marketing function was discontinued during the year, while essential functions were outsourced to reliable service providers. The division owns world-class processing and storage facilities, all of which are operated in accordance with various accredited standards and best practices. Production and storage facilities are strategically located throughout South Africa and eSwatini. The Group’s scale and footprint ensures the sourcing of quality raw materials and products, while also providing producers access to a wide range of markets.
PakHouse Brands focuses on areas that will help BKB to achieve its strategic vision of sustainable profitable growth. The division is focused on profitable growth in the agri-processing value chain through high performing teams and efficient operations with our customers, consumers and the environment in mind.
Financial performance improved significantly with operating profit growing by 40% year on year. PakHouse Division’s goods and services were classified as essential during the COVID-19 lockdown period and its businesses could mostly continue trading as normal. Various investments in infrastructure, development and training of people, product quality, improved service levels, brand development and marketing, contributed to the improved performance of the Group.
The Lucerne (AlphaAlfa) business reported an operating profit growth of 42%. This was supported by operational improvements at the Kimberley press which resulted in a 30% increase in the production of double-pressed bales.
Desert Raisins was brought under new management during the year and reported an operating profit. Improved inventory management reduced the stockholding by 50%, Flooding during harvest in the raisin production areas had a negative impact on product availability for the 2022 financial year. This will result in lower than expected sales volumes from our Desert Raisins business for the next financial year.
BKB Gritco experienced a difficult year and reported an operating loss. Late season rain resulted in high volumes of grade three maize being available, resulting in lower demand for hominy chop in the animal feed market. High commodity prices together with the pandemic restrictions had a further negative effect on grit market sales.
Increased storage capacity and improved efficiencies at the grain storage and handling business assisted in handling a record volume of 532 000 MT of grain which resulted in an operating profit growth of 61%.
Atlanta Sugar reported operating profit growth of 20%. The division managed to increase its customer base and product offering with the introduction of 10 new stock keeping units (SKU’s). The business capitalised on the increase of “home” consumption due to lockdown regulations. This, together with increased demand from African countries due to difficulties with import logistics from Brazil and India, further strengthened sales. The effective implementation of sugar import duties by the SA authorities also gave the sugar industry much needed stability.
The PakHouse Group is looking forward to further improvements in efficiencies and the management of the grain and fruit divisions in order to increase the return on recent investments made.
OPERATIONS REVIEW continued

B K B | A N N U A L R E P O R T 2 0 2 1
S E R V I C E E X C E L L E N C E | E N T R E P R E N E U R S H I P | E A R N I N G S | E M P L O Y E E S | E N V I R O N M E N T
#IntegrityIntegrated 2827 P E O P L E | P L A N E T | P R O F I T
#SustainabilitySynergised27
BKB is committed to the highest standards of governance, ethics and integrity. The Group’s sustainability, success and growth is underpinned by its values and commitment to good governance and accountability. BKB’s governance framework is guided by the principles outlined in King IV. The principles outlined in King IV have been adopted as far as is practically possible.
GOVERNANCE AND COMPLIANCE
BOARD OF DIRECTORSThe Board of Directors consisted of 12 members at year end. Nine served in a non-executive capacity and three served in executive capacities. The Board meets quarterly and is responsible for strategic and policy decisions.
The Chairman is a non-executive director and all non-executive directors are appointed for a specific period. The Board shall comprise of no fewer than six and no more than 15 directors as follows:
- a maximum of eight directors elected by the holders of the ordinary shares
- a maximum of four executive directors appointed by the abovementioned elected directors
- a maximum of three non-executive directors appointed by the elected non-executive directors based on their expertise and experience
The role and function of the Board includes:
- Providing strategic direction
- Setting the tone and leading the Group in an ethical, effective and responsible manner
- Exercising effective control over the Company and Group
- Ensuring the sustainability and financial position of the business
- Putting appropriate risk management, internal controls and regulatory compliance procedures in place
GOVERNANCE REPORT
- Designating and assigning responsibility to sub-committees and providing terms of reference
- Defining levels of authority for management
- Providing governance and oversight over subsidiary companies’ activities
AUDIT AND RISK COMMITTEEThe Audit and Risk Committee consists of four non-executive directors. The external auditors and the internal auditors have unlimited access to the Audit and Risk Committee, which ensures that their independence is not compromised in any way. The external auditors attend the meetings and are granted the opportunity to discuss any relevant matter. Internal audit matters are considered during each quarterly Audit and Risk Committee meeting. Members of executive, senior management and internal audit attend the meetings by invitation.
The committee’s roles and responsibilities are set out in its Charter, which is reviewed on an annual basis.
HUMAN RESOURCES AND REMUNERATION COMMITTEEThe Human Resources and Remuneration Committee consists of one executive and three non-executive directors and the General Manager of Human Resources.
This committee determines the remuneration of all personnel. Matters relating to the remuneration of non-executive directors are submitted to shareholders for approval at the Annual General Meeting. The committee also ensures that the appropriate Human Resources policies and procedures are in place and aligned to the values of BKB, the required talent is recruited and retained and proper development and reward structures are in place. This committee is responsible for ensuring that a proper employment equity plan is in place and actioned.
NOMINATIONS COMMITTEEThe Nominations Committee is made up of three non-executive directors and is chaired by the Chairman of Board. The committee ensures that the recommended Board appointments are made considering the need for appropriate skills, competency and experience. This committee will also make recommendations regarding composition of Board Committees.
SOCIAL, ETHICS AND SUSTAINABILITY COMMITTEEThis committee consists of one executive and three non-executive directors and the General Manager of Human Resources. The functions of the Social, Ethics and Sustainability Committee are:
- Providing leadership and guidance on social, ethical and sustainability issues to the Board
- Ensuring that effective and adequate policies and procedures are in place to manage social, ethical and sustainability risks
- Reviewing and monitoring Group-wide compliance with policy guidelines and appropriate local and international standards and laws relating to social, ethical and sustainability matters.
- Ensuring that management has allocated adequate resources to comply with social, ethical and sustainability policies, codes of best practice and regulatory requirements
- Consulting and communicating with internal and external stakeholders with respect to social, ethical and sustainability issues
This committee is also responsible for our Broad-Based Black Economic Empowerment (“BBEEE”) implementation.
GOVERNANCE

B K B | A N N U A L R E P O R T 2 0 2 1
P E O P L E | P L A N E T | P R O F I T
#SustainabilitySynergised 3029 30S E R V I C E E X C E L L E N C E | E N T R E P R E N E U R S H I P | E A R N I N G S | E M P L O Y E E S | E N V I R O N M E N T
#IntegrityIntegrated
INVESTMENT COMMITTEEThe Investment Committee comprised of three executive and three non-executive directors during the past year. This committee assists the Board in:
- Considering new acquisitions or investments
INTERNAL CONTROL SYSTEMSProper internal control systems and processes are in place. They provide reasonable assurance to the Board of Directors and Management on the preparation of reliable, published financial statements and the safeguarding of the Group’s assets. The proper operation of internal controls is monitored internally and the findings and recommendations are reported to Management and the Board of Directors. The Board of Directors exercises oversight over the financial reporting process through the Audit and Risk Committee.
EMPLOYEE PARTICIPATIONThe Group employs a range of participative structures for issues that significantly and directly affect employees. These have been designed to maintain sound relationships between employer and employees through the effective communication of relevant information, consultation and the identification and resolution of conflict. The Group employs a policy of equal opportunities for all and promotes staff on merit.
CODE OF ETHICSThrough its Code of Ethics, the Group is committed to the highest standards of integrity, conduct and ethics in its dealings with all of its stakeholders.Directors, executive management and all staff are expected to fulfil their ethical obligations in such a manner that fair, commercially competitive practices are employed in operating the business.
ATTENDANCE OF MEETINGS
AGM BOARD OF DIRECTORSAUDIT AND RISK
COMMITTEEHUMAN RESOURCES, REMUNERATION AND SOCIAL AND ETHICS COMMITTEE
Sch
edul
ed
Sch
edul
ed
Sch
edul
ed
Sch
edul
ed
Sch
edul
ed
Sch
edul
ed
Sch
edul
ed
Sch
edul
ed
Sch
edul
ed
Sch
edul
ed
Spe
cial
Sch
edul
ed
Spe
cial
Sch
edul
ed
Sch
edul
ed
Spe
cial
Sch
edul
ed
Meeting dates 25/1
1/20
20
27/0
8/20
20
25/1
1/20
20
26/1
1/20
20
23/0
2/20
21
27/0
5/20
21
26/0
8/20
20
25/1
1/20
20
22/0
2/20
21
26/0
5/20
21
09/0
7/20
20
26/0
8/20
20
23/0
9/20
20
24/1
1/20
20
22/0
2/20
21
14/0
4/20
21
26/0
5/20
21
G E J Kingwill N N G N
A S du Toit E E E E N N N N N N NC D Hobson N N N N
M H Jonas X X X X N N N N N N N N N N NE A Meyer N N N N N N NV Pillay N N N N N N
H C Staple N N N N N N NH J Swart N N N N G N NP G Carshagen N N N N N N N N N N NJ F J van Rensburg G G N N N N N N NJ E Stumpf E E E E
J A van Niekerk E E E E G N N N N N ND C Louw (retired) – – – – G N – – – – –
Present X Apology N Not on committee E Ex-officio G Invitee as director
GOVERNANCE REPORT continued - Informing and updating the Board on
new and existing opportunities - Ensuring alignment between the
investment and acquisition and the business strategy
- Considering the alignment of funding options to investments and acquisitions
The committee met several times during the year.

B K B | A N N U A L R E P O R T 2 0 2 1
P E O P L E | P L A N E T | P R O F I T
#SustainabilitySynergisedS E R V I C E E X C E L L E N C E | E N T R E P R E N E U R S H I P | E A R N I N G S | E M P L O Y E E S | E N V I R O N M E N T
#IntegrityIntegrated 3231
CHAIRMAN
GEOFF KINGWILLAge: 59 B Mech Eng Industry experience:BKB Vice-chairman, Cape Wools SA Chairman, International Wool Textile Organization: Chairman Of Working Group, Armaments Corporation of South Africa (Armscor) Project EngineerSkillset: Agriculture, management, governance
VICE-CHAIRMAN
COMPANY SECRETARY
Johannette Oosthuizen
CHAIRMAN
Geoff Kingwill VICE-CHAIRMAN
Hansie Swart
CEO BKB GROUP
JohanStumpf
CEO PAKHOUSE BRANDS
André du Toit
DIRECTOR
Charles Staple
DIRECTOR
Paul Carshagen
DIRECTOR
Koos Janse van Rensburg
DIRECTOR
Chris Hobson
DIRECTOR
Mcebisi Jonas
DIRECTOR
Adrian Meyer
DIRECTOR
Ivan Pillay
FINANCIAL DIRECTOR BKB GROUP
Jannie van Niekerk
NEW
D I G I T A L A C C E L E R A T I O N
B O A R D O F D I R E C T O R SB O A R D O F D I R E C T O R S
HANSIE SWARTAge: 51 M Com Agri Economics
Industry experience:Commercial farmer (30 years) Skillset: Agricultural operations, management, strategic partnerships
EXECUTIVE DIRECTORS
JOHAN STUMPFCEOAge: 53 B Eng (Industrial), B Eng Honours (Industrial), MBA Industry experience:Mpact Ltd Executive, Klein Karoo Group Managing Director, Sundays River Citrus Company Managing DirectorSkillset: Agriculture, manufacturing, management
ANDRÉ DU TOITManaging Director: PakHouse BrandsAge: 49 B Agric Administration, B Agric Honours, MBA
Industry experience:PakHouse Brands Managing Director, BKB General Manager: Trade, BKB General Manager: Livestock and Property, Kromco (Pty) Ltd Divisional Managing Director
Skillset: Agriculture, manufacturing, international trade, management
JANNIE VAN NIEKERKCFOAge: 42 B Comm Acc Honours, CA(SA)
Industry experience:Crown Food Group Financial Director, Rhodes Food Group Financial ManagerSkillset: Finance, administration, management, fast-moving consumer goods, manufacturing
NON-EXECUTIVE DIRECTORS
PAUL CARSHAGENAge: 66 B Compt Acc
Industry experience:VKB Group Chairman, Commercial farmerSkillset: Finance, agriculture
CHRIS HOBSONAge: 49 Nat Dip HR ManagementIndustry experience:D&A Timbers (Pty) Ltd Owner and Managing Director, Iliad Africa (Pty) Ltd Managing Executive KZN, Trustee Mohair Trust, Councillor Kingswood College Council.Skillset: Financial management, procurement, business development, people and stakeholder management, operations management, risk and compliance management, mergers and acquisitions
KOOS JANSE VAN RENSBURGAge: 60 B Compt Hon, MBLIndustry experience:VKB Group Managing Director, Kaap Agri Operations Director, Boland Agri Ltd Managing Director, Coopers & Lybrand Audit PartnerSkillset: Finance, agriculture, management
CHARLES STAPLEAge: 69 B Com ; CTA; NHEd ; CA(SA)Industry experience:PwC – retired partner; Rhodes University Council Member & Chair of Audit Committee; Trustee of Ezethu Development TrustSkillset: Governance, Risk Management, Finance
MCEBISI JONASAge: 60 BA History and Sociology, Higher Dip EducationIndustry experience:Government of the Republic of South Africa Deputy Finance Minister and Member of the National Assembly, MTN Group Ltd Independent Non-Executive Director, Public Investment Corporation Chairman and Non-Executive DirectorSkillset: Finance, governance
ADRIAN MEYERAge: 59 B.Comm Honours, CA(SA)
Industry experience:Cidel Bank & Trust Co-Founder and Director, National Trust Co Inc. (Canada) VP and Controller, Trans Canada Credit Loan Subsidiary of Norwest (now Wells Fargo) (Canada) CFO, Private Equity Investor, Farmer
Skillset: Banking, private companies, trusts, agriculture
IVAN PILLAYAge: 68 Management DiplomaIndustry experience:Small Business Institute of South Africa Director, South African Revenue Services Deputy Commissioner, Public Affairs Research Institute Director, The Whistleblower House Director.Skillset: Management, Public Administration, Investigations
COMPANY SECRETARY
JOHANNETTE OOSTHUIZENAge: 56 B Com (Law); CIS Intermediate Diploma – The Southern African Institute Of Chartered Secretaries and Administrators; Associate Diploma – The Institute Of Bankers in South Africa Industry experience:Legal and Economic Analyst/Delta Motor Corporation; Senior Trust Officer/Standard Trust; Pension Fund administrator/NMBM
Skillset: Local government; Banking; Motor industry and Agriculture
BOARD OF
DIRECTORS

B K B | A N N U A L R E P O R T 2 0 2 1
P E O P L E | P L A N E T | P R O F I T
#SustainabilitySynergisedS E R V I C E E X C E L L E N C E | E N T R E P R E N E U R S H I P | E A R N I N G S | E M P L O Y E E S | E N V I R O N M E N T
#IntegrityIntegrated 3433
The BKB Group could be affected by a number of risks that might, individually or collectively, have an impact on the achievement of its business objectives.The following table is an overview of key risks the BKB Group faces. The risks noted are not exhaustive and are in no particular order. The BKB Group continuously seeks to identify, analyse, evaluate, treat and monitor all risks, to maximise opportunities and prevent or reduce losses.
KEY RISK BKB’S RESPONSE
Political risk and weakening local infrastructure
BKB operates in an environment fraught with political uncertainty, which influences both the economy and society at large. The Group may be affected by actions/lack of action/changes by national and provincial government as well as local authorities. Inability to provide basic services at all levels is a major risk and concern. Lack of service delivery including the provision of general safety, electricity, water, efficient ports, good roads and connectivity are real risks. The deterioration of infrastructure in rural South Africa is of particular concern.
The Group is actively engaged with the agricultural industry and stakeholders, where these matters are taken up with all levels of government.
The Group continues to increase its own electricity generation through solar energy and on-site generators. As regards water supply self-sufficiency, rain water harvesting is applied wherever feasible. Exposure to this risk is being managed through seeking potential opportunities in new jurisdictions.
Pandemic
As is the case for many businesses, pandemic conditions have the potential to severely impact the Group’s ability to conduct its business. The safety of its people, clients and customers, the general community and also business continuity are placed at risk during such events.
The Group continues to monitor the pandemic’s impact on its people, operations and financial position. The impact on the Group’s results and operations was limited to only certain areas of the business. Strict adherence to COVID-19 pandemic protocols remain in force to protect employees and other stakeholders, and to ensure business continuity.
Animal welfare and diseases
The safety and welfare of livestock is of paramount importance to the BKB Group. Failure to protect the welfare of livestock under our control might result in business disruption and reputational damage. The impact of ongoing diseases like foot-and-mouth further limits movement of livestock which directly impacts business operations.
The Group’s people are trained in safe livestock handling protocols and methods and strive to exceed all government requirements. Through the Group’s development in blockchain technology, animals and wool can be traced to producer farms, indicating infected areas. The BKB Group also has a national footprint which further mitigates risk. In addition, the Group is actively engaged with the industry and other stakeholders to improve animal welfare practices.
KEY RISK BKB’S RESPONSE
Cyber threats
Like most businesses, BKB’s operations rely on information technology solutions which exposes the Group to the threat of cyber disruption and loss of data. As a result of the Covid pandemic more employees are working from home and this further increases risk.
The BKB Group maintains a strong focus on its information technology capabilities and it continues to investigate and implement stronger security measures on a continuous improvement basis. These measures and initiatives include, inter-alia, use of third-party back-up facilities, restricted access to systems, data and infrastructure, more intelligent password control, security software and user awareness campaigns.
Credit risk
Providing finance is an essential part of the BKB Group’s service offering. The default of one or more significant debtors could have a material impact on the Group. Defaulting reasons include drought, crop failure and lack of access to finance. The possible impact of changing land reform legislation on debtors book security is also a consideration.
BKB has a very strong credit policy and related risk evaluation process in place. Its implementation is backed by a strong, expert team. There is centralised vetting which ensures that BKB knows its clients/potential clients well. There is regular Credit Committee review and oversight. Appropriate securities are obtained. Credit default insurance is in place for selected debtors.
Commodity pricing/exchange rates
The BKB Group has exposure to commodity price fluctuations where movements in commodity prices and exchange rates could affect margins in the future.
Exposures are managed through the diversification of income streams by product and geography, controlled inventory levels as well as seeking opportunities to increase export sales. Foreign exchange exposures are carefully managed and monitored.
Climate change/climatic conditions
BKB has traditionally operated in the drier parts of South Africa. Drought conditions in some of these areas have worsened over the last number of years and have already led to a reduction in livestock numbers in South Africa and, consequently, lower volumes of business for some of BKB’s divisions.
Diversification through seeking opportunities in sectors that are less dependent on natural rain.
Continuing to maintain a geographical spread of operations and a diversified range of products and services.
MATERIAL
BUSINESS RISKS

B K B | A N N U A L R E P O R T 2 0 2 1
P E O P L E | P L A N E T | P R O F I T
#SustainabilitySynergisedS E R V I C E E X C E L L E N C E | E N T R E P R E N E U R S H I P | E A R N I N G S | E M P L O Y E E S | E N V I R O N M E N T
#IntegrityIntegrated 3635
BKB GROUP: ENVIRONMENTAL, SOCIAL AND GOVERNANCE (ESG) IMPACTS
Social responsibility, ethics and sustainability are integral to the BKB Group’s approach to creating long-term value and are material considerations in how the Group operates in the social, ecological and economic environments. Sustainability is built on the assumption that developing appropriate strategies benefits the Group’s people, the environment and planet and fosters Company longevity. As stakeholders’ expectations on corporate responsibility and ESG matters rise, the BKB Group recognises the need to act proactively on sustainability-related matters.
The BKB Group’s sustainability journey is one that embraces the triple bottom-line concept of People, Planet and Profit.
OUR PEOPLEThe Group’s focus on employee engagement as a vital part of the employee value proposition is evaluated every alternate year by way of an independent survey. The results reflect that 88% of our employees attest to a high level of job satisfaction, 84% describe themselves as being motivated, while 87% have a high/very high intention to stay with the Group. Voluntary labour turnover is 6.3% per annum. This positive environment enables the Group to attract and retain a high quality workforce,
3 441EMPLOYEES
48 EMPLOYEES WITH DISABILITIES
25.7%FEMALE EMPLOYEES
74.3%MALE EMPLOYEES
727 RECIPIENTS OF TRAINING
141 LEARNERS IN 8 LEARNERSHIP
INITIATIVES
88%OF OUR EMPLOYEES ATTEST TO HIGH LEVEL OF
JOB SATISFACTION
84%OF OUR EMPLOYEES DESCRIBE THEMSELVES AS BEING
MOTIVATED
R1,3M INTO BKB EDUCATIONAL BURSARY TRUST
SUPPORTING 147 CHILDREN WITH SCHOOL AND TUITION FEES
15 EMPLOYEES FURTHER TERTIARY STUDY AND
4 COMPLETE MATRIC
6.3% VOLUNTARY LABOUR TURNOVER
78.4% OF WORKFORCE PROFILE ARE FROM DESIGNATED GROUPS
BBBEE-LEVEL 6
A SNAPSHOT OF OUR EMPLOYEES
reduces employee turnover and improves customer satisfaction and efficiencies in our business.
The Group is constantly striving to enhance the level of interaction and relationships with all its employees.
OUR CONTINUED RESPONSE TO COVID-19The continued impact of the COVID-19 pandemic and related restrictions on the Group’s businesses and employees has been severe. Ongoing lockdowns in South Africa with restrictions being subsequently eased in varying degrees, have forced employees to adapt to the challenges caused by the persistent presence of the pandemic. The BKB Group suffered 149 positive COVID-19 cases, with 10 hospitalisations and four fatalities during the past financial year.
BKB is exceptionally proud of all its employees who have risen to the challenges created by the COVID-19 pandemic. Health and safety, compliance and HR teams rigorously implemented safety protocols, reporting processes, case management and contact tracing platforms, in compliance with sometimes ambiguous regulations and in record time. The safety of customers and employees remains a priority for us.
SKILLS DEVELOPMENTBKB’s people are its greatest asset and competitive advantage. Learning is an essential part of their personal development. The Group recognises that the personal growth of its employees benefits BKB’s business enormously.
Training initiatives provided to 727 employees included leadership, mentoring and emotional intelligence training, marketing, client relationships, compliance training and various agriculture industry specific courses. Of the eight learnerships accommodating 141 learners that are successfully hosted in the BKB Group, the Group is especially proud of the Wholesale and Retail Distribution Learnership for 14 hearing-impaired employees on the wool floor who have successfully completed the qualification. There are currently 39 hearing-impaired sorters and pressers employed on the BKB wool floor, which demonstrates commitment to the national drive to uplift people with disabilities. The staff bursary programme allowed 15 employees to further their tertiary studies and four employees completed their adult (Grade 12) senior certificate.

B K B | A N N U A L R E P O R T 2 0 2 1
P E O P L E | P L A N E T | P R O F I T
#SustainabilitySynergisedS E R V I C E E X C E L L E N C E | E N T R E P R E N E U R S H I P | E A R N I N G S | E M P L O Y E E S | E N V I R O N M E N T
#IntegrityIntegrated 3837
SOCIO-ECONOMIC DEVELOPMENTOur passion for growing people extends beyond the development of our own employees. BKB has proudly established a BKB Educational Trust with the purpose of financially assisting school children and students. This year we spent R1,3 million to support 147 children with their school and tuition fees.
THE BKB GROUP ENVIRONMENTAL SUSTAINABILITY JOURNEYDedicated staff, representing all businesses and support divisions in the Group, actively participate in several sustainability initiatives:
• Internal and external BKB Group sustainability communication campaigns provide relevant content over all electronic and digital platforms via BKB’s “Down to Earth” information on sustainability.
• BKB Group’s sponsorship and participation in webinars and information days on regenerative farming with the Media 24 Group.
• Articles on clients’ success stories with regards to regenerative farming and conservation with several media houses.
• A conservation initiative through collaboration with the Mountain Zebra – Camdeboo National Parks Buffer Zone project with a financial contribution towards the management thereof.
• Programmes that focus on sustainable business practices regarding people care, animal care, carbon reduction, solar energy generation, and water saving across several business divisions of the BKB Group.
SUSTAINABLE BUSINESS PRACTICESThe BKB Group is constantly looking for new ways to support the implementation of systems that meet global sourcing requirements for the future. It is an immense responsibility to be the biggest South African broker, with a client base of approximately 78 000 producers. Innovation and sustainability needs are therefore at the forefront of decisions and actions. The focus is to enable more efficient and customer-based solutions through exploring and utilising synergistic opportunities in the value chain.
As stated in our Natural Fibre’s Business Report, BKB introduced the global Responsible Wool Standard (“RWS”) to South African wool growers in 2016, followed by the Responsible Mohair Standard (“RMS”) for mohair growers in 2020. These global standards provide an opportunity for growers to demonstrate and reliably prove their best on-farm practices to their end market, ensuring a strong chain of custody for certified materials as they move through the supply chain. These standards require all sites to be certified, from the farmer through to the final business-to-business transaction. Post-farm, the subsequent stages of the supply chain are certified to the Textile Exchange Content Claim Standard, ensuring complete transparency and traceability from farm to shelf.
BKB, together with its subsidiary broker, House of Fibre, is proud to be the single largest supplier of RWS wool and RMS mohair in the world, with over 1 100 producers Group-wide, farming with approximately three million sheep and 440 000 Angora goats on an area of over seven million hectares of land. In complying with these standards, South African producers are well-positioned to continue supplying responsible quality wool and mohair to meet the growing market demand.
The pandemic has expedited the use of online training platforms. The Retail Trading Division invested in tablets for every trading branch to enable employees to participate in training programmes on a virtual basis. Half of the learnerships are being conducted virtually and 80 out of our 141 learners attended online classes.
The BKB Leadership Academy supports the Group’s goal to be the market leaders in the development and leadership of employees. The Group believes that an investment in leadership development is essential to the Group’s future. This year, 56 managers attended the one-year leadership programme.
The Group’s Graduate and Work shadow programme accommodates 17 interns and two experiential learners from designated groups. Over the past year some of these interns have been placed in permanent positions.
REMUNERATION AND REWARDBKB’s remuneration strategy ensures that the organisation is seen as the employer of choice in the industry. It seeks to create the appropriate environment that attracts and retains high performing, talented employees and motivates them to perform at their optimum levels in alignment with the Group’s organisational goals. BKB puts its people first.
Our remuneration structure, as underpinned by our remuneration policy and supplemented by benchmarking surveys, remains instrumental in ensuring reward parity, both internally and externally. BKB remunerates employees in line with the dynamics of the market and the context in which we operate. It aligns with the strategic direction of BKB. As such, remuneration plays a critical role in attracting and retaining high performing individuals.
BKB has designed a short term incentive scheme which is aimed at sharing the success of the organisation proportionately with employees. The aim of the scheme is to establish competitive earning opportunities, attract and retain high calibre staff and reinforce organisational performance. It seeks to encourage exceptional performance of employees.
The short-term incentives (“STIs”) are based on the unique circumstances of the level of an employee and the particular division. All schemes have defined criteria for participation and payment. Personal, non-financial targets are also set.
BKB operates a Long-Term Incentive Share Participation Scheme that is a discretionary award applied to qualifying senior key employees, as recommended by the HR Committee and approved by the Board. The scheme is designed to recognise service and performance and entitle eligible employees to participate in the potential growth of BKB.
HUMAN RESOURCES POLICIESThe Group provides a variety of benefits to its employees. These range from general benefits, such as medical aid and retirement fund schemes, with generous death and disability benefits, to overall employee care.
The BKB Wellness programme includes free trauma counselling and an HIV/Aids Insurance Protector Plan providing psychological and medical support and free anti-retroviral treatment to all employees.
Merit and recognition awards include Long Service Awards and annual Value Awards. Our annual Chairman’s Award for Excellence, a most prestigious honour, is awarded to an individual who made a difference and contributed towards BKB’s purpose through their talent, skill and ingenuity.
Attracting and retaining the right talent is at the heart of the Group’s business’ success. The Group subscribes to an online recruitment talent community portal, SimplifyHR. The Group is furthermore making use of the Vieple video interviewing tool, an asynchronous interviewing platform that provides a simple and efficient way to conduct remote and first-line interviews, This easy to use business application contributed to reducing the cost associated with face-to- face interviews, decreasing lead times to 37 days and improving quality of hire.
The Group is exceptionally proud of the launch of its new HR Induction App in March 2021. Digital onboarding and induction ensures that new employees get a consistent, easy to consume introduction to BKB, no matter where and when they join. A fully tracked, module based, mixed media platform helps familiarise employees through videos, short quizzes and info-based content. This tool will undoubtedly assist with the induction of new employees, especially in these difficult times.
EMPLOYMENT EQUITY AND TRANSFORMATION BKB is committed to transformation and has an Employment Equity Committee, chaired by the General Manager: Human Resources, which provides a forum for representatives of labour, management and other designated groups to review the progress and discuss the direction of BKB’s employment equity plans and policies. In addition, the Board has a Social & Ethics Committee and Human Resources Committee to ensure compliance and governance and conscious leadership. Of the Group’s total workforce profile, 78.4% is representative of Previously Disadvantaged Individuals (“PDI”). There is 16.7% PDI representation at Board level, 10.3% PDI representation on middle management and 28.5% PDI representation on junior management.
BKB GROUP: ENVIRONMENTAL, SOCIAL AND GOVERNANCE (ESG) IMPACTS continued

B K B | A N N U A L R E P O R T 2 0 2 1
P E O P L E | P L A N E T | P R O F I T
#SustainabilitySynergisedS E R V I C E E X C E L L E N C E | E N T R E P R E N E U R S H I P | E A R N I N G S | E M P L O Y E E S | E N V I R O N M E N T
#IntegrityIntegrated 4039
The Audit and Risk Committee (“the committee”) is pleased to present its report in terms of section 94(7) of the Companies Act. This report sets out how the committee discharged its responsibilities for the financial year ended 30 June 2021.
The committee is accountable to the Board and to the shareholders of BKB Limited. The committee is the Audit Committee for all companies in the BKB Group.
MEMBERS OF THE AUDIT AND RISK COMMITTEEThe members of the committee are all independent non-executive directors of the Group who were appointed at the Annual General Meeting:
NAME QUALIFICATION
H C Staple (Chairman) BComm; CTA; CA (SA)E A Meyer BComm (Honours); CA (SA)H J Swart MComm (Agricultural Economics)J F Janse van Rensburg BCompt (Accounting); BCompt Hons; MBL
The committee is satisfied that the members have the required knowledge and experience as set out in the Companies Act. The committee is satisfied that it has fulfilled its governance and statutory responsibilities.
MEETINGS HELD BY THE AUDIT AND RISK COMMITTEEThe committee held four meetings during the past financial year and all the members of the committee attended all the meetings.
The external auditors, PricewaterhouseCoopers Inc (“PwC”), attended and reported to all meetings of the committee. The external auditor has unrestricted access to this committee.
Executive directors, relevant general and senior managers, and representatives of the compliance and risk management functions, attended meetings by invitation.
The chair has regular meetings with the external auditors and the Group’s Chief Executive Officer and Chief Financial Officer. Additional closed meetings with these parties are held by the committee.
EXTERNAL AUDITORThe committee satisfied itself that the external auditor, PwC, is independent of the Group, both as defined by the Companies Act and the standards stipulated by the auditing profession. Assurance was provided by the external auditor that internal governance processes within the firm support and demonstrate appropriate independence.
The committee, in consultation with executive management, agreed to the terms of the statutory audit engagement. The audit fee for the external audit has been considered and approved taking into consideration such factors as the timing of the audit, scope and extent of the work required.
The committee considered and approved all non-audit services provided by the external auditor. The committee ensured that the scope of non-audit services rendered by the external auditors did not impair auditor independence.
The committee is recommending PwC for reappointment as external auditors and Mrs S Williams as the designated audit partner for the 2022 financial year.
FUNCTIONS OF THE AUDIT AND RISK COMMITTEEThe detailed duties of the committee are set out in its Charter. In summary, the committee’s role is to provide independent oversight of the effectiveness of the Group’s control environment, its assurance functions, risk management processes and the integrity of the Annual Financial Statements.
The committee reviewed the accounting policies, significant accounting matters and the going concern assessment applicable to the Annual Financial Statements of the Group for the year ended 30 June 2021. The committee ensured that these financial statements were in compliance with the requirements of the International Financial Reporting Standards and the Companies Act.
The committee discussed the findings and results of the audit with the external auditors. The external auditor’s reports were reviewed and the committee is satisfied that appropriate actions were taken by management.
The committee considered the results of reviews performed by internal audit and ensured that processes are put in place by management to take the necessary corrective action where control weaknesses have been identified. The future structure, organisation and resourcing of the Group’s internal audit function remains a focus area and is under review by the committee.
The committee reviewed the Group’s risk and control environment assessments, including IT risks. This was done to ensure that risks are properly addressed. The Committee is satisfied with management’s responses to findings and the actions taken to address and mitigate material risks.
The committee considered the adequacy and appropriateness of the controls in place to prevent, detect and monitor the occurrence of non-compliance with applicable laws and regulations. The committee is able to report that there have been no significant or material incidents of non-compliance with applicable laws and regulations during the year under review.
FINANCIAL FUNCTION AND CHIEF FINANCIAL OFFICERThe committee is satisfied that the Chief Financial Officer, Mr J A van Niekerk, has appropriate expertise and experience. The committee is also satisfied with the expertise and adequacy of resources of the Group’s finance function.
RECOMMENDATION OF ANNUAL FINANCIAL STATEMENTSThe committee reviewed the Annual Financial Statements of the Group and the Company and is satisfied that they comply with International Financial Reporting Standards in all material respects and also with the Companies Act.
The committee recommended the Annual Financial Statements to the Board of Directors for approval on 14 September 2021.
On behalf of Audit and Risk Committee
Charles StapleChairman: Audit and Risk Committee
14 September 2021
Audit and Risk Committee report

B K B | A N N U A L R E P O R T 2 0 2 1
P E O P L E | P L A N E T | P R O F I T
#SustainabilitySynergisedS E R V I C E E X C E L L E N C E | E N T R E P R E N E U R S H I P | E A R N I N G S | E M P L O Y E E S | E N V I R O N M E N T
#IntegrityIntegrated 4241
The directors are required in terms of the Companies Act 71 of 2008 to maintain adequate accounting records. They are responsible for the content and integrity of the Annual Financial Statements and related financial information included in this report. It is their responsibility to ensure that the Annual Financial Statements fairly present the state of affairs of the Company and Group as at the end of the financial year and the results of its operations and cash flows for the period then ended, in conformity with International Financial Reporting Standards. The external auditor is engaged to express an independent opinion on the financial statements.
The Annual Financial Statements are prepared in accordance with International Financial Reporting Standards and are based on appropriate accounting policies consistently applied and supported by reasonable and prudent judgements and estimates.
The directors acknowledge that they are ultimately responsible for the system of internal financial control established by the Company and Group and place considerable importance on maintaining a strong control environment. To enable the directors to meet these responsibilities, the Board sets standards for internal control aimed at reducing the risk of error or loss in a cost effective manner. The standards include the proper delegation of responsibilities within a clearly defined framework, effective accounting procedures and adequate segregation of duties to ensure an acceptable level of risk. These controls are monitored throughout the Group. All employees are required to maintain the highest ethical standards in ensuring that the Group’s business is conducted in a manner that is above reproach.
Risk management in the Group focuses on identifying, assessing, managing and monitoring all known forms of risk across the Group. While operating risk cannot be fully eliminated, the Group endeavours to minimise it by ensuring that appropriate infrastructure, controls, systems and ethical behaviour are applied and managed within predetermined procedures and constraints.
The directors are of the opinion that, based on the information and explanations given by management, the system of internal control provides reasonable assurance that the financial records may be relied on for the preparation of the Annual Financial Statements. However, any system of internal financial control can provide only reasonable, and not absolute, assurance against material misstatement or loss.
The directors have reviewed the Company and Group’s cash flow forecast for the year to 30 June 2022. In light of this review and the current financial position, they are satisfied that the Company and Group have access to adequate banking facilities and cash resources to continue their operations for the foreseeable future.
Based on the prevailing financial position of the Company and of the Group, budgets for the coming year and available banking facilities and credit lines, the directors have no reason to believe that the Company and Group will not be a going concern. The Annual Financial Statements for both the Company and the Group have therefore been prepared on a going concern basis.
The external auditors were given unrestricted access to all financial records and related data, including minutes of all meetings of the Board of Directors and committees of the Board. The directors believe that all representations made to the independent auditors during their audit are valid and appropriate.
The external auditor is responsible for independently auditing and reporting on the Company and Group's financial statements. The financial statements have been examined by the Company and Group's external auditor and their unqualified report is presented on pages 46 to 47.
The Company and Group Annual Financial Statements on pages 49 to 110 were prepared under the supervision of Mr J A van Niekerk (CA (SA))
The Annual Financial Statements for the year ended 30 June 2021 were approved by the Board on 14 September 2021 and signed on their behalf by:
APPROVAL OF FINANCIAL STATEMENTS
Geoff Kingwill Johan StumpfChairman: BKB Board of Directors Managing director
In my opinion as Group Secretary, I hereby confirm, in terms of the Companies Act 71 of 2008, for the year ended 30 June 2021, that the Group has lodged with the Commissioner of Companies all such returns as are required of a public company in terms of this Act and that all such returns are true, correct and up to date.
Ms J OosthuizenGroup Secretary
14 September 2021
DIRECTORS’ RESPONSIBILITIES AND APPROVAL
GROUP SECRETARY’S DECLARATION
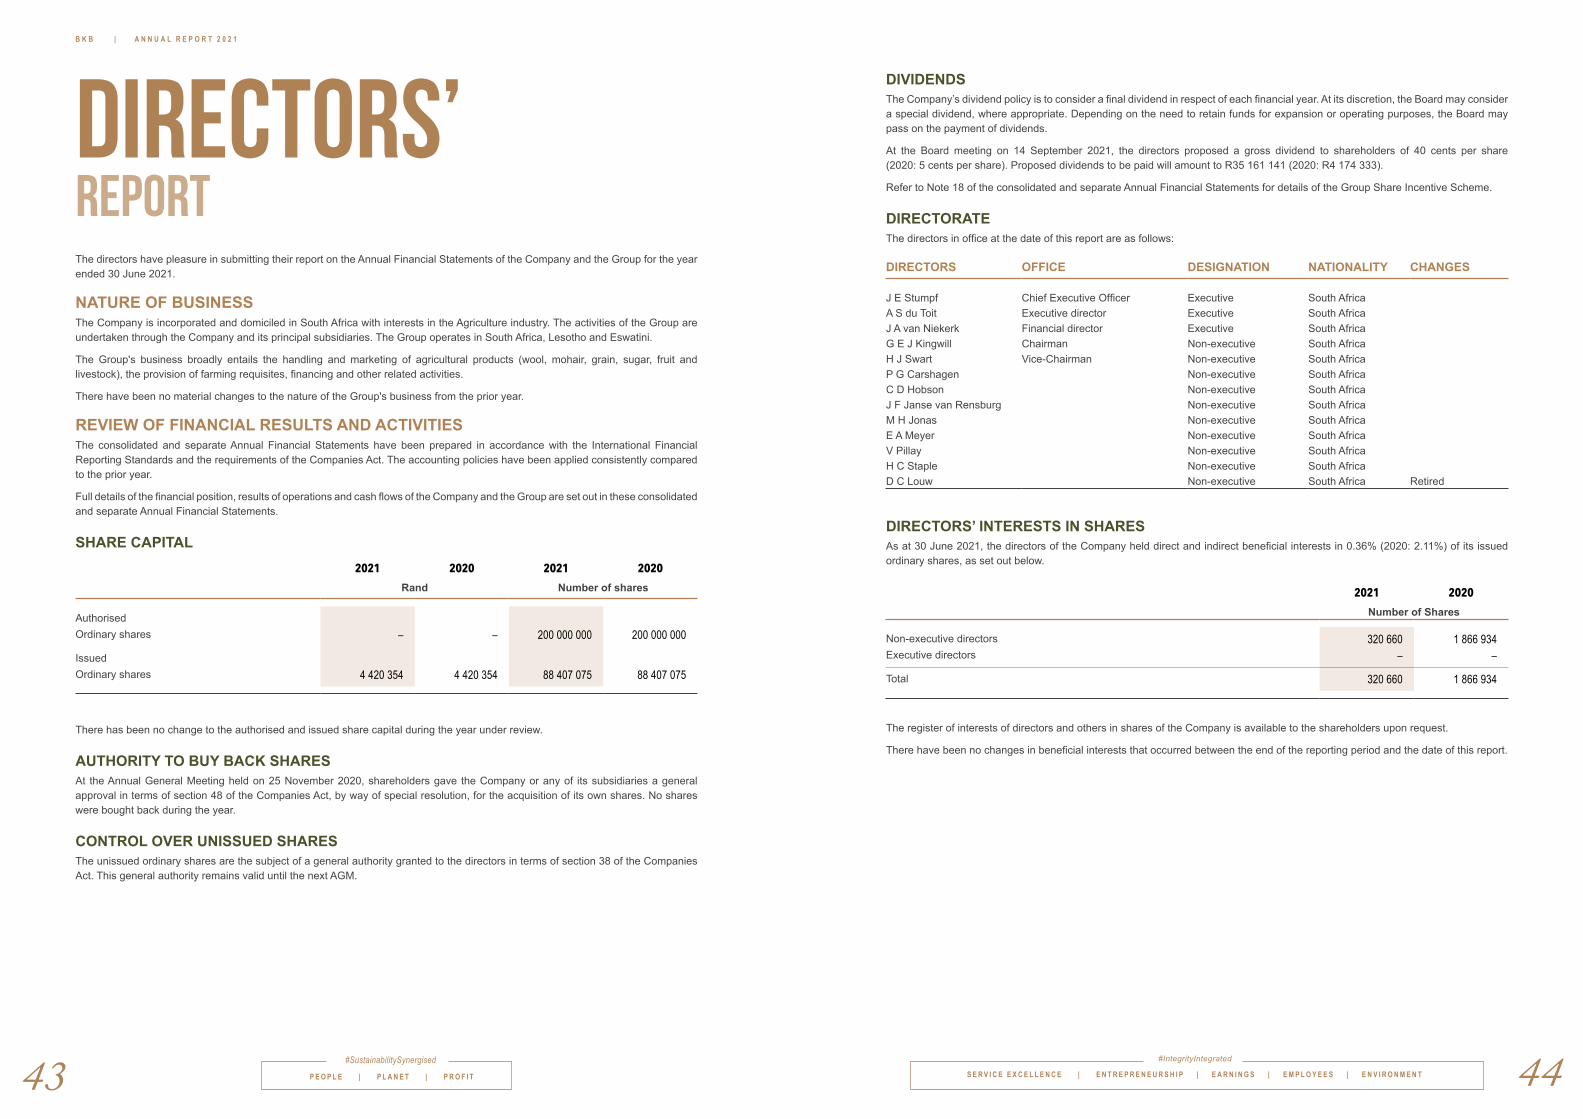
B K B | A N N U A L R E P O R T 2 0 2 1
P E O P L E | P L A N E T | P R O F I T
#SustainabilitySynergised 4443 S E R V I C E E X C E L L E N C E | E N T R E P R E N E U R S H I P | E A R N I N G S | E M P L O Y E E S | E N V I R O N M E N T
#IntegrityIntegrated
The directors have pleasure in submitting their report on the Annual Financial Statements of the Company and the Group for the year ended 30 June 2021.
NATURE OF BUSINESSThe Company is incorporated and domiciled in South Africa with interests in the Agriculture industry. The activities of the Group are undertaken through the Company and its principal subsidiaries. The Group operates in South Africa, Lesotho and Eswatini.
The Group's business broadly entails the handling and marketing of agricultural products (wool, mohair, grain, sugar, fruit and livestock), the provision of farming requisites, financing and other related activities.
There have been no material changes to the nature of the Group's business from the prior year.
REVIEW OF FINANCIAL RESULTS AND ACTIVITIESThe consolidated and separate Annual Financial Statements have been prepared in accordance with the International Financial Reporting Standards and the requirements of the Companies Act. The accounting policies have been applied consistently compared to the prior year.
Full details of the financial position, results of operations and cash flows of the Company and the Group are set out in these consolidated and separate Annual Financial Statements.
SHARE CAPITAL 2021 2020 2021 2020
Rand Number of shares
AuthorisedOrdinary shares – – 200 000 000 200 000 000
IssuedOrdinary shares 4 420 354 4 420 354 88 407 075 88 407 075
There has been no change to the authorised and issued share capital during the year under review.
AUTHORITY TO BUY BACK SHARESAt the Annual General Meeting held on 25 November 2020, shareholders gave the Company or any of its subsidiaries a general approval in terms of section 48 of the Companies Act, by way of special resolution, for the acquisition of its own shares. No shares were bought back during the year.
CONTROL OVER UNISSUED SHARESThe unissued ordinary shares are the subject of a general authority granted to the directors in terms of section 38 of the Companies Act. This general authority remains valid until the next AGM.
DIVIDENDSThe Company’s dividend policy is to consider a final dividend in respect of each financial year. At its discretion, the Board may consider a special dividend, where appropriate. Depending on the need to retain funds for expansion or operating purposes, the Board may pass on the payment of dividends.
At the Board meeting on 14 September 2021, the directors proposed a gross dividend to shareholders of 40 cents per share (2020: 5 cents per share). Proposed dividends to be paid will amount to R35 161 141 (2020: R4 174 333).
Refer to Note 18 of the consolidated and separate Annual Financial Statements for details of the Group Share Incentive Scheme.
DIRECTORATEThe directors in office at the date of this report are as follows:
DIRECTORS OFFICE DESIGNATION NATIONALITY CHANGES
J E Stumpf Chief Executive Officer Executive South AfricaA S du Toit Executive director Executive South AfricaJ A van Niekerk Financial director Executive South Africa G E J Kingwill Chairman Non-executive South AfricaH J Swart Vice-Chairman Non-executive South AfricaP G Carshagen Non-executive South AfricaC D Hobson Non-executive South AfricaJ F Janse van Rensburg Non-executive South AfricaM H Jonas Non-executive South AfricaE A Meyer Non-executive South AfricaV Pillay Non-executive South AfricaH C Staple Non-executive South AfricaD C Louw Non-executive South Africa Retired
DIRECTORS’ INTERESTS IN SHARESAs at 30 June 2021, the directors of the Company held direct and indirect beneficial interests in 0.36% (2020: 2.11%) of its issued ordinary shares, as set out below.
2021 2020
Number of Shares
Non-executive directors 320 660 1 866 934Executive directors – –
Total 320 660 1 866 934
The register of interests of directors and others in shares of the Company is available to the shareholders upon request.
There have been no changes in beneficial interests that occurred between the end of the reporting period and the date of this report.
DIRECTORS’ REPORT

B K B | A N N U A L R E P O R T 2 0 2 1
P E O P L E | P L A N E T | P R O F I T
#SustainabilitySynergisedS E R V I C E E X C E L L E N C E | E N T R E P R E N E U R S H I P | E A R N I N G S | E M P L O Y E E S | E N V I R O N M E N T
#IntegrityIntegrated 4645
DIRECTORS’ INTERESTS IN CONTRACTSDuring the financial year, contracts in which directors or officers of the Group had an interest and significantly affected the business of the Group were not entered into.
INTERESTS IN SUBSIDIARIES, ASSOCIATES AND JOINT ARRANGEMENTSDetails of material interests in subsidiary companies are presented in the company Annual Financial Statements in Note 7.
Apart from Atlanta Investments (Pty) Ltd, Atlanta Products (Pty) Ltd, Oceanic Swaziland (Pty) Ltd and Lihoai Consultancy (Pty) Ltd, all subsidiaries are incorporated in South Africa.
There were no significant acquisitions or divestitures during the year ended 30 June 2021.
EVENTS AFTER THE REPORTING PERIODThe directors are not aware of any material events occurring after the reporting date and up to the date of this report that would have a material impact on these Annual Financial Statements.
AUDITORSPwC continued in office as external auditors for the Company and its subsidiaries for 2021.
At the AGM, the shareholders will be requested to reappoint PwC as the independent external auditors of the Group and to confirm Mrs. S Williams as the designated lead audit partner for the 2022 financial year.
SECRETARYThe Company Secretary is Johanette Oosthuizen.
BUSINESS ADDRESS 61 Grahamstown RoadNorth EndGqeberha 6001
REGISTERED OFFICEThe Company’s registered office is at 61 Grahamstown Road, North End, Gqeberha.
DIRECTORS’ REPORT continued Independent auditor’s reportTO THE SHAREHOLDERS OF BKB LIMITED
OUR OPINIONIn our opinion, the consolidated and separate financial statements present fairly, in all material respects, the consolidated and separate financial position of BKB Limited (the Company) and its subsidiaries (together the Group) as at 30 June 2021, and its consolidated and separate financial performance and its consolidated and separate cash flows for the year then ended in accordance with International Financial Reporting Standards and the requirements of the Companies Act of South Africa.
WHAT WE HAVE AUDITEDBKB Limited’s consolidated and separate financial statements set out on pages 49 to 110 comprise:
• the consolidated and separate statements of financial position as at 30 June 2021;• the consolidated and separate statements of profit or loss and other comprehensive income for the year then ended;• the consolidated and separate statements of changes in equity for the year then ended;• the consolidated and separate statements of cash flows for the year then ended; and• the notes to the financial statements, which include a summary of significant accounting policies.
BASIS FOR OPINIONWe conducted our audit in accordance with International Standards on Auditing (ISAs). Our responsibilities under those standards are further described in the Auditor’s responsibilities for the audit of the consolidated and separate financial statements section of our report.
We believe that the audit evidence we have obtained is sufficient and appropriate to provide a basis for our opinion.
INDEPENDENCEWe are independent of the Group in accordance with the Independent Regulatory Board for Auditors’ Code of Professional Conduct for Registered Auditors (IRBA Code) and other independence requirements applicable to performing audits of financial statements in South Africa. We have fulfilled our other ethical responsibilities in accordance with the IRBA Code and in accordance with other ethical requirements applicable to performing audits in South Africa. The IRBA Code is consistent with the corresponding sections of the International Ethics Standards Board for Accountants’ International Code of Ethics for Professional Accountants (including International Independence Standards).
OTHER INFORMATIONThe directors are responsible for the other information. The other information comprises the information included in the document titled “Annual Report 2021”, which includes the Directors’ Report, the Audit and Risk Committee Report and the Group Secretary’s Declaration as required by the Companies Act of South Africa. The other information does not include the consolidated or the separate financial statements and our auditor’s report thereon.
Our opinion on the consolidated and separate financial statements does not cover the other information and we do not express an audit opinion or any form of assurance conclusion thereon.
In connection with our audit of the consolidated and separate financial statements, our responsibility is to read the other information identified above and, in doing so, consider whether the other information is materially inconsistent with the consolidated and separate financial statements or our knowledge obtained in the audit, or otherwise appears to be materially misstated.
If, based on the work we have performed, we conclude that there is a material misstatement of this other information, we are required to report that fact. We have nothing to report in this regard.

S E R V I C E E X C E L L E N C E | E N T R E P R E N E U R S H I P | E A R N I N G S | E M P L O Y E E S | E N V I R O N M E N T
#IntegrityIntegrated 48
B K B | A N N U A L R E P O R T 2 0 2 1
P E O P L E | P L A N E T | P R O F I T
#SustainabilitySynergised47
RESPONSIBILITIES OF THE DIRECTORS FOR THE CONSOLIDATED AND SEPARATE FINANCIAL STATEMENTSThe directors are responsible for the preparation and fair presentation of the consolidated and separate financial statements in accordance with International Financial Reporting Standards and the requirements of the Companies Act of South Africa, and for such internal control as the directors determine is necessary to enable the preparation of consolidated and separate financial statements that are free from material misstatement, whether due to fraud or error.
In preparing the consolidated and separate financial statements, the directors are responsible for assessing the Group and the Company’s ability to continue as a going concern, disclosing, as applicable, matters related to going concern and using the going concern basis of accounting unless the directors either intend to liquidate the Group and/or the Company or to cease operations, or have no realistic alternative but to do so.
AUDITOR’S RESPONSIBILITIES FOR THE AUDIT OF THE CONSOLIDATED AND SEPARATE FINANCIAL STATEMENTSOur objectives are to obtain reasonable assurance about whether the consolidated and separate financial statements as a whole are free from material misstatement, whether due to fraud or error, and to issue an auditor’s report that includes our opinion. Reasonable assurance is a high level of assurance, but is not a guarantee that an audit conducted in accordance with ISAs will always detect a material misstatement when it exists. Misstatements can arise from fraud or error and are considered material if, individually or in the aggregate, they could reasonably be expected to influence the economic decisions of users taken on the basis of these consolidated and separate financial statements.
As part of an audit in accordance with ISAs, we exercise professional judgement and maintain professional scepticism throughout the audit. We also:
• Identify and assess the risks of material misstatement of the consolidated and separate financial statements, whether due to fraud or error, design and perform audit procedures responsive to those risks, and obtain audit evidence that is sufficient and appropriate to provide a basis for our opinion. The risk of not detecting a material misstatement resulting from fraud is higher than for one resulting from error, as fraud may involve collusion, forgery, intentional omissions, misrepresentations, or the override of internal control.
• Obtain an understanding of internal control relevant to the audit in order to design audit procedures that are appropriate in the circumstances, but not for the purpose of expressing an opinion on the effectiveness of the Group’s and the Company’s internal control.
• Evaluate the appropriateness of accounting policies used and the reasonableness of accounting estimates and related disclosures made by the directors.
• Conclude on the appropriateness of the directors’ use of the going concern basis of accounting and, based on the audit evidence obtained, whether a material uncertainty exists related to events or conditions that may cast significant doubt on the Group’s and the Company’s ability to continue as a going concern. If we conclude that a material uncertainty exists, we are required to draw attention in our auditor’s report to the related disclosures in the consolidated and separate financial statements or, if such disclosures are inadequate, to modify our opinion. Our conclusions are based on the audit evidence obtained up to the date of our auditor’s report. However, future events or conditions may cause the Group and / or Company to cease to continue as a going concern.
• Evaluate the overall presentation, structure and content of the consolidated and separate financial statements, including the disclosures, and whether the consolidated and separate financial statements represent the underlying transactions and events in a manner that achieves fair presentation.
• Obtain sufficient appropriate audit evidence regarding the financial information of the entities or business activities within the Group to express an opinion on the consolidated financial statements. We are responsible for the direction, supervision and performance of the Group audit. We remain solely responsible for our audit opinion.
We communicate with the directors regarding, among other matters, the planned scope and timing of the audit and significant audit findings, including any significant deficiencies in internal control that we identify during our audit.
PricewaterhouseCoopers Inc. Director: AF Puggia Registered Auditor Gqeberha, South Africa15 September 2021
annual
financial statements
Statements of Financial Position 49
Statements of Profit or Loss and Other Comprehensive Income
50
Statements of Changes in Equity 51
Statements of Cash Flows 52
Notes to the Financial Statements 53 – 92
Accounting Policies 93 – 110
contents
The examination of controls over the maintenance and integrity of the Group’s website is beyond the scope of the audit of the financial statements. Accordingly, we accept no responsibility for any changes that may have occurred to the financial statements since they were initially presented on the website.

B K B | A N N U A L R E P O R T 2 0 2 1
S E R V I C E E X C E L L E N C E | E N T R E P R E N E U R S H I P | E A R N I N G S | E M P L O Y E E S | E N V I R O N M E N T
#IntegrityIntegrated
P E O P L E | P L A N E T | P R O F I T
#SustainabilitySynergised49 50
Annual Financial Statements for the year ended 30 June 2021
STATEMENTS OF FINANCIAL POSITION AS AT 30 JUNE 2021
2021 2020 2021 2020Notes R'000 R'000 R'000 R'000
ASSETSNon-current assetsProperty, plant and equipment 2 887 841 844 666 410 584 405 180 Right-of-use assets 3 66 123 56 140 36 182 32 551 Investment property 4 35 323 35 528 1 312 1 517 Intangible assets 5 85 172 91 592 20 272 26 065 Investments in subsidiaries 7 - - 312 311 311 250 Investment in associates 8 8 450 - - - Loans to group companies 9 - - 106 778 90 150 Trade and other receivables 10 22 322 24 578 11 977 13 823 Deferred tax assets 11 29 288 23 170 - -
1 134 519 1 075 674 899 416 880 536 Current assetsInventories 12 710 447 750 691 370 917 324 839 Loans to group companies 9 - - 291 941 316 941 Trade and other receivables 10 888 499 882 662 443 679 547 808 Derivatives 13 1 004 13 381 - - Other financial assets 14 20 700 317 - - Current income tax assets 682 2 770 - 1 751 Cash and cash equivalents 15 69 348 75 139 1 488 47 227
1 690 680 1 724 960 1 108 025 1 238 566 Assets classified as held for sale 16 10 957 - 10 957 - Total current assets 1 701 637 1 724 960 1 118 982 1 238 566
Total assets 2 836 156 2 800 634 2 018 398 2 119 102
EQUITYCapital and reservesShare capital 17 4 420 4 420 4 420 4 420 Share premium account 218 950 218 950 197 583 197 583 Treasury shares (120 713) (120 713) - - Non-distributable reserves 162 111 151 458 149 488 146 778 Distributable reserves 1 022 905 921 191 747 364 695 473 Capital and reserves attributable to owners of the parent 1 287 673 1 175 306 1 098 855 1 044 254 Non-controlling interest (206) - - - Total equity 1 287 467 1 175 306 1 098 855 1 044 254
LIABILITIESNon-current liabilitiesBorrowings 19 116 493 137 170 74 570 92 191 Lease liabilities 3 60 235 51 035 35 528 33 098 Post-retirement medical aid liabilities 20 6 302 6 802 6 302 6 802 Deferred tax liabilities 11 45 895 47 776 21 877 32 304 Provisions 21 8 295 8 086 8 295 8 086
237 220 250 869 146 572 172 481 Current liabilitiesTrade and other payables 22 588 212 603 267 266 883 270 608 Loans from group companies 23 - - 22 586 45 436 Borrowings 19 547 541 657 012 467 141 584 239 Financial liabilities at fair value 24 21 056 26 173 - - Derivatives 13 8 566 5 869 483 285 Lease liabilities 3 12 014 8 685 4 783 1 799 Current income tax liabilities 1 821 884 230 - Bank overdrafts 15 122 940 72 569 1 546 -
1 302 150 1 374 459 763 652 902 367 Liabilities directly associated with assets classified as held for sale 16 9 319 - 9 319 - Total current liabilities 1 311 469 1 374 459 772 971 902 367
Total liabilities 1 548 689 1 625 328 919 543 1 074 848
Total equity and liabilities 2 836 156 2 800 634 2 018 398 2 119 102
BKB LIMITED AND ITS SUBSIDIARIES(Registration number 1998/012435/06)
Group Company
Annual Financial Statements for the year ended 30 June 2021
STATEMENTS OF PROFIT OR LOSS AND OTHER COMPREHENSIVE INCOME
2021 2020 2021 2020Notes R'000 R'000 R'000 R'000
Value of business conducted 25 13 213 136 11 100 715 6 223 656 5 358 824
Revenue from contracts with customers 26 5 544 979 4 992 180 2 778 213 2 496 012 Cost of sales 27 (4 389 925) (4 020 683) (2 135 197) (1 945 544) Gross profit 1 155 054 971 497 643 016 550 468
Other operating income 28 49 946 42 817 17 559 17 020 Administrative and other expenses 29 (977 382) (898 091) (582 871) (516 157) Impairment of financial assets 29 (12 012) (11 873) (6 418) (4 755) Loss from equity accounted investments 29 (238) - - - Operating profit 215 368 104 350 71 286 46 576
Dividends from subsidiaries - - 18 437 20 021 Finance income 30 5 152 3 841 33 014 41 961 Finance costs 31 (71 669) (89 423) (55 157) (68 071) Profit before taxation 148 851 18 768 67 580 40 487 Income tax expense 32 (43 934) (10 200) (11 803) (4 527) Profit for the year 104 917 8 568 55 777 35 960
Other comprehensive income:Items that will not be reclassified to profit or loss:
Movement in reserve on revaluation of properties (2 036) 2 545 - - (Losses)/gains on property revaluations (2 828) 3 535 - - Income tax relating to items that will not be reclassified 792 (990) - -
Items that will be reclassified to profit or loss:Movement in cash flow hedge reserve 9 978 (10 156) - -
Fair value adjustments to cash flow hedge reserve 45 135 (43 660) - - Reclassification to profit or loss (29 622) 29 554 - - Income tax relating to items that may be reclassified (5 535) 3 950 - -
Other comprehensive income/(loss) for the year net of taxation 7 942 (7 611) - -
112 859 957 55 777 35 960
Profit attributable to:Owners of the parent 105 123 15 303 Non-controlling interest (206) (6 735)
104 917 8 568
Owners of the parent 113 065 14 472 Non-controlling interest (206) (13 515)
112 859 957
Basic earnings per share (cents) 33 133.3 19.4 Diluted earnings per share (cents) 33 133.3 19.4 Dividends per share (cents) 33 5.0 10.0
Total comprehensive income attributable to:
Group Company
BKB LIMITED AND ITS SUBSIDIARIES(Registration number 1998/012435/06)
Total comprehensive income for the year

B K B | A N N U A L R E P O R T 2 0 2 1
S E R V I C E E X C E L L E N C E | E N T R E P R E N E U R S H I P | E A R N I N G S | E M P L O Y E E S | E N V I R O N M E N T
#IntegrityIntegrated
P E O P L E | P L A N E T | P R O F I T
#SustainabilitySynergised51 52
Annual Financial Statements for the year ended 30 June 2021
STATEMENTS OF CHANGES IN EQUITY
2021 2020 2021 2020R'000 R'000 R'000 R'000
Share capitalBalance at the beginning and end of the year 4 420 4 420 4 420 4 420
Share premium accountBalance at the beginning and end of the year 218 950 218 950 197 583 197 583
Treasury sharesBalance at the beginning of the year (120 713) (120 650) - -
Share movement during the year - (63) - - Balance at the end of the year (120 713) (120 713) - -
Non-distributable reservesReserve on revaluation of propertiesBalance at the beginning of the year 155 624 152 945 143 706 143 706 Revaluations (2 828) 3 535 - - Deferred tax on revaluations 792 (990) - - Purchase of 25% shares in Desert Raisins (Pty) Ltd - 134 - - Transfer to distributable reserves (384) - (384) - Balance at the end of the year 153 204 155 624 143 322 143 706
Cash flow hedge reserveBalance at the beginning of the year (7 238) 2 536 - - Fair value adjustments to cash flow hedge reserve 45 136 (34 243) - - Reclassification to profit or loss (29 622) 29 554 - - Income tax relating to items that may be reclassified (5 535) 1 313 - - Purchase of 25% shares in Desert Raisins (Pty) Ltd - (6 398) - - Balance at the end of the year 2 741 (7 238) - -
Share based payment reserveBalance at the beginning of the year - - - -
Employee share scheme - value of employee services 3 094 - 3 094 - Balance at the end of the year 3 094 - 3 094 -
Black economic empowerment reserveBalance at the beginning and end of the year 2 439 2 439 2 439 2 439
Unissued share reserveBalance at the beginning and end of the year 633 633 633 633
162 111 151 458 149 488 146 778 Distributable reservesRetained earningsBalance at the beginning of the year 921 191 914 313 695 473 668 354 Profit for the year 105 123 15 303 55 777 35 960 Dividends (3 943) (7 886) (4 420) (8 841) Purchase of 25% shares in Desert Raisins (Pty) Ltd - (539) - - Transfer from revaluation reserve 534 - 534 - Balance at the end of the year 1 022 905 921 191 747 364 695 473
Non-controlling interestBalance at the beginning of the year - 8 712 - - Loss for the year (206) (6 735) - - Other comprehensive loss - (6 780) - -
- 4 803 - - Balance at the end of the year (206) - - -
1 287 467 1 175 306 1 098 855 1 044 254
Sale of non-controlling interest in Desert Raisins (Pty) Ltd
Company
BKB LIMITED AND ITS SUBSIDIARIES(Registration number 1998/012435/06)
Group
Annual Financial Statements for the year ended 30 June 2021
STATEMENTS OF CASH FLOWS
2021 2020 2021 2020Notes R'000 R'000 R'000 R'000
Cash flow from operating activitiesCash receipts from customers 13 257 245 11 032 307 6 345 344 5 279 421 Cash paid to suppliers and employees (12 943 239) (10 746 760) (6 191 919) (5 265 261) Cash generated from operating activities 34 314 006 285 547 153 425 14 160 Interest received 5 152 3 841 33 014 41 961 Interest paid (71 669) (89 423) (55 157) (68 071) Taxation paid 35 (53 501) (22 659) (20 099) (5 258)
193 988 177 306 111 183 (17 208)
Cash flow from investing activitiesPurchase of property, plant and equipment (101 128) (56 753) (25 049) (18 671) Sale of property, plant and equipment 10 663 11 202 5 773 2 783 Purchase of non-controlling interest - (2 000) - - Purchase of other intangible assets (3 310) (2 926) (1 375) ( 693) Business combinations - (1 500) - - Sale of other intangible assets 405 - - 2 319 Increase in investment in subsidiaries - - (770) (15 000) Increase in investment in associate (8 688) - - - Advances of non-current receivables (4 447) (3 923) (4 447) (3 923) Repayment of non-current receivables 6 703 34 761 6 293 4 088 Loans advanced to group companies - - (1 557 298) (1 480 969) Loans repaid by group companies - - 1 542 820 1 648 040 Dividends received from group companies - - 18 437 20 021
(99 802) (21 139) (15 616) 157 995
Cash flow from financing activitiesDividends paid (3 943) (7 886) (4 420) (8 841) Cash paid on share movements - (63) - - Proceeds from borrowings 114 801 123 104 - - Repayment of borrowings (130 183) (125 004) (19 953) (10 143) Proceeds from financial liabilities at fair value through profit or loss 978 198 1 013 423 - - Repayments of financial liabilities at fair value through profit or loss (983 316) (1 040 092) - - Principal elements of lease payments (11 138) (7 836) (3 713) (1 385)
(35 581) (44 354) (28 086) (20 369)
Total cash movement for the year 58 605 111 813 67 481 120 418 Cash and cash equivalents beginning of the year 2 570 (49 243) 47 227 (13 191) Movement in cash credit accounts (114 767) (60 000) (114 766) (60 000) Cash and cash equivalents end of the year 15 (53 592) 2 570 (58) 47 227
Group Company
BKB LIMITED AND ITS SUBSIDIARIES(Registration number 1998/012435/06)

B K B | A N N U A L R E P O R T 2 0 2 1
S E R V I C E E X C E L L E N C E | E N T R E P R E N E U R S H I P | E A R N I N G S | E M P L O Y E E S | E N V I R O N M E N T
#IntegrityIntegrated
P E O P L E | P L A N E T | P R O F I T
#SustainabilitySynergised53 54
Annual Financial Statements for the year ended 30 June 2021
NOTES TO THE FINANCIAL STATEMENTS
1 Segmental information
These reportable segments as well as the products and services from which each of them derive revenue are set out below:
Reportable segmentBrokerage services
Trading
TechnologyLeasing of propertiesFruit
Grain
Sugar
The SBUs offer different services and are managed separately as they require different skills, technology and marketing strategies.
Segmental revenue and results
Operating segments Segment revenue - internal
Segment revenue - external
Profit/ (loss) before tax
Depreciation and
amortisation
Human resource/ staff
costs
Net finance (expense)/
income
Taxation
R'000 R'000 R'000 R'000 R'000 R'000 R'000 2021Brokerage services 73 979 1 059 384 70 014 (14 947) (157 676) (22 270) (19 404) Trading 427 1 814 305 35 702 (7 553) (95 615) (21 221) (9 999) Livestock and properties - 233 278 42 232 (9 551) (114 063) (9 218) (12 082) Technology 6 438 25 877 (9 535) (1 030) (13 021) (2211) (965) Leasing of properties 39 143 4 045 27 822 (829) (451) (1 355) (7 672) Fruit - 347 573 (11 604) (1 429) (7 126) (17 521) 3 401 Grain 53 688 1 249 464 838 (1 977) (42 888) (23 160) (478) Sugar 726 311 805 614 55 810 (1 723) (21 526) 3 424 (16 020) All other segments 74 032 5 439 (62 428) (3 083) (59 218) 27 015 19 285 Total 974 018 5 544 979 148 851 (42 122) (511 584) (66 517) (43 934)
2020Brokerage services 53 542 775 624 25 243 (11 531) (155 056) (24 720) (7 071) Trading 1 698 1 774 762 27 785 (7 339) (90 834) (26 069) (7 780) Livestock and properties - 176 414 13 884 (8 529) (96 759) (6 663) (3 925) Technology 1 428 21 000 (10 129) (753) (12 026) (333) (3 212) Leasing of properties 37 463 4 767 24 209 (593) (422) (1 599) (6 775) Fruit - 358 039 (56 847) (6 036) (8 699) (27 948) 15 768 Grain 75 394 995 033 1 017 (918) (38 555) (27 501) 551 Sugar 772 044 882 556 40 927 (2 474) (19 027) (251) (12 012) All other segments 93 259 3 985 (47 321) (2 919) (46 079) 29 502 14 256 Total 1 034 828 4 992 180 18 768 (41 092) (467 457) (85 582) (10 200)
BKB LIMITED AND ITS SUBSIDIARIES(Registration number 1998/012435/06)
Comprises the packaging, distribution and sales of sugar and agro based consumer goods.
Comprises the processing, distribution and marketing of dried fruits, predominantly in foreignmarkets.Comprises the trading in grain commodities, grain storage and handling, maize milling and lucerneprocessing.
The Group has identified reportable segments which represent the structure used by the board of directors and executive management to make keystrategic and operating decisions and assess performance.
The Group has eight reportable segments within which the Group’s strategic business units (SBUs) fall.
Livestock and properties
The leasing of warehouse and office space.
Comprises marketing by auction, trading, warehousing and logistics of wool and mohair for boththe producer and buyer.Comprises retail trading branches throughout the country specializing in agricultural requisites.Comprises the marketing and auctioneering of livestock, general farming implements andagricultural, commercial and residential properties.Comprises the digital transformation business units.
Products and services
The executive directors assess the performance of the operating segments based on a measure of adjusted value of business conducted, revenueand profit before tax. This measurement basis includes the effects of non-recurring expenditure from the operating segments such as restructuringcosts, legal expenses and goodwill impairments when the impairment is the result of an isolated, non-recurring event.
Annual Financial Statements for the year ended 30 June 2021
NOTES TO THE FINANCIAL STATEMENTS
BKB LIMITED AND ITS SUBSIDIARIES(Registration number 1998/012435/06)
1 Segmental information (continued)
Segment assets and liabilities
Total assets Total liabilities
Total assets Total liabilities
R'000 R'000 R'000 R'000
Brokerage services 535 133 80 025 566 832 155 421 Trading 484 797 337 263 444 595 316 096 Livestock and properties 370 357 188 692 261 783 107 716 Technology 21 729 43 800 20 239 31 919 Leasing of properties 606 219 78 739 588 751 76 214 Fruit 277 264 324 499 387 947 430 015 Grain 733 768 506 124 617 092 390 668 Sugar 233 061 55 702 209 704 63 906 All other segments 138 263 498 281 210 531 560 213 Total 3 400 591 2 113 125 3 307 474 2 132 168
Reconciling itemsInter-segment loans (564 435) (564 436) (506 840) (506 840) Total as per statements of financial position 2 836 156 1 548 689 2 800 634 1 625 328
Geographical information
Revenue - internal
Revenue - external
Non-current Assets
Revenue - internal
Revenue - external
Non-current Assets
R'000 R'000 R'000 R'000 R'000 R'000 South Africa 241 043 5 542 356 1 056 481 262 784 4 983 269 996 908 Eswatini 726 311 2 623 55 716 772 044 8 911 54 188 Lesotho 6 664 - - - - - Total 974 018 5 544 979 1 112 197 1 034 828 4 992 180 1 051 096
The amounts provided to the board of directors with respect to total assets are measured in a manner consistent with that of the financialstatements. These assets are allocated based on the operations of the segment and the physical location of the asset.
Investments in shares held by the Group are not considered to be segment assets and are not allocated to segments.
Capital expenditure reflects additions to non-current assets, other than financial instruments and deferred tax assets.
The amounts provided to the board of directors with respect to total liabilities are measured in a manner consistent with that of the financialstatements. These liabilities are allocated based on the operations of the segment.
Included in non-current assets situated in South Africa are assets of R9.3 million classified as held for sale at 30 June 2021.
Non-current assets reconcile to the statements of financial position through non-current receivables of R22.3 million (2020: R24.6 million).
The table below provides information on segment assets and liabilities as well as a reconciliation to total assets and liabilities as per the statementsof financial position.
2021 2020
2021 2020

B K B | A N N U A L R E P O R T 2 0 2 1
S E R V I C E E X C E L L E N C E | E N T R E P R E N E U R S H I P | E A R N I N G S | E M P L O Y E E S | E N V I R O N M E N T
#IntegrityIntegrated
P E O P L E | P L A N E T | P R O F I T
#SustainabilitySynergised55 56
Annual Financial Statements for the year ended 30 June 2021
NOTES TO THE FINANCIAL STATEMENTS
2 Property, plant and equipment
Land and buildings
Plant and machinery
Motor vehicles
Furniture and fixtures
Office equipment
Computer equipment Total
R'000 R'000 R'000 R'000 R'000 R'000 R'000 Group
Year ended 30 June 2021Opening net book value 451 451 303 102 72 816 4 994 4 199 8 104 844 666 Additions 31 618 35 512 22 884 1 283 1 161 8 670 101 128 Disposals (2 225) (1 957) (6 549) (43) (17) (374) (11 165) Transfers 465 (489) - 12 12 - - Revaluations (1 002) - - - - - (1 002) Depreciation (768) (28 143) (10 264) (858) (1 226) (4 527) (45 786) Closing net book value 479 539 308 025 78 887 5 388 4 129 11 873 887 841
At 30 June 2021Cost or fair value 481 135 432 648 127 336 12 446 12 897 37 231 1 103 693 Accumulated depreciation (1 596) (124 623) (48 449) (7 058) (8 768) (25 358) (215 852) Net book value 479 539 308 025 78 887 5 388 4 129 11 873 887 841
Year ended 30 June 2020Opening net book value 442 998 303 792 74 051 4 872 4 657 5 957 836 327 Additions 3 816 31 287 13 990 1 014 629 6 017 56 753 Disposals (889) (2 419) (4 545) (42) (1) (526) (8 422) Transfers 2 633 (2 821) - (36) 108 116 - Revaluations 3 535 - - - - - 3 535 Depreciation (642) (26 737) (10 680) (814) (1 194) (3 460) (43 527) Closing net book value 451 451 303 102 72 816 4 994 4 199 8 104 844 666
At 30 June 2020Cost or fair value 452 279 401 539 119 502 11 741 11 876 31 537 1 028 474 Accumulated depreciation (828) (98 437) (46 686) (6 747) (7 677) (23 433) (183 808) Net book value 451 451 303 102 72 816 4 994 4 199 8 104 844 666
Land and buildings
Plant and machinery
Motor vehicles
Furniture and fixtures
Office equipment
Computer equipment Total
R'000 R'000 R'000 R'000 R'000 R'000 R'000 Company
Year ended 30 June 2021Opening net book value 320 242 42 553 29 786 3 885 3 690 5 024 405 180 Additions 6 166 4 698 6 269 1 044 901 5 971 25 049 Disposals (2 225) (1 100) (2 176) (10) (8) (64) (5 583) Revaluations (168) - - - - - (168) Depreciation - (5 154) (4 118) (612) (1 058) (2 952) (13 894) Closing net book value 324 015 40 997 29 761 4 307 3 525 7 979 410 584
At 30 June 2021Cost or fair value 324 015 71 872 58 884 10 265 10 872 26 666 502 574 Accumulated depreciation - (30 875) (29 123) (5 958) (7 347) (18 687) (91 990) Net book value 324 015 40 997 29 761 4 307 3 525 7 979 410 584
BKB LIMITED AND ITS SUBSIDIARIES(Registration number 1998/012435/06)
Annual Financial Statements for the year ended 30 June 2021
NOTES TO THE FINANCIAL STATEMENTS
BKB LIMITED AND ITS SUBSIDIARIES(Registration number 1998/012435/06)
2 Property, plant and equipment (continued)
Land and buildings
Plant and machinery
Motor vehicles
Furniture and fixtures
Office equipment
Computer equipment Total
R'000 R'000 R'000 R'000 R'000 R'000 R'000 Company
Year ended 30 June 2020Opening net book value 318 166 40 360 32 066 3 988 4 176 3 896 402 652 Additions 2 076 7 710 4 196 480 492 3 717 18 671 Disposals - (642) (1 782) (23) (1) (504) (2 952) Depreciation - (4 875) (4 694) (560) (977) (2 085) (13 191) Closing net book value 320 242 42 553 29 786 3 885 3 690 5 024 405 180
At 30 June 2020Cost or fair value 320 242 69 763 58 392 9 276 10 027 21 964 489 664 Accumulated depreciation - (27 210) (28 606) (5 391) (6 337) (16 940) (84 484) Net book value 320 242 42 553 29 786 3 885 3 690 5 024 405 180
Net carrying amounts of assets under instalment sale agreements
2021 2020 2021 2020R'000 R'000 R'000 R'000
Plant and machinery 68 180 67 623 - - Motor vehicles 9 049 8 761 - -
77 229 76 384 - -
Revaluations
Refer to note 44 for specific details regarding the valuation of the land and buildings.
The carrying value of the revalued assets under the cost model would have been:
2021 2020 2021 2020R'000 R'000 R'000 R'000
Land and buildings 261 155 232 530 124 049 120 108
Group Company
Revaluations are performed every three years on the Group's office building and fibre warehouse as well on its processing and packagingplants. Trading branches as well as shearing and auction facilities are valued every five years as these are mostly in rural areas.
The cost of assets includes assets in progress to the value of R2 170 838 (2020: R2 715 607) for the Group and R1 995 405 (2020: R757472) for the Company.
Group Company
Registers with details of land and buildings are available for inspection by shareholders or their duly authorised representatives at theregistered office of the Company.
Included in the Group value of buildings above is a 50% share of the property owned by Bethlehem Veilingskrale (Pty) Ltd. The 50% interestis valued at R1 191 000 (2020: R1 050 000).

B K B | A N N U A L R E P O R T 2 0 2 1
S E R V I C E E X C E L L E N C E | E N T R E P R E N E U R S H I P | E A R N I N G S | E M P L O Y E E S | E N V I R O N M E N T
#IntegrityIntegrated
P E O P L E | P L A N E T | P R O F I T
#SustainabilitySynergised57 58
Annual Financial Statements for the year ended 30 June 2021
NOTES TO THE FINANCIAL STATEMENTS
3 Leases
Amounts recognised in the Statements of Financial PositionThe statements of financial position show the following amounts relating to leases:
2021 2020 2021 2020R'000 R'000 R'000 R'000
Right-of-use assetsBuildings 58 500 47 898 31 714 29 325 Equipment 3 823 2 142 2 308 - Vehicles 3 800 6 100 2 160 3 226
66 123 56 140 36 182 32 551
Lease liabilitiesCurrent 12 014 8 685 4 783 1 799 Non-Current 60 235 51 035 35 528 33 098
72 249 59 720 40 311 34 897
The maturity analysis of lease liabilities is set out in Note 43.
Additions to the right-of-use assets during the year were 33 022 5 549 18 482 1 772
Amounts recognised in the Statements of Profit or Loss
Depreciation charge of right-of-use assetsBuildings 11 276 8 412 5 528 3 038 Equipment 792 685 165 - Vehicles 2 879 2 319 1 066 693
14 947 11 416 6 759 3 731
Interest expense 6 648 5 926 4 258 3 261 Expenses relating to short-term leases 16 060 17 586 1 156 2 036 Expenses relating to leases of low-value assets 8 986 6 283 1 188 252 Expenses relating to variable lease payments 15 657 9 239 1 530 961
Total cash outflow for leases were 58 489 46 870 11 845 7 895
Variable lease payments
2021 2020 2021 2020R'000 R'000 R'000 R'000
4 Investment property
Balance at the beginning of the year 35 528 35 528 1 517 1 517 Fair value adjustments (205) - (205) -
Balance at the end of the year 35 323 35 528 1 312 1 517
Amounts recognised in profit and loss for the yearRental income 2 451 3 266 971 1 108 Direct operating expenses (3 197) (2 584) (791) (656)
The Group leases offices, warehouses, retail stores, equipment and forklifts. Rental contracts are typically made for fixed periods of sixmonths to seventeen years. This note provides information for leases where the Group is a lessee.
Some property leases contain variable payment terms that are linked to value of business generated at auctions. Lease payments arecalculated on the basis of 1% of value of business. Variable payment terms are used for a variety of reasons, including minimising the fixedcosts base for auctions held. Variable lease payments that depend on turnover are recognised in profit or loss in the period in which thecondition that triggers those payments occurs.
Group Company
BKB LIMITED AND ITS SUBSIDIARIES(Registration number 1998/012435/06)
Group Company
The statements of profit or loss show the following amounts relating toleases:
Registers with details of land and buildings are available for inspection by shareholders or their duly authorised representatives at theregistered office of the Company.
Annual Financial Statements for the year ended 30 June 2021
NOTES TO THE FINANCIAL STATEMENTS
BKB LIMITED AND ITS SUBSIDIARIES(Registration number 1998/012435/06)
2021 2020 2021 2020R'000 R'000 R'000 R'000
5 Intangible Assets
GoodwillBalance at the beginning of the year 61 678 63 539 4 500 4 500
Impairment - (1 861) - - Balance at the end of the year 61 678 61 678 4 500 4 500
Goodwill relates to the acquisitions of: Atlanta Products (Pty) Ltd 19 346 19 346 - - BKB Van Wyk (Pty) Ltd 16 216 16 216 - - BKBLouwid (Pty) Ltd 6 876 6 876 - - Grainco (Pty) Ltd 13 716 13 716 - - Riverview - BKB Limited 4 500 4 500 4 500 4 500 Wool and Mohair Exchange NPC 1 024 1 024 - -
61 678 61 678 4 500 4 500 Goodwill allocation per operating segment:
Grain 13 716 13 716 - - Leasing of properties 1 024 1 024 - - Livestock and properties 27 592 27 592 4 500 4 500 Sugar 19 346 19 346 - -
61 678 61 678 4 500 4 500 Trade rightsBalance at the beginning of the year 10 489 11 576 10 489 11 576
Classified as held for sale (2 900) - (2 900) - Amortisation (1 047) (1 087) (1 047) (1 087)
Balance at the end of the year 6 542 10 489 6 542 10 489
Cost 9 072 12 652 9 072 12 652 Accumulated amortisation and impairment (2 530) (2 163) (2 530) (2 163)
6 542 10 489 6 542 10 489 Trade rights comprises of:
Trade rights - Beaufort West driveway 2 845 3 111 2 845 3 111 Trade rights - Hanover driveway - 3 100 - 3 100 Auction rights - Riverview Trading 1 530 1 710 1 530 1 710 Auction rights - Slabbert,Verster & Malherbe 2 167 2 568 2 167 2 568
6 542 10 489 6 542 10 489 Brand namesBalance at the beginning of the year 1 821 15 193 - -
Impairment - (10 490) - - Amortisation (260) (2 882) - -
Balance at the end of the year 1 561 1 821 - -
Cost 28 022 28 022 - - Accumulated amortisation and impairment (26 461) (26 201) - -
1 561 1 821 - - Brand names comprises of:
BKB Van Wyk (Pty) Ltd 1 561 1 821 - - 1 561 1 821 - -
Client lists and relationshipsBalance at the beginning of the year 4 701 7 195 3 451 3 871
Acquired through business combinations - 1 500 - - Amortisation (1 170) (2 851) (420) (420) Impairment - (1 143) - -
Balance at the end of the year 3 531 4 701 3 031 3 451
Cost 68 874 68 624 4 011 4 011 Accumulated amortisation and impairment (65 343) (63 923) (980) (560)
3 531 4 701 3 031 3 451 Client lists and relationships comprises of:
Riverview Trading 3 031 3 451 3 031 3 451 Solomons & Crafford 500 1 250 - -
3 531 4 701 3 031 3 451
Group Company

B K B | A N N U A L R E P O R T 2 0 2 1
S E R V I C E E X C E L L E N C E | E N T R E P R E N E U R S H I P | E A R N I N G S | E M P L O Y E E S | E N V I R O N M E N T
#IntegrityIntegrated
P E O P L E | P L A N E T | P R O F I T
#SustainabilitySynergised59 60
Annual Financial Statements for the year ended 30 June 2021
NOTES TO THE FINANCIAL STATEMENTS
BKB LIMITED AND ITS SUBSIDIARIES(Registration number 1998/012435/06)
2021 2020 2021 2020R'000 R'000 R'000 R'000
5 Intangible Assets (continued)
Computer softwareBalance at the beginning of the year 12 903 16 367 7 625 11 665
Additions 3 310 2 926 1 375 693 Disposals (405) - - (2 319) Amortisation (3 948) (4 109) (2 801) (2 414) Impairment - (2 281) - -
Balance at the end of the year 11 860 12 903 6 199 7 625
Cost 33 220 35 063 24 662 23 288 Accumulated amortisation and impairment (21 360) (22 160) (18 463) (15 663)
11 860 12 903 6 199 7 625
85 172 91 592 20 272 26 065
6 Impairment of assets
Value in use
Significant assumption used
BKBLouwid (Pty) Ltd
BKB van Wyk (Pty) Ltd
GrainCo (Pty) Ltd
Revenue growth rate 5.0% 5.0% 7.5% 3.0%Terminal growth rate 2.5% 2.5% 3.8% 3.0%Gross profit percentage - - 5.2% 73.0%Commission percentage 4.9% 5.8% - -Post-tax discount rate 14.6% 14.6% 15.3% 14.5%
R'000 R'000 R'000 R'000
Value in use (recoverable amount) 131 017 89 463 136 219 122 309 Value in use exceeds carrying amount 104 193 63 263 52 899 18 951
Sensitivity of key assumptions
Impact of changes in key assumptions
BKBLouwid (Pty) Ltd
BKB van Wyk (Pty) Ltd
GrainCo (Pty) Ltd
Revenue growth rate -11.1% -8.0% -1.0% 0.9%Gross profit - - 4.2% 0.8%
Goodwill is allocated to the Group's cash-generating units (CGU's) identified according to internal Company structure and/or businesssegment. The recoverable amount of a cash-generating unit is determined based on value-in-use calculations. The calculations use cashflow projections based on financial budgets approved by management, and a terminal value, where applicable. The discount rates used in theimpairment calculations were determined based on the weighted average cost of capital (WACC).
The period over which management has projected cash flows is based on financial budgets approved by management for the next financialyear which was then further projected for another four years.
The growth rate used to extrapolate cash flow projections beyond the period covered in the calculation was based on most recent budgets.
No impairment of goodwill arose due to the value-in-use impairment calculations, supporting current carrying values.
The recoverable amounts of the cash-generating units would equal their carrying amounts if management assumptions were changed to thefollowing:
The cost of assets includes assets in progress to the value of R42 675 (2020 :R163 342) for the Group and R163 342 for the 2020 financialyear for the Company. The remaining useful lives for intangible assets carried at amortised cost is six years for brand names, one to eightyears for client lists, five to eleven years for trade rights and two to eight years for computer software.
Company
Atlanta Products (Pty) Ltd
The impairment tests were performed at 30 June 2021. The recoverable amounts were determined on the basis of the value-in-use using thediscounted cash flow method. The basis for projecting future cash flows is the business plans prepared by management for the five years2022 to 2026. These plans take into consideration historical empirical values and management’s expectations regarding the futuredevelopment of the relevant markets. The impairment tests took into account the assumptions tabled above.
Group
Atlanta Products (Pty) Ltd
Annual Financial Statements for the year ended 30 June 2021
NOTES TO THE FINANCIAL STATEMENTS
BKB LIMITED AND ITS SUBSIDIARIES(Registration number 1998/012435/06)
7 Investments in subsidiaries
The following table lists the entities which are controlled by the Group, either directly or indirectly through subsidiaries.
2021 2020 2021 2020% holding % holding R'000 R'000
BKB Shearing (Pty) Ltd 100% 100% - - Lihoai Consultancy (Pty) Ltd 100% 100% - - Anzomix (Pty) Ltd 100% 100% - -
The House of Fibre (Pty) Ltd 100% 100% - - BKB Pinnacle Fibres (Pty) Ltd 100% 100% 13 13 BKB Fuels (Pty) Ltd 100% 0% - - BKB Distribution Centre (Pty) Ltd 100% 100% - - Home & Hectare (Pty) Ltd 100% 100% - - BKBLouwid (Pty) Ltd 100% 100% 7 338 7 338 BKB Van Wyk (Pty) Ltd 100% 100% 5 5 Hoëveld Veilingsentrum (Pty) Ltd 50% 0% 770 - Shift Digital Acceleration (Pty) Ltd 100% 100% 110 1
RFID Africa Experts (Pty) Ltd 100% 100% - - Wool & Mohair Exchange of South Africa NPC 100% 100% 3 966 3 966 Billsons Coutts (Pty) Ltd 100% 100% 37 001 37 001 PaKHouse Brands (Pty) Ltd 100% 100% 262 926 262 926
Atlanta Sugar (Pty) Ltd 100% 100% - - Atlanta Sugar SA (Pty) Ltd 100% 100% 182 - Atlanta Investments (Pty) Ltd 100% 100% - -
Atlanta Products (Pty) Ltd 100% 100% - - Oceanic Swaziland (Pty) Ltd 100% 100% - -
Grainco Group Holdings (Pty) Ltd 100% 100% - - AlphaAlfa (Pty) Ltd 100% 100% - - BKB Grainco (Pty) Ltd 100% 100% - - Grainco (Pty) Ltd 100% 100% - -
Gritco Properties (Pty) Ltd 100% 100% - - Pakhouse Fruits Holdings (Pty) Ltd 100% 100% - -
Desert Raisins (Pty) Ltd 100% 100% - - 312 311 311 250
8 Investment in associates
The following table lists the entities which the Group have significant influence over.
2021 2020 2021 2020% holding % holding R'000 R'000
Nutopia Agri Developments (Pty) Ltd 50% 0% 8 450 -
Summarised financial information for associates
2021 2020R'000 R'000
Summarised Statement of Financial PositionTotal assets 17 529 - Total liabilities (15 563) -
Summarised Statement of Profit or Loss and Other Comprehensive IncomeRevenue 526 - Loss for the year (534) -
Group
The tables below provide summarised financial information of the associate. The information disclosed reflects the amounts presented in thefinancial statements of the relevant associate and not the Group's share of those amounts. They have been amended to reflect adjustmentsmade by the entity when using the equity method, including fair value adjustments and modifications for differences in accounting policy.
Company

B K B | A N N U A L R E P O R T 2 0 2 1
S E R V I C E E X C E L L E N C E | E N T R E P R E N E U R S H I P | E A R N I N G S | E M P L O Y E E S | E N V I R O N M E N T
#IntegrityIntegrated
P E O P L E | P L A N E T | P R O F I T
#SustainabilitySynergised61 62
Annual Financial Statements for the year ended 30 June 2021
NOTES TO THE FINANCIAL STATEMENTS
BKB LIMITED AND ITS SUBSIDIARIES(Registration number 1998/012435/06)
2021 2020 2021 2020R'000 R'000 R'000 R'000
9 Loans to group companies
The House of Fibre (Pty) Ltd - - - 13 196 Lihoai Consultancy (Pty) Ltd - - - 21 BKB Pinnacle Fibres (Pty) Ltd - - 1 472 - BKB Distribution Centre (Pty) Ltd - - 2 049 - BKBLouwid (Pty) Ltd - - 44 718 14 812 Hoëveld Veilingsentrum (Pty) Ltd - - 9 638 - Shift Digital Acceleration (Pty) Ltd - - 11 381 7 432 RFID Africa Experts (Pty) Ltd - - 22 813 16 407 Wool & Mohair Exchange of South Africa NPC - - 5 755 5 768 Billsons Coutts (Pty) Ltd - - 7 766 8 411 PaKHouse Brands (Pty) Ltd - - 3 630 4 591 Atlanta Sugar (Pty) Ltd - - 97 97 Atlanta Sugar SA (Pty) Ltd - - 661 - Atlanta Products (Pty) Ltd - - 473 494 Grainco Group Holdings (Pty) Ltd - - 126 408 95 963 Pakhouse Fruits Holdings (Pty) Ltd - - 72 584 72 584 Desert Raisins (Pty) Ltd - - 97 181 172 618
- - 406 626 412 394 Loss allowance - IFRS 9 - - (7 907) (5 303)
- - 398 719 407 091
2021 2020 2021 2020R'000 R'000 R'000 R'000
Non-current assets - - 106 778 90 150 Current assets - - 291 941 316 941
- - 398 719 407 091
10 Trade and other receivables T
Financial instrumentsTrade receivables 790 437 791 185 309 692 398 619 Trade receivables - loans to employees 19 215 18 957 10 134 10 124 Loss allowance (19 852) (13 905) (9 372) (6 656) Trade receivables at amortised cost 789 800 796 237 310 454 402 087 Receivable from BKB Personnel Share Trust - - 102 659 102 768 Other receivables 37 076 29 632 18 454 23 731
Non-financial instrumentsVAT 39 360 50 375 17 721 26 207 Deposits 34 811 17 414 2 301 179 Prepayments 9 775 13 583 4 069 6 659
910 822 907 241 455 658 561 631
Non-current assets 22 322 24 578 11 977 13 823 Current assets 888 499 882 662 443 679 547 808
910 821 907 240 455 656 561 631 Exposure to credit risk
CompanyGroup
Loans to subsidiaries are payable on demand and interest is charged at a prime related interest rate except for a fixed repayment loan of R1156 971 (2020: R3 019 049) included in the Desert Raisins (Pty) Ltd's balance. The loan is repayable in monthly instalments of R169 718(2020: R170 046).
Trade receivables inherently expose the Group to credit risk, being the risk that the Group will incur financial loss if customers fail to makepayments as they fall due.
The Group's historical credit loss experience does not show significantly different loss patterns for different customer segments. Theprovision for credit losses is therefore based on past due status without disaggregating into further risk profiles. The loss allowance provisionis determined as follows:
Group Company
Annual Financial Statements for the year ended 30 June 2021
NOTES TO THE FINANCIAL STATEMENTS
BKB LIMITED AND ITS SUBSIDIARIES(Registration number 1998/012435/06)
10 Trade and other receivables (continued)
Group
Gross carrying
amount atdefault
Lossallowance
Gross carrying
amount atdefault
Lossallowance
Expected credit loss rate:12 Month expected credit lossSpecific low risk of default 9.5% (2020: 3.2%) 103 602 (9 840) 84 333 (2 676) Specific high risk of default 1.9% (2020: 89.4%) 37 109 (723) 3 855 (3 448)
Lifetime expected credit lossNot past due: 0.8% (2020: 0.8%) 377 216 (3 177) 463 763 (3 569) Less than 30 days past due: 0.8% (2020: 0.7%) 137 437 (1 131) 153 064 (1 144) 31 - 60 days past due: 2.3% (2020: 1.1%) 72 645 (1 660) 51 875 (561) 61 - 90 days past due: 2.5% (2020: 0.9%) 43 594 (1 071) 16 699 (158) 91 - 120 days past due: 4.5% (2020: 4.5%) 9 667 (431) 10 662 (485) More than 120 days past due: 6.4% (2020: 7.2%) 28 382 (1 819) 25 891 (1 864) Total 809 652 (19 852) 810 142 (13 905)
Company
Expected credit loss rate:12 Month expected credit lossSpecific low risk of default 4.9% (2020: 3.6%) 86 437 (4 258) 71 791 (2 570)
Lifetime expected credit lossNot past due: 0.8% (2020:0.5%) 187 973 (1 539) 267 889 (1 440) Less than 30 days past due: 1.7% (2020: 1.7%) 22 723 (393) 39 045 (673) 31 - 60 days past due: 15.1% (2020: 3.9%) 5 445 (824) 5 039 (195) 61 - 90 days past due: 12.2% (2020: 2.8%) 3 452 (421) 2 256 (64) 91 - 120 days past due: 20.9% (2020: 5.2%) 912 (191) 2 237 (117) More than 120 days past due: 13.6% (2020: 7.8%) 12 884 (1 746) 20 486 (1 597) Total 319 826 (9 372) 408 743 (6 656)
2021 2020 2021 2020R'000 R'000 R'000 R'000
Opening balance in accordance with IFRS 9 (13 905) (15 766) (6 656) (7 113) Provision raised on new trade receivables (5 947) (514) (2 716) - Provisions reversed on settled trade receivables - 2 375 - 457 Closing balance (19 852) (13 905) (9 372) (6 656)
Concentrations of credit riskTrade receivables by market:Trading 133 516 147 380 145 975 159 814 Fibre buyers 27 367 123 119 27 305 101 455 Production 284 772 198 691 63 036 69 978 Advances 73 376 67 372 73 376 67 372 Grain 137 449 102 979 - - Sugar 77 973 96 089 - - Fruit 55 984 55 555 - -
790 437 791 185 309 692 398 619
Exposure to currency riskRand 716 697 751 172 285 813 402 087 US Dollar 73 103 45 065 24 641 -
789 800 796 237 310 454 402 087
20202021
Group Company
The net carrying amounts, in Rand, of trade receivables at amortised cost are all denominated in US Dollars. The amounts have beenpresented in Rand by converting the foreign currency amount at the closing rate at the reporting date.

B K B | A N N U A L R E P O R T 2 0 2 1
S E R V I C E E X C E L L E N C E | E N T R E P R E N E U R S H I P | E A R N I N G S | E M P L O Y E E S | E N V I R O N M E N T
#IntegrityIntegrated
P E O P L E | P L A N E T | P R O F I T
#SustainabilitySynergised63 64
Annual Financial Statements for the year ended 30 June 2021
NOTES TO THE FINANCIAL STATEMENTS
BKB LIMITED AND ITS SUBSIDIARIES(Registration number 1998/012435/06)
2021 2020 2021 2020R'000 R'000 R'000 R'000
11 Deferred tax
Analysis of deferred tax asset/(liability)
Property, plant and equipment (130 751) (128 228) (69 623) (69 739) Leases 2 108 3 540 1 509 657 Intangible assets (1 859) (1 859) - - Provisions 29 775 23 071 22 074 13 673 Realised capital loss 22 989 23 074 22 989 23 074 Income in advance 1 559 ( 870) 1 174 31 Tax losses available for set off against future taxable income 59 572 56 666 - -
(16 607) (24 606) (21 877) (32 304)
The total net deferred tax liability comprises:Deferred tax asset 29 288 23 170 60 133 46 549 Deferred tax liability (45 895) (47 776) (82 010) (78 853)
(16 607) (24 606) (21 877) (32 304)
Reconciliation of deferred tax asset/(liability)
Balance at the beginning of the year (24 606) (42 176) (32 304) (32 856) Charge to profit or loss 12 592 14 610 10 277 552 Debit to other comprehensive income (4 593) 2 960 - - Realisation of deferred tax on revaluation reserve - - 150 - Balance at the end of the year (16 607) (24 606) (21 877) (32 304)
2021 2020 2021 2020R'000 R'000 R'000 R'000
12 Inventories
Farming requisites and merchandise 422 386 313 726 303 660 244 167 Wool and mohair inventory 72 933 88 341 72 347 85 773 Fruit inventory 118 913 246 365 - - Grain inventory 53 836 75 737 - - Sugar inventory 34 324 19 246 - - Consumables 20 070 17 981 5 323 5 324
722 462 761 396 381 330 335 264 Provision for obsolete, slow moving and defective stock (12 015) (10 705) (10 413) (10 425)
710 447 750 691 370 917 324 839
Inventory included at net realisable value 7 283 96 829 6 887 22 048 Grain inventory included at market value 4 577 41 323 - -
Company
Group Company
Deferred tax has not been raised for deductible temporary differences and unused tax losses in the Group, amounting to R34 063 560 (2020:R21 234 722) and Company Rnil (2020: Rnil).
Deferred tax has been raised for all unused capital losses in the Group.
Deferred tax assets and liabilities have been offset at individual entitylevel where the income taxes relate to the same jurisdiction and thelaw allows net settlement.
Group
Annual Financial Statements for the year ended 30 June 2021
NOTES TO THE FINANCIAL STATEMENTS
BKB LIMITED AND ITS SUBSIDIARIES(Registration number 1998/012435/06)
2021 2020 2021 2020R'000 R'000 R'000 R'000
13 Derivatives
Foreign exchange contracts (financial asset) 1 004 13 381 - - Foreign exchange options (financial liability) (8 083) - - - Foreign exchange contracts (financial liability) (483) (5 869) (483) (285) Net financial (liability) / asset (7 562) 7 512 (483) (285)
Current assets 1 004 13 381 - - Current liabilities (8 566) (5 869) (483) (285)
(7 562) 7 512 (483) (285)
14 Other financial assets
At fair value through profit or loss - held for tradingOther financial assets 20 700 317 - -
2021 2020 2021 2020R'000 R'000 R'000 R'000
15 Cash and cash equivalents
Cash on hand 751 416 290 302 Bank balances 68 597 74 723 1 198 46 925 Bank overdrafts (122 940) (72 569) (1 546) -
(53 592) 2 570 (58) 47 227
Current assets 69 348 75 139 1 488 47 227 Current liabilities (122 940) (72 569) (1 546) -
(53 592) 2 570 (58) 47 227
Summary of securities provided for overdraft facilities:Cession of trade receivables (AlphaAlfa & Grainco) 112 805 92 063 - - Cession of trade receivables (Atlanta Sugar SA) 77 352 94 895 - - Deed of hypothecation over moveable assets, inventory and tradereceivables (Atlanta Products)
10 500 10 500 - -
Bond over Oceanic Swaziland property 12 000 12 000 - - Covering bond over Port Elizabeth property 110 000 110 000 110 000 110 000 Covering bond over rural properties 63 000 63 000 63 000 63 000 General notarial bond over movable grain inventory (AlphaAlfa &Grainco)
70 000 70 000 - -
Special and notarial bond over movable assets (Grainco) - 4 500 - - First covering mortgage bond over properties (Bultfontein &Bethlehem)
50 000 53 240 - -
505 657 510 198 173 000 173 000
Summary of surety provided for overdraft facilities:
Other financial assets comprise open forward contracts. Open positions are valued using market-to-market rate of a particular commodity atyear end. Commodities traded include soya beans, sunflower seeds, wheat, white maize and yellow maize.
Group Company
Surety of R400 million provided by BKB van Wyk (Pty) Ltd, Grainco (Pty) Ltd, BKBLouwid (Pty) Ltd, PaKHouse Brands (Pty) Ltd, AtlantaSugar SA (Pty) Ltd, BKB Grainco (Pty) Ltd for overdraft facilities in BKB Limited.
Unlimited surety provided by Oceanic Swaziland (Pty) Ltd and R5 million surety provided by BKB Limited for overdraft facility in AtlantaProducts (Pty) Ltd.
Surety of R50 million provided by BKB Limited for overdraft facilities in Atlanta Sugar SA (Pty) Ltd.
Group Company
Surety of R50 million provided by BKB Limited for forex forwardexchange contracts facilities in Desert Raisins (Pty) Ltd.
Surety of R5 million provided by BKB Limited for overdraft facilities in BKB van Wyk (Pty) Ltd.

B K B | A N N U A L R E P O R T 2 0 2 1
S E R V I C E E X C E L L E N C E | E N T R E P R E N E U R S H I P | E A R N I N G S | E M P L O Y E E S | E N V I R O N M E N T
#IntegrityIntegrated
P E O P L E | P L A N E T | P R O F I T
#SustainabilitySynergised65 66
Annual Financial Statements for the year ended 30 June 2021
NOTES TO THE FINANCIAL STATEMENTS
BKB LIMITED AND ITS SUBSIDIARIES(Registration number 1998/012435/06)
15 Cash and cash equivalents (continued)
2021 2020 2021 2020R'000 R'000 R'000 R'000
16 Assets/(liabilities) classified as held for sale
Assets classified as held for saleTrade rights - Hanover Driveway 2 900 - 2 900 - Right of use asset 8 057 - 8 057 -
10 957 - 10 957 -
Liabilities directly associated with assets classified as held forsaleLease obligation (9 319) - (9 319) -
2021 2020 2021 2020R'000 R'000 R'000 R'000
17 Share Capital
200 000 000 (2020: 200 000 000) Ordinary shares with no par value - - - -
Issued88 407 075 (2020: 88 407 075) Ordinary shares with no par value 4 420 4 420 4 420 4 420
2021 2020 2021 2020 Number Number Number Number
Reconciliation of number of shares in issue Balance at the beginning and end of the year 88 407 075 88 407 075 88 407 075 88 407 075
2021 2020 2021 2020 Number Number Number Number
Reconciliation of number of shares in issue Balance at the beginning of the year 9 551 852 9 547 220 - - Acquired by the Trust - 4 632 - - Balance at the end of the year 9 551 852 9 551 852 - -
Company
Treasury shares have arisen through the consolidation of the BKB Personnel Share Trust. Details of the Trust's shareholding is as follows:Treasury shares
Authorised
Company
Joint and several guarantee for R70 million to ABSA Bank Limited in favour of AlphaAlfa (Pty) Ltd by Grainco (Pty) Ltd and GrainCo GroupHoldings (Pty) Ltd.
Joint and several guarantee for R125 million to ABSA Bank Limited in favour of GrainCo Group Holdings (Pty) Ltd by AlphaAlfa (Pty) Ltd,Grainco (Pty) Ltd and Gritco Properties (Pty) Ltd.
In December 2020, the directors of BKB Limited decided to sell Hanover driveway. By April 2021 all the suspensive conditions were fulfilledand the Company was released from all obligations in terms of the relevant agreements. The sale is expected to be concluded by December2021, upon registration of the trade rights in the name of the purchaser.
The assets and liabilities are presented as part of the Trading segment in Note 1.
Group
Group
Group
Joint and several guarantee for R100 million to ABSA Bank Limited in favour of Grainco (Pty) Ltd by Gritco Properties (Pty) Ltd and GrainCoGroup Holdings (Pty) Ltd.
Company
Group
Company
Annual Financial Statements for the year ended 30 June 2021
NOTES TO THE FINANCIAL STATEMENTS
BKB LIMITED AND ITS SUBSIDIARIES(Registration number 1998/012435/06)
18 Share based payments
i. Performance shares
2021 2020 2021 2020Movements in number of shares awarded Number Number Number Number
Balance at the beginning of the year - - - - Granted 98 599 - 98 599 - Balance at the end of the year 98 599 - 98 599 -
Share awards outstanding vest in the following years, subject to thefulfilment of performance conditions.Year ending 30 June 2024 98 599 - 98 599 -
2021 2020 2021 2020 R R R R
IFRS 2 share based payment charge 831 815 - 751 447 -
ii. Bonus shares
2021 2020 2021 2020Movements in number of shares awarded Number Number Number Number
Balance at the beginning of the year - - - - Granted 224 209 - 224 209 - Balance at the end of the year 224 209 - 224 209 -
l 60% weighting: Return on Funds Employed (ROFE) outperforming BKB Limited’s Weighted Average Cost of Capital (WACC)l 40% weighting: Net Debt divided by Earnings Before Interest, Tax, Depreciation and amortisation (Net Debt ratio) outperforming a benchmark of peer group companies
If an eligible employee ceases to be employed by the Group by reason of a "no fault termination" prior to vesting of performance shares, theperformance shares available to vest shall be deemed to have vested and settled to the employee in terms of the share plan and on a datedetermined in consultation with the eligible employee (BKB Limited discretion).
If an eligible employee ceases to be employed by the Group by reason of a "no fault termination" prior to vesting of bonus shares, the bonusshares available to vest shall be deemed to have vested and settled to the employee in terms of the share plan with effect from the date oftermination of employment.
Special allocations of bonus shares awarded vest after three years conditional on continued employment. Bonus shares are granted at azero strike price.
The plan is designed to provide long-term incentives for senior managers and executives, to deliver long term sustainable returns acceptableto shareholders. Under the plan, annual conditional awards of Performance shares and Bonus shares will be allocated to eligible employeesof the Group. Annual allocations of these awards are governed by BKB Limited’s remuneration policies.
Annual conditional awards of performance shares will be made to participants at a zero strike price. Performance shares will vest on thefourth anniversary for their award to the extent that specified performance criteria over the intervening period (assessment period) has beenmet.
The BKB Limited 2021 Bonus and Performance Share Entitlement Plan
Group Company
Group Company
Group Company
The performance conditions applied to the performance shares awarded in 2021 are as follows:
The board of directors will, prior to the commencement of each assessment period, set target ranges for performance criteria comprisingminimum and maximum thresholds to be attained.
The BKB Limited 2021 Bonus and Performance Share Entitlement Plan was approved by the board of directors on 1 April 2021. Participationin the plan is at the board’s discretion and no individual has a contractual right to participate in the plan or to receive any guaranteed benefits.

B K B | A N N U A L R E P O R T 2 0 2 1
S E R V I C E E X C E L L E N C E | E N T R E P R E N E U R S H I P | E A R N I N G S | E M P L O Y E E S | E N V I R O N M E N T
#IntegrityIntegrated
P E O P L E | P L A N E T | P R O F I T
#SustainabilitySynergised67 68
Annual Financial Statements for the year ended 30 June 2021
NOTES TO THE FINANCIAL STATEMENTS
BKB LIMITED AND ITS SUBSIDIARIES(Registration number 1998/012435/06)
18 Share based payments (continued)
ii. Bonus shares (continued)2021 2020 2021 2020
Number Number Number Number Share awards outstanding vest in the following years, subject to thefulfilment of performance conditions.Year ending 30 June 2024 224 209 - 224 209 -
2021 2020 2021 2020 R R R R
IFRS 2 share based payment charge 2 262 471 - 2 052 258 -
iii. Valuation of share incentive grants
2021 2020 2021 2020
Spot price per share at grant date (cents) 1 000 - 900 - Discounted cash flow (DCF) valuation per share (cents) 1 022 - 1 110 - Risk free rate (%) 4.56% - 5.19% - Strike price (grant price) (cents) - - - - Dividend yield (%) 2.41% - 2.89% - Option life (years) 3 - 4 - Forfeiture rate (%) 9.09% - 9.09% - Volatility (%) 45.68% - 35.13% - Fair value per share at grant date (cents) 928 - 1 110 -
2021 2020 2021 2020R'000 R'000 R'000 R'000
19 Borrowings
Held at amortised costABSA Bank Limited - Cash credit accounts 454 756 - 454 756 -
ABSA Bank Limited 60 045 52 634 - -
First National Bank Limited 86 955 98 553 86 955 98 553 The loan is repayable in monthly instalments of R1 472 846 (2020:R1 472 846). Bears interest at a rate linked to prime.
- 569 522 - 569 522
- 8 355 - 8 355
Instalment sale agreements 62 278 65 118 - - 664 034 794 182 541 711 676 430
Land and Agricultural Bank of South Africa Limited - Cash credit accounts
The volatility input to the pricing model is a measure of the expected price fluctuations of the BKB share price over the life of the optionstructure. Volatility is measured as the annualised standard deviation of historical daily price changes of selected surrogates.
Group Company
Land and Agricultural Bank of South Africa Limited - TermloanBKB Limited: Repayable in annual instalments of R1 675 010 during2020. Bears interest at a rate linked to prime.
Company
The cash credit accounts relate to BKB Limited. Bears interest at arate linked to prime.
Commodity finance of lucerne stock and raw material in AlphaAlfa(Pty) Ltd. Bears interest at a rate linked to prime.
The revolving credit facility relates to BKB Limited. Bears interest at arate linked to prime.
The fair value of the shares granted in terms of the share plan is independently determined by an actuary of Financial Modelling Agencyusing an adjusted form of the Black-Scholes model which includes a Monte Carlo simulation model.
Performance shares Bonus shares
Group Company
Group
Annual Financial Statements for the year ended 30 June 2021
NOTES TO THE FINANCIAL STATEMENTS
BKB LIMITED AND ITS SUBSIDIARIES(Registration number 1998/012435/06)
2021 2020 2021 2020R'000 R'000 R'000 R'000
19 Borrowings (continued)
Non-current liabilities 116 493 137 170 74 570 92 191 Current liabilities 547 541 657 012 467 141 584 239
664 034 794 182 541 711 676 430
Securities and sureties
ABSA Bank Limited - Cash credit accounts
Covering bond over rural properties 75 000 - 75 000 - Covering bonds over properties in Desert Raisins (Pty) Ltd 40 000 - - -
Covering bond over rural properties - 75 000 - 75 000 Covering bonds over properties in Desert Raisins (Pty) Ltd - 40 000 - -
First National Bank Limited securityCovering bond over Port Elizabeth properties 110 000 110 000 110 000 110 000 Covering bond over rural properties 63 000 63 000 63 000 63 000
ABSA Bank Limited securityGrain inventory 75 037 65 941 - -
Surety signed by BKB Van Wyk (Pty) Ltd, BKBLouwid (Pty) Ltd, Home& Hectare (Pty) Ltd, Wool and Mohair Exchange NPC, BKB Shearing(Pty) Ltd, Billsons Coutts (Pty) Ltd, RFID Experts Africa (Pty) Ltd,Desert Raisins (Pty) Ltd and PaKHouse Brands (Pty) Ltd.
Surety signed by BKB Van Wyk (Pty) Ltd, BKBLouwid (Pty) Ltd, Home& Hectare (Pty) Ltd, Wool and Mohair Exchange NPC, BKB Shearing(Pty) Ltd, Billsons Coutts (Pty) Ltd, RFID Experts Africa (Pty) Ltd,Desert Raisins (Pty) Ltd and PaKHouse Brands (Pty) Ltd.
Surety of R400 million signed by BKB Van Wyk (Pty) Ltd, BKBLouwid(Pty) Ltd, BKB Grainco (Pty) Ltd, Grainco (Pty) Ltd, Atlanta Sugar SA(Pty) Ltd and PaKHouse Brands (Pty) Ltd.
160 000
Cession of trade and other receivables (BKB, BKBLouwid, BKB VanWyk and Desert Raisins)
Notarial covering bonds over movable assets (including inventory) ofBKB Limited - 160 000
Land and Agricultural Bank of South Africa Limited - Cash credit accounts and term loan security
-
Group Company
Notarial covering bonds over movable assets (including inventory) ofBKB Limited 160 000 - Notarial covering bonds over movable assets (including inventory) ofDesert Raisins (Pty) Ltd 180 000
160 000 -
Notarial covering bonds over movable assets (including inventory) ofDesert Raisins (Pty) Ltd
- - 539 496 367 813
-
Cession of trade and other receivables (BKB, BKBLouwid, BKB VanWyk and Desert Raisins) 280 347 - 147 872 -
- -
180 000 - - -
B K B | A N N U A L R E P O R T 2 0 2 1
S E R V I C E E X C E L L E N C E | E N T R E P R E N E U R S H I P | E A R N I N G S | E M P L O Y E E S | E N V I R O N M E N T
#IntegrityIntegrated
P E O P L E | P L A N E T | P R O F I T
#SustainabilitySynergised69 70
Annual Financial Statements for the year ended 30 June 2021
NOTES TO THE FINANCIAL STATEMENTS
BKB LIMITED AND ITS SUBSIDIARIES(Registration number 1998/012435/06)
19 Borrowings (continued)
Instalment sale agreements
2021 2020 2021 2020R'000 R'000 R'000 R'000
Minimum instalments due- within one year 23 849 23 824 - - - in second to fifth year inclusive 45 321 49 233 - -
69 170 73 057 - - Less: future finance charges (6 892) (7 939) - - Present value of instalments 62 278 65 118 - -
Present value of minimum instalments - within one year 20 356 20 139 - - - in second to fifth year inclusive 41 922 44 979 - -
62 278 65 118 - - Instalment sale securityMotor vehicles 9 049 8 761 - - Plant and machinery 68 180 67 623 - -
77 229 76 384 - -
20 Retirement benefits
Defined benefit plan
2021 2020 2021 2020R'000 R'000 R'000 R'000
Balance at the beginning of the year 6 802 7 402 6 802 7 402 Interest expense 511 616 511 616 Re-measurements - (155) - (155) Contribution payments by employer (1 011) (1 061) (1 011) (1 061) Balance at the end of the year 6 302 6 802 6 302 6 802
The amounts recognised in the income statement are as follows:
Interest cost 511 616 511 616 Re-measurements due to experience adjustments - 28 - 28 Re-measurements due to changes in financial assumptions - (183) - (183)
511 461 511 461
Key assumptions used
Discount rate used 8.11% 8.11% 8.11% 8.11%Increase in medical costs 8.00% 8.00% 8.00% 8.00%
The Company contributes to the medical aid costs of certain of the retired employees. The plan is a post employment medical benefit plan.
Currently medical aid subsidies are payable to 48 pensioners (2020: 48) with an average age of 84.3 years (2020: 84.3). The table used todetermine the mortality rate is "post employment-PA90(2)". The weighted average duration of the defined benefit obligation is 5.2 years.Expected contributions for the year ending 30 June 2022 are R1.1 million.
Actuarial valuations are obtained every three years, the last actuarial valuation was carried out on 30 June 2020. The annual movement inthe balance is analysed as follows:
Instalment sale agreements are payable over periods from 1 to 5 years at prime linked interest rates repayable in monthly instalments ofbetween R5 142 and R1 147 322 (2020: R5 324 and R1 154 713).
Group Company
Refer to Note 36 "Changes in liabilities arising from financing activities" for details of the movement in the borrowings during the reportingperiod and Note 43 "Financial instruments and financial risk management" for the fair value of borrowings.
Group Company
Surety of R16 million signed by BKB Limited for instalment sale facilities in AlphaAlfa (Pty) Ltd and Desert Raisins (Pty) Ltd.
Annual Financial Statements for the year ended 30 June 2021
NOTES TO THE FINANCIAL STATEMENTS
BKB LIMITED AND ITS SUBSIDIARIES(Registration number 1998/012435/06)
20 Retirement benefits (continued)
Number
Defined Benefit
obligation Number
Defined Benefit
obligation R'000 R'000
BKB members 36 3 774 36 4 183 ECAC members 12 2 528 12 2 619
48 6 302 48 6 802
Sensitivity 2021
Change in assumption
2021Change in Obligation
2020Change in
assumption
2020Change in Obligation
Healthcare cost +1% +3.2% +1% +3.2%-1% -3.0% -1% -3.0%
Mortality +1% -5.2% +1% -5.2%-1% +5.7% -1% +5.7%
2021 2020 2021 2020R'000 R'000 R'000 R'000
21 Provisions
Long term provisionsProvision for service bonusBalance at the beginning of the year 8 086 7 148 8 086 7 148 Additions 926 1 428 926 1 428 Utilised during the year (717) (490) (717) (490) Balance at the end of the year 8 295 8 086 8 295 8 086
The sensitivity analyses are based on a change in an assumption while holding all other assumptions constant. In practise this is unlikely tooccur and changes in some of the assumptions may be correlated. When calculating the sensitivity of the defined benefit obligation tosignificant actuarial assumptions, the same method (present value of the defined benefit obligation calculated with the projected unit creditmethod at the end of the reporting period) has been applied.
All risks are managed through the employer’s subsidy policy and are monitored through annual valuations of the liability.
Certain employees are entitled to long service bonuses if certain criteria are met. Provision is made for this eventuality.
Group
5. Future changes in the tax environment: The risk that changes in the tax legislation governing employee benefits may increase the liabilityfor the Company.
3. Open-ended, long-term liability: The risk that the liability may be volatile in the future and uncertain.
2021 2020
The methods and types of assumptions used in preparing the sensitivity analysis did not change compared to the previous period.
Risks involved in maintaining the post employment healthcare obligation:
The risks faced by the Company as a result of the post-employment healthcare obligation can be summarised as follows:
Company
4. Legislative changes: The risk that changes to legislation with respect to the post-employment benefits may increase the liability for theCompany.
As at valuation date, the present value of the defined benefit obligationwas comprised as follows:
1. Inflation: The risk that future healthcare cost inflation as well as CPI inflation are higher than expected and uncontrolled.2. Longevity: The risk that beneficiaries live longer than expected and thus their healthcare benefit is payable for longer than expected.

B K B | A N N U A L R E P O R T 2 0 2 1
S E R V I C E E X C E L L E N C E | E N T R E P R E N E U R S H I P | E A R N I N G S | E M P L O Y E E S | E N V I R O N M E N T
#IntegrityIntegrated
P E O P L E | P L A N E T | P R O F I T
#SustainabilitySynergised71 72
Annual Financial Statements for the year ended 30 June 2021
NOTES TO THE FINANCIAL STATEMENTS
BKB LIMITED AND ITS SUBSIDIARIES(Registration number 1998/012435/06)
2021 2020 2021 2020R'000 R'000 R'000 R'000
22 Trade and other payables
Financial Instruments:Trade creditors 462 759 498 269 191 541 208 263 Accrued bonus 30 249 11 826 20 891 6 569 Accrued leave pay 29 758 27 062 17 345 16 165 Other accrued expenses 23 247 30 428 11 357 17 862 Other payables 27 962 24 200 25 749 21 749 Non-financial Instruments:Amounts received in advance 4 189 2 074 - - VAT 10 048 9 408 - -
588 212 603 267 266 883 270 608
23 Loans from group companies
The House of Fibre (Pty) Ltd - - 530 - Lihoai Consultancy (Pty) Ltd - - 2 887 - BKB Shearing (Pty) Ltd - - 789 1 301 Home and Hectare (Pty) Ltd - - 9 236 8 877 BKB Van Wyk (Pty) Ltd - - 9 144 35 117 Atlanta Sugar SA (Pty) Ltd - - - 141
- - 22 586 45 436
24 Financial liabilities at fair value
At fair value through profit or lossABSA Bank Limited 21 014 24 595 - -
Open forward contracts 42 1 578 - -
21 056 26 173 - - ABSA Bank Limited SecurityGrain inventory 22 892 26 095 - -
25 Value of business conducted
Brokerage services 3 420 684 2 786 615 3 013 612 2 502 136 Trading 1 803 593 1 761 822 1 805 243 1 763 544 Livestock and properties 5 044 777 3 654 548 1 379 383 1 062 376 Technology 25 873 21 000 - - Leasing of properties 5 780 6 306 3 456 3 281 Fruit 347 572 358 039 - - Grain 1 731 607 1 595 573 - - Sugar 805 615 882 555 - - Financing 27 635 34 257 21 962 27 487
13 213 136 11 100 715 6 223 656 5 358 824
Group Company
Comprise open forward contracts. Open positions are valued usingmark-to-market rate of a particular commodity at year end.Commodities traded include soya beans, sunflower seeds, wheat,white maize and yellow maize.
The value of business conducted represents the value of transactions for the Group as well as those conducted in its capacity as anagent/broker.
Loans from subsidiaries are payable on demand and interest ischarged at the prime related interest rate.
Commodities are financed by ABSA in the form of a loan. The loan iscalculated on the short position that the Company transferred toABSA. The carrying value of the loan changes with respect to themark-to-market value of the SAFEX commodities. The loan isrepayable as the short positions on SAFEX close. This loan is securedby the value of the inventory and bears interest at a rate linked toprime.
Annual Financial Statements for the year ended 30 June 2021
NOTES TO THE FINANCIAL STATEMENTS
BKB LIMITED AND ITS SUBSIDIARIES(Registration number 1998/012435/06)
2021 2020 2021 2020R'000 R'000 R'000 R'000
26 Revenue
Revenue from contracts with customersSale of goods 4 901 799 4 443 512 2 410 294 2 164 306 Rendering of services 257 750 233 391 180 280 164 827 Commissions received 351 927 274 714 162 221 136 111 Interest received 27 635 34 257 21 962 27 487
5 868 6 306 3 456 3 281 5 544 979 4 992 180 2 778 213 2 496 012
Sale of goodsBrokerage services 754 415 500 173 614 171 408 504 Trading 1 795 697 1 754 105 1 796 123 1 755 802 Technology 25 081 20 638 - - Fruit 347 034 351 965 - - Grain 1 173 958 934 075 - - Sugar 805 614 882 556 - -
4 901 799 4 443 512 2 410 294 2 164 306
Rendering of servicesBrokerage services 174 794 160 455 172 384 157 110 Trading 7 896 7 717 7 896 7 717 Technology 796 362 - - Fruit 539 6 074 - - Grain 73 725 58 783 - -
257 750 233 391 180 280 164 827
Commissions receivedBrokerage services 125 754 106 466 111 361 96 433 Livestock and properties 225 952 167 925 50 860 39 678 Grain 221 323 - -
351 927 274 714 162 221 136 111
Other revenueInterest received 27 635 34 257 21 962 27 487 Rental income 5 868 6 306 3 456 3 281
33 503 40 563 25 418 30 768
Total revenue from contracts with customers 5 544 979 4 992 180 2 778 213 2 496 012
Timing of revenue recognition
At a point in timeSale of goods 4 901 799 4 443 512 2 410 294 2 164 306 Commissions received 351 927 274 714 162 221 136 111
5 253 726 4 718 226 2 572 515 2 300 417
Over timeRendering of services 257 750 233 391 180 280 164 827 Interest received 27 635 34 257 21 962 27 487 Rental income 5 868 6 306 3 456 3 281
291 253 273 954 205 698 195 595
Total revenue from contracts with customers 5 544 979 4 992 180 2 778 213 2 496 012
Group Company
Disaggregation of revenue from contracts with customers
Rental income

B K B | A N N U A L R E P O R T 2 0 2 1
S E R V I C E E X C E L L E N C E | E N T R E P R E N E U R S H I P | E A R N I N G S | E M P L O Y E E S | E N V I R O N M E N T
#IntegrityIntegrated
P E O P L E | P L A N E T | P R O F I T
#SustainabilitySynergised73 74
Annual Financial Statements for the year ended 30 June 2021
NOTES TO THE FINANCIAL STATEMENTS
BKB LIMITED AND ITS SUBSIDIARIES(Registration number 1998/012435/06)
2021 2020 2021 2020R'000 R'000 R'000 R'000
27 Cost of sales
Sale of goods 4 389 925 4 020 683 2 135 197 1 945 544
Sale of goodsBrokerage services 667 521 453 666 530 014 365 048 Trading 1 604 756 1 578 799 1 605 183 1 580 496 Technology 17 649 13 080 - - Fruit 305 011 329 757 - - Grain 1 075 221 840 299 - - Sugar 719 767 805 082 - -
4 389 925 4 020 683 2 135 197 1 945 544
28 Other operating income
Profit on sale of property 152 - 152 - Profit on sale of plant and equipment - 2 780 39 - Bad debts recovered 3 449 3 216 3 334 2 163 Reversal of impairment loss 1 825 - - - Cash discounts received 7 814 7 640 7 737 7 354 Foreign exchange gains 19 861 18 582 1 129 725 Other 16 845 10 599 5 168 6 778
49 946 42 817 17 559 17 020
29 Operating profit
Operating profit for the year is stated after charging/(crediting) the following, amongst others:
2021 2020 2021 2020R'000 R'000 R'000 R'000
Auditor's remuneration - external 4 078 5 347 2 123 2 126 Approved audit fees 4 064 3 890 1 909 1 855 Adjustment for previous year (205) 1 227 82 184 Tax and advisory services 219 230 132 87
Employee costs 511 584 467 457 286 948 252 037 Salaries, wages, bonuses and other benefits 451 676 414 040 267 544 231 895 Commission paid 39 526 30 543 8 418 6 946 Training and other expenses 12 015 13 609 6 590 8 294 Provision for service bonus 926 1 428 926 1 428 Retirement benefit plans: defined contribution expense 6 930 7 376 2 959 3 013 Retirement benefit plans: defined benefit expense Finance expense 511 616 511 616 Remeasurements - (155) - (155)
Group Company
Group Company
Annual Financial Statements for the year ended 30 June 2021
NOTES TO THE FINANCIAL STATEMENTS
BKB LIMITED AND ITS SUBSIDIARIES(Registration number 1998/012435/06)
29 Operating profit (continued)
Expenses by nature
2021 2020 2021 2020R'000 R'000 R'000 R'000
Advertising expense 16 145 18 869 9 676 10 624 Auditors remuneration 3 859 5 117 1 991 2 039 Bank charges 16 818 14 382 10 683 9 867 Commission paid 29 837 12 418 25 508 6 165 Computer expenses 26 890 22 870 22 006 17 409 Depreciation and amortisation 42 122 41 092 24 921 20 843 Discount allowed 67 500 57 998 28 969 24 221 Employee costs 511 584 467 457 286 948 252 037 Foreign exchange losses 562 2 179 543 494 Impairment of intangible assets - 15 775 - - Impairment of financial assets 12 012 11 873 6 418 4 755 Insurance cost net of recoveries 7 746 7 411 (128) (87) Lease charges 18 485 17 738 4 295 3 902 Legal expenses 3 364 3 078 2 593 1 878 Loss from equity accounted investments 238 - - - Loss on sale of plant and equipment 654 - - 169 Losses on products 10 539 8 072 4 921 6 602 Management fees - - 47 236 59 205 Non-executive directors' fees 3 153 3 317 3 153 3 317 Pressing and storage costs 23 016 14 425 12 280 9 687 Professional consulting fees 10 682 9 903 13 750 4 958 Property tax 5 179 4 855 4 286 3 997 Repairs and maintenance 35 807 30 266 15 468 16 905 Security 8 974 6 634 3 392 2 382 Shearing food allowance 6 225 8 131 6 225 8 131 Subsistence and travel 10 122 11 787 5 766 6 069 Telephone and postage 11 037 11 078 6 372 6 074 Transport 86 778 78 909 5 550 3 344 Vehicle costs 41 912 40 515 27 017 26 530 Water and electricity 13 178 12 138 10 981 9 811 Other 32 714 29 675 27 438 23 805
1 057 132 967 962 618 258 545 133 Less: Discount allowed set off against revenue (67 500) (57 998) (28 969) (24 221)
989 632 909 964 589 289 520 912
30 Finance income
Bank and other cash 4 249 3 236 2 696 1 053 Other financial assets 903 605 538 524 Loans to group companies:Subsidiaries - - 29 780 40 384
5 152 3 841 33 014 41 961
31 Finance costs
Interest paid 65 021 83 497 49 637 64 810 Interest paid leases 6 648 5 926 4 258 3 261 Loans from group companies:Subsidiaries - - 1 262 -
71 669 89 423 55 157 68 071
The total selling and distribution expenses, marketing expenses, general and administrative expenses, research and development expenses,maintenance expenses and other operating expenses are analysed by nature as follows:
Group Company
B K B | A N N U A L R E P O R T 2 0 2 1
S E R V I C E E X C E L L E N C E | E N T R E P R E N E U R S H I P | E A R N I N G S | E M P L O Y E E S | E N V I R O N M E N T
#IntegrityIntegrated
P E O P L E | P L A N E T | P R O F I T
#SustainabilitySynergised75 76
Annual Financial Statements for the year ended 30 June 2021
NOTES TO THE FINANCIAL STATEMENTS
BKB LIMITED AND ITS SUBSIDIARIES(Registration number 1998/012435/06)
2021 2020 2021 2020R'000 R'000 R'000 R'000
32 Taxation
CurrentLocal income tax - current period 55 792 24 337 21 907 5 072 Local income tax - recognised in current tax for prior periods 14 - 14 - STC 720 473 159 7
56 526 24 810 22 080 5 079 DeferredOriginating and reversing temporary differences (10 362) (14 610) (8 048) (552) Arising from prior period adjustments (2 230) - (2 229) -
(12 592) (14 610) (10 277) (552)
43 934 10 200 11 803 4 527
Reconciliation of the tax expense
Accounting profit 148 851 18 768 67 580 40 487
Tax at the applicable tax rate of 28% (2020: 28%) 41 678 5 255 18 922 11 336
Tax effect of adjustments on taxable incomeUnder provision - prior year 14 (13) 14 - Deferred taxation - prior year (2 309) (693) (2 229) - Exempt income and allowable deductions (593) (2 212) (5 731) (7 502) Expenses not deductible for tax purposes 1 626 2 655 1 507 1 517 Securities transfer tax 719 473 159 7 Current tax recognised in other comprehensive income - (55) - - Special income tax allowances (1 009) (1 100) (936) (851) Income taxed at capital gains tax rate 97 141 97 20 Income taxed at different rate (123) 70 - - Deferred tax asset not raised 197 (103) - - Assessed loss not recognised 3 637 5 916 - - Recognition of assessed loss - (134) - -
43 934 10 200 11 803 4 527 Estimated tax losses carried forwardEstimated tax losses to be set off against future taxable profit 252 280 209 202 - -
33 Earnings per share
Basic earnings per share
2021 2020 2021 2020Basic earnings per shareBasic earnings per share (c per share) 133.3 19.4 - -
2021 2020 2021 2020R'000 R'000 R'000 R'000
Reconciliation of profit for the year to basic earningsProfit for the year attributable to equity holders of the parent 104 917 8 568 - - Adjusted for: - - Non-controlling interest 206 6 735 - -
105 123 15 303 - -
The calculation of basic earnings per share is based on earnings attributable to ordinary shareholders, divided by the weighted averagenumber of ordinary shares in issue during the year.
Basic earnings per share was based on earnings of R105 123 000 (2020: R15 303 000) and a weighted average number of ordinary sharesof 78 855 223 (2020:78 855 223).
Group Company
Group Company
Group Company
Annual Financial Statements for the year ended 30 June 2021
NOTES TO THE FINANCIAL STATEMENTS
BKB LIMITED AND ITS SUBSIDIARIES(Registration number 1998/012435/06)
33 Earnings per share (continued)
Diluted earnings per share
2021 2020 2021 2020Diluted earnings per shareDiluted earnings per share (c per share) 133.3 19.4 - -
2021 2020 2021 2020R'000 R'000 R'000 R'000
Reconciliation of basic earnings to diluted earningsBasic earnings (no adjustments) 105 123 15 303 - -
Reconciliation of weighted average number of ordinary shares to diluted sharesWeighted average number of ordinary shares used for basic earnings per share 78 855 78 855 - -
2021 2020 2021 2020
Headline earnings per share (c) 132.3 36.9 - - Diluted headline earnings per share (c) 132.3 36.9 - -
2021 2020 2021 2020R'000 R'000 R'000 R'000
Reconciliation between earnings and headline earningsBasic earnings 105 123 15 303 - - Adjusted for:Net loss/(profit) on sale of property, plant and equipment 502 (2 780) - - Reversal of impairment loss (1 825) - - - Fair value losses on investment property 205 - - - Impairment of intangible assets - 15 775 - - Tax effect of adjustments 313 778 - -
104 318 29 076 - -
Reconciliation between diluted earnings and dilutedheadline earningsDiluted earnings 105 123 15 303 - - Adjusted for:Net loss/(profit) on sale of property, plant and equipment 502 (2 780) - - Reversal of impairment loss (1 825) - - - Fair value losses on investment property 205 - - - Impairment of intangible assets - 15 775 - - Tax effect of adjustments 313 778 - -
104 318 29 076 - -
CompanyGroup
Group Company
Diluted earnings per share was based on earnings of R105 123 000 (2020: R15 303 000) and a weighted average number of ordinary sharesof 78 855 223 (2020: 78 855 223).
Headline earnings and diluted headline earnings per share
Headline earnings per share and diluted headline earnings per share are determined by dividing headline earnings and diluted headlineearnings by the weighted average number of ordinary share outstanding during a period.
Headline earnings and diluted headline earnings are determined by adjusting basic earnings and diluted earnings by excluding separatelyidentifiable re-measurement items. Headline earnings and diluted headline earnings are presented after tax and non-controlling interest.
Group Company
Group Company
The calculation of diluted earnings per share is based on the earnings attributable to ordinary shareholders, divided by the weighted averagenumber of ordinary shares in issue during the year, plus the weighted average number of dilutive potential shares resulting from shareoptions.

B K B | A N N U A L R E P O R T 2 0 2 1
S E R V I C E E X C E L L E N C E | E N T R E P R E N E U R S H I P | E A R N I N G S | E M P L O Y E E S | E N V I R O N M E N T
#IntegrityIntegrated
P E O P L E | P L A N E T | P R O F I T
#SustainabilitySynergised77 78
Annual Financial Statements for the year ended 30 June 2021
NOTES TO THE FINANCIAL STATEMENTS
BKB LIMITED AND ITS SUBSIDIARIES(Registration number 1998/012435/06)
33 Earnings per share (continued)
2021 2020 2021 2020Dividends per share
Final (c) 5.0 10.0 - -
2021 2020 2021 2020R'000 R'000 R'000 R'000
34 Cash generated from operations
Profit before taxation 148 851 18 768 67 580 40 487 Adjustments for:Depreciation and amortisation 67 158 65 872 24 921 20 843 Dividend income - - (18 437) (20 021) Finance income (5 152) (3 841) (33 014) (41 961) Finance costs 71 669 89 423 55 157 68 071 Share based payment expense 3 094 - 2 803 - Fair value gains (20 382) (21 936) - - Fair value losses on investment property 205 - 205 - Reversal of impairment loss (1 825) - 168 - Loss from equity accounted investments 238 - - - Impairment of intangible assets - 15 775 - - Increase/(decrease) in impairment of financial assets 5 947 (1 861) 2 716 (457) Movement in provision for obsolete stock 1 310 (506) (12) (293) Movement in retirement benefit liability (500) (600) (500) (600) Movement in provision for service bonus 209 938 209 938 Loss/(profit) on sale of property, plant and equipment 502 (2 780) (191) 169
Changes in working capitalDecrease/(increase) in inventories 38 934 96 476 (46 066) (13 611) (Increase)/decrease in current trade and other receivables (11 784) (109 364) 101 413 (95 967) Increase in derivative financial instruments 15 074 972 198 285 Increase/(decrease) in cash flow hedge reserve 15 513 (14 106) - - (Decrease)/increase in trade and other payables (15 055) 152 317 (3 725) 56 277
314 006 285 547 153 425 14 160
35 Tax paid
Balance receivable at the beginning of the year 1 886 4 037 1 751 1 572 Charged to profit or loss (56 526) (24 810) (22 080) (5 079) Balance payable/(receivable) at the end of the year 1 139 (1 886) 230 (1 751)
(53 501) (22 659) (20 099) (5 258)
Group Company
Group Company
Dividends amounting to R4 million (2020: R9 million) were paid to shareholders of the Company who were registered on 30 August 2020.
Annual Financial Statements for the year ended 30 June 2021
NOTES TO THE FINANCIAL STATEMENTS
36 Changes in liabilities arising from financing activities
Reconciliation of liabilities arising from financing activities set out below:
Borrowings
Other financial assets/
liabilities
Leases Total share capital Total
R'000 R'000 R'000 R'000 R'000Group - 2021
Opening balance 794 182 25 856 59 720 102 657 982 415 - - 33 022 - 33 022
Leases terminated - - (36) - (36) Classified as held for sale - - (9 319) - (9 319) Fair value changes - (20 382) - - (20 382) Cash flows - cash credit accounts (114 766) - - - (114 766) Cash flows (15 382) (5 118) (11 138) - (31 638) Closing balance 664 034 356 72 249 102 657 839 296
Group - 2020
Opening balance 856 082 74 461 - 102 720 1 033 263 - - 62 007 - 62 007
Fair value changes - (21 936) - - (21 936) Acquisitions - leases - - 5 549 - 5 549
(60 000) - - - (60 000) Cash flows (1 900) (26 669) (7 836) (63) (36 468) Closing balance 794 182 25 856 59 720 102 657 982 415
Company - 2021
Opening balance 676 430 - 34 897 202 003 913 330 Acquisitions - leases - - 18 482 - 18 482 Leases terminated - - (36) - (36) Classified as held for sale - - (9 319) - (9 319)
(114 766) - - - (114 766) Cash flows (19 953) - (3 713) - (23 666) Closing balance 541 711 - 40 311 202 003 784 025
Company - 2020
Opening balance 746 573 - - 202 003 948 576 - - 34 510 - 34 510 - - 1 772 - 1 772
(60 000) - - - (60 000) Cash flows (10 143) - (1 385) - (11 528) Closing balance 676 430 - 34 897 202 003 913 330
BKB LIMITED AND ITS SUBSIDIARIES(Registration number 1998/012435/06)
Acquisitions - leases
Other changes include non-cash movements, including accrued interest expense which will be presented as operating cash flows in thestatement of cash flows when paid.
Cash flows - cash credit accounts
Cash flows - cash credit accounts
Cash flows - cash credit accounts
Recognised on adoption of IFRS 16
Recognised on adoption of IFRS 16 Acquisitions - leases

B K B | A N N U A L R E P O R T 2 0 2 1
S E R V I C E E X C E L L E N C E | E N T R E P R E N E U R S H I P | E A R N I N G S | E M P L O Y E E S | E N V I R O N M E N T
#IntegrityIntegrated
P E O P L E | P L A N E T | P R O F I T
#SustainabilitySynergised79 80
Annual Financial Statements for the year ended 30 June 2021
NOTES TO THE FINANCIAL STATEMENTS
2021 2020 2021 2020R'000 R'000 R'000 R'000
37 Dividends paid
Dividends (3 943) (7 886) (4 420) (8 841)
38 Business combinations
Solomons & Crafford
2021 2020 2021 2020R'000 R'000 R'000 R'000
Fair value of assets acquired and liabilities assumedClient lists and relationships - 1 500 - - Property, plant and equipment - 100 - - Total identifiable net assets - 1 600 - - Goodwill - - - -
- 1 600 - -
Acquisition date fair value of consideration paid
Cash - (1 600) - -
39 Contingencies
2021 2020 2021 2020R'000 R'000 R'000 R'000
Contingent liabilitiesGuarantees issued 670 670 670 670
No losses are expected from these contingent liabilities.
2021 2020 2021 2020R'000 R'000 R'000 R'000
40 Commitments
Authorised capital expenditureNot yet contracted for and authorised by directors 113 729 89 896 56 596 48 978
BKB LIMITED AND ITS SUBSIDIARIES(Registration number 1998/012435/06)
Group Company
On 1 March 2020 the Group acquired the business of Solomons & Crafford (excluding liabilities).
Company
During 2021 BKB Limited signed a guarantee of R 20 million in respect of the new auction facilities in Hoëveld Veilingsentrum (Pty) Ltd. At30 June 2021 the Company has no present obligation as the loan has not yet been drawn down.
Group Company
Group Company
The Lesotho Revenue Authority, with whom South Africa has a double taxation agreement, raised income tax and value added taxassessments for BKB Limited in respect of income tax and value added tax for multiple years of assessment during 2019. The Companyconsulted with it's professional advisors and contested the assessments. The value added tax assessment was resolved during 2020. Theincome tax assessment was resolved during 2021.
Capital expenditure will be financed by funds generated by the businesses, existing cash resources and borrowing facilities available to theGroup and need appropriate support and justification before final approval.
Group
Annual Financial Statements for the year ended 30 June 2021
NOTES TO THE FINANCIAL STATEMENTS
BKB LIMITED AND ITS SUBSIDIARIES(Registration number 1998/012435/06)
2021 2020 2021 2020R'000 R'000 R'000 R'000
41 Related parties
RelationshipsSubsidiaries (refer to Note 7)
Related party balances
Loan accounts - Owing by related partiesLoans to key management 9 081 8 833 85 86
Amounts included in trade receivables/(trade payables)regarding related partiesGrainco (Pty) Ltd - - (1 952) (21) BKBLouwid (Pty) Ltd - - 554 624 BKB Van Wyk (Pty) Ltd - - 421 462 Shift Digital Acceleration (Pty) Ltd - - (357) (309) Atlanta Sugar SA (Pty) Ltd - - 36 83 Atlanta Products (Pty) Ltd - - 6 99 AlphaAlfa (Pty) Ltd - - (82) 374 Desert Raisins (Pty) Ltd - - 265 292 RFID Africa Experts (Pty) Ltd - - (50) (61) BKB Personnel Share Trust - - 102 659 102 768 Key management 1 214 678 1 214 678
Related party transactions
Interest received from/(paid) to related partiesBillsons Coutts (Pty) Ltd - - 630 914 BKB Distribution Centre (Pty) Ltd 6 - The House of Fibre (Pty) Ltd - - 690 1 130 Home and Hectare (Pty) Ltd - - (350) (607) Hoëveld Veilingsentrum (Pty) Ltd - - 423 - BKBLouwid (Pty) Ltd - - 2 710 752 BKB Van Wyk (Pty) Ltd - - (892) (684) Shift Digital Acceleration (Pty) Ltd - - 678 333 RFID Africa Experts (Pty) Ltd - - 1 534 - Wool & Mohair Exchange of South Africa NPC - - 431 567 PaKHouse Brands (Pty) Ltd - - 274 269 Atlanta Sugar SA (Pty) Ltd - - 25 301 Grainco Group Holdings (Pty) Ltd - - 9 097 10 149 AlphaAlfa (Pty) Ltd - - 421 - Desert Raisins (Pty) Ltd - - 12 469 26 103 BKB Personnel Share Trust - - 374 1 157 Key management 374 1 157 - -
Sales to/(purchases from) related partiesThe House of Fibre (Pty) Ltd - - (59 155) (38 269) RFID Africa Experts (Pty) Ltd - - (2 246) (419) Atlanta Sugar SA (Pty) Ltd - - 274 453 AlphaAlfa (Pty) Ltd - - (4 308) (8 257) Grainco (Pty) Ltd - - (8 968) (22 057) Transactions with key management and directors 6 679 8 758 6 679 8 758
Rent (paid to)/received from related partiesBillsons Coutts (Pty) Ltd - - (238) (362) Home and Hectare (Pty) Ltd - - 40 38 BKBLouwid (Pty) Ltd - - 316 301 BKB Van Wyk (Pty) Ltd - - 142 101 Shift Digital Acceleration (Pty) Ltd - - 25 - Wool & Mohair Exchange of South Africa NPC - - (304) (289)
Group Company

B K B | A N N U A L R E P O R T 2 0 2 1
S E R V I C E E X C E L L E N C E | E N T R E P R E N E U R S H I P | E A R N I N G S | E M P L O Y E E S | E N V I R O N M E N T
#IntegrityIntegrated
P E O P L E | P L A N E T | P R O F I T
#SustainabilitySynergised81 82
Annual Financial Statements for the year ended 30 June 2021
NOTES TO THE FINANCIAL STATEMENTS
BKB LIMITED AND ITS SUBSIDIARIES(Registration number 1998/012435/06)
2021 2020 2021 2020R'000 R'000 R'000 R'000
41 Related parties (continued)
Services received from related partiesThe House of Fibre (Pty) Ltd - - (6 399) (3 449) Shift Digital Acceleration (Pty) Ltd - - (2 829) (698) Lihoai Consultancy (Pty) Ltd - - (6 664) -
Management fees (paid to)/received from related partiesBKB Shearing (Pty) Ltd - - (46 332) (58 538) RFID Africa Experts (Pty) Ltd - - (904) (667) Wool & Mohair Exchange of South Africa NPC - - 350 300
Dividends received from related partiesHome and Hectare (Pty) Ltd - - 1 058 19 BKBLouwid (Pty) Ltd - - 2 221 7 064 BKB Van Wyk (Pty) Ltd - - 2 787 4 502 PaKHouse Brands (Pty) Ltd - - 12 371 8 436
Rebate fees receivedHome and Hectare (Pty) Ltd - - 105 147
Compensation to directors and other key managementShort-term employee benefits 40 811 30 931 31 742 22 459 Termination benefits 191 892 - 892 Share-based payment 2 114 (4 837) 2 060 (3 965) Non-executive directors fees and expenses reimbursed 3 304 3 503 3 304 3 503
46 420 30 489 37 106 22 889
Group Company
Annual Financial Statements for the year ended 30 June 2021
NOTES TO THE FINANCIAL STATEMENTS
42 Directors' emoluments
2021 Fees
Salary & employee benefits
Expense reimbursed
Termination benefit Total
R'000 R'000 R'000 R'000 R'000JE Stumpf - 6 071 8 - 6 079 AS du Toit - 3 079 24 - 3 103 JA van Niekerk - 3 600 - - 3 600 DC Louw 292 - 8 - 300 GEJ Kingwill 581 - 40 - 621 PG Carshagen 236 - 6 - 242 CD Hobson 260 - 20 - 280 JF Janse van Rensburg 283 - 12 - 295 MH Jonas 236 - 6 - 242 EA Meyer 283 - 17 - 300 V Pillay 260 - 2 - 262 HC Staple 381 - 2 - 383 HJ Swart 341 - 38 - 379
3 153 12 750 183 - 16 086
2020 Fees
Salary & employee benefits
Expense reimbursed
Termination benefit Total
R'000 R'000 R'000 R'000 R'000JE Stumpf - 2 123 6 - 2 129 W Edmayr - 3 550 - 892 4 442 AS du Toit - 3 000 53 - 3 053 JA van Niekerk - 500 - - 500 DC Louw 700 - 43 - 743 GEJ Kingwill 371 - 49 - 420 PG Carshagen 230 - 8 - 238 CD Hobson 253 - 25 - 278 JF Janse van Rensburg 253 - - - 253 MH Jonas 230 - 4 - 234 EA Meyer 276 - 20 - 296 V Pillay 242 - 6 - 248 HC Staple 371 - - - 371 HJ Swart 276 - 24 - 300 FPR van Wyk 115 - 7 - 122
3 317 9 173 245 892 13 627
Service contracts
Share awards allocated to executive directors
2021 JE Stumpf AS du Toit JA van Niekerk
Cumulative number of shares at 1 July 2020 - - - Annual award of performance shares 34 160 11 976 11 460 Annual award of bonus shares 69 742 19 915 29 918 Cumulative number of shares at 30 June 2021 103 902 31 891 41 378
Johan Edmund Stumpf was appointed as Managing Director on 1 February 2020 on a fixed term contract that will expire on 31 August 2025.All non-executive directors get re-elected at the annual general meeting after their three year term has expired.
Executive directors are subject to written employment agreements. The employment agreements regulate duties, remuneration, allowances,restraints, leave and notice periods of these executives.
BKB LIMITED AND ITS SUBSIDIARIES(Registration number 1998/012435/06)
The BKB Limited 2021 Bonus and Performance Share Entitlement Plan was introduced during the 2021 financial year, set out below are thenumber of shares allocated to executive directors during the financial year.

B K B | A N N U A L R E P O R T 2 0 2 1
S E R V I C E E X C E L L E N C E | E N T R E P R E N E U R S H I P | E A R N I N G S | E M P L O Y E E S | E N V I R O N M E N T
#IntegrityIntegrated
P E O P L E | P L A N E T | P R O F I T
#SustainabilitySynergised83 84
Annual Financial Statements for the year ended 30 June 2021
NOTES TO THE FINANCIAL STATEMENTS
43 Financial instruments and risk management
43.1 Categories of financial instruments
Categories of financial assets
Notes Fair value
through profit or loss
Amortised cost Total
R'000 R'000 R'000Group - 2021Derivatives 13 1 004 - 1 004 Trade and other receivables 10 - 826 876 826 876 Cash and cash equivalents 15 - 69 348 69 348 Other financial assets 14 20 700 - 20 700
21 704 896 224 917 928
Group - 2020Derivatives 13 13 381 - 13 381 Trade and other receivables 10 - 825 869 825 869 Cash and cash equivalents 15 - 75 139 75 139 Other financial assets 14 317 - 317
13 698 901 008 914 706
Company - 2021Loans to group companies 9 - 398 719 398 719 Trade and other receivables 10 - 431 567 431 567 Cash and cash equivalents 15 - 1 488 1 488
- 831 774 831 774
Company - 2020Loans to group companies 9 - 407 091 407 091 Trade and other receivables 10 - 528 586 528 586 Cash and cash equivalents 15 - 47 227 47 227
- 982 904 982 904
Categories of financial liabilities
Notes Fair value
through profit or loss
Amortised cost Total
R'000 R'000 R'000Group - 2021Derivatives 13 8 566 - 8 566 Trade and other payables 22 - 573 975 573 975 Borrowings 19 - 664 034 664 034 Lease liabilities 3 - 72 249 72 249 Financial liabilities at fair value 24 21 056 - 21 056 Bank overdraft 15 - 122 940 122 940
29 622 1 433 198 1 462 820
Group - 2020Derivatives 13 5 869 - 5 869 Trade and other payables 22 - 591 785 591 785 Borrowings 19 - 794 182 794 182 Lease liabilities 3 - 59 720 59 720 Financial liabilities at fair value 24 26 173 - 26 173 Bank overdraft 15 - 72 569 72 569
32 042 1 518 256 1 550 298
BKB LIMITED AND ITS SUBSIDIARIES(Registration number 1998/012435/06)
Annual Financial Statements for the year ended 30 June 2021
NOTES TO THE FINANCIAL STATEMENTS
BKB LIMITED AND ITS SUBSIDIARIES(Registration number 1998/012435/06)
43 Financial instruments and risk management (continued)
43.1 Categories of financial instruments (continued)
Notes Fair value
through profit or loss
Amortised cost Total
R'000 R'000 R'000Company - 2021Trade and other payables 22 - 266 883 266 883 Loans from group companies 23 - 22 586 22 586 Borrowings 19 - 541 711 541 711 Lease liabilities 3 - 40 311 40 311 Derivatives 13 483 - 483 Bank overdraft 15 - 1 546 1 546
483 873 037 873 520 Company - 2020Trade and other payables 22 - 270 608 270 608 Loans from group companies 23 - 45 436 45 436 Borrowings 19 - 676 430 676 430 Lease liabilities 3 - 34 897 34 897 Derivatives 13 285 - 285
285 1 027 371 1 027 656
43.2 Capital risk management
The capital structure and gearing ratio of the Group at the reporting date was as follows:
2021 2020 2021 2020R'000 R'000 R'000 R'000
Loans from group companies - - 22 586 45 436 Financial liabilities at fair value 21 056 26 173 - - Borrowings 664 034 794 182 541 711 676 430 Lease liabilities 72 249 59 720 40 311 34 897 Total borrowings 757 339 880 075 604 608 756 763 Cash and cash equivalents 53 592 (2 570) 58 (47 227) Net borrowings 810 931 877 505 604 666 709 536
Equity 1 287 467 1 175 306 1 098 855 1 044 254
Debt/equity ratio 63% 75% 55% 68%
The Group's objective when managing capital (which includes share capital, borrowings, working capital and cash and cash equivalents)is to maintain a flexible capital structure that reduces the cost of capital to an acceptable level of risk and to safeguard the Group's abilityto continue as a going concern while taking advantage of strategic opportunities in order to maximise stakeholder returns sustainably.
The Group manages its capital structure and makes adjustments to it in light of changes in economic conditions and the riskcharacteristics of the underlying assets. In order to maintain the capital structure, the Group may adjust the amount of dividends paid tothe shareholders, return capital to the shareholders, repurchase shares currently issued, issue new shares, issue new debt, issue newdebt to replace existing debt with different characteristics and/or sell assets to reduce debt.
The Group monitors capital utilising a number of measures, including the gearing ratio. The gearing ratio is calculated as net borrowings(total borrowings less cash) divided by shareholders' equity.
Group Company

B K B | A N N U A L R E P O R T 2 0 2 1
S E R V I C E E X C E L L E N C E | E N T R E P R E N E U R S H I P | E A R N I N G S | E M P L O Y E E S | E N V I R O N M E N T
#IntegrityIntegrated
P E O P L E | P L A N E T | P R O F I T
#SustainabilitySynergised85 86
Annual Financial Statements for the year ended 30 June 2021
NOTES TO THE FINANCIAL STATEMENTS
BKB LIMITED AND ITS SUBSIDIARIES(Registration number 1998/012435/06)
43 Financial instruments and risk management (continued)
43.3 Financial risk management
Overview
The Group is exposed to the following risks from its use of financial instruments:Credit risk;Liquidity risk; andMarket risk (currency risk, interest rate risk and price risk).
i. Credit risk
The board has overall responsibility for the establishment and oversight of the Group's risk management framework. The board hasestablished the Audit and Risk Committee, which is responsible for developing and monitoring the Group's risk management policies. Thecommittee reports quarterly to the board on its activities.
The Group's risk management policies are established to identify and analyse the risks faced by the Group, to set appropriate risk limitsand controls, and to monitor risks and adherence to limits. Risk management policies and systems are reviewed regularly to reflectchanges in market conditions and the Group's activities.
Credit risk for exposures other than those arising on cash and cash equivalents, are managed by making use of credit approvals, limitsand monitoring. Sufficient collateral or guarantees are also obtained when necessary. Each counterparty is analysed individually forcreditworthiness before terms and conditions are offered. The analysis involves making use of information submitted by the counterpartiesas well as external bureau data (where available). Counterparty credit limits are in place and are reviewed and approved by creditmanagement committees. The exposure to credit risk and the creditworthiness of counterparties is continuously monitored.
Credit risk exposure arising on cash and cash equivalents is managed by the Group through dealing with well-established financialinstitutions with high credit ratings.
Credit loss allowances for expected credit losses are recognised for all debt instruments, but excluding those measured at fair valuethrough profit or loss.
In order to calculate credit loss allowances, management determine whether the loss allowances should be calculated on a 12 month oron a lifetime expected credit loss basis. This determination depends on whether there has been a significant increase in the credit risksince initial recognition. If there has been a significant increase in credit risk, then the loss allowance is calculated based on lifetimeexpected credit losses. If not, then the loss allowance is based on 12 month expected credit losses. This determination is made at the endof each financial period. Thus the basis of the loss allowance for a specific financial asset could change year on year.
Management apply the principle that if a financial asset's credit risk is low at year end, then, by implication, the credit risk has notincreased significantly since initial recognition. In all such cases, the loss allowance is based on 12 month expected credit losses. Creditrisk is assessed as low if there is a low risk of default. When determining the risk of default, management consider information such aspayment history to date, industry in which the customer is engaged, period for which the customer has been in business, external creditreferences etc. Credit risk is not assessed to be low simply because of the value of collateral associated with a financial instrument. If theinstrument would not have a low credit risk in the absence of collateral, then the credit risk is not considered low when taking the collateralinto account. Trade receivable which do not contain a significant financing component are the exceptions and are discussed below.
The Group Audit and Risk Committee oversees how management monitors compliance with the risk management policies andprocedures and reviews the adequacy of the risk management framework in relation to the risks faced by the Group. The Group's riskexposure are considered by the committee on a quarterly basis.
Credit risk is the risk of financial loss to the Group if a customer or counterparty to a financial instrument fails to meet its contractualobligations.
The Group is exposed to credit risk on loans receivable, debt instruments at fair value through other comprehensive income, trade andother receivables, cash and cash equivalents, loan commitments and financial guarantees.
Annual Financial Statements for the year ended 30 June 2021
NOTES TO THE FINANCIAL STATEMENTS
BKB LIMITED AND ITS SUBSIDIARIES(Registration number 1998/012435/06)
43 Financial instruments and risk management (continued)
43.3 Financial risk management (continued)
i. Credit risk (continued)
NotesGross
carryingamount
Credit lossallowance
Amortisedcost / fair
valueGroup - 2021Trade and other receivables 10 809 652 (19 852) 789 800 Cash and cash equivalents 15 69 348 - 69 348
879 000 (19 852) 859 148
Group - 2020Trade and other receivables 10 810 142 (13 905) 796 237 Cash and cash equivalents 15 75 139 - 75 139
885 281 (13 905) 871 376
Company - 2021Loans to group companies 9 406 626 (7 907) 398 719 Trade and other receivables 10 319 826 (9 372) 310 454 Cash and cash equivalents 15 1 488 - 1 488
727 940 (17 279) 710 661
Company - 2020Loans to group companies 9 412 394 (5 303) 407 091 Trade and other receivables 10 408 743 (6 656) 402 087 Cash and cash equivalents 15 47 227 - 47 227
868 364 (11 959) 856 405
ii. Liquidity risk
Amounts are presented at amortised cost or fair value depending on the accounting treatment of the item presented. The gross carryingamount for debt instruments at fair value through other comprehensive income is equal to the fair value because the credit loss allowancedoes not reduce the carrying amount. The credit loss allowance is only shown for disclosure purposes. Debt instruments at fair valuethrough profit or loss do not include a loss allowance. The fair value is therefore equal to the gross carrying amount.
Where necessary, the assessment for a significant increase in credit risk is made on a collective basis. Management typically adopt thisapproach when information relevant to the determination of credit risk is not available on an individual instrument level. Often, the onlyinformation available on individual instruments which could indicate an increase in credit risk, is "past due" information. It is typical thatmore forward-looking information is generally more readily available on a collective basis. Therefore, making the determination on acollective basis, helps to ensure that credit loss allowances are determined on the basis of lifetime expected credit losses before theyreach the point of being past due. Forward looking, macro-economic information is applied on a collective basis when it is readily availablewithout undue cost or effort. When loss allowances are determined on a collective basis, management determines the loss allowances bygrouping financial instruments on the basis of shared credit risk characteristics.
For trade receivables which do not contain a significant financing component, the loss allowance is determined as the lifetime expectedcredit losses of the instruments. For all other trade receivables IFRS 9 permits the determination of the credit loss allowance by eitherdetermining whether there was a significant increase in credit risk since initial recognition or by always making use of lifetime expectedcredit losses. Management have chosen as an accounting policy, to make use of lifetime expected credit losses. Management doestherefore not make the annual assessment of whether the credit risk has increased significantly since initial recognition for tradereceivables.
The maximum exposure to credit risk is presented in the table below:
The Group is exposed to liquidity risk, which is the risk that the Group will encounter difficulties in meeting its obligations as they becomedue.
The Group manages its liquidity risk by effectively managing its working capital, capital expenditure and cash flows. The financingrequirements are met through a mixture of cash generated from operations and long and short term borrowings. Committed borrowingfacilities are available for meeting liquidity requirements and deposits are held at central banking institutions.
There have been no significant changes in the liquidity risk management policies and processes since the prior reporting period.
The maturity profile of contractual cash flows of non-derivative financial liabilities, and financial assets held to mitigate the risk, arepresented in the following table. The cash flows are undiscounted contractual amounts.

B K B | A N N U A L R E P O R T 2 0 2 1
S E R V I C E E X C E L L E N C E | E N T R E P R E N E U R S H I P | E A R N I N G S | E M P L O Y E E S | E N V I R O N M E N T
#IntegrityIntegrated
P E O P L E | P L A N E T | P R O F I T
#SustainabilitySynergised87 88
Annual Financial Statements for the year ended 30 June 2021
NOTES TO THE FINANCIAL STATEMENTS
BKB LIMITED AND ITS SUBSIDIARIES(Registration number 1998/012435/06)
43 Financial instruments and risk management (continued)
43.3 Financial risk management (continued)
ii. Liquidity risk (continued) Less than
1 year 2 to 5 years > 5 years Total
Group - 2021Trade and other payables 573 975 - - 573 975 Borrowings 547 541 116 493 - 664 034 Financial liabilities at fair value 21 056 - - 21 056 Derivatives 8 566 - - 8 566 Lease liabilities 12 014 33 408 26 827 72 249 Bank overdraft 122 940 - - 122 940
1 286 092 149 901 26 827 1 462 820
Group - 2020Trade and other payables 591 785 - - 591 785 Borrowings 657 012 137 170 - 794 182 Financial liabilities at fair value 26 173 - - 26 173 Derivatives 5 869 - - 5 869 Lease liabilities 8 685 19 541 31 494 59 720 Bank overdraft 72 569 - - 72 569
1 362 093 156 711 31 494 1 550 298
Company - 2021Trade and other payables 266 883 - - 266 883 Loans from group companies 22 586 - - 22 586 Borrowings 467 141 74 570 - 541 711 Derivatives 483 - - 483 Lease liabilities 4 783 18 585 16 943 40 311 Bank overdraft 1 546 - - 1 546
763 422 93 155 16 943 873 520
Company - 2020Trade and other payables 270 608 - - 270 608 Loans from group companies 45 436 - - 45 436 Borrowings 584 239 92 191 - 676 430 Derivatives 285 - - 285 Lease liabilities 1 799 4 397 28 701 34 897
902 367 96 588 28 701 1 027 656
2021 2020 2021 2020Lease liabilities R'000 R'000 R'000 R'000
Within one year 17 822 14 028 8 297 4 882 Two to five years 48 029 36 303 27 861 17 874 Greater than five 34 484 60 539 23 811 57 796
100 335 110 870 59 969 80 552 Less finance charges component (28 086) (51 150) (19 658) (45 655)
72 249 59 720 40 311 34 897
Non-current liabilities 60 235 51 035 35 528 33 098 Current liabilities 12 014 8 685 4 783 1 799
72 249 59 720 40 311 34 897
iii. Foreign currency risk
The maturity analysis of gross contractual cash flows in terms of leaseliabilities are as follows:
The Group is exposed to foreign currency risk as a result of certain transactions and borrowings which are denominated in foreigncurrencies. Exchange rate exposures are managed within approved policy parameters utilising foreign forward exchange contracts wherenecessary. The foreign currencies in which the Group deals primarily is the US Dollar.
Group Company
Annual Financial Statements for the year ended 30 June 2021
NOTES TO THE FINANCIAL STATEMENTS
BKB LIMITED AND ITS SUBSIDIARIES(Registration number 1998/012435/06)
43 Financial instruments and risk management (continued)
43.3 Financial risk management (continued)
iii. Foreign currency risk (continued)
Exposures in Rand
2021 2020 2021 2020US Dollar exposure R'000 R'000 R'000 R'000
Trade and other receivables 73 103 45 065 24 641 - Cash and cash equivalents 230 288 8 - Trade and other payables (4 270) - (4 080) - Net US Dollar exposure 69 063 45 353 20 569 -
Euro exposureTrade and other payables (4 539) (5 830) - - Net Euro exposure (4 539) (5 830) - -
2021 2020 2021 2020US Dollar exposure $'000 $'000 $'000 $'000
Trade and other receivables 5 123 2 592 1 724 - Cash and cash equivalents 16 17 1 - Trade and other payables (299) - (286) - Net US Dollar exposure 4 840 2 609 1 439 -
2021 2020 2021 2020Euro exposure €'000 €'000 €'000 €'000
Trade and other payables (267) (299) - -
Exchange ratesForeign currency per RandUS Dollar 14.27 17.39 14.29 - Euro 17.02 19.50 - -
Forward exchange contracts
Group - 2021Exports Note Contract
amount Sell dollars - expiry 2 July 2021 to 27 January 2022 12 19 540 726
Group - 2020ExportsSell dollars - expiry 30 July 2020 to 21 May 2021 12 36 316 678
Company - 2021ExportsSell dollars - expiry 2 July 2021 to 27 September 2021 12 1 750 600
Contract rate
15.35 - 18.92
13.74 - 15.35
There have been no significant changes in the foreign currency risk management policies and processes since the prior reporting period.
Group Company
13.74 - 14.37
Group Company
The net carrying amounts, in foreign currency of the above exposure was as follows:
Group Company
The net carrying amounts, in Rand, of the various exposures, are denominated in the following currencies. The amounts have beenpresented in Rand by converting the foreign currency amounts at the closing rate at the reporting date:
Certain forward exchange contracts have been entered into for the purposes of managing foreign currency risk. The net market value ofall forward exchange contracts at reporting date is calculated by comparing the forward exchange contracted rates to the equivalentmarket foreign exchange rates at reporting date.

B K B | A N N U A L R E P O R T 2 0 2 1
S E R V I C E E X C E L L E N C E | E N T R E P R E N E U R S H I P | E A R N I N G S | E M P L O Y E E S | E N V I R O N M E N T
#IntegrityIntegrated
P E O P L E | P L A N E T | P R O F I T
#SustainabilitySynergised89 90
Annual Financial Statements for the year ended 30 June 2021
NOTES TO THE FINANCIAL STATEMENTS
BKB LIMITED AND ITS SUBSIDIARIES(Registration number 1998/012435/06)
43 Financial instruments and risk management (continued)
43.3 Financial risk management (continued)
iii. Foreign currency risk (continued)
Foreign currency sensitivity analysis
Group
Company
iv. Interest rate risk
Interest rate sensitivity analysis
Group
Company
At 30 June 2021, if the Rand/US Dollar exchange rate had been 5% (2020: 5%) higher or lower during the period, with all other variablesheld constant, profit or loss before tax for the year would have been R3 million (2020: R2.6 million) higher and R3 million (2020: R2.6million) lower.
The subsidiaries involved in grain-related activities are particularly exposed to fluctuations in interest rates. Interest on all commodityfinancing gets repaid by the customer. The policy is to manage interest rate risk by monitoring interest rates carefully, and adjustingproduct pricing accordingly, as well as including variable interest rates in their sales contracts.
There have been no significant changes in the interest rate risk management policies and processes since the prior reporting period.
At 30 June 2021, if the Rand/US Dollar exchange rate had been 5% higher or lower during the period, with all other variables heldconstant, profit or loss for the year would have been R1 million higher and R1 million lower.
At 30 June 2021, if the Rand/Euro exchange rate had been 5% (2020: 5%) higher or lower during the period, with all other variables heldconstant, profit or loss before tax for the year would have been R226 967 (2020: R291 480) lower and R226 967 (2020: R291 480) higher.
The Group manages its interest rate risk by negotiating the best possible interest rates with relevant financial institutions, and throughborrowing funds at floating interest rates.
At 30 June 2020 open foreign currency options included a Put option held by AlphaAlfa (Pty) Ltd of USD1 850 000 and a Call option infavour of ABSA Bank Limited of USD3 700 000. The Put option has a strike rate of R16.60 and the Call option a strike rate of R19.20.
At 30 June 2021 open foreign currency options included Put options held by Desert Raisins (Pty) Ltd of USD12 250 000 and Call optionsin favour of ABSA Bank Limited of USD24 500 000. The Put options have a strike rate of R13.59 and the Call options have strike ratesranging between R13.95 and R15.35.
The following information presents the sensitivity of the Group to an increase or decrease in the respective currencies it is exposed to.The sensitivity rate is the rate used when reporting foreign currency risk internally to key management personnel and representsmanagement's assessment of the reasonably possible change in foreign exchange rates. The sensitivity analysis includes onlyoutstanding foreign currency denominated amounts and adjusts their translation at the reporting date. No changes were made to themethods and assumptions used in the preparation of the sensitivity analysis compared to the previous reporting period.
The following sensitivity analysis has been prepared using a sensitivity rate which is used when reporting interest rate risk internally to keymanagement personnel and represents management's assessment of the reasonably possible change in interest rates. All other variablesremain constant. The sensitivity analysis includes only financial instruments exposed to interest rate risk which were recognised at thereporting date. No changes were made to the methods and assumptions used in the preparation of the sensitivity analysis compared tothe previous reporting period.
At 30 June 2021, if the prime lending rate had been 1% per annum higher or lower during the period, with all other variables heldconstant, profit or loss before tax for the year would have been R4.2 million (2020: R6.9 million) lower and R4.2 million (2020: R6.9million) higher.
At 30 June 2021, if the prime lending rate had been 1% per annum higher or lower during the period, with all other variables heldconstant, profit or loss before tax for the year would have been R1 million (2020: R1.3 million) higher and R1 million (2020: R1.3 million)lower.
Interest rate risk is the risk that the Group's financial position may be adversely affected as a result of changes in the market interest rate.The Group is exposed to the effects of fluctuations in the prevailing levels of market interest rates on its financial position and cash flows.The Group's most significant interest bearing assets are its trade receivables, and cash and cash equivalents. The Group's mostsignificant interest bearing liabilities are its loans with various financial institutions.
Annual Financial Statements for the year ended 30 June 2021
NOTES TO THE FINANCIAL STATEMENTS
BKB LIMITED AND ITS SUBSIDIARIES(Registration number 1998/012435/06)
43 Financial instruments and risk management (continued)
43.3 Financial risk management (continued)
v. Price risk
44 Fair value information
Fair value hierarchyThe table below analyses assets and liabilities carried at fair value. The different levels are defined as follows:
Level 3: Unobservable inputs for the asset or liability.
Levels of fair value measurements2021 2020 2021 2020
Level 2 R'000 R'000 R'000 R'000Recurring fair value measurements
AssetsInvestment propertyResidential property 1 312 1 517 1 312 1 517 Office buildings 34 011 34 011 - - Total investment property 35 323 35 528 1 312 1 517
Property, plant and equipmentTrading branches 128 028 128 014 128 028 128 014 Office buildings and fibre warehouse 183 758 182 946 173 535 174 835 Shearing and auction facilities 43 211 18 443 22 452 17 393 Processing and packaging plant 124 542 122 048 - - Total property, plant and equipment 479 539 451 451 324 015 320 242
Financial assets at fair value through profit or lossCommodity contracts: Inventory - SAFEX 4 577 41 323 - - Open forward contracts 20 700 317 - - Total financial assets at fair value through profit or loss 25 277 41 640 - -
Hedging derivativesForeign exchange contracts 1 004 13 381 - -
LiabilitiesFinancial liabilities at fair value through profit or lossABSA Bank Limited 21 014 24 595 - - Open forward contracts 42 1 578 - - Total financial liabilities at fair value through profit or loss 21 056 26 173 - -
Hedging derivativesForeign exchange contracts 8 566 5 869 483 285
Group Company
The Group does not use derivatives to manage operational exposures to price risks relating to changes in livestock and wool and mohairprices.
The subsidiaries involved in grain-related activities enter into forward sales and purchase contracts with their customers and suppliers, aswell as stock on hand. These contracts carry market price risk when the price of the contract is fixed, as underlying commodity marketscontinues to fluctuate. This can have the effect that the subsidiaries would incur a loss or realise a gain depending on the movement inthe market. The price risk is directly linked with the tonnage of the commodity determined in the contract with the suppliers andcustomers.
The grain operations are fully hedged on the SAFEX market and changes in SAFEX fluctuation will not be significant.
The grain operations manage the risk by taking out futures on the SAFEX market, thereby negating the net exposure to fluctuations incommodity prices.
Level 2: Inputs other than quoted prices included in level 1 that are observable for the asset or liability either directly or indirectly.Level 1: Quoted unadjusted prices in active markets for identical assets or liabilities that the Group can access at measurement date.

B K B | A N N U A L R E P O R T 2 0 2 1
S E R V I C E E X C E L L E N C E | E N T R E P R E N E U R S H I P | E A R N I N G S | E M P L O Y E E S | E N V I R O N M E N T
#IntegrityIntegrated
P E O P L E | P L A N E T | P R O F I T
#SustainabilitySynergised91 92
Annual Financial Statements for the year ended 30 June 2021
NOTES TO THE FINANCIAL STATEMENTS
BKB LIMITED AND ITS SUBSIDIARIES(Registration number 1998/012435/06)
44 Fair value information (continued)
Valuation techniques used to derive level 2 fair values
No changes have been made to the valuation technique.
Capitalisation rateTrading branches 10% to 13%Office buildings 10% to 11%Shearing and auction facilities 11%Processing and packaging plant 11% to 11.5%
Valuation processes applied by the Group
Unimproved land to the extent of 42 691 square meters was valued at R4 269 100.
The Bultfontein property was valued on 30 June 2021, the valuation was based on the capitalisation of income method. Net rental incomefor the year was estimated to be R1 153 366 and the capitalisation rate was estimated to be 11.5%.
As at 30 June 2019, the fair values of the land and buildings situated at Lot 497 and 500, Matsapha Industrial Estate, Swaziland havebeen determined by AM Ngwenya of Ngwenya Wonfor and Associates with an effective valuation date of 28 February 2019.
Level 2 fair values of trading branches, office buildings, shearing and auction facilities, processing and packaging plants have beengenerally derived using the yield method. The main Level 2 inputs used in this model are discount rates, terminal yields, expectedvacancy rates and rental growth rates are estimated by Andrè Crouse Valuers based on comparable transactions and industry data.
The Port Elizabeth office buildings and fibre warehouse was valued on 30 June 2021 and 30 June 2020 no adjustment was required to thecurrent value which the property is recognised at.
A directors’ assessment was performed for trading branches, office buildings, shearing and auction facilities as well as processing andpackaging plant which were not independently valued during the 2021 financial year.
The directors are of the opinion that the fair values as determined by the independent valuers during the last valuations performed, forproperties listed above, represent the fair value of the investment properties and land and buildings.
The valuation of land and buildings situated at Portion 24 of Erf 455 Bloemsmond, Gordonia, Vryburg was based on the depreciatedreplacement value method. A certain replacement cost is used as starting point and then reduced by physical depreciation, functional andeconomic obsolescence and possible buyers resistance. In the valuation process depreciation of property can be described as thedeterioration of any of the attributes bestowed upon it by nature; its physical condition, its utility or purposeful use and that of any of itscomponents contributing thereto, irrespective of the causes thereof.
The Group engages external, independent and qualified valuers to estimate the fair value of the Group’s office building and fibrewarehouse as well on its processing and packaging plants. Trading branches as well as shearing and auction facilities are valued everyfive years as these are mostly in rural areas.
As at 30 June 2019, the fair values of the land and buildings situated at Portion 24 of Erf 455 Bloemsmond and Portion 24 of Erf 455Bloemsmond, Gordonia, Vryburg have been determined by Mr. TH Myburgh (Professional Valuer), of Equity Property Professionals withan effective valuation date of 28 May 2019.
The Bethlehem property was valued on 30 June 2021, the valuation was based on the capitalisation of income method. Net rental incomefor the year was estimated to be R1 908 676 and the capitalisation rate was estimated to be 11%.
The most significant assumption used in the valuation of the properties was the capitalisation rate, which has been set out below for thevarious properties:
Trading branches, office buildings, shearing and auction facilities, processing and packaging plants
Andre Crouse of Koelro No57CC t/a Andre Crouse, who is a member of the South African Council of Property Valuers Profession is theindependent valuer used for the valuations of all the Group's properties in South Africa except for the processing plant situated in Vryburg.Mr. A Crouse qualifications include (BCom(Hons), Dip Ind Eng (USA) and Nat Dip Tech (Prod Eng)). He has more than 20 yearsexperience in his field of expertise.
Annual Financial Statements for the year ended 30 June 2021
NOTES TO THE FINANCIAL STATEMENTS
45 Going concern
46 Events after the reporting period
47 New Standards and Interpretations
47.1 Standards and interpretations effective and adopted in the current year
Standards/Interpretations: Effective date: Expected impact:
01-Jun-20
01-Jan-20
01-Jan-20
01-Jan-20
01-Jan-20
01-Jan-23
47.2 Standards and interpretations not yet effective
Standards/Interpretations: Effective date: Expected impact:
01-Jan-21
IFRS 3: Reference to the Conceptual Framework 01-Jan-22
01-Jan-22
01-Jan-22
01-Jan-22
01-Jan-22
Amendments to IFRS 9 ‘Financial Instruments’, IAS 39 ‘Financial Instruments:Recognition and Measurement’, IFRS 7 ‘Financial Instruments: Disclosures’ andIFRS 16 ‘Leases’ – interest rate benchmark (IBOR) reform (Phase 2)
Unlikely there will be a material impact
BKB LIMITED AND ITS SUBSIDIARIES(Registration number 1998/012435/06)
The directors believe that the Group has adequate financial resources to continue in operation for the foreseeable future and accordinglythe financial statements have been prepared on a going concern basis.
The directors have satisfied themselves that the Group is in a sound financial position and that it has access to sufficient borrowingfacilities to meet its foreseeable cash requirements. The directors are not aware of any new material changes that may adversely impactthe Group. The directors are also not aware of any material non-compliance with statutory or regulatory requirements or of any pendingchanges to legislation which may affect the Group.
The directors will continue to monitor the impact of the COVID-19 pandemic on the Group's operations and its financial position. Theimpact of COVID-19 has been limited to certain areas of the business and has not materially impacted the Group's results.
COVID 19 - Related Rent Concessions - Amendment to IFRS 16
Amendment to IFRS 3 - Business combinations - Definition of a business
The Directors are not aware of any material events occurring after the reporting date and up to the date of this report that would have amaterial impact on these annual financial statements.
IAS 1 Presentation of Financial Statements: Disclosure initiative
No material impact.
No material impact.
No material impact.
Amendments to IFRS 9, ‘Financial Instruments’, IAS 39, ‘Financial Instruments:Recognition and Measurement’ and IFRS 7, ‘Financial Instruments: Disclosure’ –Interest rate benchmark reform (Phase 1)
No material impact.
In the current year, the Group has adopted the following standards and interpretations that are effective for the current financial year andthat are relevant to its operations:
Unlikely there will be a material impact
Unlikely there will be a material impact
No material impact.
Classification of Liabilities as Current or Non-Current - Amendment to IAS 1 Unlikely there will be a material impact
Deferred Tax related to Assets and Liabilities arising from a Single Transaction -Amendments to IAS 12
No material impact.
Amendment to IAS 1, ‘Presentation of financial statements’ and IAS 8, ‘Accountingpolicies, changes in accounting estimates and errors’ on the definition of material.
Amendments to IAS 16 ‘Property, Plant and Equipment’ on Proceeds before IntendedUse
Unlikely there will be a material impact
Amendments to IAS 37 ‘Provisions, Contingent Liabilities and Contingent Assets’ onOnerous Contracts—Cost of Fulfilling a Contract
IFRS 9 Financial Instruments: Annual Improvements to IFRS Standards 2018–2020
Unlikely there will be a material impact

B K B | A N N U A L R E P O R T 2 0 2 1
S E R V I C E E X C E L L E N C E | E N T R E P R E N E U R S H I P | E A R N I N G S | E M P L O Y E E S | E N V I R O N M E N T
#IntegrityIntegrated
P E O P L E | P L A N E T | P R O F I T
#SustainabilitySynergised93 94
BKB LIMITED AND ITS SUBSIDIARIES (Registration number 1998/012435/06) Annual Financial Statements for the year ended 30 June 2021
ACCOUNTING POLICIES
48. Significant accounting policies
The annual financial statements for the year ended 30 June 2021 were authorized for issue by the board of directors on 14 September 2021. The principal accounting policies applied in the preparation of these consolidated and separate annual financial statements are set out below.
48.1 Basis of preparation
The consolidated and separate annual financial statements have been prepared on the going concern basis in accordance with, and in compliance with, International Financial Reporting Standards ("IFRS") and International Financial Reporting Interpretations Committee ("IFRIC") interpretations issued and effective at the time of preparing these annual financial statements, and the Companies Act 71 of 2008 of South Africa, as amended.
The annual financial statements have been prepared on the historical cost convention, unless otherwise stated in the accounting policies. They are presented in thousands of Rand, which is the Group's and Company's functional currency.
These accounting policies are consistent with the previous period.
48.2 Segmental reporting
Operating segments are reported in a manner consistent with the internal reporting provided to the chief operating decision maker. The chief operating decision-maker, who is responsible for allocating resources and assessing performance of the operating segments, has been identified as the executive directors that make strategic decisions.
The basis of segmental reporting has been set out in Note 1.
48.3 Consolidation
48.3.1 Basis of consolidation
The consolidated annual financial statements incorporate the annual financial statements of the Company and all subsidiaries. Subsidiaries are entities (including structured entities) which are controlled by the Holding Company.
The Holding Company has control of an entity when it is exposed to or has rights to variable returns from involvement with the entity and it has the ability to affect those returns through use of its power over the entity. They are deconsolidated from the date that control ceases. The results of subsidiaries are included in the consolidated annual financial statements from the effective date of acquisition to the effective date of disposal. Adjustments are made when necessary to the annual financial statements of subsidiaries to bring their accounting policies in line with those of the Group. All inter-company transactions, balances, and unrealised gains on transactions between Group companies are eliminated in full on consolidation. Unrealised losses are also eliminated unless the transaction provides evidence of an impairment of the asset transferred.
Non-controlling interests in the net assets of consolidated subsidiaries are identified and recognised separately from the Group's interest therein and are recognised within equity. Losses of subsidiaries attributable to non-controlling interests are allocated to the non-controlling interest even if this results in a debit balance being recognised for non-controlling interest. Transactions with non-controlling interests that do not result in loss of control are accounted for as equity transactions and are recognised directly in the Statement of Changes in Equity.
The difference between the fair value of consideration paid or received and the movement in non-controlling interest for such transactions is recognised in equity attributable to the owners of the Company.
Where a subsidiary is disposed of and a non-controlling shareholding is retained, the remaining investment is measured to fair value with the adjustment to fair value recognised in profit or loss as part of the gain or loss on disposal of the controlling interest. The fair value is the initial carrying amount for the purposes of subsequently accounting for the retained interest as an associate, joint venture or financial asset. In addition, any amounts previously recognised in other comprehensive income in respect of that entity are accounted for as if the Group had directly disposed of the related assets or liabilities. This may mean that amounts previously recognised in other comprehensive income are reclassified to profit or loss.
48.3.2 Investments in subsidiaries in the separate financial statements
In the Company's separate financial statements, investments in subsidiaries are carried at cost less any accumulated impairment losses. This excludes investments which are held for sale and are consequently accounted for in accordance with IFRS 5 Non-current Assets Held for Sale and Discontinued Operations.
BKB LIMITED AND ITS SUBSIDIARIES (Registration number 1998/012435/06) Annual Financial Statements for the year ended 30 June 2021
ACCOUNTING POLICIES
48.3 Consolidation (continued) 48.3.3 Business combinations
The Group accounts for business combinations using the acquisition method of accounting. The cost of the business combination is measured as the aggregate of the fair values of assets given, liabilities incurred or assumed and equity instruments issued. Costs directly attributable to the business combination are expensed as incurred, except the costs to issue debt which are amortised as part of the effective interest and costs to issue equity which are included in equity. Any contingent consideration is included in the cost of the business combination at fair value as at the date of acquisition. Subsequent changes to the assets, liability or equity which arise as a result of the contingent consideration are not affected against goodwill, unless they are valid measurement period adjustments. Otherwise, all subsequent changes to the fair value of contingent consideration that is deemed to be an asset or liability is recognised in either profit or loss or in other comprehensive income, in accordance with relevant IFRS's. Contingent consideration that is classified as equity is not remeasured, and its subsequent settlement is accounted for within equity.
The acquiree's identifiable assets, liabilities and contingent liabilities which meet the recognition conditions of IFRS 3 Business combinations are recognised at their fair values at acquisition date, except for non-current assets (or disposal groups) that are classified as held for sale in accordance with IFRS 5 Non-current assets Held For Sale and Discontinued Operations, which are recognised at fair value less costs to sell.
Contingent liabilities are only included in the identifiable assets and liabilities of the acquiree where there is a present obligation at acquisition date.
On acquisition, the acquiree's assets and liabilities are reassessed in terms of classification and are reclassified where the classification is inappropriate for group purposes. This excludes lease agreements and insurance contracts, whose classification remains as per their inception date.
Non-controlling interests in the acquiree are measured on an acquisition-by-acquisition basis either at fair value or at the non-controlling interests' proportionate share in the recognised amounts of the acquiree's identifiable net assets. This treatment applies to non-controlling interests which are present ownership interests and entitle their holders to a proportionate share of the entity's net assets in the event of liquidation. All other components of non-controlling interests are measured at their acquisition date fair values, unless another measurement basis is required by IFRS's.
In cases where the Group held a non-controlling shareholding in the acquiree prior to obtaining control, that interest is measured to fair value as at acquisition date. The measurement to fair value is included in profit or loss for the year.
Goodwill is determined as the consideration paid, plus the fair value of any shareholding held prior to obtaining control, plus non-controlling interest and less the fair value of the identifiable assets and liabilities of the acquiree. If the fair value of the net assets acquired is in excess of the consideration paid then the gain is recognised directly in profit or loss.
Goodwill is not amortised but is tested on an annual basis for impairment. If goodwill is assessed to be impaired, that impairment is not subsequently reversed. 48.4 Investment in associates An associate is an entity over which the Group has significant influence and which is neither a subsidiary nor a joint arrangement. Significant influence is the power to participate in the financial and operating policy decisions of the investee but is not control or joint control over those policies. It generally accompanies a shareholding of between 20% and 50% of the voting rights. Investment in associates is accounted for using the equity method, except when the investment is classified as held for sale in accordance with IFRS 5 Non-current Assets Held for Sale and Discontinued Operations. Under the equity method, investment in associates is carried in the Statements of Financial Position at cost adjusted for post-acquisition changes in the group’s share of net assets of the associate, less any impairment losses. The Group’s share of post-acquisition profit or loss is recognised in profit or loss, and its share of movements in other comprehensive income is recognised in other comprehensive income with a corresponding adjustment to the carrying amount of the investment. Losses in an associate in excess of the Group’s interest in that associate, including any other secure receivables, are recognised only to the extent that the Group has incurred a legal or constructive obligation to make payment on behalf of the associate. Any goodwill on acquisition of an associate is included in the carrying amount of the investment, however a gain on acquisition is recognised immediately in profit or loss. Profits or losses on transactions between the Group and an associate are eliminated to the extent of the Group’s interest therein. Unrealised losses are eliminated unless the transaction provides evidence of an impairment of the asset transferred. Accounting policies of the associates have been changed where necessary to ensure consistency with the policies adopted by the Group. When the Group reduces its level of significant influence, the Group proportionately reclassifies the related items which were previously accumulated in equity through other comprehensive income to profit or loss as a reclassification adjustment. In such cases, if an investment remains, that investment is measured at fair value, with the fair value adjustment being recognised in profit or loss as part of the gain or loss on disposal.

B K B | A N N U A L R E P O R T 2 0 2 1
S E R V I C E E X C E L L E N C E | E N T R E P R E N E U R S H I P | E A R N I N G S | E M P L O Y E E S | E N V I R O N M E N T
#IntegrityIntegrated
P E O P L E | P L A N E T | P R O F I T
#SustainabilitySynergised95 96
BKB LIMITED AND ITS SUBSIDIARIES (Registration number 1998/012435/06) Annual Financial Statements for the year ended 30 June 2021
ACCOUNTING POLICIES
48.5 Significant judgements and sources of estimation uncertainty
The preparation of annual financial statements in conformity with IFRS requires management, from time to time, to make judgements, estimates and assumptions that affect the application of policies and reported amounts of assets, liabilities, income and expenses. These estimates and associated assumptions are based on experience and various other factors that are believed to be reasonable under the circumstances. Actual results may differ from these estimates. The estimates and underlying assumptions are reviewed on an ongoing basis. Revisions to accounting estimates are recognised in the period in which the estimates are revised and in any future periods affected.
48.5.1 Critical judgements in applying accounting policies
The critical judgements made by management in applying accounting policies, apart from those involving estimations, that have the most significant effect on the amounts recognised in the financial statements, are outlined as follows:
i. Lease term: IFRS 16 In determining the lease term, management considered all facts and circumstances that create an economic incentive to exercise an extension option, or not exercise a termination option. Extension options (or periods after termination options) are only included in the lease term if the lease is reasonably certain to be extended (or not terminated). ii. Expected manner of realisation for deferred tax
Management have reviewed the investment property portfolio of the Group in order to determine the appropriate rate at which to measure deferred tax. Investment property is measured at fair value. The manner of recovery of the carrying amount, i.e. through use or sale, affects the determination of the deferred tax assets or liabilities. IFRS assumes that the carrying amount of investment property is recovered through sale rather than through continued use. Management considered the business model of the portfolio and concluded that the assumption is not rebutted and that the deferred taxation should be measured on the sale basis.
iii. Taxation
Judgement is required in determining the provision for income taxes due to the complexity of legislation. There are many transactions and calculations for which the ultimate tax determination is uncertain during the ordinary course of business. The Group recognises liabilities for anticipated tax audit issues based on estimates of whether additional taxes will be due. Where the final outcome of these matters is different from the amounts that were initially recorded, such differences will impact upon the income tax and deferred tax provisions in the period in which such determination is made.
The Group recognises the net future tax benefit related to deferred income tax assets to the extent that it is probable that the deductible temporary differences will reverse in the foreseeable future. Assessing the recoverability of deferred income tax assets requires the Group to make significant estimates related to expectations of future taxable income. Estimates of future taxable income are based on forecasted cash flows from operations and the application of existing tax laws in each jurisdiction. To the extent that future cash flows and taxable income differ significantly from estimates, the ability of the Group to realise the net deferred tax assets recorded at the end of the reporting period could be affected. iv. Consolidation Judgement was applied in assessing whether the Group has control over Hoëveld Veilingsentrum (Pty) Ltd through it’s 50% shareholding. It was concluded that the Group has power over the investee, a right to variable returns and the ability to use the power over the investee to affect the value of returns.
48.5.2 Key sources of estimation uncertainty
i. Impairment of financial assets
The impairment provisions for financial assets are based on assumptions about risk of default and expected loss rates. The Group uses judgement in making these assumptions and selecting the inputs to the impairment calculation, based on the Group’s history, existing market conditions as well as forward looking estimates at the end of each reporting period. For details of the key assumptions and inputs used, refer to the individual notes addressing financial assets.
ii. Allowance for slow moving, damaged and obsolete inventory
Management assesses whether inventory is impaired by comparing its cost to its estimated net realisable value. Where an impairment is necessary, inventory items are written down to net realisable value. The write down is included in profit or loss.
In the Company an allowance is recognised against slow moving trade inventory at reporting date. Seasonal trade inventory older than twelve months is provided for at 15%. All other trade inventory older than twelve months is provided for at 25%. All trade inventory older than 24 months is provided for at 50%.
iii. Fair value estimation
Several assets and liabilities of the Group are either measured at fair value or disclosure is made of their fair values. Observable market data is used as inputs to the extent that it is available. Qualified external valuers are consulted for the determination of appropriate valuation techniques and inputs. Information about the specific techniques and inputs of the various assets and liabilities are disclosed in Note 44.
BKB LIMITED AND ITS SUBSIDIARIES (Registration number 1998/012435/06) Annual Financial Statements for the year ended 30 June 2021
ACCOUNTING POLICIES
48.5.2 Key sources of estimation uncertainty (continued)
iv. Impairment testing
The Group reviews and tests the carrying value of assets when events or changes in circumstances suggest that the carrying amount may not be recoverable. When such indicators exist, management determines the recoverable amount by performing value in use and fair value calculations. These calculations require the use of estimates and assumptions. When it is not possible to determine the recoverable amount for an individual asset, management assesses the recoverable amount for the cash generating unit to which the asset belongs.
v. Useful lives of property, plant and equipment
Management assess the appropriateness of the useful lives of property, plant and equipment at the end of each reporting period. The useful lives of motor vehicles, furniture and computer equipment are determined based on Group replacement policies for the various assets. Individual assets within these classes, which have a significant carrying amount are assessed separately to consider whether replacement will be necessary outside of normal replacement parameters. The useful life of property, plant and equipment is assessed annually based on factors including wear and tear, technological obsolescence and usage requirements.
When the estimated useful life of an asset differs from previous estimates, the change is applied prospectively in the determination of the depreciation charge.
48.6 Investment property
Investment property is recognised as an asset when it is probable that the future economic benefits that are associated with the investment property will flow to the enterprise and the cost of the investment property can be measured reliably.
Investment property is initially recognised at cost. Transaction costs are included in the initial measurement.
Investment property in the Group comprises an office building and residential properties which are held for long-term rental yields and are not occupied by the Group. Investment property is carried at fair value, representing open market value determined on an annual basis by the board of directors.
Fair value is based on active market prices, adjusted if necessary for any difference in the nature, location or condition of the specific asset. If the information is not available, the Group uses alternative valuation methods such as recent prices in less active markets or discounted cash flow projections. Valuations are conducted triennially by an independent valuer, except for residential properties in rural areas. Changes in fair values are recorded in profit or loss. The Group is exposed to changes in the residual value at the end of current leases, however the Group typically enters into new operating leases and therefore will not immediately realise any reduction in residual value at the end of these leases. Expectations about the future residual values are reflected in the fair value of the properties. 48.7 Non-current assets (disposal groups) held for sale Non-current assets and disposal groups are classified as held for sale if their carrying amount will be recovered through a sale transaction rather than through continuing use. This condition is regarded as met only when the sale is highly probable and the asset (or disposal group) is available for immediate sale in its present condition. Management must be committed to the sale, which should be expected to qualify for recognition as a completed sale within one year from the date of classification. Non-current assets (or disposal groups) held for sale are measured at the lower of their carrying amount and fair value less cost to sell. A non-current asset is not depreciated (or amortised) while it is classified as held for sale, or while it is part of a disposal group classified as such. Interest and other expenses attributable to the liabilities of a disposal group classified as held for sale are recognised in profit or loss. 48.8 Property, plant and equipment
Property, plant and equipment are tangible assets which the Group holds for its own use or for rental to related parties and which are expected to be used for more than one year.
An item of property, plant and equipment is recognised as an asset when it is probable that future economic benefits associated with the item will flow to the Group, and the cost of the item can be measured reliably.
Property, plant and equipment is initially measured at cost. Cost includes all the expenditure which is directly attributable to the acquisition or construction of the asset, including the capitalisation of borrowing costs on qualifying assets and adjustments in respect of hedge accounting, where appropriate.
Expenditure incurred subsequently for major maintenance and services, additions to or replacements of parts of property, plant and equipment is capitalised if it is probable that future economic benefits associated with the expenditure will flow to the Group and the cost can be measured reliably. Day to day maintenance costs are included in profit or loss in the year in which they are incurred.

B K B | A N N U A L R E P O R T 2 0 2 1
S E R V I C E E X C E L L E N C E | E N T R E P R E N E U R S H I P | E A R N I N G S | E M P L O Y E E S | E N V I R O N M E N T
#IntegrityIntegrated
P E O P L E | P L A N E T | P R O F I T
#SustainabilitySynergised97 98
BKB LIMITED AND ITS SUBSIDIARIES (Registration number 1998/012435/06) Annual Financial Statements for the year ended 30 June 2021
ACCOUNTING POLICIES
48.8 Property, plant and equipment (continued) Land and buildings comprise offices, warehouses, industrial, residential and trading branch buildings. Property values are reviewed on an annual basis by the directors. Offices, warehouses and industrial buildings are valued triennially by an external, independent valuer and included in the financial statements at the fair value less subsequent depreciation for buildings. Any accumulated depreciation at the date of revaluation is eliminated against the gross carrying amount of the asset and the net amount is restated to the revalued amount of the asset. All other property, plant and equipment is stated at historical cost less depreciation. Historical cost includes expenditure that is directly attributable to the acquisition of the items.
Revaluations of land and buildings are made with sufficient regularity such that the carrying amount does not differ materially from that which would be determined using fair value at the end of the reporting year. Revaluations are performed every three years on the Group's office building and fibre warehouse as well on its processing and packaging plants. Trading branches as well as shearing and auction facilities are valued every five years as these are mostly in rural areas.
Land and buildings are subsequently stated at revalued amount, being the fair value at the date of revaluation less any subsequent accumulated depreciation and subsequent accumulated impairment losses.
Any increase in carrying amount, as a result of a revaluation, is recognised in other comprehensive income and accumulated in the revaluation reserve in equity. The increase is recognised in profit or loss to the extent that it reverses a revaluation decrease of the same asset previously recognised in profit or loss.
Any decrease in carrying amount, as a result of a revaluation, is recognised in profit or loss in the current year. The decrease is recognised in other comprehensive income to the extent of any credit balance existing in the revaluation reserve in respect of that asset. The decrease recognised in other comprehensive income reduces the amount accumulated in the revaluation reserve in equity.
The revaluation reserve related to a specific item of land and buildings is transferred directly to retained income when the asset is derecognised.
Depreciation of an asset commences when the asset is available for use. Depreciation is charged to write off the asset's carrying amount over its estimated useful life to its estimated residual value, using a method that best reflects the pattern in which the asset's economic benefits are consumed by the Group. Leased assets are depreciated in a consistent manner over the shorter of their expected useful lives and the lease term. Depreciation is not charged to an asset if its estimated residual value exceeds or is equal to its carrying amount. Depreciation of an asset ceases at the earlier of the date that the asset is classified as held for sale or derecognised.
The useful lives of items of property, plant and equipment have been assessed as follows:
Item Depreciation method Average useful life Land and buildings Straight line 50 years Plant and machinery Straight line 5 - 20 years Furniture and fixtures Straight line 5 - 15 years Motor vehicles Straight line 4 - 5 years Office equipment Straight line 5 - 10 years IT equipment Straight line 3 - 5 years
The residual value, useful life and depreciation method of each asset is reviewed at the end of each reporting year. If the expectations differ from previous estimates, the change is accounted for prospectively as a change in accounting estimate. The directors consider the current values of properties to approximate their residual values.
Each part of an item of property, plant and equipment with a cost that is significant in relation to the total cost of the item is depreciated separately.
The depreciation charge for each year is recognised in profit or loss.
Impairment tests are performed on property, plant and equipment when there is an indicator that they may be impaired. When the carrying amount of an item of property, plant and equipment is assessed to be higher than the estimated recoverable amount, an impairment loss is recognised immediately in profit or loss to bring the carrying amount in line with the recoverable amount. An item of property, plant and equipment is derecognised upon disposal or when no future economic benefits are expected from its continued use or disposal. Any gain or loss arising from the derecognition of an item of property, plant and equipment, determined as the difference between the net disposal proceeds, if any, and the carrying amount of the item, is included in profit or loss when the item is derecognised.
BKB LIMITED AND ITS SUBSIDIARIES (Registration number 1998/012435/06) Annual Financial Statements for the year ended 30 June 2021
ACCOUNTING POLICIES
48.9 Intangible assets
An intangible asset is recognised when:
it is probable that the expected future economic benefits that are attributable to the asset will flow to the entity, and the cost of the asset can be measured reliably.
Intangible assets are initially recognised at cost. Expenditure on research (or on the research phase of an internal project) is recognised as an expense when it is incurred. An intangible asset arising from development (or from the development phase of an internal project) is recognised when:
it is technically feasible to complete the asset so that it will be available for use or sale. there is an intention to complete and use or sell it. there is an ability to use or sell it. it will generate probable future economic benefits. there are available technical, financial and other resources to complete the development and to use or sell the asset. the expenditure attributable to the asset during its development can be measured reliably.
Intangible assets are carried at cost less any accumulated amortisation and any impairment losses.
An intangible asset is regarded as having an indefinite useful life when, based on all relevant factors, there is no foreseeable limit to the period over which the asset is expected to generate net cash inflows. Amortisation is not provided for these intangible assets, but they are tested for impairment annually and whenever there is an indication that the asset may be impaired. For all other intangible assets amortisation is provided on a straight-line basis over their useful life.
The amortisation period and the amortisation method for intangible assets are reviewed every period-end.
Reassessing the useful life of an intangible asset with a finite useful life after it was classified as indefinite is an indicator that the asset may be impaired. As a result the asset is tested for impairment and the remaining carrying amount is amortised over its useful life.
Internally generated brands, mastheads, publishing titles, customer lists and items similar in substance are not recognised as intangible assets.
Amortisation is provided to write down the intangible assets, on a straight-line basis, to their residual values as follows:
Item Useful life Patents, trademarks and other rights 5 - 20 years Brand names 5 - 20 years Computer software 2 - 8 years Client lists and relationships 5 - 20 years
48.10 Financial instruments
Financial instruments held by the Group are classified in accordance with the provisions of IFRS 9 Financial Instruments.
The financial instruments held by the Group, based on their specific classifications is set out in Note 43 Financial instruments and risk management.
The specific accounting policies for the classification, recognition and measurement of each type of financial instrument held by the Group are presented below:
48.10.1 Loans receivable at amortised cost
i. Classification
Loans to group companies (Note 9), loans to directors, managers and employees (Note 41), and loans receivable (Note 10) are classified as financial assets subsequently measured at amortised cost.
They have been classified in this manner because the contractual terms of these loans give rise, on specified dates, to cash flows that are solely payments of principal and interest on the principal outstanding, and the Group's business model is to collect the contractual cash flows on these loans.

B K B | A N N U A L R E P O R T 2 0 2 1
S E R V I C E E X C E L L E N C E | E N T R E P R E N E U R S H I P | E A R N I N G S | E M P L O Y E E S | E N V I R O N M E N T
#IntegrityIntegrated
P E O P L E | P L A N E T | P R O F I T
#SustainabilitySynergised99 100
BKB LIMITED AND ITS SUBSIDIARIES (Registration number 1998/012435/06) Annual Financial Statements for the year ended 30 June 2021
ACCOUNTING POLICIES
48.10 Financial instruments (continued)
48.10.1 Loans receivable at amortised cost (continued)
ii. Recognition and measurement
Loans receivable are recognised when the Group becomes a party to the contractual provisions of the loan. The loans are measured, at initial recognition, at fair value plus transaction costs, if any.
They are subsequently measured at amortised cost.
The amortised cost is the amount recognised on the loan initially, minus principal repayments, plus cumulative amortisation (interest) using the effective interest method of any difference between the initial amount and the maturity amount, adjusted for any loss allowance.
iii. Application of the effective interest method
Interest income is calculated using the effective interest method and is included in profit or loss in finance income (Note 30).
The application of the effective interest method to calculate interest income on a loan receivable is dependent on the credit risk of the loan as follows:
The effective interest rate is applied to the gross carrying amount of the loan, provided the loan is not credit impaired. The gross carrying amount is the amortised cost before adjusting for a loss allowance.
If a loan is purchased or originated as credit-impaired, then a credit-adjusted effective interest rate is applied to the amortised cost in the determination of interest. This treatment does not change over the life of the loan, even if it is no longer credit impaired.
If a loan was not purchased or originally credit-impaired, but it has subsequently become credit-impaired, then the effective interest rate is applied to the amortised cost of the loan in the determination of interest. If, in subsequent periods, the loan is no longer credit impaired, then the interest calculation reverts to applying the effective interest rate to the gross carrying amount.
iv. Impairment
The Group recognises a loss allowance for expected credit losses on all loans receivable measured at amortised cost. The amount of expected credit losses is updated at each reporting date to reflect changes in credit risk since initial recognition of the respective loans.
The Group measures the loss allowance at an amount equal to lifetime expected credit losses (lifetime ECL) when there has been a significant increase in credit risk since initial recognition. If the credit risk on a loan has not increased significantly since initial recognition, then the loss allowance for that loan is measured at 12 month expected credit losses (12 month ECL).
Lifetime ECL represents the expected credit losses that will result from all possible default events over the expected life of a loan. In contrast, 12 month ECL represents the portion of lifetime ECL that is expected to result from default events on a loan that are possible within 12 months after the reporting date.
In order to assess whether to apply lifetime ECL or 12 month ECL, that is whether or not there has been a significant increase in credit risk since initial recognition, the Group considers whether there has been a significant increase in the risk of a default occurring since initial recognition rather than at evidence of a loan being credit impaired at the reporting date or of an actual default occurring.
v. Measurement and recognition of expected credit losses
The measurement of expected credit losses is a function of the probability of default, loss given default (i.e. the magnitude of the loss if there is a default) and the exposure at default.
The assessment of the probability of default and loss given default is based on historical data adjusted by forward-looking information as described above. The exposure at default is the gross carrying amount of the loan at the reporting date.
An impairment loss is recognised for all loans in profit or loss with a corresponding adjustment to their carrying amount through a loss allowance account. The impairment loss is included in impairment on financial assets in profit or loss as a movement in credit loss allowance (Note 29).
48.10.2 Trade and other receivables
i. Classification
Trade and other receivables, excluding VAT and prepayments, are classified as financial assets subsequently measured at amortised cost (Note 10). Trade and other receivables comprise trade debtors, advances and finance arrangements.
They have been classified in this manner because their contractual terms give rise, on specified dates to cash flows that are solely payments of principal and interest on the principal outstanding, and the Group's business model is to collect the contractual cash flows on trade and other receivables.
BKB LIMITED AND ITS SUBSIDIARIES (Registration number 1998/012435/06) Annual Financial Statements for the year ended 30 June 2021
ACCOUNTING POLICIES
48.10 Financial instruments (continued)
48.10.2 Trade and other receivables (continued)
ii. Recognition and measurement
Trade and other receivables are recognised when the Group becomes a party to the contractual provisions of the receivables. They are measured, at initial recognition, at fair value plus transaction costs, if any.
They are subsequently measured at amortised cost.
The amortised cost is the amount recognised on the receivable initially, minus principal repayments, plus cumulative amortisation (interest) using the effective interest method of any difference between the initial amount and the maturity amount, adjusted for any loss allowance.
iii. Application of the effective interest method
For receivables which contain a significant financing component, interest income is calculated using the effective interest method and is included in revenue from contracts with customers (Note 26).
The application of the effective interest method to calculate interest income on trade receivables is dependent on the credit risk of the receivable as follows:
The effective interest rate is applied to the gross carrying amount of the receivable, provided the receivable is not credit impaired. The gross carrying amount is the amortised cost before adjusting for a loss allowance.
If a receivable is a purchased or originated as credit-impaired, then a credit-adjusted effective interest rate is applied to the amortised cost in the determination of interest. This treatment does not change over the life of the receivable, even if it is no longer credit impaired.
If a receivable was not purchased or originally credit-impaired, but it has subsequently become credit-impaired, then the effective interest rate is applied to the amortised cost of the receivable in the determination of interest. If, in subsequent periods, the receivable is no longer credit impaired, then the interest calculation reverts to applying the effective interest rate to the gross carrying amount.
iv. Trade and other receivables denominated in foreign currencies
When trade and other receivables are denominated in a foreign currency, the carrying amount of the receivables is determined in the foreign currency. The carrying amount is then translated to the Rand equivalent using the spot rate at the end of each reporting period. Any resulting foreign exchange gains or losses are recognised in profit or loss in other operating income (Note 28) or administrative and other expenses (Note 29).
Details of foreign currency risk exposure and the management thereof are provided under financial instruments and risk management Note 43.
v. Impairment
The Group recognises a loss allowance for expected credit losses on trade and other receivables, excluding VAT and prepayments. The amount of expected credit losses is updated at each reporting date.
The Group measures the loss allowance for trade and other receivables at an amount equal to lifetime expected credit losses (lifetime ECL), which represents the expected credit losses that will result from all possible default events over the expected life of the receivable.
vi. Measurement and recognition of expected credit losses
The Group makes use of a provision matrix as a practical expedient to the determination of expected credit losses on trade and other receivables. The provision matrix is based on historic credit loss experience, adjusted for factors that are specific to the debtors, general economic conditions and an assessment of both the current and forecast direction of conditions at the reporting date, including the time value of money, where appropriate.
The customer base is widespread and does not show significantly different loss patterns for different customer segments. The loss allowance is calculated on a collective basis for all trade and other receivables in totality. Details of the provision matrix is presented in Note 10.
An impairment loss is recognised in profit or loss with a corresponding adjustment to the carrying amount of trade and other receivables, through use of a loss allowance account. The impairment loss is included in impairment on financial assets in profit or loss as a movement in credit loss allowance (Note 29).

B K B | A N N U A L R E P O R T 2 0 2 1
S E R V I C E E X C E L L E N C E | E N T R E P R E N E U R S H I P | E A R N I N G S | E M P L O Y E E S | E N V I R O N M E N T
#IntegrityIntegrated
P E O P L E | P L A N E T | P R O F I T
#SustainabilitySynergised101 102
BKB LIMITED AND ITS SUBSIDIARIES (Registration number 1998/012435/06) Annual Financial Statements for the year ended 30 June 2021
ACCOUNTING POLICIES
48.10 Financial instruments (continued)
48.10.3 Borrowings and loans from related parties
i. Classification
Loans from group companies (Note 23) and borrowings (Note 19) are classified as financial liabilities subsequently measured at amortised cost.
ii. Recognition and measurement
Borrowings and loans from related parties are recognised when the Group becomes a party to the contractual provisions of the loan. The loans are measured, at initial recognition, at fair value plus transaction costs, if any.
They are subsequently measured at amortised cost using the effective interest method.
The effective interest method is a method of calculating the amortised cost of a financial liability and of allocating interest expense over the relevant period. The effective interest rate is the rate that exactly discounts estimated future cash payments (including all fees and points paid or received that form an integral part of the effective interest rate, transaction costs and other premiums or discounts) through the expected life of the financial liability, or (where appropriate) a shorter period, to the amortised cost of a financial liability.
Interest expense, calculated on the effective interest method, is included in profit or loss in finance costs (Note 31).
Borrowings expose the Group to liquidity risk and interest rate risk. Refer to Note 43 for details of risk exposure and management thereof.
iii. Loans denominated in foreign currencies
When borrowings are denominated in a foreign currency, the carrying amount of the loan is determined in the foreign currency. The carrying amount is then translated to the Rand equivalent using the spot rate at the end of each reporting period. Any resulting foreign exchange gains or losses are recognised in profit or loss in the other operating income (Note 28) or administrative and other expenses (Note 29). Details of foreign currency risk exposure and the management thereof are provided in the specific loan notes and in the financial instruments and risk management Note 43.
48.10.4 Trade and other payables
i. Classification
Trade and other payables (Note 22), excluding VAT and amounts received in advance, are classified as financial liabilities subsequently measured at amortised cost. Trade payables are obligations to pay for goods and services that have been acquired in the ordinary course of business from suppliers.
ii. Recognition and measurement
They are recognised when the Group becomes a party to the contractual provisions, and are measured, at initial recognition, at fair value plus transaction costs.
They are subsequently measured at amortised cost using the effective interest method.
The effective interest method is a method of calculating the amortised cost of a financial liability and of allocating interest expense over the relevant period. The effective interest rate is the rate that exactly discounts estimated future cash payments (including all fees and points paid or received that form an integral part of the effective interest rate, transaction costs and other premiums or discounts) through the expected life of the financial liability, or (where appropriate) a shorter period, to the amortised cost of a financial liability.
If trade and other payables contain a significant financing component, and the effective interest method results in the recognition of interest expense, then it is included in profit or loss in finance costs (Note 31).
Trade and other payables expose the Group to liquidity risk and possibly to interest rate risk. Refer to Note 43 for details of risk exposure and management thereof.
BKB LIMITED AND ITS SUBSIDIARIES (Registration number 1998/012435/06) Annual Financial Statements for the year ended 30 June 2021
ACCOUNTING POLICIES
48.10 Financial instruments (continued)
48.10.5 Financial liabilities at fair value through profit or loss
i. Classification
Financial liabilities which are held for trading are classified as financial liabilities measured at fair value through profit or loss. Refer to Note 43.
Financial liabilities which are held for trading, consisting of foreign exchange contracts and open positions on the South African Futures Exchange (SAFEX), are initially measured at fair value on contract date and are re-measured to fair value at subsequent reporting dates. Changes in the fair value of derivative financial instruments are recognised in profit or loss as they arise. When a financial liability is contingent consideration in a business combination, the Group classifies it as a financial liability at fair value through profit or loss. Refer to Note 43.
ii. Recognition and measurement
Financial liabilities at fair value through profit or loss are recognised when the Group becomes a party to the contractual provisions of the instrument. They are measured, at initial recognition and subsequently, at fair value. Transaction costs are recognised in profit or loss.
For financial liabilities designated at fair value through profit or loss, the portion of fair value adjustments which are attributable to changes in the Group's own credit risk, are recognised in other comprehensive income and accumulated in equity in the reserve for valuation of liabilities, rather than in profit or loss. However, if this treatment would create or enlarge an accounting mismatch in profit or loss, then that portion is also recognised in profit or loss.
Interest paid on financial liabilities at fair value through profit or loss is included in finance costs (Note 31).
iii. Financial liabilities denominated in foreign currencies
When a financial liability at fair value through profit or loss is denominated in a foreign currency, the fair value of the instrument is determined in the foreign currency. The fair value is then translated to the Rand equivalent using the spot rate at the end of each reporting period. Any resulting foreign exchange gains or losses are recognised as part of the fair value adjustment in profit or loss. To the extent that the foreign exchange gain or loss relates to the portion of the fair value adjustment recognised in other comprehensive income, that portion of foreign exchange gain or loss is included in the fair value adjustment recognised in other comprehensive income.
Details of foreign currency risk exposure and the management thereof are provided in the financial instruments and risk management Note 43.
48.10.6 Cash and cash equivalents
Cash and cash equivalents are stated at carrying amount which is deemed to be fair value.
48.10.7 Bank overdrafts
Bank overdrafts are initially measured at fair value and are subsequently measured at amortised cost, using the effective interest rate method. Cash credit accounts are treated as bank overdrafts in the statements of cash flows as these accounts operate as overdraft accounts in substance despite being classified as borrowings in the financial statements.
48.10.8 Derecognition
i. Financial assets
The Group derecognises a financial asset when the contractual rights to the cash flows from the asset expire or when it transfers the financial asset and substantially all the risks and rewards of ownership of the asset to another party. If the Group neither transfers nor retains substantially all the risks and rewards of ownership and continues to control the transferred asset, the Group recognises its retained interest in the asset and an associated liability for amounts it may have to pay. If the Group retains substantially all the risks and rewards of ownership of a transferred financial asset, the Group continues to recognise the financial asset and also recognises a collateralised borrowing for the proceeds received.
ii. Financial liabilities
The Group derecognises financial liabilities when the Group obligations are discharged, cancelled or they expire. The difference between the carrying amount of the financial liability derecognised and the consideration paid and payable, including any non-cash assets transferred or liabilities assumed, is recognised in profit or loss.

B K B | A N N U A L R E P O R T 2 0 2 1
S E R V I C E E X C E L L E N C E | E N T R E P R E N E U R S H I P | E A R N I N G S | E M P L O Y E E S | E N V I R O N M E N T
#IntegrityIntegrated
P E O P L E | P L A N E T | P R O F I T
#SustainabilitySynergised103 104
BKB LIMITED AND ITS SUBSIDIARIES (Registration number 1998/012435/06) Annual Financial Statements for the year ended 30 June 2021
ACCOUNTING POLICIES
48.10 Financial instruments (continued)
48.10.9 Reclassification
i. Financial assets
The Group only reclassifies affected financial assets if there is a change in the business model for managing financial assets. If a reclassification is necessary, it is applied prospectively from the reclassification date. Any previously stated gains, losses or interest are not restated.
The reclassification date is the beginning of the first reporting period following the change in business model which necessitates a reclassification.
ii. Financial liabilities
Financial liabilities are not reclassified.
48.10.10 Offsetting financial instruments
Financial assets and liabilities are offset and the net amount reported in the statement of financial position when there is a legally enforceable right to offset the recognised amounts and there is an intention to settle on a net basis or realise the asset and settle the liability simultaneously. The legally enforceable right must not be contingent on future events and must be enforceable in the normal course of business and in the event of default, insolvency or bankruptcy of the company or the counterpart.
48.10.11 Hedge accounting
Derivative financial instruments are initially recognised at fair value on the date a derivative contract is entered into and are subsequently remeasured at their fair value. At the inception of the hedge relationship, the Group documents the relationship between the hedging instrument and the hedged item, along with its risk management objectives and its strategy for undertaking various hedge transactions. At the inception of the hedge and on an ongoing basis, the Group documents whether the hedging instrument is effective in offsetting changes in fair values or cash flows of the hedged item attributable to the hedged risk, which is when the hedging relationships meet all of the following hedge effectiveness requirements:
there is an economic relationship between the hedged item and the hedging instrument; the effect of credit risk does not dominate the value changes that result from that economic relationship; and the hedge ratio of the hedging relationship is the same as that resulting from the quantity of the hedged item that the Group actually
hedges and the quantity of the hedging instrument that the Group actually uses to hedge that quantity of hedged item.
If a hedging relationship ceases to meet the hedge effectiveness requirement relating to the hedge ratio but the risk management objective for that designated hedging relationship remains the same, the Group adjusts the hedge ratio of the hedging relationship so that it meets the qualifying criteria again.
The Group designates the full change in the fair value of a forward contract (i.e. including the forward elements) as the hedging instrument for all of its hedging relationships involving forward contracts. The fair values of various derivative instruments used for hedging purposes and detail on movements in the hedging reserve are disclosed in the statement of changes in equity in the financial statements. The fair value of a hedging derivative is classified as a non-current asset or liability if the remaining maturity of the hedged item is more than 12 months after the reporting date and as a current asset or liability if the remaining maturity of the hedged item is less than 12 months from this date.
i. Cash flow hedges
Cash flow hedges cover the exposure to variability in cash flows due to foreign currency risk associated with a recognised asset and/or a highly probable forecasted transaction. Cash flow hedging instruments are mainly used to manage foreign exchange risks and these instruments mainly comprise foreign exchange contracts. The effective portion of changes in the fair value of qualifying hedging instruments that are designated and qualify as cash flow hedges is recognised in other comprehensive income and accumulated in equity, limited to the cumulative change in fair value of the hedged item from inception of the hedge. The gain or loss relating to the ineffective portion is recognised immediately in profit or loss in other operating gains (losses).
Amounts previously recognised in other comprehensive income and accumulated in equity are reclassified to profit or loss in the periods when the hedged item affects profit or loss, in the same line as the recognised hedged item. However, when the hedged forecast transaction results in the recognition of a non-financial asset or a non-financial liability, the gains and losses previously recognised in other comprehensive income and accumulated in equity are removed from equity and included in the initial measurement of the cost of the non-financial asset or non-financial liability. This transfer does not affect other comprehensive income. The deferred amounts are ultimately recognised in cost of goods sold in the case of inventory or in depreciation in the case of property, plant and equipment. Furthermore, if the Group expects that some or all of the loss accumulated in other comprehensive income will not be recovered in the future, that amount is immediately reclassified to profit or loss.
BKB LIMITED AND ITS SUBSIDIARIES (Registration number 1998/012435/06) Annual Financial Statements for the year ended 30 June 2021
ACCOUNTING POLICIES
48.10.11 Hedge accounting (continued) i. Cash flow hedges (continued)
The Group discontinues hedge accounting only when the hedging relationship (or a part thereof) ceases to meet the qualifying criteria (after rebalancing, if applicable). This includes instances when the hedging instrument expires or is sold, terminated or exercised. The discontinuation is accounted for prospectively. Any gain or loss recognised in other comprehensive income and accumulated in equity at that time remains in equity and is recognised when the forecast transaction is ultimately recognised in profit or loss. When a forecast transaction is no longer expected to occur, the gain or loss accumulated in equity is recognised immediately in profit or loss. 48.11 Tax
48.11.1 Current tax assets and liabilities
Current tax for current and prior periods is, to the extent unpaid, recognised as a liability. If the amount already paid in respect of current and prior periods exceeds the amount due for those periods, the excess is recognised as an asset.
Current tax liabilities (assets) for the current and prior periods are measured at the amount expected to be paid to (recovered from) the tax authorities, using the tax rates and tax laws that have been enacted or substantively enacted by the end of the reporting period.
48.11.2 Deferred tax assets and liabilities
A deferred tax liability is recognised for all taxable temporary differences, except to the extent that the deferred tax liability arises from the initial recognition of an asset or liability in a transaction which at the time of the transaction, affects neither accounting profit nor taxable profit (tax loss).
A deferred tax asset is recognised for all deductible temporary differences to the extent that it is probable that taxable profit will be available against which the deductible temporary difference can be utilised. A deferred tax asset is not recognised when it arises from the initial recognition of an asset or liability in a transaction at the time of the transaction, affects neither accounting profit nor taxable profit (tax loss).
A deferred tax asset is recognised for the carry forward of unused tax losses and unused STC credits to the extent that it is probable that future taxable profit will be available against which the unused tax losses and unused STC credits can be utilised.
Deferred tax assets and liabilities are measured at the tax rates that are expected to apply to the period when the asset is realised or the liability is settled, based on tax rates and tax laws that have been enacted or substantively enacted by the end of the reporting period.
48.11.3 Tax expenses
Current and deferred taxes are recognised as income or an expense and included in profit or loss for the period, except to the extent that the tax arises from:
a transaction or event which is recognised, in the same or a different period, to other comprehensive income, or a business combination.
Current tax and deferred taxes are charged or credited to other comprehensive income if the tax relates to items that are credited or charged, in the same or a different period, to other comprehensive income.
Current tax and deferred taxes are charged or credited directly to equity if the tax relates to items that are credited or charged, in the same or a different period, directly in equity.
48.12 Leases The Group leases offices, warehouses, retail stores, equipment and forklifts. Rental contracts are typically made for fixed periods of six months to seventeen years, but may have extension options as described below. Contracts may contain both lease and non-lease components. The Group allocates the consideration in the contract to the lease and non-lease components based on their relative stand-alone prices. However, for leases of property for which the Group is a lessee, it has elected not to separate lease and non-lease components and instead accounts for these as a single lease component. Lease terms are negotiated on an individual basis and contain a wide range of different terms and conditions. The lease agreements do not impose any covenants other than the security interests in the leased assets that are held by the lessor. Leased assets may not be used as security for borrowing purposes. Assets and liabilities arising from a lease are initially measured on a present value basis. Lease liabilities include the net present value of the following lease payments:
fixed payments (including in-substance fixed payments), less any lease incentives receivable; variable lease payment that are based on an index or a rate, initially measured using the index or rate as at the commencement date; amounts expected to be payable by the Group under residual value guarantees; and payments of penalties for terminating the lease, if the lease term reflects the Group exercising that option.

B K B | A N N U A L R E P O R T 2 0 2 1
S E R V I C E E X C E L L E N C E | E N T R E P R E N E U R S H I P | E A R N I N G S | E M P L O Y E E S | E N V I R O N M E N T
#IntegrityIntegrated
P E O P L E | P L A N E T | P R O F I T
#SustainabilitySynergised105 106
BKB LIMITED AND ITS SUBSIDIARIES (Registration number 1998/012435/06) Annual Financial Statements for the year ended 30 June 2021
ACCOUNTING POLICIES
48.12 Leases (continued) Lease payments to be made under reasonably certain extension options are also included in the measurement of the liability.
The lease payments are discounted using the interest rate implicit in the lease. If that rate cannot be readily determined, which is generally the case for leases in the Group, the lessee’s incremental borrowing rate is used, being the rate that the individual lessee would have to pay to borrow the funds necessary to obtain an asset of similar value to the right-of-use asset in a similar economic environment with similar terms, security and conditions.
To determine the incremental borrowing rate, the Group:
where possible, uses recent third-party financing received by the individual lessee as a starting point, adjusted to reflect changes in financing conditions since third party financing was received;
uses a build-up approach that starts with a risk-free interest rate adjusted for credit risk for leases held by the Group, which does not have recent third party financing, and
makes adjustments specific to the lease, e.g. term, country, currency and security.
The Group is exposed to potential future increases in variable lease payments based on an index or rate, which are not included in the lease liability until they take effect. When adjustments to lease payments based on an index or rate take effect, the lease liability is reassessed and adjusted against the right-of-use asset. Lease payments are allocated between principal and finance cost. The finance cost is charged to profit or loss over the lease period so as to produce a constant periodic rate of interest on the remaining balance of the liability for each period. Right-of-use assets are measured at cost comprising the following:
the amount of the initial measurement of lease liability; any lease payments made at or before the commencement date less any lease incentives received; and any initial direct costs, and restoration costs.
Right-of-use assets are stated at cost less depreciation. Right-of-use assets are generally depreciated over the shorter of the asset's useful life and the lease term on a straight-line basis. If the Group is reasonably certain to exercise a purchase option, the right-of-use asset is depreciated over the underlying asset’s useful life. While the Group revalued its land and buildings that are presented within property, plant and equipment, it has chosen not to do so for the right-of-use buildings held by the Group. Payments associated with short-term leases of equipment and vehicles and all leases of low-value assets are recognised on a straight-line basis as an expense in profit or loss. Short-term leases are leases with a lease term of 12 months or less. Low-value assets comprise IT equipment and small items of office equipment. Extension and termination options are included in a number of property leases across the Group. These are used to maximise operational flexibility in terms of managing the assets used in the Group’s operations. 48.13 Inventories
Inventories are measured at the lower of cost and net realisable value.
Net realisable value is the estimated selling price in the ordinary course of business less the estimated costs of completion and the estimated costs necessary to make the sale.
The cost of inventories comprises of all costs of purchase, costs of conversion and other costs incurred in bringing the inventories to their present location and condition.
The cost of wholesale inventories is stated at the actual cost of purchase of such inventories, or net realisable value, if lower. The cost of manufactured inventories are as follows:
Raw Materials: Actual cost determined on a first-in-first-out basis. Finished Goods and Work-in-progress: Raw materials, direct labour, other direct costs and related production overheads (based
on normal capacity).
Trading stock is generally determined on a weighted average basis and includes transportation and handling charges.
Grain inventories held in terms of brokerage transactions are measured at fair value at period end, based on the prevailing mark-to-market price of the specific inventory item as determined by SAFEX. The fair value of SAFEX commodity grain inventories is calculated based on SAFEX rates, less location differential, less grade discount and premiums at year end. The fair value of non-SAFEX commodity grain inventories is calculated based on willing buyer / willing seller prices at year end.
When inventories are sold the carrying amount of those inventories is recognised as an expense in the period in which the related revenue is recognised. The amount of any write-down of inventories to net realisable value and all losses of inventories are recognised as an expense in the period the write-down or loss occurs. The amount of any reversal of any write-down of inventories, arising from an increase in net realisable value, are recognised as a reduction in the amount of inventories recognised as an expense in the period in which the reversal occurs.
BKB LIMITED AND ITS SUBSIDIARIES (Registration number 1998/012435/06) Annual Financial Statements for the year ended 30 June 2021
ACCOUNTING POLICIES
48.14 Impairment of assets
The Group assesses at each end of the reporting period whether there is any indication that an asset may be impaired. If any such indication exists, the Group estimates the recoverable amount of the asset.
Irrespective of whether there is any indication of impairment, at the end of each financial year the Group also:
tests intangible assets with an indefinite useful life or intangible assets not yet available for use for impairment annually by comparing its carrying amount with its recoverable amount.
tests goodwill acquired in a business combination for impairment.
If there is any indication that an asset may be impaired, the recoverable amount is estimated for the individual asset. If it is not possible to estimate the recoverable amount of the individual asset, the recoverable amount of the cash-generating unit to which the asset belongs is determined.
The recoverable amount of an asset or a cash-generating unit is the higher of its fair value less costs to sell and its value in use. If the recoverable amount of an asset is less than its carrying amount, the carrying amount of the asset is reduced to its recoverable amount. That reduction is an impairment loss. An impairment loss of assets carried at cost less any accumulated depreciation or amortisation is recognised immediately in profit or loss. Any impairment loss of a revalued asset is treated as a revaluation decrease.
Goodwill acquired in a business combination is, from the acquisition date, allocated to each of the cash-generating units, or groups of cash- generating units, that are expected to benefit from the synergies of the combination, irrespective of whether other assets or liabilities of the acquiree are assigned to those units or groups of units.
Each unit or group of units to which the goodwill is so allocated represents the lowest level within the entity at which the goodwill is monitored for internal management purposes, and is not larger than an operating segment as defined by paragraph 5 of IFRS 8 Operating Segments before aggregation.
An impairment loss is recognised for cash-generating units if the recoverable amount of the unit is less than the carrying amount of the units. The impairment loss is allocated to reduce the carrying amount of the assets of the unit in the following order:
first, to reduce the carrying amount of any goodwill allocated to the cash-generating unit and then, to the other assets of the unit, pro rata on the basis of the carrying amount of each asset in the unit.
The Group assesses at each reporting date whether there is any indication that an impairment loss recognised in prior periods for assets other than goodwill may no longer exist or may have decreased. If any such indication exists, the recoverable amounts of those assets are estimated.
The increased carrying amount of an asset other than goodwill attributable to a reversal of an impairment loss does not exceed the carrying amount that would have been determined had no impairment loss been recognised for the asset in prior periods. A reversal of an impairment loss on assets carried at cost less accumulated depreciation or amortisation other than goodwill is recognised immediately in profit or loss. Any reversal of an impairment loss of a revalued asset is treated as a revaluation increase.
48.15 Share capital and equity
An equity instrument is any contract that evidences a residual interest in the assets of an entity after deducting all of its liabilities.
Ordinary shares are classified as equity. Ordinary shares are recognised at par value and classified as 'share capital' in equity. Any amounts received from the issue of shares in excess of par value is classified as 'share premium' in equity.
Shares issued at below fair value to conclude BEE transactions, where control over the counterparty was not present, are accounted for in profit or loss at the difference between the fair value of the shares and the issue price. A BEE reserve, included in non-distributable reserves, is credited in the statement of financial position.
If the Group reacquires its own equity instruments, the consideration paid, including any directly attributable incremental costs (net of income taxes) on those treasury shares is deducted from equity. No gain or loss is recognised in profit or loss on the purchase, sale, issue or cancellation of the Group’s own equity instruments. Any consideration paid or received shall be recognised directly in equity.
Shares held by the BKB Personnel Share Trust are deducted from equity attributable to the Group’s equity holders on consolidation until the shares are cancelled, re-issued or disposed of. Where such shares are subsequently sold or re-issued, any consideration received, net of any directly attributable incremental transaction costs, is included in equity attributable to the Group’s equity holders.
Incremental costs directly attributable to the issue of new shares or options are shown in equity as a deduction, net of tax, from the proceeds.

B K B | A N N U A L R E P O R T 2 0 2 1
S E R V I C E E X C E L L E N C E | E N T R E P R E N E U R S H I P | E A R N I N G S | E M P L O Y E E S | E N V I R O N M E N T
#IntegrityIntegrated
P E O P L E | P L A N E T | P R O F I T
#SustainabilitySynergised107 108
BKB LIMITED AND ITS SUBSIDIARIES (Registration number 1998/012435/06) Annual Financial Statements for the year ended 30 June 2021
ACCOUNTING POLICIES
48.16 Share based payments
The Group operates an equity-settled share-based payment compensation plan. The fair value of bonus shares and performance shares granted to group directors and senior executives are recognised as an employee expense with a corresponding increase in equity. The fair value is measured at grant date and expensed over the period during which the employee becomes unconditionally entitled to the equity instruments. The fair value of the instruments granted is measured using generally accepted valuation techniques, taking into account the terms and conditions upon which the instruments are granted excluding the impact of non-market vesting conditions. Fair value is measured using the Monte-Carlo option pricing models where applicable. The expected life used in the models has been adjusted, based on management’s best estimate, for the effects of behavioural considerations such as volatility, dividend yield and the vesting period. The fair value takes into account the terms and conditions on which these incentives are granted and the extent to which the employees have rendered service to the reporting date. Non-market vesting conditions are included in assumptions about the number of shares that are expected to vest. At each reporting date, the entity revises its estimates of the number of shares that are expected to vest. It recognises the impact of the revision of original estimates, if any, for equity-settled share-based payments, in the income statement, with a corresponding adjustment to equity. The grant by the Company of its equity instruments to the employees of subsidiary undertakings in the Group is treated as a capital contribution. The fair value of employee services received, measured by reference to the grant date fair value of equity instruments granted, is recognised over the vesting period as an increase to investment in subsidiary undertakings, with a corresponding credit to equity in the parent entity accounts. The Group’s net vesting impact on the vesting of share-based payment obligations is transferred to retained earnings within the statement of changes in equity.
48.17 Employee benefits
48.17.1 Short-term employee benefits
The cost of short-term employee benefits, (those payable within 12 months after the service is rendered, such as paid vacation leave and sick leave, bonuses, and non-monetary benefits such as medical care), are recognised in the period in which the service is rendered and are not discounted.
The expected cost of compensated absences is recognised as an expense as the employees render services that increase their entitlement or, in the case of non-accumulating absences, when the absence occurs.
The expected cost of profit sharing and bonus payments is recognised as an expense when there is a legal or constructive obligation to make such payments as a result of past performance.
48.17.2 Defined contribution plans
The Group provides retirement and income protection benefits through a defined contribution plan for all of its permanent employees. The plan is administered separately from the Group and is governed by the Pension Funds Act.
A defined contribution plan is a pension plan into which the Group pays fixed contributions into a separate entity (a Fund) and will have no legal or constructive obligations to pay further contributions if the fund does not have sufficient assets to pay all employees’ benefits relating to employee service in the current and prior periods.
Payments to defined contribution retirement benefit plans are charged as an expense as they fall due. 48.17.3 Defined benefit plans
BKB Limited provides post-retirement medical benefits to certain retired employees.
The post-retirement medical liability is valued triennially by independent, qualified actuaries. The liability is determined by discounting the future benefits payable at interest rates of government bonds with approximately the same maturity dates as the medical liability. The expected costs of these benefits are accrued over the period of employment, using the projected unit credit method. Re-measurements arising from experience adjustments and changes in actuarial assumptions are charged or credited to other comprehensive income in the year in which they arise.
For defined benefit plans the cost of providing the benefits is determined using the projected unit credit method.
Past service costs are recognised immediately to the extent that the benefits are already vested, and are otherwise amortised on a straight line basis over the average period until the amended benefits become vested.
Actuarial gains and losses are recognised in the year in which they arise, in other comprehensive income.
The amount recognised in the statement of financial position represents the present value of the defined benefit obligation as adjusted for unrecognised actuarial gains and losses and unrecognised past service costs.
BKB LIMITED AND ITS SUBSIDIARIES (Registration number 1998/012435/06) Annual Financial Statements for the year ended 30 June 2021
ACCOUNTING POLICIES
48.18 Provisions and contingencies
Provisions are recognised when:
the Group has a present obligation as a result of a past event; it is probable that an outflow of resources embodying economic benefits will be required to settle the obligation; and a reliable estimate can be made of the obligation.
The amount of a provision is the present value of the expenditure expected to be required to settle the obligation.
Where some or all of the expenditure required to settle a provision is expected to be reimbursed by another party, the reimbursement shall be recognised when, and only when, it is virtually certain that reimbursement will be received if the entity settles the obligation. The reimbursement shall be treated as a separate asset. The amount recognised for the reimbursement shall not exceed the amount of the provision.
Provisions are not recognised for future operating losses.
If an entity has a contract that is onerous, the present obligation under the contract shall be recognised and measured as a provision.
After their initial recognition contingent liabilities recognised in business combinations that are recognised separately are subsequently measured at the higher of:
the amount that would be recognised as a provision; and the amount initially recognised less cumulative amortisation.
Contingent assets and contingent liabilities are not recognised. Contingencies are disclosed in Note 39. 48.19 Government grants
Government grants are recognised when there is reasonable assurance that:
the Group will comply with the conditions attaching to them; and the grants will be received.
Government grants related to assets, including non-monetary grants at fair value, are presented in the statement of financial position as a reduction of the carrying amount of the asset, which results in reduced depreciation expense.
48.20 Revenue from contracts with customers
Revenue is measured at the fair value of the consideration received or receivable and represents the amount receivable for goods and services provided in the normal course of business, net of trade discounts, volume rebates and value added tax.
Revenue from contracts with customers is measured based on the consideration specified in a contract and excludes amounts collected on behalf of third parties. The Group recognises revenue when it transfers control of a product or service to a customer. The Group recognises revenue from the following major sources:
Sale of goods - wholesale (Brokerage, Fruit, Grain and Sugar) Sale of goods - retail (Trading) Rendering of services (Brokerage services, Trading and Grain) Commission received (Brokerage, Livestock auctioneering, property transactions and Grain) Rental income Interest income
Revenue is measured based on the consideration specified in a contract with a customer and excludes amounts collected on behalf of third parties. The Group recognises revenue when it transfers control of a product or service to a customer. The Group does not expect to have any contracts where the period between transfer of the promised goods or services to the customer and payment by the customer exceeds one year. As a consequence, the Group does not adjust any of the transaction prices for the time value of money.
48.20.1 Sale of goods - wholesale
For sales of goods to the wholesale market, revenue is recognised when control of the goods has transferred, being when the goods have been shipped to the wholesaler’s specific location. Following delivery, the wholesaler has full discretion over the manner of distribution and price to sell the goods, has the primary responsibility when on selling the goods and bears the risks of obsolescence and loss in relation to the goods. A receivable is recognised by the Group when the goods are delivered/shipped to the wholesaler as this represents the point in time at which the right to consideration becomes unconditional, as only the passage of time is required before payment is due. No element of financing is deemed present as the sales are made in terms of credit terms, which are consistent with market practice.

B K B | A N N U A L R E P O R T 2 0 2 1
S E R V I C E E X C E L L E N C E | E N T R E P R E N E U R S H I P | E A R N I N G S | E M P L O Y E E S | E N V I R O N M E N T
#IntegrityIntegrated
P E O P L E | P L A N E T | P R O F I T
#SustainabilitySynergised109 110
BKB LIMITED AND ITS SUBSIDIARIES (Registration number 1998/012435/06) Annual Financial Statements for the year ended 30 June 2021
ACCOUNTING POLICIES
48.20 Revenue from contracts with customers (continued) 48.20.1 Sale of goods – wholesale (continued) Sale of wholesale goods comprises:
Sale of processed maize and related products Margin on grain and related commodities Sale of manufactured lucerne and hay products Sale of surplus grain, upgradings and downgradings Packaging, marketing and sale of raisins Sale of sugar and related products Sale of wool and mohair
48.20.2 Sale of goods - retail
The Group sells goods directly to customers through its own retail outlets. Revenue is recognised at a point in time for sale of goods.
For sale of goods to retail customers, revenue is recognised when control of the goods has transferred, being at the point the customer purchases the goods at the retail outlet. Payment of the transaction price is due immediately at the point the customer purchases the goods, or based on credit terms negotiated for account holding customers. A receivable is recognised for account holding customers. No financing element is recognised as the payment terms are less than 6 months.
48.20.3 Rendering of services
Income is recognised at an amount that reflects the consideration to which the Group expects to become entitled for providing services to a customer. Income is measured based on the consideration specified in the contract with the customer and excludes amounts collected on behalf of third parties. The Group recognises income as the service is provided to a customer.
Rendering of services comprises:
Handling, pressing and storage of wool and mohair Handling and storage of grain Shearing of animals
48.20.4 Commission received
Commission income is recognised at an amount that reflects the consideration to which the Group expects to become entitled for providing services to a customer. Income is measured based on the consideration specified in the contract with the customer and excludes amounts collected on behalf of third parties. The Group recognises income as the service is provided to a customer.
Commission received comprises:
Commission on brokerage of wool and mohair Commission on sale of livestock and agricultural products Commission on sale of residential (urban and rural), commercial and farm properties
48.20.5 Rental income
Rental income is recognised on a straight-line basis over the period of the lease. 48.20.6 Interest income
Interest income is recognised on a time-proportion basis using the effective interest method. Interest received from debtors is included in revenue.
48.21 Cost of sales
When inventories are sold, the carrying amount of those inventories is recognised as an expense in the period in which the related revenue is recognised. The amount of any write-down of inventories to net realisable value and all losses of inventories are recognised as an expense in the period the write-down or loss occurs. The amount of any reversal of any write-down of inventories, arising from an increase in net realisable value, is recognised as a reduction in the amount of inventories recognised as an expense in the period in which the reversal occurs.
The related costs of providing services recognised as revenue in the current period is included in cost of sales. Contract costs comprise: costs that relate directly to the specific contract; costs that are attributable to contract activity in general and can be allocated to the contract; and such other costs as are specifically chargeable to the customer under the terms of the contract.
Cost of sales is reduced by the amount recognised in inventory as a "right to return goods asset" which represents the Group right to recover products from customers where customers exercise their right of return under the Group returns policy.
BKB LIMITED AND ITS SUBSIDIARIES (Registration number 1998/012435/06) Annual Financial Statements for the year ended 30 June 2021
ACCOUNTING POLICIES
48.22 Borrowing costs
Borrowing costs that are directly attributable to the acquisition, construction or production of a qualifying asset are capitalised as part of the cost of that asset until such time as the asset is ready for its intended use. The amount of borrowing costs eligible for capitalisation is determined as follows:
Actual borrowing costs on funds specifically borrowed for the purpose of obtaining a qualifying asset less any temporary investment of those borrowings.
Weighted average of the borrowing costs applicable to the entity on funds generally borrowed for the purpose of obtaining a qualifying asset. The borrowing costs capitalised do not exceed the total borrowing costs incurred.
The capitalisation of borrowing costs commences when:
expenditures for the asset have occurred; borrowing costs have been incurred, and activities that are necessary to prepare the asset for its intended use or sale are in progress.
Capitalisation is suspended during extended periods in which active development is interrupted.
Capitalisation ceases when substantially all the activities necessary to prepare the qualifying asset for its intended use or sale are complete.
All other borrowing costs are recognised as an expense in the period in which they are incurred.
48.23 Translation of foreign currencies
48.23.1 Foreign currency transactions
A foreign currency transaction is recorded on initial recognition in Rands by applying to the foreign currency amount the spot exchange rate between the functional currency and the foreign currency at the date of the transaction.
At the end of the reporting period:
foreign currency monetary items are translated using the closing rate; non-monetary items that are measured in terms of historical cost in a foreign currency are translated using the exchange rate at the
date of the transaction; and non-monetary items that are measured at fair value in a foreign currency are translated using the exchange rates at the date when
the fair value was determined.
Exchange differences arising on the settlement of monetary items or on translating monetary items at rates different from those at which they were translated on initial recognition during the period or in previous annual financial statements are recognised in profit or loss in the period in which they arise.
When a gain or loss on a non-monetary item is recognised to other comprehensive income and accumulated in equity, any exchange component of that gain or loss is recognised to other comprehensive income and accumulated in equity. When a gain or loss on a non-monetary item is recognised in profit or loss, any exchange component of that gain or loss is recognised in profit or loss.
Cash flows arising from transactions in a foreign currency are recorded in Rands by applying to the foreign currency amount the exchange rate between the Rand and the foreign currency at the date of the cash flow.

B K B | A N N U A L R E P O R T 2 0 2 1
P E O P L E | P L A N E T | P R O F I T
#SustainabilitySynergised111
WWW.BKB.CO.ZA