Annual Update 2021
72
Annual Update 2021
-
Upload
khangminh22 -
Category
Documents
-
view
0 -
download
0
Transcript of Annual Update 2021
Annual Update 2021

HIGHLIGHTS
Despite herd rebuild, the Australian beef
industry has halved its CO2e emissions since 2005, recording a reduction of
51.46% in 2018.
Regular pain relief usage for cattle has risen
to 30% from 21%.
Australia continues to be free from World
Organisation for Animal Health Official
Diseases.
Awareness of Animal Welfare Standards for
Cattle has risen to 97.3% from 73%.
Producers rated their global life satisfaction
at 79.45 out of 100, indicating an increase in quality of life from
previous years.
The processing sector reduced the amount of
CO2e emitted per tonne Hot Standard Carcase Weight by 8.1% when processing
beef, and further reduced water usage
by 7.9%.
Responses to the producer sustainability survey increased four-fold
to over 1,100.
2

CHALLENGES
The processing sector has faced export bans and continues to work
through non-tariff trade barriers.
Drought-impacted livestock supply caused the early short-term closure of
processing plants.
The ongoing response to COVID-19 created
issues in sourcing labour in regional
communities.
Floods and fire continue to impact farmers and the animals they care for in many parts of
the country.
Rapid and effective responses to changing
health advice kept the beef supply chain operational
during the COVID-19 emergency.
Australian Beef Sustainability2021
Annual Update
3

ABOUTthis report
The Australian Beef Sustainability Framework (ABSF) was developed by the Australian beef industry to meet the changing expectations of customers, consumers, investors, and other external stakeholders. This is achieved by identifying opportunities for the beef industry to improve and to showcase its sustainability credentials, through tracking performance against industry priorities.
This Annual Update is the fourth of its kind, and represents the Australian beef industry across the entire value chain, including farms, feedlots, transport, processing, and export. Since its launch in 2017, considerable work has been undertaken to optimise indicators and collect the data to map industry’s performance. This is achieved through extensive consultation and industry programs outlined in this update. The result is a customer-facing document which aims to:
» Promote industry transparency and progress to customers and the community
» Advise industry investment for continuous improvement in areas most important to our customers and stakeholders
» Help protect and grow access to investment and finance by providing evidence of performance and continuous improvement
» Foster constructive relationships with stakeholders to work collaboratively on continuous improvement.
SustainabilitySustainability is the production of beef in a manner that is socially, environmentally, and economically responsible. We do this through the care of natural resources, people and the community, the health and welfare of animals, and the drive for continuous improvement.
VisionA thriving Australian beef industry that strives to continuously improve the wellbeing of people, animals and the environment.
The Framework does not:
» Establish or endorse measurement systems at an individual business level
» Provide an accreditation or certification system
» Endorse prescriptive management practices
» Create additional paperwork for individual businesses.
The ABSF is driven by industry, and led by an independent Sustainability Steering Group (SSG). Peak Industry Councils (Australian Livestock Exporters Council, Australian Lot Feeders’ Association, Australian Meat Industry Council, and the Cattle Council of Australia) have provided valuable feedback, both on this update and on the other work of the Framework. Guiding principles, governance, and further history of the ABSF are available in the Appendix.
4

CONTENTS
Highlights and challenges ........................................ 2
About this report ...................................................... 4
Letter from RMAC Chair ........................................... 6
Letter from SSG Chair ............................................... 7
Our industry ............................................................... 8
Market snapshot ..................................................... 10
Integrity systems ...................................................... 11
The Australian Beef Sustainability Framework ..... 12
Six key priorities ...................................................... 14
Animal husbandry techniques ................................ 15
Profitability across value chain ............................... 20
Balance of tree and grass cover ............................. 24
Antimicrobial stewardship ...................................... 29
Manage climate change risk ................................... 33
Health & safety of people in the industry ............. 40
Scorecard ................................................................. 44
Progressing the ABSF .............................................. 57
Materiality assessment ............................................ 61
Appendices .............................................................. 63
Glossary .................................................................... 67
References ............................................................... 70
Australian Beef Sustainability2021
Annual Update
5

LETTER FROMRed Meat Advisory Council Chair
This year marks five years since the Red Meat Advisory Council appointed the first Sustainability Steering Group in 2016. Australia’s beef industry supply chain set the agenda well before most other industries had even started to consider similar reporting frameworks. As an industry, we should be proud of the progressive leadership that we collectively demonstrated more than half a decade ago.
There is no doubt that the Framework’s ongoing success is critical to how our industry engages with customers, the community, and policymakers. Our industry is at the forefront of setting global benchmarks for animal health, welfare, environmental management and product integrity. We have an excellent story to tell, and we should not be afraid to tell it.
Our industry’s ability to articulate an evidence-based position is becoming increasingly important. There is no shortage of parties seeking to attack Australia’s beef industry by spreading disinformation. Whether it is from animal liberation activists or manufactured plant-based protein corporations, as an industry, we need to unite against disinformation and use tools like the Sustainability Framework to chart a positive course forward.
It is welcoming to observe the increased engagement the Framework is enjoying from businesses and representative bodies across the supply chain. Not only has the number of respondents to the Framework’s producer survey increased by manyfold, there is now also a strong desire by representative bodies to be more closely involved.
Throughout the next 12 months, the Red Meat Advisory Council will be working in partnership with our members and the Sustainability Steering Group to strengthen the Framework’s support. Half a decade is an important milestone that provides an opportunity to review and further integrate industry priorities within the Framework. Working together through this process, we will support our industry’s vision to double the value of Australian red meat sales as the trusted source of the highest quality protein by 2030.
JOHN MCKILLOPIndependent Chair, Red Meat Advisory Council
6

LETTER FROMSustainability Steering Group Chair
The past year has been like no other – travel restrictions, lockdowns, quarantines, and international politics have disrupted supply chains and important revenue pathways.
However, it has been humbling to see the resilience that the Australian beef industry has displayed to ensure we continue to provide nutritious, safe, and sustainably produced beef to our consumers.
We have also experienced record sale prices, increased investment in climate and welfare initiatives, a challenging time for processors, and a sharpened focus on industry working together to achieve its true potential.
On behalf of the Sustainability Steering Group, I am honoured to present the Australian Beef Sustainability 2021 Annual Update. In this iteration, we are proud to present the outstanding work being undertaken by industry to continually build sustainability, and to make it a foundational consideration in all that we do. This document also seeks to transparently provide much of the information our customers and broader community have come to expect.
In compiling this Update, we have sourced the most accurate data available, and engaged key stakeholders along the way, to ensure we do our part in working together to capture the many opportunities before our industry.
A major activity of 2020 was the review of the materiality assessment. As part of this process we consulted with both industry and external stakeholders to contribute to setting the priorities and scope that the Australian Beef Sustainability Framework will report on over the next five years. The extensive consultative process of interviews, surveys, and forum discussions have allowed us to achieve a comprehensive and robust analysis of the current sustainability parameters we are operating within.
While most updates from this review have not yet been implemented due to time constraints, they will be fully rolled out in time for next year’s iteration.
I encourage you to review the progress industry is making across the six key priorities (page 14) and how our performance is trending in the scorecard (page 44).
We appreciate the time taken to read and engage with the Australian Beef Sustainability Annual Update, and we look forward to further engagement with all of our stakeholders over the coming year to recognise and celebrate the value and performance of our industry.
TESS HERBERTChair, Sustainability Steering Group Australian Beef Sustainability Framework
Australian Beef Sustainability2021
Annual Update
7
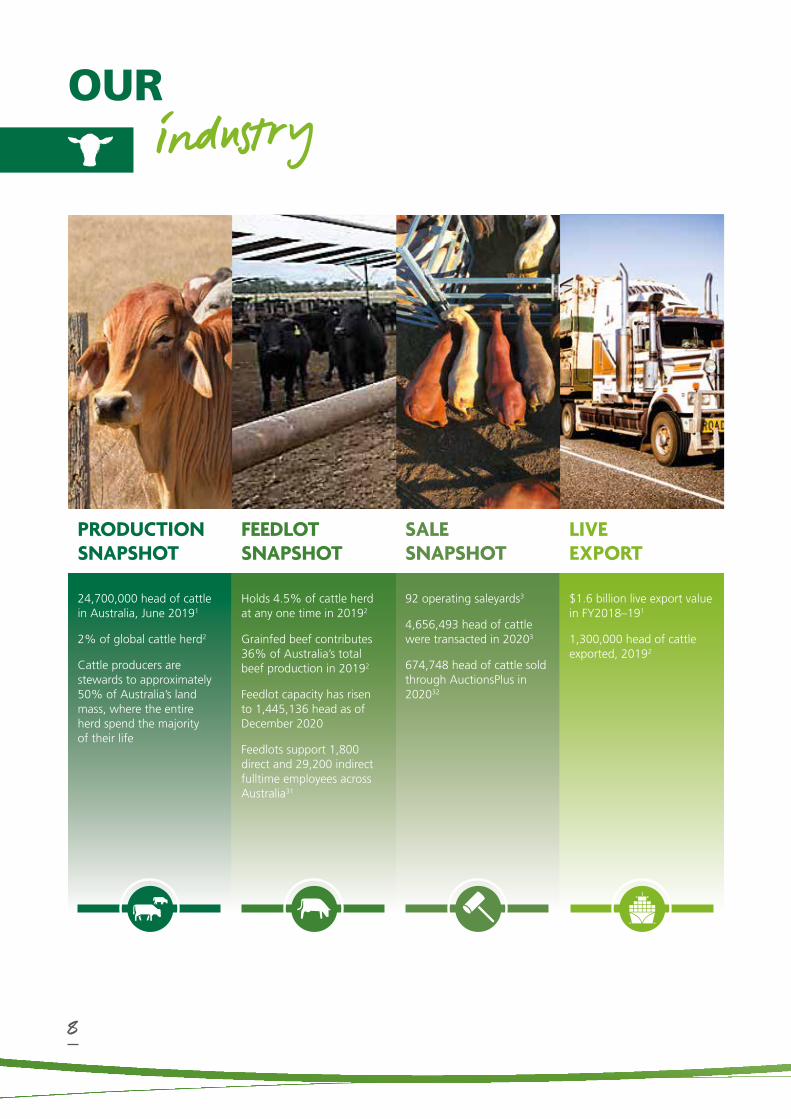
OURIndustry
24,700,000 head of cattle in Australia, June 20191
2% of global cattle herd2
Cattle producers are stewards to approximately 50% of Australia’s land mass, where the entire herd spend the majority of their life
Holds 4.5% of cattle herd at any one time in 20192
Grainfed beef contributes 36% of Australia’s total beef production in 20192
Feedlot capacity has risen to 1,445,136 head as of December 2020
Feedlots support 1,800 direct and 29,200 indirect fulltime employees across Australia31
92 operating saleyards3
4,656,493 head of cattle were transacted in 20203
674,748 head of cattle sold through AuctionsPlus in 202032
$1.6 billion live export value in FY2018–191
1,300,000 head of cattle exported, 20192
PRODUCTION SNAPSHOT
FEEDLOT SNAPSHOT
SALE SNAPSHOT
LIVE EXPORT
8

$13.5 billion in exports by meat processors, FY2018-192
31,200 full-time employees in processing industry, FY192
Domestic sales totaled $11.3 billion in FY192
3% increase in the value of beef sold up to $20.2 billion in FY1
$72.5 billion red meat turnover FY19, up 7% from previous FY2
Australia’s red meat and livestock industry accounted for 1.4% of Australia’s GDP FY192
Produced 2,400,000t carcase weight of beef and veal2
Provided 36.9 billion meals to the world that met the recommended daily intake of red meat4
45,712 agricultural businesses involved with cattle, 2018–191
Red meat and livestock industry directly employed 189,000 and indirectly 245,000 - a total of 434,000, 2018–192
90% of red meat employees live in rural areas contributing to Australia’s regional communities2
PROCESSING SNAPSHOT
HOW MUCH IS IT WORTH?
HOW MUCH IS PRODUCED?
PEOPLE IN THE INDUSTRY
Australian Beef Sustainability2021
Annual Update
9

Netherlands
0.6%United
Kingdom
0.3%
Singapore
0.5%
Malaysia
0.8%
Vietnam
1.1%
HongKong
Canada
1.1%
Japan
23.4%
SouthKorea
13.2%
1.0% Saudi Arabia0.7% UAE0.2% Kuwait0.2% Qatar
Middle East China
2.1%
Taiwan
2.3%
Philippines
2.1%
Indonesia
4.7%
24.4%
0.4%
Thailand
0.5%
United States
20.4%
MARKETsnapshot
Figure 1: Australian beef exports by volume (2019).
In 2019, Australia’s top three beef export destinations (in volume terms) were China (300,133 tonnes swt, or 24.4% of total exports), Japan (287,497 tonnes swt, or 23.4% of total exports) and the US (250,980 tonnes swt, or 20.4% of total exports).2
Australia produces 2% of the world’s beef supply1
Australia supplies 16% of world beef exports5
In 2019, Australia exported 76% of its total beef and veal production to over 70 countries1
10
Netherlands
0.6%United
Kingdom
0.3%
Singapore
0.5%
Malaysia
0.8%
Vietnam
1.1%
HongKong
Canada
1.1%
Japan
23.4%
SouthKorea
13.2%
1.0% Saudi Arabia0.7% UAE0.2% Kuwait0.2% Qatar
Middle East China
2.1%
Taiwan
2.3%
Philippines
2.1%
Indonesia
4.7%
24.4%
0.4%
Thailand
0.5%
United States
20.4%
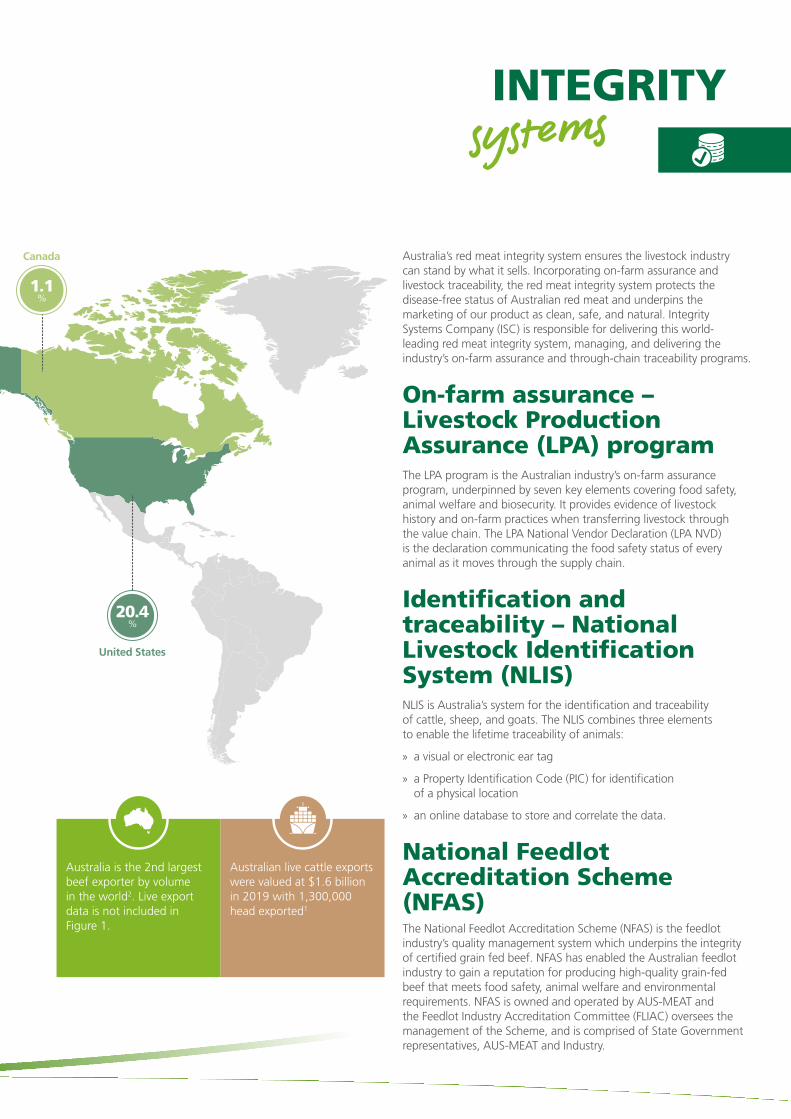
INTEGRITYsystems
Australia’s red meat integrity system ensures the livestock industry can stand by what it sells. Incorporating on-farm assurance and livestock traceability, the red meat integrity system protects the disease-free status of Australian red meat and underpins the marketing of our product as clean, safe, and natural. Integrity Systems Company (ISC) is responsible for delivering this world- leading red meat integrity system, managing, and delivering the industry’s on-farm assurance and through-chain traceability programs.
On-farm assurance – Livestock Production Assurance (LPA) programThe LPA program is the Australian industry’s on-farm assurance program, underpinned by seven key elements covering food safety, animal welfare and biosecurity. It provides evidence of livestock history and on-farm practices when transferring livestock through the value chain. The LPA National Vendor Declaration (LPA NVD) is the declaration communicating the food safety status of every animal as it moves through the supply chain.
Identification and traceability – National Livestock Identification System (NLIS)NLIS is Australia’s system for the identification and traceability of cattle, sheep, and goats. The NLIS combines three elements to enable the lifetime traceability of animals:
» a visual or electronic ear tag
» a Property Identification Code (PIC) for identification of a physical location
» an online database to store and correlate the data.
National Feedlot Accreditation Scheme (NFAS) The National Feedlot Accreditation Scheme (NFAS) is the feedlot industry’s quality management system which underpins the integrity of certified grain fed beef. NFAS has enabled the Australian feedlot industry to gain a reputation for producing high-quality grain-fed beef that meets food safety, animal welfare and environmental requirements. NFAS is owned and operated by AUS-MEAT and the Feedlot Industry Accreditation Committee (FLIAC) oversees the management of the Scheme, and is comprised of State Government representatives, AUS-MEAT and Industry.
Australia is the 2nd largest beef exporter by volume in the world2. Live export data is not included in Figure 1.
Australian live cattle exports were valued at $1.6 billion in 2019 with 1,300,000 head exported1

THE AUSTRALIAN BEEF
Sustainability Framework
Animal welfareThe wellbeing and health of animals is of paramount importance to producers and the entire beef value chain. Each year, industry invests in research, development, and adoption programs to ensure high standards of animal welfare and to continually identify and develop ways to do things better.
Good animal welfare is entrenched in our industry’s standards and guidelines, and has led to Australia becoming world leaders in animal welfare.
The animal welfare theme of the ABSF was developed with the five domains of animal welfare in mind, and continues to be a key demonstrator of industry’s commitment to sustainable practices.
PRIORITIESEnhance animal wellbeing
1.1 Competent livestock handling
1.2 Safe livestock transport
1.3 Animal husbandry techniques
1.4 Humane processing
Promote animal health
2.1 Maintain healthy livestock
2.2 Minimise biosecurity risk
Economic resilienceEconomic health is intrinsically linked to the overall performance and capability of any business, and thus an important measure of sustainability.
Australia is one of the largest exporters and most efficient producers of beef in the world, however it is important to understand how profitability delivers resilience against unexpected shocks such as drought and market change, which can have flow-on effects to environmental performance and animal welfare.
The ABSF reports on economic resilience by focusing on aspects of reducing costs to industry, which are higher than our major global competitors, and boosting productivity. As global demand for Australian beef increases, expanding the industry’s access to international markets will support more strong and profitable beef businesses.
PRIORITIESEnhance profitability and productivity
3.1 Profitability across value chain
3.2 Farm, feedlot and processor productivity and cost of production
Optimise market
4.1 Barriers to trade
4.2 Product integrity
1.
3.
2.4.
12

Environmental stewardshipAs a major land steward, the beef industry shares a close and important relationship with the environment in which it operates, and prospers through maintaining a thriving ecosystem and healthy soil, vegetation, water, and air.
The beef industry is, therefore, ideally positioned to contribute to the ecological health of the Australian landscape by implementing sustainable land management and grazing practices.
Australian beef producers are committed to fulfilling their role as environmental stewards, while nurturing their surrounding ecosystems to foster productivity.
The ABSF also highlights how industry is adapting to the changing environment.
PRIORITIESImprove land management practice
5.1 Minimise nutrient and sediment loss
5.2 Balance of tree and grass cover
Mitigate and manage climate change
6.1 Manage climate change risk
6.2 Climate change adaptation and preparedness
6.3 Efficient use of water
Minimise waste
7.1 Solid waste to landfill from processing
People and the communityA safe, healthy, and capable workforce, together with prosperous and resilient regional communities, is essential to the sustainability of beef production.
The ABSF reports how the industry promotes a safe, healthy, and growing workforce, and how it provides greater access to skills and labour.
The beef industry also supports human health across Australia and the world by providing safe and nutritious food, while increasing the prosperity of rural and regional communities.
PRIORITIESProduce nutritious and safe food
8.1 Beef is eaten as part of a healthy balanced diet
8.2 Food safety
8.3 Antimicrobial stewardship
Build workplace capacity
9.1 Education and training
9.2 Diversity in the workforce
Ensure health, safety and wellbeing of people in the industry
10.1 Health and safety of people in industry
10.2 Wellbeing of people in the industry
5.9.
8.
6.
7.
10.
4 THEMES
10 PRIORITY
AREAS
23 PRIORITIES
49 INDICATORS
THE AUSTRALIAN BEEF SUSTAINABILITY FRAMEWORK IS MADE UP OF:
Australian Beef Sustainability2021
Annual Update
13

SIX KEYPriorities
ANIMAL HUSBANDRY TECHNIQUESThese techniques include castration, disbudding, horn removal (dehorning), and spaying. This priority looks at alternatives to practices (e.g. breeding selection for the polled gene, immune-contraceptive desexing, effective electronic identification) and, in the interim, administration of pain relief when carrying out necessary but aversive husbandry procedures.
PROFITABILITY ACROSS VALUE CHAINTo be economically sustainable, the industry must generate a positive rate of return over the long term on all capital used in cattle raising and beef production. Currently this priority looks only at farm business profit, due to data limitations.
BALANCE OF TREE AND GRASS COVERBeef production is intrinsically linked to well-managed landscapes. This priority looks at industry’s care of natural resources and biodiversity, by measuring the area of land managed for environmental outcomes and changes in vegetation.
ANTIMICROBIAL STEWARDSHIPMaintaining the efficacy of antimicrobials so that infections in humans and animals remain treatable is of critical importance. This priority looks at industry use of antibiotics and surveillance programs to detect resistance to them.
MANAGE CLIMATE CHANGE RISKGreenhouse gases are emitted throughout the beef value chain, including methane produced through cattle’s natural digestion (scope 3 emissions). This priority looks at carbon dioxide equivalents emitted when raising and processing beef, as well as carbon dioxide equivalents the industry removes from the environment through carbon sequestration.
HEALTH AND SAFETY OF PEOPLE IN INDUSTRYWorking environments through the beef value chain, especially on-farm, may expose employees and contractors to risk. This priority looks at notifiable fatalities, however industry recognises further investigation of injuries could highlight risk factors and improve work safety.
1.
2.
3.
4.
5.
6.
At the first Consultative Committee meeting held in August 2017, industry stakeholders were asked which of the 23 priority areas within the ABSF industry should focus on. The consultation resulted in the identification of five key priority areas, with a sixth added by the SSG.
Without excluding other priority areas, which continue to be worked on, the following six focus industry and ABSF activities to drive continuous improvement across the value chain.
14
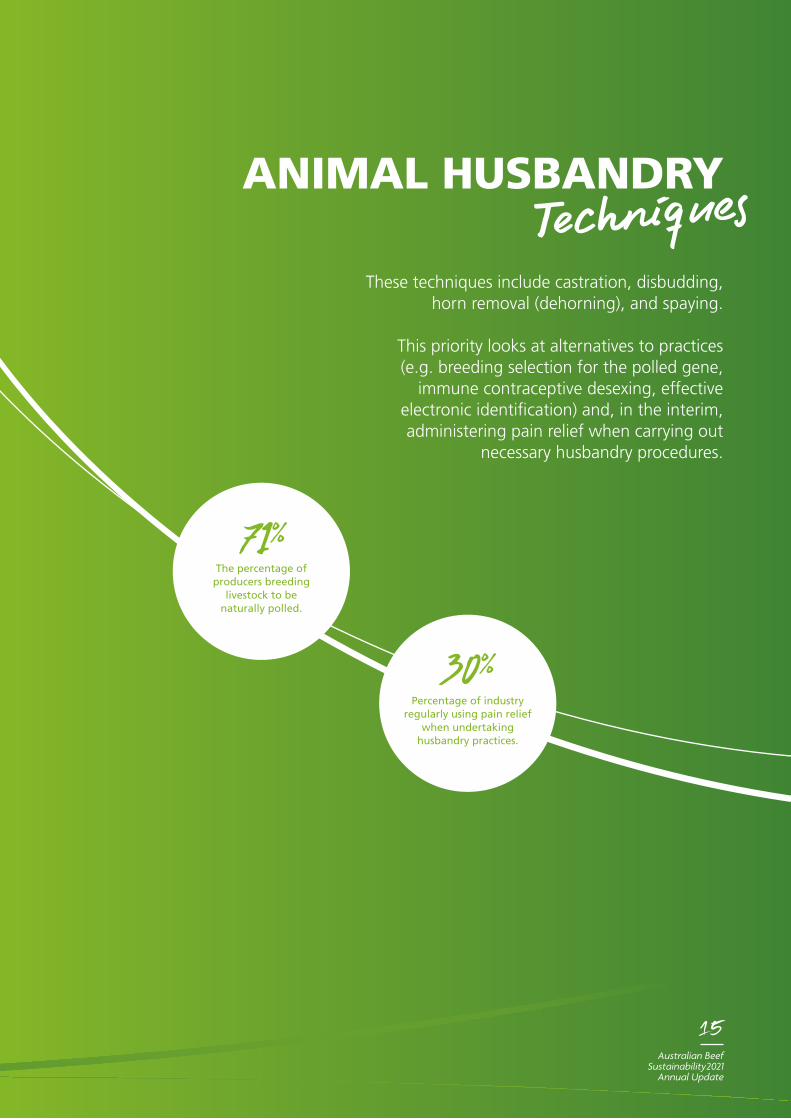
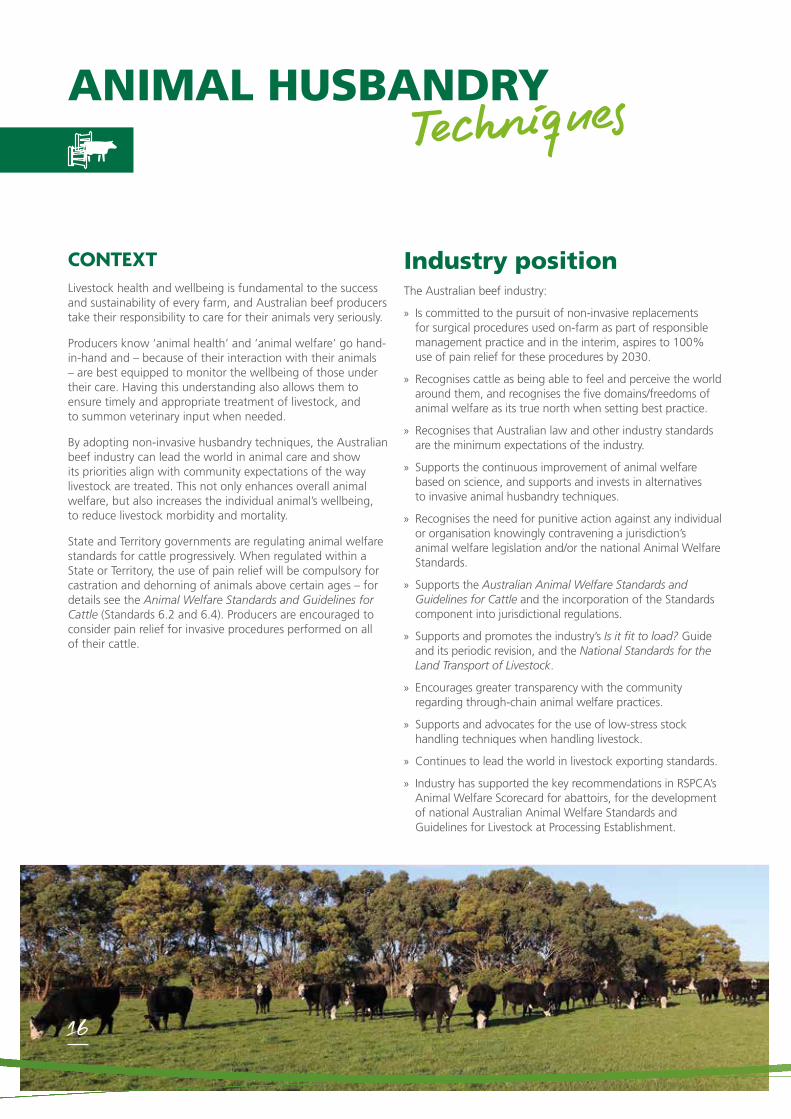
ANIMAL HUSBANDRYTechniques
These techniques include castration, disbudding, horn removal (dehorning), and spaying.
This priority looks at alternatives to practices (e.g. breeding selection for the polled gene,
immune contraceptive desexing, effective electronic identification) and, in the interim, administering pain relief when carrying out
necessary husbandry procedures.
71%The percentage of producers breeding
livestock to be naturally polled.
30%Percentage of industry
regularly using pain relief when undertaking
husbandry practices.
Australian Beef Sustainability2021
Annual Update
15
ANIMAL HUSBANDRYTechniques
CONTEXTLivestock health and wellbeing is fundamental to the success and sustainability of every farm, and Australian beef producers take their responsibility to care for their animals very seriously.
Producers know ‘animal health’ and ‘animal welfare’ go hand-in-hand and – because of their interaction with their animals – are best equipped to monitor the wellbeing of those under their care. Having this understanding also allows them to ensure timely and appropriate treatment of livestock, and to summon veterinary input when needed.
By adopting non-invasive husbandry techniques, the Australian beef industry can lead the world in animal care and show its priorities align with community expectations of the way livestock are treated. This not only enhances overall animal welfare, but also increases the individual animal’s wellbeing, to reduce livestock morbidity and mortality.
State and Territory governments are regulating animal welfare standards for cattle progressively. When regulated within a State or Territory, the use of pain relief will be compulsory for castration and dehorning of animals above certain ages – for details see the Animal Welfare Standards and Guidelines for Cattle (Standards 6.2 and 6.4). Producers are encouraged to consider pain relief for invasive procedures performed on all of their cattle.
Industry positionThe Australian beef industry:
» Is committed to the pursuit of non-invasive replacements for surgical procedures used on-farm as part of responsible management practice and in the interim, aspires to 100% use of pain relief for these procedures by 2030.
» Recognises cattle as being able to feel and perceive the world around them, and recognises the five domains/freedoms of animal welfare as its true north when setting best practice.
» Recognises that Australian law and other industry standards are the minimum expectations of the industry.
» Supports the continuous improvement of animal welfare based on science, and supports and invests in alternatives to invasive animal husbandry techniques.
» Recognises the need for punitive action against any individual or organisation knowingly contravening a jurisdiction’s animal welfare legislation and/or the national Animal Welfare Standards.
» Supports the Australian Animal Welfare Standards and Guidelines for Cattle and the incorporation of the Standards component into jurisdictional regulations.
» Supports and promotes the industry’s Is it fit to load? Guide and its periodic revision, and the National Standards for the Land Transport of Livestock.
» Encourages greater transparency with the community regarding through-chain animal welfare practices.
» Supports and advocates for the use of low-stress stock handling techniques when handling livestock.
» Continues to lead the world in livestock exporting standards.
» Industry has supported the key recommendations in RSPCA’s Animal Welfare Scorecard for abattoirs, for the development of national Australian Animal Welfare Standards and Guidelines for Livestock at Processing Establishment.
16

100%
90%
80%
70%
60%
50%
40%
30%
20%
10%
0%
Castration Dehorning Spaying Disbudding
71%
10%
19%
85%
8%
7%
84%
8%
8%
89%
11%1%
Always Sometimes Never
Self-assessment through surveys is currently the best available data for both these indicators, recognising it is not the best data source. Alternative measures continue to be explored, such as pain relief drug sales which are not feasible (products are not species specific, nor does the sale of a product necessitate the product was used). A working group is currently investigating these indicators and potential indicators further.
TechniquesWhat the data is telling usIndicator 1.3a: The percentage of producers breeding livestock to be naturally polled.
Figure 2: Percentage of producers using pain relief for specific invasive husbandry techniques.
Figure 4: 3R model of preferred strategies to manage animal welfare.
Figure 3: Percentage of herd receiving pain relief when under-going specific invasive husbandry techniques.
Indicator 1.3b: The percentage of industry regularly using pain relief when undertaking aversive husbandry practices.
This indicator has been realigned to report on a metric which is repeatable through current data gathering activities. This figure represents 741 of 1046 producers who stated they breed livestock to be genetically polled. When asked what percentage of the herd had the poll gene or was naturally polled, the survey respondents indicated a total of 54%.
100%
75%
50%
25%
0%2020
70.1
%
40%
30%
20%
10%
0%20182017 2019 2020
15% 21
% 30%
4%
The update of pain relief for regular use when undertaking husbandry practices has increased to 30% this year. This figure is from the 2021 producer survey. When diving further into these results, the percentage of producers using pain relief for specific invasive procedures, represents a majority of the cattle herd. For example, while 38% of producers always use pain relief when disbudding, this represents 84% of cattle spayed in 2020 (Figure 2 & 3).
100%
90%
80%
70%
60%
50%
40%
30%
20%
10%
0%
Castration Dehorning Spaying Disbudding
22%
12%
66%
43%
13%
45%
38%
12%
51%
28%
68%
3%
Always Sometimes Never
SNAPSHOT OF ACTIVITY MLA leads the industry’s on-farm animal welfare activities across research, development, adoption, engagement, and communications. For animal husbandry, MLA is focusing on the 3R model (see Figure 4).
By using pain relief
With an alternative, stress-free procedure
Necessary procedures by
applying the least stressful method
Replace
Relieve
Refine
Australian Beef Sustainability2021
Annual Update
17

Empowering the use of pain reliefProducers’ access to registered pain-relief compounds has recently improved. Each compound has a different purpose, so it is important to match the planned procedure with the most relevant compound or combination of compounds.
To assist with this, the grass fed beef industry’s commitment to animal welfare has been further enhanced by the release of a guide to pain relief for necessary animal husbandry practices. Issued by the Cattle Council of Australia, the guide follows the recent improvement in access to registered pain-relief compounds. Information is provided on: disbudding/dehorning, spaying, castration, branding, ear notching and tattooing.
The guide deals with local anesthetics such as the 24-hour effective, off-the-shelf gel Tri-Solfen and the vet-prescribed lignocaine. Reference is also made to longer-acting, S5 vet prescribed, non-steroidal anti-inflammatories, including meloxicam Buccalgesic and Metacam, as well as flunixin, ketoprofen, and tolfenamic acid products.
The guide can be downloaded from: www.cattlecouncil.com.au
Australian Livestock Processing Industry Animal Welfare Certification System In 2005 AMIC developed the Industry Animal Welfare Standards at livestock processing establishments: preparing meat for human consumption (Industry Standards), which were incorporated into the Australian Livestock Processing Industry Animal Welfare Certification System (AAWCS) in 2013 and are independently audited by AUSMEAT. The Industry Standards are periodically reviewed and updated to ensure that they meet both community and industry expectations of working towards best practice in animal welfare for livestock processing.
The standards were reviewed in 2020 / 2021 and a guideline to assist processors in the implementation of the standards was developed. Industry is currently working to publish the new standard and communicate changes to the standard in the coming months.
Further information on the standards can be found at https://aawcs.com.au/standards
Animal welfare surveillance updateIn a first for any livestock industry in Australia, the livestock export industry has developed a standardised way to collect animal welfare data on its ships and will use it to meet new reporting requirements.
The latest version of the Australian Standards for the Export of Livestock (ASEL 3.0), which came into effect on 1 November 2020, includes the need for shipboard stock handlers to record significantly more observations regarding the welfare of animals.
A working group was established in 2020 to formalise the way data was collected, to ensure it was meaningful and could be compared later across different voyages. It included animal welfare experts, veterinary epidemiologists, statistical experts, industry participants and those with practical knowledge of the on-board environment.
Rather than concentrating on what needed to be measured, the group used the recommendations guiding the development of the new standards and focussed on the how. This involved specifying the timing of animal welfare indicator measurements, the scoring systems to be used, providing basic instructions, and where possible, supplementing these instructions with photographs and videos.
Some of the work has already been reflected in the new ASEL 3.0 scoring systems. Other parts have been put into action through LIVEXCollect, a data collection system developed by LiveCorp that has become the approved reporting tool for ASEL 3.0. It uses programmed Excel spreadsheets with advanced functionality to standardise the data recorded, including automatic calculations and drop-downs using different scoring systems.
Work will also be done on ways to automate collection where possible, to strengthen the quality and independence of the data.
The livestock export industry, its regulator, and the community all agree on the need for the collection of meaningful indicators of animal welfare. However, the only way to extract maximum value from that information is to ensure the quality of the data, and the working group’s recommendations will help to make that happen.
ANIMAL HUSBANDRYTechniques continued
18

Australian Agricultural Company (AACo) began selecting polled cattle five years ago. Their genetic programs combine precision breeding for polledness with improving other desirable traits that are important to their herds, markets and environment. “The Mitchell”, their northern composite maternal breed, is already well on the way towards a completely hornless herd. The aim is to be rolling out 100% polled Mitchell bulls by the end of 2022.
AACo’s process starts at the Bull Breeding Units at Wylarah, Glentana and Collie Blue in Central Queensland with strategic selection and mating. By 2024, they aim to be producing their first groups of commercial polled Wagyu bulls to complement their full blood herd. Over time, these will be distributed across the Company’s properties, with their entire commercial herd to be polled within two generations.
Animal welfare is at the forefront of AACo’s decision making, which makes reducing pain and discomfort a key focus.
AACo’s Animal Welfare Policy requires that pain relief is required for all potentially painful animal husbandry surgical procedures. While this provides an effective reduction in pain, AACo is also driving innovation, including their poll program, to reduce the need for some procedures in the first place.
This work is important to AACo because it supports and enhances their commitment to the five freedoms of animal welfare and the safety of their people, but also because it reduces costs and losses associated with dehorning and disbudding. These can include lost productivity, reduced meat quality and reduced hide quality. Customers also want to know that their animals lived good lives, free of unnecessary pain, and AACo wants to be able to tell that story with confidence. And when a story includes leading genetic innovation, human safety and animal welfare, it’s certainly a story worth telling.
POLLED A STORY WORTH TELLINGWagyu are originally horned with very few polled animals available in breeding stocks. Introducing a trait, like polledness, into existing breeds without impacting other traits, requires effort, resources and time, but the benefits far outweigh any challenges.
Case Study
Australian Beef Sustainability2021
Annual Update
19

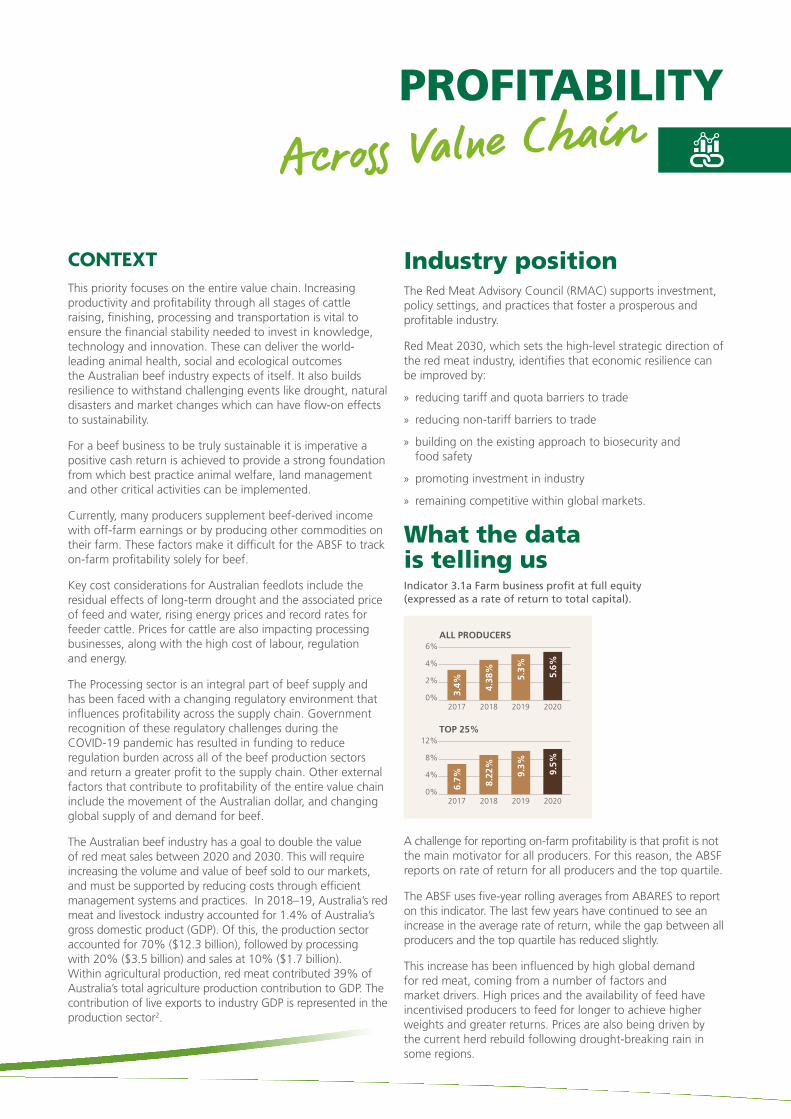
PROFITABILITYAcross Value Chain
To be economically sustainable, the industry must generate a positive rate of return over the long term on all capital used in cattle raising and beef production. Currently this priority looks only at farm business profit, due to data limitations.
9.5%Farm business profit at full
equity (expressed as a rate of return to total capital).
(TOP 25%)
5.6%Farm business profit at full
equity (expressed as a rate of return to total capital).
(ALL PRODUCERS)
20
CONTEXT This priority focuses on the entire value chain. Increasing productivity and profitability through all stages of cattle raising, finishing, processing and transportation is vital to ensure the financial stability needed to invest in knowledge, technology and innovation. These can deliver the world-leading animal health, social and ecological outcomes the Australian beef industry expects of itself. It also builds resilience to withstand challenging events like drought, natural disasters and market changes which can have flow-on effects to sustainability.
For a beef business to be truly sustainable it is imperative a positive cash return is achieved to provide a strong foundation from which best practice animal welfare, land management and other critical activities can be implemented.
Currently, many producers supplement beef-derived income with off-farm earnings or by producing other commodities on their farm. These factors make it difficult for the ABSF to track on-farm profitability solely for beef.
Key cost considerations for Australian feedlots include the residual effects of long-term drought and the associated price of feed and water, rising energy prices and record rates for feeder cattle. Prices for cattle are also impacting processing businesses, along with the high cost of labour, regulation and energy.
The Processing sector is an integral part of beef supply and has been faced with a changing regulatory environment that influences profitability across the supply chain. Government recognition of these regulatory challenges during the COVID-19 pandemic has resulted in funding to reduce regulation burden across all of the beef production sectors and return a greater profit to the supply chain. Other external factors that contribute to profitability of the entire value chain include the movement of the Australian dollar, and changing global supply of and demand for beef.
The Australian beef industry has a goal to double the value of red meat sales between 2020 and 2030. This will require increasing the volume and value of beef sold to our markets, and must be supported by reducing costs through efficient management systems and practices. In 2018–19, Australia’s red meat and livestock industry accounted for 1.4% of Australia’s gross domestic product (GDP). Of this, the production sector accounted for 70% ($12.3 billion), followed by processing with 20% ($3.5 billion) and sales at 10% ($1.7 billion). Within agricultural production, red meat contributed 39% of Australia’s total agriculture production contribution to GDP. The contribution of live exports to industry GDP is represented in the production sector2.
Industry position The Red Meat Advisory Council (RMAC) supports investment, policy settings, and practices that foster a prosperous and profitable industry.
Red Meat 2030, which sets the high-level strategic direction of the red meat industry, identifies that economic resilience can be improved by:
» reducing tariff and quota barriers to trade
» reducing non-tariff barriers to trade
» building on the existing approach to biosecurity and food safety
» promoting investment in industry
» remaining competitive within global markets.
What the data is telling usIndicator 3.1a Farm business profit at full equity (expressed as a rate of return to total capital).
6%
4%
2%
0%20182017 2019 2020
4.38
%
3.4%
5.3% 5.6%
ALL PRODUCERS
12%
8%
4%
0%20182017 2019 2020
8.22
%
6.7% 9.
3%
9.5%
TOP 25%
A challenge for reporting on-farm profitability is that profit is not the main motivator for all producers. For this reason, the ABSF reports on rate of return for all producers and the top quartile.
The ABSF uses five-year rolling averages from ABARES to report on this indicator. The last few years have continued to see an increase in the average rate of return, while the gap between all producers and the top quartile has reduced slightly.
This increase has been influenced by high global demand for red meat, coming from a number of factors and market drivers. High prices and the availability of feed have incentivised producers to feed for longer to achieve higher weights and greater returns. Prices are also being driven by the current herd rebuild following drought-breaking rain in some regions.
PROFITABILITY
Across Value Chain
21

SNAPSHOT OF ACTIVITY
Driving market accessAustralian beef’s favourable preferential export access largely improved in 2020. The entering into force of the Indonesia-Australia Comprehensive Economic Partnership Agreement removed all remaining tariffs (immediately or phased out by 2023) on Australian beef and cattle exports, while the entering into force of the Peru-Australia Free Trade Agreement has opened up niche market opportunities for Australian beef in South America.
Existing preferential access was reinforced via the signing of the Regional Comprehensive Economic Partnership Agreement that includes 15 Asia Pacific nations, in November 2020. Similarly, entering into force of the Australia-Hong Kong Free Trade Agreement and associated Investment Agreement reinforced Australia’s tariff-free access into the market.
Meanwhile, previous Free Trade Agreements delivered further gains for the Australian beef industry, with notable tariff reductions in Japan, Korea and China, and the removal of the Thailand beef quota. Parallel trade negotiations continue between Australia and the EU and UK, where existing access includes restrictive quotas and prohibitive out-of-quota tariffs.
While over 90% of Australian beef exports enter overseas markets under some form of preferential trade agreement, shipments to the Gulf Cooperation Council countries and Taiwan remain notable exceptions, in addition to the UK and EU, where access could be strengthened in future. Costs of technical trade barriers (e.g. import permit restrictions, phytosanitary regulations) have decreased by 13% since 2017.
Traditional trade policy tools like tariffs and quotas are being actively replaced with non-tariff policy tools (NTB) by governments throughout the world.
In response, the processing industry is partnering with the Australian government to develop and implement a range of strategies to overcome existing and new NTBs. These include: active tripartite collaboration within the AMIC-led Market Access Trade Groups; the development of a Market Access Prioritisation Framework through the Meat Modernisation initiative; as well as the Government’s $72.7m Agribusiness Expansion Initiative announced in December 2020.
Meat Standards AustraliaIn 2019–20, the world-leading eating quality grading program, Meat Standards Australia (MSA), delivered an estimated $172 million in additional farm gate returns to MSA beef producers.
In 2019–20, MSA represented 46% of the national adult cattle slaughter, a three percentage point increase on the previous year. An additional 276,000 cattle were processed through the MSA program in 2019–20, taking the total to approximately 3.8 million, the highest number of cattle graded in a year since MSA’s inception.
Two-thousand beef and sheep producers received face-to-face MSA training, and 2,300 producers undertook training via the MSA e-learning portal. This commitment to education is reflected in record-breaking national average compliance to MSA minimum requirements for beef at 94.4%. With the increase in cattle volume, the quality of cattle presented for MSA grading improved, with the national average MSA Index reaching 58.03, another record for the 22-year-old program.
In 2019–20, MSA implemented several enhancements to its MSA beef grading model, including a new myMSA platform, expanding cooking styles, beef cuts and aging regimes. These upgrades were endorsed by the MSA Pathways R&D Committee, MSA Beef Taskforce and the Australian Meat Industry Language and Standards Committee, consisting of leading Australian meat and animal researchers and red meat industry representatives.
PROFITABILITYAcross Value Chain continued
22

The Livestock Export Program (LEP)* and exporters agree the market would be better able to withstand fluctuations in price and availability of Australian cattle if there was a strong feedlot sector in Vietnam. The Australian industry, through the Australian Centre for International Agricultural Research (ACIAR) and the LEP are exploring ways to expand Vietnam’s potential as a market for feeder livestock, shifting away from its roots as a market for slaughter cattle. This would provide more flexibility to send lighter weight animals for feeding before slaughter. One challenge for this approach is the cost of feed, and getting the right mix of ingredients all year round.
The Australian Centre for International Agricultural Research (ACIAR) may have the solution. It’s running a project to work with feedlots and the smallholder farmers around them, to identify and ensure a consistent, local supply of the right crops.
The LEP has been providing support by introducing ACIAR representatives to Peak Industry Councils and producer groups involved in live exports, lot feeders in Australia, as well as Australian exporters and Vietnamese importers.
ACIAR is starting to work more and more with commercial companies, and there are opportunities for partnerships and potentially co-investment to leverage foreign aid funding to develop an integrated supply chain model. The LEP is also open to using its co-funding program to support any involvement by industry participants.
*The Livestock Export Program is a partnership between the rural Research and Development Corporations LiveCorp and Meat & Livestock Australia (MLA), which provides in-market services for the livestock export industry such as capacity building and market intelligence, and manages R&D projects.
FEEDING DEMAND IN VIETNAM Vietnam is a growing market for Australia’s livestock export industry, but the opportunities are limited to some degree by a reliance on cattle ready to be sent to abattoirs.
Case Study
Australian Beef Sustainability2021
Annual Update
23

3.36%Percentage national woodland
cover loss
3.23%Percentage
national woodland cover gain
1.15%Percentage
national forest cover loss
0.75%Percentage
national forest cover gain
Percentage cattle-producing land managed
for environmental outcomes
through active management
57%Percentage of
regions achieving healthy ground cover
thresholds
3.02%Percentage cattle-
producing land set aside for conservation or protection purposes
7%4
ABSF DEFINITIONSForest: Woody vegetation with >20% canopy cover reaching 2m high with a minimum area of 0.2 hectares
Woodland: Woody vegetation with a 5-20% tree canopy cover
Groundcover: Non-woody vegetation, such as a grassland
Primary: Primary refers to woodland or forest which was present in 1988
Woody Vegetation: A plant that produces wood as its structural tissue and has woody stems, such as trees
*Current measuring metrics do not delineate between native/non-native
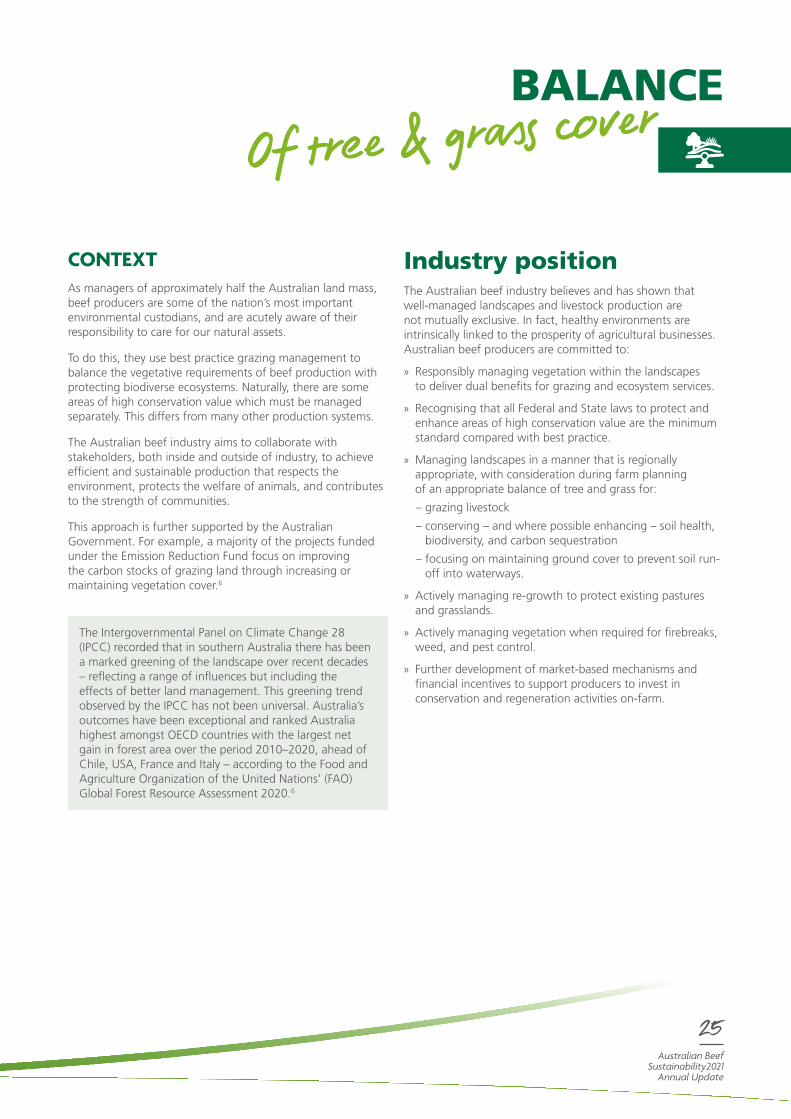
Beef production is intrinsically linked to well-managed landscapes. This priority looks at industry’s care of natural resources and biodiversity, by measuring area of land managed for environmental outcomes and changes in vegetation.
BALANCE
Of tree & grass cover
24
BALANCEOf tree & grass cover
Industry position The Australian beef industry believes and has shown that well-managed landscapes and livestock production are not mutually exclusive. In fact, healthy environments are intrinsically linked to the prosperity of agricultural businesses. Australian beef producers are committed to:
» Responsibly managing vegetation within the landscapes to deliver dual benefits for grazing and ecosystem services.
» Recognising that all Federal and State laws to protect and enhance areas of high conservation value are the minimum standard compared with best practice.
» Managing landscapes in a manner that is regionally appropriate, with consideration during farm planning of an appropriate balance of tree and grass for:
– grazing livestock
– conserving – and where possible enhancing – soil health, biodiversity, and carbon sequestration
– focusing on maintaining ground cover to prevent soil run-off into waterways.
» Actively managing re-growth to protect existing pastures and grasslands.
» Actively managing vegetation when required for firebreaks, weed, and pest control.
» Further development of market-based mechanisms and financial incentives to support producers to invest in conservation and regeneration activities on-farm.
The Intergovernmental Panel on Climate Change 28 (IPCC) recorded that in southern Australia there has been a marked greening of the landscape over recent decades – reflecting a range of influences but including the effects of better land management. This greening trend observed by the IPCC has not been universal. Australia’s outcomes have been exceptional and ranked Australia highest amongst OECD countries with the largest net gain in forest area over the period 2010–2020, ahead of Chile, USA, France and Italy – according to the Food and Agriculture Organization of the United Nations’ (FAO) Global Forest Resource Assessment 2020.6
CONTEXT As managers of approximately half the Australian land mass, beef producers are some of the nation’s most important environmental custodians, and are acutely aware of their responsibility to care for our natural assets.
To do this, they use best practice grazing management to balance the vegetative requirements of beef production with protecting biodiverse ecosystems. Naturally, there are some areas of high conservation value which must be managed separately. This differs from many other production systems.
The Australian beef industry aims to collaborate with stakeholders, both inside and outside of industry, to achieve efficient and sustainable production that respects the environment, protects the welfare of animals, and contributes to the strength of communities.
This approach is further supported by the Australian Government. For example, a majority of the projects funded under the Emission Reduction Fund focus on improving the carbon stocks of grazing land through increasing or maintaining vegetation cover.6
Australian Beef Sustainability2021
Annual Update
25

What the data is telling us The Australian beef industry works closely with key customers, stakeholders, and technical experts in this area, including through the ABSF process. This included convening an Expert Working Group to develop the practical, evidence-based measures for this priority. The ABSF reported against these measures for the first time in 2019.
Each update of the National Forest and Sparse Woody Vegetation Data (DOEE 2019) results in a new suite of products across the entire time series. Changes are undertaken as part of a continuous improvement verification program. Since 2004, woody vegetation cover and change products are updated manually. In addition, Cibo Labs also refines the grazed area estimate based on the latest land use and land parcel information.
BALANCEOf tree & grass cover continued
Indicator 5.2a(i): Percentage cattle producing land set aside for conservation or protection purposes.
4%
3%
2%
1%
0%2016-172015-16 2017-18 2018-19
2.43
%
2.51
%
2.56
%
3.02
%
Data for this indicator comes from the ABS and represents 12,049,214 hectares of cattle-producing land set aside for conservation or protection purposes. This includes reserves, parks, heritage sites and indigenous protected areas. Industry is aware conservation of significant sites is important, and is trying to find the correct balance of land set aside and land used for production.
This figure represents the area of land where on-farm management activities contribute to positive environmental outcomes. The measured activities align with the sustainability recommendations from government agencies, regional NRM organisations, and other land management groups. These results include both environmental management, and active grazing management such as fencing, spelling, and water access management. This data has come from the producer survey, and is reflective of responses received. The drop is likely due to the reduction in herd numbers during the drought, and active management was no longer conducted across all paddocks or properties.
80%
60%
40%
20%
%02018 2019 2020
52%
62.5
%
47.2
2%
Indicator 5.2a(iii): Percentage cattle producing land managed for environmental outcomes through active management.
Indicator 5.2b(v): Percentage of regions achieving healthy groundcover thresholds.
100%
50%
0%2019
57.4
%
Groundcover is important to maintaining healthy soils by reducing soil erosion, and increasing water infiltration. This calculation is based on 31 of the 54 NRM regions achieving their relevant healthy ground cover threshold for the late dry season (September as per available imagery). This data is for 2019, and it is important to note that most of Australia was battling a drought, likely to affect the achievability of a prescribed threshold. Thresholds are available from: Leys JF, Howorth JE, Guerschman JP, Bala B, Stewart JB 2020, Setting targets for National Landcare Program monitoring and reporting vegetation cover for Australia, NSW DPIE.
Vegetation changes: Indicators 5.2b(i) - 5.2b(iv)
What’s being measured? 2018/19Ten year
annual average (2010-2019)
Percentage national forest cover gain
0.75% 1.49%
Percentage national forest cover loss
-1.15% -1.43%
Percentage national woodland cover gain
3.23% 6.03%
Percentage national woodland cover loss
-3.36% -4.59%
These indicators represented national forest/woodland gain and loss from 2018 to 2019 across grazing properties. To put this in perspective, the net change in national woody (forest and woodland) cover extent was -0.29%. At this stage, without regionality and context, these figures are difficult to interpret, and it is unclear if they represent an improvement or decline for this priority. The ABSF is continually investigating how healthy vegetation levels for each region can be represented in this national indicator.
26
SNAPSHOT OF ACTIVITY
Rangelands Living SkinThe Rangelands Living Skin project aims to measure the impacts of a variety of interventions or practices, on four rangelands production systems. Production, economic and environmental outcomes will all be considered as a whole, with a long term goal of improving landscape health and business viability.
This research will underpin guidelines for best management practices and collaborative approaches for the rangelands to aid in ongoing prosperity and maintaining a social licence to operate. It is critical this work is supported by science and a robust methodology will be developed by the NSW Department of Primary Industries, with input from a variety of agricultural consultants.
The main practices that will be researched include:
» Grazing management
» Total grazing pressure fencing
» Water management through strategic ponding and/or spreading banks.
Other interventions may include:
» New or multi-species plantings
» Application of biological inputs.
This project will provide economic and scientific evidence for or against some of the practices and interventions currently being recommended within the industry.
Following the initiation of the research component, the project will upscale to facilitate and support wider practice change, including collection of baseline measurements, supporting producers in implementing and maintaining the practices, and measuring the resulting productivity and sustainability improvements.
The overarching outcome of the project will be the implementation of best management practices and the facilitation of ongoing support for improved practices and capability into the future. This will enable producers to be resilient and prepared for increased climate variability, position Australia well to take up new market opportunities and provide further verification of environmental care to share with consumers and the broader community.
Recognising on-farm biodiversity managementIn 2019, the Australian Government announced funding for an Australian Farm Biodiversity Certification Scheme to be created as part of the national agriculture stewardship package. The National Farmers’ Federation was tasked with its development. Through the first phase of the project, the Australian Farm Institute undertook desktop and consultative research into existing schemes with similar goals, including the ABSF, and determined their applicability to Australian agricultural systems.
The project also focused on reviewing best practice management standards and collating extensive feedback from over 500 stakeholders to address the value proposition of the Scheme and potential barriers to adoption within the farming and natural resource management communities.
It was found that for the Scheme to be effective, a solid foundation of data was required to determine baseline measurements, monitor and evaluate change, and engage participants. It is expected the Scheme will deliver evidence-based practices that lead to positive social, environmental, and economic outcomes, while targets will be consistent with global standards to leverage stewardship efforts in a global context.
The Agriculture Stewardship Carbon + Biodiversity Pilot (C+B Pilot) is a component of the Australian Government’s Agriculture Stewardship Package. The pilot is exploring how a market mechanism can be used to buy and sell biodiversity services and thereby improve environmental outcomes and provide new financial opportunities for farmers.
Environmental planting projects undertaken in the C+B Pilot will be eligible to receive:
» Carbon credits for the carbon dioxide they sequester in the plants
» Cash payments for the biodiversity benefits they provide.
Australian Beef Sustainability2021
Annual Update
27

Flicking flies with their tails, the animals seem completely oblivious to the vital role they have played in the transformation of Goondicum Station. They have enabled Rob and Nadia Campbell to capitalise on the dawn of an unconventional agricultural trade – natural capital.
Not only is the private sector paying them for their bushland and the carbon it captures, but the bank manager is on board too. National Australia Bank has recognised the value of environmental improvements that began at Goondicum in the 1960s, cutting interest rates on parts of the station under conservation. The grazing systems developed by successive generations of the Campbell family have allowed large areas of native vegetation to regenerate and encouraged native wildlife populations to increase.
Goondicum is now home to one of Queensland’s largest carbon-farming projects, which will see the Campbells increase total tree coverage to 20%.
“So now we’re seeing another form of diversification and a new form of income paying for improvements to the
environment, while allowing us to continue sustainable and profitable cattle grazing,” Nadia Campbell says.
“My father could see that the land was degenerating and that the natural pasture was starting to get eaten out, the land was getting compacted, and we weren’t getting the moisture and nutrients into the soil,” Rob Campbell says.
The economic benefits of having more trees and lower stocking densities became clear almost immediately as the Campbells noticed dramatic improvements in pasture quality and livestock condition.
The Campbells have reduced stocking densities by 25% to enable longer rest periods that encourage pasture, shrubs and trees to regenerate. They also conduct carefully timed ‘cool burns’ to trigger the germination of native grasses that produce new feed and promote biodiversity, but also to reduce fuel that leads to intense ‘hot’ bushfires. To balance production with conservation, they still carry out an extremely selective thinning program within native vegetation laws.
Case Study
FARMING FOR THE FUTURE In a eucalyptus forest east of Monto in Central Queensland, fat, glossy cattle have retreated to the shade to escape the midday sun. The sun in northern Australia stings even in the cooler months.
Nadia and Rob Campbell on their Goondicum Station in Queensland by John Wilson: News Corp Australia
28

ANTIMICROBIALStewardship
Maintaining the efficacy of antimicrobials so that infections in humans and animals remain treatable is of critical
importance. This priority looks at industry use of antibiotics and surveillance programs to detect resistance to them.
62%The percentage of feedlots
covered by an antibiotic stewardship plan.
Australian Beef Sustainability2021
Annual Update
29

ANTIMICROBIALStewardship
CONTEXT Australia has one of the most conservative approaches to antimicrobial use in the world, and is a global leader in minimising the use of antibiotics in food-producing animals.7
The term ‘antimicrobial’ refers to medicines that act to selectively kill or inhibit the growth of microorganisms like bacteria in humans and animals. Antimicrobials are one of many vital tools which may be used by the Australian beef industry to help ensure the health and welfare of cattle.
Antimicrobial resistance (AMR) occurs when a disease-causing microorganism becomes resistant to antimicrobial medicines used as treatment. AMR is a concern for both medical and livestock policy-makers, medical professionals, veterinarians, producers, and the wider community, and recognised as a global health priority. These concerns, along with the development of fewer antimicrobials, means the effectiveness of those currently available must be preserved.
The Australian Pesticides and Veterinary Medicines Authority’s (APVMA) conservative approach to the registration of antimicrobial agents, combined with good farm management practices, has resulted in very low levels of AMR in Australian cattle. Nevertheless, it remains paramount antimicrobials are preserved for future use.
Industry position Responsible antimicrobial stewardship aligns with RMAC’s Red Meat 2030 priority to ‘set the standard for world class animal health, welfare, biosecurity and production practices’.
The appropriate use of antimicrobials is a shared responsibility of the prescribing vet and farm or feedlot managers or owners. The veterinarian accepts responsibility for the decision to use an antimicrobial agent, while the farm or feedlot manager and staff are responsible for good animal care practices (including infection prevention and control), following all directions for use, and implementing management changes over time. This approach safeguards the health and welfare of the animals, while minimising the likelihood of adverse impacts on individual animals, other livestock, or on public health due to bacterial disease or treatment involving antimicrobials.
What the data is telling us Indicator 8.3a: The percentage of feedlots covered by an antimicrobial stewardship plan.
In 2018 the Australian Lot Feeders’ Association (ALFA) voluntarily established the Antimicrobial Stewardship Guidelines and, since their release, there has been increasing uptake by industry. In the first year, 39% of feedlots implemented antimicrobial stewardship, while last year, the ABSF reported that number had increased to 58.5%. This year the number has again risen to 62.48%. This figure has been verified through several hundred independent audits and provides a very positive indication the Guidelines are being taken up by industry.
80%
60%
40%
20%
0%2018 2019 2020
39% 58
.5%
62.4
8%
30

SNAPSHOT OF ACTIVITY
Antimicrobial surveillanceAlthough Australia does not have a national, ongoing surveillance program for monitoring AMR in the animal production sector, periodic assessments are conducted.
A recent study was completed to determine the presence of non-wild type (NWT) populations of bacteria, opposed to wild-type (WT), from the faeces of beef cattle, dairy cattle, and veal calves at slaughter, which were then assessed for their response to antimicrobials. Results showed that 94% of Salmonella, 83.8% of E. coli and 75.8% of Enterococcus isolates were WT for all antimicrobials tested. This suggests responsible use of antibiotics in cattle production in Australia.
Populations of NWT isolates to antimicrobials that are considered highly or critically important to human medicine were low and there was limited evidence of specific production practices, such as grain-feeding, leading to widespread disproportionate development of NWT isolates.
The outcomes of the study permit the Australian beef industry to arrive at the same conclusion as the previous 2013 study – that is, populations of NWT isolates to antimicrobials considered highly or critically important to human medicine are low.
Measurement toolMeasurement of antimicrobial use plays an integral role in the effective management of antimicrobials. Australian lot feeders, through their commitment to implement onsite Antimicrobial Stewardship Plans, have adopted a measurement metric to ensure the ongoing monitoring of usage at an individual site level.
MLA is currently working on the development of a measurement tool for antimicrobial usage. This is because it is important for producers to measure the total amount of antibiotics administered, and because it remains important some antimicrobials are used to ensure optimal animal health. When completed, grassfed producers may be able to use farm-level measurement, in conjunction with an annual review by a veterinarian, as a simple and appropriate approach to stewardship.
Further work is also being done to support the Australian Veterinary Association in producing guidelines for the prescription of antibiotics. These guidelines will assist veterinarians to decide when to prescribe antimicrobials and which to select for use in both the grassfed and feedlot sectors.
Australian Beef Sustainability2021
Annual Update
31

Using culture and susceptibility testing for surveillance of antimicrobial resistance is a key pillar of antimicrobial stewardship, as outlined in the 2018 edition of the ALFA-MLA Antimicrobial stewardship guidelines for the Australian cattle feedlot industry.
A project concluding in 2020 undertook a pilot surveillance of resistance of bovine respiratory disease (BRD) pathogens to common veterinary antimicrobial agents across seven Australian feedlots in 2019, to encourage the adoption of antimicrobial stewardship best practice.
The main BRD-causing bacteria tested for antimicrobial resistance in order of prevalence included:
» Pasteurella multocida
» Mannheimia hemolytica
» Histophilus somni
» Mycoplasma bovis.
For the first time in Australia, low levels of resistance were found in Pasteurella multocida (23.1%) to the macrolide class of antimicrobials. Whilst resistance levels are low by international standards, feedlots should continue to embrace antimicrobial stewardship principles to maintain the judicious use of antimicrobials.
This project has enabled antimicrobial culture and susceptibility testing for the Australian feedlot industry through collaboration between lot feeders, diagnostic laboratories, researchers, and consulting veterinarians. Feedlots are now equipped to conduct their own local antimicrobial resistance (AMR) surveillance and integrate the findings into their antimicrobial stewardship programs.
In practical terms, feedlots should:
» Implement an antimicrobial stewardship plan with their consulting veterinarian based on the antimicrobial stewardship principles to reduce risk of further resistance developing
» Conduct a routine antimicrobial resistance surveillance program each year
» Look for viable preventatives (e.g. vaccines, backgrounding system prior to feedlot entry) and alternatives to lower the use of medically important antimicrobials
» Conduct internal feedlot reporting to monitor the use and total quantity of antimicrobials.
ANTIMICROBIAL SURVEILLANCE – BOVINE RESPIRATORY DISEASE PATHOGENS
Case Study
32

12.6kg CO2e emitted per kg liveweight when
raising beef.
397kg CO2e emitted per tonne Hot Standard
Carcase Weight (HSCW) when processing beef.
5.8%Carbon captured and re-used in processing. 51%
Percentage total CO2e reduced by beef industry from a 2005
baseline.
MANAGE
Climate change riskGreenhouse gases are emitted throughout the beef
value chain, including methane produced through cattle’s natural digestion (scope 3 emissions). This
priority looks at carbon dioxide equivalents emitted when raising and processing beef, as well as carbon
dioxide equivalents the industry removes from the environment through carbon sequestration.
Australian Beef Sustainability2021
Annual Update
33

MANAGEClimate change risk
CONTEXT Like all industries, the beef sector has a responsibility to contribute to managing the risk of climate change and plays an important role in offsetting national emissions by sequestering carbon in soils and vegetation. In fact, soils are the world’s second largest reservoirs of carbon and hold potential for expanded carbon sequestration, thereby providing a means to help mitigate the rising presence of greenhouse gases.
Increasing atmospheric concentrations of the three primary greenhouse gases (GHG), carbon dioxide (CO2), methane (CH4), and nitrous oxide (N2O) are responsible for the majority of atmospheric warming and consequent climate change.
The Australian Government Quarterly Update of Australia’s National Greenhouse Gas Inventory: June 2020 confirms Australia has beaten its 2020 emissions reduction target by 459 million tonnes (i.e. Australia emitted 459 Mt CO2-e less than what was budgeted).
Australia’s surpassing of its 2020 target is due in large part to significant declines in emissions from the electricity and agriculture sectors. Changes in land management practices over the last decade have contributed to the nation’s forest cover increasing faster than any other OECD country over that period, according to the Food and Agriculture Organisation. Australia’s total emissions are now 16.6% below the level of emissions in 2005 (the baseline year for the Paris Agreement).
Figure 5: Percentage contribution to national GHG emissions in 2017 by Australian economic sector (NGHGI)33.
38% Electricity, Gas and Water
15% Mining
13% Residential
12% Services, Construction and Transport
11% Agriculture, Forestry and Fishing
10% Manufacturing
Industry position In 2017 the Australian red meat industry committed to achieving carbon neutrality by 2030 (CN30).
The CN30 target definition is net zero greenhouse gas (GHG) emissions by 2030, which means that by 2030 Australian beef, lamb and goat production, lot feeding, and processing value chain segments will make no net release of GHG emissions into the atmosphere.
Red Meat 2030 outlines that CN30 will be achieved by:
1. Identifying required actions and coordinating across the supply chain to achieve the target
2. Researching mechanisms and practices relating to pasture and soil-based carbon sequestration, enteric methane emission reduction, and other mitigation technologies
3. Demonstrably reducing production, processing, and consumption waste
4. Increasing research into, and use of, renewables within the industry’s energy mix.
CN30 is a clear message to global customers and consumers that the Australian red meat industry is serious about addressing GHG emissions. It will demonstrate that the red meat industry is a global leader in enteric methane and carbon farming innovation, economic development, and environmental stewardship.
34

GWP* and methane
Methane is the primary GHG of interest for the Australian beef industry because it is a primary emission from ruminant livestock.
Methane is the second leading cause of global warming, but current calculations do not consider that it has the shortest lifespan. Scientists have developed a revised GWP metric, GWP* that addresses the shortcoming of the current methodology – inappropriate calculation of short-lived climate pollutants (SLCP). This methodology enhances GWP by the inclusion of the rate of change of SLCP emissions in the calculations to convert SLCP emissions to a CO2-we.
MLA has been exploring the use of GWP* for red meat industries and is currently working on reporting red meat emissions using both GWP100 and emerging measures such as GWP* and radiative forcing.
Figure 6: Greenhouse gas emissions sources and sinks in the Australian red meat and livestock industry.
CH₄
Methane is a by-product of the digestion process. It is released as livestock burp. Small amounts are also released as manure breaks down and during waste treatment.
Methane is mainly released from livestock following digestion of plant matter.
Carbon Dioxide is mainly released through burning of fossil fuels, plant decay, plus insect and microbial activity in soil. It’s also absorbed by plants through photosynthesis and can be stored as roots in soil and plant matter above ground level.
N₂0
PROCESSING
LOT FEEDING
CO₂ is released through production and consumption of fossil fuels, plant decay, the animal and plant respiration process, controlled and uncontrolled burns, plus insect and microbial activity in the soil.
CO₂ is absorbed by plants through photosynthesis. Carbon is consumed by animals, stored in stable woody vegetation, or broken down and absorbed into the soil.
Legumes fix atmospheric nitrogen into the soil, which is taken up by pastures, crops and trees. C0₂
Nitrous Oxide is released through use of nitrogen fertilisers, and breakdown of urine and dung. Controlled savanna fires are cooler, meaning fewer N₂0 (and CH₄) emissions.
N
Australian Beef Sustainability2021
Annual Update
35
What the data is telling us The ABSF tracks the CN30 target with four other climate change and greenhouse gas indicators. Since the baseline year of 2005, the industry has reduced net emissions by 51.46%
Indicator 6.1e: Percentage of CO2e reduced by beef industry from a 2005 baseline.
Indicator 6.1a: kg CO2e emitted per kg liveweight when raising beef.
Figure 7: Mj/t HSCW
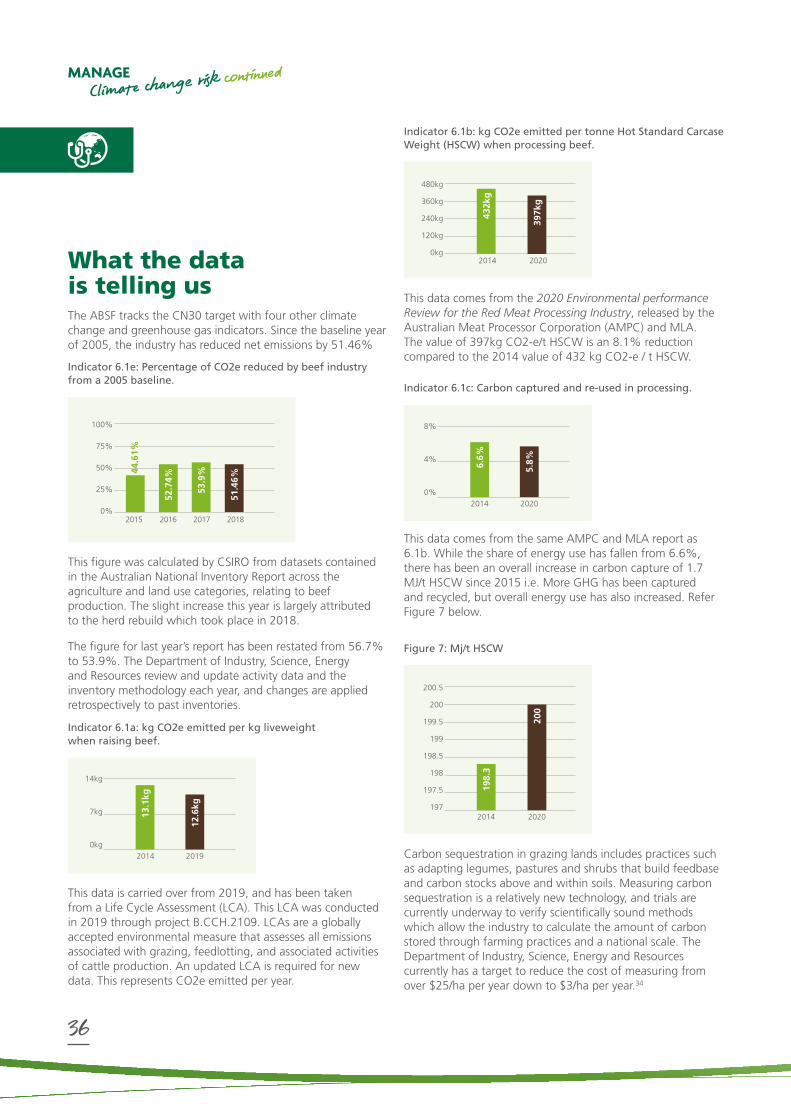
Indicator 6.1b: kg CO2e emitted per tonne Hot Standard Carcase Weight (HSCW) when processing beef.
Indicator 6.1c: Carbon captured and re-used in processing.
100%
75%
50%
25%
0%20162015 2017 2018
52.7
4%
53.9
%
51.4
6%
44.6
1%
This figure was calculated by CSIRO from datasets contained in the Australian National Inventory Report across the agriculture and land use categories, relating to beef production. The slight increase this year is largely attributed to the herd rebuild which took place in 2018.
The figure for last year’s report has been restated from 56.7% to 53.9%. The Department of Industry, Science, Energy and Resources review and update activity data and the inventory methodology each year, and changes are applied retrospectively to past inventories.
14kg
7kg
0kg2014 2019
13.1
kg
12.6
kg
This data is carried over from 2019, and has been taken from a Life Cycle Assessment (LCA). This LCA was conducted in 2019 through project B.CCH.2109. LCAs are a globally accepted environmental measure that assesses all emissions associated with grazing, feedlotting, and associated activities of cattle production. An updated LCA is required for new data. This represents CO2e emitted per year.
480kg
360kg
240kg
120kg
0kg20202014
397k
g
432k
g
This data comes from the 2020 Environmental performance Review for the Red Meat Processing Industry, released by the Australian Meat Processor Corporation (AMPC) and MLA. The value of 397kg CO2-e/t HSCW is an 8.1% reduction compared to the 2014 value of 432 kg CO2-e / t HSCW.
8%
4%
0%20202014
5.8%6.6%
This data comes from the same AMPC and MLA report as 6.1b. While the share of energy use has fallen from 6.6%, there has been an overall increase in carbon capture of 1.7 MJ/t HSCW since 2015 i.e. More GHG has been captured and recycled, but overall energy use has also increased. Refer Figure 7 below.
Carbon sequestration in grazing lands includes practices such as adapting legumes, pastures and shrubs that build feedbase and carbon stocks above and within soils. Measuring carbon sequestration is a relatively new technology, and trials are currently underway to verify scientifically sound methods which allow the industry to calculate the amount of carbon stored through farming practices and a national scale. The Department of Industry, Science, Energy and Resources currently has a target to reduce the cost of measuring from over $25/ha per year down to $3/ha per year.34
MANAGEClimate change risk continued
200.5
200
199.5
199
198.5
198
197.5
1972014
198.
3
2020
200
36

SNAPSHOT OF ACTIVITY
CN30 RoadmapMLA has released the CN30 Roadmap to provide CN30 information for all red meat industry stakeholders. For producers, lot feeders, processors, and retailers, the CN30 Roadmap provides information on how to connect the individual actions of their operations to those of the wider industry and how to reduce net emissions as part of a prosperous and successful beef business.
For customers, consumers, and communities, the CN30 Roadmap demonstrates how the red meat industry can be productive and profitable in a low carbon economy. It also shows how industry will tackle the climate challenges that lie ahead, and that the support of the wider community will be critical to achieving the target.
CN30 activities are grouped into four key areas of work, representing the most important issues in pursuit of the CN30 target:
1. Emissions avoidance
2. Carbon storage
3. Integrated management systems
4. Leadership building.
Figure 8: Key areas of work to achieve CN30 target.
Multiple benefitsINDUSTRY
LEADERSHIP
Carbon Storage
GHG Emissions Avoidance
(Grazing properties / Feedlots / Processing) Integrated
Management Systems
(Rapid adoption / Carbon accounting / Measurement and
reporting)
Soil Condition Analyses System8 CSIRO has developed the Soil Condition Analyses System (SCANS) that can be used to help monitor soil organic carbon content, composition, bulk density, and carbon stocks after changes in land use or management. The SCANS presents a good base for the development of an innovative, efficient, auditable and verifiable soil carbon trading methodology. The approach will allow landholders to effectively measure organic carbon stocks and related soil attributes, to detect changes, and improve decision-making and management.
CSIRO estimation and mapping analytics use novel and robust statistical estimation methods, and modern geostatistical and Bayesian methods for spatial modelling and mapping. It was identified that using accurate estimates from the SCANS will allow landholders to more effectively assess the effects that their management practices might have on the accumulation and retention of soil organic carbon stocks. In this way, they might better assess the economic implications of entering into a soil carbon accounting project, and the level of risk in their decision making.
Demonstrated environmental stewardship
Increased profitability
Increased animal
productivity
Australian Beef Sustainability2021
Annual Update
37
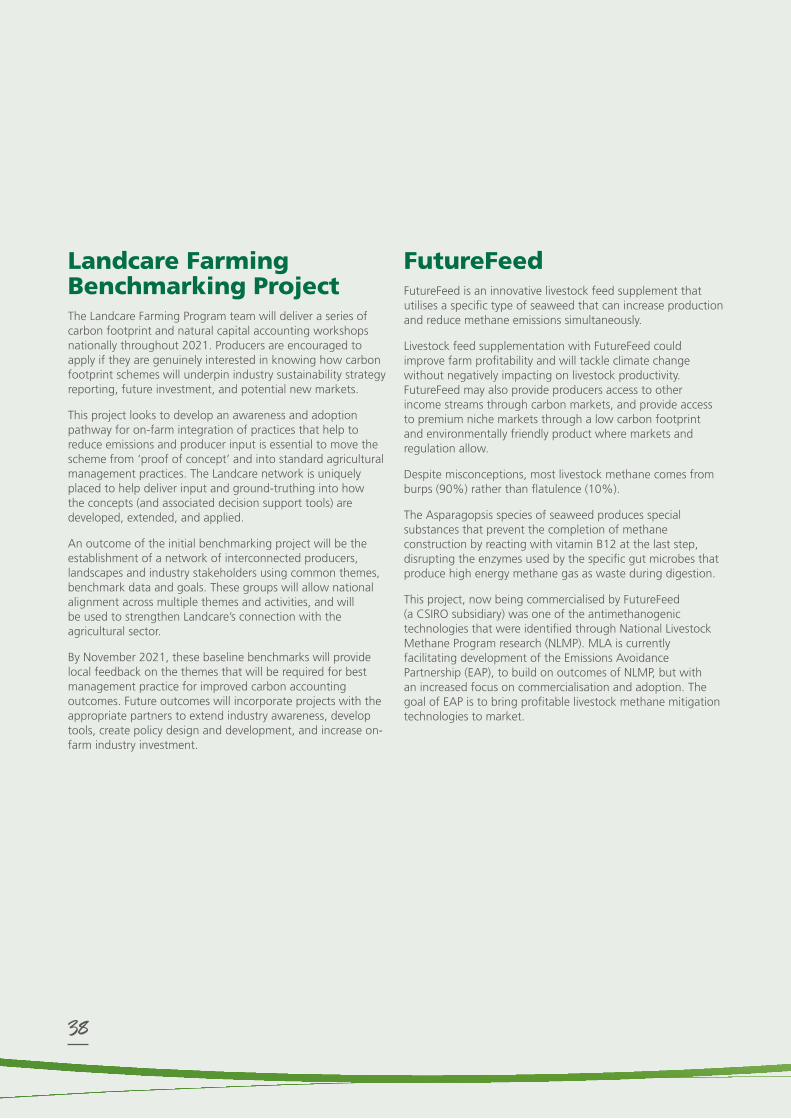
Landcare Farming Benchmarking ProjectThe Landcare Farming Program team will deliver a series of carbon footprint and natural capital accounting workshops nationally throughout 2021. Producers are encouraged to apply if they are genuinely interested in knowing how carbon footprint schemes will underpin industry sustainability strategy reporting, future investment, and potential new markets.
This project looks to develop an awareness and adoption pathway for on-farm integration of practices that help to reduce emissions and producer input is essential to move the scheme from ‘proof of concept’ and into standard agricultural management practices. The Landcare network is uniquely placed to help deliver input and ground-truthing into how the concepts (and associated decision support tools) are developed, extended, and applied.
An outcome of the initial benchmarking project will be the establishment of a network of interconnected producers, landscapes and industry stakeholders using common themes, benchmark data and goals. These groups will allow national alignment across multiple themes and activities, and will be used to strengthen Landcare’s connection with the agricultural sector.
By November 2021, these baseline benchmarks will provide local feedback on the themes that will be required for best management practice for improved carbon accounting outcomes. Future outcomes will incorporate projects with the appropriate partners to extend industry awareness, develop tools, create policy design and development, and increase on-farm industry investment.
FutureFeedFutureFeed is an innovative livestock feed supplement that utilises a specific type of seaweed that can increase production and reduce methane emissions simultaneously.
Livestock feed supplementation with FutureFeed could improve farm profitability and will tackle climate change without negatively impacting on livestock productivity. FutureFeed may also provide producers access to other income streams through carbon markets, and provide access to premium niche markets through a low carbon footprint and environmentally friendly product where markets and regulation allow.
Despite misconceptions, most livestock methane comes from burps (90%) rather than flatulence (10%).
The Asparagopsis species of seaweed produces special substances that prevent the completion of methane construction by reacting with vitamin B12 at the last step, disrupting the enzymes used by the specific gut microbes that produce high energy methane gas as waste during digestion.
This project, now being commercialised by FutureFeed (a CSIRO subsidiary) was one of the antimethanogenic technologies that were identified through National Livestock Methane Program research (NLMP). MLA is currently facilitating development of the Emissions Avoidance Partnership (EAP), to build on outcomes of NLMP, but with an increased focus on commercialisation and adoption. The goal of EAP is to bring profitable livestock methane mitigation technologies to market.
38
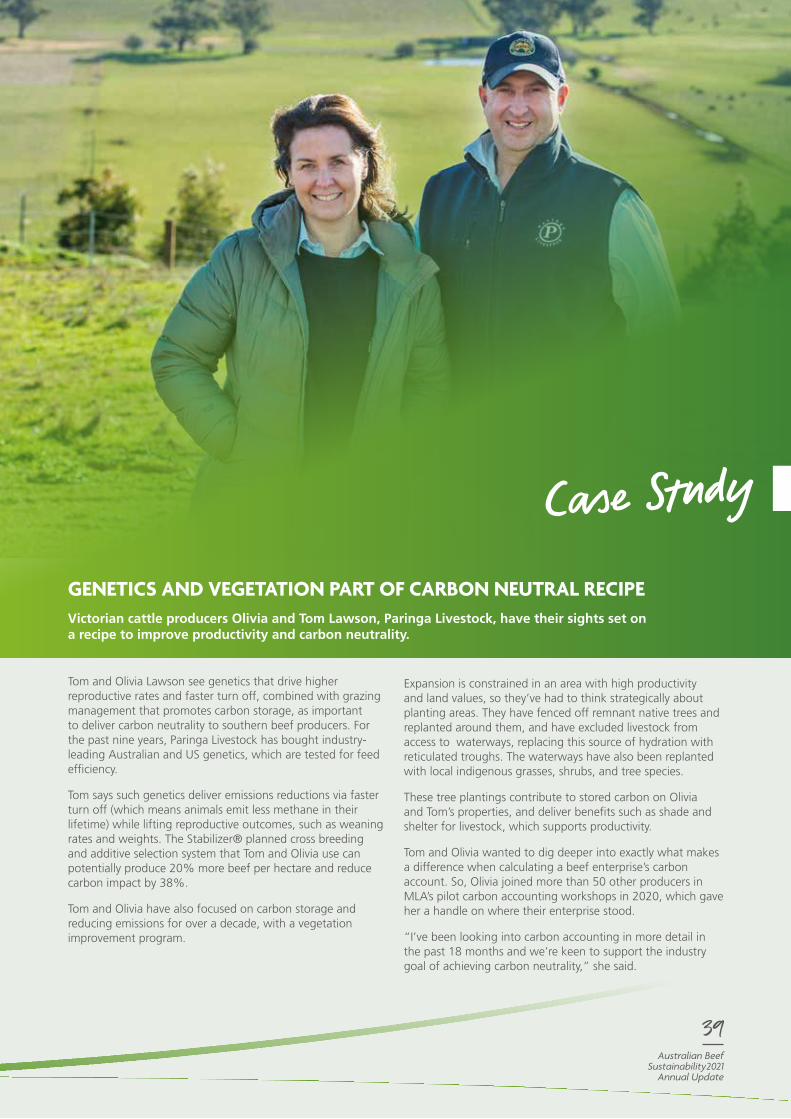
Tom and Olivia Lawson see genetics that drive higher reproductive rates and faster turn off, combined with grazing management that promotes carbon storage, as important to deliver carbon neutrality to southern beef producers. For the past nine years, Paringa Livestock has bought industry-leading Australian and US genetics, which are tested for feed efficiency.
Tom says such genetics deliver emissions reductions via faster turn off (which means animals emit less methane in their lifetime) while lifting reproductive outcomes, such as weaning rates and weights. The Stabilizer® planned cross breeding and additive selection system that Tom and Olivia use can potentially produce 20% more beef per hectare and reduce carbon impact by 38%.
Tom and Olivia have also focused on carbon storage and reducing emissions for over a decade, with a vegetation improvement program.
Expansion is constrained in an area with high productivity and land values, so they’ve had to think strategically about planting areas. They have fenced off remnant native trees and replanted around them, and have excluded livestock from access to waterways, replacing this source of hydration with reticulated troughs. The waterways have also been replanted with local indigenous grasses, shrubs, and tree species.
These tree plantings contribute to stored carbon on Olivia and Tom’s properties, and deliver benefits such as shade and shelter for livestock, which supports productivity.
Tom and Olivia wanted to dig deeper into exactly what makes a difference when calculating a beef enterprise’s carbon account. So, Olivia joined more than 50 other producers in MLA’s pilot carbon accounting workshops in 2020, which gave her a handle on where their enterprise stood.
“I’ve been looking into carbon accounting in more detail in the past 18 months and we’re keen to support the industry goal of achieving carbon neutrality,” she said.
GENETICS AND VEGETATION PART OF CARBON NEUTRAL RECIPE Victorian cattle producers Olivia and Tom Lawson, Paringa Livestock, have their sights set on a recipe to improve productivity and carbon neutrality.
Case Study
Australian Beef Sustainability2021
Annual Update
39

HEALTH & SAFETY
of people in the industryWorking environments through the beef value chain, especially
on-farm, may expose employees and contractors to risk. This priority looks at notifiable fatalities, however industry recognises
the importance of further investigation of injuries to help highlight risk factors and improve work safety.
35FARMS
Notifiable fatalities (2015-19)
0FEEDLOT
Notifiable fatalities (2015-19) 2
PROCESSING Notifiable fatalities
(2015-19)
40

of people in the industry
Indicator 10.1a: Notifiable fatalities.
of people in the industryHEALTH & SAFETY
CONTEXT Australia’s red meat processing sector has well-established work health and safety (WHS) procedures, systems, and practices in place to protect its most valuable asset – its people.
For livestock transporters, the Australian Trucking Association’s TruckSafe scheme sets out standards for driver health and safety.
Farms are unique business environments. Producers face the highest risk to life across the agriculture industry, working with chemicals, noise, dust, sun, animals, and machinery, with the majority of this work occurring in remote locations.
The COVID-19 pandemic threw the health and safety of all people into the spotlight, and it was no different for those working in agriculture. The support given to the industry, as a provider of safe and nutritious food, has been imperative to maintaining the wellbeing of the red meat community.
The Australian Lot Feeders’ Association (ALFA) provided tailored guidance material to help feedlots prepare for, prevent and manage the impact of the COVID-19 virus. These tools were picked up more broadly by cattle and sheep producers, live exporters and processors, having been downloaded over 1,000 times from ALFA’s COVID-19 resources webpage. Feedlots have taken COVID-19 seriously, putting in systems and processes to help protect their working communities and shore-up business continuity.
The Australian Meat Industry Council (AMIC) has been instrumental in establishing a Taskforce to raise awareness of Q fever to the Federal and State Governments on the basis that it is a community disease and not one that is restricted to employment in the meat industry. One of the objectives of the taskforce is to get the vaccine on to the Pharmaceutical Benefits Scheme list in order to reduce costs for the industry.
Industry position The health and wellbeing of people is a foremost priority of the beef sector. Red Meat 2030 states the industry will strive for a safe and healthy workplace for all who are employed across the supply chain – from those on farms to those who work in processing plants and international markets. To do this, it supports policies that incentivise business to improve work health and safety outcomes, and commit to a zero-harm policy for every individual.
What the data is telling us The Work-related Traumatic Injury Fatality Data set is sourced from information from the media, workers’ compensation data, fatality notifications from Australia’s various WHS authorities and information in the National Coronial Information System. While the details of some workplace deaths are published, there are some that are not in the public domain. Data for sub-categories with smaller fatality numbers are provided as combined amounts (e.g. five-year total) to avoid disclosing confidential and potentially identifiable information.
Over 2015-2019, farms saw a decrease in notifiable fatalities from the two previous rolling five-year totals. Processing reported an increase of one notifiable fatality from the previous reporting period, while feedlots remained on zero notifiable fatalities since at least 2013. The ABSF is currently investigating the Live Export data for this indicator.
60
40
20
0Farms Feedlot Processing
42
0 0 1
35
2
2014-18 2015-19
Australian Beef Sustainability2021
Annual Update
41
SNAPSHOT OF ACTIVITY
COVID-19 responseWith health and safety being an existing priority for industry, farms, feedlots, and processors were well placed to respond to the ongoing COVID-19 pandemic. Australian Livestock Exporters’ Council, Australian Lot Feeders’ Association, Australian Meat Industry Council, and the Cattle Council of Australia each developed COVID-19 specific resources to assist employers and businesses to continue operating as near to normal as possible.
The National Farmers’ Federation worked to ensure that food and fibre production were deemed essential services, culminating in the National Agricultural Workers’ Code. This code supports a principles-based approach to national consistency in cross-border movement of agriculture workers while at the same time taking a risk-based approach to health and safety of the workforce and broader community.
Advice given by governments was that appropriate social practices were applicable at all times throughout the pandemic, and especially relevant at workplaces. Managers, supervisors, and persons conducting a business or undertaking were directed to ensure their staff were aware and practising good hygiene and social distancing. Agricultural work is often outdoors where the risk of disease transmission is lower, but some workplaces such as meat and food processing establishments may have restricted work areas, and can pose a higher risk.
AMIC also developed an industry specific COVID-19 guideline, which was used widely, by both industry and government, as a reference document for best practice COVID-19 risk mitigation in the sector.
Rural Health and Safety AllianceData is key to understanding, prioritising, and realising improvements in performance. Thus accurate, reliable and timely capture, analysis and reporting of work-related health and safety data is key to improving the industry’s health, safety, and wellbeing outcomes. There are, however, a number of challenges which exist within the agriculture and fisheries industries, given there are many different metrics and systems used to capture and report on WHS data.
The Rural Health and Safety Alliance (RSHA) developed the Safety Data Capture project to facilitate, with a number of industry bodies and the University of Queensland, the development of objectives for agricultural WHS data. Stage 1 of the project found the objective is to capture, analyse, and communicate agricultural WHS data to inform decision makers of:
» The current status of health and safety risks and the effectiveness of risk control measures in preventing or mitigating these risks
» Actual system and/or control failures as identified through incident and other analyses to enhance learning that improves WHS performance
» The overall industry performance over time and against relevant benchmark data.
HEALTH & SAFETY
of people in the industry continued
42
The Royal Flying Doctor Service (RFDS) (Queensland Section) has navigated 2020 with minimal disruption to its vital healthcare services despite the challenges presented by the COVID-19 pandemic.
According to RFDS yearly patient and aviation statistics, patient transfers across the state were on par with 2019, with 10,678 patients being flown to emergency or specialist care between January 1 and December 1 2020. Forty of these patients were transferred under COVID-19 precautions in Queensland.
While adhering to strict health guidelines during the height of the pandemic, the RFDS in Queensland drew on the years of trust and confidence it has built with the communities it serves to find ways to deliver primary healthcare services, including general practice and nursing clinics to 94 locations.
More than 25,000 patients accessed these services, from the far north on Cape York, to the south-west corner at Birdsville, while more than 15,000 patients accessed healthcare via the RFDS telehealth service.
The RFDS Dental Service team, while unable to carry out dental consultations during parts of the pandemic-affected year, still delivered oral healthcare to 1,035 patients across 11 outback communities.
Meanwhile, RFDS mental health clinicians delivered 5,275 consultations across the service’s three major mental health and wellbeing teams, despite having to shift to a telehealth first model during the height of the pandemic.
While delivering these services across Queensland, RFDS pilots flew a total of 21,542 hours over 7.4 million kilometres, landing at 224 locations.
FLYING DOCTOR POWERS THROUGH PANDEMIC WITH UNWAVERING HEALTHCARE DELIVERY
Case StudyRFDS (Queensland Section) Medical Officer, Katrina Starmer, supplied by Royal Flying Doctor Service (Queensland Section)
Australian Beef Sustainability2021
Annual Update
43

SCORECARD
Indicator Data Trends Explanation
PRIORITY AREA 1: ENHANCE ANIMAL WELLBEING
PRIORITY 1.1: COMPETENT LIVESTOCK HANDLING
1.1a The percentage awareness of the Australian Animal Welfare Standards for Cattle.
Upward, Improvement
This only applies to properties accredited under LPA and not “Australian cattle properties” more broadly. Note, this is based on the total number of producers who have completed the reaccreditation process vs not completed it. They need to complete an assessment and learning module about the element outlined in LPA and they then receive a certificate for their completion.9
1.1b The percentage compliance with National Feedlot Accreditation Scheme (NFAS) Animal Welfare requirements.
Downward, setback
There were 377 NFAS audits conducted in 2020. Twenty non-conformances were raised in relation to the animal welfare elements. A large proportion of these non-conformances were related to the failure to conduct internal animal welfare audits. In response to the increase in non-conformances, in late 2020 ALFA delivered training to support lot feeders in completing effective internal animal welfare audits.10
1.1c Percentage awareness of the Australian Animal Welfare Standards for Saleyards and Depots.
Not Applicable This data has been extrapolated from the 2020 Beef Sustainability Producer Survey, where 913 of 977 respondents stated they were aware of the standards.11
ANIMAL WELFARE
100%
75%
50%
25%
0%2018 2019 2020
56% 73
% 97.3
%
100%
75%
50%
25%
0%2020
93.4
5%
100%
75%
50%
25%
0%20182017 2019 2020
97.1
5%
96.2
4%
98.0
3%
94.7
0%
The Sustainability Steering Group constantly seeks alternative data sources where increased reputability is required. Where possible, these changes have been implemented in the scorecard metrics, and the data sources identified in the explanation.
Not all indicators have existing data sources. To address this, the ABSF engages producers annually through a producer sustainability survey. This year, with thanks to industry support, the survey received over 1,100 responses, up from 254 in 2019. This increase in responses allows the industry to be more confident in the figures it is presenting against indicators.
The agricultural industry, by nature, will experience varying trends due to external forces, and this scorecard aims to be transparent around the data to improve industry performance.
Some indicators have had to change slightly due to variations in data gathering mechanisms. These are:
1.3a Reworded to reflect producer sustainability survey
2.2b Reworded to reflect the declaration from the World Organisation for Animal Health (OIE)
3.1a Reworded to reflect what is being expressed
4.2a Reworded to align with consumer surveys
6.3a Reworded to reflect how the data is presented
9.1b On-the-job training removed as the subjective nature of the indicator made it impossible to measure
44

Indicator Data Trends Explanation
PRIORITY AREA 1: ENHANCE ANIMAL WELLBEING
PRIORITY 1.2: SAFE LIVESTOCK TRANSPORT
1.2a Number of powered vehicles and trailing equipment which operate under TruckSafe Animal Welfare.
Upward, Improvement
TruckSafe is an independently audited quality assurance program for the Australian livestock transport industry. It has a voluntary module. The module adheres to the Australian Livestock & Rural Transporters Association National Animal Welfare Policy. Data for the percentage of trucks under TruckSafe is not available.12
1.2b The percentage of reportable incidents of shipboard mortalities.
Flat, No Change
There has been minimal change, with a flat trend for mortalities over the past four years. The industry recognises that mortalities are a limited indicator, and do not capture welfare during transport. The live export industry is developing on-transport welfare measures which may be used in the future.13
PRIORITY 1.3: ANIMAL HUSBANDRY TECHNIQUES
1.3a The percentage of producers breeding livestock to be naturally polled.
No Trend Applicable
This indicator has been realigned to report on a metric which is repeatable through current data gathering activities. This figure represents 741 of 1046 producers who stated they breed livestock to be genetically polled.11
1.3b Percentage of industry regularly using pain relief when undertaking aversive husbandry practices.
Upward, Improvement
These procedures include dehorning, castration, spaying, and disbudding. This indicator has included the descriptor ‘aversive’ to align with the language of the Animal Welfare Standards, and focus on practices for which pain relief is prescribed by vets and other welfare experts. For a full break down of the results, please refer to Page 17.11
ANIMAL WELFARE
800
600
400
200
020182017 2019 2020
576
474 60
9
603
POWERED VEHICLES
2,000
1,500
1,000
500
020182017 2019 2020
1,72
7
1,27
8 1,84
5
1,84
4
TRAILING EQUIPMENT
0.15
0.10
0.05
020182017 2019 2020
0.10
%
0.11
%
100%
75%
50%
25%
0%2020
70.1
%
40%
30%
20%
10%
0%20182017 2019 2021
15% 21
% 30%
4%0.
10%
0.14
%
Australian Beef Sustainability2021
Annual Update
45
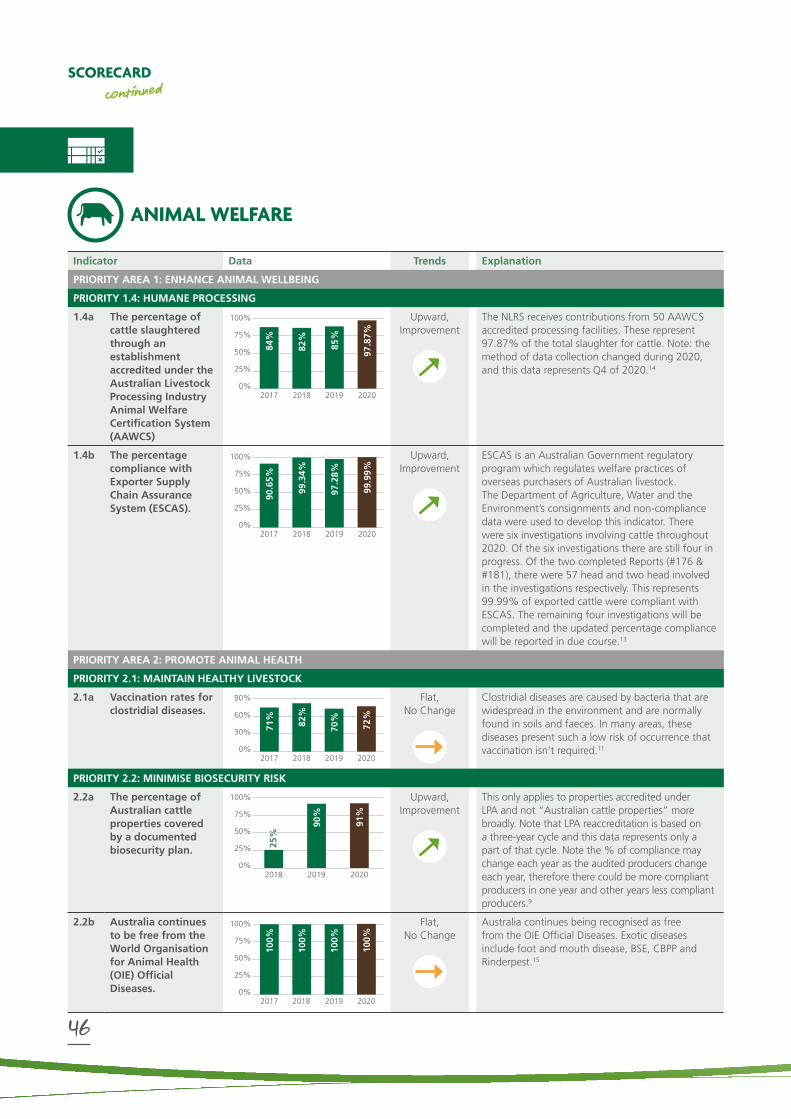
Indicator Data Trends Explanation
PRIORITY AREA 1: ENHANCE ANIMAL WELLBEING
PRIORITY 1.4: HUMANE PROCESSING
1.4a The percentage of cattle slaughtered through an establishment accredited under the Australian Livestock Processing Industry Animal Welfare Certification System (AAWCS)
Upward, Improvement
The NLRS receives contributions from 50 AAWCS accredited processing facilities. These represent 97.87% of the total slaughter for cattle. Note: the method of data collection changed during 2020, and this data represents Q4 of 2020.14
1.4b The percentage compliance with Exporter Supply Chain Assurance System (ESCAS).
Upward, Improvement
ESCAS is an Australian Government regulatory program which regulates welfare practices of overseas purchasers of Australian livestock. The Department of Agriculture, Water and the Environment’s consignments and non-compliance data were used to develop this indicator. There were six investigations involving cattle throughout 2020. Of the six investigations there are still four in progress. Of the two completed Reports (#176 & #181), there were 57 head and two head involved in the investigations respectively. This represents 99.99% of exported cattle were compliant with ESCAS. The remaining four investigations will be completed and the updated percentage compliance will be reported in due course.13
PRIORITY AREA 2: PROMOTE ANIMAL HEALTH
PRIORITY 2.1: MAINTAIN HEALTHY LIVESTOCK
2.1a Vaccination rates for clostridial diseases.
Flat, No Change
Clostridial diseases are caused by bacteria that are widespread in the environment and are normally found in soils and faeces. In many areas, these diseases present such a low risk of occurrence that vaccination isn’t required.11
PRIORITY 2.2: MINIMISE BIOSECURITY RISK
2.2a The percentage of Australian cattle properties covered by a documented biosecurity plan.
Upward, Improvement
This only applies to properties accredited under LPA and not “Australian cattle properties” more broadly. Note that LPA reaccreditation is based on a three-year cycle and this data represents only a part of that cycle. Note the % of compliance may change each year as the audited producers change each year, therefore there could be more compliant producers in one year and other years less compliant producers.9
2.2b Australia continues to be free from the World Organisation for Animal Health (OIE) Official Diseases.
Flat, No Change
Australia continues being recognised as free from the OIE Official Diseases. Exotic diseases include foot and mouth disease, BSE, CBPP and Rinderpest.15
SCORECARDcontinued
ANIMAL WELFARE
100%
75%
50%
25%
0%2018 2019 2020
90%
91%
25%
90%
60%
30%
0%20182017 2019 2020
82%
71%
70%
72%
100%
75%
50%
25%
0%2017 2018 2019 2020
100%
100%
100%
100%
100%
75%
50%
25%
0%20182017 2019 2020
82%
84%
85%
97.8
7%
100%
75%
50%
25%
0%20182017 2019 2020
99.3
4%
90.6
5%
97.2
8%
99.9
9%
46

Indicator Data Trends Explanation
PRIORITY AREA 3: ENHANCE PROFITABILITY AND PRODUCTIVITY
PRIORITY 3.1: PROFITABILITY ACROSS VALUE CHAIN
3.1a Farm business profit at full equity (expressed as a rate of return to total capital).
Upward, Improvement
Five year rolling average ending FY2019-20. This measure includes capital appreciation, the wealth generated through land value appreciation. Capital appreciation is included in the rate of return as it more truly reflects the financial position of many producers and the investment returns of the industry, particularly as, at times, substantial wealth is generated through the appreciation of land values.16
PRIORITY 3.2: FARM, FEEDLOT AND PROCESSOR PRODUCTIVITY AND COST OF PRODUCTION
3.2a Total farm productivity.
Downward, Setback
TFP is a ratio of market outputs index to a market inputs expressed as a five-year rolling average. One hundred points on this index represents the 1984-1985 baseline. A national TFP of 120.9 shows a 20.9% increase on this baseline. ABARES has since updated previous years data.16
3.2b Cost of beef produced on Australian farms. (US c/kg cwt sold).
Upward Setback
Average cost of production for 2019 - only includes the grassfed production system and includes all on-farm costs of production.16
3.2c Average cost of cattle processing per head.
No Trend Applicable
This data has come from a one-off AMPC-led study into processing costs. The AMPC study revealed that Australia's cost of processing is considerably higher than competing countries.17
ECONOMIC RESILIENCE
140
105
70
35
020182017 2019 2020
125.
7
128.
1
122.
9
120.
9
$8
$6
$4
$2
$020172016 2018 2019
$5.7
2
$5.3
9
$5.5
9
$6.0
8
$390
$260
$130
$02015-16
$360
.62
6%
4%
2%
0%20182017 2019 2020
4.38
%
3.4%
5.3% 5.6%
ALL PRODUCERS
12%
8%
4%
0%20182017 2019 2020
8.22
%
6.7% 9.
3%
9.5%
TOP 25
Australian Beef Sustainability2021
Annual Update
47

Indicator Data Trends Explanation
PRIORITY AREA 4: OPTIMISE MARKET
PRIORITY 4.1: BARRIERS TO TRADE
4.1a Market Access Index. Downward, Improvement
The Market Access Index has been developed using trade barriers and tariffs faced in each major beef export market. A lower index value indicates more favourable market access conditions Other major beef exporters had an average index score of 57.5 in 2017, indicating very high levels of market access for Australia compared to competitors.35
4.1b Costs of technical trade barriers.
Downward, Improvement
Technical trade barriers such as the use of import permit restrictions, failure to grant export clearance, or phytosanitary regulations represent significant costs to the industry. This updated figure represents a 13% decrease in costs since 2017. Reported figures only include Non-Tariff Barriers that were captured in original analysis – it doesn’t capture the impact of new Non-Tariff Barriers. In future, the original detailed modelling will likely be re-run to provide more detailed/current estimates of the impact of Non-Tariff Barriers.18
PRIORITY 4.2: PRODUCT INTEGRITY
4.2a The percentage of Australian consumers who agree in relation to Australian beef: – I trust the safety of
this meat– Is full of flavour– Is consistently high
quality
Flat, No Change
Measured through MLA Domestic Consumer Tracking, based on a continuous consumer survey of main grocery buyers aged 18-64 who eat meat, representative of metropolitan Australia.19
ECONOMIC RESILIENCE
SCORECARDcontinued
60%
40%
20%
0%2017 2018 2019 2020
60%
59%
59%
60%
SAFE
60%
40%
20%
0%20182017 2019 2020
60%
60%
60%
59%
FULL OF FLAVOUR
60%
40%
20%
0%20182017 2019 2020
47%
46%
48%
48%
CONSISTENTLY HIGH QUALITY
$3.0bn
$1.5bn
$0.0bn20202017
$2.0
bn $1
.742
bn
60
40
20
02017 2020
22.3
19.8
48

Indicator Data Trends Explanation
PRIORITY AREA 5: IMPROVE LAND MANAGEMENT PRACTICES
PRIORITY 5.1: MINIMISE NUTRIENT AND SEDIMENT LOSS
5.1a Number of days per year soil covered by vegetation. No data available
No data available
Measuring soil health and groundcover on a daily basis at a national scale is difficult from both a technical and practical standpoint. After initial investigation, no agreed methodology exists. While data exists in different regions, it is challenging to bring data sets together at a national level. The SSG is continuing to investigate options to measure this critical area.
5.1b Soil health.
No data available
No data available
5.1c Water quality.
No data available
No data available
PRIORITY 5.2: BALANCE OF TREE AND GRASS COVER
5.2a (i)
Percentage cattle producing land set aside for conservation or protection purposes.
Upward, Improvement
This represents 12,049,214 hectares of cattle-producing land set aside for conservation or protection purposes. This includes reserves, parks, heritage sites and indigenous protected areas.20
5.2a (ii)
Land managed by beef producers for conservation outcomes through formal arrangements.
No data available
This indicator can be difficult to obtain data for, as formal arrangements differ between jurisdictions. The SSG is continuing to investigate.
5.2a (iii)
Percentage cattle-producing land managed for environmental outcomes through active management.
Downward, Setback
This figure represents the area of land where on farm management activities contribute to positive environmental outcomes. The measured activities align with the sustainability recommendations from government agencies, regional NRM organisations, and other land management groups. These results include both environmental management, and active grazing management such as fencing, spelling, and water access management.11
ENVIRONMENTAL STEWARDSHIP
4%
3%
2%
1%
0%2016-172015-16 2017-18 2018-19
2.43
%
2.51
%
2.56
%
3.02
%
80%
60%
40%
20%
%02018 2019 2020
52%
62.5
%
47.2
2%
Australian Beef Sustainability2021
Annual Update
49
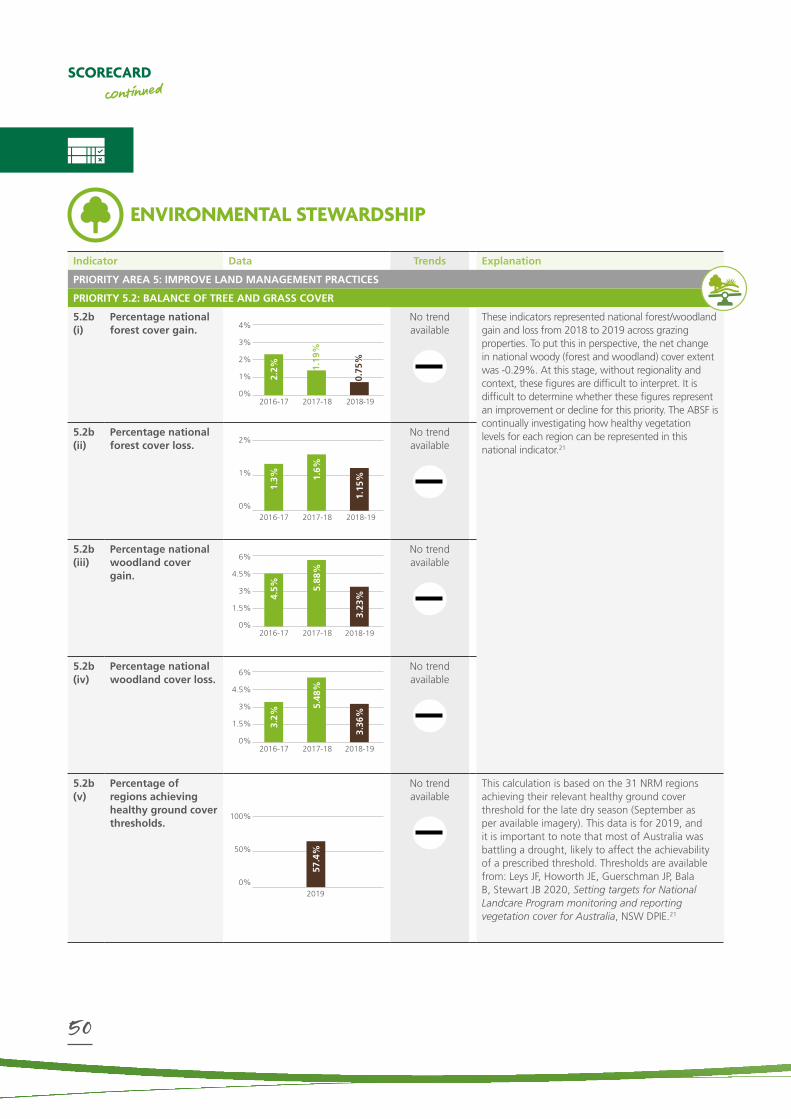
Indicator Data Trends Explanation
PRIORITY AREA 5: IMPROVE LAND MANAGEMENT PRACTICES
PRIORITY 5.2: BALANCE OF TREE AND GRASS COVER
5.2b (i)
Percentage national forest cover gain.
No trend available
These indicators represented national forest/woodland gain and loss from 2018 to 2019 across grazing properties. To put this in perspective, the net change in national woody (forest and woodland) cover extent was -0.29%. At this stage, without regionality and context, these figures are difficult to interpret. It is difficult to determine whether these figures represent an improvement or decline for this priority. The ABSF is continually investigating how healthy vegetation levels for each region can be represented in this national indicator.21
5.2b (ii)
Percentage national forest cover loss.
No trend available
5.2b (iii)
Percentage national woodland cover gain.
No trend available
5.2b (iv)
Percentage national woodland cover loss.
No trend available
5.2b (v)
Percentage of regions achieving healthy ground cover thresholds.
No trend available
This calculation is based on the 31 NRM regions achieving their relevant healthy ground cover threshold for the late dry season (September as per available imagery). This data is for 2019, and it is important to note that most of Australia was battling a drought, likely to affect the achievability of a prescribed threshold. Thresholds are available from: Leys JF, Howorth JE, Guerschman JP, Bala B, Stewart JB 2020, Setting targets for National Landcare Program monitoring and reporting vegetation cover for Australia, NSW DPIE.21
SCORECARDcontinued
ENVIRONMENTAL STEWARDSHIP
2%
1%
0%2016-17 2017-18 2018-19
1.3% 1.
6%
1.15
%
100%
50%
0%2019
57.4
%
6%
4.5%
3%
1.5%
0%2016-17 2017-18 2018-19
4.5% 5.
88%
3.23
%
6%
4.5%
3%
1.5%
0%2016-17 2017-18 2018-19
3.2%
5.48
%
3.36
%
4%
3%
2%
1%
0%2016-17 2017-18 2018-19
2.2% 1.
19%
0.75
%
50

Indicator Data Trends Explanation
PRIORITY AREA 6: MITIGATE AND MANAGE CLIMATE CHANGE
PRIORITY 6.1: MANAGE CLIMATE CHANGE RISK
6.1a kg CO2e emitted per kg liveweight when raising beef.
Downward, Improvement
Data was taken from a Life Cycle Assessment (LCA). This LCA was conducted in 2019 through project B.CCH.2109. LCAs are a globally accepted environmental measure that assesses all emissions associated with grazing, feedlotting, and associated activities of cattle production.22
6.1b kg CO2e emitted per tonne Hot Standard Carcase Weight (HSCW) when processing beef.
Downward, Improvement
An 8.1% reduction compared to the 2015 value of 432 kg CO2-e / t HSCW.23
6.1c Carbon captured and re-used in processing.
Downward, Setback
While this has been reported as a downward trend due to the share reducing from 6.6% to 5.8%, there has been an overall increase of 1.7 Mj/t HSCW since 2015. Methane and other gases are able to be captured during wastewater treatment to create biogas that is then used in the facility reducing the use of natural gas.23
6.1d Carbon sequestration.
No data available
No trend available
The cattle industry is able to sequester carbon to reduce net CO2 emissions, and draw down atmospheric carbon. The practice increases soil organic carbon levels and improves on-farm productivity. Currently there is no agreed method to measure carbon sequestration nationally across the industry. Work continues to investigate possible options.
6.1e Percentage total CO2e reduced by beef industry from a 2005 baseline.
Flat, No Change
The industry is continuing to make progress towards its carbon neutral by 2030 target. This figure captures net emissions from beef and land-use related emissions. A baseline year of 2005 has largely been chosen, as it is the earliest available data for Federal national accounting, and aligns with the Paris Agreement. The slight increase this year is largely attributed to the herd rebuild which took place in 2018. The figure for last year’s report has been restated from 56.7% to 53.9%. The Department of Industry, Science, Energy and Resources review and update activity data and the inventory methodology each year, and changes are applied retrospectively to past inventories.24
ENVIRONMENTAL STEWARDSHIP
14kg
7kg
0kg2014 2019
13.1
kg
12.6
kg
480kg
360kg
240kg
120kg
0kg20202014
397k
g
432k
g
8%
4%
0%20202014
5.8%6.6%
100%
75%
50%
25%
0%20162015 2017 2018
52.7
4%
44.6
1% 53.9
%
51.4
6%
Australian Beef Sustainability2021
Annual Update
51

SCORECARDcontinued
ENVIRONMENTAL STEWARDSHIP
Indicator Data Trends Explanation
PRIORITY AREA 6: MITIGATE AND MANAGE CLIMATE CHANGE
PRIORITY 6.2: CLIMATE CHANGE ADAPTATION AND PREPAREDNESS
6.2a Producer confidence in having the information, tools, technologies and resources (both business and biophysical) to be able to adapt to change over time.
Downward, Setback
This figure comes from a different data source this year because the results from the most recent Regional Wellbeing Survey have not been finalised. Where possible, the same questions have been asked to respondents. This is reflective of the 974 responses in the survey. On a scale of 1-7, respondents were asked how confident they were in having the information, tools, technologies, and resources to be able to adapt to climate change over time.11
PRIORITY 6.3: EFFICIENT USE OF WATER
6.3a Litres of water used per kilogram of liveweight for raising cattle.
Downward, Improvement
Data was taken from a Life Cycle Assessment (LCA). This LCA was conducted in 2019 through project B.CCH.2109. LCAs are a globally accepted environmental measure that assess resource usage associated with grazing, feedlotting, and associated activities of cattle production.22
6.3b Kilolitres of water used per tonne Hot Standard Carcase Weight (HSCW) when processing beef.
Downward, Improvement
This shows a reduction of water use intensity of 7.9% or 0.7 kL / t HSCW. Considering the 2008/2009 FY Environmental Performance Review where 8.7 kL / t HSCW was reported, this shows that the Australian red meat processing industry is continuing to achieve reductions in water intake.23
PRIORITY AREA 7: MINIMISE WASTE
PRIORITY 7.1: SOLID WASTE TO LANDFILL FROM PROCESSING
7.1a Kilograms of solid waste per tonne Hot Standard Carcase Weight (HSCW) when processing beef.
Upward, Setback
Sites in this Environmental Performance Review reported a wider scope of wastes sent to landfill, whereas the 2015 figure was calculated for only solid waste sent to landfill. Sites did not break down the components of their general waste, however large volumes of liquids (e.g. waste oil, non-renderable blood, un-dewatered paunch) sent to landfill are believed to have skewed these results. Due to increases in state-based landfill levies, it is not consistent with expectation that the processing sector has increased tonnages of wastes disposed to landfill. The context of the COVID period should also be considered here, where the demand for non-recyclable face masks, gloves, sanitizer, and wipes would have contributed to additional landfilled waste.23
6
4
2
02018 2020
4.87
4.68
FARMS
6
4
2
02018
4.93
FEEDLOTS
600
400
200
02014 2019
515L
/kg
486L
/kg
9
6
3
020202014
7.9
8.6
KL
per
tonn
e H
SCW
12
8
4
020202014
11.9
5.9
KL
per
tonn
e H
SCW
52

Indicator Data Trends Explanation
PRIORITY AREA 8: PRODUCE NUTRITIOUS AND SAFE FOOD
PRIORITY 8.1: BEEF IS EATEN AS PART OF A HEALTHY BALANCED DIET
8.1a The percentage of consumers in Australia who consider beef part of a healthy balanced diet.
Flat, No change
Proportion of consumers who agree with the statement that Australian beef “is an important part of a healthy, balanced lifestyle.” This percentage is steady on the previous two years.19
PRIORITY 8.2: FOOD SAFETY
8.2a The percentage of product exported that a market found unacceptable in terms of food safety-related indicators.
Flat, No change
This indicator looks at raw beef rejected at the border. In the US, there has been an increasing trend in recent years. Japanese data is currently unavailable for 2020. The Australian industry is consistently high performing. Minor differences between the years are statistically insignificant given the volumes exported.25
PRIORITY 8.3: ANTIMICROBIAL STEWARDSHIP
8.3a The percentage of feedlots covered by an antibiotic stewardship plan.
Upward, Improvement
This represents the number of NFAS accredited feedlots which were surveyed throughout 2020 and indicated they had voluntarily implemented an antibiotic stewardship plan in their enterprise.26
PEOPLE AND THE COMMUNITY
60%
45%
30%
15%
0%2017 2018 2019 2020
58%
54%
55%
55%
80%
60%
40%
20%
0%2018 2019 2020
39% 58
.5%
62.4
8%
0.012%
0.010%
0.008%
0.006%
0.004%
0.002%
0.000%2018 2019 2020
0.01
11%
0.02
05%
0.00
24%
US
0.012%
0.010%
0.008%
0.006%
0.004%
0.002%
0.000%2018 2019
0%
JAPAN
0%
Australian Beef Sustainability2021
Annual Update
53
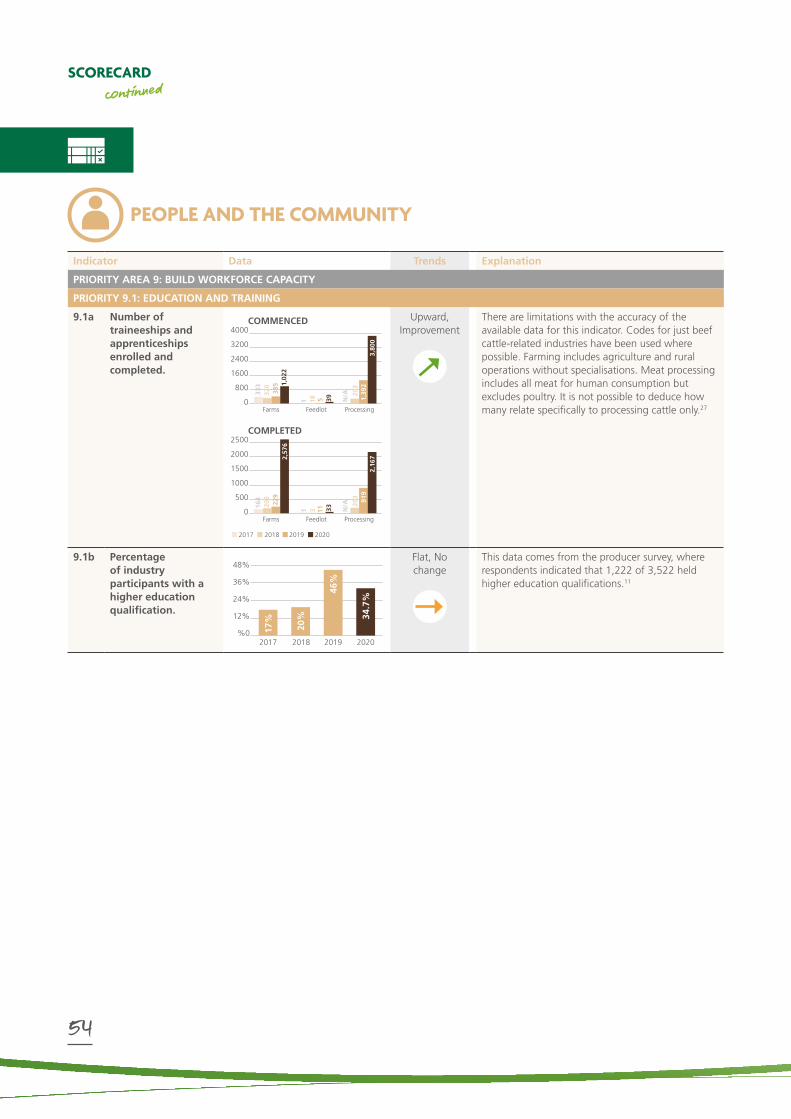
Indicator Data Trends Explanation
PRIORITY AREA 9: BUILD WORKFORCE CAPACITY
PRIORITY 9.1: EDUCATION AND TRAINING
9.1a Number of traineeships and apprenticeships enrolled and completed.
Upward, Improvement
There are limitations with the accuracy of the available data for this indicator. Codes for just beef cattle-related industries have been used where possible. Farming includes agriculture and rural operations without specialisations. Meat processing includes all meat for human consumption but excludes poultry. It is not possible to deduce how many relate specifically to processing cattle only.27
9.1b Percentage of industry participants with a higher education qualification.
Flat, No change
This data comes from the producer survey, where respondents indicated that 1,222 of 3,522 held higher education qualifications.11
PEOPLE AND THE COMMUNITY
SCORECARDcontinued
4000
3200
2400
1600
800
0Farms Feedlot Processing
COMMENCED
320
333
385 1,
022
1,39
23,
800
203
N/A
18 5 391
20182017 2019 2020
48%
36%
24%
12%
%02017 2018 2019 2020
17%
20%
46%
34.7
%
2500
2000
1500
1000
500
0Farms Feedlot Processing
COMPLETED
919
2,57
6
2,16
7
203
164
229
203
31 11 33 N/A
54

PEOPLE AND THE COMMUNITY
Indicator Data Trends Explanation
PRIORITY AREA 9: BUILD WORKFORCE CAPACITY
PRIORITY 9.2: DIVERSITY IN THE WORKFORCE
9.2a The percentage of women and men in the workforce.
Flat, No change
These results indicate a steady representation of the male and female percentages in the beef value chain. There are limitations with the accuracy of data for this indicator. Meat processing includes all meat except poultry, not just beef.28
9.2b The age breakdown of the workforce.
No Trend Applicable
This data comes from the producer survey, representing the age breakdown of the 3,522 employees.11
9.2c The percentage of Indigenous representation in the workforce.
Downward, Setback
This data comes from the producer survey, where respondents indicated that 100 of 3,522 employees were of Aboriginal or Torres Strait Islander heritage. ABS data provides a more accurate representation, and the ABSF will use this data when it is available.11
20182017 2019 2020
5%
3.5%
3%
1.5%
0%2018 2019 2020
3.2%
5%
2.8%
80%
60%
40%
20%
0%Female Male
3039.6
39.5
39.6
60.4
60.5
60.470
FARMS & FEEDLOTS
80%
60%
40%
20%
0%Female Male
7374
.37575
25 2725
.725
PROCESSING
20192018 2020
30%
24%
18%
12%
6%
0%
1019
.3
23
1616
.818
1913
.2
11
1914
.7
9
2114
.7
6
1032
21.4
18-2
4
25-3
4
35-4
4
45-5
4
55-6
4
65+
Australian Beef Sustainability2021
Annual Update
55

SCORECARDcontinued
Indicator Data Trends Explanation
PRIORITY AREA 10: ENSURE HEALTH, SAFETY AND WELLBEING OF PEOPLE IN THE INDUSTRY
PRIORITY 10.1: HEALTH AND SAFETY OF PEOPLE IN THE INDUSTRY
10.1a Notifiable fatalities. Downward, Improvement
The Work-related Traumatic Injury Fatality Data set is sourced from information from the media, workers’ compensation data, fatality notifications from Australia’s various WHS authorities and information in the National Coronial Information System. While details on some workplace deaths are published, there are some deaths that are not in the public domain. Data for sub-categories with smaller fatality numbers are provided as combined amounts (e.g. five-year year total) to avoid disclosing confidential and potentially identifiable information.29
PRIORITY 10.2: WELLBEING OF PEOPLE IN THE INDUSTRY
10.2a Global Life Satisfaction (GLS) Index.
Upward, Improvement
This figure comes from a different data source this year because the results from the most recent Regional Wellbeing Survey have not been finalised. Where possible, the same questions have been asked to respondents. Data is reflective of the 905 responses in the survey. On a scale of 1-100, respondents were asked, considering all aspects of their life, how satisfied they were with their lives as a whole.11
PEOPLE AND THE COMMUNITY
50
40
30
20
10
0Farms Feedlot Processing
42
47
35
00
11
0
2
2014-182013-17 2015-19
100
80
60
40
20
0Farms Feedlot
76.1
75.7
79.4
5
2018 2020
N/A
56

PROGRESSINGThe ABSF
The SSG is currently in the second year of its three-year workplan, covering the following actions:
ANNUAL SUSTAINABILITY REPORTSThis is the fourth Australian Beef Sustainability Annual Update. As the ABSF progresses, the data capture and the industry’s performance trends will become more comprehensive. Based on feedback received last year, a summary report has also been developed for those wishing to access only the report card and key points of the Annual Update.
ENHANCED ENGAGEMENT WITH INDUSTRY GROUPSWhile COVID-19 disrupted most engagement opportunities during 2020, all efforts were made by the SSG and the ABSF team to not lose contact with industry. This has been achieved through monthly updates, and webinars presented to Peak Industry Councils and State Farming Organisations, with topics specific to their region or sector. As travel restrictions ease, it is anticipated engagement with industry groups will become more streamlined. The newly established Industry Forum is testament to the efforts placed here.
HALF-YEARLY CONSULTATIVE COMMITTEE FORUMSThe Consultative Committee is an invaluable reference group for the ABSF. It includes representatives from Australian and international retailers, banks, investors, non-governmental organisations, industry groups, government, and researchers. Historically, the Consultative Committee has held full-day forums. Due to the restrictions and travel advice regarding COVID-19, the SSG instead hosted a series of interactive webinars in August 2020 to ensure ongoing consultation and inclusiveness of the ABSF.
There were 144 unique attendees across the five webinars on the following topics:
» Review of the 2020 Annual Update
» Post-COVID sustainability for beef
» Health and wellbeing of people
» Materiality Assessment of the beef industry
» International markets and trade.
The groups were fortunate to meet face-to-face in February 2021, which drew more than 72 representatives from across the value chain. More information is available in the Appendix.
Step Progress
Annual sustainability reports
Enhanced engagement with industry groups
Half yearly Consultative Committee forums
Advocacy in media and events
Data for more ABSF metrics
Engagement with key stakeholders
Goals for all ABSF priorities
Deep dives into two key priorities
Review of key material risks
Map of Sustainable Development Goals aligning to ABSF priorities
Progressed and on track
Slightly progressed
Completed
Australian Beef Sustainability2021
Annual Update
57

ADVOCACY IN MEDIA AND EVENTSThe SSG works tirelessly when the beef industry’s reputation is questioned or placed at risk. Despite COVID-19 delaying most events, the ABSF played a strong role in advocacy in the media.
In July, the international meat industry came under attack from a United Nations (UN) tweet, claiming “The meat industry is responsible for more greenhouse gas emissions than the world’s biggest oil companies”. There was a strong international backlash against the tweet, and Australia’s response was led by Minister for Agriculture, Drought and Emergency Management, The Hon. David Littleproud MP, who referenced a number of ABSF data points in his defence. The UN later removed its tweet.
Fight for Planet A was one of the more controversial documentaries to air in 2020, and the ABSF played a strong part in correcting misinformation presented in the ABC documentary. Through the innovative mapping of woody vegetation cover, the Australian beef industry was able to show that tree coverage had increased, and 65% of all land used for beef production is managed for better environmental outcomes – equivalent to over 360 million hectares. The ABC was put on notice during Senate hearings in October 2020 over the factually incorrect program, while a formal complaint is still being investigated by the Australian Communications and Media Authority.
DATA FOR MORE ABSF METRICSThis year we have been able to report on 90% of the ABSF’s indicators, continuing an upward trend. It is important to note however, that some of these indicators utilise old data or some have been developed without resourcing to measure. Where possible, these indicators have been slightly modified to gain data, or have been removed from the Update and replaced with a measurable metric.
As part of the materiality review (Page 61), the SSG will undertake a full review of all indicators against the ABSF priorities in preparation for the 2022 Annual Update. Extensive industry consultation will be integral to this action, to ensure indicators are representative and achievable to be reported against.
ENGAGEMENT WITH KEY STAKEHOLDERSThe ABSF engages a wide range of people who have an interest in the beef industry and who can affect or be affected by it.
Engaging with these stakeholders ensures the ABSF is measuring, reporting, and addressing the issues that the industry and community are interested in, and which genuinely influence the sustainability of Australian beef production. These relationships help the SSG and industry representatives make informed decisions, and allow the Framework to provide stakeholders with the information they need to make better decisions.
2020 was a difficult year for engagement, and all participants had to be flexible in how they communicated with one another. The launch of the 2020 Annual Update was an online event, hosted by the Rural Press Club of Queensland, while a number of other engagements were conducted through dedicated webinars. Activity included:
» Presenting at seven ABSF webinars
» Participating in 15 external webinars
» Physical engagements were limited by COVID-19 travel restrictions, however recent lifting of border controls and intrastate travel has allowed for some commitments to recommence.
As borders reopen and travel is permitted, the SSG will look to reinvigorate engagement commitments.
PROGRESSINGThe ABSF continued
58

GOALS FOR ALL ABSF PRIORITIESDeveloping sustainability goals is a natural progression that will make the sustainability ambitions of the beef industry clearer to all stakeholders.
Under the direction of RMAC, the SSG has been exploring the possibility of goals for the ABSF to better engage with consumers and the broader community, protect access to capital and markets, and provide guidance to the industry on where to invest its efforts for continuous improvement. The SSG designed five guiding principles which will serve as the foundation for goal development activities. These principles were confirmed by the Consultative Committee in August 2019 and by RMAC in early 2020. These principles are available via: https://www.sustainableaustralianbeef.com.au/projects/goal-setting/
While specific goal setting for the Australian beef industry has not advanced further than this due to a number of constraints, there has been progress made in broader discussions in relation to goals being set through the Global Roundtable for Sustainable Beef and the United Nations Sustainable Development Goals.
DEEP DIVES INTO TWO KEY PRIORITIESAn important part of the ABSF’s mandate is improving the credibility of its indicators and measures. While the ABSF aims to continuously improve its measures across all 23 priorities, some require more thorough examination.
The SSG has initiated investigations into the priority animal husbandry techniques. The purpose of this deep dive is to address the challenges of the current reporting mechanisms, while also ensuring the national cattle industry position is addressed. Specific matters to be addressed are:
» If the indicators which the ABSF currently reports on are the most applicable and relevant when measuring the cattle industry’s performance in regard to animal husbandry techniques
» Analysing the reliability and credibility of the current data sources
» Providing or recommending other data sources with improved reliability and credibility.
A working group is currently undertaking these investigations on behalf of the SSG. This group comprises:
» Melinee Leather, Barfield Station
» Trevor Moore, The Casino Food Co-Op
» Justin Toohey, Animal Welfare Collaborative Advisory Panel
» Melina Tenson, RSPCA
» Melissa George, Bovine Dynamics
» Claire House, Australian Meat Industry Council
Australian Beef Sustainability2021
Annual Update
59

PROGRESSINGThe ABSF continued
REVIEW OF KEY MATERIAL RISKSThe SSG successfully completed a full review of the key material risks for the Australian beef industry. This activity has been essential to understanding the views of the industry’s stakeholders, and has set the ABSF up for more accurate and targeted reporting in coming years.
For more information, refer to Page 61, or visit www.sustainableaustralianbeef.com.au/projects/materiality
MAP OF SDGS ALIGNING TO ABSF PRIORITIESThe UN Sustainable Development Goals (SDGs) represent the world’s plan for action on sustainability. When the ABSF was released, work was done to show which SDGs the Framework addressed – this can be found in the Appendix.
Of increasing urgency is the need for Australia to respond to international pressure, particularly from the European Union, and more recently our Asian neighbours, to push beyond our ‘clean and green’ image and measure and report against internationally recognised sustainability metrics. Maturing our approach to global sustainability benchmarking is vital to keeping pace with our trade competitors and avoiding losing market access.
The EU is leading the future of sustainability reporting. If Australia is to maintain access to this and other markets, we need to increase awareness and encourage agricultural export businesses to look seriously at their alignment to international sustainability benchmarks, such as the SDGs. These benchmarks are also tools for Australia to demonstrate its responsiveness to changing consumer expectations and attracting sustainability-linked investment.
Australia’s rural industries have a huge opportunity to respond to growing global expectations around sustainability reporting. However, alongside this opportunity exists a threat in that if we don’t act quickly, we could end up behind our trade competitors.
For many agricultural commodities, the SDGs present an opportunity to maintain licence to operate while developing a more sustainable and resilient industry that is connected to society. The SDGs also have the potential to support industries in meeting requirements and regulations when seeking financial opportunities and investment in an era where shared value is a characteristic desired by banks, insurers, and investors.30
Governments may rely on the contribution of data by certain industries to inform a country’s aggregate SDG progress. For example, in the past the Department of Agriculture, Water and the Environment (DAWE) has requested data from the fisheries sector via the Fisheries Research and Development Corporation on the status of Australian fish stocks in order to help determine the nation’s progress toward indicator 14.4.1 Proportion of fish stocks within biologically sustainable levels. Additionally, departments may call on industries to validate or check a declaration of aggregate contribution toward SDGs in government reporting. For example, the cotton industry as represented by the Cotton Research and Development Corporation were asked in 2018 by DFAT to validate the accuracy of statements regarding water use and carbon efficiency in the industry under SDG 2.30
60

MATERIALITYAssessment
The Sustainability Steering Group undertook a Materiality Assessment to identify and prioritise those areas of production that present a material opportunity for industry. It assessed the significance of sustainability actions arising from industry operations and the influence of these actions on the decisions of stakeholders.
The ABSF completed a materiality assessment in 2011. This was followed by a technical review of priority areas in 2014, a social licence review in 2015, and an update of the initial assessment in 2016.
The 2020 Materiality Assessment was informed by best practice from the Global Reporting Initiative (GRI) Standards, Sustainability Accounting Standards Board (SASB), the AA1000 AccountAbility Principles (AA1000AP) 2018, the AA1000 Stakeholder Engagement Standard 2015 (AA1000SES), and the Sustainable Development Goals (SDGs).
For this assessment, materiality has been defined according to two dimensions:
1. Significance of the industry’s economic, environmental, and social impacts.
2. Significance to, and influence on, stakeholder assessments and decisions.
Outcomes The Materiality Assessment identified 24 material priorities to be adopted in the ABSF from 2022 onwards. As part of this work, the Sustainability Steering Group will review the current themes, priorities, indicators, and progress of the ABSF and compare these with the results of this materiality assessment, to identify gaps, strengths, and weaknesses.
The highly material topics were identified as:
» Animal husbandry
» Processing practices
» Livestock transport
» Livestock health and welfare
» GHG emissions and carbon capture
» Biodiversity
» Soil health
» Forests, woodlands, and grasslands
» Climate change resilience
» Biosecurity
» Water
The full Materiality Assessment report is available at: www.sustainableaustralianbeef.com.au
Australian Beef Sustainability2021
Annual Update
61

Figure 9: What we did.
62

ABSF HISTORY Following a series of technical reviews, the first SSG – appointed in January 2016 – led the development of the ABSF through extensive industry, external and public consultation. The ABSF officially launched in March 2017 and, since then, the SSG has driven its implementation through continued consultation, engagement with experts and ongoing review of industry activity and data aligned with the ABSF.
GOVERNANCE The ABSF is an initiative of the Red Meat Advisory Council (RMAC). RMAC is the peak body representing the collective interests of the Australian red meat industry. It is made up of the Australian Livestock Exporters Council, Australian Lot Feeders’ Association, Australian Meat Industry Council, and the Cattle Council of Australia, and other red meat industry representative bodies. RMAC has appointed a grassroots SSG that is representative of industry, to lead the ABSF.
The priority area is important (or likely to be important) to our customers, the community and the Australian beef industry and is within the industry’s scope of influence.
The constructive views of industry, customers, consumers, government and community groups as to how industry can continuously improve performance will be valued and considered.
The decision (about a theme, priority area, indicator, KPI or recommendation) is grounded in evidence. It can or has the potential to be monitored and managed.
The indicator is realistic. The industry is able (scope of influence) to make changes that represent value in the chain through continuous improvement.
The industry can provide an open and honest picture of performance using the most appropriate data available.
RELEVANCE INCLUSIVITY CREDIBILITY PRACTICALITY TRANSPARENCY
Approve RMAC
Sustainability Steering Group
Producers, processors, feedlots, transport
On
go
ing
measu
remen
t
Industry service companies (MLA, AMPC and Live Corp)
Consultative Committee Technical experts
Direct
Consult
Adopt best practice
SupportDeliver research, development, extension and secretarial support
PRINCIPLES AND VALUES Five principles were established to guide development and implementation for the framework.
APPENDICES
Australian Beef Sustainability2021
Annual Update
63

APPENDICEScontinued
CONSULTATIVE COMMITTEE The Consultative Committee serves as a reference group for the ABSF. Consulting with the group has provided valuable insight and perspective into the activities and expectations of our non-industry stakeholders. Their input was used to determine the six key priorities.
The Consultative Committee includes Australian and overseas retailers, banks, investors, environment and welfare non-government organisations, agribusiness, researchers, government, policy organisations and industry groups.
The Consultative Committee meets twice a year to:
» Share information about emerging trends, issues, and opportunities for sustainable food production
» Identify emerging issues and opportunities for industry
» Confirm the priority areas of sustainable beef production for reporting progress to stakeholders and the wider community
» Enable the SSG and therefore, industry to better anticipate emerging focus areas for customers and other stakeholders
» Provide the SSG with more information to better implement the ABSF.
The establishment of the Consultative Committee recognises those within and outside of the industry must work together for the ABSF to be valuable, relevant, and robust. The commitment made to the Consultative Committee is that all views are listened to and considered, with clear reporting of why or why not suggestions were actioned. Organisations wishing to join the Consultative Committee should contact the ABSF Secretariat via www.sustainableaustralianbeef.com.au
INDUSTRY FORUMAs an industry we have been on this road of transparency and collaboration for five years and there are numerous occasions where the value of this has been clear to those involved and close to the process.
The ABSF is committed to working harder to connect with the wider red meat sector and to facilitate a strong understanding of the priorities of our end customers and those who influence consumer decision-making.
The SSG agreed a suitable method to address this matter was to expand on the Consultative Committee format and develop an annual Industry Forum.
This annual event focuses on discussion of some of the more contentious matters which may arise when an internal industry view opposes that held by some external stakeholders.
The first Industry Forum was held in March of this year and welcomed over 30 industry representatives to the table for constructive feedback and discussion on the performance of both the industry and the ABSF. The SSG was inspired to hear further industry commitment to supporting the sustainability message. This forum will become a key activity for the ABSF in the years to come, as industry looks to strengthen its position and performance across all aspects of sustainability.
64

SUSTAINABILITY STEERING GROUPRMAC appoints an independent, grassroots group, representative of the beef value chain, to progress the ABSF on behalf of industry. These positions are skill and knowledge based, and appointed through an expression of interest process run by RMAC.
Tess Herbert Chair, SSG Owner, Gundamain and Ladysmith Feedlots
Carl Duncan Group Manager Resource Efficiency & Sustainability, Teys Australia
Mark Davie Director, Keppel Brand
Melinee Leather Owner/Manager, Leather Cattle Company
Dr Michael Maxwell Partner, HFW
Kim McDougall General Manager, Agriculture, Harvest Road Group
Trevor Moore Group Systems & Compliance Manager, The Casino Foods Co-Op
Jenny O’Sullivan Mixed farming owner and operator and Principle of agri-tourism business
Australian Beef Sustainability2021
Annual Update
65

APPENDICEScontinued
SUSTAINABLE DEVELOPMENT GOALS (SDGS) The SDGs are a universal call to action to end poverty, protect the planet and improve the lives and prospects of everyone, everywhere. The 17 goals were adopted by all UN Member States in 2015, as part of the 2030 Agenda for Sustainable Development which set out a 15-year plan to achieve the SDGs.
Today, progress is being made in many places, but overall, action to meet the SDGs is not yet advancing at the speed or scale required. World leaders at the SDG Summit in September 2019 called for a Decade of Action and delivery for sustainable development, and pledged to mobilise financing, enhance national implementation, and strengthen institutions to achieve the SDGs by the target date of 2030 – leaving no one behind. Implementation and success will rely on countries’ own sustainable development policies, plans and programmes.
Communities, investors, and other stakeholders increasingly expect industries to prove their sustainability. Aligning with the SDGs helps the Australian beef industry meet these changing expectations. The ABSF addresses SDGs 2 (zero hunger), 6 (clean water and sanitation), 7 (affordable and clean energy), 8 (decent work and economic growth), 12 (responsible consumption and production), 13 (climate action), 14 (life below water), 15 (life on land) and 17 (partnerships for the goals).
Figure 10: Sustainable Development Goals
66

GLOSSARY
Australian Beef Sustainability2021
Annual Update
67
AAWCS Australian Livestock Processing Industry Animal Welfare Certification System. An independently-audited certification program used by Australian livestock processors to demonstrate compliance with the industry best practice animal welfare standards.
ABARES Australian Bureau of Agricultural and Resource Economics and Sciences.
ABS Australian Bureau of Statistics.
ALEC Australian Livestock Exporters’ Council. The peak industry body for the Australian livestock export industry.
ALFA Australian Lot Feeders’ Association. The peak national body for the Australian cattle feedlot industry.
AMIC Australian Meat Industry Council. The peak council that represents retailers, processors, exporters and smallgoods manufacturers in the post-farm-gate meat industry.
AMPC Australian Meat Processing Corporation. The Rural Research and Development Corporation that supports the red meat processing industry throughout Australia. AMPC’s mandate is to provide research, development and extension services that improve the sustainability and efficiency of the sector.
APVMA Australian Pesticides and Veterinary Medicines Authority. An Australian Government statutory agency responsible for the management and regulation of all agricultural and veterinary chemical products in Australia.
AMR Antimicrobial resistance. The ability of a microbe to resist the effects of medication that once could successfully destroy the microbe. Microbes include bacteria, viruses and other microscopic organisms.
Branding The placing of permanent identifying marks on the hide of an animal by destroying the hair follicles and altering the hair regrowth.
BSE Bovine spongiform encephalopathy, commonly known as mad cow disease.
Canopy cover The fraction of ground area covered by the vertical projection of tree crown perimeters.
Carbon sequestration A process of capturing and storing atmospheric carbon dioxide, which has the potential to mitigate climate change.
Carcase The body of an animal after being dressed (removal of head, feet, hide and internal organs).
CBPP Contagious Bovine Pleuropneumonia, a highly contagious infectious disease of cattle that attacks the lungs and thoracic membrane, with a high mortality rate.
CN30 Initiative and target relating to the red meat industry becoming carbon neutral by 2030.
CO2e Carbon dioxide equivalent, a standard unit for measuring greenhouse gas emissions.
CSIRO Commonwealth Scientific and Industrial Research Organisation. An Australian federal government agency responsible for scientific research.
DAWE Department of Agriculture, Water and the Environment
Dehorning The removal of horns from cattle. It is a labour-intensive, skilled operation with important animal welfare implications, and is totally avoidable by breeding polled (hornless) cattle.
Ear nothing It has business benefits by enabling livestock to be identified on-farm, leading to improved management.
ESCAS Exporter Supply Chain Assurance System. An Australian Government regulatory program based on four principles: animal welfare, control through the supply chain, traceability through the supply chain and independent auditing.

GLOSSARYcontinued
Five Domains of Animal Welfare The Five Domains of Animal Welfare that extend on the Five Freedoms (see below). They support the evolved understanding of animal welfare as the state of an animal in relation to its ability to cope with its own environment, not just freedom from cruelty.
Five Freedoms of Animal Welfare The Five Freedoms were created by the UK Farm Animal Welfare Council, and provide a base from which to consider the welfare of an animal.
GDP Gross Domestic Product.
GHG Greenhouse gas.
GLS Global Life Satisfaction. Quantifies a person’s subjective wellbeing in a ‘global’ sense - taking into account all aspects of their wellbeing.
GRI Global Reporting Initiative, an international independent standards organisation that helps businesses communicate their sustainability impacts, and is a global standard for sustainability reporting.
ha Hectare.
HSCW Hot Standard Carcase Weight. Used to describe the weight of an animal, particularly when the animal is sold directly from a farm to an abattoir.
Kg Kilogram.
KL Kilolitre.
L Litre.
LCA Life Cycle Assessment. A technique to assess environmental impacts associated with a product across a supply chain.
Lotfeeding The process of feeding cattle on grain in a feedlot, where cattle are fed a high-protein grain-based diet to reach exact market specifications, before being supplied to processors.
LPA Livestock Production Assurance. The Australian livestock industry’s on-farm assurance program covering food safety, animal welfare and biosecurity. It provides evidence of livestock history and on-farm practices when transferring livestock through the value chain.
LPA NVD LPA National Vendor Declarations. A form that documents the movement of livestock when they are bought, sold or moved off a property. This form accompanies all such movements.
Materiality The principle of reporting against and addressing the industry’s most material issues. These are issues with a direct or indirect impact on an organisation’s ability to create, preserve or erode economic, environmental and social value for itself, its stakeholders and society at large.
MLA Meat & Livestock Australia. A producer-owned industry service provider that provides marketing and research and development services to cattle, sheep and goat industries.
MSA Meat Standards Australia. A grading system for meat that has met strict eating quality criteria.
NFAS National Feedlot Accreditation Scheme. An independently-audited quality assurance scheme initiated by ALFA that includes quality assurance, welfare and other components.
NLIS National Livestock Identification System. Australia’s system for identifying and tracing cattle, sheep and goats.
NRM Natural resource management. This refers to the protection and improvement of environmental assets such as soils, water, vegetation and biodiversity.
NSW New South Wales, a state on the east coast of Australia.
68

OIE World Organisation for Animal Health. An intergovernmental organisation coordinating, supporting and promoting animal disease control.
Paris Agreement An international agreement under the United Nations Framework Convention on Climate Change, dealing with the mitigation of greenhouse gas emissions, adaptation to climate change, and climate change-related finance. The Paris Agreement commits members to the long-term goal of keeping the increase in global average temperatures to well below 2°C above pre-industrial levels, and to limit the increase to 1.5°C.
Polled livestock Livestock, including cows and bulls, born without horns due to the poll gene for which they can be selectively bred.
Rinderpest An infectious viral disease of cattle characterised by fever, dysentery and inflammation of the mucous membranes.
Red Meat 2030 A 10-year strategic plan for Australia’s red meat businesses, developed in consultation with industry and government.
RMAC Red Meat Advisory Council. A network of producers, lot feeders, manufacturers, retailers and livestock exporters that represent Australian beef, goatmeat and sheepmeat businesses from gate to plate.
Safe Work Safe Work Australia - An Australian government statutory body established to develop national policy relating to work health and safety and workers’ compensation.
TruckSafe An independently-audited accreditation scheme for truck operators that ensures quality, safety and best practice. TruckSafe includes an animal welfare module.
Woody vegetation Plants that produce wood as their structural tissue and have woody stems, such as trees.
Australian Beef Sustainability2021
Annual Update
69

REFERENCES
1 MLA Fast Facts 2020
2 2020 State of the Industry, MLA
3 2020 MLA Saleyard Survey
4 Calculated using the 2.4m tonnes produced and the 65g/day recommended
5 MLA Global Snapshot, 2020
6 Quarterly Update of Australia’s National Greenhouse Gas Inventory: June 2020
7 https://www.amr.gov.au/about-amr/amr-australia/amr-and-animal-health-australia
8 https://research.csiro.au/climatesmartagriculture/our-research/resilient-farming-systems/scans-and-sons-and-daughters-of-scans
9 LPA Audit Outcomes
10 ALFA - NFAS Audit Results
11 Beef Producer Survey
12 Trucksafe - Australian Trucking Association
13 Department of Agriculture, Water and the Environment (https://www.agriculture.gov.au/export/controlled-goods/live-animals/live-animal-export-statistics/reports-to-parliament)
14 MLA, Aggregated slaughter numbers from accredited establishments
15 World Organisation for Animal Health (OIE)
16 ABARES
17 2018, SH Heilbron Economic and Policy Consulting
18 MLA Red Meat Market Access Indicators 2021
70
19 MLA Domestic Consumer Tracker
20 ABS, Agricultural Commodities
21 CIBOLabs, Project Code: E.CEM.1931
22 2019, S.G. Wiedemann et al
23 MLA Project: V.MFS.0448
24 CSIRO, Project Code: E.CEM.1932
25 MLA Commissioned Tracking
26 ALFA - Antimicrobial Survey Results
27 National Centre for Vocational Education Research
28 Workplace Gender Quality Agency
29 SafeWork
30 AgriFutures Australia, 2020
31 Deloitte Access Economics B.FLT.8011
32 AuctionsPlus Statistical Review December - 2020
33 Department of the Environment and Energy. (2019). Australian Greenhouse Emissions Information System. Commonwealth of Australia, Canberra.
34 Technology Investment Roadmap: First Low Emissions Technology Statement, Australian Government Department of Industry, Science, Energy and Resources, September 2020
35 2020, Quirke, Market Access Index prepared by The CIE
Australian Beef Sustainability2021
Annual Update
71
AUSTRALIAN BEEF SUSTAINABILITY FRAMEWORK
FOR FURTHER INFORMATION PLEASE CONTACT:
Jacob Betros Secretariat for the
Sustainability Steering [email protected]