Helical plc
95
HELICAL PLC Annual Report and Accounts 2021
-
Upload
khangminh22 -
Category
Documents
-
view
1 -
download
0
Transcript of Helical plc

Annual R
epo
rt and A
ccounts 20
21
HELICAL PLCAnnual Report and Accounts 2021

Helical plc We create buildings for today’s occupiers who demand more inspiring and flexible space, market leading amenities, high quality management and with sustainability and wellness at their core. Applying this philosophy we seek to maximise Shareholder returns through delivering income growth from creative asset management and capital gains from our development activity.
01 STRATEGIC REPORT
Chief Executive’s Statement 2 Our Market 6The Office Experience 8 Investment Case 10Strategy 26Business Model 30 Key Performance Indicators 32 Property Portfolio 36 The Property Portfolio in Numbers 44 Financial Review 47Risk Management 52Sustainability at Helical 60Our Stakeholders – Section 172(1) Statement 72
82 GOVERNANCE
Chairman’s Review 82Board of Directors 84 Corporate Governance Report 88 – Nominations Committee 94 – Audit and Risk Committee 99 – Directors’ Remuneration 103 Report of the Directors 126 Directors’ Responsibilities Statement 129
130 FINANCIAL STATEMENTS
Independent Auditor’s Report to the Members of Helical plc 130Consolidated Income Statement 136 Consolidated Statement of Comprehensive Income 136Consolidated and Company Balance Sheets 137Consolidated and Company Cash Flow Statements 138 Consolidated and Company Statements of Changes in Equity 139Notes to the Financial Statements 141
172 ADDITIONAL INFORMATION
Appendix 1 – See-through Analysis 172Appendix 2 – Total Accounting Return and Total Property Return 174Appendix 3 – Five Year Review 175Appendix 4 – Property Portfolio 176Appendix 5 – EPRA Performance Measures 177Glossary 178Shareholder Information 180Financial Calendar and Advisors 182
London focused We continue to view the London commercial property market as the best source of capital profits and we believe that our experience and skills are best deployed in this sector.
Property Portfolio Pages 36 to 43
BREEAM “Outstanding” 33 Charterhouse Street received the UK’s first BREEAM “Outstanding” at design stage under the 2018 guidelines
Designing for Net Zero Publication of “Designing for Net Zero”, a guide to help aid our professional teams in meeting our net zero carbon aspirations
Sustainability at Helical Pages 60 to 71
Sustainability
We believe that businesses will always need space to bring their teams together to collaborate and work effectively. That’s why we’ve built our portfolio to help give our tenants the freedom to grow in the years ahead.
1 See Glossary for definition of terms. The financial statements have been prepared in accordance with International Accounting Standards (IAS) in conformity with the Companies Act 2006. In common with usual and best practice in our sector, alternative performance measures have also been provided to supplement IFRS, some of which are based on the recommendations of the European Public Real Estate Association (“EPRA”), with others designed to give additional information about the Group’s share of assets and liabilities, income and expenses in subsidiaries and joint ventures.
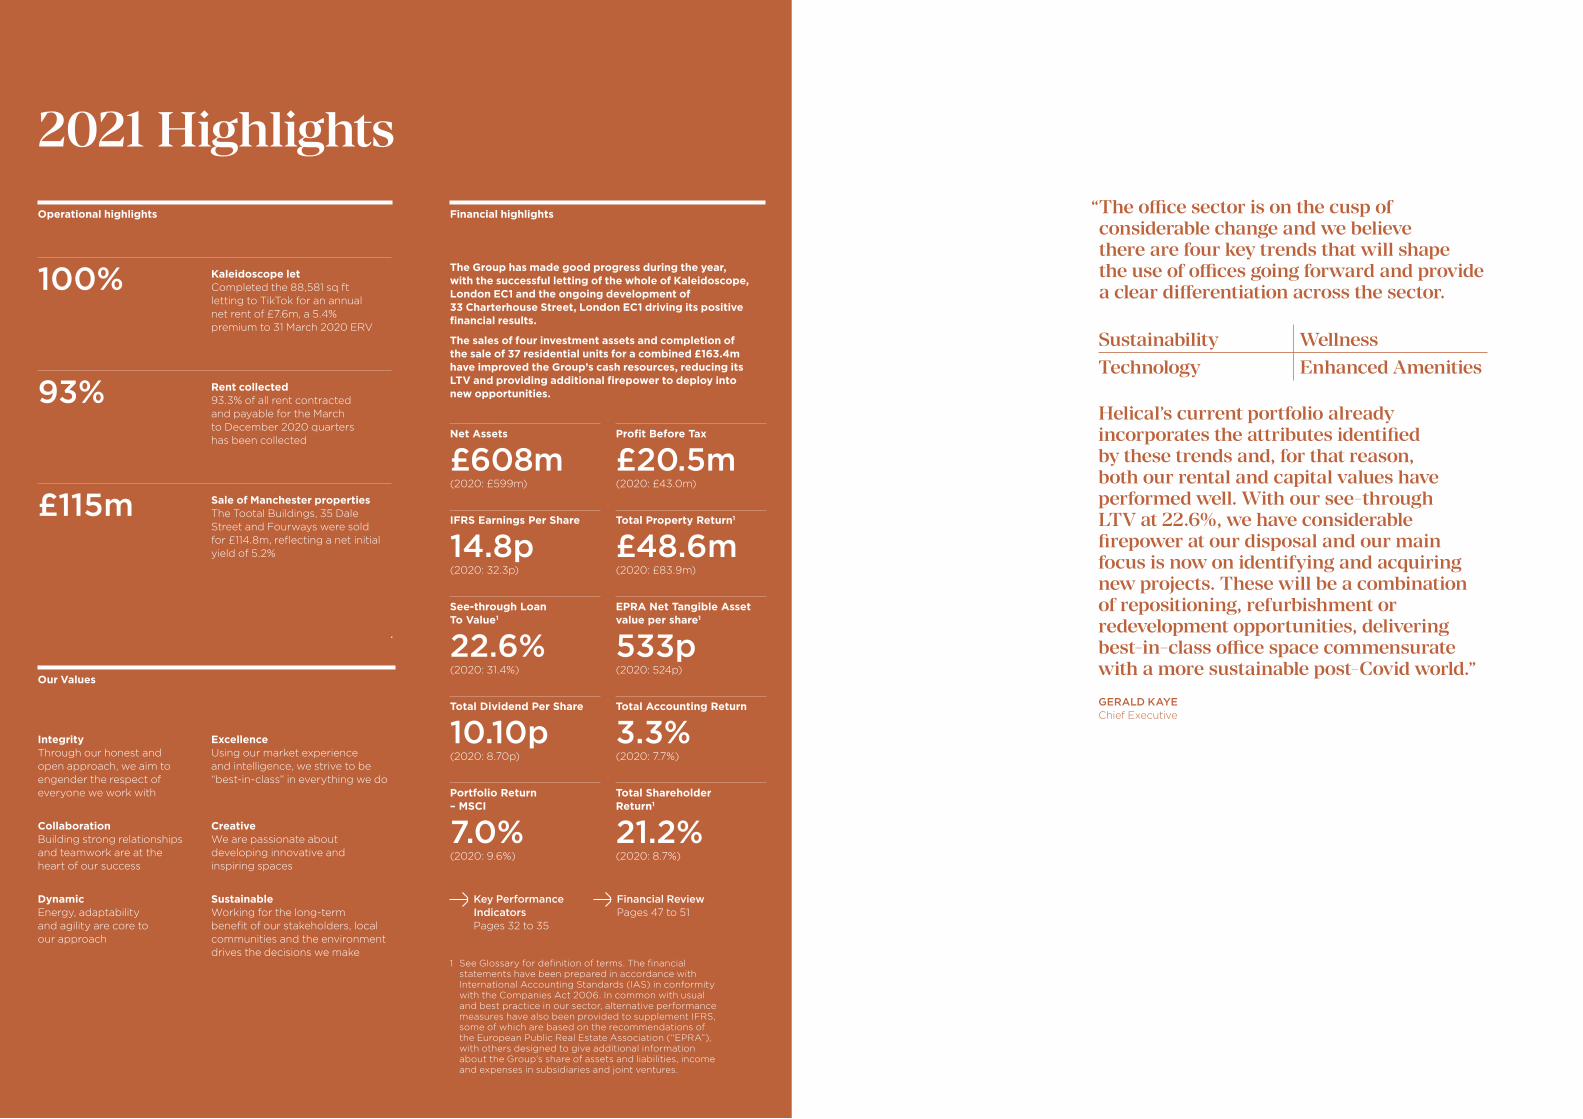
“ The office sector is on the cusp of considerable change and we believe there are four key trends that will shape the use of offices going forward and provide a clear differentiation across the sector.
Sustainability WellnessTechnology Enhanced Amenities
Helical’s current portfolio already incorporates the attributes identified by these trends and, for that reason, both our rental and capital values have performed well. With our see-through LTV at 22.6%, we have considerable firepower at our disposal and our main focus is now on identifying and acquiring new projects. These will be a combination of repositioning, refurbishment or redevelopment opportunities, delivering best-in-class office space commensurate with a more sustainable post-Covid world.”
GERALD KAYE Chief Executive
Key Performance Indicators Pages 32 to 35
Financial Review Pages 47 to 51
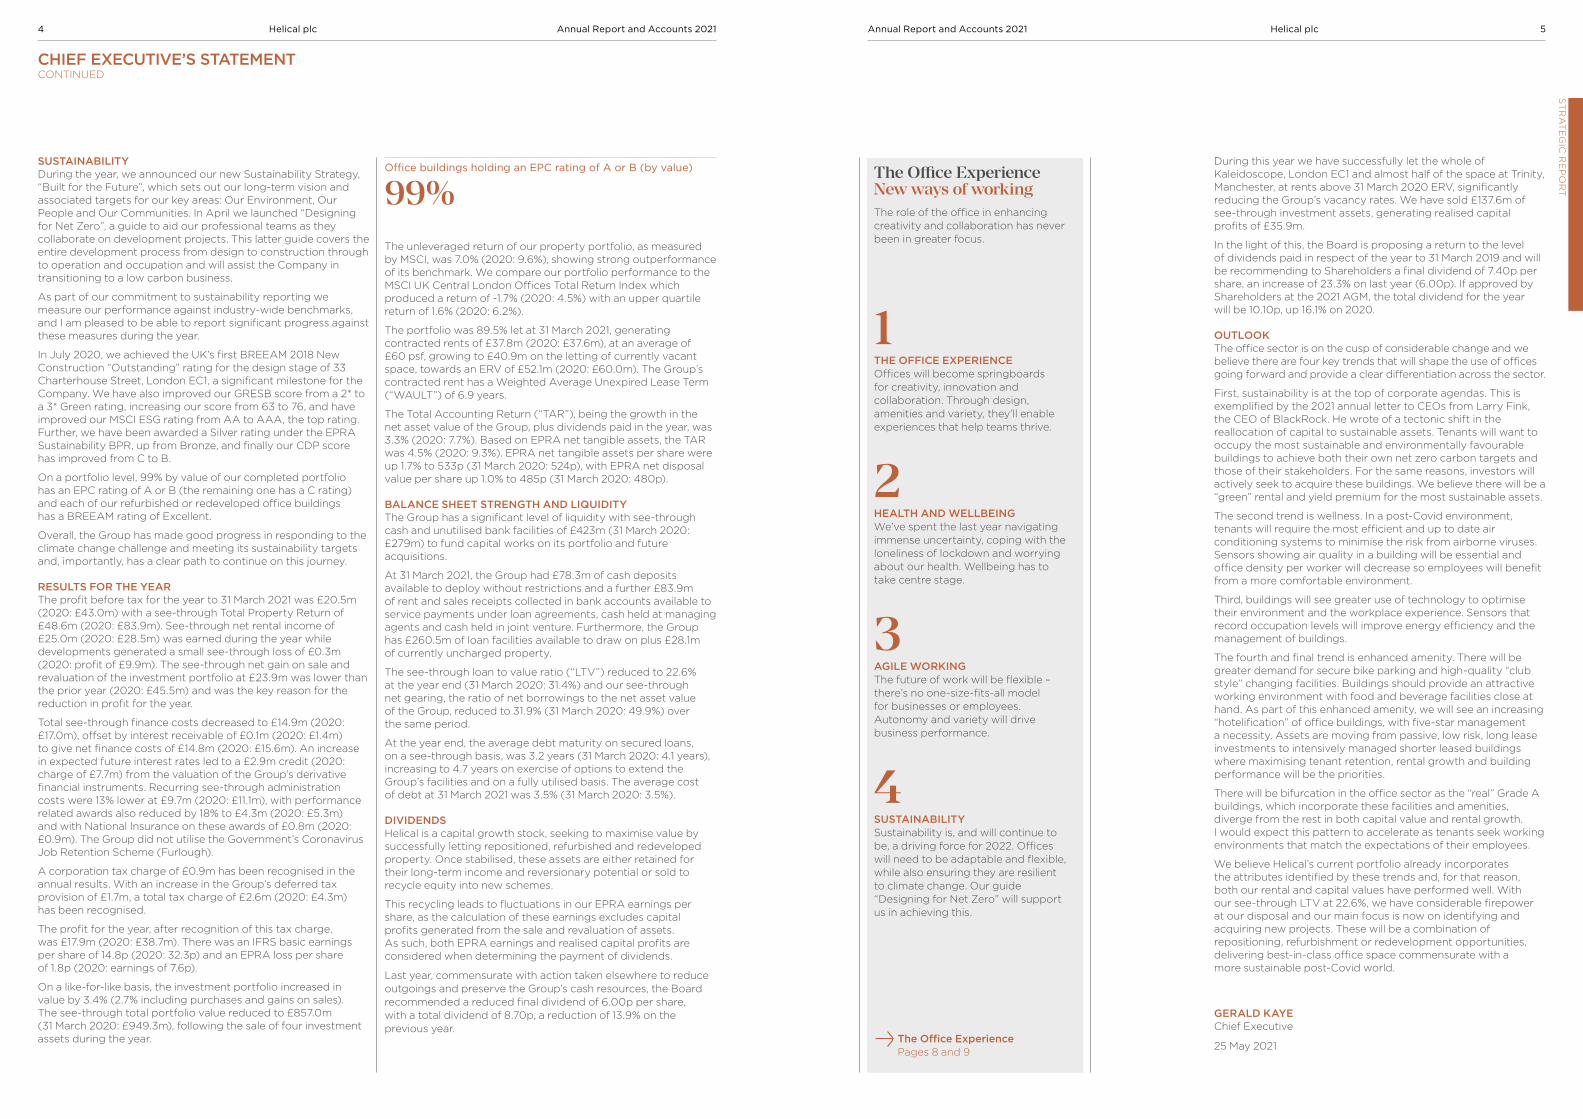
Operational highlights
Kaleidoscope let Completed the 88,581 sq ft letting to TikTok for an annual net rent of £7.6m, a 5.4% premium to 31 March 2020 ERV
100%
Rent collected 93.3% of all rent contracted and payable for the March to December 2020 quarters has been collected
93%
Sale of Manchester properties The Tootal Buildings, 35 Dale Street and Fourways were sold for £114.8m, reflecting a net initial yield of 5.2%
£115m
Financial highlights
The Group has made good progress during the year, with the successful letting of the whole of Kaleidoscope, London EC1 and the ongoing development of 33 Charterhouse Street, London EC1 driving its positive financial results.
The sales of four investment assets and completion of the sale of 37 residential units for a combined £163.4m have improved the Group’s cash resources, reducing its LTV and providing additional firepower to deploy into new opportunities.
Net Assets
£608m(2020: £599m)
Profit Before Tax
£20.5m(2020: £43.0m)
IFRS Earnings Per Share
14.8p(2020: 32.3p)
Total Property Return1
£48.6m(2020: £83.9m)
See-through Loan To Value1
22.6%(2020: 31.4%)
EPRA Net Tangible Asset value per share1
533p(2020: 524p)
Total Accounting Return
3.3%(2020: 7.7%)
Total Dividend Per Share
10.10p(2020: 8.70p)
Total Shareholder Return1
21.2%(2020: 8.7%)
Portfolio Return – MSCI
7.0%(2020: 9.6%)
Our Values
Integrity Through our honest and open approach, we aim to engender the respect of everyone we work with
Excellence Using our market experience and intelligence, we strive to be “best-in-class” in everything we do
Collaboration Building strong relationships and teamwork are at the heart of our success
Dynamic Energy, adaptability and agility are core to our approach
Creative We are passionate about developing innovative and inspiring spaces
Sustainable Working for the long-term benefit of our stakeholders, local communities and the environment drives the decisions we make
2021 Highlights

futureThe
of offic es
OVERVIEWWe announce these annual results as the country emerges from the Covid-19 pandemic with businesses re-opening and employees returning to their usual places of work. It is hoped all remaining restrictions are lifted on 21 June in accordance with the Government roadmap. Removing these restrictions is vital to the recovery of the economy so that businesses can operate efficiently and effectively in a post-Covid world.
Helical has performed well over the past year, despite the challenges presented by the pandemic, collecting over 93% of rents from its tenants and reducing both finance and administration costs. Our investment portfolio has contributed rental growth and capital surpluses, mainly as the result of our letting successes at Kaleidoscope, London EC1 and Trinity in Manchester. We have strengthened the Balance Sheet by selling investment assets above book value (before transaction costs) and have reduced the Group’s gearing level to its lowest for 30 years.
The role of the office in enhancing creativity and collaboration has never been in greater focus.
CHIEF EXECUTIVE’S STATEMENT
2 Helical plc Annual Report and Accounts 2021 3Helical plcAnnual Report and Accounts 2021S
TR
AT
EG
IC R
EP
OR
T
The unleveraged return of our property portfolio, as measured by MSCI, was 7.0% (2020: 9.6%), showing strong outperformance of its benchmark. We compare our portfolio performance to the MSCI UK Central London Offices Total Return Index which produced a return of -1.7% (2020: 4.5%) with an upper quartile return of 1.6% (2020: 6.2%).
The portfolio was 89.5% let at 31 March 2021, generating contracted rents of £37.8m (2020: £37.6m), at an average of £60 psf, growing to £40.9m on the letting of currently vacant space, towards an ERV of £52.1m (2020: £60.0m). The Group’s contracted rent has a Weighted Average Unexpired Lease Term (“WAULT”) of 6.9 years.
The Total Accounting Return (“TAR”), being the growth in the net asset value of the Group, plus dividends paid in the year, was 3.3% (2020: 7.7%). Based on EPRA net tangible assets, the TAR was 4.5% (2020: 9.3%). EPRA net tangible assets per share were up 1.7% to 533p (31 March 2020: 524p), with EPRA net disposal value per share up 1.0% to 485p (31 March 2020: 480p).
BALANCE SHEET STRENGTH AND LIQUIDITYThe Group has a significant level of liquidity with see-through cash and unutilised bank facilities of £423m (31 March 2020: £279m) to fund capital works on its portfolio and future acquisitions.
At 31 March 2021, the Group had £78.3m of cash deposits available to deploy without restrictions and a further £83.9m of rent and sales receipts collected in bank accounts available to service payments under loan agreements, cash held at managing agents and cash held in joint venture. Furthermore, the Group has £260.5m of loan facilities available to draw on plus £28.1m of currently uncharged property.
The see-through loan to value ratio (“LTV”) reduced to 22.6% at the year end (31 March 2020: 31.4%) and our see-through net gearing, the ratio of net borrowings to the net asset value of the Group, reduced to 31.9% (31 March 2020: 49.9%) over the same period.
At the year end, the average debt maturity on secured loans, on a see-through basis, was 3.2 years (31 March 2020: 4.1 years), increasing to 4.7 years on exercise of options to extend the Group’s facilities and on a fully utilised basis. The average cost of debt at 31 March 2021 was 3.5% (31 March 2020: 3.5%).
DIVIDENDSHelical is a capital growth stock, seeking to maximise value by successfully letting repositioned, refurbished and redeveloped property. Once stabilised, these assets are either retained for their long-term income and reversionary potential or sold to recycle equity into new schemes.
This recycling leads to fluctuations in our EPRA earnings per share, as the calculation of these earnings excludes capital profits generated from the sale and revaluation of assets. As such, both EPRA earnings and realised capital profits are considered when determining the payment of dividends.
Last year, commensurate with action taken elsewhere to reduce outgoings and preserve the Group’s cash resources, the Board recommended a reduced final dividend of 6.00p per share, with a total dividend of 8.70p, a reduction of 13.9% on the previous year.
During this year we have successfully let the whole of Kaleidoscope, London EC1 and almost half of the space at Trinity, Manchester, at rents above 31 March 2020 ERV, significantly reducing the Group’s vacancy rates. We have sold £137.6m of see-through investment assets, generating realised capital profits of £35.9m.
In the light of this, the Board is proposing a return to the level of dividends paid in respect of the year to 31 March 2019 and will be recommending to Shareholders a final dividend of 7.40p per share, an increase of 23.3% on last year (6.00p). If approved by Shareholders at the 2021 AGM, the total dividend for the year will be 10.10p, up 16.1% on 2020.
OUTLOOKThe office sector is on the cusp of considerable change and we believe there are four key trends that will shape the use of offices going forward and provide a clear differentiation across the sector.
First, sustainability is at the top of corporate agendas. This is exemplified by the 2021 annual letter to CEOs from Larry Fink, the CEO of BlackRock. He wrote of a tectonic shift in the reallocation of capital to sustainable assets. Tenants will want to occupy the most sustainable and environmentally favourable buildings to achieve both their own net zero carbon targets and those of their stakeholders. For the same reasons, investors will actively seek to acquire these buildings. We believe there will be a “green” rental and yield premium for the most sustainable assets.
The second trend is wellness. In a post-Covid environment, tenants will require the most efficient and up to date air conditioning systems to minimise the risk from airborne viruses. Sensors showing air quality in a building will be essential and office density per worker will decrease so employees will benefit from a more comfortable environment.
Third, buildings will see greater use of technology to optimise their environment and the workplace experience. Sensors that record occupation levels will improve energy efficiency and the management of buildings.
The fourth and final trend is enhanced amenity. There will be greater demand for secure bike parking and high-quality “club style” changing facilities. Buildings should provide an attractive working environment with food and beverage facilities close at hand. As part of this enhanced amenity, we will see an increasing “hotelification” of office buildings, with five-star management a necessity. Assets are moving from passive, low risk, long lease investments to intensively managed shorter leased buildings where maximising tenant retention, rental growth and building performance will be the priorities.
There will be bifurcation in the office sector as the “real” Grade A buildings, which incorporate these facilities and amenities, diverge from the rest in both capital value and rental growth. I would expect this pattern to accelerate as tenants seek working environments that match the expectations of their employees.
We believe Helical’s current portfolio already incorporates the attributes identified by these trends and, for that reason, both our rental and capital values have performed well. With our see-through LTV at 22.6%, we have considerable firepower at our disposal and our main focus is now on identifying and acquiring new projects. These will be a combination of repositioning, refurbishment or redevelopment opportunities, delivering best-in-class office space commensurate with a more sustainable post-Covid world.
GERALD KAYEChief Executive
25 May 2021
SUSTAINABILITY During the year, we announced our new Sustainability Strategy, “Built for the Future”, which sets out our long-term vision and associated targets for our key areas: Our Environment, Our People and Our Communities. In April we launched “Designing for Net Zero”, a guide to aid our professional teams as they collaborate on development projects. This latter guide covers the entire development process from design to construction through to operation and occupation and will assist the Company in transitioning to a low carbon business.
As part of our commitment to sustainability reporting we measure our performance against industry-wide benchmarks, and I am pleased to be able to report significant progress against these measures during the year.
In July 2020, we achieved the UK’s first BREEAM 2018 New Construction “Outstanding” rating for the design stage of 33 Charterhouse Street, London EC1, a significant milestone for the Company. We have also improved our GRESB score from a 2* to a 3* Green rating, increasing our score from 63 to 76, and have improved our MSCI ESG rating from AA to AAA, the top rating. Further, we have been awarded a Silver rating under the EPRA Sustainability BPR, up from Bronze, and finally our CDP score has improved from C to B.
On a portfolio level, 99% by value of our completed portfolio has an EPC rating of A or B (the remaining one has a C rating) and each of our refurbished or redeveloped office buildings has a BREEAM rating of Excellent.
Overall, the Group has made good progress in responding to the climate change challenge and meeting its sustainability targets and, importantly, has a clear path to continue on this journey.
RESULTS FOR THE YEARThe profit before tax for the year to 31 March 2021 was £20.5m (2020: £43.0m) with a see-through Total Property Return of £48.6m (2020: £83.9m). See-through net rental income of £25.0m (2020: £28.5m) was earned during the year while developments generated a small see-through loss of £0.3m (2020: profit of £9.9m). The see-through net gain on sale and revaluation of the investment portfolio at £23.9m was lower than the prior year (2020: £45.5m) and was the key reason for the reduction in profit for the year.
Total see-through finance costs decreased to £14.9m (2020: £17.0m), offset by interest receivable of £0.1m (2020: £1.4m) to give net finance costs of £14.8m (2020: £15.6m). An increase in expected future interest rates led to a £2.9m credit (2020: charge of £7.7m) from the valuation of the Group’s derivative financial instruments. Recurring see-through administration costs were 13% lower at £9.7m (2020: £11.1m), with performance related awards also reduced by 18% to £4.3m (2020: £5.3m) and with National Insurance on these awards of £0.8m (2020: £0.9m). The Group did not utilise the Government’s Coronavirus Job Retention Scheme (Furlough).
A corporation tax charge of £0.9m has been recognised in the annual results. With an increase in the Group’s deferred tax provision of £1.7m, a total tax charge of £2.6m (2020: £4.3m) has been recognised.
The profit for the year, after recognition of this tax charge, was £17.9m (2020: £38.7m). There was an IFRS basic earnings per share of 14.8p (2020: 32.3p) and an EPRA loss per share of 1.8p (2020: earnings of 7.6p).
On a like-for-like basis, the investment portfolio increased in value by 3.4% (2.7% including purchases and gains on sales). The see-through total portfolio value reduced to £857.0m (31 March 2020: £949.3m), following the sale of four investment assets during the year.
Office buildings holding an EPC rating of A or B (by value)
99%
CHIEF EXECUTIVE’S STATEMENT CONTINUED
The Office Experience New ways of working
1THE OFFICE EXPERIENCEOffices will become springboards for creativity, innovation and collaboration. Through design, amenities and variety, they’ll enable experiences that help teams thrive.
2HEALTH AND WELLBEINGWe’ve spent the last year navigating immense uncertainty, coping with the loneliness of lockdown and worrying about our health. Wellbeing has to take centre stage.
3AGILE WORKINGThe future of work will be flexible – there’s no one-size-fits-all model for businesses or employees. Autonomy and variety will drive business performance.
4SUSTAINABILITYSustainability is, and will continue to be, a driving force for 2022. Offices will need to be adaptable and flexible, while also ensuring they are resilient to climate change. Our guide “Designing for Net Zero” will support us in achieving this.
The role of the office in enhancing creativity and collaboration has never been in greater focus.
The Office Experience Pages 8 and 9
4 Helical plc Annual Report and Accounts 2021 5Helical plcAnnual Report and Accounts 2021S
TR
AT
EG
IC R
EP
OR
T

The past year has seen an acceleration of several key themes within the commercial property sector and we believe that our strategy and high quality, recently refurbished or redeveloped portfolio are well placed to capitalise upon the significant growth opportunities that will arise as we move forward.
WHY LONDON?We continue to view the London commercial property market as the best source of capital profits and we believe that our experience and skills are best deployed in this sector. Economic activity in London has been significantly restricted over the past year but we are heartened by the fact that London has always demonstrated great resilience and agility in the face of adversity. As a global economic centre that attracts a diverse range of innovation and creativity led businesses, London should be able to recover quickly and strongly. With a highly skilled workforce located in close proximity to the city centre, and 47% of the population under 35 years old, London is particularly well placed to capture the potential of new growth sectors such as Fintech, Life Sciences and Artificial Intelligence.
THE LONDON MARKET The past year has seen a contrasting trend in the letting and investment markets.
The London commercial office letting market has been constrained as many occupiers adopted a "wait and see" approach to their decision making. CBRE has reported that for the year to 31 March 2021 the rolling 12 month take up is down 66% and this decline in activity has seen the central London vacancy rate rise from 4.5% to 8.9%. However, it is important to consider the underlying data when assessing these results as a clear bifurcation of buildings between the high quality space satisfying the latest needs of tenants and poorer quality space is already becoming evident.
The availability of second hand, predominantly tenant controlled, space is 111% above the average and represents 77% of the available space in the market, whilst newly supplied, available space is only 8% above average. Similarly, as demonstrated by our recent letting of Kaleidoscope, London EC1 to TikTok, prime rents have increased, with CBRE’s research highlighting the resilience of the Tech Belt market. We anticipate that best-in-class space will continue to achieve rental growth as the market becomes increasingly bifurcated with tenants competing to occupy a limited number of high quality buildings which offer their employees the optimal working environment.
As we have previously highlighted prior to the pandemic, the long-term future supply of space is constrained, and the pipeline is continuing to decrease as developers defer capital investment decisions. Knight Frank reports that 44% of the pipeline under construction is pre-let and that, even if demand for new and refurbished space were to decline to levels last seen in 2009, during the global financial crisis, the current stock under construction and due to complete this year (excluding pre-let space) would be unable to satisfy requirements. As businesses will increasingly seek to occupy new, best-in-class buildings, this supply shortage is likely to be exacerbated in the medium term.
The investment market has been more resilient throughout the last year, with London finishing 2020 strongly and ranked as the world’s number one city for cross border commercial office investment according to Knight Frank. With £50bn of global capital said to be targeting London commercial property, the trend in yield compression seen recently is expected to continue for best-in-class assets. Furthermore, the benefits of investment
The past year has seen significant challenges for the commercial property market as the pandemic has curtailed economic and social activity across the globe. However, as the vaccination programme progresses at pace, optimism and confidence are returning in the UK.
Our portfolio Highlights
Our portfolio of best-in-class office space continues to align to market trends and provide both rental income and capital growth.
MATTHEW BONNING-SNOOKProperty Director
OUR MARKET
into property have been highlighted by the volatility seen in global equity markets and the historically low fixed income returns available elsewhere. Investors are increasingly focusing on the covenant strength of the tenant base, and the multi-let nature of our buildings is aligned with these requirements.
KEY MARKET TRENDSGoing forward, it will be increasingly important to take advantage of the strong relationships we have built with our customers to understand their evolving business models and occupational requirements as they return to fully utilising their existing office space and look to grow. Occupiers are still considering their future occupational requirements, but initial feedback suggests a wider proliferation of agile working models by businesses. We will look to build upon our existing flexible, customer focused approach to ensure our buildings continue to attract and retain new tenants.
As customers pay particular attention to the wellbeing of their employees, quality design and amenities are increasingly important. We have always considered public realm and enhanced amenity provision to be a key offer of our buildings and we are benefiting from this trend. Sustainability and technologies are likely to become key differentiators for decision makers in the commercial property sector going forward. Sustainability sits at the heart of all Helical developments, guided by our “Built for the Future” strategy, and we continue to ensure all our assets maximise their performance throughout their whole life cycle, from initial development through to operational use. Similarly, exceptional digital connectivity is critical to all occupiers, with an increasing emphasis placed upon the integration of adaptable technology to ensure buildings are smart and capable of harnessing the extensive data that they generate. Our portfolio of tech-enabled, amenity rich, high quality assets is particularly well placed to capitalise upon these requirements.
LOOKING FORWARDThe change in occupier priorities when considering their office requirements is likely to result in an expedited obsolescence of older buildings. With our strategy of repositioning, refurbishing and redeveloping we can play a key role in the regeneration of these “brown” spaces, sustainably restoring them to the highest occupational and technological standards, and we have a strong track record of achieving this. We will continue to work with existing owners, or new investors seeking to deploy capital into the central London commercial office market and to do this in an equity efficient structure.
Our experience of the pandemic has reinforced our view that our investment in multi-let offices in well-located and accessible Grade A buildings, incorporating the latest in sustainable building design, offering state of the art technology with occupier health and wellbeing at their core, provides the most resilient defence against adversity and the best opportunity for continued growth.
“ As customers increasingly focus on the wellbeing of their employees, quality design and amenities are increasingly important.”
Property Portfolio Pages 36 to 43
Continued lettings Following lettings at Kaleidoscope and Trinity, portfolio vacancy has reduced from 17.2% in the year to 10.5% at 31 March 2021.
Rental growth We completed 12 lettings totalling 123,583 sq ft in the year, adding £8.8m to contracted rent, at a 5.4% premium to 31 March 2020 ERVs.
Long-term income 61.5% of contracted rent is secure for the next five years with only 10.6% subject to lease expiries or breaks in the next 12 months.
New portfolio 96% of the office units have either been recently developed or refurbished.
Rental collection 93% of rents collected during the year.
Capital growth 3.4% valuation increase, on a like for like basis, of our see-through investment portfolio.
6 Helical plc Annual Report and Accounts 2021 7Helical plcAnnual Report and Accounts 2021S
TR
AT
EG
IC R
EP
OR
T

UNDERGROUND
THE OFFICE EXPERIENCETHE OFFICE EXPERIENCE
Connectivity is key
The last year has highlighted how important social interaction, community, creativity, reliable infrastructure and sense of identity offered by offices are to growing businesses.
The role of the office in enhancing creativity and collaboration for organisations has never been in greater focus. Helical’s modern, high quality, amenity rich portfolio is well positioned to capitalise upon these evolving dynamics.
COMMUNITYOur multi-let, amenity rich buildings provide our occupiers the perfect opportunity to cultivate a sense of community. We have actively sought to foster this throughout our portfolio via a series of landlord-run social and networking events. We have also sought to utilise technology to enhance the sense of community, with the roll out of building specific apps providing a platform to enable meaningful interaction. Through significant investment in public realm we also encourage the wider local communities to use and benefit from the enhanced areas we have created.
HEALTH AND WELLBEINGEmployee wellbeing is a key area of focus for occupiers, particularly as employees return to the office after an extended period of remote working. Our carefully curated, design-led space provides an enriching working environment for employees, supporting their physical and mental wellbeing. Our developments aim to provide the healthiest possible environment, with air flow rates at our new 33 Charterhouse Street development significantly exceeding BCO requirements. Similarly, through the integration of new technology into our buildings we are able to offer occupiers the ability to harness the significant data available to provide a perfectly calibrated, personalised working environment to their employees.
CONNECTIVITYPhysical and digital connectivity are essential requirements for occupiers in the modern workplace. Our well-located offices are all within a short distance of key transport hubs and are located in dynamic, desirable areas amongst a growing network of high-performing businesses. Similarly, all our offices provide exceptional, modern digital infrastructure, as demonstrated by Kaleidoscope’s recent WiredScore Platinum accreditation.
AMENITIESHelical buildings seek to provide best-in-class tenant amenities, offering generous cycle storage and spa quality changing facilities. We seek to provide thoughtfully-designed outdoor space and extensive public realm in all of our developments so that tenants are afforded the opportunity to expand their workplace.
SUSTAINABILITYSustainability sits at the core of all Helical developments, guided by our “Built for the Future” strategy. We continue to place utmost importance on ensuring all our assets maximise their sustainable credentials throughout their whole life cycle, from initial development through to operational use. All our existing central London office developments are certified as BREEAM “Excellent” and we continue to push for greater impact with our 33 Charterhouse Street development achieving the UK’s first BREEAM 2018 New Construction “Outstanding” rating for the design stage.
AGILE WORKINGAs they adapt to rapidly evolving working practices, occupiers are increasingly seeking agility within the space they occupy. Flexibility is at the heart of Helical’s offering to its tenants, demonstrated by our willingness to offer them bespoke lease terms to meet their individual needs. Our “Plug and Play” space has been designed to allow tenants to move quickly and easily. By building strong relationships with all our tenants we can provide them with space that supports their needs, enables collaboration and has the flexibility to adapt to future changes.
The office experience
DESIGNQuality design is essential to maximise the efficient use of space and to enable businesses to collaborate. The office will continue to act as a key centre for business, enabling information and knowledge to be shared and culture to be established. Every Helical building puts quality design at its heart, providing exceptional spaces for businesses to flourish.
8 Helical plc Annual Report and Accounts 2021 9Helical plcAnnual Report and Accounts 2021S
TR
AT
EG
IC R
EP
OR
T

To demonstrate the 6 Reasons to Invest in action, we include the following three case studies: the successful development and letting of Kaleidoscope; the sustainable design of 33 Charterhouse Street; and the return of equity from the sale of three Manchester assets.
We create buildings for today’s occupiers who demand more inspiring and flexible space, market leading amenities, high quality management and with sustainability and wellness at their core. Applying this philosophy we seek to maximise Shareholder returns through delivering income growth from creative asset management and capital gains from our development activity.
Maximising Shareholder returns by delivering income growth from creative asset management and capital gains from our development activity.
11Helical plcAnnual Report and Accounts 2021S
TR
AT
EG
IC R
EP
OR
T10 Helical plc Annual Report and Accounts 2021
INVESTMENT CASE
Reasons to invest

Actingopportu nity01/Strong track recordEach of the Executive Directors has over 25 years of experience at Helical and, supported by a dynamic and collaborative team, have developed award-winning buildings that appeal to the most demanding of occupiers.
02/ Market knowledge and relationshipsWith 35 years’ experience as a property company, through multiple property cycles, Helical has developed a comprehensive knowledge of the market and built an extensive network from which it can source new development opportunities and access to capital.
on
12 Helical plc Annual Report and Accounts 2021 13Helical plcS
TR
AT
EG
IC R
EP
OR
T
INVESTMENT CASE
Annual Report and Accounts 2021
Focusing our portfolio on the Capital
Acting on opportunity/
INVESTMENT CASE – IN ACTION
ACQUISITIONThe site was initially acquired by Crossrail via a Compulsory Purchase Order to facilitate the development of the Elizabeth Line, and planning permission was obtained to deliver a new office building above the station once complete. The former owners of the land had the right to reacquire the land at its market value and formed a consortium to take advantage of this opportunity. However, given the complexity and expertise required to develop the site, the consortium sought to dispose of the interest they held, which had the benefit of the opportunity.
Given Helical’s extensive experience in the locality, including the adjacent developments at Barts Square and 25 Charterhouse Square, we were approached with the opportunity to acquire the site in an off-market transaction. Helical recognised the transformative impact Crossrail would have in creating unparalleled connectivity in the area, and the impact that the City of London’s “Culture Mile” initiative would have in further developing the area into an arts and cultural hub. As such, in March 2018, Helical acquired the company formed by the consortium and was granted a 150 year lease over the site, entering into a development agreement with TfL/Crossrail to develop the property. Due to the complex nature of the development, TfL/Crossrail required Helical to demonstrate its significant experience and expertise before granting the development rights.
In order to maximise the return on equity, Helical obtained a £50.4m development facility from Wells Fargo in August 2018 to fund the development costs.
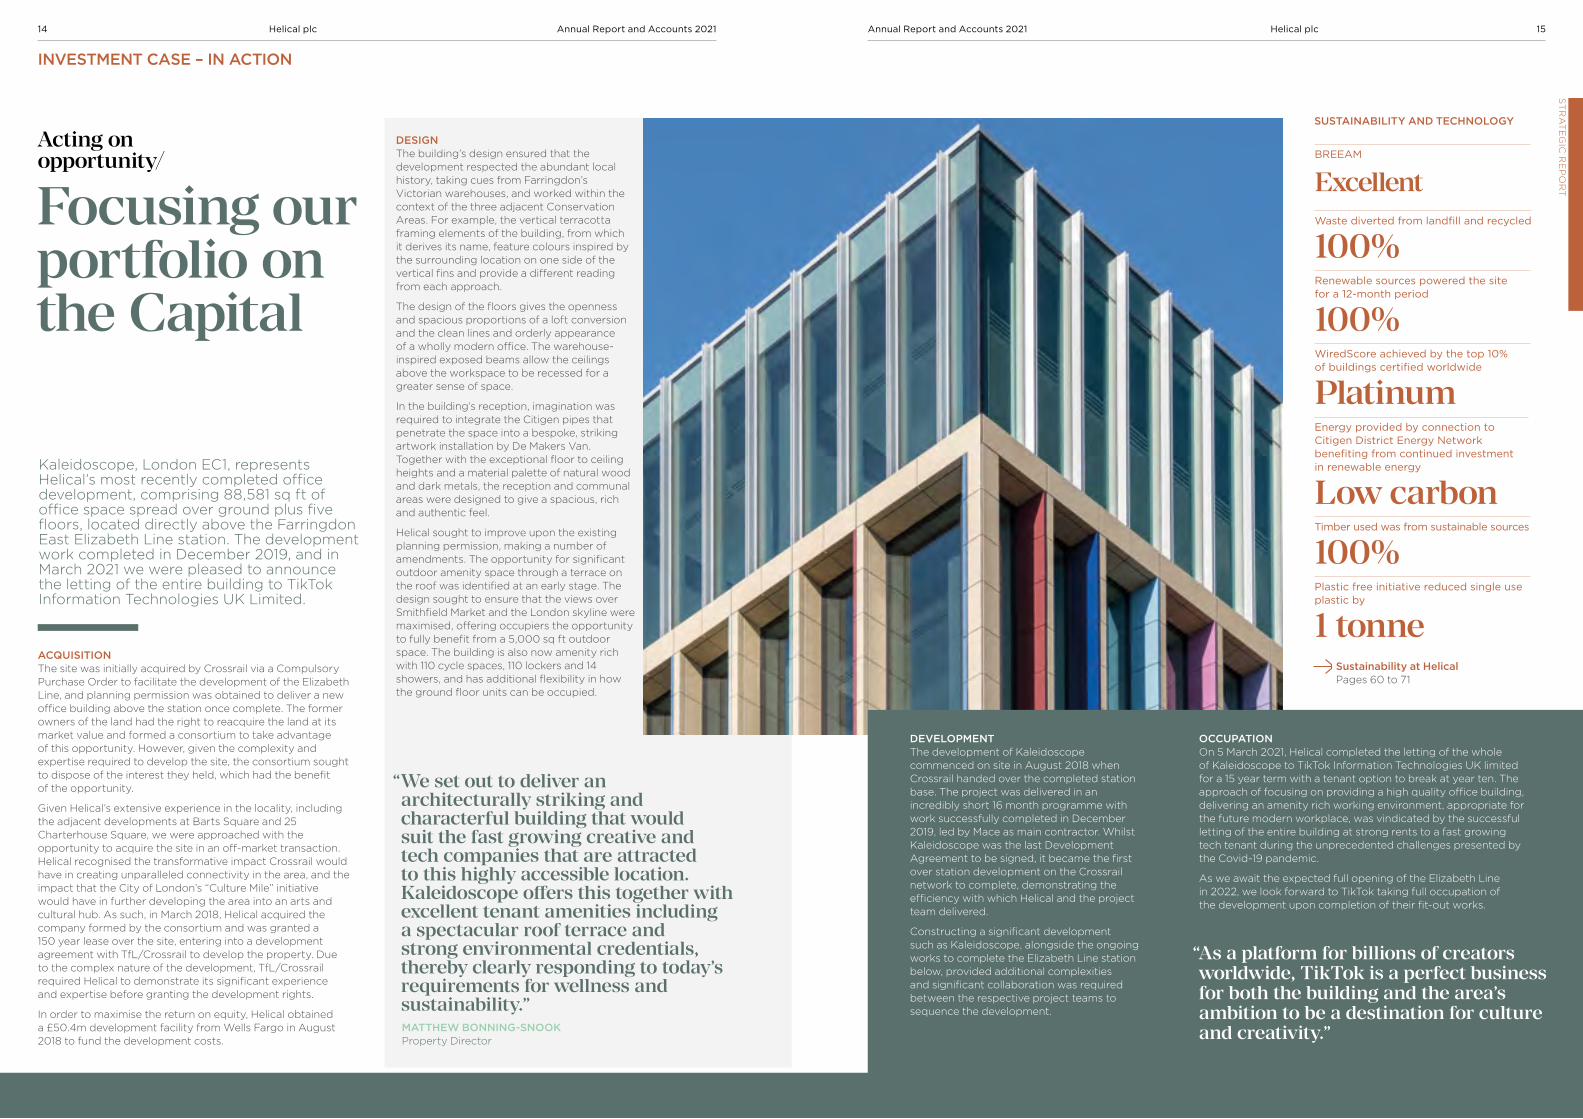
DESIGN The building’s design ensured that the development respected the abundant local history, taking cues from Farringdon’s Victorian warehouses, and worked within the context of the three adjacent Conservation Areas. For example, the vertical terracotta framing elements of the building, from which it derives its name, feature colours inspired by the surrounding location on one side of the vertical fins and provide a different reading from each approach.
The design of the floors gives the openness and spacious proportions of a loft conversion and the clean lines and orderly appearance of a wholly modern office. The warehouse-inspired exposed beams allow the ceilings above the workspace to be recessed for a greater sense of space.
In the building’s reception, imagination was required to integrate the Citigen pipes that penetrate the space into a bespoke, striking artwork installation by De Makers Van. Together with the exceptional floor to ceiling heights and a material palette of natural wood and dark metals, the reception and communal areas were designed to give a spacious, rich and authentic feel.
Helical sought to improve upon the existing planning permission, making a number of amendments. The opportunity for significant outdoor amenity space through a terrace on the roof was identified at an early stage. The design sought to ensure that the views over Smithfield Market and the London skyline were maximised, offering occupiers the opportunity to fully benefit from a 5,000 sq ft outdoor space. The building is also now amenity rich with 110 cycle spaces, 110 lockers and 14 showers, and has additional flexibility in how the ground floor units can be occupied.
DEVELOPMENTThe development of Kaleidoscope commenced on site in August 2018 when Crossrail handed over the completed station base. The project was delivered in an incredibly short 16 month programme with work successfully completed in December 2019, led by Mace as main contractor. Whilst Kaleidoscope was the last Development Agreement to be signed, it became the first over station development on the Crossrail network to complete, demonstrating the efficiency with which Helical and the project team delivered.
Constructing a significant development such as Kaleidoscope, alongside the ongoing works to complete the Elizabeth Line station below, provided additional complexities and significant collaboration was required between the respective project teams to sequence the development.
Kaleidoscope, London EC1, represents Helical’s most recently completed office development, comprising 88,581 sq ft of office space spread over ground plus five floors, located directly above the Farringdon East Elizabeth Line station. The development work completed in December 2019, and in March 2021 we were pleased to announce the letting of the entire building to TikTok Information Technologies UK Limited.
“ As a platform for billions of creators worldwide, TikTok is a perfect business for both the building and the area’s ambition to be a destination for culture and creativity.”
“ We set out to deliver an architecturally striking and characterful building that would suit the fast growing creative and tech companies that are attracted to this highly accessible location. Kaleidoscope offers this together with excellent tenant amenities including a spectacular roof terrace and strong environmental credentials, thereby clearly responding to today’s requirements for wellness and sustainability.”MATTHEW BONNING-SNOOKProperty Director
BREEAM
Excellent
Energy provided by connection to Citigen District Energy Network benefiting from continued investment in renewable energy
Low carbon
Waste diverted from landfill and recycled
100%Renewable sources powered the site for a 12-month period
100%WiredScore achieved by the top 10% of buildings certified worldwide
Platinum
Timber used was from sustainable sources
100%Plastic free initiative reduced single use plastic by
1 tonne
SUSTAINABILITY AND TECHNOLOGY
Sustainability at Helical Pages 60 to 71
OCCUPATIONOn 5 March 2021, Helical completed the letting of the whole of Kaleidoscope to TikTok Information Technologies UK limited for a 15 year term with a tenant option to break at year ten. The approach of focusing on providing a high quality office building, delivering an amenity rich working environment, appropriate for the future modern workplace, was vindicated by the successful letting of the entire building at strong rents to a fast growing tech tenant during the unprecedented challenges presented by the Covid-19 pandemic.
As we await the expected full opening of the Elizabeth Line in 2022, we look forward to TikTok taking full occupation of the development upon completion of their fit-out works.
14 Helical plc Annual Report and Accounts 2021 15Helical plcAnnual Report and Accounts 2021S
TR
AT
EG
IC R
EP
OR
T

A customer focused approachHelical develops buildings which appeal to occupiers looking for design-led, sustainable and amenity rich workplaces, and that support talent attraction and retention. Whether the properties are built from the ground up, or are rejuvenated existing assets, they aim to be the best-in-class, respecting the culture of the area. Once complete and let, Helical applies the same philosophy of excellence to its ongoing asset management, ensuring the occupiers receive the best service.
03/
Hu focuseddesign
04/Sustainable business modelSustainability is at the core of all activities at Helical. We recognise the impact the buildings we develop have on the environment and are focused on reducing our carbon footprint throughout the property’s life cycle.
man
16 Helical plc Annual Report and Accounts 2021 17Helical plcAnnual Report and Accounts 2021S
TR
AT
EG
IC R
EP
OR
T
INVESTMENT CASE

BREEAM 2018 New Construction
Outstanding
43% reduction in operational carbon
500m2 of recycled raised access flooring
20% reduction in embodied carbon
Earth friendly concrete
Dynamic water management and recycling system which will capture and filter both grey and rainwater to be used in the building
144 327W PV Panels
2 bee colonies
750m2 green roof
The site is situated on the corner of Charterhouse Street and Farringdon Road, just 100m from Farringdon Station and immediately opposite the future Museum of London site at Smithfield Market. Since acquisition, planning consent has been obtained to enhance the ground floor configuration and to add an additional floor of 13,380 sq ft within the envelope of the existing design, such that the property will now provide 205,369 sq ft of office accommodation over ground plus ten floors.
The sustainability credentials of 33 Charterhouse Street were endorsed with the development achieving the UK's first BREEAM 2018 New Construction “Outstanding” rating for the design stage. The building achieved an overall score of 89%.
A BETTER PLACE TO BE 33 Charterhouse Street will be a cornerstone building of what will be a significantly transformed area of London. Standing alongside the new Museum of London, the Smithfield Market area is set to be a new entertainment and cultural hub. For our future occupiers, we want their experience inside our building to match these surroundings and have been conscious to incorporate health and wellbeing into the design and amenities of the property.
A key priority of our Sustainability Strategy is to:
“ Design and operate our buildings to support health and wellbeing.”
In meeting this priority, we have incorporated the following into the design and operation of 33 Charterhouse Street:
THE CARBON CHALLENGEAs a developer of new buildings, we recognise that there is a significant whole-life carbon impact in realising these projects. In response to this, we set the following targets in June 2020:
• All new developments to be net zero carbon in operation by 2025;
• Reduce the embodied carbon in all new developments by 20% against the current RIBA benchmark; and
• Reduce the operational carbon emissions of the existing portfolio by 25% by 2025.
As our largest development, 33 Charterhouse Street presented us with the opportunity to challenge carbon from the initial design through to operation, interrogating where the greatest carbon savings could be made and how to incorporate these into our design choices and construction methods.
At an operational level, 33 Charterhouse Square is targeting a 43.3% emissions reduction compared to Part L of the Building Regulations (2013). This significant saving has been made possible through the connection to Citigen, a district energy network.
Connection not only eliminates the requirement of in-building plant creating extra space, but also allows the building to benefit from Citigen’s own continual investment into low carbon energy technologies.
The building is also on track to meet an embodied carbon figure of less than 880 kg co2e/m2, exceeding our target of being 20% lower than the current RIBA benchmark. This has been achieved by incorporating the following measures:
• Use of aluminium with a high recycled content;
• Use of earth friendly concrete which offers a 50% embodied carbon saving;
• Employing structural steel with a high recycled content;
• Use of 500m2 of recycled raised access flooring; and
• Sourcing brick and stone locally.
In May 2019, Helical acquired the long leasehold interest in 33 Charterhouse Street, a major development site located in Farringdon, in a 50:50 joint venture with AshbyCapital.
Sustainability has been at the heart of this development from the start of the project andthis has presented us with a number of challenges and opportunities. Through the adoption of market leading technologies and design and operational practices, 33 Charterhouse Street embodies the aspirations Helical has set itself as part of its Sustainability Strategy.
Pioneering sustainable developments
Human focused design/
INVESTMENT CASE
18 Helical plc Annual Report and Accounts 2021 19Helical plcAnnual Report and Accounts 2021S
TR
AT
EG
IC R
EP
OR
T
750m2Green roof seeded with indigenous flower species as well as wild flowers
2 Bee colonies further preserving local ecology
4 Air Enhanced air quality with the use of a number of air quality sensors per floor
Zones Floor zoning, allowing tenants to run localised cooling, heating and lighting
WELL WELL enabled allowing tenants to achieve a Platinum WELL rating in their fit out
426 Bike storage spaces and 2 bike repair stations along with 672 lockers and 30 showers

BUILDING FOR THE FUTUREAs we look forward to practical completion in September 2022, we are committed to delivering a building which will be operationally sustainable, enhances the biodiversity of the local area and is designed to put health and wellbeing at the forefront. As we continue through the development programme, we believe there are still opportunities to be realised to create further efficiencies, adding to the sustainability credentials of the building. With a continued focus on achieving a BREEAM “Outstanding” rating at completion, we believe this building is truly “Built for the Future”.
SUPPORTING LOCAL COMMUNITIESAs our largest ongoing development project, spanning a three-year programme, it was important to acknowledge the potential impact the development could have on local communities. In line with our strategy, we look to:
“ Bring social, economic and environmental benefits to the areas in which we operate.”
33 Charterhouse Street presented an excellent opportunity to engage and communicate with communities to bring both social value and benefits to those who live and work in the area.
In partnership with the main contractor, Mace, the following community initiatives have been implemented on site:
• Installation of a “green wall” which runs the length of the project, creating better air quality from air purifying plants;
• Undertook significant works at Prior Western Primary School, enhancing their playground and creating £10,000 of social value;
• Employment of a St Mungo’s service user as a Crane Slinger via Keltbray;
• Participation in the Considerate Construction Scheme; and
• A monthly newsletter providing a site update, issued to suppliers, contractors and local residents.
Construction on 33 Charterhouse Street commenced in early 2020 with completion on track for September 2022.
INVESTMENT CASE
SUSTAINABILITY AWARDBy achieving BREEAM rating “Outstanding”, the building’s design has demonstrated it will:
• Use “smart” building technology to integrate the building’s performance and occupier engagement through a specific app;
• Deliver a site-specific ecology plan;
• Use market leading water management systems; and
• Eliminate the use of fossil fuels, including refrigerants, on site.
33 Charterhouse Street/EC1
Project progress
20 Helical plc Annual Report and Accounts 2021 21Helical plcAnnual Report and Accounts 2021S
TR
AT
EG
IC R
EP
OR
T

INVESTMENT CASE
05/
06/Robust financial positionThe Group uses gearing on a tactical basis, increasing it to accentuate returns in a rising market, or reducing debt to prepare for more challenging times whilst retaining firepower to take advantage of opportunities that arise.
Focused portfolioThe Group has built a high quality portfolio, focused in London’s tech belt, comprised of properties which have excellent transport links and are culturally rich. The buildings are occupied by a diverse range of tenants, but with a clear focus on the fast-growing creative sectors.
Strengththrough
experi ence
22 Helical plc Annual Report and Accounts 2021 23Helical plcAnnual Report and Accounts 2021S
TR
AT
EG
IC R
EP
OR
T
2021
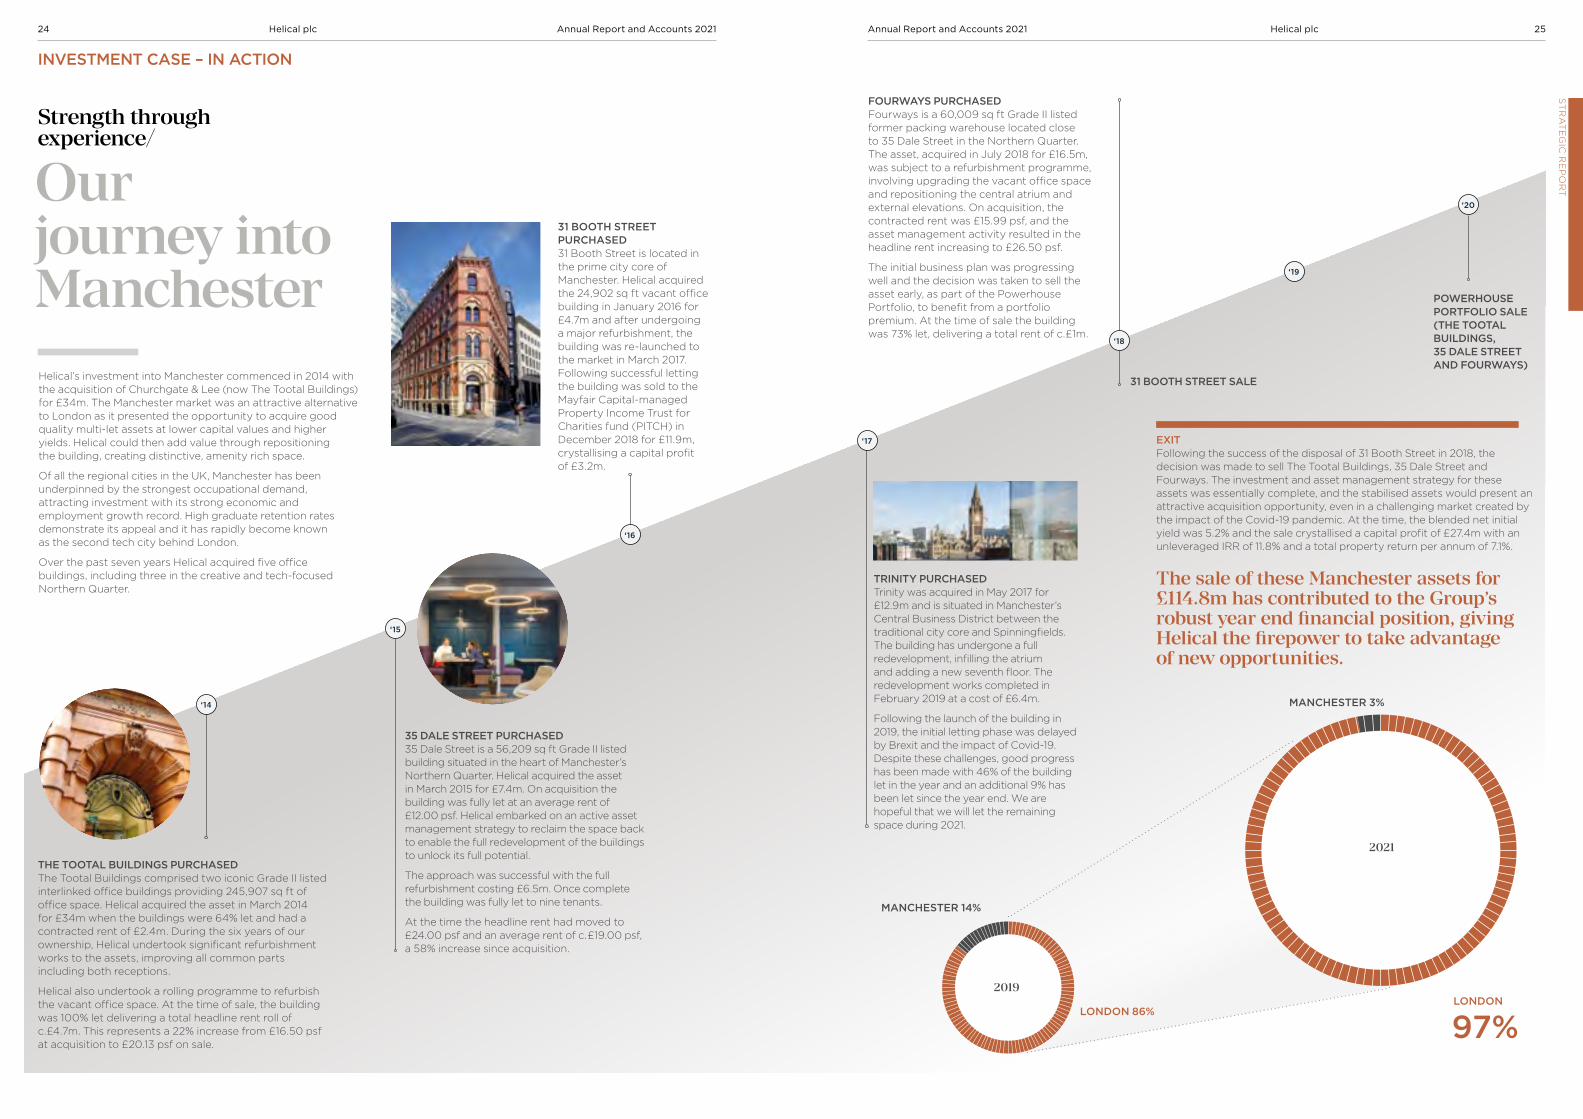
TRINITY PURCHASEDTrinity was acquired in May 2017 for £12.9m and is situated in Manchester’s Central Business District between the traditional city core and Spinningfields. The building has undergone a full redevelopment, infilling the atrium and adding a new seventh floor. The redevelopment works completed in February 2019 at a cost of £6.4m.
Following the launch of the building in 2019, the initial letting phase was delayed by Brexit and the impact of Covid-19. Despite these challenges, good progress has been made with 46% of the building let in the year and an additional 9% has been let since the year end. We are hopeful that we will let the remaining space during 2021.
‘19
Helical’s investment into Manchester commenced in 2014 with the acquisition of Churchgate & Lee (now The Tootal Buildings) for £34m. The Manchester market was an attractive alternative to London as it presented the opportunity to acquire good quality multi-let assets at lower capital values and higher yields. Helical could then add value through repositioning the building, creating distinctive, amenity rich space.
Of all the regional cities in the UK, Manchester has been underpinned by the strongest occupational demand, attracting investment with its strong economic and employment growth record. High graduate retention rates demonstrate its appeal and it has rapidly become known as the second tech city behind London.
Over the past seven years Helical acquired five office buildings, including three in the creative and tech-focused Northern Quarter.
THE TOOTAL BUILDINGS PURCHASEDThe Tootal Buildings comprised two iconic Grade II listed interlinked office buildings providing 245,907 sq ft of office space. Helical acquired the asset in March 2014 for £34m when the buildings were 64% let and had a contracted rent of £2.4m. During the six years of our ownership, Helical undertook significant refurbishment works to the assets, improving all common parts including both receptions.
Helical also undertook a rolling programme to refurbish the vacant office space. At the time of sale, the building was 100% let delivering a total headline rent roll of c.£4.7m. This represents a 22% increase from £16.50 psf at acquisition to £20.13 psf on sale.
EXIT Following the success of the disposal of 31 Booth Street in 2018, the decision was made to sell The Tootal Buildings, 35 Dale Street and Fourways. The investment and asset management strategy for these assets was essentially complete, and the stabilised assets would present an attractive acquisition opportunity, even in a challenging market created by the impact of the Covid-19 pandemic. At the time, the blended net initial yield was 5.2% and the sale crystallised a capital profit of £27.4m with an unleveraged IRR of 11.8% and a total property return per annum of 7.1%.
FOURWAYS PURCHASEDFourways is a 60,009 sq ft Grade II listed former packing warehouse located close to 35 Dale Street in the Northern Quarter. The asset, acquired in July 2018 for £16.5m, was subject to a refurbishment programme, involving upgrading the vacant office space and repositioning the central atrium and external elevations. On acquisition, the contracted rent was £15.99 psf, and the asset management activity resulted in the headline rent increasing to £26.50 psf.
The initial business plan was progressing well and the decision was taken to sell the asset early, as part of the Powerhouse Portfolio, to benefit from a portfolio premium. At the time of sale the building was 73% let, delivering a total rent of c.£1m.
35 DALE STREET PURCHASED35 Dale Street is a 56,209 sq ft Grade II listed building situated in the heart of Manchester’s Northern Quarter. Helical acquired the asset in March 2015 for £7.4m. On acquisition the building was fully let at an average rent of £12.00 psf. Helical embarked on an active asset management strategy to reclaim the space back to enable the full redevelopment of the buildings to unlock its full potential.
The approach was successful with the full refurbishment costing £6.5m. Once complete the building was fully let to nine tenants.
At the time the headline rent had moved to £24.00 psf and an average rent of c. £19.00 psf, a 58% increase since acquisition.
Our journey into Manchester
Strength through experience/
31 BOOTH STREET PURCHASED31 Booth Street is located in the prime city core of Manchester. Helical acquired the 24,902 sq ft vacant office building in January 2016 for £4.7m and after undergoing a major refurbishment, the building was re-launched to the market in March 2017. Following successful letting the building was sold to the Mayfair Capital-managed Property Income Trust for Charities fund (PITCH) in December 2018 for £11.9m, crystallising a capital profit of £3.2m.
The sale of these Manchester assets for £114.8m has contributed to the Group’s robust year end financial position, giving Helical the firepower to take advantage of new opportunities.
‘14
‘15
‘16
‘17
POWERHOUSE PORTFOLIO SALE (THE TOOTAL BUILDINGS, 35 DALE STREET AND FOURWAYS)
31 BOOTH STREET SALE
‘18
MANCHESTER 3%
MANCHESTER 14%
LONDON 86%LONDON
97%
‘20
2019
INVESTMENT CASE – IN ACTION
24 Helical plc Annual Report and Accounts 2021 25Helical plcAnnual Report and Accounts 2021S
TR
AT
EG
IC R
EP
OR
T

Growth
Our strategyWe are confident that the successful delivery of our strategy in recent years means we are well positioned, with our Grade A buildings offering an appealing environment for businesses seeking high quality space.
STRATEGY
Property
Maximise Shareholder return by increasing the net asset value of the Group through capital gains and growing our rental income stream to cover dividends.
Strategic priorities
Deliver long-term sustainable growth.
Clear focus on Total Shareholder Return, delivering capital growth and income.
Purpose and Values embedded effectively in the operational policies and practices of the Group.
Incentivise management to outperform the Group’s competitors by setting challenging levels of performance targets, against which rewards are measured.
Key Performance IndicatorsTOTAL SHAREHOLDER RETURN (1 YEAR) 21.2%TOTAL ACCOUNTING RETURN 3.3%EPRA NTA 533p
Other Performance MeasuresEPRA LOSS PER SHARE 1.8p
Principal associated risks• Poor management of stakeholder
relations
• Political risk
• The Group’s strategy is inconsistent with the market
• Non-compliance with prevailing legislation, regulation and best practice
• Risk of pandemic outbreak
Key Performance IndicatorsPORTFOLIO RETURN – MSCI (1 YEAR) 7.0% PORTFOLIO RETURN – MSCI (3 YEAR) 8.9%
Other Performance MeasuresERV £52.1m CONTRACTED RENTAL INCOME £37.8m VACANCY RATE 10.5%WAULT 6.9yrsTOTAL PROPERTY RETURN £48.6m
Principal associated risks• Property values decline/reduced
tenant demand for space
• The Group carries out significant development projects
• Health and safety risk
• Business disruption and cyber security
Manage a balanced portfolio with a clear market focus, combining assets with significant development and asset management potential with a strong rental income stream.
Strategic priorities
A focus on London, delivering income growth from asset management and capital gains from development activity.
Locate sites where complexity presents opportunity to add significant value through innovative development and asset management.
Maximise income through attracting a diverse and financially robust portfolio of tenants.
Continue a culture that is committed to the highest standards in health and safety.
Improve the communities in which we are active and ensure sustainability underpins our approach.
Our strategic pillars: 1. Growth 2. Property 3. Sustainability 4. People 5. Financing
26 Helical plc Annual Report and Accounts 2021 27Helical plcAnnual Report and Accounts 2021S
TR
AT
EG
IC R
EP
OR
T

Ensure that sustainability is at the heart of our business decisions creating a portfolio which is futureproofed for all our stakeholders.
Sustainability
People
STRATEGY CONTINUED
Operate a sustainable capital structure in which the core business costs are covered by income from the investment portfolio.
Use gearing on a tactical basis throughout the cycle to accentuate returns.
Attract and retain the best people encouraging their development and progression to ensure future succession is secured.
Maintain our excellent reputation and network of property sector contacts, trusted partners and advisors.
Financing
Strategic priorities
Transition to a low carbon business.
Buy, use and re-use resources efficiently.
Bring social, economic and environmental benefits to the areas in which we operate.
Design and operate our buildings to support health and wellbeing.
Key Performance IndicatorsBREEAM rating (Excellent or above)
6 out of 9OFFICE BUILDINGS
Other Performance MeasuresEPC ratings (B or higher, by value) 99%Energy acquired from renewable sources 100%
Principal associated risk• Sustainability risk
Strategic priorities
Maintain an appropriate risk-adjusted LTV.
Use of “equity lite” structures to maximise returns.
Strong banking relationships for quick access to finance at competitive pricing.
Build cash reserves to cope with market fluctuations and take advantage of opportunities as they arise.
Other Performance MeasuresSEE-THROUGH LOAN TO VALUE 22.6%SEE-THROUGH NET GEARING 31.9%AVERAGE COST OF DEBT 3.5%AVERAGE MATURITY – SECURED DEBT 3.2yrsCASH AND UNDRAWN BANK FACILITIES
£423m
Principal associated risks• Availability and cost of bank borrowing
and cash resources
• Breach of loan covenants
Strategic priorities
Small and empowered core team supported by valued advisors to allow scalability.
Clear plan for succession.
Strong relationships and a reputation which generates off-market opportunities.
A trusted team of external consultants to enable us to deliver quickly and to a very high standard.
Work with joint venture partners to increase project scale and to manage risk.
Key Performance IndicatorsAVERAGE EMPLOYEE SERVICE 11.0yrsAVERAGE STAFF TURNOVER 3.6%
Other Performance MeasuresTRAINING AND DEVELOPMENT 950hrs
Principal associated risks• Employment and retention of key
personnel and business relationships
• Reliance on external partners
28 Helical plc Annual Report and Accounts 2021 29Helical plcAnnual Report and Accounts 2021S
TR
AT
EG
IC R
EP
OR
T
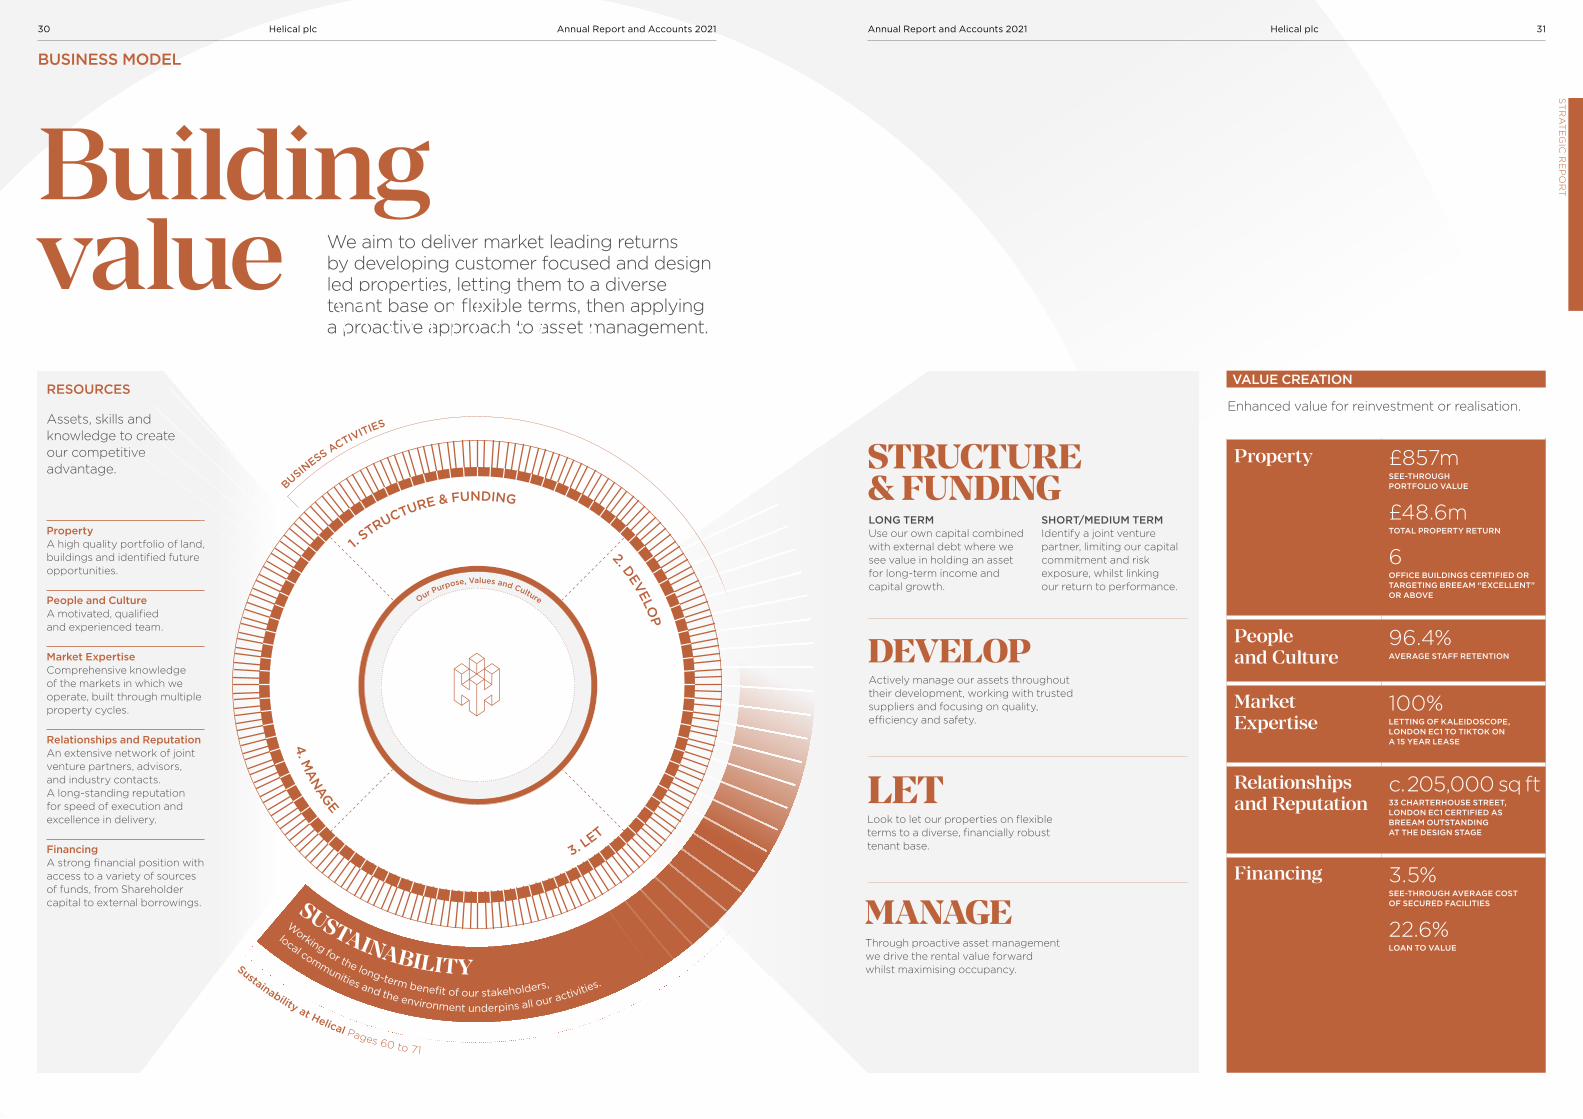
We aim to deliver market leading returns by developing customer focused and design led properties, letting them to a diverse tenant base on flexible terms, then applying a proactive approach to asset management.
PropertyA high quality portfolio of land, buildings and identified future opportunities.
People and CultureA motivated, qualified and experienced team.
Market ExpertiseComprehensive knowledge of the markets in which we operate, built through multiple property cycles.
Relationships and ReputationAn extensive network of joint venture partners, advisors, and industry contacts. A long-standing reputation for speed of execution and excellence in delivery.
FinancingA strong financial position with access to a variety of sources of funds, from Shareholder capital to external borrowings.
Assets, skills and knowledge to create our competitive advantage.
Building value
Enhanced value for reinvestment or realisation.
VALUE CREATION
Property £857mSEE-THROUGH PORTFOLIO VALUE
£48.6mTOTAL PROPERTY RETURN
6OFFICE BUILDINGS CERTIFIED OR TARGETING BREEAM “EXCELLENT” OR ABOVE
People and Culture
96.4%AVERAGE STAFF RETENTION
Market Expertise
100%LETTING OF KALEIDOSCOPE, LONDON EC1 TO TIKTOK ON A 15 YEAR LEASE
Relationships and Reputation
c. 205,000 sq ft33 CHARTERHOUSE STREET, LONDON EC1 CERTIFIED AS BREEAM OUTSTANDING AT THE DESIGN STAGE
Financing 3.5%SEE-THROUGH AVERAGE COST OF SECURED FACILITIES
22.6%LOAN TO VALUE
LONG TERM Use our own capital combined with external debt where we see value in holding an asset for long-term income and capital growth.
SHORT/MEDIUM TERMIdentify a joint venture partner, limiting our capital commitment and risk exposure, whilst linking our return to performance.
Actively manage our assets throughout their development, working with trusted suppliers and focusing on quality, efficiency and safety.
Look to let our properties on flexible terms to a diverse, financially robust tenant base.
Through proactive asset management we drive the rental value forward whilst maximising occupancy.
RESOURCES
SUSTAINABILITY
1. STRUCTURE & FUNDING
2. DEVELOP
4. M
AN
AGE
3. LET
BUSINESS ACTIVITIES
Sustainability at Helical Pages 60 to 71
Working for the long-term benefi t of our stakeholders,
local communities and the environment underpins all our activities.
BUSINESS MODEL
Our Purpose, Values and Culture
30 Helical plc Annual Report and Accounts 2021 31Helical plcAnnual Report and Accounts 2021S
TR
AT
EG
IC R
EP
OR
T

EPRA NET TANGIBLE ASSET VALUE PER SHARE pence
20212020201920182017
533524494
468*473*
*Calculated using EPRA net assets
7.0%-1.7%
I YEAR % pa
8.9%2.5%
3 YEARS % pa
9.4%3.4%
5 YEARS % pa
12.5%9.5%
10 YEARS % pa
11.8%8.0%
20 YEARS % pa
HELICAL’S UNLEVERAGED PORTFOLIO RETURNS TO 31 MARCH 2021
Helical plc MSCI Central London O�ces Total Return Index
Source: MSCI
KEY PERFORMANCE INDICATORS
Measuring our performanceWe measure our performance using several financial and non-financial Key Performance Indicators (“KPIs”).
We incentivise management to outperform the Group’s peers by setting challenging targets and using these performance indicators to measure success. We design our remuneration packages to align management’s interests with Shareholders’ aspirations.
EPRA NET TANGIBLE ASSET VALUE PER SHARE
DESCRIPTIONThe Group’s main financial objective is to maximise growth in net asset value per share, which we seek to achieve through increases in investment portfolio values and from retained earnings from other property related activity. EPRA net tangible asset value per share is the property industry’s preferred measure of the proportion of net assets attributable to each share as it includes the fair value of net assets on an ongoing long-term basis. The adjustments to net asset value to arrive at this figure are shown in Note 33 to the financial statements.
PERFORMANCEThe Group is targeted with increasing its net assets, of which EPRA net tangible asset growth is a key component.
The EPRA net tangible asset value per share at 31 March 2021 increased by 1.7% to 533p (31 March 2020: 524p).
LINK TO REMUNERATIONPERFORMANCE SHARE PLAN 2014A third of the maximum Performance Share Plan (“PSP”) award is based on the compound growth in net asset value (“NAV”) over three years.
533pEPRA NTA
MSCI PROPERTY INDEX
DESCRIPTIONMSCI produces several independent benchmarks of property returns that are regarded as the main industry indices.
PERFORMANCEMSCI has compared the ungeared performance of Helical’s total property portfolio against that of portfolios within MSCI for over 20 years. The Group targets outperforming the MSCI Central London Office Total Return Index by 3.25%. Helical’s ungeared performance for the year to 31 March 2021 was 7.0% (2020: 9.6%). This compares to the MSCI Central London Offices Total Return Index of -1.7% (2020: 4.5%) and the upper quartile return of 1.6% (2020: 6.2%).
Helical’s share of the development portfolio (2% of gross property assets) is included in its performance, as measured by MSCI, at the lower of book cost or fair value and uplifts are only included on the sale of an asset.
LINK TO REMUNERATIONANNUAL BONUS SCHEME 2018Half of the Annual Bonus Scheme 2018 performance criteria is based on the Group’s performance compared to the MSCI Central London Offices Total Return Index, with target performance being to match the index and outperformance exceeding it by 3.25%.
PERFORMANCE SHARE PLAN 2014A third of the maximum PSP award is based on the Group’s performance as compared with the performance of the MSCI Central London Offices Total Return Index over three years.
7.0%
32 Helical plc Annual Report and Accounts 2021 33Helical plcAnnual Report and Accounts 2021S
TR
AT
EG
IC R
EP
OR
T

TOTAL ACCOUNTING RETURN %
20212020201920182017
3.3%7.7%8.4%5.3%8.3%
21.2%26.7%18.4%
I YEAR % pa
11.5%3.2%0.3%
3 YEARS % pa
3.8%6.3%1.6%
5 YEARS % pa
6.9%6.0%6.5%
10 YEARS % pa
2.4%5.2%0.5%
15 YEARS % pa
7.9%5.3%4.8%
20 YEARS % pa
HELICAL’S TOTAL RETURNSTO 31 MARCH 2021
● Helical plc1 ● Listed real estate sector index3
● UK equity market2
Source: Datastream (Thomson Reuters).
AVERAGE LENGTH OF SERVICE AT 31 MARCH years
20212020201920182017
11.010.08.77.98.0
STAFF TURNOVER DURING THE YEAR TO 31 MARCH%
20212020201920182017
3.6%10.3%6.9%15.2%5.7%
KEY PERFORMANCE INDICATORS CONTINUED
TOTAL SHAREHOLDER RETURN
DESCRIPTIONTotal Shareholder Return is a measure of the return on investment for Shareholders. It combines share price appreciation and dividends paid to show the total return to the Shareholders expressed as an annualised percentage.
PERFORMANCEThe Group targets exceeding the upper quartile when compared to its peers.
The Total Shareholder Return in the year to 31 March 2021 was 21.2% (2020: 8.7%).
LINK TO REMUNERATIONPERFORMANCE SHARE PLAN 2014A third of the maximum PSP award is based on the Group’s TSR performance compared with its peers.
1 Growth over all years to 31/03/21.2 Growth in FTSE All-Share Return Index over all years to 31/03/21.3 Growth in FTSE 350 Real Estate Super Sector Return Index over all
years to 31/03/21. For data prior to 30 September 1999, the FTSE All Share Real Estate Sector Index has been used.
TOTAL ACCOUNTING RETURN
DESCRIPTIONTotal Accounting Return is the growth in the net asset value of the Group plus dividends paid in the reporting year, expressed as a percentage of the net asset value at the beginning of the period. The metric measures the growth in Shareholders’ Funds each year and is expressed as an absolute measure.
PERFORMANCEThe Group targets a Total Accounting Return of 5–10%.
The Total Accounting Return on IFRS net assets in the year to 31 March 2021 was 3.3% (2020: 7.7%).
LINK TO REMUNERATIONANNUAL BONUS SCHEME 2018A quarter of the maximum bonus is payable based on the Total Accounting Return (growth in net asset value plus dividends), adjusted for performance-related awards.
3.3%
21.2%
BREEAM AND EPC RATINGS
DESCRIPTIONBREEAM is an environmental impact assessment methodology for commercial buildings. It sets out best practice standards for the environmental performance of buildings through their design, specification, construction and operational phases. Performance is measured across a series of ratings: “Pass”, “Good”, “Very Good”, “Excellent” and “Outstanding”.
The Group targets a BREEAM rating of “Excellent” or “Outstanding” on all major refurbishments or new developments.
PERFORMANCEAt 31 March 2021, six of our nine (31 March 2020: eight of our 14) office buildings had achieved, or were targeting, a BREEAM certification of “Excellent” or “Outstanding”. Those six buildings account for c.85% of the portfolio by value.
Building BREEAM rating2EPC rating
33 Charterhouse Street, London EC11 Outstanding (2018) A
The Warehouse and Studio, London EC1 Excellent (2014) B
The Tower, London EC1 Excellent (2014) B
25 Charterhouse Square, London EC1 Excellent (2014) B
Kaleidoscope, London EC1 Excellent (2014) B
55 Bartholomew, London EC1 Excellent (2014) B
1 Certified at design stage.2 Year designates the date of the applicable standard.
We are currently exploring BREEAM In Use certification for The Loom where it was not possible to obtain a BREEAM certification at the design and development stages.
Energy Performance Certificates (EPC) provide ratings on a scale of A–G on a building’s energy efficiency and are required when a building is constructed, sold or let. All but one of our buildings (99% by portfolio value) have an EPC rating of A or B.
LINK TO REMUNERATIONANNUAL BONUS SCHEME 2018A quarter of the maximum Annual Bonus is payable based on strategic objectives, which include improvements in ESG scoring.
99% OFFICE BUILDINGS BY VALUE HAVE AN EPC RATING OF A OR B
AVERAGE LENGTH OF EMPLOYEE SERVICE AND AVERAGE STAFF TURNOVER
DESCRIPTIONA high level of staff retention remains a key feature of Helical’s business. The Group retains a highly skilled and experienced team with an increasing length of service.
PERFORMANCEThe Group targets staff turnover to be less than 10% per annum.
The average length of service of the Group’s head office employees at 31 March 2021 was 11.0 years and the average staff turnover during the year to 31 March 2021 was 3.6%.
LINK TO REMUNERATIONANNUAL BONUS SCHEME 2018The deferred shares awarded under the Annual Bonus Scheme 2018 are required to be held for a period of three years.
PERFORMANCE SHARE PLAN 2014These awards have a three-year vesting period and the participants are required to hold them for a further two years after they vest.
SHARE INCENTIVE PLAN 2002These awards are made to all staff and are required to be held for a period of three years.
11.0yrs
34 Helical plc Annual Report and Accounts 2021 35Helical plcAnnual Report and Accounts 2021S
TR
AT
EG
IC R
EP
OR
T

Property Overview Helical’s portfolio is comprised of income-producing multi-let offices, office refurbishments and developments and a mixed use commercial/residential scheme. As at 31 March 2021, London represented 97% and Manchester 3% of the investment property portfolio. Our strategy is to continue to increase our London holdings, focusing on areas where we see strong tenant demand and growth potential, such as the “Tech Belt” that runs from King’s Cross through Old Street and Shoreditch to Whitechapel.
PROPERTY PORTFOLIO
Highly focusedLondon portfolio
1
2
34
5
6
7
8
910 11121314
Tenant diversity1. Software and Computer Services 31%2. Online retailing – Fashion 12%3. Flexible offices 11%4. IT Consultancy 10%5. Advertising/Marketing 8%6. Financial Products 8%7. Media 7%8. Human Resources 4%9. Restaurants 3%10. Consumer goods – other 2%11. Business Consultancy 1%12. Government/Charity 1%13. Law 1%14. Other 1%
37Helical plcAnnual Report and Accounts 2021S
TR
AT
EG
IC R
EP
OR
T36 Helical plc Annual Report and Accounts 2021
33 Charterhouse Street, EC1
The Bower, EC1
Barts Square, EC1
Kaleidoscope, EC1
The Loom, E1
25 Charterhouse Square, EC1

PROPERTY PORTFOLIO CONTINUED
Kaleidoscope/ EC1
In March, we completed the letting of the whole of Kaleidoscope, our 88,581 sq ft office building located directly above the Farringdon East Elizabeth Line Station, to TikTok Information Technologies UK Limited on a 15-year lease term. The tenant has a break at year ten, and a market rent free period has been granted. The letting achieved an annual rent of £7.6m, reflecting a 5.4% premium to the 31 March 2020 ERV.
SUSTAINABILITY RATINGSBREEAM ExcellentEPC B
The development of our 205,369 sq ft office building, in 50:50 joint venture with AshbyCapital, is progressing in line with the programme and is due to achieve practical completion in September 2022. The site is situated just 100m from Farringdon Station and directly opposite the location for the new Museum of London, offering future tenants excellent connectivity and amenity.
During the year, we exercised the option under the Development Agreement with the City of London to secure a new 150-year lease of the site. Following the grant of the new lease, Mace was appointed as principal contractor. We have also secured a £140m development
facility from Allianz, which has subsequently been independently verified as a “Green Loan”, which will fully fund all future budgeted development costs.
In line with Helical’s sustainability ambitions, 33 Charterhouse Street has also been awarded the UK’s first BREEAM 2018 New Construction “Outstanding” rating for the design stage.
SUSTAINABILITY RATINGSBREEAM OutstandingEPC (targeted) A
33 Charterhouse Street/EC1
38 Helical plc Annual Report and Accounts 2021 39Helical plcAnnual Report and Accounts 2021S
TR
AT
EG
IC R
EP
OR
T
PROPERTY PORTFOLIO CONTINUED
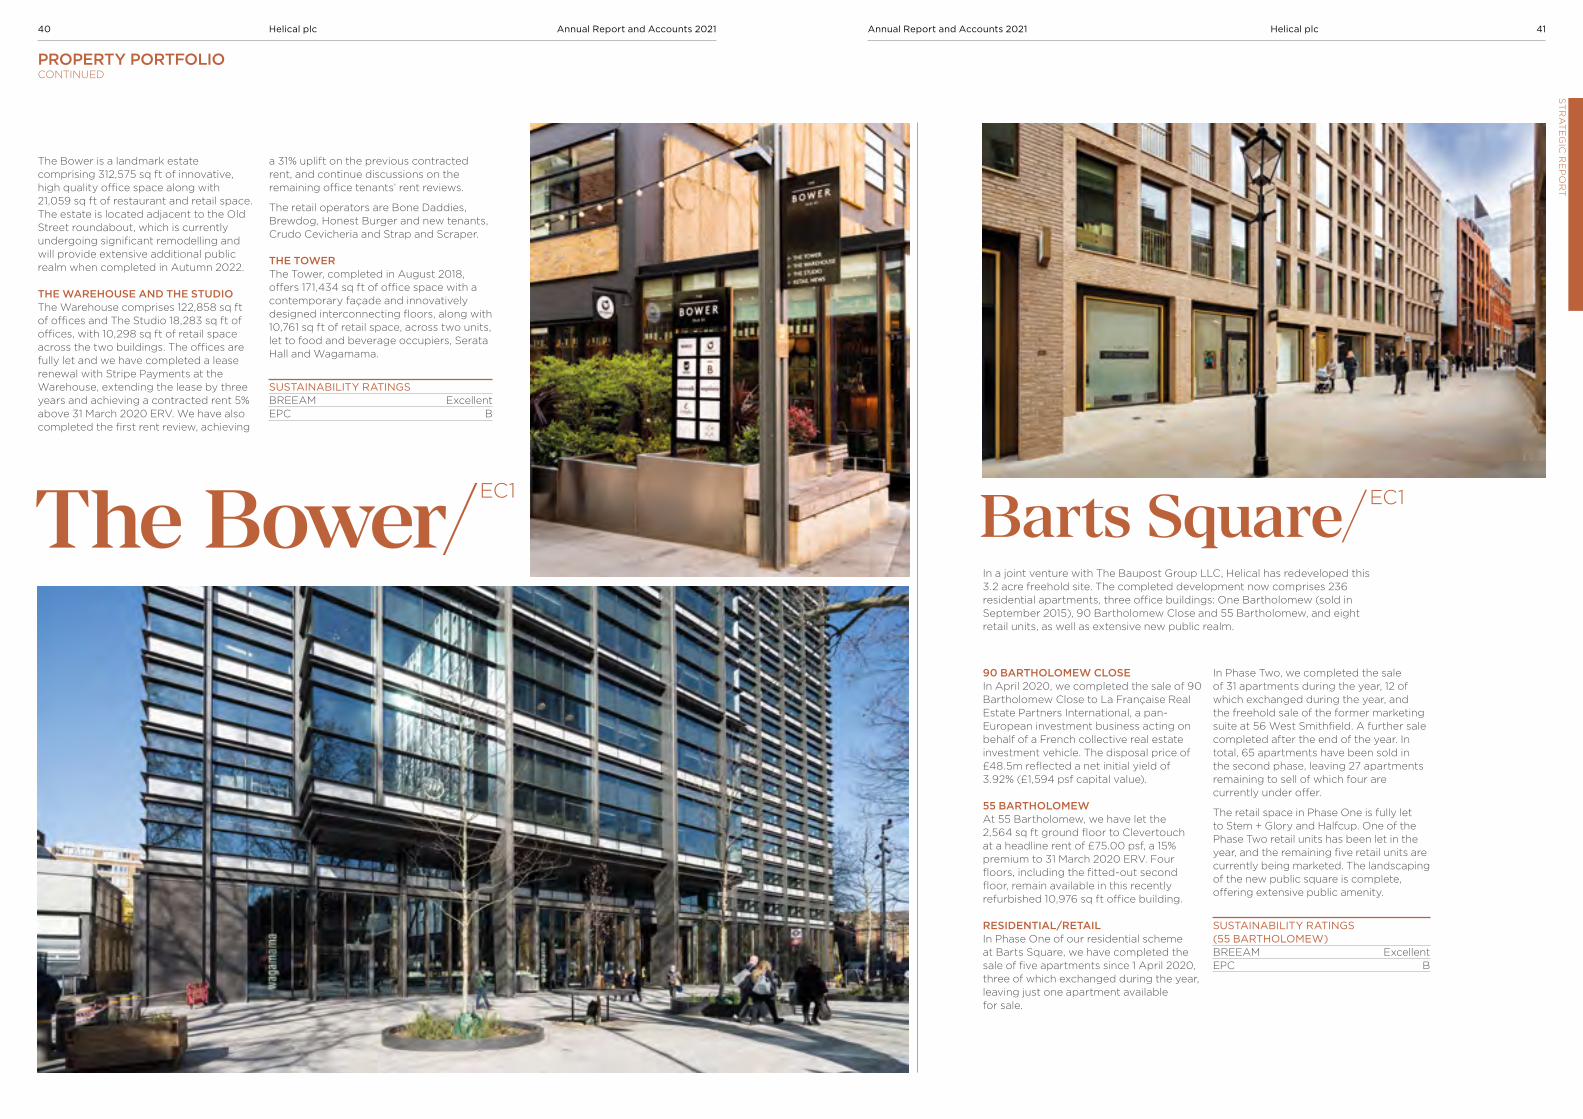
The Bower is a landmark estate comprising 312,575 sq ft of innovative, high quality office space along with 21,059 sq ft of restaurant and retail space. The estate is located adjacent to the Old Street roundabout, which is currently undergoing significant remodelling and will provide extensive additional public realm when completed in Autumn 2022.
THE WAREHOUSE AND THE STUDIOThe Warehouse comprises 122,858 sq ft of offices and The Studio 18,283 sq ft of offices, with 10,298 sq ft of retail space across the two buildings. The offices are fully let and we have completed a lease renewal with Stripe Payments at the Warehouse, extending the lease by three years and achieving a contracted rent 5% above 31 March 2020 ERV. We have also completed the first rent review, achieving
a 31% uplift on the previous contracted rent, and continue discussions on the remaining office tenants’ rent reviews.
The retail operators are Bone Daddies, Brewdog, Honest Burger and new tenants, Crudo Cevicheria and Strap and Scraper.
THE TOWERThe Tower, completed in August 2018, offers 171,434 sq ft of office space with a contemporary façade and innovatively designed interconnecting floors, along with 10,761 sq ft of retail space, across two units, let to food and beverage occupiers, Serata Hall and Wagamama.
SUSTAINABILITY RATINGSBREEAM ExcellentEPC B
The Bower/EC1
90 BARTHOLOMEW CLOSEIn April 2020, we completed the sale of 90 Bartholomew Close to La Française Real Estate Partners International, a pan-European investment business acting on behalf of a French collective real estate investment vehicle. The disposal price of £48.5m reflected a net initial yield of 3.92% (£1,594 psf capital value).
55 BARTHOLOMEWAt 55 Bartholomew, we have let the 2,564 sq ft ground floor to Clevertouch at a headline rent of £75.00 psf, a 15% premium to 31 March 2020 ERV. Four floors, including the fitted-out second floor, remain available in this recently refurbished 10,976 sq ft office building.
RESIDENTIAL/RETAILIn Phase One of our residential scheme at Barts Square, we have completed the sale of five apartments since 1 April 2020, three of which exchanged during the year, leaving just one apartment available for sale.
Barts Square/ EC1
In Phase Two, we completed the sale of 31 apartments during the year, 12 of which exchanged during the year, and the freehold sale of the former marketing suite at 56 West Smithfield. A further sale completed after the end of the year. In total, 65 apartments have been sold in the second phase, leaving 27 apartments remaining to sell of which four are currently under offer.
The retail space in Phase One is fully let to Stem + Glory and Halfcup. One of the Phase Two retail units has been let in the year, and the remaining five retail units are currently being marketed. The landscaping of the new public square is complete, offering extensive public amenity.
SUSTAINABILITY RATINGS (55 BARTHOLOMEW)BREEAM ExcellentEPC B
In a joint venture with The Baupost Group LLC, Helical has redeveloped this 3.2 acre freehold site. The completed development now comprises 236 residential apartments, three office buildings: One Bartholomew (sold in September 2015), 90 Bartholomew Close and 55 Bartholomew, and eight retail units, as well as extensive new public realm.
40 Helical plc Annual Report and Accounts 2021 41Helical plcAnnual Report and Accounts 2021S
TR
AT
EG
IC R
EP
OR
T

PROPERTY PORTFOLIO CONTINUED
At this 108,606 sq ft listed former Victorian wool warehouse, we have undertaken further asset management activities, reconfiguring units as they become available to offer larger floorplates and offering “Plug and Play” space to complement the existing variety of units. As a result of lease events during the year, 16,041 sq ft is currently available across seven units.
SUSTAINABILITY RATINGSEPC B
25 Charterhouse Square comprises 42,921 sq ft of offices adjacent to the new Farringdon East Elizabeth Line station, overlooking the historic Charterhouse Square. The building was extensively refurbished upon acquisition and is currently 74% let to Anomaly, Peakon and Hudson Sandler.
The ground floor and first floor space is currently available following a tenant lease event. The ground floor units, which were previously used as office furniture showrooms, have been significantly remodelled and now benefit from a change of use to allow them to be occupied as office accommodation going forward.
SUSTAINABILITY RATINGSBREEAM ExcellentEPC B
25 Charterhouse Square/EC1
The Loom/
E1
Trinity/MANCHESTER
Manchester
In the year, we have let the third and fourth floors to Kennedys Law LLP, the two fifth floor units to Tosca Debt Capital LLP and Saffrey Champness LLP, and both of the ground floor retail units. These lettings total 26,982 sq ft and deliver £0.8m of contracted rent at a 5.8% premium to the 31 March 2020 ERV. With a further floor let after the year end, the 58,760 sq ft building is now 55% let.
SUSTAINABILITY RATINGSEPC B
The Powerhouse/W4
The Powerhouse is a listed building, providing 24,288 sq ft of office and recording studio space, on Chiswick High Road and is fully let on a long lease to Metropolis Music Group.
SUSTAINABILITY RATINGSEPC C
42 Helical plc Annual Report and Accounts 2021 43Helical plcAnnual Report and Accounts 2021S
TR
AT
EG
IC R
EP
OR
T

THE PROPERTY PORTFOLIO IN NUMBERSTHE PROPERTY PORTFOLIO IN NUMBERS
PORTFOLIO ANALYTICS SEE-THROUGH TOTAL PORTFOLIO BY FAIR VALUE
Investment £m %
Land anddevelopment
£m %Total
£m %
London Offices
– Completed, let and available to let 742.7 88.5 – – 742.7 86.7
– Being redeveloped 69.3 8.2 – – 69.3 8.1
London Residential – – 16.5 94.2 16.5 1.9
Total London 812.0 96.7 16.5 94.2 828.5 96.7Manchester Offices
– Completed, let and available to let 27.3 3.3 – – 27.3 3.2
Total Manchester 27.3 3.3 – – 27.3 3.2Total Core Portfolio 839.3 100.0 16.5 94.2 855.8 99.9Other 0.1 0.0 1.1 5.8 1.2 0.1
Total Non-Core Portfolio 0.1 0.0 1.1 5.8 1.2 0.1Total 839.4 100.0 17.6 100.0 857.0 100.0
SEE-THROUGH LAND AND DEVELOPMENT PORTFOLIO
Book value£m
Fair value£m
Surplus£m
Fair value%
London Residential 16.5 16.5 0.0 94.2
Land 0.5 1.1 0.6 5.8
Total 17.0 17.6 0.6 100.0
CAPITAL EXPENDITUREWe have a committed and planned development and refurbishment programme.
Property
Capexbudget
(Helical share)£m
Remaining spend
(Helical share)£m
Pre-redevelopedspace
sq ftNew space
sq ft
Total completedspace
sq ftCompletion
date
Investment – committedThe Tower, The Bower, London EC1 110.0 3.0 114,000 68,195 182,195 Completed
33 Charterhouse Street, London EC1 65.9 44.4 – 205,369 205,369 September 2022
The Loom, London E1 0.8 0.8 – – 108,606 Ongoing refurbishment
Other 5.3 0.8 – – – Ongoing refurbishment
Development – committedBarts Square, London EC1 – Phase One 69.9 0.2 – 127,364 127,364 Completed
Barts Square, London EC1 – Phase Three 44.3 0.8 – 89,353 89,353 Completed
ASSET MANAGEMENT Asset management is a critical component in driving Helical’s performance. Through having well considered business plans and maximising the combined skills of our management team, we are able to create value in our assets without relying on market movements.
See-through Investment portfolio
Fairvalue
weighting%
Passingrent£m %
Contractedrent£m %
ERV£m %
ERV movement
like-for-like%
London Offices
– Completed, let and available to let 88.5 26.5 99.6 37.0 97.9 41.6 79.8 1.0
– Being redeveloped 8.2 – – – – 8.6 16.5 1.2
Total London 96.7 26.5 99.6 37.0 97.9 50.2 96.3 1.1Manchester Offices
– Completed, let and available to let 3.3 0.1 0.4 0.8 2.1 1.8 3.5 5.8
Total Manchester 3.3 0.1 0.4 0.8 2.1 1.8 3.5 5.8Other 0.0 0.0 0.0 0.0 0.0 0.1 0.2 0.0
Total 100.0 26.6 100.0 37.8 100.0 52.1 100.0 1.2
During the year, total contracted income increased by £0.2m, primarily as a result of rent from new lettings and rent reviews. This income more than offset the reduction in contracted income from the sale of 90 Bartholomew Close and three assets in Manchester and losses from breaks and lease expiries.
See-throughtotal portfolio
contracted rent£m
Rent lost at break/expiry (1.5)
Rent reviews and uplifts on lease renewals 0.2
New lettings
– London 8.0
– Manchester 0.8
Total increase in the year from asset management activities 7.5Contracted rent reduced through disposals of London Offices (0.9)
Contracted rent reduced through disposals of Manchester Offices (6.4)
Total contracted rental change from sales and purchases (7.3)Net increase in contracted rents in the year 0.2
INVESTMENT PORTFOLIOSEE-THROUGH VALUATION MOVEMENTS
Valuation change
incl. purchases & gains on sales
%
Valuation change
excl. purchases & gains on sales
%
Investmentportfolio
weighting31 March 2021
%
Investment portfolio
weighting31 March 2020
%
London Offices
– Completed, let and available to let 2.5 2.6 88.5 80.1
– Being redeveloped 9.2 9.2 8.2 4.9
Total London 3.0 3.2 96.7 85.0Manchester Offices
– Completed, let and available to let 1.1 10.0 3.3 15.0
Total Manchester 1.1 10.0 3.3 15.0Total 2.7 3.4 100.0 100.0
PORTFOLIO YIELDS
EPRA Topped Up NIY
31 March 2021%
EPRA Topped Up NIY
31 March 2020%
ReversionaryYield
31 March 2021%
ReversionaryYield
31 March 2020%
True Equivalent Yield
31 March 2021%
True Equivalent Yield
31 March 2020%
London Offices
– Completed, let and available to let 4.5 3.9 5.1 5.2 5.0 5.0
– Being redeveloped n/a n/a 5.6 5.5 4.9 4.9
Total London 4.5 3.9 5.3 5.3 4.9 5.0Manchester Offices
– Completed, let and available to let 2.4 4.4 5.9 6.2 5.7 6.0
Total Manchester 2.4 4.4 5.9 6.2 5.7 6.0Total 4.5 4.0 5.3 5.4 5.0 5.1
SEE-THROUGH CAPITAL VALUES, VACANCY RATES AND UNEXPIRED LEASE TERMS
31 March 2021Capital value psf
£
31 March 2021Vacancy rate
%
31 March 2021WAULT
Years
31 March 2020WAULT
Years
London Offices
– Completed, let and available to let 1,215 5.8 6.9 6.6
– Being redeveloped 674 n/a n/a n/a
Total London 1,081 5.8 6.9 6.6Manchester Offices
– Completed, let and available to let 465 54.1 8.4 3.9
Total Manchester 465 54.1 8.4 3.9Total 1,040 10.5 6.9 6.1
44 Helical plc Annual Report and Accounts 2021 45Helical plcAnnual Report and Accounts 2021S
TR
AT
EG
IC R
EP
OR
T

THE PROPERTY PORTFOLIO IN NUMBERS CONTINUED
SEE-THROUGH LEASE EXPIRIES OR TENANT BREAK OPTIONS
Year to2022
Year to2023
Year to2024
Year to2025
Year to2026
2027onward
% of rent roll 10.6 12.0 9.3 5.5 1.1 61.5
Number of leases 23 15 12 5 5 34
Average rent per lease (£) 173,880 302,442 291,618 413,643 84,982 679,270
Of the total leases, 61.5% of contracted rent is secure for in excess of five years.
TOP 10 TENANTSWe have a strong rental income stream and a diverse tenant base. The top 10 tenants account for 68.9% of the total rent roll and the tenants come from a variety of industries.
Contracted rent£m
Rent roll%Rank Tenant Tenant industry
1 TikTok Technology 7.6 20.2
2 Farfetch Online retail 3.9 10.4
3 WeWork Flexible offices 3.8 10.2
4 Brilliant Basics Technology 3.2 8.4
5 VMware Technology 2.0 5.3
6 Anomaly Marketing 1.4 3.7
7 John Brown Media Media 1.1 2.8
8 CBS Media 1.0 2.8
9 Allegis Recruitment 1.0 2.6
10 Incubeta Marketing 0.9 2.5
Total 25.9 68.9
LETTING ACTIVITY
Areasq ft
Contracted rent(Helical’s share)
£Rent psf £
£
Above/(below) 31 March 2020
ERV %
Lease termto expiry
Years
Investment PropertiesLondonCompleted, let and available to let – offices
– Kaleidoscope, London EC1 88,581 7,633,000 86.17 5.4 15.0
– The Loom, London E1 3,813 210,000 55.00 (0.1) 5.0
– 55 Bartholomew, London EC1 2,564 90,000 75.00 15.4 5.0
Completed, let and available to let – retail
– The Warehouse, The Bower, London EC1 691 38,000 54.99 (21.4) 4.0
– Barts Square, London EC1 952 21,000 47.27 23.9 4.0
Total London 96,601 7,992,000 84.04 5.4 14.5
ManchesterCompleted, let and available to let – offices
– Trinity 22,682 676,000 29.80 4.4 8.0
Completed, let and available to let – retail
– Trinity 4,300 100,000 23.26 16.2 10.0
Total Manchester 26,982 776,000 28.76 5.8 9.4Total 123,583 8,768,000 71.97 5.4 14.1
FINANCIAL REVIEW
Helical aims to deliver market leading returns by investing in and developing real estate that best serves the needs of its tenants and maximises value for its Shareholders.
IFRS PERFORMANCE
PROFIT BEFORE TAX
£20.5m (2020: £43.0m)
EPS
14.8p(2020: 32.3p)
DILUTED NAV PER SHARE
492p(31 March 2020: 489p)
TOTAL ACCOUNTING RETURN
3.3%(2020: 7.7%)
EPRA PERFORMANCE
EPRA LOSS
£2.2m (2020: Earnings of £9.1m)
EPRA EPS LOSS
1.8p(2020: Earnings of 7.6p)
EPRA NTA PER SHARE
533p(31 March 2020: 524p)
TOTAL ACCOUNTING RETURN ON EPRA NTA
4.5% (2020: 9.3%)
TIM MURPHY FINANCE DIRECTOR
2021 Performance Financial highlights
47Helical plcAnnual Report and Accounts 2021S
TR
AT
EG
IC R
EP
OR
T46 Helical plc Annual Report and Accounts 2021

FINANCIAL REVIEW CONTINUED
EARNINGS PER SHAREThe IFRS earnings per share decreased from 32.3p to 14.8p and is based on the after tax earnings attributable to ordinary Shareholders divided by the weighted average number of shares in issue during the year.
On an EPRA basis, the loss per share was 1.8p compared to earnings per share of 7.6p in 2020, reflecting the Group’s share of net rental income of £25.0m (2020: £28.5m) and development losses of £0.3m (2020: profits of £9.9m), but excluding gains on sale and revaluation of investment properties of £23.9m (2020: £45.5m).
NET ASSET VALUEIFRS diluted net asset value per share increased from 489p to 492p and is a measure of Shareholders’ Funds divided by the number of shares in issue at the year end, adjusted to allow for the effect of all dilutive share awards.
EPRA has introduced three new asset value measures which are applicable to Helical’s results for the year to 31 March 2021. The new measures replace the existing EPRA net asset value and triple net asset value metrics. Helical considers the EPRA net tangible asset measure to be the most relevant for its business. EPRA net tangible asset value per share increased by 1.7% to 533p per share (31 March 2020: 524p). This movement arose principally from a total comprehensive income (retained profits) of £17.9m (2020: £38.8m), less £10.5m of dividends (2020: £12.2m).
EPRA net disposal value per share increased to 485p (31 March 2020: 480p).
INCOME STATEMENT RENTAL INCOME AND PROPERTY OVERHEADSGross rental income for the Group in respect of wholly owned properties decreased to £28.0m (2020: £31.6m), mainly reflecting the sale of three Manchester offices during the year. In the joint ventures, gross rents decreased to £0.2m (2020: £0.9m) due to the sale of 90 Bartholomew Close, London EC1 at the beginning of the year. Property overheads in respect of wholly owned assets and in respect of those assets in joint ventures decreased in line with rents at £3.2m (2020: £4.1m). Overall, see-through net rents decreased by 12.3% to £25.0m (2020: £28.5m).
RENT COLLECTION
March – December 2020quarters
%
Rent collected to date 93.3
Rent under discussion 1.8
Rent concessions 4.9
The Group has collected 93.3% of all rent contracted and payable for the March, June, September and December 2020 quarters. This is a strong performance in light of the impact of the global pandemic.
DEVELOPMENT PROFITS In the year, from our role as development manager at 33 Charterhouse Street, London EC1, we recognised £0.8m of fees. Further fees of £0.1m were recognised for carrying out accounting and corporate services at Barts Square, London EC1 and 33 Charterhouse Street, London EC1.
Ongoing costs of closing out our legacy retail development programme of £0.3m offset these to give a net development profit in the main Group of £0.6m (2020: £3.3m).
The prior year profit of £3.3m included £0.8m of fees from our role as development manager of One Creechurch Place, London EC3 and a write back of a provision in relation to the sale of Retirement Villages in 2018.
SHARE OF RESULTS OF JOINT VENTURESThe revaluation of our investment assets held in joint ventures generated a surplus of £6.4m (2020: £8.5m). A loss of £0.9m was recognised in respect of our Barts Square, London EC1 residential development as a result of marketing and void costs. Transaction costs on the sale of 90 Bartholomew Close, London EC1 resulted in a net loss on sale of investment properties of £0.6m.
Finance, administration, taxation and other sundry items added a further £1.7m of costs. An adjustment to reflect our economic interest in the Barts Square, London EC1 development to its recoverable amount generated a loss of £0.8m, leaving a net profit from our joint ventures of £2.4m (2020: £13.4m).
GAIN ON SALE AND REVALUATION OF INVESTMENT PROPERTIES The valuation of our investment portfolio, on a see-through basis, continued to reflect the benefit of our letting and development activities where we generated a see-through valuation surplus of £23.9m (2020: £45.5m), or 2.7% (including purchases and gains on sales) and 3.4% on a like-for-like basis. Transaction costs on the sale of the three Manchester assets resulted in a net loss on sale of £1.3m.
ADMINISTRATIVE EXPENSESAdministration costs in the Group, before performance-related awards, reduced from £10.5m to £9.3m as a result of the impact of Covid-19 and actions taken in response.
Performance related share awards and bonus payments, including National Insurance costs, decreased to £5.1m (2020: £6.2m). Of this amount, £2.0m (2020: £2.8m), being the charge for share awards under the Performance Share Plan, is expensed through the Income Statement but added back to Shareholders’ Funds through the Statement of Changes in Equity.
2021 £000
2020 £000
Administrative expenses 9,276 10,524
Performance related awards, including NIC 5,140 6,191
Group 14,416 16,715
In joint ventures 432 596
Total 14,848 17,311
FINANCE COSTS, FINANCE INCOME AND DERIVATIVE FINANCIAL INSTRUMENTS Total finance costs, including in joint ventures, fell during the year to £14.9m (2020: £17.0m), reflecting the lower level of borrowings.
2021 £000
2020 £000
Interest payable on secured bank loans
– subsidiaries 10,567 11,292
– joint ventures 1,319 543
Interest payable on unsecured bonds – 855
Loan cancellation costs – 1,692
Amortisation of refinancing costs 1,111 2,270
Sundry interest and bank charges
– subsidiaries 2,401 1,736
– joint ventures - 328
Interest capitalised (514) (1,745)
Total 14,884 16,971
Finance income earned, including in joint ventures, was £0.1m (2020: £1.4m). The movement upwards in medium and long-term interest rate projections during the year contributed to a credit of £2.9m (2020: charge of £7.7m) on the mark-to-market valuation of the derivative financial instruments.
Total Property Return£m
48.6
83.981.468.8
79.9
2020 2021201920182017
The net rental income, development profits and net gains on sale and revaluation of our investment portfolio, which contribute to the Total Property Return, provide the inputs for our performance as measured by MSCI.
Unleveraged portfolio return – MSCI%
7.0
9.610.110.89.3
2020 2021201920182017
TOTAL ACCOUNTING RETURNTotal Accounting Return is the growth in the net asset value of the Group plus dividends paid in the reporting year, expressed as a percentage of the net asset value at the beginning of the year. The metric measures the growth in Shareholders’ Funds each year and is expressed as an absolute measure.
The Total Accounting Return on IFRS net assets in the year to 31 March 2021 was 3.3% (2020: 7.7%).
Total Accounting Return on IFRS net assets%
3.3
7.78.4
5.3
8.3
2020 2021201920182017
Total Accounting Return on EPRA net tangible assets is the growth in the EPRA net tangible asset value of the Group plus dividends paid in the year, expressed as a percentage of EPRA net tangible asset value at the beginning of the year.
Total Accounting Return on EPRA net tangible assets%
4.5
9.38.0*
1.0*
4.2*
2020 2021201920182017
* Calculated using EPRA net assets.
OVERVIEWThe Group has made good progress during the year, with the successful letting of the whole of Kaleidoscope, London EC1 and the ongoing development of 33 Charterhouse Street, London EC1 driving its positive financial results.
The quality of the portfolio, and the tenants it attracts, has resulted in a strong rent collection of 93.3% for the year, despite operating in the Covid-19 global pandemic. For those tenants that have been hardest hit, primarily food and beverage operators, Helical has offered rent holidays and concessions. Unfortunately, a small number of tenants have ceased trading.
The sales of four investment assets and completion of the sale of 37 residential units for a combined £163.4m have improved the Group’s cash resources, reducing its LTV and providing additional firepower to deploy into new opportunities.
RESULTS FOR THE YEARThe see-through results for the year to 31 March 2021 include net rental income of £25.0m, a net gain on sale and revaluation of the investment portfolio of £23.9m and development losses of £0.3m, leading to a Total Property Return of £48.6m (2020: £83.9m). Total administration costs of £14.8m (2020: £17.3m) and net finance costs, also of £14.8m (2020: £15.6m), contributed to a pre-tax profit of £20.5m (2020: £43.0m). EPRA net tangible asset value per share increased by 1.7% to 533p (31 March 2020: 524p).
The Company has proposed a final dividend of 7.40p per share (2020: 6.00p) which, if approved by Shareholders at the 2021 AGM, will be payable on 26 July 2021. The total dividend paid or payable in respect of the year to 31 March 2021 will be 10.10p (2020: 8.70p), an increase of 16.1%.
The Group’s real estate portfolio, including its share of assets held in joint ventures, decreased to £857.0m (31 March 2020: £949.3m) primarily as a result of the sale of investment assets, offset by net revaluation gains on the investment portfolio and capital expenditure at 33 Charterhouse Street, London EC1.
The sale of investment properties facilitated the repayment of debt during the year and decreased the Group’s see-through loan to value to 22.6% (31 March 2020: 31.4%). The Group’s weighted average cost of debt remained at 3.5% (31 March 2020: 3.5%) and the weighted average debt maturity was 3.2 years (31 March 2020: 4.0 years). The average maturity of the facilities would increase to 4.6 years on exercise of the available extension options, on a fully utilised basis.
At 31 March 2021, the Group had unutilised bank facilities of £260.5m and £162.2m of cash on a see-through basis. These are primarily available to fund the development of 33 Charterhouse Street, London EC1 and future property acquisitions.
TOTAL PROPERTY RETURNWe calculate our Total Property Return to enable us to assess the aggregate of income and capital profits made each year from our property activities. Our business is primarily aimed at producing surpluses in the value of our assets through asset management and development, with the income side of the business seeking to cover our annual administration and finance costs.
48 Helical plc Annual Report and Accounts 2021 49Helical plcAnnual Report and Accounts 2021S
TR
AT
EG
IC R
EP
OR
T

FINANCIAL REVIEW CONTINUED
SECURED DEBTThe Group arranges its secured investment and development facilities to suit its business needs as follows:
• Investment Facilities
We have a £400m Revolving Credit Facility that enables the Group to acquire, refurbish, reposition and hold significant parts of our investment portfolio with the remaining investment assets held in £131m of term loan secured facilities. The value of the Group’s properties secured in these facilities at 31 March 2021 was £729m (31 March 2020: £709m) with a corresponding loan to value of 46.8% (31 March 2020: 43.8%). The average maturity of the Group’s investment facilities at 31 March 2021 was 3.3 years (31 March 2020: 4.4 years), increasing to 4.8 years on a fully utilised basis and following the two one-year extensions of the Revolving Credit Facility. The weighted average interest rate was 3.3% (31 March 2020: 3.3%). The marginal cost of fully utilising the undrawn Revolving Credit Facility was 1.5% (31 March 2020: 2.2%).
• Joint Venture Facilities
We hold a number of investment and development properties in joint venture with third parties and include in our reported figures our share, in proportion to our economic interest, of the debt associated with each asset. The average maturity of the Group‘s share of bank facilities in joint ventures at 31 March 2021 was 1.9 years (31 March 2020: 1.8 years) with a weighted average interest rate of 6.5% (31 March 2020: 4.2%). The average interest rate will fall as the 33 Charterhouse Street, London EC1 development facility is drawn down and would be 4.7% on a fully utilised basis, reducing to 2.25% once the building is complete and let.
UNSECURED DEBTThe Group’s unsecured debt, following the repayment of the £5m working capital facility in July 2020, is £nil (31 March 2020: £5.0m).
CASH AND CASH FLOWAt 31 March 2021, the Group had £423m (31 March 2020: £279m) of cash and agreed, undrawn, committed bank facilities including its share in joint ventures, as well as £28.1m (31 March 2020: £70m) of uncharged property on which it could borrow funds.
NET BORROWINGS AND GEARINGTotal gross borrowings of the Group, including in joint ventures, have decreased from £386.9m to £362.2m during the year to 31 March 2021. After deducting cash balances of £162.2m (31 March 2020: £83.0m) and unamortised refinancing costs of £6.1m (31 March 2020: £6.0m), net borrowings decreased from £298.5m to £193.9m. The see-through gearing of the Group, including in joint ventures, decreased from 49.9% to 31.9%.
31 March2021
31 March 2020
See-through gross borrowings £362.2m £386.9m
See-through cash balances £162.2m £83.0m
Unamortised refinancing costs £6.1m £6.0m
See-through net borrowings £193.9m £298.5m
Shareholders’ Funds £608.2m £598.7m
See-through gearing – IFRS net asset value 31.9% 49.9%
HEDGINGAt 31 March 2021, the Group had £280.8m (31 March 2020: £285.8m) of fixed rate debt with an average effective interest rate of 3.1% (31 March 2020: 3.0%) and £60.4m (31 March 2020: £68.0m) of floating rate debt with an average effective interest rate of 4.2% (31 March 2020: 4.9%). In addition, the Group had £240m of interest rate caps at an average of 1.75% (31 March 2020: £240m at 1.75%). In our joint ventures, the Group’s share of fixed rate debt was £9.4m (31 March 2020: £nil) with an effective rate of 10.7% and £11.6m (31 March 2020: £33.1m) of floating rate debt with an effective rate of 3.1% (31 March 2020: 4.2%), with interest rate caps set at 1.5% plus margin on £35.3m (31 March 2020: £32.3m at 1.5%).
31 March2021
£m
Effective interest
rate %
31 March2020
£m
Effective interest
rate %
Fixed rate debt
– secured borrowings 280.8 3.1 280.8 3.0
– unsecured borrowings – – 5.0 3.3
Total 280.8 3.1 285.8 3.0
Floating rate debt
– secured 60.4 4.21 68.0 4.91
Total 341.2 3.3 353.8 3.4
In joint ventures
– fixed rate 9.4 10.72 - -
– floating rate 11.6 3.1 33.1 4.2
Total borrowings 362.2 3.5 386.9 3.5
1 This includes commitment fees on undrawn facilities. Excluding these would reduce the effective rate to 1.9% (31 March 2020: 3.0%).
2 This includes commitment fees on undrawn facilities. Excluding these would reduce the effective rate to 4.95% (31 March 2020: nil%).
TIM MURPHYFinance Director
25 May 2021
INVESTMENT PORTFOLIOWhollyowned
£000
In joint venture
£000See-through
£000
Head leases capitalised
£000
Lease incentives
£000
Bookvalue£000
Valuation at 31 March 2020 836,875 76,809 913,684 2,161 (20,131) 895,714
Acquisitions
– wholly owned – – – – – –
– joint ventures – – – 4,421 – 4,421
Capital expenditure
– wholly owned 13,163 – 13,163 (14) – 13,149
– joint ventures – 18,459 18,459 – – 18,459
Letting costs amortised
– wholly owned (19) – (19) – – (19)
– joint ventures – – – – – –
Disposals
– wholly owned (114,144) – (114,144) – 2,261 (111,883)
– joint ventures – (20,305) (20,305) – 606 (19,699)
Revaluation surplus
– wholly owned 21,000 – 21,000 – (1,613) 19,387
– joint ventures – 6,474 6,474 – (51) 6,423
Economic interest adjustment
– joint ventures – 1,079 1,079 – (6) 1,073
Valuation at 31 March 2021 756,875 82,516 839,391 6,568 (18,934) 827,025
The Group spent £31.6m on capital works across the Investment portfolio, mainly at 33 Charterhouse Street, London EC1 (£18.4m), Kaleidoscope, London EC1 (£7.5m), The Tower, London EC1 (£2.8m), Fourways, Manchester (£1.1m), Trinity, Manchester (£0.8m) and The Tootal Buildings, Manchester (£0.5m). Three assets in Manchester, The Tootal Buildings, 35 Dale Street and Fourways, were sold during the year for a combined book value of £114.1m. In the joint ventures, 90 Bartholomew Close, London EC1 was sold in the year with a book value of £20.3m.
Revaluation gains added £27.5m to increase the see-through value of the portfolio, before lease incentives, to £839.4m (31 March 2020: £913.7m). The accounting for head leases and lease incentives resulted in a book value of the see-through investment portfolio of £827.0m (31 March 2020: £895.7m).
DEBT AND FINANCIAL RISKIn total, the see-through outstanding debt at 31 March 2021 of £362.2m (31 March 2020: £386.9m) had a weighted average interest cost of 3.5% (31 March 2020: 3.5%) and a weighted average debt maturity of 3.2 years (31 March 2020: 4.0 years). The average maturity of the facilities would increase to 4.6 years following exercise of the two one-year extensions of the Group’s £400m Revolving Credit Facility, and the one-year extension of the joint venture development loan, on a fully utilised basis.
Debt Profile at 31 March 2021 – Including Commitment Fees but Excluding the Amortisation of Arrangement Fees
Totalfacility
£000
Total utilised
£000
Available facility
£000
Weighted average
interest rate %
Average maturity
Years
Extended* average maturity
Years
Investment facilities 531,150 341,150 190,000 3.3 3.3 4.8
Total wholly owned 531,150 341,150 190,000 3.3 3.3 4.8
In joint ventures 81,513 21,024 60,489 6.5 1.9 3.8
Total secured debt 612,663 362,174 250,489 3.5 3.2 4.7
Working capital 10,000 - 10,000 - - 1.0
Total unsecured debt 10,000 - 10,000 - - 1.0
Total debt 622,663 362,174 260,489 3.5 3.2 4.6
* Calculated on a fully utilised basis with the two one-year extensions of the Revolving Credit Facility included and one-year extension of the joint venture development loan.
TAXATIONHelical pays corporation tax on its UK sourced net rental income, trading and development profits and realised chargeable gains, after offsetting administration and finance costs.
The current tax charge for the year increased to £0.9m from £0.5m. This was offset by a decrease in the deferred tax charge to £1.7m from £3.8m, resulting in a total tax charge for the year of £2.6m (2020: £4.3m).
DIVIDENDSThe interim dividend paid on 31 December 2020 of 2.70p was unchanged from the previous interim dividend of 2.70p. The Company has proposed a final dividend of 7.40p, an increase of 23.3% on the previous year (2020: 6.00p), for approval by
Shareholders at the 2021 AGM. If approved, the total dividend paid or payable in respect of the results for the year to 31 March 2021 will be 10.10p (2020: 8.70p), an increase of 16.1%.
BALANCE SHEETSHAREHOLDERS’ FUNDSShareholders’ Funds at 1 April 2020 were £598.7m. The Group’s results for the year added £17.9m (2020: £38.8m), net of tax, representing the total comprehensive income for the year. Movements in reserves arising from the Group’s share schemes increased funds by £2.1m. The Company paid dividends to Shareholders during the year of £10.5m. The net increase in Shareholders’ Funds from Group activities during the year was £9.5m to £608.2m.
50 Helical plc Annual Report and Accounts 2021 51Helical plcAnnual Report and Accounts 2021S
TR
AT
EG
IC R
EP
OR
T

RISK MANAGEMENT
TOP
-DO
WN
AP
PR
OA
CH
BO
TTO
M-U
P A
PP
RO
AC
H
Helical’s approach to risk management
RISK MANAGEMENT
Risk is an integral part of the Group’s business activities and Helical’s ability to identify, assess, monitor and manage its risks is fundamental to its financial stability, continuing performance and reputation.
When making business decisions, the Board of Helical assesses all potential risks faced and considers the effect that such risks could have on the achievement of the strategic priorities and the long-term success of the Company.
The Board acknowledges that there are numerous risks faced by the business and that these are often interrelated. However, the Board also views the potential risks as opportunities which, when handled appropriately, can drive performance. Therefore, having an effective Risk Management Framework is key to support the delivery of the Group’s strategy.
The Board confirms that during this reporting period it has carried out a robust assessment of the Group’s emerging and principal risks (please see Audit and Risk Committee Report, pages 99 to 102, for details of the work undertaken by the Directors during the reporting period). These risks and the Group’s appetite for risk are discussed below.
RISK APPETITEThe Board has established procedures to determine the nature and extent of the principal risks the Company is willing to take in order to achieve its long-term strategic objectives. It is through the enactment of these procedures that the Company is able to set its risk appetite.
Helical’s risk appetite is driven by the business strategy. The overall risk appetite is moderate to low and appropriate mitigating actions are taken to reduce the severity of identified risks into the acceptable range set by the Board. In determining the risk appetite, the Board considers upside risks as well as downside risks. Helical’s risk appetite is not static and is reviewed by the Board at least twice a year.
Our appetite for risk in each principal risk category is set out below:
In accordance with good stewardship, the Board does not inhibit sensible risk taking that is critical to growth. This approach is embedded in the risk culture of the Group which is guided by the Company’s Values (see page 75). The risk culture aligns with the strategy and objectives of the business and is embedded within the risk appetite.
ROLES & RESPONSIBILITIES Whilst the Board is ultimately responsible for the management of risk, the Group is structured in such a way that risk identification, assessment, management and monitoring occur at all levels of the Helical team. Roles and responsibilities with respect to risk are well established and the close working relationships existing between senior management and our Property Executives enhance our ability to manage our risks.
The identification of risk occurs primarily at Board level through application of Helical’s Risk Management Framework (see page 53). As part of this process, the Risk Register and corresponding Risk Heat Map (please see pages 54 to 59) are produced. The Board meets at least twice a year to assess the appropriateness of the Risk Register, taking into account the macro-economic environment, current projects and performance and past experience.
The Board considers both prevailing and emerging risks in the risk identification process. Horizon scanning is conducted, not just by the Board or senior management, but by every individual staff member. Team meetings are conducted every two weeks and provide a forum for information sharing with respect to emerging risks. Helical’s collaborative environment and flat management structure further support open discussion on future and emerging risks.
RISK CULTURE
Organisational structure
Risk culture
Behaviours
Personal ethics
Personal predisposition to risk
Risk management approach
The Board Has ultimate responsibility for risk management within the Group. The Board sets the risk appetite of the Group, establishes a risk management strategy and is responsible for maintaining a robust internal control system.
The Board Continually monitors and reviews the risk management strategy to ensure that it remains appropriate and consistent with the Group’s overall strategy and external market conditions.
The Audit and Risk Committee
Supports the Board by evaluating the effectiveness of the risk management procedures and internal controls throughout the year.
The Executive Committee
Is responsible for the day-to-day operational application of the risk management strategy and ensuring that all staff are aware of their responsibilities.
Helical’s management team
Runs the business in line with the risk management strategy established by the Board and reports to the Board on how it operates.
Both the small team size and the flat management structure allow the Executive Committee to have close contact with all aspects of the business and ensure that the identification and management of risks and opportunities are at the forefront of decision makers’ minds.
Individual asset managers
Are responsible for identifying and assessing risks relating to the properties they manage and reporting to the Executive Committee as appropriate.
All staff members Are responsible for complying with risk management procedures and internal control measures, reporting to the Executive Committee as necessary.
OVERSIGHT, IDENTIFICATION, ASSESSMENT AND MITIGATION OF RISKS AT A STRATEGIC LEVEL
OVERSIGHT, IDENTIFICATION, ASSESSMENT AND MITIGATION OF RISKS AT AN OPERATIONAL LEVEL
Risk management framework
Helical’s Risk Management Framework is made up of eight components which all function to create an effective system of risk management and internal control. It is through the application of the Risk Management Framework that clear procedures for risk identification, assessment, measurement, mitigation, monitoring and reporting are aligned with the Group’s strategic aims and the Board’s risk appetite.
STRATEGIC
FINANCIAL
OPERATIONAL
REPUTATIONALLOW MEDIUM HIGH
Tone from the top
Business as usual
Tone from the middle
Objective setting
Risk identification
Risk assessment
Risk response
Control activities
Monitoring
Information & communication
Board
Op
erat
iona
l mo
nito
ring
and
re
po
rtin
g r
esp
ons
ibili
ty Audit and Risk Committee
Executive Committee
Management team
Asset managers
All staff Stra
teg
ic im
ple
men
tati
on
and
co
mp
lianc
e re
spo
nsib
ility
Risk culture
Risk culture
Internal environment
GOVER
NA
NC
E
GOVERNA
NC
E
52 Helical plc Annual Report and Accounts 2021 53Helical plcAnnual Report and Accounts 2021S
TR
AT
EG
IC R
EP
OR
T

RISK MANAGEMENT CONTINUED
Like
liho
od
Impact
12
4
3
1
5
9
2
6
78
10
11 13
14
Mapping our Principal Risks
PRINCIPAL RISKS CHANGE
Strategic Risks
1 The Group's strategy is inconsistent with the market
2 The Group carries out significant development projects =
3 Property values decline/reduced tenant demand for space
4 Political risk
5 Risk of pandemic outbreak*
6 Sustainability risk =Financial Risks
7 Availability and cost of bank borrowing and cash resources =
8 Breach of loan covenants =Operational Risks
9 Employment and retention of key personnel and business relationships =
10 Reliance on external partners =
11 Health and safety risk =
12 Business disruption and cyber security
Reputational Risks
13 Poor management of stakeholder relations =
14 Non-compliance with prevailing legislation, regulation and best practice =
* This risk has been separately identified this year.
VIABILITY STATEMENT HELICAL’S LONG-TERM PROSPECTSWith over 35 years’ experience as a property company, the Group has navigated multiple property cycles. These cycles present challenges and opportunities and it has been through successfully responding to both that Helical has grown to become a highly respected London office developer and asset manager. During this time, it has also built an extensive network of trusted partners who provide support, capital and access to new opportunities.
The Group has a high quality portfolio, primarily located in growing areas of London, and is delivering modern space which appeals to occupiers who need to attract the best talent. Helical has an excellent relationship with the financial institutions who provide its debt and has long-term and flexible financing.
It is from this strong position that the Board has considered the Company’s future viability.
TIME PERIOD ASSESSMENTThe Directors have assessed the viability of the Group for a period of five years to March 2026, being the period for which the Board regularly reviews forecasts, and which encompasses the lifetime of the Group’s major development projects. The Board considers the future performance of the Group beyond five years, but less certainty exists over the forecasting assumptions beyond this period.
REVIEW PROCESSThe viability of the Group is reviewed throughout the year and through multiple channels, detailed below:
• The strategic direction of the Group is established by the Board once a year and is captured in the Business Plan which forms the basis of the detailed budgets and actions for the year;
• The Board and Audit and Risk Committee review the principal risks of the Group at least twice a year, reassessing the severity of each risk and determining the Group’s proposed response and planned mitigation;
• The five-year forecasts for the Group are updated and reviewed by the Board and Executive Committee on a quarterly basis; and
• Management reviews the short-term (three to twelve months) cash requirements of the Group on a monthly basis and cash balances and movements are monitored daily.
PRINCIPAL RISKS AND SENSITIVITY ANALYSISIn making its assessment, the Board considers the Group’s principal risks and assesses their combined potential impact in severe, but plausible, downside scenarios together with the likely effectiveness of mitigating actions that the Group has at its disposal.
The assessment included the following key assumptions:
• Rental income – whilst the Group has a WAULT of 6.9 years across its portfolio, both void and rent-free periods have been included where a lease term ends within the period of review;
• Debt financing – the Company’s primary source of financing is its £400m Revolving Credit Facility which expires in July 2024, however, this facility has two one-year extension options which have been assumed to have been exercised;
• Development and asset management – these activities require capital expenditure, and this has been included for both specific projects and general ongoing works; and
• Administration expenditure and finance costs – administration expenditure has been subject to inflationary increases. The hedging instruments the Group has in place mitigate the impact of any future changes to the interest base rate.
The most relevant risks and their potential impact, along with the sensitivity analysis performed, are highlighted below:
Risk areas Principal risks
Covid-19
The impact of Covid-19 is expected to have the most material effect in the next 12 months and is considered in the going concern review on page 142.
• Risk of pandemic outbreak
• Property values decline/reduced tenant demand for space
• Political risk
• Breach of loan covenants
• Health and safety risk
• Business disruption and cyber security
Based on the outcomes of the procedures outlined above and other matters considered by the Board, the Directors hold a reasonable expectation that the Group will be able to continue in operation and meet its liabilities as they fall due over the five-year period to 31 March 2026.
OUR PRINCIPAL RISKSHelical’s principal risks fall into the following categories: Strategic Risks, Financial Risks, Operational Risks, and Reputational Risks.
When identifying risks, each risk is linked to the Group’s strategic objectives: Growth, Property, Sustainability, Financing and People.
Risk severity involves assessing both the likelihood of a risk materialising and its potential impact. The Executive Committee assesses the risk severity and reports its assessment to the Board, which is based on:
• understanding the cause of the risk;
• an understanding of the resources at the Group’s disposal to mitigate the risk;
• estimating the probability of such a risk occurring, both pre and post mitigating actions; and
• an assessment of the quantitative and qualitative impact of such a risk materialising.
The severity levels determined by the Executive Committee are assessed by the Board.
The Board also reviews the mitigating actions to ensure they reduce the risk down to an acceptable level based on the Group’s risk appetite.
Risk Description Mitigating actions Changes in risk severity
STRATEGIC RISKSStrategic risks are external risks that could prevent the Group delivering its strategy. It is these risks which principally impact decision making with respect to the purchasing or selling of property assets.
The Group’s strategy is inconsistent with the market
Link to Strategy Growth
YoY change
Changing market conditions could hinder the Group’s ability to buy and sell properties envisioned in its strategy. The location, size and mix of properties in Helical’s portfolio determine the impact of the risk.
The Covid-19 pandemic has accelerated the move to more agile working practices. Whilst it is clear that there is an important role for the modern office, the full impact of the shift is yet to be determined.
If the Group’s chosen markets underperform, the impact on the Group’s liquidity, investment property revaluations and rental income is greater.
Management constantly monitors the market and makes changes to the Group’s strategy in light of market conditions. The Group conducts an annual strategic review and maintains rolling forecasts, with inbuilt sensitivity analysis to model anticipated economic conditions.
The Group’s management team is highly experienced and has a strong track record of understanding the property market.
Due to the Group’s small management team, strategic change can be implemented quickly.
As part of the Government’s response to Covid-19, non-essential workers (including office staff) were advised to work from home. The Government roadmap announced has resulted in a clearer path to the end of the pandemic but there remains uncertainty over the long-term impact. As such, this risk has increased.
Risks arising from the Group’s significant development projects
Link to Strategy Property
YoY change =
The Group carries out significant development projects over a number of years and is therefore exposed to fluctuations in the market and tenant demand levels over time.
Management carefully reviews the risk profile of individual developments and in some cases builds properties in several phases to minimise the Group’s exposure to reduced demand for particular asset classes or geographical locations over time. The Group carries out developments in partnership with other organisations and pre-lets space to reduce development risk, where considered appropriate.
The Group currently has one ongoing development at 33 Charterhouse Street, London EC1 and has made significant progress in fully letting Kaleidoscope, London EC1.
Property values decline/reduced tenant demand for space
Link to Strategy Property
YoY change
The property portfolio is at risk of valuation falls through changes in market conditions, including underperforming sectors or locations, lack of tenant demand or general economic uncertainty.
The Group’s property portfolio has tenants from diverse industries, reducing the risk of over-exposure to one sector. We carry out occupier financial covenant checks ahead of approving leases in order to limit our exposure to tenant failure. Management reviews external data, seeks the advice of industry experts and monitors the performance of individual assets and sectors in order to dispose of non-performing assets and rebalance the portfolio to suit the changing market. Management regularly models different property revaluation scenarios through its forecasting process in order to prepare a considered approach to mitigating the potential impact.
Covid-19 has resulted in a high level of macro-economic uncertainty which is adversely impacting many businesses, particularly retail and leisure.
A long-term move to increased home working could reduce demand for office space.
The letting of Kaleidoscope in March 2021 has restored some confidence in the desirability of the London office market and as a result the risk level has reduced.
54 Helical plc Annual Report and Accounts 2021 55Helical plcAnnual Report and Accounts 2021S
TR
AT
EG
IC R
EP
OR
T

RISK MANAGEMENT CONTINUED
Risk Description Mitigating actions Changes in risk severity
Political risk
Link to Strategy Growth
YoY change
There is a risk that regulatory and tax changes could adversely affect the market in which the Group operates and changes in legislation could lead to delays in receiving planning permission.
With an agreement reached between the United Kingdom and the European Union in December 2020 there is a clearer picture as to how the United Kingdom will be impacted. However, we are yet to see how financial services will be impacted and the longer-term effect of the agreement on the case for investment in the UK.
Covid-19 has resulted in the Government taking significant measures to respond to this crisis, including providing high levels of financial support and proposing future taxation increases.
Management seeks advice from experts to ensure it understands the political environment and the impact of emerging regulatory and tax changes on the Group. It maintains good relationships with planning consultants and local authorities. Where appropriate, management joins with industry representatives to contribute to policy and regulatory debate relevant to the industry.
Covid-19 has resulted in the Government taking significant measures to respond to this crisis.
The agreement reached between the United Kingdom and the European Union has reduced some of the uncertainties surrounding the UK leaving the European single market, and as a result the risk level has been reduced.
Risk of pandemic outbreak
Link to Strategy Growth
YoY change New risk
A pandemic outbreak could have a considerable impact on the global economy, as well as that of our business and our stakeholders.
In the event of a pandemic:
• The Executive Committee will be tasked with the daily monitoring and managing of the risk, and will focus on the impact on property locations, the business and supply chain.
• Regular Board discussions will be held during any pandemic to review the Group’s response and mitigating actions.
• Enhanced engagement with our stakeholders will be conducted (particularly with occupiers, contractors, shareholders and employees).
• There will be continuous review of Government guidelines and emerging practice, with risk assessments undertaken as control measures change.
• Guidance will be issued to our staff, occupiers and contractors on how to protect themselves and others.
The Group ensures that it has adequate Business Continuity Plans and IT Business Continuity Plans in place to enable remote working for all staff.
Testing of business resilience and risk planning is conducted throughout the year.
Given the scale of the impact of Covid-19, the risk of pandemic outbreak has been recognised as a separate strategic risk for the Group.
Sustainability risk
Link to Strategy Sustainability
YoY change =
The Group is exposed to sustainability risks such as climate and legislation changes related to ESG issues.
The Group has a Sustainability Committee, chaired by Matthew Bonning-Snook, which reviews the Group’s approach and strategy. The Committee sets appropriate targets and KPIs which are reported on annually.
The Group benchmarks its ESG reporting against various industry indicators and instructs an external expert to perform gap analysis on its performance.
The Sustainability Strategy and a key performance review document clearly demonstrate the Group’s approach to sustainability and the associated risks.
We recognise that the risks associated with the impact of carbon emissions and climate change continue to increase and that businesses that are not responding to these risks are likely to experience operational and reputational damage.
Risk Description Mitigating actions Changes in risk severity
FINANCIAL RISKSFinancial risks are those that could prevent the Group from funding its chosen strategy, both in the long and short term.
Availability and cost of bank borrowing and cash resources
Link to Strategy Financing
YoY change =
The inability to roll over existing facilities or take out new borrowing could impact on the Group’s ability to maintain its current portfolio and purchase new properties. The Group may forego opportunities if it does not maintain sufficient cash to take advantage of them as they arise.
The Group is at risk of increased interest rates on unhedged borrowings.
The Group maintains a good relationship with many established lending institutions and borrowings are spread across a number of these.
Funding requirements are reviewed monthly by management, who seek to ensure that the maturity dates of borrowings are spread over several years.
Management monitors the cash levels of the Group on a daily basis and maintains sufficient levels of cash resources and undrawn committed bank facilities to fund opportunities as they arise.
The Group hedges the interest rates on the majority of its borrowings, effectively fixing or capping the rates over several years.
The Group has £154.4m of cash and £7.8m of cash held in joint venture with £55.1m available to drawdown on bank facilities at 31 March 2021.
Breach of loan covenants
Link to Strategy Financing
YoY change =
If the Group breaches debt covenants, lending institutions may require the early repayment of borrowings.
Covenants are closely monitored throughout the year. Management carries out sensitivity analyses to assess the likelihood of future breaches based on significant changes in property values or rental income.
The impact of Covid-19, and the lockdown response in particular, has put businesses under cash flow pressure. This in turn may adversely impact rent collection therefore the income covenants on our loan facilities may come under pressure.
OPERATIONAL RISKSOperational risks are internal risks that could prevent the Group from delivering its strategy.
Employment and retention of key personnel and business relationships
Link to Strategy People
YoY change =
The Group’s continued success is reliant on its management and staff and successful relationships with its joint venture partners.
The senior management team is very experienced with a high average length of service. The Nominations Committee and Board review succession planning issues and remuneration is set to attract and retain high calibre staff. Staff are encouraged to undertake personal development and training courses, supported by the Company.
The Group nurtures well established relationships with joint venture partners, seeking further projects where it has had previous successful collaborations.
The risk has remained broadly similar due to high staff retention levels and the maintenance of strong business relationships.
Reliance on external partners
Link to Strategy People
YoY change =
The Group is dependent on a number of external third parties to ensure the successful delivery of its development programme and asset management of existing assets. These include;
• Contractors and suppliers;
• Consultants;
• Managing agents; and
• Legal and professional teams.
The Group actively monitors its development projects and uses external project managers to provide support. Potential contractors are vetted for their quality, health and safety record and financial viability prior to engagement.
The Group has a highly experienced team managing its properties, who regularly conduct on-site reviews and monitor cash flows against budget. The Group seeks to maintain excellent relationships with its specialist professional advisors, often engaging parties with whom it has successfully worked previously. Management actively monitors these parties to ensure they are delivering the required quality on time and strong working relationships are maintained.
No change has been noted or is expected.
56 Helical plc Annual Report and Accounts 2021 57Helical plcAnnual Report and Accounts 2021S
TR
AT
EG
IC R
EP
OR
T

Risk Description Mitigating actions Changes in risk severity
REPUTATIONAL RISKSReputational risks are those that could affect the Group in all aspects of its strategy.
Poor management of stakeholder relations
Link to Strategy Growth
YoY change =
The Group risks suffering from reputational damage resulting in a loss of credibility with key stakeholders including Shareholders, analysts, banking institutions, contractors, managing agents, tenants, property purchasers/sellers and employees.
The Group believes that successfully delivering its strategy and mitigating its principal risks should protect its reputation.
The Group regularly reviews its strategy and risks to ensure it is acting in the interests of its stakeholders.
The Group maintains a strong relationship with investors and analysts through regular meetings.
Management closely monitors day-to-day business operations and the Group has a formal approval procedure for all press releases and public announcements.
A Group Disclosure Policy and Share Dealing Code, Policy & Procedures have been circulated to all staff in accordance with the EU Market Abuse Regulation (MAR).
This risk remains and is expected to remain at the same level.
Non-compliance with prevailing legislation, regulation and best practice
Link to Strategy Growth
YoY change =
The nature of the Group’s operations and markets exposes it to financial crimes risks (including bribery and corruption risks, money laundering and tax evasion) both internally and externally within the supply chain.
The Group is exposed to the potential risk of acquiring or disposing of a property where the owner/purchaser has been involved in criminal conduct or illicit activities.
The Group would attract criticism and negative publicity were any instances of modern slavery and human trafficking identified within its supply chain.
The Group would attract criticism and negative publicity if instances of non-compliance with GDPR and the Data Protection Act 2018 were identified. Non-compliance may also result in financial penalties.
The Group’s anti-bribery and corruption and whistleblowing policies and procedures are reviewed and updated annually and emailed to staff and displayed on our website. Projects with greater exposure to bribery and corruption are monitored closely.
The Group avoids doing business in high risk territories. The Group has related policies and procedures designed to mitigate bribery and corruption risks including:
• Know Your Client checks;
• due diligence processes;
• capital expenditure controls;
• contracts risk assessment procedures; and
• competition and anti-trust guidance.
The Group engages legal professionals to support these policies where appropriate.
All employees are required to complete anti-bribery and corruption training and to submit details of corporate hospitality and gifts received.
All property transactions are reviewed and authorised by the Executive Committee.
Our Modern Slavery Act statement, which is prominently displayed on our website, gives details of our policy and our approach.
The Group monitors its GDPR and Data Protection Act 2018 compliance to ensure appropriate safeguards, policies, procedures, contractual terms and records are implemented and maintained in accordance with the regulation.
This risk remains and is expected to remain at the same level.
RISK MANAGEMENT CONTINUED
Risk Description Mitigating actions Changes in risk severity
Health and safety risk
Link to Strategy Property
YoY change =
The nature of the Group’s operations and markets expose it to potential health and safety risks both internally and externally within the supply chain.
The Group reviews and updates its Health & Safety Policy regularly and it is approved by the Board annually. Contractors are required to comply with the terms of our Health & Safety Policy and the Group engages an external health and safety consultant to review contractor agreements prior to appointment and ensures they have appropriate policies and procedures in place, then monitors the adherence to such policies and procedures throughout the project’s lifetime.
The Executive Committee reviews the report by the external consultant every month and the Board reviews them at every scheduled meeting. The internal asset managers carry out regular site visits.
Whilst the level of the Group’s development activity is expected to be lower, Covid-19 continues to present additional challenges in maintaining safe working environments.
Business disruption and cyber security
Link to Strategy Property
YoY change
The Group relies on Information Technology to perform effectively and a cyber-attack could result in IT systems being unavailable, adversely affecting the Group’s operations.
Commercially sensitive and personal information is electronically stored by the Group. Theft of this information could adversely impact the Group’s commercial advantage and result in penalties where the information is governed by law (GDPR and the Data Protection Act 2018).
The Group increasingly employs IT solutions across its property portfolio to ensure its buildings are “smart”.
The Group is at risk of being a victim of social engineering fraud.
An external event such as extreme weather, environmental incident, power shortage, pandemic or terrorist attack could cause significant damage, disruption to the business or reputational damage.
The Group engages and actively manages external Information Technology experts to ensure IT systems operate effectively and that we respond to the evolving IT security environment. This includes regular off-site backups and a comprehensive disaster recovery process. The external provider also ensures the system is secure and this is subject to routine testing including bi-annual disaster recovery tests and annual Cyber Essential Plus Certification.
There is a robust control environment in place for invoice approval and payment authorisations including authorisation limits and a dual sign off requirement for large invoices and bank payments.
The Group provides training and performs penetration testing to identify emails of a suspicious nature, ensuring these are flagged to the IT providers, and ensures employees are aware they should not open attachments or follow instructions within the email.
The Group has a disaster recovery plan, on-site security at its properties and insurance policies in place in order to deal with any external events and mitigate their impact.
The outbreak and spread of Covid-19 has created global economic uncertainty and the significantly increased impact and likelihood of this risk continues. Remote working increases the risk to cyber security. As businesses have adapted to these challenges and the Covid-19 outlook has improved, this risk has reduced.
58 Helical plc Annual Report and Accounts 2021 59Helical plcAnnual Report and Accounts 2021S
TR
AT
EG
IC R
EP
OR
T

“It is imperative that sustainability is at the core of all activities at Helical. As owners and creators of exciting design led buildings, we acknowledge that our activities have a direct and indirect environmental, social and economic impact. We also recognise that there is a climate crisis and, as a responsible business, we need to ensure that we are minimising our impact on the environment. As we move towards a net zero carbon world, we are in a position whereby we can drive change in the way buildings are built, managed and operated. By creating measurable carbon targets, and adopting low carbon technologies and green energy contracts, Helical is well placed to become a net zero carbon business in the future.”
Focus onSustainability
SUSTAINABILITY AT HELICAL
MATTHEW BONNING-SNOOKProperty Director & Chair of the Sustainability Committee
MONEY RAISED BY HELICAL TEAM FOR LANDAID £1,500
(2020: n/a)
ANNUAL CHARITY DONATIONS £45,000(2020: £45,000)
REDUCTION IN OUR LIKE-FOR-LIKE PORTFOLIO GHG EMISSIONS (SCOPE 1 AND 2)
17%(2020: 4%)
REDUCTION IN EMBODIED CARBON AT 33 CHARTERHOUSE STREET
20%(2020: n/a)
STAFF FELT POSITIVE ABOUT RETURNING TO THE OFFICE 92%
(2020: n/a)
NUMBER OF MHFA FIRST AIDERS 4(2020: n/a)
Our Environment• Transition to a low carbon
business
• Buy, use and re-use resources efficiently
• Released “Designing for Net Zero”
• Introduction of a Carbon Champion
• Helical becomes a “carbon neutral” business
Our Communities• Bring social, economic and
environmental benefits to the areas where we operate
• Design and operate our buildings to support health and wellbeing
• Green Groups set up with tenants
• Helical team participated in the LandAid QuaranTen event
Our People• Attract and retain the best people
• Maintain strong relationships with our business partners
• Staff interviews and feedback session held
• Mental Health First Aid (MHFA) training
60 Helical plc Annual Report and Accounts 2021 61Helical plcAnnual Report and Accounts 2021S
TR
AT
EG
IC R
EP
OR
T

SUSTAINABILITY AT HELICAL CONTINUED
3*
B
SUSTAINABILITY REPORTSPlease refer to our Sustainability Performance Report 2021 for more details on how we have performed against the targets set in “Built for the Future”.
62 Helical plc Annual Report and Accounts 2021 63Helical plcAnnual Report and Accounts 2021S
TR
AT
EG
IC R
EP
OR
T
In June 2020, we launched our Sustainability Strategy “Built for the Future”. This strategy set out the Company’s long-term vision encompassing “Our Environment, Our Communities and Our People” and will support the business in becoming truly sustainable. Underpinning its focus areas, our strategy identifies six key priorities which drive our long-term vision for sustainability:
• Transition to a low carbon business;
• Buy, use and re-use resources efficiently;
• Bring social, economic and environmental benefits to the areas in which it operates;
• Design and operate its buildings to support health and wellbeing;
• Attract and retain the best people; and
• Maintain strong relationships with our business partners.
Helical believes that by integrating these priorities across its business, supply chain and its stakeholders, it will create long-term value and, crucially, will ensure Helical is “Built for the Future”.
The United Nations has set 17 Sustainable Development Goals (“SDGs”) which articulate the key challenges facing the globe. We have worked to align our key priorities with those SDGs relevant to our business and our industry. We have, therefore, mapped our key priorities and related objectives against the following United Nations SDGs:
Our approach to a sustainable future
21
20
20
20
20
20
20
21
21
21
A year of progressJUNE 2020Release of our first Sustainability Performance Report
DECEMBER 2020
CDP Score awarded
MARCH 2021The Allianz funding facility for 33 Charterhouse Street certified as a “Green Loan”
NOVEMBER 2020
GRESB Score awarded, which is a significant improvement from 2020
FEBRUARY 2021We become a signatory to HRH The Prince of Wales’ “Terra Carta”, a charter that puts sustainability at the heart of the private sector
APRIL 2021Release of “Designing for Net Zero” – our first low carbon building design guide
MAY 2021Joined the UK Green Building Council
MAY 2021Sue Farr appointed as the designated Non-Executive Director for ESG and Sustainability
In September 2019, a Sustainability Committee was formally appointed by the Board. The Committee is chaired by Matthew Bonning-Snook, our Property Director, and meets on a quarterly basis to review and set targets, policies and our overall approach to sustainability. The Committee reports to both the Executive Committee and the Board.
MEMBERSMatthew Bonning-Snook Property Director & Chair of Committee
Laura Beaumont Head of Sustainability
John Inwood Head of Asset Management
Pavlos Clifton Senior Development Executive
Lois Robertson Operations Manager
Sustainability Committee
SilverSEPTEMBER 2020
Award received for EPRA Sustainability Best Practice Recommendations
OutstandingAUGUST 2020
rating received for the UK’s first BREEAM 2018 New Construction rating for the design stage of our 33 Charterhouse Street development
JUNE 2020Release of “Built for the Future” – our sustainability strategy

SUSTAINABILITY AT HELICAL CONTINUED
ENERGY EFFICIENCYWe have continued to roll out a number of energy efficiency improvements across our assets in the reporting period. This includes:
• Increased coverage of LED lighting;
• Developed existing energy management practices;
• Increased the coverage of climate and lighting controls;
• Reviewed options for Low and Zero Carbon (LZC) technologies, such as photovoltaics; and
• Actively managed ventilation and heating strategies.
At one of our sites we have performed a pilot study into software integration of the BMS and control systems with an energy platform. The objective is to improve the efficiency of the asset in delivering improved comfort levels, and operational and energy savings. We intend to review the success of this pilot with a view to rolling this out across the portfolio.
OUR METHODOLOGYFor our SECR disclosure we have used the operational control consolidation method, as this best reflects our property management arrangements and our influence over energy consumption. Included in our operational control data are emissions and energy usage from our managed properties (including 100% of emissions from joint venture properties) and head office usage. Where we have purchased energy, which is sub-metered to occupiers, this is itemised separately. We have included usage or emissions from our development sites and refurbishments sites as these are still considered under our operational control. We have used DEFRA Environmental Reporting Guidelines and the Greenhouse Gas Protocol to calculate our emissions.
Our full Sustainability Performance Report 2021, aligned with EPRA Sustainability Best Practice Recommendations, can be found on our website.
THIRD PARTY VERIFICATIONWe appointed Avieco Ltd to perform third party verification of our SECR disclosure for the year 1 April 2020 to 31 March 2021.
Based on the verification procedures detailed in their full statement, Avieco have found no evidence to suggest that Helical’s SECR disclosure and associated environmental indicators are materially incorrect and confirm they have been prepared in accordance with the relevant guidance and legislation. This conclusion should be read in conjunction with Avieco’s full ISO 14064:3 limited verification statement available in the Sustainability Performance Report 2021 on our website.
CARBON NEUTRAL BUSINESSAs we continue to investigate the best methods to reduce carbon emissions at our existing assets and our development projects, we have elected to address the emissions we produce at a corporate level. We have worked hard to reduce our head office and associated emissions over the past three years by 54%, and this has been achieved by championing energy saving initiatives at our head office and replacing our company vehicles with pure electric or hybrid models. We have then offset our residual carbon emissions using Gold Standard verified credits as recommended by the UK GBC. We have calculated our emissions for the year to include head office electricity, water, waste and company car mileage, and over the next year we will extend our reporting scope to include all staff travel, and head office procurement.
STREAMLINED ENERGY AND CARBON REPORTING (SECR) DISCLOSUREOur SECR disclosure presents our carbon footprint across Scopes 1, 2 and 3, together with an appropriate intensity metric and our total energy use of electricity and gas.
2021 2020
Gross internal floor area (m2) 161,759 167,333 Scope 1 emissions and direct energy use
Emissions associated with combustion of fuel including company cars (tCO2e) 860 618 Emissions associated with operation of facilities (refrigerant gas) (tCO2e) – 24 Energy use of combustion of fuel (kWh) 4,274,003 3,348,280 Scope 2 emissions and indirect energy use
Location based emissions associated with purchased electricity, heat, steam and cooling usage (tCO2e) 1,310 1,765 Location based emissions associated with head office electricity usage (tCO2e) 23 23 Energy use of purchased electricity, heat, steam and cooling (kWh) 6,427,922 6,905,587 Energy use of electricity at head office including electric vehicles (kWh) 96,009 91,910 Emissions and energy use totals
Absolute emissions Scope 1 & 2 (tCO2e) 2,193 2,431 Total energy use relating to Scope 1 & 2 (kWh) 10,797,934 10,345,777 Intensity measures
Emissions per m2 gross internal area (tCO2e/m2/year) 0.014 0.015 Energy use per m2 gross internal area (kWh/m2/year) 66.75 61.83 Emissions per £M revenue (tCO2e/£M) 85.66 87.44 Emissions and energy use totals like-for-like
Absolute emissions on a like-for-like basis (tCO2e) 1,281 1,487 Energy use on a like-for-like basis (kWh) 6,052,266 6,546,421Intensity measures like-for-like
Emissions per m2 gross internal area on a like-for-like basis (tCO2e/m2/year) 0.048 0.058Energy use per m2 gross internal area on a like-for-like basis (kWh/m2/year) 229.82 258.11
* Scope 3 emissions are reported separately in our Sustainability Performance Report.
64 Helical plc Annual Report and Accounts 2021 65Helical plcAnnual Report and Accounts 2021S
TR
AT
EG
IC R
EP
OR
T
In recognition of the current climate change crisis and Helical’s commitment to transition to a low carbon business, the Company has set the following short to medium-term targets:
• All new developments to be net zero carbon in operation by 2025;
• Reduce the embodied carbon in all new developments by 20% against the current RIBA benchmark; and
• Reduce the operational carbon emissions of its existing portfolio by 25% by 2025.
The built environment is estimated to contribute around 40% of the UK’s carbon emissions and it is therefore imperative that the real estate industry addresses its carbon footprint.
Our approach to decarbonising our business starts with maximising the energy efficiency of our buildings. We already purchase 100% of our electricity and gas on renewable tariffs for our office buildings, however, alongside this, we need to significantly reduce consumption. During the year, our like-for-like energy consumption decreased by 17%. However, to enable us to deliver sustained year on year improvements in energy efficiency, and to meet our energy intensity and carbon intensity reduction targets, we will need to work closely with our occupiers and supply chain partners to reduce the amount of energy we collectively consume.
As a developer, embodied carbon accounts for a significant proportion of a new development’s carbon footprint. We have therefore committed to undertake a full life cycle carbon assessment for all new developments to accurately track embodied carbon. Our ambition to reduce embodied carbon is further endorsed by the release of our step by step guide to designing low carbon and resilient buildings: “Designing for Net Zero”. This guide is intended for design teams to ensure carbon efficiencies are being interrogated at every stage of a development.
Maintaining year on year reductions in embodied carbon will only be achieved through the use of new technology, alternative materials and innovative building techniques. Only once building energy efficiency measures, embodied carbon reductions and renewable energy installations have been addressed will we consider offsetting the residual carbon.
Key priorities — Transition to a low carbon business
— Buy, use and re-use resources efficiently
TERRA CARTAUpon its launch in January 2021, Helical signed up to HRH The Prince of Wales’ Terra Carta, which forms part of HRH’s Sustainable Markets Initiative and works to put nature, people and the planet at the heart of global business.
The Terra Carta lists ten action points for the decade and aims to provide an integrated roadmap towards an inspiring, inclusive, equitable, prosperous and sustainable future. The Charter’s roadmap is designed to harness the power of nature, combining it with the transformative power, innovation, and resources of the private sector.
We have pledged to support the Terra Carta, its principles and action articles, as they complement and echo the existing sustainability commitments and aspirations of the business. This includes transitioning into a net zero carbon business and will be supported by the release of “Designing for Net Zero”.
Our
Env
iron
men
t

SUSTAINABILITY AT HELICAL CONTINUED
66 Helical plc Annual Report and Accounts 2021 67Helical plcAnnual Report and Accounts 2021S
TR
AT
EG
IC R
EP
OR
T
THE TASK FORCE ON CLIMATE-RELATED FINANCIAL DISCLOSURES (TCFD)This is the first year we have elected to incorporate the findings of the Task Force on Climate related Financial Disclosures into our Annual Report. The timeline below sets out the steps we will be taking to ensure we are fully compliant with the recommendations by 2022.
A summary of our approach to compliance, in line with the TCFD guidelines, is provided below. For more on our approach to risk see pages 52 to 59 and pages 88 to 93 for Board activities. A more detailed disclosure of TCFD is available on our website with our Sustainability Performance Report 2021.
Year to 31 March 2020 Year to 31 March 2021 Year to 31 March 2022
Governance and Strategy
Risk Management Strategy and Risk Management
Established a Sustainability Committee with Board oversight.
Completed climate scenario analysis.
Audit asset level exposure.
Develop robust mitigation and resilience strategy.
Implement mitigation targets and metrics.
STRATEGYDescribe the climate-related risks and opportunities the organisation has identified over the short, medium and long term.
Horizon Period Definition
Short term 0-3 years Defined risks and opportunities are generally specific in nature and have a higher impact to the business today.
Medium term 3-5 years The period for which the Group regularly reviews forecasts and which will often encompass the lifetime of major development projects.
Long term 5-15 years More broader risks which have a wider impact on the Group’s strategy and will help define how the Group will look to operate in the long term.
Describe the impact of climate-related risks and opportunities on the organisation’s businesses, strategy and financial planning.
As a property developer and asset manager, climate-related issues affect the way we design our new developments and how we manage our existing assets effectively.
To help us incorporate climate-related resilience into our development assets, we have published a guide “Designing for Net Zero”. This guide details our ten-step approach to designing low carbon and climate resilient developments and considers post occupation performance and carbon offsetting strategies.
Describe the resilience of the organisation’s strategy, taking into consideration different climate-related scenarios, including a 2°C or lower scenario.
Physical climate-related risks, such as increasing temperatures, could increase the cost of maintaining and managing our buildings, e.g. utility costs and greenhouse gas (“GHG”) emissions. As a property developer and operator, we have a significant focus on reducing energy usage and carbon, ensuring the efficient operation of our buildings. Our targets support our ambition to transition to a low carbon business by 2025.
RISK MANAGEMENTDescribe how processes for identifying, assessing, and managing climate-related risks are integrated into the organisation’s overall risk management.
The Executive Committee, Audit and Risk Committee and the Board formally review the Group’s principal risks. This includes climate-related risks, including their likelihood, impact and mitigating controls, which are managed by the Sustainability Committee.
METRICS AND TARGETSDisclose the metrics used by the organisation to assess climate-related risks and opportunities in line with its strategy and risk management process.
We report on an extensive range of consumption and intensity metrics relating to energy, carbon, waste and water in our Sustainability Performance Report 2021.
We disclose Scope 1, Scope 2 and, if appropriate, Scope 3 GHG emissions, and the related risks.
Metrics in connection with climate-related risks including Scope 1, 2 and 3 emissions are reported within our Streamlined Energy and Carbon Reporting (SECR) on page 65 and within our Sustainability Performance Report 2021 on our website which is aligned with EPRA Sustainability Best Practice Recommendations.
Describe the targets used by the organisation to manage climate-related risks and opportunities and performance against targets.
We have developed a set of targets which are aligned with the Science Based Targets initiatives (SBTi), and we have also set out an embodied carbon reduction target. These targets, along with other relevant KPIs, are set out in our Sustainability Strategy “Built for the Future” which can be found on our website.
GOVERNANCEDescribe the Board’s oversight of climate-related risks and opportunities.
Sustainability updates are regularly provided at scheduled Board meetings with formal updates provided on a six-monthly basis. Sue Farr has also been appointed the designated Non Executive Director for ESG matters.
Describe management’s role in assessing and managing climate-related risks and opportunities.
The Sustainability Committee, chaired by our Property Director, Matthew Bonning-Snook, meets quarterly and is attended by several members of the executive team. Regular sustainability updates are also provided to the Executive Committee and Board.
“ Climate change is one of the greatest issues businesses are currently facing. As a listed commercial property developer, we have a duty to drive transparency, accountability and responsibility in our reporting. By supporting the TCFD recommendations, we are actively demonstrating our commitments to being a sustainable business.”

SUSTAINABILITY AT HELICAL CONTINUED
£1,500Raised by Helical team for LandAid QuaranTen
68 Helical plc Annual Report and Accounts 2021 69Helical plcAnnual Report and Accounts 2021S
TR
AT
EG
IC R
EP
OR
T
Key priorities — Bring social, economic and environmental
benefits to the areas in which we operate
— Design and operate our buildings to support health and wellbeing
Investing in local initiatives and supporting communities maximises social value and creates places that are sustainable for the long term. We monitor and manage the social impact of our development activities, ensuring that we are bringing a positive social, economic and environmental impact to the area. This includes creating a calendar of events and initiatives to ensure we are positively engaging with local residents, schools, community groups and businesses, issuing monthly newsletters to those impacted by our development activities and supporting local charities.
The Covid-19 pandemic has highlighted the importance of health and wellbeing, with both communities and tenants placing a much greater value on their access to green spaces, bio-diversity and improved air quality. For our existing portfolio we are working with our building managers to ensure that relevant and applicable health and wellbeing aspects are considered in an integrated and inclusive way. These include:
• Indoor air quality reviews;
• Access to mental health first aid trainers;
• Facilitation of building specific Green Group meetings; and
• Calendar of wellness events.
Our approach to health and wellbeing is not limited to our buildings. We actively promote initiatives to support the health and wellbeing of our people, local communities and supply chain partners, working to support mental health initiatives and ensure ethical labour practices. On page 18, you will find a case study on 33 Charterhouse Street which highlights how we embed these aspirations during a development project.
SUSTAINABILITY AT HELICAL CONTINUED
Our
Com
mun
itie
s THIS IS FOR LANDAID In July 2020 LandAid were unable to hold their annual 10k run fundraising event so instead opted to hold the LandAid QuaranTEN where participants could run or cycle 10 miles or 10 kilometres or walk 10,000 steps.
Thirteen members of the Helical team “stepped up” and along with family members raised a fantastic £1,500 by running, walking and pedalling their way around their local areas. In true British Summertime tradition conditions varied from hot to windy to torrential rain but heroic performances prevailed throughout and generous sponsors supported everyone’s efforts.
Altogether more than 760 individuals from within the property industry participated in the event and a grand total of over £120,000 was raised to support LandAid’s work to end youth homelessness.
“ After participating in the LandAid run for several years I knew how special the atmosphere was during the race. Doing the run “virtually” last year was tough without the real life support of colleagues, friends and family but somehow it made us all more determined to come together and raise money for a great cause. I even managed a personal best!”
LESLEY DODD Senior Financial Accountant
Number of individuals at Helical that participated in LandAid QuaranTEN
13

ExecutiveDirectors
3
Executives
6
9
All sta�
15
13
Male Female
SUSTAINABILITY AT HELICAL CONTINUED
“ I’m so glad I volunteered to do this training, not only was it incredibly comprehensive, but it also gave an insight as to how easy it can be to miss the warning signs that someone may be experiencing mental ill health. It is a subject that is spoken about at length in the media and I was really pleased to see that, even though Helical is a small company, it takes wellbeing incredibly seriously. It is clear that Helical is committed to eliminating the stigma and encouraging an open culture when it comes to mental health.”
MENTAL HEALTH FIRST AID TRAINING Our employees’ wellbeing remains fundamental to supporting our high performing Culture. In recognition of our commitment to health and wellbeing in the workplace, in March 2021, four employees participated in mental health training, achieving a level three qualification in Mental Health First Aid in the Workplace. This two-day training course demonstrates how to look out for warning signs of poor mental health and how to offer colleagues appropriate support in accessing professional help where required.
70 Helical plc Annual Report and Accounts 2021 71Helical plcAnnual Report and Accounts 2021S
TR
AT
EG
IC R
EP
OR
T
Our
Peo
ple Not only do we offer our staff a competitive
remuneration and benefits package, we also support part-time, job-sharing and flexible working requests where possible. During the year under review, 17.8% of the workforce carried out their roles on a part-time basis in order to meet family commitments. We believe this competitive approach to remuneration, alongside an attractive working environment, has continued to keep staff turnover low at 3.6%, with an average length of service of 11.0 years.
To ensure a highly skilled and experienced team, Helical continues to evaluate training needs in line with business objectives. Our employees are actively encouraged to attend training that enhances their knowledge and benefits the business. Over the year, our staff undertook 950 hours of training and development – an average of 4.5 days per employee. We promote wellbeing through a number of benefits including a paid-for gym membership, medical insurance, a cycle-to-work scheme and the availability of fruit and healthy snacks at the office. As Helical operates with a small team, our ability to establish excellent long-term relationships with our advisors, agents and other suppliers is very important. As part of this, fair treatment of suppliers remains a key priority for Helical and the Group’s policy is to settle all agreed liabilities as soon as possible and within the terms established with each supplier.
Total number of staff as at 31
March 2021
Average length of
service (years)
Executive Directors 3 26.8Executives 15 8.7All employees 28 11.0
Key priorities — Attract and retain the best people
— Maintain strong relationships with our business partners
HEALTH AND SAFETYHelical has a corporate culture that is committed to the prevention of injuries and ill health to its employees or other people that may be affected by its activities. The Group’s Health & Safety Policy reflects this commitment and is a core component of Helical’s culture. The Board of Directors and senior executives are responsible for implementing this policy and they look to ensure that health and safety considerations are always given priority in planning and in day-to-day activities.
• The Group’s Health & Safety Policy was last reviewed and updated in February 2021 to reflect the latest legislative and regulatory developments. Training of Helical staff in the updated Health & Safety Policy and supporting the construction design and management requirements has been undertaken during the reporting year.
• The Group’s Health & Safety Policy can be found on the Company’s website and a summary of performance for the active sites is below. This is based on all the data that has been made available to us.
• Helical has delivered nearly three million hours of construction during the year with no fatalities or major accidents and only four RIDDOR reportable incidents. The majority of Helical projects are managed by principal contractors holding OHSAS 18001 certification and that maintain 100% Construction Skills Certification Scheme (CSCS) accreditation for all full time and subcontracted staff. Further details on our Health and Safety performance can be found within our Sustainability Performance Report.
LAURA BEAUMONTMental Health First Aider
Percentage of staff that felt positive about returning to the office
92%Percentage of staff that still feel that our core values: Integrity, Excellence, Collaboration, Creative, Dynamic, Sustainable accurately represent our Culture/business
85%
Percentage of staff that felt they were well supported while working from home
88%SUPPORTING OUR STAFF For the majority of the past year, our staff have navigated the challenges of working from home, juggling work-life balance and in many cases acting as live-in teachers. A fundamental part of our company Culture is the ability to come together as a group to collaborate, inspire and feel part of one team. This has proven to be incredibly difficult over the past 12 months and we have had to adapt the ways we socialise and communicate with our staff.
It was important to us that our staff felt supported and there was a channel of communication whereby thoughts and concerns could be raised. In response to this we carried out staff interviews with every member of staff in both May 2020 and March 2021. Detailed responses to these interviews can be found on page 81 within the Governance Review, however the interviews highlighted that staff were missing the culture of being in the office and being able to connect with other colleagues. Throughout the year we held a number of “virtual” social events, including a wine and cheese tasting night, a virtual treasure hunt and a 10K fundraiser for LandAid. As we return to the office we are looking forward to rekindling our team spirit and again being part of a culture that makes Helical so unique.
Helical has a small core team but works closely with trusted partners across multiple disciplines. Our success is built on the skills of our staff and therefore finding, developing, rewarding and retaining our people is a key element of our corporate strategy.
At Helical we encourage an open and inclusive culture as we believe this creates a collaborative and focused approach to achieving the Group’s aims and aspirations, encouraging individuals to proactively suggest ideas and opportunities for the benefit of the business and the people. This culture is further supported and encouraged through Helical’s Values, further details of which are set out in the Governance Review.
Diversity is important in helping Helical achieve its strategic aims. By ensuring that Helical is a diverse business, the Group benefits from a variety of experiences and perspectives, stimulating creativity and contributing to our open and cohesive culture.

OUR STAKEHOLDERS – SECTION 172(1) STATEMENT
Engaging with our stakeholders
SECTION 172(1) STATEMENTThe Board of Directors confirm, that during the year under review, it has acted to promote the long-term success of the Company for the benefit of the Shareholders, whilst having due regard to the matters set out in section 172(1)(a) to (f) of the Companies Act 2006, being:
(a) the likely consequences of any decision in the long term;
(b) the interests of the Company’s employees;
(c) the need to foster the Company’s business relationships with suppliers, customers and others;
(d) the impact of the Company’s operations on the community and the environment;
(e) the desirability of the Company maintaining a reputation for high standards of business conduct; and
(f) the need to act fairly between members of the Company.
Promoting the long-term success of the GroupEngrained within the Culture of Helical is its consistent approach to ensuring the wider interests of its stakeholders are considered in all its corporate decision making. When making decisions, the Directors of Helical are committed to complying with their section 172(1) Companies Act 2006 duty (“s172(1) Duty”) to weigh up all the relevant factors and determine which course of action would most likely contribute to the success of the Company. The Board is also focused on its responsibility to have regard for all stakeholders when setting strategy and developing policies.
The Stakeholder Model which summarises the interaction between the s172(1) Duty and Helical’s stakeholders is included in all Board and Committee packs. When matters are presented to the Board for approval, the Board considers the interests of its stakeholders alongside the matters set out in section 172(1) Companies Act 2006 (see the Stakeholder Engagement Table on pages 78 to 79 for more details). On key approval items in Board and Board Committee papers, guidance will be given as to which stakeholders the Board should have regard to when reaching a decision.
Section 172(1) and the Board’s Principal Decisions throughout the yearWe define Principal Decisions as both those that are material to the Company, but also those that are significant to our key stakeholder groups. For detail on how we established and defined our key stakeholder groups please see the Stakeholder Engagement section on page 77 to 79. In making the following Principal Decisions the Board considered the views and interests of its key stakeholders, as well as the need to maintain a reputation for high standards of business conduct and the need to act fairly between the members of the Company, whilst also considering the likely consequences of any decision in the long term.
Property development is an inherently long-term business and the Board therefore takes a long-term approach to its decision making. We are exceedingly proud of our heritage, having developed and diversified from being a producer of steel bars to building and managing some of the most sought-after, prime office premises in London. Helical has been in business for 102 years, and we believe this success can be attributed to our commitment to the Helical Purpose (see page 74), whilst maintaining high standards of business conduct and the strong culture articulated through our Values (see page 75).
PRINCIPAL DECISIONSThe Board had regard to all matters (a) to (f) of section 172(1) Companies Act 2006 when reaching Principal Decisions throughout the reporting period. Two examples of such decisions in which the Board had regard to s172(1)(a)-(f) are noted below:
The Stakeholder Model – Interaction between s172 and stakeholders
S172(1) DUTY Directors must
promote success for the benefit of the
members with regard to…
A. Likely long-term consequences
B. Interests of employees
C. Need to foster
business relationships
with suppliers, customers and
othersD.
Impact of operations on
the community and the
environment
E. Maintaining
reputation for high standards
of business conduct
F. Need to act
fairly between members
SHAREHOLDERS
PARTNERS
SUPPLIERS AND CONTRACTORS
OCCUPIERS (TENANTS/CUSTOMERS)
EMPLOYEES
LOCAL COMMUNITIES
GOVERNMENT AND OTHER REGULATORY BODIES
SustainabilitySustainability underpins all of our strategic priorities, and is considered throughout the implementation of our business strategy. Operating in a sustainable manner has always been a priority of the Helical leadership and this is clearly communicated in the Company’s Purpose (see page 74). Much of the Board’s decision making is focused on ensuring that the Company is sustainable in the long term, and this forms the basis of the Viability Statement (see page 54). The Board also attends an annual strategy meeting to consider the long-term strategy of the business, incorporating presentations and discussions on opportunities and threats to the business.
Sustainability is at the core of all activities at Helical and as well as linking back to the Company’s Purpose, being sustainable is one of the Company’s Values. We recognise the impact our building developments have on the environment and are focused on reducing our carbon footprint throughout a development’s life cycle. In June 2020, the Company published its Sustainability Strategy “Built for the Future” and accompanying performance review document which served to clearly demonstrate the Group’s approach to sustainability and the associated risks of failing to operate in a sustainable manner. Furthermore, last year the Board also included Sustainability as a core tenet of our strategy and a separate risk for the business.
Over the past year, Helical has seen a considerable improvement in its sustainability achievements as it has continued to focus on ESG matters. Sustainability is a standing item on the agenda of each quarterly Board meeting and updates from the Sustainability Committee are delivered to the Board in between Board meetings as necessary. In May 2021, the Board approved the appointment of Sue Farr as the Non-Executive Director responsible for ESG & Sustainability matters.
During the year, the Board reviewed and approved the Company’s vision for a truly sustainable business, documented in the Sustainability Strategy and enhanced sustainability reporting documents. In approving these documents, the Board considered the long-term success of the business and the interests of the Group’s stakeholders. Within the Sustainability Strategy, the key priorities are identified as our Environment, our Communities and our People, and the strategy focuses on those measures that have the highest impact on the long-term vision of our business.
In furtherance of its commitment to sustainability, the Board will be focusing on a number of key projects over the next two years, including:
• the Company meeting its net zero carbon ambition for future developments using the principles set out in the recently released “Designing for Net Zero” guide;
• the launch of 33 Charterhouse Street, the first UK office to achieve BREEAM 2018 “Outstanding” at the design stage; and
• alignment of reporting practices with the Task Force on Climate-related Financial Disclosures (“TCFD”) to ensure greater transparency in reporting.
In approving all sustainability strategies, policies and documentation, the Company engages with, and considers, the views of all its stakeholders.
s172 matters considered in this Principal Decision:
A B C D E F
Disposals – Sale of The Powerhouse Portfolio, Manchester The Board plays a critical role in ensuring that a rigorous and robust process is followed in respect of asset disposals to ensure that all elements of the proposals, including stakeholder considerations, are carefully reviewed and challenged. Details of this disposal and its connection to the Company’s long-term strategy are included in the case study on pages 24 to 25.
Prior to making a decision, the Board was presented with all the relevant information with respect to the proposed disposal and asked to consider whether the proposal was in line with its strategy, in this case, of growth through recycling equity and realising capital profits. Considerations included:
• the performance of the building against the business plan and capital/income metrics;
• the capital expenditure committed to the assets;
• the opportunities in the market to deploy the recycled capital and utilise our skills;
• how to achieve maximum projected returns for all of our Shareholders;
• the regulatory, political and competitor landscape;
• the best interests of our stakeholders; and
• a review of the Company’s existing operations and market presence in the relevant city, impact on local communities, employee matters, suppliers and potential risks associated with the disposal of the assets.
s172 matters considered in this Principal Decision:
A B C D E F
72 Helical plc Annual Report and Accounts 2021 73Helical plcAnnual Report and Accounts 2021S
TR
AT
EG
IC R
EP
OR
T
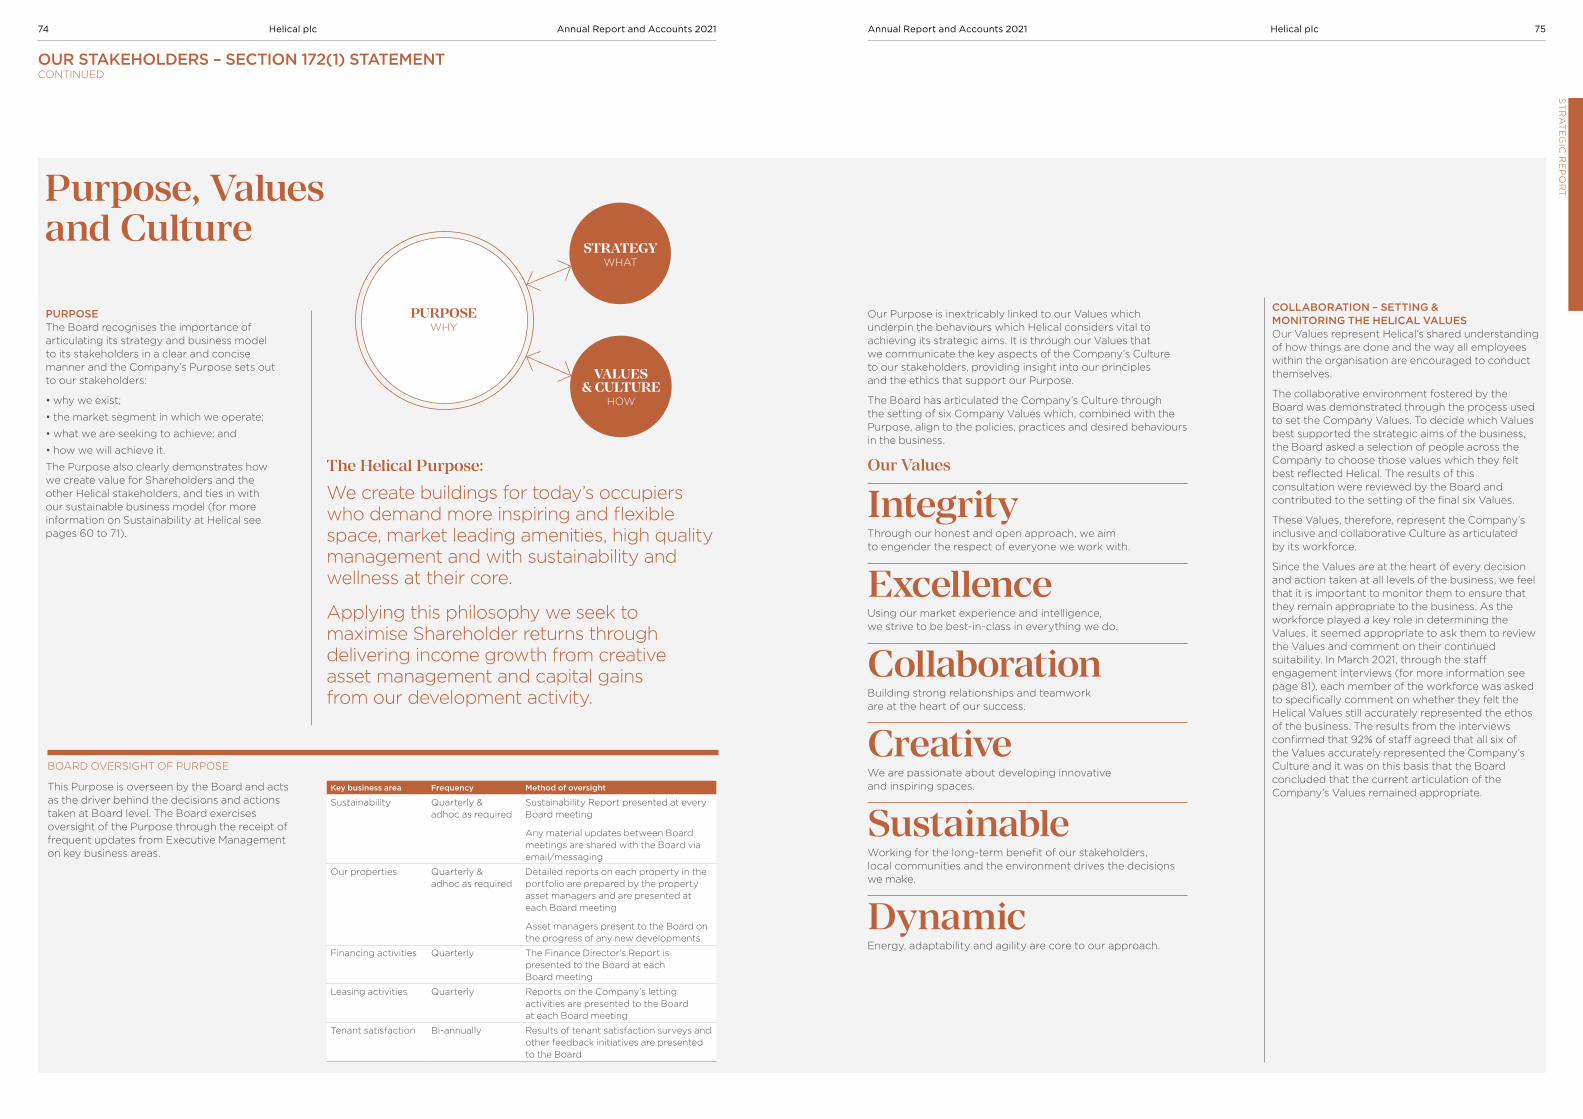
74 Helical plc Annual Report and Accounts 2021 75Helical plcAnnual Report and Accounts 2021S
TR
AT
EG
IC R
EP
OR
T
Our Purpose is inextricably linked to our Values which underpin the behaviours which Helical considers vital to achieving its strategic aims. It is through our Values that we communicate the key aspects of the Company’s Culture to our stakeholders, providing insight into our principles and the ethics that support our Purpose.
The Board has articulated the Company’s Culture through the setting of six Company Values which, combined with the Purpose, align to the policies, practices and desired behaviours in the business.
Our Values
IntegrityThrough our honest and open approach, we aim to engender the respect of everyone we work with.
ExcellenceUsing our market experience and intelligence, we strive to be best-in-class in everything we do.
CollaborationBuilding strong relationships and teamwork are at the heart of our success.
CreativeWe are passionate about developing innovative and inspiring spaces.
SustainableWorking for the long-term benefit of our stakeholders, local communities and the environment drives the decisions we make.
DynamicEnergy, adaptability and agility are core to our approach.
PURPOSEThe Board recognises the importance of articulating its strategy and business model to its stakeholders in a clear and concise manner and the Company’s Purpose sets out to our stakeholders:
• why we exist;
• the market segment in which we operate;
• what we are seeking to achieve; and
• how we will achieve it.
The Purpose also clearly demonstrates how we create value for Shareholders and the other Helical stakeholders, and ties in with our sustainable business model (for more information on Sustainability at Helical see pages 60 to 71).
Purpose, Values and Culture
OUR STAKEHOLDERS – SECTION 172(1) STATEMENT CONTINUED
COLLABORATION – SETTING & MONITORING THE HELICAL VALUESOur Values represent Helical’s shared understanding of how things are done and the way all employees within the organisation are encouraged to conduct themselves.
The collaborative environment fostered by the Board was demonstrated through the process used to set the Company Values. To decide which Values best supported the strategic aims of the business, the Board asked a selection of people across the Company to choose those values which they felt best reflected Helical. The results of this consultation were reviewed by the Board and contributed to the setting of the final six Values.
These Values, therefore, represent the Company’s inclusive and collaborative Culture as articulated by its workforce.
Since the Values are at the heart of every decision and action taken at all levels of the business, we feel that it is important to monitor them to ensure that they remain appropriate to the business. As the workforce played a key role in determining the Values, it seemed appropriate to ask them to review the Values and comment on their continued suitability. In March 2021, through the staff engagement interviews (for more information see page 81), each member of the workforce was asked to specifically comment on whether they felt the Helical Values still accurately represented the ethos of the business. The results from the interviews confirmed that 92% of staff agreed that all six of the Values accurately represented the Company’s Culture and it was on this basis that the Board concluded that the current articulation of the Company’s Values remained appropriate.Key business area Frequency Method of oversight
Sustainability Quarterly & adhoc as required
Sustainability Report presented at every Board meeting
Any material updates between Board meetings are shared with the Board via email/messaging
Our properties Quarterly & adhoc as required
Detailed reports on each property in the portfolio are prepared by the property asset managers and are presented at each Board meeting
Asset managers present to the Board on the progress of any new developments
Financing activities Quarterly The Finance Director’s Report is presented to the Board at each Board meeting
Leasing activities Quarterly Reports on the Company’s letting activities are presented to the Board at each Board meeting
Tenant satisfaction Bi-annually Results of tenant satisfaction surveys and other feedback initiatives are presented to the Board
BOARD OVERSIGHT OF PURPOSE
This Purpose is overseen by the Board and acts as the driver behind the decisions and actions taken at Board level. The Board exercises oversight of the Purpose through the receipt of frequent updates from Executive Management on key business areas.
The Helical Purpose:
We create buildings for today’s occupiers who demand more inspiring and flexible space, market leading amenities, high quality management and with sustainability and wellness at their core.
Applying this philosophy we seek to maximise Shareholder returns through delivering income growth from creative asset management and capital gains from our development activity.
STRATEGY WHAT
VALUES & CULTURE
HOW
PURPOSE WHY

HOW WE MONITOR & SUSTAIN OUR CULTURE
Our Culture The combination of Helical’s objectives for growth, development and long-term survival and resultant strategies to achieve these objectives have a direct link with the Culture of the Company. The embedded Culture is supported by our employees (as evidenced in the setting and monitoring of the Values – see page 75), and this results in Helical having a motivated and high performing team which supports the success of the strategy and delivers the outcomes necessary for long-term success.
An important aspect of the Group’s Culture is its approach to risk. In accordance with good stewardship, the Board does not inhibit sensible risk taking that is critical to growth. This approach is embedded in the risk culture of the Group which aligns with the strategy and objectives of the business and is embedded within the risk appetite (see Risk Management section on page 52).
The Helical Board promotes an open culture, enabling the strategic direction to be fully understood by all members of the workforce. This environment supports the achievement of the Company’s aims and aspirations and is conducive to the Group’s collaborative approach of encouraging all members of staff to proactively share ideas, opportunities and concerns.
By ensuring that Helical is an inclusive and diverse business, the Group benefits from a variety of experiences and perspectives. Such variety is important for the maintenance of a strong succession pipeline, necessary for future sustainability, and also helps to stimulate creativity and contributes to the open and cohesive Culture within the Company.
OUR STAKEHOLDERS – SECTION 172(1) STATEMENT CONTINUED
• At a minimum, conduct annual review of workforce policies and procedures – see Board Leadership & Company Purpose section of the Governance Review at pages 88 to 90
• Employee engagement initiatives – see pages 80 to 81
— Results of staff interviews
— Workforce engagement sessions (including Q&A) reported to the Executive Management team and Board, and considered in decision making
— Board’s interaction with senior management and wider workforce
• Tenant surveys and feedback analysis
• Staff tenure and retention rates (see KPI section on page 35)
• Whistleblowing mechanisms in place, with relevant data reported to the Board – see page 89 for further details
• Support provided to the workforce through the provision of a number of health and wellbeing initiatives (please see Sustainability Report on pages 70 to 71).
• Investing in training and organisational development for staff
• Health and safety data, including near misses, reported to the Management meetings every two weeks, the Executive Committee monthly and the Board quarterly
• Designated Non-Executive Director for ESG and Sustainability plays a key role in monitoring the Culture and ensuring its alignment with Company strategy and supports the long-term sustainable success of the business
• Collaboration with Occupiers throughout the pandemic
• Prompt payment to Suppliers
• Promotion of diverse and inclusive environment – see Nominations Committee Report on pages 95 and 96
• Consideration of Culture in recruitment and selection, both with regard to individuals and the recruiters used – see report of the Nominations Committee at pages 94 to 98
• Aligning formal rewards with Culture
• Incentive schemes developed to drive behaviours consistent with Purpose, Values and strategy – see report of the Remuneration Committee on page 112
STAKEHOLDER ENGAGEMENTThe Directors are pleased to report on how they have had regard to the need to foster the relationships with suppliers and contractors, tenants/occupiers, partners and others, and the effect of this on recent Principal Decisions taken by the Company.
In line with section 172 of the Companies Act 2006, the Directors of Helical act to promote the success of the Company for the benefit of its Shareholders. However, the Helical Board also places a great emphasis on the importance of the views and interests of its other key stakeholders. Helical’s stakeholders are those groups that are likely to be affected by the Company’s actions, and hence play a key role in the successful execution of the Company’s long-term strategy.
In recognition of the importance of the Group’s relationship to its stakeholders, the Board has set out its commitments to its stakeholders as follows:
(i) engaging with our stakeholders to build and maintain positive business relationships;
(ii) ensuring that our stakeholders are kept informed and have access to information about our business;
(iii) considering the needs and expectations of our stakeholders throughout the Company;
(iv) inviting feedback from our stakeholders to help us identify current and emerging issues facing our business; and
(v) ensuring that our activities generate sustainable, long-term value for all our stakeholders.
Our stakeholders, engagement mechanisms, consideration of stakeholder interests and the impacts on Board decision making The Company’s stakeholders are defined in the Stakeholder Model (see page 72) and in the Stakeholder Engagement Table overleaf. The Company’s stakeholders are kept under continuous review by the Board, with the Stakeholder Model being featured on every approval item and being considered as part of every Board decision taken.
The Board places utmost importance on the maintenance of positive relationships with all the Company’s stakeholders. It is through effective engagement that the Board has sought to understand their views.
The Stakeholder Engagement Table on pages 78 to 79 describes how the Directors have had regard to the matters set out in section 172(1) (a) to (f) and forms the Directors’ statement required by section 414CZA of The Companies Act 2006.
76 Helical plc Annual Report and Accounts 2021 77Helical plcAnnual Report and Accounts 2021S
TR
AT
EG
IC R
EP
OR
T
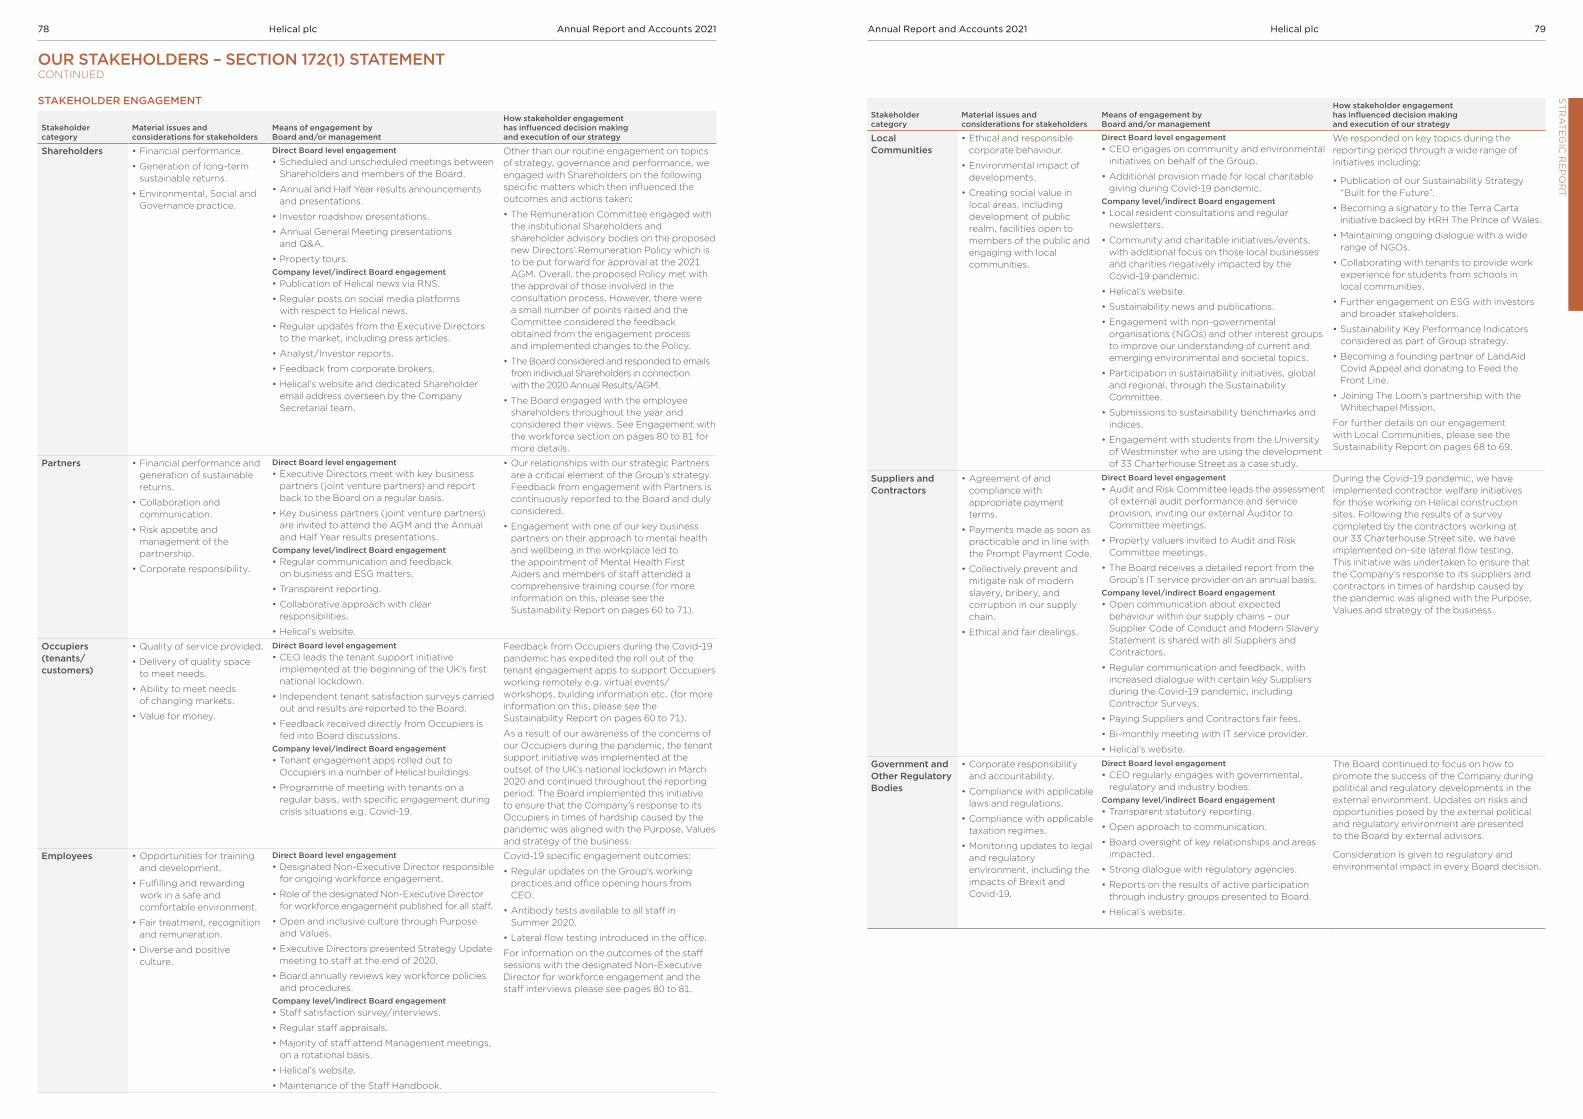
Stakeholder category
Material issues and considerations for stakeholders
Means of engagement by Board and/or management
How stakeholder engagement has influenced decision making and execution of our strategy
Local Communities
• Ethical and responsible corporate behaviour.
• Environmental impact of developments.
• Creating social value in local areas, including development of public realm, facilities open to members of the public and engaging with local communities.
Direct Board level engagement• CEO engages on community and environmental
initiatives on behalf of the Group.
• Additional provision made for local charitable giving during Covid-19 pandemic.
Company level/indirect Board engagement • Local resident consultations and regular
newsletters.
• Community and charitable initiatives/events, with additional focus on those local businesses and charities negatively impacted by the Covid-19 pandemic.
• Helical’s website.
• Sustainability news and publications.
• Engagement with non-governmental organisations (NGOs) and other interest groups to improve our understanding of current and emerging environmental and societal topics.
• Participation in sustainability initiatives, global and regional, through the Sustainability Committee.
• Submissions to sustainability benchmarks and indices.
• Engagement with students from the University of Westminster who are using the development of 33 Charterhouse Street as a case study.
We responded on key topics during the reporting period through a wide range of initiatives including:
• Publication of our Sustainability Strategy “Built for the Future”.
• Becoming a signatory to the Terra Carta initiative backed by HRH The Prince of Wales.
• Maintaining ongoing dialogue with a wide range of NGOs.
• Collaborating with tenants to provide work experience for students from schools in local communities.
• Further engagement on ESG with investors and broader stakeholders.
• Sustainability Key Performance Indicators considered as part of Group strategy.
• Becoming a founding partner of LandAid Covid Appeal and donating to Feed the Front Line.
• Joining The Loom’s partnership with the Whitechapel Mission.
For further details on our engagement with Local Communities, please see the Sustainability Report on pages 68 to 69.
Suppliers and Contractors
• Agreement of and compliance with appropriate payment terms.
• Payments made as soon as practicable and in line with the Prompt Payment Code.
• Collectively prevent and mitigate risk of modern slavery, bribery, and corruption in our supply chain.
• Ethical and fair dealings.
Direct Board level engagement• Audit and Risk Committee leads the assessment
of external audit performance and service provision, inviting our external Auditor to Committee meetings.
• Property valuers invited to Audit and Risk Committee meetings.
• The Board receives a detailed report from the Group’s IT service provider on an annual basis.
Company level/indirect Board engagement • Open communication about expected
behaviour within our supply chains – our Supplier Code of Conduct and Modern Slavery Statement is shared with all Suppliers and Contractors.
• Regular communication and feedback, with increased dialogue with certain key Suppliers during the Covid-19 pandemic, including Contractor Surveys.
• Paying Suppliers and Contractors fair fees.
• Bi-monthly meeting with IT service provider.
• Helical’s website.
During the Covid-19 pandemic, we have implemented contractor welfare initiatives for those working on Helical construction sites. Following the results of a survey completed by the contractors working at our 33 Charterhouse Street site, we have implemented on-site lateral flow testing. This initiative was undertaken to ensure that the Company’s response to its suppliers and contractors in times of hardship caused by the pandemic was aligned with the Purpose, Values and strategy of the business.
Government and Other Regulatory Bodies
• Corporate responsibility and accountability.
• Compliance with applicable laws and regulations.
• Compliance with applicable taxation regimes.
• Monitoring updates to legal and regulatory environment, including the impacts of Brexit and Covid-19.
Direct Board level engagement• CEO regularly engages with governmental,
regulatory and industry bodies.Company level/indirect Board engagement • Transparent statutory reporting.
• Open approach to communication.
• Board oversight of key relationships and areas impacted.
• Strong dialogue with regulatory agencies.
• Reports on the results of active participation through industry groups presented to Board.
• Helical’s website.
The Board continued to focus on how to promote the success of the Company during political and regulatory developments in the external environment. Updates on risks and opportunities posed by the external political and regulatory environment are presented to the Board by external advisors.
Consideration is given to regulatory and environmental impact in every Board decision.
STAKEHOLDER ENGAGEMENT
Stakeholder category
Material issues and considerations for stakeholders
Means of engagement by Board and/or management
How stakeholder engagement has influenced decision making and execution of our strategy
Shareholders • Financial performance.
• Generation of long-term sustainable returns.
• Environmental, Social and Governance practice.
Direct Board level engagement• Scheduled and unscheduled meetings between
Shareholders and members of the Board.
• Annual and Half Year results announcements and presentations.
• Investor roadshow presentations.
• Annual General Meeting presentations and Q&A.
• Property tours.Company level/indirect Board engagement • Publication of Helical news via RNS.
• Regular posts on social media platforms with respect to Helical news.
• Regular updates from the Executive Directors to the market, including press articles.
• Analyst/Investor reports.
• Feedback from corporate brokers.
• Helical’s website and dedicated Shareholder email address overseen by the Company Secretarial team.
Other than our routine engagement on topics of strategy, governance and performance, we engaged with Shareholders on the following specific matters which then influenced the outcomes and actions taken:
• The Remuneration Committee engaged with the institutional Shareholders and shareholder advisory bodies on the proposed new Directors’ Remuneration Policy which is to be put forward for approval at the 2021 AGM. Overall, the proposed Policy met with the approval of those involved in the consultation process. However, there were a small number of points raised and the Committee considered the feedback obtained from the engagement process and implemented changes to the Policy.
• The Board considered and responded to emails from individual Shareholders in connection with the 2020 Annual Results/AGM.
• The Board engaged with the employee shareholders throughout the year and considered their views. See Engagement with the workforce section on pages 80 to 81 for more details.
Partners • Financial performance and generation of sustainable returns.
• Collaboration and communication.
• Risk appetite and management of the partnership.
• Corporate responsibility.
Direct Board level engagement• Executive Directors meet with key business
partners (joint venture partners) and report back to the Board on a regular basis.
• Key business partners (joint venture partners) are invited to attend the AGM and the Annual and Half Year results presentations.
Company level/indirect Board engagement • Regular communication and feedback
on business and ESG matters.
• Transparent reporting.
• Collaborative approach with clear responsibilities.
• Helical’s website.
• Our relationships with our strategic Partners are a critical element of the Group’s strategy. Feedback from engagement with Partners is continuously reported to the Board and duly considered.
• Engagement with one of our key business partners on their approach to mental health and wellbeing in the workplace led to the appointment of Mental Health First Aiders and members of staff attended a comprehensive training course (for more information on this, please see the Sustainability Report on pages 60 to 71).
Occupiers (tenants/ customers)
• Quality of service provided.
• Delivery of quality space to meet needs.
• Ability to meet needs of changing markets.
• Value for money.
Direct Board level engagement• CEO leads the tenant support initiative
implemented at the beginning of the UK’s first national lockdown.
• Independent tenant satisfaction surveys carried out and results are reported to the Board.
• Feedback received directly from Occupiers is fed into Board discussions.
Company level/indirect Board engagement • Tenant engagement apps rolled out to
Occupiers in a number of Helical buildings.
• Programme of meeting with tenants on a regular basis, with specific engagement during crisis situations e.g. Covid-19.
Feedback from Occupiers during the Covid-19 pandemic has expedited the roll out of the tenant engagement apps to support Occupiers working remotely e.g. virtual events/workshops, building information etc. (for more information on this, please see the Sustainability Report on pages 60 to 71).
As a result of our awareness of the concerns of our Occupiers during the pandemic, the tenant support initiative was implemented at the outset of the UK’s national lockdown in March 2020 and continued throughout the reporting period. The Board implemented this initiative to ensure that the Company’s response to its Occupiers in times of hardship caused by the pandemic was aligned with the Purpose, Values and strategy of the business.
Employees • Opportunities for training and development.
• Fulfilling and rewarding work in a safe and comfortable environment.
• Fair treatment, recognition and remuneration.
• Diverse and positive culture.
Direct Board level engagement• Designated Non-Executive Director responsible
for ongoing workforce engagement.
• Role of the designated Non-Executive Director for workforce engagement published for all staff.
• Open and inclusive culture through Purpose and Values.
• Executive Directors presented Strategy Update meeting to staff at the end of 2020.
• Board annually reviews key workforce policies and procedures.
Company level/indirect Board engagement • Staff satisfaction survey/interviews.
• Regular staff appraisals.
• Majority of staff attend Management meetings, on a rotational basis.
• Helical’s website.
• Maintenance of the Staff Handbook.
Covid-19 specific engagement outcomes:
• Regular updates on the Group’s working practices and office opening hours from CEO.
• Antibody tests available to all staff in Summer 2020.
• Lateral flow testing introduced in the office.
For information on the outcomes of the staff sessions with the designated Non-Executive Director for workforce engagement and the staff interviews please see pages 80 to 81.
OUR STAKEHOLDERS – SECTION 172(1) STATEMENT CONTINUED
78 Helical plc Annual Report and Accounts 2021 79Helical plcAnnual Report and Accounts 2021S
TR
AT
EG
IC R
EP
OR
T

TOPICS DISCUSSED AT THE WORKFORCE ENGAGEMENT SESSIONS
SUE CLAYTON – DESIGNATED NON-EXECUTIVE DIRECTOR FOR WORKFORCE ENGAGEMENTSue Clayton was appointed as the designated Non- Executive Director for workforce engagement in 2019, and has been successfully building on the engagement between the Board and the workforce during the reporting period. Whilst operating through the Covid-19 pandemic, it has not been possible for our full workforce to meet with Sue in person, but she has hosted a series of staff engagement sessions via video conferencing. Conscious that having too many people on a videocall could limit the ability for all staff to engage in discussions, the workforce was split into smaller groups to enable good dialogue between all participants. A number of topics were discussed at these sessions and any questions or concerns raised by staff were communicated to the Board for consideration (see Consideration of Workforce Interests section on page 81). Attendee feedback indicated that these sessions were positively received by all those involved, with the relaxed forum providing staff with a mechanism to share their thoughts and concerns. In addition to these sessions, Sue has been contactable via email throughout the year.
The feedback obtained from Sue enables the Board to monitor the Culture of the Company and act appropriately to respond to the thoughts and concerns of the workforce.
Rationale for choosing a designated Non-Executive Director for our workforce engagement mechanismHelical has a relatively small workforce of 28 employees. As such, it is possible for our Directors to engage directly with members of the workforce, with ease, on a regular basis. The appointment of a Director from the workforce (as a representative) and the establishment of a formal workforce advisory panel (as mechanisms for engagement) were both deemed to be a disproportionate approach for Helical and its engagement requirements.
Why the Board appointed SueSue volunteered for the role of designated Non- Executive Director for workforce engagement and the Board unanimously agreed that she was well suited to the role given her skill set, particularly her background in people management.
“I offered to become the designated Non-Executive Director for workforce engagement as I am keen to ensure that the Board members are aware of the views of as many Helical employees as possible. We meet a number of the team at our regular Board meetings over the year but these additional Employee Engagement sessions gave me opportunities to meet more people.
In my executive career I have been involved in a number of roles including sitting on a Diversity and Inclusion Steering Committee and I have experience in recruitment, mentoring and managing teams of people. I am therefore interested in the people side of our business and am pleased that Helical is able to attract and retain such talented staff.”
What does our designated Non-Executive Director for workforce engagement do?The Board has structured the role to aid its understanding of the views of the Helical employees and consider their interests in Board discussions and decision making. The role and its accompanying responsibilities have been documented in a terms of reference which is available to view on our website: https://www. helical.co.uk/investors/corporate-governance/
STAFF ENGAGEMENT INTERVIEWSAs noted above, our staff are key to our success and in order to retain our talent, it is essential to ensure that our staff satisfaction levels are high and the culture of the workplace is in keeping with our Values (see our Values on page 75). Therefore, in addition to the workforce engagement initiative run by Sue Clayton, one-on-one staff engagement interviews were conducted during the reporting period by our Operations Manager, Lois Robertson. Given the size of our workforce, it was feasible to conduct individual staff interviews as a means of meaningful engagement. This approach was also selected as it was considered more personal to the employee than a survey, giving each member of staff time to discuss issues of importance to them, rather than simply answering “yes” or “no” to a series of questions. The staff were provided with a number of suggested questions/discussion points in advance of their individual meetings. The results of each interview were kept completely confidential.
The feedback garnered from the staff survey was communicated to the Executive Committee in the first instance, and reported to the Board where appropriate.
CONSIDERATION OF WORKFORCE INTERESTSThe key results and actions from both the Staff Engagement sessions with our designated Non-Executive Director for workforce engagement and our Staff Engagement interviews are noted below:
What our employees have said What we are doing about it
We want to hear about the future strategy of the Company on a more regular basis.
CEO has invited all staff to attend a presentation on strategy in June 2021.
We would like more opportunities to meet all the Non-Executive Directors on the Board.
An informal session for all staff and the NEDs is being scheduled for a date when national Covid-19 restrictions allow.
Individual staff members will continue to be invited to lunch with the Board post each quarterly Board meeting.
Can we utilise our office space in a way that is more conducive to our health and wellbeing e.g. space for exercise classes at lunch?
Staff have been allocated a “well-being” space within the office to enable them to do exercise classes and other activities.
Learning and development opportunities have slowed during the pandemic.
The Executive Committee is committed to reinvigorating the learning and development programme and has undertaken an exercise to identify development opportunities for individuals.
A need for training in mental health and wellbeing was identified, particularly since the outbreak of the pandemic. The Executive Committee commissioned the roll out of mental health first aid training and four members of staff were appointed as Mental Health First Aiders at the beginning of 2021. For more information on this initiative, please see the Sustainability Report on pages 70 to 71.
Team interaction has decreased during the pandemic.
The Executive Committee organised a variety of virtual all-staff events during the pandemic. However, in recognition of the fact that such events are no substitute for face-to-face interactions, the following events have been proposed for 2021, Covid-19 restrictions permitting:
• Summer social event to take place after the AGM;
• Land Aid 10K run; and
• Property tour in September.
Engagement with workforce The importance of engaging with the workforce can be linked back to the Group’s key operational and reputational risks (see Risk Register on page 59), specifically the management of workforce relationships and retention of talent. We know that our staff are vital to our success and every member of the Helical workforce is valued, with their opinions continuously sought and held in high regard. The Board defines the workforce of Helical as its full-time and part-time employees and staff members temporarily hired for work through an employment agency.
This principle of mutual respect and inclusion is integral to the Culture of the Company (see pages 76 to 77). Engagement with the workforce is deemed a key priority for the Directors and, as such, the Board frequently invites members of staff to present on key projects or topics of interest at its meetings. Through this engagement mechanism, our employees are given the opportunity to meet the full Board of Directors.
The Board also encourages open dialogue with the workforce and details of how to communicate directly with the Board and Executive management are clearly documented in the workforce policies and procedures which are reviewed annually.
OUR STAKEHOLDERS – SECTION 172(1) STATEMENT CONTINUED
“ I offered to become the designated Non-Executive Director for workforce engagement as I am keen to ensure that the Board members are aware of the views of as many Helical employees as possible.”
SUE CLAYTON
• Working from home – how had it been for everyone?
• Corporate communications
• Learning & Development
• Team spirit
• Flexible working
• Relationships with occupiers, suppliers and contractors
• Head Office amenities
• Helical strategy
• ESG
• Future of offices
• Opportunities to meet all the Non-Executive Directors
80 Helical plc Annual Report and Accounts 2021 81Helical plcAnnual Report and Accounts 2021S
TR
AT
EG
IC R
EP
OR
T
The Strategic Report, on pages 1 to 81, was approved by the Board on 25 May 2021.
On behalf of the Board
GERALD KAYEChief Executive

CHAIRMAN’S REVIEW
STAKEHOLDER ENGAGEMENT Our stakeholders are very important to us and we remain committed to maintaining a regular and open dialogue with them and taking their interests into consideration in every decision we make as a collective Board. Throughout the reporting period, as a result of Covid-19 restrictions, the Group has been required to consider alternative methods to ensure effective levels of engagement with all our stakeholders. Please see our Section 172(1) Statement on pages 72 to 81 of the Strategic Report for further details.
BOARD DECISIONSThe Board are committed to ensuring Helical’s sustainable success whilst navigating through the current challenging background. Regardless of the market conditions, the Board’s decision making process is founded on the promotion of the long-term success of the business for the benefit of our Shareholders, whilst also having regard to the interests of our other stakeholders.
In addition to discussions on economic and political issues and their impact on the market, the Board meeting agendas over the year covered a variety of issues including:
• a review of the Group’s corporate, property and financial strategy;
• approval of the Group’s Sustainability Strategy “Built for the Future”;
• approval of the Group’s updated Risk Management Framework, and risk appetite with respect to principal and emerging risks;
• consideration and approval of material property transactions and opportunities;
• review of the effectiveness of the Board and its Committees, conducted as part of an internal Board evaluation process;
• approval of the Board Diversity and Inclusion Policy and the setting of key Board diversity and inclusion objectives; and
• consideration of Board and senior management succession plans.
DEAR SHAREHOLDER,On behalf of the Board, I am pleased to present the Corporate Governance Report for the year ended 31 March 2021. The Report sets out Helical’s governance processes and explains how they enable the long-term success of the business. We have designed this year’s Report to ensure that all stakeholders are able to gain a deeper understanding of how we approach governance, structuring it around the sections of the 2018 UK Corporate Governance Code (the “Code”) and, where appropriate, cross-referring to sections of the Strategic Report to provide complete and navigable governance reporting.
COVID-19COVID-19 has impacted every market sector, and the last fifteen months has been a challenging period for many companies, including Helical. This Report covers a period of unprecedented and significant uncertainty as the Company navigated its way through the impact of the pandemic and adapted its working practices whilst also ensuring that good governance was upheld. Despite the challenges, the Group has had a successful year, maintaining strong rent collection, letting Kaleidoscope at a premium to last year’s ERV and making good progress on the development of 33 Charterhouse Street, including securing debt to fully finance its development. Working through the pandemic has meant that we had to operate the majority of our Board meetings entirely online and ran a closed AGM. I believe the Board responded well to these challenges, focusing its energy on ensuring that the long-term success of the business was protected, and I am pleased to be able to outline the activities of the Board and its Committees over this period.
UK CORPORATE GOVERNANCE CODE 2018 At Helical, good corporate governance underpins all Board discussion and decision making. We have continued to apply the Principles of the Code throughout the year and, as at the date of this Report, the Company has complied with all the Code’s Provisions. The Financial Reporting Council’s (“FRC”) 2018 Guidance on Board Effectiveness has also informed the practices of the Board over the course of the year.
I encourage you to read our Corporate Governance Report for a more detailed account of how Helical has complied with the Code and its accompanying guidance. We have also considered the guidance in the FRC’s November 2020 Review of Corporate Governance Reporting, using this guidance to further enhance our reporting throughout the Annual Report.
RICHARD GRANT CHAIRMAN
Strong performance, governance and leadership
INVESTOR RELATIONSWe have an extensive programme of meetings and presentations with Shareholders throughout the year with the majority of these taking place in the periods following our annual and half year results.
In the year to 31 March 2021, our usual face to face meetings with Shareholders were largely replaced by video-linked conversations to discuss our results. These meetings were attended by the Chief Executive, Gerald Kaye and the Finance Director, Tim Murphy. In March 2021, Sue Farr, the Chair of the Remuneration Committee, wrote to Shareholders representing over 67% of issued share capital in a consultation exercise regarding the Company’s proposed new Remuneration Policy, as discussed on pages 103 to 125. The feedback received indicated a strong level of support for the proposals from the Shareholders.
I, along with the Company’s other Non-Executive Directors, will be available to meet Shareholders at the 2021 AGM and, indeed, at any time should they wish to discuss any matters with the wider Board. Several of the Non-Executive Directors will be attending the Company’s planned property tours for investors later in the year and look forward to meeting Shareholders at these events.
MY TENURE ON THE BOARDThe Code recommends that the tenure of a Non-Executive Director of a listed company should not exceed nine years. At the 2021 AGM, I will have reached the recommended tenure limit, but I will be asking for Shareholder approval to continue in the role for one further year. Following an extensive review, the Board of Directors concluded that the extension of my chairmanship would be in the best interests of the Company and its stakeholders, with the continuation of my appointment ensuring stability and continuity as the business navigates its way out of the Covid-19 pandemic. For more information on this matter, please see page 88 of the Corporate Governance Report.
SUMMARYFinally, I would like to take this opportunity to thank the Helical workforce for their continued drive, skill and enthusiasm throughout this particularly challenging year. The pandemic confirmed to me just how accurately Helical’s Values represent the Culture of the Company, and this is so important considering the Board’s effectiveness is dependent on the hard work and dedication of the entire Helical team. I should also like to thank my fellow Directors, particularly Gerald Kaye, for exhibiting exceptional leadership whilst navigating through unchartered territory.
Over the course of the year, our stakeholders have continued to contribute to our success and stakeholder engagement shall remain high on the Board’s agenda going forward.
As we emerge from the pandemic, I am confident that Helical is well positioned to pursue its strategy and take advantage of opportunities in the forthcoming year and I look forward to witnessing the achievements of the business and the ongoing success of the Company.
The following pages describe our governance structure and the work of the Board and its Committees in greater detail.
RICHARD J. GRANTChairman
25 May 2021
ANNUAL STRATEGY REVIEWIn September 2020, the Board carried out its annual strategic review of the business, which included consideration of the economic, geopolitical, societal and environmental risks. This review involved an assessment of the Company’s position in the listed sector, its strengths and weaknesses and options for business growth. The strategic review confirmed that the Group’s continued focus on the development of, and investment in, offices in London would maximise the potential future performance of the Group. It also confirmed that the talent, knowledge and experience of the current executive team would enable the Company to continue to prosper, in alignment with our Shareholders’ interests. Further details of the Board’s annual strategy review can be found on page 90 of the Corporate Governance Report.
BOARD EVALUATIONIn the year to 31 March 2021, the annual Board evaluation was undertaken internally and overseen by me. This year’s internal evaluation confirmed that Helical’s Board, Committees and individual Directors continue to operate effectively, despite these challenging times and the impact of remote meetings on the Board dynamic. The results of the evaluation highlighted a few items for further discussion, but overall demonstrated that the Board had embraced the opportunity to improve its effectiveness by focusing on the suggestions of the previous year’s review. Further information on this year’s effectiveness review can be found on page 98.
BOARD COMMITTEESThe work of the Nominations, Audit and Risk and Remuneration Committees is discussed in detail in their individual reports on pages 94 to 125. A report on the work of the Group Sustainability Committee can be found on pages 60 to 71 of the Strategic Report.
Towards the end of the year, the Remuneration Committee engaged with the Group’s Shareholders to develop a new Remuneration Policy to replace the 2018 Policy, which expires at the 2021 AGM. The new Policy will be presented to Shareholders for approval at the 2021 AGM.
AGM AND ARTICLES OF ASSOCIATION Although our 2020 AGM had to operate in a “closed” environment, we will be inviting our Shareholders to join us in person for our 2021 AGM. In light of the Covid-19 restrictions and their impacts on the last AGM season, we will be proposing the adoption of new Articles of Association that will allow us to hold hybrid AGMs in the future. If approved, this particular change to our Articles of Association will further improve our Shareholder engagement mechanisms. For details of our 2021 AGM, please see the Notice of Annual General Meeting Report of the Directors on page 128.
“ I believe the Board responded well to the challenges of the pandemic, focusing its energy on ensuring that the long-term success of the business was protected.” C
OR
PO
RA
TE
GO
VE
RN
AN
CE
RE
PO
RT
82 Helical plc Annual Report and Accounts 2021 83Helical plcAnnual Report and Accounts 2021

1. RICHARD GRANT BOARD CHAIRMAN AND CHAIR OF THE NOMINATIONS COMMITTEE
N R
Board meetings present: 6/6
Tenure: 8 years
Independent: Yes (see page 88)
Skills, relevant experience and contribution to long-term success Richard Grant, BA (Oxon), ACA, has over 40 years’ financial experience. He was the Chief Financial Officer of Cadogan Estates Limited from 1994 until his retirement in 2017, and prior to this, he was a Corporate Finance Partner at PricewaterhouseCoopers.
Richard was appointed as a Non-Executive Director in July 2012, became Deputy Chair of Helical in 2018, and was appointed as Chairman of the Board in July 2019.
Richard brings significant leadership qualities to the Board, combined with considerable financial experience and extensive knowledge of the property sector. He is an effective Chairman as demonstrated both through his contribution to Board discussions and his ability to proficiently chair Board and Committee meetings. Richard’s effectiveness as Chairman is further bolstered by his experience on public company boards.
Through his wealth of skills and prior experience, Richard is able to contribute to all aspects of business discussions and his valuable knowledge and insight is key to promoting the sustainable success of the Company.
Other external appointments• Stenprop Limited – Board Chairman and
Chair of the Nominations Committee. • Wittington Investments (Properties) Limited
– Board Chairman.
2. GERALD KAYE CHIEF EXECUTIVE AND CHAIR OF THE EXECUTIVE COMMITTEE
E V
Board meetings present: 6/6
Tenure: 26 years
Independent: No
Skills, relevant experience and contribution to long-term success Gerald Kaye, BSc (Est Man) FRICS, was appointed Chief Executive in 2016. He joined the Board as an Executive Director in 1994, responsible for the Group’s development activities.
Gerald is a past President of the British Council for Offices, a former Director of London & Edinburgh Trust Plc and former Chief Executive of SPP. LET. EUROPE NV.
Gerald’s experience at Helical ensures that he has an in-depth knowledge of the Group’s operations and markets, which helps him to lead the business, be a key contributor to Board discussions and aid the effective decision making of the Board. He considers stakeholder engagement to be a crucial aspect of his role given its impact on the long-term success of Helical, and he therefore spends considerable time engaging with our major shareholders, visiting the Group’s properties and development sites and maintaining extensive relationships in the property industry.
Other external appointments• Member of the Investment Committee
at Guy’s & St Thomas’ Foundation.
Our Board A AUDIT AND RISK COMMITTEE MEMBER
N NOMINATIONS COMMITTEE MEMBER
R REMUNERATION COMMITTEE MEMBER
V PROPERTY VALUATIONS COMMITTEE MEMBER
S S USTAINABILITY COMMITTEE MEMBER
E EXECUTIVE COMMITTEE MEMBER
COMMITTEE CHAIR
S SECRETARY TO THE BOARD AND BOARD COMMITTEES
BOARD OF DIRECTORS
3. TIM MURPHY FINANCE DIRECTOR
E
Board meetings present: 6/6
Tenure: 8 years
Independent: No
Skills, relevant experience and contribution to long-term success Tim Murphy, BA (Hons) FCA, joined the Group in 1994 and became Finance Director of the Company in 2012. He is responsible for the financial statements, financial reporting, treasury and taxation. Before joining Helical Tim worked at the financial and professional services firm Grant Thornton.
Tim is a highly experienced financial practitioner with significant sector knowledge, both technical and commercial.
Tim is experienced in working with boards and management teams in respect of financial and commercial management, reporting, and risk and control frameworks. These experiences make Tim particularly well-placed to contribute to the Group’s broader strategic agenda and further the sustainable success of the business.
1. RICHARD GRANT
5. SUE CLAYTON 6. RICHARD COTTON
8. SUE FARR
2. GERALD KAYE
4. MATTHEW BONNING-SNOOK
9. JAMES MOSS – COMPANY SECRETARY7. JOE LISTER
3. TIM MURPHY
CO
RP
OR
AT
E G
OV
ER
NA
NC
E R
EP
OR
T84 Helical plc Annual Report and Accounts 2021 85Helical plcAnnual Report and Accounts 2021

9. JAMES MOSS COMPANY SECRETARY AND GROUP FINANCIAL CONTROLLER
S E
Board meetings attended: 6/6
Tenure: 6 years
Skills, relevant experience: James Moss, MChem (Hons) (Oxon) FCA, joined Helical in September 2014 as Group Financial Controller and was appointed Company Secretary in May 2015 and to the Executive Committee in March 2018. He was previously at Grant Thornton, where he was responsible for leading audit and other assurance assignments in their Real Estate sector.
5. SUE CLAYTON NON-EXECUTIVE DIRECTOR, CHAIR OF THE PROPERTY VALUATIONS COMMITTEE AND DESIGNATED NON-EXECUTIVE DIRECTOR FOR WORKFORCE ENGAGEMENT
V A N R
Board meetings present: 6/6
Tenure: 5 years
Independent: Yes
Skills, relevant experience and contribution to long-term success Sue Clayton, FRICS, was appointed to the Board as a Non-Executive Director in February 2016. She is Chair of the Property Valuations Committee and a member of the Nominations Committee, the Audit and Risk Committee and the Remuneration Committee.
In 2019, the Board appointed Sue as the designated Non-Executive Director for workforce engagement and she has engaged directly with members of the workforce on a regular basis throughout the year. Our workforce are key to our strategy and long-term sustainable success and Sue’s role thus contributes to the strategic aims of the Company (see also report on Helical’s workforce engagement initiatives at page 80 to 81).
Sue has over 30 years of experience in UK investment markets. She is a former Managing Director of CBRE’s Capital Markets Team and has sat on the CBRE UK Management and Executive Boards. She also held the position of Employee Director on the CBRE Group Inc. Board. Sue started her career as a graduate with Richard Ellis (now CBRE) and worked in Valuation and Fund Management before moving into Investment Agency.
Sue is a Fellow of the Royal Institution of Chartered Surveyors and her extensive commercial experience in the property industry and knowledge of the UK property market renders her a highly valuable contributor to the Group’s strategy. It is also through her skills and experience in the field of property valuation that she provides a significant contribution to the effectiveness of the Group’s governance structure, especially with respect to the work of the Property Valuations Committee.
Other external appointments• Board Member of the Committee of
Management of Hermes Property Unit Trust. • Non-Executive Director of SEGRO plc.
6. RICHARD COTTON SENIOR INDEPENDENT DIRECTOR
A N R
Board meetings present: 6/6
Tenure: 5 years
Independent: Yes
Skills, relevant experience and contribution to long-term success Richard Cotton was appointed to the Board as a Non-Executive Director in March 2016 and as Senior Independent Director in February 2018. Richard is a member of the Remuneration Committee, Audit and Risk Committee and the Nominations Committee.
Richard has a wide range of experience in both executive and non-executive roles at a number of quoted and unquoted companies. Richard was formerly head of UK Real Estate at J.P. Morgan Cazenove, a position he held until 2009, and he spent five subsequent years as Managing Director of Forum Partners. Richard has also previously held the position of Chairman of Centurion Properties and was a Non- Executive Director of Hansteen Holdings plc.
His experience in the financial sector, together with his knowledge and skills in property, strengthens the overall expertise of the Board. He is a key contributor to the firm’s strategic discussions, and his knowledge of the financial services industry is frequently drawn upon in Board discussions and assists the Board in decision making.
His appointment as the Group’s Senior Independent Director is underpinned by his extensive board experience and understanding of stakeholder interests.
Other external appointments• Non-Executive Director of Big Yellow
Group plc. • A member of the Commercial Development
Advisory Group at Transport for London.
A AUDIT AND RISK COMMITTEE MEMBER
N NOMINATIONS COMMITTEE MEMBER
R REMUNERATION COMMITTEE MEMBER
V PROPERTY VALUATIONS COMMITTEE MEMBER
S S USTAINABILITY COMMITTEE MEMBER
E EXECUTIVE COMMITTEE MEMBER
COMMITTEE CHAIR
S SECRETARY TO THE BOARD AND BOARD COMMITTEES
BOARD OF DIRECTORS CONTINUED
4. MATTHEW BONNING-SNOOK PROPERTY DIRECTOR AND CHAIR OF THE SUSTAINABILITY COMMITTEE
S E V
Board meetings present: 6/6
Tenure: 13 years
Independent: No
Skills, relevant experience and contribution to long-term success Matthew Bonning-Snook, BSc (Urb Est Surveying) MRICS, was appointed to the Board as an Executive Director in 2007. Prior to joining Helical in 1995, he was a Development Agent and Consultant at Richard Ellis (now CBRE).
Matthew’s long tenure with the Group, detailed knowledge of the London property market and his extensive network of contacts within the industry means that he has valuable knowledge and insight to promote and contribute to the Group’s strategy.
In 2019, the Board appointed Matthew as Chair of the Sustainability Committee and he leads our commitment to measuring and improving Helical’s corporate ESG performance against external industry benchmarks. Matthew’s valuable contributions to the long-term sustainable success of the business are therefore evident, both in his skill and experience as a property development executive but also in his leadership of the Group’s sustainability initiatives.
8. SUE FARR NON-EXECUTIVE DIRECTOR, CHAIR OF THE REMUNERATION COMMITTEE AND DESIGNATED NON-EXECUTIVE DIRECTOR FOR ESG & SUSTAINABILITY
R A N
Board meetings present: 6/6
Tenure: 1 year
Independent: Yes
Skills, relevant experience and contribution to long-term success Sue contributes considerable knowledge, skill and experience to the Board and its Committees, particularly in the areas of marketing, branding and consumer issues, which are key areas of focus for the Board and important for the continued success of our business.
Sue is the Chair of the Remuneration Committee and has served on the boards of a diverse range of companies and has experience on other remuneration committees, both as a member and chair. Her effectiveness as Chair is bolstered by her understanding of employee and wider business perspectives and her ability to consider the consequences of remuneration decisions. She is also a member of the Audit and Risk and Nominations Committees.
In May 2021, the Board appointed Sue as the designated Non-Executive Director for ESG & Sustainability and she plays a key role in monitoring Helical’s Culture and ensuring its alignment with Company strategy to support the long-term sustainable success of the business.
Sue is a former Chair of both the Marketing Society and the Marketing Group of Great Britain. In 2003, Sue joined the Chime Group, where she was Chair of the Advertising and Marketing Services Division and Strategic and Business Development Director until 2015, and served as a Special Advisor to their Board until July 2020. Prior to joining the Chime Group, Sue served as Marketing Director of the BBC for seven years, Director of Corporate Affairs at Thames Television for three years and Director of Corporate Communications at Vauxhall Motors. Sue has also served as a Non-Executive Director for Millennium & Copthorne Hotels plc, New Look plc, Dairy Crest plc, Dolphin Capital Partners and Historic Royal Palaces.
Other external appointments• Non-Executive Director,
British American Tobacco plc.• Non-Executive Director,
Accsys Technologies PLC.• Non-Executive Director,
Unlimited Marketing Group Ltd.
7. JOE LISTER NON-EXECUTIVE DIRECTOR AND CHAIR OF THE AUDIT AND RISK COMMITTEE
A N R
Board meetings present: 6/6
Tenure: 2 years
Independent: Yes
Skills, relevant experience and contribution to long-term success Joe Lister was appointed to the Board in September 2018 and as Chair of the Audit and Risk Committee in July 2019. He is the Chief Financial Officer at Unite Group plc, a position he has held since January 2008 after joining the company in 2002. Prior to joining Unite Group plc, Joe qualified as a Chartered Accountant with PricewaterhouseCoopers.
In addition to being Chair of the Audit and Risk Committee, Joe is a member of both the Nominations Committee and the Remuneration Committee.
Joe is a key contributor in all aspects of the Group’s strategy, and he brings a wealth of experience and insight into the effect that strategic changes might have on the property sector and consequently, the long-term success of the business. He has a strong financial background, having qualified as a chartered accountant, and is highly knowledgeable and experienced in risk management in the property sector. His background therefore enables him to effectively perform the role of Chair of the Audit and Risk Committee at Helical. Furthermore, he is an experienced listed company director and contributes helpful insights to shareholder relations offering differing perspectives gained through his experience as a member of the executive management team at Unite Group plc.
Other external appointments• Executive Director, Unite Group plc.
CO
RP
OR
AT
E G
OV
ER
NA
NC
E R
EP
OR
T86 Helical plc Annual Report and Accounts 2021 87Helical plcAnnual Report and Accounts 2021

CORPORATE GOVERNANCE REPORT
The Board confirmed that Richard’s leadership has been key to the effectiveness of the Board and feels, that his experience brings a very helpful perspective to strategic discussions. The Board unanimously agrees) that the extension of Richard’s chairmanship is in the best interests of the Company and its stakeholders, with the continuation of his appointment ensuring stability and continuity with all the Group’s stakeholders whilst the business navigates its way out of the Covid-19 pandemic.
In order to mitigate any risks to the effectiveness and dynamics of the Board, the Chairman’s effectiveness will be continually assessed until the handover process is completed. This will be led by Richard Cotton, SID, who will engage regularly with each of the Directors to confirm the continued effectiveness of the Board under Richard Grant’s leadership.
For more information regarding Richard’s succession, please see the report of the Nominations Committee on page 97.
Helical’s Culture and Values are reinforced through the Company’s Code of Conduct along with various other policies and procedures including share dealing, security of data and anti-bribery and corruption measures. In terms of engaging with external stakeholders, the Company publishes certain key policies on its website (https://www.helical.co.uk/investors/corporate-governance/). All Company policies and procedures have been implemented with the objective of supporting the long-term sustainable success of the business. For further details on Helical’s Purpose, Values and Culture and how they link to Company strategy, please see pages 74 and 75.
The ability of our employees to speak freely and openly is an important characteristic of Helical’s ethos. Helical’s Whistleblowing Policy enables all members of the workforce to raise concerns about malpractice or misconduct, in confidence, to either the CEO, Company Secretary, Chairman or Senior Independent Director. Whistleblowing is a matter reserved for the Board and any whistleblowing issue raised, as well as any outcome of subsequent investigations, will be notified to the Board. Further methods used by the Board to engage with the workforce and other stakeholders are detailed in the Stakeholder Engagement section at pages 72 to 81.
As well as being linked to the Culture of the Company, the Purpose and Values flow through to other policies, practices and behaviours in the business. For example, the Value of working Sustainably underpins the Company’s strategy and more detail on this can be found in the Sustainability Report on pages 60 to 71.
As confirmed in the Company’s most recent internal Board evaluation (for more information on the 2020/21 internal Board evaluation, please see the report of the Nominations Committee on pages 94 to 98), the Board of Directors collectively have the skills and experience required to provide effective leadership of the Company. They demonstrate focus and interest in generating Shareholder value and in supporting the interests of the Group’s stakeholders, whilst also contributing to the wider society.
The Directors’ range of backgrounds and expertise ensure that the Company’s leadership is effective and balanced (see pages 84 to 87 for details).
STATEMENT OF COMPLIANCE WITH THE UK CORPORATE GOVERNANCE CODE 2018For the year to 31 March 2021 the Group has applied the Principles of the UK Corporate Governance Code 2018 (the “Code”) and has complied with all relevant Provisions of the Code throughout the accounting period. The Code, along with the Financial Reporting Council’s 2018 Guidance on Board Effectiveness, has informed the Company’s governance practices, particularly with respect to the Board’s effectiveness and decision making, and has contributed to the delivery of strategy. However, at the 2021 Annual General Meeting (“AGM”) our Chairman, Richard Grant, will have served on the Board of the Company for nine years, so following the 2021 AGM, Helical will be compliant with all the Provisions of the UK Code, except for Provision 19.
Provision 19 of the Code suggests that a company chair should not remain in post beyond nine years from their initial appointment to the board. Having considered this requirement, the Board agreed that it remained appropriate to renew Richard’s appointment for a further term of one year. The Nominations Committee has commenced the succession process to replace him, and it is intended that a full handover will be achieved before the 2022 AGM. Following his re-election at the 2021 AGM, Richard will remain as Chair of the Nominations Committee but will not chair the Committee meetings dealing with the appointment of his successor.
It is also proposed that Richard will step down from his membership on the Remuneration Committee immediately after the 2021 AGM, in line with Provision 32 of the UK Corporate Governance Code.
In Richard Grant, we are fortunate to have an exceptional Non-Executive Director who has served on the Board for nearly nine years, the latter two as Chairman. Richard encourages open and candid discussion in the boardroom, including the constructive challenge of the Executive Directors. The business has been through considerable change over the time Richard has been on the Board, streamlining the portfolio to focus on offices in London. More recently, Richard has chaired the Board effectively whilst faced with the challenges presented by the Covid-19 pandemic. Against this backdrop Richard has developed and maintained the strong, stakeholder-focused culture that is core to Helical. Under his leadership, the Company has delivered strong results and generated significant value for Shareholders.
During the year under review, Richard worked closely with the CEO to formulate the Company’s succession plans. Whilst these plans are being implemented, the Board regard Richard’s continued management and oversight of the plans he developed to be in the Company’s best interests. In particular, Richard will be leading the search for a new Non-Executive Director and will also be conducting a detailed handover of the Chairman’s role to his successor over the course of next year.
In coming to the decision to extend Richard Grant’s tenure beyond nine years, the Board considered the risks of having a non-independent chair on the Board’s effectiveness and its dynamics. Richard Cotton, the Senior Independent Director, led the 2021 internal evaluation of the Chairman’s performance and more details of this process can be found on page 98.
The Board appreciates the Company’s broader role in society and the need to engage with all those affected by its endeavours. The Board prioritises its duty to promote the success of the Company whilst having regard to all its stakeholders and contributing to the wider society. Helical’s stakeholders are clearly defined and the Board actively engages with each of these groups on a regular basis (for more information on how this is demonstrated in practice, see the s172(1) Companies Act 2006 and Stakeholder Engagement section on pages 72 to 81). How the Board members discharged their statutory s172(1) Duties when making Principal Decisions is described on page 73.
The Board and its Committees review workforce policies and procedures on an annual basis and more frequently, if required. As part of the annual review process, the Board considers each policy and procedure in the context of desired behaviours and practices and ensures that they remain aligned to Helical’s Culture and support long-term sustainability and success (see also page the Strategic Report, pages 76 to 77). For example, the Remuneration Committee takes the pay policies and practices of the wider workforce into consideration when determining the remuneration packages of the Executive Directors. For more information on this, please see the Remuneration Committee Report on pages 103 to 125. The Purpose and Values of the Company are also taken into account when setting the Group’s Remuneration Policy and structure. Details of this can be found in the Report of the Remuneration Committee at pages 103 to 125.
As part of its leadership responsibilities, the Board continually monitors the Culture of the business and during the reporting period, our designated Non-Executive Director for workforce engagement, Sue Clayton, helped shape the Company’s Culture through information sharing and engagement between the Board and the workforce. During the reporting period, the Board approved the publication of a terms of reference for the role of the designated Non-Executive Director for workforce engagement and this document serves to reinforce the Company Culture of effective engagement with the workforce. For more information on Sue’s role in enabling the Board to monitor the Company’s Culture and in ensuring that the Culture is reflected in decision making, please see pages 76 to 81.
Another effective way in which Helical has monitored its Culture throughout the period is through individual staff interviews. Please see page 81 for more details on how the staff interviews are used to monitor Culture and how the outcomes of the interviews have been considered by the Board and the Executive Management team.
Corporate Governance Report structure We have restructured our Corporate Governance Report to reflect the five pillars of the Code:
Some of the information required by the Code is included in the Strategic Report and is cross-referenced with the Corporate Governance Report to avoid unnecessary duplication.
I BOARD LEADERSHIP AND COMPANY PURPOSE
III COMPOSITION, SUCCESSION AND EVALUATION
II DIVISION OF RESPONSIBILITIES
IV AUDIT, RISK AND INTERNAL CONTROL
V REMUNERATION
Underpinning Helical’s Business Model is a commitment to strong corporate governance, an essential component of the Company’s objective of long-term value creation for stakeholders whilst having a beneficial impact on society and taking responsibility for its effect on the environment. Corporate governance plays an important role in the strategic management of our business and it is through the alignment of stakeholder interests with management actions that the direction and performance of Helical are determined. The Board applies the overarching principles of good corporate governance: Fairness, Accountability, Responsibility and Transparency when formulating and delivering its strategy. These principles underpin the Board’s activities, including but not limited to, the oversight of financial reporting and auditing, remuneration of senior executives, stakeholder relations and communications, risk management and internal control, ethics, ESG and sustainability. The application of these principles of good corporate governance supports the Board in ensuring that it effectively promotes the long-term success of the Company.
I BOARD LEADERSHIP AND COMPANY PURPOSE
Our values: Integrity Excellence Collaboration Creative Sustainable Dynamic
CO
RP
OR
AT
E G
OV
ER
NA
NC
E R
EP
OR
T88 Helical plc Annual Report and Accounts 2021 89Helical plcAnnual Report and Accounts 2021

CORPORATE GOVERNANCE REPORT CONTINUED
ANNUAL STRATEGY SESSIONThe Group’s core activities are performed within the governance and strategic framework set by the Board. However, Helical’s strategy is continually overseen by the Board throughout the year, and reviewed as necessary. For example, changes to strategy may be implemented in the event of significant changes to market conditions or to align the Company’s objectives with the interests of its stakeholders.
In September 2020, the Board met for its annual strategy session at which all the Directors were in attendance. The annual meeting provides a forum, outside the quarterly Board meetings, for the Board members to come together to focus their discussions on strategy, drawing upon the breadth of experience and insights of the Non-Executive Directors.
The Directors were provided with reading materials in advance of the session to allow for prior consideration of the agenda items.
At the outset of the meeting, a presentation on the outlook for the London Office Market was provided by CBRE. The Board’s discussions focused on the economic climate and outlook, including the impact of Covid-19, the property market, Sustainability and the interests of Shareholders and other stakeholders, with the strategic options available to the Company being carefully deliberated in light of these factors.
The meeting concluded with key actions which were incorporated into the Group’s strategy for the forthcoming year.
Due to the Government restrictions that have been in place throughout a majority of the reporting period, the Chairman has not been able to attend Shareholder meetings in person, but has made himself available for meetings at the request of our Shareholders. Any feedback from the Chairman’s interactions with Shareholders are reported directly to the Board. The Directors strive to maintain effective corporate leadership by integrating stakeholder engagement with the accepted core functions of the Board. For more details on how the Board discharges this key responsibility of engagement, please see the Stakeholder Engagement section on pages 72 to 81.
Senior Independent DirectorThe Senior Independent Director (“SID”) has acted, and continues to act, as a sounding board for the Chairman and as an intermediary for the other Directors and Shareholders. The SID is available to Shareholders for meetings or to discuss any concerns which have not been resolved through, or would be inappropriate to resolve through, the normal channels of communication with the Chairman, Chief Executive or other Directors.
The annual appraisal of the Chairman’s performance was conducted by the SID as part of the 2020/21 internal Board evaluation (for further details, please see page 98).
Designated Non-Executive Director for workforce engagementSue Clayton was appointed to the role of designated Non-Executive Director for workforce engagement in 2019 and her role is key to facilitating meaningful engagement between the Board and the wider workforce and ensuring that the interests of the Helical employees are considered in Board discussions and decision making. For more information on the this role at Helical, please see pages 80 and 81 of the Strategic Report.
The detailed roles of the Chairman, CEO, SID and designated Non-Executive Director for workforce engagement are available on our website: https://www.helical.co.uk/investors/corporate-governance/
Company SecretaryOur Company Secretary plays a leading role in the good governance of the Company. Under the direction of the Chairman, the Company Secretary’s responsibilities include:
• Maintaining a record of attendance at Board meetings and Committee meetings;
• Responsible for ensuring good information flows to the Board and its Committees, and between the Executive Committee and the Non-Executive Directors;
• Advising the Board on all regulatory and corporate governance matters; and
• Assisting the Chairman in ensuring that the Directors have suitably tailored and detailed induction and ongoing training and professional development programmes.
Information and professional development The Chairman, with support from the Company Secretary, is responsible for ensuring that the Directors receive clear and accurate information in a timely manner. Throughout their Board tenure, the Directors are encouraged to develop their knowledge of the Group through property tours, meetings with stakeholders and meetings with members of senior management. The Board is also kept appraised of all relevant updates with respect to relevant legislative and regulatory requirements and all corporate governance matters. All Directors have access to the services and advice of the Company Secretary.
EFFECTIVENESS Matters considered by the Board in 2020/21
Corporate responsibility
• Receipt of reports from the Sustainability Committee to assess the Company’s approach to sustainability and establish a future strategy with objectives;
• Approval of the Group Diversity and Inclusion Policy; and
• Appointment of designated Non-Executive Director for ESG & Sustainability.
Strategy
• Review of corporate objectives;
• Review of market trends, opportunities and risks;
• Annual off-site Board Strategy meeting focused on strategy;
• Receipt of regular strategy updates; and
• Approval and publication of the Group Sustainability Strategy, “Built for the Future”, and consideration of future sustainability projects.
Property transactions and operations
• Approval of material property transactions and opportunities e.g. The Powerhouse Portfolio, Manchester;
• Letting of Kaleidoscope to TikTok; and
• Review of independent valuations of properties.
Financial and operational performance
• Approval of the Company’s full year and half year results;
• Review of the capital and debt structure;
• Assessment of viability and going concern, including sensitivity analysis;
• Receipt of regular reports from the Chief Executive and the Finance Director;
• Approval of the Group budget;
• Review of the dividend policy and recommendation of the 2020 final dividend and approval of the 2021 interim dividend;
• Receipt of presentations from senior management from across the business and consideration of reports on matters of material importance to the Company; and
• Approval of major capital and operating expenditure proposals;
• Review of financing proposals.
Governance and risk
• Continued consideration of the strategic implications of the Covid-19 pandemic;
• Financial crime risks review and mitigation;
• Oversight of the Group’s Health & Safety Policy;
• Quarterly review of the Group’s Health and Safety performance;
• Review of risk strategy and risk appetite and reaffirming the Group’s Risk Framework;
• Bi-annual review of principal and emerging risks facing the Group;
• Continued consideration of cyber security;
• Continued consideration of Brexit implications and mitigating strategies;
• Internal control system review;
• Receipt of regular reports and updates on governance matters;
• Continuous review of UK Corporate Governance legislation and guidance – 2018 UK Corporate Governance Code, FRC’s Guidance on Board Effectiveness and The Companies (Miscellaneous Reporting) Regulations 2018;
• Review of its governance processes e.g. meeting frequency;
• Participation in the internally facilitated Board evaluation;
• Annual review and approval of Board policies and procedures, Schedule of Matters Reserved for the Board and Committee terms of reference; and
• Review and approval of the annual Modern Slavery Statement.
People
• Review of succession and talent management processes within the Group;
• Monitoring of performance and continued development of Health and Safety risk mitigation;
• Receipt of feedback from the designated Non-Executive Director regarding the employee engagement sessions and consideration of issues raised;
• Approval of Group Remuneration Policy and structure;
• Review of staff engagement mechanisms including oversight and review of Company whistleblowing procedures;
• Executive and Non-Executive development and succession planning;
• Evaluation of the Board’s effectiveness; and
• Engagement with the Company’s stakeholders and consideration of their interests when making Board decisions (see Section 172(1) Companies Act 2006 and Stakeholder Engagement sections on pages 72 to 81).
The Helical Board is suitably balanced, with more than half of the Board, excluding the Chairman, being independent Non-Executive Directors.
The Non-Executive Directors are responsible for constructively challenging and helping to develop proposals on strategy. They are also responsible for applying independent and objective judgement and scrutiny to all matters before the Board and its Committees. Throughout the reporting period, the Non-Executive Directors have received information from JP Morgan Cazenove and Numis Securities Limited to help enhance their understanding of the views of Helical’s major Shareholders.
The Board is satisfied that all the Directors are able to allocate sufficient time to the Company to discharge their responsibilities effectively. Upon appointment, the Non-Executive Directors are also required to inform the Chairman of their external appointments prior to their acceptance of a role on the Board. In addition, the Chairman’s time commitments are subject to review by the Senior Independent Director, in conjunction with the other Non-Executive Directors. The Board reviews the Conflict of Interest register at each Board meeting. For details of the Directors’ current external commitments, please see “Our Board” section on pages 84 to 87.
There is a clear division of responsibilities between the running of the Board and the Executive Directors’ responsibility for running the business. An honest and open culture exists between both the Executive and Non-Executive Directors, enabling the Non-Executives to provide constructive challenge and give specialist advice and guidance on strategy.
This open forum extends beyond the boardroom and can be evidenced by the Board’s usage of an instant messaging platform to share real time, key business updates.
The Executive Committee, led by the Chief Executive, is responsible for ensuring the Group’s strategy is communicated and implemented. It is comprised of the three Executive Directors and two senior managers and usually meets monthly, or more frequently if required. Given the size of the organisation, the importance of succession planning within the executive team is a key area of focus for the Board. Further details on succession planning can be read in the Nominations Committee Report on pages 94 to 98.
Chairman and Chief ExecutiveThe positions of Chairman and Chief Executive are held separately, and their roles and responsibilities are clearly established, set out in writing and agreed by the Board. The Chairman is responsible for the leadership of the Board and ensuring its effectiveness. The Chief Executive is responsible for the leadership of the business and managing it within the authorities delegated by the Board. Alongside boardroom discussions, the Chairman maintains contact with the Non-Executive Directors by telephone and, at least annually, will invite only the Non-Executive Directors to attend a meeting to discuss Company matters.
II DIVISION OF RESPONSIBILITIES
I BOARD LEADERSHIP & COMPANY PURPOSE
CO
RP
OR
AT
E G
OV
ER
NA
NC
E R
EP
OR
T90 Helical plc Annual Report and Accounts 2021 91Helical plcAnnual Report and Accounts 2021

Board meetings during the reporting periodRegular Board meetings are scheduled each year and the Directors allocate sufficient time to the Company to discharge their responsibilities effectively, with the Non-Executives in particular providing constructive challenge and strategic guidance and offering specialist insight and advice based on their experience (see page 84 to 87 for the diverse skill set of the Board, which provides for balanced and effective leadership of the Company). During the year ended 31 March 2021 six scheduled Board meetings were held, with an additional two unscheduled meetings held to discuss specific issues and events.
The Board also held its annual offsite strategy event in September 2020, which enabled focused discussions relating to the Group’s strategy. The strategy event was structured to facilitate formal discussions during the day followed by more informal discussion in the evening (see also page 90 for further details).
Board attendance at scheduled meetingsBoard meetings – 1 April to 31 March 2021 Attendance
Richard Grant, Non-Executive Chairman 6/6
Gerald Kaye, Chief Executive Officer 6/6
Richard Cotton, Senior Independent Director 6/6
Sue Clayton, Non-Executive Director 6/6
Joe Lister, Non-Executive Director 6/6
Sue Farr, Non-Executive Director 6/6
Tim Murphy, Finance Director 6/6
Matthew Bonning-Snook, Property Director 6/6
BOARD
NOMINATIONS COMMITTEE Ensures there is a formal, rigorous and transparent procedure for the appointment and induction of new Directors to the Board, leads the process for Board appointments and succession planning (including the development of a diverse succession pipeline) and supports the annual Board evaluation process.
Committee members:• Richard Grant (Chair)*
Independent Non-Executive Director
• Sue Clayton Independent Non-Executive Director
• Richard Cotton Independent Non-Executive Director
• Joe Lister Independent Non-Executive Director
• Sue Farr Independent Non-Executive Director
Please also see Report of the Nominations Committee on pages 94 to 98.
* Richard Grant will not chair the Committee meetings which deal with the appointment of his successor.
AUDIT AND RISK COMMITTEE Assists the Board in fulfilling its oversight responsibilities by reviewing and monitoring: the integrity of financial information provided to Shareholders; the Company’s system of internal controls and risk management; the external audit process and auditors; and the processes for compliance with laws, regulations and ethical codes of practice.
Committee members:• Joe Lister (Chair)
Independent Non-Executive Director
• Sue Clayton Independent Non-Executive Director
• Richard Cotton Independent Non-Executive Director
• Sue Farr Independent Non-Executive Director
Please also see Report of the Audit and Risk Committee on pages 99 to 102.
REMUNERATION COMMITTEE Assists the Board in fulfilling its responsibility to Shareholders to ensure that the Remuneration Policy and practices of the Company reward fairly and responsibly, with a clear link to corporate and individual performance, having regard to statutory and regulatory requirements.
Committee members:• Sue Farr (Chair)
Independent Non-Executive Director
• Sue Clayton Independent Non-Executive Director
• Richard Cotton Independent Non-Executive Director
• Richard Grant* Independent Non-Executive Director
• Joe Lister Independent Non-Executive Director
Please also see Report of the Remuneration Committee on pages 103 to 125.
* Richard Grant will be stepping down from the Remuneration Committee immediately after the 2021 AGM.
PROPERTY VALUATIONS COMMITTEE Reviews the valuations of the Company’s property portfolio and reports to the Audit and Risk Committee on its findings.
Committee members:• Sue Clayton (Chair)
Independent Non-Executive Director
• Gerald Kaye Chief Executive
• Matthew Bonning-Snook Property Director
• Tom Anderson Senior Investment Executive
Please also see Report of the Audit and Risk Committee on pages 99 to 102.
SUSTAINABILITY COMMITTEEAssists the Board in setting and monitoring the Company’s sustainability strategy, policies, targets and performance.
Committee members:• Matthew Bonning-Snook (Chair)
Property Director • Laura Beaumont
Head of Sustainability • John Inwood
Head of Asset Management • Pavlos Clifton
Senior Development Executive • Lois Robertson
Operations Manager
For further details on the Group’s sustainability initiatives, please see pages 60 to 71.
GOVERNANCE STRUCTURE
The Board’s main responsibilities include, but are not limited to:
• providing overall leadership of the Group and for setting its long-term strategic aims;
• establishing the Company’s Purpose, Values and Culture, and ensuring that these are aligned with the Company’s strategic aims and objectives;
• approving changes to the Group’s capital, corporate and governance structures;
• reviewing management and operational performance;
• oversight and approval of the Group’s financial reporting;
• approving the risk appetite of the Company and ensuring the maintenance of a robust system of controls and risk management;
• review of the adequacy and security of the Company’s
arrangements for its workforce to raise concerns, in confidence, about possible wrongdoing in financial reporting or other matters;
• approving major capital projects, investments and divestments above limits of authority delegated by the Board;
• approving resolutions and corresponding documentation to be put to Shareholders at general meetings, circulars and listing particulars;
• ensuring satisfactory dialogue, and approving all formal communications, with Shareholders;
• ensuring effective engagement with, and encouraging participation from, the Company’s stakeholders;
• approval of policies on matters such as Health and Safety, Corporate Social Responsibility and the environment; and
• oversight of all corporate governance matters.
Board members • Richard Grant (Independent Non-Executive Chairman) • Gerald Kaye (Chief Executive) • Richard Cotton (Senior Independent Director) • Sue Clayton (Independent Non-Executive Director) • Joe Lister (Independent Non-Executive Director) • Sue Farr (Independent Non-Executive Director)• Tim Murphy (Finance Director) • Matthew Bonning-Snook (Property Director) Secretary• Secretary to the Board: James Moss
Please also see the Schedule of Matters reserved for the Board, available to download at https://www.helical.co.uk/investors/corporate-governance
COMMITTEES SUB-COMMITTEES
The Committees’ terms of reference are available to download at https://www.helical.co.uk/investors/corporate-governance
EXECUTIVE COMMITTEEAssists the Chief Executive Officer in the performance of his duties and ensures that the Group’s strategy is implemented, subject to the limitations of authority set out in the Schedule of Matters Reserved for the Board.
Committee members:• Gerald Kaye (Chair)
Chief Executive• Tim Murphy
Finance Director • Matthew Bonning-Snook
Property Director• James Moss
Group Financial Controller and Company Secretary
• Tom Anderson Senior Investment Executive
Key Investor Relations activities 2020
June Annual results announcement and analysts presentation for 2020 (virtual, Covid-19)
June Investor Roadshow presentations (virtual, Covid-19)
July AGM Trading Update
Annual General Meeting (closed, Covid-19)
October Portfolio and trading update
November Half Year results announcement and analysts presentation for 2020 (virtual, Covid-19)
November/December
Investor Roadshow presentations (mostly virtual, Covid-19; some in-person)
2021
April Portfolio and trading update
Annual General Meeting For details of the resolutions passed at the 2020 AGM and the voting results, please visit our website: https://www.helical.co.uk/investors/shareholder-information/agm/
Fair, balanced and understandable – the Board’s responsibility The Code requires the Board to ensure that, taken as a whole, the Annual Report and Accounts present a fair, balanced and understandable assessment of the Group’s position and prospects. In reviewing the Annual Report and Accounts, the Audit and Risk Committee considered the points set out in its report on pages 99 to 102. After such a review, the Audit and Risk Committee reported its findings to the Board. For the Directors’ statement in this regard, please see page 129.
CORPORATE GOVERNANCE REPORT CONTINUED
II DIVISION OF RESPONSIBILITIES II DIVISION OF RESPONSIBILITIES
CO
RP
OR
AT
E G
OV
ER
NA
NC
E R
EP
OR
T92 Helical plc Annual Report and Accounts 2021 93Helical plcAnnual Report and Accounts 2021

NOMINATIONS COMMITTEE
DEAR SHAREHOLDER,I am pleased to present the Nominations Committee Report covering the work of the Committee during the year to 31 March 2021.
The Committee met three times over the year and spent a significant proportion of its time considering the composition of the Board and its Committees and developing succession pipelines for my role and that of senior management. In addition, the Committee oversaw the 2021 Board Effectiveness Review which was conducted internally.
In line with the 2018 UK Corporate Governance Code (the ”Code”), we have changed the structure of the Nominations Committee Report from that presented in previous years, focusing on the three core areas discussed in Section 3 of the Code: Composition, Succession and Evaluation.
BOARD COMPOSITIONThe Nominations Committee evaluates the balance of skills, experience, diversity and knowledge on the Board. The Committee considers the Board and its Committees to be functioning efficiently and effectively. The Board and its Committees discharge their respective duties successfully with the appropriate level of challenge and independence. Based on its review of the composition of the Board and its Committees over the period, the Nominations Committee is satisfied that the members of the Board, in conjunction with the senior management, are well equipped to achieve the Company’s strategic objectives.
Director appointments are made against objective criteria and are based on experience and merit. This supports the Group’s strategy to maintain an appropriate combination of skills, experience, independence and knowledge on the Board and its Committees. On an annual basis, the Nominations Committee formally considers the composition of the Board and its Committees, and focuses its review upon the balance of skills, experience, length of service, knowledge of the Group and wider diversity considerations. This review is aided by the use of a skills matrix. The Committee also keeps the composition of the Board and its Committees under review throughout the year.
Whilst there have been no changes to the composition of the Board itself during the period, Sue Farr assumed the role of Chair of the Remuneration Committee at the 2020 AGM, succeeding Richard Cotton who had fulfilled the role on an interim basis following the retirement of Michael O’Donnell in July 2019.
Sue was identified as a suitable candidate for the role of Remuneration Committee Chair during the rigorous non-executive recruitment process operated externally by the independent advisory firm, Korn Ferry, in May 2019 (for an overview of the non-executive director recruitment process see diagram below). Following her appointment to the Board, she became a member of the Company’s Remuneration Committee. Sue did not assume the Remuneration Committee Chair role immediately, as it was felt necessary to allow her a period of time to familiarise herself with the business of the Group and its governance structure.
Sue was selected for the role of Remuneration Committee Chair due to her extensive remuneration committee experience. She is the chair of the Accsys Technologies plc Remuneration Committee and is a member of the British American Tobacco plc Remuneration Committee. Sue was also previously the chair of the Millennium & Copthorne Hotels plc Remuneration Committee and was a member of the Dairy Crest Group plc Remuneration Committee.
Sue’s biography can be found on page 87.
Diversity – Board levelThe Helical Board fosters an inclusive and diverse culture which is fundamental to talent retention, growth and delivery of performance and enhancement of long-term success. Diversity and inclusion is embraced throughout the Group, and underpins each of our Values which support the execution of the Board’s strategic objectives, and is key to the achievement of the Company’s Purpose. A diverse Board includes and makes good use of differences in the skills, experience, background, race, sexual orientation, gender and other characteristics of directors as set out in the Equality Act. The skills and backgrounds collectively represented on the Board should reflect the diverse nature of the environment in which Helical operates and improve its effectiveness through diversity of approach and thought.
In accordance with the Committee’s terms of reference and on behalf of the Board, the Committee regularly reviews the diversity of the Board and its Committees, taking account of the Company’s strategic priorities, and making recommendations to the Board about any changes that are deemed necessary. Board diversity is a key consideration when recommending future Board appointments and conducting succession planning exercises.
Our policy on Board diversity, adopted during the reporting period, reflects our continued commitment to promote an inclusive and diverse culture.
BOARD DIVERSITY POLICY OBJECTIVES:
• In reviewing Board composition, the Committee will consider the benefits of all aspects of diversity including, but not limited to, those described above, in order to enable it to discharge its duties and responsibilities effectively and to guard against “group think”.
• The Committee will oversee the development of a diverse pipeline for succession to the Board. The Committee is committed to ensuring that candidate lists for Board positions are compiled by drawing from a broad and diverse range of candidates.
• In identifying suitable candidates for appointment to the Board, the Committee will consider both internal and external candidates on merit against objective criteria and with due regard to the benefits of Board diversity.
• The Committee will strive to engage executive search firms who have signed up to the UK Voluntary Code of Conduct on Gender Diversity.
• As part of the annual Board evaluation, the Committee will review the composition of the Board and consider: the balance of competencies to ensure alignment to Helical’s Purpose and strategic priorities; the environment in which it operates; the characteristics, perspectives, independence and diversity of Board members; how the Board works together; and other factors relevant to its effectiveness.
• The Committee may set targets for Board diversity on a regular basis and will oversee plans for diversity and inclusion and assess progress annually.
Committee membership and attendance Attended Absent
IndependentCommittee meeting
attendance
Richard Grant (Chair)* Yes Sue Clayton Yes Richard Cotton Yes Sue Farr Yes Joe Lister Yes
* Richard Grant will not chair the Committee meetings which deal with the appointment of his successor.
RICHARD GRANT CHAIR OF THE NOMINATIONS COMMITTEE
KEY HIGHLIGHTS FOR 2020/21• Sue Farr, independent
Non-Executive Director, appointed as Chair of the Remuneration Committee
• Internal Board evaluation conducted at the beginning of 2021
• Succession planning for the Board and senior management
KEY AREAS OF FOCUS DURING 2021/22• Appointment and induction
of new Chairman of the Board and new Non-Executive Director
• Succession pipeline for Senior Management to remain under review
• Continued focus on diversity throughout all levels of the organisation
• Board evaluation to be conducted internally in early 2022
The Company Secretary acts as secretary to the Committee.
The Committee’s terms of reference are available to download at: https://www.helical.co.uk/investors/corporate-governance/
Directors’ elections In compliance with the Code, all the Directors shall be subject to annual re-election and will therefore put themselves forward for re-election at the 2021 Annual General Meeting (“AGM”) of the Company. Please see the Notice of Meeting of the 2021 AGM for additional information and the recommendations on re-election. The Board is satisfied that each of the Directors being put forward for re-election continue to be independent (other than the Chairman post July 2021 – see page 88) and that they continue to be effective and dedicated to the role.
III COMPOSITION, SUCCESSION AND EVALUATION
III COMPOSITION, SUCCESSION AND EVALUATION
CO
RP
OR
AT
E G
OV
ER
NA
NC
E R
EP
OR
T94 Helical plc Annual Report and Accounts 2021 95Helical plcAnnual Report and Accounts 2021
DIRECTOR APPOINTMENT PROCESS
Role requirements and criteria: The Committee, in conjunction with the Chief Executive, agrees objective criteria for appointees – skills, knowledge, experience and personal attributes relevant to the Group’s strategy whilst also promoting diversity of gender, social and ethnic backgrounds.
Search process: Under the direction of the Committee, an independent executive search provider (Korn Ferry in 2019/20) is engaged to facilitate the search process.
Review: Details of preferred candidates are presented to, and considered by, the Committee. Shortlisted candidates are interviewed by a sub-committee of the Board.
Recruitment: The Committee considers feedback from interviews and, after careful consideration, recommends appointments to the Board.
Induction: Newly appointed Directors undergo an induction schedule bespoke to their needs.

During the year under review, 40% of the Group’s female employees held professional qualifications, providing a positive balance of gender in our talent pool. In order to maintain a diverse and inclusive business, Helical supports part-time, job-sharing and flexible working requests wherever possible. During the year under review 18% of the workforce carried out their roles on a part-time basis. The overall gender balance of the workforce can be found on page 70.
The Board supports the findings of the Hampton-Alexander Review with respect to increasing gender diversity in company leadership below board level. The Board is committed to strengthening the pipeline of senior female executives within the business and will continue to develop the Group’s policies and practices to support women succeeding at the highest levels possible at Helical. Diversity is a key point of focus for the Nominations Committee in both Board and senior management level succession planning – see pages 95 to 97.
Director independence and effectiveness Following due consideration of each Director’s tenure, alongside the commitment and effective contribution demonstrated in relation to their respective roles, the Committee has recommended to the Board that resolutions to re-elect each Non-Executive Director be proposed at the AGM alongside resolutions to re-elect the Executive Directors. The Committee ensures that Board appointees have enough time available to devote to the appointed role. To enable the Board to identify any potential conflicts of interest and ensure that Directors continue to have sufficient time available to devote to the Company, Directors are required to inform the Board of any changes to their other significant commitments.
Non-Executive Directors' tenure
1-3 years3-6 yearsOver 6 years
40%50%10%
40
10
40
From the 2021 AGM, I will have served on the Board for over nine years and the Board considers such a diversion from the recommendations of the Code is in the best interests of the Company and its stakeholders. For more information regarding the decision to extend my tenure, please see page 88.
Whilst Helical does not set specific targets for diversity on the Board, it recognises the recommendations of the Hampton-Alexander Review and will strive to increase the number of female Board members over time provided that this is consistent with other skills and requirements. With respect to gender diversity, female representation on the Board of Directors currently stands at 25%.
The Board will continue to focus on the levels of diversity amongst its Directors, and aiming to make improvements to such levels, in order to promote the success of the Company, thereby generating value for Shareholders and contributing to wider society.
In accordance with the Group’s diversity objectives, the Board chooses to engage external search firms who are signatories to the UK Voluntary Code of Conduct for Executive Search Firms to address gender diversity on corporate boards. The Company is also a signatory to Real Estate Balance, a cross industry organisation which has, since 2017, focused on helping to increase the number of women operating in senior positions in the real estate sector. Since 2019, Helical has been a signatory to the Real Estate Balance CEO’s Commitments for Diversity and the Group supports the principles on leadership, culture and opportunity contained in the Real Estate Balance Toolkit, designed to support a more diverse workplace.
Diversity and Inclusion in the workforce:Helical is dedicated to promoting and celebrating the positive effect that diversity has, both in the workplace and within the wider community, and this is embedded within the Company’s Culture. In addition, the Board is focused on ensuring that the views of its workforce and other stakeholders are taken into account, and that an environment of inclusivity is promoted at all times.
By ensuring that Helical is an inclusive and diverse business, the Group benefits from a variety of experiences and perspectives, stimulating creativity and contributing to our open and cohesive culture. In addition, benefits extend to the development of a diverse succession pipeline, necessary for future sustainability.
The Board’s key objectives with regards to diversity and inclusion in the workforce are documented in the Company’s Diversity and Inclusion Policy which can be found on our website: https://www.helical.co.uk/investors/corporate-governance/
The Board will be monitoring and reviewing the Company’s progress with regards to its Diversity and Inclusion (“D&I”) initiatives by assessing the successful delivery of Company strategy over time against the objectives set. Success will also be measured using the information gathered through the Company’s employee engagement initiatives (please see Our Stakeholders – Section 172(1) Statement section on pages 72 to 81).
Helical’s Employment Policy supports its D&I objectives, whereby all employee candidates are considered fairly and without prejudice or discrimination. The policy also supports the enhancement of our employees’ career development. The Company’s Employment Policy can also be found on our website: https://www.helical.co.uk/investors/corporate-governance/.
Female representation on the Board of Directors
25%Group’s female employees with professional qualifications
40%
Chairman’s succession As a result of my tenure exceeding the nine years recommended by the Code after July 2021, the Committee recognised the need to plan for the appointment of my successor. The Committee will ensure that the incoming Chairman is independent upon appointment and that the appointment process is discussed with an external Board recruitment services firm. I will not chair the Committee meetings dealing with the appointment of my successor in line with Provision 17 of the Code.
It is envisaged that I will step down from the Board at the 2022 AGM at which the appointment of my successor will also be proposed. The Committee will ensure that a full, formal and tailored programme of induction will be conducted with my successor prior to appointment. For details of the reasoning behind the extension of my tenure, please see page 88.
In advance of my departure, the Committee plans to appoint an additional Non-Executive Director to the Board. A formal, transparent and rigorous recruitment process for this role will be conducted with the assistance of an external search consultancy.
Given the size of the Company, whilst it is always the Committee’s aim to nurture and promote existing talent when recruiting for senior leadership and Board roles, the Group will also utilise the expertise of the external search consultants to ensure that the best possible range of diverse candidates is considered.
The objectives of the Board Diversity Policy will be implemented throughout the search process and we will report on how we have met these objectives in the report of the Committee next year.
SUCCESSIONThe Committee is responsible for making appointments to the Board and ensures that plans have been created to enable orderly succession to the Board, its Committees and the senior management team of Helical. In formulating succession plans, the Committee is cognisant of the need to develop a diverse pipeline of candidates, particularly with regard to gender and social and ethnic backgrounds, in order to equip the Group with the necessary skills and expertise it requires to drive long-term value creation and support its strategic aims. The Company’s Diversity and Inclusion Policy informs succession planning at all levels of the Company (see https://www.helical.co.uk/investors/corporate-governance/ for the full policy).
During the year, as part of the 2021 internal Board evaluation (see also Evaluation section below), the current skills and expertise of the Board members were assessed, with consideration being given to whether the skills and expertise were sufficient and broad enough to ensure the effective operation of the Board. The review of the Directors’ skill sets helped to identify gaps which will be used to inform the Committee when appointing future Board members. The Committee will continue to monitor the skills and capabilities, and length of tenure of Board members, recommending further appointments as necessary. For details of our Directors’ skills and capabilities and how they contribute to the Company’s long-term success, please see pages 84 to 87.
The Committee reviews the suitability of the Group’s succession plans below Board level at least once a year, as part of its annual strategic review. In 2019/20, the Committee instructed the Executive Committee to conduct a detailed review of the succession pipeline in the following year, considering the skills and strengths of all potential internal candidates, highlighting any gaps and training requirements. The process was designed to ensure that appropriate opportunities are in place to develop high performing individuals and enable proactive planning for succession in the executive team and across all levels of the business. Following its most recent review, the Executive Committee concluded that the Helical team displayed a good range of skills and that there were candidates who possessed the desired capabilities for progression to roles on the Executive Committee and the Board over time.
The Chief Executive presented the succession plan to the Nominations Committee for consideration in March 2021. The plan identified potential successors for the roles on the Board in the short and long term. The Committee was satisfied that plans remain sufficiently robust to enable vacancies to be filled on a short to medium-term basis. As part of the plan, gender and ethnic diversity were taken into account.
“ The Executive Committee concluded that the Helical team displayed a good range of skills and that there were candidates who possessed the desired capabilities for progression to roles on the Executive Committee and the Board over time.”
NOMINATIONS COMMITTEE CONTINUED
III COMPOSITION, SUCCESSION AND EVALUATIONIII COMPOSITION, SUCCESSION AND EVALUATION
CO
RP
OR
AT
E G
OV
ER
NA
NC
E R
EP
OR
T96 Helical plc Annual Report and Accounts 2021 97Helical plcAnnual Report and Accounts 2021
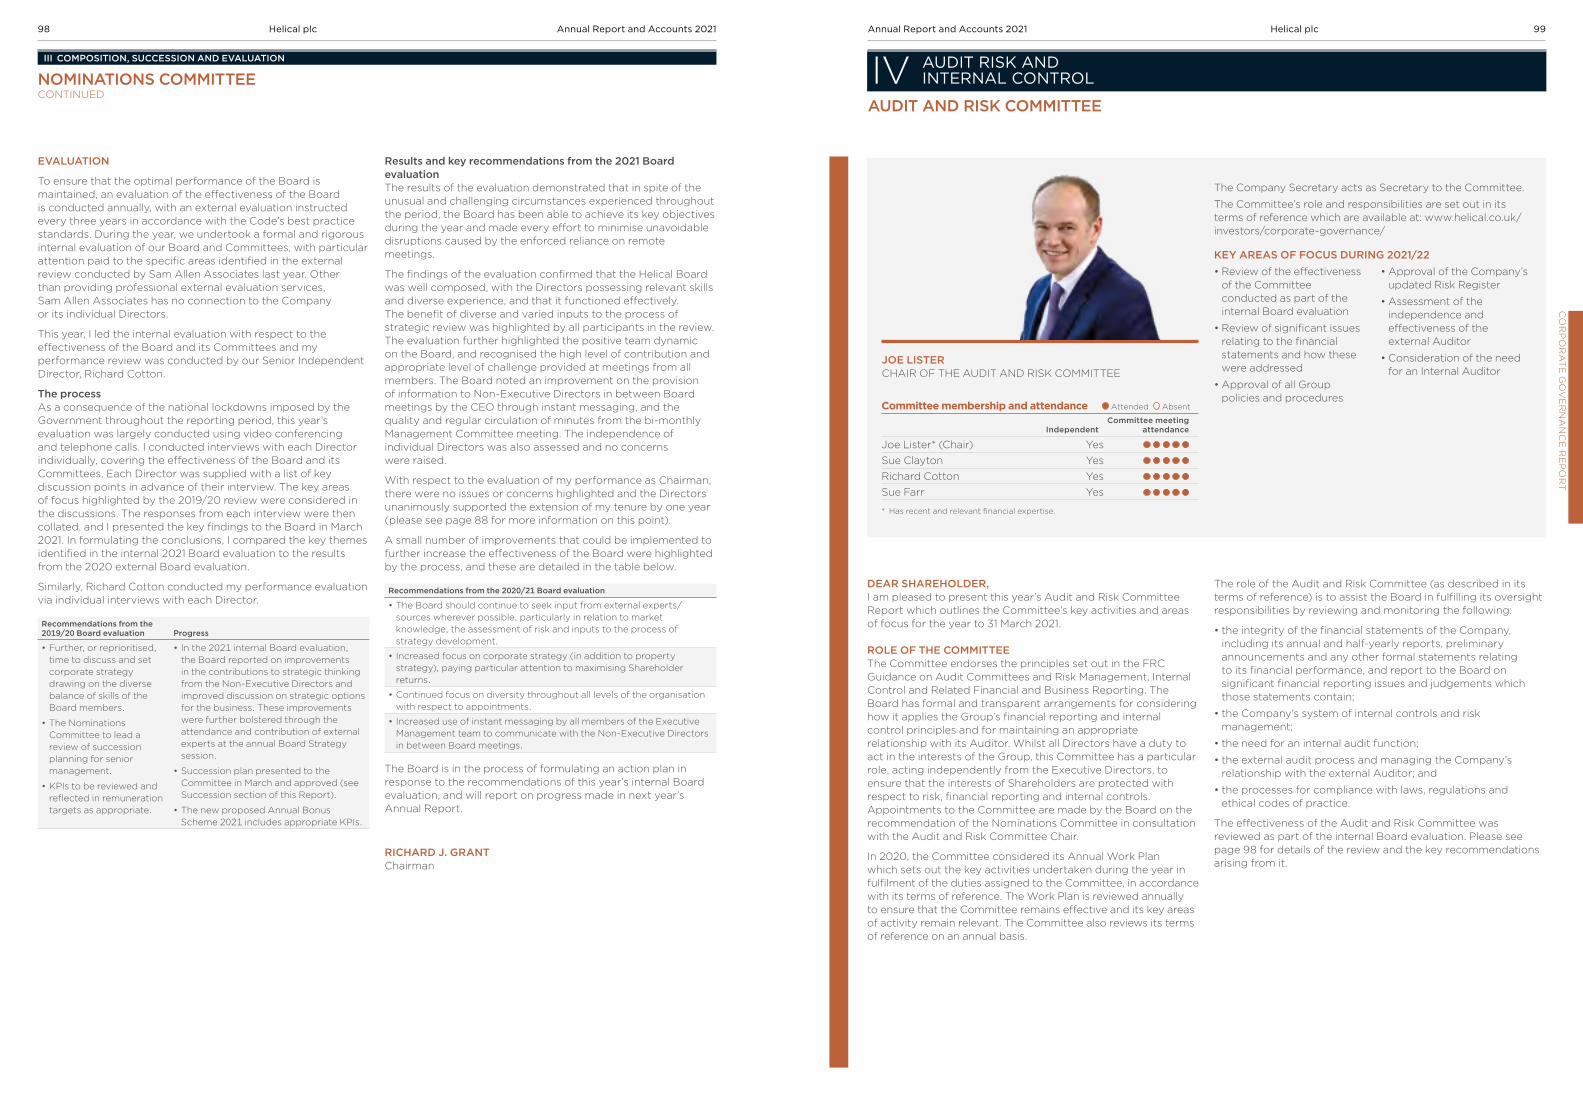
Results and key recommendations from the 2021 Board evaluationThe results of the evaluation demonstrated that in spite of the unusual and challenging circumstances experienced throughout the period, the Board has been able to achieve its key objectives during the year and made every effort to minimise unavoidable disruptions caused by the enforced reliance on remote meetings.
The findings of the evaluation confirmed that the Helical Board was well composed, with the Directors possessing relevant skills and diverse experience, and that it functioned effectively. The benefit of diverse and varied inputs to the process of strategic review was highlighted by all participants in the review. The evaluation further highlighted the positive team dynamic on the Board, and recognised the high level of contribution and appropriate level of challenge provided at meetings from all members. The Board noted an improvement on the provision of information to Non-Executive Directors in between Board meetings by the CEO through instant messaging, and the quality and regular circulation of minutes from the bi-monthly Management Committee meeting. The independence of individual Directors was also assessed and no concerns were raised.
With respect to the evaluation of my performance as Chairman, there were no issues or concerns highlighted and the Directors unanimously supported the extension of my tenure by one year (please see page 88 for more information on this point).
A small number of improvements that could be implemented to further increase the effectiveness of the Board were highlighted by the process, and these are detailed in the table below.
Recommendations from the 2020/21 Board evaluation
• The Board should continue to seek input from external experts/sources wherever possible, particularly in relation to market knowledge, the assessment of risk and inputs to the process of strategy development.
• Increased focus on corporate strategy (in addition to property strategy), paying particular attention to maximising Shareholder returns.
• Continued focus on diversity throughout all levels of the organisation with respect to appointments.
• Increased use of instant messaging by all members of the Executive Management team to communicate with the Non-Executive Directors in between Board meetings.
The Board is in the process of formulating an action plan in response to the recommendations of this year’s internal Board evaluation, and will report on progress made in next year’s Annual Report.
RICHARD J. GRANTChairman
EVALUATION
To ensure that the optimal performance of the Board is maintained, an evaluation of the effectiveness of the Board is conducted annually, with an external evaluation instructed every three years in accordance with the Code’s best practice standards. During the year, we undertook a formal and rigorous internal evaluation of our Board and Committees, with particular attention paid to the specific areas identified in the external review conducted by Sam Allen Associates last year. Other than providing professional external evaluation services, Sam Allen Associates has no connection to the Company or its individual Directors.
This year, I led the internal evaluation with respect to the effectiveness of the Board and its Committees and my performance review was conducted by our Senior Independent Director, Richard Cotton.
The processAs a consequence of the national lockdowns imposed by the Government throughout the reporting period, this year’s evaluation was largely conducted using video conferencing and telephone calls. I conducted interviews with each Director individually, covering the effectiveness of the Board and its Committees. Each Director was supplied with a list of key discussion points in advance of their interview. The key areas of focus highlighted by the 2019/20 review were considered in the discussions. The responses from each interview were then collated, and I presented the key findings to the Board in March 2021. In formulating the conclusions, I compared the key themes identified in the internal 2021 Board evaluation to the results from the 2020 external Board evaluation.
Similarly, Richard Cotton conducted my performance evaluation via individual interviews with each Director.
Recommendations from the 2019/20 Board evaluation Progress
• Further, or reprioritised, time to discuss and set corporate strategy drawing on the diverse balance of skills of the Board members.
• The Nominations Committee to lead a review of succession planning for senior management.
• KPIs to be reviewed and reflected in remuneration targets as appropriate.
• In the 2021 internal Board evaluation, the Board reported on improvements in the contributions to strategic thinking from the Non-Executive Directors and improved discussion on strategic options for the business. These improvements were further bolstered through the attendance and contribution of external experts at the annual Board Strategy session.
• Succession plan presented to the Committee in March and approved (see Succession section of this Report).
• The new proposed Annual Bonus Scheme 2021 includes appropriate KPIs.
DEAR SHAREHOLDER, I am pleased to present this year’s Audit and Risk Committee Report which outlines the Committee’s key activities and areas of focus for the year to 31 March 2021.
ROLE OF THE COMMITTEE The Committee endorses the principles set out in the FRC Guidance on Audit Committees and Risk Management, Internal Control and Related Financial and Business Reporting. The Board has formal and transparent arrangements for considering how it applies the Group’s financial reporting and internal control principles and for maintaining an appropriate relationship with its Auditor. Whilst all Directors have a duty to act in the interests of the Group, this Committee has a particular role, acting independently from the Executive Directors, to ensure that the interests of Shareholders are protected with respect to risk, financial reporting and internal controls. Appointments to the Committee are made by the Board on the recommendation of the Nominations Committee in consultation with the Audit and Risk Committee Chair.
In 2020, the Committee considered its Annual Work Plan which sets out the key activities undertaken during the year in fulfilment of the duties assigned to the Committee, in accordance with its terms of reference. The Work Plan is reviewed annually to ensure that the Committee remains effective and its key areas of activity remain relevant. The Committee also reviews its terms of reference on an annual basis.
The role of the Audit and Risk Committee (as described in its terms of reference) is to assist the Board in fulfilling its oversight responsibilities by reviewing and monitoring the following:
• the integrity of the financial statements of the Company, including its annual and half-yearly reports, preliminary announcements and any other formal statements relating to its financial performance, and report to the Board on significant financial reporting issues and judgements which those statements contain;
• the Company’s system of internal controls and risk management;
• the need for an internal audit function;
• the external audit process and managing the Company’s relationship with the external Auditor; and
• the processes for compliance with laws, regulations and ethical codes of practice.
The effectiveness of the Audit and Risk Committee was reviewed as part of the internal Board evaluation. Please see page 98 for details of the review and the key recommendations arising from it.
Committee membership and attendance Attended Absent
IndependentCommittee meeting
attendance
Joe Lister* (Chair) Yes Sue Clayton Yes Richard Cotton Yes Sue Farr Yes
* Has recent and relevant financial expertise.
JOE LISTER CHAIR OF THE AUDIT AND RISK COMMITTEE
KEY AREAS OF FOCUS DURING 2021/22• Review of the effectiveness
of the Committee conducted as part of the internal Board evaluation
• Review of significant issues relating to the financial statements and how these were addressed
• Approval of all Group policies and procedures
• Approval of the Company’s updated Risk Register
• Assessment of the independence and effectiveness of the external Auditor
• Consideration of the need for an Internal Auditor
The Company Secretary acts as Secretary to the Committee.
The Committee’s role and responsibilities are set out in its terms of reference which are available at: www.helical.co.uk/investors/corporate-governance/
AUDIT AND RISK COMMITTEE
IV AUDIT RISK AND INTERNAL CONTROLNOMINATIONS COMMITTEE
CONTINUED
III COMPOSITION, SUCCESSION AND EVALUATION
CO
RP
OR
AT
E G
OV
ER
NA
NC
E R
EP
OR
T98 Helical plc Annual Report and Accounts 2021 99Helical plcAnnual Report and Accounts 2021
THE WORK OF THE COMMITTEE DURING THE YEAR The Committee met five times during the year and a record of Director attendance for these meetings is shown on the previous page. It is common practice at Helical for Audit and Risk Committee meetings to be attended by all Board members, whether or not they are members of the Committee, as their experience is highly valued and their contribution welcomed in Committee discussions. The Company’s external Auditor, Deloitte, are also invited to attend all or part of meetings as appropriate and over the period, the Committee met twice with Deloitte without members of management being present.
In conjunction with the Board, the work of the Audit and Risk Committee during the year included the following key matters:
• Review of the Group’s internal financial controls that identify, assess, manage and monitor financial risks and its other internal control and risk management systems (encompassed in the Group’s Risk Management Framework – see below for further details);
• Review of the financial statements of the Group and the announcement of the annual results and the interim statement on the half year results;
• Review of the Annual Report, to ensure it is fair, balanced and understandable and provides the Shareholders with the information necessary to assess the Company’s position, performance, business model and strategy;
• Review and approval of a report on the Committee’s activities, including how it discharged its responsibilities, for the Annual Report;
• Review and approval of the viability statement, going concern basis of preparation and risk management and internal controls statements;
• Overseeing and ensuring that a robust assessment of emerging and principal risks facing the Company is undertaken;
• Review of the Company’s risk exposure and future risk strategy;
• Review of the terms of engagement with the external Auditor;
• Review of the effectiveness/performance of the external Auditor and their programme of work, taking into consideration relevant UK professional and regulatory requirements;
• Consideration of the external Auditor’s independence and objectivity;
• Review of the provision of non-audit services by the external Auditor, taking into account relevant regulations and ethical guidance;
• Review of IT risk and business continuity planning;
• Review of the Company’s procedures for detecting fraud;
• Review of the Company policies and controls, including those relating to ethical behaviour, anti-bribery and corruption, anti-facilitation of tax evasion and the Modern Slavery Act; and
• Consideration of the requirement for an internal audit function.
RISK MANAGEMENT AND INTERNAL CONTROLS During the year, the Committee and the Board re-affirmed the Group’s Risk Management Framework and this approval is representative of the emphasis placed on the management and mitigation of risks in order to enable the development and delivery of the Group’s business objectives.
Encompassed within the Risk Management Framework is the Board’s responsibility to maintain and monitor the Company’s system of internal controls. Such a system is designed to manage, rather than eliminate, the risk of failure to achieve business objectives. Helical’s internal controls are designed to provide reasonable assurance in the following areas:
• Effectiveness and efficiency of operations;
• Reliability of financial reporting; and
• Compliance with applicable laws and regulations.
It is the responsibility of the Board to ensure that the Company’s internal control system is effective in preventing losses from risk events, or identifying risk events, and taking corrective action when they occur. Oversight of the control system is delegated to this Committee which identifies, monitors and manages the principal risks faced by the Group and reviews the effectiveness of all material controls. The Company’s Executive Committee continually assesses and monitors the adequacy of the key internal controls and makes recommendations to the Audit and Risk Committee regarding the addition of key controls as necessary. For further details on Helical’s Risk Management Framework, please see pages 52 to 53.
SIGNIFICANT AREAS OF REVIEWIn discharging its responsibilities in connection with the preparation of the financial statements for the year to 31 March 2021, the Committee is responsible for reviewing the appropriateness of the Group’s accounting policies, assumptions, judgements and estimates as applied by the executive management to the financial statements. During this review the following significant issues were considered:
• Internal Controls The Committee annually reviews the need for an internal audit function and recently reaffirmed its stance that, in view of the small scale and relative simplicity of the business, it does not consider that an internal audit function would be cost effective. The Audit and Risk Committee reviewed Helical’s internal control environment and confirmed that the key controls had been implemented for the year. This review did not highlight any material weaknesses in the design and effectiveness of the Group’s systems and controls.
• Property Valuation The valuation of the Group’s investment and development portfolio is a key area of judgement in preparing the annual and half yearly financial statements and reports. For this reason, the fair value of the majority of the Group’s investment portfolio is determined by independent third party experts who are familiar with the markets in which the Group operates and have suitable professional qualifications. The Group’s development stock is accounted for in the financial statements at the lower of cost and net realisable value. Accordingly, the Committee reviews the assumptions made in determining the net realisable value of the Group’s assets. In addition, the Committee reviews those instances where stock is considered to have a fair value above its current book value. The surplus of fair value above book value is not included in the Group’s Balance Sheet, nor is any movement reflected in the Income Statement. However, in accordance with the best practice recommendations of the European Public Real Estate Association (“EPRA”), the surplus is included in the calculation of the EPRA Net Tangible Value per share at each reporting
STRATEGY • Is the Company’s purpose clearly articulated?
• Does the strategy discuss how the business intends to achieve its objectives in the context of the market outlook?
• Are the drivers of value explained clearly?
• Is there enough information to assess the strategic risks?
BUSINESS MODEL • Are the key elements of the business model clearly explained?
• Are business model risks and disruptions adequately disclosed?
• Do the disclosed business risks disclosed link to sensitivities set out within the financial statements?
This work enabled the Committee to be satisfied that the Annual Report and Accounts, taken as a whole, is fair, balanced and understandable and provides the necessary information for Shareholders to assess the Company’s performance, business model and strategy. This was reported to the Board at its meeting in May 2021.
UPDATES INCLUDED IN THE 2021 ANNUAL REPORT: • Enhanced reporting on Sustainability and on the
implementation of the Group’s Sustainability Strategy (see pages 60 to 71)
• The Group’s corporate governance reporting has been enhanced with the inclusion of:
– Principal Board decisions and how these link to the Directors’ s172(1) Duty (see page 73)
– Enhanced reporting on Helical’s stakeholder engagement initiatives, specifically through inclusion of the detailed outcomes of such engagement (see Strategic Report on pages 78 and 79)
• Information on the impact of Covid-19 on the business, market, going concern and viability
• Our view of “The Office Experience” and three case studies supporting our Investment Case.
date. The fair value calculation of the trading and development stock is reviewed by a suitably qualified independent third party valuer. In order to assist the Audit and Risk Committee in considering the valuations, the fair values of the investment and development property portfolios are reviewed and approved by the Property Valuations Committee which is chaired by Sue Clayton, FRICS, an independent Non-Executive Director.
• Going Concern and Estimates and Judgements The impact of Covid-19 has caused significant uncertainty in the property market and wider economy. In light of this, the Committee considered, and concluded upon, the Group’s ability to continue as a going concern and its viability for the next five-year period (please see Note 1 to these Accounts and the Report of the Directors, pages 126 to 128). It also considered the estimates and judgements discussed in Note 36 to these Accounts.
FAIR, BALANCED AND UNDERSTANDABLE – REVIEW OF THE 2021 ANNUAL REPORT In accordance with the requirements of the Code, the Committee has reviewed and concluded that the Group’s Annual Report and Accounts, taken as a whole, is fair, balanced and understandable. In determining its position, the Committee also considered the Company’s compliance with relevant regulatory frameworks, including the FRC’s letter on key matters relevant to the 2020/21 financial reporting season published in November 2020, and oversaw the quality and integrity of the Group’s financial reporting and accounting policies and practices.
As part of its review of the financial statements, the Committee considered, and challenged as appropriate, the accounting practices and significant judgements and estimates which underpin the Group’s financial statements.
Those members of the team responsible for the drafting of the Annual Report convened frequently to establish the general content and themes and to ensure that reporting was balanced and addressed all key issues and requirements.
Our Annual Report designer (Sampson May) also provided feedback on the structure, format and content to assist management in ensuring the Annual Report was comprehensible and easy to navigate.
In addition, the Committee asked the following questions during its review of the Annual Report and Accounts:
PERFORMANCE • Is it clear how outcomes are measured using key performance
indicators?
• Is there a good mix of financial and non-financial key performance indicators?
• Is there an appropriate balance between statutory and non-statutory performance measures?
• Is it clear that the stated key performance indicators measure the achievement of the Company’s strategy and how they are linked to Directors’ remuneration?
• Are movements in key performance indicators over time, both favourable and adverse, fair and well-explained?
• Are key performance risks explained?
AUDIT AND RISK COMMITTEE CONTINUED
IV AUDIT RISK AND INTERNAL CONTROL IV AUDIT RISK AND INTERNAL CONTROL
CO
RP
OR
AT
E G
OV
ER
NA
NC
E R
EP
OR
T100 Helical plc Annual Report and Accounts 2021 101Helical plcAnnual Report and Accounts 2021
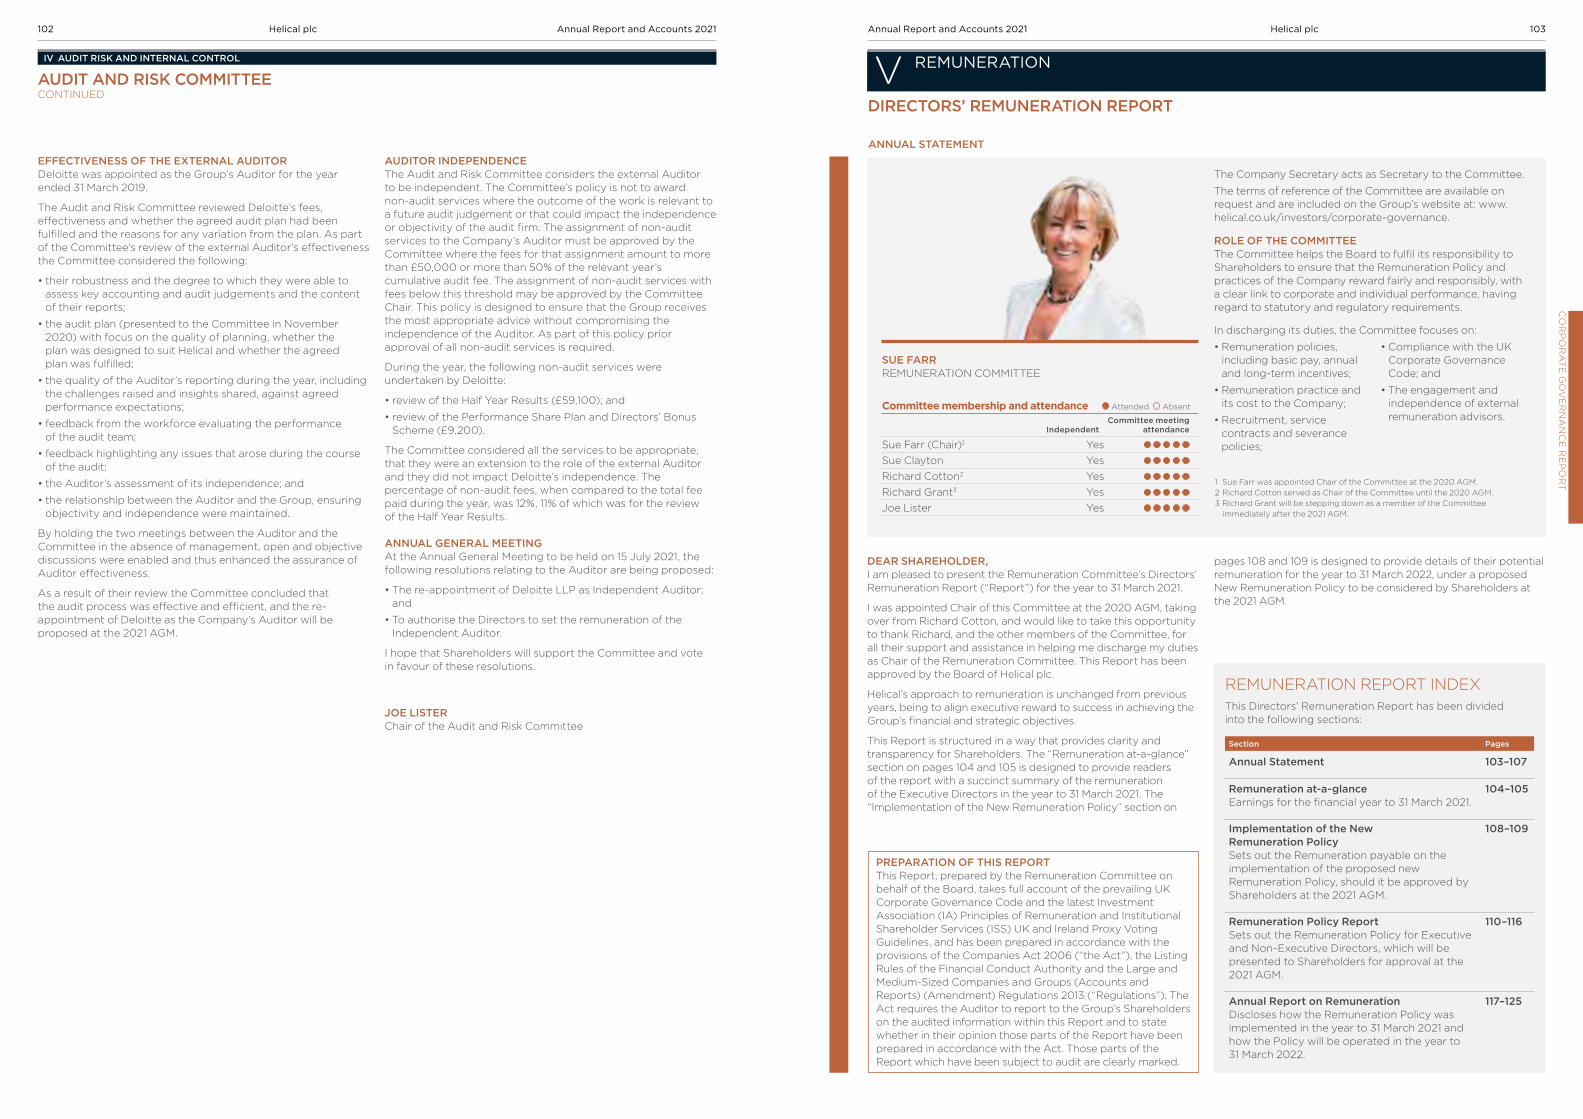
EFFECTIVENESS OF THE EXTERNAL AUDITOR Deloitte was appointed as the Group’s Auditor for the year ended 31 March 2019.
The Audit and Risk Committee reviewed Deloitte’s fees, effectiveness and whether the agreed audit plan had been fulfilled and the reasons for any variation from the plan. As part of the Committee’s review of the external Auditor’s effectiveness the Committee considered the following:
• their robustness and the degree to which they were able to assess key accounting and audit judgements and the content of their reports;
• the audit plan (presented to the Committee in November 2020) with focus on the quality of planning, whether the plan was designed to suit Helical and whether the agreed plan was fulfilled;
• the quality of the Auditor’s reporting during the year, including the challenges raised and insights shared, against agreed performance expectations;
• feedback from the workforce evaluating the performance of the audit team;
• feedback highlighting any issues that arose during the course of the audit;
• the Auditor’s assessment of its independence; and
• the relationship between the Auditor and the Group, ensuring objectivity and independence were maintained.
By holding the two meetings between the Auditor and the Committee in the absence of management, open and objective discussions were enabled and thus enhanced the assurance of Auditor effectiveness.
As a result of their review the Committee concluded that the audit process was effective and efficient, and the re-appointment of Deloitte as the Company’s Auditor will be proposed at the 2021 AGM.
AUDITOR INDEPENDENCE The Audit and Risk Committee considers the external Auditor to be independent. The Committee’s policy is not to award non-audit services where the outcome of the work is relevant to a future audit judgement or that could impact the independence or objectivity of the audit firm. The assignment of non-audit services to the Company’s Auditor must be approved by the Committee where the fees for that assignment amount to more than £50,000 or more than 50% of the relevant year’s cumulative audit fee. The assignment of non-audit services with fees below this threshold may be approved by the Committee Chair. This policy is designed to ensure that the Group receives the most appropriate advice without compromising the independence of the Auditor. As part of this policy prior approval of all non-audit services is required.
During the year, the following non-audit services were undertaken by Deloitte:
• review of the Half Year Results (£59,100); and
• review of the Performance Share Plan and Directors’ Bonus Scheme (£9,200).
The Committee considered all the services to be appropriate, that they were an extension to the role of the external Auditor and they did not impact Deloitte’s independence. The percentage of non-audit fees, when compared to the total fee paid during the year, was 12%, 11% of which was for the review of the Half Year Results.
ANNUAL GENERAL MEETING At the Annual General Meeting to be held on 15 July 2021, the following resolutions relating to the Auditor are being proposed:
• The re-appointment of Deloitte LLP as Independent Auditor; and
• To authorise the Directors to set the remuneration of the Independent Auditor.
I hope that Shareholders will support the Committee and vote in favour of these resolutions.
JOE LISTERChair of the Audit and Risk Committee
DEAR SHAREHOLDER,I am pleased to present the Remuneration Committee’s Directors’ Remuneration Report (“Report”) for the year to 31 March 2021.
I was appointed Chair of this Committee at the 2020 AGM, taking over from Richard Cotton, and would like to take this opportunity to thank Richard, and the other members of the Committee, for all their support and assistance in helping me discharge my duties as Chair of the Remuneration Committee. This Report has been approved by the Board of Helical plc.
Helical’s approach to remuneration is unchanged from previous years, being to align executive reward to success in achieving the Group’s financial and strategic objectives.
This Report is structured in a way that provides clarity and transparency for Shareholders. The “Remuneration at-a-glance” section on pages 104 and 105 is designed to provide readers of the report with a succinct summary of the remuneration of the Executive Directors in the year to 31 March 2021. The “Implementation of the New Remuneration Policy” section on
pages 108 and 109 is designed to provide details of their potential remuneration for the year to 31 March 2022, under a proposed New Remuneration Policy to be considered by Shareholders at the 2021 AGM.
REMUNERATION REPORT INDEXThis Directors’ Remuneration Report has been divided into the following sections:
Section Pages
Annual Statement 103–107
Remuneration at-a-glance Earnings for the financial year to 31 March 2021.
104–105
Implementation of the New Remuneration Policy Sets out the Remuneration payable on the implementation of the proposed new Remuneration Policy, should it be approved by Shareholders at the 2021 AGM.
108–109
Remuneration Policy Report Sets out the Remuneration Policy for Executive and Non-Executive Directors, which will be presented to Shareholders for approval at the 2021 AGM.
110–116
Annual Report on Remuneration Discloses how the Remuneration Policy was implemented in the year to 31 March 2021 and how the Policy will be operated in the year to 31 March 2022.
117–125
PREPARATION OF THIS REPORTThis Report, prepared by the Remuneration Committee on behalf of the Board, takes full account of the prevailing UK Corporate Governance Code and the latest Investment Association (IA) Principles of Remuneration and Institutional Shareholder Services (ISS) UK and Ireland Proxy Voting Guidelines, and has been prepared in accordance with the provisions of the Companies Act 2006 (“the Act”), the Listing Rules of the Financial Conduct Authority and the Large and Medium-Sized Companies and Groups (Accounts and Reports) (Amendment) Regulations 2013 (“Regulations”). The Act requires the Auditor to report to the Group’s Shareholders on the audited information within this Report and to state whether in their opinion those parts of the Report have been prepared in accordance with the Act. Those parts of the Report which have been subject to audit are clearly marked.
Committee membership and attendance Attended Absent
IndependentCommittee meeting
attendance
Sue Farr (Chair)1 Yes Sue Clayton Yes Richard Cotton2 Yes Richard Grant3 Yes Joe Lister Yes
SUE FARR REMUNERATION COMMITTEE
The Company Secretary acts as Secretary to the Committee.
The terms of reference of the Committee are available on request and are included on the Group’s website at: www.helical.co.uk/investors/corporate-governance.
ROLE OF THE COMMITTEEThe Committee helps the Board to fulfil its responsibility to Shareholders to ensure that the Remuneration Policy and practices of the Company reward fairly and responsibly, with a clear link to corporate and individual performance, having regard to statutory and regulatory requirements.
In discharging its duties, the Committee focuses on:
• Remuneration policies, including basic pay, annual and long-term incentives;
• Remuneration practice and its cost to the Company;
• Recruitment, service contracts and severance policies;
• Compliance with the UK Corporate Governance Code; and
• The engagement and independence of external remuneration advisors.
1 Sue Farr was appointed Chair of the Committee at the 2020 AGM.2 Richard Cotton served as Chair of the Committee until the 2020 AGM.3 Richard Grant will be stepping down as a member of the Committee
immediately after the 2021 AGM.
DIRECTORS’ REMUNERATION REPORT
V REMUNERATIONAUDIT AND RISK COMMITTEE CONTINUED
IV AUDIT RISK AND INTERNAL CONTROL
ANNUAL STATEMENT
CO
RP
OR
AT
E G
OV
ER
NA
NC
E R
EP
OR
T102 Helical plc Annual Report and Accounts 2021 103Helical plcAnnual Report and Accounts 2021

EARNINGS FOR THE FINANCIAL YEAR TO 31 MARCH 2021
Total remuneration for Executive DirectorSalary2
£000 Benefits3
£000Pension4
£000
TotalFixed£000
Annual Bonus
£000
ShareAwards5
£000
Share Incentive
Plan6 £000
TotalVariable
£000
Total 2021£000
Total 2020£000
Gerald Kaye 545 45 – 590 493 1,035 7 1,535 2,125 2,316
Tim Murphy 317 11 – 328 287 587 7 881 1,209 1,360
Matthew Bonning-Snook 424 44 – 468 383 807 7 1,197 1,665 1,830
1 Full details of the Directors’ remuneration for the year can be found in the table on page 118.2 Basic salaries were not increased on 1 April 2020, in light of the Covid-19 crisis, and remained throughout the year at the same level as the previous year.3 There were no changes to the provision of benefits-in-kind, which remained the same as for the previous year.4 The Group’s policy of not making pension provision for Executive Directors remained unchanged, with such Directors required to provide for their retirement through the
Group’s incentive schemes.5 Share awards include dividend shares awarded to Directors on 29 June 2020 under the terms of the Annual Bonus Scheme 2018.6 The Executive Directors participated in the HMRC approved all-employee Share Incentive Plan which, during the year, awarded them shares to the value of £7,200, the same
as in the previous year.
EPRA Net Tangible Asset (NTA) value per share
533p2020: 524p
Total Accounting Return
3.3%2020: 7.7%
Total Shareholder Return
21.2%2020: 8.7%
MSCI ESG
AAA2020: AA
GRESB
3*2020: 2*
Total Property Return – MSCI (1 year)
7.0%2020: 9.6%
Total Property Return – MSCI (3 year)
8.9%2020: 10.2%
EPRA Sustainability BPR
Silver2020: Bronze
CDP
B2020: C
Remuneration at-a-glance
FINANCIAL KPIs
ESG KPIs
BREEAM OUTSTANDING (design stage)33 Charterhouse Street, London EC1
£140m Green Loan33 Charterhouse Street, London EC1
Built for the Future Sustainability Strategy Document
Designing for Net ZeroDesign Guide for our Developments
ANNUAL BONUS PLAN – TARGETS AND OUTCOMES
SHAREHOLDING OF THE EXECUTIVE DIRECTORS
Performance measure
Payout target
Actual%
awarded20% 100%
TPR 50% -1.65% 1.60% 6.99% 50.0%
TAR 25% 5.0% 10.0% 3.6% 0.0%
Strategic and ESG 25% 10.3%
Total 100% 60.3%
Applying these performance outcomes to the individual Directors’ salaries and bonus multiples, the Annual Bonuses payable are:
Bonus payable
£000% of
maximum
Gerald Kaye 493 60.3
Tim Murphy 287 60.3
Matthew Bonning-Snook 383 60.3
Performance measure
Payout target
Actual%
awarded10% 100%
NAV 33% 5.0% 12.5% 6.0% 7.4%
TPR 33% 2.8% 4.8% 8.9% 33.3%
TSR 33% -27.4% 4.1% 25.2% 33.3%
Total 100% 74.0%
1 The share price used to calculate the expected value at vesting was 387.63p, based on the average share price over the three months to 31 March 2021.
The level of PSP vesting in 2021 (74% of maximum) demonstrates the successful longer-term performance of the Company with strong portfolio performance and a corresponding increase in shareholder returns over the performance period.
2018 PSP AWARD VESTING IN 2021 – TARGETS AND OUTCOMES
1 The value of unvested interests over shares is calculated on the shares expected to vest, net of tax liabilities, of the 2018 PSP award, unvested Deferred Shares and the Restricted Share Incentive Plan shares at the weighted average share price for the three months to 31 March 2021 of 387.63p.
Gerald Kaye
Chief Executive
% of salary 1,750%1,500%1,250%1,000%750%500%250%0%
Tim Murphy
Finance Director
Matthew Bonning-Snook
Property Director
Shareholding requirement
Beneficially owned shares
Unvested interests over shares1
Unvested interests over shares1
Unvested interests over shares1
Shareholding requirement
Beneficially owned shares
Shareholding requirement
Beneficially owned shares
500%
240%
198%
236%
1,498%
500%
1,204%
500%
770%
The estimated number of shares vestingare as follows: Number
Estimated valueat vesting1
£’000
Gerald Kaye 254,032 985
Tim Murphy 147,832 573
Matthew Bonning-Snook 197,602 766
DIRECTORS’ REMUNERATION REPORT CONTINUED
V REMUNERATION V REMUNERATION
CO
RP
OR
AT
E G
OV
ER
NA
NC
E R
EP
OR
T104 Helical plc Annual Report and Accounts 2021 105Helical plcAnnual Report and Accounts 2021

ESG During the year, the Group published its Sustainability Strategy document, “Built for the Future”, and a design guide for its developments, “Designing for Net Zero”.
Impact of the Covid-19 pandemicAt the start of the financial year, the country had recently entered its first lockdown and it was a period of considerable uncertainty with the timing and strength of any recovery from the Covid-19 pandemic yet to be determined.
In last year’s Annual Report, we noted our concern of the impact of the pandemic on the business and took swift action to reduce outgoings and preserve the Group’s cash resources. Included in this action was a 20.0% reduction in the final dividend payable to Shareholders in July 2020. Responding to these measures the Committee, with the full support of the Executive Directors, exercised its discretion to reduce the 2019/20 bonus outturn by 10.0%, the equivalent of a 25% reduction in basic salaries for six months, and deliver the reduced annual bonus award wholly in deferred shares.
We are now reporting at a time of relative optimism with a successful rollout of a number of vaccines, significant reductions in the numbers of people infected with the virus and with a complete end to the restrictions imposed by the Government in sight.
During the financial year to 31 March 2021, the Group has successfully executed much of its business plan, letting its main vacant building, Kaleidoscope, London EC1, selling assets that had reached their potential, reducing gearing from 31.4% to 22.6%, and collecting over 93% of invoiced rents during the year. At the year end, the investment portfolio showed a surplus of £23.9m, a good result in a challenging year.
Despite our successes during the year, we recognise that many have suffered during the pandemic. Our industry’s main charity, LandAid, provides temporary accommodation for vulnerable young people enabling them to make a new start in life. As part of our community assistance, we were a Founding Partner to the LandAid Emergency Fund in April 2020, enabling frontline charities across the country to provide vital support during the pandemic.
We retained all our staff in employment throughout the year and have not utilised the Government’s Coronavirus Job Retention Scheme (Furlough). Despite this, we reduced our fixed overheads by £1.4m (12.7%) compared to the previous year as we sought to reduce our costs.
The Annual Report on Remuneration, on pages 117 to 125, provides a record of the work undertaken by the Committee during the year, followed by a detailed analysis of how the remuneration for the year to 31 March 2021 has been calculated under the Policy for that year and what performance measures were set for the Annual Bonus Scheme and Performance Share Plan.
Finally, under Other Remuneration Matters, on pages 122 to 125, this Report includes a record of Directors’ shareholdings and a comparison of these shareholdings against the Group’s shareholding guidelines and details of outstanding share awards. The section also includes a note of the Company’s share price performance and Total Shareholder Return (“TSR”) against sector benchmarks and a comparison of the remuneration of the Chief Executive and other Directors against the Group’s employees.
PERFORMANCEExecutive performance measures and pay are closely aligned to Shareholders’ interests with a high proportion of total available remuneration based on variable pay designed to reward the achievement of long-term strategic objectives. Our remuneration is directly linked to the five pillars of our Strategy (see pages 26 to 29).
Our objective is to maximise Shareholder return by increasing the net asset value of the Group from managing a portfolio of offices, primarily in London, balanced between let investment assets and new development schemes. We operate a sustainable capital structure, seeking to attract and retain the best people with ESG matters at the heart of our business.
In a challenging year, the Group generated a profit before tax of £20.5m (2020: £43.0m), a Total Accounting Return of 3.3%, with an increase in EPRA NTA of 1.7%. The Total Property Return, as measured by MSCI, generated a return of 7.0%. The TSR for the year, based on the spot prices at each year end, generated a return of 21.2% (2020: 8.7%). In light of the good results and an improved outlook, the Board is recommending a final dividend of 7.40p (2020: 6.0p) taking the total dividend for the year to 10.10p (2020: 8.7p), an increase of 16.1%.
The Group made significant progress in meeting its ESG Key Performance Indicators, improving its MSCI ESG rating from AA to AAA, its GRESB rating from 2* to 3* and its EPRA Sustainability rating from Bronze to Silver. The Group’s rating by the Carbon Disclosure Project (“CDP”) improved from C to B.
Operationally, the Group was awarded the first UK BREEAM (2018) Outstanding rating for the design stage at its development at 33 Charterhouse Street, London EC1. The financing of this development, with Allianz, is through a £140m Green Loan.
Invoiced rents collected during the year
93%Investment portfolio showed a surplus of
£23.9mGearing reduced from 31.4% to
22.6%Reduction in fixed overheads
12.7%
In proposing the new Policy, we have reflected market expectations of appropriate remuneration levels in the sector and amongst the Group’s peers. As part of the Policy review, the Committee consulted with the Company’s major Shareholders (covering over 67% of issued share capital) and the major shareholder representative bodies. In addition to setting out the proposals in a detailed letter and responding to a number of questions and requests for clarifications, Shareholder feedback was summarised and shared with those consulted. The level of support for the proposals has been very strong. However, reflecting Shareholder feedback, and demonstrating the benefit of the consultation process, two changes were made to the original proposals. The two changes made were: (i) increasing the weighting on ESG measures from 5% to 10% of annual bonus potential; and (ii) extending post cessation shareholding guidelines for two years from cessation (rather than the phased approach which was originally proposed). The Committee’s intended approach to operating the proposed new Policy is detailed in the section headed “Implementation Of The New Remuneration Policy” on pages 108 and 109 and further details of the new Policy are included in the Remuneration Policy Report on pages 110 to 116.
2021 ANNUAL GENERAL MEETING RESOLUTIONWe were unable to permit access to our Shareholders to attend our 2020 AGM, due to the restrictions in place at the time, but we are hopeful that we will be able to welcome you to our 2021 AGM to be held on 15 July 2021.
The following resolutions relating to remuneration will be presented at the 2021 AGM:
• An advisory resolution in respect of the Annual Report on Remuneration for the year to 31 March 2021; and
• A binding resolution in respect of the new Remuneration Policy to cover the three-year period from 1 April 2021.
I trust that Shareholders will support the Committee and vote in favour of these resolutions.
I will be happy to respond to any questions Shareholders may have on this Report or in relation to any Committee activities. If you have questions or would like to discuss any aspect of the Remuneration Policy, please feel free to contact me through James Moss (Company Secretary) at [email protected].
SUE FARRChair of the Remuneration Committee
25 May 2021
Annual Bonus Scheme 2018Subsequent to the year end, and in accordance with the rules of the Helical Annual Bonus Scheme 2018, annual bonuses have been approved for inclusion in the financial statements for the year to 31 March 2021 for Gerald Kaye, Tim Murphy and Matthew Bonning-Snook. Half of the maximum bonus payable was dependent on the relative Total Property Return of the Group, as calculated by MSCI, compared with the MSCI Central London Offices Total Return Index. One quarter was determined by the Total Accounting Return of the Group and the remaining quarter was payable based on strategic objectives. In accordance with these performance criteria, bonuses were calculated for the Executive Directors as follows: Gerald Kaye £493,000, Tim Murphy £287,000 and Matthew Bonning-Snook £383,000. As all three Executive Directors satisfy the minimum shareholding guideline of 500% of salary and bonus awards are less than 100% of their base salaries, these bonuses will be paid in cash. Full details of the targets and the performance against these targets are set out in the “Remuneration at-a-glance” section and the Annual Report on Remuneration.
Performance Share Plan 2014Share awards granted in 2018 under the terms of the 2014 Performance Share Plan were subject to three performance conditions over the three years to 31 March 2021. One third of the awards was based on absolute net asset value performance, the second third of the awards was based on a comparison of the Group’s portfolio return to the MSCI Central London Offices Total Return Index and the final third of the awards was based on a comparison of the Group’s Total Shareholder Return to that of a basket of companies in the Real Estate Super Sector. The performance criteria were measured at the end of the three-year period and the MSCI and TSR conditions were met in full. The net asset value condition was partially met. Consequently, 74% of the awards are expected to vest in June 2021. Full details of the targets and Helical’s performance are set out in the Annual Report on Remuneration.
The Committee believes that the provision for annual bonuses and the expected vesting of the PSP award in respect of the three-year performance period to 31 March 2021, accurately and fairly represents the reward determined by the Group’s remuneration schemes based on the performance of the Group over the respective annual and three-year performance periods.
RENEWAL OF REMUNERATION POLICYDuring the last year, the Committee has reviewed the Group’s Remuneration Policy (“Policy”) and the result of these deliberations is a new Policy, to be put to Shareholders for a binding vote at the AGM on 15 July 2021. The Committee is not proposing any significant changes to the previous Policy, which received 97% in favour at the 2018 AGM. We believe the new Policy continues to incentivise management to deliver the Strategy agreed by the Board, maximising Shareholder returns through delivering income growth from creative asset management and capital gains from our development activity.
The main changes to the Policy are:
• The introduction of a minimum shareholding requirement for new Directors;
• The introduction of a formal, post-cessation of employment, shareholding requirement; and
• Updated and enhanced malus and clawback provisions.
DIRECTORS’ REMUNERATION REPORT CONTINUED
V REMUNERATION V REMUNERATION
Built for the future/SUSTAINABILITY
STRATEGY
Designing for Net Zero/
DESIGN GUIDE
CO
RP
OR
AT
E G
OV
ER
NA
NC
E R
EP
OR
T106 Helical plc Annual Report and Accounts 2021 107Helical plcAnnual Report and Accounts 2021

IMPLEMENTATION OF THE NEW REMUNERATION POLICY Subject to Shareholder approval at the 2021 AGM on 15 July 2021, the Remuneration Policy will be implemented for the year to 31 March 2022 as follows:
Remuneration Policy Proposed Policy changes Implementation for 2021/22 Change from 2020/21 Implementation
Basic annual salaries
Set on appointment to the Board and reviewed annually on 1 April or on change in role or responsibility.
No change The basic salaries of the Executive Directors from 1 April 2021 are:
Gerald Kaye £552,290
Tim Murphy £321,800
Matthew Bonning-Snook £430,100
Annual inflationary increase awarded of 1.5% from 1 April 2021. The average increase for all other employees was 5.2%.
Benefits-in-kind
To provide insured health protection, cars and fuel allowances
No change Each Executive Director is provided with a car or car allowance, car fuel, private medical insurance, life assurance and permanent health insurance.
No change
Pension
The Group does not provide for the retirement of Executive Directors
No change No retirement provision No change
Annual Bonus
Annual performance targets are set by the Committee in advance of the financial year and are linked to the Group’s strategy of maximising Shareholder returns through delivering income growth from creative asset management and capital gains from its development activity.
The maximum bonus is capped at 150% for each Executive Director.
The pay-out for threshold performance against any targets will be no more than 20% of the maximum bonus (and may be lower).
To the extent there is low or no bonus payable on the portfolio/financial measures, the Committee will retain discretion to reduce (including to zero) the pay-out under the strategic targets.
No change 150% of salary subject to the following performance measures and weightings:
35%: TPR against the MSCI Central London Capital Growth Index
Base – Index (20% payable)
Stretch – Index plus 3.25%
40%: TAR
Base – 2.5% (10% payable)
Stretch – 10.0%
25%: Strategic and ESG targets (these will be reported on retrospectively in the Directors’ Remuneration Report for the year to 31 March 2022).
The TPR of the Group’s portfolio will be measured against the MSCI Capital Growth Index, not the MSCI Total Return Index.
TPR weighting reduced from 50% to 35%.
TAR weighting increased from 25% to 40%.
TAR threshold target reduced from 5% and % payable at threshold reduced from 20% to 10%
Strategic and ESG targets replace personal targets.
Deferred Bonus
Executive Directors who have met their minimum shareholding requirement will receive the first 100% of their salary in cash with any excess above 100% of salary to be provided in deferred shares.
Executive Directors who do not meet their minimum shareholding requirement will receive two thirds of the annual bonus in cash and one third in shares.
The Committee may award dividend equivalents on deferred shares that vest.
No change As per Policy No change
Remuneration Policy Proposed Policy changes Implementation for 2021/22 Change from 2020/21 Implementation
Long-Term Incentive Awards
Annual Award 2021 – Vesting in 2024
Annual awards, under the terms of the Group’s Performance Share Plan (“PSP”), will be granted in June 2021 over shares equal to 250% of salary at 31 March 2021.
No change The three performance conditions are:
33%: Net Asset Value Growth
33%: TPR versus MSCI Index
33%: Relative TSR
The threshold and maximum targets are noted in the table on page 114.
The NAV stretch threshold reduced from 12.5% pa to 10.0% pa.
Malus and Clawback
Malus and clawback provisions will continue to operate (albeit updated and enhanced)
Additional triggers of serious reputational damage and corporate failure added.
As per Policy As per Policy
Shareholding Requirement – In Employment
To require Executive Directors to hold shares equating to a minimum value whilst in employment (500% of salary for current Executive Directors and 250% of salary for new Executive Directors).
For new Executive Directors, a minimum of 250% of salary to be achieved within five years of the start of employment.
As per Policy As per Policy
Shareholding Requirement – Post Cessation
To require former Executive Directors to hold shares equating to a minimum value for a period post cessation of employment.
250% of salary for two years post cessation.
Introduction of a formal post cessation minimum shareholding requirement.
As per Policy As per Policy
Non-Executive Directors
Set on appointment to the Board and reviewed annually on 1 April or on change in role or responsibility. The fees payable were last increased on 1 April 2019. The base fee for NEDs is £48,000 pa with an additional £10,000 payable to the Chairs of each committee.
No change Richard Grant (Chairman) £150,000
Richard Cotton (SID) £70,000
Sue Clayton (Property Valuations) £58,000
Sue Farr (Remuneration) £58,000
Joe Lister (Audit and Risk) £58,000
No change
DIRECTORS’ REMUNERATION REPORT CONTINUED
V REMUNERATION V REMUNERATION
CO
RP
OR
AT
E G
OV
ER
NA
NC
E R
EP
OR
T108 Helical plc Annual Report and Accounts 2021 109Helical plcAnnual Report and Accounts 2021

POLICY CHANGESNo changes are being proposed in respect of incentive quantum, with the annual bonus continuing to be capped at 150% of salary and PSP awards capped at 250% of salary. However, the proposed Policy includes the following changes:
Shareholding guidelines (in employment) – Two changes are proposed in respect of our “in-employment” shareholding guidelines. Firstly, our current Remuneration Policy, which was approved by Shareholders at the 2018 AGM, set share ownership guidelines at 500% of salary for Executive Directors. However, while the 500% of salary is considered an appropriate level for the current long-serving Directors, the Committee is of the view that this level will make future recruitment to the Board challenging. As such, the Committee is proposing that new Executive Directors are appointed on a shareholding guideline of 250% of salary to be achieved within five years of appointment. Secondly, the guidelines will be amended to include unvested non-performance related share awards on a net of tax basis (as per the IA’s update to its Remuneration Principles).
Post cessation shareholding guidelines – In line with the UK Corporate Governance Code, the Committee wishes to introduce post cessation shareholding guidelines into the 2021 Directors’ Remuneration Policy. As such, based on shares delivered from deferred bonuses/PSP awards which are granted post the 2021 AGM, shares equal to 250% of salary will need to be retained until the second anniversary following the date of cessation.
Malus and clawback provisions – Provisions have been reviewed and enhanced to include serious reputational damage and corporate failure.
Other minor changes – In addition to the above, minor changes will be made to the Policy wording in respect of the annual bonus and PSP performance metrics. Consistent with market practice, the specific references to performance metrics and weightings set out in the 2021 Remuneration Policy will be removed to increase the flexibility to refine metrics and weightings during the Policy Period to align with the Group’s strategy where appropriate.
REMUNERATION POLICY REPORTThis section of the Remuneration Report sets out the Remuneration Policy of the Group. The Committee believes that the Policy continues to support the Group’s Strategy and is aligned with Shareholders’ interests.
POLICY SCOPEThe Remuneration Policy applies to the Chairman, Executive Directors and Non-Executive Directors and oversight of the remuneration of the wider workforce.
POLICY DURATIONThe previous Remuneration Policy was approved by Shareholders at the Annual General Meeting held on 12 July 2018 for a maximum period of three years and is now reaching its expiry. This Policy Report sets out the 2021 Remuneration Policy which, subject to the approval of Shareholders at the 2021 AGM, will be effective for the three years from 1 April 2021 to 31 March 2024.
REMUNERATION POLICYHelical’s approach to the remuneration of its Executive Directors is to provide a basic remuneration package combined with an incentive-based bonus and share scheme structure aligned with the interests of its Shareholders. The majority of performance-based awards are judged on the relative performance of the Group’s real estate portfolio against an industry benchmark or on the absolute performance of the Group and its Total Shareholder Return against appropriate industry benchmarks. The remaining awards are judged on strategic and ESG objectives. Remuneration within the real estate sector is monitored and reviewed regularly to ensure that the Group’s positioning of its remuneration remains in line with these objectives. In addition to this external view, the Committee monitors the remuneration levels of senior management below Board level and the remuneration of other employees to ensure that these are taken into account in determining the remuneration of Executive Directors.
The objective of the Remuneration Policy is to ensure that Executive Directors and senior management are provided with appropriate incentives to encourage enhanced performance and are, in a fair and responsible manner, rewarded for their individual contributions to the success of the Group. Within the terms of the agreed policy the Committee shall determine:
• The total individual remuneration packages of each Executive Director including, where appropriate, basic salaries, annual bonuses, share awards, and other benefits;
• The fees payable to the Chairman of the Company;
• Salaries, bonuses and share awards of senior employees and workforce remuneration;
• Targets and hurdles for any performance related remuneration schemes; and
• Service agreements incorporating termination payments and compensation commitments.
DIRECTORS’ REMUNERATION REPORT CONTINUED
V REMUNERATION
DIRECTORS’ REMUNERATION POLICY TABLEThe table below summarises the Directors’ Remuneration Policy.
Element Purpose and link to strategy Operation Maximum Performance targets
Salary • Reflects the value of the individual and their role and responsibilities
• Reflects delivery against key personal objectives and development
• Provides an appropriate level of basic fixed income, avoiding excessive risk arising from over reliance on variable income
• Normally reviewed annually, effective 1 April
• Paid in cash on a monthly basis; not pensionable
• Takes periodic account against companies with similar characteristics and sector comparators
• Reviewed in context of the salary increases across the Group
• No minimum or maximum salary increase is operated
• Salary increases will normally be aligned to the average increase awarded to other employees
• Increases may be above this level if there is an increase in the scale, scope or responsibility of the role or to allow the basic salary of newly appointed Executives to move towards market norms as their experience and contribution increases
• N/A
Annual bonus
• Provides focus on delivering returns from the Group’s property portfolio
• Rewards and helps retain key Executive Directors and is aligned with the Group’s risk profile
• Maximum bonus only payable for achieving demanding targets
• Payable in cash (two thirds) and deferred shares (one third) unless the shareholding guideline has been met, in which case the annual bonus will be payable in cash up to 100% of salary and in deferred shares from 100% to 150% of salary
• Non-pensionable• Dividend equivalent payments
(in cash or in shares) may be payable on deferred shares
• 150% of salary pa for all Executive Directors
• Performance normally measured over one year
• No more than 20% of an award vests at threshold performance
• The majority of the bonus potential will be based on portfolio and financial targets (e.g. Total Property Return and/or Total Accounting Return) and a minority will be based on strategic and/or ESG objectives
• Malus and clawback provisions apply
Long-term incentive awards
• Aligned to main strategic objective of delivering long-term value creation
• Aligns Executive Directors’ interests with those of Shareholders
• Rewards and helps retain key Executives and is aligned with the Group’s risk profile
• Discretionary annual grant of conditional share awards under the 2014 PSP Scheme
• Executive Directors are required to retain PSP shares acquired, net of shares sold to pay tax liabilities arising on vesting, for at least two years after vesting
• Dividend equivalent payments (in cash or in shares) may be payable
• 250% of salary pa for all Executive Directors
• Performance normally measured over three years
• 10% of an award vests at threshold performance
• Performance targets will be based on portfolio, financial and/or share price (e.g. net asset value per share, Total Property Return and/or Total Shareholder Return) and, for a minority of award, strategic and/or ESG objectives
• Malus and clawback provisions apply
Pensions • There is no Group pension scheme for Directors and no contributions are payable to Directors’ own pension schemes
N/A N/A N/A
Other benefits
• Provide insured benefits to support the individual and their family during periods of ill health, accidents or death
• Cars or car allowances and fuel allowances to facilitate effective travel
• Benefits provided through third party providers
• Insured benefits include: private medical cover, life assurance and permanent health insurance
• Other benefits may be provided where appropriate
N/A N/A
Share ownership guidelines
• To provide alignment of interests between Executive Directors and Shareholders
• Executive Directors are required to build and maintain a specified shareholding through the retention of the post-tax shares received on the vesting of awards
N/A • Current Executive Directors are required to hold a shareholding equal to or in excess of 500% of basic salary
• New Executive Directors are required to build up a shareholding equal to or in excess of 250% of basic salary, within five years of appointment
Non-Executive Director fees
• Reflects time commitments and responsibilities of each role and fees paid by similarly sized companies
• The remuneration of the Non-Executive Directors is determined by the Executive Board
• Cash fees paid monthly• Fees are reviewed on a regular
basis• Benefits may be provided
where appropriate• Fixed three-year contracts with
three-month notice periods
• No minimum or maximum fee increase is operated
• Fee increases may be guided by the average increase awarded to Executive Directors and other employees and/or general movements in the market
• Increases may be above this level if there is an increase in the scale, scope or responsibility of the role
N/A
In addition to the above, Executive Directors may also participate in any all-employee share arrangement operated by the Company, up to prevailing HMRC limits.
V REMUNERATION
CO
RP
OR
AT
E G
OV
ER
NA
NC
E R
EP
OR
T110 Helical plc Annual Report and Accounts 2021 111Helical plcAnnual Report and Accounts 2021

LEAVER POLICYOn termination of employment each Director may be entitled to a payment in lieu of notice of basic salary and other contractual entitlements i.e. provision of a car, health and life insurance etc. The Group may make payments in lieu of notice as one lump sum or in instalments, at its own discretion. If the Group chooses to pay in instalments the Director is obliged to seek alternative income over the relevant period and to disclose the amount of alternative income received by the Group. Instalment payments will be reduced by any alternative income.
Under the Annual Bonus Scheme 2018, participants will not normally be entitled to receive any payment under the scheme following cessation of employment and shall immediately cease to have any interests, benefits, rights and/or entitlements under the scheme howsoever arising on the date of such cessation except where good leaver status applies (i.e. death; injury; disability; redundancy; retirement; sale or transfer of employing company or business outside the Group; or any other reason permitted by the Committee). For good leavers, individuals would cease to accrue amounts in respect of any period after cessation of employment but would receive any amounts previously deferred into shares under the terms of the Annual Bonus Scheme 2018.
Any share-based entitlements granted to an Executive Director under the Group’s share plans will be determined based on the relevant plan rules. For awards granted under the 2014 PSP, awards held by good leavers will vest on the normal vesting date subject to performance conditions and time pro-rating, unless the Committee determines that awards should vest at cessation and/or time pro-rating should not apply.
Finally, under the proposed 2021 Remuneration Policy, the following post cessation shareholding guidelines will apply with effect from the 2021 AGM:
• Unvested deferred annual bonus and PSP share awards will be treated in line with the good leaver/bad leaver provisions presented in the shareholder approved Remuneration Policy; and
• Shares to the value of 250% of salary to be retained for two years, post cessation. Such shares to be out of those delivered from deferred bonuses and PSP awards which are granted after the 2021 AGM.
Share Incentive Plan
In line with that of existing Executive Directors.
Shareholding guideline
Newly appointed Executive Directors will be expected to build up a shareholding in the Company of 250% of salary out of shares purchased and/or shares vesting through the Group’s Annual Bonus Scheme and Performance Share Plan, within five years of their appointment.
Buy-out awards
Should it be deemed necessary to compensate a new Director for loss of bonus or incentives from a previous employer, the Committee may structure the remuneration of such Director to buy-out any such bonus or incentives on a like-for-like basis in respect of currency (i.e. cash versus shares), timing and performance targets. Where possible such buy-out will be structured within the Company’s existing incentive arrangements but the Committee has the discretion to implement the exemption under rule 9.4.2 of the Listing Rules.
Non-Executive Directors
Newly appointed Non-Executive Directors will be paid fees at a level consistent with existing Non-Executive Directors. Fees would be paid pro-rata in the year of appointment.
HOW EMPLOYEE PAY IS TAKEN INTO ACCOUNT AND COMPARED WITH THE REMUNERATION POLICY OF EXECUTIVE DIRECTORSAll permanent employees of the Group, including Executive Directors, receive a basic remuneration package including basic salary, private medical cover, permanent health insurance, life assurance and membership of the Share Incentive Plan. In addition, Directors and senior management are entitled to the use of company cars or the payment of a car allowance and a car fuel allowance. There is no Group pension scheme for Directors and no contributions are payable into Directors’ own pension schemes. For all permanent employees below Board level, the Company pays pension contributions of 12.5% in respect of all employees’ pension arrangements. Whilst employees below Board level are not entitled to participate in the Annual Bonus Scheme, discretionary bonuses are paid to employees on an individual basis depending on their performance and contribution.
The Performance Share Plan is available to all employees but is primarily utilised to incentivise Executive Directors and senior management. In determining executive remuneration, the Committee considers the overall remuneration of all the Group’s employees and, other than in exceptional circumstances, seeks to award increases in salaries at levels below those made to other staff and within its own guidelines. The remaining remuneration is weighted towards performance related awards. The Committee does not consult with the Group’s employees when drawing up its Remuneration Policy.
DIRECTORS’ REMUNERATION REPORT CONTINUED
V REMUNERATION
COMPLIANCE WITH THE 2018 UK CORPORATE GOVERNANCE CODE (“CODE”)The Remuneration Committee has ensured that the provisions of the Code have been taken into account in its decisions during the year and in the preparation of this Report.
The Code states that pension provision for Directors is aligned with that provided for the wider workforce. As the Directors do not receive pensions from the Group, this provision is not relevant to Helical.
The Code also suggests that post-employment shareholding provisions are set to ensure that Directors who leave the Group are not able to immediately liquidate their shareholdings. The Group’s proposed new Remuneration Policy (“Policy”), incorporates provisions restricting the sale of certain share entitlements, post-employment.
The Committee has considered the six factors set out in Provision 40 of the 2018 UK Corporate Governance Code and ensured that its Policy and this Report are consistent with these factors:
• Clarity and Simplicity – The Policy is designed to simplify remuneration arrangements and provide clarity between remuneration and the performance of the Group. In addition, this Report is designed to assist the reader in understanding how the Policy is being implemented.
• Risk – The Policy contains provisions for malus and clawback and permits the use of negative discretion by the Committee to ensure that the outcomes of the performance related pay components of total remuneration can be adjusted in the light of overall performance and Shareholder experience. Executive Directors are required to build substantial shareholdings in the Company to further ensure that their personal interests are aligned with those of Shareholders.
• Predictability – The range of potential award outcomes for the performance related pay components are set out in this Report. In addition to assessing the range between the minimum and maximum values of remuneration packages, it also highlights the impact of share price growth on the maximum awards.
• Proportionality – The Policy sets out clear links between the potential rewards available to Executive Directors, the implementation of the Group’s business strategy and the performance outcomes that generate Shareholder value. Stretching targets are set by the Committee which retains the ability to adjust remuneration outcomes where these do not truly reflect the Group’s underlying performance. With a significant element of remuneration being performance-related and in the form of equity subject to holding periods, the interests of the Executive Directors and Shareholders are aligned.
• Alignment to Culture – Helical’s Strategy, Values and Purpose have evolved over the years. Our Executive Directors, along with our wider workforce, are continually looking to deliver on our Strategy whilst acting in accordance with our Values and our Culture. The remuneration packages available to them are aligned with the Strategy and designed to incentivise them to deliver value to our Shareholders.
Finally, the Committee has considered a number of matters as set out in Paragraph 41 of the UK Corporate Governance Code as part of its overall oversight of remuneration at the Company. Specifically, the Committee is satisfied that the level of remuneration provided to the Directors is appropriate, both by comparison to the Company’s peer group within the real estate industry (against which remuneration is benchmarked) and also in the context of the level of remuneration of the wider workforce – a team of experienced professionals of whom a significant number are incentivised in similar ways to the Directors.
The Committee also considered whether the Policy operated as intended in the light of the Company’s performance and quantum. The Policy measures a range of performance metrics that are aligned to the Company’s Strategy with the remuneration outcomes being assessed against these. The ability of the Committee to exercise negative discretion (as has been applied twice in the last four years) when the experience of Shareholders does not match the performance metrics, demonstrates that the necessary checks and balances in place are operating as intended.
The Company regularly seeks feedback from the workforce through a variety of methods as explained on pages 80 and 81. Through these methods, the Company can engage with its workforce on remuneration matters where appropriate.
The Committee does not view formal engagement with the workforce on executive remuneration as being appropriate in a company of Helical’s size.
RECRUITMENT POLICYIn considering the structure of the Board, the balance between Executive Directors and independent Non-Executive Directors and the skills, knowledge and experience required to ensure the Board functions in accordance with the Group’s objectives, the Committee will seek to apply the following principles in relation to the remuneration of new Directors, whether by internal promotion or external appointment:
Element Policy
Salary The salary of newly appointed Executive Directors would reflect the individual’s experience and skills, taking into account internal comparisons. On initial appointment and depending on experience, salaries would generally be set at a level lower than benchmarked for that role to allow for pay increases to market levels subject to satisfactory progress and contribution.
Benefits Benefits would be as are currently provided and periodically reviewed, being car or car allowance, car fuel allowance, private medical cover, permanent health insurance and life assurance.
Pension There is no Group pension scheme for Directors and no contributions are payable to Directors’ own pension schemes.
Annual bonus Annual bonus arrangements under the terms of the 2018 Annual Bonus Scheme will be made in accordance with the terms of that scheme, with the Committee retaining the right to pro-rate any bonus payable in respect of the year of appointment.
Long-term incentives
Annual awards under the terms of the 2014 PSP will be made in accordance with the terms of that Plan.
V REMUNERATION
CO
RP
OR
AT
E G
OV
ER
NA
NC
E R
EP
OR
T112 Helical plc Annual Report and Accounts 2021 113Helical plcAnnual Report and Accounts 2021

HELICAL ANNUAL BONUS SCHEME 2018Gerald Kaye, Tim Murphy and Matthew Bonning-Snook participate in the Annual Bonus Scheme 2018, which was approved by Shareholders at the 2018 AGM. This scheme provides annual bonuses based on the performance of the property portfolio, the Group and the individual Directors and is aligned with Shareholders’ interests with appropriate hurdles and Shareholder protections.
The main features of the Annual Bonus Scheme 2018 are as follows:
• 40% of the maximum annual bonus will be payable if the Total Accounting Return (“TAR”) of the Group (Growth in IFRS NAV plus dividends), calculated annually, is or exceeds 10.0%, with 20% of this part of the award paid out if the TAR lower threshold target is set at 5.0% and 10% of this part of the award paid out if the TAR lower threshold is set between 2.5% and 5.0%;
• 35% of the maximum annual bonus will be payable if the Total Property Return (“TPR”) of the Group’s property portfolio matches or exceeds the performance of the MSCI Central London Offices Capital Growth Index (“Index”) plus 3.25%, with 20% of this part of the award paid out if the performance matches the performance of the Index;
• 25% of the maximum annual bonus will be payable if strategic and ESG objectives, to be determined by the Committee and reported on retrospectively each year, are met.
The Committee will regularly review the threshold and maximum TPR and TAR targets to ensure they remain appropriate to the Group’s strategy and market conditions.
SHAREHOLDER PROTECTIONS• Annual bonus payments to individual Directors will be
restricted in any financial year to 150% of salary;
• Until the minimum shareholding guideline of 500% of salary for current Executive Directors and 250% of salary for new Executive Directors is met, two thirds of any payment is made in cash after the relevant year end and one third is deferred for three years into Helical plc shares. Once the minimum shareholding guideline is met, any bonus payment is normally made in cash up to 100% of salary and in deferred shares from 100% to 150% of salary;
• The Committee has a general negative discretion surrounding bonus payments and, to the extent there is a low or no bonus payable on the financial measures, it will retain the discretion to reduce (including to zero) the payment under the strategic and ESG targets;
• The scheme will operate malus and clawback provisions, whereby amounts deferred, or the net of tax amounts paid, may be recovered or withheld in the event of a misstatement of results, an error being made in assessing the calculation, in the event of gross misconduct, serious reputational damage and corporate failure; and
• The Committee will have discretion to award annual bonuses in deferred shares (in full or in part) irrespective of an Executive Director’s shareholding guidelines, although it is expected that this discretion would only be used in exceptional circumstances.
OTHER MATTERSAwards may be satisfied through shares purchased in the market or by new issue or treasury shares. Where new issue or treasury shares are used, the standard 5% in ten-year dilution limit will apply.
GENDER PAY GAP REPORTINGThe Group falls below the threshold for mandatory Gender Pay Gap reporting. Due to the low number of employees, which could result in distortions of data, the Board does not believe it appropriate to voluntarily report. Notwithstanding this, the Board firmly believes in pay equality for equal work and is mindful of both the legal and moral obligations to ensure that employees are remunerated in a fair manner regardless of gender.
Amount of annual bonus payable if the Total Accounting Return (“TAR”) of the Group is 10% or greater
40%
Amount of annual bonus payable if the Total Property Return (“TPR”) exceeds the MSCI Index plus 3.25%
35%Amount of annual bonus payable if the strategic and ESG targets are met
25%
EXECUTIVE DIRECTORS’ DATES OF APPOINTMENT AND SERVICE CONTRACTSAll service contracts are available for inspection at the registered offices of the Company. Original dates of appointment to the Board are as follows:
Executive Director Notice period Date of 1st employment Board appointment Date of current contract
Gerald Kaye 6 months 6 March 1994 28 September 1994 25 July 2016
Tim Murphy 6 months 1 March 1994 24 July 2012 25 July 2016
Matthew Bonning-Snook 6 months 13 March 1995 1 August 2007 25 July 2016
REWARD SCENARIOSThe charts below show how the composition of the Executive Directors’ remuneration packages varies under four different performance scenarios, namely, at minimum (i.e. fixed pay), target (assumed to be 50% of the maximum incentive levels), maximum levels, all assuming no share price appreciation, and the maximum levels assuming 50% share price appreciation across the performance period of long-term incentive awards.
The charts are based on:
• Salary levels effective 1 April 2021;
• An approximated annual value of benefits (no pension is provided);
• A 150% of salary maximum annual bonus (with target assumed to be 50% of the maximum);
• A 250% of salary award under the 2014 PSP in line with the normal maximum award (with target assumed to be 50% of the maximum) plus shares awarded under the Helical Bar 2002 Approved Share Incentive Plan; and
• In the final column of each chart, share appreciation of 50% across the three-year performance period of the awards made under Performance Share Plan 2014.
599
1,712
Minimum On target Maximum
GERALD KAYE TIM MURPHY MATTHEW BONNING-SNOOK
2,818
3,509
100% 35% 21% 17% 100% 34% 20% 16% 100% 35% 22% 17%
24%29% 24%
41%
49% 39%
20%
24% 30% 24%42%
50% 40%
20%
24%30% 24%
41%
49% 39%
20%
333
984
Minimum On target Maximum
1,628
2,030
474
1,341
Minimum On target MaximumMaximumwith Share
pricegrowth
Maximumwith Share
pricegrowth
Maximumwith Share
pricegrowth
2,201
2,739
Basic salary & benefits Bonus Share Awards Maximum with 50% share price growth
Value of remuneration packages at di�erent levels of performance£’000
DIRECTORS’ REMUNERATION REPORT CONTINUED
V REMUNERATION V REMUNERATION
PERFORMANCE SHARE PLAN 2014Performance conditions for awards granted under the terms of the Performance Share Plan 2014 will be equally weighted and measured over three years as follows:
NET ASSET VALUE GROWTH TPR VERSUS MSCI INDEX RELATIVE TSR
% of award vestingAnnual compound increase % of award vesting Ranking after three years % of award vesting Ranking after three years
10.0% pa or more 33.3 Upper quartile or above
33.3 Upper quartile or above
33.3
5.0% pa to 10.0% pa Pro-rata from 3.3 and 33.3
Median to upper quartile
Pro-rata from 3.3 and 33.3
Median to upper quartile
Pro-rata from 3.3 and 33.3
5.0% pa 3.3 Median 3.3 Median 3.3
Below 5.0% pa nil Less than median nil Less than median nil
1 Net Asset Value Growth – the “fully diluted triple net” asset value as at the start of the financial year in which a grant takes place will be compared to the value three years later (having added back dividends and changes in issued share capital). If UK inflation (RPI) is higher than 3% pa over the three-year period, then the required compound increase will be raised by the excess over 3% pa average.
2 TPR versus MSCI Index – the Total Property Return of the Group’s property portfolio will be compared to the MSCI Central London Offices Total Return Index.3 Relative TSR – The comparator group for awards granted will be those companies included in the FTSE 350 and Small Cap Indices, excluding agencies.4 Share awards will lapse in full where Net Asset Value per share (having added back dividends and changes in issued share capital) does not increase over the three-year
period or the Total Property Return falls below the MSCI median, the growth in triple net asset value is below 5.0% pa and the relative TSR is below the median over the three-year period.
CO
RP
OR
AT
E G
OV
ER
NA
NC
E R
EP
OR
T114 Helical plc Annual Report and Accounts 2021 115Helical plcAnnual Report and Accounts 2021

NON-EXECUTIVE DIRECTORSNon-Executive Directors are appointed by a Letter of Appointment and their remuneration is determined by the Executive Board. Current Letters of Appointment, setting out the terms of appointment, operate from 1 April 2015 or, if later, the date of appointment. The appointment of Non-Executive Directors is terminable on three months’ notice. Non-Executive Directors are not eligible to participate in any new share awards made under the terms of the Group’s bonus or share award schemes. In exceptional circumstances, where an Executive Director becomes a Non-Executive Director, ongoing participation in awards previously made in bonus and share schemes will be subject to the rules of those schemes and to the discretion of the Committee.
NON-EXECUTIVE DIRECTORS’ LETTERS OF APPOINTMENT
Non-Executive Director Board appointmentCommencement date of
current term
Richard Grant – Board Chairman and Chair of the Nominations Committee 24 July 2012 1 April 2015
Richard Cotton – Senior Independent Director 1 March 2016 1 March 2016
Sue Clayton – Chair of the Property Valuations Committee 1 February 2016 1 February 2016
Sue Farr – Chair of the Remuneration Committee 5 June 2019 5 June 2019
Joe Lister – Chair of the Audit and Risk Committee 1 September 2018 1 September 2018
PEER GROUPThe Remuneration Committee determined a peer group of companies at the start of the Policy for benchmarking purposes (albeit with some caution, given the variances in size and nature of operations in the sector and more general risk of pay inflation where too great a reliance is placed on published data) and as a reference point in ensuring that performance targets are appropriately stretching and when reviewing the Group’s relative performance.
The peer group set at the start of the Policy is as follows:
Capital & Counties Properties plc;
Capital & Regional plc;
Derwent London plc;
Great Portland Estates plc;
Hammerson plc;
LondonMetric Property plc;
McKay Securities plc;
NewRiver REIT plc;
Shaftesbury plc;
St. Modwen Properties plc;
U+I Group plc; and
Workspace Group plc.
ANNUAL REPORT ON REMUNERATIONThis part of the Directors’ Remuneration Report explains how the Group has implemented the Remuneration Policy in the year to 31 March 2021 and how the Policy is intended to be implemented in the year to 31 March 2022.
APPLICATION OF THE REMUNERATION POLICY IN THE YEAR TO 31 MARCH 2021WORK OF THE COMMITTEE DURING THE YEARThe Committee’s work during the year under review included the following:
FIXED PAY• The annual salary review for the Executive Directors and wider workforce.
PERFORMANCE RELATED PAY• The approval of annual bonuses for the year ended 31 March 2020;
• The review of bonus targets for the year ended 31 March 2021;
• The setting of targets for the PSP awards which were granted in June 2020; and
• The approval of the vesting of PSP awards in June 2020 which were originally awarded in June 2017.
OTHER MATTERS• The Committee reviewed the Group’s Remuneration Policy (“Policy”) and, having considered feedback received from
Shareholders and shareholder advisory bodies, is recommending a new Policy at the 2021 AGM; and
• The Committee updated its terms of reference.
TOTAL REMUNERATION IN THE YEAR TO 31 MARCH 2021This section has been subject to audit unless otherwise stated.
BALANCE OF FIXED VERSUS VARIABLE PAY (UNAUDITED)In line with its Policy, the Committee seeks to ensure that the balance of remuneration provides a basic salary and performance related bonuses and share awards that reward absolute performance and outperformance relative to the Group’s peer group. In the year to 31 March 2021, the balance of fixed versus variable pay on an actual basis for the Executive Directors in office throughout the year compared to the maximum payable was as follows:
Actual £000
Share of total %
Maximum £000
Share of total %
Basic salaries and benefits-in-kind 1,386 28 1,386 21
Annual Bonus Scheme 2018 1,163 23 1,928 29
Deferred bonus dividend shares 105 2 105 2
Share awards 2,345 47 3,141 48
4,999 100% 6,560 100%
Note: Share awards reflect the market value of shares that are expected to vest (actual) or could vest (maximum) in respect of the three-year performance period to 31 March 2021 in accordance with the terms of the Performance Share Plan 2014, plus the shares awarded under the terms of the Share Incentive Plan.
ANNUAL TOTAL REMUNERATION COMPARED TO THE 2020 POTENTIAL (UNAUDITED)The following bar charts show the actual remuneration earned by the Executive Directors against the minimum and maximum scenarios for the year.
The elements of remuneration have been categorised into three components: (i) basic salary and benefits; (ii) annual bonus (including deferred bonus); and (iii) PSP.
We have shown the actual and maximum scenarios with the impact of the actual share price appreciation over the three years to 31 March 2021 (3 month average).
DIRECTORS’ REMUNERATION REPORT CONTINUED
V REMUNERATION V REMUNERATION
CO
RP
OR
AT
E G
OV
ER
NA
NC
E R
EP
OR
T116 Helical plc Annual Report and Accounts 2021 117Helical plcAnnual Report and Accounts 2021

Value of remuneration packages at di�erent levels of performance£’000
28%100%100% 100%27% 28%
23%590
2,125
47%
2%
47%
2%
24%23%
47%
2%
Minimum Actual Maximum with actualshare price
growth
Minimum Actual Maximum with actualshare price
growth
Minimum Actual Maximum with actualshare price
growth
GERALD KAYE TIM MURPHY MATTHEW BONNING-SNOOK
Basic salary & benefits Bonus PSP Share price growth
3,500
3,000
2,500
2,000
1,500
1,000
500
0
21%
29%
48%
2%2,796
20%
30%
48%
2%1,599
21%
29%
48%
2%2,187
1,209
328468
1,665
DIRECTORS’ REMUNERATIONTotal remuneration in respect of the Directors in the year to 31 March 2021 was as follows:
Year to 31 March 2021
Fixed Variable
Total £000
Basic salary/fees
£000Benefits 1
£000Sub-total
£000
Annual cash
bonus£000
Deferred bonus shares
£000
Share 3,4
awards£000
Share Incentive
Plan 2 £000
Sub-total£000
Executive DirectorsGerald Kaye 545 45 590 493 – 1,035 7 1,535 2,125
Tim Murphy 317 11 328 287 – 587 7 881 1,209
Matthew Bonning-Snook 424 44 468 383 – 807 7 1,197 1,665
1,286 100 1,386 1,163 – 2,429 21 3,613 4,999Non-Executive DirectorsRichard Grant 150 – 150 – – – – – 150
Sue Clayton 58 – 58 – – – – – 58
Richard Cotton 70 – 70 – – – – – 70
Sue Farr 55 – 55 – – – – – 55
Joe Lister 58 – 58 – – – – – 58
391 – 391 – – – – – 391–
Total 1,677 100 1,777 1,163 – 2,429 21 3,613 5,390
1 Benefits include the provision of a car, fuel allowance, private medical cover, life assurance and permanent health insurance. Significant individual benefits include £25,000 and £22,000 car benefit for Gerald Kaye and Matthew Bonning-Snook respectively.
2 The Share Incentive Plan figure relates to the free and matching shares awarded under the Helical Bar 2002 Approved Share Incentive Plan, details of which are on page 123.3 Value of PSP awards based on average share price over three months to 31 March 2021 of 387.63p. Dividend shares awarded to Directors on 29 June 2020 under the terms
of the Annual Bonus Scheme 2016 are included at their vesting price of 320.00p.4 The PSP award values include share price appreciation totalling £32,000 for Gerald Kaye, £19,000 for Tim Murphy and £25,000 for Matthew Bonning-Snook.
Total remuneration in respect of the Directors in the year to 31 March 2020 was as follows:
Year to 31 March 2020
Fixed Variable
Total £000
Basic salary/fees
£000Benefits 1
£000Sub-total
£000
Annual cash
bonus£000
Deferred bonus shares
£000
Share 3,4
awards£000
Share Incentive
Plan 2 £000
Sub-total£000
Executive DirectorsGerald Kaye 545 59 604 – 622 1,083 7 1,712 2,316
Tim Murphy 317 22 339 – 371 643 7 1,021 1,360
Matthew Bonning-Snook 424 42 466 – 467 890 7 1,364 1,830
1,286 123 1,409 – 1,460 2,616 21 4,097 5,506Non-Executive DirectorsRichard Grant 128 – 128 – – – – – 128
Sue Clayton 58 – 58 – – – – – 58
Richard Cotton 70 – 70 – – – – – 70
Sue Farr 5 39 – 39 – – – – – 39
Joe Lister 55 – 55 – – – – – 55
350 – 350 – – – – – 350Former DirectorsMichael O’Donnell 6 17 – 17 – – – – – 17
Michael Slade 6 44 16 60 – – – – – 60
61 16 77 – – – – – 77
Total 1,697 139 1,836 – 1,460 2,616 21 4,097 5,933
1 Benefits include the provision of a car, fuel allowance, private medical cover, life assurance and permanent health insurance. Significant individual benefits include £38,000 and £22,000 car benefit for Gerald Kaye and Matthew Bonning-Snook respectively.
2 The Share Incentive Plan figure relates to the free and matching shares awarded under the Helical Bar 2002 Approved Share Incentive Plan, details of which are on page 123.3 PSP awards are included at their actual vesting values in June 2020 of 358.50p. The table included in the 2020 Financial Statements included share awards at the average
share price over the three months to 31 March 2020 of 439.87p. Dividend shares awarded to Directors on 24 June 2019 under the terms of the Annual Bonus Scheme 2016 are included at their actual vesting price of 354.50p
4 The PSP award values include share price appreciation totalling £113,000 for Gerald Kaye, £69,000 for Tim Murphy and £92,000 for Matthew Bonning-Snook.5 Sue Farr was appointed to the Board on 5 June 2019.6 Michael Slade and Michael O’Donnell stepped down from the Board on 11 July 2019.
DIRECTORS’ REMUNERATION REPORT CONTINUED
V REMUNERATION V REMUNERATION
CO
RP
OR
AT
E G
OV
ER
NA
NC
E R
EP
OR
T118 Helical plc Annual Report and Accounts 2021 119Helical plcAnnual Report and Accounts 2021

DETERMINATION OF ANNUAL BONUS OUTCOMEThe table below sets out the financial measures and strategic objectives and their respective outcomes under the terms of the Annual Bonus Scheme 2018. These measures apply to all Executive Directors equally and provide each Director with a percentage payout of their maximum bonus, capped at 150% of basic salary. This is set out in the second table below.
Metric Performance condition WeightingThreshold
target Stretch target Outcome
% of bonus payable
TPR Total Property Return v MSCI Central London Offices Total Return Index 20% of the maximum bonus available pays out if the Group’s TPR matches the performance of the Index increasing pro-rata to 100% for matching or exceeding the Index plus 3.25%.
50.00% -1.65% 1.60% 6.99% 50.00%
TAR Total Accounting Return 20% of the maximum bonus available pays out if the Group’s TAR, adjusted for performance related awards and calculated annually, exceeds 5.0% increasing pro-rata to 100% for a TAR of 10.0% or greater.
25.00% 5.00% 10.00% 3.64% 0.00%
Strategic and ESG
1. Pipeline of schemes/projects Seek to acquire at least one significant high-quality project in the year which complements the existing portfolio, and which is consistent with the Group’s strategy and long-term plans.
2. Equity Obtaining material “equity” from third party investors to fund Helical’s schemes/projects. Equity to include funds from any source eg individual project equity participation, strategic partners or shareholders.
3. Lettings Base Target – let 50% of both Kaleidoscope (75% of potential award) and Trinity (25%). Stretch Target – let 100% of both Kaleidoscope (75% of potential award) and Trinity (25%), with a minimum 90% occupancy underpin
4. Overheads If Targets 1 and 2 met, reduce annualised overheads by 2.5% (base) or by 5.0% (stretch). If Targets 1 and 2 not met, reduce annualised overheads by 5.0% (base) or by 7.5% (stretch).
5. ESG Make tangible progress in implementing the Company’s sustainability strategy and improvements towards best practice, for a company of Helical’s size, in ESG matters: - GRESB Target 3* (versus 2* awarded in 2020) - EPRA Sustainability BPR Target Silver (versus Bronze awarded in 2020)
6.67%
6.67%
6.66%
3.33%
1.67%
-5.0% -7.5%
Not Achieved
Not Achieved
Kaleidoscope100% let
Trinity46% let
-11.7%
GRESBTarget Met
EPRA Target Met
0.00%
0.00%
5.33%
3.33%
1.67%
Total 100.00% 60.33
The total annual bonus for the year ended 31 March 2021 is set out below:
Executive Director
Basic salary£000
Maximum bonus
payable (150% basic
salary)£000
Bonus outcome
%
Bonus payable
£000Cash£000
Deferred shares
£000
Gerald Kaye 545 817 60.3% 493 493 –
Tim Murphy 317 475 60.3% 287 287 –
Matthew Bonning-Snook 424 636 60.3% 383 383 –
All Executive Directors satisfy the minimum shareholding guideline of 500% of salary and bonuses up to 100% of their base salaries are eligible to be paid in cash.
PSP AWARDS VESTING IN 2021The PSP award granted on 1 June 2018 will vest after 1 June 2021. The expected vesting percentage is as follows:
Metric Performance condition WeightingThreshold
target Stretch target Actual % vesting
NAV (fully diluted triple net)
Net Asset Value Growth 10% of this part of an award vests for pre-dividend compound NAV growth of 5.0% pa increasing pro-rata to 100% of this part of an award vesting for pre-dividend compound NAV growth of 12.5% pa
33.33% 5.0% pa 12.5% pa 6.0% 7.4%
TPR Total Property Return v MSCI Central London Offices Total Return Index 10% of this part of an award vests for median ranking increasing pro-rata to 100% of this part of an award vesting for upper quartile or above performance
33.33% Median2.8%
Upperquartile
4.8%
8.9% 33.3%
TSR Total Shareholder Return 10% of this part of an award vests for median ranking increasing pro-rata to 100% of this part of an award for upper quartile or above performance
33.33% Median-27.4%
Upperquartile
4.1%
25.2% 33.3%
Total 100.0% 74.0%
Based on the above and given that the net asset value per share (having added back dividends) increased over the three-year performance period, details of the shares awarded and the expected value at vesting are as follows:
Executive DirectorNumber of shares at
grantNumber of shares expected to lapse
Number of shares expected to vest
Estimated valueat vesting1
£’000
Gerald Kaye 343,333 89,301 254,032 985
Tim Murphy 199,800 51,968 147,832 573
Matthew Bonning-Snook 267,066 69,464 197,602 766
1 The share price used to calculate the expected value at vesting was 387.63p, based on the average share price over the three months to 31 March 2021.
The share awards presented in the remuneration table for the year to 31 March 2020 on page 119 are based on the 2014 PSP awards granted on 6 June 2017. The three-year performance period to 31 March 2020 showed that the net asset value per share, calculated in accordance with the terms of the 2014 PSP, had increased by 5.9% pa, below the lower threshold of 7.5% pa. During this three-year period the total return of Helical’s property portfolio, as determined by MSCI IPD, was 10.2% compared to the upper quartile of the MSCI Annual March Universe Total Return Index which showed a return of 7.0%. The TSR of the Company during the period was 57.5% compared to the median of plus 39.6% and upper quartile of 58.0%. Therefore, 65.83% of the shares vested in total. The share price used to calculate the expected value at vesting for the 2017 PSP awards in the 2020 Annual Report was 439.87p (based on the average share price over the three months to 31 March 2020). The actual share price at vesting on 10 June 2020 was 358.50p and the comparative figures reflect these actual vesting share prices.
PAYMENTS FOR LOSS OF OFFICE (AUDITED)No payments were made to Directors in the year for loss of office or to past Directors.
STATEMENT OF IMPLEMENTATION OF REMUNERATION POLICY FOR THE YEAR TO 31 MARCH 2022This Annual Report on Remuneration is required, under the provisions of the Act, to include a statement on the implementation of the Remuneration Policy in the year to 31 March 2022. To assist Shareholders to understand the Group’s overall remuneration, we have included this information in the Remuneration at-a-glance section on pages 104 to 105 above.
DIRECTORS’ REMUNERATION REPORT CONTINUED
V REMUNERATION V REMUNERATION
CO
RP
OR
AT
E G
OV
ER
NA
NC
E R
EP
OR
T120 Helical plc Annual Report and Accounts 2021 121Helical plcAnnual Report and Accounts 2021
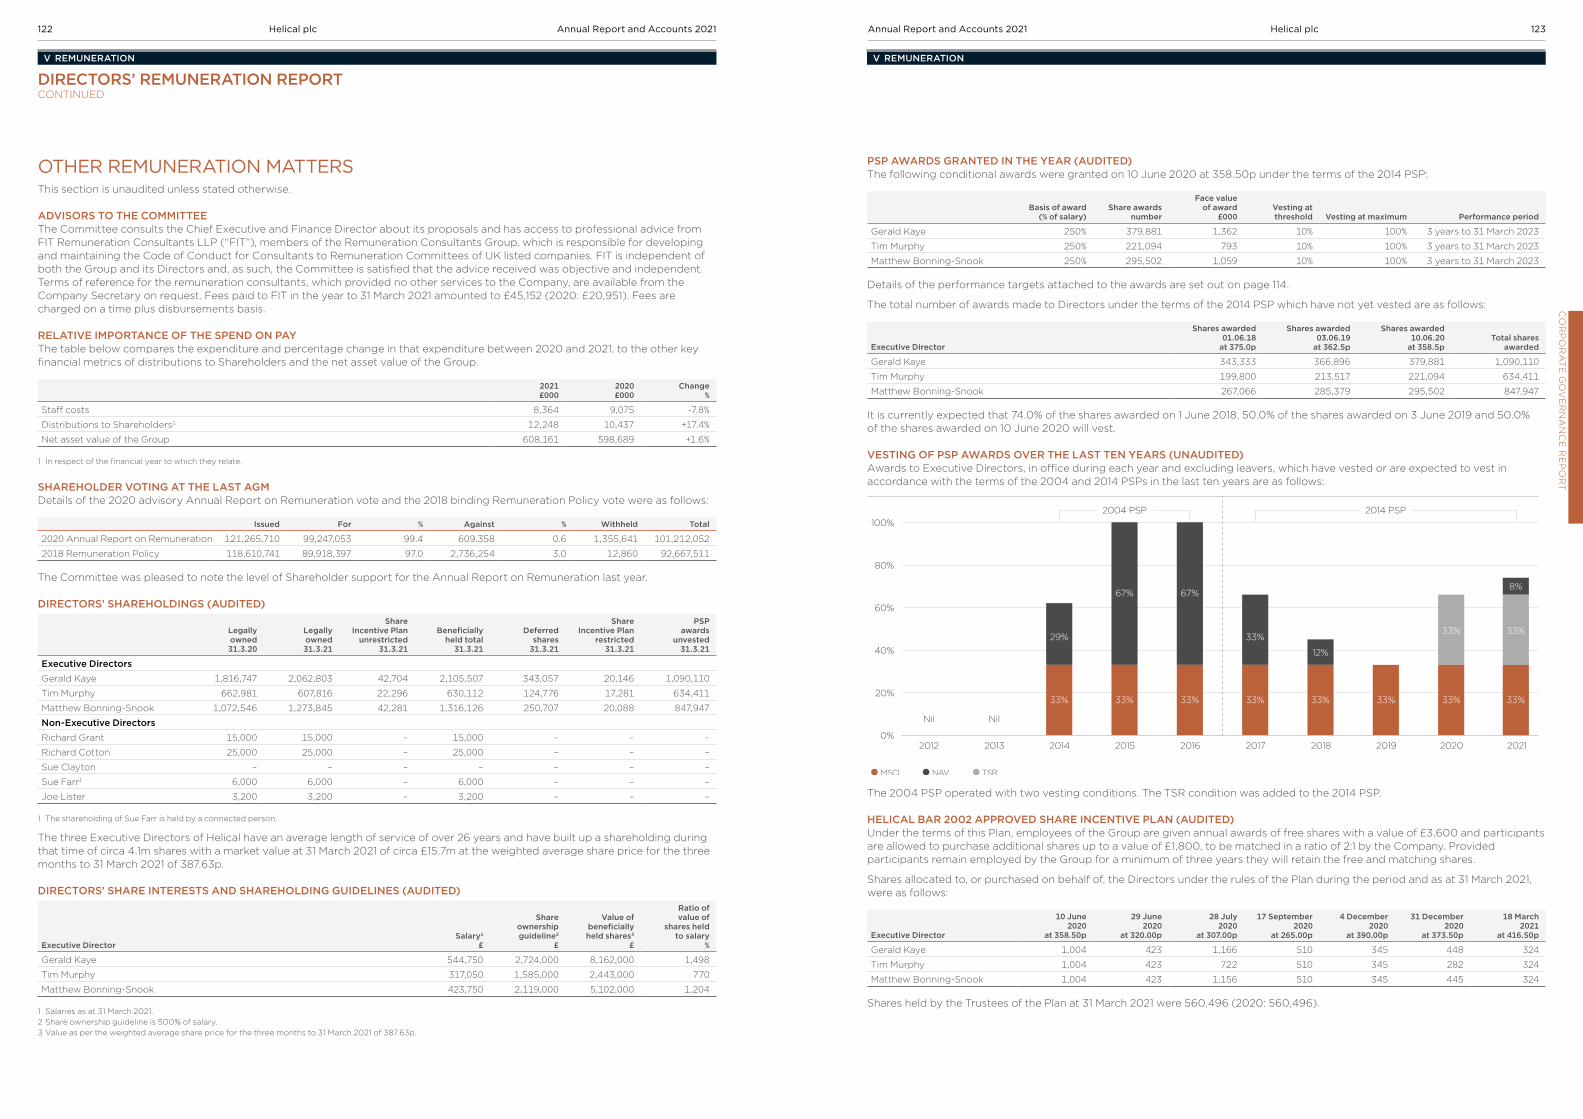
OTHER REMUNERATION MATTERSThis section is unaudited unless stated otherwise.
ADVISORS TO THE COMMITTEEThe Committee consults the Chief Executive and Finance Director about its proposals and has access to professional advice from FIT Remuneration Consultants LLP (“FIT”), members of the Remuneration Consultants Group, which is responsible for developing and maintaining the Code of Conduct for Consultants to Remuneration Committees of UK listed companies. FIT is independent of both the Group and its Directors and, as such, the Committee is satisfied that the advice received was objective and independent. Terms of reference for the remuneration consultants, which provided no other services to the Company, are available from the Company Secretary on request. Fees paid to FIT in the year to 31 March 2021 amounted to £45,152 (2020: £20,951). Fees are charged on a time plus disbursements basis.
RELATIVE IMPORTANCE OF THE SPEND ON PAYThe table below compares the expenditure and percentage change in that expenditure between 2020 and 2021, to the other key financial metrics of distributions to Shareholders and the net asset value of the Group.
2021 £000
2020 £000
Change %
Staff costs 8,364 9,075 -7.8%
Distributions to Shareholders1 12,248 10,437 +17.4%
Net asset value of the Group 608,161 598,689 +1.6%
1 In respect of the financial year to which they relate.
SHAREHOLDER VOTING AT THE LAST AGMDetails of the 2020 advisory Annual Report on Remuneration vote and the 2018 binding Remuneration Policy vote were as follows:
Issued For % Against % Withheld Total
2020 Annual Report on Remuneration 121,265,710 99,247,053 99.4 609.358 0.6 1,355,641 101,212,052
2018 Remuneration Policy 118,610,741 89,918,397 97.0 2,736,254 3.0 12,860 92,667,511
The Committee was pleased to note the level of Shareholder support for the Annual Report on Remuneration last year.
DIRECTORS’ SHAREHOLDINGS (AUDITED)
Legally owned 31.3.20
Legally owned 31.3.21
Share Incentive Plan
unrestricted31.3.21
Beneficially
held total 31.3.21
Deferred shares
31.3.21
Share Incentive Plan
restricted 31.3.21
PSPawards
unvested 31.3.21
Executive DirectorsGerald Kaye 1,816,747 2,062,803 42,704 2,105,507 343,057 20,146 1,090,110
Tim Murphy 662,981 607,816 22,296 630,112 124,776 17,281 634,411
Matthew Bonning-Snook 1,072,546 1,273,845 42,281 1,316,126 250,707 20,088 847,947
Non-Executive DirectorsRichard Grant 15,000 15,000 – 15,000 – – –
Richard Cotton 25,000 25,000 – 25,000 – – –
Sue Clayton – – – – – – –
Sue Farr1 6,000 6,000 – 6,000 – – –
Joe Lister 3,200 3,200 – 3,200 – – –
1 The shareholding of Sue Farr is held by a connected person.
The three Executive Directors of Helical have an average length of service of over 26 years and have built up a shareholding during that time of circa 4.1m shares with a market value at 31 March 2021 of circa £15.7m at the weighted average share price for the three months to 31 March 2021 of 387.63p.
DIRECTORS’ SHARE INTERESTS AND SHAREHOLDING GUIDELINES (AUDITED)
Executive DirectorSalary1
£
Share ownership guideline2
£
Value of beneficiallyheld shares3
£
Ratio of value of
shares held to salary
%
Gerald Kaye 544,750 2,724,000 8,162,000 1,498
Tim Murphy 317,050 1,585,000 2,443,000 770
Matthew Bonning-Snook 423,750 2,119,000 5,102,000 1,204
1 Salaries as at 31 March 2021.2 Share ownership guideline is 500% of salary.3 Value as per the weighted average share price for the three months to 31 March 2021 of 387.63p.
PSP AWARDS GRANTED IN THE YEAR (AUDITED)The following conditional awards were granted on 10 June 2020 at 358.50p under the terms of the 2014 PSP:
Basis of award(% of salary)
Share awardsnumber
Face value of award
£000Vesting at threshold Vesting at maximum Performance period
Gerald Kaye 250% 379,881 1,362 10% 100% 3 years to 31 March 2023
Tim Murphy 250% 221,094 793 10% 100% 3 years to 31 March 2023
Matthew Bonning-Snook 250% 295,502 1,059 10% 100% 3 years to 31 March 2023
Details of the performance targets attached to the awards are set out on page 114.
The total number of awards made to Directors under the terms of the 2014 PSP which have not yet vested are as follows:
Executive Director
Shares awarded01.06.18
at 375.0p
Shares awarded03.06.19
at 362.5p
Shares awarded10.06.20
at 358.5pTotal shares
awarded
Gerald Kaye 343,333 366,896 379,881 1,090,110
Tim Murphy 199,800 213,517 221,094 634,411
Matthew Bonning-Snook 267,066 285,379 295,502 847,947
It is currently expected that 74.0% of the shares awarded on 1 June 2018, 50.0% of the shares awarded on 3 June 2019 and 50.0% of the shares awarded on 10 June 2020 will vest.
VESTING OF PSP AWARDS OVER THE LAST TEN YEARS (UNAUDITED)Awards to Executive Directors, in office during each year and excluding leavers, which have vested or are expected to vest in accordance with the terms of the 2004 and 2014 PSPs in the last ten years are as follows:
20212012 2013 2014 2015 2016 2017 2018 2019 2020
2004 PSP 2014 PSP
NilNil
33% 33% 33% 33% 33%
33%
33%
33%
8%
33%
29%
67% 67%
12%
33%
33%
MSCI NAV TSR
100%
80%
60%
40%
20%
0%
The 2004 PSP operated with two vesting conditions. The TSR condition was added to the 2014 PSP.
HELICAL BAR 2002 APPROVED SHARE INCENTIVE PLAN (AUDITED)Under the terms of this Plan, employees of the Group are given annual awards of free shares with a value of £3,600 and participants are allowed to purchase additional shares up to a value of £1,800, to be matched in a ratio of 2:1 by the Company. Provided participants remain employed by the Group for a minimum of three years they will retain the free and matching shares.
Shares allocated to, or purchased on behalf of, the Directors under the rules of the Plan during the period and as at 31 March 2021, were as follows:
Executive Director
10 June 2020
at 358.50p
29 June 2020
at 320.00p
28 July 2020
at 307.00p
17 September2020
at 265.00p
4 December2020
at 390.00p
31 December2020
at 373.50p
18 March 2021
at 416.50p
Gerald Kaye 1,004 423 1,166 510 345 448 324
Tim Murphy 1,004 423 722 510 345 282 324
Matthew Bonning-Snook 1,004 423 1,156 510 345 445 324
Shares held by the Trustees of the Plan at 31 March 2021 were 560,496 (2020: 560,496).
DIRECTORS’ REMUNERATION REPORT CONTINUED
V REMUNERATION V REMUNERATION
CO
RP
OR
AT
E G
OV
ER
NA
NC
E R
EP
OR
T122 Helical plc Annual Report and Accounts 2021 123Helical plcAnnual Report and Accounts 2021

Shares allocated to, or purchased on behalf of, the Directors, which remain in their ownership at 31 March 2021, were as follows:
Executive Director Unrestricted RestrictedAs at 31 March
2021
Gerald Kaye 42,704 20,146 62,850
Tim Murphy 22,296 17,281 39,577
Matthew Bonning-Snook 42,281 20,088 62,369
1 Unrestricted shares are those shares allocated to Directors that have met their minimum five year ownership qualifying period.2. Restricted shares are those shares allocated to Directors that have not met their minimum five year ownership qualifying period.
HELICAL ANNUAL BONUS SCHEME – DEFERRED SHARES (AUDITED)Under the terms of the Annual Bonus Scheme 2016, one third of annual bonuses awarded to scheme participants each year were deferred for three years into Helical plc shares. Under the Annual Bonus Scheme 2018, the same applies unless an Executive Director satisfies the minimum shareholding guideline, in which case bonus payments up to 100% of salary are payable in cash with the remainder in deferred shares. Deferred shares awarded under the terms of these schemes, and which vested during the year to 31 March 2021, are as noted in the table below:
Executive DirectorDeferred shares
1 April 2020
2020 bonus award
10 June 2020
2017 awardvesting
29 June 2020Deferred shares
31 March 2021
Expected2021
award
Dividend shares awarded on 2017 award
vesting
Gerald Kaye 324,961 173,578 (155,482) 343,057 – 15,628
Tim Murphy 63,798 103,412 (42,434) 124,776 – 4,265
Matthew Bonning-Snook 247,672 130,236 (127,201) 250,707 – 12,785
SHARE PRICE PERFORMANCE AND TOTAL SHAREHOLDER RETURN (TSR)The market price of the ordinary shares of Helical plc at 31 March 2021 was 413.50p (2020: 350.00p). This market price varied between 246.00p and 426.00p and at an average of 345.00p during the year.
The Total Shareholder Returns for a holding in the Group’s shares in the three and 10 years to 31 March 2021 compared to a holding in the FTSE 350 Supersector Real Estate Index are shown in the graphs below. This index has been chosen because it includes the majority of listed real estate companies.
TSR – THREE YEARS TO 31 MARCH 2021The graph below showing the relative performance of Helical during the three years to 31 March 2021 matches the performance period for the 2018 PSP award granted on 1 June 2018 and which will vest after 1 June 2021.TOTAL SHAREHOLDER RETURN
Mar2018
Mar2019
150
125
100
75
50
25
0Mar
2020Mar2021
Helical FTSE 350 Supersector Real Estate Index
Source: Datastream (Thomson Reuters).
This graph shows the value, by 31 March 2021, of £100 invested in Helical on 31 March 2018, compared with the value of £100 invested in the FTSE 350 Supersector Real Estate Index.
TSR – TEN YEARS TO 31 MARCH 2021The graph below shows the base position, at 31 March 2011, from which subsequent performance is measured, as required by the Regulations.TOTAL SHAREHOLDER RETURN
Mar’21
Mar’11
Mar’12
Mar’13
Mar’14
Mar’16
Mar’17
Mar’18
Mar’19
Mar’20
Mar’15
Helical FTSE 350 Supersector Real Estate Index
Source: Datastream (Thomson Reuters).
150
200
250
100
50
0
This graph shows the value, by 31 March 2021, of £100 invested in Helical on 31 March 2011, compared with the value of £100 invested in the FTSE 350 Supersector Real Estate Index.
REMUNERATION OF THE CHIEF EXECUTIVEComparing the ten-year TSR of the Company, set out above, to the remuneration of the Chief Executive, the table opposite presents single figure remuneration for the Chief Executive over the period, since 1 April 2011, together with past annual bonus pay-outs and the vesting of long-term incentive share awards:
Year ended Name
Total remuneration
£000
Annual bonus (% of maxpay-out)
PSP (% of max
vesting)
31 March 2021 Gerald Kaye 2,125 60 74
31 March 2020 Gerald Kaye 2,316 761 66
31 March 2019 Gerald Kaye 1,732 91 33
31 March 2018 Gerald Kaye 2,209 752 46
31 March 2017 Gerald Kaye 2,6353 100 66
31 March 2016 Michael Slade 3,867 100 100
31 March 2015 Michael Slade 5,534 100 100
31 March 2014 Michael Slade 3,343 100 62
31 March 2013 Michael Slade 1,523 65 –
31 March 2012 Michael Slade 541 – –
1 85% before the application of negative discretion by the Committee.2 100% before the application of negative discretion by the Committee.3 The total remuneration of Gerald Kaye includes the period whilst he was an Executive Director but prior to his appointment as CEO on 25 July 2016.
COMPARISON OF CHANGES IN THE REMUNERATION OF THE BOARD TO THE GROUP’S OTHER EMPLOYEESThe percentage change in the remuneration of each member of the Board and for the average of all other employees in the Group, between 2020 and 2021, was as follows:
Base salary/fees Benefits
Annual Bonus
Executive DirectorsGerald Kaye 0.0% -23.2% -20.8%
Tim Murphy 0.0% -46.7% -22.6%
Matthew Bonning-Snook 0.0% 4.0% -17.9%
Non-Executive DirectorsRichard Grant2 17.2% n/a n/a
Richard Cotton 0.0% n/a n/a
Sue Clayton 0.0% n/a n/a
Sue Farr3 41.0% n/a n/a
Joe Lister4 5.5% n/a n/a
Average of all other employees 0.8% 7.6% -5.0%
1 The remuneration of Directors used to calculate the percentage change in base salary/fees, benefits and share incentive plan and annual bonus, is taken from the tables of Directors’ remuneration on pages 118 and 119.
2 The percentage increase in the fees payable to Richard Grant reflects his appointment as Chairman at the 2019 AGM.3 The percentage increase in the fees payable to Sue Farr reflects her first full year as a member of the Board since her appointment on 5 June 2019 and her appointment
as Chair of the Remuneration Committee at the 2020 AGM.4 The percentage increase in the fees payable to Joe Lister reflects his appointment as Chair of the Audit and Risk Committee at the 2019 AGM.
CHIEF EXECUTIVE PAY RATIOAs Helical has fewer than 250 employees, there is no requirement to disclose the Chief Executive pay ratio. However, given the Committee’s commitment to transparency and good governance, this information is provided on a voluntary basis.
The table below compares the 2021 single total figure of remuneration for the Chief Executive, as shown in the table on page 104, with the Group’s other employees paid at the 25th, 50th and 75th percentiles:
Remuneration 25th percentile 50th percentile 75th percentile
Ratio of CEO single figure remuneration to the Group’s other employees at each percentile 27:1 23:1 7:1
Other employees’ total pay and benefits £80,124 £93,618 £290,860
Other employees’ salary £58,375 £70,000 £137,813
This is the first year we have published our pay ratios, which have been calculated under Option A. All non-salary remuneration has been included. Joiners, leavers and employees on statutory leave (eg maternity) have been excluded from this comparison.
Total pay and benefits have been calculated on the same basis as for the Chief Executive single figure shown on page 104 and include annual salary, taxable benefits, free and matching shares allocated under the terms of the Group’s Share Incentive Plan, annual bonus awarded in respect of the year to 31 March 2021, taxable share awards vesting under the terms of the Group’s Performance Share Plan, and employer pension contributions to employees’ pension arrangements.
Approved by the Board on 25 May 2021 and signed on its behalf.
SUE FARRChair of the Remuneration Committee
DIRECTORS’ REMUNERATION REPORT CONTINUED
V REMUNERATION V REMUNERATION
CO
RP
OR
AT
E G
OV
ER
NA
NC
E R
EP
OR
T124 Helical plc Annual Report and Accounts 2021 125Helical plcAnnual Report and Accounts 2021

REPORT OF THE DIRECTORS
GOING CONCERN In accordance with Provision 30 of the Code, the Board is required to report on whether it considers it appropriate to adopt the going concern basis of accounting. In considering this requirement, the Directors took into account the matters set out in the Group’s Viability Statement on page 54. Having due regard to the matters referenced in Note 1 to the financial statements, the Directors were able to conclude that they have a reasonable expectation that the Company and the Group have adequate resources to continue in operational existence for at least the next 12 months, and have continued to adopt the going concern basis of accounting when preparing the financial statements for the year ended 31 March 2021.
DIRECTORS’ CONFLICT OF INTEREST Under the Companies Act 2006 (the “Act”), Directors are subject to a statutory duty to avoid a situation where they have, or can have, a direct or indirect interest that conflicts, or may possibly conflict, with the interests of the Company. As is permissible under the Act, the Company’s Articles of Association allow the Board to consider, and if it sees fit, to authorise situations where a Director has an interest that conflicts, or may possibly conflict, with the interests of the Company. Directors are required to notify the Company of any conflict or potential conflict of interest under an established procedure and any conflicts or potential conflicts are noted at each Board meeting. In accordance with the Code Provision 7, the Board has a well-established process for the management of conflicts of interests.
DIRECTORS’ LIABILITY INSURANCE AND INDEMNITY The Company maintains Directors and Officers Liability Insurance which is subject to annual renewal. To the extent permitted by UK Law, the Company also indemnifies the Directors against legal proceedings brought in connection with the execution of their duties as Company Directors.
POLITICAL DONATIONS The Company’s policy with regard to political donations is to ensure that Shareholder approval is sought before making any such payments. No Shareholder approval has been sought and, accordingly, the Company made no political donations in the year to 31 March 2021.
FINANCIAL INSTRUMENTS, CAPITALISED INTEREST AND LONG-TERM INCENTIVE SCHEMES The information required in respect of financial instruments, as required by Schedule 7 of the Large and Medium Sized Companies and Groups (Accounts and Reports) (Amendment) Regulations 2013, is shown in Note 35. Interest capitalised on the Group property portfolio is shown in Notes 14 and 19. Long-term incentive schemes are explained in the Directors’ Remuneration Report on pages 103 to 125.
STRATEGIC REPORT A review of the Company’s business during the year, the principal and emerging risks and uncertainties it faces as well as future prospects and developments are included in the Strategic Report on pages 1 to 81 which should be read in conjunction with this report.
RESULTS AND DIVIDENDS The results for the year are set out in the Consolidated Income Statement and Consolidated Statement of Comprehensive Income on page 136. An interim dividend of 2.70p (2019: 2.70p) was paid on 31 December 2020 to Shareholders on the Shareholder register on 4 December 2020. A final dividend of 7.40p (2020: 6.00p) per share is recommended for approval at the Annual General Meeting (“AGM”) to be held on 15 July 2021 and, if approved, will be paid on 26 July 2021 to Shareholders on the register on 25 June 2021. The total ordinary dividend declared and paid in the year of 8.70p (2020: 10.20p) per share amounted to £10,528,000 (2020: £12,219,000).
CORPORATE GOVERNANCE During the year ended 31 March 2021 the Group has consistently applied the Principles of good corporate governance contained in the 2018 UK Corporate Governance Code (the “Code”), and has complied with all the Provisions of the Code in full. The application of the Code’s Principles can be evidenced in the context of the particular circumstances of the Group and how the Board has set the Group’s purpose and strategy, met objectives and achieved outcomes through the decisions it has taken. Please see page 88 of the Corporate Governance Report for more detail.
DIRECTORS The Directors who held office during the year and up to the date of this report are listed alongside their biographical details on pages 84 to 87. All the Directors will be offering themselves for re-election at the AGM on 15 July 2021 and their continuing contribution to the Company’s long-term sustainable success is explained within each individual Director’s biography. Details of Directors’ remuneration, including their interests in share awards, and its alignment with the Company’s strategy and the promotion of long-term sustainable success are set out in the Directors’ Remuneration Report on pages 103 to 125. Details of the Directors’ interests in the ordinary shares of the Company are shown on page 122.
CULTURE, EMPLOYMENT AND ENVIRONMENTAL MATTERS The corporate Culture of the Company, articulated through the Company Purpose and Values, is discussed on pages 74 and 75 of the Strategic Report. As part of its leadership responsibilities, the Board continually monitors the Culture of the business. The role of the designated workforce engagement Non-Executive Director is key with respect to the monitoring of the Helical Culture and more information about this role can be found in the Workforce Engagement section on pages 80 and 81. For details of all the methods used by the Board to monitor and sustain the corporate Culture of Helical during the reporting period, please see pages 76 and 77 of the Strategic Report.
The Board recognises the importance of having a diverse workforce and an inclusive environment in which they can work. Details of the Company’s Diversity and Inclusion Policy can be found on page 95 and 96.
All employee candidates are considered fairly and without prejudice or discrimination and the Company affords equal opportunities to all its employees, irrespective of sex, race, colour, disability, sexual orientation, religious beliefs or marital status (please see details of our Employment Policy on page 96).
Information in respect of the Group’s employment and environmental matters as well as greenhouse gas reporting is contained in the Sustainability Report on pages 60 to 71.
POST BALANCE SHEET EVENTS Details of post balance sheet events are set out in Note 32 to the financial statements.
GROUP STRUCTURE Details of the Group’s subsidiary undertakings are disclosed in Note 37 to the financial statements.
SHARE CAPITAL Details of the Company’s issued share capital are shown in Note 26 to the financial statements. The Company’s share capital consists of both ordinary shares and deferred shares. Each class of shares rank pari passu between themselves. There are no restrictions on the transfer of shares in the Company other than those specified by law or regulation (for example: insider trading laws) and pursuant to the Listing Rules of the Financial Conduct Authority whereby certain employees of the Group require the approval of the Company to deal in the ordinary shares. On a show of hands at a General Meeting of the Company, every holder of ordinary shares present in person and entitled to vote shall have one vote and on a poll every member present in person or by proxy and entitled to vote shall have one vote for every ordinary share held. The Notice of the 2021 Annual General Meeting (“AGM”) specifies deadlines for exercising voting rights and appointing a proxy or proxies to vote in relation to resolutions to be passed at the meeting. There are no restrictions on voting rights other than as specified by the Company’s Articles of Association.
CHANGE OF CONTROL Certain agreements between the Company or its subsidiaries and entities including lending banks, joint venture partners and development partners contain termination rights to take effect in the event of a change of control of the Group. Given the commercial sensitivity of these agreements, the Directors do not intend to disclose specific details. The Company’s Employee Share Incentive Plan, Annual Bonus Scheme and Performance Share Plan contain provisions relating to the vesting and exercise of options or share awards in the event of a change of control of the Company.
SUBSTANTIAL SHAREHOLDINGS As at 14 May 2021, the Shareholders listed below had notified the Company of a disclosable interest of 3% or more in the nominal value of the ordinary share capital of the Group.
Fund Manager/OwnerShares at
14/05/2021 % Holding
Mr Michael Eric Slade 10,994,464 9.07%
Janus Henderson Investors 10,329,751 8.52%
Baillie Gifford 9,746,144 8.04%
BlackRock 7,641,938 6.30%*
Schroder Investment Management 6,732,707 5.55%
Jupiter Asset Management 6,294,828 5.19%
M&G Investments 5,838,168 4.81%
Dimensional Fund Advisors 5,201,274 4.29%
Vanguard Group 4,157,672 3.43%
Aviva Investors 3,961,092 3.27%
* Holding as at 23 April 2021.
KEY STAKEHOLDERSIn line with section 172 of the Companies Act 2006, the Directors act to promote the success of the Company for the benefit of its members. However, the Board places a great emphasis on the importance of the views and interests of its other key stakeholders. For details of our stakeholder engagement mechanisms and the consideration given to stakeholder views and interests when decision making, including the outcomes of such engagement, please see pages 78 and 79.
CO
RP
OR
AT
E G
OV
ER
NA
NC
E R
EP
OR
T126 Helical plc Annual Report and Accounts 2021 127Helical plcAnnual Report and Accounts 2021

DIRECTORS’ RESPONSIBILITIES STATEMENT
RESPONSIBILITY STATEMENT We confirm that to the best of our knowledge:
• the financial statements, prepared in accordance with International Accounting Standards in conformity with the requirements of the Companies Act 2006, give a true and fair view of the assets, liabilities, financial position and profit or loss of the Company and the undertakings included in the consolidation taken as a whole;
• the Strategic Report includes a fair review of the development and performance of the business and the position of the Company and the undertakings included in the consolidation taken as a whole, together with a description of the principal risks and uncertainties that they face; and
• the Annual Report and financial statements, taken as a whole, are fair, balanced and understandable and provide the information necessary for Shareholders to assess the Company’s position and performance, business model and strategy.
This responsibility statement was approved by the Board of Directors on 25 May 2021 and is signed on its behalf by:
TIM MURPHY Finance Director
25 May 2021
The Directors are responsible for preparing the Annual Report and the financial statements in accordance with applicable law and regulations.
Company law requires the Directors to prepare financial statements for each financial year. Under that law the Directors are required to prepare the Group financial statements in accordance with International Accounting Standards in conformity with the requirements of the Companies Act 2006 and have also chosen to prepare the Parent Company financial statements under International Accounting Standards in conformity with the requirements of the Companies Act 2006. Under company law the Directors must not approve the accounts unless they are satisfied that they give a true and fair view of the state of affairs of the Company and of the profit or loss of the Company for that period. In preparing these financial statements, International Accounting Standard 1 requires that Directors:
• properly select and apply accounting policies;
• present information, including accounting policies, in a manner that provides relevant, reliable, comparable and understandable information;
• provide additional disclosures when compliance with the specific requirements in International Accounting Standards are insufficient to enable users to understand the impact of particular transactions, other events and conditions on the entity’s financial position and financial performance; and
• make an assessment of the company’s ability to continue as a going concern.
The Directors are responsible for keeping adequate accounting records that are sufficient to show and explain the Company’s transactions and disclose with reasonable accuracy at any time the financial position of the Company and enable them to ensure that the financial statements comply with the Companies Act 2006. They are also responsible for safeguarding the assets of the Company and hence for taking reasonable steps for the prevention and detection of fraud and other irregularities.
The Directors are responsible for the maintenance and integrity of the corporate and financial information included on the Company’s website. Legislation in the United Kingdom governing the preparation and dissemination of financial statements may differ from legislation in other jurisdictions.
REPORT OF THE DIRECTORSCONTINUED
The Board is continuing to monitor developments in connection with Coronavirus (Covid-19). On the basis of public health guidance and legislation from the UK Government issued at the date of this Notice of Annual General Meeting, the intention is for the Annual General Meeting to be held in person in line with appropriate restrictions based on the guidance in place at the time. However, should circumstances change prior to the date of the Annual General Meeting meaning that it cannot be held as planned, the Board may need to revise its position and make any necessary amendments to arrangements for the Annual General Meeting from those contained in this Notice of Annual General Meeting. Any such amendments will be notified to shareholders by an RIS announcement and will be posted on the Company’s website at www.helical.co.uk as early as possible prior to the date of the Annual General Meeting.
AUDITORS The Company’s Auditor, Deloitte LLP, have expressed their willingness to continue in office and resolutions to reappoint them and to authorise the Directors to determine their remuneration will be proposed at the 2021 AGM. The Directors confirm that:
• so far as each Director is aware, there is no relevant audit information of which the Company’s Auditor is unaware; and
• the Directors have taken all the steps that they ought to have taken as directors in order to make themselves aware of any relevant audit information and to establish that the Auditor is aware of that information.
By Order of the Board
JAMES MOSS FCA Company Secretary
PURCHASE OF OWN SHARES The Company was granted authority at the 2020 AGM to make market purchases of its own ordinary shares. No ordinary shares were purchased under this authority during the year and up to the date of this report. The authority will expire at the conclusion of the 2021 AGM, at which a resolution will be proposed to renew this authority.
AMENDMENT OF ARTICLES OF ASSOCIATION The Company’s Articles of Association (“Articles”) can be amended only by a special resolution of the members, requiring a majority of not less than 75% of such members voting in person or by proxy.
During the reporting period, the Board approved updates to the Company’s Articles and the proposed updates to the Articles will be put to the Shareholders for approval at the 2021 AGM. The updated Articles are being proposed for approval to ensure that the Company’s Articles are in line with UK law, regulation and best practice.
ANNUAL GENERAL MEETING It is intended that the Annual General Meeting of the Company will be held on 15 July 2021 at 11:30 am at Butchers’ Hall, 87 Bartholomew Close, London EC1A 7EB. The special business at the 2021 AGM will include resolutions dealing with the authority to issue shares, the disapplication of pre-emption rights, the authority for the Company to purchase its own shares, the authority to call General Meetings on not less than 14 clear days’ notice and the approval of the updated Articles of Association of the Company. The Notice of Meeting, containing explanations of all the resolutions to be proposed at that meeting, is enclosed with this Annual Report and can be found on the Group’s website at www.helical.co.uk
CO
RP
OR
AT
E G
OV
ER
NA
NC
E R
EP
OR
T128 Helical plc Annual Report and Accounts 2021 129Helical plcAnnual Report and Accounts 2021

INDEPENDENT AUDITOR’S REPORTTO THE MEMBERS OF HELICAL PLC
4. CONCLUSIONS RELATING TO GOING CONCERNIn auditing the financial statements, we have concluded that the Directors’ use of the going concern basis of accounting in the preparation of the financial statements is appropriate.
Our evaluation of the Directors’ assessment of the Group’s and Parent Company’s ability to continue to adopt the going concern basis of accounting included:
• Challenging the judgements and assumptions applied by management in their going concern assessment and associated forecasts of financial performance and financial position, assessing the reasonableness of assumptions regarding uncertain cash inflows and the timing and quantum of cash outflows;
• Testing of the mechanical accuracy of the model utilised;
• Assessing the appropriateness of management’s sensitivities in their worst case scenario cash flow forecast, taking into consideration assumptions associated with rental collection levels impacted by the ongoing Covid-19 pandemic;
• Evaluating the key loan documentation to understand the principal terms, including financial covenants, and assessment review of the Group’s existing and forecast compliance with these (including testing of the mechanical accuracy of management’s covenant calculations and consistency with the contractual definitions);
• Assessing the appropriateness of the headroom available on covenants and comparison of management’s projections with market information available associated with future income and property asset values; and
• Evaluating the appropriateness of the disclosures in the financial statements around going concern and the clarity of the process undertaken by management in concluding on the appropriateness of the assessment.
Based on the work we have performed, we have not identified any material uncertainties relating to events or conditions that, individually or collectively, may cast significant doubt on the Group’s and Parent Company’s ability to continue as a going concern for a period of at least 12 months from when the financial statements are authorised for issue.
In relation to the reporting on how the Group has applied the UK Corporate Governance Code, we have nothing material to add or draw attention to in relation to the Directors’ statement in the financial statements about whether the Directors considered it appropriate to adopt the going concern basis of accounting.
Our responsibilities and the responsibilities of the Directors with respect to going concern are described in the relevant sections of this report.
5. KEY AUDIT MATTERSKey audit matters are those matters that, in our professional judgement, were of most significance in our audit of the financial statements of the current period and include the most significant assessed risks of material misstatement (whether or not due to fraud) that we identified. These matters included those which had the greatest effect on: the overall audit strategy, the allocation of resources in the audit; and directing the efforts of the engagement team.
These matters were addressed in the context of our audit of the financial statements as a whole, and in forming our opinion thereon, and we do not provide a separate opinion on these matters.
5.1. INVESTMENT PROPERTY VALUATION
Key audit matter description
At 31 March 2021, the Group held wholly owned investment property valued at £740.2m (31 March 2020: £819.6m).
Investment properties are held at fair value on the Group Balance Sheet. During the year, a net valuation gain of £19.4m (31 March 2020: £38.4m) was recorded. Investment property valuation represents the most significant area of estimation and judgement within the Group’s financial statements, which is why we consider this to be a key audit matter as well as a potential fraud risk.
The fair values are calculated by third party valuation experts using factual information, such as lease agreements and tenancy data, and their professional judgement concerning market conditions and factors impacting individual properties. The key estimates associated with this balance which can lead to significant valuation movements relate to property yields, estimated rental values and the level of expenditure required to maintain a property. Covid-19 further increased judgement in relation to assumptions around:
• occupier demand and solvency;
• asset liquidity;
• the relative impact on flexible office space; and
• the assumptions around development progress on site and timelines to completion and letting.
See also key sources of estimation uncertainty in Note 36, the investment properties in Note 14 of the financial statements and the Audit and Risk Committee Report on page 100.
REPORT ON THE AUDIT OF THE FINANCIAL STATEMENTS
1. OPINION
In our opinion the financial statements of Helical plc (the ‘Parent Company’) and its subsidiaries (the ‘Group’)
• give a true and fair view of the state of the Group’s and of the Parent Company’s affairs as at 31 March 2021 and of the Group’s profit for the year then ended;
• have been properly prepared in accordance with International Accounting Standards in conformity with the requirements of the Companies Act 2006; and
• have been prepared in accordance with the requirements of the Companies Act 2006.
We have audited the financial statements which comprise:
• the Consolidated Income Statement;
• the Consolidated Statement of Comprehensive Income;
• the Consolidated and Company Balance Sheets;
• the Consolidated and Company Statements of Changes in Equity;
• the Consolidated and Company Cash Flow Statements; and
• the related Notes 1 to 37.
The financial reporting framework that has been applied in the preparation of the financial statements is applicable law and International Accounting Standards in conformity with the requirements of the Companies Act 2006.
2. BASIS FOR OPINIONWe conducted our audit in accordance with International Standards on Auditing (UK) (ISAs (UK)) and applicable law. Our responsibilities under those standards are further described in the auditor’s responsibilities for the audit of the financial statements section of our report.
We are independent of the Group and the Parent Company in accordance with the ethical requirements that are relevant to our audit of the financial statements in the UK, including the Financial Reporting Council’s (the ‘FRC’s’) Ethical Standard as applied to listed public interest entities, and we have fulfilled our other ethical responsibilities in accordance with these requirements. The non-audit services provided to the Group for the year are disclosed in Note 6 to the financial statements. We confirm that the non-audit services prohibited by the FRC’s Ethical Standard were not provided to the Group or the Parent Company.
We believe that the audit evidence we have obtained is sufficient and appropriate to provide a basis for our opinion.
3. SUMMARY OF OUR AUDIT APPROACH
Key audit matters The key audit matter that we identified in the current year was:
• Investment property valuation
Within this report, key audit matters are identified as follows:
Newly identified
Increased level of risk
Similar level of risk
Decreased level of risk
Materiality The materiality that we used for the Group’s financial statements was £10.0m which was determined on the basis of 1% of the total assets.
Scoping We performed an audit of the financial statements of the Parent Company and the Group, including the audit work on the Barts Square and 33 Charterhouse Street joint ventures.
Significant changes in our approach
There have been changes to our prior year key audit matters with “Going concern and covenant compliance” no longer being considered a key audit matter, due to reduced judgement around the estimation of the impact of the Covid-19 pandemic at 31 March 2021 compared to the previous year.
130 Helical plc Annual Report and Accounts 2021 131Helical plcAnnual Report and Accounts 2021F
INA
NC
IAL S
TAT
EM
EN
TS

INDEPENDENT AUDITOR’S REPORTTO THE MEMBERS OF HELICAL PLCCONTINUED
TOTAL SHAREHOLDER RETURN
Total assets Group materiality
Total assets £1,021.0m
Group materiality £10.0m
Component materiality range£1.6m to £5.7m
Audit and Risk Committee reporting threshold£0.5m
How the scope of our audit responded to the key audit matter
We obtained an understanding of relevant controls in the investment property valuation process, including management’s review of the lease information provided to third party valuers and approval of third party valuations by the Chair of the Property Valuations Committee. Management’s process for challenging the appropriateness of property valuations has been assessed.
We held meetings with the third party valuers appointed by management to value the property portfolio. With the assistance of our internal real estate valuation specialists we challenged the significant judgements and assumptions applied in their valuation model, including where relevant, the impact of Covid-19 on the sector and asset and the valuation adjustments reflected as a result. We further assessed the movements in the key judgements and benchmarked the inputs against market data.
We assessed the changes made to key valuation input assumptions at a macro-level in light of the potential impact of the Covid-19 pandemic on the properties held by the Group and benchmarked these against changes being made in the wider market and against relevant market evidence including specific property sales and other external data.
We analysed the individual property valuations to understand significant movements against prior year and comparative market evidence considered by the valuers.
We tested the integrity of data and information pertaining to rental income, purchaser’s costs and occupancy provided by management to external valuers and utilised in the valuation.
We assessed the valuation methodology being used and considered any departures from the Red Book guidance. We have also tested the integrity of the model which is used by the external valuer.
We compared the property specific assumptions made to assess whether there is consistency within the portfolio as well as consistency with related assumptions used in other estimates.
We have assessed the competence, objectivity and capabilities of the external valuers.
As part of our disclosures testing, we have assessed the appropriateness of the disclosures made in the financial statements and considered if the specific disclosures in relation to the estimation, included those around key sources of estimation uncertainty in Note 14, are considered reasonable.
Key observations Based on our audit work, we are satisfied that the judgements and assumptions used in arriving at the fair value of the Group’s property portfolio are appropriate and supported by the evidence obtained during the audit.
6. OUR APPLICATION OF MATERIALITY6.1. MATERIALITYWe define materiality as the magnitude of misstatement in the financial statements that makes it probable that the economic decisions of a reasonably knowledgeable person would be changed or influenced. We use materiality both in planning the scope of our audit work and in evaluating the results of our work.
Based on our professional judgement, we determined materiality for the financial statements as a whole as follows:
GROUP FINANCIAL STATEMENTS PARENT COMPANY FINANCIAL STATEMENTS
Materiality £10.0m (2020: £10.2m).
£1.7m (2020: £2.5m) for balances affecting the income statement excluding valuation gains and tax.
£5.7m (2020: £5.7m).
Basis for determining materiality
1% of total assets (2020: 1% of total assets) The lower materiality used for balances impacting the income statement, excluding valuation gains and tax, was determined with reference to 5% of the previous three years’ average profit before tax, as well as consideration of the consistency of the % applied compared to other financial statement measures, including revenue and net assets (2020: 5% of profit before tax).
We changed our approach in the current year to take account of the impact of the Covid-19 pandemic and the lower profitability of the Group in the year.
1% of total assets (2020: 1% of total assets).
Rationale for the benchmark applied
Total assets is the most appropriate benchmark because it appropriately reflects the valuation of investment property which is of key interest to the users of the financial statements.
Average profit before tax (“PBT”) is deemed an appropriate benchmark for items impacting the income statement as these are more sensitive to the users of the financial statements.
Total assets is the most appropriate benchmark due to the Parent Company being a holding company.
6.2. PERFORMANCE MATERIALITYWe set performance materiality at a level lower than materiality to reduce the probability that, in aggregate, uncorrected and undetected misstatements exceed the materiality for the financial statements as a whole.
GROUP FINANCIAL STATEMENTS
PARENT COMPANY FINANCIAL STATEMENTS
Performance materiality
70% (2020: 70%) of Group materiality.
70% (2020: 70%) of Parent Company materiality.
Basis and rationale for determining performance materiality
In determining performance materiality, we considered the low number of corrected and uncorrected misstatements identified in prior periods, as well as the quality of the Group’s control environment, including the impact of Covid-19 on the control environment; and the absence of material changes in the business.
6.3. ERROR REPORTING THRESHOLDWe agreed with the Audit and Risk Committee that we would report to the Committee all audit differences in excess of £0.5m (2020: £0.5m), as well as differences below that threshold that, in our view, warranted reporting on qualitative grounds. We also report to the Audit and Risk Committee on disclosure matters that we identified when assessing the overall presentation of the financial statements.
7. AN OVERVIEW OF THE SCOPE OF OUR AUDIT7.1 IDENTIFICATION AND SCOPING OF COMPONENTSOur Group audit was scoped by obtaining an understanding of the Group and its environment, including Group-wide controls, and assessing the risks of material misstatement at the Group level. We have audited the material balances which support the Group’s financial statements.
We performed an audit of the financial statements of the Parent Company and Group, which includes the audits of joint ventures. Our audit approach covers 100% of the Group’s revenue, profit before tax, and net assets.
The materiality range for the Barts Square and 33 Charterhouse Street joint ventures is £1.6m to £3.0m. All work has been performed by the Group engagement team.
8. OTHER INFORMATIONThe other information comprises the information included in the Annual Report, other than the financial statements and our auditor’s report thereon. The Directors are responsible for the other information contained within the Annual Report.
Our opinion on the financial statements does not cover the other information and, except to the extent otherwise explicitly stated in our report, we do not express any form of assurance conclusion thereon.
Our responsibility is to read the other information and, in doing so, consider whether the other information is materially inconsistent with the financial statements or our knowledge obtained in the course of the audit, or otherwise appears to be materially misstated.
If we identify such material inconsistencies or apparent material misstatements, we are required to determine whether this gives rise to a material misstatement in the financial statements themselves. If, based on the work we have performed, we conclude that there is a material misstatement of this other information, we are required to report that fact.
We have nothing to report in this regard.
9. RESPONSIBILITIES OF DIRECTORSAs explained more fully in the Directors’ Responsibilities Statement, the Directors are responsible for the preparation of the financial statements and for being satisfied that they give a true and fair view, and for such internal control as the Directors determine is necessary to enable the preparation of financial statements that are free from material misstatement, whether due to fraud or error.
In preparing the financial statements, the Directors are responsible for assessing the Group’s and the Parent Company’s ability to continue as a going concern, disclosing as applicable, matters related to going concern and using the going concern basis of accounting unless the Directors either intend to liquidate the Group or the Parent Company or to cease operations, or have no realistic alternative but to do so.
10. AUDITOR’S RESPONSIBILITIES FOR THE AUDIT OF THE FINANCIAL STATEMENTSOur objectives are to obtain reasonable assurance about whether the financial statements as a whole are free from material misstatement, whether due to fraud or error, and to issue an auditor’s report that includes our opinion. Reasonable assurance is a high level of assurance, but is not a guarantee that an audit conducted in accordance with ISAs (UK) will always detect a material misstatement when it exists. Misstatements can arise from fraud or error and are considered material if, individually or in the aggregate, they could reasonably be expected to influence the economic decisions of users taken on the basis of these financial statements.
A further description of our responsibilities for the audit of the financial statements is located on the FRC’s website at: www.frc.org.uk/auditorsresponsibilities. This description forms part of our auditor’s report.
132 Helical plc Annual Report and Accounts 2021 133Helical plcAnnual Report and Accounts 2021F
INA
NC
IAL S
TAT
EM
EN
TS

INDEPENDENT AUDITOR’S REPORTTO THE MEMBERS OF HELICAL PLCCONTINUED
11. EXTENT TO WHICH THE AUDIT WAS CONSIDERED CAPABLE OF DETECTING IRREGULARITIES, INCLUDING FRAUDIrregularities, including fraud, are instances of non-compliance with laws and regulations. We design procedures in line with our responsibilities, outlined above, to detect material misstatements in respect of irregularities, including fraud. The extent to which our procedures are capable of detecting irregularities, including fraud, is detailed below.
11.1. IDENTIFYING AND ASSESSING POTENTIAL RISKS RELATED TO IRREGULARITIESIn identifying and assessing risks of material misstatement in respect of irregularities, including fraud and non-compliance with laws and regulations, we considered the following:
• the nature of the industry and sector, control environment and business performance including the design of the Group’s remuneration policies, key drivers for Directors’ remuneration, bonus levels and performance targets;
• results of our enquiries of management and the Audit and Risk Committee about their own identification and assessment of the risks of irregularities;
• any matters we identified having obtained and reviewed the Group’s documentation of their policies and procedures relating to:
– identifying, evaluating and complying with laws and regulations and whether they were aware of any instances of non-compliance;
– detecting and responding to the risks of fraud and whether they have knowledge of any actual, suspected or alleged fraud; and
– the internal controls established to mitigate risks of fraud or non-compliance with laws and regulations.
• the matters discussed among the audit engagement team and relevant internal specialists, including real estate specialists, regarding how and where fraud might occur in the financial statements and any potential indicators of fraud.
As a result of these procedures, we considered the opportunities and incentives that may exist within the organisation for fraud and identified the greatest potential for fraud in the accuracy and potential manipulation of the assumptions applied in determining the valuation of the property portfolio. In common with all audits under ISAs (UK), we are also required to perform specific procedures to respond to the risk of management override.
We also obtained an understanding of the legal and regulatory framework that the Group operates in, focusing on provisions of those laws and regulations that had a direct effect on the determination of material amounts and disclosures in the financial statements. The key laws and regulations we considered in this context included the UK Companies Act, UK Bribery Act, The Criminal Finances Act 2017, Landlord and Tenant Act 1985, GDPR, Modern Slavery Act, Listing Rules and tax legislation.
In addition, we considered provisions of other laws and regulations that do not have a direct effect on the financial statements but compliance with which may be fundamental to the Group’s ability to operate or to avoid a material penalty. These included the Group’s Health and Safety Regulations and Equal Opportunities, Environmental Laws, Disability Rights, Building regulations, construction safety and planning restrictions.
13. CORPORATE GOVERNANCE STATEMENTThe Listing Rules require us to review the Directors’ statement in relation to going concern, longer-term viability and that part of the Corporate Governance Statement relating to the Group’s compliance with the provisions of the UK Corporate Governance Code specified for our review.
Based on the work undertaken as part of our audit, we have concluded that each of the following elements of the Corporate Governance Statement is materially consistent with the financial statements and our knowledge obtained during the audit:
• the Directors’ statement with regards to the appropriateness of adopting the going concern basis of accounting and any material uncertainties identified;
• the Directors’ explanation as to its assessment of the Group’s prospects, the period this assessment covers and why the period is appropriate;
• the Directors’ statement on fair, balanced and understandable;
• the Board’s confirmation that it has carried out a robust assessment of the emerging and principal risks;
• the section of the Annual Report that describes the review of effectiveness of risk management and internal control systems; and
• the section describing the work of the Audit and Risk Committee.
14. MATTERS ON WHICH WE ARE REQUIRED TO REPORT BY EXCEPTION14.1. ADEQUACY OF EXPLANATIONS RECEIVED AND ACCOUNTING RECORDSUnder the Companies Act 2006 we are required to report to you if, in our opinion:
• we have not received all the information and explanations we require for our audit; or
• adequate accounting records have not been kept by the Parent Company, or returns adequate for our audit have not been received from branches not visited by us; or
• the Parent Company financial statements are not in agreement with the accounting records and returns.
We have nothing to report in this regard.
14.2. DIRECTORS’ REMUNERATIONUnder the Companies Act 2006 we are also required to report if in our opinion certain disclosures of Directors’ remuneration have not been made or the part of the Directors’ Remuneration Report to be audited is not in agreement with the accounting records and returns.
We have nothing to report in this regard.
11.2. AUDIT RESPONSE TO RISKS IDENTIFIEDAs a result of performing the above, we identified investment property valuation as a key audit matter related to the potential risk of fraud. The key audit matters section of our report explains the matter in more detail and also describes the specific procedures we performed in response to that key audit matter.
In addition to the above, our procedures to respond to risks identified included the following:
• reviewing the financial statement disclosures and testing to supporting documentation to assess compliance with provisions of relevant laws and regulations described as having a direct effect on the financial statements;
• enquiring of management, the Audit and Risk Committee and external legal counsel concerning actual and potential litigation and claims;
• performing analytical procedures to identify any unusual or unexpected relationships that may indicate risks of material misstatement due to fraud;
• reading minutes of meetings of those charged with governance, and enquiring on any correspondence with HMRC; and
• in addressing the risk of fraud through management override of controls, testing the appropriateness of journal entries and other adjustments; assessing whether the judgements made in making accounting estimates are indicative of a potential bias; and evaluating the business rationale of any significant transactions that are unusual or outside the normal course of business.
We also communicated relevant identified laws and regulations and potential fraud risks to all engagement team members, including internal specialists, and remained alert to any indications of fraud or non-compliance with laws and regulations throughout the audit.
REPORT ON OTHER LEGAL AND REGULATORY REQUIREMENTS
12. OPINIONS ON OTHER MATTERS PRESCRIBED BY THE COMPANIES ACT 2006
In our opinion the part of the Directors’ Remuneration Report to be audited has been properly prepared in accordance with the Companies Act 2006.
In our opinion, based on the work undertaken in the course of the audit:
• the information given in the Strategic Report and the Report of the Directors for the financial year for which the financial statements are prepared is consistent with the financial statements; and
• the Strategic Report and the Report of the Directors have been prepared in accordance with applicable legal requirements.
In the light of the knowledge and understanding of the Group and the Parent Company and their environment obtained in the course of the audit, we have not identified any material misstatements in the Strategic Report or the Report of the Directors.
15. OTHER MATTERS WHICH WE ARE REQUIRED TO ADDRESS15.1. AUDITOR TENUREFollowing the recommendation of the Audit and Risk Committee, we were appointed by the Directors on 12 June 2018 to audit the financial statements for the year ending 31 March 2019 and subsequent financial periods. The period of total uninterrupted engagement including previous renewals and reappointments of the firm is three years, covering the years ending 31 March 2019 to 31 March 2021.
15.2. CONSISTENCY OF THE AUDIT REPORT WITH THE ADDITIONAL REPORT TO THE AUDIT AND RISK COMMITTEE Our audit opinion is consistent with the additional report to the Audit and Risk Committee we are required to provide in accordance with ISAs (UK).
16. USE OF OUR REPORTThis report is made solely to the Company’s members, as a body, in accordance with Chapter 3 of Part 16 of the Companies Act 2006. Our audit work has been undertaken so that we might state to the Company’s members those matters we are required to state to them in an auditor’s report and for no other purpose. To the fullest extent permitted by law, we do not accept or assume responsibility to anyone other than the Company and the Company’s members as a body, for our audit work, for this report, or for the opinions we have formed.
GEORGINA ROBB, FCA (SENIOR STATUTORY AUDITOR)For and on behalf of Deloitte LLP Statutory Auditor London, United Kingdom
25 May 2021
134 Helical plc Annual Report and Accounts 2021 135Helical plcAnnual Report and Accounts 2021F
INA
NC
IAL S
TAT
EM
EN
TS

CONSOLIDATED INCOME STATEMENTFor the year ended 31 March 2021
CONSOLIDATED STATEMENT OF COMPREHENSIVE INCOMEFor the year ended 31 March 2021
Notes
Year ended 31.3.21
£000
Year ended 31.3.20
£000
Revenue 3 38,596 44,361
Cost of sales 3 (12,987) (13,161)
Net property income 4 25,609 31,200
Share of results of joint ventures 18 2,352 13,396
Gross profit before net gain on sale and revaluation of investment properties 27,961 44,596
Loss on sale of investment properties 5 (1,341) (1,272)
Revaluation of investment properties 14 19,387 38,351
Gross profit 46,007 81,675
Administrative expenses 6 (14,416) (16,715)
Operating profit 31,591 64,960
Finance costs 8 (14,079) (16,100)
Finance income 8 58 1,345
Change in fair value of derivative financial instruments 35 2,938 (7,651)
Change in fair value of Convertible Bond – 468
Foreign exchange gain – 8
Profit before tax 20,508 43,030
Tax on profit on ordinary activities 9 (2,631) (4,313)
Profit for the year 17,877 38,717
Earnings per share 13
Basic 14.8p 32.3p
Diluted 14.5p 31.7p
All the activities of the Group are from continuing operations.
Year ended 31.3.21
£000
Year ended 31.3.20
£000
Profit for the year 17,877 38,717
Exchange difference on retranslation of net investments in foreign operations – 68
Total comprehensive income for the year 17,877 38,785
The exchange differences on retranslation of net investments in foreign operations will be reclassified to the Income Statement on disposal.
CONSOLIDATED AND COMPANY BALANCE SHEETSAt 31 March 2021
Notes
Group31.3.21
£000
Group31.3.20
£000
Company31.3.21
£000
Company31.3.20
£000
Non-current assets
Investment properties 14 740,207 819,573 – –
Owner occupied property, plant and equipment 16 5,362 6,007 5,362 6,007
Investment in subsidiaries 17 – – 208,583 208,272
Investment in joint ventures 18 79,953 80,818 – –
Derivative financial instruments 35 171 86 – –
825,693 906,484 213,945 214,279
Current assets
Land and developments 19 448 852 – –
Corporation tax receivable – 1,417 – –
Trade and other receivables 20 40,427 40,382 293,935 300,315
Cash and cash equivalents 21 154,448 74,586 68,026 56,918
195,323 117,237 361,961 357,233
Total assets 1,021,016 1,023,721 575,906 571,512
Current liabilities
Trade and other payables 22 (46,764) (45,771) (145,893) (180,994)
Lease liability 23 (634) (611) (634) (611)
Corporation tax payable (655) – – –
Borrowings 24 – (5,000) – (5,000)
(48,053) (51,382) (146,527) (186,605)
Non-current liabilities
Borrowings 24 (336,703) (343,184) – –
Derivative financial instruments 35 (7,601) (10,455) – –
Lease liability 23 (6,929) (7,563) (4,740) (5,374)
Trade and other payables 22 – (590) – –
Deferred tax liability 10 (13,569) (11,858) (244) (219)
(364,802) (373,650) (4,984) (5,593)
Total liabilities (412,855) (425,032) (151,511) (192,198)
Net assets 608,161 598,689 424,395 379,314
Equity
Called-up share capital 26 1,478 1,465 1,478 1,465
Share premium account 107,990 103,522 107,990 103,522
Revaluation reserve 164,316 171,464 – –
Capital redemption reserve 7,478 7,478 7,478 7,478
Other reserves 291 291 1,987 1,987
Retained earnings 326,608 314,469 305,462 264,862
Total equity 608,161 598,689 424,395 379,314
The profit in the year for the Company was £51,128,000 (2020: £55,169,000).
The financial statements were approved by the Board and authorised for issue on 25 May 2021.
TIM MURPHYFinance Director
Company number 156663
136 Helical plc Annual Report and Accounts 2021 137Helical plcAnnual Report and Accounts 2021F
INA
NC
IAL S
TAT
EM
EN
TS

CONSOLIDATED AND COMPANY CASH FLOW STATEMENTSFor the year ended 31 March 2021
Group31.3.21
£000
Group31.3.20
£000
Company31.3.21
£000
Company31.3.20
£000
Cash flows from operating activities
Profit before tax 20,508 43,030 51,907 55,531
Depreciation 791 807 791 807
Revaluation surplus on investment properties (19,387) (38,351) – –
Loss on sales of investment properties 1,341 1,272 – –
Letting cost amortised 19 – – –
Profit on sale of plant and equipment (14) (11) (14) (11)
Net financing costs 14,021 14,755 577 1,317
Change in fair value of derivative financial instruments (2,938) 7,651 – –
Change in fair value of Convertible Bond – (468) – 270
Share-based payments charge 2,031 2,814 – –
Share settled bonus – 1,485 – –
Share of results of joint ventures (2,352) (13,396) – –
Impairment of investments – – 6,294 3,296
Dividends received from subsidiaries – – (60,415) (62,140)
Foreign exchange movement – 67 – –
Cash inflows/(outflows) from operations before changes in working capital 14,020 19,655 (860) (930)
Change in trade and other receivables (2,554) 12,499 944 (3,563)
Change in land and developments 404 1,459 – –
Change in trade and other payables 3,758 (3,890) 16,893 (11,141)
Cash inflows/(outflows) generated from operations 15,628 29,723 16,977 (15,634)
Finance costs (12,902) (19,630) (590) (1,773)
Finance income 58 6,717 13 358
Tax received/(paid) 1,219 (4,467) 1,227 (4,382)
(11,625) (17,380) 650 (5,797)
Cash flows from operating activities 4,003 12,343 17,627 (21,431)
Cash flows from investing activities
Additions to investment property (16,306) (44,159) – –
Net proceeds from sale of investment property 113,207 40,260 – –
Investment in joint ventures and subsidiaries (7,414) (50,749) (3,150) (29,560)
Return on investment in joint ventures – 1,334 – –
Dividends from joint ventures 10,266 6,670 6,066 –
Dividends from subsidiaries – – 2,355 48,598
Sale of plant and equipment 23 27 23 27
Purchase of owner occupied property, plant and equipment (156) (18) (155) (18)
Net cash generated from/(used by) investing activities 99,620 (46,635) 5,139 19,047
Cash flows from financing activities
Borrowings drawn down 12,339 254,038 – 5,000
Borrowings repaid (25,000) (329,929) (5,000) (100,000)
Lease liability payments (610) (588) (611) (588)
Sale of own shares 25 – – –
Shares issued 13 6 4,481 2,224
Equity dividends paid (10,528) (12,219) (10,528) (12,219)
Net cash used by financing activities (23,761) (88,692) (11,658) (105,583)
Net increase/(decrease) in cash and cash equivalents 79,862 (122,984) 11,108 (107,967)
Cash and cash equivalents at start of year 74,586 197,570 56,918 164,885
Cash and cash equivalents at end of year 154,448 74,586 68,026 56,918
CONSOLIDATED AND COMPANY STATEMENTS OF CHANGES IN EQUITYAt 31 March 2021
Group
Sharecapital
£000
Share premium
£000
Revaluation reserve
£000
Capital redemption
reserve£000
Other reserves
£000
Retained earnings
£000Total£000
At 31 March 2019 1,459 101,304 131,050 7,478 291 325,843 567,425
Balances at 1 April 2019, as previously reported 1,459 101,304 131,050 7,478 291 325,843 567,425
Impact of transition to IFRS 16 – – – – – (548) (548)
Adjusted balances at 1 April 2019 1,459 101,304 131,050 7,478 291 325,295 566,877
Total comprehensive income – – – – – 38,785 38,785
Revaluation surplus – – 38,351 – – (38,351) –
Realised on disposals – – 2,063 – – (2,063) –
Issued share capital 6 2,218 – – – – 2,224
Performance Share Plan – – – – – 2,814 2,814
Performance Share Plan – deferred tax – – – – – 483 483
Share settled Performance Share Plan – – – – – (1,349) (1,349)
Share settled bonus – – – – – 1,074 1,074
Dividends paid – – – – – (12,219) (12,219)
At 31 March 2020 1,465 103,522 171,464 7,478 291 314,469 598,689
Total comprehensive income – – – – – 17,877 17,877
Revaluation surplus – – 19,387 – – (19,387) –
Realised on disposals – – (26,535) – – 26,535 –
Issued share capital 13 4,468 – – – – 4,481
Performance Share Plan – – – – – 2,031 2,031
Performance Share Plan – deferred tax – – – – – 66 66
Share settled Performance Share Plan – – – – – (3,335) (3,335)
Share settled bonus – – – – – (1,145) (1,145)
Profit on sale of shares – – – – – 25 25
Dividends paid – – – – – (10,528) (10,528)
At 31 March 2021 1,478 107,990 164,316 7,478 291 326,608 608,161
For a breakdown of Total Comprehensive Income see the Consolidated Statement of Comprehensive Income.
The adjustment against retained earnings of £2,031,000 (31 March 2020: £2,814,000) adds back the share-based payments charge in accordance with IFRS 2 Share Based Payments.
There were net transactions with owners of £8,405,000 (31 March 2020: £6,973,000) made up of the Performance Share Plan credit of £2,031,000 (31 March 2020: £2,814,000) and related deferred tax credit of £66,000 (31 March 2020: £483,000), dividends paid of £10,528,000 (31 March 2020: £12,219,000), issued share capital of £13,000 (31 March 2020: £6,000) and corresponding share premium of £4,468,000 (31 March 2020: £2,218,000), share settled Performance Share Plan awards charge of £3,335,000 (31 March 2020: £1,349,000), the share settled bonus awards charge of £1,145,000 (31 March 2020: credit of £1,074,000) and profit on sale of shares credit of £25,000 (31 March 2020: £nil).
138 Helical plc Annual Report and Accounts 2021 139Helical plcAnnual Report and Accounts 2021F
INA
NC
IAL S
TAT
EM
EN
TS

NOTES TO THE FINANCIAL STATEMENTS
1. BASIS OF PREPARATIONHelical plc (the Company) is a public company limited by shares incorporated in the United Kingdom under the Companies Act and registered in England. The address of the Company’s registered office is shown on page 181. The principal activities of the Company and its subsidiaries (the Group) and the nature of the Group’s operations are set out in the Strategic Report on pages 1 to 81.
These financial statements have been prepared using the recognition and measurement principles of International Accounting Standards in conforming with the Companies Act 2006.
The financial statements have been prepared in Sterling (rounded to the nearest thousand) under the historical cost convention as modified by the revaluation of investment properties and derivative financial instruments. The measurement bases and principal accounting policies of the Group are set out in Note 36. These accounting policies are consistent with those applied in the year to 31 March 2020, as amended to reflect any new standards.
The presentation of the Consolidated Income Statement has been amended to include Cost of Sales as a separate line item. This replaces the Net Rental Income, Development Property Profit and Other Operating Income that was previously disclosed on the Consolidated Income Statement. This revised disclosure does not change the previously reported Revenue, Gross Profit, Operating Profit or Profit for the year.
Amendments to standards and interpretations which are mandatory for the year ended 31 March 2021 are detailed below however none of these have had a material impact on the financial statements:
• Amendments to References to the Conceptual Framework in IFRS Standards (effective for periods beginning on or after 1 January 2020);
• Amendments to IFRS 3 Definition of Business (effective for periods beginning on or after 1 January 2020);
• Amendments to IAS 1 and IAS 8 Definition of Material (effective for periods beginning on or after 1 January 2020); and
• Amendments to IFRS 9, IAS 39 and IFRS 7 Interest Rate Benchmark Reform (effective for periods beginning on or after 1 January 2020).
The following standards, interpretations and amendments have been issued but are not yet effective and will be adopted at the point they are effective:
• Amendment to IFRS 16 Covid-19-Related Rent Concessions (effective for periods beginning on or after 1 June 2020);
• Amendments to IFRS 9, IAS 39, IFRS 7, IFRS 4 and IFRS 16 Interest Rate Benchmark Report – Phase 2 (effective for periods beginning on or after 1 January 2021);
• Amendments to IAS 16 Property, Plant and Equipment – Proceeds before Intended Use (effective for periods beginning on or after 1 January 2022);
• Annual Improvements to IFRS Standards 2018-2020 (effective for periods beginning on or after 1 January 2022);
• Amendments to IFRS 3 Reference to the Conceptual Framework (effective for periods beginning on or after 1 January 2022);
• Amendments to IAS 37 Onerous Contracts – Cost of Fulfilling a Contract (effective for periods beginning on or after 1 January 2022);
• IFRS 17 Insurance Contracts (effective for periods beginning on or after 1 January 2023);
• Amendments to IFRS 17 Insurance Contracts (effective for periods beginning on or after 1 January 2023);
• Amendments to IAS 1 Classification of Liabilities as Current or Non-current (effective for periods beginning on or after 1 January 2023);
• Amendments to IAS 1 Classification of Liabilities as Current or Non-current – Deferral of Effective Date (effective for periods beginning on or after 1 January 2023);
• Amendments to IFRS 4 Extension of the Temporary Exemption from Applying IFRS 9 (effective for periods beginning on or after 1 January 2023);
• Amendments to IAS 1 and IFRS Practice Statement 2 Disclosure of Accounting Policies (effective for periods beginning on or after 1 January 2023); and
• Amendments to IAS 8 Definition of Accounting Estimates (effective for periods beginning on or after 1 January 2023).
Company
Sharecapital
£000
Share premium
£000
Capital redemption
reserve£000
Other reserves
£000
Retained earnings
£000Total£000
At 31 March 2019 1,459 101,304 7,478 1,987 222,460 334,688
Balances at 1 April 2019, as previously reported 1,459 101,304 7,478 1,987 222,460 334,688
Impact of transition to IFRS 16 – – – – (548) (548)
Adjusted balances at 1 April 2019 1,459 101,304 7,478 1,987 221,912 334,140
Total comprehensive income – – – – 55,169 55,169
Issued share capital 6 2,218 – – – 2,224
Dividends paid – – – – (12,219) (12,219)
At 31 March 2020 1,465 103,522 7,478 1,987 264,862 379,314
Total comprehensive income – – – – 51,128 51,128
Issued share capital 13 4,468 – – – 4,481
Dividends paid – – – – (10,528) (10,528)
At 31 March 2021 1,478 107,990 7,478 1,987 305,462 424,395
Total Comprehensive Income is made up of the profit after tax of £51,128,000 (2020: £55,169,000).
Included within changes in equity are net transactions with owners of £6,047,000 (2020: £9,995,000) being dividends paid of £10,528,000 (2020: £12,219,000) and issued share capital of £4,481,000 (2020: £2,224,000).
Notes:Share capital – represents the nominal value of issued share capital.Share premium – represents the excess of value of shares issued over their nominal value.Revaluation reserve – represents the surplus/deficit of fair value of investment properties over their historic cost.Capital redemption reserve – represents amounts paid to purchase issued shares for cancellation at their nominal value. Retained earnings – represents the accumulated retained earnings of the Group/Company.
CONSOLIDATED AND COMPANY STATEMENTS OF CHANGES IN EQUITY CONTINUEDAt 31 March 2021
140 Helical plc Annual Report and Accounts 2021 141Helical plcAnnual Report and Accounts 2021F
INA
NC
IAL S
TAT
EM
EN
TS

NOTES TO THE FINANCIAL STATEMENTSCONTINUED
1. BASIS OF PREPARATION CONTINUEDGOING CONCERNThe Directors have considered the appropriateness of adopting the going concern basis in preparing the financial statements. Their assessment is based on forecasts for the period to 30 September 2022, with the potential impact of Covid-19 being an area of focus and including severe downside scenarios on the principal risks and uncertainties.
The key assumptions used in the review are summarised below:
• The Group rental income receipts were modelled for each tenant on an individual basis;
• Existing loan facilities remain available, but no new financing is arranged; and
• Free cash is utilised to repay debt/cure bank facility covenants.
The results of this review demonstrated the following:
• The Group has £154.4m of cash and £7.8m of cash held in joint ventures with £55.1m available to drawdown on bank facilities at 31 March 2021;
• The forecast shows that all bank facility financial covenants will be met throughout the review period;
• Based on the forecast for the next quarter, June 2021, rental income could fall by 18% before income covenants would come under pressure;
• Property values could fall by 33% in the going concern period before loan to value covenants come under pressure; and
• The Group has also performed a severe stress test which shows that it could withstand receiving no rental income during the going concern period (excluding the impact on income covenants which could be mitigated by cash deposit/repayment cures).
Based on this analysis, the Directors have adopted the going concern basis in preparing the accounts for the year ended 31 March 2021.
2. REVENUE FROM CONTRACTS WITH CUSTOMERS
Year ended 31.3.21
£000
Year ended 31.3.20
£000
Development property income 1,700 3,849
Service charge income 8,841 8,790
Other income 48 91
Total revenue from contracts with customers 10,589 12,730
The total revenue from contracts with customers is the revenue recognised in accordance with IFRS 15 Revenue from Contracts with Customers. This reflects the development property income, the service charge income and other revenue in Note 3.
Impairments of contract assets recognised in the year to 31 March 2021 amounted to £140,000 (2020: £nil).
3. SEGMENTAL INFORMATIONIFRS 8 Operating Segments requires the identification of the Group’s operating segments, which are defined as being discrete components of the Group’s operations whose results are regularly reviewed by the Chief Operating Decision Maker (being the Chief Executive) to allocate resources to those segments and to assess their performance. The Group divides its business into the following segments:
• investment properties, which are owned or leased by the Group for long-term income and for capital appreciation; and,
• development properties, which include sites, developments in the course of construction, completed developments available for sale, and pre-sold developments.
Revenue
Investment Year ended
31.03.21£000
DevelopmentYear ended
31.03.21£000
TotalYear ended
31.03.21£000
InvestmentYear ended
31.03.20£000
DevelopmentYear ended
31.03.20£000
TotalYear ended
31.03.20£000
Gross rental income 28,007 – 28,007 31,631 – 31,631
Development property income – 1,700 1,700 – 3,849 3,849
Service charge income 8,841 – 8,841 8,790 – 8,790
Other revenue 48 – 48 91 – 91
Revenue 36,896 1,700 38,596 40,512 3,849 44,361
Cost of sales
Investment Year ended
31.03.21£000
DevelopmentYear ended
31.03.21£000
TotalYear ended
31.03.21£000
InvestmentYear ended
31.03.20£000
DevelopmentYear ended
31.03.20£000
TotalYear ended
31.03.20£000
Rents payable (232) – (232) (178) – (178)
Property overheads (2,810) – (2,810) (3,615) – (3,615)
Service charge expense (8,841) – (8,841) (8,790) – (8,790)
Development cost of sales – (1,018) (1,018) – (1,744) (1,744)
Development sales expenses – (4) (4) – (29) (29)
Expected credit loss (provision)/reversal – (82) (82) – 1,198 1,198
Other expense – – – (3) – (3)
Cost of sales (11,883) (1,104) (12,987) (12,586) (575) (13,161)
All revenue is from external sales and is attributable to continuing operations. There were no inter-segmental sales.
Revenue for the year comprises revenue from other income £48,000 (2020: £91,000), revenue from services of £1,700,000 (2020: £3,849,000), service charge income of £8,841,000 (2020: £8,790,000) and rental income of £28,007,000 (2020: £31,631,000).
Profit before tax
InvestmentYear ended
31.03.21£000
Development Year ended
31.03.21£000
TotalYear ended
31.03.21£000
InvestmentYear ended
31.03.20£000
Development Year ended
31.03.20£000
TotalYear ended
31.03.20£000
Net rental income 24,965 – 24,965 27,838 – 27,838
Development property profit – 596 596 – 3,274 3,274
Share of results of joint ventures 4,389 (2,037) 2,352 11,880 1,516 13,396
Gain on sale and revaluation of investment properties 18,046 – 18,046 37,079 – 37,079
Segmental profit/(loss) 47,400 (1,441) 45,959 76,797 4,790 81,587
Other operating income 48 88
Gross profit 46,007 81,675
Administrative expenses (14,416) (16,715)
Finance costs (14,079) (16,100)
Finance income 58 1,345
Change in fair value of derivative financial instruments 2,938 (7,651)
Change in fair value of Convertible Bond – 468
Foreign exchange gain – 8
Profit before tax 20,508 43,030
142 Helical plc Annual Report and Accounts 2021 143Helical plcAnnual Report and Accounts 2021F
INA
NC
IAL S
TAT
EM
EN
TS

3. SEGMENTAL INFORMATION CONTINUED
Net assets
Investment 31.03.21
£000
Development 31.03.21
£000
Total31.03.21
£000
Investment 31.03.20
£000
Development 31.03.20
£000
Total31.03.20
£000
Investment properties 740,207 – 740,207 819,573 – 819,573
Land and developments – 448 448 – 852 852
Investment in joint ventures 74,165 5,788 79,953 73,643 7,175 80,818
814,372 6,236 820,608 893,216 8,027 901,243
Owner occupied property, plant and equipment 5,362 6,007
Derivative financial instruments 171 86
Trade and other receivables 40,427 40,382
Corporation tax receivable – 1,417
Cash and cash equivalents 154,448 74,586
Total assets 1,021,016 1,023,721
Liabilities (412,855) (425,032)
Net assets 608,161 598,689
All non-current assets are derived from the Group’s UK operations.
4. NET PROPERTY INCOME
Year ended 31.3.21
£000
Year ended 31.3.20
£000
Gross rental income 28,007 31,631
Head rents payable (232) (178)
Property overheads (2,810) (3,615)
Net rental income 24,965 27,838
Development property income 1,700 3,849
Development cost of sales (1,018) (1,744)
Sales expenses (4) (29)
Change in expected credit loss – (provision)/reversal of provision (82) 1,198
Development property profit 596 3,274
Other revenue 48 91
Other expense – (3)
Net property income 25,609 31,200
Property overheads include lettings costs, vacancy costs and bad debt provisions. The amounts above include gross rental income from investment properties of £28,007,000 (2020: £31,631,000) and net rental income from investment properties of £24,965,000 (2020: £27,838,000).
5. LOSS ON SALE OF INVESTMENT PROPERTIES
Year ended 31.3.21
£000
Year ended 31.3.20
£000
Proceeds from the sale of investment properties 114,800 41,580
Sale expenses (1,593) (1,320)
Book value (Note 14) (111,883) (41,481)
Tenants’ incentives on sold investment properties (2,665) (51)
Loss on sale of investment properties (1,341) (1,272)
NOTES TO THE FINANCIAL STATEMENTSCONTINUED
6. ADMINISTRATIVE EXPENSES
Year ended 31.3.21
£000
Year ended 31.3.20
£000
Administrative expenses 14,416 16,715
Operating profit is stated after the following items that are contained within administrative expenses:
Depreciation – Owner occupied property, plant and equipment 791 807
Share-based payments charge 2,031 2,814
Staff costs 8,364 9,075
Auditor’s remuneration:
Audit fees
Payable to the Company’s auditor for the audit of Parent Company and consolidated financial statements 194 174
Payable to the Company’s auditor for the audit of Company’s subsidiaries 82 89
Audit related assurance services 59 56
Other non-audit services 9 9
Operating lease costs 268 221
7. STAFF COSTS
Year ended 31.3.21
£000
Year ended 31.3.20
£000
Staff costs during the year:
Wages and salaries 6,722 7,211
Social security costs 1,355 1,586
Other pension costs 287 278
8,364 9,075
Details of the remuneration of Directors amounting to £5,390,000 (2020: £6,513,000) are included in the Directors’ Remuneration Report on pages 103 to 125. The amount of the share-based payments charge relating to share awards made to Directors is £1,410,000 (2020: £2,066,000). Included within wages and salaries are Directors’ bonuses of £1,163,000 (2020: £1,460,000) as discussed in the Directors’ Remuneration Report on pages 103 to 125.
Other pension costs relate to payments to individual pension plans.
The average monthly number of employees of the Group during the year was 29 (2020: 29), all of whom are UK head office staff. There were averages of five (2020: five) management, seven (2020: seven) Property Executives and 17 (2020: 17) administrative staff.
Of the staff costs of £8,364,000 (2020: £9,075,000), £8,364,000 is included within administrative expenses (2020: £9,075,000) and £nil is included within development costs (2020: £nil).
Within administrative costs is the share-based payments charge for the year of £2,031,000 (2020: £2,814,000) which is not included in the staff costs above.
8. FINANCE COSTS AND FINANCE INCOME
Year ended 31.3.21
£000
Year ended 31.3.20
£000
Interest payable on bank loans, bonds and overdrafts (10,697) (12,147)
Other interest payable and similar charges (3,382) (5,698)
Interest capitalised – 1,745
Finance costs (14,079) (16,100)
Interest receivable and similar income 58 1,345
Finance income 58 1,345
No interest has been capitalised in the year to 31 March 2021. In the prior year, interest has been capitalised in accordance with IAS 23 Borrowing Costs.
144 Helical plc Annual Report and Accounts 2021 145Helical plcAnnual Report and Accounts 2021F
INA
NC
IAL S
TAT
EM
EN
TS

9. TAX ON PROFIT ON ORDINARY ACTIVITIES
Year ended 31.3.21
£000
Year ended 31.3.20
£000
The tax charge is based on the profit for the year and represents:
United Kingdom corporation tax at 19% (2020: 19%)
Group corporation tax (1,218) (470)
Adjustment in respect of prior years 365 (19)
Current tax charge (853) (489)
Deferred tax
Capital allowances (398) (879)
Tax losses (794) (201)
Unrealised chargeable gains 338 (4,691)
Other temporary differences (924) 1,947
Deferred tax charge (1,778) (3,824)
Total tax charge for the year (2,631) (4,313)
FACTORS AFFECTING THE TAX CHARGE FOR THE YEARThe tax assessed for the year is lower than (2020: lower than) the standard rate of corporation tax in the UK.
The differences are explained below:
Year ended 31.3.21
£000
Year ended 31.3.20
£000
Profit on ordinary activities before tax 20,508 43,030
Profit on ordinary activities multiplied by standard rate of corporation tax in the UK of 19% (2020: 19%) (3,896) (8,176)
Effect of:
Net expenses not deductible for tax purposes (238) (404)
Adjustment to capital allowances – disposals 591 293
Tax movements on share awards 171 279
Movement on tax losses not previously recognised in deferred tax – –
Operating profit of joint ventures 447 2,545
Current tax charge adjustment in respect of prior periods 365 (19)
Movement on sale and revaluation not recognised through deferred tax1 93 4,053
Chargeable gain (in excess of)/less than profit or loss on investment property (165) 266
Deferred tax adjustment in respect of prior periods – (305)
Gain on settlement of Convertible Bond – (1,556)
Change of rate of corporation tax – (1,289)
Total tax charge for the year (2,632) (4,313)
1 This includes adjustments relating to the initial recognition of deferred tax on unrealised gains and losses in respect of investment properties held by non-resident landlords arising from the introduction of the NRCGT legislation.
FACTORS THAT MAY AFFECT FUTURE TAX CHARGESThe tax charge is expected to be less than the full rate in future years, primarily due to the Group continuing to claim allowances in respect of eligible expenditure on investment properties.
NOTES TO THE FINANCIAL STATEMENTSCONTINUED
10. DEFERRED TAXDeferred tax provided for in the financial statements is set out below:
31.3.21Group
£000
31.3.20Group
£000
31.3.21Company
£000
31.3.20Company
£000
Capital allowances (4,540) (4,142) (244) (219)
Tax losses 1,024 1,818 – –
Unrealised chargeable gains (13,512) (13,850) – –
Other temporary differences 3,459 4,316 – –
Deferred tax liability (13,569) (11,858) (244) (219)
Note: The previously substantively enacted proposed reduction in the corporation tax rate to 17%, which was due to take effect from 1 April 2020, was cancelled in Budget 2020 with the rate remaining at 19%. As a consequence, deferred tax items previously recognised at 17% are now recognised at 19%. The Finance Bill 2021 proposed an increase in the standard rate of tax from 19% to 25% on 1 April 2023. As this has not yet been substantively enacted this has not been reflected in these financial statements.
Under IAS 12 Income Taxes, deferred tax provisions are made for the tax that would potentially be payable on the realisation of investment properties and other assets at book value. Other temporary differences include deferred tax assets arising from the recognition of the fair value of derivative financial instruments and future tax relief available to the Group from capital allowances and when share awards vest. A credit of £66,000 (2020: £483,000) in respect of future tax relief for share awards has been recognised in reserves in accordance with IAS 12 Income Taxes. Together with the charge through the Consolidated Income Statement, this movement explains the change in the deferred tax liability for the year.
The Group contains entities with tax losses for which no deferred tax asset is recognised. The total unrecognised losses amount to approximately £6,454,000 (31 March 2020: £6,457,000). A deferred tax asset has not been recognised because the entities in which the losses have been generated either do not have forecast taxable profits or the losses have restrictions whereby their utilisation is considered to be unlikely.
If upon sale of the investment properties the Group retained all the capital allowances, the deferred tax provision in respect of capital allowances of £4,540,000 (31 March 2020: £4,142,000) would be released and further capital allowances of £76,028,000 (31 March 2020: £87,274,000) would be available to reduce future tax liabilities.
11. DIVIDENDS PAID AND PAYABLE
Year ended 31.3.21
£000
Year ended 31.3.20
£000
Attributable to equity share capital
Ordinary
Interim paid 2.70p per share (2020: 2.70p) 3,274 3,239
Prior year final paid 6.00p per share (2019: 7.50p) 7,254 8,980
10,528 12,219
A final dividend of 7.40p, if approved at the AGM on 15 July 2021, will be paid on 26 July 2021 to Shareholders on the register on 25 June 2021. This final dividend, amounting to £8,974,000, has not been included as a liability as at 31 March 2021, in accordance with IFRS.
12. PARENT COMPANYThe Company has taken advantage of Section 408 of the Companies Act 2006 and has not included its own Income Statement in the financial statements. The profit for the year of the Company was £51,128,000 (2020: £55,169,000).
146 Helical plc Annual Report and Accounts 2021 147Helical plcAnnual Report and Accounts 2021F
INA
NC
IAL S
TAT
EM
EN
TS

13. EARNINGS PER SHAREThe calculation of the basic earnings per share is based on the earnings attributable to ordinary Shareholders divided by the weighted average number of shares in issue during the year. This is a different basis to the net asset per share calculations which are based on the number of shares at the year end.
The calculation of diluted earnings per share is based on the basic earnings per share, adjusted to allow for the issue of shares and the post tax effect of dividends on the assumed exercise of all dilutive options.
The EPRA earnings per share is calculated in accordance with IAS 33 Earnings per Share and the best practice recommendations of the European Public Real Estate Association (“EPRA”).
Reconciliations of the earnings and weighted average number of shares used in the calculations are set out below:
Year ended 31.3.21
000
Year ended 31.3.20
000
Ordinary shares in issue 121,266 119,978
Weighting adjustment (282) (133)
Weighted average ordinary shares in issue for calculation of basic and EPRA earnings per share 120,984 119,845
Weighted average ordinary shares issued on share settled bonuses 719 973
Weighted average ordinary shares to be issued under Performance Share Plan 1,434 1,385
Weighted average ordinary shares in issue for calculation of diluted earnings per share 123,137 122,203
£000 £000
Earnings used for calculation of basic and diluted earnings per share 17,877 38,717
Basic earnings per share 14.8p 32.3p
Diluted earnings per share 14.5p 31.7p
£000 £000
Earnings used for calculation of basic and diluted earnings per share 17,877 38,717
Net gain on sale and revaluation of investment properties – subsidiaries (18,046) (37,079)
– joint ventures (5,870) (8,451)
Tax on profit on disposal of investment properties 4,936 599
Tax on gain on settlement of derivative component of Convertible Bond – 1,555
Movement in share of joint ventures 767 (275)
Fair value movement on derivative financial instruments – subsidiaries (2,938) 7,651
– joint ventures – 39
Fair value movement on Convertible Bond – (468)
Profit on cancellation of derivative financial instruments – (233)
Expense on cancellation of loans – 2,939
Deferred tax on adjusting items 1,075 4,088
(Loss)/earnings used for calculations of EPRA earnings per share (2,199) 9,082
EPRA (loss)/earnings per share (1.8)p 7.6p
The loss/earnings used for the calculation of EPRA earnings per share includes net rental income and development property profits/losses.
NOTES TO THE FINANCIAL STATEMENTSCONTINUED
14. INVESTMENT PROPERTIES
Group
Freehold31.3.21
£000
Leasehold31.3.21
£000
Total31.3.21
£000
Freehold31.3.20
£000
Leasehold31.3.20
£000
Total31.3.20
£000
Book value at 1 April 657,261 162,312 819,573 652,250 126,502 778,752
Additions 5,393 7,756 13,149 19,049 24,902 43,951
Disposals (111,883) – (111,883) (41,481) – (41,481)
Letting cost amortisation (8) (11) (19) – – –
Revaluation surplus (6,638) 26,025 19,387 27,443 10,908 38,351
Book value at 31 March 544,125 196,082 740,207 657,261 162,312 819,573
Investment properties are stated at fair value as at 31 March 2021 as follows:
Group
Freehold31.3.21
£000
Leasehold31.3.21
£000
Total31.3.21
£000
Freehold31.3.20
£000
Leasehold31.3.20
£000
Total31.3.20
£000
Book value at 31 March 544,125 196,082 740,207 657,261 162,312 819,573
Lease incentives and letting costs included in trade and other receivables 16,450 2,365 18,815 18,064 1,399 19,463
Head leases capitalised – (2,147) (2,147) – (2,161) (2,161)
Fair value at 31 March 560,575 196,300 756,875 675,325 161,550 836,875
Interest capitalised during the year in respect of the refurbishment of investment properties amounted to £nil (2020: £1,745,000).
Cumulative interest capitalised in respect of the refurbishment of investment properties at 31 March 2021 amounted to £13,102,000 (31 March 2020: £13,102,000).
Investment properties with a total fair value of £729,425,000 (31 March 2020: £812,725,000) were held as security against borrowings.
All of the Group’s properties are Level 3, as defined by IFRS 13 Fair Value Measurement, in the fair value hierarchy as at 31 March 2021 and there were no transfers between levels during the year. Level 3 inputs used in valuing the properties are those which are unobservable, as opposed to Level 1 (inputs from quoted prices) and Level 2 (observable inputs either directly, i.e. as prices, or indirectly, i.e. derived from prices).
Transfers into and transfers out of the fair value hierarchy levels are recognised on the date of the event or change in circumstances that caused the transfer.
VALUATION METHODOLOGYThe fair value of the Group’s investment property as at 31 March 2021 was determined by independent external valuers at that date, except for investment properties valued by the Directors. The valuations are in accordance with the RICS Valuation – Professional Standards (“The Red Book”) and the International Valuation Standards and were arrived at by reference to market transactions for similar properties.
Fair values for investment properties are calculated using the present value income approach. The main assumptions underlying the valuations are in relation to rent profile and yields as discussed below. A key driver of the property valuations is the terms of the leases in place at the valuation date. These determine the cash flow profile of the property for a number of years. The valuation assumes adjustments from these rental values to current market rent at the time of the next rent review (where a typical lease allows only for upward adjustment) and as leases expire and are replaced by new leases. The current market level of rent is assessed based on evidence provided by the most recent relevant leasing transactions and negotiations. The nominal equivalent yield is applied as a discount rate to the rental cash flows which, after taking into account other input assumptions such as vacancies and costs, generates the market value of the property.
The equivalent yield applied is assessed by reference to market transactions for similar properties and takes into account, amongst other things, any risks associated with the rent uplift assumptions.
The net initial yield is calculated as the current net income over the gross market value of the asset and is used as a sense check and to compare against market transactions for similar properties. The valuation outputs, along with inputs and assumptions, are reviewed to ensure these are in line with what a market participant would use when pricing each asset.
The reversionary yield is the return received from an asset once the estimated rental value has been captured on today’s assessment of market value.
There are interrelationships between all the inputs as they are determined by market conditions. The existence of an increase in more than one input would be to magnify the input on the valuation. The impact on the valuation will be mitigated by the interrelationship of two inputs in opposite directions.
Details of the investment portfolio yields can be found on page 45.
148 Helical plc Annual Report and Accounts 2021 149Helical plcAnnual Report and Accounts 2021F
INA
NC
IAL S
TAT
EM
EN
TS

14. INVESTMENT PROPERTIES CONTINUEDA sensitivity analysis was performed to ascertain the impact of a 25 basis point shift in the equivalent yield and a £2.50 psf shift in London ERVs and a £1.00 psf shift in Manchester ERVs for the wholly owned investment portfolio:
London%
Manchester %
Total%
Total£000
Equivalent yield
+ 25 bps (5.2) (4.8) (5.2) (39,275)
- 25 bps 5.8 5.3 5.8 43,725
ERV
+ £2.50 (London) & £1.00 (Manchester) 2.9 2.8 2.9 22,175
- £2.50 (London) & £1.00 (Manchester) (3.0) (2.6) (3.0) (22,575)
The investment properties have been valued at 31 March 2021 as follows:
Group 31.3.21
£000
Group31.3.20
£000
Cushman & Wakefield LLP 756,725 836,725
Directors’ valuation 150 150
756,875 836,875
The historical cost of investment property is £573,709,000 (31 March 2020: £645,927,000).
15. OPERATING LEASE ARRANGEMENTSThe Group earns rental income by leasing its investment properties to tenants under non-cancellable operating leases. At the Balance Sheet date, the Group had contracted with tenants to receive the following future minimum lease payments:
Group 31.3.21
£000
Group31.3.20
£000
Not later than one year 26,182 31,335
Later than one year but not more than five years 96,038 95,414
More than five years 115,145 94,638
237,365 221,387
The Company has no operating lease arrangements as lessor.
NOTES TO THE FINANCIAL STATEMENTSCONTINUED
16. OWNER OCCUPIED PROPERTY, PLANT AND EQUIPMENT
Group
Leasehold property and
improvements 31.3.21
£000
Plant and equipment
31.3.21£000
Total31.3.21
£000
Leasehold property and
improvements 31.3.20
£000
Plant and equipment
31.3.20£000
Total31.3.20
£000
Cost at 1 April 7,138 712 7,850 2,074 816 2,890
Impact of transition to IFRS 16 – – – 5,064 – 5,064
Adjusted balances at 1 April 7,138 712 7,850 7,138 816 7,954
Additions at cost – 155 155 – 18 18
Disposals – (296) (296) – (122) (122)
Cost at 31 March 7,138 571 7,709 7,138 712 7,850
Depreciation at 1 April 1,352 491 1,843 683 458 1,141
Provision for the year 668 123 791 669 138 807
Eliminated on disposals – (287) (287) – (105) (105)
Depreciation at 31 March 2,020 327 2,347 1,352 491 1,843
Net book amount at 31 March 5,118 244 5,362 5,786 221 6,007
Plant and equipment include vehicles, fixtures and fittings and other office equipment.
All leasehold property and improvements and plant and equipment relate to the Company.
Included within leasehold property and improvements is a right of use asset with a net book value of £4,022,000 (31 March 2020: £4,543,000).
17. INVESTMENT IN SUBSIDIARIES
Group31.3.21
£000
Group31.3.20
£000
Company31.3.21
£000
Company31.3.20
£000
Cost at 1 April – – 250,726 198,668
Additions – – 3,641 52,058
Disposals – – (12,910) –
Cost at 31 March – – 241,457 250,726
Impairment at 1 April – – 42,454 41,047
Impaired during the year – – 3,329 1,407
Disposals – – (12,909) –
Impairment at 31 March – – 32,874 42,454
Net book amount at 31 March – – 208,583 208,272
A list of all the Company’s subsidiary undertakings, all of which have been consolidated, are shown in Note 37 to the financial statements.
150 Helical plc Annual Report and Accounts 2021 151Helical plcAnnual Report and Accounts 2021F
INA
NC
IAL S
TAT
EM
EN
TS

18. INVESTMENT IN JOINT VENTURES
Summarised consolidated Income Statements
Investment31.3.21
£000
Development 31.3.21
£000
Total31.3.21
£000
Investment31.3.20
£000
Development 31.3.20
£000
Total31.3.20
£000
Revenue 99 25,925 26,024 6,438 25,724 32,162
Gross rental income 99 57 156 701 197 898
Property overheads (112) (19) (131) (186) (112) (298)
Net rental income (13) 38 25 515 85 600
Gain/(loss) on revaluation of investment properties 6,445 (22) 6,423 8,247 204 8,451
Loss on sale of investment properties (553) – (553) – – –
Development (loss)/profit – (948) (948) 5,737 2,387 8,124
Provision against stock – – – – (1,481) (1,481)
Other operating expenses – – – (14) (7) (21)
Gross profit/(loss) 5,879 (932) 4,947 14,485 1,188 15,673
Administrative expenses (300) (132) (432) (414) (182) (596)
Operating profit/(loss) 5,579 (1,064) 4,515 14,071 1,006 15,077
Interest payable on bank loans and overdrafts (560) (603) (1,163) (539) (4) (543)
Other interest payable and similar charges (156) – (156) – (328) (328)
Interest capitalised 514 – 514 – – –
Finance income 2 3 5 16 38 54
Change in fair value of derivative financial instruments – – – – (39) (39)
Profit before tax 5,379 (1,664) 3,715 13,548 673 14,221
Tax (223) (373) (596) (1,943) (715) (2,658)
Profit after tax 5,156 (2,037) 3,119 11,605 (42) 11,563
Reversal of One Creechurch Place loss1 – – – – 224 224
Profit on sale of interest in One Creechurch Place – – – – 1,334 1,334
Adjustment for Barts Square economic interest2 (767) – (767) 275 – 275
Share of results of joint ventures 4,389 (2,037) 2,352 11,880 1,516 13,396
Summarised consolidated balance sheets
Investment31.3.21
£000
Development 31.3.21
£000
Total31.3.21
£000
Investment31.3.20
£000
Development 31.3.20
£000
Total31.3.20
£000
Non-current assets
Investment properties 85,325 1,492 86,817 74,776 1,365 76,141
Owner occupied property, plant and equipment 41 41 – 41 41
85,325 1,533 86,858 74,776 1,406 76,182
Current assets
Land and developments – 16,545 16,545 – 34,164 34,164
Trade and other receivables 8,144 (6,483) 1,661 2,418 1,362 3,780
Cash and cash equivalents 3,022 4,759 7,781 1,055 6,766 7,821
11,166 14,821 25,987 3,473 42,292 45,765
Current liabilities
Trade and other payables (4,605) (2,493) (7,098) (1,671) (5,491) (7,162)
Borrowings (3,287) (8,168) (11,455) – – –
(7,892) (10,661) (18,553) (1,671) (5,491) (7,162)
Non-current liabilities
Trade and other payables (401) (7) (408) – (316) (316)
Borrowings (8,014) – (8,014) (13,456) (19,298) (32,754)
Leasehold Interest (4,584) – (4,584) – – –
Deferred tax (1,528) 106 (1,422) (1,382) 406 (976)
(14,527) 99 (14,428) (14,838) (19,208) (34,046)
Net assets before acquisition costs 74,072 5,792 79,864 61,740 18,999 80,739
Acquisition costs 89 89 79 – 79
Net assets 74,161 5,792 79,953 61,819 18,999 80,818
1 This is an adjustment that has been made to add back the Group’s share of the loss incurred in one of its joint ventures, arising from finance and other costs in the year, to ensure the Group’s interest is shown at its recoverable amount.
2 This is an adjustment to reflect the impact of the consolidation of a joint venture at its economic interest of 47.0% (2020: 43.0%) rather than its actual ownership interest of 33.3%.
NOTES TO THE FINANCIAL STATEMENTSCONTINUED
The fair value of the investment properties at 31 March 2021 is as follows:
Total 31.3.21
£000
Total31.3.20
£000
Book value at 31 March 86,817 76,141
Lease incentives and letting costs included in trade and other receivables (4,301) 668
Fair value at 31 March 82,516 76,809
The Directors’ valuation of land and developments shows a surplus of £nil (31 March 2020: £nil) above book value.
Dividends of £10,266,000 were received from joint venture companies during the year (2020: £6,670,000). The joint venture companies are private companies, therefore no quoted market prices are available for their shares.
The cost of the Company’s investment in joint ventures was £nil (31 March 2020: £nil).
The Group has two material joint ventures (31 March 2020: two). The full results and position of these joint ventures are set out below, of which we have included our share in the above table.
Summarised Income Statement
Barts LP Group 31.03.21
£000
Barts LP Group 31.03.20
£000
Charterhouse Street Group
31.03.21£000
Charterhouse Street Group
31.03.20£000
Revenue 55,226 74,274 – –
Gross rental income 305 1,692 – –
Property overheads (278) (481) – (92)
Net rental income/(costs) 27 1,211 – (92)
Development (loss)/gain (2,133) 18,774 – –
Gain on revaluation of investment properties 1,233 10,411 11,687 7,948
Loss on sale of investment properties (1,178) – – –
Provision against book value of development stock – (3,443) – –
Other operating expense (1) (50) – (166)
Administrative expenses (610) (1,057) (272) –
Finance costs (1,707) (1,260) (1,030) (4)
Interest capitalised – – 1,029 –
Finance income 8 112 2 5
Change in fair value movement of derivative financial instruments – (91) – –
(Loss)/profit before tax (4,361) 24,607 11,416 7,691
Tax 951 (4,768) (2,074) (1,381)
(Loss)/profit after tax (3,410) 19,839 9,342 6,310
152 Helical plc Annual Report and Accounts 2021 153Helical plcAnnual Report and Accounts 2021F
INA
NC
IAL S
TAT
EM
EN
TS
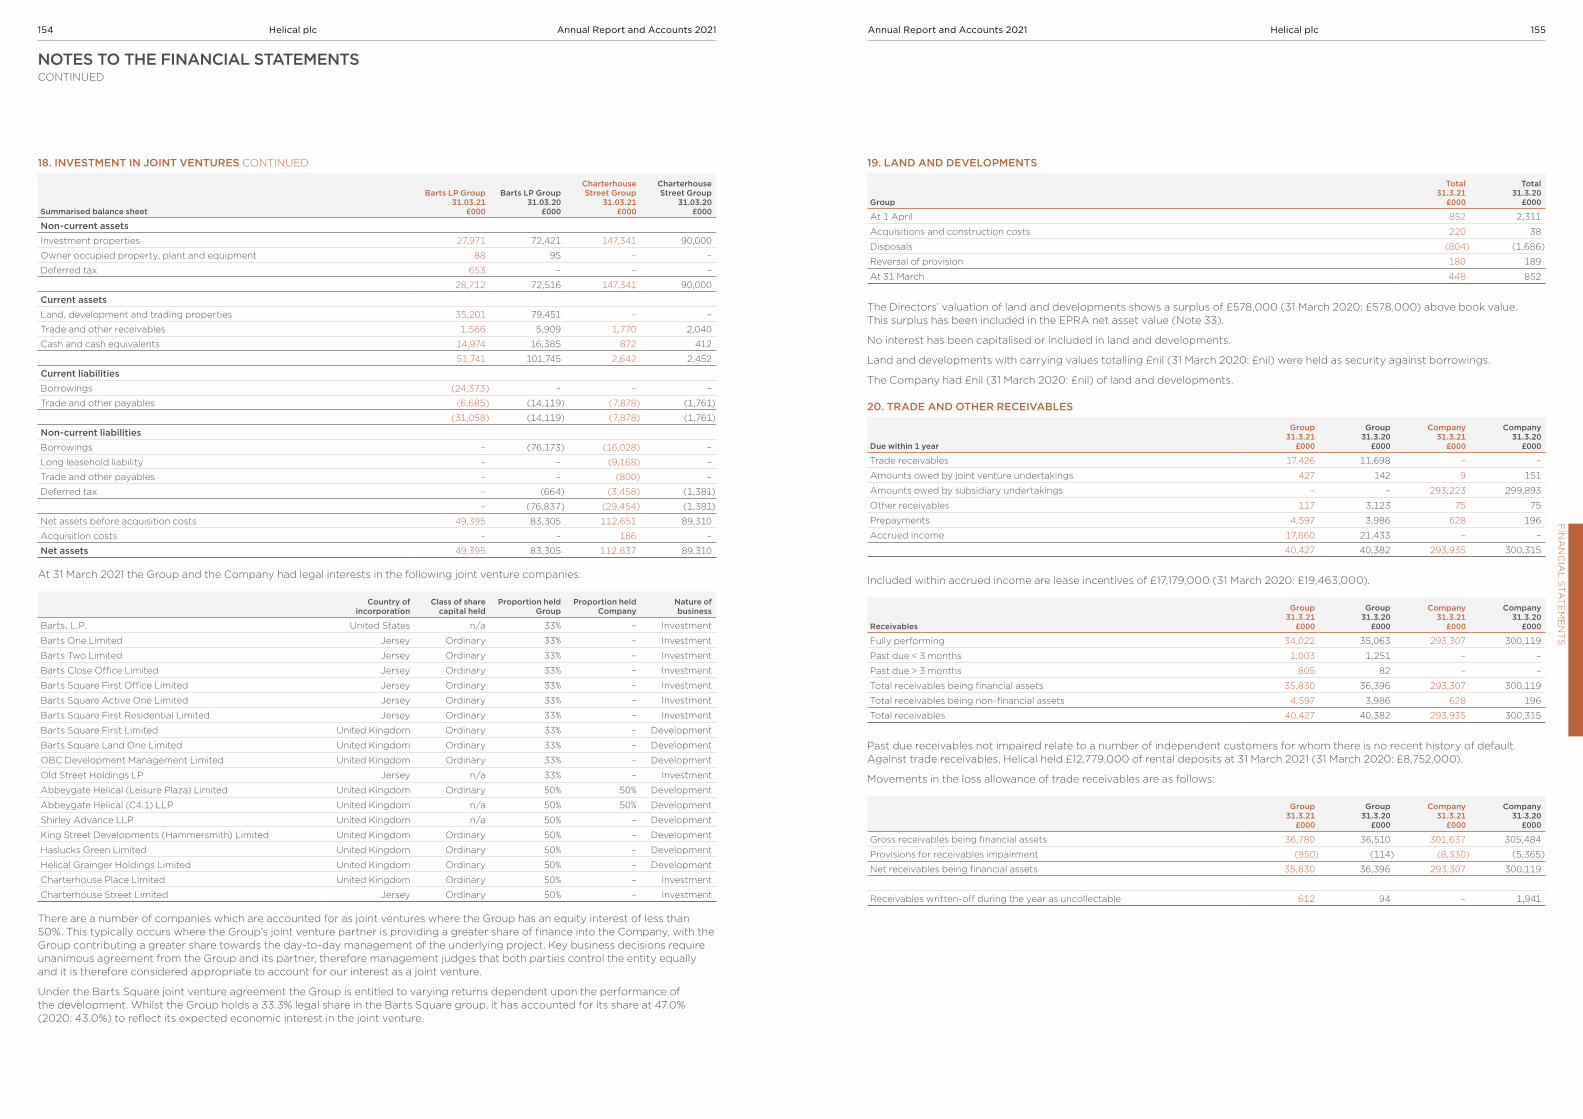
18. INVESTMENT IN JOINT VENTURES CONTINUED
Summarised balance sheet
Barts LP Group 31.03.21
£000
Barts LP Group 31.03.20
£000
Charterhouse Street Group
31.03.21£000
Charterhouse Street Group
31.03.20£000
Non-current assetsInvestment properties 27,971 72,421 147,341 90,000
Owner occupied property, plant and equipment 88 95 – –
Deferred tax 653 – – –
28,712 72,516 147,341 90,000
Current assetsLand, development and trading properties 35,201 79,451 – –
Trade and other receivables 1,566 5,909 1,770 2,040
Cash and cash equivalents 14,974 16,385 872 412
51,741 101,745 2,642 2,452
Current liabilitiesBorrowings (24,373) – – –
Trade and other payables (6,685) (14,119) (7,878) (1,761)
(31,058) (14,119) (7,878) (1,761)
Non-current liabilitiesBorrowings – (76,173) (16,028) –
Long leasehold liability – – (9,168) –
Trade and other payables – – (800) –
Deferred tax – (664) (3,458) (1,381)
– (76,837) (29,454) (1,381)
Net assets before acquisition costs 49,395 83,305 112,651 89,310
Acquisition costs – – 186 –
Net assets 49,395 83,305 112,837 89,310
At 31 March 2021 the Group and the Company had legal interests in the following joint venture companies:
Country of incorporation
Class of share capital held
Proportion held Group
Proportion held Company
Nature of business
Barts, L.P. United States n/a 33% – Investment
Barts One Limited Jersey Ordinary 33% – Investment
Barts Two Limited Jersey Ordinary 33% – Investment
Barts Close Office Limited Jersey Ordinary 33% – Investment
Barts Square First Office Limited Jersey Ordinary 33% – Investment
Barts Square Active One Limited Jersey Ordinary 33% – Investment
Barts Square First Residential Limited Jersey Ordinary 33% – Investment
Barts Square First Limited United Kingdom Ordinary 33% – Development
Barts Square Land One Limited United Kingdom Ordinary 33% – Development
OBC Development Management Limited United Kingdom Ordinary 33% – Development
Old Street Holdings LP Jersey n/a 33% – Investment
Abbeygate Helical (Leisure Plaza) Limited United Kingdom Ordinary 50% 50% Development
Abbeygate Helical (C4.1) LLP United Kingdom n/a 50% 50% Development
Shirley Advance LLP United Kingdom n/a 50% – Development
King Street Developments (Hammersmith) Limited United Kingdom Ordinary 50% – Development
Haslucks Green Limited United Kingdom Ordinary 50% – Development
Helical Grainger Holdings Limited United Kingdom Ordinary 50% – Development
Charterhouse Place Limited United Kingdom Ordinary 50% – Investment
Charterhouse Street Limited Jersey Ordinary 50% – Investment
There are a number of companies which are accounted for as joint ventures where the Group has an equity interest of less than 50%. This typically occurs where the Group’s joint venture partner is providing a greater share of finance into the Company, with the Group contributing a greater share towards the day-to-day management of the underlying project. Key business decisions require unanimous agreement from the Group and its partner, therefore management judges that both parties control the entity equally and it is therefore considered appropriate to account for our interest as a joint venture.
Under the Barts Square joint venture agreement the Group is entitled to varying returns dependent upon the performance of the development. Whilst the Group holds a 33.3% legal share in the Barts Square group, it has accounted for its share at 47.0% (2020: 43.0%) to reflect its expected economic interest in the joint venture.
NOTES TO THE FINANCIAL STATEMENTSCONTINUED
19. LAND AND DEVELOPMENTS
Group
Total 31.3.21
£000
Total31.3.20
£000
At 1 April 852 2,311
Acquisitions and construction costs 220 38
Disposals (804) (1,686)
Reversal of provision 180 189
At 31 March 448 852
The Directors’ valuation of land and developments shows a surplus of £578,000 (31 March 2020: £578,000) above book value. This surplus has been included in the EPRA net asset value (Note 33).
No interest has been capitalised or included in land and developments.
Land and developments with carrying values totalling £nil (31 March 2020: £nil) were held as security against borrowings.
The Company had £nil (31 March 2020: £nil) of land and developments.
20. TRADE AND OTHER RECEIVABLES
Due within 1 year
Group 31.3.21
£000
Group31.3.20
£000
Company31.3.21
£000
Company31.3.20
£000
Trade receivables 17,426 11,698 – –
Amounts owed by joint venture undertakings 427 142 9 151
Amounts owed by subsidiary undertakings – – 293,223 299,893
Other receivables 117 3,123 75 75
Prepayments 4,597 3,986 628 196
Accrued income 17,860 21,433 – –
40,427 40,382 293,935 300,315
Included within accrued income are lease incentives of £17,179,000 (31 March 2020: £19,463,000).
Receivables
Group31.3.21
£000
Group31.3.20
£000
Company31.3.21
£000
Company31.3.20
£000
Fully performing 34,022 35,063 293,307 300,119
Past due < 3 months 1,003 1,251 – –
Past due > 3 months 805 82 – –
Total receivables being financial assets 35,830 36,396 293,307 300,119
Total receivables being non-financial assets 4,597 3,986 628 196
Total receivables 40,427 40,382 293,935 300,315
Past due receivables not impaired relate to a number of independent customers for whom there is no recent history of default. Against trade receivables, Helical held £12,779,000 of rental deposits at 31 March 2021 (31 March 2020: £8,752,000).
Movements in the loss allowance of trade receivables are as follows:
Group31.3.21
£000
Group31.3.20
£000
Company31.3.21
£000
Company31.3.20
£000
Gross receivables being financial assets 36,780 36,510 301,637 305,484
Provisions for receivables impairment (950) (114) (8,330) (5,365)
Net receivables being financial assets 35,830 36,396 293,307 300,119
Receivables written-off during the year as uncollectable 612 94 – 1,941
154 Helical plc Annual Report and Accounts 2021 155Helical plcAnnual Report and Accounts 2021F
INA
NC
IAL S
TAT
EM
EN
TS

20. TRADE AND OTHER RECEIVABLES CONTINUEDThe following table shows the movement in lifetime Estimated Credit Loss (“ECL”) that has been recognised for trade receivables in accordance with the simplified approach set out in IFRS 9.
Group£000
Company£000
Balance as at 1 April 2019 75 –
Net remeasurement of loss allowance 114 –
Amounts written off (75) –
Amounts recovered – –
Balance as at 31 March 2020 114 –
Net remeasurement of loss allowance 836 –
Amounts written off – –
Amounts recovered – –
Balance as at 31 March 2021 950 –
The Group has considered the likelihood of default for each tenant and for each contract balance (on an individual basis), either on a 12-month basis, if there has been no significant change in credit risk, or on a lifetime basis, where credit risk has changed. This requires a forward looking assessment based on past performance and the Group’s knowledge of its debtor profile.
Included in total receivables being financial assets above are contract balances and receivables from contracts with customers, as defined by IFRS 15 Revenue from Contracts with Customers, as follows:
Contract assets from contracts with customers
Group31.3.21
£000
Group31.3.20
£000
Company31.3.21
£000
Company31.3.20
£000
At 1 April 681 6,233 – –
Additions 256 655 – –
Received during the year (669) (6,207) – –
Change in loss allowance – – – –
At 31 March 268 681 – –
Receivables from contracts with customers
Group31.3.21
£000
Group31.3.20
£000
Company31.3.21
£000
Company31.3.20
£000
At 1 April 181 – – –
Additions 2,414 181 – –
Received during the year (90) – – –
Change in loss allowance – – – –
At 31 March 2,505 181 – –
Contract assets are typically recognised when the Group recognises revenue on partial completion of performance obligations, ordinarily the construction and letting of buildings in its role as development manager. Receivables are recognised when the Group has an unconditional right to consideration. Cash is typically received once a building is practically complete and a large proportion of the lettable area is subject to leases; this may occur in tranches.
21. CASH AND CASH EQUIVALENTS
Group31.3.21
£000
Group31.3.20
£000
Company31.3.21
£000
Company31.3.20
£000
Cash held at managing agents 3,289 3,563 7 7
Restricted cash 72,878 7,245 81 68
Cash deposits 78,281 63,778 67,938 56,843
154,448 74,586 68,026 56,918
Restricted cash is made up of cash held by solicitors and cash in restricted bank accounts.
NOTES TO THE FINANCIAL STATEMENTSCONTINUED
22. TRADE AND OTHER PAYABLES
Group31.3.21
£000
Group31.3.20
£000
Company31.3.21
£000
Company31.3.20
£000
Trade payables 24,194 28,378 526 78
Social security costs and other taxation 1,786 1,591 – –
Amounts owed to joint ventures – – – 390
Amounts owed to subsidiary undertakings – – 143,701 178,885
Other payables 93 469 397 14
Accruals 14,023 9,277 1,269 1,627
Deferred income 6,668 6,056 – –
Current trade and other payables 46,764 45,771 145,893 180,994
Accruals – 590 – –
Non-current trade and other payables – 590 – –
Total trade and other payables 46,764 46,361 145,893 180,994
23. LEASE LIABILITY
Group31.3.21
£000
Group31.3.20
£000
Company31.3.21
£000
Company31.3.20
£000
Current lease liability 634 611 634 611
Non-current lease liability 6,929 7,563 4,740 5,374
Included within lease liability are £634,000 (31 March 2020: £611,000) of current and £4,740,000 (31 March 2020: £5,374,000) of non-current lease liabilities which relate to the long leasehold of the Group’s head office.
Finance lease obligations in respect of the Group’s leasehold properties are payable as follows:
Minimumlease payments
31.3.21£000
Interest31.3.21
£000
Present valueof minimum
lease payments 31.3.21
£000
Interest31.3.20
£000
Present valueof minimum
lease payments 31.3.20
£000
Minimumlease payments
31.3.20£000
Not later than one year 922 (31) 891 922 (40) 882
Later than one year but not more than five years 3,689 (406) 3,283 3,689 (442) 3,247
More than five years 17,342 (13,953) 3,389 18,264 (14,413) 3,851
21,953 (14,390) 7,563 22,875 (14,895) 7,980
The lease liabilities relate to the lease of the Group’s head office and to ground rents payable in respect of the head lease at 25 Charterhouse Square, London EC1 (the lease term is 155 years). The associated assets of £4,022,000 (31 March 2020: £4,543,000) and £2,147,000 (31 March 2020: £2,161,000) are shown in Note 16 and Note 14, respectively.
24. BORROWINGS
Group31.3.21
£000
Group31.3.20
£000
Company31.3.21
£000
Company31.3.20
£000
Current borrowings 5,000 – 5,000
Borrowings repayable within:
one to two years – – – –
two to three years 49,705 – – –
three to four years 286,998 37,190 – –
four to five years – 305,994 – –
Non-current borrowings 336,703 343,184 – –
Total borrowings 336,703 348,184 – 5,000
Term loans in creditors falling due within one year and after one year are secured against properties held in the normal course of business by subsidiary undertakings to the fair value of £729,425,000 (31 March 2020: £812,725,000). These will be repayable when the underlying properties are sold. Bank overdrafts and term loans exclude the Group’s share of borrowings in joint venture companies of £19,469,000 (31 March 2020: £32,754,000).
156 Helical plc Annual Report and Accounts 2021 157Helical plcAnnual Report and Accounts 2021F
INA
NC
IAL S
TAT
EM
EN
TS

25. FINANCING AND DERIVATIVE FINANCIAL INSTRUMENTSThe policies for dealing with liquidity and interest rate risk are noted in our Principal Risks on pages 55 to 59.
Borrowings maturity
Group 31.3.21
£000
Group31.3.20
£000
Due after more than one year 336,703 343,184
Due within one year – 5,000
336,703 348,184
The Group has various undrawn committed borrowing facilities. The facilities available at 31 March 2021 in respect of which all conditions precedent had been met were as follows:
Group 31.3.21
£000
Group31.3.20
£000
Expiring in one year or less 10,000 5,000
Expiring in more than one year but not more than two years – –
Expiring in more than two years but not more than three years – –
Expiring in more than three years but not more than four years 190,000 12,339
Expiring in more than four years but not more than five years – 170,000
Expiring in more than five years – –
200,000 187,339
Interest rates – Group % Expiry
Group31.3.21
£000 % Expiry
Group31.3.20
£000
Fixed rate borrowings:
swap rate plus bank margin 3.030 Apr 2024 50,000 3.030 Apr 2024 50,000
swap rate plus bank margin 2.480 Aug 2024 50,000 2.480 Aug 2024 50,000
swap rate plus bank margin 2.450 Aug 2024 50,000 2.450 Aug 2024 50,000
fixed rate plus margin 3.480 Dec 2024 71,000 3.480 Dec 2024 71,000
fixed rate plus margin 3.210 Dec 2024 9,750 3.210 Dec 2024 9,750
swap rate plus bank margin 3.370 Jun 2026 50,000 3.370 Jun 2026 50,000
Weighted average 3.149 Jan 2025 280,750 3.033 Jan 2025 280,750
Floating rate borrowings 4.242 Sep 2023 60,400 4.875 Jan 2024 73,061
Unamortised finance costs (4,447) (5,627)
Total borrowings 3.343 Jul 2024 336,703 3.393 Jul 2024 348,184
Floating rate borrowings bear interest at rates based on LIBOR.
In addition to the fixed rates, borrowings are also hedged by the following financial instruments:
Instrument – GroupValue £000 % Start Expiry
Current:
cap 35,000 1.750 Jul 2018 Jul 2023
cap 35,000 1.750 Aug 2018 Jul 2023
cap 35,000 1.750 Aug 2018 Jul 2023
cap 50,000 1.750 Feb 2019 Apr 2024
floor 50,000 0.830 Feb 2019 Apr 2024
cap 22,500 1.750 Nov 2019 Jul 2021
cap 22,500 1.750 Nov 2019 Jul 2021
cap 40,000 1.750 Jan 2020 Jul 2023
At 31 March 2021 the Company had no interest rate swaps, caps or floors (31 March 2020: nil).
Net gearing
Group 31.3.21
£000
Group31.3.20
£000
Total borrowings 336,703 348,184
Cash (154,448) (74,586)
Net borrowings 182,255 273,598
NOTES TO THE FINANCIAL STATEMENTSCONTINUED
Net borrowings excludes the Group’s share of borrowings in joint ventures of £19,469,000 (31 March 2020: £32,754,000) and cash of £7,781,000 (31 March 2020: £7,821,000). All borrowings in joint ventures are secured.
Group 31.3.21
£000
Group31.3.20
£000
Net assets 608,161 598,689
Gearing 30% 46%
26. SHARE CAPITAL
31.3.21£000
31.3.20£000
Authorised 39,577 39,577
The authorised share capital of the Company is £39,576,626.60 divided into ordinary shares of 1p each and deferred shares of 1/8p each.
Allotted, called up and fully paid:31.3.21
£00031.3.20
£000
121,265,710 (31 March 2020: 119,977,581) ordinary shares of 1p each 1,213 1,200
212,145,300 deferred shares of 1/8p each 265 265
1,478 1,465
Shares in issue 31.3.21
Number
Share capital 31.3.21
£000
Shares in issue 31.3.20
Number
Share capital 31.3.20
£000
Ordinary shares
At 1 April 119,977,581 1,200 119,363,349 1,194
Issued share capital 1,288,129 13 614,232 6
At 31 March 121,265,710 1,213 119,977,581 1,200
Deferred sharesAt 1 April and 31 March 212,145,300 265 212,145,300 265
CAPITAL MANAGEMENTThe Group’s capital management objectives are:
• to ensure the Group’s ability to continue as a going concern; and
• to provide an adequate return to Shareholders.
The Group sets the amount of capital in proportion to its overall financing structure. It manages the capital structure and makes adjustments to it in the light of changes in economic conditions and the risk characteristics of the underlying assets. In order to maintain or adjust the capital structure, the Group may adjust the amount of dividends paid to Shareholders, return capital to Shareholders, issue new shares, or sell assets to reduce debt. Capital is defined as being issued share capital, share premium, retained earnings, revaluation reserve and other reserves (2021: £600,683,000, 2020: £591,211,000). The Group continually monitors its gearing level to ensure that it is appropriate. Gearing decreased from 46% to 30% in the year as the Group disposed of property during the year.
The deferred shares were issued on 23 December 2004 to those Shareholders electing to receive a dividend, rather than a capital repayment or further shares in the Company, as part of the Return of Cash approved by Shareholders on 20 December 2004. The deferred shares carry no voting rights and have no right to a dividend or capital payment in the event of a winding up of the Company.
The Company’s Articles of Association give the Company irrevocable authority to purchase all or any of the deferred shares for a maximum aggregate total of 1 penny for all deferred shares in issue on the date of such purchase.
27. SHARE OPTIONSAt 31 March 2021 and 31 March 2020 there were no unexercised options over new ordinary 1p shares in the Company.
158 Helical plc Annual Report and Accounts 2021 159Helical plcAnnual Report and Accounts 2021F
INA
NC
IAL S
TAT
EM
EN
TS

28. SHARE-BASED PAYMENTSThe Group provides share-based payments to employees in the form of Performance Share Plan (PSP) awards and a Share Incentive Plan. The Group uses a combination of the Black-Scholes and stochastic valuation models and the resulting value is amortised through the Consolidated Income Statement over the vesting period of the share-based payments. Details of the performance criteria are set out on page 109.
Performance Share Plan awards Awards
2021Weighted
average award value Awards
2020Weighted
average award value
Outstanding at beginning of year 3,779,873 332p 3,663,102 319p
Awards vested during year (930,334) 271p (372,108) 322p
Awards lapsed during the year (482,913) 271p (744,217) 322p
Awards made during the year 1,273,176 342p 1,233,096 363p
Outstanding at end of year 3,639,802 359p 3,779,873 332p
All awards have an exercise price of £nil (2020: £nil).
The weighted average share price at the date of exercise for the share options exercised during the year was 358.5p (2020: 362.5p).
The PSP awards outstanding at 31 March 2021 had a weighted average remaining contractual life of one year and two months.
The fair value of the awards made in the year to 31 March 2021 was £3,776,000 (2020: £3,961,000). These were granted on 10 June 2020.
The inputs into the Black-Scholes and stochastic models of valuation of the PSP awards made in the year to 31 March 2021 were as follows:
2021 2020 2019
Weighted average share price 342.0p 362.5p 375.0p
Weighted average exercise price – – –
Expected volatility 35% 30% 30%
Expected life 3 years 3 years 3 years
Risk free rate –0.04% 0.52% 0.65%
Expected dividends 0.00% 0.00% 0.00%
The Group recognised a charge of £2,031,000 (2020: £2,814,000) during the year in relation to share-based payments.
Volatility is measured by calculating the standard deviation of the natural logarithm of share price movements for the period prior to the date of grant which is commensurate with the remaining length of the performance period.
At the Balance Sheet date there were no exercisable awards. There is a two-year holding period for vested awards.
NOTES TO THE FINANCIAL STATEMENTSCONTINUED
29. CHANGES IN LIABILITIES ARISING FROM FINANCING ACTIVITIESThe table below details changes in the Group’s liabilities from financing activities, including both cash and non-cash changes. Liabilities arising from financing activities are those whose cash flows were, or future cash flows will be, classified in the Consolidated and Company Cash Flow Statements as cash flows from financing activities.
BorrowingsGroup
£000Company
£000
At 31 March 2019 425,282 98,767
Financing cash flows (75,891) (95,000)
Fair value movement of Convertible Bond (468) –
Other changes (739) 1,233
At 31 March 2020 348,184 5,000
Financing cash flows (12,661) (5,000)
Other changes 1,180 –
At 31 March 2021 336,703 –
Financing cash flows comprise borrowings drawn down and repaid in the Consolidated and Company Cash Flow Statements. Other changes include the rolling up of interest and the change in unamortised refinancing costs.
30. CONTINGENT LIABILITIESThe Company has entered into cross guarantees in respect of the banking facilities of its subsidiaries. These are not considered to have a material value.
There were no other contingent liabilities at 31 March 2021 for the Group or the Company (31 March 2020: £nil).
31. CAPITAL COMMITMENTSThe Group has a commitment of £4,400,000 (31 March 2020: £19,600,000) in relation to development contracts which are due to be completed in the year to March 2022. A further £45,600,000 (31 March 2020: £1,500,000) relates to the Group’s share of commitments in joint ventures.
32. POST BALANCE SHEET EVENTSThere were no material post balance sheet events.
33. NET ASSETS PER SHARE
At 31 March
2021£000
Numberof shares
000 pence
At31 March
2020£000
Number of shares
000 pence
IFRS net assets 608,161 121,266 598,689 119,978
Adjustments:
deferred shares (265) (265)
Basic net asset value 607,896 121,266 501 598,424 119,978 499
share settled bonus 718 973
dilutive effect of the Performance Share Plan 1,519 1,306
Diluted net asset value 607,896 123,503 492 598,424 122,257 489
Adjustments:
fair value of financial instruments 7,431 10,368
deferred tax 18,348 15,668
fair value of land and developments 578 578
real estate transfer tax 56,877 61,607
EPRA net reinstatement value 691,130 123,503 560 686,645 122,257 562
real estate transfer tax (24,862) (46,221)
deferred tax (7,605) –
EPRA net tangible asset value 658,663 123,503 533 640,424 122,257 524
real estate transfer tax (32,015) (15,386)
deferred tax 7,605 –
EPRA net asset value 634,253 123,503 514 625,038 122,257 511
160 Helical plc Annual Report and Accounts 2021 161Helical plcAnnual Report and Accounts 2021F
INA
NC
IAL S
TAT
EM
EN
TS

33. NET ASSETS PER SHARE CONTINUED
At 31 March
2021£000
Numberof shares
000 pence
At31 March
2020£000
Number of shares
000 pence
Diluted net assets 607,896 123,503 492 598,424 122,257 489
Adjustments:
surplus on fair value of stock 578 578
fair value of fixed rate loan (9,622) (12,481)
EPRA net disposal value/EPRA triple net asset value 598,852 123,503 485 586,521 122,257 480
The net asset values per share have been calculated in accordance with guidance issued by the European Public Real Estate Association (“EPRA”).
The adjustments to the net asset value comprise the amounts relating to the Group and its share of joint ventures.
The calculation of EPRA net tangible asset value includes a real estate transfer tax adjustment which adds back the benefit of the saving of the purchaser’s costs that Helical expects to receive on the sale of the corporate vehicle that owns the building, rather than a direct asset sale.
The calculation of EPRA net disposal value/triple net asset value per share reflects the fair value of all the assets and liabilities of the Group at 31 March 2021. One of the loans held by the Group is at a fixed rate and therefore not at fair value. The adjustment of £9,622,000 (2020: £12,481,000) is the increase from book to fair value.
34. RELATED PARTY TRANSACTIONSAt 31 March 2021 and 31 March 2020 the following amounts were due from the Group’s joint ventures:
31.3.21£000
31.3.20£000
King Street Developments (Hammersmith) Limited – 71
Shirley Advance LLP 8 7
Barts Square companies 16 61
Old Street Holdings LP 3 3
Charterhouse Street Limited 400 200
In the year, interest on bonds of £nil (2020: £745,000) and a promote fee for development management services of £nil (2020: £305,000) were charged by the Group to Creechurch Place Limited. A development management, accounting and corporate services fee of £50,000 (2020: £1,119,000) was charged by the Group to the Barts Square companies. In addition, a development management, accounting and corporate services fee of £850,000 (2020: £243,000) was charged by the Group to the Charterhouse Place Limited group.
All balances are repayable on demand. No provisions have been recognised in respect of amounts owed from joint ventures.
At 31 March 2021 and 31 March 2020 there were the following balances between the Company and its subsidiaries:
31.3.21£000
31.3.20£000
Amounts due from subsidiaries 293,223 299,893
Amounts due to subsidiaries 143,701 178,885
Management charges relate to the performance of management services for the Company or its subsidiaries. Interest receivable relates to interest on loans made by the Company to its subsidiaries. All of these transactions, and the Balance Sheet date amounts arising from these transactions, were conducted on an arm’s length basis and on normal commercial terms. Amounts owed by subsidiaries to the Company are identified in Note 20. Amounts owed to subsidiaries by the Company are identified in Note 22.
The Group considers that key management personnel are the Directors. The compensation paid or payable to key management is:
31.3.21£000
31.3.20£000
Salaries and other short-term employee benefits 3,347 2,113
Share-based payments 2,785 5,233
6,132 7,346
The total dividends paid to Directors of the Group in the year were £374,639 (2020: £381,355).
NOTES TO THE FINANCIAL STATEMENTSCONTINUED
35. FINANCIAL INSTRUMENTSCATEGORIES OF FINANCIAL INSTRUMENTSFinancial assets in the Group include derivative financial assets and available-for-sale assets which are designated as “Fair value through the Profit or Loss”. Financial assets also include trade and other receivables and cash and cash equivalents, all of which are included within financial assets measured at amortised cost.
Financial liabilities classed as “Fair value through the Profit or Loss” include derivatives and those liabilities designated as such. Financial liabilities also include secured bank loans and overdrafts, trade and other payables and provisions, all of which are classified as financial liabilities at amortised cost.
FINANCIAL ASSETS AND LIABILITIES BY CATEGORYThe financial instruments of the Group as classified in the financial statements can be analysed under the following categories.
Financial assets
Group 31.3.21
£000
Group31.3.20
£000
Company31.3.21
£000
Company31.3.20
£000
Measured at amortised cost 190,278 110,982 361,333 357,037
Fair value through the Profit or Loss 171 86 – –
Total financial assets 190,449 111,068 361,333 357,037
These financial assets are included in the Balance Sheet within the following headings:
Balance Sheet
Group31.3.21
£000
Group31.3.20
£000
Company31.3.21
£000
Company31.3.20
£000
Trade and other receivables 35,830 36,396 293,307 300,119
Cash and cash equivalents 154,448 74,586 68,026 56,918
Derivative financial asset 171 86 – –
Total financial assets 190,449 111,068 361,333 357,037
Financial assets are stated in accordance with IAS 32 Financial Instruments: Presentation.
The carrying value of the trade and other receivables and cash and cash equivalents is not deemed to be materially different from the fair value.
Financial liabilities
Group31.3.21
£000
Group31.3.20
£000
Company31.3.21
£000
Company31.3.20
£000
Fair value through the Profit or Loss 7,635 10,879 – –
Measured at amortised cost 383,198 394,649 151,267 191,979
Total financial liabilities 390,833 405,528 151,267 191,979
The financial liabilities are included in the Balance Sheet within the following headings:
Group31.3.21
£000
Group31.3.20
£000
Company31.3.21
£000
Company31.3.20
£000
Trade and other payables 38,966 38,715 145,893 180,994
Borrowings – current – 5,000 – 5,000
Borrowings – non-current 336,703 343,184 – –
Long leasehold liability 7,563 8,174 5,374 5,985
Derivative financial instruments 7,601 10,455 – –
Total financial liabilities 390,833 405,528 151,267 191,979
162 Helical plc Annual Report and Accounts 2021 163Helical plcAnnual Report and Accounts 2021F
INA
NC
IAL S
TAT
EM
EN
TS

35. FINANCIAL INSTRUMENTS CONTINUEDFINANCIAL ASSETS AND LIABILITIES BY CATEGORY CONTINUEDThe carrying value of trade and other payables and borrowings is not deemed to be materially different from the fair value, other than for one fixed rate loan, whose fair value is £9,622,000 (31 March 2020: £12,481,000) greater than its carrying value. Financial liabilities are stated in accordance with IAS 32 Financial Instruments: Presentation.
The Group and Company financial instruments that are measured subsequent to initial recognition at fair value are interest rate swaps, caps and floors, and those designated on initial recognition.
Interest rate swaps, caps and floors are measured at the present value of future cash flows estimated and discounted based on the applicable yield curves derived from quoted interest rates.
IFRS 13 categorises financial assets and liabilities as being valued in three hierarchical levels:
Level 1: values are unadjusted quoted prices in active markets for identical assets or liabilities;
Level 2: values are derived from observing market data; and
Level 3: values cannot be derived from observable market data.
Assets and liabilities measured at fair value are classified as below:
Level 1 None
Level 2 Derivative financial instruments (Note 35)
Level 3 Investment property (Note 14)
There were no transfers between categories in the current or prior year.
Derivative financial instruments
Group31.3.21
£000
Group31.3.20
£000
Company31.3.21
£000
Company31.3.20
£000
Interest rate caps 115 86 – –
Interest rate floors (910) (1,036) – –
Interest rate swaps (6,635) (9,419) – –
(7,430) (10,369) – –
The Group’s movement in the fair value of the derivative financial instruments in the year was a gain of £2,938,000 (2020: £7,651,000) due to interest rate caps, floors and swaps.
CREDIT RISKCredit risks arise from the possibility that customers may not be able to settle their obligations as agreed. To manage this risk the Group periodically assesses the financial reliability of customers, taking into account their financial position, past experience and other factors. It is Group policy to assess the financial viability of potential tenants where their rent roll is individually significant before entering into lease agreements. This review involves the latest available set of financial statements, other publicly available financial information and management accounts where appropriate. The covenant strength of each tenant is determined based on this information and a deposit or guarantee is sought if necessary. The Group’s tenants are spread across a wide variety of industries, reducing the Group’s risk to any individual industry. The Group works closely with its agents, who advise where a loss allowance is required for individual tenants, based on their credit control procedures.
Credit risk also exists due to cash and cash equivalents and deposits with banks and other financial institutions. The cash is held with reputable banking institutions and in client accounts with solicitors and managing agents and therefore credit risk is considered low.
As at 31 March 2021 the Group had total credit risk exposure, excluding cash, of £35,830,000, all of which is financial assets held at amortised cost. The quantitative disclosures of trade and other receivables credit risk is shown in Note 20.
The Group has a small number of other debtors that are financial assets. Each is considered on an individual basis and involves the Group’s detailed knowledge of the counterparties involved in order to assess the likelihood of non-recoverability. All these debtors are deemed to be recoverable.
The amounts owed to the Company are considered on an individual basis by assessing the subsidiaries’ and joint ventures’ ability to repay the debt at the point at which it is repayable. The Group considers the net assets of the debtor, taking into account any potential uplifts to fair value of investments, land and developments in making its assessment.
The Group is not reliant on any major customer for its ability to continue as a going concern.
NOTES TO THE FINANCIAL STATEMENTSCONTINUED
LIQUIDITY RISKLiquidity risk is defined as the risk that the Group would not be able to settle or meet its obligations on time or at a reasonable price.
Liquidity and funding risks, related processes and policies are overseen by management.
The Group manages its liquidity risk on a consolidated basis based on business needs, tax, capital or regulatory considerations, if applicable, and through numerous sources of finance in order to maintain flexibility. Management monitors the Group’s net liquidity position through rolling forecasts on the basis of expected cash flows. The Group’s cash and cash equivalents are held with major regulated financial institutions and the Directors regularly monitor the financial institutions that the Group uses to ensure its exposure to liquidity risk is minimised.
For further information on debt facilities, see Notes 24 and 25.
The maturity profile of the Group’s contracted financial liabilities is as follows:
Group31.3.21
£000
Group31.3.20
£000
Company31.3.21
£000
Company31.3.20
£000
Payable within 3 months 39,546 70,664 144,558 185,808
Payable between 3 months and 1 year 11,655 14,446 614 614
Payable between 1 and 3 years 70,883 23,629 1,637 1,637
Payable after 3 years 294,870 363,830 6,955 6,955
Total contracted liabilities 416,954 472,569 153,764 195,014
At 31 March 2021 the Group had £200,000,000 (31 March 2020: £187,339,000) of undrawn borrowing facilities, £28,080,000 (31 March 2020: £69,780,000) of uncharged property assets and cash balances of £154,448,000 (31 March 2020: £74,586,000). The above contracted liabilities assume that no loans are extended beyond their current facility expiry date. Management believes that these facilities, together with anticipated sales and the renewal of some of these loan facilities, mean that the Group can meet its contracted liabilities as they fall due.
MARKET RISKThe Group is exposed to market risk, primarily related to interest rates, foreign currency exchange movements, the market value of the investments and accrued development profits. The Group actively monitors these exposures.
INTEREST RATE RISKIt is the Group’s policy and practice to minimise interest rate cash flow exposures on long-term financing. The Group does this by using a number of derivative financial instruments including interest rate swaps and interest rate caps and floors. The purpose of these derivatives is to manage the interest rate risks arising from the Group’s sources of finance. The Group does not use financial instruments for speculative purposes.
Details of financing and financial instruments can be found in Note 25.
In the year to 31 March 2021, if interest rates had moved by 0.5%, this would have resulted in the following movement to net profits and equity due to movements in interest charges and mark-to-market valuations of derivatives.
Group impacton results
31.3.21 £000
Group impacton equity
31.3.21 £000
Company impact on results
31.3.21 £000
Company impact on equity
31.3.21 £000
0.5% increase – increase in net results and equity 6,832 6,832 227 227
0.5% decrease – decrease in net results and equity (4,908) (4,908) (227) (227)
FOREIGN CURRENCY EXCHANGE RISKThe Group and Company have no material exposure to movements in foreign currency rates.
164 Helical plc Annual Report and Accounts 2021 165Helical plcAnnual Report and Accounts 2021F
INA
NC
IAL S
TAT
EM
EN
TS

Ordinarily, the Group return includes both fixed and variable consideration. These constitute the transaction price. Variable consideration is estimated as the amount of consideration to which the Group would be entitled in exchange for transferring goods or services. This is done on an expected value basis. This estimate is constrained to the extent that it is highly probable that a significant reversal of the amount of revenue recognised will not occur when the uncertainty is removed.
The fixed and variable consideration are allocated to the relevant performance obligations in proportion to their estimated stand-alone selling prices. Revenue is recognised either over time or at a point in time, depending on the terms of the contract. The proportion of the transaction price allocated to construction is recognised at any given reporting date in proportion to the costs certified to date as a percentage of the total expected construction costs. The proportion of the transaction price allocated to the letting of the property is recognised at any given reporting date in proportion to the area subject to leases as a percentage of the total lettable space.
Investment incomeRevenue in respect of investment and other income represents investment income, fees and commissions earned on an accruals basis and the fair value of the consideration received/receivable on investments held for the short term. Dividends are recognised when the Shareholders’ right to receive payment has been established. Interest income is accrued on a time basis, by reference to the principal outstanding and the effective interest rate.
Deferred incomeMoney received in advance of the provision of goods or services is held in the balance sheet until the income can be recognised in the Income Statement.
SHARE-BASED PAYMENTSThe Group provides share-based payments in the form of Performance Share Plan awards and a Share Incentive Plan. These payments are discussed in greater detail in the Directors’ Remuneration Report on pages 103 to 125. The fair values of share-based payments related to employees’ service are determined indirectly by reference to the fair value of the related instrument at the grant date. The Group uses a combination of the Black-Scholes and stochastic valuation models and the resulting value is amortised through the Income Statement over the vesting period of the share-based payments.
For the Performance Share Plan and Share Incentive Plan awards, where market conditions apply, the expense is allocated to the Income Statement evenly over the vesting period.
For the Performance Share Plan and Share Incentive Plan awards, where non-market conditions apply, the expense is allocated, over the vesting period, to the Income Statement based on the best available estimate of the number of awards that are expected to vest. Estimates are subsequently revised if there is any indication that the number of awards expected to vest differs from previous estimates.
The amount charged to the Income Statement is credited to the Retained Earnings reserve.
36. PRINCIPAL ACCOUNTING POLICIESBASIS OF CONSOLIDATIONThe Group Financial Statements consolidate those of Helical plc (the “Company”) and all of its subsidiary undertakings (together the “Group”) drawn up to 31 March 2021. Subsidiary undertakings are entities for which the Group has power over the investee, is exposed to or has the rights to variable returns and has the ability to control those returns. Subsidiaries are accounted for under the purchase method and are held in the Company balance sheet at cost and reviewed annually for impairment.
Joint ventures are entities whose economic activities are contractually controlled jointly by the Group and by other ventures independent of the Group, where both parties are exposed to variable returns but neither has control over those returns. This exists where unanimous agreement of the investee’s relevant activities is required. They are accounted for using the equity method of accounting, whereby the Group’s share of profit after tax in the joint venture is recognised in the Consolidated Income Statement (“Income Statement”) and the Group’s share of the joint venture’s net assets are incorporated in the Consolidated balance sheet.
The Company’s cost of investment in joint ventures less any provision for permanent impairment loss is shown in the Company balance sheet.
Intra-group balances and any unrealised gains on transactions between the Company and its subsidiaries and between subsidiaries are eliminated. Unrealised losses are also eliminated unless the transaction provides evidence of an impairment of the asset transferred.
The Consolidated Financial Statements are presented in sterling which is also the functional currency of the Parent Company.
REVENUE RECOGNITIONRental incomeRental income receivable is recognised in the Income Statement on a straight-line basis over the lease term. Any incentive for lessees to enter into a lease agreement and any costs associated with entering into the lease are spread over the same period.
Sale of goodsAssets, such as trading properties, development sites and completed developments, are regarded as sold at the point at which the customer has control of the goods. This occurs on completion of the contract for sale. Measurements of revenue arising from the sale of such assets are derived from the transaction price as determined by IFRS 15 Revenue from Contracts with Customers.
Construction contracts and development management servicesThe Group has contracts to develop and let properties for third parties. Where two or more contracts are entered into at or near the same time with the same customer, the contracts are combined and accounted for as a single contract. An arrangement may involve the construction and letting of a third party property or the sale and subsequent construction and letting of a property. The construction and letting of a property are considered to be separate performance obligations. Where an arrangement also involves the sale of an asset, this is an additional distinct performance obligation. The initial sale of a site to a customer is recognised as a sale of goods in accordance with IFRS 15, where the sale of land is not conditional on the construction of the buildings and is not reversible in the event that the building is not constructed.
NOTES TO THE FINANCIAL STATEMENTSCONTINUED
DEPRECIATIONIn accordance with IAS 40 Investment Property, depreciation is not provided for on freehold investment properties or on leasehold investment properties. The Group does not own the freehold land and buildings which it occupies. Costs incurred in respect of leasehold improvements to the Group’s head office at 5 Hanover Square, London W1S 1HQ are capitalised and held as short-term leasehold improvements. Leasehold improvements, plant and equipment are stated at cost less accumulated depreciation and any recognised impairment loss. Residual values are reassessed annually.
Depreciation is charged so as to write off the cost of assets less residual value, over their estimated useful lives, using the straight-line method, on the following basis:
Short leasehold improvements – Over the term of the lease
Plant and equipment – 25%
TAXATIONThe taxation charge represents the sum of tax currently payable and deferred tax. The charge for current taxation is based on the results for the year as adjusted for items which are non-assessable or disallowed. It is calculated using rates that have been enacted or substantively enacted by the balance sheet date. Tax payable upon realisation of revaluation gains recognised in prior periods is recorded as a current tax charge with a release of the associated deferred taxation.
Deferred tax is the tax expected to be payable or recoverable on differences between the carrying amounts of assets and liabilities in the financial statements and the corresponding tax bases used in the computation of taxable profit and is accounted for using the balance sheet liability method.
Deferred tax liabilities are generally recognised for all taxable timing differences and deferred tax assets are recognised to the extent that it is probable that taxable profits will be available against which deductible timing differences can be utilised. The measurement of deferred tax assets and liabilities reflects the tax consequences of the manner in which the Group expects, at the balance sheet date, to recover or settle the carrying amount of those assets and liabilities. Such assets and liabilities are not recognised if the timing differences arise from the initial recognition of goodwill or from the initial recognition (other than in a business combination) of other assets and liabilities in a transaction that affects neither the tax profit nor the accounting profit.
The carrying amount of deferred tax assets is reviewed at each balance sheet date and reduced to the extent that it is no longer probable that sufficient taxable profits will be available to allow all or part of the assets to be recovered.
The deferred tax asset relating to share-based payment awards reflects the estimated value of tax relief available on the vesting of the awards at the balance sheet date.
Deferred tax is determined using tax rates that have been enacted or substantively enacted by the balance sheet date and are expected to apply when the related deferred tax asset is realised or the deferred tax liability is settled. It is recognised in the Income Statement except when it relates to items credited or charged directly to equity, in which case the deferred tax is also dealt with in equity.
The Group recognises a deferred tax liability for all taxable timing differences associated with investments in subsidiaries, associates and interests in joint ventures, except to the extent that both of the following conditions are satisfied:
a) the Group is able to control the timing of the reversal of the timing difference; and
b) it is probable that the timing difference will not reverse in the foreseeable future.
DIVIDENDSDividend distributions to the Company’s Shareholders are recognised as a liability in the financial statements in the period in which dividends are approved.
INVESTMENT PROPERTIESInvestment properties are properties owned or leased by the Group which are held for long-term rental income and for capital appreciation. Investment properties are initially recognised at cost, including associated transaction costs, and subsequently at fair value adjusted for the carrying value of lease incentive and letting cost receivables. These fair values are based on market values as determined by professionally qualified external valuers or are determined by the Directors of the Group based on their knowledge of the property. In accordance with IAS 40 Investment Property, investment properties held under leases are stated gross of the recognised finance lease liability.
Gains or losses arising from changes in the fair value of investment properties are recognised as gains or losses on revaluation in the Income Statement of the period in which they arise.
In accordance with IAS 40, as the Group uses the fair value model, no depreciation is provided in respect of investment properties including integral plant.
Property that is being constructed or developed for future use as an investment property is treated as investment property in accordance with IAS 40.
When the Group redevelops an existing investment property for continued future use as investment property, the property remains an investment property measured at fair value and is not reclassified. Interest is capitalised before tax relief until the date of practical completion.
Details of the valuation of investment properties can be found in Note 14.
Investment properties are derecognised on completion of sale.
Included in investment property are right of use assets relating to leasehold investment property.
LAND AND DEVELOPMENTSLand and developments held for sale are inventory and are included in the balance sheet at the lower of cost and net realisable value. Net realisable value is the estimated selling price in the ordinary course of business less estimated costs to completion and estimated costs necessary to make the sale.
Gross borrowing costs associated with expenditure on properties under development or undergoing major refurbishment are capitalised. The interest capitalised is either based on the interest paid (where a project has a specific loan) or calculated using the Group’s weighted average cost of borrowings (where there are no specific borrowings for the project). Interest is capitalised from the date of commencement of the development work until date of practical completion.
166 Helical plc Annual Report and Accounts 2021 167Helical plcAnnual Report and Accounts 2021F
INA
NC
IAL S
TAT
EM
EN
TS

DERIVATIVE FINANCIAL INSTRUMENTSDerivative financial assets and financial liabilities are recognised on the balance sheet when the Group becomes a party to the contractual provisions of the instrument.
The Group enters into derivative transactions such as interest rate swaps, caps and floors in order to manage the risks arising from its activities. Derivatives are initially recorded at fair value and are subsequently remeasured to fair value based on market prices, estimated future cash flows and forward rates as appropriate. Any change in the fair value of such derivatives is recognised immediately in the Income Statement.
Financial assets are derecognised when the contractual rights to the cash flows from the financial asset expire, or when the financial asset and substantially all the risks and rewards are transferred. A financial liability is derecognised when it is extinguished, discharged, cancelled or expires.
Further information on the categorisation of financial instruments can be found in Note 35.
LEASESThe Group has leases for which it must account from the position of both a lessee and a lessor.
Group as lessee The Group assesses whether a contract is, or, contains a lease, at inception of a contract based on whether the contract conveys the right to control the use of an identified asset for a period of time in exchange for consideration.
The Group has also elected to apply the following practical expedients:
• to account for each lease component and any non-lease components as a single arrangement;
• the exemption not to recognise right-of-use assets and lease liabilities for short-term leases that have a lease term of 12 months or less; and
• leases of low value assets.
The lease payments associated with these leases are recognised as an expense on a straight-line basis over the lease term.
The Group recognises a right-of-use asset and a lease liability at the lease commencement date. The lease liability is initially measured at the present value of the lease payments that are not paid at the commencement date, discounted using the interest rate implicit in the lease or, if that rate cannot be readily determined, the Group’s incremental borrowing rate. Generally, the Group uses its incremental borrowing rate as the discount rate.
The lease liability is subsequently measured at amortised cost using the effective interest method. It is remeasured when there is a change in future lease payments arising from a change in an index or rate, if there is a change in the Group’s estimate of the amount expected to be payable under a residual value guarantee, or if the Group changes its assessment of whether it will exercise a purchase, extension or termination option.
36. PRINCIPAL ACCOUNTING POLICIES CONTINUEDHELD FOR SALE INVESTMENTSInvestments are defined as held for sale when the Group intends to sell the investment and if sale is highly probable. Such held for sale investments are measured at the lower of their carrying amounts immediately prior to their classification as held for sale and their fair value less costs to sell.
FINANCIAL ASSETSFinancial assets do not carry any interest and are stated initially at fair value and subsequently at amortised cost as reduced by appropriate loss allowances. The loss allowance is based on the lifetime expected credit losses, if the credit risk of a receivable has increased significantly since initial recognition. This is reduced to 12 months where the credit risk has not increased significantly. The Group derecognises a financial asset when the contractual rights to the cash flows from the asset expire or on transfer of the asset and of the associated risks and rewards to another party.
CASH AND CASH EQUIVALENTSCash and cash equivalents are carried in the balance sheet at amortised cost. For the purposes of the cash flow statement, cash and cash equivalents comprise cash in hand, deposits with banks, cash held at solicitors, cash in blocked accounts and other short-term, highly liquid investments with original maturities of three months or less.
TRADE AND OTHER PAYABLESTrade and other payables are not interest bearing and are initially recognised at fair value and subsequently at amortised cost. The Group derecognises trade and other payable liabilities when they are extinguished, which occurs when the obligation associated with the liability is discharged, cancelled or expires.
BORROWING AND BORROWING COSTSInterest bearing bank loans and overdrafts are initially recorded at fair value, net of finance and other costs yet to be amortised, in accordance with IFRS 9, and subsequently at amortised cost. Embedded derivatives contained within the borrowing agreements are treated in accordance with IFRS 9, which includes consideration of whether embedded derivatives require bifurcation.
Convertible Bonds are designated as fair value through the profit and loss and so are presented on the balance sheet at fair value, with all gains and losses, including the write-off of issuance costs, recognised in the Income Statement. The interest charge in respect of the coupon rate on the Bonds has been recognised within finance costs on an accruals basis.
Borrowing costs directly attributable to the acquisition and construction of new developments and investment properties are added to the costs of such properties until the date of completion of the development or investment. After initial recognition borrowings are carried at amortised cost.
Gains or losses on extinguishing debt are recognised in the Income Statement in the period in which they occur.
NOTES TO THE FINANCIAL STATEMENTSCONTINUED
When the lease liability is remeasured in this way, a corresponding adjustment is made to the carrying amount of the right-of-use asset, or is recorded in profit or loss if the carrying amount of the right-of-use asset has been reduced to zero.
The lease liability is presented as a separate line in the Consolidated and Company balance sheets. The right-of-use asset is initially measured at the initial amount of the lease liability adjusted for any lease payments made at or before the commencement date.
The assets are depreciated to the earlier of the end of the useful life of the right-of-use asset or the lease term using the straight-line method. The lease term includes periods covered by an option to extend if the Group is reasonably certain to exercise that option.
In addition, the right-of-use asset is periodically reduced by impairment losses, if any, and adjusted for certain remeasurements of the lease liability. This will be assessed annually in line with IAS 36: Impairment of Assets.
Group as lessorLeases to tenants where substantially all the risks and rewards of ownership are retained by the Group as the lessor are classified as operating leases. Payments made under operating leases, including prepayments, and net of any incentives provided by the Group, are charged to the Income Statement on a straight-line basis over the period of the lease.
NET ASSET VALUES PER SHARENet asset values per share have been calculated in accordance with the best practice recommendations of the European Public Real Estate Association (“EPRA”).
EARNINGS PER SHAREEarnings per share have been calculated in accordance with IAS 33 Earnings per Share and the best practice recommendations of EPRA.
USE OF JUDGEMENTS AND ESTIMATESTo be able to prepare accounts according to the accounting principles, management must make estimates and assumptions that affect the assets and liabilities and revenue and expense amounts recorded in the financial statements. These estimates are based on historical experience and other assumptions that management and the Board of Directors believe are reasonable under the particular circumstances. The results of these considerations form the basis for making judgements about the carrying value of assets and liabilities that are not readily available from other sources.
Areas requiring the use of critical judgement and estimates that may significantly impact the Group’s earnings and financial position are:
SIGNIFICANT JUDGEMENTSThe key areas are discussed below:
• Consideration of the nature of joint arrangements. In the context of IFRS 10 Consolidated Financial Statements, this involves consideration of where the control lies and whether either party has the power to vary its returns from the arrangements. In particular, significant judgement is exercised where the shareholding of the Group is not 50% (Note 18).
KEY SOURCES OF ESTIMATION UNCERTAINTYThe key areas are discussed below:
• Determination of the most appropriate percentage interest level at which to recognise our share of joint ventures, where our economic interest can differ to our ownership interest (see Note 18). Under the Barts Square joint venture agreement, the Group is entitled to varying returns dependent upon the performance of the development. Whilst the Group holds a 33.3% legal share in the Barts Square group, it has accounted for its share at 47.0% to reflect its expected economic interest in the joint venture. There are several estimates that contribute to this expected economic interest, the most sensitive of which is the estimated sales price of the residential units. If the estimated sales prices were 20% lower, the Group’s economic interest would fall by 0.1% (with a net asset decrease of £50,000), whilst an increase of 10% would result in a rise of its economic interest of 1.8% (with a net asset increase of £900,000); and
• Valuation of investment properties. Discussion of the sensitivity of these valuations to changes in the equivalent yields and rental values is included in Note 14.
168 Helical plc Annual Report and Accounts 2021 169Helical plcAnnual Report and Accounts 2021F
INA
NC
IAL S
TAT
EM
EN
TS

NOTES TO THE FINANCIAL STATEMENTSCONTINUED
37. SUBSIDIARY AND RELATED UNDERTAKINGSThe Company’s subsidiary and related undertakings are listed below. Except where otherwise indicated all undertakings are incorporated, registered and operate in the United Kingdom at 5 Hanover Square, London, W1S 1HQ.
The share capital of each of the companies, where applicable, is comprised of ordinary shares unless otherwise stated.
Company Direct/Indirect Ultimate %
ACTIVE SUBSIDIARIES1 207 OLD STREET UNIT TRUST 1 Indirect 100%*
2 211 OLD STREET UNIT TRUST 1 Indirect 100%*
3 AYCLIFFE & PETERLEE INVESTMENT COMPANY LIMITED Direct 100%
4 BAYLIGHT DEVELOPMENTS LIMITED Indirect 100%
5 CPP INVESTMENTS LIMITED Indirect 100%
6 EMBANKMENT PLACE (LP) LIMITED 4 Direct 100%
7 FARRINGDON EAST (JERSEY) LIMITED 1 Indirect 100%
8 G2 ESTATES LIMITED Direct 100%
9 HB SAWSTON NO 3 LIMITED Direct 100%
10 HELICAL (CHART) LIMITED Direct 100%
11 HELICAL (CHURCHGATE) LIMITED Indirect 100%
12 HELICAL (CS HOLDINGS) JERSEY LIMITED 1 Direct 100%
13 HELICAL (CS) JERSEY LIMITED 1 Indirect 100%
14 HELICAL (DALE HOUSE) LIMITED Direct 100%
15 HELICAL (LB) LIMITED Direct 100%
16 HELICAL (NQ) LIMITED Direct 100%
17 HELICAL (OS HOLDCO) JERSEY LIMITED 1 Indirect 100%
18 HELICAL (POWER ROAD) LIMITED Direct 100%
19 HELICAL (SHEPHERDS) LIMITED Indirect 100%
20 HELICAL (TELFORD) LIMITED Direct 100%
21 HELICAL (WHITECHAPEL) LIMITED Indirect 100%
22 HELICAL BAR (DRURY LANE) LIMITED Direct 100%
23 HELICAL BAR (JERSEY) LIMITED 1 Direct 100%
24 HELICAL BAR (ST VINCENT STREET) LIMITED Direct 100%
25 HELICAL BAR (WALES) LIMITED Indirect 100%
26 HELICAL BAR DEVELOPMENTS LIMITED Direct 100%
27 HELICAL FARRINGDON EAST (JERSEY) LIMITED 1 Direct 100%
28 HELICAL FINANCE (AV) LIMITED Direct 100%
29 HELICAL FINANCE (RBS) LIMITED Direct 100%
30 HELICAL JERSEY HOLDINGS LIMITED 1 Direct 100%
31 HELICAL JERSEY INVESTMENT HOLDINGS LIMITED 1 Direct 100%
32 HELICAL OLD STREET JERSEY HOLDINGS LIMITED 1 Direct 100%
33 HELICAL OLD STREET JERSEY LIMITED 1 Indirect 100%
34 HELICAL PROPERTIES LIMITED Direct 100%
35 HELICAL PROPERTIES INVESTMENT LIMITED Direct 100%
36 HELICAL RETAIL LIMITED Direct 100%
37 HELICAL SERVICES LIMITED Direct 100%
38 METROPOLIS PROPERTY LIMITED Indirect 100%
39 OLD STREET UNITHOLDER NO 1 LIMITED 1 Indirect 100%
40 OLD STREET UNITHOLDER NO 2 LIMITED 1 Indirect 100%
Company Direct/Indirect Ultimate %
JOINT VENTURES AND JOINT OPERATIONS1 ABBEYGATE HELICAL (C4.1) LLP Direct 50%
2 ABBEYGATE HELICAL (LEISURE PLAZA) LIMITED Direct 50%
3 BARTS CLOSE OFFICE LIMITED 1 Indirect 33%
4 BARTS ONE LIMITED 1 Indirect 33%
5 BARTS SQUARE ACTIVE ONE LIMITED 1 Indirect 33%
6 BARTS SQUARE FIRST LIMITED Indirect 33%
7 BARTS SQUARE FIRST OFFICE LIMITED 1 Indirect 33%
8 BARTS SQUARE FIRST RESIDENTIAL LIMITED 1 Indirect 33%
9 BARTS SQUARE LAND ONE LIMITED Indirect 33%
10 BARTS TWO LIMITED1 Indirect 33%
11 BARTS, L.P. 3 Indirect 33%
12 HASLUCKS GREEN LIMITED Indirect 50%
13 HELICAL GRAINGER (HOLDINGS) LIMITED Indirect 50%
14 KING STREET DEVELOPMENTS (HAMMERSMITH) LIMITED Indirect 50%
15 OBC DEVELOPMENT MANAGEMENT LIMITED Indirect 33%
16 SHIRLEY ADVANCE LLP Indirect 50%
17 CHARTERHOUSE PLACE LIMITED Indirect 50%
18 CHARTERHOUSE STREET LIMITED2 Indirect 50%
DORMANT SUBSIDIARIES AND JOINT VENTURES1 AYCLIFFE & PETERLEE DEVELOPMENT COMPANY LIMITED Direct 100%
2 HB SAWSTON NO. 1 LIMITED Direct 100%
3 HB SAWSTON NO. 2 LIMITED Direct 100%
4 HB SAWSTON NO. 4 LIMITED Direct 100%
5 HELICAL (BOOTH ST) LIMITED Direct 100%
6 HELICAL (CARDIFF) LIMITED Direct 100%
7 HELICAL (HAILSHAM) LIMITED Indirect 100%
8 HELICAL (HUB) LIMITED Direct 100%
9 HELICAL (PORCHESTER) LIMITED Direct 100%
10 HELICAL (QUARTZ) LIMITED Direct 100%
11 HELICAL (SEVENOAKS) LIMITED Direct 100%
12 HELICAL (WEST LONDON) LIMITED Direct 100%
13 HELICAL BAR (CITY INVESTMENTS) LIMITED Indirect 100%
14 HELICAL BAR (MITRE SQUARE) DEVELOPMENTS LIMITED Direct 100%
15 HELICAL BAR DEVELOPMENTS (SOUTH EAST) LIMITED Direct 100%
16 HELICAL BAR LIMITED Direct 100%
17 HELICAL BAR TRUSTEES LIMITED Direct 100%
18 HELICAL GROUP LIMITED Direct 100%
19 HELICAL PROPERTIES (RS) LIMITED Direct 100%
20 HELICAL REGISTRARS LIMITED Direct 100%
21 HGCI (HOLDCO) LIMITED Indirect 100%
22 HGCI (TRANSCO) LIMITED Indirect 100%
23 HGCI (UK) LIMITED Indirect 100%
24 HGCI HOLDINGS LIMITED Indirect 100%
25 HGCI INTERMEDIATE LIMITED Indirect 100%**
26 HGCI LIMITED Direct 100%
27 OLD STREET HOLDINGS GP LIMITED 2 Indirect 33%
28 OLD STREET HOLDINGS L.P.2 Indirect 33%
29 OLD STREET UNITHOLDER LIMITED2 Indirect 33%
30 ROPEMAKER PARK MANAGEMENT COMPANY LIMITED Indirect 100%**
31 SCBP MANAGEMENT COMPANY LIMITED Indirect 75%
32 SPRING (HOLDINGS) LIMITED Indirect 100%
33 SPRING (NO.1) LIMITED Direct 100%
34 SPRING (NO.2) LIMITED Indirect 100%
35 SPRING (NO.3) LIMITED Indirect 100%
Registered offices:1 12 Castle Street, St Helier, Jersey JE4 5UT.2 IFC 5, St Helier, Jersey, JE1 1ST.3 c/o Corporation Service Company, 2711 Centerville Road, Suite 400, Wilmington DE 19808, United States.4 c/o Dentons, 1 George Square, Glasgow G2 1AL.
Notes:* No shares in issue in the Unit Trusts. The registered office address is that of the appropriate trustee.
** Limited by Guarantee.
170 Helical plc Annual Report and Accounts 2021 171Helical plcAnnual Report and Accounts 2021F
INA
NC
IAL S
TAT
EM
EN
TS
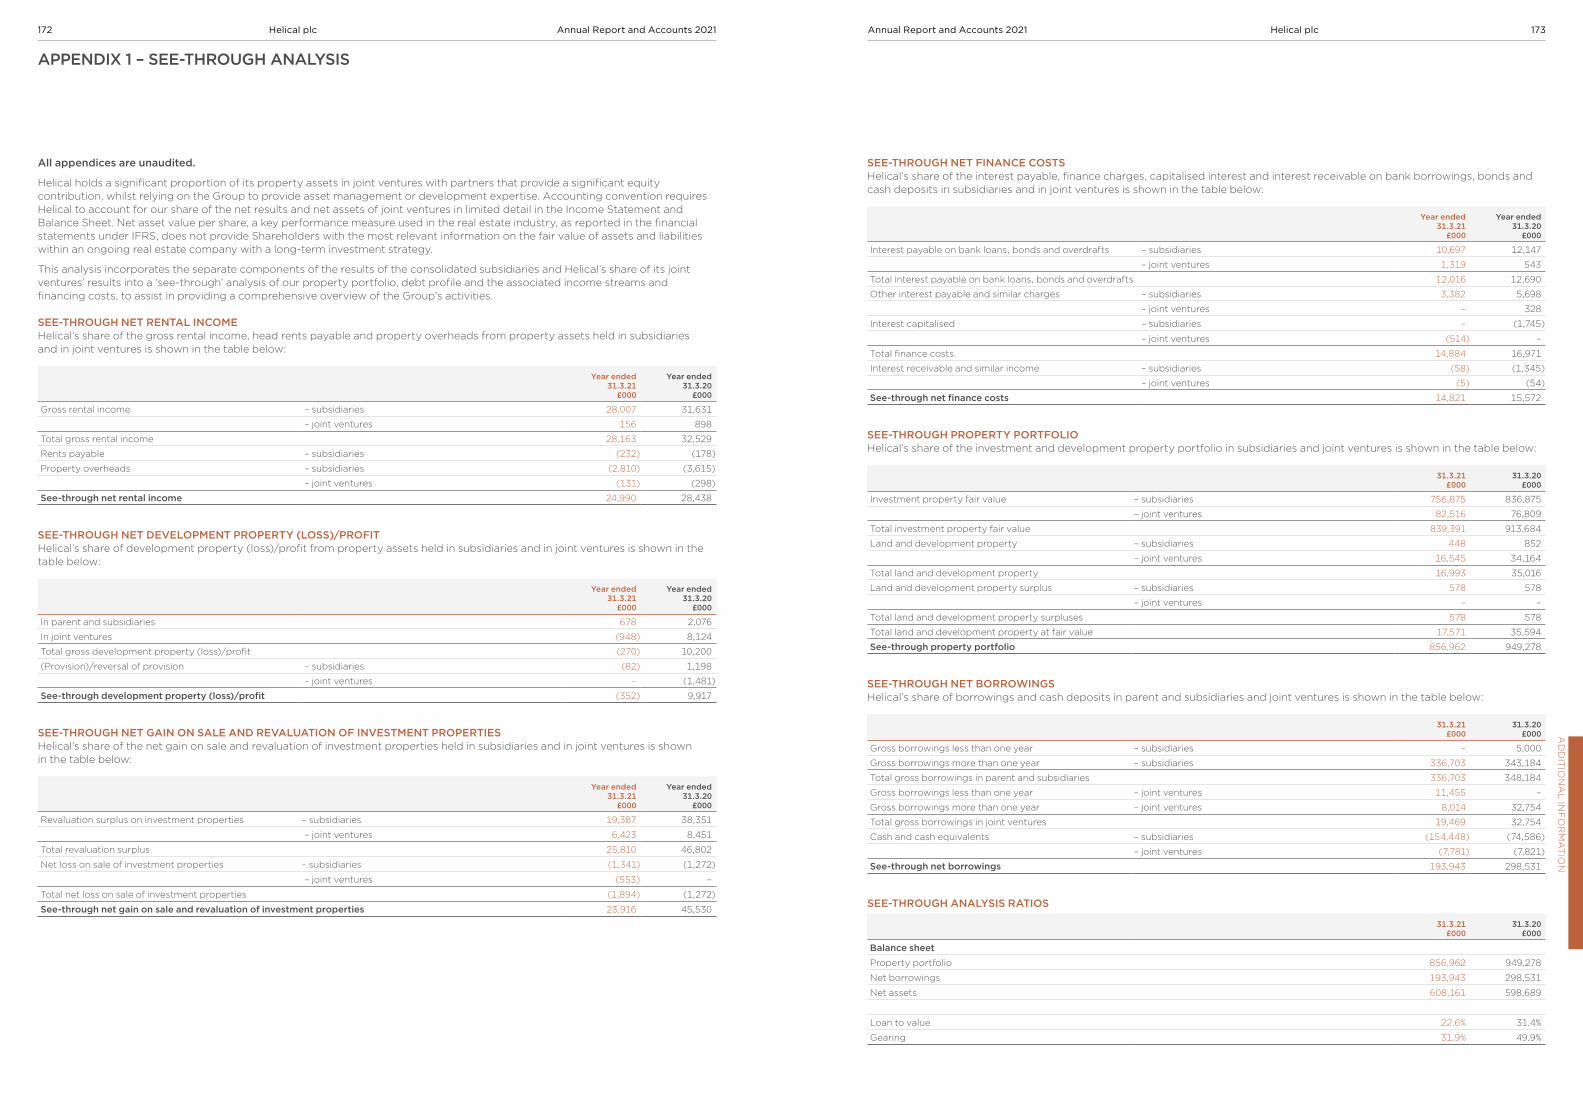
All appendices are unaudited.
Helical holds a significant proportion of its property assets in joint ventures with partners that provide a significant equity contribution, whilst relying on the Group to provide asset management or development expertise. Accounting convention requires Helical to account for our share of the net results and net assets of joint ventures in limited detail in the Income Statement and Balance Sheet. Net asset value per share, a key performance measure used in the real estate industry, as reported in the financial statements under IFRS, does not provide Shareholders with the most relevant information on the fair value of assets and liabilities within an ongoing real estate company with a long-term investment strategy.
This analysis incorporates the separate components of the results of the consolidated subsidiaries and Helical’s share of its joint ventures’ results into a ‘see-through’ analysis of our property portfolio, debt profile and the associated income streams and financing costs, to assist in providing a comprehensive overview of the Group’s activities.
SEE-THROUGH NET RENTAL INCOMEHelical’s share of the gross rental income, head rents payable and property overheads from property assets held in subsidiaries and in joint ventures is shown in the table below:
Year ended 31.3.21
£000
Year ended 31.3.20
£000
Gross rental income – subsidiaries 28,007 31,631
– joint ventures 156 898
Total gross rental income 28,163 32,529
Rents payable – subsidiaries (232) (178)
Property overheads – subsidiaries (2,810) (3,615)
– joint ventures (131) (298)
See-through net rental income 24,990 28,438
SEE-THROUGH NET DEVELOPMENT PROPERTY (LOSS)/PROFITHelical’s share of development property (loss)/profit from property assets held in subsidiaries and in joint ventures is shown in the table below:
Year ended 31.3.21
£000
Year ended 31.3.20
£000
In parent and subsidiaries 678 2,076
In joint ventures (948) 8,124
Total gross development property (loss)/profit (270) 10,200
(Provision)/reversal of provision – subsidiaries (82) 1,198
– joint ventures – (1,481)
See-through development property (loss)/profit (352) 9,917
SEE-THROUGH NET GAIN ON SALE AND REVALUATION OF INVESTMENT PROPERTIESHelical’s share of the net gain on sale and revaluation of investment properties held in subsidiaries and in joint ventures is shown in the table below:
Year ended 31.3.21
£000
Year ended 31.3.20
£000
Revaluation surplus on investment properties – subsidiaries 19,387 38,351
– joint ventures 6,423 8,451
Total revaluation surplus 25,810 46,802
Net loss on sale of investment properties – subsidiaries (1,341) (1,272)
– joint ventures (553) –
Total net loss on sale of investment properties (1,894) (1,272)
See-through net gain on sale and revaluation of investment properties 23,916 45,530
APPENDIX 1 – SEE-THROUGH ANALYSIS
SEE-THROUGH NET FINANCE COSTSHelical’s share of the interest payable, finance charges, capitalised interest and interest receivable on bank borrowings, bonds and cash deposits in subsidiaries and in joint ventures is shown in the table below:
Year ended 31.3.21
£000
Year ended 31.3.20
£000
Interest payable on bank loans, bonds and overdrafts – subsidiaries 10,697 12,147
– joint ventures 1,319 543
Total interest payable on bank loans, bonds and overdrafts 12,016 12,690
Other interest payable and similar charges – subsidiaries 3,382 5,698
– joint ventures – 328
Interest capitalised – subsidiaries – (1,745)
– joint ventures (514) –
Total finance costs 14,884 16,971
Interest receivable and similar income – subsidiaries (58) (1,345)
– joint ventures (5) (54)
See-through net finance costs 14,821 15,572
SEE-THROUGH PROPERTY PORTFOLIOHelical’s share of the investment and development property portfolio in subsidiaries and joint ventures is shown in the table below:
31.3.21 £000
31.3.20£000
Investment property fair value – subsidiaries 756,875 836,875
– joint ventures 82,516 76,809
Total investment property fair value 839,391 913,684
Land and development property – subsidiaries 448 852
– joint ventures 16,545 34,164
Total land and development property 16,993 35,016
Land and development property surplus – subsidiaries 578 578
– joint ventures – –
Total land and development property surpluses 578 578
Total land and development property at fair value 17,571 35,594
See-through property portfolio 856,962 949,278
SEE-THROUGH NET BORROWINGSHelical’s share of borrowings and cash deposits in parent and subsidiaries and joint ventures is shown in the table below:
31.3.21 £000
31.3.20£000
Gross borrowings less than one year – subsidiaries – 5,000
Gross borrowings more than one year – subsidiaries 336,703 343,184
Total gross borrowings in parent and subsidiaries 336,703 348,184
Gross borrowings less than one year – joint ventures 11,455 –
Gross borrowings more than one year – joint ventures 8,014 32,754
Total gross borrowings in joint ventures 19,469 32,754
Cash and cash equivalents – subsidiaries (154,448) (74,586)
– joint ventures (7,781) (7,821)
See-through net borrowings 193,943 298,531
SEE-THROUGH ANALYSIS RATIOS
31.3.21£000
31.3.20£000
Balance sheet
Property portfolio 856,962 949,278
Net borrowings 193,943 298,531
Net assets 608,161 598,689
Loan to value 22.6% 31.4%
Gearing 31.9% 49.9%
AD
DIT
ION
AL IN
FO
RM
AT
ION
172 Helical plc Annual Report and Accounts 2021 173Helical plcAnnual Report and Accounts 2021

TOTAL ACCOUNTING RETURN
Year ended 31.3.21
£000
Year ended 31.3.20
£000
Brought forward net assets 598,689 567,425
Carried forward net assets 608,161 598,689
Increase in net assets 9,472 31,264
Dividends paid 10,528 12,219
Total Accounting Return 20,000 43,483
Total Accounting Return percentage 3.3% 7.7%
TOTAL ACCOUNTING RETURN ON EPRA NET TANGIBLE ASSETS
Year ended 31.3.21
£000
Year ended 31.3.20
£000
Brought forward EPRA net tangible assets 640,424 597,321
Carried forward EPRA net tangible assets 658,663 640,424
Increase in EPRA net tangible assets 18,239 43,103
Dividends paid 10,528 12,219
Total Accounting Return on EPRA net tangible assets 28,767 55,322
Total Accounting Return percentage on EPRA net tangible assets 4.5% 9.3%
TOTAL PROPERTY RETURN
Year ended 31.3.21
£000
Year ended 31.3.20
£000
See-through net rental income 24,990 28,438
See-through development property (losses)/profits (352) 9,917
See-through revaluation surplus 25,810 46,802
See-through net loss on sale of investment properties (1,894) (1,272)
Total Property Return 48,554 83,885
APPENDIX 2 – TOTAL ACCOUNTING RETURN AND TOTAL PROPERTY RETURN
INCOME STATEMENTS
Year ended 31.3.21
£000
Year ended 31.3.20
£000
Year ended 31.3.19
£000
Year ended 31.3.18
£000
Year ended 31.3.17
£000
Revenue 38,596 44,361 44,175 175,596 99,934
Net rental income 24,965 27,838 24,599 36,329 46,162
Development property profit/(loss) 678 2,076 2,564 (1,961) 7,143
(Provisions)/ reversal of provisions against stock (82) 1,198 (4,345) (2,213) (6,300)
Share of results of joint ventures 2,352 13,396 (3,217) 3,196 (6,528)
Other operating income 48 88 – 111 982
Gross profit before gain on investment properties 27,961 44,596 19,601 35,462 41,459
(Loss)/gain on sale of investment properties (1,341) (1,272) 15,008 13,567 1,391
Revaluation surplus on investment properties 19,387 38,351 44,284 23,848 39,152
Fair value movement of available-for-sale assets – – 144 1,385 (3,352)
Administrative expenses excluding performance related awards (9,276) (10,524) (10,858) (11,023) (10,800)
Performance related awards (including NIC) (5,140) (6,191) (5,895) (1,742) (7,572)
Finance costs (14,079) (16,100) (17,407) (37,438) (25,598)
Finance income 58 1,345 983 4,303 3,156
Change in fair value of derivative financial instruments 2,938 (7,651) (3,322) 4,029 789
Change in fair value of Convertible Bond – 468 865 (1,559) 2,973
Foreign exchange gains/(losses) – 8 53 (10) (3)
Profit before tax 20,508 43,030 43,456 30,822 41,595
Tax on profit on ordinary activities (2,631) (4,313) (836) (4,537) (2,471)
Profit after tax 17,877 38,717 42,620 26,285 39,124
BALANCE SHEETS
31.3.21£000
31.3.20£000
31.3.19£000
31.3.18£000
31.3.17£000
Investment portfolio at fair value 756,875 836,875 791,250 802,134 1,003,000
Land, trading properties and developments 448 852 2,311 6,042 86,680
Group’s share of investment properties held by joint ventures 82,516 76,809 25,382 22,623 13,907
Group’s share of land, trading and development properties held by joint ventures 16,545 34,164 56,935 76,474 89,115
Group’s share of land and development property surpluses 578 578 578 2,328 12,514
Group’s share of total properties at fair value 856,962 949,278 876,456 909,601 1,205,216
Net debt 182,255 273,598 227,712 325,121 574,439
Group’s share of net debt of joint ventures 11,688 24,933 40,861 37,733 45,537
Group’s share of net debt 193,943 298,531 268,573 362,854 619,976
Net assets 608,161 598,689 567,425 533,894 516,897
EPRA net tangible assets value 658,663 640,424 597,321 561,644* 565,973*
Dividend per ordinary share paid/payable 8.70p 10.20p 9.60p 8.70p 3.12p
Dividend per ordinary share declared 10.10p 8.70p 10.10p 9.50p 8.60p
EPRA (loss)/earnings per ordinary share (1.8)p 7.6p (8.4)p (7.0)p 0.5p
EPRA net tangible assets per share 533p 524p 494p 468p* 473p*
* EPRA net asset value.
APPENDIX 3 – FIVE YEAR REVIEW
AD
DIT
ION
AL IN
FO
RM
AT
ION
174 Helical plc Annual Report and Accounts 2021 175Helical plcAnnual Report and Accounts 2021

LONDON PORTFOLIO – INVESTMENT PROPERTIES
Address DescriptionArea sq ft
(NIA)Vacancy rate at 31 March 2021
Vacancy rate at 31 March 2020
Completed, let and available to letThe Warehouse & Studio, The Bower, EC1 Multi-let office building 151,439 0.0% 0.2%
The Tower, The Bower, EC1 Multi-let office building 182,195 0.0% 0.0%
The Loom, E1 Multi-let office building 108,606 14.8% 4.2%
Kaleidoscope, EC1 Single-let over-station office building 88,581 0.0% 100.0%
25 Charterhouse Square, EC1 Multi-let office building 42,921 26.0% 0.0%
55 Bartholomew, EC1 Multi-let office building 10,976 67.2% 90.5%
The Powerhouse, W4 Single-let recording studios/office building 24,288 0.0% 0.0%
609,006 5.8% 16.5%
Being redeveloped33 Charterhouse Street, EC1 Office redevelopment 205,3691 n/a n/a
814,375 n/a n/a
1 Estimated space once developed.
LONDON PORTFOLIO – DEVELOPMENT PROPERTIES
Address DescriptionArea sq ft
(NIA)
Unsold apartments at 31 March 2021
Unsold apartments at 31 March 2020
Barts Square, EC1 236 residential apartments and 14,730 sq ft retail/leisure 216,717 28 44
MANCHESTER OFFICES
Address DescriptionArea sq ft
(NIA)Vacancy rate at 31 March 2021
Vacancy rate at 31 March 2020
Trinity Multi-let office building 58,760 54.1% 100%
APPENDIX 4 – PROPERTY PORTFOLIO
The European Public Real Estate Association (“EPRA”) Best Practice Recommendations set out a number of EPRA Performance Measures (“EPMs”) to aid comparability in reporting across property companies. The principal EPMs applicable to the Group are set out below:
EPRA performance measure Definition Note 31.3.21 31.3.20
EPRA Earnings/(losses) per share Earnings/(losses) per share from operational activities. 13 (1.8)p 7.6p
EPRA NTA Assumes that entities buy and sell assets, thereby crystallising certain levels of unavoidable deferred tax, but excludes assets and liabilities, such as fair value movements on financial derivatives, that are not expected to crystallise in normal circumstances and deferred taxes on property valuation surpluses are excluded. 33 533p 524p
EPRA NAV Net asset value adjusted to include properties and other investment interests at fair value and to exclude certain items not expected to crystallise in a long-term investment property business model. 33 514p 511p
EPRA NNNAV/EPRA NDV EPRA NAV adjusted to include the fair values of financial instruments, debt and deferred taxes. 33 485p 480p
EPRA NIY Annualised rental income based on the cash rents passing at the balance sheet date, less non-recoverable property operating expenses, divided by the market value of the property, increased with (estimated) purchasers’ costs. 3.21% 2.95%
EPRA Topped Up NIY This measure incorporates an adjustment to the EPRA NIY in respect of the expiration of rent-free periods (or other unexpired lease incentives such as discounted rent periods and step rents). 4.59% 4.05%
EPRA Vacancy Rate Estimated Market Rental Value (ERV) of vacant space divided by ERV of the whole portfolio. 7.89% 19.72%
The note references provide the calculation of the associated measure. Other measures are calculated as follows:
EPRA Net Initial Yield and EPRA Topped Up Net Initial Yield31.3.21
£00031.3.20
£000
Investment property at fair value – subsidiaries 756,875 836,875
– joint ventures 82,516 76,809
Less: Property under construction – subsidiaries – –
– joint ventures (69,250) (45,000)
Undeveloped land (100) (100)
Properties not held for rental income – –
Completed property portfolio 770,041 868,584
Allowance for estimated purchases’ costs of 6.8% 52,363 59,064
Gross up completed property portfolio 822,404 927,648
Passing rent net of head rents 26,413 27,105
EPRA NIY 3.21% 2.92%
Add: Contracted rent 11,322 10,482
Topped up annualised net rents 37,735 37,587
EPRA Topped Up NIY 4.59% 4.05%
EPRA Vacancy Rate31.3.21
£00031.3.20
£000
ERV of vacant space 3,371 10,161
ERV of total portfolio 42,720 51,533
EPRA Vacancy Rate 7.89% 19.72%
Below is a table setting out in greater detail the types of capital expenditure made by the Group during the year:
Note
Year ended 31.3.21
£000
Year ended 31.3.20
£000
Acquisitions – 41,026
Existing portfolio 36,030 44,044
Capitalised interest – 1,745
Total capital expenditure 14 36,030 86,815
There were no (2020: one) new investment properties purchased during the year. The majority of the expenditure on the existing portfolio was made on the London portfolio (94%) and the Manchester offices (6%). In prior year 100% of the capitalised interest was in London. Capitalised interest is calculated in accordance with IAS 23 Borrowing Costs.
APPENDIX 5 – EPRA PERFORMANCE MEASURES
AD
DIT
ION
AL IN
FO
RM
AT
ION
176 Helical plc Annual Report and Accounts 2021 177Helical plcAnnual Report and Accounts 2021
GLOSSARY
CAPITAL VALUE (PSF)The open market value of the property divided by the net lettable area of the property in square feet.
COMPANY OR HELICAL OR GROUPHelical plc and its subsidiary undertakings.
DILUTED FIGURESReported amounts adjusted to include the effects of potential shares issuable under the Director and employee remuneration schemes.
EARNINGS PER SHARE (EPS)Profit after tax divided by the weighted average number of ordinary shares in issue.
EPRAEuropean Public Real Estate Association.
EPRA EARNINGS PER SHAREEarnings per share adjusted to exclude gains/losses on sale and revaluation of investment properties and their deferred tax adjustments, the tax on profit/loss on disposal of investment properties, trading property profits/losses, movement in fair value of available-for-sale assets and fair value movements on derivative financial instruments, on an undiluted basis. Details of the method of calculation of the EPRA earnings per share are available from EPRA (see Note 13).
EPRA NET ASSETS PER SHAREDiluted net asset value per share adjusted to exclude fair value surplus/deficit of financial instruments, deferred tax on capital allowances and on investment properties revaluation, but including the fair value of trading and development properties in accordance with the best practice recommendations of EPRA (see Note 33).
EPRA NET DISPOSAL VALUE PER SHARE (EFFECTIVE FROM 1 JANUARY 2020) Represents the Shareholders’ value under a disposal scenario, where deferred tax, financial instruments and certain other adjustments are calculated to the full extent of their liability, net of any resulting tax (see Note 33).
EPRA NET REINSTATEMENT VALUE PER SHARE (EFFECTIVE FROM 1 JANUARY 2020)Net asset value adjusted to reflect the value required to rebuild the entity and assuming that entities never sell assets. Assets and liabilities, such as fair value movements on financial derivatives, that are not expected to crystallise in normal circumstances and deferred taxes on property valuation surpluses are excluded (see Note 33).
EPRA NET TANGIBLE ASSETS PER SHARE (EFFECTIVE FROM 1 JANUARY 2020) Assumes that entities buy and sell assets, thereby crystallising certain levels of unavoidable deferred tax, but excludes assets and liabilities, such as fair value movements on financial derivatives, that are not expected to crystallise in normal circumstances and deferred taxes on property valuation surpluses are excluded (see Note 33).
ESTIMATED RENTAL VALUE (ERV)The market rental value of lettable space as estimated by the Group’s valuers at each balance sheet date.
EPRA TOPPED-UP NIYThe current annualised rent, net of costs, topped-up for contracted uplifts, expressed as a percentage of the fair value of the relevant property.
EPRA TRIPLE NET ASSET VALUE PER SHAREEPRA net asset value per share adjusted to include fair value of financial instruments and deferred tax on capital allowances and on investment properties revaluation (see Note 33).
GEARINGTotal borrowings less short-term deposits and cash as a percentage of net assets.
LIKE-FOR-LIKE VALUATION CHANGEThe valuation gain/loss, net of capital expenditure, on those properties held at both the previous and current reporting period end, as a proportion of the fair value of those properties at the beginning of the reporting period plus net capital expenditure.
MCSI INC. (MSCI IPD)MSCI Inc. is a company that produces independent benchmarks of property returns.
NET ASSET VALUE PER SHARE (NAV)Net assets divided by the number of ordinary shares at the balance sheet date (see Note 33).
NET INITIAL YIELD (NIY)Annualised net passing rents on investment properties as a percentage of their open market value, including costs of purchase.
PASSING RENTThe annual gross rental income being paid by the tenant.
REVERSIONARY YIELDThe income/yield from the full estimated rental value of the property on the market value of the property grossed up to include purchaser’s costs, capital expenditure and capitalised revenue expenditure.
SEE-THROUGH/GROUP SHAREThe consolidated Group and the Group’s share in its joint ventures (see Appendix 1).
SEE-THROUGH NET GEARINGThe see-through net borrowings expressed as a percentage of net assets (see Appendix 1).
TOTAL ACCOUNTING RETURNThe growth in the net asset value of the Company plus dividends paid in the year, expressed as a percentage of net asset value at the start of the year (see Appendix 2).
TOTAL ACCOUNTING RETURN ON EPRA NET TANGIBLE ASSETSThe growth in the EPRA net tangible asset value of the Company plus dividends paid in the year, expressed as a percentage of the EPRA net tangible asset value at the start of the year (see Appendix 2).
TOTAL PROPERTY RETURNThe total of net rental income, trading and development profits and net gain on sale and revaluation of investment properties on a see-through basis (see Appendix 2).
TOTAL SHAREHOLDER RETURN (TSR)The growth in the ordinary share price as quoted on the London Stock Exchange plus dividends per share received for the period expressed as a percentage of the share price at the beginning of the period.
TRUE EQUIVALENT YIELDThe constant capitalisation rate which, if applied to all cash flows from an investment property, including current rent, reversions to current market rent and such items as voids and expenditures, equates to the market value. Assumes rent is received quarterly in advance.
UNLEVERAGED RETURNSTotal property gains and losses (both realised and unrealised) plus net rental income expressed as a percentage of the total value of the properties.
WEIGHTED AVERAGE UNEXPIRED LEASE TERM (WAULT)The total contracted rent up to the first break, or lease expiry date, divided by the contracted annual rent.
AD
DIT
ION
AL IN
FO
RM
AT
ION
179Helical plcAnnual Report and Accounts 2021178 Helical plc Annual Report and Accounts 2021

SHAREHOLDER INFORMATION
WEBSITEThe report and financial statements, a list of properties held by the Group, Company presentations, press releases, the financial calendar and other information on the Group are available on our website at www.helical.co.uk
REGISTRARAll general enquiries concerning holdings of ordinary shares in Helical plc should be addressed to the Company’s Registrar:
LINK GROUPLink Group, 10th Floor, Central Square, 29 Wellington Street, Leeds, LS1 4DL
Telephone: 0371 664 0300* From outside the UK +44 371 664 0300
Website: www.linkgroup.eu/ Email: [email protected]
* Calls are charged at the standard geographic rate and will vary by provider. Calls outside the United Kingdom will be charged at the applicable international rate. We are open between 09:00 – 17:30, Monday to Friday excluding public holidays in England and Wales.
E-COMMUNICATIONShareholders and all interested parties may choose to be alerted about press releases, regulatory news updates and financial calendar updates by subscribing to the alert service in the “Regulatory News” area of our website.
Shareholders may inform us how they wish to receive statutory communications from the Company, including annual reports and notices of general meetings, via the Shareholder portal. Further to a letter of deemed consent sent to Shareholders on 5 April 2017, Shareholders are notified by post by default when notices, documents and information from the Company are available on the website at www.helical.co.uk. If you wish to be notified by email each time the Company places a statutory document on its website or if you would like to receive printed copies of statutory documents in the post, please go to www.signalshares.com. Once you have registered, click on the “Manage your Account” link and follow the on-screen instructions.
PAYMENT OF DIVIDENDSUK Shareholders whose dividends are not currently paid to mandated accounts may wish to consider having their dividends paid directly into their bank or building society account. This has a number of advantages, including the crediting of cleared funds into the nominated account on the dividend payment date. Shareholders who would like their future dividends to be paid in this way should complete a mandate instruction available from the Registrar or register their mandate at: www.signalshares.com. Under this arrangement dividend confirmations are sent to the Shareholder’s registered address.
DIVIDENDS FOR SHAREHOLDERS RESIDENT OUTSIDE THE UKInstead of waiting for a sterling cheque to arrive by mail, you can ask us to send your dividends direct to your bank account. For information, please contact the Company’s Registrar.
DIVIDEND REINVESTMENT PLAN (DRIP)The Company offers Shareholders the option to participate in a DRIP. This enables Shareholders to reinvest their cash dividends in Helical plc shares.
For further details, contact the Company’s Registrar (on 0371 664 0381* or email [email protected]) or complete an application form online at: www.signalshares.com.
* Calls are charged at the standard geographic rate and will vary by provider. Calls outside the United Kingdom will be charged at the applicable international rate. Lines are open between 09:00 – 17:30, Monday to Friday excluding public holidays in England and Wales.
For participants in the DRIP, key dates of forthcoming dividends can be found in Financial Calendar page in the “Investors” section of the website at www.helical.co.uk
SHARE DEALING SERVICEAn online and telephone share dealing service is available to our Shareholders through Link Share Deal.
For further information on this service or to buy and sell shares online, please visit www.linksharedeal.com or call 0371 664 0445*.
*Calls cost 12p per minute plus your phone company’s access charge. Calls outside the United Kingdom will be charged at the applicable international rate. Lines are open between 8.00am – 4.30pm Monday to Friday excluding public holidays in England and Wales.
SHAREGIFTShareholders with a small number of shares, which are uneconomical to sell, may wish to consider donating them to a charity, free of charge through ShareGift (registered charity 1052686). For further information please visit www.sharegift.org, call 020 7930 3737 or write to ShareGift, PO Box 72253, London, SW1P 9LQ / [email protected]
DIVIDENDSDividends declared and/or paid during the year to 31 March 2021 were as follows:
DividendRecord date 2020
Payment date 2020 Amount
2019-20 Final 26 June 27 July 6.00p
2020-21 Interim 4 December 31 December 2.70p
Dividend payment dates in 2021 will be as follows:
DividendRecord date 2021
Payment date 2021 Amount
2020-21 Final 25 June 26 July 7.40p
2021-22 Interim December December TBC 1
1 The amount of the 2021–22 interim dividend will be announced in November 2021.
UNSOLICITED INVESTMENT ADVICE – WARNING TO SHAREHOLDERSMany companies have become aware that their shareholders have received unsolicited phone calls or correspondence concerning investment matters. These are typically from overseas-based “brokers” who target UK shareholders offering to sell them what often turn out to be worthless or high-risk shares in US or UK investments. They can be very persistent and extremely persuasive. It is not just the novice investor who has been duped in this way; many of the victims had been successfully investing for several years. Shareholders are advised to be very wary of any unsolicited investment advice, offers to buy shares at a discount or offers of free reports into Helical.
If you receive unsolicited investment advice:
• Exercise caution and never disclose personal details;
• Obtain the correct name of the person and organisation and make a record of any other information they give you, such as a telephone number, address or website address;
• Check that they are properly authorised by the FCA (Financial Conduct Authority) before getting involved. This can be checked at fca.org.uk/consumers. If you deal with an unauthorised firm you will not be eligible to receive payment under the Financial Services Compensation Scheme;
• Get impartial advice before handing over any money;
• If the caller persists, hang up;
• Inform us on 020 7629 0113 (email: [email protected]) or our Registrars, Link Asset Services, on 0871 664 0300 (email: [email protected]). Whilst we are not able to investigate such incidents ourselves we will record the details and will liaise with the FCA; and
• Report the suspected fraud to the FCA either by calling: 0800 111 6768 or by completing an online form at: www.fca.org.uk/consumers/report-scam-unauthorised-firm.
SHARE PRICE INFORMATIONThe latest information on the Helical plc share price is available on our website www.helical.co.uk.
REGISTERED OFFICE5 Hanover Square, London, W1S 1HQ Registered in England and Wales No. 156663
AD
DIT
ION
AL IN
FO
RM
AT
ION
180 Helical plc Annual Report and Accounts 2021 181Helical plcAnnual Report and Accounts 2021 Helical plcHelical plc

FINANCIAL CALENDAR AND ADVISORS
CALENDAR 2021 – 20222021
24 June 2021 Ex-dividend date for final ordinary dividend
25 June 2021 Record date for final ordinary dividend
5 July 2021 Last day for DRIP elections
15 July 2021 Annual General Meeting
26 July 2021 Final ordinary dividend payable
November 2021 1 Half Year Results and interim ordinary dividend announced
December 2021 2 Ex-dividend date for interim ordinary dividend
December 2021 2 Registration qualifying date for interim ordinary dividend
2022
May 2022 Announcement of Full Year Results to 31 March 2022
Notes1 The announcement date of the Half Year Results will be confirmed in October 2021.2 Dates for the potential interim dividend will be confirmed in the Half Year Results
Announcement.
ADVISORSRegistrarsLink Asset Services
BankersAviva Commercial Finance Limited
Barclays Bank PLC
HSBC Bank PLC
The Royal Bank of Scotland PLC
National Westminster Bank PLC
Wells Fargo Bank N.A., London Branch
Allianz Debt Fund SCSp SICAV-SIF
Joint stockbrokersJ.P. Morgan Cazenove
Numis Securities Limited
AuditorsDeloitte LLP
Corporate solicitorsClifford Chance LLP
Mishcon de Reya LLP
CONTACT DETAILSHelical plcRegistered in England and Wales No.156663
Registered Office 5 Hanover Square London W1S 1HQ
T: 020 7629 0113 F: 020 7408 1666 E: [email protected]
www.helical.co.uk
This Report is printed on paper derived from sustainable materials. Both the manufacturing paper mill and printer are registered to the Environmental Management System ISO 14001 and are Forest Stewardship Council® (FSC) chain-of-custody certified. This Report is recyclable and Bio-degradable – If you have finished with this document and no longer wish to retain it, please pass it on to other interested readers or dispose of it in your recycled paper waste.
This Report is recyclable and Bio-degradable – If you have finished with this document and no longer wish to retain it, please pass it on to other interested readers or dispose of it in your recycled paper waste.
Designed and produced by SampsonMay Telephone: 020 7403 4099 www.sampsonmay.com
182 Helical plc Annual Report and Accounts 2021Helical plc

Registered in England and Wales No.156663 Registered Office 5 Hanover Square London W1S 1HQ
T: 020 7629 0113 F: 020 7408 1666
Helical plc @helicalplchelical.co.uk
Annual R
epo
rt and A
ccounts 20
21